UNITED STATES
SECURITIES AND EXCHANGE COMMISSION
Washington, D.C. 20549
FORM N-CSR
CERTIFIED SHAREHOLDER REPORT OF REGISTERED
MANAGEMENT INVESTMENT COMPANIES
Investment Company Act file number: 811-06520
AMG FUNDS I
(Exact name of registrant as specified in charter)
600 Steamboat Road, Suite 300, Greenwich, Connecticut 06830
(Address of principal executive offices) (Zip code)
AMG Funds LLC
600 Steamboat Road, Suite 300, Greenwich, Connecticut 06830
(Name and address of agent for service)
Registrant’s telephone number, including area code: (203) 299-3500
| | |
| Date of fiscal year end: September 30 |
|
Date of reporting period: OCTOBER 1, 2019 – SEPTEMBER 30, 2020 (Annual Shareholder Report) |
| Item 1. | Reports to Shareholders |
| | |
 | | ANNUAL REPORT |
| | |
| | | AMG Funds September 30, 2020 |
| | | 
|
| | |
| | | AMG Managers Brandywine Fund |
| | | Class I: BRWIX |
| | |
| | | AMG Managers Brandywine Blue Fund |
| | | Class I: BLUEX |
| | | |
| | | |
| | | |
| | | |
Beginning on January 1, 2021, as permitted by regulations adopted by the Securities and Exchange Commission, paper copies of the Funds’ shareholder reports like this one will no longer be sent by mail, unless you specifically request paper copies of the reports from the Funds or from your financial intermediary, such as a broker-dealer or bank. Instead, the reports will be made available on the Funds’ website (https://www.amgfunds.com/resources/order_literature.html), and you will be notified by mail each time a report is posted and provided with a website link to access the report.
If you already elected to receive shareholder reports electronically, you will not be affected by this change and you need not take any action. You may elect to receive shareholder reports and other communications from the Funds electronically at any time by contacting your financial intermediary or, if you invest directly with the Funds, by logging into your account at www.amgfunds.com.
You may elect to receive all future reports in paper free of charge. If you invest through a financial intermediary, you can contact your financial intermediary to request that you continue to receive paper copies of your shareholder reports. If you invest directly with the Funds, you can call 1.800.548.4539 to inform the Funds that you wish to continue receiving paper copies of your shareholder reports. Your election to receive reports in paper will apply to all funds in the AMG Funds Family of Funds held in your account if you invest through your financial intermediary or all funds in the AMG Funds Family of Funds held with the fund complex if you invest directly with the Funds.
| | | | |
| amgfunds.com | | | | 093020 AR073 |
|
AMG Funds Annual Report — September 30, 2020 |
| | | | | | |
| | | |
| | | | | | | |
| | | TABLE OF CONTENTS | | PAGE | |
| | | | |
| | | LETTER TO SHAREHOLDERS | | | 4 | |
| | | |
| | | ABOUT YOUR FUND’S EXPENSES | | | 5 | |
| | | |
| | | PORTFOLIO MANAGER’S COMMENTS, FUND SNAPSHOTS, ROSES AND THORNS AND SCHEDULES OF PORTFOLIO INVESTMENTS | | | | |
| | | |
| | | AMG Managers Brandywine Fund | | | 10 | |
| | | |
| | | AMG Managers Brandywine Blue Fund | | | 13 | |
| | | |
| | | FINANCIAL STATEMENTS | | | | |
| | | |
| | | Statement of Assets and Liabilities | | | 20 | |
| | | |
| | | Balance sheets, net asset value (NAV) per share computations and cumulative distributable earnings (loss) | | | | |
| | | |
| | | Statement of Operations | | | 21 | |
| | | |
| | | Detail of sources of income, expenses, and realized and unrealized gains (losses) during the fiscal year | | | | |
| | | |
| | | Statements of Changes in Net Assets | | | 22 | |
| | | |
| | | Detail of changes in assets for the past two fiscal years | | | | |
| | | |
| | | Financial Highlights | | | 23 | |
| | | |
| | | Historical net asset values per share, distributions, total returns, income and expense ratios, turnover ratios and net assets | | | | |
| | | |
| | | Notes to Financial Statements | | | 25 | |
| | | |
| | | Accounting and distribution policies, details of agreements and transactions with Fund management and affiliates, and descriptions of certain investment risks | | | | |
| | | |
| | | REPORT OF INDEPENDENT REGISTERED PUBLIC ACCOUNTING FIRM | | | 30 | |
| | | |
| | | OTHER INFORMATION | | | 31 | |
| | | |
| | | TRUSTEES AND OFFICERS | | | 32 | |
| | | |
| | | ANNUAL RENEWAL OF INVESTMENT MANAGEMENT AND SUBADVISORY AGREEMENTS | | | 34 | |
| | | | | | | |
|
Nothing contained herein is to be considered an offer, sale or solicitation of an offer to buy shares of any series of the AMG Funds Family of Funds. Such offering is made only by prospectus, which includes details as to offering price and other material information. | |
| | |
| | Letter to Shareholders |
DEAR FELLOW SHAREHOLDER:
Stocks extended their climb in the September quarter, continuing a dramatic rise from the Covid-crisis depths reached in March. Mirroring the market’s response in the spring, investor confidence in the recovery outweighed concerns about lingering risks posed by the ongoing pandemic.
AMG Managers Brandywine Fund (“Brandywine”) rose 9.16 percent in the three months through September. The Russell 3000® and Russell 3000® Growth Indexes gained 9.21 and 12.86 percent. AMG Managers Brandywine Blue Fund (“Brandywine Blue”) increased 13.37 percent in the quarter as the S&P 500®, Russell 1000® and Russell 1000® Growth Indexes added 8.93, 9.47 and 13.22 percent.
The recent run of enthusiasm left stocks in positive territory through the first nine months of 2020. AMG Managers Brandywine Fund finished September with a 9.48 percent year-to-date return, while the Russell 3000® and Russell 3000® Growth Indexes gained 5.41 and 23.00 percent. AMG Managers Brandywine Blue Fund returned 17.59 percent in the same period. The S&P 500®, Russell 1000® and Russell 1000® Growth Indexes increased 5.57, 6.40 and 24.33 percent.
Investors saw reason for optimism in the first couple months of the September quarter, including better-than-expected job gains and optimism that Congress would provide additional economic stimulus. Second-quarter earnings results appeared to contribute to confidence, with more than two-thirds of the companies in the S&P 500® Index reporting earnings above the mean estimate.
Technology played a central role in keeping the wheels of commerce turning despite the limitations related to the outbreak. Housing also emerged as a significant bright spot, with low rates spurring robust increases in housing starts and existing home sales. Excitement surrounding these trends helped propel major indexes to record highs in August. It turned out to be the best August for the S&P 500® Index in more than three decades.
Things changed in September. Lacking evidence of any tangible progress, investors viewed the prospect of an agreement being reached regarding a new round of stimulus for the economy before upcoming elections as increasingly dim. Volatility rose as the market changed direction. Leaders to the upside, namely technology companies, led the market lower as investors challenged their previous assumptions.
Despite the drama late in the period, the three months through September represented a broadly positive period for stocks. Every economic sector represented in the Brandywine portfolio, save a small decline in consumer staples, gained ground. All sectors in the Brandywine Blue portfolio posted positive absolute returns.
Technology holdings comprised the largest percentage of assets in Brandywine and Brandywine Blue and contributed the most to total gains in both Funds. Semiconductor holdings were top performers amid expectation-beating earnings results.
Enphase Energy, which makes microinverter systems used in solar energy applications, exceeded June-quarter estimates by 23 percent. The company also announced that it initiated shipments of a new battery storage system product. Advanced Micro Devices beat June-quarter expectations with earnings per share of
$0.18, up from $0.08 in the year-ago period. Results showed that the company captured market share in processors used in the desktop, notebook and server markets. Both companies were held by both Funds.
Other standout performers from the technology sector held by both Funds included Corning, Salesforce.com and The Trade Desk. Despite sharing some holdings, the Funds experienced different outcomes in terms of relative performance. Technology was the biggest detractor from Brandywine’s performance relative to the Russell 3000® Growth Index, while the sector was the second biggest contributor to Brandywine Blue’s performance versus the Russell 1000® Growth Index.
Consumer discretionary holdings, including Amazon (both Funds) and Chewy (Brandywine only), were the second biggest contributors to Brandywine’s absolute return. Both companies thrived as their online business models proved to be well-suited for pandemic conditions. Revenue for Amazon and Chewy grew 40 and 47 percent, respectively, in their most recently reported quarters. As a group, however, consumer discretionary holdings trailed the sector within the benchmark, making it Brandywine’s second biggest relative performance detractor.
Industrial holdings were the second biggest contributors to Brandywine Blue’s absolute performance and the most pronounced positive influence on relative results. Generac Holdings was a notable contributor as the work-from-home trend helped drive a 30 percent increase in sales of the company’s residential standby generators. Reservations early in the pandemic about the outlook for turf equipment prompted analysts to be overly conservative regarding Toro Co., which exceeded June-quarter estimates by 50 percent on strength driven by rises in golf course usage and residential lawncare. Both companies were held by both Funds.
There were fewer holdings that declined than usual in the mostly positive environment of the September quarter, and most declines were relatively modest. Sabre Corp. (Brandywine) and Ciena Corp. (both Funds) were exceptions.
June-quarter results for Sabre, which provides various technology solutions to the travel industry, showed that it was too early to take fledgling signs of improvement in tourism as evidence of a broader trend. As for Ciena, a networking infrastructure provider, solid results in its July-quarter earnings report didn’t signify full emergence from pandemic-related problems. The company reported conservative spending trends among customers and restrictions in India were likely to fuel uncertainty in coming quarters.
For more information on holdings that influenced September-quarter results, please see Roses & Thorns on page 7 for Brandywine and page 14 for Brandywine Blue.
Thanks for your long-term focus and continued confidence. We’re encouraged by recent results and working hard to build on them.

Scott Gates
Chief Investment Officer
Friess Associates, LLC
2
|
About Your Fund’s Expenses |
| | | | | | | | |
As a shareholder of a Fund, you may incur two types of costs: (1) transaction costs, which may include sales charges (loads) on purchase payments; redemption fees; and exchange fees; and (2) ongoing costs, including management fees; distribution (12b-1) fees; and other Fund expenses. This example is intended to help you understand your ongoing costs (in dollars) of investing in the Fund and to compare these costs with the ongoing costs of investing in other mutual funds. The example is based on $1,000 invested at the beginning of the period and held for the entire period as indicated below. ACTUAL EXPENSES The first line of the following table provides information about the actual account values and | | | | actual expenses. You may use the information in this line, together with the amount you invested, to estimate the expenses that you paid over the period. Simply divide your account value by $1,000 (for example, an $8,600 account value divided by $1,000 = 8.6), then multiply the result by the number in the first line under the heading entitled “Expenses Paid During Period” to estimate the expenses you paid on your account during this period. HYPOTHETICAL EXAMPLE FOR COMPARISON PURPOSES The second line of the following table provides information about hypothetical account values and hypothetical expenses based on the Fund’s actual expense ratio and an assumed annual rate of return of 5% before expenses, which is not the Fund’s | | | | actual return. The hypothetical account values and expenses may not be used to estimate the actual ending account balance or expenses you paid for the period. You may use this information to compare the ongoing costs of investing in the Fund and other funds by comparing this 5% hypothetical example with the 5% hypothetical examples that appear in the shareholder reports of other funds. Please note that the expenses shown in the table are meant to highlight your ongoing costs only and do not reflect any transactional costs, such as sales charges (loads), redemption fees, or exchange fees. Therefore, the second line of the table is useful in comparing ongoing costs only, and will not help you determine the relative total costs of owning different funds. |
| | | | | | | | |
| | | | | | | | |
Six Months Ended September 30, 2020 | | Expense
Ratio for
the Period | | Beginning
Account
Value
04/01/20 | | Ending
Account
Value
09/30/20 | | Expenses
Paid
During
the Period* |
AMG Managers Brandywine Fund |
|
Based on Actual Fund Return |
| | | | |
Class I | | 1.11% | | $1,000 | | $1,351 | | $6.52 |
|
Based on Hypothetical 5% Annual Return |
| | | | |
Class I | | 1.11% | | $1,000 | | $1,019 | | $5.60 |
AMG Managers Brandywine Blue Fund |
|
Based on Actual Fund Return |
| | | | |
Class I | | 1.17% | | $1,000 | | $1,386 | | $6.98 |
|
Based on Hypothetical 5% Annual Return |
| | | | |
Class I | | 1.17% | | $1,000 | | $1,019 | | $5.91 |
| * | Expenses are equal to the Fund’s annualized expense ratio multiplied by the average account value over the period, multiplied by the number of days in the most recent fiscal half-year (183), then divided by 366. |
3
|
AMG Managers Brandywine Fund Portfolio Manager’s Comments (unaudited) |
| | | | | | | | |
Early optimism abruptly gave way to widespread fear that was soon overcome by a new bout of enthusiasm, leaving stocks with healthy gains in a fiscal year that featured a bear market induced by a global health crisis. Despite an economic recession and a continuing pandemic, investors found ample reason for optimism in the 12 months through September 30, 2020. AMG Managers Brandywine Fund (the “Fund”) employs an investment strategy that is based on the premise that company-specific fundamentals, with a particular emphasis on earnings, drive stock prices. While conceding that broader trends influence stocks as a group during certain periods, this approach considers such periods to be finite, with investors ultimately returning to judge each company on its individual merits over time. Macro factors played a significant role in defining market sentiment during the fiscal year, with the government’s aggressive response to an economic shock rising above other forces to promote confidence amid trying conditions. The sentiment resulting from the applied stimulus fueled some disparity between stock prices and fundamentals in certain areas, though the environment was generally good for our approach. The Fund rose 18.95 percent in its fiscal year. The fiscal year began on a positive note, with volatility stemming from U.S.-China trade relations abating throughout the final three months of 2019 as the world’s two largest economies approached and eventually agreed to a “phase one” trade deal. Late-quarter confidence regarding trade was a continuation of an upbeat attitude evident in | | | | October, when investors anticipated, then celebrated the U.S. Federal Reserve Bank’s (the Fed) third interest rate reduction for the calendar year. Throughout the period, the most pronounced threat to stocks all year, the risk of recession highlighted by an inversion of the yield curve in August, retreated as a stream of comforting economic data flowed. The Fund participated in the positive market environment that marked the December quarter, with seven of nine economic sectors represented in its portfolio posting positive absolute returns. Technology and health care holdings, its two biggest concentrations of assets at the time, drove performance. The emergence of the Covid-19 pandemic sparked widespread fear that ultimately pushed major market indexes into bear market territory during the three months through March. The March quarter ended up being the worst quarter since the waning months of the 2008 financial crisis for the S&P 500® Index and the worst quarter since 1987 for the Dow Jones Industrial Average. The Fund participated in the double-digit market downturn, with holdings perceived to be among the most economically sensitive leading the way. Holdings from the technology and consumer discretionary sectors, representing the largest and third largest portfolio positions, respectively, detracted the most from performance. Stocks staged a comeback of historic proportions in the three months through June as aggressive action taken by the government emboldened investors to look beyond near-term economic trouble. From direct payments to individuals from the U.S. Treasury to rock-bottom rates courtesy of the Fed, optimism | | | | stemmed from the government’s various forms of intervention designed to support commerce and market integrity. Portfolio holdings rebounded with the rest of the market. Illustrating the market’s mood reversal, the holdings that led the Fund’s decline in the previous quarter, technology and consumer discretionary holdings, drove the Fund to a double-digit gain in the June quarter. Upbeat sentiment carried into the September quarter, running through July and August. Major market indexes reached new highs in mid-August, bringing an end to the shortest bear market in history. Better-than-expected job gains, housing strength and hope for another round of stimulus maintained the positive mood. The market showed few signs of weakness until September, when negotiations regarding new stimulus appeared at a standstill. Still, the final quarter of the fiscal year was positive in aggregate. Every economic sector represented in the Fund’s portfolio, except for an isolated decline in consumer staples, posted positive absolute returns. Technology and consumer discretionary holdings, which at the time represented the Fund’s largest portfolio positions, contributed the most to the Fund’s return. This commentary reflects the viewpoints of Friess Associates, LLC as of September 30, 2020 and is not intended as a forecast or guarantee of future results. |
4
|
AMG Managers Brandwine Fund Portfolio Manager’s Comments (continued) |
CUMULATIVE TOTAL RETURN PERFORMANCE
AMG Managers Brandywine Fund’s cumulative total return is based on the daily change in net asset value (NAV), and assumes that all dividends and distributions were reinvested. The graph compares a hypothetical $10,000 investment made in the AMG Managers Brandywine Fund’s Class I shares on September 30, 2010, to a $10,000 investment made in the Russell 3000® Growth Index, Russell 3000® Index and S&P 500® Index for the same time period. The graph and table do not reflect the deduction of taxes that a shareholder would pay on a Fund distribution or redemption of shares. The listed returns for the Fund are net of expenses and the returns for the index exclude expenses. Total returns would have been lower had certain expenses not been reduced.
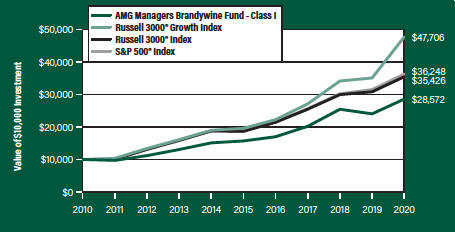
The table below shows the average annual total returns for the AMG Managers Brandywine Fund and the Russell 3000® Growth Index, Russell 3000® Index and S&P 500® Index for the same time periods ended September 30, 2020.
| | | | | | | | | | | | |
Average Annual Total Returns1 | | One Year | | | Five Years | | | Ten Years | |
|
AMG Managers Brandywine Fund2, 3, 4, 5, 6, 7, 8, 9 | |
| | | |
Class I | | | 18.95% | | | | 12.74 | % | | | 11.07% | |
| | | |
Russell 3000® Growth Index10, 13 | | | 36.12% | | | | 19.51 | % | | | 16.91% | |
| | | |
Russell 3000® Index11, 13 | | | 15.00% | | | | 13.69 | % | | | 13.48% | |
| | | |
S&P 500® Index12, 13 | | | 15.15% | | | | 14.15 | % | | | 13.74% | |
The performance data shown represents past performance. Past performance is not a guarantee of future results. Current performance may be lower or higher than the performance data quoted. The investment return and principal value of an investment will fluctuate so that an investor’s shares, when redeemed, may be worth more or less than their original cost.
Investors should carefully consider the Fund’s investment objectives, risks, charges and expenses before investing. For performance information through the most recent month end, current net asset values per share for the Fund and other information, please call 800.548.4539 or visit our website at amgfunds.com for a free prospectus. Read it carefully before investing or sending money.
Distributed by AMG Distributors, Inc., member FINRA/SIPC.
| 1 | Total return equals income yield plus share price change and assumes reinvestment of all dividends and capital gain distributions. Returns are net of fees and may reflect offsets of Fund expenses as described in the prospectus. No adjustment has been made for taxes payable by shareholders on their reinvested dividends and capital gain distributions. Returns for periods greater than one year are annualized. The listed returns on the Fund are net of expenses and based on the published NAV as of September 30, 2020. All returns are in U.S. dollars ($). |
| | |
| | | 2 The Fund returns for all periods prior to October 1, 2013, reflect performance of the predecessor fund, Brandywine Fund, and was managed by Friess Associates, LLC with the same investment objective and substantially similar investment policies. 3 Active and frequent trading of a fund may result in higher transaction costs and increased tax liability. 4 The Fund invests in growth stocks, which may be more sensitive to market movements because their prices tend to reflect future investor expectations rather than just current profits. Growth stocks may underperform value stocks during given periods. 5 Investments in international securities are subject to certain risks of overseas investing including currency fluctuations and changes in political and economic conditions, which could result in significant market fluctuations. These risks are magnified in emerging markets. 6 Companies that are in similar businesses may be similarly affected by particular economic or market events; to the extent the Fund has substantial holdings within a particular sector, the risks associated with that sector increase. 7 The Fund is subject to risks associated with investments in small-capitalization companies, such as erratic earnings patterns, competitive conditions, limited earnings history and a reliance on one or a limited number of products. 8 Market prices of investments held by the Fund may fall rapidly or unpredictably due to a variety of economic or political factors, market conditions, disasters or public health issues, or in response to events that affect particular industries or companies. 9 The Fund is subject to risks associated with investments in mid-capitalization companies such as greater price volatility, lower trading volume, and less liquidity than the stocks of larger, more established companies. 10 The Russell 3000® Growth Index measures the performance of those Russell 3000® Index companies with higher price-to-book ratios and higher forecasted growth values. 11 The Russell 3000® Index is composed of the 3,000 largest U.S. companies as measured by market capitalization, and represents about 98% of the U.S. stock market. 12 The S&P 500® Index is a capitalization-weighted index of 500 stocks. The S&P 500® Index is designed to measure performance of the broad domestic economy through changes in the aggregate market value of 500 stocks representing all major industries. 13 Unlike the Fund, indices are unmanaged, are not available for investment and do not incur expenses. The Russell Indices are trademarks of the London Stock Exchange Group companies. The S&P500® Index is proprietary data of Standard & Poor’s, a division of McGraw-Hill Companies, Inc. All rights reserved. Not FDIC insured, nor bank guaranteed. May lose value. |
5
|
AMG Managers Brandywine Fund Fund Snapshots (unaudited) September 30, 2020 |
PORTFOLIO BREAKDOWN
| | | | | | | | |
Industry (Top Ten) | | AMG Managers Brandywine Fund1 | | | Russell 3000® Growth Index | |
| | | |
Application Software | | | 10.3% | | | | 6.9% | |
| | | |
Interactive Media & Services | | | 6.7% | | | | 7.8% | |
| | | |
Semiconductors | | | 6.4% | | | | 4.8% | |
| | | |
Building Products | | | 5.3% | | | | 0.3% | |
| | | |
Health Care Equipment | | | 4.9% | | | | 2.7% | |
| | | |
Internet & Direct Marketing Retail | | | 4.7% | | | | 8.5% | |
| | | |
Semiconductor Equipment | | | 4.5% | | | | 1.1% | |
| | | |
Interactive Home Entertainment | | | 4.2% | | | | 0.3% | |
| | | |
Electronic Components | | | 3.6% | | | | 0.1% | |
| | | |
Life Sciences Tools & Services | | | 3.4% | | | | 1.5% | |
| | | |
Other Common Stock | | | 43.5% | | | | 66.0% | |
| | | |
Short-Term Investments | | | 4.1% | | | | 0.0% | |
| | | |
Other Assets | | | (1.6)% | | | | 0.0% | |
| 1 | As a percentage of net assets. |
TOP TEN HOLDINGS
| | | | | | | | |
Security Name | | % of Net Assets | | | % Change from Book Cost | |
| | | |
Tandem Diabetes Care, Inc. | | | 4.9 | | | | 126.4 | |
| | | |
Amazon.com, Inc. | | | 4.7 | | | | 69.1 | |
| | | |
Facebook, Inc., Class A | | | 2.9 | | | | (5.2) | |
| | | |
Adobe, Inc. | | | 2.6 | | | | 96.3 | |
| | | |
Generac Holdings, Inc. | | | 2.4 | | | | 69.6 | |
| | | |
Enphase Energy, Inc. | | | 2.4 | | | | 78.2 | |
| | | |
salesforce.com, Inc. | | | 2.3 | | | | 60.9 | |
| | | |
SVMK, Inc. | | | 2.3 | | | | 10.1 | |
| | | |
Corning, Inc. | | | 2.2 | | | | 16.6 | |
| | | |
Activision Blizzard, Inc. | | | 2.2 | | | | 33.6 | |
| | | | | | | | | |
| | | |
Top Ten as a Group | | | 28.9 | | | | | |
| | | | | | | | | |
| | | | | | | | | |
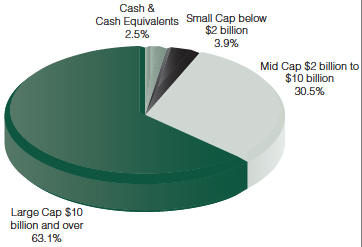
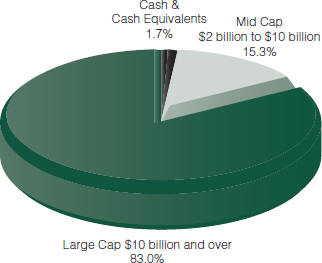
PORTFOLIO MARKET CAPITALIZATION
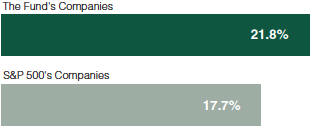
ESTIMATED EARNINGS GROWTH RATE OF THE FUND’S INVESTMENTS
Forecasted Increase in Earnings Per Share 2021 vs 2020
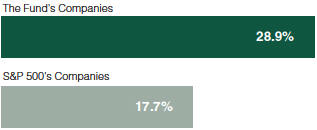
Source: Consensus estimates from FactSet Research Systems Inc.
This is not a forecast of the Fund’s future performance. Earnings growth for a Fund holding does not guarantee a corresponding increase in the market value of the holding or the Fund.
Because a fund’s strategy may result in multiple investments in particular sectors of the economy, its performance may depend on the performance of those sectors and may fluctuate more widely than investments diversified across more sectors. For additional information on these and other risk considerations, please see the Fund’s prospectus.
Any sectors, industries, or securities discussed should not be perceived as investment recommendations. Mention of a specific security should not be considered a recommendation to buy or solicitation to sell that security. Specific securities mentioned in this report may have been sold from the Fund’s portfolio of investments by the time you receive this report.
6
|
AMG Managers Brandywine Fund Roses and Thorns (unaudited) Quarter Ending September 30, 2020 |
| | | | | | |
$ Gain (in millions) | | % Gain | | | Biggest $ Winners Reason for Move |
| | |
| $8.3 | | | 73.6% | | | Enphase Energy Inc. (ENPH) |
| | |
| | | | | | | The maker of microinverter systems used in solar photovoltaics reported June-quarter earnings of $0.17 per share, exceeding the consensus estimate. Enphase benefitted from strong demand for residential solar installations. The company also began North American shipments of a new battery storage system product. |
| | |
| $7.5 | | | 61.8% | | | Advanced Micro Devices Inc. (AMD) |
| | |
| | | | | | | The semiconductor manufacturer earned $0.18 per share in the June quarter, up from $0.08 in the year-ago period and ahead of the consensus estimate. Market-share gains and strong personal computer and server demand drove results. The company also raised its full-year guidance. |
| | |
| $7.3 | | | 58.8% | | | Generac Holdings Inc. (GNRC) |
| | |
| | | | | | | The company, which makes power generation equipment, grew June-quarter earnings 17 percent, exceeding the consensus estimate. With more people spending more time at home, sales of residential standby generators increased 30 percent. The company raised guidance for the remainder of the year. |
| | |
| $6.1 | | | 49.4% | | | Chewy Inc. (CHWY) |
| | |
| | | | | | | The online retailer of pet-related products exceeded June-quarter expectations with 47 percent revenue growth. Customers viewed the company’s e-commerce fulfillment of pet foods and other products as a favorable alternative to in-person shopping amid pandemic restrictions and risks. Auto-ship sales, a source of recurring revenue, rose 50 percent during the quarter. |
| | |
| $5.5 | | | 49.4% | | | Twitter Inc. (TWTR) |
| | |
| | | | | | | Shares of Twitter, a microblogging and social networking service, increased amid enthusiasm for rebounding advertising trends. The three months through June represented the company’s sixth consecutive quarter of growth in monetizable daily active usage, meaning the audience for advertising on Twitter continued to expand. |
| | |
$Loss
(in millions) | | % Loss | | | Biggest $ Losers Reason for Move |
| | |
| $3.2 | | | 22.3% | | | Ciena Corp. (CIEN) |
| | |
| | | | | | | The provider of network and communications infrastructure grew July-quarter earnings 49 percent, exceeding the consensus estimate by 28 percent. Revenue growth also topped expectations. Shares declined when Ciena reduced near-term sales guidance, citing customer efforts to conserve cash amid macro headwinds and tight Covid-19 restrictions in India as impediments to growth in coming quarters. |
| | |
| $3.1 | | | 20.1% | | | Advanced Energy Industries Inc. (AEIS) |
| | |
| | | | | | | The company, which provides products used in semiconductor manufacturing and thin film plasma processes, earned $1.18 per share in the June quarter, up from $0.45 in the year-ago period and ahead of the consensus estimate. Purchased in August, shares declined as semiconductor capital equipment stocks joined other technology stocks in leading the market lower in September as investors grew anxious regarding a lack of progress in negotiations for economic stimulus. |
| | |
| $2.8 | | | 23.8% | | | Sabre Corp. (SABR) |
| | |
| | | | | | | While early signs of recovery in the travel space emerged incrementally, results for the technology solutions provider for the global travel and tourism industry showed that it was premature to expect a broader rebound in the three months through June. Bookings stabilized in the middle of the quarter, but a high level of cancellations early in the period resulted in disappointing overall results. |
| | |
| $2.5 | | | 17.0% | | | Calix Inc. (CALX) |
| | |
| | | | | | | The maker of telecommunications network equipment performed well in the summer months as results showed that increased internet usage spurred demand for its broadband access systems. The company earned $1.70 per share in the June quarter, far exceeding the consensus estimate of $0.06. Shares declined in September as Calix joined other technology stocks in leading the market lower as investors grew anxious regarding a lack of progress in negotiations for economic stimulus. |
| | |
| $2.3 | | | 33.2% | | | GoHealth Inc. (GOCO) |
| | |
| | | | | | | The internet-based health insurance marketplace operator reported solid June-quarter results, its first quarterly report since becoming a public company. Several lawsuits filed in relation to the company’s initial public offering raised investor concerns and weighed on GoHealth’s stock price. |
All gains/losses are calculated on an average cost basis from June 30, 2020 through September 30, 2020. Companies still held at the end of the period appear in the accompanying Schedule of Portfolio Investments.
This commentary reflects the viewpoints of Friess Associates, LLC as of September 30, 2020, and is not intended as a forecast or guarantee of future results.
7
|
AMG Managers Brandywine Fund Schedule of Portfolio Investments September 30, 2020 |
| | | | | | | | | | | | |
| | | |
| Shares | | | | | Cost | | | Value | |
| |
| | Common Stocks - 97.5% | | | | | |
| |
| | Communication Services | | | | | |
| | |
| | | | Interactive Home Entertainment - 4.2% | | | | | |
| | | |
| | 229,786 | | | Activision Blizzard, Inc. | | | $13,922,090 | | | | $18,601,177 | |
| | | |
| | 124,311 | | | Electronic Arts, Inc.* | | | 12,057,369 | | | | 16,211,397 | |
| | |
| | | | Interactive Media & Services - 6.7% | | | | | |
| | | |
| | 91,150 | | | Facebook, Inc., Class A* | | | 25,172,850 | | | | 23,872,185 | |
| | | |
| | 592,433 | | | Snap, Inc., Class A* | | | 14,239,696 | | | | 15,468,426 | |
| | | |
| | 373,239 | | | Twitter, Inc. * | | | 12,258,691 | | | | 16,609,135 | |
| | |
| | | | Movies & Entertainment - 2.2% | | | | | |
| | | |
| | 27,338 | | | Netflix, Inc.* | | | 9,694,441 | | | | 13,669,820 | |
| | | |
| | 183,303 | | | Warner Music Group Corp., Class A | | | 5,486,217 | | | | 5,268,129 | |
| | | | | | | | | | | | |
| | |
| | Total Communication Services | | | 92,831,354 | | | | 109,700,269 | |
| | |
| | | | This sector is 18.2% above your Fund’s cost. | | | | |
| | |
| | Consumer Discretionary | | | | | | | | |
| | |
| | | | Apparel, Accessories & Luxury Goods - 1.7% | | | | | |
| | | |
| | 205,184 | | | VF Corp. | | | 15,462,074 | | | | 14,414,176 | |
| | |
| | | | Automotive Retail - 0.8% | | | | | |
| | | |
| | 137,292 | | | Penske Automotive Group, Inc. | | | 6,505,173 | | | | 6,543,337 | |
| | |
| | | | Education Services - 1.4% | | | | | |
| | | |
| | 166,526 | | | Chegg, Inc.*,1 | | | 6,085,780 | | | | 11,896,617 | |
| | |
| | | | Footwear - 2.0% | | | | | |
| | | |
| | 382,009 | | | Crocs, Inc.* | | | 10,461,251 | | | | 16,323,245 | |
| | |
| | | | Home Improvement Retail - 2.5% | | | | | |
| | | |
| | 155,270 | | | Floor & Decor Holdings, Inc., Class A* | | | 10,872,018 | | | | 11,614,196 | |
| | | |
| | 596,546 | | | GrowGeneration Corp.*,1 | | | 9,544,259 | | | | 9,532,805 | |
| | |
| | | | Internet & Direct Marketing Retail - 4.7% | | | | | |
| | | |
| | 12,382 | | | Amazon.com, Inc.* | | | 23,060,330 | | | | 38,987,575 | |
| | |
| | | | Leisure Products - 1.5% | | | | | |
| | | |
| | 273,842 | | | YETI Holdings, Inc.* | | | 11,670,738 | | | | 12,410,519 | |
| | |
| | | | Specialty Stores - 1.7% | | | | | |
| | | |
| | 98,696 | | | Tractor Supply Co. | | | 14,752,314 | | | | 14,147,085 | |
| | | | | | | | | | | | |
| | |
| | Total Consumer Discretionary | | | 108,413,937 | | | | 135,869,555 | |
| | |
| | | | This sector is 25.3% above your Fund’s cost. | | | | |
| |
| | Financials | | | | | |
| | |
| | | | Property & Casualty Insurance - 1.7% | | | | | |
| | | |
| | 283,069 | | | First American Financial Corp. | | | 14,979,736 | | | | 14,411,043 | |
| | |
| | | | This sector is 3.8% below your Fund’s cost. | | | | |
| | |
| | Health Care | | | | | | | | |
| | |
| | | | Health Care Equipment - 4.9% | | | | | |
| | | |
| | 360,874 | | | Tandem Diabetes Care, Inc.* | | | 18,088,286 | | | | 40,959,199 | |
| | |
| | | | Health Care Technology - 0.2% | | | | | |
| | | |
| | 32,380 | | | GoodRx Holdings, Inc., Class A* | | | 1,490,775 | | | | 1,800,328 | |
| | | | | | | | | | | | |
| | | |
| Shares | | | | | Cost | | | Value | |
| | |
| | | | Life Sciences Tools & Services - 3.4% | | | | | |
| | | |
| | 96,313 | | | Repligen Corp.* | | | $14,543,337 | | | | $14,210,020 | |
| | | |
| | 32,617 | | | Thermo Fisher Scientific, Inc. | | | 5,572,949 | | | | 14,401,058 | |
| | |
| | | | Pharmaceuticals - 1.8% | | | | | |
| | | |
| | 88,809 | | | Zoetis, Inc. | | | 12,146,650 | | | | 14,686,344 | |
| | | | | | | | | | | | |
| | |
| | Total Health Care | | | 51,841,997 | | | | 86,056,949 | |
| | |
| | | | This sector is 66.0% above your Fund’s cost. | | | | |
| | |
| | Industrials | | | | | | | | |
| | |
| | | | Aerospace & Defense - 1.7% | | | | | |
| | | |
| | 30,094 | | | TransDigm Group, Inc. | | | 15,371,503 | | | | 14,298,261 | |
| | |
| | | | Agricultural & Farm Machinery - 1.4% | | | | | |
| | | |
| | 145,204 | | | The Toro Co. | | | 10,043,392 | | | | 12,189,876 | |
| | |
| | | | Building Products - 5.3% | | | | | |
| | | |
| | 265,122 | | | Masco Corp. | | | 15,176,870 | | | | 14,616,176 | |
| | | |
| | 230,006 | | | Owens Corning | | | 15,354,684 | | | | 15,826,713 | |
| | | |
| | 243,170 | | | UFP Industries, Inc. | | | 11,713,862 | | | | 13,741,536 | |
| | |
| | | | Electrical Components & Equipment - 2.4% | | | | | |
| | | |
| | 102,380 | | | Generac Holdings, Inc.* | | | 11,689,458 | | | | 19,824,863 | |
| | |
| | | | Railroads - 1.7% | | | | | |
| | | |
| | 179,277 | | | CSX Corp. | | | 14,268,153 | | | | 13,924,445 | |
| | |
| | | | Research & Consulting Services - 1.9% | | | | | |
| | | |
| | 509,235 | | | Clarivate PLC (Jersey)* | | | 15,108,180 | | | | 15,781,193 | |
| | |
| | | | Trucking - 1.4% | | | | | |
| | | |
| | 287,155 | | | Knight-Swift Transportation Holdings, Inc. | | | 12,178,746 | | | | 11,687,208 | |
| | | | | | | | | | | | |
| | |
| | Total Industrials | | | 120,904,848 | | | | 131,890,271 | |
| | |
| | | | This sector is 9.1% above your Fund’s cost. | | | | |
| |
| | Information Technology | | | | | |
| | |
| | | | Application Software - 10.3% | | | | | |
| | | |
| | 45,070 | | | Adobe, Inc.* | | | 11,261,231 | | | | 22,103,680 | |
| | | |
| | 75,800 | | | salesforce.com, Inc.* | | | 11,837,726 | | | | 19,050,056 | |
| | | |
| | 849,968 | | | SVMK, Inc.* | | | 17,062,354 | | | | 18,792,792 | |
| | | |
| | 34,337 | | | The Trade Desk, Inc., Class A* | | | 14,965,795 | | | | 17,813,349 | |
| | | |
| | | | Zoom Video Communications, Inc., | | | | | | | | |
| | | |
| | 17,751 | | | Class A* | | | 8,019,973 | | | | 8,344,923 | |
| | |
| | | | Communications Equipment - 2.0% | | | | | |
| | | |
| | 689,296 | | | Calix, Inc.* | | | 14,769,842 | | | | 12,255,683 | |
| | | |
| | 60,267 | | | Lumentum Holdings, Inc.* | | | 3,040,880 | | | | 4,527,860 | |
| | |
| | | | Data Processing & Outsourced Services - 3.3% | | | | | |
| | | |
| | 62,400 | | | Global Payments, Inc. | | | 11,300,463 | | | | 11,080,992 | |
| | | |
| | 49,387 | | | Mastercard, Inc., Class A | | | 9,582,574 | | | | 16,701,202 | |
| | |
| | | | Electronic Components - 3.6% | | | | | |
| | | |
| | 579,626 | | | Corning, Inc. | | | 16,104,370 | | | | 18,785,679 | |
The accompanying notes are an integral part of these financial statements.
8
|
AMG Managers Brandywine Fund Schedule of Portfolio Investments (continued) |
| | | | | | | | | | | | |
Shares | | | | | Cost | | | Value | |
| |
| | Information Technology (continued) | | | | | |
| | |
| | | | Electronic Components - 3.6% (continued) | | | | | |
| | | |
| | 747,046 | | | Knowles Corp.* | | | $11,969,602 | | | | $11,130,985 | |
| | |
| | | | Internet Services & Infrastructure - 1.9% | | | | | |
| | | |
| | 8,147 | | | Snowflake, Inc., Class A*,1 | | | 1,996,341 | | | | 2,044,897 | |
| | | |
| | 56,969 | | | Twilio, Inc., Class A* | | | 15,040,269 | | | | 14,076,470 | |
| | |
| | | | Semiconductor Equipment - 4.5% | | | | | |
| | | |
| | 192,584 | | | Advanced Energy Industries, Inc.* | | | 15,173,630 | | | | 12,121,237 | |
| | | |
| | 238,152 | | | Enphase Energy, Inc.*,1 | | | 11,034,600 | | | | 19,668,973 | |
| | | |
| | 65,945 | | | Teradyne, Inc. | | | 5,749,751 | | | | 5,239,990 | |
| | | |
| | | | Semiconductors - 6.4% | | | | | | | | |
| | | |
| | 118,735 | | | Inphi Corp.* | | | 14,987,541 | | | | 13,328,004 | |
| | | |
| 86,651 | | | NXP Semiconductors, N.V.
(Netherlands) | | | 11,113,944 | | | | 10,814,911 | |
| | | |
| | 99,931 | | | Skyworks Solutions, Inc. | | | 14,752,046 | | | | 14,539,961 | |
| | | |
| | 81,330 | | | Universal Display Corp.1 | | | 15,058,449 | | | | 14,699,584 | |
| | | |
| | | | Systems Software - 1.9% | | | | | | | | |
| | | |
| | 114,150 | | | Zscaler, Inc.* | | | 7,671,479 | | | | 16,059,763 | |
| | |
| | | | Technology Hardware, Storage & Peripherals - 2.1% | | | | | |
| | | |
| | 151,428 | | | Apple, Inc. | | | 10,893,427 | | | | 17,536,877 | |
| | | | | | | | | | | | |
| | |
| | Total Information Technology | | | 253,386,287 | | | | 300,717,868 | |
| | |
| | | | This sector is 18.7% above your Fund’s cost. | | | | |
| | |
| | Materials | | | | | | | | |
| | | |
| | | | Metal & Glass Containers - 1.1% | | | | | | | | |
| | | |
| | 115,486 | | | Crown Holdings, Inc.* | | | 8,760,872 | | | | 8,876,254 | |
| | |
| | | | This sector is 1.3% above your Fund’s cost. | | | | |
| | |
| | Real Estate | | | | | | | | |
| | | |
| | | | Residential REITs - 1.5% | | | | | | | | |
| | | |
| | 88,552 | | | Sun Communities, Inc. | | | 12,560,351 | | | | 12,451,297 | |
| | | |
| | | | Specialized REITs - 1.7% | | | | | | | | |
| | | |
| | 44,619 | | | SBA Communications Corp. | | | 14,062,100 | | | | 14,210,259 | |
| | | | | | | | | | | | |
| | |
| | Total Real Estate | | | 26,622,451 | | | | 26,661,556 | |
| | |
| | | | This sector is 0.1% above your Fund’s cost. | | | | |
| | |
| | Total Common Stocks | | | 677,741,482 | | | | 814,183,765 | |
| | | |
Principal Amount | | | | | | | | | |
| |
| | Short-Term Investments - 4.1% | | | | | |
| |
| | Joint Repurchase Agreements - 1.4%2 | | | | | |
| | $446,605 | | | Bank of America Securities, Inc., dated 09/30/20, due 10/01/20, 0.060% total to be received $446,606 (collateralized by various U.S. Treasuries, 1.250% - 2.375%, 10/31/21 - 05/15/29, totaling $455,537) | | | 446,605 | | | | 446,605 | |
| | | | | | | | | | | | |
Principal Amount | | | | | Cost | | | Value | |
| | | |
| | $1,280,801 | | | Cantor Fitzgerald Securities, Inc., dated 09/30/20, due 10/01/20, 0.100% total to be received $1,280,805 (collateralized by various U.S. Government Agency Obligations, 0.415% - 9.000%, 10/25/20 - 06/20/69, totaling $1,306,417) | | | $1,280,801 | | | | $1,280,801 | |
| | | |
| 1,594,698 | | | Citadel Securities LLC, dated 09/30/20, due 10/01/20, 0.120% total to be received $1,594,703 (collateralized by various U.S. Treasuries, 0.000% - 7.500%, 10/08/20 - 08/15/50, totaling $1,626,599) | | | 1,594,698 | | | | 1,594,698 | |
| | | |
| 2,744,369 | | | Citigroup Global Markets, Inc., dated 09/30/20, due 10/01/20, 0.080% total to be received $2,744,375 (collateralized by various U.S. Government Agency Obligations and U.S. Treasuries, 0.000% - 4.625%, 11/27/20 - 11/01/59, totaling $2,799,257) | | | 2,744,369 | | | | 2,744,369 | |
| | | |
| 2,744,369 | | | MUFG Securities America, Inc., dated 09/30/20, due 10/01/20, 0.080% total to be received $2,744,375 (collateralized by various U.S. Government Agency Obligations, 2.000% - 5.000%, 08/01/35 - 09/01/50, totaling $2,799,256) | | | 2,744,369 | | | | 2,744,369 | |
| | | |
| 2,744,369 | | | RBC Dominion Securities, Inc., dated 09/30/20, due 10/01/20, 0.080% total to be received $2,744,375 (collateralized by various U.S. Government Agency Obligations and U.S. Treasuries, 0.000% - 5.500%, 10/27/20 - 07/15/61, totaling $2,799,256) | | | 2,744,369 | | | | 2,744,369 | |
| | | | | | | | | | | | |
| | | |
| | | | Total Joint Repurchase Agreements | | | 11,555,211 | | | | 11,555,211 | |
| | | |
| Shares | | | | | | | | | |
| | Other Investment Companies - 2.7% | | | | | |
| | | |
| | 7,353,450 | | | Dreyfus Government Cash Management Fund, Institutional Shares, 0.02%3 | | | 7,353,450 | | | | 7,353,450 | |
| | | |
| 7,353,450 | | | Dreyfus Institutional Preferred Government Money Market Fund, Institutional Shares, 0.04%3 | | | 7,353,450 | | | | 7,353,450 | |
| | | |
| 7,576,282 | | | JPMorgan U.S. Government Money Market Fund, IM Shares, 0.06%3 | | | 7,576,282 | | | | 7,576,282 | |
| | | |
| | | | Total Other Investment Companies | | | 22,283,182 | | | | 22,283,182 | |
| | | | | | | | | | | | |
| | |
| | Total Short-Term Investments | | | 33,838,393 | | | | 33,838,393 | |
| | |
| | Total Investments - 101.6% | | | 711,579,875 | | | | 848,022,158 | |
| | |
| | Other Assets, less Liabilities - (1.6%) | | | | | | | (12,964,986 | ) |
| | Total Net Assets - 100.0% | | | | | | | $835,057,172 | |
| | | | | | | | | | | | |
The accompanying notes are an integral part of these financial statements.
9
|
AMG Managers Brandywine Fund Schedule of Portfolio Investments (continued) |
| * | Non-income producing security. |
| 1 | Some of these securities, amounting to $19,656,225 or 2.4% of net assets, were out on loan to various borrowers and are collateralized by cash and various U.S. Treasury Obligations. See Note 4 of Notes to Financial Statements. |
| 2 | Cash collateral received for securities lending activity was invested in these joint repurchase agreements. |
| 3 | Yield shown represents the September 30, 2020, seven day average yield, which refers to the sum of the previous seven days’ dividends paid, expressed as an annual percentage. |
REITs Real Estate Investment Trusts
The following table summarizes the inputs used to value the Fund’s investments by the fair value hierarchy levels as of September 30, 2020:
| | | | | | | | | | | | | | | | |
| | | Level 1 | | | Level 2 | | | Level 3 | | | Total | |
| | | | |
Investments in Securities | | | | | | | | | | | | | | | | |
| | | | |
Common Stocks† | | | $814,183,765 | | | | — | | | | — | | | $ | 814,183,765 | |
| | | | |
Short-Term Investments | | | | | | | | | | | | | | | | |
| | | | |
Joint Repurchase Agreements | | | — | | | $ | 11,555,211 | | | | — | | | | 11,555,211 | |
| | | | |
Other Investment Companies | | | 22,283,182 | | | | — | | | | — | | | | 22,283,182 | |
| | | | | | | | | | | | | | | | |
| | | | |
Total Investments in Securities | | | $836,466,947 | | | $ | 11,555,211 | | | | — | | | $ | 848,022,158 | |
| | | | | | | | | | | | | | | | |
| † | All common stocks held in the Fund are Level 1 securities. For a detailed breakout of common stocks by major industry classification, please refer to the Fund’s Schedule of Portfolio Investments. |
For the fiscal year ended September 30, 2020, there were no transfers in or out of Level 3.
The accompanying notes are an integral part of these financial statements.
10
|
AMG Managers Brandywine Blue Fund Portfolio Manager’s Comments (unaudited) |
| | | | |
The 12 months through September included exceptional extremes, beginning with the stock market’s upward progress being dramatically disrupted by the emergence of a global pandemic. Investors quickly accepted the near-term economic consequences and chose to view the prospects for recovery with enthusiasm, resulting in solid gains in large-cap benchmarks. AMG Managers Brandywine Blue Fund (the “Fund”) employs an investment strategy designed to capitalize on the relationship between operational performance and share prices by isolating companies with superior earnings profiles. While recognizing that broad factors can influence stocks for fleeting periods, this approach is based on the premise that individual-company fundamentals determine stock prices over the long haul. Given the far-reaching impact of the health crisis, macro factors were a significant market influence for much of the fiscal year. Still, the government’s swift and sizable response to the pandemic appeared to be the most pronounced macro influence, contributing to positive investor sentiment. The Fund’s earnings-driven investment strategy was generally effective in this climate. The Fund rose 27.84 percent in the fiscal year. The fiscal year began with some relief in October as investors applauded a third interest rate reduction by the U.S. Federal Reserve Bank. Volatility picked up as economic uncertainty resurfaced later in the final quarter of 2019 due to heightened trade tensions between the U.S. and China. The market’s mood became decidedly positive toward the end of the | | December quarter as the two countries reached a partial agreement. Fund holdings generated positive absolute returns in six of the nine economic sectors represented in the portfolio during the December quarter. Technology holdings, which comprised the Fund’s largest portfolio position, contributed the most to performance. Health care holdings, which represented the second largest portfolio position, were the second biggest contributors to results. Marred by the emergence of the Covid-19 crisis, the March quarter, spanning the first three months of 2020, was the worst quarter for the S&P 500® Index since the 2008 financial crisis. As fighting the pandemic prompted shutdowns, shelter-in-place orders and resource realignment, investors fled cyclical economic sectors. Record jobless claims further dampened expectations for companies in any way reliant on discretionary spending on the part of business or consumer customers. Performance trends reversed in the bear-market conditions of the March quarter. Every economic sector represented in the Fund declined. Technology and health care holdings, the Fund’s two largest portfolio positions at the time, went from being the biggest positive performance influences in the December quarter to the biggest performance detractors in the March quarter. There was no shortage of developments with potential to rattle investors during the three months through June, including the continuing pandemic, dismal economic data points and mass protests across the country. Still, investors bet on the promise | | of an unprecedented $1.6 trillion stimulus package above all else. With very few exceptions, investor sentiment was overtly positive in the June quarter. Technology holdings, which still represented the largest portfolio position, contributed the most to performance amid the market’s upbeat mood. Holdings from the consumer discretionary and health care sectors contributed to June-quarter performance as well. While the pace slowed some, the market maintained its upward bias in the final quarter of the fiscal year. Hope among investors that the government would provide additional economic stimulus fueled optimism through the first couple months of the September quarter. The S&P 500® reached a new all-time high in mid-August, ending the bear-market recovery in record time. Volatility picked up in September as stimulus negotiations stalled, but stocks still managed to preserve healthy gains for the quarter. Holdings from every economic sector represented in the Fund portfolio posted positive absolute returns. Technology holdings, led by semiconductor-related companies, were again top performance contributors. Holdings from the industrial, communication services and consumer discretionary sectors were also material performance contributors. This commentary reflects the viewpoints of Friess Associates, LLC as of September 30, 2020 and is not intended as a forecast or guarantee of future results. |
11
|
AMG Managers Brandywine Blue Fund Portfolio Manager’s Comments (unaudited) |
CUMULATIVE TOTAL RETURN PERFORMANCE
AMG Managers Brandywine Blue Fund’s cumulative total return is based on the daily change in net asset value (NAV), and assumes that all dividends and distributions were reinvested. The graph compares a hypothetical $10,000 investment made in the AMG Managers Brandywine Blue Fund’s Class I shares on September 30, 2010, to a $10,000 investment made in the Russell 1000® Growth Index, Russell 1000® Index and S&P 500® Index for the same time period. The graph and table do not reflect the deduction of taxes that a shareholder would pay on a Fund distribution or redemption of shares. The listed returns for the Fund are net of expenses and the returns for the index exclude expenses.
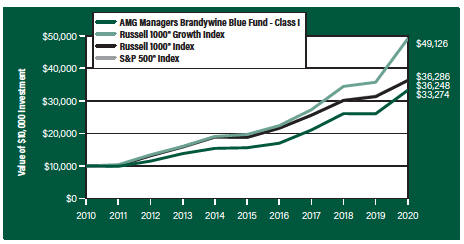
The table below shows the average annual total returns for the AMG Managers Brandywine Blue Fund and the Russell 1000® Growth Index, Russell 1000® Index and S&P 500® Index for the same time periods ended September 30, 2020.
| | | | | | |
Average Annual Total Returns1 | | One Year | | Five Years | | Ten Years |
|
AMG Managers Brandywine Blue Fund2, 3, 4, 5, 6, 7, 8, 9 |
Class I | | 27.84% | | 16.37% | | 12.77% |
Russell 1000® Growth Index10, 13 | | 37.53% | | 20.10% | | 17.25% |
Russell 1000® Index11, 13 | | 16.01% | | 14.09% | | 13.76% |
S&P 500® Index12, 13 | | 15.15% | | 14.15% | | 13.74% |
The performance data shown represents past performance. Past performance is not a guarantee of future results. Current performance may be lower or higher than the performance data quoted. The investment return and principal value of an investment will fluctuate so that an investor’s shares, when redeemed, may be worth more or less than their original cost.
Investors should carefully consider the Fund’s investment objectives, risks, charges and expenses before investing. For performance information through the most recent month end, current net asset values per share for the Fund and other information, please call 800.548.4539 or visit our website at amgfunds.com for a free prospectus. Read it carefully before investing or sending money.
Distributed by AMG Distributors, Inc., member FINRA/SIPC.
| 1 | Total return equals income yield plus share price change and assumes reinvestment of all dividends and capital gain distributions. Returns are net of fees and may reflect offsets of Fund expenses as described in the prospectus. No adjustment has been made for taxes payable by shareholders on their reinvested dividends and capital gain distributions. Returns for periods greater than one year are annualized. The listed returns on the Fund are net of expenses and based on the published NAV as of September 30, 2020. All returns are in U.S. dollars ($). |
| | |
| | | 2 The Fund returns for all periods prior to October 1, 2013, reflect performance of the predecessor fund, Brandywine Blue Fund, and was managed by Friess Associates, LLC with the same investment objective and substantially similar investment policies. 3 Active and frequent trading of a fund may result in higher transaction costs and increased tax liability. 4 A greater percentage of the Fund’s holdings may be focused in a smaller number of securities which may place the Fund at greater risk than a more diversified fund. 5 Investments in international securities are subject to certain risks of overseas investing including currency fluctuations and changes in political and economic conditions, which could result in significant market fluctuations. These risks are magnified in emerging markets. 6 Companies that are in similar businesses may be similarly affected by particular economic or market events; to the extent the Fund has substantial holdings within a particular sector, the risks associated with that sector increase. 7 Market prices of investments held by the Fund may fall rapidly or unpredictably due to a variety of economic or political factors, market conditions, disasters or public health issues, or in response to events that affect particular industries or companies. 8 The Fund invests in growth stocks, which may be more sensitive to market movements because their prices tend to reflect future investor expectations rather than just current profits. Growth stocks may underperform value stocks during given periods. 9 The Fund is subject to risks associated with investments in mid-capitalization companies such as greater price volatility, lower trading volume, and less liquidity than the stocks of larger, more established companies. 10 The Russell 1000® Growth Index is a market capitalization weighted index that measures the performance of those Russell 1000® companies with higher price-to-book ratios and higher forecasted growth values. 11 The Russell 1000® Index measures the performance of approximately 1,000 of the largest securities based on a combination of their market cap and current index membership. The Russell 1000® Index represents approximately 92% of the U.S. market. 12 The S&P 500® Index is a capitalization-weighted index of 500 stocks. The S&P 500® Index is designed to measure performance of the broad domestic economy through changes in the aggregate market value of 500 stocks representing all major industries. 13 Unlike the Fund, indices are unmanaged, are not available for investment and do not incur expenses. The Russell Indices are trademarks of the London Stock Exchange Group companies. The S&P 500® Index is proprietary data of Standard & Poor’s, a division of McGraw-Hill Companies, Inc. All rights reserved. Not FDIC insured, nor bank guaranteed. May lose value. |
12
|
AMG Managers Brandywine Blue Fund Fund Snapshots (unaudited) Septemer 30, 2020 |
PORTFOLIO BREAKDOWN
| | | | | | | | |
| Industry (Top Ten) | | AMG Managers Brandywine Blue Fund1 | | | Russell 1000® Growth Index | |
| | | |
Application Software | | | 10.5 | % | | | 6.9 | % |
| | | |
Interactive Media & Services | | | 8.9 | % | | | 8.2 | % |
| | | |
Semiconductors | | | 7.3 | % | | | 5.0 | % |
| | | |
Interactive Home Entertainment | | | 5.7 | % | | | 0.3 | % |
| | | |
Internet & Direct Marketing Retail | | | 5.4 | % | | | 8.9 | % |
| | | |
Building Products | | | 4.9 | % | | | 0.2 | % |
| | | |
Data Processing & Outsourced Services | | | 4.8 | % | | | 6.6 | % |
| | | |
Life Sciences Tools & Services | | | 4.8 | % | | | 1.5 | % |
| | | |
Technology Hardware, Storage & Peripherals | | | 3.2 | % | | | 11.4 | % |
| | | |
Internet Services & Infrastructure | | | 3.2 | % | | | 0.7 | % |
| | | |
Other Common Stock | | | 39.6 | % | | | 50.3 | % |
| | | |
Short-Term Investments | | | 4.0 | % | | | 0.0 | % |
| | | |
Other Assets | | | (2.3 | )% | | | 0.0 | % |
| 1 | As a percentage of net assets. |
TOP TEN HOLDINGS
| | | | |
| Security Name | | % of Net Assets | | % Change from Book Cost |
| | | |
Amazon.com, Inc. | | 5.4 | | 71.0 |
| | | |
salesforce.com, Inc. | | 3.6 | | 58.4 |
| | | |
The Trade Desk, Inc., Class A | | 3.3 | | 16.8 |
| | | |
Apple, Inc. | | 3.2 | | 57.5 |
| | | |
Snap, Inc. | | 3.2 | | 7.9 |
| | | |
Netflix, Inc. | | 3.1 | | 34.7 |
| | | |
Corning, Inc. | | 3.0 | | 15.1 |
| | | |
Facebook, Inc., Class A | | 3.0 | | (4.1) |
| | | |
Skyworks Solutions, Inc. | | 3.0 | | (1.6) |
| | | |
Thermo Fisher Scientific, Inc. | | 3.0 | | 130.4 |
| | | | | |
| | | |
Top Ten as a Group | | 33.8 | | |
| | | | | |
| | | | | |
PORTFOLIO MARKET CAPITALIZATION
ESTIMATED EARNINGS GROWTH RATE OF THE FUND’S INVESTMENTS
Forecasted Increase in Earnings Per Share 2021 vs 2020
Source: Consensus estimates from FactSet Research Systems Inc.
This is not a forecast of the Fund’s future performance. Earnings growth for a Fund holding does not guarantee a corresponding increase in the market value of the holding or the Fund.
Because a fund’s strategy may result in multiple investments in particular sectors of the economy, its performance may depend on the performance of those sectors and may fluctuate more widely than investments diversified across more sectors. For additional information on these and other risk considerations, please see the Fund’s prospectus.
Any sectors, industries, or securities discussed should not be perceived as investment recommendations. Mention of a specific security should not be considered a recommendation to buy or solicitation to sell that security. Specific securities mentioned in this report may have been sold from the Fund’s portfolio of investments by the time you receive this report.
13
|
AMG Managers Brandywine Blue Fund Roses and Thorns (unaudited) Quarter Ending September 30, 2020 |
| | | | | | |
$ Gain (in millions) | | % Gain | | Biggest $ Winners Reason for Move |
| $2.5 | | 61.8% | | Advanced Micro Devices Inc. (AMD) |
| | | | | The semiconductor manufacturer earned $0.18 per share in the June quarter, up from $0.08 in the year-ago period and ahead of the consensus estimate. Market-share gains and strong personal computer and server demand drove results. The company also raised its full-year guidance. |
| $2.3 | | 73.6% | | Enphase Energy Inc. (ENPH) |
| | | | | The maker of microinverter systems used in solar photovoltaics reported June-quarter earnings of $0.17 per share, exceeding the consensus estimate. Enphase benefitted from strong demand for residential solar installations. The company also began North American shipments of a new battery storage system product. |
| $2.2 | | 57.0% | | Generac Holdings Inc. (GNRC) |
| | | | | The company, which makes power generation equipment, grew June-quarter earnings 17 percent, exceeding the consensus estimate. With more people spending more time at home, sales of residential standby generators increased 30 percent. The company raised guidance for the remainder of the year. |
| $2.0 | | 33.9% | | Salesforce.com (CRM) |
| | | | | The company, which offers cloud-based enterprise software for customer relationship management, earned $1.44 per share in the July quarter, up from $0.66 in the year-ago period and more than double the consensus estimate. Revenue increased 29 percent. New customer wins and subscription-and-support revenue were highlights. |
| $1.7 | | 49.4% | | Twitter Inc. (TWTR) |
| | | | | Shares of Twitter, a microblogging and social networking service, increased amid enthusiasm for rebounding advertising trends. The three months through June represented the company’s sixth consecutive quarter of growth in monetizable daily active usage, meaning the audience for advertising on Twitter continued to expand. |
| | |
$ Loss
(in millions) | | % Loss | | Biggest $ Losers Reason for Move |
| $1.2 | | 22.7% | | Ciena Corp. (CIEN) |
| | | | | The provider of network and communications infrastructure grew July-quarter earnings 49 percent, exceeding the consensus estimate by 28 percent. Revenue growth also topped expectations. Shares declined when Ciena reduced near-term sales guidance, citing customer efforts to conserve cash amid macro headwinds and tight Covid-19 restrictions in India as impediments to growth in coming quarters. |
| $0.5 | | 14.5% | | Exact Sciences Corp. (EXAS) |
| | | | | The diagnostics company focused on the detection of colorectal cancer grew June-quarter revenue 35 percent. Results showed some disruption to sales of the company’s flagship Cologuard testing kits. Also, Illumina, which makes tools used in life sciences research, acquired Grail, a private maker of blood-based diagnostics tests, resulting in a combined entity that some view as a competitive threat to Exact Sciences. |
| $0.4 | | 6.4% | | Twilio Inc. (TWLO) |
| | | | | Purchased in late August, Twilio shares declined with other cloud-based software makers that were previously solid performers. We were not aware of any material news that affected the stock. Technology stocks led the market lower in September as investors grew anxious regarding a lack of progress in negotiations for economic stimulus. |
| $0.3 | | 6.6% | | VF Corp. (VFC) |
| | | | | Although the apparel and footwear company reported top- and bottom-line results for the June quarter that were modestly better than expected, investors expressed concern regarding profit margin pressure brought on by increased promotional activity. |
| $0.3 | | 4.5% | | Tractor Supply Co. (TSCO) |
| | | | | The operator of retail farm and ranch stores reported June-quarter earnings of $2.90 per share, 61 percent above the year-ago period and ahead of the consensus estimate. Shares declined in September as investors grew anxious regarding a lack of progress in negotiations for economic stimulus. We were not aware of any material news that affected the stock. |
All gains/losses are calculated on an average cost basis from June 30, 2020 through September 30, 2020. Companies still held at the end of the period appear in the accompanying Schedule of Portfolio Investments.
This commentary reflects the viewpoints of Friess Associates, LLC as of September 30, 2020, and is not intended as a forecast or guarantee of future results.
14
|
AMG Managers Brandywine Blue Fund Schedule of Portfolio Investments September 30, 2020 |
| | | | | | | | | | | | |
| Shares | | | | | Cost | | | Value | |
| | Common Stocks—98.3% | | | | | | | | |
| | Communication Services | | | | | | | | |
| | | | Interactive Home Entertainment - 5.7% | | | | | | | | |
| | 69,478 | | | Activision Blizzard, Inc. | | $ | 4,268,049 | | | $ | 5,624,244 | |
| | 41,976 | | | Electronic Arts, Inc.* | | | 4,200,631 | | | | 5,474,090 | |
| | | | Interactive Media &
Services - 8.9% | | | | | | |
| | 22,000 | | | Facebook, Inc., Class A* | | | 6,005,199 | | | | 5,761,800 | |
| | 238,971 | | | Snap, Inc., Class A* | | | 5,781,970 | | | | 6,239,533 | |
| | 118,282 | | | Twitter, Inc. * | | | 3,889,246 | | | | 5,263,549 | |
| | | | Movies &
Entertainment - 3.1% | | | | | | |
| | 12,060 | | | Netflix, Inc.* | | | 4,476,244 | | | | 6,030,362 | |
| | | | | | | | | | | | |
| | |
| | Total Communication Services | | | 28,621,339 | | | | 34,393,578 | |
| | |
| | | | This sector is 20.2% below your Fund’s cost. | | | | |
| | |
| | Consumer Discretionary | | | | | | | | |
| | |
| | | | Apparel, Accessories & Luxury Goods - 2.3% | | | | | |
| | 63,576 | | | VF Corp. | | | 4,781,052 | | | | 4,466,214 | |
| | |
| | | | Home Improvement Retail - 2.1% | | | | | |
| | 54,709 | | | Floor & Decor Holdings, Inc., Class A* | | | 3,834,863 | | | | 4,092,233 | * |
| | |
| | | | Internet & Direct Marketing Retail—5.4% | | | | | |
| | 3,350 | | | Amazon.com, Inc.* | | | 6,169,587 | | | | 10,548,246 | |
| | |
| | | | Specialty Stores—2.9% | | | | | |
| | 38,691 | | | Tractor Supply Co. | | | 5,805,155 | | | | 5,545,968 | |
| | | | | | | | | | | | |
| | |
| | Total Consumer Discretionary | | | 20,590,657 | | | | 24,652,661 | |
| | |
| | | | This sector is 19.7% above your Fund’s cost. | | | | |
| | |
| | Financials | | | | | | | | |
| | |
| | | | Property & Casualty Insurance - 2.4% | | | | | |
| | 94,200 | | | First American Financial Corp. | | | 4,998,657 | | | | 4,795,722 | |
| | | | | | | | | | | | |
| | |
| | | | This sector is 4.1% below your Fund’s cost. | | | | |
| | |
| | Health Care | | | | | | | | |
| | |
| | | | Life Sciences Tools & Services - 4.8% | | | | | |
| | 23,547 | | | Repligen Corp.* | | | 3,560,717 | | | | 3,474,125 | |
| | 13,010 | | | Thermo Fisher Scientific, Inc. | | | 2,492,945 | | | | 5,744,175 | |
| | |
| | | | Pharmaceuticals - 2.3% | | | | | |
| | 27,444 | | | Zoetis, Inc. | | | 3,756,326 | | | | 4,538,414 | |
| | | | | | | | | | | | |
| | |
| | Total Health Care | | | 9,809,988 | | | | 13,756,714 | |
| | |
| | | | This sector is 40.2% above your Fund’s cost. | | | | |
| | |
| | Industrials | | | | | | | | |
| | |
| | | | Aerospace & Defense - 1.6% | | | | | |
| | 6,532 | | | TransDigm Group, Inc. | | | 3,334,921 | | | | 3,103,484 | |
| | |
| | | | Agricultural & Farm Machinery - 2.0% | | | | | |
| | 46,032 | | | The Toro Co. | | | 3,227,008 | | | | 3,864,386 | |
| | |
| | | | Building Products - 4.9% | | | | | |
| | 85,300 | | | Masco Corp. | | | 4,880,001 | | | | 4,702,589 | |
| | | | | | | | | | | | |
| Shares | | | | | Cost | | | Value | |
| | 70,564 | | | Owens Corning | | $ | 4,728,738 | | | $ | 4,855,509 | |
| | |
| | | | Electrical Components & Equipment - 2.6% | | | | | |
| | | |
| | 26,245 | | | Generac Holdings, Inc.* | | | 3,009,935 | | | | 5,082,082 | |
| | |
| | | | Railroads - 2.1% | | | | | |
| | | |
| | 52,680 | | | CSX Corp. | | | 4,197,003 | | | | 4,091,655 | |
| | |
| | | | Research & Consulting Services - 2.7% | | | | | |
| | | |
| | 167,912 | | | Clarivate PLC (Jersey)* | | | 4,959,516 | | | | 5,203,593 | |
| | |
| | | | Trucking - 1.4% | | | | | |
| | | |
| | 66,796 | | | Knight-Swift Transportation Holdings, Inc. | | | 2,831,440 | | | | 2,718,597 | |
| | | | | | | | | | | | |
| | |
| | Total Industrials | | | 31,168,562 | | | | 33,621,895 | |
| | |
| | | | This sector is 7.9% above your Fund’s cost. | | | | |
| |
| | Information Technology | | | | | |
| | |
| | | | Application Software - 10.5% | | | | | |
| | | |
| | 10,121 | | | Adobe, Inc.* | | | 2,520,236 | | | | 4,963,642 | |
| | | |
| | 28,150 | | | salesforce.com, Inc.* | | | 4,466,693 | | | | 7,074,658 | |
| | | |
| | 12,262 | | | The Trade Desk, Inc., Class A* | | | 5,447,311 | | | | 6,361,281 | |
| | | |
| | 4,147 | | | Zoom Video Communications, Inc., Class A | | | 1,873,631 | | | | 1,949,546 | |
| | |
| | | | Data Processing & Outsourced Services - 4.8% | | | | | |
| | | |
| | 29,100 | | | Global Payments, Inc. | | | 5,310,350 | | | | 5,167,578 | |
| | | |
| | 12,374 | | | Mastercard, Inc., Class A | | | 2,164,570 | | | | 4,184,516 | |
| | |
| | | | Electronic Components - 3.0% | | | | | |
| | | |
| | 180,374 | | | Corning, Inc. | | | 5,078,755 | | | | 5,845,921 | |
| | |
| | | | Internet Services & Infrastructure - 3.2% | | | | | |
| | | |
| | 1,905 | | | Snowflake, Inc., Class A*,1 | | | 454,297 | | | | 478,155 | |
| | | |
| | 23,000 | | | Twilio, Inc., Class A* | | | 6,069,095 | | | | 5,683,070 | |
| | |
| | | | Semiconductor Equipment - 2.8% | | | | | |
| | | |
| | 65,311 | | | Enphase Energy, Inc.*,1 | | | 3,015,915 | | | | 5,394,035 | |
| | |
| | | | Semiconductors - 7.3% | | | | | |
| | | |
| | 22,779 | | | NXP Semiconductors, N.V. (Netherlands) | | | 2,917,162 | | | | 2,843,047 | |
| | | |
| | 39,492 | | | Skyworks Solutions, Inc. | | | 5,836,831 | | | | 5,746,086 | |
| | | |
| | 31,200 | | | Universal Display Corp. | | | 5,789,174 | | | | 5,639,088 | |
| | |
| | | | Systems Software - 2.4% | | | | | |
| | | |
| | 33,700 | | | Zscaler, Inc.* | | | 2,226,310 | | | | 4,741,253 | |
| | |
| | | | Technology Hardware, Storage & Peripherals - 3.2% | | | | | |
| | | |
| | 54,610 | | | Apple, Inc. | | | 4,016,184 | | | | 6,324,384 | |
| | | | | | | | | | | | |
| | |
| | Total Information Technology | | | 57,186,514 | | | | 72,396,260 | |
| | |
| | | | This sector is 26.6% above your Fund’s cost. | | | | |
| | |
| | Materials | | | | | | | | |
| | |
| | | | Metal & Glass Containers - 1.0% | | | | | |
| | | |
| | 26,864 | | | Crown Holdings, Inc.* | | | 2,038,750 | | | | 2,064,767 | |
| | |
| | | | This sector is 1.3% above your Fund’s cost. | | | | |
The accompanying notes are an integral part of these financial statements.
15
|
AMG Managers Brandywine Blue Fund Schedule of Portfolio Investments (continued) |
| | | | | | | | | | | | |
Shares | | | | | Cost | | | Value | |
| |
| | Real Estate | | | | | |
| | |
| | | | Specialized REITs - 2.9% | | | | | |
| | | |
| | 17,600 | | | SBA Communications Corp. | | | $5,537,137 | | | | $5,605,248 | |
| | |
| | | | This sector is 1.2% above your Fund’s cost. | | | | |
| | |
| | Total Common Stocks | | | 159,951,604 | | | | 191,286,845 | |
| Principal
Amount |
| | | | | | | | | | |
| |
| | Short-Term Investments - 4.0% | | | | | |
| |
| | Joint Repurchase Agreements - 3.0%2 | | | | | |
| | | |
| | $1,385,273 | | | Citigroup Global Markets, Inc., dated 09/30/20, due 10/01/20, 0.080% total to be received $1,385,276 (collateralized by various U.S. Government Agency Obligations and U.S. Treasuries, 0.000% - 4.625%, 11/27/20 - 11/01/59, totaling $1,412,979) | | | 1,385,273 | | | | 1,385,273 | |
| | | |
| | 1,385,273 | | | HSBC Securities USA, Inc., dated 09/30/20, due 10/01/20, 0.080% total to be received $1,385,276 (collateralized by various U.S. Government Agency Obligations and U.S. Treasuries, 0.000% - 5.000%, 11/01/26 - 08/01/50, totaling $1,412,978) | | | 1,385,273 | | | | 1,385,273 | |
| | | |
| | 291,623 | | | JP Morgan Securities LLC, dated 09/30/20, due 10/01/20, 0.060% total to be received $291,623 (collateralized by various U.S. Treasuries, 0.000% - 1.750%, 11/19/20 - 08/31/24, totaling $297,456) | | | 291,623 | | | | 291,623 | |
| | | |
| | 1,385,273 | | | MUFG Securities America, Inc., dated 09/30/20, due 10/01/20, 0.080% total to be received $1,385,276 (collateralized by various U.S. Government Agency Obligations, 2.000% - 5.000%, 08/01/35 - 09/01/50, totaling $1,412,978) | | | 1,385,273 | | | | 1,385,273 | |
| | | | | | | | | | | | |
Principal
Amount | | | | | Cost | | | Value | |
| | | |
| | $1,385,273 | | | RBC Dominion Securities, Inc., dated 09/30/20, due 10/01/20, 0.080% total to be received $1,385,276 (collateralized by various U.S. Government Agency Obligations and U.S. Treasuries, 0.000% - 5.500%, 10/27/20 - 07/15/61, totaling $1,412,978) | | $ | 1,385,273 | | | $ | 1,385,273 | |
| | | | | | | | | | | | |
| | | | Total Joint Repurchase Agreements | | | 5,832,715 | | | | 5,832,715 | |
| | Shares | | | | | | | | | | | |
| |
| | Other Investment Companies - 1.0% | | | | | |
| | | |
| | 640,627 | | | Dreyfus Government Cash Management Fund, Institutional Shares, 0.02%3 | | | 640,627 | | | | 640,627 | |
| | | |
| | 640,627 | | | Dreyfus Institutional Preferred Government Money Market Fund, Institutional Shares, 0.04%3 | | | 640,627 | | | | 640,627 | |
| | | |
| | 660,040 | | | JPMorgan U.S. Government Money Market Fund, IM Shares, 0.06%3 | | | 660,040 | | | | 660,040 | |
| | | | Total Other Investment Companies | | | 1,941,294 | | | | 1,941,294 | |
| | | | | | | | | | | | |
| | |
| | Total Short-Term Investments | | | 7,774,009 | | | | 7,774,009 | |
| | |
| | Total Investments - 102.3% | | | 167,725,613 | | | | 199,060,854 | |
| |
| | Other Assets, less Liabilities - (2.3%) | | | | (4,413,488 | ) |
| |
| | Total Net Assets - 100.0% | | | $ | 194,647,366 | |
| | | | | | | | | | | | |
| * | Non-income producing security. |
| 1 | Some of these securities, amounting to $5,813,157 or 3.0% of net assets, were out on loan to various borrowers and are collateralized by cash. See Note 4 of Notes to Financial Statements. |
| 2 | Cash collateral received for securities lending activity was invested in these joint repurchase agreements. |
| 3 | Yield shown represents the September 30, 2020, seven day average yield, which refers to the sum of the previous seven days’ dividends paid, expressed as an annual percentage. |
| REITs Real | Estate Investment Trusts |
The accompanying notes are an integral part of these financial statements.
16
|
AMG Managers Brandywine Blue Fund Schedule of Portfolio Investments (continued) |
The following table summarizes the inputs used to value the Fund’s investments by the fair value hierarchy levels as of September 30, 2020:
| | | | | | | | | | | | | | | | |
| | | Level 1 | | | Level 2 | | | Level 3 | | | Total | |
Investments in Securities | | | | | | | | | | | | | | | | |
Common Stocks† | | $ | 191,286,845 | | | | — | | | | — | | | $ | 191,286,845 | |
| | | | |
Short-Term Investments | | | | | | | | | | | | | | | | |
Joint Repurchase Agreements | | | — | | | $ | 5,832,715 | | | | — | | | | 5,832,715 | |
Other Investment Companies | | | 1,941,294 | | | | — | | | | — | | | | 1,941,294 | |
| | | | | | | | | | | | | | | | |
Total Investments in Securities | | $ | 193,228,139 | | | $ | 5,832,715 | | | | — | | | $ | 199,060,854 | |
| | | | | | | | | | | | | | | | |
| † | All common stocks held in the Fund are Level 1 securities. For a detailed breakout of common stocks by major industry classification, please refer to the Fund’s Schedule of Portfolio Investments. |
For the fiscal year ended September 30, 2020, there were no transfers in or out of Level 3.
The accompanying notes are an integral part of these financial statements.
17
| | |
| | | Statement of Assets and Liabilities September 30, 2020 |
| | | |
| | | |
| | | | | | | | |
| | | AMG
Managers
Brandywine Fund | | | AMG
Managers
Brandywine
Blue Fund | |
| | |
Assets: | | | | | | | | |
| | |
Investments at value 1 (including securities on loan valued at $19,656,225, and $5,813,157, respectively) | | $ | 848,022,158 | | | $ | 199,060,854 | |
| | |
Receivable for investments sold | | | 2,312,346 | | | | 2,905,983 | |
| | |
Dividend and interest receivables | | | 142,640 | | | | 22,294 | |
| | |
Securities lending income receivable | | | 12,471 | | | | 1,644 | |
| | |
Receivable for Fund shares sold | | | 249 | | | | 21,406 | |
| | |
Prepaid expenses and other assets | | | 18,370 | | | | 8,992 | |
| | |
Total assets | | | 850,508,234 | | | | 202,021,173 | |
| | |
Liabilities: | | | | | | | | |
| | |
Payable upon return of securities loaned | | | 11,555,211 | | | | 5,832,715 | |
| | |
Payable for investments purchased | | | 3,036,265 | | | | 1,050,898 | |
| | |
Payable for Fund shares repurchased | | | 12,434 | | | | 272,101 | |
| | |
Accrued expenses: | | | | | | | | |
| | |
Investment advisory and management fees | | | 594,084 | | | | 138,767 | |
| | |
Administrative fees | | | 101,264 | | | | 23,654 | |
| | |
Shareholder service fees | | | 42,168 | | | | 6,108 | |
| | |
Other | | | 109,636 | | | | 49,564 | |
| | |
Total liabilities | | | 15,451,062 | | | | 7,373,807 | |
| | | | | | | | |
| | |
Net Assets | | $ | 835,057,172 | | | $ | 194,647,366 | |
| | |
1 Investments at cost | | $ | 711,579,875 | | | $ | 167,725,613 | |
| | |
Net Assets Represent: | | | | | | | | |
| | |
Paid-in capital | | $ | 586,374,098 | | | $ | 137,946,648 | |
| | |
Total distributable earnings | | | 248,683,074 | | | | 56,700,718 | |
| | |
Net Assets | | $ | 835,057,172 | | | $ | 194,647,366 | |
| | |
Class I: | | | | | | | | |
| | |
Net Assets | | $ | 835,057,172 | | | $ | 194,647,366 | |
| | |
Shares outstanding | | | 14,660,703 | | | | 3,483,072 | |
| | |
Net asset value, offering and redemption price per share | | $ | 56.96 | | | $ | 55.88 | |
The accompanying notes are an integral part of these financial statements.
18
|
Statement of Operations For the fiscal year ended September 30, 2020 |
| | | | | | | | | | |
| | | AMG
Managers
Brandywine Fund | | | AMG
Managers
Brandywine
Blue Fund | | | |
| | | |
Investment Income: | | | | | | | | | | |
| | | |
Dividend income | | | $4,310,184 | | | | $1,214,747 | | | |
| | | |
Interest income | | | 220,318 | | | | 76,073 | | | |
| | | |
Securities lending income | | | 211,362 | | | | 14,134 | | | |
| | | |
Foreign withholding tax | | | (4,874) | | | | (1,281) | | | |
| | | |
Total investment income | | | 4,736,990 | | | | 1,303,673 | | | |
| | | |
Expenses: | | | | | | | | | | |
| | | |
Investment advisory and management fees | | | 6,932,573 | | | | 1,615,930 | | | |
| | | |
Administrative fees | | | 1,181,689 | | | | 275,443 | | | |
| | | |
Shareholder servicing fees - Class I | | | 220,684 | | | | 88,897 | | | |
| | | |
Transfer agent fees | | | 94,592 | | | | 14,228 | | | |
| | | |
Trustee fees and expenses | | | 75,202 | | | | 17,415 | | | |
| | | |
Professional fees | | | 70,697 | | | | 39,655 | | | |
| | | |
Custodian fees | | | 65,713 | | | | 27,973 | | | |
| | | |
Reports to shareholders | | | 61,035 | | | | 29,000 | | | |
| | | |
Registration fees | | | 30,499 | | | | 25,539 | | | |
| | | |
Miscellaneous | | | 24,914 | | | | 5,898 | | | |
| | | |
Total expenses | | | 8,757,598 | | | | 2,139,978 | | | |
| | | | | | | | | | |
| | | |
Net investment loss | | | (4,020,608) | | | | (836,305) | | | |
| | | |
Net Realized and Unrealized Gain: | | | | | | | | | | |
| | | |
Net realized gain on investments | | | 134,871,648 | | | | 46,015,100 | | | |
| | | |
Net change in unrealized appreciation/depreciation on investments | | | 4,073,500 | | | | (142,390) | | | |
| | | |
Net realized and unrealized gain | | | 138,945,148 | | | | 45,872,710 | | | |
| | | | | | | | | | |
| | | |
Net increase in net assets resulting from operations | | | $134,924,540 | | | | $45,036,405 | | | |
The accompanying notes are an integral part of these financial statements.
19
|
Statements of Changes in Net Assets For the fiscal years ended September 30, |
| | | | | | | | | | | | | | | | |
| | | AMG
Managers
Brandywine Fund | | | AMG
Managers
Brandywine Blue Fund | |
| | | | |
| | | 2020 | | | 2019 | | | 2020 | | | 2019 | |
| | | | |
Increase (Decrease) in Net Assets Resulting From Operations: | | | | | | | | | | | | | | | | |
| | | | |
Net investment loss | | | $(4,020,608) | | | | $(2,046,989) | | | | $(836,305) | | | | $(351,529) | |
| | | | |
Net realized gain on investments | | | 134,871,648 | | | | 60,047,241 | | | | 46,015,100 | | | | 23,261,222 | |
| | | | |
Net change in unrealized appreciation/depreciation on investments | | | 4,073,500 | | | | (109,350,378 | ) | | | (142,390 | ) | | | (24,677,744 | ) |
| | | | |
Net increase (decrease) in net assets resulting from operations | | | 134,924,540 | | | | (51,350,126 | ) | | | 45,036,405 | | | | (1,768,051 | ) |
| | | | |
Distributions to Shareholders: | | | | | | | | | | | | | | | | |
| | | | |
Class I | | | (78,234,351 | ) | | | — | | | | (24,116,514 | ) | | | (18,414,046 | ) |
| | | | |
Capital Share Transactions:1 | | | | | | | | | | | | | | | | |
| | | | |
Net increase (decrease) from capital share transactions | | | (7,781,771 | ) | | | (55,802,477 | ) | | | (8,516,890 | ) | | | 5,426,761 | |
| | | | | | | | | | | | | | | | |
| | | | |
Total increase (decrease) in net assets | | | 48,908,418 | | | | (107,152,603 | ) | | | 12,403,001 | | | | (14,755,336 | ) |
| | | | |
Net Assets: | | | | | | | | | | | | | | | | |
| | | | |
Beginning of year | | | 786,148,754 | | | | 893,301,357 | | | | 182,244,365 | | | | 196,999,701 | |
| | | | |
Endofyear | | | $835,057,172 | | | | $786,148,754 | | | | $194,647,366 | | | | $182,244,365 | |
1 See Note 1(g) of the Notes to Financial Statements.
The accompanying notes are an integral part of these financial statements.
20
|
AMG Managers Brandywine Fund Financial Highlights For a share outstanding throughout each fiscal year |
| | | | | | | | | | | | | | | | | | | | | | |
| Class I | | For the fiscal years ended September 30, | | | |
| | | | | | | | | | | | | | | | | |
| | 2020 | | | 2019 | | | 2018 | | | 20171 | | | 2016 | | | |
| | | | | | |
Net Asset Value, Beginning of Year | | | $52.89 | | | | $56.01 | | | | $44.48 | | | | $37.42 | | | | $34.54 | | | |
| | | | | | |
Income (loss) from Investment Operations: | | | | | | | | | | | | | | | | | | | | | | |
| | | | | | |
Net investment loss2 | | | (0.27 | ) | | | (0.13 | ) | | | (0.21 | )3 | | | (0.17 | )3,4 | | | (0.08)3,5 | | | |
| | | | | | |
Net realized and unrealized gain (loss) on investments | | | 9.70 | | | | (2.99 | ) | | | 11.74 | | | | 7.23 | | | | 2.96 | | | |
| | | | | | |
Total income (loss) from investment operations | | | 9.43 | | | | (3.12 | ) | | | 11.53 | | | | 7.06 | | | | 2.88 | | | |
| | | | | | |
Less Distributions to Shareholders from: | | | | | | | | | | | | | | | | | | | | | | |
| | | | | | |
Net realized gain on investments | | | (5.36 | ) | | | — | | | | — | | | | — | | | | — | | | |
| | | | | | |
Net Asset Value, End of Year | | | $56.96 | | | | $52.89 | | | | $56.01 | | | | $44.48 | | | | $37.42 | | | |
| | | | | | |
Total Return6 | | | 18.95 | % | | | (5.57 | )% | | | 25.92 | %3 | | | 18.87 | %3 | | | 8.34%3 | | | |
| | | | | | |
Ratio of net expenses to average net assets | | | 1.11 | % | | | 1.10 | % | | | 1.10 | % | | | 1.11 | % | | | 1.11% | | | |
| | | | | | |
Ratio of gross expenses to average net assets | | | 1.11 | % | | | 1.10 | % | | | 1.10 | %7 | | | 1.12 | %7 | | | 1.11%7 | | | |
| | | | | | |
Ratio of net investment loss to average net assets | | | (0.51 | )% | | | (0.26 | )% | | | (0.43 | )%3 | | | (0.43 | )%3 | | | (0.24)%3 | | | |
| | | | | | |
Portfolio turnover | | | 221 | % | | | 145 | % | | | 138 | % | | | 187 | % | | | 185% | | | |
| | | | | | |
Net assets end of year (000’s) omitted | | | $835,057 | | | | $786,149 | | | | $893,301 | | | | $771,474 | | | | $720,766 | | | |
| | | |
| 1 | Effective February 27, 2017, the Fund’s Class S shares were renamed to Class I shares. |
| 2 | Per share numbers have been calculated using average shares. |
| 3 | Total returns and net investment income (loss) would have been lower had certain expenses not been offset. |
| 4 | Includes non-recurring dividends. Without these dividends, net investment loss per share would have been $(0.22). |
| 5 | Includes non-recurring dividends. Without these dividends, net investment loss per share would have been $(0.10). |
| 6 | The total return is calculated using the published Net Asset Value as of fiscal year end. |
| 7 | Excludes the impact of expense reimbursement or fee waivers and expense reductions such as brokerage credits, but includes expense repayments and non-reimbursable expenses, if any, such as interest, taxes, and extraordinary expenses. (See Note 1(c) and 2 in the Notes to Financial Statements.) |
21
|
AMG Managers Brandywine Blue Fund Financial Highlights For a share outstanding throughout each fiscal year |
| | | | | | | | | | | | | | | | | | | | | | |
| Class I | | For the fiscal years ended September 30, | | | |
| | | | | | | | | | | | | | | | | |
| | 2020 | | | 2019 | | | 2018 | | | 20171 | | | 2016 | | | |
| | | | | | |
Net Asset Value, Beginning of Year | | | $49.78 | | | | $56.64 | | | | $45.69 | | | | $36.87 | | | | $33.95 | | | |
| | | | | | |
Income (loss) from Investment Operations: | | | | | | | | | | | | | | | | | | | | | | |
| | | | | | |
Net investment loss2 | | | (0.22 | ) | | | (0.10 | ) | | | (0.24 | ) | | | (0.12 | )3 | | | (0.02)4 | | | |
| | | | | | |
Net realized and unrealized gain (loss) on investments | | | 12.84 | | | | (1.40 | ) | | | 11.19 | | | | 8.94 | | | | 3.02 | | | |
| | | | | | |
Total income (loss) from investment operations | | | 12.62 | | | | (1.50 | ) | | | 10.95 | | | | 8.82 | | | | 3.00 | | | |
| | | | | | |
Less Distributions to Shareholders from: | | | | | | | | | | | | | | | | | | | | | | |
| | | | | | |
Net investment income | | | — | | | | — | | | | — | | | | — | | | | (0.08) | | | |
| | | | | | |
Net realized gain on investments | | | (6.52 | ) | | | (5.36 | ) | | | — | | | | — | | | | — | | | |
| | | | | | |
Total distributions to shareholders | | | (6.52 | ) | | | (5.36 | ) | | | — | | | | — | | | | (0.08) | | | |
| | | | | | |
Net Asset Value, End of Year | | | $55.88 | | | | $49.78 | | | | $56.64 | | | | $45.69 | | | | $36.87 | | | |
| | | | | | |
Total Return5 | | | 27.84 | % | | | (0.17 | )% | | | 23.97 | % | | | 23.92 | % | | | 8.86% | | | |
| | | | | | |
Ratio of expenses to average net assets | | | 1.17 | % | | | 1.15 | % | | | 1.16 | % | | | 1.20 | % | | | 1.20% | | | |
| | | | | | |
Ratio of net investment loss to average net assets | | | (0.46 | )% | | | (0.20 | )% | | | (0.47 | )% | | | (0.29 | )% | | | (0.05)% | | | |
| | | | | | |
Portfolio turnover | | | 215 | % | | | 135 | % | | | 122 | % | | | 167 | % | | | 139% | | | |
| | | | | | |
Net assets end of year (000’s) omitted | | | $194,647 | | | | $182,244 | | | | $197,000 | | | | $172,454 | | | | $156,953 | | | |
| | | |
| 1 | Effective February 27, 2017, the Fund’s Class S shares were renamed to Class I shares. |
| 2 | Per share numbers have been calculated using average shares. |
| 3 | Includes non-recurring dividends. Without these dividends, net investment loss per share would have been $(0.18). |
| 4 | Includes non-recurring dividends. Without these dividends, net investment loss per share would have been $(0.04). |
| 5 | The total return is calculated using the published Net Asset Value as of fiscal year end. |
22
|
Notes to Financial Statements September 30, 2020 |
1. ORGANIZATION AND SUMMARY OF SIGNIFICANT ACCOUNTING POLICIES
AMG Funds I (the “Trust”) is an open-end management investment company, organized as a Massachusetts business trust, and registered under the Investment Company Act of 1940, as amended (the “1940 Act”). Currently, the Trust consists of number of different funds, each having distinct investment management objectives, strategies, risks, and policies. Included in this report are AMG Managers Brandywine Fund (“Brandywine”) and AMG Managers Brandywine Blue Fund (“Brandywine Blue”), each a “Fund” and collectively, the “Funds”.
A significant portion of the Brandywine Blue’s holdings may be focused in a relatively small number of securities, which may make the Fund more volatile and subject to greater risk than a more diversified fund.
Market disruptions associated with the Covid-19 pandemic have had a global impact, and uncertainty exists as to the long-term implications. Such disruptions can adversely affect assets of the Funds and thus Fund performance.
The Funds’ financial statements are prepared in accordance with accounting principles generally accepted in the United States of America (“U.S. GAAP”), including accounting and reporting guidance pursuant to Accounting Standards Codification Topic 946 applicable to investment companies. U.S. GAAP requires management to make estimates and assumptions that affect the reported amounts of assets and liabilities and disclosure of contingent assets and liabilities at the date of the financial statements and the reported amounts of income and expenses during the reporting period. Actual results could differ from those estimates and such differences could be material. The following is a summary of significant accounting policies followed by the Funds in the preparation of their financial statements:
a. VALUATION OF INVESTMENTS
Equity securities traded on a national securities exchange or reported on the NASDAQ national market system (“NMS”) are valued at the last quoted sales price on the primary exchange or, if applicable, the NASDAQ official closing price or the official closing price of the relevant exchange or, lacking any sales, at the last quoted bid price or the mean between the last quoted bid and ask prices (the “mean price”). Equity securities traded in the over-the-counter market (other than NMS securities) are valued at the mean price. Foreign equity securities (securities principally traded in markets other than U.S. markets) are valued at the official closing price on the primary exchange or, for markets that either do not offer an official closing price or where the official closing price may not be representative of the overall market, the last quoted sale price.
Fixed income securities purchased with a remaining maturity of 60 days or less are valued at amortized cost, provided that the amortized cost value is approximately the same as the fair value of the security valued without the use of amortized cost. Investments in other open-end registered investment companies are valued at their end of day net asset value per share.
The Funds’ portfolio investments are generally valued based on independent market quotations or prices or, if none, “evaluative” or other market based valuations provided by third party pricing services approved by the Board of Trustees of the Trust (the “Board”). Under certain circumstances, the value of certain Fund portfolio investments may be based on an evaluation of fair value, pursuant to procedures established by and under the general supervision of the Board. The Valuation Committee, which is comprised of the Independent Trustees of the Board, and the Pricing Committee, which is comprised of representatives from AMG Funds LLC (the “Investment Manager”) are the committees appointed by the Board to make
fair value determinations. Each Fund may use the fair value of a portfolio investment to calculate its net asset value (“NAV”) in the event that the market quotation, price or market based valuation for the portfolio investment is not readily available or otherwise not determinable pursuant to the Board’s valuation procedures, if the Investment Manager or the Pricing Committee believes the quotation, price or market based valuation to be unreliable, or in certain other circumstances. When determining the fair value of an investment, the Pricing Committee and, if required under the Trust’s securities valuation procedures, the Valuation Committee, seeks to determine the price that the Fund might reasonably expect to receive from current sale of that portfolio investment in an arms-length transaction. Fair value determinations shall be based upon consideration of all available facts and information, including, but not limited to (i) attributes specific to the investment; (ii) fundamental and analytical data relating to the investment; and (iii) the value of other comparable securities or relevant financial instruments, including derivative securities, traded on other markets or among dealers.
The values assigned to fair value portfolio investments are based on available information and do not necessarily represent amounts that might ultimately be realized in the future, since such amounts depend on future developments inherent in long-term investments. Because of the inherent uncertainty of valuation, those estimated values may differ significantly from the values that would have been used had a ready market for the investments existed, and the differences could be material. The Board will be presented with a quarterly report showing as of the most recent quarter end, all outstanding securities fair valued by the Funds, including a comparison with the prior quarter end and the percentage of the Funds that the security represents at each quarter end.
With respect to foreign equity securities and certain foreign fixed income securities, the Board has adopted a policy that securities held in the Funds that can be fair valued by the applicable fair value pricing service are fair valued on each business day provided that each individual price exceeds a pre-established confidence level.
U.S. GAAP defines fair value as the price that a fund would receive to sell an asset or pay to transfer a liability in an orderly transaction between market participants at the measurement date. U.S. GAAP also establishes a framework for measuring fair value, and a three level hierarchy for fair value measurements based upon the transparency of inputs to the valuation of an asset or liability. Inputs may be observable or unobservable and refer broadly to the assumptions that market participants would use in pricing the asset or liability. Observable inputs reflect the assumptions market participants would use in pricing the asset or liability based on market data obtained from sources independent of the Funds. Unobservable inputs reflect the Funds’ own assumptions about the assumptions that market participants would use in pricing the asset or liability developed based on the best information available in the circumstances. Each investment is assigned a level based upon the observability of the inputs which are significant to the overall valuation.
The three-tier hierarchy of inputs is summarized below:
Level 1 – inputs are quoted prices in active markets for identical investments (e.g., equity securities, open-end investment companies)
Level 2 – other observable inputs (including, but not limited to: quoted prices for similar assets or liabilities in markets that are active, quoted prices for identical or similar assets or liabilities in markets that are not active, inputs other than quoted prices that are observable for the assets or liabilities (such as interest rates, yield curves, volatilities, prepayment speeds, loss severities, credit risks and default
23
|
Notes to Financial Statements (continued) |
rates) or other market corroborated inputs) (e.g., debt securities, government securities, foreign currency exchange contracts, swaps, foreign securities utilizing international fair value pricing, fair valued securities with observable inputs)
Level 3 – inputs are significant unobservable inputs (including the Fund’s own assumptions used to determine the fair value of investments) (e.g., fair valued securities with unobservable inputs)
Changes in inputs or methodologies used for valuing investments may result in a transfer in or out of levels within the fair value hierarchy. The inputs or methodologies used for valuing investments may not necessarily be an indication of the risk associated with investing in those investments.
b. SECURITY TRANSACTIONS
Security transactions are accounted for as of trade date. Realized gains and losses on securities sold are determined on the basis of identified cost.
c. INVESTMENT INCOME AND EXPENSES
Dividend income is recorded on the ex-dividend date. Dividends from foreign securities are recorded on the ex-dividend date, and if after the fact, as soon as the Fund becomes aware of the ex-dividend date. Interest income, which includes amortization of premium and accretion of discount on debt securities, is accrued as earned. Dividend and interest income on foreign securities is recorded gross of any withholding tax. Non-cash dividends included in dividend income, if any, are reported at the fair market value of the securities received. Upon notification from
issuers, distributions received from a real estate investment trust (REIT) may be redesignated as a reduction of cost of investments and/or realized gain. Other income and expenses are recorded on an accrual basis. Expenses that cannot be directly attributed to a Fund are apportioned among the funds in the Trust and other trusts or funds within the AMG Funds Family of Funds (collectively the “AMG Funds Family”) based upon their relative average net assets or number of shareholders.
d. DIVIDENDS AND DISTRIBUTIONS
Fund distributions resulting from either net investment income or realized net capital gains, if any, will normally be declared and paid at least annually in December. Distributions to shareholders are recorded on the ex-dividend date. Distributions are determined in accordance with federal income tax regulations, which may differ from net investment income and net realized capital gains for financial statement purposes (U.S. GAAP). Differences may be permanent or temporary. Permanent differences are reclassified among capital accounts in the financial statements to reflect their tax character. Permanent book and tax basis differences, if any, relating to shareholder distributions will result in reclassifications to paid-in capital. Temporary differences arise when certain items of income, expense and gain or loss are recognized in different periods for financial statement and tax purposes; these differences will reverse at some time in the future. Permanent differences are primarily due to a net operating loss write off. Temporary differences are primarily due to qualified late year ordinary losses and wash sales.
The tax character of distributions paid during the fiscal years ended September 30, 2020 and September 30, 2019 were as follows:
| | | | | | | | | | | | | | | | |
| | | Brandywine | | | Brandywine Blue | |
| | | | |
Distributions paid from: | | | 2020 | | | | 2019 | | | | 2020 | | | | 2019 | |
| | | | |
Ordinary income * | | | — | | | | — | | | $ | 960,620 | | | | — | |
| | | | |
Long-term capital gains | | $ | 78,234,351 | | | | — | | | | 23,155,894 | | | $ | 18,414,046 | |
| | | | | | | | | | | | | | | | |
| | | | |
| | $ | 78,234,351 | | | | — | | | $ | 24,116,514 | | | $ | 18,414,046 | |
| | | | | | | | | | | | | | | | |
* For tax purposes, short-term capital gain distributions, if any, are considered ordinary income distributions.
As of September 30, 2020, the components of distributable earnings (excluding unrealized appreciation/depreciation) on a tax basis consisted of:
| | | | | | | | |
| | | Brandywine | | | Brandywine Blue | |
| | |
Undistributed ordinary income | | | — | | | $ | 18,223,816 | |
| | |
Undistributed long-term capital gains | | $ | 116,377,395 | | | | 7,279,421 | |
| | |
Late-year loss deferral | | | 3,635,547 | | | | — | |
At September 30, 2020, the cost of investments and the aggregate gross unrealized appreciation and depreciation for federal income tax purposes were as follows:
| | | | | | | | | | | | | | | | |
| Fund | | Cost | | | Appreciation | | | Depreciation | | | Net Appreciation | |
| | | | |
Brandywine | | $ | 712,080,932 | | | $ | 153,787,268 | | | $ | (17,846,042 | ) | | $ | 135,941,226 | |
| | | | |
Brandywine Blue | | | 167,863,373 | | | | 33,912,973 | | | | (2,715,492 | ) | | | 31,197,481 | |
e. FEDERAL TAXES
Each Fund currently qualifies as an investment company and intends to comply with the requirements under Subchapter M of the Internal Revenue Code of 1986, as amended, and to distribute substantially all of its taxable income and gains to
its shareholders and to meet certain diversification and income requirements with respect to investment companies. Therefore, no provision for federal income or excise tax is included in the accompanying financial statements.
24
|
Notes to Financial Statements (continued) |
Additionally, based on each Fund’s understanding of the tax rules and rates related to income, gains and transactions for the foreign jurisdictions in which it invests, each Fund will provide for foreign taxes, and where appropriate, deferred foreign taxes.
Management has analyzed the Funds’ tax positions taken on federal income tax returns as of September 30, 2020, and for all open tax years (generally, the three prior taxable years), and has concluded that no provision for federal income tax is required in the Funds’ financial statements. Additionally, Management is not aware of any tax position for which it is reasonably possible that the total amounts of unrecognized tax benefits will change materially in the next twelve months.
f. CAPITAL LOSS CARRYOVERS AND DEFERRALS
As of September 30, 2020, the Funds had no capital loss carryovers for federal income tax purposes. Should the Funds incur net capital losses for the fiscal year ended September 30, 2021, such amounts may be used to offset future realized capital gains indefinitely, and retain their character as short-term and/or long-term.
g. CAPITAL STOCK
The Trust’s Declaration of Trust authorizes for each Fund the issuance of an unlimited number of shares of beneficial interest, without par value. Each Fund records sales and repurchases of its capital stock on the trade date.
For the fiscal years ended September 30, 2020 and September 30, 2019, the capital stock transactions by class for the Funds were as follows:
| | | | | | | | | | | | | | | | | | | | | | | | | | | | | | | | |
| | | Brandywine | | | Brandywine Blue | |
| | | September 30, 2020 | | | September 30, 2019 | | | September 30, 2020 | | | September 30, 2019 | |
| | | Shares | | | Amount | | | Shares | | | Amount | | | Shares | | | Amount | | | Shares | | | Amount | |
| | | | | | | | |
Class I: | | | | | | | | | | | | | | | | | | | | | | | | | | | | | | | | |
| | | | | | | | |
Proceeds from sale of shares | | | 46,057 | | | $ | 2,373,834 | | | | 76,721 | | | $ | 3,962,287 | | | | 298,448 | | | $ | 14,918,425 | | | | 416,273 | | | $ | 19,917,676 | |
| | | | | | | | |
Reinvestment of distributions | | | 1,413,629 | | | | 72,476,754 | | | | — | | | | — | | | | 493,674 | | | | 23,168,103 | | | | 447,028 | | | | 17,639,726 | |
| | | | | | | | |
Cost of shares repurchased | | | (1,661,560) | | | | (82,632,359) | | | | (1,162,713) | | | | (59,764,764) | | | | (970,100) | | | | (46,603,418) | | | | (680,251) | | | | (32,130,641) | |
| | | | | | | | | | | | | | | | | | | | | | | | | | | | | | | | |
| | | | | | | | |
Net increase (decrease) | | | (201,874) | | | $ | (7,781,771) | | | | (1,085,992) | | | $ | (55,802,477) | | | | (177,978) | | | $ | (8,516,890) | | | | 183,050 | | | $ | 5,426,761 | |
| | | | | | | | | | | | | | | | | | | | | | | | | | | | | | | | |
h. REPURCHASE AGREEMENTS AND JOINT REPURCHASE AGREEMENTS
The Funds may enter into third-party repurchase agreements for temporary cash management purposes and third-party or bilateral joint repurchase agreements for reinvestment of cash collateral on securities lending transactions under the securities lending program offered by The Bank of New York Mellon (“BNYM”) (the “Program”) (collectively, “Repurchase Agreements”). The value of the underlying collateral, including accrued interest, must equal or exceed the value of the Repurchase Agreements during the term of the agreement. For joint repurchase agreements, the Funds participate on a pro rata basis with other clients of BNYM in its share of the underlying collateral under such joint repurchase agreements and in its share of proceeds from any repurchase or other disposition of the underlying collateral. The underlying collateral for all Repurchase Agreements is held in safekeeping by the Funds’ custodian or at the Federal Reserve Bank. If the seller defaults and the value of the collateral declines, or if bankruptcy proceedings commence with respect to the seller of the security, realization of the collateral by the Funds may be delayed or limited. Pursuant to the Program, the Funds are indemnified for such losses by BNYM on joint repurchase agreements.
At September 30, 2020, the market value of Repurchase Agreements outstanding for Brandywine and Brandywine Blue was $11,555,211 and $5,832,715, respectively.
2. AGREEMENTS AND TRANSACTIONS WITH AFFILIATES
For each of the Funds, the Trust has entered into an investment advisory agreement under which the Investment Manager, a subsidiary and the U.S. retail distribution arm of Affiliated Managers Group, Inc. (“AMG”), serves as investment
manager to the Funds and is responsible for the Funds’ overall administration and operations. The Investment Manager selects one or more subadvisers for the Funds (subject to Board approval) and monitors each subadviser’s investment performance, security holdings and investment strategies. Each Fund’s investment portfolio is managed by Friess Associates, LLC (“Friess”) and Friess Associates of Delaware, LLC (“Friess of Delaware”) who serve pursuant to a subadvisory agreement with the Investment Manager.
Investment management fees are paid directly by the Funds to the Investment Manager based on average daily net assets. For the fiscal year ended September 30, 2020, the Funds’ investment management fees were paid at the following annual rate of each Fund’s respective average daily net assets:
| | | | |
| |
Brandywine | | | 0.88% | |
| |
Brandywine Blue | | | 0.88% | |
The Trust, on behalf of the Funds, has entered into an amended and restated Administration Agreement under which the Investment Manager serves as the Funds’ administrator (the “Administrator”) and is responsible for all non-portfolio management aspects of managing the Funds’ operations, including administration and shareholder services to each Fund. Each Fund pays a fee to the Administrator at the rate of 0.15% per annum of the Fund’s average daily net assets for this service.
25
|
Notes to Financial Statements (continued) |
The Funds are distributed by AMG Distributors, Inc. (the “Distributor”), a wholly-owned subsidiary of the Investment Manager. The Distributor serves as the distributor and underwriter for each Fund and is a registered broker-dealer and member of the Financial Industry Regulatory Authority, Inc. (“FINRA”). Shares of each Fund will be continuously offered and will be sold directly to prospective purchasers and through brokers, dealers or other financial intermediaries who have executed selling agreements with the Distributor. Generally the Distributor bears all or a portion of the expenses of providing services pursuant to the distribution agreement, including the payment of the expenses relating to the distribution of prospectuses for sales purposes and any advertising or sales literature.
For Class I shares, the Board has approved reimbursement payments to the Investment Manager for shareholder servicing expenses (“shareholder servicing fees”) incurred. Shareholder servicing fees include payments to financial intermediaries, such as broker-dealers (including fund supermarket platforms), banks, and trust companies who provide shareholder recordkeeping, account servicing and other services. The Class I shares may reimburse the Investment Manager for the actual amount incurred up to a maximum annual rate of each Class’s average daily net assets as shown in the table below.
The impact on the annualized expense ratios for the fiscal year ended September 30, 2020, were as follows:
| | | | | | | | |
| Fund | | Maximum Annual Amount Approved | | | Actual Amount Incurred | |
| | |
Brandywine | | | | | | | | |
| | |
Class I | | | 0.15 | % | | | 0.03 | % |
| | |
Brandywine Blue | | | | | | | | |
| | |
Class I | | | 0.15 | % | | | 0.05 | % |
The Board provides supervision of the affairs of the Trust and other trusts within the AMG Funds Family. The Trustees of the Trust who are not affiliated with the Investment Manager receive an annual retainer and per meeting fees for regular, special and telephonic meetings, and they are reimbursed for out-of-pocket expenses incurred while carrying out their duties as Board members. The Chairman of the Board and the Audit Committee Chair receive additional annual retainers. Certain Trustees and Officers of the Funds are Officers and/or Directors of the Investment Manager, AMG and/or the Distributor.
The Securities and Exchange Commission (the “SEC”) granted an exemptive order that permits the Funds to lend and borrow money for certain temporary purposes directly to and from other eligible funds in the AMG Funds Family. Participation in this interfund lending program is voluntary for both the borrowing and lending funds, and an interfund loan is only made if it benefits each participating fund. The Administrator manages the program according to procedures approved by the Board, and the Board monitors the operation of the program. An interfund loan must comply with certain conditions set out in the exemptive order, which are designed to assure fairness and protect all participating funds. The interest earned and interest paid on interfund loans are included on the Statement of Operations as interest income and miscellaneous expense, respectively. For the fiscal year ended September 30, 2020, the Funds neither borrowed nor lent to other funds in the AMG Funds Family. At September 30, 2020, the Funds had no interfund loans outstanding.
3. PURCHASES AND SALES OF SECURITIES
Purchases and sales of securities (excluding short-term securities and U.S. Government Obligations) for the fiscal year ended September 30, 2020, were as follows:
| | | | | | | | |
| | | Long Term Securities | |
| Fund | | Purchases | | | Sales | |
| | |
Brandywine | | $ | 1,682,350,422 | | | $ | 1,760,751,388 | |
| | |
Brandywine Blue | | | 380,594,437 | | | | 409,426,424 | |
The Funds had no purchases or sales of U.S. Government Obligations during the fiscal year ended September 30, 2020.
4. PORTFOLIO SECURITIES LOANED
The Funds participate in the Program providing for the lending of securities to qualified borrowers. Securities lending income includes earnings of such temporary cash investments, plus or minus any rebate to a borrower. These earnings (after any rebate) are then divided between BNYM, as a fee for its services under the Program, and the Funds, according to agreed-upon rates. Collateral on all securities loaned is accepted in cash, U.S. Treasury Obligations or U.S. Government Agency Obligations. Collateral is maintained at a minimum level of 102% (105% in the case of certain foreign securities) of the market value, plus interest, if applicable, of investments on loan. It is the Funds’ policy to obtain additional collateral from or return excess collateral to the borrower by the end of the next business day, following the valuation date of the securities loaned. Therefore, the value of the collateral held may be temporarily less than the value of the securities on loan. Lending securities entails a risk of loss to the Funds if and to the extent that the market value of the securities loaned were to increase and the borrower did not increase the collateral accordingly, and the borrower fails to return the securities. Under the terms of the Program, the Funds are indemnified for such losses by BNYM. Cash collateral is held in separate omnibus accounts managed by BNYM, who is authorized to exclusively enter into joint repurchase agreements for that cash collateral. Securities collateral is held in separate omnibus accounts managed by BNYM that cannot be sold or pledged. BNYM bears the risk of any deficiency in the amount of the cash collateral available for return to the borrower due to any loss on the collateral invested. Loans of securities are terminable at any time and the borrower, after notice, is required to return borrowed securities as soon as practical, which is normally within three business days.
The value of securities loaned on positions held, cash collateral and securities collateral received at September 30, 2020, were as follows:
| | | | | | | | | | | | | | | | |
| Fund | | Securities Loaned | | | Cash Collateral Received | | | Securities Collateral Received | | | Total Collateral Received | |
| | | | |
Brandywine | | $ | 19,656,225 | | | $ | 11,555,211 | | | $ | 8,502,125 | | | $ | 20,057,336 | |
| | | | |
Brandywine Blue | | | 5,813,157 | | | | 5,832,715 | | | | — | | | | 5,832,715 | |
26
|
Notes to Financial Statements (continued) |
The following table summarizes the securities received as collateral for securities lending at September 30, 2020:
| | | | | | | | | | |
| Fund | | Collateral Type | | Coupon Range | | | Maturity Date Range | |
| | | |
Brandywine | | U.S. Treasury Obligations | | | 0.000 | %-8.000% | | | 10/08/20-02/15/50 | |
5. COMMITMENTS AND CONTINGENCIES
Under the Trust’s organizational documents, its trustees and officers are indemnified against certain liabilities arising out of the performance of their duties to the Trust. In addition, in the normal course of business, the Funds may enter into contracts and agreements that contain a variety of representations and warranties, which provide general indemnifications. The maximum exposure to the Funds under these arrangements is unknown, as this would involve future claims that may be made against a Fund that have not yet occurred. However, based on experience, the Funds had no prior claims or losses and expect the risks of loss to be remote.
6. MASTER NETTING AGREEMENTS
The Funds may enter into master netting agreements with their counterparties for the securities lending program and Repurchase Agreements, which provide the right, in the event of default (including bankruptcy or insolvency) for the non-defaulting party to liquidate the collateral and calculate net exposure to the defaulting party or request additional collateral. For financial reporting purposes, the Funds do not offset financial assets and financial liabilities that are subject to master netting agreements in the Statement of Assets and Liabilities. For securities lending transactions, see Note 4.
The following table is a summary of the Funds’ open Repurchase Agreements that are subject to a master netting agreement as of September 30, 2020:
| | | | | | | | | | | | | | | | | | | | |
| | | | Gross Amount Not Offset in the
Statement of Assets and Liabilities | | | | |
Fund | | Gross Amounts of
Assets Presented in
the Statement of
Assets and Liabilities | | | Offset
Amount | | | Net
Asset
Balance | | | Collateral
Received | | | Net
Amount | |
| | | | | |
Brandywine | | | | | | | | | | | | | | | | | | | | |
| | | | | |
Bank of America Securities, Inc. | | $ | 446,605 | | | | — | | | $ | 446,605 | | | $ | 446,605 | | | | — | |
| | | | | |
Cantor Fitzgerald Securities, Inc. | | | 1,280,801 | | | | — | | | | 1,280,801 | | | | 1,280,801 | | | | — | |
| | | | | |
Citadel Securities LLC | | | 1,594,698 | | | | — | | | | 1,594,698 | | | | 1,594,698 | | | | — | |
| | | | | |
Citigroup Global Markets, Inc. | | | 2,744,369 | | | | — | | | | 2,744,369 | | | | 2,744,369 | | | | — | |
| | | | | |
MUFG Securities America, Inc. | | | 2,744,369 | | | | — | | | | 2,744,369 | | | | 2,744,369 | | | | — | |
| | | | | |
RBC Dominion Securities, Inc. | | | 2,744,369 | | | | — | | | | 2,744,369 | | | | 2,744,369 | | | | — | |
| | | | | | | | | | | | | | | | | | | | |
| | | | | |
Total | | $ | 11,555,211 | | | | — | | | $ | 11,555,211 | | | $ | 11,555,211 | | | | — | |
| | | | | | | | | | | | | | | | | | | | |
| | | | | |
Brandywine Blue | | | | | | | | | | | | | | | | | | | | |
| | | | | |
Citigroup Global Markets, Inc. | | $ | 1,385,273 | | | | — | | | $ | 1,385,273 | | | $ | 1,385,273 | | | | — | |
| | | | | |
HSBC Securities USA, Inc. | | | 1,385,273 | | | | — | | | | 1,385,273 | | | | 1,385,273 | | | | — | |
| | | | | |
JP Morgan Securities LLC | | | 291,623 | | | | — | | | | 291,623 | | | | 291,623 | | | | — | |
| | | | | |
MUFG Securities America, Inc. | | | 1,385,273 | | | | — | | | | 1,385,273 | | | | 1,385,273 | | | | — | |
| | | | | |
RBC Dominion Securities, Inc. | | | 1,385,273 | | | | — | | | | 1,385,273 | | | | 1,385,273 | | | | — | |
| | | | | | | | | | | | | | | | | | | | |
| | | | | |
Total | | $ | 5,832,715 | | | | — | | | $ | 5,832,715 | | | $ | 5,832,715 | | | | — | |
| | | | | | | | | | | | | | | | | | | | |
7. SUBSEQUENT EVENTS
The Funds have determined that no material events or transactions occurred through the issuance date of the Funds’ financial statements which require an additional disclosure in or adjustment of the Funds’ financial statements.
27
|
Report of Independent Registered Public Accounting Firm |
TO THE BOARD OF TRUSTEES OF AMG FUNDS I AND SHAREHOLDERS OF AMG MANAGERS BRANDYWINE FUND AND AMG MANAGERS BRANDYWINE BLUE FUND
Opinions on the Financial Statements
We have audited the accompanying statements of assets and liabilities, including the schedules of portfolio investments, of AMG Managers Brandywine Fund and AMG Managers Brandywine Blue Fund (two of the funds constituting AMG Funds I, hereafter collectively referred to as the “Funds”) as of September 30, 2020, the related statements of operations for the year ended September 30, 2020, the statements of changes in net assets for each of the two years in the period ended September 30, 2020, including the related notes, and the financial highlights for each of the five years in the period ended September 30, 2020 (collectively referred to as the “financial statements”). In our opinion, the financial statements present fairly, in all material respects, the financial position of each of the Funds as of September 30, 2020, the results of each of their operations for the year then ended, the changes in each of their net assets for each of the two years in the period ended September 30, 2020 and each of the financial highlights for each of the five years in the period ended September 30, 2020 in conformity with accounting principles generally accepted in the United States of America.
Basis for Opinions
These financial statements are the responsibility of the Funds’ management. Our responsibility is to express an opinion on the Funds’ financial statements based on our audits. We are a public accounting firm registered with the Public Company Accounting Oversight Board (United States) (PCAOB) and are required to be independent with respect to the Funds in accordance with the U.S. federal securities laws and the applicable rules and regulations of the Securities and Exchange Commission and the PCAOB.
We conducted our audits of these financial statements in accordance with the standards of the PCAOB. Those standards require that we plan and perform the audit to obtain reasonable assurance about whether the financial statements are free of material misstatement, whether due to error or fraud.
Our audits included performing procedures to assess the risks of material misstatement of the financial statements, whether due to error or fraud, and performing procedures that respond to those risks. Such procedures included examining, on a test basis, evidence regarding the amounts and disclosures in the financial statements. Our audits also included evaluating the accounting principles used and significant estimates made by management, as well as evaluating the overall presentation of the financial statements. Our procedures included confirmation of securities owned as of September 30, 2020 by correspondence with the custodian and brokers; when replies were not received from brokers, we performed other auditing procedures. We believe that our audits provide a reasonable basis for our opinions.
PricewaterhouseCoopers LLP
Boston, Massachusetts
November 12, 2020
We have served as the auditor of one or more investment companies in the AMG Funds Family since 1993.
28
|
Other Information (Unaudited) |
TAX INFORMATION
AMG Managers Brandywine Fund and AMG Managers Brandywine Blue Fund each hereby designates the maximum amount allowable of its net taxable income as qualified dividends as provided in the Jobs and Growth Tax Relief Reconciliation Act of 2003. The 2019/2020 Form 1099-DIV you receive for each Fund will show the tax status of all distributions paid to you during the year.
Pursuant to section 852 of the Internal Revenue Code, AMG Managers Brandywine Fund and AMG Managers Brandywine Blue Fund each hereby designates $78,234,351 and $23,155,894, respectively, as a capital gain distribution with respect to the taxable year ended September 30, 2020, or if subsequently determined to be different, the net capital gains of such fiscal year.
29
|
AMG Funds Trustees and Officers |
| | | | | | | | |
| The Trustees and Officers of the Trust, their business addresses, principal occupations for the past five years and ages are listed below. The Trustees provide broad supervision over the affairs of the Trust and the Funds. The Trustees are experienced executives who meet periodically throughout the year to oversee the Funds’ activities, review contractual arrangements with companies that provide services to the Funds, and | | | | review the Funds’ performance. Unless otherwise noted, the address of each Trustee or Officer is the address of the Trust: 600 Steamboat Road, Suite 300, Greenwich, Connecticut 06830. There is no stated term of office for Trustees. Trustees serve until their resignation, retirement or removal in | | | | accordance with the Trust’s organizational documents and policies adopted by the Board from time to time. The Chairman of the Trustees, President, Treasurer and Secretary of the Trust are elected by the Trustees annually. Other officers hold office at the pleasure of the Trustees. |
Independent Trustees
The following Trustees are not “interested persons” of the Trust within the meaning of the 1940 Act:
| | |
Number of Funds Overseen in
Fund Complex | | Name, Age, Principal Occupation(s) During Past 5 Years and Other Directorships Held by Trustee |
| | |
• Trustee since 2012 • Oversees 49 Funds in Fund Complex | | Bruce B. Bingham, 71 Partner, Hamilton Partners (real estate development firm) (1987-2020); Director of The Yacktman Funds (2000-2012). Trustee of AMG Funds since 2012. |
| | |
• Trustee since 2000 • Oversees 49 Funds in Fund Complex | | Edward J. Kaier, 75 Attorney at Law and Partner, Teeters Harvey Marrone & Kaier LLP (2007-Present); Attorney at Law and Partner, Hepburn Willcox Hamilton & Putnam, LLP (1977-2007); Trustee of Third Avenue Trust (2002-2019); Trustee of Third Avenue Variable Trust (2002-2019). |
| | |
• Trustee since 2013 • Oversees 52 Funds in Fund Complex | | Kurt A. Keilhacker, 57 Managing Partner, TechFund Capital (1997-Present); Managing Partner, TechFund Europe (2000-Present); Board Member, 6wind SA, (2002-2019); Managing Partner, Elementum Ventures (2013-Present); Director, Pantheon Funds (2014-Present); Director, MetricStory, Inc. (2017-Present); Trustee, Wheaton College (2018-Present); Trustee, Gordon College (2001-2016). |
| | |
• Trustee since 2000 • Oversees 49 Funds in Fund Complex | | Steven J. Paggioli, 70 Independent Consultant (2002-Present); Trustee, Professionally Managed Portfolios (28 portfolios); Advisory Board Member, Sustainable Growth Advisors, LP; Independent Director, Muzinich BDC, Inc. (business development company) (2019-Present); Director, The Wadsworth Group; Independent Director, Chase Investment Counsel (2008–2019); Executive Vice President, Secretary and Director, Investment Company Administration, LLC and First Fund Distributors, INC. (1990-2001). |
| | |
• Trustee since 2013 • Oversees 49 Funds in Fund Complex | | Richard F. Powers III, 74 Adjunct Professor, U.S. Naval War College (2016-Present); Adjunct Professor, Boston College (2011-2015); Director, Ameriprise Financial Inc. (2005-2009); President and CEO of Van Kampen Investments Inc. (1998-2003); President, Morgan Stanley Client Group (2000-2002); Executive Vice President and Chief Marketing Officer of the Morgan Stanley Individual Investor Group (1984-1998). |
| | |
• Independent Chairman • Trustee since 2000 • Oversees 52 Funds in Fund Complex | | Eric Rakowski, 62 Professor of Law, University of California at Berkeley School of Law (1990-Present); Tax Attorney at Davis Polk & Wardwell and clerked for Judge Harry T. Edwards of the U.S. Court of Appeals for the District of Columbia Circuit and for Justice William J. Brennan Jr. of the U.S. Supreme Court; Director of Harding, Loevner Funds, Inc. (9 portfolios); Trustee of Third Avenue Trust (2002-2019); Trustee of Third Avenue Variable Trust (2002-2019). |
| | |
• Trustee since 2013 • Oversees 52 Funds in Fund Complex | | Victoria L. Sassine, 55 Adjunct Professor, Babson College (2007–Present); Director, Board of Directors, PRG Group (2017-Present); Chairperson of the Board of Directors of Business Management Associates (2018 to 2019); CEO, Founder, Scale Smarter Partners, LLC (2018-Present); Teaching Fellow, Goldman Sachs 10,000 Small Business Initiative (2010-Present); Chairperson, Board of Directors, Business Management Associates (2018-Present). |
| | |
• Trustee since 2000 • Oversees 49 Funds in Fund
Complex | | Thomas R. Schneeweis, 73 Professor Emeritus, University of Massachusetts (2013-Present); President, TRS Associates (1982-Present); Board Member, Chartered Alternative Investment Association (“CAIA”) (2002-Present); Director, CAIA Foundation (2010-2019); Director, Institute for Global Asset and Risk Management (Education) (2010-Present); Co-Owner, Quantitative Investment Technologies (2014-Present); Co-Owner, Yes Wealth Management (2018-Present); Director of Research, Yes Wealth Management (2018-Present); Partner, S Capital Wealth Advisors (2015-2018); Partner, S Capital Management, LLC (2007-2015); President, Alternative Investment Analytics, LLC, (formerly Schneeweis Partners, LLC) (2001-2013); Finance Professor, University of Massachusetts (1977-2013). |
30
|
AMG Funds Trustees and Officers (continued) |
Interested Trustees
Each Trustee in the following table is an “interested person” of the Trust within the meaning of the 1940 Act. Ms. Carsman is an interested person of the Trust within the meaning of the 1940 Act by virtue of her position with, and interest in securities of, AMG.
| | |
Number of Funds Overseen in
Fund Complex | | Name, Age, Principal Occupation(s) During Past 5 Years and Other Directorships Held by Trustee |
| | |
• Trustee since 2011 • Oversees 52 Funds in Fund Complex | | Christine C. Carsman, 68 Senior Policy Advisor, Affiliated Managers Group, Inc. (2019-Present); Deputy General Counsel, Affiliated Managers Group, Inc. (2011-2018); Vice President (2004 to 2007), Senior Vice President (2007—2016), Executive Vice President (2017—2018) and Chief Regulatory Counsel (2004 to 2018), Affiliated Managers Group, Inc. (2004—2011); Senior Counsel, Vice President and Director of Operational Risk Management and Compliance, Wellington Management Company, LLP (1995—2004); Director of Harding, Loevner Funds, Inc. (9 portfolios); Secretary and Chief Legal Officer, AMG Funds, AMG Funds I, AMG Funds II and AMG Funds III (2004-2011). |
Officers |
Position(s) Held with Fund and
Length of Time Served | | Name, Age, Principal Occupation(s) During Past 5 Years |
| | |
• President since 2018 • Principal Executive Officer since 2018 • Chief Executive Officer since 2018 • Chief Operating Officer since 2007 | | Keitha L. Kinne, 62 Chief Operating Officer, AMG Funds LLC (2007-Present); Chief Investment Officer, AMG Funds LLC (2008-Present); President and Principal, AMG Distributors, Inc. (2018-Present); Chief Operating Officer, AMG Distributors, Inc. (2007-Present); President, Chief Executive Officer and Principal Executive Officer, AMG Funds, AMG Funds I, AMG Funds II, AMG Funds III and AMG Funds IV (2018-Present); Chief Operating Officer, AMG Funds, AMG Funds I, AMG Funds II, and AMG Funds III (2007-Present); Chief Operating Officer, AMG Funds IV (2016-Present); Chief Operating Officer and Chief Investment Officer, Aston Asset Management, LLC (2016); President and Principal Executive Officer, AMG Funds, AMG Funds I, AMG Funds II and AMG Funds III (2012-2014); Managing Partner, AMG Funds LLC (2007-2014); President and Principal, AMG Distributors, Inc. (2012-2014); Managing Director, Legg Mason & Co., LLC (2006-2007); Managing Director, Citigroup Asset Management (2004-2006). |
| | |
• Secretary since 2015 • Chief Legal Officer since 2015 | | Mark J. Duggan, 55 Senior Vice President and Senior Counsel, AMG Funds LLC (2015-Present); Secretary and Chief Legal Officer, AMG Funds, AMG Funds I, AMG Funds II, AMG Funds III and AMG Funds IV (2015-Present); Attorney, K&L Gates, LLP (2009-2015). |
| | |
• Chief Financial Officer since 2017 • Treasurer since 2017 • Principal Financial Officer since 2017 • Principal Accounting Officer since 2017 | | Thomas G. Disbrow, 54 Vice President, Mutual Fund Treasurer & CFO, AMG Funds, AMG Funds LLC (2017-Present); Chief Financial Officer, Principal Financial Officer, Treasurer and Principal Accounting Officer, AMG Funds, AMG Funds I, AMG Funds II, AMG Funds III and AMG Funds IV (2017-Present); Managing Director—Global Head of Traditional Funds Product Control, UBS Asset Management (Americas), Inc. (2015-2017); Managing Director—Head of North American Funds Treasury, UBS Asset Management (Americas), Inc. (2011-2015). |
| | |
| • Deputy Treasurer since 2017 | | John A. Starace, 49 Director, Mutual Fund Accounting, AMG Funds LLC (2017-Present); Vice President, Deputy Treasurer of Mutual Funds Services, AMG Funds LLC (2014-2017); Deputy Treasurer, AMG Funds, AMG Funds I, AMG Funds II, AMG Funds III and AMG Funds IV (2017-Present); Vice President, Citi Hedge Fund Services (2010-2014); Audit Senior Manager (2005-2010) and Audit Manager (2001-2005), Deloitte & Touche LLP. |
| | |
• Chief Compliance Officer since 2019 | | Patrick J. Spellman, 46 Vice President, Chief Compliance Officer, AMG Funds LLC (2017-Present); Chief Compliance Officer and Sarbanes-Oxley Code of Ethics Compliance Officer, AMG Funds, AMG Funds I, AMG Funds II, AMG Funds III and AMG Funds IV (2019-Present); Chief Compliance Officer, AMG Distributors, Inc., (2010-Present); Senior Vice President, Chief Compliance Officer, AMG Funds LLC (2011-2017); Anti-Money Laundering Compliance Officer, AMG Funds, AMG Funds I, AMG Funds II, and AMG Funds III (2014-2019); Anti-Money Laundering Officer, AMG Funds IV, (2016-2019); Compliance Manager, Legal and Compliance, Affiliated Managers Group, Inc. (2005-2011). |
| | |
| • Assistant Secretary since 2016 | | Maureen A. Meredith, 35 Vice President, Counsel, AMG Funds LLC (2019-Present); Director, Counsel, AMG Funds LLC (2017-2018); Vice President, Counsel, AMG Funds LLC (2015-2017); Assistant Secretary, AMG Funds, AMG Funds I, AMG Funds II, AMG Funds III and AMG Funds IV (2016-Present); Associate, Ropes & Gray LLP (2011-2015); Law Fellow, Massachusetts Appleseed Center for Law and Justice (2010-2011). |
| | |
| • Anti-Money Laundering Compliance Officer since 2019 | | Hector D. Roman, 42 Director, Legal and Compliance, AMG Funds LLC (2020-Present); Manager, Legal and Compliance, AMG Funds LLC (2017-2019); Director of Compliance, Morgan Stanley Investment Management (2015-2017); Senior Advisory, PricewaterhouseCoopers LLP (2014-2015); Risk Manager, Barclays Investment Bank (2008-2014); Anti-Money Laundering Compliance Officer, AMG Funds, AMG Funds I, AMG Funds II, AMG Funds III and AMG Funds IV (2019-Present). |
31
|
Annual Renewal of Investment Management and Subadvisory Agreements |
| | | | | | | | |
AMG Managers Brandywine Fund and AMG Managers Brandywine Blue Fund: Approval of Investment Management, Subadvisory and Sub-Subadvisory Agreements on June 25, 2020 At a meeting held via telephone and video conference on June 25, 2020,1 the Board of Trustees (the “Board” or the “Trustees”), and separately a majority of the Trustees who are not “interested persons” of AMG Funds I (the “Trust”) (the “Independent Trustees”), approved (i) the Investment Management Agreement, as amended pursuant to letter agreements at any time prior to the date of the meeting, with AMG Funds LLC (the “Investment Manager”) for each of AMG Managers Brandywine Fund and AMG Managers Brandywine Blue Fund (each, a “Fund,” and collectively, the “Funds”) and separately each of Amendment No. 1 thereto dated July 1, 2015, and Amendment No. 2 thereto dated October 1, 2016 (collectively, the “Investment Management Agreement”) and (ii) the Subadvisory Agreement, as amended at any time prior to the date of the meeting, with the Subadviser with respect to each Fund and the Sub-Subadvisory Agreement with the Sub-Subadviser with respect to each Fund (collectively, the “Friess Agreements”). The Subadviser and the Sub-Subadviser are referred to collectively herein as “Friess.” The Independent Trustees were separately represented by independent legal counsel in connection with their consideration of the approval of these agreements. In considering the Investment Management Agreement and the Friess Agreements, the Trustees reviewed a variety of materials relating to each Fund, the Investment Manager and Friess including the nature, extent and quality of services, comparative performance, fee and expense information for an appropriate peer group of similar mutual funds for each Fund (each, a “Peer Group”), performance information for the relevant benchmark index for each Fund (each, a “Fund Benchmark”), other relevant matters, and other information provided to them on a periodic basis throughout the year. Prior to voting, the Independent Trustees: (a) reviewed the foregoing information with their independent legal counsel; (b) received materials from their independent legal counsel discussing the legal standards applicable to their consideration of the Investment Management Agreement and the Friess Agreements; and (c) met with their independent legal counsel in private sessions at which no representatives of management were present. NATURE, EXTENT AND QUALITY OF SERVICES In considering the nature, extent and quality of the services provided by the Investment Manager, the Trustees reviewed information relating to the | | | | Investment Manager’s operations and personnel. Among other things, the Investment Manager provided financial information, information about its supervisory and professional staff and descriptions of its organizational and management structure. The Trustees also took into account information provided periodically throughout the previous year by the Investment Manager in Board meetings relating to the performance of its duties with respect to the Funds and the Trustees’ knowledge of the Investment Manager’s management and the quality of the performance of the Investment Manager’s duties under the Investment Management Agreement and Administration Agreement. In the course of their deliberations regarding the Investment Manager, the Trustees evaluated, among other things: (a) the extent and quality of the Investment Manager’s oversight of the operation and management of the Funds; (b) the quality of the search, selection and monitoring services performed by the Investment Manager in overseeing the portfolio management responsibilities of Friess; (c) the Investment Manager’s ability to supervise the Funds’ other service providers; and (d) the Investment Manager’s compliance program. The Trustees also took into account that, in performing its functions under the Investment Management Agreement and supervising Friess, the Investment Manager: performs periodic detailed analyses and reviews of the performance by Friess of its obligations to each Fund, including without limitation, analysis and review of portfolio and other compliance matters and review of Friess’s investment performance with respect to a Fund; prepares and presents periodic reports to the Board regarding the investment performance of Friess and other information regarding Friess, at such times and in such forms as the Board may reasonably request; reviews and considers any changes in the personnel of Friess responsible for performing Friess’s obligations and makes appropriate reports to the Board; reviews and considers any changes in the ownership or senior management of Friess and makes appropriate reports to the Board; performs periodic in-person or telephonic diligence meetings, including with respect to compliance matters, with representatives of Friess; assists the Board and management of the Trust in developing and reviewing information with respect to the initial approval of each Friess Agreement and annual consideration of each Friess Agreement thereafter; prepares recommendations with respect to the continued retention of Friess or the replacement of Friess, including at the request of the Board; | | | | identifies potential successors to, or replacements of, Friess or potential additional subadvisers, including performing appropriate due diligence, and developing and presenting to the Board a recommendation as to any such successor, replacement, or additional subadviser, including at the request of the Board; designates and compensates from its own resources such personnel as the Investment Manager may consider necessary or appropriate to the performance of its services; and performs such other review and reporting functions as the Board shall reasonably request consistent with the Investment Management Agreement and applicable law. The Trustees also took into account the financial condition of the Investment Manager with respect to its ability to provide the services required under the Investment Management Agreement. The Trustees also considered the Investment Manager’s risk management processes. For each Fund, the Trustees also reviewed information relating to Friess’s operations and personnel and the investment philosophy, strategies and techniques (its “Investment Strategy”) used in managing the Fund. Among other things, the Trustees reviewed information on portfolio management and other professional staff, information regarding Friess’s organizational and management structure and Friess’s brokerage policies and practices. The Trustees considered specific information provided regarding the experience of the individuals at Friess with portfolio management responsibility for the Funds, including the information set forth in the Funds’ prospectus and statement of additional information. In the course of their deliberations, the Trustees evaluated, among other things: (a) the services rendered by Friess in the past; (b) the qualifications and experience of Friess’s personnel; and (c) Friess’s compliance program. The Trustees also took into account the financial condition of Friess with respect to its ability to provide the services required under each Friess Agreement. The Trustees also considered Friess’s risk management processes. PERFORMANCE The Board considered each Fund’s net performance during relevant time periods as compared to the Fund’s Peer Group and Fund Benchmark and considered the gross performance of the Fund as compared to Friess’s relevant performance composite that utilizes the same investment strategy and approach and noted that the Board reviews on a |
32
|
Annual Renewal of Investment Management and Subadvisory Agreements (continued) |
| | | | | | | | |
quarterly basis detailed information about both the Fund’s performance results and portfolio composition, as well as Friess’s Investment Strategy. The Board was mindful of the Investment Manager’s expertise, resources and attention to monitoring Friess’s performance, investment style and risk-adjusted performance with respect to the Funds and its discussions with the Subadviser’s management regarding the factors that contributed to the performance of the Funds. ADVISORY AND SUBADVISORY FEES; PROFITABILITY; AND ECONOMIES OF SCALE In considering the reasonableness of the advisory fee charged by the Investment Manager for managing each Fund, the Trustees noted that the Investment Manager, and not the Fund, is responsible for paying the fees charged by the Fund’s Subadviser, and, in turn, the Subadviser is responsible for paying the fees charged by the Fund’s Sub-Subadviser and, therefore, that the fees paid to the Investment Manager cover the cost of providing portfolio management services as well as the cost of providing search, selection and monitoring services in operating a “manager-of-managers” complex of mutual funds. The Trustees also considered the amount of the advisory fee retained by the Investment Manager after payment of the subadvisory fee with respect to each Fund. The Trustees also noted payments made or to be made from the Subadviser to the Investment Manager, and other payments made or to be made from the Investment Manager to the Subadviser. The Trustees concluded that, in light of the high quality supervisory services provided by the Investment Manager and the fact that the Investment Manager and the Subadviser are paying the fees under the Subadvisory Agreements and Sub-Subadvisory Agreements, respectively, the advisory fee payable by each Fund to the Investment Manager can reasonably be expected to exceed the median advisory fee for the Peer Group, which consists of many funds that do not operate with a manager-of-managers structure. In addition, in considering the reasonableness of the advisory fee payable to the Investment Manager, the Trustees also reviewed information provided by the Investment Manager setting forth all revenues and other benefits, both direct and indirect (including any so-called “fallout benefits” such as reputational value derived from the Investment Manager serving as Investment Manager to a Fund), received by the Investment Manager and its affiliates attributable to managing each Fund and all the mutual funds in the AMG Funds Family of Funds; the cost of providing | | | | such services; the significant risks undertaken as Investment Manager and sponsor of the Funds, including investment, operational, enterprise, entrepreneurial, litigation, regulatory and compliance risks; and the resulting profitability to the Investment Manager and its affiliates from these relationships. The Trustees also considered management’s discussion of the current asset levels of the Funds, and the impact on profitability of both the current asset levels and any future growth of assets of the Funds. The Board took into account management’s discussion of the advisory fee structure, and the services the Investment Manager provides in performing its functions under the Investment Management Agreement and supervising Friess. In this regard, the Trustees noted that, unlike a mutual fund that is managed by a single investment adviser, the Funds operate in a manager-of-managers structure. Based on the foregoing, the Trustees concluded that the profitability to the Investment Manager is reasonable and that the Investment Manager is not realizing material benefits from economies of scale that would warrant adjustments to the advisory fees for any Fund at this time. With respect to economies of scale, the Trustees also noted that as a Fund’s assets increase over time, the Fund may realize other economies of scale to the extent that the increase in assets is proportionally greater than the increase in certain other expenses. In considering the reasonableness of the subadvisory fee payable by the Investment Manager to Friess, the Trustees relied on the ability of the Investment Manager to negotiate the terms of the Friess Agreements at arm’s length as part of the manager-of-managers structure, noting that the Investment Manager is not affiliated with Friess. In addition, the Trustees considered other potential benefits of the subadvisory relationship to Friess, including, among others, the indirect benefits that Friess may receive from its relationship with a Fund, including any so-called “fallout benefits” to Friess, such as reputational value derived from the Subadviser and Sub-Subadviser serving as Subadviser and Sub-Subadviser, respectively, to the Fund. In addition, the Trustees noted that the subadvisory fees are paid by the Investment Manager out of its advisory fee and, in turn, the sub-subadvisory fees are paid by the Subadviser. As a consequence of all of the foregoing, the cost of services to be provided by Friess and the profitability to Friess of its relationship with a Fund were not material factors in the Trustees’ deliberations. For similar reasons, the Trustees did not consider | | | | potential economies of scale in the management of a Fund by Friess to be a material factor in their deliberations at this time. In addition to the foregoing, the Trustees considered the specific factors and related conclusions set forth below with respect to each Fund, the Investment Manager and Friess. AMG Managers Brandywine Fund Fund Performance Among other information relating to the Fund’s performance (including the predecessor fund’s performance for periods prior to its acquisition by the Trust on October 1, 2013), the Trustees noted that the Fund’s performance for Class I shares (the Fund’s sole share class) for the 1-year, 3-year, 5-year and 10-year periods ended March 31, 2020 was below the median performance of the Peer Group and below the performance of the Fund Benchmark, the Russell 3000® Growth Index. The Trustees also took into account management’s discussion of the Fund’s performance, including the reasons for the Fund’s underperformance and noted that the Fund ranked near the median performance of the Peer Group for the 3-year and 5-year periods. The Trustees concluded that the Fund’s overall performance has been satisfactory in light of the Fund’s investment objective, strategies and policies. Advisory and Subadvisory Fees and Fund Expenses The Trustees noted that the Fund’s management fees (which include both the advisory and administration fees) and total expenses as of March 31, 2020 were both higher than the average for the Fund’s Peer Group. The Trustees took into account management’s discussion of the Fund’s expenses and competitiveness with comparably sized funds. The Trustees concluded that, in light of the nature, extent and quality of the services provided by the Investment Manager and Friess and the considerations noted above with respect to the Investment Manager and Friess, the Fund’s advisory, subadvisory and sub-subadvisory fees are reasonable. AMG Managers Brandywine Blue Fund Fund Performance Among other information relating to the Fund’s performance (including the predecessor fund’s performance for periods prior to its acquisition by the Trust on October 1, 2013), the Trustees noted that the Fund’s performance for Class I shares (the Fund’s |
33
|
Annual Renewal of Investment Management and Subadvisory Agreements (unaudited) |
| | | | | | | | |
sole share class) for the 1-year, 3-year, 5-year and 10-year periods ended March 31, 2020 was above, below, below, and below, respectively, the median performance of the Peer Group and below the performance of the Fund Benchmark, the Russell 1000® Growth Index. The Trustees also took into account management’s discussion of the Fund’s performance, including the Fund’s more recent improved performance relative to its Peer Group and the reasons for the Fund’s underperformance. The Trustees concluded that the Fund’s overall performance has been satisfactory in light of the Fund’s investment objective, strategies and policies. Advisory and Subadvisory Fees and Fund Expenses The Trustees noted that the Fund’s management fees (which include both the advisory and administration fees) and total expenses as of March 31, 2020 were both higher than the average for the Peer Group. The Trustees also took into account management’s discussion of the Fund’s expenses and competitiveness with comparably sized funds. The Trustees concluded that, in light of the nature, extent and quality of the services provided by the Investment Manager and Friess, and the | | | | considerations noted above with respect to the Investment Manager and Friess, the Fund’s advisory, subadvisory and sub-subadvisory fees are reasonable. * * * * * After consideration of the foregoing, the Trustees also reached the following conclusions (in addition to the conclusions discussed above) regarding the Investment Management Agreement and each Friess Agreement: (a) the Investment Manager and Friess have demonstrated that they possess the capability and resources to perform the duties required of them under the Investment Management Agreement and the Friess Agreements and (b) the Investment Manager and Friess maintain appropriate compliance programs. Based on all of the above-mentioned factors and their related conclusions, with no single factor or conclusion being determinative and with each Trustee not necessarily attributing the same weight to each factor, the Trustees concluded that approval of the Investment Management Agreement and each Friess Agreement would be in the best interests of the applicable Fund and its shareholders. | | | | Accordingly, on June 25, 2020, the Trustees, and separately a majority of the Independent Trustees, voted to approve the Investment Management Agreement and the Friess Agreements for each Fund. 1 The Trustees determined that the conditions surrounding Covid-19 constituted unforeseen or emergency circumstances and that reliance on the Securities and Exchange Commission’s (“SEC”) exemptive order, which provides relief from the in-person voting requirements of the Investment Company Act of 1940, as amended (the “1940 Act”), in certain circumstances (the “In-Person Relief”), was necessary or appropriate due to the circumstances related to current or potential effects of Covid-19. The Trustees unanimously wished to rely on the In-Person Relief with respect to the approval of those matters on the agenda for the June 25, 2020 meeting that would otherwise require in-person votes under the 1940 Act. The Trustees, including a majority of the Trustees who are not “interested persons” of AMG Funds I, undertook to ratify the actions taken pursuant to the In-Person Relief at the Board’s next in-person meeting, consistent with the requirements of the In-Person Relief. See Investment Company Release No. 33897 (June 19, 2020). This exemptive order supersedes, in part, a similar, earlier exemptive order issued by the SEC (Investment Company Release No. 33824 (March 25, 2020)). |
| | | | | | | | |
34
THIS PAGE INTENTIONALLY LEFT BLANK
THIS PAGE INTENTIONALLY LEFT BLANK
|
 |
| | | | | | | | |
INVESTMENT MANAGER AND ADMINISTRATOR AMG Funds LLC 600 Steamboat Road, Suite 300 Greenwich, CT 06830 800.548.4539 DISTRIBUTOR AMG Distributors, Inc. 600 Steamboat Road, Suite 300 Greenwich, CT 06830 800.548.4539 SUBADVISER Friess Associates, LLC P.O. Box 576 Jackson, Wyoming 83001 Friess Associates of Delaware, LLC P.O. Box 4166 Greenville, DE 19807 CUSTODIAN The Bank of New York Mellon 111 Sanders Creek Parkway East Syracuse, NY 13057 | | | | LEGAL COUNSEL Ropes & Gray LLP Prudential Tower, 800 Boylston Street Boston, MA 02199-3600 TRANSFER AGENT BNY Mellon Investment Servicing (US) Inc. Attn: AMG Funds 4400 Computer Drive Westborough, MA 800.548.4539 | | | | This report is prepared for the Funds’ shareholders. It is authorized for distribution to prospective investors only when preceded or accompanied by an effective prospectus. To receive a free copy of the prospectus or Statement of Additional Information, which includes additional information about Fund Trustees, please contact us by calling 800.548.4539. Distributed by AMG Distributors, Inc., member FINRA/SIPC. Current net asset values per share for each Fund are available on the Funds’ website at amgfunds.com. A description of the policies and procedures each Fund uses to vote its proxies is available: (i) without charge, upon request, by calling 800.548.4539, or (ii) on the Securities and Exchange Commission’s (SEC) website at sec.gov. For information regarding the Funds’ proxy voting record for the 12-month period ended June 30, call 800.548.4539 or visit the SEC website at sec.gov. The Funds file their complete schedule of portfolio holdings with the SEC for the first and third quarters of each fiscal year as an exhibit to their reports on Form N-PORT. The Funds’ portfolio holdings on Form N-PORT are available on the SEC’s website at sec.gov. To review a complete list of the Funds’ portfolio holdings, or to view the most recent semiannual report or annual report, please visit amgfunds.com. |
|
|
| | | | | | | | |
AFFILIATE SUBADVISED FUNDS BALANCED FUNDS AMG GW&K Global Allocation GW&K Investment Management, LLC AMG FQ Global Risk-Balanced First Quadrant, L.P. EQUITY FUNDS AMG FQ Tax-Managed U.S. Equity AMG FQ Long-Short Equity First Quadrant, L.P. AMG Frontier Small Cap Growth Frontier Capital Management Co., LLC AMG GW&K Small Cap Core AMG GW&K Small/Mid Cap AMG GW&K Mid Cap AMG GW&K Emerging Markets Equity AMG GW&K Emerging Wealth Equity AMG GW&K International Small Cap Fund GW&K Investment Management, LLC AMG Renaissance Large Cap Growth The Renaissance Group LLC AMG River Road Dividend All Cap Value AMG River Road Focused Absolute Value AMG River Road Long-Short AMG River Road Small-Mid Cap Value AMG River Road Small Cap Value River Road Asset Management, LLC | | | | AMG TimesSquare Emerging Markets Small Cap AMG TimesSquare Global Small Cap AMG TimesSquare International Small Cap AMG TimesSquare Mid Cap Growth AMG TimesSquare Small Cap Growth TimesSquare Capital Management, LLC AMG Yacktman AMG Yacktman Focused AMG Yacktman Focused Fund - Security Selection Only AMG Yacktman Special Opportunities Yacktman Asset Management LP FIXED INCOME FUNDS AMG GW&K Core Bond ESG AMG GW&K Enhanced Core Bond ESG AMG GW&K Municipal Bond AMG GW&K Municipal Enhanced Yield GW&K Investment Management, LLC OPEN-ARCHITECTURE FUNDS EQUITY FUNDS AMG Managers Brandywine AMG Managers Brandywine Blue Friess Associates, LLC AMG Managers CenterSquare Real Estate CenterSquare Investment Management LLC | | | | AMG Managers Emerging Opportunities WEDGE Capital Management L.L.P. Next Century Growth Investors LLC RBC Global Asset Management (U.S.) Inc. AMG Managers Fairpointe Mid Cap Fairpointe Capital LLC AMG Managers LMCG Small Cap Growth LMCG Investments, LLC AMG Managers Montag & Caldwell Growth Montag & Caldwell, LLC AMG Managers Pictet International Pictet Asset Management Limited AMG Managers Silvercrest Small Cap Silvercrest Asset Management Group LLC AMG Managers Skyline Special Equities Skyline Asset Management, L.P. AMG Managers Special Equity Ranger Investment Management, L.P. Lord, Abbett & Co. LLC Smith Asset Management Group, L.P. Federated MDTA LLC AMG SouthernSun Small Cap AMG SouthernSun U.S. Equity SouthernSun Asset Management, LLC FIXED INCOME FUNDS AMG Managers Doubleline Core Plus Bond DoubleLine Capital LP AMG Managers Global Income Opportunity AMG Managers Loomis Sayles Bond Loomis, Sayles & Company, L.P. |
| | | | | | | | | |
| | | | | | | | | |
| | | | | | | | | |
| | | | | | | | | |
| | | | | | | | | |
| | | | | | | | | |
| | | | | | | | | |
| | | | | | | | | |
| | | | | | | | | |
| | | | | | | | | |
| | | | |
| amgfunds.com | | | | 093020 AR073 |
Registrant has adopted a Code of Ethics. See attached Exhibit (a)(1).
| Item 3. | AUDIT COMMITTEE FINANCIAL EXPERT |
Registrant’s Board of Trustees has determined that independent Trustee Mr. Steven J. Paggioli qualifies as an Audit Committee Financial Expert. Mr. Paggioli is “independent” as such term is defined in Form N-CSR.
| Item 4. | PRINCIPAL ACCOUNTANT FEES AND SERVICES |
(a) Audit Fees
The aggregate fees billed by the Funds’ independent registered public accounting firm, PricewaterhouseCoopers LLP (“PwC”), to the Funds for the Funds’ two most recent fiscal years for professional services rendered for audits of annual financial statements, or services that are normally provided in connection with statutory and regulatory filings or engagements (“Audit Fees”) were as follows:
| | | | | | | | |
| | | Fiscal 2020 | | | Fiscal 2019 | |
AMG Managers Brandywine Fund | | $ | 27,956 | | | $ | 29,126 | |
AMG Managers Brandywine Blue Fund | | $ | 24,979 | | | $ | 25,172 | |
(b) Audit-Related Fees
There were no fees billed by PwC to the Funds in its two recent fiscal years for services rendered for assurance and related services that are reasonably related to the performance of the audit or review of the Fund’s financial statements, but are not reported as Audit Fees (“Audit-Related Fees”).
For the Funds’ two most recent fiscal years, there were no Audit-Related Fees billed by PwC for engagements related directly to the operations and financial reporting of one or more Funds by a Fund Service Provider. A Fund Service Provider is (a) any investment adviser to the Fund (not including any Subadvisor whose role is primarily portfolio management and is subcontracted with or overseen by another investment adviser) or (b) any entity that provides ongoing services to the Fund and is controlling, controlled by or under common control with a Fund investment adviser described in (a).
(c) Tax Fees
The aggregate fees billed by PwC to the Funds for the two most recent fiscal years for professional services rendered for tax compliance, tax advice, and tax planning (“Tax Fees”) were as follows:
| | | | | | | | |
| | | Fiscal 2020 | | | Fiscal 2019 | |
AMG Managers Brandywine Fund | | $ | 6,250 | | | $ | 6,250 | |
AMG Managers Brandywine Blue Fund | | $ | 6,250 | | | $ | 6,250 | |
For the Funds’ two most recent fiscal years, Tax Fees billed by PwC for engagements by Fund Service Providers that related directly to the operations and financial reporting of the Funds were $0 for fiscal 2020 and $0 for fiscal 2019, respectively.
The services for which Tax Fees were charged comprise all services performed by professional staff in PwC’s tax division except those services related to the audit. Typically, this category would include fees for tax compliance, tax planning, and tax advice. Tax compliance, tax advice, and tax planning services include preparation of original and amended tax returns, claims for refund and tax payment-planning services, assistance with tax audits and appeals, tax advice related to mergers and acquisitions and requests for rulings or technical advice from taxing authorities.
(d) All Other Fees
There were no other fees billed by PwC to the Funds for all other non-audit services (“Other Fees”) during the Funds’ two most recent fiscal years. During the same period, there were no Other Fees billed by PwC for engagements by Fund Service Providers that related directly to the operations and financial reporting of the Funds.
(e)(1)According to policies adopted by the Audit Committee, services provided by PwC to the Funds must be pre-approved by the Audit Committee. On an annual basis, the Audit Committee reviews and pre-approves various types of services that PwC may perform for the Funds without specific approval of each engagement, subject to specified budget limitations. As contemplated by the Sarbanes-Oxley Act of 2002 and related SEC rules, the Audit Committee also pre-approves non-audit services provided by PwC to any Fund Service Provider for any engagement that relates directly to the operations and financial reporting of the Funds. Any engagement that is not already pre-approved or that will exceed a pre-approved budget must be submitted to the Audit Committee for pre-approval. The Chairman of the Audit Committee is authorized on behalf of the Board of Trustees and the Audit Committee to approve the engagement of PwC to perform non-audit services subject to certain conditions, including notification to the Audit Committee of such pre-approval not later than the next meeting of the Audit Committee following the date of such pre-approval.
(e)(2) None.
(f) Not applicable.
(g) The aggregate fees billed by PwC in 2020 and 2019 for non-audit services rendered to the Funds and Fund Service Providers were $62,000 and $68,250, respectively. For the fiscal year ended September 30, 2020, this amount reflects the amounts disclosed above in Item 4(b),(c),(d), plus $49,500 in fees billed to the Fund Service Providers for non-audit services that did not relate directly to the operations and financial reporting of the Funds. For the fiscal year ended September 30, 2019, this amount reflects the amounts disclosed above in Item 4(b),(c),(d), plus $49,500 in fees billed to the Fund Service Providers for non-audit services that did not relate directly to the operations and financial reporting of the Funds.
(h) The Trust’s Audit Committee has considered whether the provision of non-audit services by registrant’s independent registered public accounting firm to the registrant’s investment advisor, and any entity controlling, controlled, or under common control with the investment advisor that provided ongoing services to the registrant that were not pre-approved by the Committee (because such services did not relate directly to the operations and financial reporting of the registrant) was compatible with maintaining the independence of the independent registered public accounting firm.
| Item 5. | AUDIT COMMITTEE OF LISTED REGISTRANTS |
Not applicable.
| Item 6. | SCHEDULE OF INVESTMENTS |
The schedule of investments in unaffiliated issuers as of the close of the reporting period is included as part of the shareholder report contained in Item 1 hereof.
| Item 7. | DISCLOSURE OF PROXY VOTING POLICIES AND PROCEDURES FOR CLOSED-END MANAGEMENT INVESTMENT COMPANIES |
Not applicable.
| Item 8. | PORTFOLIO MANAGERS OF CLOSED-END MANAGEMENT INVESTMENT COMPANIES |
Not applicable.
| Item 9. | PURCHASES OF EQUITY SECURITIES BY CLOSED-END MANAGEMENT INVESTMENT COMPANIES AND AFFILIATED PURCHASERS |
Not applicable.
| Item 10. | SUBMISSION OF MATTERS TO A VOTE OF SECURITY HOLDERS |
Not applicable.
| Item 11. | CONTROLS AND PROCEDURES |
(a) The Registrant’s principal executive and principal financial officers have concluded, based on their evaluation of the registrant’s disclosure controls and procedures as of a date within 90 days of the filing of this report, that the Registrant’s disclosure controls and procedures are reasonably designed to ensure that information required to be disclosed by the Registrant on Form N-CSR is recorded, processed, summarized and reported within the required time periods and that information required to be disclosed by the registrant in the reports that it files or submits on Form N-CSR is accumulated and communicated to the Registrant’s management, including its principal executive and principal financial officers, as appropriate to allow timely decisions regarding required disclosure.
(b) There were no changes in the Registrant’s internal control over financial reporting during the period covered by this report that have materially affected, or are reasonably likely to materially affect, the internal control over financial reporting.
| Item 12. | DISCLOSURE OF SECURITIES LENDING ACTIVITIES FOR CLOSED-END MANAGEMENT INVESTMENT COMPANIES |
Not applicable.
SIGNATURES
Pursuant to the requirements of the Securities Exchange Act of 1934 and the Investment Company Act of 1940, the registrant has duly caused this report to be signed on its behalf by the undersigned, thereunto duly authorized.
| | |
| AMG FUNDS I |
| |
| By: | | /s/ Keitha L. Kinne |
| | Keitha L. Kinne, Principal Executive Officer |
Date: November 23, 2020
Pursuant to the requirements of the Securities Exchange Act of 1934 and the Investment Company Act of 1940, this report has been signed below by the following persons on behalf of the registrant and in the capacities and on the dates indicated.
| | |
| By: | | /s/ Keitha L. Kinne |
| | Keitha L. Kinne, Principal Executive Officer |
| |
| Date: | | November 23, 2020 |
| |
| By: | | /s/ John Starace |
| | John Starace, Principal Financial Officer |
| |
| Date: | | November 23, 2020 |