UNITED STATES
SECURITIES AND EXCHANGE COMMISSION
Washington, D.C. 20549
FORM N-CSR
CERTIFIED SHAREHOLDER REPORT OF
REGISTERED MANAGEMENT INVESTMENT COMPANIES
Investment Company Act file number: 811-06520
AMG FUNDS I
(Exact name of registrant as specified in charter)
680 Washington Blvd., Suite 500, Stamford, Connecticut 06901
(Address of principal executive offices) (Zip code)
AMG Funds LLC
680 Washington Blvd., Suite 500, Stamford, Connecticut 06901
(Name and address of agent for service)
Registrant’s telephone number, including area code: (203) 299-3500
Date of fiscal year end: September 30
Date of reporting period: OCTOBER 1, 2020 – SEPTEMBER 30, 2021
(Annual Shareholder Report)
| Item 1. | Reports to Shareholders |
| | |
 | | ANNUAL REPORT |
| | |
| | | AMG Funds September 30, 2021 |
| | | 
|
| | |
| | | AMG Boston Common Global Impact Fund |
| | | (formerly AMG Managers Brandywine Fund) |
| | |
| | | Class I: BRWIX |
| | | |
| | | |
| | | |
| | | |
| | | | |
| amgfunds.com | | | | 093021 AR074 |
| | |
| | | AMG Funds Annual Report — September 30, 2021 |
| | | | | | |
| | | |
| | | | | | | |
| | | TABLE OF CONTENTS | | PAGE | |
| | | | |
| | | LETTER TO SHAREHOLDERS | | | 2 | |
| | | |
| | | ABOUT YOUR FUND’S EXPENSES | | | 3 | |
| | | |
| | | PORTFOLIO MANAGER’S COMMENTS, FUND SNAPSHOTS AND SCHEDULE OF PORTFOLIO INVESTMENTS | | | 4 | |
| | | |
| | | FINANCIAL STATEMENTS | | | | |
| | | |
| | | Statement of Assets and Liabilities | | | 13 | |
| | | |
| | | Balance sheet, net asset value (NAV) per share computations and cumulative distributable earnings (loss) | | | | |
| | | |
| | | Statement of Operations | | | 14 | |
| | | |
| | | Detail of sources of income, expenses, and realized and unrealized gains (losses) during the fiscal year | | | | |
| | | |
| | | Statements of Changes in Net Assets | | | 15 | |
| | | |
| | | Detail of changes in assets for the past two fiscal years | | | | |
| | | |
| | | Financial Highlights | | | 16 | |
| | | |
| | | Historical net asset values per share, distributions, total returns, income and expense ratios, turnover ratios and net assets | | | | |
| | | |
| | | Notes to Financial Statements | | | 17 | |
| | | |
| | | Accounting and distribution policies, details of agreements and transactions with Fund management and affiliates, and descriptions of certain investment risks | | | | |
| | | |
| | | REPORT OF INDEPENDENT REGISTERED PUBLIC ACCOUNTING FIRM | | | 23 | |
| | | |
| | | OTHER INFORMATION | | | 24 | |
| | | |
| | | TRUSTEES AND OFFICERS | | | 25 | |
| | | |
| | | ANNUAL RENEWAL OF INVESTMENT MANAGEMENT AND SUBADVISORY AGREEMENTS | | | 28 | |
| | | |
| | | FUNDS LIQUIDITY RISK MANAGEMENT PROGRAM | | | 30 | |
| |
| | Nothing contained herein is to be considered an offer, sale or solicitation of an offer to buy shares of any series of the AMG Funds Family of Funds. Such offering is made only by prospectus, which includes details as to offering price and other material information. | |
| | |
| | Letter to Shareholders |
Dear Shareholder:
The fiscal year ended September 30, 2021, was marked by the continued extraordinary recovery amid the unprecedented global effort to stop the COVID-19 pandemic. Equities rallied to new record highs amid better-than-expected corporate earnings, colossal fiscal and monetary stimulus programs, and an improving economic backdrop. Since the market bottom on March 23, 2020, the S&P 500® Index has gained over 97%. Businesses and consumers contended with disrupted supply chains and rising prices on a wide range of goods such as lumber and gasoline, and outbreaks of the Delta variant kept the world on edge. The fiscal year ended with slightly elevated volatility as investors assessed rising inflation, more hawkish global central bank policies, and a major regulatory crackdown in China.
The S&P 500® gained 30.00% during the fiscal year and all sectors produced double-digit returns, but there was very wide dispersion in performance. Energy and financials led the market with returns of 83.05% and 59.13%, respectively. On the other hand, utilities and consumer staples lagged with returns of 10.97% and 11.34%, respectively. Value stocks returned to favor after a long stretch of underperformance compared to Growth stocks. The Russell 1000® Value Index returned 35.01% compared to the 27.32% return for the Russell 1000® Growth Index. Small cap stocks outperformed as the Russell 2000® Index experienced its best quarter (fourth quarter 2020) on record. Within small caps, the Value-Growth disparity was much more pronounced as the Russell 2000® Value Index returned 63.92% compared to 33.27% for the Russell 2000® Growth Index. Outside the U.S., foreign developed markets outpaced emerging markets with a 25.73% return for the MSCI EAFE Index compared to an 18.20% return for the MSCI Emerging Markets Index.
Interest rates climbed from near-historic lows as the vaccine rollout initiated a return to normalcy and the economic outlook improved. The 10-year Treasury yield rose 80 basis points to 1.48% and ended the fiscal year not far off its post-pandemic high. The Bloomberg U.S. Aggregate Bond Index, a broad measure of U.S. bond market performance, lost -0.90% over the period. Healthy risk appetite drove credit spreads tighter and helped investment-grade corporate bonds produce a modestly positive 1.74% return. Riskier high-yield bonds outperformed the investment-grade market with an 11.28% return as measured by the return of the Bloomberg U.S. Corporate High Yield Bond Index. Municipal bonds benefited from a strong technical backdrop and drove a 2.63% return for the Bloomberg Municipal Bond Index.
AMG Funds appreciates the privilege of providing investment tools to you and your clients. Our foremost goal is to provide investment solutions that help our shareholders successfully reach their long-term investment goals. AMG Funds provides access to a distinctive array of actively managed return-oriented investment strategies. We thank you for your continued confidence and investment in AMG Funds. You can rest assured that under all market conditions our team is focused on delivering excellent investment management services for your benefit.
Respectfully,

Keitha Kinne
President
AMG Funds
| | | | | | | | | | | | | | | | | |
| | | | | Periods ended |
| Average Annual Total Returns | | September 30, 2021* |
| | | | |
| Stocks: | | | | 1 Year | | 3 Years | | 5 Years |
| | | | |
Large Cap | | (S&P 500® Index) | | | | 30.00 | % | | | | 15.99 | % | | | | 16.90 | % |
| | | | |
Small Cap | | (Russell 2000® Index) | | | | 47.68 | % | | | | 10.54 | % | | | | 13.45 | % |
| | | | |
International | | (MSCI All Country World Index ex USA) | | | | 23.92 | % | | | | 8.03 | % | | | | 8.94 | % |
Bonds: | | | | | | | | | | | | | | | | | |
| | | | |
Investment Grade | | (Bloomberg U.S. Aggregate Bond Index) | | | | -0.90 | % | | | | 5.36 | % | | | | 2.94 | % |
| | | | |
High Yield | | (Bloomberg U.S. Corporate High Yield Bond Index) | | | | 11.28 | % | | | | 6.91 | % | | | | 6.52 | % |
| | | | |
Tax-exempt | | (Bloomberg Municipal Bond Index) | | | | 2.63 | % | | | | 5.06 | % | | | | 3.26 | % |
| | | | |
Treasury Bills | | (ICE BofAML U.S. 6-Month Treasury Bill Index) | �� | | | 0.13 | % | | | | 1.43 | % | | | | 1.34 | % |
*Source: FactSet. Past performance is no guarantee of future results.
2
|
About Your Fund’s Expenses |
| | | | | | | | |
As a shareholder of a Fund, you may incur two types of costs: (1) transaction costs, which may include sales charges (loads) on purchase payments; redemption fees; and exchange fees; and (2) ongoing costs, including management fees; distribution (12b-1) fees; and other Fund expenses. This example is intended to help you understand your ongoing costs (in dollars) of investing in the Fund and to compare these costs with the ongoing costs of investing in other mutual funds. The example is based on $1,000 invested at the beginning of the period and held for the entire period as indicated below. ACTUAL EXPENSES The first line of the following table provides information about the actual account values and | | | | actual expenses. You may use the information in this line, together with the amount you invested, to estimate the expenses that you paid over the period. Simply divide your account value by $1,000 (for example, an $8,600 account value divided by $1,000 = 8.6), then multiply the result by the number in the first line under the heading entitled “Expenses Paid During Period” to estimate the expenses you paid on your account during this period. HYPOTHETICAL EXAMPLE FOR COMPARISON PURPOSES The second line of the following table provides information about hypothetical account values and hypothetical expenses based on the Fund’s actual expense ratio and an assumed annual rate of return of 5% before expenses, which is not the Fund’s | | | | actual return. The hypothetical account values and expenses may not be used to estimate the actual ending account balance or expenses you paid for the period. You may use this information to compare the ongoing costs of investing in the Fund and other funds by comparing this 5% hypothetical example with the 5% hypothetical examples that appear in the shareholder reports of other funds. Please note that the expenses shown in the table are meant to highlight your ongoing costs only and do not reflect any transactional costs, such as sales charges (loads), redemption fees, or exchange fees. Therefore, the second line of the table is useful in comparing ongoing costs only, and will not help you determine the relative total costs of owning different funds. |
| | | | | | | | |
| | | | | | | | |
Six Months Ended September 30, 2021 | | Expense
Ratio for
the Period | | Beginning
Account
Value
04/01/21 | | Ending
Account
Value
09/30/21 | | Expenses
Paid
During
the Period* |
AMG Boston Common Global Impact Fund |
Based on Actual Fund Return |
| | | | |
Class I | | 0.98% | | $1,000 | | $1,056 | | $5.05 |
Based on Hypothetical 5% Annual Return |
| | | | |
Class I | | 0.98% | | $1,000 | | $1,020 | | $4.96 |
| * | Expenses are equal to the Fund’s annualized expense ratio multiplied by the average account value over the period, multiplied by the number of days in the most recent fiscal half-year (183), then divided by 365. |
3
| | |
| | | AMG Boston Common Global Impact Fund Portfolio Manager’s Comments (unaudited) |
| | | |
| | | |
| | | | | | | | |
AMG Boston Common Global Impact Fund (the “Fund”) returned 31.75% during the year ended September 30, 2021, compared to the 27.44% return for the MSCI All Country World Index (the “MSCI Index”). The Fund’s legacy primary benchmark, the Russell 3000® Growth Index, returned 27.57% during the period. Effective March 19, 2021, the Fund’s subadviser changed from Friess Associates, LLC to Boston Common Asset Management, LLC (“Boston Common”). Also effective March 19, 2021, the Fund changed its name from AMG Managers Brandywine Fund to AMG Boston Common Global Impact Fund and changed its investment objective, benchmark, principal investment strategies, and principal risks. Performance Review For the period from October 1, 2020 through March 19, 2021, the Fund outperformed the legacy Russell 3000® Growth Index. The Fund’s outperformance was primarily attributable to stock selection in the consumer discretionary, information technology, and industrials sectors. The Fund’s sector allocations had a modestly negative contribution to returns, primarily from an underweight in financials and overweight in consumer discretionary. Following the Fund’s strategy change on March 19, 2021 through September 30, 2021, the Fund generated a positive return but lagged the MSCI Index. Investors navigated a dynamic set of factors during the period. Rising global vaccination rates and falling COVID infections helped create an outlook for a more normalized summer in most developed nations, boosting consumer confidence in many places to its highest level since the beginning of the pandemic. In contrast, lagging vaccination progress in developing nations caused factory closures in places such as Asia and broad-based logistical backlogs. In the meantime, alongside strong pent-up demand and widespread supply chain disruptions, inflationary pressures increased in several countries, raising investor concerns. By the third quarter of 2021, regulatory crackdowns and concerns about indebted property developers weighed on sentiment in China. Germany’s federal election ushered in a potential new coalition government, while Japan’s ruling party selected a new leader. While North American equities led global markets, European and UK equities held their ground. Asia Pacific and Emerging Market equities lagged, impeded by declines in China and Hong Kong. Soaring energy and gas prices pushed energy stocks | | | | higher on a sector basis, while IT and healthcare stocks also outperformed. Utilities and consumer discretionary stocks lagged the most, pressured by higher-than-expected input prices and snarled supply chains. On a relative basis, although the Fund’s regional allocation detracted from returns, stock selection added value over the period. The Fund benefited most from our overweight in eco-efficient industrials stocks. Contributing most in this sector were Carrier Global (U.S.), a manufacturer of highly efficient HVAC systems, and Tomra, a Norwegian provider of sensor-based recycling solutions. Others include Spirax-Sarco Engineering (UK), whose business involves the control and efficient management of steam and industrial fluids, and Xylem, an American water technology provider. Also adding value were materials and consumer discretionary holdings. Within the materials space, green chemical specialists Croda International (UK) and Koninklijke DSM (Netherlands) outperformed most metal and mining companies in the Index. While consumer discretionary stocks generally lagged at the Index level, the Fund’s holdings outperformed. Key contributors included Japanese companies Shimano (bike components) and Yamaha (musical instruments) amid growing demand for leisure products. BYD Company (China), a battery and electric vehicle manufacturer, also added value. Swiss hearing-aid specialist Sonova Holding was a strong outperformer in the healthcare sector. The Fund’s underweight to the financial sector, in addition to weak performance from emerging markets (EM) financial holdings, detracted most from performance. Weaker-than-expected earnings due to long-term beneficial restructuring of its insurance agencies as well as investor concern regarding exposure to leveraged real estate companies hurt Ping An Insurance Group (China) during the period. The COVID situation pressured other EM financials such as Bank Rakyat (Indonesia) and HDFC Bank (India), although improving vaccination progress should lift growth expectations. Stock selection in real estate also detracted as Hannon Armstrong (U.S.), a specialty finance company providing capital and advisory services to companies focused on renewable energy, energy efficiency, and sustainable infrastructure, declined. Neighborhood grocer Sprouts Farmers Market detracted most within consumer staples, which lagged the Index overall. | | | | Outlook and Positioning Record monetary and fiscal support and the lifting of COVID restrictions have buoyed economic growth in 2021 and created favorable conditions for global equities. Activity indicators have surged from last year’s low base and policymakers still seem largely keen to continue with the emergency relief measures. While the pandemic will likely have long-lasting effects, vibrant industrial and consumer activity suggest healthy prospects for corporate profits once production and logistics problems are overcome. COVID has caused shifts in demand, major shortfalls in production, and dramatic increases in backlogs as logistics challenges grew. These dislocations have lowered near-term growth and increased inflation. With over two-thirds of the populations of the U.S., European Union, UK, China, and Japan at least partially vaccinated, social and economic normalization should proceed as long as vaccines continue to protect against severe disease from new variants. Highly unequal vaccine distribution is a challenge for developing countries, yet Emerging Market valuations look attractive given our view that economies in Asia and elsewhere have dynamic long-term outlooks. The Fund’s strategy remains founded on our belief that highly innovative solutions companies addressing global sustainability challenges and opportunities will experience larger-than-expected demand for their products, thereby enabling the Fund to outperform the broader global equity market over a full market cycle. An increasing number of countries have announced goals toward achieving net-zero emissions by 2050. It is our opinion that such policy initiatives and regulatory directives across the globe will provide a long-term tailwind for the impact revenue-generating capabilities and future growth of many of our product solutions companies. Currently, the largest impact investment themes are eco-efficiency/recycling and access to health. Fund Activity Over the period we expanded upon our impact theme of access to health while slightly reducing our exposure to sustainable housing development. We added two U.S.-based healthcare companies, Illumina and Biogen. We see Illumina as a clear solutions provider, being the most advanced enterprise within the leading-edge technology of genetic testing and sequencing. We believe this technology will play an increasingly central role in shaping the medicine of the future, ranging from |
| | | | | | | | |
4
| | |
| | | AMG Boston Common Global Impact Fund Portfolio Manager’s Comments (continued) |
| | | |
| | | |
| | | | | | | | |
cancer treatment selection to wellness pre-screening to population-wide studies. Illumina is a high-multiple stock but has very attractive operating margins, high recurring revenue streams within an expanding total addressable market, and very clear societal benefits. We believe Biogen’s FDA-approved aducanumab (product name Aduhelm) is an innovative drug against Alzheimer’s disease that is likely to be prescribed to a select group of Alzheimer’s patients. This breakthrough solutions product is addressing a degenerative brain disorder that causes significant problems with memory, thinking, and behavior in patients. We also considered that Biogen has additional drugs in advanced clinical trials for Alzheimer’s and other high risk/high reward targets, including Parkinson’s and ALS. Within the impact theme of organic and healthier food, we bought McCormick, a leading global ingredient and flavor provider. Its focus on spices, seasonings, baking ingredients, and condiments positions the company in a superior growth category. We anticipate the company will deliver | | | | above-industry top-line growth, as it benefits from both secular trends in healthy in-home cuisine as well as rebounding restaurant dining. McCormick has strong sustainability and supply-chain monitoring practices and a solid track record of prudent capital allocation. We purchased Kurita Water Industries, a leading Japanese provider of equipment and chemicals that produce ultrapure water and help reclaim wastewater. Kurita provides products and services that contribute to water savings as well as reductions in CO2 emissions and waste. This company aims to save its customers 240 million cubic meters of water by 2023. In addition, we added to Koninklijke DSM, which is soon expected to introduce Bovaer, an innovative feed supplement that enables a reduction in the carbon footprint of cattle. Other promising solutions in the company’s pipeline include a sweetening alternative for sugar and an instant formula product closely resembling mother’s milk. To fund these purchases, we sold several stocks. Our conviction for Air Liquide diminished as momentum | | | | toward its long-term opportunity of green hydrogen weakened. Furthermore, we sold Taiwan Semiconductor but added to semiconductor equipment manufacturer Applied Materials, which we believe has a higher solutions exposure combined with strong growth prospects. Following strong performance and elevated valuation multiples, we trimmed our positions in Waters, Mohawk Industries, and Daikin Industries. We sold Grifols following an expensive acquisition and Swedish personal care company Essity following margin pressures within its consumer tissue segment, driven by continued volatility in pulp pricing. This commentary reflects the viewpoints of the portfolio manager, Boston Common Asset Management, LLC as of September 30, 2021 , is not intended as a forecast or guarantee of future results, and is subject to change without notice. |
| | | | | | | | |
5
| | |
| | | AMG Boston Common Global Impact Fund Portfolio Manager’s Comments (continued) |
| | | |
| | | |
CUMULATIVE TOTAL RETURN PERFORMANCE
AMG Boston Common Global Impact Fund’s cumulative total return is based on the daily change in net asset value (NAV), and assumes that all dividends and distributions were reinvested. The graph compares a hypothetical $10,000 investment made in the AMG Boston Common Global Impact Fund’s Class I shares on September 30, 2011, to a $10,000 investment made in the MSCI All Country World Index and Russell 3000® Growth Index for the same time period. The graph and table do not reflect the deduction of taxes that a shareholder would pay on a Fund distribution or redemption of shares. The listed returns for the Fund are net of expenses and the returns for the index exclude expenses. Total returns would have been lower had certain expenses not been reduced.
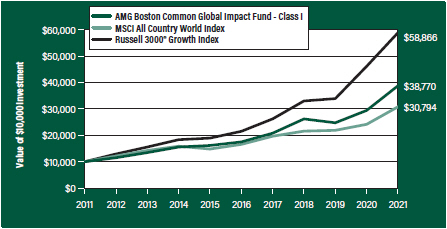
The table below shows the average annual total returns for the AMG Boston Common Global Impact Fund and the MSCI All Country World Index and Russell 3000® Growth Index for the same time periods ended September 30, 2021.
| | | | | | | | | | | | |
| Average Annual Total Returns1 | | One
Year | | | Five
Years | | | Ten
Years | |
|
AMG Boston Common Global Impact Fund2, 3, 4, 5, 6, 7, 8, 9, 10, 11, 12, 13, 14, 15 | |
Class I | | | 31.75 | % | | | 17.24 | % | | | 14.51 | % |
MSCI All Country World Index16 | | | 27.44 | % | | | 13.20 | % | | | 11.90 | % |
| | | |
Russell 3000® Growth Index17 | | | 27.57 | % | | | 22.30 | % | | | 19.40 | % |
The performance data shown represents past performance. Past performance is not a guarantee of future results. Current performance may be lower or higher than the performance data quoted. The investment return and principal value of an investment will fluctuate so that an investor’s shares, when redeemed, may be worth more or less than their original cost.
Investors should carefully consider the Fund’s investment objectives, risks, charges and expenses before investing. For performance information through the most recent month end, current net asset values per share for the Fund and other information, please call 800.548.4539 or visit our website at amgfunds.com for a free prospectus. Read it carefully before investing or sending money.
Distributed by AMG Distributors, Inc., member FINRA/SIPC.
| 1 | Total return equals income yield plus share price change and assumes reinvestment of all dividends and capital gain distributions. Returns are net of fees and may reflect offsets of Fund expenses as described in the prospectus. No adjustment has been made for taxes payable by shareholders on their reinvested dividends and capital gain distributions. Returns for periods greater than one year are annualized. The listed returns on the Fund are net of expenses and based on the published NAV as of September 30, 2021. All returns are in U.S. dollars ($). |
| | |
| | | 2 As of March 19, 2021, the Fund’s Subadviser was changed to Boston Common Asset Management, LLC. Prior to March 19, 2021, the Fund was known as the AMG Managers Brandywine Fund, and had different principal investment strategies and corresponding risks. Performance shown for periods prior to March 19, 2021, reflects the performance and investment strategies of the Fund’s previous Subadviser, Friess Associates, LLC and Friess Associates of Delaware, LLC. The Fund’s past performance would have been different if the Fund were managed by the current Subadviser and strategy, and the Fund’s prior performance record might be less pertinent for investors considering whether to purchase shares of the fund. 3 Active and frequent trading of a fund may result in higher transaction costs and increased tax liability. 4 The Fund invests in growth stocks, which may be more sensitive to market movements because their prices tend to reflect future investor expectations rather than just current profits. Growth stocks may underperform value stocks during given periods. 5 Investments in international securities are subject to certain risks of overseas investing including currency fluctuations and changes in political and economic conditions, which could result in significant market fluctuations. These risks are magnified in emerging markets. 6 Companies that are in similar industry sectors may be similarly affected by particular economic or market events; to the extent the Fund has substantial holdings within a particular sector, the risks associated with that sector increase. 7 The Fund is subject to risks associated with investments in small-capitalization companies, such as erratic earnings patterns, competitive conditions, limited earnings history and a reliance on one or a limited number of products. 8 The Fund is subject to currency risk resulting from fluctuations in exchange rates that may affect the total loss or gain on a non-U.S. Dollar investment when converted back to U.S. Dollars. 9 Market prices of investments held by the Fund may fall rapidly or unpredictably due to a variety of economic or political factors, market conditions, disasters or public health issues, or in response to events that affect particular industries or companies. 10 Changes in the general political and social environment of a country can have substantial effects on the value of investments exposed to that country. 11 The Fund is subject to the risks associated with investments in emerging markets, such as erratic earnings patterns, economic and political instability, changing exchange controls, limitations |
| | | |
6
| | |
| | | AMG Boston Common Global Impact Fund Portfolio Manager’s Comments (continued) |
| | | |
| | | |
| | | | | | | | |
on repatriation of foreign capital and changes in local governmental attitudes toward private investment, possibly leading to nationalization or confiscation of investor assets. 12 Applying the Fund’s ESG investment criteria may result in the selection or exclusion of securities of certain issuers for reasons other than performance, and the Fund may underperform funds that do not utilize an ESG investment strategy. The application of this strategy may affect the Fund’s exposure to certain companies, sectors, regions, countries or types of investments, which could negatively impact the Fund’s performance depending on whether such investments are in or out of favor. Applying ESG criteria to investment decisions is qualitative and subjective by nature, and there is no guarantee that the criteria utilized by the Subadviser or any judgment exercised by the Subadviser will reflect the beliefs or values of any particular investor. 13 The Fund may not be able to dispose of particular investments, such as illiquid securities, readily at | | | | favorable times or prices or the Fund may have to sell them at a loss. 14 The Fund is subject to risks associated with investments in mid-capitalization companies such as greater price volatility, lower trading volume, and less liquidity than the stocks of larger, more established companies. 15 The Fund invests in value stocks, which may perform differently from the market as a whole and may be undervalued by the market for a long period of time. 16 On March 19, 2021, the primary benchmark changed from the Russell 3000® Growth Index to the MSCI All Country World Index (ACWI). The MSCI All Country World Index (ACWI) is a free float-adjusted market capitalization weighted index that is designed to measure the equity market performance of developed and emerging markets. Please go to msci.com for most current list of countries represented by the index. Unlike the Fund, the MSCI All Country World Index (ACWI) is unmanaged, is | | | | not available for investment and does not incur expenses. 17 The Russell 3000® Growth Index measures the performance of those Russell 3000® Index companies with higher price-to-book ratios and higher forecasted growth values. Unlike the Fund, the Russell 3000® Growth Index is unmanaged, is not available for investment and does not incur expenses. All MSCI data is provided ‘as is’. The products described herein are not sponsored or endorsed and have not been reviewed or passed on by MSCI. In no event shall MSCI, its affiliates or any MSCI data provider have any liability of any kind in connection with the MSCI data or the products described herein. The Russell 3000® Growth Index is a trademark of the London Stock Exchange Group companies. Not FDIC insured, nor bank guaranteed. May lose value. |
| | | | | | | | |
7
| | |
| | | AMG Boston Common Global Impact Fund Fund Snapshots (unaudited) September 30, 2021 |
| | | |
| | | |
PORTFOLIO BREAKDOWN
| | |
| Sector | | % of
Net Assets |
| | |
Industrials | | 20.6 |
| | |
Health Care | | 15.4 |
| | |
Consumer Discretionary | | 15.1 |
| | |
Information Technology | | 14.8 |
| | |
Materials | | 13.7 |
| | |
Financials | | 9.1 |
| | |
Consumer Staples | | 5.6 |
| | |
Utilities | | 3.9 |
| | |
Real Estate | | 1.4 |
| | |
Short-Term Investments | | 3.1 |
| | |
Other Assets Less Liabilities | | (2.7) |
TOP TEN HOLDINGS
| | |
| Security Name | | % of
Net Assets |
| | |
Carrier Global Corp. (United States) | | 3.0 |
| | |
Shimano, Inc. (Japan) | | 3.0 |
| | |
Borregaard A.S.A. (Norway) | | 2.6 |
| | |
Hannon Armstrong Sustainable Infrastructure Capital, Inc. (United States) | | 2.5 |
| | |
Yamaha Corp. (Japan) | | 2.5 |
| | |
Xylem, Inc. (United States) | | 2.4 |
| | |
TopBuild Corp. (United States) | | 2.4 |
| | |
Sonova Holding AG (Switzerland) | | 2.4 |
| | |
Kerry Group PLC, Class A (Ireland) | | 2.3 |
| | |
TOMRA Systems A.S.A. (Norway) | | 2.3 |
| | |
Top Ten as a Group | | 25.4 |
| | |
Because a fund’s strategy may result in multiple investments in particular sectors of the economy, its performance may depend on the performance of those sectors and may fluctuate more widely than investments diversified across more sectors. For additional information on these and other risk considerations, please see the Fund’s prospectus.
Any sectors, industries, or securities discussed should not be perceived as investment recommendations. Mention of a specific security should not be considered a recommendation to buy or solicitation to sell that security. Specific securities mentioned in this report may have been sold from the Fund’s portfolio of investments by the time you receive this report.
8
| | |
| | | AMG Boston Common Global Impact Fund Schedule of Portfolio Investments September 30, 2021 |
| | | |
| | | |
| | | | | | | | |
| | | Shares | | | Value | |
| | |
Common Stocks - 99.6% | | | | | | | | |
| | |
Consumer Discretionary - 15.1% | | | | | | | | |
| | |
Barratt Developments PLC (United Kingdom) | | | 1,885,505 | | | | $16,667,463 | |
| | |
BYD Co., Ltd., Class H (China) | | | 521,000 | | | | 16,193,933 | |
| | |
KB Home (United States)1 | | | 506,456 | | | | 19,711,268 | |
| | |
Mohawk Industries, Inc. (United States)* | | | 70,369 | | | | 12,483,461 | |
| | |
Shimano, Inc. (Japan) | | | 93,100 | | | | 27,202,629 | |
| | |
TopBuild Corp. (United States)* | | | 104,985 | | | | 21,501,978 | |
| | |
Yamaha Corp. (Japan) | | | 360,100 | | | | 22,651,042 | |
| | |
Total Consumer Discretionary | | | | | | | 136,411,774 | |
| | |
Consumer Staples - 5.6% | | | | | | | | |
| | |
Kerry Group PLC, Class A (Ireland) | | | 158,088 | | | | 21,242,063 | |
| | |
McCormick & Co., Inc., Non-Voting Shares (United States) | | | 145,000 | | | | 11,749,350 | |
| | |
Sprouts Farmers Market, Inc. (United States)*,1 | | | 771,270 | | | | 17,870,326 | |
| | |
Total Consumer Staples | | | | | | | 50,861,739 | |
| | |
Financials - 9.1% | | | | | | | | |
| | |
Bank Rakyat Indonesia Persero Tbk PT, ADR (Indonesia)1 | | | 1,512,244 | | | | 20,657,253 | |
| | |
Hannon Armstrong Sustainable Infrastructure | | | | | | | | |
| | |
Capital, Inc., REIT (United States)1 | | | 426,985 | | | | 22,835,158 | |
| | |
HDFC Bank, Ltd., ADR (India) | | | 157,304 | | | | 11,497,349 | |
| | |
ORIX Corp. (Japan) | | | 978,900 | | | | 18,316,715 | |
| | |
Ping An Insurance Group Co. of China, Ltd., | | | | | | | | |
| | |
Class H (China) | | | 1,378,500 | | | | 9,428,082 | |
| | |
Total Financials | | | | | | | 82,734,557 | |
| | |
Health Care - 15.4% | | | | | | | | |
| | |
Biogen, Inc. (United States)* | | | 42,669 | | | | 12,074,900 | |
| | |
Cerner Corp. (United States) | | | 226,281 | | | | 15,957,336 | |
| | |
China Traditional Chinese Medicine | | | | | | | | |
| | |
Holdings Co., Ltd. (Hong Kong) | | | 28,682,000 | | | | 14,494,195 | |
| | |
CSL, Ltd. (Australia) | | | 52,382 | | | | 10,944,238 | |
| | |
Gilead Sciences, Inc. (United States) | | | 269,115 | | | | 18,797,683 | |
| | |
Grifols SA, ADR (Spain) | | | 276,558 | | | | 4,040,512 | |
| | |
Hoya Corp. (Japan) | | | 90,600 | | | | 14,135,305 | |
| | |
Illumina, Inc. (United States)* | | | 34,043 | | | | 13,808,181 | |
| | |
Sonova Holding AG (Switzerland) | | | 56,795 | | | | 21,463,299 | |
| | |
Waters Corp. (United States)* | | | 38,048 | | | | 13,594,551 | |
| | |
Total Health Care | | | | | | | 139,310,200 | |
| | |
Industrials - 20.6% | | | | | | | | |
| | |
Carrier Global Corp. (United States) | | | 532,612 | | | | 27,567,997 | |
| | |
Cummins, Inc. (United States) | | | 59,320 | | | | 13,320,899 | |
| | |
Daikin Industries, Ltd. (Japan) | | | 67,400 | | | | 14,695,792 | |
| | |
Kurita Water Industries, Ltd. (Japan) | | | 255,900 | | | | 12,313,478 | |
| | | | | | | | |
| | | Shares | | | Value | |
Schneider Electric SE (France) | | | 115,009 | | | | $19,155,213 | |
Spirax-Sarco Engineering PLC (United Kingdom) | | | 72,490 | | | | 14,585,411 | |
TOMRA Systems A.S.A. (Norway) | | | 403,920 | | | | 21,129,936 | |
Vestas Wind Systems A/S (Denmark) | | | 525,224 | | | | 21,066,227 | |
Westinghouse Air Brake Technologies Corp. (United States) | | | 234,274 | | | | 20,196,762 | |
Xylem, Inc. (United States) | | | 177,775 | | | | 21,987,212 | |
Total Industrials | | | | | | | 186,018,927 | |
Information Technology - 14.8% | | | | | | | | |
Adobe, Inc. (United States)* | | | 31,356 | | | | 18,052,276 | |
Applied Materials, Inc. (United States) | | | 117,191 | | | | 15,085,998 | |
Ciena Corp. (United States)* | | | 272,835 | | | | 14,010,077 | |
First Solar, Inc. (United States)* | | | 200,108 | | | | 19,102,310 | |
Intuit, Inc. (United States) | | | 37,034 | | | | 19,980,213 | |
Pagseguro Digital, Ltd., Class A (Brazil)*,1 | | | 282,525 | | | | 14,612,193 | |
VMware, Inc., Class A (United States)*,1 | | | 101,553 | | | | 15,100,931 | |
Xinyi Solar Holdings, Ltd. (China) | | | 8,692,000 | | | | 17,793,599 | |
Total Information Technology | | | | | | | 133,737,597 | |
Materials - 13.7% | | | | | | | | |
Borregaard A.S.A. (Norway) | | | 972,911 | | | | 23,600,728 | |
Croda International PLC (United Kingdom) | | | 142,554 | | | | 16,333,435 | |
DS Smith PLC (United Kingdom) | | | 3,561,666 | | | | 19,670,033 | |
Ecolab, Inc. (United States) | | | 67,835 | | | | 14,151,738 | |
Koninklijke DSM NV (Netherlands) | | | 76,812 | | | | 15,360,562 | |
Novozymes A/S, Class B (Denmark) | | | 221,878 | | | | 15,210,026 | |
Umicore, S.A. (Belgium) | | | 330,283 | | | | 19,539,416 | |
Total Materials | | | | | | | 123,865,938 | |
Real Estate - 1.4% | | | | | | | | |
Vonovia SE (Germany) | | | 212,808 | | | | 12,793,669 | |
Utilities - 3.9% | | | | | | | | |
American Water Works Co., Inc. (United States) | | | 118,758 | | | | 20,074,852 | |
Orsted A.S. (Denmark)2 | | | 113,903 | | | | 15,014,084 | |
Total Utilities | | | | | | | 35,088,936 | |
Total Common Stocks
(Cost $850,706,245) | | | | | | | 900,823,337 | |
| | |
| | | Principal
Amount | | | | |
Short-Term Investments - 3.1% | | | | | | | | |
Joint Repurchase Agreements - 2.2%3 | | | | | | | | |
Bank of America Securities, Inc., dated 09/30/21, due 10/01/21, 0.050% total to be received $4,602,602 (collateralized by various U.S. Government Agency Obligations, 1.500% - 5.000%, 09/01/31 - 07/01/60, totaling $4,694,648) | | | $4,602,596 | | | | 4,602,596 | |
The accompanying notes are an integral part of these financial statements.
9
| | |
| | | AMG Boston Common Global Impact Fund Schedule of Portfolio Investments (continued) |
| | | |
| | | |
| | | | | | | | |
| | | Principal
Amount | | | Value | |
| |
Joint Repurchase Agreements - 2.2%3
(continued) | | | | | |
| | |
Cantor Fitzgerald Securities, Inc., dated 09/30/21, due 10/01/21, 0.050% total to be received $4,602,606 (collateralized by various U.S. Government Agency Obligations, 0.430% - 9.500%, 11/01/21 - 07/20/71, totaling $4,694,652) | | $ | 4,602,600 | | | | $4,602,600 | |
| | |
Daiwa Capital Markets America, dated 09/30/21, due 10/01/21, 0.050% total to be received $2,769,944 (collateralized by various U.S. Government Agency Obligations and U.S. Treasuries, 0.000% - 8.000%, 11/15/21 - 10/01/51, totaling $2,825,339) | | | 2,769,940 | | | | 2,769,940 | |
| | |
RBC Dominion Securities, Inc., dated 09/30/21, due 10/01/21, 0.050% total to be received $4,602,602 (collateralized by various U.S. Government Agency Obligations and U.S. Treasuries, 0.000% - 6.500%, 10/31/21 - 05/01/58, totaling $4,694,648) | | | 4,602,596 | | | | 4,602,596 | |
| | |
State of Wisconsin Investment Board, dated 09/30/21, due 10/01/21, 0.100% total to be received $2,801,567 (collateralized by various U.S. Treasuries, 0.125% - 3.875%, 07/15/23 - 02/15/48, totaling $2,857,673) | | | 2,801,559 | | | | 2,801,559 | |
| | |
Total Joint Repurchase Agreements | | | | | | | 19,379,291 | |
| * | Non-income producing security. |
| 1 | Some of these securities, amounting to $56,162,774 or 6.2% of net assets, were out on loan to various borrowers and are collateralized by cash and various U.S. Treasury Obligations. See Note 4 of Notes to Financial Statements. |
| 2 | Security exempt from registration under Rule 144A of the Securities Act of 1933. This security may be resold in transactions exempt from registration, normally to qualified institutional buyers. At September 30, 2021, the value of these securities amounted to $15,014,084 or 1.7% of net assets. |
| | | | | | | | |
| | | Shares | | | Value | |
| | |
Other Investment Companies - 0.9% | | | | | | | | |
| | |
Dreyfus Government Cash Management Fund, Institutional Shares, 0.03%4 | | | 2,666,029 | | | | $2,666,029 | |
| | |
Dreyfus Institutional Preferred Government Money Market Fund, Institutional Shares, 0.01%4 | | | 2,666,002 | | | | 2,666,002 | |
| | |
JPMorgan U.S. Government Money Market Fund, IM Shares, 0.03%4 | | | 2,746,813 | | | | 2,746,813 | |
| | |
Total Other Investment Companies | | | | | | | 8,078,844 | |
| | |
Total Short-Term Investments
(Cost $27,458,135) | | | | | | | 27,458,135 | |
| | |
Total Investments - 102.7%
(Cost $878,164,380) | | | | | | | 928,281,472 | |
| | |
Other Assets, less Liabilities - (2.7)% | | | | | | | (23,986,228 | ) |
| | |
Net Assets - 100.0% | | | | | | $ | 904,295,244 | |
| 3 | Cash collateral received for securities lending activity was invested in these joint repurchase agreements. |
| 4 | Yield shown represents the September 30, 2021, seven day average yield, which refers to the sum of the previous seven days’ dividends paid, expressed as an annual percentage. |
ADR American Depositary Receipt
REIT Real Estate Investment Trust
The accompanying notes are an integral part of these financial statements.
10
| | |
| | | AMG Boston Common Global Impact Fund Schedule of Portfolio Investments (continued) |
| | | |
| | | |
The following table summarizes the inputs used to value the Fund’s investments by the fair value hierarchy levels as of September 30, 2021:
| | | | | | | | | | | | | | | | |
| | | Level 1 | | | Level 21 | | | Level 3 | | | Total | |
Investments in Securities | | | | | | | | | | | | | | | | |
Common Stocks | | | | | | | | | | | | | | | | |
Industrials | | | $125,269,033 | | | | $60,749,894 | | | | — | | | | $186,018,927 | |
Health Care | | | 78,273,163 | | | | 61,037,037 | | | | — | | | | 139,310,200 | |
Consumer Discretionary | | | 53,696,707 | | | | 82,715,067 | | | | — | | | | 136,411,774 | |
Information Technology | | | 115,943,998 | | | | 17,793,599 | | | | — | | | | 133,737,597 | |
Materials | | | 14,151,738 | | | | 109,714,200 | | | | — | | | | 123,865,938 | |
Financials | | | 54,989,760 | | | | 27,744,797 | | | | — | | | | 82,734,557 | |
Consumer Staples | | | 50,861,739 | | | | — | | | | — | | | | 50,861,739 | |
Utilities | | | 20,074,852 | | | | 15,014,084 | | | | — | | | | 35,088,936 | |
Real Estate | | | 12,793,669 | | | | — | | | | — | | | | 12,793,669 | |
Short-Term Investments | | | | | | | | | | | | | | | | |
Joint Repurchase Agreements | | | — | | | | 19,379,291 | | | | — | | | | 19,379,291 | |
Other Investment Companies | | | 8,078,844 | | | | — | | | | — | | | | 8,078,844 | |
| | | | | | | | | | | | | | | | |
Total Investments in Securities | | | $534,133,503 | | | | $394,147,969 | | | | — | | | | $928,281,472 | |
| | | | | | | | | | | | | | | | |
| 1 | An external pricing service is used to reflect any impact on security value due to market movements between the time the Fund valued such foreign securities and the earlier closing of foreign markets. |
For the fiscal year ended September 30, 2021, there were no transfers in or out of Level 3.
For the fiscal year ended September 30, 2021, the effect of derivative instruments on the Statement of Operations for the Fund and the amount of realized gain/loss and unrealized appreciation/depreciation on derivatives recognized in income was as follows:
| | | | | | | | | | | | |
| | | Realized Gain/(Loss) | | | Change in Unrealized Appreciation/Depreciation | |
| | | | |
Derivatives not accounted for as hedging instruments | | Statement of Operations Location | | Realized
Gain/(Loss) | | | Statement of Operations Location | | Change in
Unrealized
Appreciation/
Depreciation | |
Equity contracts | | Net realized gain on futures contracts | | | $1,011,495 | | | Net change in unrealized appreciation/ depreciation on futures contracts | | | — | |
Foreign currency exchange contracts | | Net realized loss on forward contracts | | | (215,350 | ) | | Net change in unrealized appreciation/ depreciation on forward contracts | | | — | |
| | | | | | | | | | | | |
| | Totals | | | $796,145 | | | | | | — | |
| | | | | | | | | | | | |
The accompanying notes are an integral part of these financial statements.
11
| | |
| | | AMG Boston Common Global Impact Fund Schedule of Portfolio Investments (continued) |
| | | |
| | | |
The country allocation in the Schedule of Portfolio Investments at September 30, 2021, was as follows:
| | |
| Country | | % of Long-Term
Investments |
| |
Australia | | 1.2 |
| |
Belgium | | 2.2 |
| |
Brazil | | 1.6 |
| |
China | | 4.8 |
| |
Denmark | | 5.7 |
| |
France | | 2.1 |
| |
Germany | | 1.4 |
| |
Hong Kong | | 1.6 |
| |
India | | 1.3 |
| |
Indonesia | | 2.3 |
| |
Ireland | | 2.4 |
| |
Japan | | 12.1 |
| |
Netherlands | | 1.7 |
| |
Norway | | 5.0 |
| |
Spain | | 0.4 |
| |
Switzerland | | 2.4 |
| |
United Kingdom | | 7.5 |
| |
United States | | 44.3 |
| | |
| |
| | 100.0 |
| | |
The accompanying notes are an integral part of these financial statements.
12
| | |
| | | Statement of Assets and Liabilities September 30, 2021 |
| | | |
| | | |
| | | | |
| | | AMG
Boston Common
Global Impact
Fund | |
| |
Assets: | | | | |
| |
Investments at value1 (including securities on loan valued at $56,162,774) | | | $928,281,472 | |
| |
Receivable for investments sold | | | 1,384,423 | |
| |
Dividend and interest receivables | | | 2,144,661 | |
| |
Securities lending income receivable | | | 32,944 | |
| |
Receivable for Fund shares sold | | | 5,238 | |
| |
Receivable from affiliate | | | 21,540 | |
| |
Prepaid expenses and other assets | | | 20,833 | |
| |
Total assets | | | 931,891,111 | |
| |
Liabilities: | | | | |
| |
Payable upon return of securities loaned | | | 19,379,291 | |
| |
Payable for investments purchased | | | 7,129,354 | |
| |
Payable for Fund shares repurchased | | | 238,678 | |
| |
Accrued expenses: | | | | |
| |
Investment advisory and management fees | | | 576,593 | |
| |
Administrative fees | | | 118,478 | |
| |
Other | | | 153,473 | |
| |
Total liabilities | | | 27,595,867 | |
| | | | |
| |
Net Assets | | | $904,295,244 | |
| |
1 Investments at cost | | | $878,164,380 | |
| |
Net Assets Represent: | | | | |
| |
Paid-in capital | | | $851,840,737 | |
| |
Total distributable earnings | | | 52,454,507 | |
| |
Net Assets | | | $904,295,244 | |
| |
Class I: | | | | |
| |
Net Assets | | | $904,295,244 | |
| |
Shares outstanding | | | 20,778,332 | |
| |
Net asset value, offering and redemption price per share | | | $43.52 | |
The accompanying notes are an integral part of these financial statements.
13
| | |
| | | Statement of Operations For the fiscal year ended September 30, 2021 |
| | | |
| | | |
| | | | |
| | | AMG
Boston Common
Global Impact
Fund | |
| |
Investment Income: | | | | |
| |
Dividend income | | | $10,722,807 | |
| |
Securities lending income | | | 243,214 | |
| |
Foreign withholding tax | | | (763,631 | ) |
| |
Total investment income | | | 10,202,390 | |
| |
Expenses: | | | | |
| |
Investment advisory and management fees | | | 7,852,361 | |
| |
Administrative fees | | | 1,428,186 | |
| |
Shareholder servicing fees - Class I | | | 119,238 | |
| |
Transfer agent fees | | | 97,967 | |
| |
Custodian fees | | | 81,532 | |
| |
Reports to shareholders | | | 81,176 | |
| |
Professional fees | | | 69,516 | |
| |
Trustee fees and expenses | | | 64,511 | |
| |
Registration fees | | | 39,160 | |
| |
Miscellaneous | | | 33,550 | |
| |
Total expenses before offsets | | | 9,867,197 | |
| |
Expense reimbursements | | | (21,540 | ) |
| |
Total expenses | | | 9,845,657 | |
| | | | |
| |
Net investment income | | | 356,733 | |
| |
Net Realized and Unrealized Gain: | | | | |
| |
Net realized gain on investments | | | 341,239,023 | |
| |
Net realized loss on forwards contracts | | | (215,350 | ) |
| |
Net realized gain on futures contracts | | | 1,011,495 | |
| |
Net realized loss on foreign currency transactions | | | (396,818 | ) |
| |
Net change in unrealized appreciation/depreciation on investments | | | (86,325,191 | ) |
| |
Net change in unrealized appreciation/depreciation on foreign currency translations | | | (8,449 | ) |
| |
Net realized and unrealized gain | | | 255,304,710 | |
| | | | |
| |
Net increase in net assets resulting from operations | | | $255,661,443 | |
The accompanying notes are an integral part of these financial statements.
14
| | |
| | | Statements of Changes in Net Assets For the fiscal years ended September 30, |
| | | |
| | | |
| | | | | | | | |
| | | AMG
Boston Common
Global Impact
Fund |
| | |
| | | 2021 | | 2020 |
| | |
Increase in Net Assets Resulting From Operations: | | | | | | | | |
| | |
Net investment income (loss) | | | $356,733 | | | | $(4,020,608) | |
| | |
Net realized gain on investments | | | 341,638,350 | | | | 134,871,648 | |
| | |
Net change in unrealized appreciation/depreciation on investments | | | (86,333,640 | ) | | | 4,073,500 | |
| | |
Net increase in net assets resulting from operations | | | 255,661,443 | | | | 134,924,540 | |
| | |
Distributions to Shareholders: | | | | | | | | |
| | |
Class I | | | (451,891,718 | ) | | | (78,234,351 | ) |
| | |
Capital Share Transactions:1 | | | | | | | | |
| | |
Net increase (decrease) from capital share transactions | | | 265,468,347 | | | | (7,781,771 | ) |
| | |
| | | | | | | | |
| | |
Total increase in net assets | | | 69,238,072 | | | | 48,908,418 | |
| | |
Net Assets: | | | | | | | | |
| | |
Beginning of year | | | 835,057,172 | | | | 786,148,754 | |
| | |
End of year | | | $904,295,244 | | | | $835,057,172 | |
| 1 | See Note 1(g) of the Notes to Financial Statements. |
The accompanying notes are an integral part of these financial statements.
15
|
AMG Boston Common Global Impact Fund Financial Highlights For a share outstanding throughout each fiscal year |
| | | | | | | | | | | | | | | | | | | | |
| | | For the fiscal years ended September 30, | |
| | | | | |
| Class I | | 2021 | | | 2020 | | | 2019 | | | 2018 | | | 20171 | |
| | | | | |
Net Asset Value, Beginning of Year | | | $56.96 | | | | $52.89 | | | | $56.01 | | | | $44.48 | | | | $37.42 | |
| | | | | |
Income (loss) from Investment Operations: | | | | | | | | | | | | | | | | | | | | |
| | | | | |
Net investment income (loss)2 | | | 0.02 | 3 | | | (0.27 | ) | | | (0.13 | ) | | | (0.21 | )3 | | | (0.17 | )3,4 |
| | | | | |
Net realized and unrealized gain (loss) on investments | | | 15.47 | | | | 9.70 | | | | (2.99 | ) | | | 11.74 | | | | 7.23 | |
| | | | | |
Total income (loss) from investment operations | | | 15.49 | | | | 9.43 | | | | (3.12 | ) | | | 11.53 | | | | 7.06 | |
| | | | | |
Less Distributions to Shareholders from: | | | | | | | | | | | | | | | | | | | | |
| | | | | |
Net realized gain on investments | | | (28.93 | ) | | | (5.36 | ) | | | — | | | | — | | | | — | |
| | | | | |
Net Asset Value, End of Year | | | $43.52 | | | | $56.96 | | | | $52.89 | | | | $56.01 | | | | $44.48 | |
| | | | | |
Total Return5 | | | 31.75 | %3 | | | 18.95 | % | | | (5.57 | )% | | | 25.92 | %3 | | | 18.87 | %3 |
| | | | | |
Ratio of net expenses to average net assets | | | 1.03 | % | | | 1.11 | % | | | 1.10 | % | | | 1.10 | % | | | 1.11 | % |
| | | | | |
Ratio of gross expenses to average net assets | | | 1.03 | %6 | | | 1.11 | % | | | 1.10 | % | | | 1.10 | %6 | | | 1.12 | %6 |
| | | | | |
Ratio of net investment income (loss) to average net assets | | | 0.04 | %3 | | | (0.51 | )% | | | (0.26 | )% | | | (0.43 | )%3 | | | (0.43 | )%3 |
| | | | | |
Portfolio turnover | | | 202 | % | | | 221 | % | | | 145 | % | | | 138 | % | | | 187 | % |
| | | | | |
Net assets end of year (000’s) omitted | | | $904,295 | | | | $835,057 | | | | $786,149 | | | | $893,301 | | | | $771,474 | |
| 1 | Effective February 27, 2017, the Fund’s Class S shares were renamed to Class I shares. |
| 2 | Per share numbers have been calculated using average shares. |
| 3 | Total returns and net investment income (loss) would have been lower had certain expenses not been offset. |
| 4 | Includes non-recurring dividends. Without these dividends, net investment loss per share would have been $(0.22). |
| 5 | The total return is calculated using the published Net Asset Value as of fiscal year end. |
| 6 | Excludes the impact of expense reimbursement or fee waivers and expense reductions such as brokerage credits, but includes expense repayments and non-reimbursable expenses, if any, such as interest, taxes, and extraordinary expenses. (See Note 1(c) and 2 in the Notes to Financial Statements.) |
16
| | |
| | | Notes to Financial Statements September 30, 2021 |
| | | |
| | | |
1. ORGANIZATION AND SUMMARY OF SIGNIFICANT ACCOUNTING POLICIES
AMG Funds I (the “Trust”) is an open-end management investment company, organized as a Massachusetts business trust, and registered under the Investment Company Act of 1940, as amended (the “1940 Act”). Currently, the Trust consists of a number of different funds, each having distinct investment management objectives, strategies, risks, and policies. Included in this report is AMG Boston Common Global Impact Fund (formerly AMG Managers Brandywine Fund) (the “Fund”).
On March 17-18, 2021, the Board of Trustees of the Trust (the “Board”) approved Boston Common Asset Management, LLC (“Boston Common”) as the subadviser to the Fund on an interim basis to replace Friess Associates, LLC (“Friess”) and Friess Associates of Delaware, LLC (“Friess of Delaware”), effective March 19, 2021, which was subsequently approved by the shareholders of the Fund on May 18, 2021. In conjunction with the subadviser change, the Fund seeks to achieve its investment objective by investing in a diversified portfolio of global equities. In conjunction with the changes in investment strategy for the Fund, the Fund sold substantially all open positions around the date of the subadviser change that increased the Fund’s portfolio turnover. Also, during the transition of the Fund’s portfolio, the Fund invested in futures contacts and forward foreign currency contracts to manage exposure to foreign markets. The Fund also declared a special capital gain distribution on March 24, 2021.
Market disruptions associated with the COVID-19 pandemic have had a global impact, and uncertainty exists as to the long-term implications. Such disruptions can adversely affect assets of the Fund and thus Fund performance.
The Fund’s financial statements are prepared in accordance with accounting principles generally accepted in the United States of America (“U.S. GAAP”), including accounting and reporting guidance pursuant to Accounting Standards Codification Topic 946 applicable to investment companies. U.S. GAAP requires management to make estimates and assumptions that affect the reported amounts of assets and liabilities and disclosure of contingent assets and liabilities at the date of the financial statements and the reported amounts of income and expenses during the reporting period. Actual results could differ from those estimates and such differences could be material. The following is a summary of significant accounting policies followed by the Fund in the preparation of its financial statements:
a. VALUATION OF INVESTMENTS
Equity securities traded on a national securities exchange or reported on the NASDAQ national market system (“NMS”) are valued at the last quoted sales price on the primary exchange or, if applicable, the NASDAQ official closing price or the official closing price of the relevant exchange or, lacking any sales, at the last quoted bid price or the mean between the last quoted bid and ask prices (the “mean price”). Equity securities traded in the over-the-counter market (other than NMS securities) are valued at the mean price. Foreign equity securities (securities principally traded in markets other than U.S. markets) are valued at the official closing price on the primary exchange or, for markets that either do not offer an official closing price or where the official closing price may not be representative of the overall market, the last quoted sale price.
Fixed income securities purchased with a remaining maturity of 60 days or less are valued at amortized cost, provided that the amortized cost value is approximately the same as the fair value of the security valued without the use of
amortized cost. Investments in other open-end registered investment companies are valued at their end of day net asset value per share.
Futures contracts for which market quotations are readily available are valued at the settlement price as of the close of the futures exchange.
The Fund’s portfolio investments are generally valued based on independent market quotations or prices or, if none, “evaluative” or other market based valuations provided by third party pricing services approved by the Board. Under certain circumstances, the value of certain Fund portfolio investments may be based on an evaluation of fair value, pursuant to procedures established by and under the general supervision of the Board. The Valuation Committee, which is comprised of the Independent Trustees of the Board, and the Pricing Committee, which is comprised of representatives from AMG Funds LLC (the “Investment Manager”) are the committees appointed by the Board to make fair value determinations. The Fund may use the fair value of a portfolio investment to calculate its net asset value (“NAV”) in the event that the market quotation, price or market based valuation for the portfolio investment is not readily available or otherwise not determinable pursuant to the Board’s valuation procedures, if the Investment Manager or the Pricing Committee believes the quotation, price or market based valuation to be unreliable, or in certain other circumstances. When determining the fair value of an investment, the Pricing Committee and, if required under the Trust’s securities valuation procedures, the Valuation Committee, seeks to determine the price that the Fund might reasonably expect to receive from current sale of that portfolio investment in an arms-length transaction. Fair value determinations shall be based upon consideration of all available facts and information, including, but not limited to (i) attributes specific to the investment; (ii) fundamental and analytical data relating to the investment; and (iii) the value of other comparable securities or relevant financial instruments, including derivative securities, traded on other markets or among dealers.
The values assigned to fair value portfolio investments are based on available information and do not necessarily represent amounts that might ultimately be realized in the future, since such amounts depend on future developments inherent in long-term investments. Because of the inherent uncertainty of valuation, those estimated values may differ significantly from the values that would have been used had a ready market for the investments existed, and the differences could be material. The Board will be presented with a quarterly report showing as of the most recent quarter end, all outstanding securities fair valued by the Fund, including a comparison with the prior quarter end and the percentage of the Fund that the security represents at each quarter end.
With respect to foreign equity securities and certain foreign fixed income securities, the Board has adopted a policy that securities held in the Fund that can be fair valued by the applicable fair value pricing service are fair valued on each business day provided that each individual price exceeds a pre-established confidence level.
U.S. GAAP defines fair value as the price that a fund would receive to sell an asset or pay to transfer a liability in an orderly transaction between market participants at the measurement date. U.S. GAAP also establishes a framework for measuring fair value, and a three level hierarchy for fair value measurements based upon the transparency of inputs to the valuation of an asset or liability. Inputs may be observable or unobservable and refer broadly to the assumptions that market participants would use in pricing the asset or liability. Observable inputs reflect the assumptions market participants would use in pricing the asset or liability based on market data obtained from sources independent of the Fund.
Unobservable inputs reflect the Fund’s own assumptions about the assumptions
17
| | |
| | | Notes to Financial Statements (continued) |
| | | |
| | | |
that market participants would use in pricing the asset or liability developed based on the best information available in the circumstances. Each investment is assigned a level based upon the observability of the inputs which are significant to the overall valuation.
The three-tier hierarchy of inputs is summarized below:
Level 1 – inputs are quoted prices in active markets for identical investments (e.g., equity securities, open-end investment companies)
Level 2 – other observable inputs (including, but not limited to: quoted prices for similar assets or liabilities in markets that are active, quoted prices for identical or similar assets or liabilities in markets that are not active, inputs other than quoted prices that are observable for the assets or liabilities (such as interest rates, yield curves, volatilities, prepayment speeds, loss severities, credit risks and default rates) or other market corroborated inputs) (e.g., debt securities, government securities, foreign currency exchange contracts, swaps, foreign securities utilizing international fair value pricing, fair valued securities with observable inputs)
Level 3 – inputs are significant unobservable inputs (including the Fund’s own assumptions used to determine the fair value of investments) (e.g., fair valued securities with unobservable inputs)
Changes in inputs or methodologies used for valuing investments may result in a transfer in or out of levels within the fair value hierarchy. The inputs or methodologies used for valuing investments may not necessarily be an indication of the risk associated with investing in those investments.
b. SECURITY TRANSACTIONS
Security transactions are accounted for as of trade date. Realized gains and losses on securities sold are determined on the basis of identified cost.
c. INVESTMENT INCOME AND EXPENSES
Dividend income is recorded on the ex-dividend date. Dividends from foreign securities are recorded on the ex-dividend date, and if after the fact, as soon as the Fund becomes aware of the ex-dividend date. Interest income, which includes amortization of premium and accretion of discount on debt securities, is accrued as earned. Dividend and interest income on foreign securities is recorded gross of any withholding tax. Non-cash dividends included in dividend income, if any, are reported at the fair market value of the securities received. Upon notification from issuers, distributions received from a real estate investment trust (REIT) may be redesignated as a reduction of cost of investments and/or realized gain. Other income and expenses are recorded on an accrual basis. Expenses that cannot be directly attributed to the Fund are apportioned among the funds in the Trust and other trusts or funds within the AMG Funds Family of Funds (collectively the “AMG Funds Family”) based upon their relative average net assets or number of shareholders.
d. DIVIDENDS AND DISTRIBUTIONS
Fund distributions resulting from either net investment income or realized net capital gains, if any, will normally be declared and paid at least annually in December. Distributions to shareholders are recorded on the ex-dividend date. Distributions are determined in accordance with federal income tax regulations, which may differ from net investment income and net realized capital gains for financial statement purposes (U.S. GAAP). Differences may be permanent or temporary. Permanent differences are reclassified among capital accounts in the
financial statements to reflect their tax character. Permanent book and tax basis differences, if any, relating to shareholder distributions will result in reclassifications to paid-in capital. Temporary differences arise when certain items of income, expense and gain or loss are recognized in different periods for financial statement and tax purposes; these differences will reverse at some time in the future. There were no permanent differences. Temporary differences are primarily due to mark to market of passive foreign investment companies and wash sale loss deferrals.
The tax character of distributions paid during the fiscal years ended September 30, 2021 and September 30, 2020 were as follows:
| | | | | | | | |
| Distributions paid from: | | 2021 | | | 2020 | |
| | |
Ordinary income * | | $ | 266,048,264 | | | | — | |
| | |
Long-term capital gains | | | 185,843,454 | | | $ | 78,234,351 | |
| | | | | | | | |
| | |
| | $ | 451,891,718 | | | $ | 78,234,351 | |
| | | | | | | | |
| * | For tax purposes, short-term capital gain distributions, if any, are considered ordinary income distributions. |
As of September 30, 2021, the components of distributable earnings (excluding unrealized appreciation/depreciation) on a tax basis consisted of:
| | | | |
| |
Undistributed long-term capital gains | | $ | 4,198,687 | |
At September 30, 2021, the cost of investments and the aggregate gross unrealized appreciation and depreciation for federal income tax purposes were as follows:
| | | | | | | | | | | | |
| Cost | | Appreciation | | | Depreciation | | | Net Appreciation | |
| | | |
| $880,017,235 | | | $89,359,969 | | | | $(41,104,149) | | | | $48,255,820 | |
e. FEDERAL TAXES
The Fund currently qualifies as an investment company and intends to comply with the requirements under Subchapter M of the Internal Revenue Code of 1986, as amended, and to distribute substantially all of its taxable income and gains to its shareholders and to meet certain diversification and income requirements with respect to investment companies. Therefore, no provision for federal income or excise tax is included in the accompanying financial statements.
Additionally, based on the Fund’s understanding of the tax rules and rates related to income, gains and transactions for the foreign jurisdictions in which it invests, the Fund will provide for foreign taxes, and where appropriate, deferred foreign taxes.
Management has analyzed the Fund’s tax positions taken on federal income tax returns as of September 30, 2021, and for all open tax years (generally, the three prior taxable years), and has concluded that no provision for federal income tax is required in the Fund’s financial statements. Additionally, Management is not aware of any tax position for which it is reasonably possible that the total amounts of unrecognized tax benefits will change materially in the next twelve months.
f. CAPITAL LOSS CARRYOVERS AND DEFERRALS
As of September 30, 2021, the Fund had no capital loss carryovers for federal income tax purposes. Should the Fund incur net capital losses for the fiscal year
18
| | |
| | | Notes to Financial Statements (continued) |
| | | |
| | | |
ended September 30, 2022, such amounts may be used to offset future realized capital gains indefinitely, and retain their character as short-term and/or long-term.
g. CAPITALSTOCK
The Trust’s Declaration of Trust authorizes for the Fund the issuance of an unlimited number of shares of beneficial interest, without par value. The Fund records sales and repurchases of its capital stock on the trade date.
For the fiscal years ended September 30, 2021 and September 30, 2020, the capital stock transactions by class for the Fund were as follows:
| | | | | | | | | | | | | | | | |
| | | September 30, 2021 | | | September 30, 2020 | |
| | | Shares | | | Amount | | | Shares | | | Amount | |
| | | | |
Class I: | | | | | | | | | | | | | | | | |
| | | | |
Proceeds from sale of shares | | | 176,870 | | | | $8,489,156 | | | | 46,057 | | | | $2,373,834 | |
| | | | |
Reinvestment of distributions | | | 9,562,894 | | | | 422,177,212 | | | | 1,413,629 | | | | 72,476,754 | |
| | | | |
Cost of shares repurchased | | | (3,622,135) | | | | (165,198,021) | | | | (1,661,560) | | | | (82,632,359) | |
| | | | | | | | | | | | | | | | |
| | | | |
Net increase (decrease) | | | 6,117,629 | | | | $265,468,347 | | | | (201,874) | | | | $(7,781,771) | |
| | | | | | | | | | | | | | | | |
h. REPURCHASE AGREEMENTS AND JOINT REPURCHASE AGREEMENTS
The Fund may enter into third-party repurchase agreements for temporary cash management purposes and third-party or bilateral joint repurchase agreements for reinvestment of cash collateral on securities lending transactions under the securities lending program offered by The Bank of New York Mellon (“BNYM”) (the “Program”) (collectively, “Repurchase Agreements”). The value of the underlying collateral, including accrued interest, must equal or exceed the value of the Repurchase Agreements during the term of the agreement. For joint repurchase agreements, the Fund participates on a pro rata basis with other clients of BNYM in its share of the underlying collateral under such joint repurchase agreements and in its share of proceeds from any repurchase or other disposition of the underlying collateral. The underlying collateral for all Repurchase Agreements is held in safekeeping by the Fund’s custodian or at the Federal Reserve Bank. If the seller defaults and the value of the collateral declines, or if bankruptcy proceedings commence with respect to the seller of the security, realization of the collateral by the Fund may be delayed or limited. Pursuant to the Program, the Fund is indemnified for such losses by BNYM on joint repurchase agreements.
At September 30, 2021, the market value of Repurchase Agreements outstanding was $19,379,291.
i. FOREIGN CURRENCY TRANSLATION
The books and records of the Fund are maintained in U.S. dollars. The value of investments, assets and liabilities denominated in currencies other than U.S. dollars are translated into U.S. dollars based upon current foreign exchange rates. Purchases and sales of foreign investments, income and expenses are converted into U.S. dollars based on currency exchange rates prevailing on the respective dates of such transactions. Net realized and unrealized gain (loss) on foreign currency transactions represent: (1) foreign exchange gains and losses from the sale and holdings of foreign currencies; (2) gains and losses between trade date and settlement date on investment securities transactions and foreign currency exchange contracts; and (3) gains and losses from the difference between amounts of interest and dividends recorded and the amounts actually received.
The Fund does not isolate the net realized and unrealized gain or loss resulting from changes in exchange rates from the fluctuations in market prices of securities held. Such fluctuations are included with the net realized and unrealized gain or loss on investments.
2. AGREEMENTS AND TRANSACTIONS WITH AFFILIATES
The Trust has entered into an investment advisory agreement under which the Investment Manager, a subsidiary and the U.S. retail distribution arm of Affiliated Managers Group, Inc. (“AMG”), serves as investment manager to the Fund and is responsible for the Fund’s overall administration and operations. The Investment Manager selects one or more subadvisers for the Fund (subject to Board approval) and monitors each subadviser’s investment performance, security holdings and investment strategies. Effective March 19, 2021, the Fund’s investment portfolio is managed by Boston Common who serves pursuant to a subadvisory agreement with the Investment Manager. AMG owns a minority equity interest in Boston Common. Prior to March 19, 2021, the Fund’s investment portfolio was managed by Friess and Friess of Delaware.
Investment management fees are paid directly by the Fund to the Investment Manager based on average daily net assets. Effective May 19, 2021, the Fund paid an investment management fee at the annual rate of 0.73% of the average daily net assets of the Fund. Prior to May 19, 2021, the Fund paid an investment management fee at the annual rate of 0.88% of the average daily net assets of the Fund.
The Investment Manager has contractually agreed, through at least February 1, 2023, to waive management fees and/or pay or reimburse fund expenses in order to limit total annual Fund operating expenses after fee waiver and expense reimbursements (exclusive of taxes, interest (including interest incurred in connection with bank and custody overdrafts, and in connection with securities sold short), shareholder servicing fees, distribution and service (12b-1) fees, brokerage commissions and other transaction costs, dividends payable with respect to securities sold short, acquired fund fees and expenses and extraordinary expenses) of the Fund to the annual rate of 0.93% of the Fund’s
19
| | |
| | | Notes to Financial Statements (continued) |
| | | |
| | | |
average daily net assets (this annual rate or such other annual rate that may be in effect from time to time, the “Expense Cap”), subject to later reimbursement by the Fund in certain circumstances. Prior to May 19, 2021, the Fund did not have an expense limitation.
In general, for a period of up to 36 months after the date any amounts are paid, waived or reimbursed by the Investment Manager, the Investment Manager may recover such amounts from the Fund, provided that such repayment would not cause the Fund’s total annual operating expenses after fee waiver and expense reimbursements (exclusive of the items noted in the parenthetical above) to exceed either (i) the Expense Cap in effect at the time such amounts were paid, waived or reimbursed, or (ii) the Expense Cap in effect at the time of such repayment by the Fund.
The contractual expense limitation may only be terminated in the event the Investment Manager or a successor ceases to be the investment manager of the Fund or a successor fund, by mutual agreement between the Investment Manager and the Board, or in the event of the Fund’s liquidation unless the Fund is reorganized or is a party to a merger in which the surviving entity is successor to the accounting and performance information of the Fund.
At September 30, 2021, the Fund’s expiration of reimbursements subject to recoupment is as follows:
| | | | |
Expiration Period | | | |
| |
2-3 years | | $ | 21,540 | |
| | | | |
| |
Total | | $ | 21,540 | |
| | | | |
The Trust, on behalf of the Fund, has entered into an amended and restated Administration Agreement under which the Investment Manager serves as the Fund’s administrator (the “Administrator”) and is responsible for all non-portfolio management aspects of managing the Fund’s operations, including administration and shareholder services to the Fund. The Fund pays a fee to the Administrator at the rate of 0.15% per annum of the Fund’s average daily net assets for this service.
The Fund is distributed by AMG Distributors, Inc. (the “Distributor”), a wholly-owned subsidiary of the Investment Manager. The Distributor serves as the distributor and underwriter for the Fund and is a registered broker-dealer and member of the Financial Industry Regulatory Authority, Inc. (“FINRA”). Shares of the Fund will be continuously offered and will be sold directly to prospective purchasers and through brokers, dealers or other financial intermediaries who have executed selling agreements with the Distributor. Generally the Distributor bears all or a portion of the expenses of providing services pursuant to the distribution agreement, including the payment of the expenses relating to the distribution of prospectuses for sales purposes and any advertising or sales literature.
For Class I shares, the Board has approved reimbursement payments to the Investment Manager for shareholder servicing expenses (“shareholder servicing fees”) incurred. Shareholder servicing fees include payments to financial intermediaries, such as broker-dealers (including fund supermarket platforms), banks, and trust companies who provide shareholder recordkeeping, account servicing and other services. The Class I shares may reimburse the Investment Manager for the actual amount incurred up to a maximum annual rate of each Class’s average daily net assets as shown in the table below. Effective May 19, 2021, the shareholder servicing fees were eliminated.
The impact on the annualized expense ratios for the fiscal year ended September 30, 2021, were as follows:
| | | | | | | | |
| | | Maximum Annual
Amount
Approved | | | Actual
Amount
Incurred | |
| | |
Class I1 | | | — | | | | 0.01% | |
| 1 | Prior to May 19, 2021, the maximum annual amount approved was 0.15%. Effective May 19, 2021, the shareholder servicing fees were eliminated. |
The Board provides supervision of the affairs of the Trust and other trusts within the AMG Funds Family. The Trustees of the Trust who are not affiliated with the Investment Manager receive an annual retainer and per meeting fees for regular, special and telephonic meetings, and they are reimbursed for out-of-pocket expenses incurred while carrying out their duties as Board members. The Chairman of the Board and the Audit Committee Chair receive additional annual retainers. Certain Trustees and Officers of the Fund are Officers and/or Directors of the Investment Manager, AMG and/or the Distributor.
The Securities and Exchange Commission (the “SEC”) granted an exemptive order that permits the Fund to lend and borrow money for certain temporary purposes directly to and from other eligible funds in the AMG Funds Family. Participation in this interfund lending program is voluntary for both the borrowing and lending funds, and an interfund loan is only made if it benefits each participating fund. The Administrator manages the program according to procedures approved by the Board, and the Board monitors the operation of the program. An interfund loan must comply with certain conditions set out in the exemptive order, which are designed to assure fairness and protect all participating funds. The interest earned and interest paid on interfund loans are included on the Statement of Operations as interest income and miscellaneous expense, respectively. At September 30, 2021, the Fund had no interfund loans outstanding.
The Fund utilized the interfund loan program during the fiscal year ended September 30, 2021 as follows:
| | | | | | | | | | |
Average
Borrowed | | Number
of Days | | Interest
Paid | | | Average Interest Rate | |
| | | |
$4,886,433 | | 4 | | | $503 | | | | 0.939% | |
3. PURCHASES AND SALES OF SECURITIES
Purchases and sales of securities (excluding short-term securities and
U.S. Government Obligations) for the fiscal year ended September 30, 2021, were $1,850,284,893 and $2,016,266,931, respectively.
The Fund had no purchases or sales of U.S. Government Obligations during the fiscal year ended September 30, 2021.
4. PORTFOLIO SECURITIES LOANED
The Fund participates in the Program providing for the lending of securities to qualified borrowers. Securities lending income includes earnings of such temporary cash investments, plus or minus any rebate to a borrower. These earnings (after any rebate) are then divided between BNYM, as a fee for its services under the Program, and the Fund, according to agreed-upon rates. Collateral on all securities loaned is accepted in cash, U.S. Treasury Obligations or U.S. Government Agency Obligations. Collateral is maintained at a minimum level of 102% (105% in the case of certain foreign securities) of the market value, plus
20
| | |
| | | Notes to Financial Statements (continued) |
| | | |
| | | |
interest, if applicable, of investments on loan. It is the Fund’s policy to obtain additional collateral from or return excess collateral to the borrower by the end of the next business day, following the valuation date of the securities loaned. Therefore, the value of the collateral held may be temporarily less than the value of the securities on loan. Lending securities entails a risk of loss to the Fund if and to the extent that the market value of the securities loaned were to increase and the borrower did not increase the collateral accordingly, and the borrower fails to return the securities. Under the terms of the Program, the Fund is indemnified for such losses by BNYM. Cash collateral is held in separate omnibus accounts managed by BNYM, who is authorized to exclusively enter into joint repurchase agreements for that cash collateral. Securities collateral is held in separate omnibus accounts managed by BNYM that cannot be sold or pledged. BNYM bears the risk of any deficiency in the amount of the cash collateral available for return to the borrower due to any loss on the collateral invested. Loans of securities are terminable at any time and the borrower, after notice, is required to return borrowed securities as soon as practical, which is normally within three business days.
The value of securities loaned on positions held, cash collateral and securities collateral received at September 30, 2021, were as follows:
| | | | | | | | | | |
Securities Loaned | | Cash Collateral Received | | Securities
Collateral
Received | | | Total
Collateral
Received | |
| | | |
$56,162,774 | | $19,379,291 | | $ | 38,834,283 | | | $ | 58,213,574 | |
The following table summarizes the securities received as collateral for securities lending at September 30, 2021:
| | | | |
Collateral Type | | Coupon
Range | | Maturity
Date Range |
| | |
U.S. Treasury Obligations | | 0.000%-6.875% | | 10/07/21-11/15/50 |
5. FOREIGN SECURITIES
The Fund invests in securities of foreign entities and in instruments denominated in foreign currencies which involve risks not typically associated with investments in domestic securities. Non-domestic securities carry special risks, such as exposure to currency fluctuations, less developed or less efficient trading markets, political instability, a lack of company information, differing auditing and legal standards, and, potentially, less liquidity. The Fund’s investments in emerging market countries are exposed to additional risks. The Fund’s performance will be influenced by political, social and economic factors affecting companies in emerging market countries. Emerging market countries generally have economic structures that are less diverse and mature, and political systems that are less stable, than those of developed countries. Realized gains in certain countries may be subject to foreign taxes at the Fund level and the Fund would pay such foreign taxes at the appropriate rate for each jurisdiction.
6. COMMITMENTS AND CONTINGENCIES
Under the Trust’s organizational documents, its trustees and officers are indemnified against certain liabilities arising out of the performance of their duties to the Trust. In addition, in the normal course of business, the Fund may enter into contracts and agreements that contain a variety of representations and warranties, which provide general indemnifications. The maximum exposure to the Fund under these arrangements is unknown, as this would involve future claims
that may be made against the Fund that have not yet occurred. However, based on experience, the Fund had no prior claims or losses and expects the risks of loss to be remote.
7. FORWARD COMMITMENTS
Certain transactions, such as futures and forward transactions may have a similar effect on the Fund’s net asset value as if the Fund had created a degree of leverage in its portfolio. However, if the Fund enters into such a transaction, the Fund will establish a segregated account with its custodian in which it will maintain cash, U.S. government securities or other liquid securities equal in value to its obligations in respect to such transaction. Securities and other assets held in the segregated account may not be sold while the transaction is outstanding, unless other suitable assets are substituted.
8. DERIVATIVE INSTRUMENTS
The following disclosures contain information on how and why the Fund used derivative instruments, the credit risk and how derivative instruments affect the Fund’s financial position, and results of operations. The location and fair value amounts of these instruments on the Statement of Assets and Liabilities, and the realized gains and losses and changes in unrealized appreciation and depreciation on the Statement of Operations, each categorized by type of derivative contract, are included in a table at the end of the Fund’s Schedule of Portfolio Investments.
For the fiscal year ended September 30, 2021, the average quarterly balances of derivative financial instruments outstanding were as follows:
| | | | |
| |
Foreign Currency Exchange Contracts | | | | |
| |
Average U.S. Dollar amount purchased/sold | | $ | 38,669,065 | |
| |
Financial Futures Contracts | | | | |
| |
Average number of contracts purchased | | | 45 | |
| |
Average notional value of contracts purchased | | $ | 3,702,767 | |
9. FORWARD FOREIGN CURRENCY CONTRACTS
During the transition of the portfolio for the Fund, the transition manager invested in forward foreign currency contracts to facilitate transactions in foreign securities and to hedge against foreign currency exchange rate risk on its non-U.S. dollar denominated investment securities. A forward foreign currency contract is an agreement between a fund and another party to buy or sell a currency at a set price at a future date. The market value of the contract will fluctuate with changes in currency exchange rates. The contract is marked-to-market daily, and the change in market value is recorded as an unrealized appreciation or depreciation. Risks may arise upon entering into these contracts from the potential inability of counterparties to meet the terms of their contracts and from unanticipated movements in the value of a foreign currency relative to the U.S. dollar. At September 30, 2021, there were no open forward foreign currency contracts.
10. FUTURES CONTRACTS
During the transition of the portfolio for the Fund, the transition manager purchased futures contracts to achieve desired levels of investment. There are certain risks associated with futures contracts. Prices may not move as expected or the Fund may not be able to close out the contract when it desires to do so, resulting in losses.
21
| | |
| | | Notes to Financial Statements (continued) |
| | | |
| | | |
On entering into a futures contract, either cash or securities in an amount equal to a certain percentage of the contract value (initial margin) must be deposited with the futures broker. Subsequent payments (variation margin) are made or received each day.
Variation margin on future contracts is recorded as unrealized appreciation or depreciation until the futures contract is closed or expired. The Fund recognizes a realized gain or loss when the contract is closed or expires equal to the difference between the value of the contract at the time it was opened and the value at the time it was closed. Fluctuations in the value of the contracts are recorded in the Statement of Assets and Liabilities as Receivable for variation margin or Payable for variation margin, and in the Statement of Operations as Net change in unrealized appreciation (depreciation) on futures contracts until the contracts are closed, when they are recorded as Net realized gain or loss on futures contracts. At September 30, 2021, there were no open futures contracts.
11. MASTER NETTING AGREEMENTS
The Fund may enter into master netting agreements with its counterparties for the securities lending program, Repurchase Agreements and derivatives, which provide the right, in the event of default (including bankruptcy or insolvency) for the non-defaulting party to liquidate the collateral and calculate net exposure to the defaulting party or request additional collateral. For financial reporting purposes, the Fund does not offset financial assets and financial liabilities that are subject to master netting agreements in the Statement of Assets and Liabilities. For securities lending transactions, see Note 4.
The following table is a summary of the Fund’s open Repurchase Agreements that are subject to a master netting agreement as of September 30, 2021:
| | | | | | | | | | | | | | | | | | | | |
| | | | | | Gross Amount Not Offset in the | | | | | | | |
| | | | | | Statement of Assets and Liabilities | | | | | | | |
| | | | | |
| | | Gross Amounts of
Assets Presented in
the Statement of
Assets and Liabilities | | | Offset Amount | | | Net Asset Balance | | | Collateral Received | | | Net Amount | |
| | | | | |
| | | | | | | | | | | | | | | | | | | | |
| | | | | |
| | | | | | | | | | | | | | | | | | | | |
| | | | | |
Bank of America Securities, Inc. | | | $4,602,596 | | | | — | | | | $4,602,596 | | | | $4,602,596 | | | | — | |
| | | | | |
Cantor Fitzgerald Securities, Inc. | | | 4,602,600 | | | | — | | | | 4,602,600 | | | | 4,602,600 | | | | — | |
| | | | | |
Daiwa Capital Markets America | | | 2,769,940 | | | | — | | | | 2,769,940 | | | | 2,769,940 | | | | — | |
| | | | | |
RBC Dominion Securities, Inc. | | | 4,602,596 | | | | — | | | | 4,602,596 | | | | 4,602,596 | | | | — | |
| | | | | |
State of Wisconsin Investment Board | | | 2,801,559 | | | | — | | | | 2,801,559 | | | | 2,801,559 | | | | — | |
| | | | | | | | | | | | | | | | | | | | |
| | | | | |
Total | | | $19,379,291 | | | | — | | | | $19,379,291 | | | | $19,379,291 | | | | — | |
| | | | | | | | | | | | | | | | | | | | |
12. SUBSEQUENT EVENTS
The Fund has determined that no material events or transactions occurred through the issuance date of the Fund’s financial statements which require an additional disclosure in or adjustment of the Fund’s financial statements.
22
| | |
| | | Report of Independent Registered Public Accounting Firm |
| | | |
| | | |
TO THE BOARD OF TRUSTEES OF AMG FUNDS I AND SHAREHOLDERS OF AMG BOSTON COMMON GLOBAL IMPACT FUND
Opinions on the Financial Statements
We have audited the accompanying statement of assets and liabilities, including the schedule of investments, of AMG Boston Common Global Impact Fund (formerly AMG Managers Brandywine Fund) (one of the funds constituting AMG Funds I, referred to hereafter as the “Fund”) as of September, 30 2021, the related statement of operations for the year ended September 30, 2021, the statement of changes in net assets for each of the two years in the period ended September 30, 2021, including the related notes, and the financial highlights for each of the five years in the period ended September 30, 2021 (collectively referred to as the “financial statements”). In our opinion, the financial statements present fairly, in all material respects, the financial position of the Fund as of September 30, 2021, the results of its operations for the year then ended, the changes in its net assets for each of the two years in the period ended September 30, 2021 and the financial highlights for each of the five years in the period ended September 30, 2021 in conformity with accounting principles generally accepted in the United States of America.
Basis for Opinions
These financial statements are the responsibility of the Fund’s management. Our responsibility is to express an opinion on the Fund’s financial statements based on our audit. We are a public accounting firm registered with the Public Company Accounting Oversight Board (United States) (PCAOB) and are required to be independent with respect to the Fund in accordance with the U.S. federal securities laws and the applicable rules and regulations of the Securities and Exchange Commission and the PCAOB.
We conducted our audit of these financial statements in accordance with the standards of the PCAOB. Those standards require that we plan and perform the audit to obtain reasonable assurance about whether the financial statements are free of material misstatement, whether due to error or fraud.
Our audit included performing procedures to assess the risks of material misstatement of the financial statements, whether due to error or fraud, and performing procedures that respond to those risks. Such procedures included examining, on a test basis, evidence regarding the amounts and disclosures in the financial statements. Our audit also included evaluating the accounting principles used and significant estimates made by management, as well as evaluating the overall presentation of the financial statements. Our procedures included confirmation of securities owned as of September 30, 2021 by correspondence with the custodian and brokers; when replies were not received from brokers, we performed other auditing procedures. We believe that our audit provides a reasonable basis for our opinion.
PricewaterhouseCoopers LLP
Boston, Massachusetts
November 23, 2021
We have served as the auditor of one or more investment companies in the AMG Funds Family since 1993.
23
| | |
| | | Other Information (unaudited) |
| | | |
| | | |
TAX INFORMATION
AMG Boston Common Global Impact Fund hereby designates the maximum amount allowable of its net taxable income as qualified dividends as provided in the Jobs and Growth Tax Relief Reconciliation Act of 2003. The 2021 Form 1099-DIV you receive for the Fund will show the tax status of all distributions paid to you during the calendar year.
In accordance with federal tax law, the Fund elected to provide foreign taxes paid and the income sourced from foreign countries. Accordingly, the Fund hereby makes the following designations regarding its period ended September 30, 2021:
AMG Boston Common Global Impact Fund
uThe total amount of taxes paid and income sourced from foreign countries was $649,081 and $6,899,346, respectively.
Pursuant to section 852 of the Internal Revenue Code, AMG Boston Common Global Impact Fund hereby designates $185,843,454 as a capital gain distribution with respect to the taxable year ended September 30, 2021, or if subsequently determined to be different, the net capital gains of such year.
PROXY VOTE
A special meeting of the shareholders of AMG Boston Common Global Impact Fund (the “Fund”) was held on May 18, 2021, to vote on proposals including to approve a new subadvisory agreement between AMG Funds LLC (the “Investment Manager”) and Boston Common Asset Management, LLC (“Boston Common”) with respect to the Fund, and to approve a modified manager-of-managers structure for the Fund that would permit the Investment Manager to enter into and materially amend subadvisory agreements with unaffiliated and affiliated subadvisers without obtaining shareholder approval and would also permit the Fund to disclose fees paid to subadvisers on an aggregate, rather than individual, basis. The proposals and results of the votes are summarized below.
| | | | | | |
| Proposal 1 | | For | | Number of Eligible Shareholders Against | | Abstain |
| | | | | | | |
| | | |
Approval of a new subadvisory agreement between the Investment Manager and Boston Common with respect to the Fund. | | 10,572,381 | | 2,308,385 | | 688,806 |
| | | |
% of Shares Present | | 77.91% | | 17.01% | | 5.08% |
| | | |
% of Outstanding Shares | | 45.54% | | 9.94% | | 2.97% |
| Proposal 2 | | For | | Number of Eligible Shareholders Against | | Abstain |
| | | | | | | |
| | | |
Approval of a modified manager-of-managers structure for the Fund that would permit the Investment Manager to enter into and materially amend subadvisory agreements with unaffiliated and affiliated subadvisers without obtaining shareholder approval and would also permit the Fund to disclose fees paid to subadvisers on an aggregate, rather than individual, basis. | | 9,933,295 | | 2,872,411 | | 763,866 |
| | | |
% of Shares Present | | 73.20% | | 21.17% | | 5.63% |
| | | |
% of Outstanding Shares | | 42.79% | | 12.37% | | 3.29% |
| | | | |
| Fund Totals: | | Shares | |
| |
Record Total | | | 23,214,366 | |
| |
Shares Voted | | | 13,569,572 | |
| |
Percent Present | | | 58.45% | |
24
| | |
| | | AMG Funds Trustees and Officers |
| | | |
| | | |
| | | | |
| The Trustees and Officers of the Trust, their business addresses, principal occupations for the past five years and ages are listed below. The Trustees provide broad supervision over the affairs of the Trust and the Funds. The Trustees are experienced executives who meet periodically throughout the year to oversee the Funds’ activities, review contractual arrangements with companies that provide services to the Funds, and | | review the Funds’ performance. Unless otherwise noted, the address of each Trustee or Officer is the address of the Trust: 680 Washington Blvd., Suite 500, Stamford, CT. 06901. There is no stated term of office for Trustees. Trustees serve until their resignation, retirement or removal in | | accordance with the Trust’s organizational documents and policies adopted by the Board from time to time. The Chairman of the Trustees, President, Treasurer and Secretary of the Trust are elected by the Trustees annually. Other officers hold office at the pleasure of the Trustees. |
| | | | |
Independent Trustees
The following Trustees are not “interested persons” of the Trust within the meaning of the 1940 Act:
| | |
Number of Funds Overseen in Fund Complex | | Name, Age, Principal Occupation(s) During Past 5 Years and Other Directorships Held by Trustee |
| | |
• Trustee since 2012 • Oversees 46 Funds in Fund Complex | | Bruce B. Bingham, 72 Partner, Hamilton Partners (real estate development firm) (1987-Current); Director of The Yacktman Funds (2 portfolios) (2000-2012). |
| | |
• Trustee since 2013 • Chairman of the Audit Committee since 2021 • Oversees 49 Funds in Fund Complex | | Kurt A. Keilhacker, 58 Managing Partner, TechFund Europe (2000-Present); Managing Partner, TechFund Capital (1997-Present); Managing Partner, Elementum Ventures (2013-Present); Director, MetricStory, Inc. (2017-Present); Trustee, Wheaton College (2018-Present); Trustee, Gordon College (2001-2016); Board Member, 6wind SA (2002-2019). |
| | |
• Trustee since 2000 • Oversees 46 Funds in Fund Complex | | Steven J. Paggioli, 71 Independent Consultant (2002-Present); Trustee, Professionally Managed Portfolios (28 portfolios); Advisory Board Member, Sustainable Growth Advisors, LP; Independent Director, Muzinich BDC, Inc. (business development company) (2019-Present); Director, The Wadsworth Group; Independent Director, Chase Investment Counsel (2008–2019); Executive Vice President, Secretary and Director, Investment Company Administration, LLC and First Fund Distributors, INC. (1990-2001). |
| | |
• Trustee since 2013 • Oversees 46 Funds in Fund Complex | | Richard F. Powers III, 75 Adjunct Professor, U.S. Naval War College (2016-Present); Adjunct Professor, Boston College (2011-2015); Director, Ameriprise Financial Inc. (2005-2009); President and CEO of Van Kampen Investments Inc. (1998-2003); President, Morgan Stanley Client Group (2000-2002); Executive Vice President and Chief Marketing Officer of the Morgan Stanley Individual Investor Group (1984-1998). |
| | |
• Independent Chairman • Trustee since 2000 • Oversees 49 Funds in Fund Complex | | Eric Rakowski, 63 Professor of Law, University of California at Berkeley School of Law (1990-Present); Tax Attorney at Davis Polk & Wardwell and clerked for Judge Harry T. Edwards of the U.S. Court of Appeals for the District of Columbia Circuit and for Justice William J. Brennan Jr. of the U.S. Supreme Court; Director of Harding, Loevner Funds, Inc. (10 portfolios); Trustee of Third Avenue Trust (3 portfolios) (2002-2019); Trustee of Third Avenue Variable Trust (1 portfolio) (2002-2019). |
| | |
• Trustee since 2013 • Oversees 49 Funds in Fund Complex | | Victoria L. Sassine, 56 Adjunct Professor, Babson College (2007–Present); Director, Board of Directors, PRG Group (2017-Present); CEO, Founder, Scale Smarter Partners, LLC (2018-Present); Adviser, EVOFEM Biosciences (2019-Present); Chairperson of the Board of Directors of Business Management Associates (2018 to 2019). |
| | |
• Trustee since 2000 • Oversees 46 Funds in Fund Complex | | Thomas R. Schneeweis, 74 Professor Emeritus, University of Massachusetts (2013-Present); President, TRS Associates (1982-Present); Board Member, Chartered Alternative Investment Association (“CAIA”) (2002-Present); Co-Founder and Director, Institute for Global Asset and Risk Management (Education) (2010-Present); Co-Owner, Quantitative Investment Technologies (2014-Present); Co-Owner, Yes Wealth Management (2018-Present); Director, CAIA Foundation (2010-2019); Partner, S Capital Wealth Advisors (2015-2018); Partner, S Capital Management, LLC (2007-2015); President, Alternative Investment Analytics, LLC, (formerly Schneeweis Partners, LLC) (2001-2013). |
25
| | |
| | | AMG Funds Trustees and Officers (continued) |
| | | |
| | | |
Interested Trustees
Each Trustee in the following table is an “interested person” of the Trust within the meaning of the 1940 Act. Ms. Carsman is an interested person of the Trust within the meaning of the 1940 Act by virtue of her position with, and interest in securities of, AMG.
| | |
Number of Funds Overseen in Fund Complex | | Name, Age, Principal Occupation(s) During Past 5 Years and Other Directorships Held by Trustee |
| | |
• Trustee since 2011 • Oversees 46 Funds in Fund Complex | | Christine C. Carsman, 69 Affiliated Managers Group, Inc. (2004-Present): Senior Policy Advisor (2019-Present), Executive Vice President, Deputy General Counsel and Chief Regulatory Counsel (2017-2018), Senior Vice President and Deputy General Counsel (2011-2016), Senior Vice President and Chief Regulatory Counsel (2007-2011), Vice President and Chief Regulatory Counsel (2004-2007); Chair of the Board of Directors, AMG Funds plc (2015-2018); Director, AMG Funds plc (2010-2018); Senior Counsel, Vice President and Director of Operational Risk Management and Compliance, Wellington Management Company, LLP (1995-2004); Director Emeritus of Harding, Loevner Funds, Inc. (0 Portfolios) (2021- Present); Director of Harding, Loevner Funds, Inc. (9 portfolios) (2017-2020); Secretary and Chief Legal Officer, AMG Funds, AMG Funds I, AMG Funds II and AMG Funds III (2004-2011). |
| | |
• Trustee since 2021 • Oversees 46 Funds in Fund Complex | | Garret W. Weston, 40 Affiliated Managers Group, Inc. (2008-Present): Managing Director, Co-Head of Affiliate Engagement (2021-Present), Senior Vice President, Affiliate Development (2016-2021), Vice President, Office of the CEO (2015-2016), Vice President, New Investments (2012-2015), Senior Associate, New Investments (2008-2012); Associate, Madison Dearborn Partners (2006-2008); Analyst, Merrill Lynch (2004-2006). |
| | |
Officers | | |
| | |
Position(s) Held with Fund and Length of Time Served | | Name, Age, Principal Occupation(s) During Past 5 Years |
| | |
• President since 2018 • Principal Executive Officer since 2018 • Chief Executive Officer since 2018 • Chief Operating Officer since 2007 | | Keitha L. Kinne, 63 Chief Operating Officer, AMG Funds LLC (2007-Present); Chief Investment Officer, AMG Funds LLC (2008-Present); President and Principal, AMG Distributors, Inc. (2018-Present); Chief Operating Officer, AMG Distributors, Inc. (2007-Present); President, Chief Executive Officer and Principal Executive Officer, AMG Funds, AMG Funds I, AMG Funds II, AMG Funds III and AMG Funds IV (2018-Present); Chief Operating Officer, AMG Funds, AMG Funds I, AMG Funds II, and AMG Funds III (2007-Present); Chief Operating Officer, AMG Funds IV (2016-Present); Chief Operating Officer and Chief Investment Officer, Aston Asset Management, LLC (2016); President and Principal Executive Officer, AMG Funds, AMG Funds I, AMG Funds II and AMG Funds III (2012-2014); Managing Partner, AMG Funds LLC (2007-2014); President and Principal, AMG Distributors, Inc. (2012-2014); Managing Director, Legg Mason & Co., LLC (2006-2007); Managing Director, Citigroup Asset Management (2004-2006). |
| | |
• Secretary since 2015 • Chief Legal Officer since 2015 | | Mark J. Duggan, 56 Managing Director and Senior Counsel, AMG Funds LLC (2021-Present); Senior Vice President and Senior Counsel, AMG Funds LLC (2015-2021); Secretary and Chief Legal Officer, AMG Funds, AMG Funds I, AMG Funds II, AMG Funds III and AMG Funds IV (2015-Present); Attorney, K&L Gates, LLP (2009-2015). |
| | |
• Chief Financial Officer since 2017 • Treasurer since 2017 • Principal Financial Officer since 2017 • Principal Accounting Officer since 2017 | | Thomas G. Disbrow, 55 Vice President, Mutual Fund Treasurer & CFO, AMG Funds, AMG Funds LLC (2017-Present); Chief Financial Officer, Principal Financial Officer, Treasurer and Principal Accounting Officer, AMG Funds, AMG Funds I, AMG Funds II, AMG Funds III and AMG Funds IV (2017-Present); Managing Director - Global Head of Traditional Funds Product Control, UBS Asset Management (Americas), Inc. (2015-2017); Managing Director - Head of North American Funds Treasury, UBS Asset Management (Americas), Inc. (2011-2015). |
| | |
• Deputy Treasurer since 2017 | | John A. Starace, 50 Vice President, Mutual Fund Accounting, AMG Funds LLC (2021-Present); Director, Mutual Fund Accounting, AMG Funds LLC (2017-2021); Vice President, Deputy Treasurer of Mutual Funds Services, AMG Funds LLC (2014-2017); Deputy Treasurer, AMG Funds, AMG Funds I, AMG Funds II, AMG Funds III and AMG Funds IV (2017-Present); Vice President, Citi Hedge Fund Services (2010-2014); Audit Senior Manager (2005-2010) and Audit Manager (2001-2005), Deloitte & Touche LLP. |
| | |
• Chief Compliance Officer and Sarbanes-Oxley Code of Ethics since 2019 | | Patrick J. Spellman, 47 Vice President, Chief Compliance Officer, AMG Funds LLC (2017-Present); Chief Compliance Officer, AMG Distributors, Inc., (2010-Present); Chief Compliance Officer and Sarbanes-Oxley Code of Ethics Compliance Officer, AMG Funds, AMG Funds I, AMG Funds II, AMG Funds III and AMG Funds IV (2019-Present); Senior Vice President, Chief Compliance Officer, AMG Funds LLC (2011-2017); Anti-Money Laundering Compliance Officer, AMG Funds, AMG Funds I, AMG Funds II, and AMG Funds III (2014-2019); Anti-Money Laundering Officer, AMG Funds IV, (2016-2019); Compliance Manager, Legal and Compliance, Affiliated Managers Group, Inc. (2005-2011). |
26
| | |
| | | AMG Funds Trustees and Officers (continued) |
| | | |
| | | |
| | |
Position(s) Held with Fund and Length of Time Served | | Name, Age, Principal Occupation(s) During Past 5 Years |
| | |
• Assistant Secretary since 2016 | | Maureen A. Meredith, 36 Vice President, Senior Counsel, AMG Funds LLC (2021-Present); Vice President, Counsel, AMG Funds LLC (2019-2021); Director, Counsel, AMG Funds LLC (2017-2018); Vice President, Counsel, AMG Funds LLC (2015-2017); Assistant Secretary, AMG Funds, AMG Funds I, AMG Funds II, AMG Funds III and AMG Funds IV (2016-Present); Associate, Ropes & Gray LLP (2011-2015); Law Fellow, Massachusetts Appleseed Center for Law and Justice (2010-2011). |
| | |
• Anti-Money Laundering Compliance Officer since 2019 | | Hector D. Roman, 43 Director, Legal and Compliance, AMG Funds LLC (2020-Present); Anti-Money Laundering Compliance Officer, AMG Funds, AMG Funds I, AMG Funds II, AMG Funds III and AMG Funds IV (2019-Present); Manager, Legal and Compliance, AMG Funds LLC (2017-2019); Director of Compliance, Morgan Stanley Investment Management (2015-2017); Senior Advisory, PricewaterhouseCoopers LLP (2014-2015); Risk Manager, Barclays Investment Bank (2008-2014). |
27
| | |
| | | Annual Renewal of Investment Management and Subadvisory Agreements |
| | | |
| | | |
| | | | | | | | |
AMG Boston Common Global Impact Fund (formerly AMG Managers Brandywine Fund): Approval of Investment Management Agreement on June 24, 2021 At a meeting held via telephone and video conference on June 24, 2021,1 the Board of Trustees (the “Board” or the “Trustees”), and separately a majority of the Trustees who are not “interested persons” of AMG Funds I (the “Trust”) (the “Independent Trustees”), approved the Investment Management Agreement, as amended pursuant to letter agreements at any time prior to the date of the meeting, with AMG Funds LLC (the “Investment Manager”) for AMG Boston Common Global Impact Fund (formerly AMG Managers Brandywine Fund) (the “Fund”) and separately each of Amendment No. 1 thereto dated July 1, 2015, and Amendment No. 2 thereto dated October 1, 2016 (collectively, the “Investment Management Agreement”).2 The Independent Trustees were separately represented by independent legal counsel in connection with their consideration of the approval of the Investment Management Agreement. In considering the Investment Management Agreement, the Trustees reviewed a variety of materials relating to the Fund and the Investment Manager, including the nature, extent and quality of services, comparative performance, fee and expense information for an appropriate peer group of similar mutual funds for the Fund (the “Peer Group”), performance information for the relevant benchmark index for the Fund (the “Fund Benchmark”), other relevant matters, and other information provided to them on a periodic basis throughout the year. Prior to voting, the Independent Trustees: (a) reviewed the foregoing information with their independent legal counsel; (b) received materials from their independent legal counsel discussing the legal standards applicable to their consideration of the Investment Management Agreement; and (c) met with their independent legal counsel in private sessions at which no representatives of management were present. NATURE, EXTENT AND QUALITY OF SERVICES In considering the nature, extent and quality of the services provided by the Investment Manager, the Trustees reviewed information relating to the Investment Manager’s operations and personnel. Among other things, the Investment Manager provided financial information, information about its supervisory and professional staff and descriptions of its organizational and management structure. The Trustees also took into account information provided periodically throughout the previous year by the Investment Manager in Board meetings relating to | | | | the performance of its duties with respect to the Fund and the Trustees’ knowledge of the Investment Manager’s management and the quality of the performance of the Investment Manager’s duties under the Investment Management Agreement and Administration Agreement. In the course of their deliberations regarding the Investment Manager, the Trustees evaluated, among other things: (a) the extent and quality of the Investment Manager’s oversight of the operation and management of the Fund; (b) the quality of the Investment Manager’s oversight of the performance by the Subadviser of its portfolio management duties; (c) the Investment Manager’s ability to supervise the Fund’s other service providers; and (d) the Investment Manager’s compliance program. The Trustees also took into account that, in performing its functions under the Investment Management Agreement and supervising the Subadviser, the Investment Manager: performs periodic detailed analyses and reviews of the performance by the Subadviser of its obligations to the Fund, including without limitation, analysis and review of portfolio and other compliance matters and review of the Subadviser’s investment performance with respect to the Fund; prepares and presents periodic reports to the Board regarding the investment performance of the Subadviser and other information regarding the Subadviser, at such times and in such forms as the Board may reasonably request; reviews and considers any changes in the personnel of the Subadviser responsible for performing the Subadviser’s obligations and makes appropriate reports to the Board; reviews and considers any changes in the ownership or senior management of the Subadviser and makes appropriate reports to the Board; performs periodic in-person, telephonic or videoconference diligence meetings, including with respect to compliance matters, with representatives of the Subadviser; assists the Board and management of the Trust in developing and reviewing information with respect to the initial approval of the Subadvisory Agreement and annual consideration of the Subadvisory Agreement thereafter; prepares recommendations with respect to the continued retention of the Subadviser or the replacement of the Subadviser, including at the request of the Board; identifies potential successors to, or replacements of, the Subadviser or potential additional subadvisers, including performing appropriate due diligence, and developing and presenting to the Board a recommendation as to any such successor, replacement, or additional subadviser, including at the request of the Board; designates and compensates from its own resources such personnel as the Investment Manager may consider necessary | | | | or appropriate to the performance of its services; and performs such other review and reporting functions as the Board shall reasonably request consistent with the Investment Management Agreement and applicable law. The Trustees noted the affiliation of the Subadviser with the Investment Manager, noting any potential conflicts of interest. The Trustees also took into account the financial condition of the Investment Manager with respect to its ability to provide the services required under the Investment Management Agreement and the Investment Manager’s undertaking to maintain a contractual expense limitation for the Fund. The Trustees also considered the Investment Manager’s risk management processes. PERFORMANCE The Board considered the Fund’s net performance during relevant time periods as compared to the Fund’s Peer Group and Fund Benchmark and noted that the Board reviews on a quarterly basis detailed information about both the Fund’s performance results and portfolio composition, as well as the Subadviser’s investment philosophy, strategy and techniques used in managing the Fund. The Board was mindful of the Investment Manager’s expertise, resources and attention to monitoring the Subadviser’s performance, investment style and risk-adjusted performance with respect to the Fund and its discussions with the management of the Fund’s subadvisers during the period regarding the factors that contributed to the performance of the Fund. Among other information relating to the Fund’s performance (including the predecessor fund’s performance for periods prior to its acquisition by the Trust on October 1, 2013), the Trustees noted that the Fund’s performance for Class I shares (the Fund’s sole share class) for the 1-year, 3-year, 5-year and 10-year periods ended March 31, 2021 was above the median performance of the Peer Group and above the performance of the Fund Benchmark, the MSCI ACWI Index. The Trustees also took into account management’s discussion of the Fund’s performance, noting that the Fund ranked in the top quintile relative to its Peer Group for the 1-year and 3-year periods, in the top decile relative to its Peer Group for the 5-year period, and in the top third relative to its Peer Group for the 10-year period. The Trustees also took into account the fact that the Fund’s subadviser, investment strategy, and Fund Benchmark changed effective March 19, 2021, and that the performance information reflected that of |
| | | | | | | | |
28
| | |
| | | Annual Renewal of Investment Management and Subadvisory Agreements (continued) |
| | | |
| | | |
| | | | | | | | |
the Fund’s prior subadviser and investment strategy. The Trustees concluded that the Fund’s overall performance has been satisfactory. ADVISORY FEES; FUND EXPENSES; PROFITABILITY; AND ECONOMIES OF SCALE In considering the reasonableness of the advisory fee payable to the Investment Manager, the Trustees reviewed information provided by the Investment Manager at the June 24, 2021 and prior meetings setting forth all revenues and other benefits, both direct and indirect (including any so-called “fallout benefits” such as reputational value derived from the Investment Manager serving as Investment Manager to the Fund), received by the Investment Manager and its affiliates attributable to managing the Fund and all the mutual funds in the AMG Funds Family of Funds; the cost of providing such services; the significant risks undertaken as Investment Manager and sponsor of the Fund, including investment, operational, enterprise, entrepreneurial, litigation, regulatory and compliance risks; and the resulting profitability to the Investment Manager and its affiliates from these relationships. The Trustees also considered the changes to the management, subadvisory, and shareholder servicing fee rates and the new expense cap that were implemented during the past year for the Fund. The Trustees also considered the amount of the advisory fee retained by the Investment Manager after payment of the subadvisory fee with respect to the Fund. The Trustees also noted payments made or to be made from the Subadviser to the Investment Manager, and other payments made or to be made from the Investment Manager to the Subadviser. The Trustees also considered management’s discussion of the current asset level of the Fund, and the impact on profitability of both the current asset level and any future growth of assets of the Fund. In considering the cost of services to be provided by the Investment Manager under the Investment Management Agreement and the profitability to the Investment Manager of its relationship with the Fund, the Trustees noted the undertaking by the Investment Manager to maintain a contractual expense limitation for the Fund. The Board also took into account management’s discussion of the advisory fee structure, and the services the Investment Manager provides in performing its functions under the Investment Management Agreement and supervising the Subadviser. Based on the foregoing, the Trustees concluded that the profitability to the Investment Manager is reasonable and that the Investment Manager is not realizing material benefits from economies of scale that would | | | | warrant adjustments to the advisory fee at this time. Also with respect to economies of scale, the Trustees noted that as the Fund’s assets increase over time, the Fund may realize other economies of scale to the extent the increase in assets is proportionally greater than the increase in certain other expenses. The Trustees noted that the Fund’s management fees (which include both the advisory and administration fees) and total expenses as of March 31, 2021 were both higher than the average for the Fund’s Peer Group. The Trustees took into account the fact that, effective May 18, 2021, the Investment Manager has contractually agreed, through February 1, 2023, to limit the Fund’s net annual operating expenses (subject to certain excluded expenses) to 0.93%. The Trustees also noted that, effective May 18, 2021, the Fund’s management fee rate was reduced. The Trustees took into account management’s discussion of the Fund’s expenses and competitiveness with comparably sized funds and select competitors. The Trustees concluded that, in light of the nature, extent and quality of the services provided by the Investment Manager, the foregoing expense limitation and the considerations noted above with respect to the Investment Manager, the Fund’s advisory fees are reasonable. The Trustees also considered information provided by the Investment Manager throughout the previous year related to the benefits of the strategic repositioning of the AMG Funds complex for greater alignment with Affiliated Managers Group, Inc. (“AMG”), in which each fund that was not previously subadvised by an affiliate of AMG (each affiliate of AMG, an “Affiliate” and collectively, “Affiliates”) was transitioned to an AMG Affiliate subadviser. The Trustees considered that the strategic repositioning was expected to create value for the Fund, the other funds in the AMG Funds complex and their shareholders through enhanced resources and competitive fee levels. The Trustees noted the expectations that the changes would result in bringing the full range of AMG’s resources to bear on the growth and success of the AMG Funds, streamlining the lineup of funds in the AMG Funds complex and reducing the number of subadvisers in the AMG Funds complex, significantly reducing strategy overlap and providing more differentiated investment solutions for the AMG Funds complex that are otherwise not available to U.S. retail investors. The Trustees further considered the expectation that the repositioning would bring AMG’s strong partnerships in support of the Fund and the AMG Funds complex as a whole and enable AMG Funds to bring the best capabilities of AMG’s Affiliates to the Fund and the rest of the AMG Funds | | | | complex. The Trustees noted that AMG’s relationship with its Affiliates will also allow the Fund to have greater insight into the Affiliates’ compliance and business platform than is generally possible with third party subadvisers, aiding the ongoing monitoring of subadvisers. * * * * * After consideration of the foregoing, the Trustees also reached the following conclusions (in addition to the conclusions discussed above) regarding the Investment Management Agreement: (a) the Investment Manager has demonstrated that it possesses the capability and resources to perform the duties required of it under the Investment Management Agreement and (b) the Investment Manager maintains an appropriate compliance program. Based on all of the above-mentioned factors and their related conclusions, with no single factor or conclusion being determinative and with each Trustee not necessarily attributing the same weight to each factor, the Trustees concluded that approval of the Investment Management Agreement would be in the best interests of the Fund and its shareholders. Accordingly, on June 24, 2021, the Trustees, and separately a majority of the Independent Trustees, voted to approve the Investment Management Agreement for the Fund. 1 The Trustees determined that the conditions surrounding COVID-19 constituted unforeseen or emergency circumstances and that reliance on the Securities and Exchange Commission’s (“SEC”) exemptive order, which provides relief from the in-person voting requirements of the Investment Company Act of 1940, as amended (the “1940 Act”), in certain circumstances (the “In-Person Relief”), was necessary or appropriate due to the circumstances related to current or potential effects of COVID-19. The Trustees unanimously wished to rely on the In-Person Relief with respect to the approval of those matters on the agenda for the June 24, 2021 meeting that would otherwise require in-person votes under the 1940 Act. See Investment Company Release No. 33897 (June 19, 2020). This exemptive order supersedes, in part, a similar, earlier exemptive order issued by the SEC (Investment Company Release No. 33824 (March 25, 2020)). 2 At a meeting held via telephone and videoconference on March 17-18, 2021, the Board of the Trust, and separately a majority of the Independent Trustees, approved the Subadvisory Agreement with respect to the Fund (the “Subadvisory Agreement”). The Subadvisory Agreement was subsequently approved by the Fund’s shareholders at a special meeting held on May 18, 2021, for an initial two-year period. |
| | | | | | | | |
29
| | |
| | | Funds Liquidity Risk Management Program |
| | | |
| | | |
| | | | | | | | |
The Securities and Exchange Commission (the “SEC”) adopted Rule 22e-4 under the Investment Company Act of 1940, as amended (the “Liquidity Rule”), to promote effective liquidity risk management throughout the open-end investment company industry, thereby reducing the risk that a fund will be unable to meet its redemption obligations and mitigating dilution of the interests of fund shareholders. The AMG Funds Family of Funds (each a “Fund,” and collectively, the “Funds”) have adopted and implemented a Liquidity Risk Management Program (the “Program”) as required by the Liquidity Rule. The Program is reasonably designed to assess and manage each Fund’s liquidity risk, taking into consideration the Fund’s investment strategy and the liquidity of its portfolio investments during normal and reasonably foreseeable stressed conditions, its short and long-term cash flow projections, and its holdings of cash and cash equivalents, as well as borrowing arrangements and other funding sources, including access to the Funds’ credit facility. Under the Liquidity Rule, each liquidity classification category (highly liquid, moderately liquid, less liquid and illiquid) is defined with respect to the time it is reasonably expected to take to convert the investment to cash (or sell or dispose of the investment) in current market conditions without significantly changing the market value of the investment. The Funds’ Board of Trustees (the “Board”) appointed AMG Funds, LLC (“AMGF”) as the Program administrator. AMGF formed a Liquidity Risk Management Committee (“LRMC”), which includes | | | | members of various departments across AMGF, including Legal, Compliance, Mutual Fund Services, Investment Research and Product Analysis & Operations and, as needed, other representatives of AMGF and/or representatives of the subadvisers to the Funds. The LRMC meets on a periodic basis, no less frequently than monthly. The LRMC is responsible for the Program’s administration and oversight and for reporting to the Board on at least an annual basis regarding the Program’s operation and effectiveness. At a meeting of the Board held on March 17-18, 2021, the Board received a report from the LRMC regarding the design and operational effectiveness of the Program for the period January 1, 2020 through December 31, 2020 (the “Program Reporting Period”). The Program complied with the key factors for consideration under the Liquidity Rule for assessing, managing and periodically reviewing a Fund’s liquidity risk, as follows: A. The Fund’s investment strategy and liquidity of portfolio investments during both normal and reasonably foreseeable stressed conditions: During the Program Reporting Period, the LRMC reviewed whether each Fund’s investment strategy and liquidity of portfolio investments during both normal and reasonably foreseeable stressed conditions is appropriate for an open-end fund structure. The LRMC also factored a Fund’s concentration in an issuer into the liquidity classification methodology by taking issuer position sizes into account. | | | | B. Short-term and long-term cash flow projections during both normal and reasonably foreseeable stressed conditions: During the Program Reporting Period, the LRMC reviewed historical net redemption activity and used this information as a component to establish each Fund’s reasonably anticipated trading size. The Funds maintain an in-kind redemption policy, which may be utilized to meet larger redemption requests, when appropriate. The LRMC may also take into consideration a Fund’s shareholder ownership concentration, a Fund’s distribution channels, and the degree of certainty associated with a Fund’s short-term and long-term cash flow projections. C. Holdings of cash and cash equivalents, as well as borrowing arrangements: The LRMC considered the terms of the credit facilities available to the Funds. The report concluded that, based upon the review of the Program, using resources and methodologies that AMGF considers reasonable, AMGF believes that the Program and Funds’ Liquidity Risk Management Policies and Procedures are adequate, effective, and reasonably designed to effectively manage the Funds’ liquidity risk. There can be no assurance that the Program will achieve its objectives in the future. Please refer to each Fund’s prospectus or statement of additional information for more information regarding a Fund’s exposure to liquidity risk and other principal risks to which an investment in a Fund may be subject. |
| | | | | | | | |
30
THIS PAGE INTENTIONALLY LEFT BLANK
THIS PAGE INTENTIONALLY LEFT BLANK
|
|
|
|
| | | | | | | | |
INVESTMENT MANAGER AND ADMINISTRATOR AMG Funds LLC 680 Washington Blvd., Suite 500 Stamford, CT 06901 800.548.4539 DISTRIBUTOR AMG Distributors, Inc. 680 Washington Blvd., Suite 500 Stamford, CT 06901 800.548.4539 SUBADVISER Boston Common Asset Management, LLC 200 State Street 7th Floor Boston, MA 02109 CUSTODIAN The Bank of New York Mellon Mutual Funds Custody 6023 Airport Road Oriskany, NY 13424 | | | | LEGAL COUNSEL Ropes & Gray LLP Prudential Tower, 800 Boylston Street Boston, MA 02199-3600 TRANSFER AGENT BNY Mellon Investment Servicing (US) Inc. Attn: AMG Funds 4400 Computer Drive Westborough, MA 01581 800.548.4539 | | | | This report is prepared for the Fund’s shareholders. It is authorized for distribution to prospective investors only when preceded or accompanied by an effective prospectus. To receive a free copy of the prospectus or Statement of Additional Information, which includes additional information about Fund Trustees, please contact us by calling 800.548.4539. Distributed by AMG Distributors, Inc., member FINRA/SIPC. Current net asset values per share for the Fund are available on the Fund’s website at amgfunds.com. A description of the policies and procedures the Fund uses to vote its proxies is available: (i) without charge, upon request, by calling 800.548.4539, or (ii) on the Securities and Exchange Commission’s (SEC) website at sec.gov. For information regarding the Fund’s proxy voting record for the 12-month period ended June 30, call 800.548.4539 or visit the SEC website at sec.gov. The Fund files its complete schedule of portfolio holdings with the SEC for the first and third quarters of each fiscal year as an exhibit to their reports on Form N-PORT. The Fund’s portfolio holdings on Form N-PORT are available on the SEC’s website at sec.gov and the Fund’s website at amgfunds.com. To review a complete list of the Fund’s portfolio holdings, or to view the most recent semiannual report or annual report, please visit amgfunds.com. |
| | | | | | | | | |
|
|
|
|
| | | | | | | | |
BALANCED FUNDS AMG GW&K Global Allocation GW&K Investment Management, LLC AMG FQ Global Risk-Balanced First Quadrant, L.P. EQUITY FUNDS AMG Beutel Goodman International Equity Beutel, Goodman & Company Ltd. AMG Boston Common Global Impact Boston Common Asset Management, LLC AMG Managers CenterSquare Real Estate CenterSquare Investment Management LLC AMG Frontier Small Cap Growth Frontier Capital Management Co., LLC AMG GW&K Small Cap Core AMG GW&K Small Cap Value AMG GW&K Small/Mid Cap AMG GW&K Small/Mid Cap Growth AMG GW&K Emerging Markets Equity AMG GW&K Emerging Wealth Equity AMG GW&K International Small Cap GW&K Investment Management, LLC AMG Montrusco Bolton Large Cap Growth Montrusco Bolton Investments, Inc. | | | | AMG Renaissance Large Cap Growth The Renaissance Group LLC AMG River Road Dividend All Cap Value AMG River Road Focused Absolute Value AMG River Road International Value Equity AMG River Road Large Cap Value Select AMG River Road Mid Cap Value AMG River Road Small-Mid Cap Value AMG River Road Small Cap Value River Road Asset Management, LLC AMG TimesSquare Emerging Markets Small Cap AMG TimesSquare Global Small Cap AMG TimesSquare International Small Cap AMG TimesSquare Mid Cap Growth AMG TimesSquare Small Cap Growth TimesSquare Capital Management, LLC AMG Veritas Asia Pacific AMG Veritas China AMG Veritas Global Focus AMG Veritas Global Real Return Veritas Asset Management LLP AMG Yacktman AMG Yacktman Focused AMG Yacktman Global AMG Yacktman Special Opportunities Yacktman Asset Management LP | | | | FIXED INCOME FUNDS AMG Beutel Goodman Core Plus Bond Beutel, Goodman & Company Ltd. AMG GW&K Core Bond ESG AMG GW&K Enhanced Core Bond ESG AMG GW&K ESG Bond AMG GW&K High Income AMG GW&K Municipal Bond AMG GW&K Municipal Enhanced Yield GW&K Investment Management, LLC |
| | | | | | | | | |
| | | | | | | | | |
| | | | | | | | | |
| | | | | | | | | |
| | | | | | | | | |
| | | | | | | | | |
| | | | | | | | | |
| | | | | | | | | |
| | | | | | | | | |
| | | | | | | | | |
| | | | |
| amgfunds.com | | | | 093021 AR074 |
| | |
| | | ANNUAL REPORT |
| | | | |
| | | | | AMG Funds September 30, 2021 
AMG Veritas Global Real Return Fund (formerly AMG Managers Brandywine Blue Fund) |
| | | | | |
| | | | | Class I: BLUEX |
| | | | | |
| | | | |
| amgfunds.com | | | | 093021 AR073 |
| | |
| | | AMG Funds Annual Report — September 30, 2021 |
| | | | | | |
| | | | | | | |
| | | TABLE OF CONTENTS | | PAGE | |
| | | | |
| | | |
| | | LETTER TO SHAREHOLDERS | | | 2 | |
| | | |
| | | ABOUT YOUR FUND’S EXPENSES | | | 3 | |
| | | |
| | | PORTFOLIO MANAGER’S COMMENTS, FUND SNAPSHOTS AND SCHEDULE OF PORTFOLIO INVESTMENTS | | | 4 | |
| | | |
| | | FINANCIAL STATEMENTS | | | | |
| | | |
| | | Statement of Assets and Liabilities | | | 13 | |
| | | |
| | | Balance sheet, net asset value (NAV) per share computations and cumulative distributable earnings (loss) | | | | |
| | | |
| | | Statement of Operations | | | 14 | |
| | | |
| | | Detail of sources of income, expenses, and realized and unrealized gains (losses) during the fiscal year | | | | |
| | | |
| | | Statements of Changes in Net Assets | | | 15 | |
| | | |
| | | Detail of changes in assets for the past two fiscal years | | | | |
| | | |
| | | Financial Highlights | | | 16 | |
| | | |
| | | Historical net asset values per share, distributions, total returns, income and expense ratios, turnover ratios and net assets | | | | |
| | | |
| | | Notes to Financial Statements | | | 17 | |
| | | |
| | | Accounting and distribution policies, details of agreements and transactions with Fund management and affiliates, and descriptions of certain investment risks | | | | |
| | | |
| | | REPORT OF INDEPENDENT REGISTERED PUBLIC ACCOUNTING FIRM | | | 23 | |
| | | |
| | | OTHER INFORMATION | | | 24 | |
| | | |
| | | TRUSTEES AND OFFICERS | | | 25 | |
| | | |
| | | ANNUAL RENEWAL OF INVESTMENT MANAGEMENT AND SUBADVISORY AGREEMENTS | | | 28 | |
| | | |
| | | FUNDS LIQUIDITY RISK MANAGEMENT PROGRAM | | | 30 | |
| | | |
| | | | | | | |
| | | | |
Nothing contained herein is to be considered an offer, sale or solicitation of an offer to buy shares of any series of the AMG Funds Family of Funds. Such offering is made only by prospectus, which includes details as to offering price and other material information. | | | | |
| | |
| | Letter to Shareholders |
Dear Shareholder:
The fiscal year ended September 30, 2021, was marked by the continued extraordinary recovery amid the unprecedented global effort to stop the COVID-19 pandemic. Equities rallied to new record highs amid better-than-expected corporate earnings, colossal fiscal and monetary stimulus programs, and an improving economic backdrop. Since the market bottom on March 23, 2020, the S&P 500® Index has gained over 97%. Businesses and consumers contended with disrupted supply chains and rising prices on a wide range of goods such as lumber and gasoline, and outbreaks of the Delta variant kept the world on edge. The fiscal year ended with slightly elevated volatility as investors assessed rising inflation, more hawkish global central bank policies, and a major regulatory crackdown in China.
The S&P 500® gained 30.00% during the fiscal year and all sectors produced double-digit returns, but there was very wide dispersion in performance. Energy and financials led the market with returns of 83.05% and 59.13%, respectively. On the other hand, utilities and consumer staples lagged with returns of 10.97% and 11.34%, respectively. Value stocks returned to favor after a long stretch of underperformance compared to Growth stocks. The Russell 1000® Value Index returned 35.01% compared to the 27.32% return for the Russell 1000® Growth Index. Small cap stocks outperformed as the Russell 2000® Index experienced its best quarter (fourth quarter 2020) on record. Within small caps, the Value-Growth disparity was much more pronounced as the Russell 2000® Value Index returned 63.92% compared to 33.27% for the Russell 2000® Growth Index. Outside the U.S., foreign developed markets outpaced emerging markets with a 25.73% return for the MSCI EAFE Index compared to an 18.20% return for the MSCI Emerging Markets Index.
Interest rates climbed from near-historic lows as the vaccine rollout initiated a return to normalcy and the economic outlook improved. The 10-year Treasury yield rose 80 basis points to 1.48% and ended the fiscal year not far off its post-pandemic high. The Bloomberg U.S. Aggregate Bond Index, a broad measure of U.S. bond market performance, lost -0.90% over the period. Healthy risk appetite drove credit spreads tighter and helped investment-grade corporate bonds produce a modestly positive 1.74% return. Riskier high-yield bonds outperformed the investment-grade market with an 11.28% return as measured by the return of the Bloomberg U.S. Corporate High Yield Bond Index. Municipal bonds benefited from a strong technical backdrop and drove a 2.63% return for the Bloomberg Municipal Bond Index.
AMG Funds appreciates the privilege of providing investment tools to you and your clients. Our foremost goal is to provide investment solutions that help our shareholders successfully reach their long-term investment goals. AMG Funds provides access to a distinctive array of actively managed return-oriented investment strategies. We thank you for your continued confidence and investment in AMG Funds. You can rest assured that under all market conditions our team is focused on delivering excellent investment management services for your benefit.
Respectfully,
Keitha Kinne
President
AMG Funds
| | | | | | | | | | | | | | |
| Average Annual Total Returns | | Periods ended
September 30, 2021* | |
| | | | | |
| Stocks: | | | | 1 Year | | | 3 Years | | | 5 Years | |
| | | | |
Large Cap | | (S&P 500® Index) | | | 30.00% | | | | 15.99% | | | | 16.90% | |
| | | | |
Small Cap | | (Russell 2000® Index) | | | 47.68% | | | | 10.54% | | | | 13.45% | |
| | | | |
International | | (MSCI All Country World Index ex USA) | | | 23.92% | | | | 8.03% | | | | 8.94% | |
| | | | | |
| Bonds: | | | | | | | | | | | |
| | | | |
Investment Grade | | (Bloomberg U.S. Aggregate Bond Index) | | | -0.90% | | | | 5.36% | | | | 2.94% | |
| | | | |
High Yield | | (Bloomberg U.S. Corporate High Yield Bond Index) | | | 11.28% | | | | 6.91% | | | | 6.52% | |
| | | | |
Tax-exempt | | (Bloomberg Municipal Bond Index) | | | 2.63% | | | | 5.06% | | | | 3.26% | |
| | | | |
Treasury Bills | | (ICE BofAML U.S. 6-Month Treasury Bill Index) | | | 0.13% | | | | 1.43% | | | | 1.34% | |
*Source: FactSet. Past performance is no guarantee of future results.
2
| | |
| | | About Your Fund’s Expenses |
| | | |
| | | |
| | | | | | | | |
As a shareholder of a Fund, you may incur two types of costs: (1) transaction costs, which may include sales charges (loads) on purchase payments; redemption fees; and exchange fees; and (2) ongoing costs, including management fees; distribution (12b-1) fees; and other Fund expenses. This example is intended to help you understand your ongoing costs (in dollars) of investing in the Fund and to compare these costs with the ongoing costs of investing in other mutual funds. The example is based on $1,000 invested at the beginning of the period and held for the entire period as indicated below. ACTUAL EXPENSES The first line of the following table provides information about the actual account values and | | | | actual expenses. You may use the information in this line, together with the amount you invested, to estimate the expenses that you paid over the period. Simply divide your account value by $1,000 (for example, an $8,600 account value divided by $1,000 = 8.6), then multiply the result by the number in the first line under the heading entitled “Expenses Paid During Period” to estimate the expenses you paid on your account during this period. HYPOTHETICAL EXAMPLE FOR COMPARISON PURPOSES The second line of the following table provides information about hypothetical account values and hypothetical expenses based on the Fund’s actual expense ratio and an assumed annual rate of return of 5% before expenses, which is not the Fund’s | | | | actual return. The hypothetical account values and expenses may not be used to estimate the actual ending account balance or expenses you paid for the period. You may use this information to compare the ongoing costs of investing in the Fund and other funds by comparing this 5% hypothetical example with the 5% hypothetical examples that appear in the shareholder reports of other funds. Please note that the expenses shown in the table are meant to highlight your ongoing costs only and do not reflect any transactional costs, such as sales charges (loads), redemption fees, or exchange fees. Therefore, the second line of the table is useful in comparing ongoing costs only, and will not help you determine the relative total costs of owning different funds. |
| | | | | | | | |
| | | | | | | | |
Six Months Ended September 30, 2021 | | Expense
Ratio for
the Period | | Beginning
Account
Value
04/01/21 | | Ending
Account
Value
09/30/21 | | Expenses
Paid
During
the Period* |
AMG Veritas Global Real Return Fund |
|
Based on Actual Fund Return |
| | | | |
Class I | | 1.16% | | $1,000 | | $1,050 | | $5.96 |
|
Based on Hypothetical 5% Annual Return |
| | | | |
Class I | | 1.16% | | $1,000 | | $1,019 | | $5.87 |
| | * | Expenses are equal to the Fund’s annualized expense ratio multiplied by the average account value over the period, multiplied by the number of days in the most recent fiscal half-year (183), then divided by 365. | |
3
| | |
| | | AMG Veritas Global Real Return Fund Portfolio Manager’s Comments (unaudited) |
| | | |
| | | |
| | | | | | | | |
For the 12 months ended September 30, 2021, the AMG Veritas Global Real Return Fund (formerly AMG Managers Brandywine Blue Fund) (the “Fund”) returned 19.79%, compared with the 5.19% return for the Bloomberg U.S. Treasury Inflation-Linked Bond Index, and the 27.32% return for the Russell 1000® Growth Index, Fund’s former benchmark. On March 19, 2021, the Fund’s Board of Trustees approved the appointment of Veritas Asset Management LLP (“Veritas”) as interim subadviser to the Fund. On May 18, 2021, the Fund’s shareholders approved the appointment of Veritas as the subadviser to the Fund. Also approved was the change in the Fund’s name and its benchmark. The commentary below reflects Veritas’ tenure as subadviser to the Fund. Market Overview The hot arena for investing continued to be in growth companies with a huge pool of money chasing high-growth assets. With policy makers encouraging borrowing and risk taking, capital has rarely (if ever) been so cheap and available and consequently the competition to buy fast-growing companies is intense. Private equity, venture capital, public equity funds, and retail investors are all clamoring to buy these fast-growth businesses at ever-increasing valuation multiples. For many of these “investors” presumably the intention is to sell to someone else at an even higher valuation multiple. In addition to these momentum investors there are a large proportion of funds that are completely value agnostic, with one recent estimate putting fundamental long only and fundamental hedge funds at only 15% of total volume in the U.S. equity markets. In the private markets we have seen a number of transactions where the value placed on a company expands multiple times in a few months, not driven by better operating performance but by an expansion of the valuation multiple ascribed to the business. While perhaps most obvious in the private markets, this phenomenon is also visible in public markets. One deliberate consequence of our investment philosophy and process is that we are not drawn in to investing in the latest fashionable areas. In the moment this can feel as though we are missing out on the party when these areas become substantial parts of the equity market and are driving market returns. However, unless both the nature of capital markets and the nature of human emotions has fundamentally changed, we think that, like all previous investing fads, the current one will end badly for those heavily exposed. | | | | In normal times, interest rates are set by market forces and represent the price of money, which is then used to measure investment risk and determine the present value of estimated future cash flows. However, since the global financial crisis this price has become distorted as policy makers around the world have held their collective thumbs on the monetary scales to keep the cost of money artificially low. As these policy makers are well aware, interest rates power is everything in the financial world. Holding interest rates artificially low undoubtedly leads to excessive risk-taking as investors who previously relied on safe interest income need to invest in higher risk assets to maintain the same level of return. After more than a decade of policy makers determining the price of money (which they have effectively set at zero) it seems that investors have become increasingly disoriented with many (high growth) companies’ valuations becoming dissociated from reality. One indication of this is how many investors now value companies not based on fundamentals but instead on “total addressable market” and “pro forma” long-run margin estimates. What they seem to miss in this work is how exceptional (based on historical examples) these companies would be if their forecasts prove correct. This is particularly the case in technological areas where rapid development increases the risk of a better solution being adopted and the existing technology thereby facing obsolescence within the long time horizon demanded by extreme valuations. Performance Review For the period from September 30, 2020 through March 19, 2021, the Fund modestly outperformed the legacy Russell 1000® Growth Index. Technology holdings were the largest percentage of the Fund’s assets and were also the largest contributors to the Fund’s relative performance. For the remainder of the year ending September 30, 2021, the Fund performed in line with its new benchmark, the Bloomberg U.S. Treasury Inflation-Linked Bond Index. The Fund has a mechanistic approach to the amount of index futures to use at a given point in time, based on the average valuation we observe of our “Veritas Investment Universe” of approximately 250 high-quality companies we would like to invest in at the right price. These are a collection of companies that have gone through our deep-dive investment process to assess whether they have the characteristics we would like to invest in. Given that this is 250 companies out of a potential 4,000 or so, the list does not represent an index. That said, no | | | | matter how good the companies are, their share prices will not operate in a vacuum and so will move in the general direction of markets, meaning that as markets move higher the average valuation of the Universe List will move higher and the amount of index future the Fund holds will increase to offer more protection against a potential pullback in markets. However, this will act as an increasing anchor drag if markets continue to rise as has been the case during the six months to the end of September. During the period, the Fund’s exposure in index futures have increased with most of this increase being in the S&P 500® Index future, as this is where markets have performed most strongly. As a consequence of this, the Fund’s net market exposure has reduced from 48.1% to 37.4%, with the impact that the index futures have drawn -2.38% from absolute performance. This means the long book has returned 7.39% with index futures and cash drawing -2.84%, giving the overall return of 4.55%. Turning to the long book, the following details selected biggest contributors and detractors. Starting with contributors. Alphabet continued to perform well over the period. Google’s sprawling ecosystem includes the world’s most popular online search engine, mobile operating system (Android), streaming video site (YouTube), web browser (Chrome), and email platform (Gmail). These platforms all support Google’s core advertising business, which sells search, display, and video ads across its platforms. According to eMarketer, Google will likely account for 28.6% of all digital ad spending worldwide this year. Additionally, Google Cloud’s revenues surged 46% when last reported, as the usage of its Cloud services accelerated throughout the pandemic. While Google Cloud is not profitable yet, and it still ranks a distant third place in the Cloud infrastructure market, it continues to expand and secure a growing list of major partners, including Target, Home Depot, and Twitter. Google Cloud’s profitability should improve as it expands, but it can subsidize its growth with its higher-margin advertising business until that happens. There have been some concerns about valuation should interest rates rise, but any pullback may make the shares attractive given the current 26 times forward multiple. Charter Communications, rose over 20% during the period, as the company benefited from an increase in broadband subscribers. Our thesis was (and remains) very simple – cable companies invested huge amounts in connecting homes with |
4
| | |
| | | AMG Veritas Global Real Return Fund Portfolio Manager’s Comments (continued) |
| | | |
| | | |
| | | | | | | | |
coaxial cable in the 1990s and 2000s that has serendipitously proven to be an excellent infrastructure for distributing broadband. This puts the cable companies in a competitively advantaged position as the investment in the infrastructure has largely been made (and fully depreciated) and the growth in broadband is therefore a new, large, and incremental revenue stream. To meaningfully compete against the cable companies any competitor would need to invest in fiber optic cable to every house, which is hugely expensive. Furthermore, with (largely) cheap software upgrades the cable companies’ coaxial cable can be upgraded such that upload and download speeds can be comparable to fiber optic cable. While the cable companies were losing video subscribers (to the likes of Netflix) they were gaining more broadband subscribers. Given that there is no content to pay for, margin is much higher. As we moved through the pandemic, Charter has benefited from the greater demand for fast internet connection. Looking forward, we remain confident in the opportunities still ahead for Charter. Broadband growth will continue with the company having only around 50% of houses subscribed to its service in the areas where it operates. Given their economic lead (the infrastructure is already there) and the (medium-term) pathway to deliver 10Gb symmetrical service offering, we think they will continue to win customers from all but fiber optic cable, and even here they are well positioned given the infrastructure cost to lay fiber. Catalent is a contract drug manufacturer that has been involved in the manufacturing of COVID-19 vaccines, including those from Moderna, AstraZeneca, and Johnson & Johnson. As one of the world’s largest drug manufacturers, it makes 73 billion doses of drug and health products annually, with 83 of the world’s top 100 drug companies as its customers. Catalent spent much of the pandemic scaling its capacity to meet the massive demand for the production of COVID vaccines and treatments (it’s on track to deliver over a billion vaccine doses this year alone) while also continuing to manufacture a broad range of other medicines (including over 130 products in its development pipeline). This demand was highlighted in the period under review when it reported revenue rising 26% to $1.2 billion, while earnings per share jumped 29% to $1.16. Adjusted EBITDA came in at record levels, driven by “robust growth” in its biologics segment, which accounted for 48% of net sales. Catalent has made a number of recent acquisitions to further its position in growth areas, | | | | buying Juniper Pharmaceuticals, Paragon Bioservices, and MaSTherCell in a bid to cement its position as a leading biologics and gene therapy manufacturer. During the period under review it acquired Bettera Holdings to expand its manufacturing capabilities for vitamins and supplements for $1 billion. Bettera owns such candy brands as Jolly Rancher, Whoppers, and Milk Duds but more importantly is also a manufacturer in the gummi, soft chew, and lozenge segments of the nutritional market. Chewable forms of vitamins, such as gummies, are gaining popularity, especially among people who find swallowing pills difficult, and the market is expected to reach $9.3 billion by 2026, according to an independent report by Allied Market Research. The current market is less than $6 billion. The acquisition will enable Catalent to expand its current consumer health technology platform with a wider range of technologies and ready-to-market product libraries, as well as a variety of packaging options to meet customers’ branding needs. Given that Catalent is the leading global innovator of softgel and oral technologies, the acquisition of Bettera will allow the company to significantly accelerate the growth of its consumer health business. Turning to detractors, the largest detractor over the period was Alibaba. There has been an onslaught of regulatory measures coming out of China, not solely aimed at Alibaba and the tech sector, but increasingly more broad-reaching. President Xiaoping promoted the ideal of letting some “get rich first” before allowing others to catch up. President Xi is now looking to focus on this catch-up phase with “common prosperity” for all. The Chinese Central Financial and Economic Affairs Commission, chaired by Xi, has emphasized the need to “regulate excessively high incomes and encourage high-income groups and enterprises to return more to society.” In fact, Xi has mentioned the phrase “common prosperity” over 60 times this year, and while the focus has largely been on e-commerce and greater competition, there is increasing emphasis on fairer employment rights (health plans, pensions, pay, etc.), with clear implications for those sectors seen as discriminating against the poorer in society, including online education, property, and healthcare (drug prices). Events that have taken place against this backdrop include the suspension of the Ant Group IPO last November after Ant’s founder Jack Ma criticized the country’s banking system (Alibaba owns a third of Ant and uses its Alipay platform to facilitate customers’ online transactions), China’s State Administration for Market Regulation launching | | | | an antitrust probe into Alibaba’s e-commerce business (the company was eventually fined 18.23 billion yuan ($2.82 billion) and its e-commerce business forced to eliminate its exclusive deals with merchants, which impacted all the large e-commerce firms, and Alibaba missing its revenue forecast, raising fears that the mounting list of new government regulations was taking its toll. This was followed by an abrupt decision by Alibaba (again not alone) to invest 100 billion yuan ($15.5 billion) into China’s “common prosperity” initiatives for improving social equality over the next five years, which has raised even more questions about its growth and subservience to the Chinese government. Additionally, they are being encouraged to sell the 5% stake in Mango Excellent Media Co., a TV shopping and entertainment network based in the central province of Hunan, only nine months after buying the stake. On top of this we have had the Didi IPO reprimand, which has led to claims that China plans to propose rules that would stop companies from going public in the U.S. if they have large amounts of sensitive consumer data (and thus questioning the Variable Interest Entity (“VIE”) structure). Meanwhile, China launched an extensive overhaul of its online education sector, posted notices that online food platforms must respect the rights of delivery staff and ensure that those workers earn at least the local minimum income, and China’s government quietly appointed a director to the Board of ByteDance Ltd.’s key domestic subsidiary. The government has proposed to stop treating some of its businesses as so-called key software enterprises (“KSE”), a designation that conferred a preferential 10% tax rate, meaning tax rates will rise for the e-commerce companies, and on top of that a U.S. law that could delist shares of Chinese companies that don’t comply with new auditing rules within the next three years. Against this feed of perceived negative news, Alibaba shares have been weak, as has the wider Chinese market. Setting aside that some of the actions of the Chinese government might be seen as fair and responsible, the short-term landscape has unsettled investors’ views on the likes of Alibaba. It’s highly probable the company will continue to play a pivotal role in supporting growth within the Chinese economy and benefiting from digitalization in all aspects of life. One area likely to grow significantly is cloud infrastructure, which is still in an early stage in China and an area in which Alibaba not only exceeds but is on the cusp of turning profitable. For context, cloud is the most profitable business segment at Amazon and helped transform Microsoft from a Windows business. Alibaba currently trades at less than 15x earnings, |
5
| | |
| | | AMG Veritas Global Real Return Fund Portfolio Manager’s Comments (continued) |
| | | |
| | | |
| | | | | | | | |
the lowest in its history as a public listed company, and management is raising the size of share buybacks. Arguably, the barriers to entry have been raised and new entrants are likely to spend less amid the current regulatory environment. Alibaba will keep investing and pursue multi-app strategies that will further drive the user base across multiple initiatives that are in the early phase of growth (online bargain shopping platform Taobao Deals and a marketplace for secondhand goods called Idle Fish). Canadian Pacific Railway has won a takeover battle for Kansas City Southern (“KCS”) after Canadian National Railway (“CNR”) declined to increase its offer, claiming an asset that would create the first railroad spanning the U.S., Canada, and Mexico. Given the recent trade deal between the three countries, the onshoring of companies back to the U.S. against trade tensions with China, and the positive solution trains offer companies trying to lower their carbon footprint, the deal should be additive in the longer term. KCS terminated its $30 billion agreement with CNR and agreed to Canadian Pacific’s (“CP”) $27 billion merger proposal. The turning point in the deal was a ruling by the regulator, the Surface Transportation Board (“STB”), which decided unanimously against CNR making use of a voting trust, which CP had already been granted. The STB essentially prohibited large-scale railroad consolidation in 2001, and CP and KCS knew going in it would likely take until mid-2022 to win approval for this combination. That’s a long time for KCS shareholders to be left waiting for an uncertain payout and could be enough to discourage any merger attempt. CP, mindful of the long wait, structured the deal in such a way as to alleviate most of the risk for KCS holders. CP proposed establishing an independent voting trust that will acquire the shares once KCS holders approve the deal, and before regulators have sounded off. Holders of KCS shares would get their cash as outlined in the merger agreement, even though CP would not yet officially own KCS. The STB has already granted CP permission to set up a trust that would | | | | allow KCS shareholders to get paid even before the deal wins approval, eliminating the uncertainty. The STB has also said that due to CP and KCS both being smaller railroads, they had only to prove that their deal doesn’t harm competition. CNR, by contrast, would have any bid judged under a higher standard that requires it to prove its proposal would benefit shipping customers. The STB denied CNR permission to set up a voting trust and CNR has walked away from the potential merger. There is still an element of uncertainty as President Biden’s executive order from July is aimed at anti-competition maneuvers in the railroad industry, among others. The STB must still approve the KCS and CP deal with this new scrutiny in the backdrop. Regulators in Mexico and shareholders must approve it as well. This may explain the subdued share price, despite the positive outcome and results that beat expectations coupled with reiteration of full-year guidance of double-digit EPS growth. Safran reported revenue and earnings that fell in the first half, as expected from an aero-engine manufacturer, but it expects a better second half, and confirmed its 2021 outlook for sales and profitability. Adjusted recurring operating income came to EUR 659 million ($778.8 million) in the period, down -30% on year. Adjusted revenue came to EUR 6.88 billion, down -22% from the previous year. Much of Safran’s revenue is made up of servicing and parts, which are charged on a per-kilometer-flown basis. As such, its shorter-term figures are largely determined by the number of planes flying and distance flown. In China, for example, after being over 2019 levels between March and May and then down in June, flights are now back at 2019 levels. In the U.S. they are -15% below 2019 levels, and Europe is at -35%, having been at -70% in May. APAC ex China is still the most impacted area at -70% to pre-pandemic levels. Safran owns an interiors business, supplying, among other things, the seating. Safran Seats business saw a strong decline in business class programs as airlines weigh whether business class demand will return to pre-pandemic levels. In terms of engines deliveries, | | | | the combined shipment of CFM56 and LEAP engines reached 448 units in H1 2021 versus 534 units in H1 2020 (down -16%). The company has a backlog of more than 9,300 engines as of the end of June 2021 and 60% of the popular Airbus A320neo family. During the period, Indigo selected the LEAP engines for its fleet of 310 new Airbus A320 planes with a multi-year service agreement. Safran confirms its full-year 2021 outlook and its underlying assumptions in a context in which the level of uncertainty over the timing of recovery continues to prevail. A delay in the pace of civil aftermarket recovery during the second half of the year constitutes an element of risk to this outlook. Shares performed well in September as more routes were opening up. Safran expects adjusted recurring operating margin to increase above 100 bps, at least a 300 bp improvement versus H2 2020, and free cash flow generation to increase above 2020 levels. Outlook The continued focus is on ensuring that the portfolio is the best quality it can be in terms of characteristics. There is a mix of higher growth companies like Alphabet, Amazon, and Facebook, coupled with companies like Charter Communications, Canadian Pacific Railway, Airbus and BAE, which are slower growth. What they have in common is high return on capital (“ROC”) and very high barriers to entry to ensure they are difficult to compete with. Given either low leverage or high cash generation, we believe the Fund is well positioned to weather more difficult environments that are likely over the next few years. The Fund, as always, looks to add long-term value by protecting and growing capital in real terms. This commentary reflects the viewpoints of Veritas Asset Management LLP as of September 30, 2021 and is not intended as a forecast or guarantee of future results. |
6
| | |
| | | AMG Veritas Global Real Return Fund Portfolio Manager’s Comments (continued) |
| | | |
| | | |
CUMULATIVE TOTAL RETURN PERFORMANCE
AMG Veritas Global Real Return Fund’s cumulative total return is based on the daily change in net asset value (NAV), and assumes that all dividends and distributions were reinvested. The graph compares a hypothetical $10,000 investment made in the AMG Veritas Global Real Return Fund’s Class I shares on September 30, 2011, to a $10,000 investment made in the Bloomberg U.S. Treasury Inflation-Linked Bond Index and Russell 1000® Growth Index for the same time period. The graph and table do not reflect the deduction of taxes that a shareholder would pay on a Fund distribution or redemption of shares. The listed returns for the Fund are net of expenses and the returns for the index exclude expenses.
The table below shows the average annual total returns for the AMG Veritas Global Real Return Fund and the Bloomberg U.S. Treasury Inflation-Linked Bond Index and Russell 1000® Growth Index for the same time periods ended September 30, 2021.
| | | | | | | | | | | | |
| Average Annual Total Returns1 | | One
Year | | | Five
Years | | | Ten
Years | |
| | | |
AMG Veritas Global Real Return Fund2, 3, 4, 5, 6, 7, 8, 9, 10, 11, 12, 13, 14, 15, 16, 17, 18, 19 | | | | | | | | | | | | |
| | | |
Class I | | | 19.79 | % | | | 18.62 | % | | | 14.98 | % |
| | | |
Bloomberg U.S. Treasury Inflation-Linked Bond Index20 | | | 5.19 | % | | | 4.34 | % | | | 3.12 | % |
| | | |
Russell 1000® Growth Index21 | | | 27.32 | % | | | 22.84 | % | | | 19.68 | % |
The performance data shown represents past performance. Past performance is not a guarantee of future results. Current performance may be lower or higher than the performance data quoted. The investment return and principal value of an investment will fluctuate so that an investor’s shares, when redeemed, may be worth more or less than their original cost.
Investors should carefully consider the Fund’s investment objectives, risks, charges and expenses before investing. For performance information through the most recent month end, current net asset values per share for the Fund and other information, please call 800.548.4539 or visit our website at amgfunds.com for a free prospectus. Read it carefully before investing or sending money.
Distributed by AMG Distributors, Inc., member FINRA/SIPC.
| 1 | Total return equals income yield plus share price change and assumes reinvestment of all dividends and capital gain distributions. Returns are net of fees and may reflect offsets of Fund expenses as described in the prospectus. No adjustment has been made for taxes payable by shareholders on their reinvested dividends and capital gain distributions. Returns for periods greater than one year are annualized. The listed returns on the Fund are net of expenses and based on the published NAV as of September 30, 2021. All returns are in U.S. dollars ($). |
| | |
| | | 2 As of March 19, 2021, the Fund’s subadvisor was changed to Veritas Asset Management LLP. Prior to March 19, 2021, the Fund was known as the AMG Managers Brandywine Blue Fund, and had different principal investment strategies and corresponding risks. Performance shown for periods prior to March 19, 2021, reflects the performance and investment strategies of the Fund’s previous subadvisor, Friess Associates, LLC and Friess Associates of Delaware, LLC. The Fund’s past performance would have been different if the Fund were managed by the current subadvisor and strategy, and the Fund’s prior performance record might be less pertinent for investors considering whether to purchase shares of the fund. 3 Active and frequent trading of a fund may result in higher transaction costs and increased tax liability. 4 A greater percentage of the Fund’s holdings may be focused in a smaller number of securities which may place the Fund at greater risk than a more diversified fund. 5 Investments in international securities are subject to certain risks of overseas investing including currency fluctuations and changes in political and economic conditions, which could result in significant market fluctuations. These risks are magnified in emerging markets. 6 The Fund is subject to currency risk resulting from fluctuations in exchange rates that may affect the total loss or gain on a non-U.S. Dollar investment when converted back to U.S. Dollars. 7 Market prices of investments held by the Fund may fall rapidly or unpredictably due to a variety of economic or political factors, market conditions, disasters or public health issues, or in response to events that affect particular industries or companies. 8 The issuers of bonds or other debt securities or a counterparty to a derivatives contract may be unable or unwilling to make interest, principal or settlement payments. |
| | | 9 When the Fund has a significant cash balance for a sustained period, the benefit to the Fund of any market upswing may likely be reduced, and the Fund’s performance may be adversely affected. 10 Changes in the general political and social environment of a country can have substantial effects on the value of investments exposed to that country. 11 The Fund may invest in derivatives such as options and futures; the complexity and rapidly changing structure of derivatives markets may increase the possibility of market losses. |
7
| | |
| | | AMG Veritas Global Real Return Fund Portfolio Manager’s Comments (continued) |
| | | |
| | | |
| | | | | | | | |
12 The Fund may not be able to value its investments in a manner that accurately reflects their market values, and the Fund may not be able to sell an investment at a price equal to the valuation ascribed to that investment by the Fund. 13 The Fund is subject to the risks associated with investments in emerging markets, such as erratic earnings patterns, economic and political instability, changing exchange controls, limitations on repatriation of foreign capital and changes in local governmental attitudes toward private investment, possibly leading to nationalization or confiscation of investor assets. 14 Because exchange-traded funds (ETFs) incur their own costs, investing in them could result in a higher cost to the investor. Additionally, the fund will be indirectly exposed to all the risks of securities held by the ETFs. 15 The use of leverage in a Fund’s strategy, such as futures and forward commitment transactions, can magnify relatively small market movements into relatively larger losses for the Fund. 16 The Fund may not be able to dispose of particular investments, such as illiquid securities, readily at favorable times or prices or the Fund may have to sell them at a loss. | | | | 17 The Fund is subject to risks associated with investments in mid-capitalization companies such as greater price volatility, lower trading volume, and less liquidity than the stocks of larger, more established companies. 18 The Fund is subject to risks associated with investments in small-capitalization companies, such as erratic earnings patterns, competitive conditions, limited earnings history and a reliance on one or a limited number of products. 19 The Fund invests in value stocks, which may perform differently from the market as a whole and may be undervalued by the market for a long period of time. 20 On March 19, 2021, the primary benchmark changed from the Russell 1000® Growth Index to Bloomberg U.S. Treasury Inflation-Linked Bond Index. The Bloomberg U.S. Treasury Inflation-Linked Bond Index measures the performance of the U.S. Treasury Inflation Protected Securities (TIPS) market. Unlike the Fund, the Bloomberg U.S. Treasury Inflation-Linked Bond Index is unmanaged, is not available for investment and does not incur expenses. 21 The Russell 1000® Growth Index is a market capitalization weighted index that measures the | | | | performance of those Russell 1000® companies with higher price-to-book ratios and higher forecasted growth values. Unlike the Fund, the Russell 1000® Growth Index is unmanaged, is not available for investment and does not incur expenses. “Bloomberg®” and Bloomberg U.S. Treasury Inflation-Linked Bond Index are service marks of Bloomberg Finance L.P. and its affiliates, including Bloomberg Index Services Limited (“BISL”), the administrator of the index (collectively, “Bloomberg”) and have been licensed for use for certain purposes by AMG Funds LLC. Bloomberg is not affiliated with AMG Funds LLC, and Bloomberg does not approve, endorse, review, or recommend the AMG Veritas Global Real Return Fund. Bloomberg does not guarantee the timeliness, accurateness, or completeness of any data or information relating to the AMG Veritas Global Real Return Fund The Russell 1000® Growth Index is a trademark of the London Stock Exchange Group companies. Not FDIC insured, nor bank guaranteed. May lose value. |
8
| | |
| | | AMG Veritas Global Real Return Fund Fund Snapshots (unaudited) September 30, 2021 |
| | | |
| | | |
PORTFOLIO BREAKDOWN
| | |
| Sector | | % of Net Assets |
Health Care | | 27.6 |
| | |
Industrials | | 21.4 |
| | |
Communication Services | | 16.7 |
| | |
Information Technology | | 10.8 |
| | |
Consumer Discretionary | | 5.8 |
| | |
Financials | | 4.9 |
| | |
Consumer Staples | | 4.0 |
| | |
Materials | | 0.9 |
| | |
Short-Term Investments | | 3.2 |
| | |
Other Assets Less Liabilities1 | | 4.7 |
| 1 | Includes collateral and net unrealized appreciation on futures contracts. |
TOP TEN HOLDINGS
| | |
| Security Name | | % of Net Assets |
| | |
Alphabet, Inc., Class A | | 7.6 |
| | |
Charter Communications, Inc., Class A | | 5.6 |
| | |
Microsoft Corp. | | 4.3 |
| | |
Unilever PLC (United Kingdom) | | 4.0 |
| | |
BAE Systems PLC (United Kingdom) | | 4.0 |
| | |
UnitedHealth Group, Inc. | | 3.9 |
| | |
Amazon.com, Inc. | | 3.8 |
| | |
Canadian Pacific Railway, Ltd. (Canada) | | 3.8 |
| | |
Thermo Fisher Scientific, Inc. | | 3.8 |
| | |
Baxter International, Inc. | | 3.7 |
| | |
Top Ten as a Group | | 44.5 |
| | |
Because a fund’s strategy may result in multiple investments in particular sectors of the economy, its performance may depend on the performance of those sectors and may fluctuate more widely than investments diversified across more sectors. For additional information on these and other risk considerations, please see the Fund’s prospectus.
Any sectors, industries, or securities discussed should not be perceived as investment recommendations. Mention of a specific security should not be considered a recommendation to buy or solicitation to sell that security. Specific securities mentioned in this report may have been sold from the Fund’s portfolio of investments by the time you receive this report.
9
| | |
| | | AMG Veritas Global Real Return Fund Schedule of Portfolio Investments September 30, 2021 |
| | | |
| | | |
| | | | | | | | |
| | |
| | | Shares | | | Value | |
| | |
Common Stocks - 92.1% | | | | | | | | |
| | |
Communication Services - 16.7% | | | | | | | | |
| | |
Alphabet, Inc., Class A (United States)* | | | 4,658 | | | | $12,453,256 | |
| | |
Charter Communications, Inc., Class A
(United States)*,1 | | | 12,665 | | | | 9,214,548 | |
| | |
Facebook, Inc., Class A (United States)* | | | 17,177 | | | | 5,829,702 | |
| | |
Total Communication Services | | | | | | | 27,497,506 | |
| | |
Consumer Discretionary - 5.8% | | | | | | | | |
| | |
Alibaba Group Holding, Ltd., Sponsored ADR
(China)* | | | 22,442 | | | | 3,322,538 | |
| | |
Amazon.com, Inc. (United States)* | | | 1,900 | | | | 6,241,576 | |
| | |
Total Consumer Discretionary | | | | | | | 9,564,114 | |
| | |
Consumer Staples - 4.0% | | | | | | | | |
| | |
Unilever PLC (United Kingdom) | | | 122,983 | | | | 6,644,923 | |
| | |
Financials - 4.9% | | | | | | | | |
| | |
Intercontinental Exchange, Inc. (United States) | | | 35,252 | | | | 4,047,635 | |
| | |
Moody’s Corp. (United States) | | | 11,111 | | | | 3,945,627 | |
| | |
Total Financials | | | | | | | 7,993,262 | |
| | |
Health Care - 27.6% | | | | | | | | |
| | |
Baxter International, Inc. (United States) | | | 75,417 | | | | 6,065,789 | |
| | |
Becton Dickinson and Co. (United States) | | | 19,239 | | | | 4,729,331 | |
| | |
Catalent, Inc. (United States)* | | | 36,319 | | | | 4,832,969 | |
| | |
The Cooper Cos, Inc. (United States) | | | 11,453 | | | | 4,733,640 | |
| | |
CVS Health Corp. (United States) | | | 68,700 | | | | 5,829,882 | |
| | |
Illumina, Inc. (United States)* | | | 4,435 | | | | 1,798,880 | |
| | |
Sonic Healthcare, Ltd. (Australia) | | | 160,566 | | | | 4,640,228 | |
| | |
Thermo Fisher Scientific, Inc. (United States) | | | 10,827 | | | | 6,185,790 | |
| | |
UnitedHealth Group, Inc. (United States) | | | 16,513 | | | | 6,452,290 | |
| | |
Total Health Care | | | | | | | 45,268,799 | |
| | |
Industrials - 21.4% | | | | | | | | |
| | |
Aena SME SA (Spain)*,2 | | | 26,846 | | | | 4,642,792 | |
| | | | | | | | |
| | |
| | | Shares | | | Value | |
| | |
Airbus SE (France)* | | | 24,967 | | | | $3,310,023 | |
| | |
BAE Systems PLC (United Kingdom) | | | 865,359 | | | | 6,554,277 | |
| | |
Canadian Pacific Railway, Ltd. (Canada)1 | | | 95,890 | | | | 6,239,562 | |
| | |
CoStar Group, Inc. (United States)* | | | 39,410 | | | | 3,391,625 | |
| | |
Safran SA (France) | | | 40,127 | | | | 5,075,289 | |
| | |
Vinci SA (France) | | | 56,773 | | | | 5,904,897 | |
| | |
Total Industrials | | | | | | | 35,118,465 | |
| | |
Information Technology - 10.8% | | | | | | | | |
| | |
Fiserv, Inc. (United States)* | | | 54,521 | | | | 5,915,528 | |
| | |
Mastercard, Inc., Class A (United States) | | | 13,758 | | | | 4,783,381 | |
| | |
Microsoft Corp. (United States) | | | 24,806 | | | | 6,993,308 | |
| | |
Total Information Technology | | | | | | | 17,692,217 | |
| | |
Materials - 0.9% | | | | | | | | |
| | |
Franco-Nevada Corp. (Canada) | | | 11,486 | | | | 1,492,146 | |
| | |
Total Common Stocks
(Cost $141,212,440) | | | | | | | 151,271,432 | |
| | |
Short-Term Investments - 3.2% | | | | | | | | |
| |
Other Investment Companies - 3.2% | | | | | |
| | |
Dreyfus Government Cash Management Fund, Institutional Shares, 0.03%3 | | | 1,730,085 | | | | 1,730,085 | |
| | |
Dreyfus Institutional Preferred Government | | | | | | | | |
| | |
Money Market Fund, Institutional Shares, 0.01%3 | | | 1,730,085 | | | | 1,730,085 | |
| | |
JPMorgan U.S. Government Money Market Fund, | | | | | | | | |
| | |
IM Shares, 0.03%3 | | | 1,782,511 | | | | 1,782,511 | |
| | |
Total Short-Term Investments
(Cost $5,242,681) | | | | | | | 5,242,681 | |
| | |
Total Investments - 95.3%
(Cost $146,455,121) | | | | | | | 156,514,113 | |
| | |
Other Assets, less Liabilities - 4.7% | | | | | | | 7,691,428 | |
| | |
Net Assets - 100.0% | | | | | | $ | 164,205,541 | |
| * | Non-income producing security. |
| 1 | Some of these securities, amounting to $15,299,307 or 9.3% of net assets, were out on loan to various borrowers and are collateralized by various U.S. Treasury Obligations. See Note 4 of Notes to Financial Statements. |
| 2 | Security exempt from registration under Rule 144A of the Securities Act of 1933. This security may be resold in transactions exempt from registration, normally to qualified institutional buyers. At September 30, 2021, the value of this security amounted to $4,642,792 or 2.8% of net assets. |
| 3 | Yield shown represents the September 30, 2021, seven day average yield, which refers to the sum of the previous seven days’ dividends paid, expressed as an annual percentage. |
ADR American Depositary Receipt
The accompanying notes are an integral part of these financial statements.
10
| | |
| | | AMG Veritas Global Real Return Fund Schedule of Portfolio Investments (continued) |
| | | |
| | | |
Open Futures Contracts
| | | | | | | | | | | | | | | | | | | | | | |
| Description | | Currency | | Number of
Contracts | | | Position | | | Expiration
Date | | | Current
Notional
Amount | | | Value and
Unrealized
Gain/(Loss) | |
| | | | | | |
EURO STOXX 50 | | EUR | | | 250 | | | | Short | | | | 12/17/21 | | | | $(11,722,502) | | | | $374,723 | |
| | | | | | |
FTSE 100 Index | | GBP | | | 65 | | | | Short | | | | 12/17/21 | | | | (6,195,042) | | | | (20,807) | |
| | | | | | |
S&P 500 E-Mini Index | | USD | | | 335 | | | | Short | | | | 12/17/21 | | | | (71,987,313) | | | | 2,529,049 | |
| | | | | | |
| | | | | | | | | | | | | | | | | | | | | | |
| | | | | | |
| | | | | | | | | | | | | | | | | Total | | | | $2,882,965 | |
| | | | | | | | | | | | | | | | | | | | | | |
CURRENCY ABBREVIATIONS:
EUR Euro Dollar
GBP British Pound
USD U.S. Dollar
The following table summarizes the inputs used to value the Fund’s investments by the fair value hierarchy levels as of September 30, 2021:
| | | | | | | | | | | | | | | | |
| | | Level 1 | | | Level 21 | | | Level 3 | | | Total | |
| | | | |
Investments in Securities | | | | | | | | | | | | | | | | |
| | | | |
Common Stocks | | | | | | | | | | | | | | | | |
| | | | |
Health Care | | | $40,628,571 | | | | $4,640,228 | | | | — | | | | $45,268,799 | |
| | | | |
Industrials | | | 14,273,979 | | | | 20,844,486 | | | | — | | | | 35,118,465 | |
| | | | |
Communication Services | | | 27,497,506 | | | | — | | | | — | | | | 27,497,506 | |
| | | | |
Information Technology | | | 17,692,217 | | | | — | | | | — | | | | 17,692,217 | |
| | | | |
Consumer Discretionary | | | 9,564,114 | | | | — | | | | — | | | | 9,564,114 | |
| | | | |
Financials | | | 7,993,262 | | | | — | | | | — | | | | 7,993,262 | |
| | | | |
Consumer Staples | | | 6,644,923 | | | | — | | | | — | | | | 6,644,923 | |
| | | | |
Materials | | | 1,492,146 | | | | — | | | | — | | | | 1,492,146 | |
| | | | |
Short-Term Investments | | | | | | | | | | | | | | | | |
| | | | |
Other Investment Companies | | | 5,242,681 | | | | — | | | | — | | | | 5,242,681 | |
| | | | | | | | | | | | | | | | |
| | | | |
Total Investments in Securities | | | $131,029,399 | | | | $25,484,714 | | | | — | | | | $156,514,113 | |
| | | | | | | | | | | | | | | | |
| | | | |
Financial Derivative Instruments - Assets | | | | | | | | | | | | | | | | |
| | | | |
Equity Futures Contracts | | | $2,903,772 | | | | — | | | | — | | | | $2,903,772 | |
| | | | |
Financial Derivative Instruments - Liabilities | | | | | | | | | | | | | | | | |
| | | | |
Equity Futures Contracts | | | (20,807) | | | | — | | | | — | | | | (20,807) | |
| | | | | | | | | | | | | | | | |
| | | | |
Total Financial Derivative Instruments | | | $2,882,965 | | | | — | | | | — | | | | $2,882,965 | |
| | | | | | | | | | | | | | | | |
| 1 | An external pricing service is used to reflect any impact on security value due to market movements between the time the Fund valued such foreign securities and the earlier closing of foreign markets. |
For the fiscal year ended September 30, 2021, there were no transfers in or out of Level 3.
The following schedule shows the value of derivative instruments at September 30, 2021:
| | | | | | | | | | | | | | | | |
| | | Asset Derivatives | | | Liability Derivatives | |
| | | | | |
Derivatives not accounted for as hedging instruments | | Statement of Assets and Liabilities Location | | | Fair Value | | | | | | | Statement of Assets and Liabilities Location | | | Fair Value | |
Equity contracts | | Cash deposit with broker for futures contracts1 | | | $7,874,108 | | | | — | | | | | | — | |
| | | | | | | | | | | | | | | | |
The accompanying notes are an integral part of these financial statements.
11
| | |
| | | AMG Veritas Global Real Return Fund Schedule of Portfolio Investments (continued) |
| | | |
| | | |
For the fiscal year ended September 30, 2021, the effect of derivative instruments on the Statement of Operations for the Fund and the amount of realized gain/loss and unrealized appreciation/depreciation on derivatives recognized in income was as follows:
| | | | | | | | | | | | |
| | | Realized Gain/(Loss) | | | Change in Unrealized Appreciation/Depreciation | |
Derivatives not accounted for as hedging instruments | | Statement of Operations Location | | Realized Gain/(Loss) | | | Statement of Operations Location | | Change in
Unrealized
Appreciation/
Depreciation | |
Equity contracts | | Net realized loss on futures contracts | | | $(6,314,720) | | | Net change in unrealized appreciation/ depreciation on futures contracts | | | $2,882,965 | |
| | | | | | | | | | | | |
| | 1 | Amount represents cash with futures broker and unrealized appreciation/depreciation on open futures contracts. See Note 9 for additional information. |
The country allocation in the Schedule of Portfolio Investments at September 30, 2021, was as follows:
| | |
| Country | | % of Long-Term Investments |
| |
Australia | | 3.1 |
| |
Canada | | 5.1 |
| |
China | | 2.2 |
| |
France | | 9.4 |
| |
Spain | | 3.1 |
| |
United Kingdom | | 8.7 |
| |
United States | | 68.4 |
| | |
| |
| | 100.0 |
| | |
The accompanying notes are an integral part of these financial statements.
12
| | |
| | | Statement of Assets and Liabilities September 30, 2021 |
| | | |
| | | |
| | | | |
| | | AMG
Veritas Global
Real Return
Fund | |
| |
Assets: | | | | |
| |
Investments at value1 (including securities on loan valued at $15,299,307) | | | $156,514,113 | |
| |
Cash deposit with brokers for futures contracts (see Note 9) | | | 7,874,108 | |
| |
Foreign currency2 | | | 9,252 | |
| |
Dividend and interest receivables | | | 70,999 | |
| |
Securities lending income receivable | | | 1,797 | |
| |
Receivable for Fund shares sold | | | 676 | |
| |
Receivable from affiliate | | | 14,764 | |
| |
Prepaid expenses and other assets | | | 11,095 | |
| |
Total assets | | | 164,496,804 | |
| |
Liabilities: | | | | |
| |
Payable for Fund shares repurchased | | | 79,671 | |
| |
Accrued expenses: | | | | |
| |
Investment advisory and management fees | | | 121,701 | |
| |
Administrative fees | | | 20,744 | |
| |
Shareholder service fees | | | 5,947 | |
| |
Other | | | 63,200 | |
| |
Total liabilities | | | 291,263 | |
| | | | |
| |
Net Assets | | | $164,205,541 | |
| |
1 Investments at cost | | | $146,455,121 | |
| |
2 Foreign currency at cost | | | $9,320 | |
| |
Net Assets Represent: | | | | |
| |
Paid-in capital | | | $154,912,004 | |
| |
Total distributable earnings | | | 9,293,537 | |
| |
Net Assets | | | $164,205,541 | |
| |
Class I: | | | | |
| |
Net Assets | | | $164,205,541 | |
| |
Shares outstanding | | | 3,952,999 | |
| |
Net asset value, offering and redemption price per share | | | $41.54 | |
The accompanying notes are an integral part of these financial statements.
13
| | |
| | | Statement of Operations For the fiscal year ended September 30, 2021 |
| | | |
| | | |
| | | | |
| | | AMG
Veritas Global
Real Return
Fund | |
| |
Investment Income: | | | | |
| |
Dividend income | | | $1,484,353 | |
| |
Securities lending income | | | 12,630 | |
| |
Foreign withholding tax | | | (75,993 | ) |
| |
Total investment income | | | 1,420,990 | |
| |
Expenses: | | | | |
| |
Investment advisory and management fees | | | 1,706,328 | |
| |
Administrative fees | | | 290,852 | |
| |
Shareholder servicing fees - Class I | | | 80,456 | |
| |
Professional fees | | | 40,979 | |
| |
Reports to shareholders | | | 32,337 | |
| |
Custodian fees | | | 30,039 | |
| |
Registration fees | | | 27,655 | |
| |
Transfer agent fees | | | 14,885 | |
| |
Trustee fees and expenses | | | 13,049 | |
| |
Miscellaneous | | | 16,845 | |
| |
Total expenses before offsets | | | 2,253,425 | |
| |
Expense reimbursements | | | (21,979 | ) |
| |
Total expenses | | | 2,231,446 | |
| | | | |
| |
Net investment loss | | | (810,456 | ) |
| |
Net Realized and Unrealized Gain: | | | | |
| |
Net realized gain on investments | | | 60,418,885 | 1 |
| |
Net realized loss on futures contracts | | | (6,314,720 | ) |
| |
Net realized gain on foreign currency transactions | | | 30,550 | |
| |
Net change in unrealized appreciation/depreciation on investments | | | (21,276,249 | ) |
| |
Net change in unrealized appreciation/depreciation on futures contracts | | | 2,882,965 | |
| |
Net change in unrealized appreciation/depreciation on foreign currency translations | | | (3,888 | ) |
| |
Net realized and unrealized gain | | | 35,737,543 | |
| | | | |
| |
Net increase in net assets resulting from operations | | | $34,927,087 | |
1 Includes a non-recurring securities litigation gain of $841,497.
The accompanying notes are an integral part of these financial statements.
14
| | |
| | | Statements of Changes in Net Assets For the fiscal years ended September 30, |
| | | |
| | | |
| | | | | | | | |
| | | AMG
Veritas Global
Real Return
Fund | |
| | |
| | | 2021 | | | 2020 | |
| | |
Increase in Net Assets Resulting From Operations: | | | | | | | | |
| | |
Net investment loss | | | $(810,456 | ) | | | $(836,305 | ) |
| | |
Net realized gain on investments | | | 54,134,715 | | | | 46,015,100 | |
| | |
Net change in unrealized appreciation/depreciation on investments | | | (18,397,172 | ) | | | (142,390 | ) |
| | |
Net increase in net assets resulting from operations | | | 34,927,087 | | | | 45,036,405 | |
| | |
Distributions to Shareholders: | | | | | | | | |
| | |
From net investment income and/or realized gain on investments: | | | | | | | | |
| | |
Class I | | | (92,131,621 | ) | | | (24,116,514 | ) |
| | |
From paid-in capital: | | | | | | | | |
| | |
Class I | | | (473,544 | ) | | | — | |
| | |
Total distributions to shareholders | | | (92,605,165 | ) | | | (24,116,514 | ) |
| | |
Capital Share Transactions:1 | | | | | | | | |
| | |
Net increase (decrease) from capital share transactions | | | 27,236,253 | | | | (8,516,890 | ) |
| | | | | | | | |
| | |
Total increase (decrease) in net assets | | | (30,441,825 | ) | | | 12,403,001 | |
| | |
Net Assets: | | | | | | | | |
| | |
Beginning of year | | | 194,647,366 | | | | 182,244,365 | |
| | |
End of year | | | $164,205,541 | | | | $194,647,366 | |
1 See Note 1(g) of the Notes to Financial Statements.
The accompanying notes are an integral part of these financial statements.
15
| | |
| | | AMG Veritas Global Real Return Fund Financial Highlights For a share outstanding throughout each fiscal year |
| | | |
| | | |
| | | | | | | | | | | | | | | | | | | | | | | | |
| | | | | | For the fiscal years ended September 30, | |
| Class I | | | | | 2021 | | | 2020 | | | 2019 | | | 2018 | | | 20171 | |
| | | | | | |
Net Asset Value, Beginning of Year | | | | | | | $55.88 | | | | $49.78 | | | | $56.64 | | | | $45.69 | | | | $36.87 | |
| | | | | | |
Income (loss) from Investment Operations: | | | | | | | | | | | | | | | | | | | | | | | | |
| | | | | | |
Net investment loss2 | | | | | | | (0.20 | )3 | | | (0.22 | ) | | | (0.10 | ) | | | (0.24 | ) | | | (0.12 | )4 |
| | | | | | |
Net realized and unrealized gain (loss) on investments | | | | | | | 9.99 | | | | 12.84 | | | | (1.40 | ) | | | 11.19 | | | | 8.94 | |
| | | | | | |
Total income (loss) from investment operations | | | | | | | 9.79 | | | | 12.62 | | | | (1.50 | ) | | | 10.95 | | | | 8.82 | |
| | | | | | |
Less Distributions to Shareholders from: | | | | | | | | | | | | | | | | | | | | | | | | |
| | | | | | |
Net realized gain on investments | | | | | | | (24.01 | ) | | | (6.52 | ) | | | (5.36 | ) | | | — | | | | — | |
| | | | | | |
Paid in capital | | | | | | | (0.12 | ) | | | — | | | | — | | | | — | | | | — | |
| | | | | | |
Total distributions to shareholders | | | | | | | (24.13 | ) | | | (6.52 | ) | | | (5.36 | ) | | | — | | | | — | |
| | | | | | |
Net Asset Value, End of Year | | | | | | | $41.54 | | | | $55.88 | | | | $49.78 | | | | $56.64 | | | | $45.69 | |
| | | | | | |
Total Return5 | | | | | | | 19.79 | %3,6 | | | 27.84 | % | | | (0.17 | )% | | | 23.97 | % | | | 23.92 | % |
| | | | | | |
Ratio of expenses to average net assets | | | | | | | 1.15 | % | | | 1.17 | % | | | 1.15 | % | | | 1.16 | % | | | 1.20 | % |
| | | | | | |
Ratio of gross expenses to average net assets | | | | | | | 1.16 | %7 | | | 1.17 | % | | | 1.15 | % | | | 1.16 | % | | | 1.20 | % |
| | | | | | |
Ratio of net investment loss to average net assets | | | | | | | (0.42 | )%3 | | | (0.46 | )% | | | (0.20 | )% | | | (0.47 | )% | | | (0.29 | )% |
| | | | | | |
Portfolio turnover | | | | | | | 235 | % | | | 215 | % | | | 135 | % | | | 122 | % | | | 167 | % |
| | | | | | |
Net assets end of year (000’s) omitted | | | | | | | $164,206 | | | | $194,647 | | | | $182,244 | | | | $197,000 | | | | $172,454 | |
| | |
| | |
| 1 | Effective February 27, 2017, the Fund’s Class S shares were renamed to Class I shares. |
| 2 | Per share numbers have been calculated using average shares. |
| 3 | Total returns and net investment income (loss) would have been lower had certain expenses not been offset. |
| 4 | Includes non-recurring dividends. Without these dividends, net investment loss per share would have been $(0.18). |
| 5 | The total return is calculated using the published Net Asset Value as of fiscal year end. |
| 6 | Includes a non-recurring securities litigation gain. Had the Fund not received the payment total return would have been 19.18%. |
| 7 | Excludes the impact of expense reimbursement or fee waivers and expense reductions such as brokerage credits, but includes expense repayments and non-reimbursable expenses, if any, such as interest, taxes, and extraordinary expenses. (See Note 1(c) and 2 in the Notes to Financial Statements.) |
16
| | |
| | | Notes to Financial Statements September 30, 2021 |
| | | |
| | | |
1. ORGANIZATION AND SUMMARY OF SIGNIFICANT ACCOUNTING POLICIES
AMG Funds I (the “Trust”) is an open-end management investment company, organized as a Massachusetts business trust, and registered under the Investment Company Act of 1940, as amended (the “1940 Act”). Currently, the Trust consists of a number of different funds, each having distinct investment management objectives, strategies, risks, and policies. Included in this report is Veritas Global Real Return Fund (formerly AMG Managers Brandywine Blue Fund) (the “Fund”).
A significant portion of the Fund’s holdings may be focused in a relatively small number of securities, which may make the Fund more volatile and subject to greater risk than a more diversified fund.
On March 17-18, 2021, the Board of Trustees of the Trust (the “Board”) approved Veritas Asset Management LLP (“Veritas”) as the subadviser to the Fund on an interim basis to replace Friess Associates, LLC (“Friess”) and Friess Associates of Delaware, LLC (“Friess of Delaware”), effective March 19, 2021, which was subsequently approved by the shareholders of the Fund on May 18, 2021. In conjunction with the subadviser change, the Fund seeks to achieve its investment objective by investing in global equities and derivatives. In conjunction with the respective changes in investment strategy for the Fund, the Fund sold substantially all open positions around the date of the subadviser change that increased the Fund’s portfolio turnover. The Fund also declared a special capital gain distribution on March 24, 2021.
Market disruptions associated with the COVID-19 pandemic have had a global impact, and uncertainty exists as to the long-term implications. Such disruptions can adversely affect assets of the Fund and thus Fund performance.
The Fund’s financial statements are prepared in accordance with accounting principles generally accepted in the United States of America (“U.S. GAAP”), including accounting and reporting guidance pursuant to Accounting Standards Codification Topic 946 applicable to investment companies. U.S. GAAP requires management to make estimates and assumptions that affect the reported amounts of assets and liabilities and disclosure of contingent assets and liabilities at the date of the financial statements and the reported amounts of income and expenses during the reporting period. Actual results could differ from those estimates and such differences could be material. The following is a summary of significant accounting policies followed by the Fund in the preparation of its financial statements:
a. VALUATION OF INVESTMENTS
Equity securities traded on a national securities exchange or reported on the NASDAQ national market system (“NMS”) are valued at the last quoted sales price on the primary exchange or, if applicable, the NASDAQ official closing price or the official closing price of the relevant exchange or, lacking any sales, at the last quoted bid price or the mean between the last quoted bid and ask prices (the “mean price”). Equity securities traded in the over-the-counter market (other than NMS securities) are valued at the mean price. Foreign equity securities (securities principally traded in markets other than U.S. markets) are valued at the official closing price on the primary exchange or, for markets that either do not offer an official closing price or where the official closing price may not be representative of the overall market, the last quoted sale price.
Fixed income securities purchased with a remaining maturity of 60 days or less are valued at amortized cost, provided that the amortized cost value is approximately the same as the fair value of the security valued without the use of
amortized cost. Investments in other open-end registered investment companies are valued at their end of day net asset value per share.
Futures contracts for which market quotations are readily available are valued at the settlement price as of the close of the futures exchange.
The Fund’s portfolio investments are generally valued based on independent market quotations or prices or, if none, “evaluative” or other market based valuations provided by third party pricing services approved by the Board. Under certain circumstances, the value of certain Fund portfolio investments may be based on an evaluation of fair value, pursuant to procedures established by and under the general supervision of the Board. The Valuation Committee, which is comprised of the Independent Trustees of the Board, and the Pricing Committee, which is comprised of representatives from AMG Funds LLC (the “Investment Manager”) are the committees appointed by the Board to make fair value determinations. The Fund may use the fair value of a portfolio investment to calculate its net asset value (“NAV”) in the event that the market quotation, price or market based valuation for the portfolio investment is not readily available or otherwise not determinable pursuant to the Board’s valuation procedures, if the Investment Manager or the Pricing Committee believes the quotation, price or market based valuation to be unreliable, or in certain other circumstances. When determining the fair value of an investment, the Pricing Committee and, if required under the Trust’s securities valuation procedures, the Valuation Committee, seeks to determine the price that the Fund might reasonably expect to receive from current sale of that portfolio investment in an arms-length transaction. Fair value determinations shall be based upon consideration of all available facts and information, including, but not limited to (i) attributes specific to the investment; (ii) fundamental and analytical data relating to the investment; and (iii) the value of other comparable securities or relevant financial instruments, including derivative securities, traded on other markets or among dealers.
The values assigned to fair value portfolio investments are based on available information and do not necessarily represent amounts that might ultimately be realized in the future, since such amounts depend on future developments inherent in long-term investments. Because of the inherent uncertainty of valuation, those estimated values may differ significantly from the values that would have been used had a ready market for the investments existed, and the differences could be material. The Board will be presented with a quarterly report showing as of the most recent quarter end, all outstanding securities fair valued by the Fund, including a comparison with the prior quarter end and the percentage of the Fund that the security represents at each quarter end.
With respect to foreign equity securities and certain foreign fixed income securities, the Board has adopted a policy that securities held in the Fund that can be fair valued by the applicable fair value pricing service are fair valued on each business day provided that each individual price exceeds a pre-established confidence level.
U.S. GAAP defines fair value as the price that a fund would receive to sell an asset or pay to transfer a liability in an orderly transaction between market participants at the measurement date. U.S. GAAP also establishes a framework for measuring fair value, and a three level hierarchy for fair value measurements based upon the transparency of inputs to the valuation of an asset or liability. Inputs may be observable or unobservable and refer broadly to the assumptions that market participants would use in pricing the asset or liability. Observable inputs reflect the assumptions market participants would use in pricing the asset or liability based on market data obtained from sources independent of the Fund. Unobservable inputs reflect the Fund’s own assumptions about the assumptions
17
| | |
| | | Notes to Financial Statements (continued) |
| | | |
| | �� | |
that market participants would use in pricing the asset or liability developed based on the best information available in the circumstances. Each investment is assigned a level based upon the observability of the inputs which are significant to the overall valuation.
The three-tier hierarchy of inputs is summarized below:
Level 1 – inputs are quoted prices in active markets for identical investments (e.g., equity securities, open-end investment companies)
Level 2 – other observable inputs (including, but not limited to: quoted prices for similar assets or liabilities in markets that are active, quoted prices for identical or similar assets or liabilities in markets that are not active, inputs other than quoted prices that are observable for the assets or liabilities (such as interest rates, yield curves, volatilities, prepayment speeds, loss severities, credit risks and default rates) or other market corroborated inputs) (e.g., debt securities, government securities, foreign currency exchange contracts, swaps, foreign securities utilizing international fair value pricing, fair valued securities with observable inputs)
Level 3 – inputs are significant unobservable inputs (including the Fund’s own assumptions used to determine the fair value of investments) (e.g., fair valued securities with unobservable inputs)
Changes in inputs or methodologies used for valuing investments may result in a transfer in or out of levels within the fair value hierarchy. The inputs or methodologies used for valuing investments may not necessarily be an indication of the risk associated with investing in those investments.
b. SECURITY TRANSACTIONS
Security transactions are accounted for as of trade date. Realized gains and losses on securities sold are determined on the basis of identified cost.
c. INVESTMENT INCOME AND EXPENSES
Dividend income is recorded on the ex-dividend date. Dividends from foreign securities are recorded on the ex-dividend date, and if after the fact, as soon as the Fund becomes aware of the ex-dividend date. Interest income, which includes amortization of premium and accretion of discount on debt securities, is accrued as earned. Dividend and interest income on foreign securities is recorded gross of any withholding tax. Non-cash dividends included in dividend income, if any, are reported at the fair market value of the securities received. Other income and expenses are recorded on an accrual basis. Expenses that cannot be directly attributed to the Fund are apportioned among the funds in the Trust and other trusts or funds within the AMG Funds Family of Funds (collectively the “AMG Funds Family”) based upon their relative average net assets or number of shareholders.
d. DIVIDENDS AND DISTRIBUTIONS
Fund distributions resulting from either net investment income or realized net capital gains, if any, will normally be declared and paid at least annually in December. Distributions to shareholders are recorded on the ex-dividend date. Distributions are determined in accordance with federal income tax regulations, which may differ from net investment income and net realized capital gains for financial statement purposes (U.S. GAAP). Differences may be permanent or temporary. Permanent differences are reclassified among capital accounts in the financial statements to reflect their tax character. Permanent book and tax basis differences, if any, relating to shareholder distributions will result in reclassifications to paid-in capital. Temporary differences arise when certain items
of income, expense and gain or loss are recognized in different periods for financial statement and tax purposes; these differences will reverse at some time in the future. Permanent differences are primarily due to distributions in excess of earnings. Temporary differences are primarily due to the deferral of qualified late year losses, wash sale loss deferrals, and mark to market of futures.
The tax character of distributions paid during the fiscal years ended September 30, 2021 and September 30, 2020 were as follows:
| | | | | | | | |
| Distributions paid from: | | 2021 | | | 2020 | |
| | |
Ordinary income * | | | $69,482,282 | | | | $960,620 | |
| | |
Long-term capital gains | | | 22,649,339 | | | | 23,155,894 | |
| | |
Paid-in capital | | | 473,544 | | | | — | |
| | | | | | | | |
| | |
| | | $92,605,165 | | | | $24,116,514 | |
| | | | | | | | |
| * | For tax purposes, short-term capital gain distributions, if any, are considered ordinary income distributions. |
As of September 30, 2021, the components of distributable earnings (excluding unrealized appreciation/depreciation) on a tax basis consisted of:
| | | | |
| |
Late-year loss deferral | | $ | 439,839 | |
At September 30, 2021, the cost of investments and the aggregate gross unrealized appreciation and depreciation for federal income tax purposes were as follows:
| | | | | | | | | | | | |
| Cost | | Appreciation | | | Depreciation | | | Net Appreciation | |
| | | |
$146,776,849 | | | $14,857,928 | | | | $(5,124,552 | ) | | | $9,733,376 | |
e. FEDERAL TAXES
The Fund currently qualifies as an investment company and intends to comply with the requirements under Subchapter M of the Internal Revenue Code of 1986, as amended, and to distribute substantially all of its taxable income and gains to its shareholders and to meet certain diversification and income requirements with respect to investment companies. Therefore, no provision for federal income or excise tax is included in the accompanying financial statements.
Additionally, based on the Fund’s understanding of the tax rules and rates related to income, gains and transactions for the foreign jurisdictions in which it invests, the Fund will provide for foreign taxes, and where appropriate, deferred foreign taxes.
Management has analyzed the Fund’s tax positions taken on federal income tax returns as of September 30, 2021, and for all open tax years (generally, the three prior taxable years), and has concluded that no provision for federal income tax is required in the Fund’s financial statements. Additionally, Management is not aware of any tax position for which it is reasonably possible that the total amounts of unrecognized tax benefits will change materially in the next twelve months.
18
| | |
| | | Notes to Financial Statements (continued) |
| | | |
| | | |
f. CAPITAL LOSS CARRYOVERS AND DEFERRALS
As of September 30, 2021, the Fund had no capital loss carryovers for federal income tax purposes. Should the Fund incur net capital losses for the fiscal year
ended September 30, 2022, such amounts may be used to offset future realized capital gains indefinitely, and retain their character as short-term and/or long-term.
g. CAPITAL STOCK
The Trust’s Declaration of Trust authorizes for the Fund the issuance of an unlimited number of shares of beneficial interest, without par value. The Fund records sales and repurchases of its capital stock on the trade date.
For the fiscal years ended September 30, 2021 and September 30, 2020, the capital stock transactions by class for the Fund were as follows:
| | | | | | | | | | | | | | | | |
| | | September 30, 2021 | | | September 30, 2020 | |
| | | Shares | | | Amount | | | Shares | | | Amount | |
| | | | |
Class I: | | | | | | | | | | | | | | | | |
| | | | |
Proceeds from sale of shares | | | 411,014 | | | | $21,389,777 | | | | 298,448 | | | | $14,918,425 | |
| | | | |
Reinvestment of distributions | | | 1,900,323 | | | | 83,737,125 | | | | 493,674 | | | | 23,168,103 | |
| | | | |
Cost of shares repurchased | | | (1,841,410 | ) | | | (77,890,649 | ) | | | (970,100 | ) | | | (46,603,418 | ) |
| | | | | | | | | | | | | | | | |
| | | | |
Net increase (decrease) | | | 469,927 | | | | $27,236,253 | | | | (177,978 | ) | | | $(8,516,890 | ) |
| | | | | | | | | | | | | | | | |
h. REPURCHASE AGREEMENTS AND JOINT REPURCHASE AGREEMENTS
The Fund may enter into third-party repurchase agreements for temporary cash management purposes and third-party or bilateral joint repurchase agreements for reinvestment of cash collateral on securities lending transactions under the securities lending program offered by The Bank of New York Mellon (“BNYM”) (the “Program”) (collectively, “Repurchase Agreements”). The value of the underlying collateral, including accrued interest, must equal or exceed the value of the Repurchase Agreements during the term of the agreement. For joint repurchase agreements, the Fund participates on a pro rata basis with other clients of BNYM in its share of the underlying collateral under such joint repurchase agreements and in its share of proceeds from any repurchase or other disposition of the underlying collateral. The underlying collateral for all Repurchase Agreements is held in safekeeping by the Fund’s custodian or at the Federal Reserve Bank. If the seller defaults and the value of the collateral declines, or if bankruptcy proceedings commence with respect to the seller of the security, realization of the collateral by the Fund may be delayed or limited. Pursuant to the Program, the Fund is indemnified for such losses by BNYM on joint repurchase agreements.
At September 30, 2021, the Fund had no Repurchase Agreements outstanding.
i. FOREIGN CURRENCY TRANSLATION
The books and records of the Fund are maintained in U.S. dollars. The value of investments, assets and liabilities denominated in currencies other than U.S. dollars are translated into U.S. dollars based upon current foreign exchange rates. Purchases and sales of foreign investments, income and expenses are converted into U.S. dollars based on currency exchange rates prevailing on the respective dates of such transactions. Net realized and unrealized gain (loss) on foreign currency transactions represent: (1) foreign exchange gains and losses from the sale and holdings of foreign currencies; (2) gains and losses between trade date and settlement date on investment securities transactions and foreign currency exchange contracts; and (3) gains and losses from the difference between amounts of interest and dividends recorded and the amounts actually received.
The Fund does not isolate the net realized and unrealized gain or loss resulting from changes in exchange rates from the fluctuations in market prices of securities held. Such fluctuations are included with the net realized and unrealized gain or loss on investments.
2. AGREEMENTS AND TRANSACTIONS WITH AFFILIATES
The Trust has entered into an investment advisory agreement under which the Investment Manager, a subsidiary and the U.S. retail distribution arm of Affiliated Managers Group, Inc. (“AMG”), serves as investment manager to the Fund and is responsible for the Fund’s overall administration and operations. The Investment Manager selects one or more subadvisers for the Fund (subject to Board approval) and monitors each subadviser’s investment performance, security holdings and investment strategies. Effective March 19, 2021, the Fund’s investment portfolio is managed by Veritas who serves pursuant to a subadvisory agreement with the Investment Manager. AMG indirectly owns a majority interest in Veritas. Prior to March 19, 2021, the Fund’s investment portfolio was managed by Friess and Friess of Delaware.
Investment management fees are paid directly by the Fund to the Investment Manager based on average daily net assets. For the fiscal year ended September 30, 2021, the Fund paid an investment management fee at the annual rate of 0.88% of the average daily net assets of the Fund.
The Investment Manager has contractually agreed, through at least February 1, 2023, to waive management fees and/or pay or reimburse fund expenses in order to limit total annual Fund operating expenses after fee waiver and expense reimbursements (exclusive of taxes, interest (including interest incurred in connection with bank and custody overdrafts, and in connection with securities sold short), shareholder servicing fees, distribution and service (12b-1) fees, brokerage commissions and other transaction costs, dividends payable with respect to securities sold short, acquired fund fees and expenses and extraordinary expenses) of the Fund to the annual rate of 1.11% of the Fund’s average daily net assets (this annual rate or such other annual rate that may be in
19
| | |
| | | Notes to Financial Statements (continued) |
| | | |
| | | |
effect from time to time, the “Expense Cap”), subject to later reimbursement by the Fund in certain circumstances. Prior to May 24, 2021, the Fund did not have an expense limitation.
In general, for a period of up to 36 months after the date any amounts are paid, waived or reimbursed by the Investment Manager, the Investment Manager may recover such amounts from the Fund, provided that such repayment would not cause the Fund’s total annual operating expenses after fee waiver and expense reimbursements (exclusive of the items noted in the parenthetical above) to exceed either (i) the Expense Cap in effect at the time such amounts were paid, waived or reimbursed, or (ii) the Expense Cap in effect at the time of such repayment by the Fund.
The contractual expense limitation may only be terminated in the event the Investment Manager or a successor ceases to be the investment manager of the Fund or a successor fund, by mutual agreement between the Investment Manager and the Board, or in the event of the Fund’s liquidation unless the Fund is reorganized or is a party to a merger in which the surviving entity is successor to the accounting and performance information of the Fund.
At September 30, 2021, the Fund’s expiration of reimbursements subject to recoupment is as follows:
| | | | |
Expiration Period | | | |
| |
2-3 years | | $ | 21,979 | |
| | | | |
| |
Total | | $ | 21,979 | |
| | | | |
The Trust, on behalf of the Fund, has entered into an amended and restated Administration Agreement under which the Investment Manager serves as the Fund’s administrator (the “Administrator”) and is responsible for all non-portfolio management aspects of managing the Fund’s operations, including administration and shareholder services to the Fund. The Fund pays a fee to the Administrator at the rate of 0.15% per annum of the Fund’s average daily net assets for this service.
The Fund is distributed by AMG Distributors, Inc. (the “Distributor”), a wholly-owned subsidiary of the Investment Manager. The Distributor serves as the distributor and underwriter for the Fund and is a registered broker-dealer and member of the Financial Industry Regulatory Authority, Inc. (“FINRA”). Shares of the Fund will be continuously offered and will be sold directly to prospective purchasers and through brokers, dealers or other financial intermediaries who have executed selling agreements with the Distributor. Generally the Distributor bears all or a portion of the expenses of providing services pursuant to the distribution agreement, including the payment of the expenses relating to the distribution of prospectuses for sales purposes and any advertising or sales literature.
For Class I shares, the Board has approved reimbursement payments to the Investment Manager for shareholder servicing expenses (“shareholder servicing fees”) incurred. Shareholder servicing fees include payments to financial intermediaries, such as broker-dealers (including fund supermarket platforms), banks, and trust companies who provide shareholder recordkeeping, account servicing and other services. The Class I shares may reimburse the Investment Manager for the actual amount incurred up to a maximum annual rate of each Class’s average daily net assets as shown in the table below.
The impact on the annualized expense ratios for the fiscal year ended September 30, 2021, were as follows:
| | | | | | | | |
| | | Maximum Annual
Amount
Approved | | | Actual
Amount
Incurred | |
| | |
Class I | | | 0.15% | | | | 0.04% | |
The Board provides supervision of the affairs of the Trust and other trusts within the AMG Funds Family. The Trustees of the Trust who are not affiliated with the Investment Manager receive an annual retainer and per meeting fees for regular, special and telephonic meetings, and they are reimbursed for out-of-pocket expenses incurred while carrying out their duties as Board members. The Chairman of the Board and the Audit Committee Chair receive additional annual retainers. Certain Trustees and Officers of the Fund are Officers and/or Directors of the Investment Manager, AMG and/or the Distributor.
The Securities and Exchange Commission (the “SEC”) granted an exemptive order that permits the Fund to lend and borrow money for certain temporary purposes directly to and from other eligible funds in the AMG Funds Family. Participation in this interfund lending program is voluntary for both the borrowing and lending funds, and an interfund loan is only made if it benefits each participating fund. The Administrator manages the program according to procedures approved by the Board, and the Board monitors the operation of the program. An interfund loan must comply with certain conditions set out in the exemptive order, which are designed to assure fairness and protect all participating funds. The interest earned and interest paid on interfund loans are included on the Statement of Operations as interest income and miscellaneous expense, respectively. At September 30, 2021, the Fund had no interfund loans outstanding.
The Fund utilized the interfund loan program during the fiscal year ended September 30, 2021 as follows:
| | | | | | | | | | | | |
Average Borrowed | | Number
of Days | | | Interest
Paid | | | Average
Interest Rate | |
| | | |
| $2,337,834 | | | 67 | | | | $3,936 | | | | 0.917% | |
3. PURCHASES AND SALES OF SECURITIES
Purchases and sales of securities (excluding short-term securities and U.S. Government Obligations) for the fiscal year ended September 30, 2021, were $441,100,953 and $519,369,520, respectively.
The Fund had no purchases or sales of U.S. Government Obligations during the fiscal year ended September 30, 2021.
4. PORTFOLIO SECURITIES LOANED
The Fund participates in the Program providing for the lending of securities to qualified borrowers. Securities lending income includes earnings of such temporary cash investments, plus or minus any rebate to a borrower. These earnings (after any rebate) are then divided between BNYM, as a fee for its services under the Program, and the Fund, according to agreed-upon rates. Collateral on all securities loaned is accepted in cash, U.S. Treasury Obligations or U.S. Government Agency Obligations. Collateral is maintained at a minimum level of 102% (105% in the case of certain foreign securities) of the market value, plus interest, if applicable, of investments on loan. It is the Fund’s policy to obtain additional collateral from or return excess collateral to the borrower by the end of the next business day, following the valuation date of the securities loaned. Therefore, the value of the collateral held may be temporarily less than the value of the securities on loan. Lending securities entails a risk of loss to the Fund if and to
20
| | |
| | | Notes to Financial Statements (continued) |
| | | |
| | | |
the extent that the market value of the securities loaned were to increase and the borrower did not increase the collateral accordingly, and the borrower fails to return the securities. Under the terms of the Program, the Fund is indemnified for such losses by BNYM. Cash collateral is held in separate omnibus accounts managed by BNYM, who is authorized to exclusively enter into joint repurchase agreements for that cash collateral. Securities collateral is held in separate omnibus accounts managed by BNYM that cannot be sold or pledged. BNYM bears the risk of any deficiency in the amount of the cash collateral available for return to the borrower due to any loss on the collateral invested. Loans of securities are terminable at any time and the borrower, after notice, is required to return borrowed securities as soon as practical, which is normally within three business days.
The value of securities loaned on positions held, cash collateral and securities collateral received at September 30, 2021, were as follows:
| | | | | | | | | | | | |
Securities Loaned | | Cash
Collateral
Received | | | Securities
Collateral
Received | | | Total
Collateral
Received | |
| | | |
| $15,299,307 | | | — | | | | $15,779,288 | | | | $15,779,288 | |
The following table summarizes the securities received as collateral for securities lending at September 30, 2021:
| | | | |
Collateral Type | | Coupon Range | | Maturity Date Range |
| | |
U.S. Treasury Obligations | | 0.000%-6.875% | | 10/07/21-11/15/50 |
5. FOREIGN SECURITIES
The Fund invests in securities of foreign entities and in instruments denominated in foreign currencies which involve risks not typically associated with investments in domestic securities. Non-domestic securities carry special risks, such as exposure to currency fluctuations, less developed or less efficient trading markets, political instability, a lack of company information, differing auditing and legal standards, and, potentially, less liquidity. Realized gains in certain countries may be subject to foreign taxes at the Fund level and the Fund would pay such foreign taxes at the appropriate rate for each jurisdiction.
6. COMMITMENTS AND CONTINGENCIES
Under the Trust’s organizational documents, its trustees and officers are indemnified against certain liabilities arising out of the performance of their duties to the Trust. In addition, in the normal course of business, the Fund may enter into contracts and agreements that contain a variety of representations and warranties, which provide general indemnifications. The maximum exposure to the Fund under these arrangements is unknown, as this would involve future claims that may be made against the Fund that have not yet occurred. However, based on experience, the Fund had no prior claims or losses and expects the risks of loss to be remote.
7. FORWARD COMMITMENTS
Certain transactions, such as futures and forward transactions may have a similar effect on the Fund’s net asset value as if the Fund had created a degree of leverage in its portfolio. However, if the Fund enters into such a transaction, the Fund will establish a segregated account with its custodian in which it will maintain cash, U.S. government securities or other liquid securities equal in value to its obligations in respect to such transaction. Securities and other assets held in
the segregated account may not be sold while the transaction is outstanding, unless other suitable assets are substituted.
8. DERIVATIVE INSTRUMENTS
The following disclosures contain information on how and why the Fund uses derivative instruments, the credit risk and how derivative instruments affect the Fund’s financial position, and results of operations. The location and fair value amounts of these instruments on the Statement of Assets and Liabilities, and the realized gains and losses and changes in unrealized appreciation and depreciation on the Statement of Operations, each categorized by type of derivative contract, are included in a table at the end of the Fund’s Schedule of Portfolio Investments.
The Fund began trading derivative financial instruments in third quarter of the Fund’s fiscal year ended September 30, 2021. The average quarterly balances of derivative financial instruments outstanding during those two quarters were as follows:
| | | | |
| |
Financial Futures Contracts | | | | |
| |
Average number of contracts sold | | | 678 | |
| |
Average notional value of contracts sold | | | $93,957,440 | |
9. FUTURES CONTRACTS
The Fund generally expects to take short positions in index futures to seek to preserve capital. There are certain risks associated with futures contracts. Prices may not move as expected or the Funds may not be able to close out the contract when it desires to do so, resulting in losses.
On entering into a futures contract, either cash or securities in an amount equal to a certain percentage of the contract value (initial margin) must be deposited with the futures broker. Subsequent variation margin payments are made or received by the Funds depending on the fluctuations in the value of the futures contracts and the value of cash or securities on deposit with the futures broker. The Funds must have total value at the futures broker consisting of either net unrealized gains, cash or securities collateral to meet the initial margin requirement, and any value over the initial margin requirement may be transferred to the Funds. The Fund pays or receives variation margin periodically. As of September 30, 2021, the Fund had an initial margin requirement of $5,136,170, which the Fund covered with a combination of cash at the futures broker and unrealized gains on futures contracts.
Variation margin on future contracts is recorded as unrealized appreciation or depreciation until the futures contract is closed or expired. The Fund recognizes a realized gain or loss when the contract is closed or expires equal to the difference between the value of the contract at the time it was opened and the value at the time it was closed. Fluctuations in the value of the contracts are recorded in the Statement of Assets and Liabilities as an asset (liability) and in the Statement of Operations as unrealized appreciation (depreciation) until the contracts are closed, when they are recorded as realized gains (losses) on futures contracts.
21
| | |
| | | Notes to Financial Statements (continued) |
| | | |
| | | |
10. MASTER NETTING AGREEMENTS
The Fund may enter into master netting agreements with its counterparties for the securities lending program, Repurchase Agreements and derivatives, which provide the right, in the event of default (including bankruptcy or insolvency) for the non-defaulting party to liquidate the collateral and calculate net exposure to the defaulting party or request additional collateral. For financial reporting purposes, the Fund does not offset financial assets and financial liabilities that are subject to master netting agreements in the Statement of Assets and Liabilities. For securities lending transactions, see Note 4. At September 30, 2021, the Fund had no repurchase agreements outstanding.
11. SUBSEQUENT EVENTS
The Fund has determined that no material events or transactions occurred through the issuance date of the Fund’s financial statements which require an additional disclosure in or adjustment of the Fund’s financial statements.
22
| | |
| | | Report of Independent Registered Public Accounting Firm |
| | | |
| | | |
TO THE BOARD OF TRUSTEES OF AMG FUNDS I AND SHAREHOLDERS OF AMG VERITAS GLOBAL REAL RETURN FUND
Opinions on the Financial Statements
We have audited the accompanying statement of assets and liabilities, including the schedule of investments, of AMG Veritas Global Real Return Fund (formerly AMG Managers Brandywine Blue Fund) (one of the funds constituting AMG Funds I, referred to hereafter as the “Fund”) as of September, 30 2021, the related statement of operations for the year ended September 30, 2021, the statement of changes in net assets for each of the two years in the period ended September 30, 2021, including the related notes, and the financial highlights for each of the five years in the period ended September 30, 2021 (collectively referred to as the “financial statements”). In our opinion, the financial statements present fairly, in all material respects, the financial position of the Fund as of September 30, 2021, the results of its operations for the year then ended, the changes in its net assets for each of the two years in the period ended September 30, 2021 and the financial highlights for each of the five years in the period ended September 30, 2021 in conformity with accounting principles generally accepted in the United States of America.
Basis for Opinions
These financial statements are the responsibility of the Fund’s management. Our responsibility is to express an opinion on the Fund’s financial statements based on our audit. We are a public accounting firm registered with the Public Company Accounting Oversight Board (United States) (PCAOB) and are required to be independent with respect to the Fund in accordance with the U.S. federal securities laws and the applicable rules and regulations of the Securities and Exchange Commission and the PCAOB.
We conducted our audit of these financial statements in accordance with the standards of the PCAOB. Those standards require that we plan and perform the audit to obtain reasonable assurance about whether the financial statements are free of material misstatement, whether due to error or fraud.
Our audit included performing procedures to assess the risks of material misstatement of the financial statements, whether due to error or fraud, and performing procedures that respond to those risks. Such procedures included examining, on a test basis, evidence regarding the amounts and disclosures in the financial statements. Our audit also included evaluating the accounting principles used and significant estimates made by management, as well as evaluating the overall presentation of the financial statements. Our procedures included confirmation of securities owned as of September 30, 2021 by correspondence with the custodian and brokers; when replies were not received from brokers, we performed other auditing procedures. We believe that our audit provides a reasonable basis for our opinion.
PricewaterhouseCoopers LLP
Boston, Massachusetts
November 23, 2021
We have served as the auditor of one or more investment companies in the AMG Funds Family since 1993.
23
| | |
| | | Other Information (unaudited) |
| | | |
| | | |
TAX INFORMATION
AMG Veritas Global Real Return Fund hereby designates the maximum amount allowable of its net taxable income as qualified dividends as provided in the Jobs and Growth Tax Relief Reconciliation Act of 2003. The 2021 Form 1099-DIV you receive for the Fund will show the tax status of all distributions paid to you during the calendar year.
Pursuant to section 852 of the Internal Revenue Code, AMG Veritas Global Real Return Fund hereby designates $22,649,339 as a capital gain distribution with respect to the taxable year ended September 30, 2021, or if subsequently determined to be different, the net capital gains of such year.
PROXY VOTE
A special meeting of the shareholders of AMG Veritas Global Real Return Fund (the “Fund”) was held on May 18, 2021, to vote on proposals including to approve a new subadvisory agreement between AMG Funds LLC (the “Investment Manager”) and Veritas Asset Management LLP (“Veritas”) with respect to the Fund, to approve a change in the Fund’s sub-classification under the Investment Company Act of 1940, as amended, from “diversified” to “non-diversified”, and to approve a modified manager-of-managers structure for the Fund that would permit the Investment Manager to enter into and materially amend subadvisory agreements with unaffiliated and affiliated subadvisers without obtaining shareholder approval and would also permit the Fund to disclose fees paid to subadvisers on an aggregate, rather than individual, basis. The proposals and results of the votes are summarized below.
| | | | | | |
| | | | | Number of Eligible Shareholders | | |
| Proposal 1 | | For | | Against | | Abstain |
| | | |
Approval of a new subadvisory agreement between the Investment Manager and Veritas with respect to the Fund. | | 2,042,011 | | 493,937 | | 99,821 |
| | | |
% of Shares Present | | 77.47% | | 18.74% | | 3.79% |
| | | |
% of Outstanding Shares | | 45.61% | | 11.03% | | 2.23% |
| | | | | | |
| | | | | Number of Eligible Shareholders | | |
| Proposal 2 | | For | | Against | | Abstain |
| | | |
Approval of a change in the Fund’s sub-classification under the Investment Company Act of 1940, as amended, from “diversified” to “non-diversified”. | | 2,016,043 | | 519,346 | | 100,377 |
| | | |
% of Shares Present | | 76.49% | | 19.70% | | 3.81% |
| | | |
% of Outstanding Shares | | 45.03% | | 11.60% | | 2.24% |
| | | | | | |
| | | | | Number of Eligible Shareholders | | |
| Proposal 3 | | For | | Against | | Abstain |
| | | |
Approval of a modified manager-of-managers structure for the Fund that would permit the Investment Manager to enter into and materially amend subadvisory agreements with unaffiliated and affiliated subadvisers without obtaining shareholder approval and would also permit the Fund to disclose fees paid to subadvisers on an aggregate, rather than individual, basis. | | 1,938,396 | | 598,015 | | 99,355 |
| | | |
% of Shares Present | | 73.54% | | 22.69% | | 3.77% |
| | | |
% of Outstanding Shares | | 43.30% | | 13.36% | | 2.22% |
| | | | |
| Fund Totals: | | Shares | |
| |
Record Total | | | 4,476,715 | |
| |
Shares Voted | | | 2,635,769 | |
| |
Percent Present | | | 58.88% | |
24
| | |
| | | AMG Funds Trustees and Officers |
| | | |
| | | |
| | | | | | | | |
| The Trustees and Officers of the Trust, their business addresses, principal occupations for the past five years and ages are listed below. The Trustees provide broad supervision over the affairs of the Trust and the Funds. The Trustees are experienced executives who meet periodically throughout the year to oversee the Funds’ activities, review contractual arrangements with companies that provide services to the Funds, and | | | | review the Funds’ performance. Unless otherwise noted, the address of each Trustee or Officer is the address of the Trust: 680 Washington Blvd., Suite 500, Stamford, CT. 06901. There is no stated term of office for Trustees. Trustees serve until their resignation, retirement or removal in | | | | accordance with the Trust’s organizational documents and policies adopted by the Board from time to time. The Chairman of the Trustees, President, Treasurer and Secretary of the Trust are elected by the Trustees annually. Other officers hold office at the pleasure of the Trustees. |
Independent Trustees
The following Trustees are not “interested persons” of the Trust within the meaning of the 1940 Act:
| | |
| Number of Funds Overseen in Fund Complex | | Name, Age, Principal Occupation(s) During Past 5 Years and Other Directorships Held by Trustee |
| |
• Trustee since 2012 | | Bruce B. Bingham, 72 |
�� Oversees 46 Funds in Fund Complex | | Partner, Hamilton Partners (real estate development firm) (1987-Current); Director of The Yacktman Funds (2 portfolios) (2000-2012). |
| | |
• Trustee since 2013 | | Kurt A. Keilhacker, 58 |
• Chairman of the Audit Committee since 2021 • Oversees 49 Funds in Fund Complex | | Managing Partner, TechFund Europe (2000-Present); Managing Partner, TechFund Capital (1997-Present); Managing Partner, Elementum Ventures (2013-Present); Director, MetricStory, Inc. (2017-Present); Trustee, Wheaton College (2018-Present); Trustee, Gordon College (2001-2016); Board Member, 6wind SA (2002-2019). |
| | |
• Trustee since 2000 | | Steven J. Paggioli, 71 |
• Oversees 46 Funds in Fund Complex | | Independent Consultant (2002-Present); Trustee, Professionally Managed Portfolios (28 portfolios); Advisory Board Member, Sustainable Growth Advisors, LP; Independent Director, Muzinich BDC, Inc. (business development company) (2019-Present); Director, The Wadsworth Group; Independent Director, Chase Investment Counsel (2008–2019); Executive Vice President, Secretary and Director, Investment Company Administration, LLC and First Fund Distributors, INC. (1990-2001). |
| | |
• Trustee since 2013 | | Richard F. Powers III, 75 |
• Oversees 46 Funds in Fund Complex | | Adjunct Professor, U.S. Naval War College (2016-Present); Adjunct Professor, Boston College (2011-2015); Director, Ameriprise Financial Inc. (2005-2009); President and CEO of Van Kampen Investments Inc. (1998-2003); President, Morgan Stanley Client Group (2000-2002); Executive Vice President and Chief Marketing Officer of the Morgan Stanley Individual Investor Group (1984-1998). |
| | |
• Independent Chairman | | Eric Rakowski, 63 |
• Trustee since 2000 • Oversees 49 Funds in Fund Complex | | Professor of Law, University of California at Berkeley School of Law (1990-Present); Tax Attorney at Davis Polk & Wardwell and clerked for Judge Harry T. Edwards of the U.S. Court of Appeals for the District of Columbia Circuit and for Justice William J. Brennan Jr. of the U.S. Supreme Court; Director of Harding, Loevner Funds, Inc. (10 portfolios); Trustee of Third Avenue Trust (3 portfolios) (2002-2019); Trustee of Third Avenue Variable Trust (1 portfolio) (2002-2019). |
| | |
• Trustee since 2013 | | Victoria L. Sassine, 56 |
• Oversees 49 Funds in Fund Complex | | Adjunct Professor, Babson College (2007–Present); Director, Board of Directors, PRG Group (2017-Present); CEO, Founder, Scale Smarter Partners, LLC (2018-Present); Adviser, EVOFEM Biosciences (2019-Present); Chairperson of the Board of Directors of Business Management Associates (2018 to 2019). |
| | |
• Trustee since 2000 | | Thomas R. Schneeweis, 74 |
• Oversees 46 Funds in Fund Complex | | Professor Emeritus, University of Massachusetts (2013-Present); President, TRS Associates (1982-Present); Board Member, Chartered Alternative Investment Association (“CAIA”) (2002-Present); Co-Founder and Director, Institute for Global Asset and Risk Management (Education) (2010-Present); Co-Owner, Quantitative Investment Technologies (2014-Present); Co-Owner, Yes Wealth Management (2018-Present); Director, CAIA Foundation (2010-2019); Partner, S Capital Wealth Advisors (2015-2018); Partner, S Capital Management, LLC (2007-2015); President, Alternative Investment Analytics, LLC, (formerly Schneeweis Partners, LLC) (2001-2013). |
25
| | |
| | | AMG Funds Trustees and Officers (continued) |
| | | |
| | | |
Interested Trustees
Each Trustee in the following table is an “interested person” of the Trust within the meaning of the 1940 Act. Ms. Carsman is an interested person of the Trust within the meaning of the 1940 Act by virtue of her position with, and interest in securities of, AMG.
| | |
| Number of Funds Overseen in Fund Complex | | Name, Age, Principal Occupation(s) During Past 5 Years and Other Directorships Held by Trustee |
| |
• Trustee since 2011 | | Christine C. Carsman, 69 |
• Oversees 46 Funds in Fund Complex | | Affiliated Managers Group, Inc. (2004-Present): Senior Policy Advisor (2019-Present), Executive Vice President, Deputy General Counsel and Chief Regulatory Counsel (2017-2018), Senior Vice President and Deputy General Counsel (2011-2016), Senior Vice President and Chief Regulatory Counsel (2007-2011), Vice President and Chief Regulatory Counsel (2004-2007); Chair of the Board of Directors, AMG Funds plc (2015-2018); Director, AMG Funds plc (2010-2018); Senior Counsel, Vice President and Director of Operational Risk Management and Compliance, Wellington Management Company, LLP (1995-2004); Director Emeritus of Harding, Loevner Funds, Inc. (0 Portfolios) (2021- Present); Director of Harding, Loevner Funds, Inc. (9 portfolios) (2017-2020); Secretary and Chief Legal Officer, AMG Funds, AMG Funds I, AMG Funds II and AMG Funds III (2004-2011). |
| | |
• Trustee since 2021 | | Garret W. Weston, 40 |
• Oversees 46 Funds in Fund Complex | | Affiliated Managers Group, Inc. (2008-Present): Managing Director, Co-Head of Affiliate Engagement (2021-Present), Senior Vice President, Affiliate Development (2016-2021), Vice President, Office of the CEO (2015-2016), Vice President, New Investments (2012-2015), Senior Associate, New Investments (2008-2012); Associate, Madison Dearborn Partners (2006-2008); Analyst, Merrill Lynch (2004-2006). |
| | |
| Officers | | |
| Position(s) Held with Fund and Length of Time Served | | Name, Age, Principal Occupation(s) During Past 5 Years |
| |
• President since 2018 | | Keitha L. Kinne, 63 |
• Principal Executive Officer since 2018 • Chief Executive Officer since 2018 • Chief Operating Officer since 2007 | | Chief Operating Officer, AMG Funds LLC (2007-Present); Chief Investment Officer, AMG Funds LLC (2008-Present); President and Principal, AMG Distributors, Inc. (2018-Present); Chief Operating Officer, AMG Distributors, Inc. (2007-Present); President, Chief Executive Officer and Principal Executive Officer, AMG Funds, AMG Funds I, AMG Funds II, AMG Funds III and AMG Funds IV (2018-Present); Chief Operating Officer, AMG Funds, AMG Funds I, AMG Funds II, and AMG Funds III (2007-Present); Chief Operating Officer, AMG Funds IV (2016-Present); Chief Operating Officer and Chief Investment Officer, Aston Asset Management, LLC (2016); President and Principal Executive Officer, AMG Funds, AMG Funds I, AMG Funds II and AMG Funds III (2012-2014); Managing Partner, AMG Funds LLC (2007-2014); President and Principal, AMG Distributors, Inc. (2012-2014); Managing Director, Legg Mason & Co., LLC (2006-2007); Managing Director, Citigroup Asset Management (2004-2006). |
| | |
• Secretary since 2015 | | Mark J. Duggan, 56 |
• Chief Legal Officer since 2015 | | Managing Director and Senior Counsel, AMG Funds LLC (2021-Present); Senior Vice President and Senior Counsel, AMG Funds LLC (2015-2021); Secretary and Chief Legal Officer, AMG Funds, AMG Funds I, AMG Funds II, AMG Funds III and AMG Funds IV (2015-Present); Attorney, K&L Gates, LLP (2009-2015). |
| | |
• Chief Financial Officer since 2017 • Treasurer since 2017 • Principal Financial Officer since 2017 • Principal Accounting Officer since 2017 | | Thomas G. Disbrow, 55 Vice President, Mutual Fund Treasurer & CFO, AMG Funds, AMG Funds LLC (2017-Present); Chief Financial Officer, Principal Financial Officer, Treasurer and Principal Accounting Officer, AMG Funds, AMG Funds I, AMG Funds II, AMG Funds III and AMG Funds IV (2017-Present); Managing Director - Global Head of Traditional Funds Product Control, UBS Asset Management (Americas), Inc. (2015-2017); Managing Director - Head of North American Funds Treasury, UBS Asset Management (Americas), Inc. (2011-2015). |
| | |
• Deputy Treasurer since 2017 | | John A. Starace, 50 Vice President, Mutual Fund Accounting, AMG Funds LLC (2021-Present); Director, Mutual Fund Accounting, AMG Funds LLC (2017-2021); Vice President, Deputy Treasurer of Mutual Funds Services, AMG Funds LLC (2014-2017); Deputy Treasurer, AMG Funds, AMG Funds I, AMG Funds II, AMG Funds III and AMG Funds IV (2017-Present); Vice President, Citi Hedge Fund Services (2010-2014); Audit Senior Manager (2005-2010) and Audit Manager (2001-2005), Deloitte & Touche LLP. |
| | |
• Chief Compliance Officer and Sarbanes-Oxley Code of Ethics since 2019 | | Patrick J. Spellman, 47 Vice President, Chief Compliance Officer, AMG Funds LLC (2017-Present); Chief Compliance Officer, AMG Distributors, Inc., (2010-Present); Chief Compliance Officer and Sarbanes-Oxley Code of Ethics Compliance Officer, AMG Funds, AMG Funds I, AMG Funds II, AMG Funds III and AMG Funds IV (2019-Present); Senior Vice President, Chief Compliance Officer, AMG Funds LLC (2011-2017); Anti-Money Laundering Compliance Officer, AMG Funds, AMG Funds I, AMG Funds II, and AMG Funds III (2014-2019); Anti-Money Laundering Officer, AMG Funds IV, (2016-2019); Compliance Manager, Legal and Compliance, Affiliated Managers Group, Inc. (2005-2011). |
26
| | |
| | | AMG Funds Trustees and Officers (continued) |
| | | |
| | | |
| | |
| Position(s) Held with Fund and Length of Time Served | | Name, Age, Principal Occupation(s) During Past 5 Years |
| |
• Assistant Secretary since 2016 | | Maureen A. Meredith, 36 Vice President, Senior Counsel, AMG Funds LLC (2021-Present); Vice President, Counsel, AMG Funds LLC (2019-2021); Director, Counsel, AMG Funds LLC (2017-2018); Vice President, Counsel, AMG Funds LLC (2015-2017); Assistant Secretary, AMG Funds, AMG Funds I, AMG Funds II, AMG Funds III and AMG Funds IV (2016-Present); Associate, Ropes & Gray LLP (2011-2015); Law Fellow, Massachusetts Appleseed Center for Law and Justice (2010-2011). |
| | |
• Anti-Money Laundering Compliance Officer since 2019 | | Hector D. Roman, 43 Director, Legal and Compliance, AMG Funds LLC (2020-Present); Anti-Money Laundering Compliance Officer, AMG Funds, AMG Funds I, AMG Funds II, AMG Funds III and AMG Funds IV (2019-Present); Manager, Legal and Compliance, AMG Funds LLC (2017-2019); Director of Compliance, Morgan Stanley Investment Management (2015-2017); Senior Advisory, PricewaterhouseCoopers LLP (2014-2015); Risk Manager, Barclays Investment Bank (2008-2014). |
27
| | |
| | | Annual Renewal of Investment Management and Subadvisory Agreements |
| | | |
| | | |
| | | | | | | | |
AMG Veritas Global Real Return Fund (formerly AMG Managers Brandywine Blue Fund): Approval of Investment Management Agreement on June 24, 2021 At a meeting held via telephone and video conference on June 24, 2021,1 the Board of Trustees (the “Board” or the “Trustees”), and separately a majority of the Trustees who are not “interested persons” of AMG Funds I (the “Trust”) (the “Independent Trustees”), approved the Investment Management Agreement, as amended pursuant to letter agreements at any time prior to the date of the meeting, with AMG Funds LLC (the “Investment Manager”) for AMG Veritas Global Real Return Fund (formerly AMG Managers Brandywine Blue Fund) (the “Fund”) and separately each of Amendment No. 1 thereto dated July 1, 2015, and Amendment No. 2 thereto dated October 1, 2016 (collectively, the “Investment Management Agreement”).2 The Independent Trustees were separately represented by independent legal counsel in connection with their consideration of the approval of the Investment Management Agreement. In considering the Investment Management Agreement, the Trustees reviewed a variety of materials relating to the Fund and the Investment Manager including the nature, extent and quality of services, comparative performance, fee and expense information for an appropriate peer group of similar mutual funds for the Fund (the “Peer Group”), performance information for the relevant benchmark index for the Fund (the “Fund Benchmark”), other relevant matters, and other information provided to them on a periodic basis throughout the year. Prior to voting, the Independent Trustees: (a) reviewed the foregoing information with their independent legal counsel; (b) received materials from their independent legal counsel discussing the legal standards applicable to their consideration of the Investment Management Agreement; and (c) met with their independent legal counsel in private sessions at which no representatives of management were present. NATURE, EXTENT AND QUALITY OF SERVICES In considering the nature, extent and quality of the services provided by the Investment Manager, the Trustees reviewed information relating to the Investment Manager’s operations and personnel. Among other things, the Investment Manager provided financial information, information about its supervisory and professional staff and descriptions of its organizational and management structure. The Trustees also took into account information provided periodically throughout the previous year by the Investment Manager in Board meetings relating to | | | | the performance of its duties with respect to the Fund and the Trustees’ knowledge of the Investment Manager’s management and the quality of the performance of the Investment Manager’s duties under the Investment Management Agreement and Administration Agreement. In the course of their deliberations regarding the Investment Manager, the Trustees evaluated, among other things: (a) the extent and quality of the Investment Manager’s oversight of the operation and management of the Fund; (b) the quality of the Investment Manager’s oversight of the performance by the Subadviser of its portfolio management duties; (c) the Investment Manager’s ability to supervise the Fund’s other service providers; and (d) the Investment Manager’s compliance program. The Trustees also took into account that, in performing its functions under the Investment Management Agreement and supervising the Subadviser, the Investment Manager: performs periodic detailed analyses and reviews of the performance by the Subadviser of its obligations to the Fund, including without limitation, analysis and review of portfolio and other compliance matters and review of the Subadviser’s investment performance with respect to the Fund; prepares and presents periodic reports to the Board regarding the investment performance of the Subadviser and other information regarding the Subadviser, at such times and in such forms as the Board may reasonably request; reviews and considers any changes in the personnel of the Subadviser responsible for performing the Subadviser’s obligations and makes appropriate reports to the Board; reviews and considers any changes in the ownership or senior management of the Subadviser and makes appropriate reports to the Board; performs periodic in-person, telephonic or videoconference diligence meetings, including with respect to compliance matters, with representatives of the Subadviser; assists the Board and management of the Trust in developing and reviewing information with respect to the initial approval of the Subadvisory Agreement and annual consideration of the Subadvisory Agreement thereafter; prepares recommendations with respect to the continued retention of the Subadviser or the replacement of the Subadviser, including at the request of the Board; identifies potential successors to, or replacements of, the Subadviser or potential additional subadvisers, including performing appropriate due diligence, and developing and presenting to the Board a recommendation as to any such successor, replacement, or additional subadviser, including at the request of the Board; designates and compensates from its own resources such personnel as the Investment Manager may consider necessary | | | | or appropriate to the performance of its services; and performs such other review and reporting functions as the Board shall reasonably request consistent with the Investment Management Agreement and applicable law. The Trustees noted the affiliation of the Subadviser with the Investment Manager, noting any potential conflicts of interest. The Trustees also took into account the financial condition of the Investment Manager with respect to its ability to provide the services required under the Investment Management Agreement and the Investment Manager’s undertaking to maintain a contractual expense limitation for the Fund. The Trustees also considered the Investment Manager’s risk management processes. PERFORMANCE The Board considered the Fund’s net performance during relevant time periods as compared to the Fund’s Peer Group and Fund Benchmark and noted that the Board reviews on a quarterly basis detailed information about both the Fund’s performance results and portfolio composition, as well as the Subadviser’s investment philosophy, strategy and techniques used in managing the Fund. The Board was mindful of the Investment Manager’s expertise, resources and attention to monitoring the Subadviser’s performance, investment style and risk-adjusted performance with respect to the Fund and its discussions with the management of the Fund’s subadvisers during the period regarding the factors that contributed to the performance of the Fund. Among other information relating to the Fund’s performance (including the predecessor fund’s performance for periods prior to its acquisition by the Trust on October 1, 2013), the Trustees noted that the Fund’s performance for Class I shares (the Fund’s sole share class) for the 1-year, 3-year, 5-year and 10-year periods ended March 31, 2021 was above the median performance of the Peer Group and above the performance of the Fund Benchmark, the Bloomberg U.S. Treasury Inflation-Linked Bond Index. The Trustees also took into account management’s discussion of the Fund’s performance, noting that the Fund ranked in the top decile relative to its Peer Group for all relevant time periods and in the top percentile relative to its Peer Group for the 5-year and 10-year periods. The Trustees also took into account the fact that the Fund’s subadviser, investment strategy, and Fund Benchmark changed effective March 19, 2021, and that the performance information reflected that of the Fund’s prior |
28
| | |
| | | Annual Renewal of Investment Management and Subadvisory Agreements (continued) |
| | | |
| | | |
| | | | | | | | |
subadviser and investment strategy. The Trustees concluded that the Fund’s overall performance has been satisfactory. ADVISORY FEES; FUND EXPENSES; PROFITABILITY; AND ECONOMIES OF SCALE In considering the reasonableness of the advisory fee payable to the Investment Manager, the Trustees reviewed information provided by the Investment Manager at the June 24, 2021 and prior meetings setting forth all revenues and other benefits, both direct and indirect (including any so-called “fallout benefits” such as reputational value derived from the Investment Manager serving as Investment Manager to the Fund), received by the Investment Manager and its affiliates attributable to managing the Fund and all the mutual funds in the AMG Funds Family of Funds; the cost of providing such services; the significant risks undertaken as Investment Manager and sponsor of the Fund, including investment, operational, enterprise, entrepreneurial, litigation, regulatory and compliance risks; and the resulting profitability to the Investment Manager and its affiliates from these relationships. The Trustees also considered the change to the subadvisory fee rate and the new expense cap that were implemented during the past year for the Fund. The Trustees also considered the amount of the advisory fee retained by the Investment Manager after payment of the subadvisory fee with respect to the Fund. The Trustees also noted payments made or to be made from the Subadviser to the Investment Manager, and other payments made or to be made from the Investment Manager to the Subadviser. The Trustees also considered management’s discussion of the current asset level of the Fund, and the impact on profitability of both the current asset level and any future growth of assets of the Fund. In considering the cost of services to be provided by the Investment Manager under the Investment Management Agreement and the profitability to the Investment Manager of its relationship with the Fund, the Trustees noted the undertaking by the Investment Manager to maintain a contractual expense limitation for the Fund. The Board also took into account management’s discussion of the advisory fee structure, and the services the Investment Manager provides in performing its functions under the Investment Management Agreement and supervising the Subadviser. Based on the foregoing, the Trustees concluded that the profitability to the Investment Manager is reasonable and that the Investment Manager is not realizing | | | | material benefits from economies of scale that would warrant adjustments to the advisory fee at this time. Also with respect to economies of scale, the Trustees noted that as the Fund’s assets increase over time, the Fund may realize other economies of scale to the extent the increase in assets is proportionally greater than the increase in certain other expenses. The Trustees noted that the Fund’s management fees (which include both the advisory and administration fees) and total expenses as of March 31, 2021 were both lower than the average for the Peer Group. The Trustees took into account the fact that, effective May 18, 2021, the Investment Manager has contractually agreed, through February 1, 2023, to limit the Fund’s net annual operating expenses (subject to certain excluded expenses) to 1.11%. The Trustees concluded that, in light of the nature, extent and quality of the services provided by the Investment Manager, the foregoing expense limitation and the considerations noted above with respect to the Investment Manager, the Fund’s advisory fees are reasonable. The Trustees also considered information provided by the Investment Manager throughout the previous year related to the benefits of the strategic repositioning of the AMG Funds complex for greater alignment with Affiliated Managers Group, Inc. (“AMG”), in which each fund that was not previously subadvised by an affiliate of AMG (each affiliate of AMG, an “Affiliate” and collectively, “Affiliates”) was transitioned to an AMG Affiliate subadviser. The Trustees considered that the strategic repositioning was expected to create value for the Fund, the other funds in the AMG Funds complex and their shareholders through enhanced resources and competitive fee levels. The Trustees noted the expectations that the changes would result in bringing the full range of AMG’s resources to bear on the growth and success of the AMG Funds, streamlining the lineup of funds in the AMG Funds complex and reducing the number of subadvisers in the AMG Funds complex, significantly reducing strategy overlap and providing more differentiated investment solutions for the AMG Funds complex that are otherwise not available to U.S. retail investors. The Trustees further considered the expectation that the repositioning would bring AMG’s strong partnerships in support of the Fund and the AMG Funds complex as a whole and enable AMG Funds to bring the best capabilities of AMG’s Affiliates to the Fund and the rest of the AMG Funds complex. The Trustees noted that AMG’s relationship with its Affiliates will also allow the Fund to have | | | | greater insight into the Affiliates’ compliance and business platform than is generally possible with third party subadvisers, aiding the ongoing monitoring of subadvisers. * * * * * After consideration of the foregoing, the Trustees also reached the following conclusions (in addition to the conclusions discussed above) regarding the Investment Management Agreement: (a) the Investment Manager has demonstrated that it possesses the capability and resources to perform the duties required of it under the Investment Management Agreement and (b) the Investment Manager maintains an appropriate compliance program. Based on all of the above-mentioned factors and their related conclusions, with no single factor or conclusion being determinative and with each Trustee not necessarily attributing the same weight to each factor, the Trustees concluded that approval of the Investment Management Agreement would be in the best interests of the Fund and its shareholders. Accordingly, on June 24, 2021, the Trustees, and separately a majority of the Independent Trustees, voted to approve the Investment Management Agreement for the Fund. 1 The Trustees determined that the conditions surrounding COVID-19 constituted unforeseen or emergency circumstances and that reliance on the Securities and Exchange Commission’s (“SEC”) exemptive order, which provides relief from the in-person voting requirements of the Investment Company Act of 1940, as amended (the “1940 Act”), in certain circumstances (the “In-Person Relief”), was necessary or appropriate due to the circumstances related to current or potential effects of COVID-19. The Trustees unanimously wished to rely on the In-Person Relief with respect to the approval of those matters on the agenda for the June 24, 2021 meeting that would otherwise require in-person votes under the 1940 Act. See Investment Company Release No. 33897 (June 19, 2020). This exemptive order supersedes, in part, a similar, earlier exemptive order issued by the SEC (Investment Company Release No. 33824 (March 25, 2020)). 2 At a meeting held via telephone and videoconference on March 17-18, 2021, the Board of the Trust, and separately a majority of the Independent Trustees, approved the Subadvisory Agreement with respect to the Fund (the “Subadvisory Agreement”). The Subadvisory Agreement was subsequently approved by the Fund’s shareholders at a special meeting held on May 18, 2021, for an initial two-year period. |
29
| | |
| | | Funds Liquidity Risk Management Program |
| | | |
| | | |
| | | | | | | | |
The Securities and Exchange Commission (the “SEC”) adopted Rule 22e-4 under the Investment Company Act of 1940, as amended (the “Liquidity Rule”), to promote effective liquidity risk management throughout the open-end investment company industry, thereby reducing the risk that a fund will be unable to meet its redemption obligations and mitigating dilution of the interests of fund shareholders. The AMG Funds Family of Funds (each a “Fund,” and collectively, the “Funds”) have adopted and implemented a Liquidity Risk Management Program (the “Program”) as required by the Liquidity Rule. The Program is reasonably designed to assess and manage each Fund’s liquidity risk, taking into consideration the Fund’s investment strategy and the liquidity of its portfolio investments during normal and reasonably foreseeable stressed conditions, its short and long-term cash flow projections, and its holdings of cash and cash equivalents, as well as borrowing arrangements and other funding sources, including access to the Funds’ credit facility. Under the Liquidity Rule, each liquidity classification category (highly liquid, moderately liquid, less liquid and illiquid) is defined with respect to the time it is reasonably expected to take to convert the investment to cash (or sell or dispose of the investment) in current market conditions without significantly changing the market value of the investment. The Funds’ Board of Trustees (the “Board”) appointed AMG Funds, LLC (“AMGF”) as the Program administrator. AMGF formed a Liquidity Risk Management Committee (“LRMC”), which includes | | | | members of various departments across AMGF, including Legal, Compliance, Mutual Fund Services, Investment Research and Product Analysis & Operations and, as needed, other representatives of AMGF and/or representatives of the subadvisers to the Funds. The LRMC meets on a periodic basis, no less frequently than monthly. The LRMC is responsible for the Program’s administration and oversight and for reporting to the Board on at least an annual basis regarding the Program’s operation and effectiveness. At a meeting of the Board held on March 17-18, 2021, the Board received a report from the LRMC regarding the design and operational effectiveness of the Program for the period January 1, 2020 through December 31, 2020 (the “Program Reporting Period”). The Program complied with the key factors for consideration under the Liquidity Rule for assessing, managing and periodically reviewing a Fund’s liquidity risk, as follows: A. The Fund’s investment strategy and liquidity of portfolio investments during both normal and reasonably foreseeable stressed conditions: During the Program Reporting Period, the LRMC reviewed whether each Fund’s investment strategy and liquidity of portfolio investments during both normal and reasonably foreseeable stressed conditions is appropriate for an open-end fund structure. The LRMC also factored a Fund’s concentration in an issuer into the liquidity classification methodology by taking issuer position sizes into account. | | | | B. Short-term and long-term cash flow projections during both normal and reasonably foreseeable stressed conditions: During the Program Reporting Period, the LRMC reviewed historical net redemption activity and used this information as a component to establish each Fund’s reasonably anticipated trading size. The Funds maintain an in-kind redemption policy, which may be utilized to meet larger redemption requests, when appropriate. The LRMC may also take into consideration a Fund’s shareholder ownership concentration, a Fund’s distribution channels, and the degree of certainty associated with a Fund’s short-term and long-term cash flow projections. C. Holdings of cash and cash equivalents, as well as borrowing arrangements: The LRMC considered the terms of the credit facilities available to the Funds. The report concluded that, based upon the review of the Program, using resources and methodologies that AMGF considers reasonable, AMGF believes that the Program and Funds’ Liquidity Risk Management Policies and Procedures are adequate, effective, and reasonably designed to effectively manage the Funds’ liquidity risk. There can be no assurance that the Program will achieve its objectives in the future. Please refer to each Fund’s prospectus or statement of additional information for more information regarding a Fund’s exposure to liquidity risk and other principal risks to which an investment in a Fund may be subject. |
30
THIS PAGE INTENTIONALLY LEFT BLANK
THIS PAGE INTENTIONALLY LEFT BLANK
| | | | | | | | |
INVESTMENT MANAGER AND ADMINISTRATOR AMG Funds LLC 680 Washington Blvd., Suite 500 Stamford, CT 06901 800.548.4539 DISTRIBUTOR AMG Distributors, Inc. 680 Washington Blvd., Suite 500 Stamford, CT 06901 800.548.4539 SUBADVISER Veritas Asset Management LLP 1 Smart’s Place London, WC2B 5LW CUSTODIAN The Bank of New York Mellon Mutual Funds Custody 6023 Airport Road Oriskany, NY 13424 | | | | LEGAL COUNSEL Ropes & Gray LLP Prudential Tower, 800 Boylston Street Boston, MA 02199-3600 TRANSFER AGENT BNY Mellon Investment Servicing (US) Inc. Attn: AMG Funds 4400 Computer Drive Westborough, MA 01581 800.548.4539 | | | | This report is prepared for the Fund’s shareholders. It is authorized for distribution to prospective investors only when preceded or accompanied by an effective prospectus. To receive a free copy of the prospectus or Statement of Additional Information, which includes additional information about Fund Trustees, please contact us by calling 800.548.4539. Distributed by AMG Distributors, Inc., member FINRA/SIPC. Current net asset values per share for the Fund are available on the Funds’ website at amgfunds.com. A description of the policies and procedures the Fund uses to vote its proxies is available: (i) without charge, upon request, by calling 800.548.4539, or (ii) on the Securities and Exchange Commission’s (SEC) website at sec.gov. For information regarding the Fund’s proxy voting record for the 12-month period ended June 30, call 800.548.4539 or visit the SEC website at sec.gov. The Fund files its complete schedule of portfolio holdings with the SEC for the first and third quarters of each fiscal year as an exhibit to their reports on Form N-PORT. The Fund’s portfolio holdings on Form N-PORT are available on the SEC’s website at sec.gov and the Fund’s website at amgfunds.com. To review a complete list of the Fund’s portfolio holdings, or to view the most recent semiannual report or annual report, please visit amgfunds.com. |
| | | | | | | | |
| | | | | | | | |
BALANCED FUNDS AMG GW&K Global Allocation GW&K Investment Management, LLC AMG FQ Global Risk-Balanced First Quadrant, L.P. EQUITY FUNDS AMG Beutel Goodman International Equity Beutel, Goodman & Company Ltd. AMG Boston Common Global Impact Boston Common Asset Management, LLC AMG Managers CenterSquare Real Estate CenterSquare Investment Management LLC AMG Frontier Small Cap Growth Frontier Capital Management Co., LLC AMG GW&K Small Cap Core AMG GW&K Small Cap Value AMG GW&K Small/Mid Cap AMG GW&K Small/Mid Cap Growth AMG GW&K Emerging Markets Equity AMG GW&K Emerging Wealth Equity AMG GW&K International Small Cap GW&K Investment Management, LLC AMG Montrusco Bolton Large Cap Growth Montrusco Bolton Investments, Inc. | | | | AMG Renaissance Large Cap Growth The Renaissance Group LLC AMG River Road Dividend All Cap Value AMG River Road Focused Absolute Value AMG River Road International Value Equity AMG River Road Large Cap Value Select AMG River Road Mid Cap Value AMG River Road Small-Mid Cap Value AMG River Road Small Cap Value River Road Asset Management, LLC AMG TimesSquare Emerging Markets Small Cap AMG TimesSquare Global Small Cap AMG TimesSquare International Small Cap AMG TimesSquare Mid Cap Growth AMG TimesSquare Small Cap Growth TimesSquare Capital Management, LLC AMG Veritas Asia Pacific AMG Veritas China AMG Veritas Global Focus AMG Veritas Global Real Return Veritas Asset Management LLP AMG Yacktman AMG Yacktman Focused AMG Yacktman Global AMG Yacktman Special Opportunities Yacktman Asset Management LP | | | | FIXED INCOME FUNDS AMG Beutel Goodman Core Plus Bond Beutel, Goodman & Company Ltd. AMG GW&K Core Bond ESG AMG GW&K Enhanced Core Bond ESG AMG GW&K ESG Bond AMG GW&K High Income AMG GW&K Municipal Bond AMG GW&K Municipal Enhanced Yield GW&K Investment Management, LLC |
| | | | | | | | | |
| | | | | | | | | |
| | | | | | | | | |
| | | | | | | | | |
| | | | | | | | | |
| | | | | | | | | |
| | | | | | | | | |
| | | | | | | | | |
| | | | | | | | | |
| | | | | | | | | |
| | | | |
| amgfunds.com | | | | 093021 AR073 |
Item 2. CODE OF ETHICS
Registrant has adopted a Code of Ethics. See attached Exhibit (a)(1).
Item 3. AUDIT COMMITTEE FINANCIAL EXPERT
Registrant’s Board of Trustees has determined that independent Trustee Mr. Steven J. Paggioli qualifies as an Audit Committee Financial Expert. Mr. Paggioli is “independent” as such term is defined in Form N-CSR.
Item 4. PRINCIPAL ACCOUNTANT FEES AND SERVICES
(a) Audit Fees
The aggregate fees billed by the Funds’ independent registered public accounting firm, PricewaterhouseCoopers LLP (“PwC”), to the Funds for the Funds’ two most recent fiscal years for professional services rendered for audits of annual financial statements, or services that are normally provided in connection with statutory and regulatory filings or engagements (“Audit Fees”) were as follows:
| | | | | | | | |
| | | Fiscal 2021 | | | Fiscal 2020 | |
AMG Boston Common Global Impact Fund | | $ | 25,008 | | | $ | 27,956 | |
AMG Veritas Global Real Return Fund | | $ | 23,557 | | | $ | 24,979 | |
(b) Audit-Related Fees
There were no fees billed by PwC to the Funds in their two recent fiscal years for services rendered for assurance and related services that are reasonably related to the performance of the audit or review of the Funds’ financial statements, but are not reported as Audit Fees (“Audit-Related Fees”).
For the Funds’ two most recent fiscal years, there were no Audit-Related Fees billed by PwC for engagements related directly to the operations and financial reporting of one or more Funds by a Fund Service Provider. A Fund Service Provider is (a) any investment adviser to the Fund (not including any Subadvisor whose role is primarily portfolio management and is subcontracted with or overseen by another investment adviser) or (b) any entity that provides ongoing services to the Fund and is controlling, controlled by or under common control with a Fund investment adviser described in (a).
(c) Tax Fees
The aggregate fees billed by PwC to the Funds for the two most recent fiscal years for professional services rendered for tax compliance, tax advice, and tax planning (“Tax Fees”) were as follows:
| | | | | | | | |
| | | Fiscal 2021 | | | Fiscal 2020 | |
AMG Boston Common Global Impact Fund | | $ | 6,250 | | | $ | 6,250 | |
AMG Veritas Global Real Return Fund | | $ | 6,250 | | | $ | 6,250 | |
For the Funds’ two most recent fiscal years, Tax Fees billed by PwC for engagements by Fund Service Providers that related directly to the operations and financial reporting of the Funds were $0 for fiscal 2021 and $0 for fiscal 2020, respectively.
The services for which Tax Fees were charged comprise all services performed by professional staff in PwC’s tax division except those services related to the audit. Typically, this category would include fees for tax compliance, tax planning, and tax advice. Tax compliance, tax advice, and tax planning services include preparation of original and amended tax returns, claims for refund and tax payment-planning services, assistance with tax audits and appeals, tax advice related to mergers and acquisitions and requests for rulings or technical advice from taxing authorities.
(d) All Other Fees
There were no other fees billed by PwC to the Funds for all other non-audit services (“Other Fees”) during the Funds’ two most recent fiscal years. During the same period, there were no Other Fees billed by PwC for engagements by Fund Service Providers that related directly to the operations and financial reporting of the Funds.
(e)(1)According to policies adopted by the Audit Committee, services provided by PwC to the Funds must be pre-approved by the Audit Committee. On an annual basis, the Audit Committee reviews and pre-approves various types of services that PwC may perform for the Funds without specific approval of each engagement, subject to specified budget limitations. As contemplated by the Sarbanes-Oxley Act of 2002 and related SEC rules, the Audit Committee also pre-approves non-audit services provided by PwC to any Fund Service Provider for any engagement that relates directly to the operations and financial reporting of the Funds. Any engagement that is not already pre-approved or that will exceed a pre-approved budget must be submitted to the Audit Committee for pre-approval. The Chairman of the Audit Committee is authorized on behalf of the Board of Trustees and the Audit Committee to approve the engagement of PwC to perform non-audit services subject to certain conditions, including notification to the Audit Committee of such pre-approval not later than the next meeting of the Audit Committee following the date of such pre-approval.
(e)(2) None.
(f) Not applicable.
(g) The aggregate fees billed by PwC in 2021 and 2020 for non-audit services rendered to the Funds and Fund Service Providers were $54,875 and $62,000, respectively. For the fiscal year ended September 30, 2021, this amount reflects the amounts disclosed above in Item 4(b),(c),(d), plus $42,375 in fees billed to the Fund Service Providers for non-audit services that did not relate directly to the operations and financial reporting of the Funds. For the fiscal year ended September 30, 2020, this amount reflects the amounts disclosed above in Item 4(b),(c),(d), plus $49,500 in fees billed to the Fund Service Providers for non-audit services that did not relate directly to the operations and financial reporting of the Funds.
(h) The Trust’s Audit Committee has considered whether the provision of non-audit services by registrant’s independent registered public accounting firm to the registrant’s investment advisor, and any entity controlling, controlled, or under common control with the investment advisor that provided ongoing services to the registrant that were not pre-approved by the Committee (because such services did not relate directly to the operations and financial reporting of the registrant) was compatible with maintaining the independence of the independent registered public accounting firm.
Item 5. AUDIT COMMITTEE OF LISTED REGISTRANTS
Not applicable.
Item 6. SCHEDULE OF INVESTMENTS
The schedule of investments in unaffiliated issuers as of the close of the reporting period is included as part of the shareholder report contained in Item 1 hereof.
Item 7. DISCLOSURE OF PROXY VOTING POLICIES AND PROCEDURES FOR CLOSED-END MANAGEMENT INVESTMENT COMPANIES
Not applicable.
Item 8. PORTFOLIO MANAGERS OF CLOSED-END MANAGEMENT INVESTMENT COMPANIES
Not applicable.
Item 9. PURCHASES OF EQUITY SECURITIES BY CLOSED-END MANAGEMENT INVESTMENT COMPANIES AND AFFILIATED PURCHASERS
Not applicable.
Item 10. SUBMISSION OF MATTERS TO A VOTE OF SECURITY HOLDERS
Not applicable.
Item 11. CONTROLS AND PROCEDURES
(a) The Registrant’s principal executive and principal financial officers have concluded, based on their evaluation of the registrant’s disclosure controls and procedures as of a date within 90 days of the filing of this report, that the Registrant’s disclosure controls and procedures are reasonably designed to ensure that information required to be disclosed by the Registrant on Form N-CSR is recorded, processed, summarized and reported within the required time periods and that information required to be disclosed by the registrant in the reports that it files or submits on Form N-CSR is accumulated and communicated to the Registrant’s management, including its principal executive and principal financial officers, as appropriate to allow timely decisions regarding required disclosure.
(b) There were no changes in the Registrant’s internal control over financial reporting during the period covered by this report that have materially affected, or are reasonably likely to materially affect, the internal control over financial reporting.
Item 12. DISCLOSURE OF SECURITIES LENDING ACTIVITIES FOR CLOSED-END MANAGEMENT INVESTMENT COMPANIES
Not applicable.
Item 13. EXHIBITS
SIGNATURES
Pursuant to the requirements of the Securities Exchange Act of 1934 and the Investment Company Act of 1940, the registrant has duly caused this report to be signed on its behalf by the undersigned, thereunto duly authorized.
| | |
| AMG FUNDS I |
| |
| By: | | /s/ Keitha L. Kinne |
| | Keitha L. Kinne, Principal Executive Officer |
| |
| Date: | | December 3, 2021 |
Pursuant to the requirements of the Securities Exchange Act of 1934 and the Investment Company Act of 1940, this report has been signed below by the following persons on behalf of the registrant and in the capacities and on the dates indicated.
| | |
| By: | | /s/ Keitha L. Kinne |
| | Keitha L. Kinne, Principal Executive Officer |
| |
| Date: | | December 3, 2021 |
| |
| By: | | /s/ Thomas Disbrow |
| | Thomas Disbrow, Principal Financial Officer |
| |
| Date: | | December 3, 2021 |