FORM 6-K
SECURITIES AND EXCHANGE COMMISSION
Washington, D.C. 20549
Report of Foreign Private Issuer
Pursuant to Rule 13a-16 or 15d-16
of the Securities Exchange Act of 1934
For the month of April, 2010
Commission File Number 1-11080
Commission File Number 1-11080
THE ICA CORPORATION
(Translation of registrant's name into English)
(Translation of registrant's name into English)
Blvd. Manuel Avila Camacho 36
Col. Lomas de Chapultepec
Del. Miguel Hidalgo
11000 Mexico City
Mexico
(Address of principal executive offices)
Col. Lomas de Chapultepec
Del. Miguel Hidalgo
11000 Mexico City
Mexico
(Address of principal executive offices)
Indicate by check mark whether the registrant files or will file annual reports under cover Form 20-F or Form 40-F.
Form 20-F.....x.... Form 40-F.........
Indicate by check mark if the registrant is submitting the Form 6-K in paper as permitted by Regulation S-T Rule 101(b)(1): ____
Indicate by check mark if the registrant is submitting the Form 6-K in paper as permitted by Regulation S-T Rule 101(b)(7): ____
Indicate by check mark whether by furnishing the information contained in this Form, the registrant is also thereby furnishing the information to the Commission pursuant to Rule 12g3-2(b) under the Securities Exchange Act of 1934.
Yes ..... No...x...
If "Yes" is marked, indicate below the file number assigned to the registrant in connection with Rule 12g3-2(b): 82- ________
First Quarter 2010 Earnings Report
April 26, 2010
Empresas ICA, S.A.B. de C.V. (BMV and NYSE: ICA), the largest engineering, construction, procurement and infrastructure company in Mexico, announced today its unaudited results for the first quarter of 2010.
Summary
| Summary | |||
| (Ps. million) | 1Q09 | 1Q10 | % Chg |
| Revenues | 6,853 | 7,004 | 2 |
| Operating Income | 573 | 605 | 5 |
| Income before Taxes | 319 | 401 | 26 |
| Consolidated Net Income (Loss) | 197 | 273 | 38 |
| Net Income (Loss) of Majority Interest | 113 | 216 | 91 |
| Adjusted EBITDA | 953 | 1,180 | 24 |
| Operating Margin | 8.4% | 8.6% | |
| Adjusted EBITDA Margin | 13.9% | 16.8% | |
| EPS (Ps.) | 0.23 | 0.33 | |
| EPADS (US$) | 0.07 | 0.10 | |
| Construction Backlog | 36,678 | 38,163 | 4 |
During the first quarter of 2010, ICA continued to take advantage of the opportunities for infrastructure development in Mexico and other markets in Latin America. Four of ICA’s principal business division recorded growth. Civil Construction is executing the highest volume of projects in the Company’s history, including several of the emblematic projects of the current Mexican government. Concessions also contributed significantly to revenue growth, both as a result of operating concessions that are continuing to mature as well as those that are in the construction phase. At the same time, the Airports and Housing divisions, which have been the areas most affected by Mexico’s recession and the global economic crisis, reported growth and their operations are showing signs of an underlying economic recovery. The growth of these divisions was partially offset by Industrial Construction, where several major projects were being concluded, and new large-scale projects that were recently awarded have not yet begun to contribute significant revenue. Rodio’s revenues also continue to decrease as a result of the recession in Spain.
Major new projects that were recently awarded are expected to enable ICA’s growth trajectory to continue. Most importantly, Industrial Construction won the clean fuels contract for the Minatitlán and Salina Cruz refineries during the quarter. The backlog for Industrial Construction is now the equivalent of 39 months of this division’s revenues, and is expected to set the stage for significant growth of this division over the coming quarters. Civil Construction backlog also increased as a result of the award of the Atotonilco water treatment project in Hidalgo and the PAC-4 contract in Panama, which is part of the expansion of the Panama Canal. As a result, ICA’s consolidated Backlog reached Ps. 38,164 million as of March 31, 2010, a new all-time high for the Company.
For more information contact: | |
Alonso Quintana (5255) 5272 9991 x 3653 alonso.quintana@ica.com.mx | In the United States: Zemi Communications |
Luciana Garcia (5255) 5272 9991 x 3697 luciana.garcia@ica.com.mx | Daniel Wilson (212) 689 9560 dbmwilson@zemi.com |
| | EARNINGS REPORT |
ICA’s consolidated revenues increased 2% in 1Q10 to Ps. 7,004 million; income before tax increased 26%; and net income of majority interest increased 91%. Strict cost controls across the organization, and particularly in the divisions most affected by the economic crisis, have helped sustain margins. Operating income increased 5%, while Adjusted EBITDA increased 24%. The Adjusted EBITDA margin was 16.8%. (See Notes for definition of Adjusted EBITDA).
ICA currently expects to generate consolidated revenue growth of 15% to 20% in 2010, with an estimated Adjusted EBITDA margin of 16% to 18%.
As a result of the higher volume of work, debt increased significantly over the past 12 months. ICA’s policy is to finance those projects that require debt at the project level and in the same currency as the source of payment for the project; currently all debt is related to projects. ICA does not have any holding company debt.
ICA’s well-diversified portfolio of businesses, our experience, emphasis on excellence in project execution, strict cost controls, and a solid financial position are expected to enable the Company to continue taking advantage of the opportunities in construction and infrastructure development in Mexico and other markets in Latin America.
INVESTOR RELATIONS | www.ica.com.mx | 2/21 |
| | EARNINGS REPORT |
Construction
Civil Construction
| Civil Construction | 1Q09 | 1Q10 | % Chg |
| Revenues | 4,020 | 4,488 | 12 |
| Operating Income | 132 | 174 | 32 |
| Adjusted EBITDA | 245 | 378 | 54 |
| Operating Margin | 3.3% | 3.9% | |
| Adjusted EBITDA Margin | 6.1% | 8.4% | |
| Debt | 4,773 | 8,598 | |
| Cash and Cash Equivalents | 645 | 388 | |
| Backlog | 33,974 | 28,091 | (17) |
| · | Civil Construction revenues increased principally as a result of execution of contracts awarded in 2007 and 2008, including the La Yesca hydroelectric project, the Mexico City Metro Line 12, work on the Red de Carreteras de Occidente (RCO or Farac I) toll roads, and the Eastern Outlet Tunnel. |
· | Operating Income increased principally because revenues grew at a faster rate than costs. The increase in Adjusted EBITDA and Adjusted EBITDA margin also reflects an increase in depreciation and amortization. |
· | The increase in debt was principally the result of additional draws on the La Yesca debt facility as a result of approved certifications for completed work on the project. The La Yesca hydroelectric project, which has been undertaken under the financed public works mechanism, accounted for 69% of debt in Civil Construction. The debt is expected to be repaid in full upon project completion. |
| Largest revenue contribution projects | Executed Work (Ps. Million) | Scheduled Completion |
| La Yesca Hydroelectric Project | 857 | 3Q12 |
| Line 12 Mexico City Subway | 702 | 2Q12 |
| FARAC I | 368 | 3Q10 |
| Eastern Outlet Tunnel | 303 | 1Q13 |
| Rio de los Remedios Ecatepec Highway | 237 | 1Q11 |
| Nuevo Necaxa - Tihuatlán Highway | 210 | 2Q12 |
INVESTOR RELATIONS | www.ica.com.mx | 3/21 |
| | EARNINGS REPORT |
Industrial Construction
| Industrial Construction | 1Q09 | 1Q10 | % Chg |
| Revenues | 1,099 | 739 | (33) |
| Operating Income | 64 | 10 | (85) |
| Adjusted EBITDA | 72 | 25 | (65) |
| Operating Margin | 5.8% | 1.3% | |
| Adjusted EBITDA Margin | 6.6% | 3.4% | |
| Debt | 566 | 470 | |
| Cash and Cash Equivalents | 586 | 699 | |
| Backlog | 2,261 | 9,611 | 325 |
| · | Revenues decreased as a result of the completion of projects including the Minatitlán II and Dos Bocas terminal projects, while new projects have not yet begun to contribute significantly. |
· | The projects that contributed most to revenues were the Chicontepec II oil field services project, the Poza Rica cryogenic plant, and the Minatitlán II refinery reconfiguration project. |
· | Debt decreased principally as a result of the payment of the loan for the Dos Bocas terminal project. |
· | Industrial Construction backlog increased by more than four times as compared to March 31, 2009 as a result of the award of new projects including the clean fuels projects for the Minatitlán and Salina Cruz refineries in 1Q10 and other projects in the second half of 2009 that are in their start up phase. Industrial Construction backlog accounts for 25% of total Backlog. (See Backlog discussion). |
| Largest revenue contribution projects | Executed Work (Ps. Million) | Scheduled Completion |
| Chicontepec II Oil Field, Veracruz | 200 | 3Q11 |
| Poza Rica Criogenic Plant | 134 | 4Q11 |
| Minatitlan II refinery reconfiguration | 117 | 2Q10 |
INVESTOR RELATIONS | www.ica.com.mx | 4/23 |
| | EARNINGS REPORT |
Rodio
| Rodio | 1Q09 | 1Q10 | % Chg |
| Revenues | 375 | 331 | (12) |
| Operating Income | 3 | 12 | 301 |
| Adjusted EBITDA | 20 | 24 | 20 |
| Operating Margin | 0.8% | 3.6% | |
| Adjusted EBITDA Margin | 5.4% | 7.3% | |
| Debt | 163 | 189 | 16 |
| Cash and Cash Equivalents | 58 | 84 | 43 |
| Backlog | 444 | 460 | 4 |
· | Revenues decreased as a result of the recession in Spain and the paralysis in the start up of new public works projects in that market. This was partially offset by increased activity in Mexico and Central America. |
· | The largest contributor to revenues was the fabrication of pilings for the Port of Barcelona and the Centro de Madrid project. |
· | Operating income increased in part because of the cancellation of a provision for work on the Madrid Convention Center. |
· | Rodio continues to execute the strict expense control and optimization of costs programs initiated in 2008, which has offset the decrease in revenues and contributed to increased margins. |
INVESTOR RELATIONS | www.ica.com.mx | 5/21 |
| | EARNINGS REPORT |
Construction Backlog
| As of March 31st, 2010 | Current Backlog | Termination Date | Total Contract (Ps. million) | Project Progress (%) | |
| Civil Construction | 74% | 28,091 | |||
| Line 12 Mexico City Subway | 4,637 | 2Q12 | 7,923 | 41 | |
| Eastern Outlet Tunnel | 3,807 | 1Q13 | 4,765 | 20 | |
| Rio de los Remedios Ecatepec Highway | 3,007 | 1Q11 | 4,914 | 39 | |
| La Yesca Hydroelectric Project | 2,850 | 3Q12 | 9,776 | 71 | |
| Atotonilco Water Treatment Plant | 1,845 | 3Q13 | 1,845 | 0 | |
| Nuevo Necaxa - Tihuatlán Highway | 1,798 | 2Q12 | 2,829 | 36 | |
| PAC-4 | 1,504 | 4Q13 | 1,504 | 0 | |
| Rio Verde - Ciudad Valles Highway | 1,339 | 2Q10 | 2,617 | 49 | |
| La Piedad Bypass | 1,215 | 1Q11 | 1,312 | 7 | |
| El Realito Aqueduct | 1,053 | 1Q12 | 1,053 | 0 | |
| Other Civil Construction Projects | 5,038 | ||||
| Industrial Construction | 25% | 9,611 | |||
| Salina Cruz Clean Gasoline Plant | 2,333 | 2Q13 | 2,333 | 0 | |
| Madero Clean Gasoline Plant | 2,298 | 2Q13 | 2,410 | 5 | |
| Cadereyta Clean Gasoline Plant | 1,639 | 2Q13 | 1,742 | 6 | |
| Minatitlán Clean Gasoline Plant | 1,588 | 1Q13 | 1,588 | 0 | |
| Poza Rica Criogenic Plant | 1,346 | 3Q11 | 1,696 | 21 | |
| Other Industrial Construction Projects | 407 | ||||
| Rodio | 1% | 460 | |||
Projects in Spain, Morocco, Russia and Central America | 460 | ||||
| Total | 38,163 | ||||
· | Backlog reached a new all-time high for the Company of Ps. 38,163 million as of March 31, 2010. Civil Construction accounts for 74% of Backlog, Industrial Construction 25%, and Rodio 1%. Backlog was the equivalent of 21 months work at 1Q10 levels. |
· | New contracts and net contract additions totaled Ps. 8,936 million in 1Q10. The major new projects were the Atotonilco water treatment plant and the PAC-4 Panama Canal expansion contract in Civil Construction and the clean fuels refinery upgrades for the Minatitlán and Salina Cruz refineries. |
· | Seven projects accounted for 46% of Backlog: the Mexico City Metro Line 12, the Eastern Outlet Tunnel, the Madero, Cadereyta, Minatitlán, and Salina Cruz clean fuels projects, and the Poza Rica cryogenic plant. In aggregate, these projects were 21% completed as of March 31, 2010. |
· | 36% percent of projects were unit price contracts, 32% were fixed price contracts, and 32% had both unit price and fixed price components. |
· | Foreign currency denominated projects were 28% of Backlog. These included the La Yesca hydroelectric project, the Poza Rica cryogenic plant, a portion of the Madero, Cadereyta, Minatitlán, and Salina Cruz clean fuels projects, and the PAC-4 contract in Panama. |
· | The ratio of new contracts to construction revenues (the book and burn ratio) was 1.62 during 1Q10. |
INVESTOR RELATIONS | www.ica.com.mx | 6/21 |
| | EARNINGS REPORT |
| (million pesos) | Months Work (a) | ||
| Balance, December 31, 2009 | 34,733 | 19 | |
| New contracts and net contract additions | 8,986 | 5 | |
| Work executed | 5,557 | 3 | |
| Balance, March 31, 2010 | 38,163 | 21 | |
| Share of Backlog | |||
| Projects in Mexico | 95% | ||
| Projects outside Mexico | 5% | ||
| Public sector clients | 93% | ||
| Private sector clients | 7% | ||
| (a) Based on construction revenues at 1Q10 levels | |||
| Contract Additions | Contract value (Ps. Million) | Startup | Scheduled completion | |
| Salina Cruz Clean Gasolines | 2,333 | 1Q10 | 2Q13 | |
| PTAR Atotonilco | 1,845 | 4Q10 | 4Q13 | |
| Minatitlán Clean Gasolines | 1,588 | 1Q10 | 1Q13 | |
| PAC-4 | 1,504 | 1Q10 | 3Q13 |
INVESTOR RELATIONS | www.ica.com.mx | 7/21 |
| | EARNINGS REPORT |
Infrastructure
Concessions
| Concessions | 1Q09 | 1Q10 | % Chg |
| Total Revenues | 545 | 633 | 16 |
| Traffic | 305 | 307 | 1 |
| Financial | 104 | 156 | 50 |
| Services | 76 | 94 | 24 |
| Construction | 59 | 75 | 26 |
| Operating Income | 138 | 186 | 34 |
| Adjusted EBITDA | 281 | 401 | 42 |
| Operating Margin | 25.4% | 29.3% | |
| Adjusted EBITDA Margin | 51.7% | 63.3% | |
| Debt | 8,868 | 10,309 | 16 |
| Cash and Cash Equivalents | 1,514 | 1,710 | 13 |
· | On March 25, 2010, ICA and the Government of Panama announced an agreement in principle for the Government of Panama to acquire the Corredor Sur expressway for US$420 million. A definitive agreement has not yet been signed, and this transaction has not yet been reflected in the financial statements. |
· | Revenues increased principally as a result of execution of projects that are under construction that generate financial and construction revenue. Revenues from operation and maintenance increased as a result of a higher level of activity on the RCO toll roads. |
· | Adjusted EBITDA increased principally as a result of increased contribution from projects in operation and an increase in net interest expense included in cost of sales for financed projects under construction. |
· | Debt increased as a result of the advance in the execution of projects that are under construction, principally Río Verde-Ciudad Valles, Nuevo Necaxa-Tihuatlán, Aqueduct II, and the La Piedad bypass. |
· | ICA acquired one new concession during the quarter—the Atotonilco water treatment plant, which has not yet started construction. As a result, ICA now has five water projects and ten concessioned highway projects. Of the fifteen concessions, six are in operation. We are reporting traffic for the Querétaro-Irapuato public-private partnership (PPP) highway, although this project is still under construction, and it is not generating significant revenues. |
INVESTOR RELATIONS | www.ica.com.mx | 8/21 |
| | EARNINGS REPORT |
| Highways | % Ownership | Equity + Debt | Length (km) | Type | Beg. of Operations | Avg. Daily Traffic Volume (ADTV) | |
| 1Q09 | 1Q10 | ||||||
| Acapulco Tunnel | 100% | 1,803 | 3 | Toll | 1994 | 10,049 | 9,397 |
| Corredor Sur | 100% | 2,550 | 20 | Toll | 2000 | 41,091 | 43,510 |
| RCO (FARAC 1) | 14% | 6,387 | 558 | Toll | 2007 | 8,659 | 8,780 |
| Del Mayab | 100% | 1,323 | 242 | Toll | 2008 | 2,443 | 2,338 |
| Irapuato- La Piedad | 100% | 827 | 74 | PPP | 2008 | 9,155 | 9,591 |
| Under Construction | |||||||
| Queretaro-Irapuato | 100% | 1,532 | 93 | PPP | 2010 | 11,986 | |
| Rio Verde Cd. Valles | 100% | 1,650 | 113 | PPP+Toll | 2010 | ||
| La Piedad Bypass | 100% | 782 | 74 | PPP+Toll | 2010 | ||
| Rio de los Remedios | 50% | 588 | 24 | Toll | 2010-11 | ||
| N.Necaxa Tihuatlan | 50% | 1,234 | 85 | PPP+Toll | 2012 | ||
| Water projects | % Ownership | Equity + Debt | Capacity (m3 mm) | Type | Beg. of Operations | Average Volume (million m3) | |
| 1Q09 | 1Q10 | ||||||
| Cd. Acuna | 100% | 323 | 0.45 | Tariff | 1998 | 2.60 | 2.50 |
| Under Construction | |||||||
| Aqueduct II | 42% | 877 | 1.5 | Tariff | 2010 | ||
| El Realito | 51% | 3 | 1.0 | Tariff | 2012 | ||
| Agua Prieta | 50% | 8.5 | Tariff | 2012 | |||
| Atotonilco | 10% | 42.0 | Tariff | ||||
INVESTOR RELATIONS | www.ica.com.mx | 9/21 |
| | EARNINGS REPORT |
Airports
| Airports | 1Q09 | 1Q10 | % Chg |
| Total Revenues | 486 | 510 | 5 |
| Aeronautical | 395 | 399 | 1 |
| Non- Aeronautical | 91 | 95 | 4 |
| Operating Income | 197 | 185 | (6) |
| Adjusted EBITDA | 296 | 293 | (1) |
| Operating Margin | 40.6% | 36.2% | |
| Adjusted EBITDA Margin | 60.9% | 57.4% | |
| Debt | 2,642 | 3,199 | 21 |
| Cash and Cash Equivalents | 311 | 301 | (3) |
| Total Assets | 10,198 | 11,177 | 10 |
| (millions) | 1Q09 | 1Q10 | % Chg |
| Total passenger traffic | 3.05 | 2.80 | (8.2) |
| Domestic | 2.42 | 2.19 | (9.3) |
| International | 0.63 | 0.60 | (4.2) |
| Cargo Units (=100kg) | 0.16 | 0.22 | 37.8 |
· | The Airports division includes Grupo Aeroportuario del Centro Norte (OMA), Aeroinvest, and Servicios de Tecnología Aeroportuaria (SETA). |
· | Total Revenues increased 5%, with growth in both aeronautical and non-aeronautical revenues, despite the reduction in traffic. Airports generated an EBITDA margin of 57.4% in the quarter. Notable were revenues generated by the NH Terminal 2 Hotel at the Mexico City International Airport (“NH T2 hotel”), and the year over year increases in revenues from OMA Carga (+87.4%), advertising (+18.5%), and parking (+2.4%). Operating indicators also improved, with increases in the number of takeoffs and landings (+2.1%) and the volume of cargo transported (+37.8%). In addition, the occupancy rate for the NH T2 hotel reached 42.2% for the full quarter. |
· | The earnings report of OMA, which is the operating company in the Airports segment, can be found at http://www.bmv.com.mx or http://ir.oma.aero. Those results differ from the ones presented here as a result of consolidation effects. |
INVESTOR RELATIONS | www.ica.com.mx | 10/21 |
| | EARNINGS REPORT |
Housing Development
| Housing | 1Q09 | 1Q10 | % Chg |
| Total Revenues | 487 | 501 | 3 |
| Operating Income | 38 | 43 | 13 |
| Adjusted EBITDA | 39 | 63 | 62 |
| Operating Margin | 7.8% | 8.5% | |
| Adjusted EBITDA Margin | 8.0% | 12.6% | |
| Debt | 1,772 | 1,396 | (21) |
| Cash and Cash Equivalents | 113 | 50 | (56) |
| Units Sold | 1Q09 | 1Q10 | % Chg |
| Total | 1,487 | 1,644 | 11 |
| Entry level | 70% | 55% | |
| Middle income | 10% | 9% | |
| Economical | 5% | 27% | |
| Traditional | 15% | 10% |
· | ViveICA sold 1,644 units in 1Q10, an increase of 11%, even though FOVISSSTE, the government agency that typically finances more expensive homes, did not begin approving mortgages until the middle of March. |
· | Operating margins increased as a result of staff reductions that reduced general and administrative expenses and lower selling costs as a result of a change to a more efficient advertising strategy. |
· | At the end of 1Q10, ViveICA had 22 projects underway in 11 states in Mexico. The land reserve as of March 31, 2010 was 1,936 hectares, equivalent to 97,171 units. The reserve is distributed among 26 projects in 12 states, with a majority focused on social interest housing. |
· | Effective 1Q09, ViveICA elected early adoption of INIF-14, which requires that revenue be recognized only upon transfer of title to the property. |
INVESTOR RELATIONS | www.ica.com.mx | 11/21 |
| | EARNINGS REPORT |
Consolidated First Quarter and Full Year Results
| First Quarter | |||
| 1Q09 | 1Q10 | % Chg | |
| (Ps. Million) | |||
| Revenues | 6,853 | 7,004 | 2 |
| Costs | 5,818 | 5,936 | 2 |
| Gross profit | 1,034 | 1,067 | 3 |
| Selling, general and operating expenses | 461 | 463 | 0 |
| Operating Income | 573 | 605 | 5 |
| Other income (loss), net | 59 | 1 | (98) |
| Comprehensive financing (cost) | (201) | (161) | (20) |
| Interest Expense | (284) | (268) | (5) |
| Interest Income | 76 | 80 | 5 |
| Exchange (Loss) Gain | 2 | 58 | 3,552 |
| Financial derivative effects | 5 | (31) | |
| Share in net income of affiliated companies | (112) | (44) | (61) |
| Income before taxes | 319 | 401 | 26 |
| Taxes | 122 | 129 | 6 |
| Consolidated net income (loss) | 197 | 273 | 38 |
| Net income (loss) of minority interest | 84 | 57 | (32) |
| Net income (loss) of majority interest | 113 | 216 | 91 |
| Earnings per share (Ps.) | Ps. 0.23 | Ps. 0.33 | |
| Earnings per ADS (US$) | US$ 0.07 | US$ 0.10 | |
| Weighted average shares outstanding (millions) | 493.15 | 645.69 | |
Revenues were Ps. 7,004 million in 1Q10, an increase of 2% as compared to Ps. 6,853 million in 1Q09. Civil Construction and Concessions accounted for most revenue growth, which was partially offset by reductions in Industrial Construction.
Cost of sales increased 2%, in line with revenue growth. Cost of sales includes interest expense on financed projects in Civil Construction, Industrial Construction, Concessions, and Housing.
General and administrative expenses were practically unchanged from 1Q09.
Operating income was Ps. 605 million in 1Q10, an increase of 5%. The Infrastructure segment contributed 61% of operating income, Construction 32%, and Housing 7%. The consolidated operating margin was 8.6%, as compared to 8.4% in 1Q09.
Other Income decreased; there were no significant transactions recorded in this line item in 1Q10.
Comprehensive financing cost decreased as a result of a higher exchange gain and lower interest expense, which was partially offset by a loss on financial derivative hedges.
Share of net loss of unconsolidated affiliates was a loss of Ps. 44 million, as compared to a loss of Ps. 112 million in 1Q09. The improved result reflects lower financial costs incurred by RCO, the operator of the FARAC I tollroads.
Income before taxes totaled Ps. 401 million in the first quarter, an increase of 26%.
INVESTOR RELATIONS | www.ica.com.mx | 12/21 |
| | EARNINGS REPORT |
Taxes increased in 1Q10 based on estimates for full year obligations. Of the total tax provision of Ps. 129 million, only 34% is cash taxes. The effective tax rate was 32%
Consolidated net income was Ps. 273 million in 1Q10, an increase of 38%.
Net income of majority interest was Ps. 216 million, an increase of 91%.
| o | Earning per share were Ps. 0.33. |
| o | Earnings per ADS were US$0.10. |
Adjusted EBITDA
| (Ps. Million) | 1Q09 | 1Q10 | % Chg |
| Net income (loss) of majority interest | 113 | 216 | 91 |
| Net income (loss) of minority interest | 84 | 57 | (32) |
| Taxes | 122 | 129 | 6 |
| Share in (loss) income of affiliated companies | (112) | (44) | (61) |
| Comprehensive financing (cost) | (201) | (161) | (20) |
| Other income (expense), net | 59 | 1 | (98) |
| Depreciation and amortization | 259 | 339 | 31 |
| Net interest expense included in cost of sales | 121 | 236 | 96 |
| Adjusted EBITDA | 953 | 1,180 | 24 |
| Adjusted EBITDA Margin | 13.9% | 16.8% |
· | Adjusted EBITDA is not a financial measure computed under U.S. GAAP or MFRS and should not be considered an indicator of financial performance or free cash flow. We define Adjusted EBITDA as net income of majority interest plus (i) net income of minority interest, (ii) income taxes, (iii) share in net income of affiliates, (iv) comprehensive financing cost, (v) other (income) expense, net, (vi) depreciation and amortization, and (vii) net interest expense included in cost of sales. Our management believes that Adjusted EBITDA provides a useful measure of its performance, supplemental to net income and operating income, because it excludes the effects of financing decisions, minority shareholdings, and other non-operating items. The calculation of Adjusted EBITDA is also provided as a result of requests from the financial community and is widely used by investor s in order to calculate ratios and to make estimates of the total value of our company in comparison to other companies. Financial ratios calculated on the base of Adjusted EBITDA are also widely used by credit providers in order to gauge the debt servicing capacity of companies and are relevant measures under one or more of our or our subsidiaries’ financing agreements. |
INVESTOR RELATIONS | www.ica.com.mx | 13/21 |
| | EARNINGS REPORT |
Total Debt
| March 31 | ||||
| Total debt (Ps.million) | 2009 | 2010 | % Var | |
| Short Term | 4,107 | 4,915 | 20 | |
| Long Term | 15,173 | 19,245 | 27 | |
| Total Debt | 19,280 | 24,160 | 25 | |
| Total Cash | 3,396 | 3,333 | (2) | |
| Net Debt | 15,884 | 20,827 | 31 | |
| Weighted average interest rate | 11.0% | 8.4% | ||
| Debt by type of currency | Short Term | Long Term | ||
| (Ps. million) | MXN | FX | MXN | FX |
| Civil | 1,909 | 682 | - | 6,006 |
| Industrial | 470 | - | - | - |
| Rodio | - | 165 | - | 24 |
| Concessions | 282 | 306 | 7,984 | 1,736 |
| Airports | 340 | - | 2,859 | - |
| Housing | 761 | - | 636 | - |
| Subtotal | 3,762 | 1,153 | 11,478 | 7,767 |
| Total | 4,915 | 19,245 | ||
| Total Debt | 24,160 | |||
· | Total debt increased as a result of the execution of projects that require financing, and in accordance with the terms of the financings for those projects, and was partially offset by the payment of debt of Industrial Construction projects that are being completed. ICA expects that debt will continue to increase in step with the advance of execution of concessions and financed projects such as the La Yesca hydroelectric project. |
· | 68% percent of debt is bank debt and 32% is securities debt, principally for concessions. |
· | 20% of debt is short-term. Of this, 65% represents working capital lines for Civil Construction, Industrial Construction, and Rodio; 19% is in the Infrastructure segment, and includes the current portion of long-term debt and OMA working capital lines; and 16% is in Housing Development, for construction loans and working capital lines. |
· | Long-term debt is 80% of total debt: 65% is in Concessions and Airports; 31% is for the La Yesca hydroelectric project; and the balance is for structured financings in Housing with terms of more than one year. |
· | ICA’s policy is to contract financing in the same currency as the source of repayment; 37% of total debt is denominated in foreign currencies, principally U.S. dollars. |
· | 100% of debt is related to projects; ICA has no debt at the holding company level. |
INVESTOR RELATIONS | www.ica.com.mx | 14/21 |
| | EARNINGS REPORT |
| Debt maturity profile | 2010 | 1 year | 2 years | 3 years | > 3 years |
| Total | 4,464 | 451 | 1,468 | 7,614 | 10,163 |
| Bank Debt | 4,246 | 441 | 1,135 | 7,254 | 3,429 |
| Securities Debt | 218 | 10 | 333 | 360 | 6,734 |
Financial Derivative Instruments
| Project | Type of Instrument | Mark to Market (Ps. million) | ||
| 12/31/2009 | 03/31/2010 | 04/19/2010 | ||
| Consolidated Subsidiaries | ||||
| La Yesca Hydroelectric Project | CAP | 36 | 10 | - |
| Floor | (364) | (339) | - | |
| FX Fwd | (303) | (167) | (135) | |
| Querétaro- Irapuato | SWAPTION | (43) | (45) | (26) |
| Irapuato- La Piedad | CAP | 1 | 0 | |
| Acapulco Tunnel | CAP | 16 | 4 | |
| Aqueduct II* | CAP | 0 | 0 | |
| Nuevo Necaxa- Tihuatlán* | SWAP | (171) | (262) | (271) |
| ICA, Río de la Compañía Tunnel | FX SWAP | 13 | 3 | |
| ICA, Leasing credit line | CAP | 1 | - | |
| ICA Viabilis | SWAP | 0 | - | |
| Rio Verde- Cd. Valles Highway | SWAP | (223) | (268) | (279) |
| La Piedad Bypass | SWAP | - | (30) | (33) |
| AEROINVEST | SWAP | - | (2) | |
| COTRISA | FX Fwd / Fx CAP | - | (4) | |
| Non consolidated affiliates | - | |||
| FARAC1, RCO | SWAP UDIS | (146) | (220) | (242) |
| * Proportional consolidation | ||||
| ** Thousand pesos | ||||
Conference Call Invitation
· | ICA invites you to participate in a conference call on April 26, at 4:30 pm Eastern Time (3:30 pm Mexico City time). In order to participate, please call 1 (888) 549-7704 from the U.S. or +1 (480) 629-9857 internationally. The conference ID is 4284778. A replay will be available until May 3, 2010 by calling (800) 406-7325 from the U.S. or +1 (303) 590-3030 internationally, with the same reference code. |
· | The conference call will also be available via Webcast |
http://phx.corporate-ir.net/phoenix.zhtml?p=irol-eventDetails&c=83646&eventID=3022913
INVESTOR RELATIONS | www.ica.com.mx | 15/21 |
| | EARNINGS REPORT |
Consolidated Statement of Income, First Quarter
| First Quarter | |||
| 1Q09 | 1Q10 | % Chg | |
| (Ps. Million) | |||
| Revenues | 6,853 | 7,004 | 2 |
| Costs | 5,818 | 5,936 | 2 |
| Gross profit | 1,034 | 1,067 | 3 |
| Selling, general and operating expenses | 461 | 463 | 0 |
| Operating Income | 573 | 605 | 5 |
| Other income (loss), net | 59 | 1 | (98) |
| Comprehensive financing (cost) | (201) | (161) | (20) |
| Interest Expense | (284) | (268) | (5) |
| Interest Income | 76 | 80 | 5 |
| Exchange (Loss) Gain | 2 | 58 | 3,552 |
| Financial derivative effects | 5 | (31) | |
| Share in net income of affiliated companies | (112) | (44) | (61) |
| Income before taxes | 319 | 401 | 26 |
| Taxes | 122 | 129 | 6 |
| Consolidated net income (loss) | 197 | 273 | 38 |
| Net income (loss) of minority interest | 84 | 57 | (32) |
| Net income (loss) of majority interest | 113 | 216 | 91 |
| Earnings per share (Ps.) | Ps. 0.23 | Ps. 0.33 | |
| Earnings per ADS (US$) | US$ 0.07 | US$ 0.10 | |
| Weighted average shares outstanding (millions) | 493.15 | 645.69 | |
INVESTOR RELATIONS | www.ica.com.mx | 16/21 |
| | EARNINGS REPORT |
Consolidated Balance Sheet
| March 31, | ||
| 2009 | 2010 | |
| (Ps. Million) | ||
| Assets | ||
| Short Term Cash and Cash Equivalents | 3,396 | 3,333 |
| Trade and Contract Receivables | 7,973 | 8,383 |
| Other Receivables | 1,770 | 2,976 |
| Inventories | 3,954 | 3,573 |
| Other Current Assets | 1,389 | 1,751 |
| Total Current Assets | 18,482 | 20,017 |
| Trade and Contract Receivables | 4,984 | 10,748 |
| Restricted Cash | 441 | 516 |
| Investment in Subsidiaries & Affiliates | 246 | 88 |
| Other Investments | 21,536 | 26,245 |
| Investment in Concessions | 19,673 | 23,363 |
| Long Term Inventories | 1,863 | 2,882 |
| Long Term Assets | 27,207 | 37,598 |
| Property, Plant and Equipment Net | 3,521 | 4,384 |
| Other Assets | 2,955 | 4,194 |
| Total Assets | 52,165 | 66,193 |
| Liabilities | ||
| Accounts Payable | 2,843 | 4,898 |
| Current Debt | 4,107 | 4,915 |
| Other Current Liabilities | 7,544 | 8,677 |
| Total Current Liabilities | 14,495 | 18,490 |
| Long-Term Debt | 15,173 | 19,245 |
| Other Noncurrent Liabilities | 5,000 | 7,747 |
| Total Liabilities | 34,668 | 45,482 |
| Majority Stockholders' Equity | 14,231 | 16,712 |
| Minority Interest in Consolidated Subsidiaries | 3,266 | 3,999 |
| Stockholders' Equity | 17,497 | 20,711 |
| Total Liabilities and Stockholders' Equity | 52,165 | 66,193 |
INVESTOR RELATIONS | www.ica.com.mx | 17/21 |
| | EARNINGS REPORT |
Statement of Cash Flows
| 3 months | ||
| 2009 | 2010 | |
| (Ps. Million) | ||
| Operating Activities | ||
| Income before taxes | 319 | 401 |
| Items in income that do not affect cash | 851 | 457 |
| Resources used in operations | (2,763) | (1,658) |
| Net flow from operating activities | (1,593) | (799) |
| Investing activities | ||
| Acquisition of businesses | - | - |
| Acquisition of real estate, machinery and equipment | (228) | (105) |
| Acquisition of other long term assets | - | (628) |
| Sale of real estate, machinery and equipment | 32 | 1 |
| Others | (588) | (64) |
| Net flow from investing activities | (784) | (795) |
| Financing activities | ||
| Borrowings | 1,991 | 2,661 |
| Debt payments | (654) | (1,135) |
| Interest expense | (445) | (357) |
| Financial lease payments | (16) | (32) |
| Decreases in minority interest | (72) | (57) |
| Increases in majority shareholders' equity | - | - |
| Share repurchases | (8) | - |
| Financing for financial derivatives | 145 | (41) |
| Net cash flow from financing activities | 941 | 1,038 |
| Net change in cash and cash equivalents | (1,436) | (557) |
| Adjustments in Cash Flow for Exchange Variations | (21) | (104) |
| Cash and cash equivalents at beginning of period | 4,853 | 4,511 |
| Cash and cash equivalents at end of period | 3,396 | 3,849 |
INVESTOR RELATIONS | www.ica.com.mx | 18/21 |
| | EARNINGS REPORT |
Empresas ICA, S.A.B. de C.V.
Consolidated Segment Information, First Quarter
| 1Q09 | 1Q10 | %Var | 1Q09 | 1Q10 | %Var | 1Q09 | 1Q10 | ||||
| Revenues | Operating Income | Operating Margin | |||||||||
| Civil | 4,020 | 4,488 | 12 | 132 | 174 | 32 | 3.3% | 3.9% | |||
| Industrial | 1,099 | 739 | (33) | 64 | 10 | (85) | 5.8% | 1.3% | |||
| Rodio | 375 | 331 | (12) | 3 | 12 | 301 | 0.8% | 3.6% | |||
| Construction | 5,494 | 5,557 | 1 | 199 | 196 | (1) | 3.6% | 3.5% | |||
| Housing | 487 | 501 | 3 | 38 | 43 | 13 | 7.8% | 8.5% | |||
| Other Concessions | 545 | 633 | 16 | 138 | 186 | 34 | 25.4% | 29.3% | |||
| Airports | 486 | 510 | 5 | 197 | 185 | (6) | 40.6% | 36.2% | |||
| Infrastructure | 1,030 | 1,142 | 11 | 336 | 370 | 10 | 32.6% | 32.4% | |||
| Other* | (159) | (197) | 24 | 1 | (5) | ||||||
| TOTAL | 6,853 | 7,004 | 2 | 573 | 605 | 5 | 8.4% | 8.6% | |||
| Depr. & Amort. | Adjusted EBITDA | Adjusted EBITDA Margin | |||||||||
| Civil | 69 | 134 | 95 | 245 | 378 | 54 | 6.1% | 8.4% | |||
| Industrial | 8 | 7 | (15) | 72 | 25 | (65) | 6.6% | 3.4% | |||
| Rodio | 17 | 12 | (29) | 20 | 24 | 20 | 5.4% | 7.3% | |||
| Construction | 95 | 154 | 62 | 338 | 427 | 26 | 6.1% | 7.7% | |||
| Housing | 1 | 3 | 163 | 39 | 63 | 62 | 8.0% | 12.6% | |||
| Other Concessions | 67 | 82 | 24 | 281 | 401 | 42 | 51.7% | 63.3% | |||
| Airports | 98 | 99 | 1 | 296 | 293 | (1) | 60.9% | 57.4% | |||
| Infrastructure | 165 | 182 | 10 | 577 | 693 | 20 | 56.0% | 60.7% | |||
| Other* | (2) | 1 | (1) | (4) | 405 | ||||||
| TOTAL | 259 | 339 | 31 | 953 | 1,180 | 24 | 13.9% | 16.8% | |||
| Total Assets | Debt | Investments | |||||||||
| Civil | 16,355 | 28,372 | 73 | 4,773 | 8,598 | 80 | 292 | 301 | 3 | ||
| Industrial | 2,962 | 2,600 | (12) | 566 | 470 | (17) | 3 | 5 | 95 | ||
| Rodio | 1,336 | 1,100 | (18) | 163 | 189 | 16 | 16 | 2 | (85) | ||
| Construction | 20,652 | 32,072 | 55 | 5,503 | 9,256 | 68 | 310 | 308 | (1) | ||
| Housing | 5,471 | 5,935 | 8 | 1,772 | 1,396 | (21) | 1 | 2 | 116 | ||
| Other Concessions | 17,915 | 21,438 | 20 | 8,868 | 10,309 | 16 | 602 | 310 | (48) | ||
| Airports | 10,198 | 11,177 | 10 | 2,642 | 3,199 | 21 | 197 | 158 | (20) | ||
| Infrastructure | 28,113 | 32,615 | 16 | 11,510 | 13,508 | 17 | 799 | 469 | (41) | ||
| Other* | (2,070) | (4,429) | 114 | 495 | - | 3 | 0 | (84) | |||
| TOTAL | 52,165 | 66,193 | 27 | 19,280 | 24,160 | 25 | 1,113 | 779 | (30) | ||
INVESTOR RELATIONS | www.ica.com.mx | 19/21 |
| | EARNINGS REPORT |
Notes and disclaimers
Mexican Financial Reporting Standards (MFRS): financial statements and other information are presented in accordance with Mexican Financial Reporting Standards and their Interpretations (INIFs). These norms differ in certain significant respects from U.S. GAAP. |
| Adoption of new accounting statements |
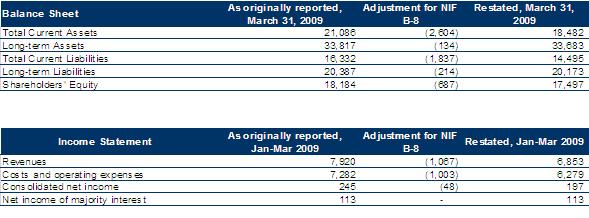
NIF B-8, “Consolidated or combined financial statements.” Effective with the 4Q09 results, the financial statements reflect accounting statement NIF B-8, “Consolidated or combined financial statements.” As a result, ICA adopted the proportional consolidation method for the results of its subsidiary ICA Fluor, which is a joint investment with Fluor Corporation. This NIF establishes that full consolidation of a subsidiary requires control, defined as the power to decide financial and operating policies, and not simply holding a majority of voting shares. As a result of the application of this norm, net income of majority interest is unchanged. However, revenues and expenses, as well as assets and liabilities are consolidated 51%. Previously, ICA Fluor was consolidated 100%. Financial statements for prior periods have been recalculated. |
Unaudited financials: financial statements are unaudited, preliminary statements. |
Prior period comparisons: unless stated otherwise, all comparisons of operating or financial results are made with respect to the comparable prior-year period. Percentage changes are calculated with respect to the actual numbers. |
Adjusted EBITDA: Adjusted EBITDA is not a financial measure computed under U.S. GAAP or MFRS and should not be considered an indicator of financial performance or free cash flow. We define Adjusted EBITDA as net income of majority interest plus (i) net income of minority interest, (ii) income taxes, (iii) share in net income of affiliates, (iv) comprehensive financing cost, (v) other (income) expense, net, (vi) depreciation and amortization, and (vii) net interest expense included in cost of sales. Our management believes that Adjusted EBITDA provides a useful measure of its performance, supplemental to net income and operating income, because it excludes the effects of financing decisions, minority shareholdings, and other non-operating items. The calculation of Adjusted EBITDA is also provided as a result of requests from the financial community and is widely used by investors in order to calculate ratios and to make estimates of the total value of our company in comparison to other companies. Financial ratios calculated on the base of Adjusted EBITDA are also widely used by credit providers in order to gauge the debt servicing capacity of companies and are relevant measures under one or more of our or our subsidiaries’ financing agreements. |
Exchange rate: Amounts in U.S. dollars (US$) are converted at an exchange rate of Ps. 12.3363 per U.S. dollar. |
Financial Derivative Instruments: ICA enters into financial derivative contracts in the subsidiaries where projects are located solely in order to reduce the uncertainty on the returns on projects. The instruments contracted are established on a notional amount. Interest rate derivatives are used in order to fix maximum financial costs. Exchange rate derivatives are contracted in order to reduce the exchange risk on projects that incur labor and materials costs in a currency different from the currency of the financing of the project. ICA contracts its financings in the same currency as the source of repayment. |
INVESTOR RELATIONS | www.ica.com.mx | 20/21 |
| | EARNINGS REPORT |
| From an accounting perspective, there are two classifications for derivative instruments. “Hedging financial instruments” must meet the specific requirements established in Mexican Financial Reporting Standards (MFRS). Other derivative financial instruments that do not meet MFRS requirements for hedge accounting treatment are designated as trading derivatives. ICA values all derivatives at fair value. Fair value is based on market prices for derivatives traded in recognized markets; if no active market exists, fair value is based on other valuation methodologies, validated by first party experts, and supported by sufficient, reliable, and verifiable information. Fair value is recognized in the balance sheet as an asset or liability, in accordance with the rights or obligations derived from the contracts executed and in accordance with accounting norms. Changes in fair value are re corded temporarily in comprehensive income within stockholders’ equity, and are subsequently reclassified to results at the same time that they are affected by the item being hedged. For trading derivatives, the fluctuation in fair value is recognized in results of the period. |
Forward looking statements: This report may contain projections or other forward-looking statements related to ICA that involve risks and uncertainties. Readers are cautioned that these statements are only projections of future events based on assumptions and estimates ICA believes to be reasonable, but these projections may differ materially from actual future results or events. Factors that could cause actual results to differ materially and adversely include, but are not limited to: changes in general economic, business or political or other conditions in Mexico or changes in general economic or business conditions in Latin America, changes in capital markets in general that may affect policies or attitudes towards lending to Mexico or Mexican companies, changes in tax and other laws affecting ICA’s businesses, increased costs, un anticipated increases in financing and other costs or the inability to obtain additional debt or equity financing on attractive terms. Readers are referred to the documents filed by ICA with the United States Securities and Exchange Commission, specifically the most recent filing on Form 20-F which identifies important risk factors that could cause actual results to differ from those contained in the forward-looking statements. All forward-looking statements are based on information available to ICA on the date hereof, and ICA assumes no obligation to update such statements. |
Empresas ICA was founded in 1947. ICA’s principal lines of business are construction and engineering; housing; and infrastructure operations, including airports, toll roads, and municipal services. For more information please visit www.ica.com.mx.
INVESTOR RELATIONS | www.ica.com.mx | 21/21 |
SIGNATURE
Pursuant to the requirements of the Securities Exchange Act of 1934, the registrant has duly caused this Report to be signed on its behalf by the undersigned, thereunto duly authorized.
Date: April 26, 2010
| Empresas ICA, S.A.B. de C.V. | ||
| /s/ JOSE LUIS GUERRERO ALVAREZ | ||
| Name: José Luis Guerrero Alvarez | ||
| Title: Chief Executive Officer | ||