The registrant’s annual report transmitted to shareholders pursuant to Rule 30e-1 under the Investment Company Act of 1940, as amended (the “Investment Company Act”), is as follows:
9.30.2017
Guggenheim Funds Annual Report
| Guggenheim Funds Trust-Equity |
| Guggenheim Alpha Opportunity Fund | | |
| Guggenheim Large Cap Value Fund | | |
| Guggenheim Market Neutral Real Estate Fund | | |
| Guggenheim Risk Managed Real Estate Fund | | |
| Guggenheim Small Cap Value Fund | | |
| Guggenheim StylePlus—Large Core Fund | | |
| Guggenheim StylePlus—Mid Growth Fund | | |
| Guggenheim World Equity Income Fund | | |
| GuggenheimInvestments.com | SBE-ANN-0917x0918 |
| DEAR SHAREHOLDER | 2 |
| ECONOMIC AND MARKET OVERVIEW | 4 |
| ABOUT SHAREHOLDERS’ FUND EXPENSES | 6 |
| ALPHA OPPORTUNITY FUND | 9 |
| LARGE CAP VALUE FUND | 23 |
| MARKET NEUTRAL REAL ESTATE FUND | 34 |
| RISK MANAGED REAL ESTATE FUND | 45 |
| SMALL CAP VALUE FUND | 60 |
| STYLEPLUS—LARGE CORE FUND | 72 |
| STYLEPLUS—MID GROWTH FUND | 85 |
| WORLD EQUITY INCOME FUND | 99 |
| NOTES TO FINANCIAL STATEMENTS | 111 |
| REPORT OF INDEPENDENT REGISTERED PUBLIC ACCOUNTING FIRM | 126 |
| OTHER INFORMATION | 127 |
| INFORMATION ON BOARD OF TRUSTEES AND OFFICERS | 137 |
| GUGGENHEIM INVESTMENTS PRIVACY POLICIES | 141 |
| | THE GUGGENHEIM FUNDS ANNUAL REPORT | 1 |
Dear Shareholder:
Security Investors, LLC and Guggenheim Partners Investment Management, LLC (“GPIM”) (together, “Investment Advisers”), are pleased to present the annual shareholder report for eight equity funds (the “Fund” or “Funds”). The report covers the annual fiscal period ended September 30, 2017.
The Investment Advisers are part of Guggenheim Investments, which represents the investment management businesses of Guggenheim Partners, LLC, (“Guggenheim”) a global, diversified financial services firm.
Guggenheim Funds Distributors, LLC is the distributor of the Funds. Guggenheim Funds Distributors, LLC is affiliated with Guggenheim and the Investment Adviser.
We encourage you to read the Economic and Market Overview section of the report, which follows this letter, and then the Managers’ Commentary for each Fund.
We are committed to providing innovative investment solutions and appreciate the trust you place in us.
Sincerely,
Security Investors, LLC
Guggenheim Partners Investment Management, LLC
October 31, 2017
Read a prospectus and summary prospectus (if available) carefully before investing. It contains the investment objectives, risks, charges, expenses and other information, which should be considered carefully before investing. Obtain a prospectus and summary prospectus (if available) at guggenheiminvestments.com or call 800.820.0888.
This material is not intended as a recommendation or as investment advice of any kind, including in connection with rollovers, transfers, and distributions. Such material is not provided in a fiduciary capacity, may not be relied upon for or in connection with the making of investment decisions, and does not constitute a solicitation of an offer to buy or sell securities. All content has been provided for informational or educational purposes only and is not intended to be and should not be construed as legal or tax advice and/or a legal opinion. Always consult a financial, tax and/ or legal professional regarding your specific situation.
Alpha Opportunity Fund is subject to a number of risks and is not suitable for all investors. ● Investments in securities and derivatives, in general, are subject to market risks that may cause their prices to fluctuate over time. An investment in the Fund may lose money. There can be no guarantee the Fund will achieve it investment objective. ●The Fund’s use of derivatives such as futures, options and swap agreements may expose the Fund to additional risks that it would not be subject to if it invested directly in the securities underlying those derivatives. ● Certain of the derivative instruments, such as swaps and structured notes, are also subject to the risks of counterparty default and adverse tax treatment. ● The more the Fund invests in leveraged instruments, the more the leverage will magnify any gains or losses on those investments. ● The Fund’s use of short selling involves increased risk and costs, including paying more for a security than it received from its sale and the risk of unlimited losses. ● In certain circumstances the Fund may be subject to liquidity risk and it may be difficult for the Fund to purchase and sell particular investments within a reasonable time at a fair price. ● In certain circumstances, it may be difficult for the Fund to purchase and sell particular investments within a reasonable time at a fair price. ●The Fund’s fixed income investments will change in value in response to interest rate changes and other factors. ● See the prospectus for more information on these and additional risks.
Large Cap Value Fund may not be suitable for all investors. ● An investment in the Fund will fluctuate and is subject to investment risks, which means an investor could lose money. ● The intrinsic value of the underlying stocks may never be realized, or the stock may decline in value. The Fund is subject to risk that large-capitalization stocks may underperform other segments of the equity market or the equity markets as a whole.
Market Neutral Real Estate Fund may not be suitable for all investors. ● Investing involves risk, including the possible loss of principal. ● There are no assurances that any fund will achieve its objective and/or strategy. ● The Fund’s investments in real estate securities subject the Fund to the same risks as direct investments in real estate, which is particularly sensitive to economic downturns. ● The Fund’s use of derivatives such as futures, options, and swap agreements may expose the Fund to additional risks that it would not be subject to if it invested directly in the securities underlying those derivatives. ● When market conditions are deemed appropriate, the Fund will leverage to the full extent permitted by its investment policies and restrictions and applicable law. Leveraging will exaggerate the effect on net asset value of any increase or decrease in the market value of the fund’s portfolio. ● The more the Fund invests in leveraged instruments, the more the leverage will magnify any gains or losses on those investments. ● The Fund’s use of short selling involves increased risk and costs. The Fund risks paying more for a security than it received from its sale. ● The Fund’s investments in other investment vehicles subject the Fund to those risks and expenses affecting the investment vehicle. ● The Fund’s investments in foreign securities carry additional risks when compared to U.S. securities, due to the impact of diplomatic, political, or economic developments in the country in question (investments in emerging markets securities are generally subject to an even greater level of risks). ● The Fund may invest in derivative instruments, which may be more volatile and less liquid, increasing the risk of loss when compared to traditional securities. Certain of the derivative instruments are also subject to the risks of counterparty default and adverse tax treatment. ● Investing in sector funds is more volatile than investing in broadly diversified funds, as there is a greater risk due to the concentration of the Funds’ holdings in issuers of the same or similar offerings. ● This Fund is considered non-diversified and can invest a greater portion of its assets in securities of
| 2 | THE GUGGENHEIM FUNDS ANNUAL REPORT | |
individual issuers than a diversified fund. As a result, changes in the market value of a single security could cause greater fluctuations in the value of fund shares than would occur in a more diversified fund. ● Short selling involves increased risks and costs. You risk paying more for a security than you received from its sale. This strategy may not be suitable for all investors. ● The Fund is subject to active trading risks that may increase volatility and impact its ability to achieve its investment objective. ● You may have a gain or loss when you sell your shares. ● It is important to note that the Fund is not guaranteed by the U.S. government. ● Please read the prospectus for more detailed information regarding these and other risks.
Risk Managed Real Estate Fund may not be suitable for all investors. ● Investments in securities in general are subject to market risks that may cause their prices to fluctuate over time ● Investing involves risk, including the possible loss of principal. ● There are no assurances that any fund will achieve its objective and/or strategy. ● The Fund’s investments in real estate securities subject the Fund to the same risks as direct investments in real estate, which is particularly sensitive to economic downturns. ● The Fund’s use of derivatives such as futures, options and swap agreements may expose the fund to additional risks that it would not be subject to if it invested directly in the securities underlying those derivatives. ● When market conditions are deemed appropriate, the Fund will leverage to the full extent permitted by its investment policies and restrictions and applicable law. Leveraging will exaggerate the effect on net asset value of any increase or decrease in the market value of the Fund’s portfolio. ● The more the Fund invests in leveraged instruments, the more the leverage will magnify any gains or losses on those investments. ● The Fund’s use of short selling involves increased risk and costs. The Fund risks paying more for a security than it received from its sale. ● The Fund’s investments in other investment vehicles subject the Fund to those risks and expenses affecting the investment vehicle. ● The Fund’s investments in foreign securities carry additional risks when compared to U.S. securities, due to the impact of diplomatic, political or economic developments in the country in question (investments in emerging markets securities are generally subject to an even greater level of risks). ● The Fund may invest in derivative instruments, which may be more volatile and less liquid, increasing the risk of loss when compared to traditional securities. Certain of the derivative instruments are also subject to the risks of counterparty default and adverse tax treatment. ● Investing in sector funds is more volatile than investing in broadly diversified funds, as there is a greater risk due to the concentration of the funds’ holdings in issuers of the same or similar offerings. ● This Fund is considered non-diversified and can invest a greater portion of its assets in securities of individual issuers than a diversified fund. As a result, changes in the market value of a single security could cause greater fluctuations in the value of fund shares than would occur in a more diversified fund. ● Short selling involves increased risks and costs. You risk paying more for a security than you received from its sale. This strategy may not be suitable for all investors. ● The Fund is subject to active trading risks that may increase volatility and impact its ability to achieve its investment objective. ● You may have a gain or loss when you sell you shares. ● It is important to note that the Fund is no guaranteed by the U.S. government. ● Please read the prospectus for more detailed information regarding these and other risks.
Small Cap Value Fund may not be suitable for all investors. ● An investment in the Fund will fluctuate and is subject to investment risks, which means investors could lose money. ● The intrinsic value of the underlying stocks may never be realized, or the stock may decline in value. ● Investing in securities of small-capitalization companies may involve a greater risk of loss and more abrupt fluctuations in market price than investments in larger-capitalization companies.
StylePlus—Large Core Fund may not be suitable for all investors. ● Investments in large capitalization stocks may underperform other segments of the equity market or the equity market as a whole. ● Growth stocks may be more volatile than other stocks because they are more sensitive to investor perceptions regarding the growth potential of the issuing companies. Value stocks are subject to the risk that the intrinsic value of the stock may never be realized by the market or that the price goes down.● The Fund may invest in derivative instruments, which may be more volatile and less liquid, increasing the risk of loss when compared to traditional securities. Certain of the derivative instruments are also subject to the risks of counterparty default and adverse tax treatment. ● The Fund’s use of leverage, through borrowings or instruments such as derivatives, may cause the Fund to be more volatile than if it had not been leveraged. ● The Fund’s investments in other investment vehicles subject the Fund to those risks and expenses affecting the investment vehicle. ● The Fund may invest in foreign securities which carry additional risks when compared to U.S. securities, due to the impact of diplomatic, political or economic developments in the country in question (investments in emerging markets securities are generally subject to an even greater level of risks). ● The Fund may invest in fixed income securities whose market value will change in response to interest rate changes and market conditions among other factors. In general, bond prices rise when interest rates fall and vice versa. ● The Fund’s exposure to high yield securities may subject the Fund to greater volatility. ● The Fund may invest in bank loans and asset-backed securities, including mortgage backed, which involve special types of risks. ● The Fund may invest in restricted securities which may involve financial and liquidity risk. ● You may have a gain or loss when you sell your shares. ● It is important to note that the Fund is not guaranteed by the U.S. government. ● Please read the prospectus for more detailed information regarding these and other risks.
StylePlus—Mid Growth Fund may not be suitable for all investors. ● Investments in mid-sized company securities may present additional risks such as less predictable earnings, higher volatility and less liquidity than larger, more established companies. ● Growth stocks may be more volatile than other stocks because they are more sensitive to investor perceptions regarding the growth potential of the issuing companies. ● The Fund may invest in derivative instruments, which may be more volatile and less liquid, increasing the risk of loss when compared to traditional securities. Certain of the derivative instruments are also subject to the risks of counterparty default and adverse tax treatment. ● The Fund’s use of leverage, through borrowings or instruments such as derivatives, may cause the Fund to be more volatile than if it had not been leveraged. ● The Fund’s investments in other investment vehicles subject the Fund to those risks and expenses affecting the investment vehicle. ● The Fund may invest in foreign securities which carry additional risks when compared to U.S. securities, due to the impact of diplomatic, political or economic developments in the country in question (investments in emerging markets securities are generally subject to an even greater level of risks). ● The Fund may invest in fixed income securities whose market value will change in response to interest rate changes and market conditions, among other factors. In general, bond prices rise when interest rates fall and vice versa. ● The Fund’s exposure to high yield securities may subject the Fund to greater volatility. ● The Fund may invest in bank loans and asset-backed securities, including mortgage backed, which involve special types of risks. ● The Fund may invest in restricted securities which may involve financial and liquidity risk. ● You may have a gain or loss when you sell your shares. ● It is important to note that the Fund is not guaranteed by the U.S. government. ● Please read the prospectus for more detailed information regarding these and other risks.
World Equity Income Fund may not be suitable for all investors. ●Investments in securities in general are subject to market risks that may cause their prices to fluctuate over time. ●The Fund’s investments in foreign securities carry additional risks when compared to U.S. securities, due to the impact of diplomatic, political or economic developments in the country in question (investments in emerging markets are generally subject to an even greater level of risks). Additionally, the Fund’s exposure to foreign currencies subjects the fund to the risk that those currencies will decline in value relative to the U.S. Dollar. ● The Fund’s investments in derivatives may pose risks in addition to those associated with investing directly in securities or other investments, including illiquidity of the derivatives, imperfect correlations with underlying investments or the Fund’s other portfolio holdings, lack of availability and counterparty risk. ● The Fund’s use of leverage, through instruments such as derivatives, may cause the fund to be more volatile than if it had not been leveraged. ●The Fund’s investments in other investment vehicles subject the Fund to those risks and expenses affecting the investment vehicle. ● The Fund may have significant exposure to securities in a particular capitalization range e.g., large-, mid- or small-cap securities. As a result, the Fund may be subject to the risk that the pre-denominate capitalization range may underperform other segments of the equity market or the equity market as a whole.
● Please read the prospectus for more detailed information regarding these and other risks.
| | THE GUGGENHEIM FUNDS ANNUAL REPORT | 3 |
ECONOMIC AND MARKET OVERVIEW (Unaudited) | September 30, 2017 |
Over the past few months, the equity markets have faced massive hurricanes in the South, rising tensions with North Korea and ongoing uncertainty surrounding domestic policy. Despite it all, the major stock indices continue to trade at or near record levels. The market’s resiliency seems to underscore that, at the end of the day, it’s fundamentals that drive equity markets and not political headlines or geopolitical tensions.
A noticeable shift in market sentiment during the third quarter led to a rotation into cyclical and small capitalization stocks. Value factors also began to outperform in September, a significant change from year-to-date performance. From a macro standpoint, the primary drivers of the value trade include rising inflationary expectations, economic growth and the prospects of tax reform.
Outside the U.S., both the European and emerging markets outperformed the Standard & Poor’s 500® (“S&P 500®”) Index on a dollar denominated basis. Renewed interest in both regions reflected attractive relative valuation and the synchronized global economic expansion.
Assuming no major geopolitical or other unforeseen shocks, we expect the U.S. economy will grow by between 2.0–2.5% in real terms in 2017 and 2018, supported by a strong labor market at home, a synchronized upswing in the global economy, and favorable financial conditions. Risks to our growth outlook are to the upside if Washington delivers on promises to cut taxes. Third quarter economic data was less distorted by the recent hurricanes than expected, and rebuilding efforts should be a positive for growth heading into 2018.
The labor market is steadily tightening, as seen in the drop in the unemployment rate to a cycle low of 4.2% in September, underscoring the robust—and unsustainable—underlying trend in hiring. Leading indicators, including hiring intentions surveys, point to further declines in the unemployment rate. Meanwhile, inflation continues to be well below the U.S. Federal Reserve’s (the “Fed”) 2% longer-run goal, with core personal consumption expenditure inflation coming in at 1.3% in September. However, inflation lags Gross Domestic Product (“GDP”) growth by about six quarters; because growth has accelerated over the past year, and the dollar has depreciated, inflation will likely move closer to 2% by the second quarter of 2018.
The firming U.S. economy, coupled with synchronized global growth and stabilization in the U.S. dollar, is likely to be supportive of the U.S. earnings environment. On the valuation front, while elevated relative to long-term averages, multiples still remain well below extreme levels. Economic and financial conditions are supportive enough for the Fed to continue to resume a quarterly pattern of rate increases in December, and to begin balance sheet normalization this year. Interest rates are expected to remain supportive of risk assets.
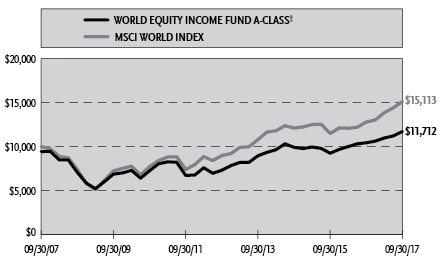
For the 12 months ended September 30, 2017, the S&P 500® Index* returned 18.61%. The MSCI Europe-Australasia-Far East (“EAFE”) Index* returned 19.10%. The return of the MSCI Emerging Markets Index* was 22.46%.
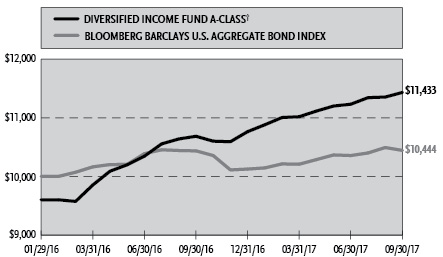
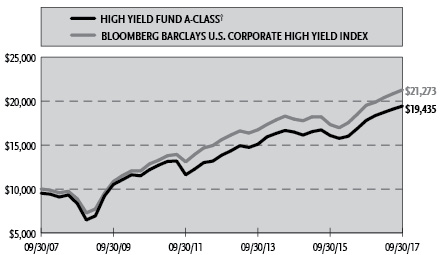
In the bond market, the Bloomberg Barclays U.S. Aggregate Bond Index* posted a 0.07% return for the period, while the Bloomberg Barclays U.S. Corporate High Yield Index* returned 8.88%. The return of the Bank of America (“BofA”) Merrill Lynch 3-Month U.S. Treasury Bill Index* was 0.66% for the 12-month period.
The opinions and forecasts expressed may not actually come to pass. This information is subject to change at any time, based on market and other conditions, and should not be construed as a recommendation of any specific security or strategy.
*Index Definitions
Indices are unmanaged and not available for direct investment. Index performance does not reflect transaction costs, fees, or expenses.
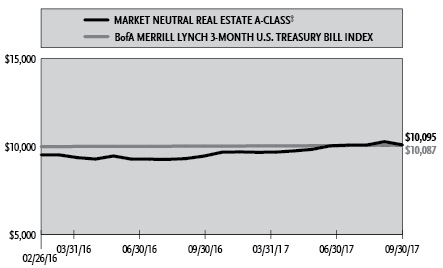
BofA Merrill Lynch 3-Month U.S. Treasury Bill Index is an unmanaged market Index of U.S. Treasury securities maturing in 90 days that assumes reinvestment of all income.
Bloomberg Barclays U.S. Aggregate Bond Index is a broad-based flagship benchmark that measures the investment grade, U.S. dollar-denominated, fixed-rate taxable bond market, including U.S. Treasuries, government-related and corporate securities, mortgage-backed securities or “MBS” (agency fixed-rate and hybrid adjustable-rate mortgage, or “ARM”, pass-throughs), asset-backed securities (“ABS”), and commercial mortgage-backed securities (“CMBS”) (agency and non-agency).
Bloomberg Barclays U.S. Corporate High Yield Index measures the U.S. dollar-denominated, high yield, fixed-rate corporate bond market. Securities are classified as high yield if the middle rating of Moody’s, Fitch, and S&P is Ba1/BB +/BB + or below.
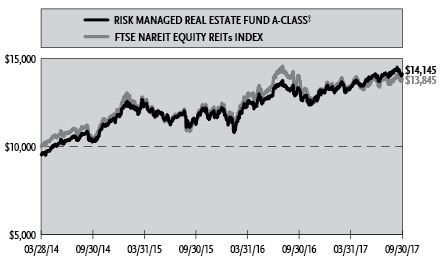
FTSE NAREIT Equity REITs Index is one of the FTSE NAREIT US Real Estate Index Series that contains all Equity REITs not designated as Timber REITs or Infrastructure REITs. FTSE NAREIT US Real Estate Index Series is designed to present investors with a comprehensive family of REIT performance indexes that spans the commercial real estate space across the US economy. The index series provides investors with exposure to all investment and property sectors. In addition, the more narrowly focused property sector and sub-sector indexes provide the facility to concentrate commercial real estate exposure in more selected markets. The National Association of Real Estate Investment Trusts (NAREIT) is the trade association for REITs and publicly traded real estate companies with an interest in the US property and investment markets.
| 4 | THE GUGGENHEIM FUNDS ANNUAL REPORT | |
ECONOMIC AND MARKET OVERVIEW (Unaudited)(concluded) | September 30, 2017 |
Morningstar Long/Short Equity Category Average is the average return of funds Morningstar places in a given category based on their portfolio statistics and compositions over the past three years. Long-short portfolios hold sizeable stakes in both long and short positions in equities, exchange traded funds, and related derivatives. Some funds that fall into this category will shift their exposure to long and short positions depending on their macro outlook or the opportunities they uncover through bottom-up research. At least 75% of the assets are in equity securities or derivatives, and funds in the category will typically have beta values to relevant benchmarks of between 0.3 and 0.8 over a three-year period.
MSCI EAFE Index is a capitalization-weighted measure of stock markets in Europe, Australasia, and the Far East.
MSCI Emerging Markets Index is a free float-adjusted market capitalization-weighted index that is designed to measure equity market performance in the global emerging markets.
MSCI World Index (Net) is calculated with net dividends reinvested. It is a free float-adjusted market capitalization weighted index that is designed to measure the equity market performance of developed markets.
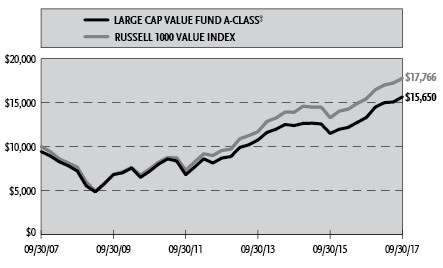
Russell 1000® Value Index is a measure of the performance for the large-cap value segment of the U.S. equity universe. It includes those Russell 1000 companies with lower price-to-book ratios and lower expected growth values.
Russell 2000® Value Index measures the performance of the small-cap value segment of the U.S. equity universe. It includes those Russell 2000 companies with lower price-to-book ratios and lower forecasted growth values.
Russell 3000® Index measures the performance of the largest 3,000 U.S. companies, representing approximately 98% of the investable U.S. equity market.
Russell Midcap Growth® Index measures the performance of the mid-cap growth segment of the U.S. equity universe. It includes those Russell Midcap Index companies with higher price-to-book ratios and higher forecasted growth values.
S&P 500® Index is a broad-based index, the performance of which is based on the performance of 500 widely held common stocks chosen for market size, liquidity, and industry group representation.
| | THE GUGGENHEIM FUNDS ANNUAL REPORT | 5 |
ABOUT SHAREHOLDERS’ FUND EXPENSES (Unaudited) | |
All mutual funds have operating expenses, and it is important for our shareholders to understand the impact of costs on their investments. Shareholders of a fund incur two types of costs: (i) transaction costs, including sales charges (loads) on purchase payments, reinvested dividends, other distributions, and exchange fees, and (ii) ongoing costs, including management fees, administrative services, and shareholder reports, among others. These ongoing costs, or operating expenses, are deducted from a fund’s gross income and reduce the investment return of the fund.
A fund’s expenses are expressed as a percentage of its average net assets, which is known as the expense ratio. The following examples are intended to help investors understand the ongoing costs (in dollars) of investing in a fund and to compare these costs with the ongoing costs of investing in other mutual funds.
The examples are based on an investment of $1,000 made at the beginning of the period and held for the entire six-month period beginning March 31, 2017 and ending September 30, 2017.
The following tables illustrate the Funds’ costs in two ways:
Table 1. Based on actual Fund return: This section helps investors estimate the actual expenses paid over the period. The “Ending Account Value” shown is derived from the Fund’s actual return, and the fifth column shows the dollar amount that would have been paid by an investor who started with $1,000 in the Fund. Investors may use the information here, together with the amount invested, to estimate the expenses paid over the period. Simply divide the Fund’s account value by $1,000 (for example, an $8,600 account value divided by $1,000 = 8.6), then multiply the result by the number provided under the heading “Expenses Paid During Period.”
Table 2. Based on hypothetical 5% return: This section is intended to help investors compare a Fund’s cost with those of other mutual funds. The table provides information about hypothetical account values and hypothetical expenses based on the Fund’s actual expense ratio and an assumed rate of return of 5% per year before expenses, which is not the Fund’s actual return. The hypothetical account values and expenses may not be used to estimate the actual ending account balance or expenses paid during the period. The example is useful in making comparisons because the U.S. Securities and Exchange Commission (the “SEC”) requires all mutual funds to calculate expenses based on the 5% return. Investors can assess a Fund’s costs by comparing this hypothetical example with the hypothetical examples that appear in shareholder reports of other funds.
The calculations illustrated above assume no shares were bought or sold during the period. Actual costs may have been higher or lower, depending on the amount of investment and the timing of any purchases or redemptions.
Please note that the expenses shown in the table are meant to highlight your ongoing costs only and do not reflect any transactional costs, such as sales charges (loads) on purchase payments, and contingent deferred sales charges (“CDSC”) on redemptions, if any. Therefore, the second table is useful in comparing ongoing costs only, and will not help you determine the relative total costs of owning different funds. In addition, if these transactional costs were included, your costs would have been higher.
More information about the Funds’ expenses, including annual expense ratios for periods up to five years (subject to the Fund’s inception date), can be found in the Financial Highlights section of this report. For additional information on operating expenses and other shareholder costs, please refer to the appropriate Fund prospectus.
| 6 | THE GUGGENHEIM FUNDS ANNUAL REPORT | |
ABOUT SHAREHOLDERS’ FUND EXPENSES (Unaudited)(continued) | |
| | Expense
Ratio1 | Fund
Return | Beginning
Account Value
March 31,
2017 | Ending
Account Value
September 30,
2017 | Expenses
Paid During
Period2 |
Table 1. Based on actual Fund return3 | | | | | |
| Alpha Opportunity Fund | | | | | |
| A-Class | 1.98% | 0.11% | $ 1,000.00 | $ 1,001.10 | $ 9.93 |
| C-Class | 2.73% | (0.25%) | 1,000.00 | 997.50 | 13.67 |
| P-Class | 1.43% | 0.26% | 1,000.00 | 1,002.60 | 7.18 |
| Institutional Class | 1.25% | 0.45% | 1,000.00 | 1,004.50 | 6.28 |
| Large Cap Value Fund | | | | | |
| A-Class | 1.17% | 4.38% | 1,000.00 | 1,043.80 | 5.99 |
| C-Class | 1.92% | 3.99% | 1,000.00 | 1,039.90 | 9.82 |
| P-Class | 1.17% | 4.38% | 1,000.00 | 1,043.80 | 5.99 |
| Institutional Class | 0.92% | 4.54% | 1,000.00 | 1,045.40 | 4.72 |
| Market Neutral Real Estate Fund | | | | | |
| A-Class | 1.64% | 3.52% | 1,000.00 | 1,035.20 | 8.37 |
| C-Class | 2.39% | 3.11% | 1,000.00 | 1,031.10 | 12.17 |
| P-Class | 1.64% | 3.48% | 1,000.00 | 1,034.80 | 8.37 |
| Institutional Class | 1.39% | 3.62% | 1,000.00 | 1,036.20 | 7.10 |
| Risk Managed Real Estate Fund | | | | | |
| A-Class | 1.29% | 5.41% | 1,000.00 | 1,054.10 | 6.64 |
| C-Class | 2.03% | 4.99% | 1,000.00 | 1,049.90 | 10.43 |
| P-Class | 1.27% | 5.37% | 1,000.00 | 1,053.70 | 6.54 |
| Institutional Class | 1.01% | 5.51% | 1,000.00 | 1,055.10 | 5.20 |
| Small Cap Value Fund | | | | | |
| A-Class | 1.32% | 2.74% | 1,000.00 | 1,027.40 | 6.71 |
| C-Class | 2.07% | 2.33% | 1,000.00 | 1,023.30 | 10.50 |
| P-Class | 1.32% | 2.74% | 1,000.00 | 1,027.40 | 6.71 |
| Institutional Class | 1.07% | 2.84% | 1,000.00 | 1,028.40 | 5.44 |
| StylePlus—Large Core Fund | | | | | |
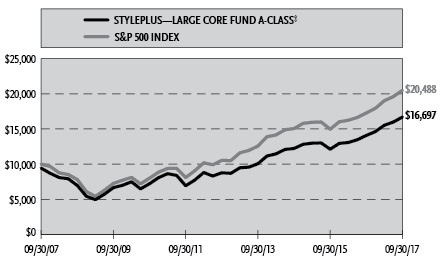
| A-Class | 1.43% | 7.50% | 1,000.00 | 1,075.00 | 7.44 |
| C-Class | 2.26% | 7.05% | 1,000.00 | 1,070.50 | 11.73 |
| P-Class | 1.40% | 7.52% | 1,000.00 | 1,075.20 | 7.28 |
| Institutional Class | 1.11% | 7.62% | 1,000.00 | 1,076.20 | 5.78 |
| StylePlus—Mid Growth Fund | | | | | |
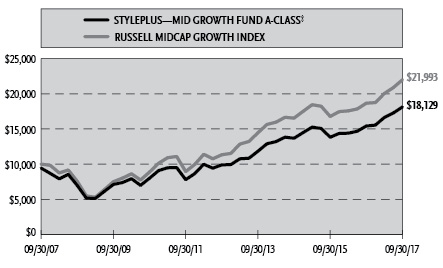
| A-Class | 1.56% | 8.93% | 1,000.00 | 1,089.30 | 8.17 |
| C-Class | 2.37% | 8.46% | 1,000.00 | 1,084.60 | 12.39 |
| P-Class | 1.66% | 8.88% | 1,000.00 | 1,088.80 | 8.69 |
| Institutional Class | 1.28% | 9.07% | 1,000.00 | 1,090.70 | 6.71 |
| World Equity Income Fund | | | | | |
| A-Class | 1.24% | 6.70% | 1,000.00 | 1,067.00 | 6.43 |
| C-Class | 1.99% | 6.26% | 1,000.00 | 1,062.60 | 10.29 |
| P-Class | 1.24% | 6.76% | 1,000.00 | 1,067.60 | 6.43 |
| Institutional Class | 0.98% | 6.78% | 1,000.00 | 1,067.80 | 5.08 |
| | THE GUGGENHEIM FUNDS ANNUAL REPORT | 7 |
ABOUT SHAREHOLDERS’ FUND EXPENSES (Unaudited)(concluded) | |
| | Expense
Ratio1 | Fund
Return | Beginning
Account Value
March 31,
2017 | Ending
Account Value
September 30,
2017 | Expenses
Paid During
Period2 |
| Table 2. Based on hypothetical 5% return (before expenses) | | | | |
| Alpha Opportunity Fund | | | | | |
| A-Class | 1.98% | 5.00% | $ 1,000.00 | $ 1,015.14 | $ 10.00 |
| C-Class | 2.73% | 5.00% | 1,000.00 | 1,011.38 | 13.77 |
| P-Class | 1.43% | 5.00% | 1,000.00 | 1,017.90 | 7.23 |
| Institutional Class | 1.25% | 5.00% | 1,000.00 | 1,018.80 | 6.33 |
| Large Cap Value Fund | | | | | |
| A-Class | 1.17% | 5.00% | 1,000.00 | 1,019.20 | 5.92 |
| C-Class | 1.92% | 5.00% | 1,000.00 | 1,015.44 | 9.70 |
| P-Class | 1.17% | 5.00% | 1,000.00 | 1,019.20 | 5.92 |
| Institutional Class | 0.92% | 5.00% | 1,000.00 | 1,020.46 | 4.66 |
| Market Neutral Real Estate Fund | | | | | |
| A-Class | 1.64% | 5.00% | 1,000.00 | 1,016.85 | 8.29 |
| C-Class | 2.39% | 5.00% | 1,000.00 | 1,013.09 | 12.06 |
| P-Class | 1.64% | 5.00% | 1,000.00 | 1,016.85 | 8.29 |
| Institutional Class | 1.39% | 5.00% | 1,000.00 | 1,018.10 | 7.03 |
| Risk Managed Real Estate Fund | | | | | |
| A-Class | 1.29% | 5.00% | 1,000.00 | 1,018.60 | 6.53 |
| C-Class | 2.03% | 5.00% | 1,000.00 | 1,014.89 | 10.25 |
| P-Class | 1.27% | 5.00% | 1,000.00 | 1,018.70 | 6.43 |
| Institutional Class | 1.01% | 5.00% | 1,000.00 | 1,020.00 | 5.11 |
| Small Cap Value Fund | | | | | |
| A-Class | 1.32% | 5.00% | 1,000.00 | 1,018.45 | 6.68 |
| C-Class | 2.07% | 5.00% | 1,000.00 | 1,014.69 | 10.45 |
| P-Class | 1.32% | 5.00% | 1,000.00 | 1,018.45 | 6.68 |
| Institutional Class | 1.07% | 5.00% | 1,000.00 | 1,019.70 | 5.42 |
| StylePlus—Large Core Fund | | | | | |
| A-Class | 1.43% | 5.00% | 1,000.00 | 1,017.90 | 7.23 |
| C-Class | 2.26% | 5.00% | 1,000.00 | 1,013.74 | 11.41 |
| P-Class | 1.40% | 5.00% | 1,000.00 | 1,018.05 | 7.08 |
| Institutional Class | 1.11% | 5.00% | 1,000.00 | 1,019.50 | 5.62 |
| StylePlus—Mid Growth Fund | | | | | |
| A-Class | 1.56% | 5.00% | 1,000.00 | 1,017.25 | 7.89 |
| C-Class | 2.37% | 5.00% | 1,000.00 | 1,013.19 | 11.96 |
| P-Class | 1.66% | 5.00% | 1,000.00 | 1,016.75 | 8.39 |
| Institutional Class | 1.28% | 5.00% | 1,000.00 | 1,018.65 | 6.48 |
| World Equity Income Fund | | | | | |
| A-Class | 1.24% | 5.00% | 1,000.00 | 1,018.85 | 6.28 |
| C-Class | 1.99% | 5.00% | 1,000.00 | 1,015.09 | 10.05 |
| P-Class | 1.24% | 5.00% | 1,000.00 | 1,018.85 | 6.28 |
| Institutional Class | 0.98% | 5.00% | 1,000.00 | 1,020.16 | 4.96 |
1 | This ratio represents annualized net expenses, which may include short dividend and interest expenses. Excluding these expenses, the operating expense ratio for the Alpha Opportunity Fund would be 2.00%, 2.71%, 1.68% and 1.28% and the Risk Managed Real Estate Fund would be 1.30%, 2.02%, 1.29% and 1.01% for the A-Class, C-Class, P-Class and Institutional Class, respectively. Excludes expenses of the underlying funds in which the Funds invest. |
2 | Expenses are equal to the Fund's annualized expense ratio, net of any applicable fee waivers, multiplied by the average account value over the period, multiplied by 183/365 (to reflect the one-half year period). |
3 | Actual cumulative return at net asset value for the period March 31, 2017 to September 30, 2017. |
| 8 | THE GUGGENHEIM FUNDS ANNUAL REPORT | |
MANAGERS’ COMMENTARY (Unaudited) | September 30, 2017 |
Dear Shareholder:
Guggenheim Alpha Opportunity Fund (the “Fund”) is managed by a team of seasoned professionals, including Farhan Sharaff, Senior Managing Director and Assistant Chief Investment Officer, Equities, and Portfolio Manager; Jayson Flowers, Senior Managing Director and Portfolio Manager; Samir Sanghani, CFA, Managing Director and Portfolio Manager; and Burak Hurmeydan, Ph.D., Director and Portfolio Manager. In the paragraphs below, the team discusses the performance of the Fund for the 12-month period ended September 30, 2017.
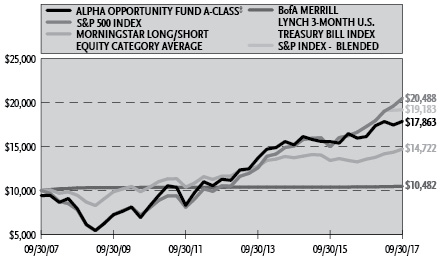
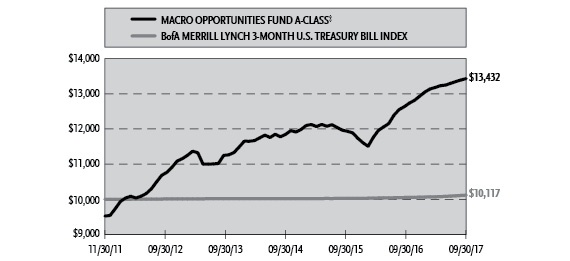
For the one year period ended September 30, 2017, Guggenheim Alpha Opportunity Fund returned 10.70%1, compared with the 0.66% return of its benchmark, the BofA Merrill Lynch 3-Month U.S. Treasury Bill Index. The Fund’s secondary benchmark is the Morningstar Long/Short Equity Category Average. Its return for the 12 months was 8.56%. The S&P 500 Index, which until March 13, 2017, served as one of the Fund’s primary benchmarks, returned 18.61%.
Investment Approach
The Fund is managed as an opportunistic long/short strategy, which employs forward-looking, fundamental analysis to measure the market’s expected return for each stock in the universe. Quantitative techniques are then applied to evaluate market- and company-specific risk factors embedded in each stock and to assess which specific risk factors (such as size, growth, or sectors) are being overvalued or undervalued by the market. Finally, a portfolio is constructed within guidelines that is long the stocks that give the portfolio both the broad risk characteristics and company-specific risks that are perceived to be undervalued and is short stocks for which those characteristics are perceived to be overpriced.
The Fund will ordinarily hold simultaneous long and short positions in equity securities or securities markets that provide exposure up to a level equal to 150% of the Fund’s net assets for both the long and short positions. The Fund intends to maintain a low overall net exposure (the difference between the notional value of long positions and the notional value of short positions), typically varying between 50% net long and 30% net short in order to maintain low correlation to traditional equity markets and lower-than-market volatility, and seek to provide consistent absolute return. The overall net exposure will change as market opportunities change, and may, based on the Fund’s view of current market conditions, be outside this range.
Derivatives in the Fund are used only to take an equity long or short position above 100% of NAV (that is, to increase leverage). Long side average exposure was 138% for the period.
Performance Review
On average during the period, the Fund held about 141% of assets in long securities, and 101% short–for an average net-dollar exposure of 40%. The realized net beta (sensitivity of monthly Fund returns to broad market moves) averaged around 0.50 during the year, although our expected beta at period end is closer to the 0.30 to 0.40 level. The long positions averaged a return of 20.77%, compared to the Russell 3000 index return of 18.71%. Short positions returned 15.40% on a stand-alone basis – providing most of the alpha (beta-adjusted return contribution) for the period.
The year ending September 30, 2017 started with a short market pullback of about 5% just before the presidential election. (I know, it’s hard to recall a market that actually goes down – it has been a while). That was immediately followed by a strong and consistent bull market with notably low volatility. Driving the bull has been a business friendly election result with Republican’s controlling the executive and legislative branches – with the hopes for dramatically lower corporate taxes and regulations. We’ve also experienced strong earnings in the US and recovering economies in Europe and China (to name a few). It’s not hard to see the sources of optimism.
The historic low volatility has been more of a conundrum. With the Fed raising rates and starting the process of QE unwind, with higher stock multiples, and with a more volatile presidential administration than the country has seen in a while – one might expect more uncertainty in stock prices than is implied in broad market volatility measures.
The risk – it seems – is actually there, but hidden a bit under the cover. Underneath the fairly steady overall equity market returns is a bit of divergence emerging between a narrowing cohort of large cap, high growth tech oriented companies, and a host of smaller and more old-fashioned businesses which are feeling more late-cycle doldrums. Indeed for the 2017 to-date period (once the election euphoria ended), the difference between Russell growth benchmarks over value benchmarks is a stunning 13% among large caps and 11% among small caps. The growth indices have also experienced lower volatility than their value counterparts (about 2% less for large caps, and 4% less for small caps) – whereas the prior 5 years the growth indices were about 1-2% more volatile.
| | THE GUGGENHEIM FUNDS ANNUAL REPORT | 9 |
MANAGERS’ COMMENTARY (Unaudited)(concluded) | September 30, 2017 |
One of the consequences of a prolonged growth stock driven market is less investor consideration given for higher free cash flow yielding names. Traditionally strong cash generating businesses tend to be considered higher quality stocks to own due to value creation options that excess cash flow can open up (higher dividends, buybacks, acquisitions). However, when growth stocks are performing well (both from an earnings and stock appreciation perspective)–the older ‘mature’ businesses can fall out of favor in relation to companies with heavy cash investment (i.e. negative cash generating). Our measure of market returns to the ‘Free Cash Flow Factor’2 has shown a big drawdown since the end of last year with the recent period equaling the historic maximum drawdown that occurred in 2007 through 2008.
In this environment, the fund has treaded a bit as the investment process tends to shun or short the growth-at-any-price and more speculative names, while being attracted to better values and cash flow generators. We expect that valuation discipline to pay off when (not if) the expensive names take a breather (or crash, as they are apt to do) as earnings need to catch up.
Performance displayed represents past performance which is no guarantee of future results.
1 | Performance figures are based on Class A shares and do not reflect taxes that a shareholder would pay on distributions or the redemption of shares. |
2 | Our proprietary factor measures the return difference between high free cash flow yield stocks minus low free cash flow yield stocks on a market neutral and sector neutral basis. |
The opinions and forecast expressed may not actually come to pass. This information is subject to change at any time, based on market and other conditions, and should not be construed as a recommendation of any specific security or strategy.
| 10 | THE GUGGENHEIM FUNDS ANNUAL REPORT | |
PERFORMANCE REPORT AND FUND PROFILE (Unaudited) | September 30, 2017 |
ALPHA OPPORTUNITY FUND
OBJECTIVE: Seeks long-term growth of capital.
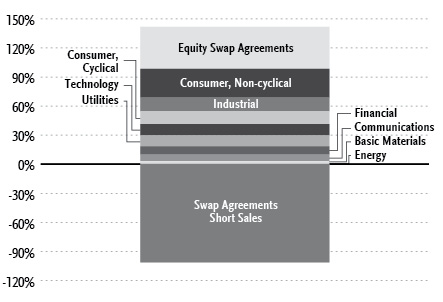
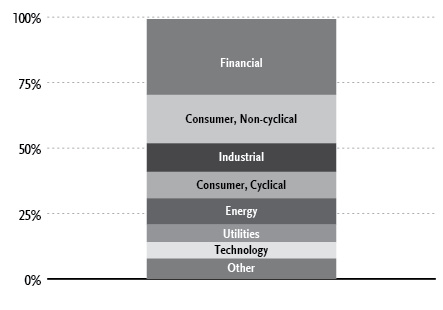
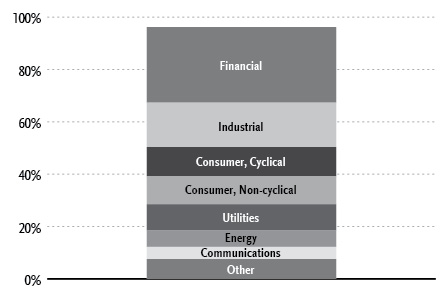
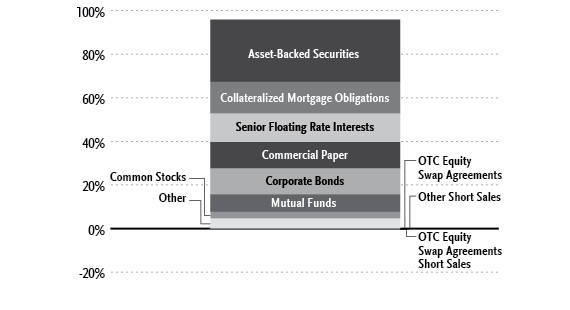
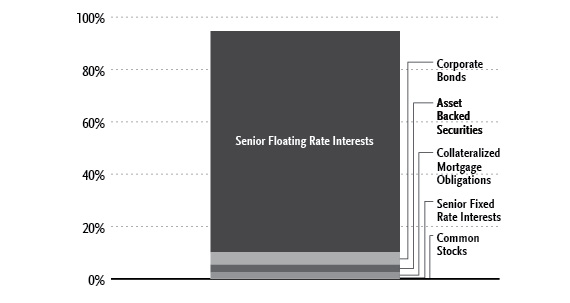
Holdings Diversification (Market Exposure as % of Net Assets)
“Holdings Diversification (Market Exposure as % of Net Assets)” excludes any temporary cash investments.
| Inception Dates: |
| A-Class | July 7, 2003 |
| C-Class | July 7, 2003 |
| P-Class | May 1, 2015 |
| Institutional Class | November 7, 2008 |
| Ten Largest Holdings (% of Total Net Assets) |
| CVS Health Corp. | 1.7% |
| Pfizer, Inc. | 1.6% |
| Sysco Corp. | 1.5% |
| Prudential Financial, Inc. | 1.5% |
| International Business Machines Corp. | 1.5% |
| Deluxe Corp. | 1.5% |
| Walgreens Boots Alliance, Inc. | 1.4% |
| FirstEnergy Corp. | 1.4% |
| Verizon Communications, Inc. | 1.3% |
| Exelon Corp. | 1.3% |
| Top Ten Total | 14.7% |
| “Ten Largest Holdings” excludes any temporary cash or derivative investments. |
| | THE GUGGENHEIM FUNDS ANNUAL REPORT | 11 |
PERFORMANCE REPORT AND FUND PROFILE (Unaudited)(concluded) | September 30, 2017 |
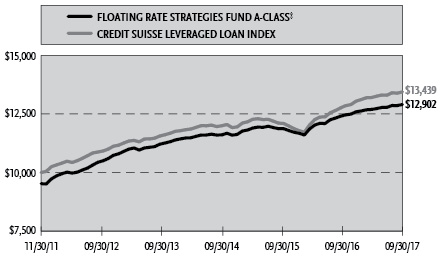
Cumulative Fund Performance*
Effective March 13, 2017, the Fund changed its principal investment strategy. As a result of the investment strategy change, the Fund’s new benchmark is the BofA Merrill Lynch 3- Month U.S. Treasury Bill Index. The Fund’s performance was previously compared to the S&P 500 Index. The S&P Index-Blended uses performance data for the S&P Index from 09/30/03 to 03/12/17, and the BofA Merrill Lynch 3- Month U.S. Treasury Bill Index from 03/13/17 to 09/30/17.
Average Annual Returns*
Periods Ended September 30, 2017
| | 1 Year | 5 Year | 10 Year |
| A-Class Shares | 10.70% | 9.64% | 6.60% |
A-Class Shares with sales charge‡ | 5.45% | 8.58% | 5.97% |
| C-Class Shares | 9.91% | 8.82% | 5.78% |
C-Class Shares with CDSC§ | 8.91% | 8.82% | 5.78% |
| Morningstar Long/Short Equity Category Average | 8.56% | 4.82% | 3.94% |
| S&P 500 Index | 18.61% | 14.22% | 7.44% |
| S&P 500 Index - Blended | 11.05% | 12.73% | 6.73% |
| BofA Merrill Lynch 3-Month U.S. Treasury Bill Index | 0.66% | 0.22% | 0.47% |
| | | 1 Year | Since Inception
(05/01/15) |
| P-Class Shares | | 11.00% | 4.39% |
| S&P 500 Index | | 18.61% | 9.98% |
| S&P 500 Index- Blended | | 11.05% | 7.01% |
| Morningstar Long/Short Equity Category Average | | 8.56% | 1.56% |
| BofA Merrill Lynch 3-Month U.S. Treasury Bill Index | | 0.66% | 0.95% |
| | 1 Year | 5 Year | Since Inception (11/07/08) |
| Institutional Class Shares | 11.42% | 10.04% | 13.09% |
| S&P 500 Index | 18.61% | 14.22% | 14.28% |
| S&P 500 Index- Blended | 11.05% | 12.73% | 13.43% |
| Morningstar Long/Short Equity Category Average | 8.56% | 4.82% | 4.84% |
| BofA Merrill Lynch 3-Month U.S. Treasury Bill Index | 0.66% | 0.22% | 1.68% |
| * | The performance data above represents past performance that is not predictive of future results. The investment return and principal value of an investment in the Fund will fluctuate so that an investor’s shares, when redeemed, may be worth more or less than their original cost. Returns are historical and include changes in principal and reinvested dividends and capital gains and do not reflect the effect of taxes. The BofA Merrill Lynch 3-Month U.S. Treasury Bill Index, the S&P 500 Index and the Morningstar Long/Short Equity Category Average are unmanaged indices and, unlike the Fund, have no management fees or operating expenses to reduce their reported returns. The graph is based on A-Class shares only; performance for C-Class, P-Class and Institutional Class will vary due to differences in fee structures. |
‡ | Effective February 22, 2011, the maximum sales charge decreased from 5.75% to 4.75%. A 5.75% maximum sales charge is used in the calculation of the 1 Year, 5 Year and 10 Year average annual returns (based on subscriptions made prior to February 22, 2011), and a 4.75% maximum sales charge will be used to calculate performance for periods based on subscriptions made on or after February 22, 2011. |
§ | Fund returns include a CDSC of 1% if redeemed within 12 months of purchase. |
| 12 | THE GUGGENHEIM FUNDS ANNUAL REPORT | |
| SCHEDULE OF INVESTMENTS | September 30, 2017 |
| ALPHA OPPORTUNITY FUND | |
| | | Shares | | | Value | |
| | | | | | | |
COMMON STOCKS† - 98.4% | |
| | | | | | | |
| Consumer, Non-cyclical - 29.6% | |
Pfizer, Inc.1 | | | 98,914 | | | $ | 3,531,230 | |
| Sysco Corp. | | | 63,288 | | | | 3,414,388 | |
| Deluxe Corp. | | | 45,326 | | | | 3,306,985 | |
Kimberly-Clark Corp.1 | | | 22,921 | | | | 2,697,343 | |
HCA Healthcare, Inc.*,1 | | | 33,761 | | | | 2,687,038 | |
DaVita, Inc.*,1 | | | 41,637 | | | | 2,472,822 | |
| US Foods Holding Corp.* | | | 90,802 | | | | 2,424,413 | |
ManpowerGroup, Inc.1 | | | 19,936 | | | | 2,348,860 | |
Express Scripts Holding Co.*,1 | | | 36,353 | | | | 2,301,872 | |
Tyson Foods, Inc. — Class A1 | | | 30,910 | | | | 2,177,610 | |
Aetna, Inc.1 | | | 13,333 | | | | 2,120,080 | |
Humana, Inc.1 | | | 8,694 | | | | 2,118,119 | |
AbbVie, Inc.1 | | | 22,487 | | | | 1,998,195 | |
| Robert Half International, Inc. | | | 37,495 | | | | 1,887,498 | |
Quest Diagnostics, Inc.1 | | | 19,900 | | | | 1,863,436 | |
| HealthSouth Corp. | | | 35,113 | | | | 1,627,488 | |
| Ingredion, Inc. | | | 13,254 | | | | 1,598,963 | |
| Darling Ingredients, Inc.* | | | 81,925 | | | | 1,435,326 | |
Cardinal Health, Inc.1 | | | 19,674 | | | | 1,316,584 | |
| Dean Foods Co. | | | 117,339 | | | | 1,276,648 | |
Conagra Brands, Inc.1 | | | 36,110 | | | | 1,218,351 | |
Universal Corp.1 | | | 19,758 | | | | 1,132,133 | |
| United Natural Foods, Inc.* | | | 27,162 | | | | 1,129,668 | |
Zimmer Biomet Holdings, Inc.1 | | | 9,643 | | | | 1,129,099 | |
AmerisourceBergen Corp. — Class A1 | | | 13,284 | | | | 1,099,251 | |
United Rentals, Inc.*,1 | | | 7,680 | | | | 1,065,523 | |
| Flowers Foods, Inc. | | | 53,925 | | | | 1,014,329 | |
Centene Corp.*,1 | | | 10,442 | | | | 1,010,472 | |
Universal Health Services, Inc. — Class B1 | | | 9,063 | | | | 1,005,449 | |
MEDNAX, Inc.*,1 | | | 21,327 | | | | 919,620 | |
| SpartanNash Co. | | | 34,850 | | | | 918,994 | |
| United Therapeutics Corp.* | | | 7,705 | | | | 902,949 | |
| Sabre Corp. | | | 46,654 | | | | 844,437 | |
| Medtronic plc | | | 10,790 | | | | 839,138 | |
| USANA Health Sciences, Inc.* | | | 14,538 | | | | 838,842 | |
| Chemed Corp. | | | 4,024 | | | | 813,049 | |
| Boston Beer Company, Inc. — Class A* | | | 5,192 | | | | 810,991 | |
| Molina Healthcare, Inc.* | | | 10,878 | | | | 747,971 | |
| Pilgrim’s Pride Corp.* | | | 25,324 | | | | 719,455 | |
| TreeHouse Foods, Inc.* | | | 10,538 | | | | 713,739 | |
Laboratory Corporation of America Holdings*,1 | | | 4,585 | | | | 692,198 | |
Baxter International, Inc.1 | | | 10,594 | | | | 664,774 | |
| Spectrum Brands Holdings, Inc. | | | 6,162 | | | | 652,679 | |
| Total Consumer, Non-cyclical | | | | | | | 65,488,009 | |
| | | | | | | | | |
| Industrial - 13.9% | |
| TE Connectivity Ltd. | | | 31,294 | | | | 2,599,280 | |
| Energizer Holdings, Inc. | | | 54,530 | | | | 2,511,107 | |
| Jacobs Engineering Group, Inc. | | | 37,319 | | | | 2,174,578 | |
| Benchmark Electronics, Inc.* | | | 59,974 | | | | 2,048,112 | |
| Fluor Corp. | | | 46,276 | | | | 1,948,220 | |
| Timken Co. | | | 34,409 | | | | 1,670,557 | |
| Huntington Ingalls Industries, Inc. | | | 7,206 | | | | 1,631,727 | |
| Arrow Electronics, Inc.* | | | 16,133 | | | | 1,297,254 | |
| Avnet, Inc. | | | 32,782 | | | | 1,288,333 | |
| Snap-on, Inc. | | | 8,591 | | | | 1,280,145 | |
| ITT, Inc. | | | 26,320 | | | | 1,165,186 | |
Norfolk Southern Corp.1 | | | 8,556 | | | | 1,131,445 | |
| Plexus Corp.* | | | 20,116 | | | | 1,128,105 | |
| Vishay Intertechnology, Inc. | | | 55,494 | | | | 1,043,287 | |
| Crane Co. | | | 12,635 | | | | 1,010,674 | |
| USG Corp.* | | | 30,333 | | | | 990,372 | |
| Trinity Industries, Inc. | | | 28,580 | | | | 911,702 | |
| Sanmina Corp.* | | | 24,111 | | | | 895,724 | |
| Methode Electronics, Inc. | | | 20,964 | | | | 887,825 | |
| Oshkosh Corp. | | | 10,121 | | | | 835,387 | |
| Applied Industrial Technologies, Inc. | | | 12,672 | | | | 833,818 | |
| Belden, Inc. | | | 9,074 | | | | 730,729 | |
| Owens-Illinois, Inc.* | | | 27,991 | | | | 704,254 | |
| Total Industrial | | | | | | | 30,717,821 | |
| | | | | | | | | |
| Consumer, Cyclical - 13.4% | |
| CVS Health Corp. | | | 47,303 | | | | 3,846,680 | |
| Walgreens Boots Alliance, Inc. | | | 39,966 | | | | 3,086,174 | |
Wal-Mart Stores, Inc.1 | | | 32,541 | | | | 2,542,754 | |
| Tailored Brands, Inc. | | | 174,559 | | | | 2,520,632 | |
| Lear Corp. | | | 10,133 | | | | 1,753,820 | |
Alaska Air Group, Inc.1 | | | 20,592 | | | | 1,570,552 | |
Big Lots, Inc.1 | | | 27,308 | | | | 1,462,890 | |
Southwest Airlines Co.1 | | | 23,574 | | | | 1,319,672 | |
| UniFirst Corp. | | | 7,685 | | | | 1,164,277 | |
PACCAR, Inc.1 | | | 13,220 | | | | 956,335 | |
| Hawaiian Holdings, Inc.* | | | 24,648 | | | | 925,532 | |
JetBlue Airways Corp.*,1 | | | 48,896 | | | | 906,043 | |
| Goodyear Tire & Rubber Co. | | | 27,180 | | | | 903,735 | |
| Cooper-Standard Holdings, Inc.* | | | 7,514 | | | | 871,398 | |
| Brinker International, Inc. | | | 26,028 | | | | 829,252 | |
| Ralph Lauren Corp. — Class A | | | 9,109 | | | | 804,234 | |
| Nu Skin Enterprises, Inc. — Class A | | | 12,627 | | | | 776,308 | |
| DineEquity, Inc. | | | 16,689 | | | | 717,293 | |
| Herman Miller, Inc. | | | 19,934 | | | | 715,631 | |
| CalAtlantic Group, Inc. | | | 19,254 | | | | 705,274 | |
| Dick’s Sporting Goods, Inc. | | | 24,861 | | | | 671,496 | |
American Airlines Group, Inc.1 | | | 13,536 | | | | 642,825 | |
| Total Consumer, Cyclical | | | | | | | 29,692,807 | |
| | | | | | | | | |
| Technology - 11.6% | |
| International Business Machines Corp. | | | 23,109 | | | | 3,352,654 | |
| Convergys Corp. | | | 93,943 | | | | 2,432,184 | |
HP, Inc.1 | | | 120,530 | | | | 2,405,779 | |
KLA-Tencor Corp.1 | | | 22,099 | | | | 2,342,494 | |
| NetApp, Inc. | | | 51,210 | | | | 2,240,950 | |
Oracle Corp.1 | | | 37,482 | | | | 1,812,255 | |
| Xerox Corp. | | | 51,983 | | | | 1,730,514 | |
| NCR Corp.* | | | 34,927 | | | | 1,310,461 | |
Western Digital Corp.1 | | | 14,621 | | | | 1,263,254 | |
| CACI International, Inc. — Class A* | | | 7,422 | | | | 1,034,256 | |
| CSRA, Inc. | | | 29,865 | | | | 963,743 | |
| Cirrus Logic, Inc.* | | | 16,514 | | | | 880,527 | |
| Seagate Technology plc | | | 23,281 | | | | 772,231 | |
| SEE NOTES TO FINANCIAL STATEMENTS. | THE GUGGENHEIM FUNDS ANNUAL REPORT | 13 |
SCHEDULE OF INVESTMENTS (continued) | September 30, 2017 |
| ALPHA OPPORTUNITY FUND | |
| | | Shares | | | Value | |
| | | | | | | |
| ON Semiconductor Corp.* | | | 40,723 | | | $ | 752,154 | |
| Akamai Technologies, Inc.* | | | 14,312 | | | | 697,280 | |
Skyworks Solutions, Inc.1 | | | 6,677 | | | | 680,386 | |
CA, Inc.1 | | | 20,024 | | | | 668,401 | |
| Icad, Inc.* | | | 95,329 | | | | 421,354 | |
| Total Technology | | | | | | | 25,760,877 | |
| | | | | | | | | |
| Utilities - 11.5% | |
| FirstEnergy Corp. | | | 99,217 | | | | 3,058,860 | |
| Exelon Corp. | | | 74,258 | | | | 2,797,299 | |
Ameren Corp.1 | | | 47,518 | | | | 2,748,441 | |
| UGI Corp. | | | 57,121 | | | | 2,676,690 | |
| Hawaiian Electric Industries, Inc. | | | 74,323 | | | | 2,480,159 | |
Edison International1 | | | 30,554 | | | | 2,357,852 | |
| Portland General Electric Co. | | | 46,431 | | | | 2,119,111 | |
| National Fuel Gas Co. | | | 36,369 | | | | 2,058,849 | |
American Electric Power Company, Inc.1 | | | 21,531 | | | | 1,512,337 | |
Xcel Energy, Inc.1 | | | 26,952 | | | | 1,275,369 | |
| AES Corp. | | | 92,368 | | | | 1,017,895 | |
Southwest Gas Holdings, Inc.1 | | | 9,102 | | | | 706,497 | |
CMS Energy Corp.1 | | | 13,497 | | | | 625,181 | |
| Total Utilities | | | | | | | 25,434,540 | |
| | | | | | | | | |
| Financial - 8.5% | |
| Prudential Financial, Inc. | | | 32,052 | | | | 3,407,769 | |
Aflac, Inc.1 | | | 33,281 | | | | 2,708,740 | |
Allstate Corp.1 | | | 21,289 | | | | 1,956,672 | |
| Lazard Ltd. — Class A | | | 38,680 | | | | 1,749,109 | |
Old Republic International Corp.1 | | | 88,154 | | | | 1,735,752 | |
JPMorgan Chase & Co.1 | | | 15,744 | | | | 1,503,709 | |
| CIT Group, Inc. | | | 23,678 | | | | 1,161,406 | |
| LaSalle Hotel Properties REIT | | | 34,340 | | | | 996,547 | |
Franklin Resources, Inc.1 | | | 20,621 | | | | 917,841 | |
Bank of New York Mellon Corp.1 | | | 15,692 | | | | 831,990 | |
| Hospitality Properties Trust REIT | | | 27,749 | | | | 790,569 | |
| Sabra Health Care REIT, Inc. REIT | | | 32,907 | | | | 721,980 | |
| CNO Financial Group, Inc. | | | 15,349 | | | | 358,246 | |
| Total Financial | | | | | | | 18,840,330 | |
| | | | | | | | | |
| Communications - 6.8% | |
Verizon Communications, Inc.1 | | | 58,760 | | | | 2,908,032 | |
Juniper Networks, Inc.1 | | | 88,109 | | | | 2,452,074 | |
| Iridium Communications, Inc.* | | | 197,436 | | | | 2,033,591 | |
| ATN International, Inc. | | | 36,372 | | | | 1,916,804 | |
| F5 Networks, Inc.* | | | 11,477 | | | | 1,383,667 | |
Omnicom Group, Inc.1 | | | 17,542 | | | | 1,299,336 | |
| ARRIS International plc* | | | 33,464 | | | | 953,389 | |
| Viavi Solutions, Inc.* | | | 74,712 | | | | 706,776 | |
| CommScope Holding Company, Inc.* | | | 20,856 | | | | 692,628 | |
Viacom, Inc. — Class B1 | | | 23,015 | | | | 640,737 | |
| Total Communications | | | | | | | 14,987,034 | |
| | | | | | | | | |
| Basic Materials - 1.6% | |
| LyondellBasell Industries N.V. — Class A | | | 8,019 | | | | 794,282 | |
| Mosaic Co. | | | 32,430 | | | | 700,164 | |
International Paper Co.1 | | | 12,224 | | | | 694,568 | |
Freeport-McMoRan, Inc.*,1 | | | 49,365 | | | | 693,084 | |
| AK Steel Holding Corp.* | | | 123,950 | | | | 692,880 | |
| Total Basic Materials | | | | | | | 3,574,978 | |
| | | | | | | | | |
| Energy - 1.5% | |
Devon Energy Corp.1 | | | 38,626 | | | | 1,417,961 | |
Anadarko Petroleum Corp.1 | | | 20,934 | | | | 1,022,626 | |
| Marathon Oil Corp. | | | 60,620 | | | | 822,007 | |
| Total Energy | | | | | | | 3,262,594 | |
| | | | | | | | | |
| Total Common Stocks | | | | | | | | |
| (Cost $211,905,611) | | | | | | | 217,758,990 | |
| | | | | | | | | |
MONEY MARKET FUND† - 6.3% | |
Goldman Sachs Financial Square Treasury Instruments Fund — Institutional Class 0.86%2 | | | 13,952,183 | | | | 13,952,183 | |
| Total Money Market Fund | | | | | | | | |
| (Cost $13,952,183) | | | | | | | 13,952,183 | |
| | | | | | | | | |
| Total Investments - 104.7% | | | | | | | | |
| (Cost $225,857,794) | | | | | | $ | 231,711,173 | |
| Other Assets & Liabilities, net - (4.7)% | | | | | | | (10,292,349 | ) |
| Total Net Assets - 100.0% | | | | | | $ | 221,418,824 | |
| Total Return Swap Agreements | |
| Counterparty | Index | | Financing
Rate Pay
(Receive) | | Payment
Frequency | Maturity
Date | | Units | | | Notional
Value | | | Unrealized
Gain (Loss) | |
OTC Equity Index Swap Agreements Sold Short†† | | | | | | | | | | | | |
| Morgan Stanley | Alpha Opportunity Portfolio Short
Custom Basket Swap4 | | | 0.81 | % | At Maturity | 2/1/19 | | | 4,108,900 | | | $ | (224,456,111 | ) | | $ | (13,593,377 | ) |
| | | | | | | | | | | | | | | | | | | | |
OTC Equity Index Swap Agreements†† | | | | | | | | | | | | | | | |
| Morgan Stanley | Alpha Opportunity Portfolio Long Custom Basket Swap3 | | | 1.64 | % | At Maturity | 2/1/19 | | | 1,745,892 | | | $ | 96,189,747 | | | $ | 3,550,074 | |
14 | THE GUGGENHEIM FUNDS ANNUAL REPORT | SEE NOTES TO FINANCIAL STATEMENTS. |
SCHEDULE OF INVESTMENTS (continued) | September 30, 2017 |
| ALPHA OPPORTUNITY FUND | |
| | | Shares | | | Unrealized
Gain (Loss) | |
| | | | | | | |
CUSTOM BASKET OF LONG SECURITIES3 | | | | | | |
| Lam Research Corp. | | | 9,659 | | | $ | 393,394 | |
| Gilead Sciences, Inc. | | | 27,658 | | | | 369,161 | |
| Amgen, Inc. | | | 14,824 | | | | 346,344 | |
| Cigna Corp. | | | 14,255 | | | | 280,242 | |
| Intel Corp. | | | 80,621 | | | | 272,562 | |
| Teradata Corp.* | | | 65,711 | | | | 271,904 | |
| WellCare Health Plans, Inc.* | | | 10,059 | | | | 269,977 | |
| Corning, Inc. | | | 102,810 | | | | 257,277 | |
| Cummins, Inc. | | | 13,260 | | | | 253,465 | |
| CenterPoint Energy, Inc. | | | 96,169 | | | | 236,923 | |
| Discover Financial Services | | | 42,729 | | | | 222,806 | |
| Reinsurance Group of America, Inc. — Class A | | | 15,997 | | | | 206,923 | |
| Applied Materials, Inc. | | | 27,748 | | | | 192,877 | |
| Michael Kors Holdings Ltd.* | | | 15,490 | | | | 188,332 | |
| Biogen, Inc.* | | | 4,874 | | | | 187,326 | |
| FedEx Corp. | | | 10,005 | | | | 168,869 | |
| Cisco Systems, Inc. | | | 104,665 | | | | 164,738 | |
| Union Pacific Corp. | | | 22,741 | | | | 151,657 | |
| Wabash National Corp. | | | 58,395 | | | | 131,839 | |
| McKesson Corp. | | | 8,421 | | | | 124,847 | |
| Northern Trust Corp. | | | 26,971 | | | | 116,067 | |
| WW Grainger, Inc. | | | 9,613 | | | | 109,292 | |
| Texas Instruments, Inc. | | | 11,197 | | | | 105,588 | |
| Principal Financial Group, Inc. | | | 42,267 | | | | 99,711 | |
| Public Service Enterprise Group, Inc. | | | 32,598 | | | | 95,348 | |
| Entergy Corp. | | | 26,056 | | | | 85,502 | |
| UnitedHealth Group, Inc. | | | 6,673 | | | | 61,217 | |
| PG&E Corp. | | | 37,531 | | | | 58,989 | |
| Hartford Financial Services Group, Inc. | | | 8,684 | | | | 45,431 | |
| Apple, Inc. | | | 3,978 | | | | 35,119 | |
| Delta Air Lines, Inc. | | | 34,714 | | | | 31,051 | |
| Travelers Companies, Inc. | | | 18,508 | | | | 28,601 | |
| Merck & Company, Inc. | | | 25,781 | | | | 27,235 | |
| Anthem, Inc. | | | 13,268 | | | | 15,471 | |
| EMCOR Group, Inc. | | | 18,732 | | | | 15,075 | |
| CoStar Group, Inc.* | | | 1,682 | | | | 3,682 | |
| Performance Food Group Co.* | | | 15,788 | | | | 1,290 | |
| Catalent, Inc.* | | | 11,302 | | | | 687 | |
| GoDaddy, Inc. — Class A* | | | 6,093 | | | | (1,330 | ) |
| Jabil, Inc. | | | 44,213 | | | | (4,359 | ) |
| Cloudera, Inc.* | | | 12,940 | | | | (8,160 | ) |
| AECOM* | | | 22,792 | | | | (10,640 | ) |
| Portola Pharmaceuticals, Inc.* | | | 11,513 | | | | (12,825 | ) |
| Synchrony Financial | | | 31,333 | | | | (32,597 | ) |
| Consolidated Edison, Inc. | | | 16,262 | | | | (34,366 | ) |
| Motorola Solutions, Inc. | | | 22,840 | | | | (37,302 | ) |
| Telephone & Data Systems, Inc. | | | 75,441 | | | | (74,608 | ) |
| Archer-Daniels-Midland Co. | | | 63,529 | | | | (77,826 | ) |
| Western Union Co. | | | 109,932 | | | | (79,356 | ) |
| Carlisle Companies, Inc. | | | 33,023 | | | | (126,985 | ) |
| Kroger Co. | | | 55,860 | | | | (154,498 | ) |
| Mylan N.V.* | | | 35,104 | | | | (206,344 | ) |
| Owens & Minor, Inc. | | | 35,726 | | | | (214,337 | ) |
| United Continental Holdings, Inc.* | | | 23,651 | | | | (300,709 | ) |
| InterDigital, Inc. | | | 20,141 | | | | (414,767 | ) |
| Bed Bath & Beyond, Inc. | | | 34,065 | | | | (508,627 | ) |
| Total Custom Basket of Long Securities | | | | | | | 3,327,185 | |
| | | | | | | | | |
CUSTOM BASKET OF SHORT SECURITIES4 | | | | | | | | |
| Compass Minerals International, Inc. | | | (43,817 | ) | | | 345,271 | |
| NewMarket Corp. | | | (6,743 | ) | | | 287,254 | |
| Ulta Beauty, Inc.* | | | (3,164 | ) | | | 208,759 | |
| General Electric Co. | | | (34,390 | ) | | | 193,671 | |
| Sensient Technologies Corp. | | | (38,458 | ) | | | 177,816 | |
| American Campus Communities, Inc. | | | (36,496 | ) | | | 167,690 | |
| Wabtec Corp. | | | (10,188 | ) | | | 165,839 | |
| NIKE, Inc. — Class B | | | (24,503 | ) | | | 158,415 | |
| Education Realty Trust, Inc. | | | (35,065 | ) | | | 150,269 | |
| Pool Corp. | | | (13,014 | ) | | | 143,734 | |
| Dave & Buster's Entertainment, Inc.* | | | (10,687 | ) | | | 142,870 | |
| Retail Opportunity Investments Corp. | | | (48,278 | ) | | | 136,269 | |
| Martin Marietta Materials, Inc. | | | (7,705 | ) | | | 115,282 | |
| Charter Communications, Inc. — Class A* | | | (4,372 | ) | | | 113,053 | |
| Federal Realty Investment Trust | | | (15,780 | ) | | | 107,481 | |
| People's United Financial, Inc. | | | (133,625 | ) | | | 99,491 | |
| Financial Engines, Inc. | | | (20,236 | ) | | | 95,061 | |
| Shake Shack, Inc. — Class A* | | | (22,685 | ) | | | 94,771 | |
| Balchem Corp. | | | (18,796 | ) | | | 82,956 | |
| Toro Co. | | | (9,199 | ) | | | 79,831 | |
| RPM International, Inc. | | | (37,614 | ) | | | 78,062 | |
| Realty Income Corp. | | | (19,934 | ) | | | 74,302 | |
| Ultimate Software Group, Inc.* | | | (4,136 | ) | | | 69,682 | |
| Papa John's International, Inc. | | | (12,303 | ) | | | 68,651 | |
| Sun Communities, Inc. | | | (17,779 | ) | | | 64,090 | |
| Mercury General Corp. | | | (15,238 | ) | | | 61,483 | |
| Acadia Realty Trust | | | (23,096 | ) | | | 58,730 | |
| Vulcan Materials Co. | | | (18,283 | ) | | | 58,262 | |
| Starbucks Corp. | | | (12,544 | ) | | | 58,256 | |
| Yum! Brands, Inc. | | | (18,130 | ) | | | 49,754 | |
| Wendy's Co. | | | (68,972 | ) | | | 45,194 | |
| Axon Enterprise, Inc.* | | | (29,770 | ) | | | 41,897 | |
| MarketAxess Holdings, Inc. | | | (6,949 | ) | | | 38,857 | |
| Kilroy Realty Corp. | | | (13,273 | ) | | | 38,689 | |
| Equity LifeStyle Properties, Inc. | | | (11,962 | ) | | | 36,658 | |
| Public Storage | | | (5,749 | ) | | | 36,547 | |
| Dunkin' Brands Group, Inc. | | | (16,340 | ) | | | 32,716 | |
| Corporate Office Properties Trust | | | (24,724 | ) | | | 32,341 | |
| SPS Commerce, Inc.* | | | (10,859 | ) | | | 31,883 | |
| Healthcare Trust of America, Inc. — Class A | | | (46,788 | ) | | | 21,569 | |
| Atlassian Corporation plc — Class A* | | | (34,957 | ) | | | 19,272 | |
| Cable One, Inc. | | | (877 | ) | | | 17,596 | |
| Tesla, Inc.* | | | (2,866 | ) | | | 16,194 | |
| ANSYS, Inc.* | | | (8,868 | ) | | | 12,347 | |
| Valley National Bancorp | | | (60,272 | ) | | | 11,107 | |
| Trustmark Corp. | | | (29,886 | ) | | | 9,146 | |
| McCormick & Company, Inc. | | | (6,640 | ) | | | 8,582 | |
| CareTrust REIT, Inc. | | | (33,611 | ) | | | 4,154 | |
| SBA Communications Corp.* | | | (10,229 | ) | | | 3,174 | |
| Southern Co. | | | (22,625 | ) | | | 3,164 | |
| SEE NOTES TO FINANCIAL STATEMENTS. | THE GUGGENHEIM FUNDS ANNUAL REPORT | 15 |
SCHEDULE OF INVESTMENTS (continued) | September 30, 2017 |
| ALPHA OPPORTUNITY FUND | |
| | | Shares | | | Unrealized
Gain (Loss) | |
| | | | | | | |
| TripAdvisor, Inc.* | | | (20,228 | ) | | $ | 2,763 | |
| Rexford Industrial Realty, Inc. | | | (35,128 | ) | | | (506 | ) |
| Healthcare Realty Trust, Inc. | | | (22,038 | ) | | | (527 | ) |
| Mohawk Industries, Inc.* | | | (4,388 | ) | | | (975 | ) |
| NiSource, Inc. | | | (50,931 | ) | | | (1,572 | ) |
| Commerce Bancshares, Inc. | | | (12,425 | ) | | | (2,933 | ) |
| Howard Hughes Corp.* | | | (7,463 | ) | | | (4,064 | ) |
| Lamb Weston Holdings, Inc. | | | (14,536 | ) | | | (5,965 | ) |
| Madison Square Garden Co. — Class A* | | | (3,641 | ) | | | (8,828 | ) |
| Washington Federal, Inc. | | | (30,186 | ) | | | (10,249 | ) |
| Fulton Financial Corp. | | | (52,144 | ) | | | (10,541 | ) |
| Aqua America, Inc. | | | (26,249 | ) | | | (12,219 | ) |
| Ladder Capital Corp. — Class A | | | (48,077 | ) | | | (12,620 | ) |
| Provident Financial Services, Inc. | | | (27,111 | ) | | | (13,188 | ) |
| Bio-Techne Corp. | | | (8,324 | ) | | | (13,494 | ) |
| Bank of Hawaii Corp. | | | (8,215 | ) | | | (14,469 | ) |
| Amazon.com, Inc.* | | | (1,124 | ) | | | (14,747 | ) |
| Old National Bancorp | | | (51,300 | ) | | | (19,186 | ) |
| Workday, Inc. — Class A* | | | (6,565 | ) | | | (19,441 | ) |
| Air Products & Chemicals, Inc. | | | (4,451 | ) | | | (23,075 | ) |
| Douglas Emmett, Inc. | | | (26,136 | ) | | | (26,068 | ) |
| Dominion Energy, Inc. | | | (22,589 | ) | | | (27,335 | ) |
| S&P Global, Inc. | | | (6,209 | ) | | | (27,545 | ) |
| Terreno Realty Corp. | | | (28,808 | ) | | | (27,713 | ) |
| BWX Technologies, Inc. | | | (12,216 | ) | | | (33,681 | ) |
| EastGroup Properties, Inc. | | | (14,485 | ) | | | (34,363 | ) |
| Alexander & Baldwin, Inc. | | | (15,387 | ) | | | (35,253 | ) |
| WD-40 Co. | | | (6,090 | ) | | | (35,627 | ) |
| Vail Resorts, Inc. | | | (5,610 | ) | | | (36,392 | ) |
| First Midwest Bancorp, Inc. | | | (43,912 | ) | | | (36,416 | ) |
| BB&T Corp. | | | (23,848 | ) | | | (40,066 | ) |
| Willis Towers Watson plc | | | (4,372 | ) | | | (41,500 | ) |
| Intercontinental Exchange, Inc. | | | (13,097 | ) | | | (42,480 | ) |
| Ingevity Corp.* | | | (11,261 | ) | | | (46,431 | ) |
| PTC, Inc.* | | | (20,360 | ) | | | (47,611 | ) |
| Priceline Group, Inc.* | | | (359 | ) | | | (48,640 | ) |
| KeyCorp | | | (70,134 | ) | | | (50,685 | ) |
| WABCO Holdings, Inc.* | | | (4,753 | ) | | | (52,115 | ) |
| Iron Mountain, Inc. | | | (19,898 | ) | | | (52,218 | ) |
| Domino's Pizza, Inc. | | | (3,984 | ) | | | (53,239 | ) |
| ServiceNow, Inc.* | | | (7,520 | ) | | | (55,040 | ) |
| Ollie's Bargain Outlet Holdings, Inc.* | | | (17,456 | ) | | | (55,332 | ) |
| Black Hills Corp. | | | (25,616 | ) | | | (56,803 | ) |
| CME Group, Inc. — Class A | | | (5,727 | ) | | | (56,832 | ) |
| Cabot Oil & Gas Corp. — Class A | | | (36,168 | ) | | | (57,391 | ) |
| Avery Dennison Corp. | | | (11,714 | ) | | | (58,429 | ) |
| Eaton Vance Corp. | | | (29,768 | ) | | | (58,697 | ) |
| Extra Space Storage, Inc. | | | (10,028 | ) | | | (59,737 | ) |
| ABIOMED, Inc.* | | | (4,373 | ) | | | (66,364 | ) |
| Laredo Petroleum, Inc.* | | | (54,828 | ) | | | (66,501 | ) |
| Essex Property Trust, Inc. | | | (6,139 | ) | | | (71,625 | ) |
| Bright Horizons Family Solutions, Inc.* | | | (12,526 | ) | | | (72,051 | ) |
| Texas Roadhouse, Inc. — Class A | | | (14,345 | ) | | | (72,331 | ) |
| Mid-America Apartment Communities, Inc. | | | (15,940 | ) | | | (74,506 | ) |
| Jack in the Box, Inc. | | | (13,707 | ) | | | (74,566 | ) |
| Glacier Bancorp, Inc. | | | (20,140 | ) | | | (75,427 | ) |
| | | | | | Unrealized
Loss | |
| | | | | | | |
| Ross Stores, Inc. | | | (13,737 | ) | | | (78,614 | ) |
| Bio-Rad Laboratories, Inc. — Class A* | | | (5,990 | ) | | | (82,816 | ) |
| Semtech Corp.* | | | (22,989 | ) | | | (83,058 | ) |
| Alexandria Real Estate Equities, Inc. | | | (19,759 | ) | | | (85,405 | ) |
| National Instruments Corp. | | | (22,071 | ) | | | (86,618 | ) |
| Silicon Laboratories, Inc.* | | | (11,773 | ) | | | (90,014 | ) |
| AptarGroup, Inc. | | | (7,959 | ) | | | (90,498 | ) |
| VF Corp. | | | (11,615 | ) | | | (90,642 | ) |
| BankUnited, Inc. | | | (35,667 | ) | | | (91,354 | ) |
| Investors Bancorp, Inc. | | | (141,206 | ) | | | (93,718 | ) |
| John Bean Technologies Corp. | | | (7,595 | ) | | | (98,765 | ) |
| Graco, Inc. | | | (10,039 | ) | | | (103,137 | ) |
| Spire, Inc. | | | (21,509 | ) | | | (106,932 | ) |
| Red Hat, Inc.* | | | (8,533 | ) | | | (108,100 | ) |
| WR Grace & Co. | | | (29,401 | ) | | | (111,345 | ) |
| Summit Materials, Inc. — Class A* | | | (29,928 | ) | | | (112,769 | ) |
| EnPro Industries, Inc. | | | (10,963 | ) | | | (113,029 | ) |
| Century Aluminum Co.* | | | (55,368 | ) | | | (114,775 | ) |
| Neurocrine Biosciences, Inc.* | | | (12,572 | ) | | | (117,405 | ) |
| CyrusOne, Inc. | | | (21,603 | ) | | | (117,717 | ) |
| Woodward, Inc. | | | (12,709 | ) | | | (121,236 | ) |
| Goldman Sachs Group, Inc. | | | (5,269 | ) | | | (121,248 | ) |
| Tyler Technologies, Inc.* | | | (5,732 | ) | | | (126,124 | ) |
| CommVault Systems, Inc.* | | | (14,001 | ) | | | (127,409 | ) |
| PayPal Holdings, Inc.* | | | (19,206 | ) | | | (130,929 | ) |
| AO Smith Corp. | | | (20,175 | ) | | | (138,599 | ) |
| Ecolab, Inc. | | | (24,804 | ) | | | (139,510 | ) |
| KBR, Inc. | | | (44,145 | ) | | | (141,727 | ) |
| Trex Company, Inc.* | | | (8,902 | ) | | | (144,464 | ) |
| O'Reilly Automotive, Inc.* | | | (8,135 | ) | | | (145,246 | ) |
| Matador Resources Co.* | | | (29,252 | ) | | | (150,660 | ) |
| Monro, Inc. | | | (14,427 | ) | | | (151,088 | ) |
| Medidata Solutions, Inc.* | | | (14,144 | ) | | | (156,125 | ) |
| Lithia Motors, Inc. — Class A | | | (6,616 | ) | | | (157,326 | ) |
| First Republic Bank | | | (20,721 | ) | | | (158,296 | ) |
| Cantel Medical Corp. | | | (8,562 | ) | | | (162,678 | ) |
| Cimarex Energy Co. | | | (10,942 | ) | | | (163,306 | ) |
| Crown Castle International Corp. | | | (15,828 | ) | | | (164,517 | ) |
| Cousins Properties, Inc. | | | (182,457 | ) | | | (165,395 | ) |
| Rollins, Inc. | | | (42,197 | ) | | | (166,066 | ) |
| Scotts Miracle-Gro Co. — Class A | | | (33,779 | ) | | | (171,171 | ) |
| Trimble, Inc.* | | | (19,748 | ) | | | (171,303 | ) |
| American Tower Corp. — Class A | | | (10,949 | ) | | | (172,256 | ) |
| First Industrial Realty Trust, Inc. | | | (45,924 | ) | | | (172,900 | ) |
| Cognex Corp. | | | (9,726 | ) | | | (176,552 | ) |
| Allegheny Technologies, Inc.* | | | (55,168 | ) | | | (177,721 | ) |
| McDonald's Corp. | | | (14,035 | ) | | | (184,259 | ) |
| Alliant Energy Corp. | | | (57,720 | ) | | | (190,876 | ) |
| Ligand Pharmaceuticals, Inc. — Class B* | | | (6,484 | ) | | | (191,083 | ) |
| Marriott Vacations Worldwide Corp. | | | (5,832 | ) | | | (192,418 | ) |
| Moody's Corp. | | | (9,497 | ) | | | (195,224 | ) |
| Five Below, Inc.* | | | (13,345 | ) | | | (197,006 | ) |
| Mercury Systems, Inc.* | | | (15,474 | ) | | | (198,210 | ) |
| Deltic Timber Corp. | | | (16,337 | ) | | | (199,826 | ) |
| CF Industries Holdings, Inc. | | | (25,911 | ) | | | (207,135 | ) |
| Monolithic Power Systems, Inc. | | | (16,772 | ) | | | (216,370 | ) |
16 | THE GUGGENHEIM FUNDS ANNUAL REPORT | SEE NOTES TO FINANCIAL STATEMENTS. |
SCHEDULE OF INVESTMENTS (concluded) | September 30, 2017 |
| ALPHA OPPORTUNITY FUND | |
| | | Shares | | | Unrealized
Loss | |
| | | | | | | |
| Atmos Energy Corp. | | | (36,155 | ) | | $ | (216,840 | ) |
| Equinix, Inc. | | | (4,332 | ) | | | (221,813 | ) |
| Wynn Resorts Ltd. | | | (4,691 | ) | | | (227,528 | ) |
| salesforce.com, Inc.* | | | (21,513 | ) | | | (252,605 | ) |
| Albemarle Corp. | | | (12,238 | ) | | | (253,489 | ) |
| Royal Gold, Inc. | | | (15,581 | ) | | | (263,942 | ) |
| Crocs, Inc.* | | | (86,432 | ) | | | (273,482 | ) |
| Adobe Systems, Inc.* | | | (9,281 | ) | | | (281,586 | ) |
| Autodesk, Inc.* | | | (10,987 | ) | | | (291,585 | ) |
| NVIDIA Corp. | | | (4,041 | ) | | | (297,623 | ) |
| Marriott International, Inc. — Class A | | | (15,643 | ) | | | (310,158 | ) |
| CoreSite Realty Corp. | | | (12,375 | ) | | | (313,738 | ) |
| DCT Industrial Trust, Inc. | | | (34,961 | ) | | | (324,871 | ) |
| Ball Corp. | | | (78,256 | ) | | | (338,440 | ) |
| CarMax, Inc.* | | | (29,329 | ) | | | (345,609 | ) |
| Facebook, Inc. — Class A* | | | (15,163 | ) | | | (350,990 | ) |
| International Flavors & Fragrances, Inc. | | | (22,555 | ) | | | (390,738 | ) |
| Xylem, Inc. | | | (28,938 | ) | | | (403,162 | ) |
| Healthcare Services Group, Inc. | | | (34,078 | ) | | | (414,767 | ) |
| Take-Two Interactive Software, Inc.* | | | (11,653 | ) | | | (504,119 | ) |
| FMC Corp. | | | (18,994 | ) | | | (572,280 | ) |
| Total Custom Basket of Short Securities | | | | | | | (12,617,035 | ) |
| * | Non-income producing security. |
† | Value determined based on Level 1 inputs — See Note 4. |
†† | Value determined based on Level 2 inputs — See Note 4. |
1 | All or a portion of this security is pledged as equity index swap collateral at September 30, 2017. |
2 | Rate indicated is the 7 day yield as of September 30, 2017. |
3 | Total Return is based on the return of the custom basket of long securities +/- financing at a variable rate. Rate indicated is the rate effective at September 30, 2017. |
4 | Total Return is based on the return of the custom basket of short securities +/- financing at a variable rate. Rate indicated is the rate effective at September 30, 2017. |
| | plc — Public Limited Company |
| | REIT — Real Estate Investment Trust |
| | |
| | See Sector Classification in Other Information section. |
The following table summarizes the inputs used to value the Fund’s investments at September 30, 2017 (See Note 4 in the Notes to Financial Statements):
| Investments in Securities (Assets) | | Level 1
Quoted
Prices | | | Level 2
Significant
Observable
Inputs | | | Level 2 -
Other* | | | Level 3
Significant
Unobservable
Inputs | | | Total | |
| Common Stocks | | $ | 217,758,990 | | | $ | — | | | $ | — | | | $ | — | | | $ | 217,758,990 | |
| Equity Index Swap Agreements | | | — | | | | — | | | | 3,550,074 | | | | — | | | | 3,550,074 | |
| Money Market Fund | | | 13,952,183 | | | | — | | | | — | | | | — | | | | 13,952,183 | |
| Total Assets | | $ | 231,711,173 | | | $ | — | | | $ | 3,550,074 | | | $ | — | | | $ | 235,261,247 | |
| | | | | | | | | | | | | | | | | | | | | |
| Investments in Securities (Liabilities) | | Level 1
Quoted
Prices | | | Level 2
Significant
Observable
Inputs | | | Level 2 -
Other* | | | Level 3
Significant
Unobservable
Inputs | | | Total | |
| Equity Index Swap Agreements | | $ | — | | | $ | — | | | $ | 13,593,377 | | | $ | — | | | $ | 13,593,377 | |
| * | Other financial instruments include swaps, which are reported as unrealized gain/loss at period end. |
Transfers between investment levels may occur as the markets fluctuate and/or the availability of data used in an investment’s valuation changes. Transfers between valuation levels, if any, are in comparison to the valuation levels at the end of the previous fiscal year, and are effective using the fair value as of the end of the current fiscal period.
For the year ended September 30, 2017, there were no transfers between levels.
| SEE NOTES TO FINANCIAL STATEMENTS. | THE GUGGENHEIM FUNDS ANNUAL REPORT | 17 |
| STATEMENT OF ASSETS AND LIABILITIES |
| September 30, 2017 |
| Assets: | |
| Investments, at value (cost $225,857,794) | | $ | 231,711,173 | |
| Cash | | | 774 | |
| Segregated cash with broker | | | 281 | |
| Unrealized appreciation on swap agreements | | | 3,550,074 | |
| Prepaid expenses | | | 34,082 | |
| Receivables: | |
| Dividends | | | 283,889 | |
| Fund shares sold | | | 32,082 | |
| Interest | | | 8,017 | |
| Total assets | | | 235,620,372 | |
| | | | | |
| Liabilities: | |
| Unrealized depreciation on swap agreements | | | 13,593,377 | |
| Payable for: | |
| Swap settlement | | | 349,883 | |
| Management fees | | | 151,983 | |
| Fund shares redeemed | | | 33,128 | |
| Fund accounting/administration fees | | | 14,396 | |
| Investment Adviser | | | 11,543 | |
| Distribution and service fees | | | 6,670 | |
| Transfer agent/maintenance fees | | | 2,430 | |
| Trustees’ fees* | | | 931 | |
| Miscellaneous | | | 37,207 | |
| Total liabilities | | | 14,201,548 | |
| Net assets | | $ | 221,418,824 | |
| | | | | |
| Net assets consist of: | |
| Paid in capital | | $ | 215,025,028 | |
| Undistributed net investment income | | | — | |
| Accumulated net realized gain on investments | | | 10,583,719 | |
| Net unrealized depreciation on investments | | | (4,189,923 | ) |
| Net assets | | $ | 221,418,824 | |
| | | | | |
| A-Class: | |
| Net assets | | $ | 15,011,107 | |
| Capital shares outstanding | | | 711,305 | |
| Net asset value per share | | $ | 21.10 | |
| Maximum offering price per share (Net asset value divided by 95.25%) | | $ | 22.15 | |
| | | | | |
| C-Class: | |
| Net assets | | $ | 2,508,067 | |
| Capital shares outstanding | | | 134,717 | |
| Net asset value per share | | $ | 18.62 | |
| | | | | |
| P-Class: | |
| Net assets | | $ | 7,719,535 | |
| Capital shares outstanding | | | 364,273 | |
| Net asset value per share | | $ | 21.19 | |
| | | | | |
| Institutional Class: | |
| Net assets | | $ | 196,180,115 | |
| Capital shares outstanding | | | 6,568,899 | |
| Net asset value per share | | $ | 29.86 | |
| STATEMENT OF OPERATIONS |
| Year Ended September 30, 2017 |
| Investment Income: | |
| Dividends | | $ | 3,305,662 | |
| Interest | | | 67,395 | |
| Total investment income | | | 3,373,057 | |
| | | | | |
| Expenses: | |
| Management fees | | | 1,862,728 | |
| Distribution and service fees: | |
| A-Class | | | 47,302 | |
| C-Class | | | 21,767 | |
| P-Class | | | 23,404 | |
| Transfer agent/maintenance fees: | |
| A-Class | | | 30,246 | |
| C-Class | | | 1,595 | |
| P-Class | | | 14,019 | |
| Institutional Class | | | 21,759 | |
| Short sales dividend expense | | | 151,028 | |
| Fund accounting/administration fees | | | 135,748 | |
| Line of credit fees | | | 17,597 | |
| Custodian fees | | | 15,208 | |
| Trustees’ fees* | | | 8,833 | |
| Recoupment of previously waived fees: | |
| A-Class | | | 60,328 | |
| C-Class | | | 14,003 | |
| Institutional Class | | | 8,700 | |
| Miscellaneous | | | 132,329 | |
| Total expenses | | | 2,566,594 | |
| Less: | |
| Expenses reimbursed by Adviser: | | | | |
| A-Class | | | (6,685 | ) |
| C-Class | | | (658 | ) |
| P-Class | | | (2,643 | ) |
| Institutional Class | | | (422 | ) |
| Expenses waived by Adviser | | | (8,272 | ) |
| Total waived/reimbursed expenses | | | (18,680 | ) |
| Net expenses | | | 2,547,914 | |
| Net investment income | | | 825,143 | |
| | | | | |
| Net Realized and Unrealized Gain (Loss): | |
| Net realized gain (loss) on: | |
| Investments | | | 16,232,264 | |
| Swap agreements | | | (61,617 | ) |
| Securities sold short | | | (2,559,215 | ) |
| Net realized gain | | | 13,611,432 | |
| Net change in unrealized appreciation (depreciation) on: | |
| Investments | | | 2,589,543 | |
| Securities sold short | | | 1,588,748 | |
| Swap agreements | | | (8,133,002 | ) |
| Net change in unrealized appreciation (depreciation) | | | (3,954,711 | ) |
| Net realized and unrealized gain | | | 9,656,721 | |
| Net increase in net assets resulting from operations | | $ | 10,481,864 | |
| * | Relates to Trustees not deemed “interested persons” within the meaning of Section 2(a)(19) of the 1940 Act. |
18 | THE GUGGENHEIM FUNDS ANNUAL REPORT | SEE NOTES TO FINANCIAL STATEMENTS. |
| STATEMENTS OF CHANGES IN NET ASSETS |
| | | Year Ended
September 30,
2017 | | | Year Ended
September 30,
2016 | |
| Increase (Decrease) in Net Assets from Operations: | | | | | | |
| Net investment income (loss) | | $ | 825,143 | | | $ | (455,465 | ) |
| Net realized gain on investments | | | 13,611,432 | | | | 1,231,333 | |
| Net change in unrealized appreciation (depreciation) on investments | | | (3,954,711 | ) | | | 1,541,556 | |
| Net increase in net assets resulting from operations | | | 10,481,864 | | | | 2,317,424 | |
| | | | | | | | | |
| Distributions to shareholders from: | | | | | | | | |
| Net realized gains | | | | | | | | |
| A-Class | | | (9,722 | ) | | | — | |
| C-Class | | | (1,227 | ) | | | — | |
| P-Class | | | (3,342 | ) | | | — | |
| Institutional Class | | | (43,388 | ) | | | — | |
| Total distributions to shareholders | | | (57,679 | ) | | | — | |
| | | | | | | | | |
| Capital share transactions: | | | | | | | | |
| Proceeds from sale of shares | | | | | | | | |
| A-Class | | | 10,194,828 | | | | 13,416,725 | |
| C-Class | | | 1,157,811 | | | | 1,144,266 | |
| P-Class | | | 14,180,540 | | | | 6,055,462 | |
| Institutional Class | | | 136,905,494 | | | | 11,962,236 | |
| Distributions reinvested | | | | | | | | |
| A-Class | | | 9,070 | | | | — | |
| C-Class | | | 1,192 | | | | — | |
| P-Class | | | 3,342 | | | | — | |
| Institutional Class | | | 43,369 | | | | — | |
| Cost of shares redeemed | | | | | | | | |
| A-Class | | | (13,021,740 | ) | | | (9,133,848 | ) |
| C-Class | | | (368,114 | ) | | | (831,133 | ) |
| P-Class | | | (11,532,946 | ) | | | (1,749,969 | ) |
| Institutional Class | | | (5,173,092 | ) | | | (7,711,248 | ) |
| Net increase from capital share transactions | | | 132,399,754 | | | | 13,152,491 | |
| Net increase in net assets | | | 142,823,939 | | | | 15,469,915 | |
| | | | | | | | | |
| Net assets: | | | | | | | | |
| Beginning of year | | | 78,594,885 | | | | 63,124,970 | |
| End of year | | $ | 221,418,824 | | | $ | 78,594,885 | |
| Undistributed net investment income/Accumulated net investment loss at end of year | | $ | — | | | $ | (657,245 | ) |
| | | | | | | | | |
| Capital share activity: | | | | | | | | |
| Shares sold | | | | | | | | |
| A-Class | | | 500,937 | | | | 702,394 | |
| C-Class | | | 63,585 | | | | 68,002 | |
| P-Class | | | 683,702 | | | | 317,616 | |
| Institutional Class | | | 4,636,032 | | | | 448,620 | |
| Shares issued from reinvestment of distributions | | | | | | | | |
| A-Class | | | 447 | | | | — | |
| C-Class | | | 66 | | | | — | |
| P-Class | | | 163 | | | | — | |
| Institutional Class | | | 1,492 | | | | — | |
| Shares redeemed | | | | | | | | |
| A-Class | | | (630,915 | ) | | | (486,062 | ) |
| C-Class | | | (20,327 | ) | | | (49,650 | ) |
| P-Class | | | (552,657 | ) | | | (91,817 | ) |
| Institutional Class | | | (177,256 | ) | | | (295,069 | ) |
| Net increase in shares | | | 4,505,269 | | | | 614,034 | |
| SEE NOTES TO FINANCIAL STATEMENTS. | THE GUGGENHEIM FUNDS ANNUAL REPORT | 19 |
This table is presented to show selected data for a share outstanding throughout each period and to assist shareholders in evaluating a Fund’s performance for the periods presented.
| A-Class | | Year Ended
September 30,
2017 | | | Year Ended
September 30,
2016 | | | Year Ended
September 30,
2015 | | | Year Ended
September 30,
2014 | | | Year Ended
September 30,
2013 | |
| Per Share Data | | | | | | | | | | | | | | | |
| Net asset value, beginning of period | | $ | 19.08 | | | $ | 18.39 | | | $ | 18.01 | | | $ | 16.22 | | | $ | 13.33 | |
| Income (loss) from investment operations: | |
Net investment income (loss)a | | | .31 | | | | (.19 | ) | | | (.35 | ) | | | (.13 | ) | | | .03 | |
| Net gain (loss) on investments (realized and unrealized) | | | 1.72 | | | | .88 | | | | .73 | | | | 1.92 | | | | 2.86 | |
| Total from investment operations | | | 2.03 | | | | .69 | | | | .38 | | | | 1.79 | | | | 2.89 | |
| Less distributions from: | |
| Net investment income | | | — | | | | — | | | | (— | )b | | | — | | | | — | |
| Net realized gains | | | (.01 | ) | | | — | | | | — | | | | — | | | | — | |
| Total distributions | | | (.01 | ) | | | — | | | | (— | )b | | | — | | | | — | |
| Net asset value, end of period | | $ | 21.10 | | | $ | 19.08 | | | $ | 18.39 | | | $ | 18.01 | | | $ | 16.22 | |
| | |
Total Returnc | | | 10.70 | % | | | 3.70 | % | | | 2.13 | % | | | 11.04 | % | | | 21.38 | % |
| Ratios/Supplemental Data | |
| Net assets, end of period (in thousands) | | $ | 15,011 | | | $ | 16,041 | | | $ | 11,485 | | | $ | 7,989 | | | $ | 7,749 | |
| Ratios to average net assets: | |
| Net investment income (loss) | | | (1.49 | %) | | | (1.02 | %) | | | (1.88 | %) | | | (0.73 | %) | | | 0.19 | % |
Total expensesg | | | 2.21 | % | | | 2.69 | % | | | 3.92 | % | | | 3.25 | % | | | 3.99 | % |
Net expensesd,e,h | | | 2.17 | % | | | 2.69 | % | | | 2.94 | % | | | 2.12 | % | | | 2.14 | % |
| Portfolio turnover rate | | | 92 | % | | | 235 | % | | | 124 | % | | | — | | | | 488 | % |
| C-Class | | Year Ended
September 30,
2017 | | | Year Ended
September 30,
2016 | | | Year Ended
September 30,
2015 | | | Year Ended
September 30,
2014 | | | Year Ended
September 30,
2013 | |
| Per Share Data | | | | | | | | | | | | | | | |
| Net asset value, beginning of period | | $ | 16.96 | | | $ | 16.47 | | | $ | 16.25 | | | $ | 14.74 | | | $ | 12.21 | |
| Income (loss) from investment operations: | |
Net investment income (loss)a | | | .09 | | | | (.29 | ) | | | (.44 | ) | | | (.23 | ) | | | (.07 | ) |
| Net gain (loss) on investments (realized and unrealized) | | | 1.58 | | | | .78 | | | | .66 | | | | 1.74 | | | | 2.60 | |
| Total from investment operations | | | 1.67 | | | | .49 | | | | .22 | | | | 1.51 | | | | 2.53 | |
| Less distributions from: | |
| Net investment income | | | — | | | | — | | | | (— | )b | | | — | | | | — | |
| Net realized gains | | | (.01 | ) | | | — | | | | — | | | | — | | | | — | |
| Total distributions | | | (.01 | ) | | | — | | | | (— | )b | | | — | | | | — | |
| Net asset value, end of period | | $ | 18.62 | | | $ | 16.96 | | | $ | 16.47 | | | $ | 16.25 | | | $ | 14.74 | |
| | |
Total Returnc | | | 9.91 | % | | | 2.91 | % | | | 1.38 | % | | | 10.24 | % | | | 20.48 | % |
| Ratios/Supplemental Data | |
| Net assets, end of period (in thousands) | | $ | 2,508 | | | $ | 1,550 | | | $ | 1,203 | | | $ | 1,117 | | | $ | 1,206 | |
| Ratios to average net assets: | |
| Net investment income (loss) | | | (0.47 | %) | | | (1.72 | %) | | | (2.64 | %) | | | (1.46 | %) | | | (0.56 | %) |
Total expensesg | | | 2.94 | % | | | 3.91 | % | | | 4.81 | % | | | 4.11 | % | | | 4.84 | % |
Net expensesd,e,h | | | 2.88 | % | | | 3.46 | % | | | 3.68 | % | | | 2.87 | % | | | 2.89 | % |
| Portfolio turnover rate | | | 92 | % | | | 235 | % | | | 124 | % | | | — | | | | 488 | % |
20 | THE GUGGENHEIM FUNDS ANNUAL REPORT | SEE NOTES TO FINANCIAL STATEMENTS. |
FINANCIAL HIGHLIGHTS (continued) |
This table is presented to show selected data for a share outstanding throughout each period and to assist shareholders in evaluating a Fund’s performance for the periods presented.
| P-Class | | Year Ended
September 30,
2017 | | | Year Ended
September 30,
2016 | | | Period Ended
September 30,
2015f | |
| Per Share Data | | | | | | | | | |
| Net asset value, beginning of period | | $ | 19.11 | | | $ | 18.39 | | | $ | 19.11 | |
| Income (loss) from investment operations: | |
Net investment income (loss)a | | | (.06 | ) | | | (.12 | ) | | | (.13 | ) |
| Net gain (loss) on investments (realized and unrealized) | | | 2.15 | | | | .84 | | | | (.59 | ) |
| Total from investment operations | | | 2.09 | | | | .72 | | | | (.72 | ) |
| Less distributions from: | |
| Net realized gains | | | (.01 | ) | | | — | | | | — | |
| Total distributions | | | (.01 | ) | | | — | | | | — | |
| Net asset value, end of period | | $ | 21.19 | | | $ | 19.11 | | | $ | 18.39 | |
| | |
Total Returnc | | | 11.00 | % | | | 3.86 | % | | | (3.77 | %) |
| Ratios/Supplemental Data | |
| Net assets, end of period (in thousands) | | $ | 7,720 | | | $ | 4,453 | | | $ | 134 | |
| Ratios to average net assets: | |
| Net investment income (loss) | | | (0.31 | %) | | | (0.65 | %) | | | (1.77 | %) |
Total expensesg | | | 1.75 | % | | | 2.44 | % | | | 3.31 | % |
Net expensesd,h | | | 1.72 | % | | | 2.44 | % | | | 2.87 | % |
| Portfolio turnover rate | | | 92 | % | | | 235 | % | | | 124 | % |
| SEE NOTES TO FINANCIAL STATEMENTS. | THE GUGGENHEIM FUNDS ANNUAL REPORT | 21 |
FINANCIAL HIGHLIGHTS (concluded) |
This table is presented to show selected data for a share outstanding throughout each period and to assist shareholders in evaluating a Fund’s performance for the periods presented.
| Institutional Class | | Year Ended
September 30,
2017 | | | Year Ended
September 30,
2016 | | | Year Ended
September 30,
2015 | | | Year Ended
September 30,
2014 | | | Year Ended
September 30,
2013 | |
| Per Share Data | | | | | | | | | | | | | | | |
| Net asset value, beginning of period | | $ | 26.82 | | | $ | 25.73 | | | $ | 25.13 | | | $ | 22.58 | | | $ | 18.52 | |
| Income (loss) from investment operations: | |
Net investment income (loss)a | | | .12 | | | | (.13 | ) | | | (.40 | ) | | | (.12 | ) | �� | | .09 | |
| Net gain (loss) on investments (realized and unrealized) | | | 2.93 | | | | 1.22 | | | | 1.00 | | | | 2.67 | | | | 3.97 | |
| Total from investment operations | | | 3.05 | | | | 1.09 | | | | .60 | | | | 2.55 | | | | 4.06 | |
| Less distributions from: | |
| Net investment income | | | — | | | | — | | | | (— | )b | | | — | | | | — | |
| Net realized gains | | | (.01 | ) | | | — | | | | — | | | | — | | | | — | |
| Total distributions | | | (.01 | ) | | | — | | | | (— | )b | | | — | | | | — | |
| Net asset value, end of period | | $ | 29.86 | | | $ | 26.82 | | | $ | 25.73 | | | $ | 25.13 | | | $ | 22.58 | |
| | |
Total Returnc | | | 11.42 | % | | | 4.20 | % | | | 2.41 | % | | | 11.29 | % | | | 21.60 | % |
| Ratios/Supplemental Data | |
| Net assets, end of period (in thousands) | | $ | 196,180 | | | $ | 56,550 | | | $ | 50,304 | | | $ | 1,645 | | | $ | 1,740 | |
| Ratios to average net assets: | |
| Net investment income (loss) | | | 0.40 | % | | | (0.49 | %) | | | (1.55 | %) | | | (0.48 | %) | | | 0.43 | % |
Total expensesg | | | 1.38 | % | | | 2.23 | % | | | 2.80 | % | | | 2.90 | % | | | 3.67 | % |
Net expensesd,e,h | | | 1.37 | % | | | 2.23 | % | | | 2.80 | % | | | 1.87 | % | | | 1.90 | % |
| Portfolio turnover rate | | | 92 | % | | | 235 | % | | | 124 | % | | | — | | | | 488 | % |
a | Net investment income (loss) per share was computed using average shares outstanding throughout the period. |
b | Distributions from net investment income are less than $0.01 per share. |
c | Total return does not reflect the impact of any applicable sales charges. |
d | Net expense information reflects the expense ratios after expense waivers and reimbursements, on applicable. |
e | The portion of the ratios of net expenses to average net assets attributable to recoupments of prior fee reductions or expense reimbursements is 0.32% for A-Class, 0.64% for C-Class, and 0.01% for Institutional Class. |
f | Since commencement of operations: May 1, 2015. Percentage amounts for the period, except total return and portfolio turnover rate, have been annualized. |
g | Does not include expenses of the underlying funds in which the Fund invests. |
h | Net expenses may include expenses that are excluded from the expense limitation agreement and recouped amounts. Excluding these expenses, the operating expense ratios for the years presented would be: |
| | | 09/30/17 | 09/30/16 | 09/30/15 | 09/30/14 | 09/30/13 |
| | A-Class | 2.00% | 2.11% | 2.11% | 2.11% | 2.11% |
| | C-Class | 2.71% | 2.86% | 2.86% | 2.86% | 2.86% |
| | P-Class | 1.68% | 1.87% | 2.10% | — | — |
| | Institutional Class | 1.28% | 1.63% | 1.86% | 1.86% | 1.86% |
22 | THE GUGGENHEIM FUNDS ANNUAL REPORT | SEE NOTES TO FINANCIAL STATEMENTS. |
MANAGERS’ COMMENTARY (Unaudited) | September 30, 2017 |
To Our Shareholders:
Guggenheim Large Cap Value Fund (the “Fund”) is managed by a team of seasoned professionals led by James Schier, CFA, Managing Director and Senior Portfolio Manager; Scott Hammond, Managing Director and Portfolio Manager; Farhan Sharaff, Assistant Chief Investment Officer, Equities, and Portfolio Manager; Gregg Strohkorb, CFA, Portfolio Manager; and David Toussaint, CFA, CPA, Director and Senior Equity Research Analyst. In the following paragraphs, the team discusses performance of the Fund for the fiscal year ended September 30, 2017.
For the one year period ended September 30, 2017, Guggenheim Large Cap Value Fund returned 17.68%1, compared with the 15.12% return of its benchmark, the Russell 1000® Value Index.
Strategy and Market Overview
Our investment approach focuses on understanding how companies make money and how easily companies can improve returns, maintain existing high levels of profitability, or benefit from change that occurs within the industries in which they operate. In today’s rapidly changing environment marked by very sharp and quick, but constrained volatility, our long-term orientation and discipline are a competitive advantage. This should become especially critical when the environment of indiscriminant valuation expansion subsides, and fundamentals once again become a more dominant factor in the market.
Performance Review
Most of the performance differential was due to stock selection. The largest positive impact was in the Financials and Industrials sectors. On the negative side, the largest impact was in the Energy and Health Care sectors.
The top individual contributors on an absolute basis were financial services companies: JPMorgan Chase & Co., Bank of America Corp., and Citigroup, Inc. The strategy’s asset-sensitive bank holdings performed particularly well as short term interest rates were hiked three times during the period.
The leading individual detractors from the Fund’s return on an absolute basis included Whiting Petroleum Corp., Qualcomm, Inc., and Kinder Morgan, Inc. – Class P. Volatility in oil prices over the period was a factor in performance of energy names.
Portfolio Positioning
The largest relative sector exposures for the year were underweights in Telecommunications Services and Real Estate, and overweights in Tech and Materials. All stances but the Tech overweight contributed to performance.
Portfolio and Market Outlook
As the period began, election results drove the market, as investors discounted the possibility of a stronger economy brought about by reduced regulation and tax cuts, and became comfortable with the notion that any interest rate increases would be gradual. While optimism that the President’s agenda would be quickly enacted faded in the early part of 2017, it was renewed in the middle of the year, helped by talk of tax cuts and a solid U.S. economy. The market has remained resilient and buoyant. We believe the bias in the market will continue to be to the upside, but expect volatility could likely resurface.
Our portfolios tend to reflect a bias toward companies with balance sheet quality. We continue to find niche companies with what we believe to be attractive growth opportunities, and, as such, are constructive on the outlook.
Performance displayed represents past performance which is no guarantee of future results.
1 | Performance figures are based on Class A shares and do not reflect taxes that a shareholder would pay on distributions or the redemption of shares. |
The opinions and forecast expressed may not actually come to pass. This information is subject to change at any time, based on market and other conditions, and should not be construed as a recommendation of any specific security or strategy.
| | THE GUGGENHEIM FUNDS ANNUAL REPORT | 23 |
PERFORMANCE REPORT AND FUND PROFILE (Unaudited) | September 30, 2017 |
LARGE CAP VALUE FUND
OBJECTIVE: Seeks long-term growth of capital.
Holdings Diversification (Market Exposure as % of Net Assets)
“Holdings Diversification (Market Exposure as % of Net Assets)” excludes any temporary cash investments.
| Inception Dates: |
| A-Class | August 7, 1944 |
| C-Class | January 29, 1999 |
| P-Class | May 1, 2015 |
| Institutional Class | June 7, 2013 |
| Ten Largest Holdings (% of Total Net Assets) |
| JPMorgan Chase & Co. | 3.4% |
| Berkshire Hathaway, Inc. — Class B | 3.1% |
| Johnson & Johnson | 2.9% |
| Chevron Corp. | 2.6% |
| Bank of America Corp. | 2.6% |
| Citigroup, Inc. | 2.5% |
| Exxon Mobil Corp. | 2.4% |
| Wells Fargo & Co. | 1.9% |
| Pfizer, Inc. | 1.8% |
| Intel Corp. | 1.8% |
| Top Ten Total | 25.0% |
| “Ten Largest Holdings” excludes any temporary cash investments. |
| 24 | THE GUGGENHEIM FUNDS ANNUAL REPORT | |
PERFORMANCE REPORT AND FUND PROFILE (Unaudited)(concluded) | September 30, 2017 |
Cumulative Fund Performance*
Average Annual Returns*
Periods Ended September 30, 2017
| | 1 Year | 5 Year | 10 Year |
| A-Class Shares | 17.68% | 12.48% | 5.20% |
A-Class Shares with sales charge‡ | 12.10% | 11.39% | 4.58% |
| C-Class Shares | 16.74% | 11.63% | 4.35% |
C-Class Shares with CDSC§ | 15.74% | 11.63% | 4.35% |
| Russell 1000 Value Index | 15.12% | 13.20% | 5.92% |
| | | 1 Year | Since Inception (05/01/15) |
| P-Class Shares | | 17.63% | 8.62% |
| Russell 1000 Value Index | | 15.12% | 8.01% |
| | | 1 Year | Since Inception (06/07/13) |
| Institutional Class Shares | | 17.96% | 10.35% |
| Russell 1000 Value Index | | 15.12% | 10.74% |
| * | The performance data above represents past performance that is not predictive of future results. The investment return and principal value of an investment in the Fund will fluctuate so that an investor’s shares, when redeemed, may be worth more or less than their original cost. Returns are historical and include changes in principal and reinvested dividends and capital gains and do not reflect the effect of taxes. The Russell 1000 Value Index is an unmanaged index and, unlike the Fund, has no management fees or operating expenses to reduce its reported return. The graph is based on A-Class shares only; performance for C-Class, P-Class and Institutional Class will vary due to differences in fee structures. The graph is based on A-Class shares only; performance for C-Class, P-Class and Institutional Class will vary due to differences in fee structures. |
‡ | Effective February 22, 2011, the maximum sales charge decreased from 5.75% to 4.75%. A 5.75% maximum sales charge is used in the calculation of the 1 Year, 5 Year and 10 Year average annual returns (based on subscriptions made prior to February 22, 2011), and a 4.75% maximum sales charge will be used to calculate performance for periods based on subscriptions made on or after February 22, 2011. |
§ | Fund returns include a CDSC of 1% if redeemed within 12 months of purchase. |
| | THE GUGGENHEIM FUNDS ANNUAL REPORT | 25 |
| SCHEDULE OF INVESTMENTS | September 30, 2017 |
| LARGE CAP VALUE FUND | |
| | | Shares | | | Value | |
| | | | | | | |
COMMON STOCKS† - 99.3% | |
| | | | | | | |
| Financial - 29.0% | |
| JPMorgan Chase & Co. | | | 23,403 | | | $ | 2,235,220 | |
| Berkshire Hathaway, Inc. — Class B* | | | 11,038 | | | | 2,023,487 | |
| Bank of America Corp. | | | 67,490 | | | | 1,710,196 | |
| Citigroup, Inc. | | | 22,081 | | | | 1,606,171 | |
| Wells Fargo & Co. | | | 23,115 | | | | 1,274,792 | |
| BB&T Corp. | | | 16,038 | | | | 752,824 | |
| Zions Bancorporation | | | 15,175 | | | | 715,957 | |
| T. Rowe Price Group, Inc. | | | 7,844 | | | | 711,059 | |
| SunTrust Banks, Inc. | | | 11,705 | | | | 699,608 | |
| Charles Schwab Corp. | | | 15,623 | | | | 683,350 | |
| Welltower, Inc. REIT | | | 8,467 | | | | 595,061 | |
| E*TRADE Financial Corp.* | | | 13,072 | | | | 570,070 | |
| Allstate Corp. | | | 6,063 | | | | 557,250 | |
| Unum Group | | | 10,634 | | | | 543,716 | |
| Piedmont Office Realty Trust, Inc. — Class A REIT | | | 26,043 | | | | 525,027 | |
| Omega Healthcare Investors, Inc. REIT | | | 15,231 | | | | 486,021 | |
| Assured Guaranty Ltd. | | | 11,627 | | | | 438,919 | |
| Morgan Stanley | | | 8,519 | | | | 410,360 | |
| Host Hotels & Resorts, Inc. REIT | | | 21,622 | | | | 399,791 | |
| American International Group, Inc. | | | 5,449 | | | | 334,514 | |
| KeyCorp | | | 17,002 | | | | 319,978 | |
| Regions Financial Corp. | | | 19,250 | | | | 293,178 | |
| Prudential Financial, Inc. | | | 2,583 | | | | 274,625 | |
| Federated Investors, Inc. — Class B | | | 7,699 | | | | 228,660 | |
| Equity Commonwealth REIT* | | | 6,130 | | | | 186,352 | |
| Rayonier, Inc. REIT | | | 5,647 | | | | 163,142 | |
| Liberty Property Trust REIT | | | 3,786 | | | | 155,453 | |
| Hartford Financial Services Group, Inc. | | | 1,938 | | | | 107,423 | |
| Total Financial | | | | | | | 19,002,204 | |
| | | | | | | | | |
| Consumer, Non-cyclical - 18.5% | |
| Johnson & Johnson | | | 14,664 | | | | 1,906,468 | |
| Pfizer, Inc. | | | 33,904 | | | | 1,210,373 | |
| Merck & Company, Inc. | | | 15,708 | | | | 1,005,783 | |
| Procter & Gamble Co. | | | 9,976 | | | | 907,616 | |
| Bunge Ltd. | | | 8,567 | | | | 595,064 | |
| Hormel Foods Corp. | | | 18,163 | | | | 583,759 | |
| Tyson Foods, Inc. — Class A | | | 7,904 | | | | 556,837 | |
| HCA Healthcare, Inc.* | | | 6,588 | | | | 524,339 | |
| Express Scripts Holding Co.* | | | 7,994 | | | | 506,180 | |
| Zimmer Biomet Holdings, Inc. | | | 3,805 | | | | 445,527 | |
| United Therapeutics Corp.* | | | 3,707 | | | | 434,423 | |
| Quest Diagnostics, Inc. | | | 4,537 | | | | 424,845 | |
| UnitedHealth Group, Inc. | | | 2,051 | | | | 401,688 | |
| Philip Morris International, Inc. | | | 3,338 | | | | 370,551 | |
| Archer-Daniels-Midland Co. | | | 7,470 | | | | 317,550 | |
| AmerisourceBergen Corp. — Class A | | | 3,822 | | | | 316,271 | |
| Post Holdings, Inc.* | | | 3,441 | | | | 303,737 | |
| DaVita, Inc.* | | | 5,093 | | | | 302,473 | |
| Medtronic plc | | | 3,728 | | | | 289,927 | |
| Akorn, Inc.* | | | 7,313 | | | | 242,718 | |
| Ingredion, Inc. | | | 1,421 | | | | 171,429 | |
| JM Smucker Co. | | | 1,604 | | | | 168,308 | |
| Dr Pepper Snapple Group, Inc. | | | 1,388 | | | | 122,796 | |
| Total Consumer, Non-cyclical | | | | | | | 12,108,662 | |
| | | | | | | | | |
| Industrial - 10.9% | |
| WestRock Co. | | | 12,721 | | | | 721,662 | |
| General Electric Co. | | | 26,811 | | | | 648,290 | |
| Orbital ATK, Inc. | | | 4,711 | | | | 627,317 | |
| Corning, Inc. | | | 20,220 | | | | 604,982 | |
| Republic Services, Inc. — Class A | | | 8,692 | | | | 574,194 | |
| Crown Holdings, Inc.* | | | 9,105 | | | | 543,751 | |
| Owens Corning | | | 6,735 | | | | 520,952 | |
| United Technologies Corp. | | | 4,360 | | | | 506,109 | |
| Carlisle Companies, Inc. | | | 4,273 | | | | 428,539 | |
| Eagle Materials, Inc. | | | 3,594 | | | | 383,480 | |
| Honeywell International, Inc. | | | 2,534 | | | | 359,169 | |
| Eaton Corporation plc | | | 4,622 | | | | 354,923 | |
| Jabil, Inc. | | | 11,304 | | | | 322,729 | |
| Snap-on, Inc. | | | 1,873 | | | | 279,096 | |
| Timken Co. | | | 5,146 | | | | 249,838 | |
| Total Industrial | | | | | | | 7,125,031 | |
| | | | | | | | | |
| Consumer, Cyclical - 10.1% | |
| Wal-Mart Stores, Inc. | | | 13,463 | | | | 1,051,998 | |
| Southwest Airlines Co. | | | 11,939 | | | | 668,346 | |
| Lear Corp. | | | 3,679 | | | | 636,762 | |
| DR Horton, Inc. | | | 15,314 | | | | 611,488 | |
| CVS Health Corp. | | | 6,851 | | | | 557,123 | |
| Goodyear Tire & Rubber Co. | | | 16,221 | | | | 539,348 | |
| Target Corp. | | | 7,523 | | | | 443,932 | |
| PVH Corp. | | | 3,280 | | | | 413,477 | |
| Carnival Corp. | | | 6,345 | | | | 409,697 | |
| JetBlue Airways Corp.* | | | 21,229 | | | | 393,373 | |
| PACCAR, Inc. | | | 5,153 | | | | 372,768 | |
| MGM Resorts International | | | 10,869 | | | | 354,221 | |
| Lowe’s Companies, Inc. | | | 2,062 | | | | 164,836 | |
| Total Consumer, Cyclical | | | | | | | 6,617,369 | |
| | | | | | | | | |
| Energy - 10.1% | |
| Chevron Corp. | | | 14,694 | | | | 1,726,544 | |
| Exxon Mobil Corp. | | | 18,875 | | | | 1,547,373 | |
| Kinder Morgan, Inc. | | | 36,145 | | | | 693,261 | |
| Marathon Oil Corp. | | | 39,981 | | | | 542,142 | |
| Hess Corp. | | | 10,503 | | | | 492,486 | |
| Valero Energy Corp. | | | 6,256 | | | | 481,274 | |
| Concho Resources, Inc.* | | | 2,644 | | | | 348,268 | |
| Diamondback Energy, Inc.* | | | 3,347 | | | | 327,872 | |
| Whiting Petroleum Corp.* | | | 51,184 | | | | 279,465 | |
| Laredo Petroleum, Inc.* | | | 11,069 | | | | 143,122 | |
| Total Energy | | | | | | | 6,581,807 | |
| | | | | | | | | |
| Utilities - 6.7% | |
| Exelon Corp. | | | 18,280 | | | | 688,608 | |
| Public Service Enterprise Group, Inc. | | | 14,367 | | | | 664,474 | |
| FirstEnergy Corp. | | | 21,412 | | | | 660,132 | |
| Ameren Corp. | | | 10,541 | | | | 609,691 | |
| OGE Energy Corp. | | | 15,287 | | | | 550,791 | |
| Edison International | | | 6,979 | | | | 538,569 | |
26 | THE GUGGENHEIM FUNDS ANNUAL REPORT | SEE NOTES TO FINANCIAL STATEMENTS. |
SCHEDULE OF INVESTMENTS (concluded) | September 30, 2017 |
| LARGE CAP VALUE FUND | |
| | | Shares | | | Value | |
| | | | | | | |
| UGI Corp. | | | 11,068 | | | $ | 518,646 | |
| Duke Energy Corp. | | | 2,116 | | | | 177,575 | |
| Total Utilities | | | | | | | 4,408,486 | |
| | | | | | | | | |
| Technology - 6.3% | |
| Intel Corp. | | | 30,932 | | | | 1,177,890 | |
| Xerox Corp. | | | 19,021 | | | | 633,209 | |
| Apple, Inc. | | | 2,826 | | | | 435,543 | |
| QUALCOMM, Inc. | | | 8,159 | | | | 422,963 | |
| Oracle Corp. | | | 7,552 | | | | 365,139 | |
| VMware, Inc. — Class A* | | | 2,972 | | | | 324,513 | |
| CSRA, Inc. | | | 9,802 | | | | 316,311 | |
| Qorvo, Inc.* | | | 4,000 | | | | 282,720 | |
| NCR Corp.* | | | 4,081 | | | | 153,119 | |
| Total Technology | | | | | | | 4,111,407 | |
| | | | | | | | | |
| Basic Materials - 3.8% | |
| Nucor Corp. | | | 9,897 | | | | 554,627 | |
| DowDuPont, Inc. | | | 7,680 | | | | 531,687 | |
| Reliance Steel & Aluminum Co. | | | 6,421 | | | | 489,088 | |
| Steel Dynamics, Inc. | | | 12,114 | | | | 417,570 | |
| Cabot Corp. | | | 5,509 | | | | 307,402 | |
| Freeport-McMoRan, Inc.* | | | 13,123 | | | | 184,247 | |
| Total Basic Materials | | | | | | | 2,484,621 | |
| | | | | | | | | |
| Communications - 3.5% | |
| Cisco Systems, Inc. | | | 30,723 | | | | 1,033,215 | |
| AT&T, Inc. | | | 17,095 | | | | 669,611 | |
| Time Warner, Inc. | | | 3,495 | | | | 358,063 | |
| Verizon Communications, Inc. | | | 5,184 | | | | 256,556 | |
| Total Communications | | | | | | | 2,317,445 | |
| | | | | | | | | |
| Diversified - 0.4% | |
| Leucadia National Corp. | | | 9,241 | | | | 233,335 | |
| | | | | | | | | |
| Total Common Stocks | | | | | | | | |
| (Cost $54,892,650) | | | | | | | 64,990,367 | |
| | | | | | | | | |
MONEY MARKET FUND† - 0.7% | |
Dreyfus Treasury Securities Cash Management Fund - Institutional Class 0.90%1 | | | 491,220 | | | | 491,220 | |
| Total Money Market Fund | | | | | | | | |
| (Cost $491,220) | | | | | | | 491,220 | |
| | | | | | | | | |
| Total Investments - 100.0% | | | | | | | | |
| (Cost $55,383,870) | | | | | | $ | 65,481,587 | |
| Other Assets & Liabilities, net - 0.0% | | | | | | | (24,798 | ) |
| Total Net Assets - 100.0% | | | | | | $ | 65,456,789 | |
| * | Non-income producing security. |
† | Value determined based on Level 1 inputs — See Note 4. |
1 | Rate indicated is the 7 day yield as of September 30, 2017. |
| | plc — Public Limited Company |
| | REIT — Real Estate Investment Trust |
| | |
| | See Sector Classification in Other Information section. |
The following table summarizes the inputs used to value the Fund’s investments at September 30, 2017 (See Note 4 in the Notes to Financial Statements):
| Investments in Securities (Assets) | | Level 1
Quoted
Prices | | | Level 2
Significant
Observable
Inputs | | | Level 3
Significant
Unobservable
Inputs | | | Total | |
| Common Stocks | | $ | 64,990,367 | | | $ | — | | | $ | — | | | $ | 64,990,367 | |
| Money Market Fund | | | 491,220 | | | | — | | | | — | | | | 491,220 | |
| Total Assets | | $ | 65,481,587 | | | $ | — | | | $ | — | | | $ | 65,481,587 | |
Transfers between investment levels may occur as the markets fluctuate and/or the availability of data used in an investment’s valuation changes. Transfers between valuation levels, if any, are in comparison to the valuation levels at the end of the previous fiscal year, and are effective using the fair value as of the end of the current fiscal period.
For the year ended September 30, 2017, there were no transfers between levels.
| SEE NOTES TO FINANCIAL STATEMENTS. | THE GUGGENHEIM FUNDS ANNUAL REPORT | 27 |
| STATEMENT OF ASSETS AND LIABILITIES |
| September 30, 2017 |
| Assets: | |
| Investments, at value (cost $55,398,044) | | $ | 65,481,587 | |
| Prepaid expenses | | | 29,081 | |
| Receivables: | |
| Dividends | | | 53,924 | |
| Fund shares sold | | | 6,293 | |
| Interest | | | 241 | |
| Total assets | | | 65,571,126 | |
| | | | | |
| Liabilities: | |
| Payable for: | |
| Fund shares redeemed | | | 43,693 | |
| Distribution and service fees | | | 14,981 | |
| Transfer agent/maintenance fees | | | 11,217 | |
| Professional fees | | | 9,738 | |
| Direct shareholders expense | | | 9,241 | |
| Management fees | | | 8,838 | |
| Fund accounting/administration fees | | | 4,236 | |
| Trustees’ fees* | | | 1,009 | |
| Miscellaneous | | | 11,384 | |
| Total liabilities | | | 114,337 | |
| Net assets | | $ | 65,456,789 | |
| | | | | |
| Net assets consist of: | |
| Paid in capital | | $ | 50,348,125 | |
| Undistributed net investment income | | | 515,155 | |
| Accumulated net realized gain on investments | | | 4,495,792 | |
| Net unrealized appreciation on investments | | | 10,097,717 | |
| Net assets | | $ | 65,456,789 | |
| | | | | |
| A-Class: | |
| Net assets | | $ | 60,156,919 | |
| Capital shares outstanding | | | 1,280,948 | |
| Net asset value per share | | $ | 46.96 | |
| Maximum offering price per share (Net asset value divided by 95.25%) | | $ | 49.30 | |
| | | | | |
| C-Class: | |
| Net assets | | $ | 3,460,504 | |
| Capital shares outstanding | | | 79,935 | |
| Net asset value per share | | $ | 43.29 | |
| | | | | |
| P-Class: | |
| Net assets | | $ | 158,010 | |
| Capital shares outstanding | | | 3,368 | |
| Net asset value per share | | $ | 46.91 | |
| | | | | |
| Institutional Class: | |
| Net assets | | $ | 1,681,356 | |
| Capital shares outstanding | | | 36,114 | |
| Net asset value per share | | $ | 46.56 | |
| STATEMENT OF OPERATIONS |
| Year Ended September 30, 2017 |
| Investment Income: | |
| Dividends | | $ | 1,296,597 | |
| Interest | | | 5,159 | |
| Total investment income | | | 1,301,756 | |
| | | | | |
| Expenses: | |
| Management fees | | | 423,193 | |
| Distribution and service fees: | |
| A-Class | | | 150,217 | |
| C-Class | | | 36,435 | |
| P-Class | | | 366 | |
| Transfer agent/maintenance fees | |
| A-Class | | | 36,448 | |
| C-Class | | | 4,051 | |
| P-Class | | | 665 | |
| Institutional Class | | | 264 | |
| Registration fees | | | 57,650 | |
| Fund accounting/administration fees | | | 52,182 | |
| Line of credit fees | | | 13,766 | |
| Trustees’ fees* | | | 8,923 | |
| Custodian fees | | | 1,957 | |
| Recoupment of previously waived fees: | | | | |
| A-Class | | | 6,489 | |
| C-Class | | | 190 | |
| P-Class | | | 7 | |
| Institutional Class | | | 249 | |
| Miscellaneous | | | 80,405 | |
| Total expenses | | | 873,457 | |
| Less: | |
| Expenses reimbursed by Adviser: | | | | |
| A-Class | | | (19,047 | ) |
| C-Class | | | (2,714 | ) |
| P-Class | | | (602 | ) |
| Institutional Class | | | (189 | ) |
| Expenses waived by Adviser | | | (64,304 | ) |
| Total waived/reimbursed expenses | | | (86,856 | ) |
| Net expenses | | | 786,601 | |
| Net investment income | | | 515,155 | |
| | | | | |
| Net Realized and Unrealized Gain (Loss): | |
| Net realized gain (loss) on: | |
| Investments | | | 5,373,662 | |
| Net realized gain | | | 5,373,662 | |
| Net change in unrealized appreciation (depreciation) on: | |
| Investments | | | 4,482,466 | |
| Net change in unrealized appreciation (depreciation) | | | 4,482,466 | |
| Net realized and unrealized gain | | | 9,856,128 | |
| Net increase in net assets resulting from operations | | $ | 10,371,283 | |
| * | Relates to Trustees not deemed “interested persons” within the meaning of Section 2(a)(19) of the 1940 Act. |
28 | THE GUGGENHEIM FUNDS ANNUAL REPORT | SEE NOTES TO FINANCIAL STATEMENTS. |
| STATEMENTS OF CHANGES IN NET ASSETS |
| | | Year Ended
September 30,
2017 | | | Year Ended
September 30,
2016 | |
| Increase (Decrease) in Net Assets from Operations: | | | | | | |
| Net investment income | | $ | 515,155 | | | $ | 802,166 | |
| Net realized gain on investments | | | 5,373,662 | | | | 2,362,410 | |
| Net change in unrealized appreciation (depreciation) on investments | | | 4,482,466 | | | | 5,158,045 | |
| Net increase in net assets resulting from operations | | | 10,371,283 | | | | 8,322,621 | |
| | | | | | | | | |
| Distributions to shareholders from: | | | | | | | | |
| Net investment income | | | | | | | | |
| A-Class | | | (784,293 | ) | | | (433,473 | ) |
| C-Class | | | (25,737 | ) | | | (6,564 | ) |
| P-Class | | | (1,769 | ) | | | (6,451 | ) |
| Institutional Class | | | (1,859 | ) | | | (31,516 | ) |
| Net realized gains | | | | | | | | |
| A-Class | | | (1,894,547 | ) | | | (3,188,410 | ) |
| C-Class | | | (126,909 | ) | | | (263,930 | ) |
| P-Class | | | (4,388 | ) | | | (38,749 | ) |
| Institutional Class | | | (2,387 | ) | | | (178,457 | ) |
| Total distributions to shareholders | | | (2,841,889 | ) | | | (4,147,550 | ) |
| | | | | | | | | |
| Capital share transactions: | | | | | | | | |
| Proceeds from sale of shares | | | | | | | | |
| A-Class | | | 6,416,240 | | | | 13,212,897 | |
| C-Class | | | 878,834 | | | | 638,542 | |
| P-Class | | | 38,483 | | | | 4,067,215 | |
| Institutional Class | | | 2,658,884 | | | | 68,775 | |
| Distributions reinvested | | | | | | | | |
| A-Class | | | 2,617,497 | | | | 3,509,323 | |
| C-Class | | | 151,423 | | | | 266,750 | |
| P-Class | | | 6,157 | | | | 45,199 | |
| Institutional Class | | | 4,245 | | | | 209,973 | |
| Cost of shares redeemed | | | | | | | | |
| A-Class | | | (11,197,321 | ) | | | (11,004,700 | ) |
| C-Class | | | (1,032,598 | ) | | | (1,369,222 | ) |
| P-Class | | | (25,961 | ) | | | (3,997,610 | ) |
| Institutional Class | | | (1,150,836 | ) | | | (2,476,303 | ) |
| Net increase (decrease) from capital share transactions | | | (634,953 | ) | | | 3,170,839 | |
| Net increase in net assets | | | 6,894,441 | | | | 7,345,910 | |
| | | | | | | | | |
| Net assets: | | | | | | | | |
| Beginning of year | | | 58,562,348 | | | | 51,216,438 | |
| End of year | | $ | 65,456,789 | | | $ | 58,562,348 | |
| Undistributed net investment income at end of year | | $ | 515,155 | | | $ | 813,658 | |
| SEE NOTES TO FINANCIAL STATEMENTS. | THE GUGGENHEIM FUNDS ANNUAL REPORT | 29 |
STATEMENTS OF CHANGES IN NET ASSETS (concluded) |
| | | Year Ended
September 30,
2017 | | | Year Ended
September 30,
2016 | |
| Capital share activity: | | | | | | |
| Shares sold | | | | | | |
| A-Class | | | 147,814 | | | | 352,919 | |
| C-Class | | | 21,698 | | | | 17,640 | |
| P-Class | | | 871 | | | | 105,931 | |
| Institutional Class | | | 60,669 | | | | 1,722 | |
| Shares issued from reinvestment of distributions | | | | | | | | |
| A-Class | | | 61,879 | | | | 92,667 | |
| C-Class | | | 3,857 | | | | 7,563 | |
| P-Class | | | 146 | | | | 1,194 | |
| Institutional Class | | | 101 | | | | 5,548 | |
| Shares redeemed | | | | | | | | |
| A-Class | | | (252,786 | ) | | | (280,411 | ) |
| C-Class | | | (25,122 | ) | | | (37,647 | ) |
| P-Class | | | (586 | ) | | | (104,417 | ) |
| Institutional Class | | | (25,603 | ) | | | (71,269 | ) |
| Net increase (decrease) in shares | | | (7,062 | ) | | | 91,440 | |
30 | THE GUGGENHEIM FUNDS ANNUAL REPORT | SEE NOTES TO FINANCIAL STATEMENTS. |
This table is presented to show selected data for a share outstanding throughout each period and to assist shareholders in evaluating a Fund’s performance for the periods presented.
| A-Class | | Year Ended
September 30,
2017 | | | Year Ended
September 30,
2016 | | | Year Ended
September 30,
2015 | | | Year Ended
September 30,
2014 | | | Year Ended
September 30,
2013 | |
| Per Share Data | | | | | | | | | | | | | | | |
| Net asset value, beginning of period | | $ | 41.78 | | | $ | 39.11 | | | $ | 43.80 | | | $ | 38.28 | | | $ | 31.25 | |
| Income (loss) from investment operations: | |
Net investment income (loss)a | | | .37 | | | | .58 | | | | .36 | | | | .30 | | | | .29 | |
| Net gain (loss) on investments (realized and unrealized) | | | 6.80 | | | | 5.23 | | | | (3.36 | ) | | | 5.51 | | | | 7.03 | |
| Total from investment operations | | | 7.17 | | | | 5.81 | | | | (3.00 | ) | | | 5.81 | | | | 7.32 | |
| Less distributions from: | |
| Net investment income | | | (.58 | ) | | | (.37 | ) | | | (.35 | ) | | | (.29 | ) | | | (.29 | ) |
| Net realized gains | | | (1.41 | ) | | | (2.77 | ) | | | (1.34 | ) | | | — | | | | — | |
| Total distributions | | | (1.99 | ) | | | (3.14 | ) | | | (1.69 | ) | | | (.29 | ) | | | (.29 | ) |
| Net asset value, end of period | | $ | 46.96 | | | $ | 41.78 | | | $ | 39.11 | | | $ | 43.80 | | | $ | 38.28 | |
| | |
Total Returnb | | | 17.68 | % | | | 15.69 | % | | | (7.19 | %) | | | 15.25 | % | | | 23.62 | % |
| Ratios/Supplemental Data | |
| Net assets, end of period (in thousands) | | $ | 60,157 | | | $ | 55,325 | | | $ | 45,318 | | | $ | 60,281 | | | $ | 47,307 | |
| Ratios to average net assets: | |
| Net investment income (loss) | | | 0.83 | % | | | 1.48 | % | | | 0.85 | % | | | 0.72 | % | | | 0.82 | % |
Total expensesd | | | 1.30 | % | | | 1.34 | % | | | 1.35 | % | | | 1.48 | % | | | 1.48 | % |
Net expensesc,e | | | 1.17 | %h | | | 1.17 | %h | | | 1.16 | %h | | | 1.17 | %h | | | 1.15 | % |
| Portfolio turnover rate | | | 40 | % | | | 56 | % | | | 60 | % | | | 40 | % | | | 43 | % |
| C-Class | | Year Ended
September 30,
2017 | | | Year Ended
September 30,
2016 | | | Year Ended
September 30,
2015 | | | Year Ended
September 30,
2014 | | | Year Ended
September 30,
2013 | |
| Per Share Data | | | | | | | | | | | | | | | |
| Net asset value, beginning of period | | $ | 38.68 | | | $ | 36.38 | | | $ | 40.91 | | | $ | 35.86 | | | $ | 29.30 | |
| Income (loss) from investment operations: | |
Net investment income (loss)a | | | .03 | | | | .27 | | | | .04 | | | | (.02 | ) | | | .02 | |
| Net gain (loss) on investments (realized and unrealized) | | | 6.28 | | | | 4.87 | | | | (3.13 | ) | | | 5.16 | | | | 6.62 | |
| Total from investment operations | | | 6.31 | | | | 5.14 | | | | (3.09 | ) | | | 5.14 | | | | 6.64 | |
| Less distributions from: | |
| Net investment income | | | (.29 | ) | | | (.07 | ) | | | (.10 | ) | | | (.09 | ) | | | (.08 | ) |
| Net realized gains | | | (1.41 | ) | | | (2.77 | ) | | | (1.34 | ) | | | — | | | | — | |
| Total distributions | | | (1.70 | ) | | | (2.84 | ) | | | (1.44 | ) | | | (.09 | ) | | | (.08 | ) |
| Net asset value, end of period | | $ | 43.29 | | | $ | 38.68 | | | $ | 36.38 | | | $ | 40.91 | | | $ | 35.86 | |
| | |
Total Returnb | | | 16.74 | % | | | 14.87 | % | | | (7.89 | %) | | | 14.35 | % | | | 22.73 | % |
| Ratios/Supplemental Data | |
| Net assets, end of period (in thousands) | | $ | 3,461 | | | $ | 3,075 | | | $ | 3,345 | | | $ | 3,963 | | | $ | 3,494 | |
| Ratios to average net assets: | |
| Net investment income (loss) | | | 0.08 | % | | | 0.75 | % | | | 0.10 | % | | | (0.04 | %) | | | 0.08 | % |
Total expensesd | | | 2.09 | % | | | 2.18 | % | | | 2.16 | % | | | 2.33 | % | | | 2.47 | % |
Net expensesc,e | | | 1.92 | %h | | | 1.92 | %h | | | 1.91 | %h | | | 1.92 | %h | | | 1.90 | % |
| Portfolio turnover rate | | | 40 | % | | | 56 | % | | | 60 | % | | | 40 | % | | | 43 | % |
| SEE NOTES TO FINANCIAL STATEMENTS. | THE GUGGENHEIM FUNDS ANNUAL REPORT | 31 |
FINANCIAL HIGHLIGHTS (continued) |
This table is presented to show selected data for a share outstanding throughout each period and to assist shareholders in evaluating a Fund’s performance for the periods presented.
| P-Class | | Year Ended
September 30,
2017 | | | Year Ended
September 30,
2016 | | | Period Ended
September 30,
2015f | |
| Per Share Data | | | | | | | | | |
| Net asset value, beginning of period | | $ | 41.74 | | | $ | 39.13 | | | $ | 43.64 | |
| Income (loss) from investment operations: | |
Net investment income (loss)a | | | .37 | | | | 1.40 | | | | .22 | |
| Net gain (loss) on investments (realized and unrealized) | | | 6.78 | | | | 4.44 | | | | (4.73 | ) |
| Total from investment operations | | | 7.15 | | | | 5.84 | | | | (4.51 | ) |
| Less distributions from: | |
| Net investment income | | | (.57 | ) | | | (.46 | ) | | | — | |
| Net realized gains | | | (1.41 | ) | | | (2.77 | ) | | | — | |
| Total distributions | | | (1.98 | ) | | | (3.23 | ) | | | — | |
| Net asset value, end of period | | $ | 46.91 | | | $ | 41.74 | | | $ | 39.13 | |
| | |
Total Returnb | | | 17.63 | % | | | 15.83 | % | | | (10.38 | %) |
| Ratios/Supplemental Data | |
| Net assets, end of period (in thousands) | | $ | 158 | | | $ | 123 | | | $ | 9 | |
| Ratios to average net assets: | |
| Net investment income (loss) | | | 0.83 | % | | | 3.61 | % | | | 1.21 | % |
Total expensesd | | | 1.69 | % | | | 1.41 | % | | | 3.29 | % |
Net expensesc,e,h | | | 1.17 | % | | | 1.17 | % | | | 1.16 | % |
| Portfolio turnover rate | | | 40 | % | | | 56 | % | | | 60 | % |
32 | THE GUGGENHEIM FUNDS ANNUAL REPORT | SEE NOTES TO FINANCIAL STATEMENTS. |
FINANCIAL HIGHLIGHTS (concluded) |
This table is presented to show selected data for a share outstanding throughout each period and to assist shareholders in evaluating a Fund’s performance for the periods presented.
| Institutional Class | | Year Ended
September 30,
2017 | | | Year Ended
September 30,
2016 | | | Year Ended
September 30,
2015 | | | Year Ended
September 30,
2014 | | | Period Ended
September 30,
2013g | |
| Per Share Data | | | | | | | | | | | | | | | |
| Net asset value, beginning of period | | $ | 41.84 | | | $ | 39.17 | | | $ | 43.87 | | | $ | 38.32 | | | $ | 36.84 | |
| Income (loss) from investment operations: | |
Net investment income (loss)a | | | .51 | | | | .83 | | | | .47 | | | | .40 | | | | .13 | |
| Net gain (loss) on investments (realized and unrealized) | | | 6.72 | | | | 5.10 | | | | (3.37 | ) | | | 5.51 | | | | 1.35 | |
| Total from investment operations | | | 7.23 | | | | 5.93 | | | | (2.90 | ) | | | 5.91 | | | | 1.48 | |
| Less distributions from: | |
| Net investment income | | | (1.10 | ) | | | (.49 | ) | | | (.46 | ) | | | (.36 | ) | | | — | |
| Net realized gains | | | (1.41 | ) | | | (2.77 | ) | | | (1.34 | ) | | | — | | | | — | |
| Total distributions | | | (2.50 | ) | | | (3.26 | ) | | | (1.80 | ) | | | (.36 | ) | | | — | |
| Net asset value, end of period | | $ | 46.56 | | | $ | 41.84 | | | $ | 39.17 | | | $ | 43.87 | | | $ | 38.32 | |
| | |
Total Returnb | | | 17.96 | % | | | 15.98 | % | | | (6.97 | %) | | | 15.52 | % | | | 4.02 | % |
| Ratios/Supplemental Data | |
| Net assets, end of period (in thousands) | | $ | 1,681 | | | $ | 40 | | | $ | 2,544 | | | $ | 3,339 | | | $ | 2,831 | |
| Ratios to average net assets: | |
| Net investment income (loss) | | | 1.13 | % | | | 2.13 | % | | | 1.09 | % | | | 0.96 | % | | | 1.12 | % |
Total expensesd | | | 1.07 | % | | | 1.04 | % | | | 0.98 | % | | | 1.08 | % | | | 1.12 | % |
Net expensesc,e | | | 0.92 | %h | | | 0.92 | %h | | | 0.91 | %h | | | 0.92 | %h | | | 0.89 | % |
| Portfolio turnover rate | | | 40 | % | | | 56 | % | | | 60 | % | | | 40 | % | | | 43 | % |
a | Net investment income (loss) per share was computed using average shares outstanding throughout the period. |
b | Total return does not reflect the impact of any applicable sales charges. |
c | Net expense information reflects the expense ratios after expense waivers and reimbursements, as applicable. |
d | Does not include expenses of the underlying funds in which the Fund invests. |
e | The portion of the ratios of net expenses to average net assets attributable to recoupments of prior fee reductions or expense reimbursements is 0.01% for A-Class, 0.01% for C-Class, 0.00% for P-Class, and 0.02% for Institutional Class. |
f | Since commencement of operations: May 1, 2015. Percentage amounts for the period, except total return and portfolio turnover rate, have been annualized. |
g | Since commencement of operations: June 7, 2013. Percentage amounts for the period, except total return and portfolio turnover rate, have been annualized. |
h | Net expenses may include expenses that are excluded from the expense limitation agreement. Excluding these expenses, the operating expense ratios for the years presented would be: |
| | | 09/30/17 | 09/30/16 | 09/30/15 | 09/30/14 |
| | A-Class | 1.15% | 1.15% | 1.15% | 1.15% |
| | C-Class | 1.90% | 1.90% | 1.90% | 1.90% |
| | P-Class | 1.15% | 1.15% | 1.15% | — |
| | Institutional Class | 0.90% | 0.90% | 0.90% | 0.90% |
| SEE NOTES TO FINANCIAL STATEMENTS. | THE GUGGENHEIM FUNDS ANNUAL REPORT | 33 |
MANAGERS’ COMMENTARY (Unaudited) | September 30, 2017 |
To Our Shareholders:
Guggenheim Market Neutral Real Estate Fund (the “Fund”) is managed by a team of seasoned professionals, including Jayson Flowers, Senior Managing Director and Portfolio Manager, Thomas Youn, CFA, Managing Director and Portfolio Manager; and Gary McDaniel, CFA, Senior Managing Director and Portfolio Manager. In the following paragraphs, the investment team discusses performance for the abbreviated fiscal year ended September 30, 2017.
For the fiscal ended September 30, 2017, Guggenheim Market Neutral Real Estate Fund returned 8.38%1, compared with the 0.66% return of its benchmark, the Bank of American Merrill Lynch 3-Month U.S. Treasury Bill Index.
Investment Approach
The Fund seeks to generate high risk-adjusted absolute returns with minimal market exposure and minimal correlation with other major asset classes. The Fund primarily utilizes a pair-trading strategy to exploit relative value opportunities among publicly traded real estate equities. The portfolio will typically maintain long exposure of 90-100% of net assets and short exposure of 90-100% of net assets under normal conditions, with minimal net market exposure.
The strategy utilizes a relative value framework that is specialized for the real estate sector. Top-down views on the private commercial real estate (“CRE”) and public REIT markets are formulated to drive sector allocation decisions. Individual securities evaluated and selected on a bottom-up basis using fundamental analysis and due diligence.
Market Review
During the fiscal year, REITs traded sideways in a relatively tight range despite the improvement in investor sentiment and the broad rally in risk assets. The FNRE Index delivered a total return of 0.73% compared to 18.6% for the S&P 500 Index. In contrast to the broader market, which enjoyed accelerating earnings growth, CRE fundamentals and REIT earnings growth continued to moderate over the course of the year and weighed on the industry’s returns.
The best-performing sectors during the fiscal year were hotels (22.43%), industrial (18.14%) and manufactured housing (14.66%). Hotels benefitted from optimism over fiscal stimulus and the potential for demand acceleration. The industrial and manufactured housing sectors simply benefitted by continued strength in fundamentals with little sign of moderation. The worst-performing sectors were shopping centers (-22.43%), shopping malls (-21.95%) and net lease (-12.53%). All three sectors were materially impacted by the disruption of e-commerce on traditional brick-and-mortar retail in the form of elevated store closures and tenant bankruptcies.
CRE fundamentals remain healthy at fiscal year-end although there are rising pockets of concern. As the market approaches the latter innings of the CRE cycle, new supply is becoming a headwind for an increasing number of property types and geographies. Property occupancy rates are at cyclical high levels, making further gains increasingly difficult to achieve. Valuations have surpassed prior peak levels with multiples at cyclical highs. Rental rate growth continues to moderate across most property types. Capital markets conditions at period end remained robust, with ample equity and debt capital earmarked for CRE, both domestically and from overseas although both debt and equity providers have become slightly more cautious in recent quarters.
Performance Review
The Fund significantly outperformed its benchmark for the fiscal year ended September 30, 2017. Since inception (February 26, 2016), the Fund has outperformed the benchmark index, with a return of 3.72% compared with 0.55% for the benchmark. The Fund generated broad-based positive attribution across most subsectors. Strong stock selection along with favorable sector allocation biases supported returns. The leading contributor were long positions in two prison REITs that gained 87% and contributed 1.68% to the Fund’s returns. Strong stock selection within residential, net lease, office, and mortgage sectors made significant contributions to performance, while positive net sector tilts in industrial, cell tower, gaming, and timber sectors also made positive contributions. Poor stock selection within the regional mall, healthcare, and storage sectors were the primary negative performance contributors.
| 34 | THE GUGGENHEIM FUNDS ANNUAL REPORT | |
MANAGERS’ COMMENTARY (Unaudited)(concluded) | September 30, 2017 |
Strategy
The Fund maintained 87.66% long exposure and 87.50% short exposure resulting in minimal exposure to equity REITs or the broad market during the year. Current exposure levels are higher with both long and short exposure levels in the low-90% range. Portfolio construction remains defensively positioned against moderating CRE fundamentals. Key sector overweights at period end include data center, manufactured housing, industrial, wireless tower, and timber REITs. We believe these sectors present attractive growth prospects relative to current valuations and will prove defensive in the event of a downshift in economic growth. Key sector underweights are real estate brokerage, specialty, net-lease and lodging REITs.
Outlook
The Fund remains defensively positioned against a continued trend of moderating fundamental. Simply put, we are entering the latter innings of this real estate cycle with fundamentals at or near cyclical highs across most metrics. As was the case in 2017, property values will likely continue to grind modestly higher due to underlying property cash flow growth while multiple expansion will prove difficult given the threat of rising interest rates and slowing cash flow growth. Despite the moderation in CRE fundamentals, REITs will likely continue to deliver solid earnings and dividend growth over the coming year, an attractive dividend yield relative to other asset classes, and potential inflation protection through underlying rent growth.
Performance displayed represents past performance which is no guarantee of future results.
1 | Performance figures are based on Class A shares and do not reflect taxes that a shareholder would pay on distributions or the redemption of shares. |
The opinions and forecast expressed may not actually come to pass. This information is subject to change at any time, based on market and other conditions, and should not be construed as a recommendation of any specific security or strategy.
| | THE GUGGENHEIM FUNDS ANNUAL REPORT | 35 |
PERFORMANCE REPORT AND FUND PROFILE (Unaudited) | September 30, 2017 |
MARKET NEUTRAL REAL ESTATE FUND
OBJECTIVE: Seeks to provide capital appreciation, while limiting exposure to general stock market risk.
Holdings Diversification (Market Exposure as % of Net Assets)
“Holdings Diversification (Market Exposure as % of Net Assets)” excludes any temporary cash investments.
| Inception Dates: |
| A-Class | February 26, 2016 |
| C-Class | February 26, 2016 |
| P-Class | February 26, 2016 |
| Institutional Class | February 26, 2016 |
| Ten Largest Holdings (% of Total Net Assets) |
| Equity Residential | 3.6% |
| Rexford Industrial Realty, Inc. | 3.5% |
| RLJ Lodging Trust | 3.3% |
| Starwood Waypoint Homes | 3.2% |
| EastGroup Properties, Inc. | 3.2% |
| Alexandria Real Estate Equities, Inc. | 3.2% |
| Prologis, Inc. | 3.2% |
| Crown Castle International Corp. | 3.1% |
| Gramercy Property Trust | 3.1% |
| Equinix, Inc. | 3.0% |
| Top Ten Total | 32.4% |
| “Ten Largest Holdings” excludes any temporary cash or derivative investments. |
| 36 | THE GUGGENHEIM FUNDS ANNUAL REPORT | |
PERFORMANCE REPORT AND FUND PROFILE (Unaudited)(concluded) | September 30, 2017 |
Cumulative Fund Performance*
Average Annual Returns*
Periods Ended September 30, 2017
| | 1 Year | Since Inception
(02/26/16) |
| A-Class Shares | 8.38% | 3.72% |
A-Class Shares with sales charge‡ | 3.23% | 0.60% |
| C-Class Shares | 7.56% | 2.96% |
C-Class Shares with CDSC§ | 6.56% | 2.96% |
| P-Class Shares | 8.34% | 3.70% |
| Institutional Class Shares | 8.62% | 3.97% |
| BofA Merrill Lynch 3-Month U.S. Treasury Bill Index | 0.66% | 0.55% |
| * | The performance data above represents past performance that is not predictive of future results. The investment return and principal value of an investment in the Fund will fluctuate so that an investor’s shares, when redeemed, may be worth more or less than their original cost. Returns are historical and include changes in principal and reinvested dividends and capital gains and do not reflect the effect of taxes. The BofA Merrill Lynch 3-Month U.S. Treasury Bill Index is an unmanaged index and, unlike the Fund, has no management fees or operating expenses to reduce its reported return. The graph is based on A-Class shares only; performance for C-Class, P-Class and Institutional Class will vary due to differences in fee structures. |
‡ | Fund returns are calculated using the maximum sales charge of 4.75%. |
§ | Fund returns include a CDSC of 1% if redeemed within 12 months of purchase. |
| | THE GUGGENHEIM FUNDS ANNUAL REPORT | 37 |
| SCHEDULE OF INVESTMENTS | September 30, 2017 |
| MARKET NEUTRAL REAL ESTATE FUND | |
| | | Shares | | | Value | |
| | | | | | | |
COMMON STOCKS† - 91.4% | |
| | | | | | | |
REITs - 85.0% | |
REITs-Diversified - 18.2% | |
| Crown Castle International Corp. | | | 1,715 | | | $ | 171,466 | |
Equinix, Inc.1 | | | 381 | | | | 170,040 | |
| American Tower Corp. — Class A | | | 1,234 | | | | 168,663 | |
| Gaming and Leisure Properties, Inc. | | | 4,538 | | | | 167,407 | |
| Weyerhaeuser Co. | | | 3,506 | | | | 119,309 | |
| Rayonier, Inc. | | | 3,941 | | | | 113,855 | |
| Cousins Properties, Inc. | | | 12,125 | | | | 113,248 | |
| Total REITs-Diversified | | | | | | | 1,023,988 | |
| | | | | | | | | |
REITs-Warehouse/Industries - 16.0% | |
| Rexford Industrial Realty, Inc. | | | 6,804 | | | | 194,731 | |
| EastGroup Properties, Inc. | | | 2,044 | | | | 180,117 | |
| Prologis, Inc. | | | 2,795 | | | | 177,371 | |
| Gramercy Property Trust | | | 5,629 | | | | 170,277 | |
| CyrusOne, Inc. | | | 2,821 | | | | 166,242 | |
| Total REITs-Warehouse/Industries | | | | | | | 888,738 | |
| | | | | | | | | |
REITs-Health Care - 8.5% | |
| Sabra Health Care REIT, Inc. | | | 7,610 | | | | 166,963 | |
| Healthcare Trust of America, Inc. — Class A | | | 5,378 | | | | 160,264 | |
| Physicians Realty Trust | | | 8,213 | | | | 145,616 | |
| Total REITs-Health Care | | | | | | | 472,843 | |
| | | | | | | | | |
REITs-Apartments - 6.9% | |
Equity Residential1 | | | 3,004 | | | | 198,055 | |
| Starwood Waypoint Homes | | | 4,978 | | | | 181,050 | |
| Total REITs-Apartments | | | | | | | 379,105 | |
| | | | | | | | | |
REITs-Hotels - 6.3% | |
| RLJ Lodging Trust | | | 8,410 | | | | 185,020 | |
| MGM Growth Properties LLC — Class A | | | 5,519 | | | | 166,729 | |
| Total REITs-Hotels | | | | | | | 351,749 | |
| | | | | | | | | |
REITs-Office Property - 6.1% | |
| Alexandria Real Estate Equities, Inc. | | | 1,492 | | | | 177,503 | |
| Tier REIT, Inc. | | | 8,353 | | | | 161,213 | |
| Total REITs-Office Property | | | | | | | 338,716 | |
| | | | | | | | | |
REITs-Storage - 5.5% | |
| Jernigan Capital, Inc. | | | 7,644 | | | | 157,084 | |
| National Storage Affiliates Trust | | | 5,664 | | | | 137,295 | |
| Total REITs-Storage | | | | | | | 294,379 | |
| | | | | | | | | |
REITs-Manufactured Homes - 5.2% | |
| Sun Communities, Inc. | | | 1,858 | | | | 159,193 | |
| Equity LifeStyle Properties, Inc. | | | 1,532 | | | | 130,343 | |
| Total REITs-Manufactured Homes | | | | | | | 289,536 | |
| | | | | | | | | |
REITs-Shopping Centers - 5.0% | |
Federal Realty Investment Trust1 | | | 1,140 | | | | 141,599 | |
| Regency Centers Corp. | | | 2,271 | | | | 140,893 | |
| Total REITs-Shopping Centers | | | | | | | 282,492 | |
| | | | | | | | | |
REITs-Mortgage - 3.0% | |
| Blackstone Mortgage Trust, Inc. — Class A | | | 5,452 | | | | 169,121 | |
| | | | | | | | | |
REITs-Single Tenant - 2.7% | |
| Spirit Realty Capital, Inc. | | | 17,656 | | | | 151,312 | |
| | | | | | | | | |
REITs-Regional Malls - 1.8% | |
| GGP, Inc. | | | 4,815 | | | | 100,008 | |
| Total REITs | | | | | | | 4,741,987 | |
| | | | | | | | | |
| Lodging - 6.4% | |
| Casino Hotels - 4.4% | |
| Caesars Entertainment Corp.* | | | 9,864 | | | | 131,684 | |
| Boyd Gaming Corp. | | | 4,341 | | | | 113,083 | |
| Total Casino Hotels | | | | | | | 244,767 | |
| | | | | | | | | |
| Hotels & Motels - 2.0% | |
| Extended Stay America, Inc. | | | 5,571 | | | | 111,420 | |
| Total Lodging | | | | | | | 356,187 | |
| | | | | | | | | |
| Total Common Stocks | | | | | | | | |
| (Cost $4,684,124) | | | | | | | 5,098,174 | |
| | | | | | | | | |
MONEY MARKET FUND† - 7.8% | |
Goldman Sachs Financial Square Treasury Instruments Fund 0.86%2 | | | 435,429 | | | | 435,429 | |
| Total Money Market Fund | | | | | | | | |
| (Cost $435,429) | | | | | | | 435,429 | |
| | | | | | | | | |
| Total Investments - 99.2% | | | | | | | | |
| (Cost $5,119,553) | | | | | | $ | 5,533,603 | |
| Other Assets & Liabilities, net - 0.8% | | | | | | | 37,080 | |
| Total Net Assets - 100.0% | | | | | | $ | 5,570,683 | |
| Total Return Swap Agreements | |
| Counterparty | Index | | Financing
Rate Pay
(Receive) | | Payment
Frequency | Maturity
Date | | Notional
Value | | | Unrealized
Loss | |
OTC Equity Swap Agreements Sold Short†† | | | | | | | | | |
| Morgan Stanley | Market Neutral Real Estate Portfolio Short Custom Basket Swap3 | | | (0.81 | %) | At Maturity | 07/22/19 | | $ | 5,144,036 | | | $ | (41,815 | ) |
38 | THE GUGGENHEIM FUNDS ANNUAL REPORT | SEE NOTES TO FINANCIAL STATEMENTS. |
SCHEDULE OF INVESTMENTS (concluded) | September 30, 2017 |
| MARKET NEUTRAL REAL ESTATE FUND | |
| | | Shares | | | Unrealized Gain | |
| | | | | | | |
CUSTOM BASKET OF SHORT SECURITIES3 | | | | | | |
| Colony NorthStar, Inc. — Class A | | | (11,441 | ) | | $ | 21,521 | |
| GEO Group, Inc. | | | (2,774 | ) | | | 8,610 | |
| Omega Healthcare Investors, Inc. | | | (4,979 | ) | | | 7,480 | |
| CoreCivic, Inc. | | | (2,977 | ) | | | 6,323 | |
| Macerich Co. | | | (1,494 | ) | | | 5,455 | |
| iShares U.S. Real Estate ETF | | | (13,649 | ) | | | 5,220 | |
| CBL & Associates Properties, Inc. | | | (9,056 | ) | | | 4,829 | |
| Piedmont Office Realty Trust, Inc. — Class A | | | (7,838 | ) | | | 4,701 | |
| Apartment Investment & Management Co. — Class A | | | (4,901 | ) | | | 4,685 | |
| Jones Lang LaSalle, Inc. | | | (855 | ) | | | 4,366 | |
| LaSalle Hotel Properties | | | (5,814 | ) | | | 3,341 | |
| VEREIT, Inc. | | | (16,602 | ) | | | 2,322 | |
| Essex Property Trust, Inc. | | | (659 | ) | | | 2,261 | |
| Liberty Property Trust | | | (3,960 | ) | | | 1,968 | |
| | | | | | Unrealized Gain (Loss) | |
| | | | | | | |
| CareTrust REIT, Inc. | | | (8,801 | ) | | | 1,848 | |
| CBRE Group, Inc. — Class A* | | | (2,869 | ) | | | 1,038 | |
| Lexington Realty Trust | | | (15,973 | ) | | | (189 | ) |
| Brixmor Property Group, Inc. | | | (6,885 | ) | | | (275 | ) |
| SL Green Realty Corp. | | | (1,591 | ) | | | (310 | ) |
| Weingarten Realty Investors | | | (4,278 | ) | | | (1,616 | ) |
| Senior Housing Properties Trust | | | (8,289 | ) | | | (1,786 | ) |
| PS Business Parks, Inc. | | | (867 | ) | | | (3,534 | ) |
| National Retail Properties, Inc. | | | (3,416 | ) | | | (4,690 | ) |
| Public Storage | | | (811 | ) | | | (4,872 | ) |
| Chatham Lodging Trust | | | (8,472 | ) | | | (9,552 | ) |
| Wynn Resorts Ltd. | | | (784 | ) | | | (13,265 | ) |
| Chesapeake Lodging Trust | | | (6,240 | ) | | | (13,395 | ) |
| Life Storage, Inc. | | | (2,342 | ) | | | (16,584 | ) |
| iShares U.S. Home Construction ETF | | | (5,023 | ) | | | (16,661 | ) |
| Total Custom Basket of Short Securities | | | | | | | (762 | ) |
| * | Non-income producing security. |
† | Value determined based on Level 1 inputs — See Note 4. |
†† | Value determined based on Level 2 inputs — See Note 4. |
1 | All or a portion of this security is pledged as equity swap collateral at September 30, 2017. |
2 | Rate indicated is the 7 day yield as of September 30, 2017. |
3 | Total return is based on the return of the custom basket of short securities +/- financing at a variable rate. Rate indicated is the rate effective at September 30, 2017. |
| | REIT — Real Estate Investment Trust |
| | |
| | See Sector Classification in Other Information section. |
The following table summarizes the inputs used to value the Fund’s investments at September 30, 2017 (See Note 4 in the Notes to Financial Statements):
| Investments in Securities (Assets) | | Level 1
Quoted
Prices | | | Level 2
Significant Observable
Inputs | | | Level 2 -
Other* | | | Level 3
Significant
Unobservable
Inputs | | | Total | |
| Common Stocks | | $ | 5,098,174 | | | $ | — | | | $ | — | | | $ | — | | | $ | 5,098,174 | |
| Money Market Fund | | | 435,429 | | | | — | | | | — | | | | — | | | | 435,429 | |
| Total Assets | | $ | 5,533,603 | | | $ | — | | | $ | — | | | $ | — | | | $ | 5,533,603 | |
| | | | | | | | | | | | | | | | | | | | | |
| Investments in Securities (Liabilities) | | Level 1
Quoted
Prices | | | Level 2
Significant
Observable
Inputs | | | Level 2 -
Other* | | | Level 3
Significant
Unobservable
Inputs | | | Total | |
| Equity Swap Agreements | | $ | — | | | $ | — | | | $ | 41,815 | | | $ | — | | | $ | 41,815 | |
| * | Other financial instruments include swaps, which are reported as unrealized gain/loss at period end. |
Transfers between investment levels may occur as the markets fluctuate and/or the availability of data used in an investment’s valuation changes. Transfers between valuation levels, if any, are in comparison to the valuation levels at the end of the previous fiscal year, and are effective using the fair value as of the end of the current fiscal period.
For the year ended September 30, 2017, there were no transfers between levels.
| SEE NOTES TO FINANCIAL STATEMENTS. | THE GUGGENHEIM FUNDS ANNUAL REPORT | 39 |
| MARKET NEUTRAL REAL ESTATE FUND | |
| STATEMENT OF ASSETS AND LIABILITIES |
| September 30, 2017 |
| Assets: | |
| Investments, at value (cost $5,119,553) | | $ | 5,533,603 | |
| Cash | | | 1,962 | |
| Prepaid expenses | | | 33,034 | |
| Receivables: | |
| Dividends | | | 28,208 | |
| Investment Advisor | | | 17,805 | |
| Swap settlement | | | 8,175 | |
| Interest | | | 426 | |
| Total assets | | | 5,623,213 | |
| | | | | |
| Liabilities: | |
| Unrealized depreciation on swap agreements | | | 41,815 | |
| Payable for: | |
| Transfer agent/maintenance fees | | | 4,502 | |
| Professional fees | | | 3,834 | |
| Direct shareholders expense | | | 1,452 | |
| Distribution and service fees | | | 201 | |
| Miscellaneous | | | 726 | |
| Total liabilities | | | 52,530 | |
| Net assets | | $ | 5,570,683 | |
| | | | | |
| Net assets consist of: | |
| Paid in capital | | $ | 4,904,716 | |
| Undistributed net investment income | | | — | |
| Accumulated net realized gain on investments | | | 293,732 | |
| Net unrealized appreciation on investments | | | 372,235 | |
| Net assets | | $ | 5,570,683 | |
| | | | | |
| A-Class: | |
| Net assets | | $ | 108,830 | |
| Capital shares outstanding | | | 4,112 | |
| Net asset value per share | | $ | 26.47 | |
| Maximum offering price per share (Net asset value divided by 95.25%) | | $ | 27.79 | |
| | | | | |
| C-Class: | |
| Net assets | | $ | 142,802 | |
| Capital shares outstanding | | | 5,459 | |
| Net asset value per share | | $ | 26.16 | |
| | | | | |
| P-Class: | |
| Net assets | | $ | 324,293 | |
| Capital shares outstanding | | | 12,249 | |
| Net asset value per share | | $ | 26.48 | |
| | | | | |
| Institutional Class: | |
| Net assets | | $ | 4,994,758 | |
| Capital shares outstanding | | | 188,000 | |
| Net asset value per share | | $ | 26.57 | |
| STATEMENT OF OPERATIONS |
| Year Ended September 30, 2017 |
| Investment Income: | |
| Dividends | | $ | 99,652 | |
| Interest | | | 3,831 | |
| Total investment income | | | 103,483 | |
| | | | | |
| Expenses: | |
| Management fees | | | 57,930 | |
| Distribution and service fees: | |
| A-Class | | | 264 | |
| C-Class | | | 1,337 | |
| P-Class | | | 415 | |
| Recoupment of previously waived fees: | |
| A-Class | | | 235 | |
| C-Class | | | 297 | |
| P-Class | | | 263 | |
| Institutional Class | | | 9,027 | |
| Transfer agent/maintenance fees: | |
| A-Class | | | 371 | |
| C-Class | | | 458 | |
| P-Class | | | 657 | |
| Institutional Class | | | 13,724 | |
| Registration fees | | | 79,291 | |
| Professional fees | | | 29,782 | |
| Fund accounting/administration fees | | | 24,999 | |
| Trustees’ fees* | | | 5,260 | |
| Custodian fees | | | 1,757 | |
| Line of credit fees | | | 1,269 | |
| Miscellaneous | | | 14,030 | |
| Total expenses | | | 241,366 | |
| Less: | |
| Expenses reimbursed by Adviser: | | | | |
| A-Class | | | (2,374 | ) |
| C-Class | | | (3,075 | ) |
| P-Class | | | (4,122 | ) |
| Institutional Class | | | (103,627 | ) |
| Expenses waived by Adviser | | | (52,175 | ) |
| Total waived/reimbursed expenses | | | (165,373 | ) |
| Net expenses | | | 75,993 | |
| Net investment income | | | 27,490 | |
| | | | | |
| Net Realized and Unrealized Gain (Loss): | |
| Net realized gain (loss) on: | |
| Investments | | | 306,237 | |
| Swap agreements | | | (282,050 | ) |
| Net realized gain | | | 24,187 | |
| Net change in unrealized appreciation (depreciation) on: | |
| Investments | | | 142,862 | |
| Swap agreements | | | 223,020 | |
| Net change in unrealized appreciation (depreciation) | | | 365,882 | |
| Net realized and unrealized gain | | | 390,069 | |
| Net increase in net assets resulting from operations | | $ | 417,559 | |
| * | Relates to Trustees not deemed “interested persons” within the meaning of Section 2(a)(19) of the 1940 Act. |
40 | THE GUGGENHEIM FUNDS ANNUAL REPORT | SEE NOTES TO FINANCIAL STATEMENTS. |
| MARKET NEUTRAL REAL ESTATE FUND | |
| STATEMENTS OF CHANGES IN NET ASSETS |
| | | Year Ended
September 30,
2017 | | | Period Ended September 30,
2016a | |
| Increase (Decrease) in Net Assets from Operations: | | | | | | |
| Net investment income | | $ | 27,490 | | | $ | 54,619 | |
| Net realized gain (loss) on investments | | | 24,187 | | | | (163,479 | ) |
| Net change in unrealized appreciation (depreciation) on investments | | | 365,882 | | | | 6,353 | |
| Net increase (decrease) in net assets resulting from operations | | | 417,559 | | | | (102,507 | ) |
| | | | | | | | | |
| Capital share transactions: | | | | | | | | |
| Proceeds from sale of shares | | | | | | | | |
| A-Class | | | 784 | | | | 102,011 | |
| C-Class | | | 36,949 | | | | 100,000 | |
| P-Class | | | 193,721 | | | | 125,772 | |
| Institutional Class | | | — | | | | 4,700,000 | |
| Cost of shares redeemed | | | | | | | | |
| A-Class | | | — | | | | — | |
| C-Class | | | — | | | | — | |
| P-Class | | | (3,606 | ) | | | — | |
| Institutional Class | | | — | | | | — | |
| Net increase from capital share transactions | | | 227,848 | | | | 5,027,783 | |
| Net increase in net assets | | | 652,764 | | | | 4,925,276 | |
| | | | | | | | | |
| Net assets: | | | | | | | | |
| Beginning of period | | | 4,925,276 | | | | — | |
| End of period | | $ | 5,570,683 | | | $ | 4,925,276 | |
| Undistributed net investment income at end of period | | $ | — | | | $ | 264,835 | |
| | | | | | | | | |
| Capital share activity: | | | | | | | | |
| Shares sold | | | | | | | | |
| A-Class | | | 30 | | | | 4,082 | |
| C-Class | | | 1,459 | | | | 4,000 | |
| P-Class | | | 7,329 | | | | 5,059 | |
| Institutional Class | | | — | | | | 188,000 | |
| Shares redeemed | | | | | | | | |
| P-Class | | | (139 | ) | | | — | |
| Net increase in shares | | | 8,679 | | | | 201,141 | |
a | Since commencement of operations: February 26, 2016. |
| SEE NOTES TO FINANCIAL STATEMENTS. | THE GUGGENHEIM FUNDS ANNUAL REPORT | 41 |
| MARKET NEUTRAL REAL ESTATE FUND | |
This table is presented to show selected data for a share outstanding throughout each period and to assist shareholders in evaluating a Fund’s performance for the periods presented.
| A-Class | | Year Ended
September 30,
2017 | | | Period Ended
September 30,
2016a | |
| Per Share Data | | | | | | |
| Net asset value, beginning of period | | $ | 24.45 | | | $ | 25.00 | |
| Income (loss) from investment operations: | |
Net investment income (loss)b | | | .08 | | | | .24 | |
| Net gain (loss) on investments (realized and unrealized) | | | 1.94 | | | | (.79 | ) |
| Total from investment operations | | | 2.02 | | | | (.55 | ) |
| Net asset value, end of period | | $ | 26.47 | | | $ | 24.45 | |
| | |
Total Returne | | | 8.38 | % | | | (2.20 | %) |
| Ratios/Supplemental Data | |
| Net assets, end of period (in thousands) | | $ | 109 | | | $ | 100 | |
| Ratios to average net assets: | |
| Net investment income (loss) | | | 0.31 | % | | | 1.66 | % |
| Total expenses | | | 4.88 | % | | | 3.74 | % |
Net expensesc,d,f | | | 1.65 | % | | | 1.64 | % |
| Portfolio turnover rate | | | 145 | % | | | 135 | % |
| C-Class | | Year Ended
September 30,
2017 | | | Period Ended
September 30,
2016a | |
| Per Share Data | | | | | | |
| Net asset value, beginning of period | | $ | 24.35 | | | $ | 25.00 | |
| Income (loss) from investment operations: | |
Net investment income (loss)b | | | (.11 | ) | | | .12 | |
| Net gain (loss) on investments (realized and unrealized) | | | 1.92 | | | | (.77 | ) |
| Total from investment operations | | | 1.81 | | | | (.65 | ) |
| Net asset value, end of period | | $ | 26.16 | | | $ | 24.35 | |
| | |
Total Returne | | | 7.56 | % | | | (2.60 | %) |
| Ratios/Supplemental Data | |
| Net assets, end of period (in thousands) | | $ | 143 | | | $ | 97 | |
| Ratios to average net assets: | |
| Net investment income (loss) | | | (0.52 | %) | | | 0.93 | % |
| Total expenses | | | 5.70 | % | | | 4.47 | % |
Net expensesc,d,f | | | 2.40 | % | | | 2.38 | % |
| Portfolio turnover rate | | | 145 | % | | | 135 | % |
42 | THE GUGGENHEIM FUNDS ANNUAL REPORT | SEE NOTES TO FINANCIAL STATEMENTS. |
| MARKET NEUTRAL REAL ESTATE FUND | |
FINANCIAL HIGHLIGHTS (continued) |
This table is presented to show selected data for a share outstanding throughout each period and to assist shareholders in evaluating a Fund’s performance for the periods presented.
| P-Class | | Year Ended
September 30,
2017 | | | Period Ended
September 30,
2016a | |
| Per Share Data | | | | | | |
| Net asset value, beginning of period | | $ | 24.45 | | | $ | 25.00 | |
| Income (loss) from investment operations: | |
Net investment income (loss)b | | | .16 | | | | .26 | |
| Net gain (loss) on investments (realized and unrealized) | | | 1.87 | | | | (.81 | ) |
| Total from investment operations | | | 2.03 | | | | (.55 | ) |
| Net asset value, end of period | | $ | 26.48 | | | $ | 24.45 | |
| | |
Total Returne | | | 8.34 | % | | | (2.20 | %) |
| Ratios/Supplemental Data | |
| Net assets, end of period (in thousands) | | $ | 324 | | | $ | 124 | |
| Ratios to average net assets: | |
| Net investment income (loss) | | | 0.52 | % | | | 1.64 | % |
| Total expenses | | | 5.18 | % | | | 3.65 | % |
Net expensesc,d,f | | | 1.65 | % | | | 1.66 | % |
| Portfolio turnover rate | | | 145 | % | | | 135 | % |
| SEE NOTES TO FINANCIAL STATEMENTS. | THE GUGGENHEIM FUNDS ANNUAL REPORT | 43 |
| MARKET NEUTRAL REAL ESTATE FUND | |
FINANCIAL HIGHLIGHTS (concluded) |
This table is presented to show selected data for a share outstanding throughout each period and to assist shareholders in evaluating a Fund’s performance for the periods presented.
| Institutional Class | | Year Ended
September 30,
2017 | | | Period Ended
September 30,
2016a | |
| Per Share Data | | | | | | |
| Net asset value, beginning of period | | $ | 24.49 | | | $ | 25.00 | |
| Income (loss) from investment operations: | |
Net investment income (loss)b | | | .14 | | | | .28 | |
| Net gain (loss) on investments (realized and unrealized) | | | 1.94 | | | | (.79 | ) |
| Total from investment operations | | | 2.08 | | | | (.51 | ) |
| Net asset value, end of period | | $ | 26.57 | | | $ | 24.49 | |
| | |
Total Returne | | | 8.62 | % | | | (2.04 | %) |
| Ratios/Supplemental Data | |
| Net assets, end of period (in thousands) | | $ | 4,995 | | | $ | 4,604 | |
| Ratios to average net assets: | |
| Net investment income (loss) | | | 0.55 | % | | | 1.92 | % |
| Total expenses | | | 4.52 | % | | | 3.41 | % |
Net expensesc,d,f | | | 1.40 | % | | | 1.39 | % |
| Portfolio turnover rate | | | 145 | % | | | 135 | % |
a | Since commencement of operations: February 26, 2016. Percentage amounts for the period, except total return and portfolio turnover rate, have been annualized. |
b | Net investment income (loss) per share was computed using average shares outstanding throughout the period. |
c | Net expense information reflects the expense ratios after expense waivers and reimbursements, as applicable. |
d | The portion of the ratios of net expenses to average net assets attributable to recoupments of prior fee reductions or expense reimbursement is 0.22% for A-Class, 0.22% for C-Class, 0.16% for P-Class, and 0.18% for Institutional Class. |
e | Total return does not reflect the impact of any applicable sales charges and has not been annualized. |
f | Net expenses may include expenses that are excluded from the expense limitation agreement and recouped amounts excluding these expenses, the operating expense ratios for the periods presented would be: |
| | | 09/30/17 | 09/30/16 | |
| | A-Class | 1.63% | 1.63% | |
| | C-Class | 2.37% | 2.37% | |
| | P-Class | 1.63% | 1.65% | |
| | Institutional Class | 1.38% | 1.38% | |
44 | THE GUGGENHEIM FUNDS ANNUAL REPORT | SEE NOTES TO FINANCIAL STATEMENTS. |
MANAGERS’ COMMENTARY (Unaudited) | September 30, 2017 |
To Our Shareholders:
Guggenheim Risk Managed Real Estate Fund (the “Fund”) is managed by a team of seasoned professionals, including Jayson Flowers, Senior Managing Director and Portfolio Manager; Thomas Youn, CFA, Managing Director and Portfolio Manager; and Gary McDaniel, CFA, Senior Managing Director and Portfolio Manager. In the following paragraphs, the investment team discusses performance for the fiscal year ended September 30, 2017.
For the fiscal year ended September 30, 2017, Guggenheim Risk Managed Real Estate Fund returned 7.54%1, compared with the 0.63% return of its benchmark, the FTSE NAREIT Equity REITs Index.
Investment Approach
Our investment framework follows a differentiated approach to REIT investing that seeks to both outperform the REIT index and to actively mitigate volatility and drawdown risk. To accomplish this, the strategy combines a traditional long-only REIT strategy, a market-neutral long/short REIT strategy and a framework for actively modulating the Fund’s overall market exposure. The Fund will typically maintain an average market exposure, or beta to the REIT index, of approximately 0.90 by targeting an average long-only sleeve allocation of 90% and long/short sleeve allocation of 40%. The targeted sleeve weights are adjusted on a monthly basis to effectively modulate the Fund’s overall market exposure as warranted by market conditions.
The underlying long-only and long/short sleeves are managed independently within the Fund using a fundamental, relative value framework that is specialized for the real estate sector. Top-down views on the private commercial real estate (“CRE”) and public REIT markets are formulated to drive sector allocation decisions. Individual securities evaluated and selected on a bottom-up basis using fundamental analysis and due diligence.
Market Review
During the fiscal year, REITs traded sideways in a relatively tight range despite the improvement in investor sentiment and the broad rally in risk assets. The FNRE Index delivered a total return of 0.73% compared to 18.6% for the S&P 500 Index. In contrast to the broader market, which enjoyed accelerating earnings growth, CRE fundamentals and REIT earnings growth continued to moderate over the course of the year and weighed on the industry’s returns.
The best-performing sectors during the fiscal year were hotels (22.43%), industrial (18.14%) and manufactured housing (14.66%). Hotels benefitted from optimism over fiscal stimulus and the potential for demand acceleration. The industrial and manufactured housing sectors simply benefitted by continued strength in fundamentals with little sign of moderation. The worst-performing sectors were shopping centers (-22.43%), shopping malls (-21.95%) and net lease (-12.53%). All three sectors were materially impacted by the disruption of e-commerce on traditional brick-and-mortar retail in the form of elevated store closures and tenant bankruptcies.
CRE fundamentals remain healthy at fiscal year-end although there are rising pockets of concern. As the market approaches the latter innings of the CRE cycle, new supply is becoming a headwind for an increasing number of property types and geographies. Property occupancy rates are at cyclical high levels, making further gains increasingly difficult to achieve. Valuations have surpassed prior peak levels with multiples at cyclical highs. Rental rate growth continues to moderate across most property types. Capital markets conditions at period end remained robust, with ample equity and debt capital earmarked for CRE, both domestically and from overseas although both debt and equity providers have become slightly more cautious in recent quarters.
Performance Review
The Fund significantly outperformed its benchmark for the fiscal year ended September 30, 2017 by 6.91%, with a return of 7.54% compared to 0.63% for the benchmark. Inception-to-date, the Fund has outperformed the benchmark index by 2.21% annually, net of fees, with an annualized gain of 11.93% compared to 9.72% for the index. Consistent with the Fund’s objective, the Fund has also managed risk with a 24.5% reduction in annualized daily volatility during the fiscal year.
| | THE GUGGENHEIM FUNDS ANNUAL REPORT | 45 |
MANAGERS’ COMMENTARY (Unaudited)(concluded) | September 30, 2017 |
The Fund’s outperformance was primarily driven by strong performance of both underlying sleeves. The Fund’s maintained an average long-only sleeve weight of 86% and a long/short sleeve weight of 45% during the fiscal year. The less-than-full market exposure level had a negligible contribution to performance given that the benchmark index was relatively flat, gaining +0.73% during the year. The long-only sleeve outperformed the benchmark index significantly, resulting in a +4.28% contribution to the Fund’s outperformance. Finally, the long/short sleeve also generated strong returns, gaining +9.26% (absolute return) during the year and contributing +4.17% to the Fund’s outperformance.
Strategy
The Fund finished the year with a market exposure level in the high-80% range, which is slightly defensive for the strategy. Portfolio construction at the underlying sleeve level for the long-only and long/short strategies have remained defensively positioned against moderating CRE fundamentals since late 2015. Key sector overweights at period end include wireless tower, manufactured housing, gaming, industrial and data center REITs. We believe these sectors present attractive growth prospects relative to current valuations and will prove defensive in the event of a downshift in economic growth. Key sector underweights are specialty, healthcare, apartment, and retail REITs. The sector underweights largely reflect our concerns over the headwinds caused by elevated levels of new construction and the continuing headwinds faced by the retail industry from e-commerce.
Outlook
The overall Fund’s market exposure and the underlying positioning within the underlying sleeves remain defensively positioned against a continued trend of moderating fundamental. Simply put, we are entering the latter innings of this real estate cycle with fundamentals at or near cyclical highs across most metrics. As was the case in 2017, property values will likely continue to grind modestly higher due to underlying property cash flow growth while multiple expansion will prove difficult given the threat of rising interest rates and slowing cash flow growth. Despite the moderation in CRE fundamentals, REITs will likely continue to deliver solid earnings and dividend growth over the coming year, an attractive dividend yield relative to other asset classes, and potential inflation protection through underlying rent growth.
Performance displayed represents past performance which is no guarantee of future results.
1 | Performance figures are based on Class A shares and do not reflect taxes that a shareholder would pay on distributions or the redemption of shares. |
The opinions and forecast expressed may not actually come to pass. This information is subject to change at any time, based on market and other conditions, and should not be construed as a recommendation of any specific security or strategy.
| 46 | THE GUGGENHEIM FUNDS ANNUAL REPORT | |
PERFORMANCE REPORT AND FUND PROFILE (Unaudited) | September 30, 2017 |
RISK MANAGED REAL ESTATE FUND
OBJECTIVE: Seeks to provide total return, comprised of capital appreciation and current income.
Holdings Diversification (Market Exposure as % of Net Assets)
“Holdings Diversification (Market Exposure as % of Net Assets)” excludes any temporary cash investments.
| Inception Dates: |
| A-Class | March 28, 2014 |
| C-Class | March 28, 2014 |
| P-Class | May 1, 2015 |
| Institutional Class | March 28, 2014 |
| Ten Largest Holdings (% of Total Net Assets) |
| Prologis, Inc. | 5.2% |
| Simon Property Group, Inc. | 5.1% |
| Equinix, Inc. | 5.0% |
| Equity Residential | 3.1% |
| AvalonBay Communities, Inc. | 2.5% |
| Gaming and Leisure Properties, Inc. | 2.5% |
| Alexandria Real Estate Equities, Inc. | 2.4% |
| Sun Communities, Inc. | 2.4% |
| Digital Realty Trust, Inc. | 2.3% |
| Welltower, Inc. | 2.2% |
| Top Ten Total | 32.7% |
| “Ten Largest Holdings” excludes any temporary cash or derivative investments. |
| | THE GUGGENHEIM FUNDS ANNUAL REPORT | 47 |
PERFORMANCE REPORT AND FUND PROFILE (Unaudited)(concluded) | September 30, 2017 |
Cumulative Fund Performance*
Average Annual Returns*
Periods Ended September 30, 2017
| | 1 Year | Since Inception
(03/28/14) |
| A-Class Shares | 7.54% | 11.93% |
A-Class Shares with sales charge‡ | 2.43% | 10.39% |
| C-Class Shares | 6.71% | 11.08% |
C-Class Shares with CDSC§ | 5.71% | 11.08% |
| Institutional Class Shares | 7.87% | 12.26% |
| FTSE NAREIT Equity REITs Index | 0.63% | 9.72% |
| | 1 Year | Since Inception (05/01/15) |
| P-Class Shares | 7.53% | 7.48% |
| FTSE NAREIT Equity REITs Index | 0.63% | 6.46% |
| * | The performance data above represents past performance that is not predictive of future results. The investment return and principal value of an investment in the Fund will fluctuate so that an investor’s shares, when redeemed, may be worth more or less than their original cost. Returns are historical and include changes in principal and reinvested dividends and capital gains and do not reflect the effect of taxes. The FTSE NAREIT Equity REITs Index is an unmanaged index and, unlike the Fund, has no management fees or operating expenses to reduce its reported return. The graph is based on A-Class shares only; performance for C-Class, P-Class and Institutional Class will vary due to differences in fee structures. |
‡ | Fund returns are calculated using the maximum sales charge of 4.75%. |
§ | Fund returns include a CDSC of 1% if redeemed within 12 months of purchase. |
| 48 | THE GUGGENHEIM FUNDS ANNUAL REPORT | |
| SCHEDULE OF INVESTMENTS | September 30, 2017 |
| RISK MANAGED REAL ESTATE FUND | |
| | | Shares | | | Value | |
| | | | | | | |
COMMON STOCKS† - 96.1% | | | | | | |
| | | | | | | |
REITs - 92.6% | | | | | | |
REITs-Diversified - 18.1% | | | | | | |
| Equinix, Inc. | | | 14,304 | | | $ | 6,383,874 | |
| Gaming and Leisure Properties, Inc. | | | 86,221 | | | | 3,180,693 | |
| Digital Realty Trust, Inc. | | | 25,099 | | | | 2,969,965 | |
American Tower Corp. — Class A1 | | | 15,535 | | | | 2,123,324 | |
| Crown Castle International Corp. | | | 19,518 | | | | 1,951,410 | |
| Cousins Properties, Inc. | | | 197,829 | | | | 1,847,723 | |
| Vornado Realty Trust | | | 18,534 | | | | 1,424,894 | |
| Duke Realty Corp. | | | 47,802 | | | | 1,377,654 | |
| Weyerhaeuser Co. | | | 29,074 | | | | 989,388 | |
| Rayonier, Inc. | | | 32,353 | | | | 934,678 | |
| Total REITs-Diversified | | | | | | | 23,183,603 | |
| | | | | | | | | |
REITs-Warehouse/Industries - 12.8% | | | | | | | | |
| Prologis, Inc. | | | 106,144 | | | | 6,735,897 | |
| Gramercy Property Trust | | | 90,582 | | | | 2,740,106 | |
| CyrusOne, Inc. | | | 40,176 | | | | 2,367,572 | |
| Rexford Industrial Realty, Inc. | | | 82,525 | | | | 2,361,866 | |
| EastGroup Properties, Inc. | | | 25,653 | | | | 2,260,542 | |
| Total REITs-Warehouse/Industries | | | | | | | 16,465,983 | |
| | | | | | | | | |
REITs-Apartments - 12.4% | | | | | | | | |
| Equity Residential | | | 60,210 | | | | 3,969,645 | |
AvalonBay Communities, Inc.1 | | | 17,965 | | | | 3,205,315 | |
| Starwood Waypoint Homes | | | 63,318 | | | | 2,302,876 | |
Essex Property Trust, Inc1 | | | 8,546 | | | | 2,170,940 | |
| Mid-America Apartment Communities, Inc. | | | 16,379 | | | | 1,750,588 | |
| Invitation Homes, Inc. | | | 61,846 | | | | 1,400,812 | |
Camden Property Trust1 | | | 11,781 | | | | 1,077,372 | |
| Total REITs-Apartments | | | | | | | 15,877,548 | |
| | | | | | | | | |
REITs-Health Care - 10.1% | | | | | | | | |
| Welltower, Inc. | | | 39,992 | | | | 2,810,638 | |
| Healthcare Trust of America, Inc. — Class A | | | 92,751 | | | | 2,763,980 | |
| Ventas, Inc. | | | 37,715 | | | | 2,456,378 | |
| Physicians Realty Trust | | | 132,891 | | | | 2,356,157 | |
| Sabra Health Care REIT, Inc. | | | 78,412 | | | | 1,720,359 | |
| HCP, Inc. | | | 32,316 | | | | 899,354 | |
| Total REITs-Health Care | | | | | | | 13,006,866 | |
| | | | | | | | | |
REITs-Office Property - 9.5% | | | | | | | | |
Alexandria Real Estate Equities, Inc.1 | | | 26,069 | | | | 3,101,429 | |
Boston Properties, Inc.1 | | | 17,860 | | | | 2,194,637 | |
| Tier REIT, Inc. | | | 88,167 | | | | 1,701,623 | |
| Highwoods Properties, Inc. | | | 32,534 | | | | 1,694,696 | |
| Douglas Emmett, Inc. | | | 26,438 | | | | 1,042,186 | |
| SL Green Realty Corp. | | | 10,175 | | | | 1,030,931 | |
| Kilroy Realty Corp. | | | 12,381 | | | | 880,537 | |
| Hudson Pacific Properties, Inc. | | | 20,091 | | | | 673,651 | |
| Total REITs-Office Property | | | | | | | 12,319,690 | |
| | | | | | | | | |
REITs-Regional Malls - 6.7% | | | | | | | | |
| Simon Property Group, Inc. | | | 40,635 | | | | 6,542,640 | |
| GGP, Inc. | | | 93,263 | | | | 1,937,073 | |
| Total REITs-Regional Malls | | | | | | | 8,479,713 | |
| | | | | | | | | |
REITs-Storage - 6.2% | | | | | | | | |
| Public Storage | | | 13,737 | | | | 2,939,581 | |
| Iron Mountain, Inc. | | | 39,271 | | | | 1,527,642 | |
| Jernigan Capital, Inc. | | | 71,387 | | | | 1,467,003 | |
| National Storage Affiliates Trust | | | 55,781 | | | | 1,352,131 | |
| Extra Space Storage, Inc. | | | 8,528 | | | | 681,558 | |
| Total REITs-Storage | | | | | | | 7,967,915 | |
| | | | | | | | | |
REITs-Shopping Centers - 5.2% | | | | | | | | |
| Regency Centers Corp. | | | 44,883 | | | | 2,784,541 | |
Federal Realty Investment Trust1 | | | 22,046 | | | | 2,738,334 | |
| Retail Opportunity Investments Corp. | | | 59,557 | | | | 1,132,179 | |
| Total REITs-Shopping Centers | | | | | | | 6,655,054 | |
| | | | | | | | | |
REITs-Manufactured Homes - 4.3% | | | | | | | | |
| Sun Communities, Inc. | | | 35,640 | | | | 3,053,635 | |
Equity LifeStyle Properties, Inc.1 | | | 28,744 | | | | 2,445,540 | |
| Total REITs-Manufactured Homes | | | | | | | 5,499,175 | |
| | | | | | | | | |
REITs-Single Tenant - 3.2% | | | | | | | | |
| Realty Income Corp. | | | 40,480 | | | | 2,315,051 | |
| Spirit Realty Capital, Inc. | | | 211,695 | | | | 1,814,226 | |
| Total REITs-Single Tenant | | | | | | | 4,129,277 | |
| | | | | | | | | |
REITs-Hotels - 3.1% | | | | | | | | |
| MGM Growth Properties LLC — Class A | | | 71,539 | | | | 2,161,193 | |
| Host Hotels & Resorts, Inc. | | | 38,586 | | | | 713,455 | |
| Apple Hospitality REIT, Inc. | | | 27,625 | | | | 522,389 | |
| RLJ Lodging Trust | | | 23,217 | | | | 510,774 | |
| Total REITs-Hotels | | | | | | | 3,907,811 | |
| | | | | | | | | |
REITs-Mortgage - 1.0% | | | | | | | | |
| Blackstone Mortgage Trust, Inc. — Class A | | | 43,299 | | | | 1,343,135 | |
| Total REITS | | | | | | | 117,451,437 | |
| | | | | | | | | |
| Lodging - 3.5% | | | | | | | | |
| Casino Hotels - 2.2% | | | | | | | | |
| Caesars Entertainment Corp.* | | | 126,932 | | | | 1,694,542 | |
| Boyd Gaming Corp. | | | 44,611 | | | | 1,162,117 | |
| Total Casino Hotels | | | | | | | 2,856,659 | |
| | | | | | | | | |
| Hotels & Motels - 1.3% | | | | | | | | |
| Extended Stay America, Inc. | | | 88,113 | | | | 1,762,260 | |
| Total Lodging | | | | | | | 4,618,919 | |
| | | | | | | | | |
| Total Common Stocks | | | | | | | | |
| (Cost $116,006,979) | | | | | | | 123,454,689 | |
| SEE NOTES TO FINANCIAL STATEMENTS. | THE GUGGENHEIM FUNDS ANNUAL REPORT | 49 |
SCHEDULE OF INVESTMENTS (continued) | September 30, 2017 |
| RISK MANAGED REAL ESTATE FUND | |
| | | Shares | | | Value | |
| | | | | | | |
MONEY MARKET FUND† - 5.4% | | | | | | |
Dreyfus Treasury Securities Cash Management Fund - Institutional Class 0.90%2 | | | 6,884,509 | | | $ | 6,884,509 | |
| Total Money Market Fund | | | | | | | | |
| (Cost $6,884,509) | | | | | | | 6,884,509 | |
| Total Investments - 100.4% | | | | | | | | |
| (Cost $122,891,488) | | | | | | | 130,339,198 | |
| | | | | | | | | |
COMMON STOCKS SOLD SHORT† - (8.4)% | | | | | | | | |
| | | | | | | | | |
| Lodging - (0.2)% | | | | | | | | |
| Casino Hotels - (0.2)% | | | | | | | | |
| Wynn Resorts Ltd. | | | (2,151 | ) | | | (320,327 | ) |
| | | | | | | | | |
| Real Estate - (0.5)% | | | | | | | | |
| Real Estate Management/Services - (0.5)% | | | | | |
| Jones Lang LaSalle, Inc. | | | (2,332 | ) | | | (288,002 | ) |
| CBRE Group, Inc. — Class A* | | | (7,899 | ) | | | (299,214 | ) |
| Total Real Estate Management/Services | | | | | | | (587,216 | ) |
| Total Real Estate | | | | | | | (587,216 | ) |
| | | | | | | | | |
REITs - (7.7)% | | | | | | | | |
REITs-Single Tenant - (0.3)% | | | | | | | | |
| National Retail Properties, Inc. | | | (9,418 | ) | | | (392,354 | ) |
| | | | | | | | | |
REITs-Regional Malls - (0.4)% | | | | | | | | |
| CBL & Associates Properties, Inc. | | | (24,711 | ) | | | (207,325 | ) |
| Macerich Co. | | | (4,127 | ) | | | (226,861 | ) |
| Total REITs-Regional Malls | | | | | | | (434,186 | ) |
| | | | | | | | | |
REITs-Warehouse/Industries - (0.3)% | | | | | | | | |
| Liberty Property Trust | | | (10,932 | ) | | | (448,868 | ) |
| | | | | | | | | |
REITs-Storage - (0.8)% | | | | | | | | |
| Public Storage | | | (2,240 | ) | | | (479,338 | ) |
| Life Storage, Inc. | | | (6,479 | ) | | | (530,047 | ) |
| Total REITs-Storage | | | | | | | (1,009,385 | ) |
| | | | | | | | | |
REITs-Apartments - (0.5)% | | | | | | | | |
| Essex Property Trust, Inc. | | | (1,812 | ) | | | (460,302 | ) |
| Apartment Investment & Management Co. — Class A | | | (13,509 | ) | | | (592,505 | ) |
| Total REITs-Apartments | | | | | | | (1,052,807 | ) |
| | | | | | | | | |
REITs-Shopping Centers - (0.6)% | | | | | | | | |
| Brixmor Property Group, Inc. | | | (18,940 | ) | | | (356,072 | ) |
| Weingarten Realty Investors | | | (11,742 | ) | | | (372,691 | ) |
| Total REITs-Shopping Centers | | | | | | | (728,763 | ) |
| | | | | | | | | |
REITs-Office Property - (0.9)% | | | | | | | | |
| VEREIT, Inc. | | | (45,928 | ) | | | (380,743 | ) |
| Piedmont Office Realty Trust, Inc. — Class A | | | (21,617 | ) | | | (435,799 | ) |
| SL Green Realty Corp. | | | (4,389 | ) | | | (444,693 | ) |
| Total REITs-Office Property | | | | | | | (1,261,235 | ) |
| | | | | | | | | |
REITs-Health Care - (1.0)% | | | | | | | | |
| Omega Healthcare Investors, Inc. | | | (13,758 | ) | | | (439,018 | ) |
| Senior Housing Properties Trust | | | (22,886 | ) | | | (447,421 | ) |
| CareTrust REIT, Inc. | | | (24,434 | ) | | | (465,223 | ) |
| Total REITs-Health Care | | | | | | | (1,351,662 | ) |
| | | | | | | | | |
REITs-Hotels - (1.2)% | | | | | | | | |
| Chesapeake Lodging Trust | | | (16,998 | ) | | | (458,436 | ) |
| LaSalle Hotel Properties | | | (15,901 | ) | | | (461,447 | ) |
| Chatham Lodging Trust | | | (23,218 | ) | | | (495,008 | ) |
| Total REITs-Hotels | | | | | | | (1,414,891 | ) |
| | | | | | | | | |
REITs-Diversified - (1.3)% | | | | | | | | |
| GEO Group, Inc. | | | (7,591 | ) | | | (204,198 | ) |
| CoreCivic, Inc. | | | (8,163 | ) | | | (218,524 | ) |
| PS Business Parks, Inc. | | | (2,411 | ) | | | (321,869 | ) |
| Colony NorthStar, Inc. — Class A | | | (31,433 | ) | | | (394,798 | ) |
| Lexington Realty Trust | | | (43,837 | ) | | | (448,014 | ) |
| Total REITs-Diversified | | | | | | | (1,587,403 | ) |
| Total REITS | | | | | | | (8,297,221 | ) |
| Total Common Stocks | | | | | | | | |
| (Cost $10,675,766) | | | | | | | (10,589,097 | ) |
| | | | | | | | | |
EXCHANGE-TRADED FUNDS SOLD SHORT† - (2.7)% | | | | | |
| iShares U.S. Home Construction ETF | | | 13,737 | | | | (501,950 | ) |
| iShares U.S. Real Estate ETF | | | 37,706 | | | | (3,011,955 | ) |
| Total Exchange-Traded Funds Sold Short | | | | | | | | |
| (Proceeds $3,466,856) | | | | | | | (3,513,905 | ) |
| Total Securities Sold Short - (11.1)% | | | | | | | | |
| (Proceeds $14,142,622) | | | | | | $ | (14,103,002 | ) |
| Other Assets & Liabilities, net - 9.6% | | | | | | | 12,285,078 | |
| Total Net Assets - 100.0% | | | | | | $ | 128,521,274 | |
| Counterparty | Index | | Financing
Rate Pay
(Receive) | | Payment
Frequency | Maturity
Date | | Notional
Value | | | Unrealized
Gain (Loss) | |
OTC Equity Swap Agreements Sold Short†† | | | | | | | | | |
| Morgan Stanley | Risk Managed Real Estate Portfolio Short Custom Basket Swap3 | | | (0.81 | %) | At Maturity | 06/12/19 | | $ | 35,814,028 | | | $ | (219,626 | ) |
OTC Equity Swap Agreements†† | | | | | | | | | | | | | | |
| Morgan Stanley | Risk Managed Real Estate Portfolio Long Custom Basket Swap4 | | | 1.56 | % | At Maturity | 06/12/19 | | | 35,979,424 | | | | 735,430 | |
50 | THE GUGGENHEIM FUNDS ANNUAL REPORT | SEE NOTES TO FINANCIAL STATEMENTS. |
SCHEDULE OF INVESTMENTS (continued) | September 30, 2017 |
| RISK MANAGED REAL ESTATE FUND | |
| | | Shares | | | Unrealized Gain (Loss) | |
| | | | | | | |
CUSTOM BASKET OF LONG SECURITIES3 | | | | | | |
| Prologis, Inc. | | | 19,709 | | | $ | 118,684 | |
| Tier REIT, Inc. | | | 58,690 | | | | 112,098 | |
| Spirit Realty Capital, Inc. | | | 125,278 | | | | 108,580 | |
| RLJ Lodging Trust | | | 58,693 | | | | 78,232 | |
| Starwood Waypoint Homes | | | 35,238 | | | | 68,866 | |
| Caesars Entertainment Corp.* | | | 69,635 | | | | 66,964 | |
| American Tower Corp. — Class A | | | 8,702 | | | | 63,773 | |
| MGM Growth Properties LLC — Class A | | | 38,506 | | | | 61,610 | |
| Equinix, Inc. | | | 2,701 | | | | 50,316 | |
| National Storage Affiliates Trust | | | 39,637 | | | | 49,155 | |
| Extended Stay America, Inc. | | | 38,685 | | | | 37,815 | |
| Rexford Industrial Realty, Inc. | | | 48,811 | | | | 36,120 | |
| EastGroup Properties, Inc. | | | 14,400 | | | | 34,332 | |
| CyrusOne, Inc. | | | 19,721 | | | | 28,490 | |
| Boyd Gaming Corp. | | | 30,998 | | | | 27,312 | |
| Cousins Properties, Inc. | | | 84,931 | | | | 24,299 | |
| Gaming and Leisure Properties, Inc. | | | 31,581 | | | | 20,843 | |
| Weyerhaeuser Co. | | | 24,541 | | | | 13,243 | |
| Alexandria Real Estate Equities, Inc. | | | 10,504 | | | | 3,785 | |
| Equity LifeStyle Properties, Inc. | | | 10,777 | | | | 1,610 | |
| Rayonier, Inc. | | | 27,461 | | | | 1,030 | |
| Blackstone Mortgage Trust, Inc. — Class A | | | 37,712 | | | | (3,851 | ) |
| Gramercy Property Trust | | | 39,495 | | | | (16,967 | ) |
| Equity Residential | | | 21,147 | | | | (20,960 | ) |
| Regency Centers Corp. | | | 15,891 | | | | (21,448 | ) |
| Federal Realty Investment Trust | | | 7,976 | | | | (21,667 | ) |
| Crown Castle International Corp. | | | 12,078 | | | | (24,298 | ) |
| Sabra Health Care REIT, Inc. | | | 52,680 | | | | (25,041 | ) |
| Sun Communities, Inc. | | | 13,107 | | | | (38,214 | ) |
| Healthcare Trust of America, Inc. — Class A | | | 37,802 | | | | (76,426 | ) |
| Jernigan Capital, Inc. | | | 52,466 | | | | (96,519 | ) |
| GGP, Inc. | | | 34,047 | | | | (109,813 | ) |
| Physicians Realty Trust | | | 57,370 | | | | (190,756 | ) |
| Total Custom Basket of Long Securities | | | | | | | 361,196 | |
CUSTOM BASKET OF SHORT SECURITIES4 | | | | | | | | |
| Colony NorthStar, Inc. — Class A | | | (79,462 | ) | | | 152,209 | |
| Senior Housing Properties Trust | | | (57,857 | ) | | | 105,868 | |
| GEO Group, Inc. | | | (19,189 | ) | | | 104,265 | |
| CoreCivic, Inc. | | | (20,635 | ) | | | 76,135 | |
| Piedmont Office Realty Trust, Inc. — Class A | | | (54,648 | ) | | | 63,152 | |
| iShares U.S. Real Estate ETF | | | (95,322 | ) | | | 59,945 | |
| LaSalle Hotel Properties | | | (40,196 | ) | | | 58,022 | |
| Macerich Co. | | | (10,432 | ) | | | 45,280 | |
| SL Green Realty Corp. | | | (11,094 | ) | | | 44,025 | |
| Apartment Investment & Management Co. — Class A | | | (34,151 | ) | | | 36,084 | |
| Jones Lang LaSalle, Inc. | | | (5,894 | ) | | | 32,444 | |
| Liberty Property Trust | | | (27,636 | ) | | | 30,900 | |
| Omega Healthcare Investors, Inc. | | | (34,780 | ) | | | 26,316 | |
| Brixmor Property Group, Inc. | | | (47,880 | ) | | | 17,512 | |
| Essex Property Trust, Inc. | | | (4,580 | ) | | | 15,853 | |
| CareTrust REIT, Inc. | | | (61,769 | ) | | | 12,808 | |
| CBRE Group, Inc. — Class A* | | | (19,969 | ) | | | 7,848 | |
| CBL & Associates Properties, Inc. | | | (62,470 | ) | | | 4,740 | |
| VEREIT, Inc. | | | (116,108 | ) | | | 4,242 | |
| Lexington Realty Trust | | | (110,821 | ) | | | (2,626 | ) |
| Weingarten Realty Investors | | | (29,684 | ) | | | (3,775 | ) |
| PS Business Parks, Inc. | | | (6,095 | ) | | | (12,815 | ) |
| Public Storage | | | (5,661 | ) | | | (29,318 | ) |
| Chatham Lodging Trust | | | (58,695 | ) | | | (66,298 | ) |
| National Retail Properties, Inc. | | | (23,808 | ) | | | (76,186 | ) |
| Wynn Resorts Ltd. | | | (5,437 | ) | | | (101,509 | ) |
| Chesapeake Lodging Trust | | | (42,970 | ) | | | (112,267 | ) |
| iShares U.S. Home Construction ETF | | | (34,726 | ) | | | (115,183 | ) |
| Life Storage, Inc. | | | (16,377 | ) | | | (121,032 | ) |
| Total Custom Basket of Short Securities | | | | | | | 256,639 | |
| * | Non-income producing security. |
† | Value determined based on Level 1 inputs — See Note 4. |
†† | Value determined based on Level 2 inputs — See Note 4. |
1 | All or a portion of this security is pledged as short security collateral at September 30, 2017. |
2 | Rate indicated is the 7 day yield as of September 30, 2017. |
3 | Total Return is based on the return of the custom basket of long securities +/ - financing at a variable rate. Rate indicated is rate effective at September 30, 2017. |
4 | Total Return is based on the return of the custom basket of short securities +/ - financing at a variable rate. Rate indicated is rate effective at September 30, 2017. |
| | REIT — Real Estate Investment Trust |
| | |
| | See Sector Classification in Other Information section. |
| SEE NOTES TO FINANCIAL STATEMENTS. | THE GUGGENHEIM FUNDS ANNUAL REPORT | 51 |
SCHEDULE OF INVESTMENTS (concluded) | September 30, 2017 |
| RISK MANAGED REAL ESTATE FUND | |
The following table summarizes the inputs used to value the Fund’s investments at September 30, 2017 (See Note 4 in the Notes to Financial Statements):
| Investments in Securities (Assets) | | Level 1
Quoted
Prices | | | Level 2
Significant
Observable
Inputs | | | Level 2 -
Other* | | | Level 3
Significant
Unobservable
Inputs | | | Total | |
| Common Stocks | | $ | 123,454,689 | | | $ | — | | | $ | — | | | $ | — | | | $ | 123,454,689 | |
| Money Market Fund | | | 6,884,509 | | | | — | | | | — | | | | — | | | | 6,884,509 | |
| Equity Swap Agreements | | | — | | | | — | | | | 735,430 | | | | — | | | | 735,430 | |
| Total Assets | | $ | 130,339,198 | | | $ | — | | | $ | 735,430 | | | $ | — | | | $ | 131,074,628 | |
| | | | | | | | | | | | | | | | | | | | | |
| Investments in Securities (Liabilities) | | Level 1
Quoted
Prices | | | Level 2
Significant
Observable
Inputs | | | Level 2 -
Other* | | | Level 3
Significant
Unobservable
Inputs | | | Total | |
| Common Stocks | | $ | 10,589,097 | | | $ | — | | | $ | — | | | $ | — | | | $ | 10,589,097 | |
| Exchange-Traded Funds | | | 3,513,905 | | | | — | | | | — | | | | — | | | | 3,513,905 | |
| Equity Swap Agreements | | | — | | | | — | | | | 219,626 | | | | — | | | | 219,626 | |
| Total Liabilities | | $ | 14,103,002 | | | $ | — | | | $ | 219,626 | | | $ | — | | | $ | 14,322,628 | |
| * | Other financial instruments include swaps, which are reported as unrealized gain/loss at period end. |
Transfers between investment levels may occur as the markets fluctuate and/or the availability of data used in an investment’s valuation changes. Transfers between valuation levels, if any, are in comparison to the valuation levels at the end of the previous fiscal year, and are effective using the fair value as of the end of the current fiscal period.
For the year ended September 30, 2017, there were no transfers between levels.
52 | THE GUGGENHEIM FUNDS ANNUAL REPORT | SEE NOTES TO FINANCIAL STATEMENTS. |
| RISK MANAGED REAL ESTATE FUND | |
| STATEMENT OF ASSETS AND LIABILITIES |
| September 30, 2017 |
| Assets: | |
| Investments, at value (cost $122,891,488) | | $ | 130,339,198 | |
| Segregated cash with broker | | | 12,294,000 | |
| Unrealized appreciation on swap agreements | | | 735,430 | |
| Prepaid expenses | | | 33,351 | |
| Receivables: | |
| Dividends | | | 422,181 | |
| Swap settlement | | | 169,924 | |
| Fund shares sold | | | 76,951 | |
| Interest | | | 4,537 | |
| Other assets | | | 6,462 | |
| Total assets | | | 144,082,034 | |
| | | | | |
| Liabilities: | |
| Securities sold short, at value (proceeds $14,142,622) | | | 14,103,002 | |
| Segregated cash due to broker | | | 1,000,000 | |
| Unrealized depreciation on swap agreements | | | 219,626 | |
| Payable for: | |
| Management fees | | | 67,789 | |
| Fund shares redeemed | | | 27,594 | |
| Distributions to shareholders | | | 95,232 | |
| Fund accounting/administration fees | | | 8,469 | |
| Distribution and service fees | | | 1,489 | |
| Trustees’ fees* | | | 1,232 | |
| Transfer agent/maintenance fees | | | 1,027 | |
| Investment Adviser | | | 10 | |
| Miscellaneous | | | 35,290 | |
| Total liabilities | | | 15,560,760 | |
| Net assets | | $ | 128,521,274 | |
| | | | | |
| Net assets consist of: | |
| Paid in capital | | $ | 117,921,213 | |
| Accumulated net investment loss | | | (552,277 | ) |
| Accumulated net realized gain on investments | | | 3,149,204 | |
| Net unrealized appreciation on investments | | | 8,003,134 | |
| Net assets | | $ | 128,521,274 | |
| | | | | |
| A-Class: | |
| Net assets | | $ | 2,195,954 | |
| Capital shares outstanding | | | 73,942 | |
| Net asset value per share | | $ | 29.70 | |
| Maximum offering price per share (Net asset value divided by 95.25%) | | $ | 31.18 | |
| | | | | |
| C-Class: | |
| Net assets | | $ | 724,864 | |
| Capital shares outstanding | | | 24,542 | |
| Net asset value per share | | $ | 29.54 | |
| | | | | |
| P-Class: | |
| Net assets | | $ | 2,563,783 | |
| Capital shares outstanding | | | 85,889 | |
| Net asset value per share | | $ | 29.85 | |
| | | | | |
| Institutional Class: | |
| Net assets | | $ | 123,036,673 | |
| Capital shares outstanding | | | 4,095,423 | |
| Net asset value per share | | $ | 30.04 | |
| * | Relates to Trustees not deemed “interested persons” within the meaning of Section 2(a)(19) of the 1940 Act. |
| SEE NOTES TO FINANCIAL STATEMENTS. | THE GUGGENHEIM FUNDS ANNUAL REPORT | 53 |
| RISK MANAGED REAL ESTATE FUND | |
| STATEMENT OF OPERATIONS |
| Year Ended September 30, 2017 |
| Investment Income: | |
| Dividends | | $ | 1,549,486 | |
| Interest | | | 57,526 | |
| Total investment income | | | 1,607,012 | |
| | | | | |
| Expenses: | |
| Management fees | | | 860,856 | |
| Distribution and service fees: | |
| A-Class | | | 2,438 | |
| C-Class | | | 5,671 | |
| P-Class | | | 1,718 | |
| Recoupment of previously waived fees: | |
| A-Class | | | 201 | |
| C-Class | | | 23 | |
| P-Class | | | 6 | |
| Transfer agent/maintenance fees: | |
| A-Class | | | 1,420 | |
| C-Class | | | 1,457 | |
| P-Class | | | 1,297 | |
| Institutional Class | | | 22,382 | |
| Fund accounting/administration fees | | | 92,008 | |
| Line of credit fees | | | 25,737 | |
| Prime broker interest expense | | | 15,149 | |
| Custodian fees | | | 9,363 | |
| Trustees’ fees* | | | 9,156 | |
| Short sales dividend expense | | | 4,660 | |
| Miscellaneous | | | 137,566 | |
| Total expenses | | | 1,191,108 | |
| Less: | |
| Expenses reimbursed by Adviser: | | | | |
| A-Class | | | (1,142 | ) |
| C-Class | | | (1,017 | ) |
| P-Class | | | (1,319 | ) |
| Institutional Class | | | (10,180 | ) |
| Expenses waived by Adviser | | | (3,031 | ) |
| Total waived/reimbursed expenses | | | (16,689 | ) |
| Net expenses | | | 1,174,419 | |
| Net investment income | | | 432,593 | |
| | | | | |
| Net Realized and Unrealized Gain (Loss): | |
| Net realized gain (loss) on: | |
| Investments | | | 3,554,135 | |
| Swap agreements | | | 3,115,658 | |
| Securities sold short | | | 638,015 | |
| Net realized gain | | | 7,307,808 | |
| Net change in unrealized appreciation (depreciation) on: | |
| Investments | | | 499,769 | |
| Securities sold short | | | 339,078 | |
| Swap agreements | | | (19,408 | ) |
| Net change in unrealized appreciation (depreciation) | | | 819,439 | |
| Net realized and unrealized gain | | | 8,127,247 | |
| Net increase in net assets resulting from operations | | $ | 8,559,840 | |
| * | Relates to Trustees not deemed “interested persons” within the meaning of Section 2(a)(19) of the 1940 Act. |
54 | THE GUGGENHEIM FUNDS ANNUAL REPORT | SEE NOTES TO FINANCIAL STATEMENTS. |
| RISK MANAGED REAL ESTATE FUND | |
| STATEMENTS OF CHANGES IN NET ASSETS |
| | | Year Ended
September 30,
2017 | | | Year Ended
September 30,
2016 | |
| Increase (Decrease) in Net Assets from Operations: | | | | | | |
| Net investment income | | $ | 432,593 | | | $ | 1,008,071 | |
| Net realized gain on investments | | | 7,307,808 | | | | 5,047,620 | |
| Net change in unrealized appreciation (depreciation) on investments | | | 819,439 | | | | 9,597,857 | |
| Net increase in net assets resulting from operations | | | 8,559,840 | | | | 15,653,548 | |
| | | | | | | | | |
| Distributions to shareholders from: | | | | | | | | |
| Net investment income | | | | | | | | |
| A-Class | | | (18,998 | ) | | | (15,560 | ) |
| C-Class | | | (7,861 | ) | | | (7,069 | ) |
| P-Class | | | (16,196 | ) | | | (1,363 | ) |
| Institutional Class | | | (2,441,728 | ) | | | (3,816,066 | ) |
| Net realized gains | | | | | | | | |
| A-Class | | | (14,684 | ) | | | (43,834 | ) |
| C-Class | | | (13,682 | ) | | | (32,752 | ) |
| P-Class | | | (2,734 | ) | | | (4,335 | ) |
| Institutional Class | | | (2,669,186 | ) | | | (13,211,585 | ) |
| Total distributions to shareholders | | | (5,185,069 | ) | | | (17,132,564 | ) |
| | | | | | | | | |
| Capital share transactions: | | | | | | | | |
| Proceeds from sale of shares | | | | | | | | |
| A-Class | | | 2,398,594 | | | | 785,426 | |
| C-Class | | | 224,935 | | | | 452,351 | |
| P-Class | | | 3,554,742 | | | | 73,853 | |
| Institutional Class | | | 11,786,247 | | | | 3,584,478 | |
| Distributions reinvested | | | | | | | | |
| A-Class | | | 31,571 | | | | 54,041 | |
| C-Class | | | 18,354 | | | | 39,469 | |
| P-Class | | | 18,640 | | | | 5,698 | |
| Institutional Class | | | 4,051,720 | | | | 13,011,489 | |
| Cost of shares redeemed | | | | | | | | |
| A-Class | | | (1,017,535 | ) | | | (474,048 | ) |
| C-Class | | | (50,198 | ) | | | (58,044 | ) |
| P-Class | | | (1,121,507 | ) | | | (26,988 | ) |
| Institutional Class | | | (7,914,904 | ) | | | (9,175,287 | ) |
| Net increase from capital share transactions | | | 11,980,659 | | | | 8,272,438 | |
| Net increase in net assets | | | 15,355,430 | | | | 6,793,422 | |
| | | | | | | | | |
| Net assets: | | | | | | | | |
| Beginning of year | | | 113,165,844 | | | | 106,372,422 | |
| End of year | | $ | 128,521,274 | | | $ | 113,165,844 | |
| Accumulated net investment loss at end of year | | $ | (552,277 | ) | | $ | (481,337 | ) |
| SEE NOTES TO FINANCIAL STATEMENTS. | THE GUGGENHEIM FUNDS ANNUAL REPORT | 55 |
| RISK MANAGED REAL ESTATE FUND | |
STATEMENTS OF CHANGES IN NET ASSETS (concluded) |
| | | Year Ended
September 30,
2017 | | | Year Ended
September 30,
2016 | |
| Capital share activity: | | | | | | |
| Shares sold | | | | | | |
| A-Class | | | 81,880 | | | | 27,279 | |
| C-Class | | | 7,646 | | | | 15,548 | |
| P-Class | | | 120,023 | | | | 2,578 | |
| Institutional Class | | | 395,502 | | | | 132,744 | |
| Shares issued from reinvestment of distributions | | | | | | | | |
| A-Class | | | 1,101 | | | | 2,003 | |
| C-Class | | | 652 | | | | 1,472 | |
| P-Class | | | 633 | | | | 210 | |
| Institutional Class | | | 140,819 | | | | 477,316 | |
| Shares redeemed | | | | | | | | |
| A-Class | | | (34,776 | ) | | | (15,824 | ) |
| C-Class | | | (1,759 | ) | | | (2,239 | ) |
| P-Class | | | (37,602 | ) | | | (952 | ) |
| Institutional Class | | | (273,671 | ) | | | (317,907 | ) |
| Net increase in shares | | | 400,448 | | | | 322,228 | |
56 | THE GUGGENHEIM FUNDS ANNUAL REPORT | SEE NOTES TO FINANCIAL STATEMENTS. |
| RISK MANAGED REAL ESTATE FUND | |
This table is presented to show selected data for a share outstanding throughout each period and to assist shareholders in evaluating a Fund’s performance for the periods presented.
| A-Class | | Year Ended
September 30,
2017 | | | Year Ended
September 30,
2016 | | | Year Ended
September 30,
2015 | | | Period Ended
September 30,
2014a | |
| Per Share Data | | | | | | | | | | | | |
| Net asset value, beginning of period | | $ | 28.87 | | | $ | 29.77 | | | $ | 26.99 | | | $ | 25.00 | |
| Income (loss) from investment operations: | |
Net investment income (loss)b | | | .03 | | | | .19 | | | | (.21 | ) | | | .02 | |
| Net gain (loss) on investments (realized and unrealized) | | | 2.08 | | | | 3.84 | | | | 3.18 | | | | 2.06 | |
| Total from investment operations | | | 2.11 | | | | 4.03 | | | | 2.97 | | | | 2.08 | |
| Less distributions from: | |
| Net investment income | | | (.57 | ) | | | (1.12 | ) | | | (.05 | ) | | | (.09 | ) |
| Net realized gains | | | (.71 | ) | | | (3.81 | ) | | | (.14 | ) | | | — | |
| Total distributions | | | (1.28 | ) | | | (4.93 | ) | | | (.19 | ) | | | (.09 | ) |
| Net asset value, end of period | | $ | 29.70 | | | $ | 28.87 | | | $ | 29.77 | | | $ | 26.99 | |
| | |
Total Returng | | | 7.54 | % | | | 14.88 | % | | | 10.97 | % | | | 8.35 | % |
| Ratios/Supplemental Data | |
| Net assets, end of period (in thousands) | | $ | 2,196 | | | $ | 743 | | | $ | 366 | | | $ | 107 | |
| Ratios to average net assets: | |
| Net investment income (loss) | | | 0.09 | % | | | 0.66 | % | | | (0.67 | %) | | | 0.16 | % |
Total expensesc | | | 1.45 | % | | | 1.93 | % | | | 3.41 | % | | | 4.22 | %h |
Net expensesd,e,i | | | 1.33 | % | | | 1.78 | % | | | 3.04 | % | | | 3.32 | % |
| Portfolio turnover rate | | | 85 | % | | | 133 | % | | | 214 | % | | | 57 | % |
| C-Class | | Year Ended
September 30,
2017 | | | Year Ended
September 30,
2016 | | | Year Ended
September 30,
2015 | | | Period Ended
September 30,
2014a | |
| Per Share Data | | | | | | | | | | | | |
| Net asset value, beginning of period | | $ | 28.77 | | | $ | 29.56 | | | $ | 26.95 | | | $ | 25.00 | |
| Income (loss) from investment operations: | |
Net investment income (loss)b | | | (.19 | ) | | | .02 | | | | (.43 | ) | | | (.23 | ) |
| Net gain (loss) on investments (realized and unrealized) | | | 2.06 | | | | 3.77 | | | | 3.18 | | | | 2.19 | |
| Total from investment operations | | | 1.87 | | | | 3.79 | | | | 2.75 | | | | 1.96 | |
| Less distributions from: | |
| Net investment income | | | (.39 | ) | | | (.77 | ) | | | — | | | | (.01 | ) |
| Net realized gains | | | (.71 | ) | | | (3.81 | ) | | | (.14 | ) | | | — | |
| Total distributions | | | (1.10 | ) | | | (4.58 | ) | | | (.14 | ) | | | (.01 | ) |
| Net asset value, end of period | | $ | 29.54 | | | $ | 28.77 | | | $ | 29.56 | | | $ | 26.95 | |
| | |
Total Returng | | | 6.71 | % | | | 14.00 | % | | | 10.20 | % | | | 7.85 | % |
| Ratios/Supplemental Data | |
| Net assets, end of period (in thousands) | | $ | 725 | | | $ | 518 | | | $ | 95 | | | $ | 52 | |
| Ratios to average net assets: | |
| Net investment income (loss) | | | (0.66 | %) | | | 0.08 | % | | | (1.42 | %) | | | (1.60 | %) |
Total expensesc | | | 2.27 | % | | | 3.32 | % | | | 5.76 | % | | | 9.33 | %h |
Net expensesd,e,i | | | 2.08 | % | | | 2.53 | % | | | 3.76 | % | | | 2.67 | % |
| Portfolio turnover rate | | | 85 | % | | | 133 | % | | | 214 | % | | | 57 | % |
| SEE NOTES TO FINANCIAL STATEMENTS. | THE GUGGENHEIM FUNDS ANNUAL REPORT | 57 |
| RISK MANAGED REAL ESTATE FUND | |
FINANCIAL HIGHLIGHTS (continued) |
This table is presented to show selected data for a share outstanding throughout each period and to assist shareholders in evaluating a Fund’s performance for the periods presented.
| P-Class | | Year Ended
September 30,
2017 | | | Year Ended
September 30,
2016 | | | Period Ended
September 30,
2015f | |
| Per Share Data | | | | | | | | | |
| Net asset value, beginning of period | | $ | 29.01 | | | $ | 29.77 | | | $ | 30.89 | |
| Income (loss) from investment operations: | |
Net investment income (loss)b | | | .13 | | | | .16 | | | | .04 | |
| Net gain (loss) on investments (realized and unrealized) | | | 1.98 | | | | 3.88 | | | | (1.16 | ) |
| Total from investment operations | | | 2.11 | | | | 4.04 | | | | (1.12 | ) |
| Less distributions from: | |
| Net investment income | | | (.56 | ) | | | (.99 | ) | | | — | |
| Net realized gains | | | (.71 | ) | | | (3.81 | ) | | | — | |
| Total distributions | | | (1.27 | ) | | | (4.80 | ) | | | — | |
| Net asset value, end of period | | $ | 29.85 | | | $ | 29.01 | | | $ | 29.77 | |
| | |
Total Returng | | | 7.53 | % | | | 14.87 | % | | | (3.63 | %) |
| Ratios/Supplemental Data | |
| Net assets, end of period (in thousands) | | $ | 2,564 | | | $ | 82 | | | $ | 30 | |
| Ratios to average net assets: | |
| Net investment income (loss) | | | 0.42 | % | | | 0.56 | % | | | 0.30 | % |
Total expensesc | | | 1.51 | % | | | 1.88 | % | | | 4.04 | %h |
Net expensesd,e,i | | | 1.30 | % | | | 1.78 | % | | | 2.94 | % |
| Portfolio turnover rate | | | 85 | % | | | 133 | % | | | 214 | % |
58 | THE GUGGENHEIM FUNDS ANNUAL REPORT | SEE NOTES TO FINANCIAL STATEMENTS. |
| RISK MANAGED REAL ESTATE FUND | |
FINANCIAL HIGHLIGHTS (concluded) |
This table is presented to show selected data for a share outstanding throughout each period and to assist shareholders in evaluating a Fund’s performance for the periods presented.
| Institutional Class | | Year Ended
September 30,
2017 | | | Year Ended
September 30,
2016 | | | Year Ended
September 30,
2015 | | | Period Ended
September 30,
2014a | |
| Per Share Data | | | | | | | | | | | | |
| Net asset value, beginning of period | | $ | 29.18 | | | $ | 29.90 | | | $ | 27.00 | | | $ | 25.00 | |
| Income (loss) from investment operations: | |
Net investment income (loss)b | | | .11 | | | | .26 | | | | (.11 | ) | | | .02 | |
| Net gain (loss) on investments (realized and unrealized) | | | 2.10 | | | | 3.89 | | | | 3.18 | | | | 2.09 | |
| Total from investment operations | | | 2.21 | | | | 4.15 | | | | 3.07 | | | | 2.11 | |
| Less distributions from: | |
| Net investment income | | | (.64 | ) | | | (1.06 | ) | | | (.03 | ) | | | (.11 | ) |
| Net realized gains | | | (.71 | ) | | | (3.81 | ) | | | (.14 | ) | | | — | |
| Total distributions | | | (1.35 | ) | | | (4.87 | ) | | | (.17 | ) | | | (.11 | ) |
| Net asset value, end of period | | $ | 30.04 | | | $ | 29.18 | | | $ | 29.90 | | | $ | 27.00 | |
| | |
Total Returng | | | 7.87 | % | | | 15.20 | % | | | 11.36 | % | | | 8.44 | % |
| Ratios/Supplemental Data | |
| Net assets, end of period (in thousands) | | $ | 123,037 | | | $ | 111,823 | | | $ | 105,882 | | | $ | 103,993 | |
| Ratios to average net assets: | |
| Net investment income (loss) | | | 0.38 | % | | | 0.91 | % | | | (0.35 | %) | | | 0.11 | % |
Total expensesc | | | 1.02 | % | | | 1.50 | % | | | 2.70 | % | | | 2.69 | %h |
Net expensesd,i | | | 1.01 | % | | | 1.50 | % | | | 2.70 | % | | | 2.58 | % |
| Portfolio turnover rate | | | 85 | % | | | 133 | % | | | 214 | % | | | 57 | % |
a | Since commencement of operations: March 28, 2014. Percentage amounts for the period, except total return and portfolio turnover rate, have been annualized. |
b | Net investment income (loss) per share was computed using average shares outstanding throughout the period. |
c | Does not include expenses of the underlying funds in which the Fund invests. |
d | Net expense information reflects the expense ratios after expense waivers and reimbursements, as applicable. |
e | The portion of the ratios of net expenses to average net assets attributable to recoupments of prior fee reductions or expense reimbursement is 0.02% for A-Class, 0.00% for C-Class and 0.00% for P-Class. |
f | Since commencement of operations: May 1, 2015. Percentage amounts for the period, except total return and portfolio turnover rate, have been annualized. |
g | Total return does not reflect the impact of any applicable sales charges and has not been annualized. |
h | Due to limited length of Fund operations, ratios for this period are not indicative of future performance. |
i | Net expenses may include expenses that are excluded from the expense limitation agreement and recouped amounts excluding these expenses, the operating expense ratios for the periods presented would be: |
| | | 09/30/17 | 09/30/16 | 09/30/15 | 09/30/14 |
| | A-Class | 1.30% | 1.29% | 1.30% | 1.30% |
| | C-Class | 2.04% | 2.03% | 2.05% | 2.05% |
| | P-Class | 1.29% | 1.28% | 1.30% | — |
| | Institutional Class | 0.97% | 1.00% | 0.99% | 1.10% |
| SEE NOTES TO FINANCIAL STATEMENTS. | THE GUGGENHEIM FUNDS ANNUAL REPORT | 59 |
MANAGERS’ COMMENTARY (Unaudited) | September 30, 2017 |
To Our Shareholders:
Guggenheim Small Cap Value Fund (the “Fund”) is managed by a team of seasoned professionals led by James Schier, CFA, Managing Director and Senior Portfolio Manager; Scott Hammond, Managing Director and Portfolio Manager; Farhan Sharaff, Assistant Chief Investment Officer, Equities, and Portfolio Manager; Gregg Strohkorb, CFA, Portfolio Manager; and David Toussaint, CFA, CPA, Director and Senior Equity Research Analyst. In the following paragraphs, the team discusses performance of the Fund for the fiscal year ended September 30, 2017.
For the year ended September 30, 2017, Guggenheim Small Cap Value Fund returned 16.41%1, compared with the 20.55% return of its benchmark, the Russell 2000 Value Index.
Strategy and Market Overview
Our investment approach focuses on understanding how companies make money and how easily companies can improve returns, maintain existing high levels of profitability, or benefit from change that occurs within the industries in which they operate. In today’s rapidly changing environment marked by very sharp and quick, but constrained volatility, our long-term orientation and discipline are a competitive advantage. This should become especially critical when the environment of indiscriminant valuation expansion subsides, and fundamentals once again become a more dominant factor in the market.
Performance Review
Most of the performance differential was due to stock selection. The largest negative impact was in Information Technology, followed by Health Care. On the positive side, the leading contributor to return was stock selection in Financials.
The top individual contributor on an absolute basis was Sanderson Farms, Inc., a poultry producer, and two Financial holdings: Federal Agricultural Mortgage Corp. (“Farmer Mac”), which is a government-chartered investor-held entity in agricultural finance; and Wintrust Financial Corp. This asset-sensitive bank holding performed particularly well as short term interest rates were hiked three times during the period.
The top individual detractors on an absolute basis were Dean Foods Co., Neophotonics Corp., and Gulfport Energy Corp.
Portfolio Positioning
The largest relative sector exposures for the year were an underweight in Real Estate and an overweight in Utilities. The overweight detracted from performance for the year, while the underweight contributed to performance.
Portfolio and Market Outlook
As the period began, election results drove the market, as investors discounted the possibility of a stronger economy brought about by reduced regulation and tax cuts, and became comfortable with the notion that any interest rate increases would be gradual. While optimism that the President’s agenda would be quickly enacted faded in the early part of 2017, it was renewed in the middle of the year, helped by talk of tax cuts and a solid U.S. economy. The market has remained resilient and buoyant. We believe the bias in the market will continue to be to the upside, but expect volatility could likely resurface.
Our portfolios tend to reflect a bias toward companies with balance sheet quality. We continue to find niche companies with what we believe to be attractive growth opportunities, and, as such, are constructive on the outlook.
Performance displayed represents past performance which is no guarantee of future results.
1 | Performance figures are based on Class A shares and do not reflect taxes that a shareholder would pay on distributions or the redemption of shares. |
The opinions and forecast expressed may not actually come to pass. This information is subject to change at any time, based on market and other conditions, and should not be construed as a recommendation of any specific security or strategy.
| 60 | THE GUGGENHEIM FUNDS ANNUAL REPORT | |
PERFORMANCE REPORT AND FUND PROFILE (Unaudited) | September 30, 2017 |
SMALL CAP VALUE FUND
OBJECTIVE: Seeks long-term capital appreciation.
Holdings Diversification (Market Exposure as % of Net Assets)
“Holdings Diversification (Market Exposure as % of Net Assets)” excludes any temporary cash investments.
| Inception Dates: |
| A-Class | July 11, 2008 |
| C-Class | July 11, 2008 |
| P-Class | May 1, 2015 |
| Institutional Class | July 11, 2008 |
| Ten Largest Holdings (% of Total Net Assets) |
| iShares Russell 2000 Value ETF | 2.3% |
| Avista Corp. | 1.9% |
| Cathay General Bancorp | 1.8% |
| Fulton Financial Corp. | 1.8% |
| Wintrust Financial Corp. | 1.8% |
| Portland General Electric Co. | 1.7% |
| Sanderson Farms, Inc. | 1.6% |
| Berkshire Hills Bancorp, Inc. | 1.6% |
| UniFirst Corp. | 1.5% |
| Spire, Inc. | 1.5% |
| Top Ten Total | 17.5% |
| “Ten Largest Holdings” excludes any temporary cash investments. |
| | THE GUGGENHEIM FUNDS ANNUAL REPORT | 61 |
PERFORMANCE REPORT AND FUND PROFILE (Unaudited)(concluded) | September 30, 2017 |
Cumulative Fund Performance*
Average Annual Returns*
Periods Ended September 30, 2017
| | 1 Year | 5 Year | Since Inception
(07/11/08) |
| A-Class Shares | 16.41% | 10.62% | 13.54% |
A-Class Shares with sales charge‡ | 10.87% | 9.55% | 12.81% |
| C-Class Shares | 15.53% | 9.78% | 12.71% |
C-Class Shares with CDSC§ | 14.53% | 9.78% | 12.71% |
| Institutional Class Shares | 16.65% | 10.88% | 13.81% |
| Russell 2000 Value Index | 20.55% | 13.27% | 10.13% |
| | | 1 Year | Since Inception
(05/01/15) |
| P-Class Shares | | 16.35% | 7.54% |
| Russell 2000 Value Index | | 20.55% | 10.99% |
| * | The performance data above represents past performance that is not predictive of future results. The investment return and principal value of an investment in the Fund will fluctuate so that an investor’s shares, when redeemed, may be worth more or less than their original cost. Returns are historical and include changes in principal and reinvested dividends and capital gains and do not reflect the effect of taxes. The Russell 2000 Value Index is an unmanaged index and, unlike the Fund, has no management fees or operating expenses to reduce its reported return. The graph is based on A-Class Shares only; performance for C-Class, P-Class and Institutional Class will vary due to differences in fee structure. The graph is based on A-Class shares only; performance for C-Class, P-Class and Institutional Class will vary due to differences in fee structures. |
‡ | Effective February 22, 2011, the maximum sales charge decreased from 5.75% to 4.75%. A 5.75% maximum sales charge is used in the calculation of the 1 Year, 5 Year and 10 Year average annual returns (based on subscriptions made prior to February 22, 2011), and a 4.75% maximum sales charge will be used to calculate performance for periods based on subscriptions made on or after February 22, 2011. |
§ | Fund returns include a CDSC of 1% if redeemed within 12 months of purchase. |
| 62 | THE GUGGENHEIM FUNDS ANNUAL REPORT | |
| SCHEDULE OF INVESTMENTS | September 30, 2017 |
| SMALL CAP VALUE FUND | |
| | | Shares | | | Value | |
| | | | | | | |
COMMON STOCKS† - 96.4% | |
| | | | | | | |
| Financial - 38.0% | |
| Cathay General Bancorp | | | 9,350 | | | $ | 375,869 | |
| Fulton Financial Corp. | | | 20,015 | | | | 375,280 | |
| Wintrust Financial Corp. | | | 4,747 | | | | 371,738 | |
| Berkshire Hills Bancorp, Inc. | | | 8,756 | | | | 339,294 | |
| First Citizens BancShares, Inc. — Class A | | | 731 | | | | 273,314 | |
| BancorpSouth, Inc. | | | 8,015 | | | | 256,881 | |
| Hanmi Financial Corp. | | | 7,838 | | | | 242,586 | |
| Umpqua Holdings Corp. | | | 11,974 | | | | 233,613 | |
| Argo Group International Holdings Ltd. | | | 3,564 | | | | 219,185 | |
| Beneficial Bancorp, Inc. | | | 13,113 | | | | 217,676 | |
Forestar Group, Inc.*,†† | | | 12,448 | | | | 217,591 | |
| Trustmark Corp. | | | 6,555 | | | | 217,102 | |
| TriCo Bancshares | | | 5,304 | | | | 216,138 | |
| Horace Mann Educators Corp. | | | 5,460 | | | | 214,851 | |
| Investors Bancorp, Inc. | | | 15,524 | | | | 211,747 | |
| Radian Group, Inc. | | | 11,320 | | | | 211,571 | |
| Federal Agricultural Mortgage Corp. — Class C | | | 2,878 | | | | 209,346 | |
| Redwood Trust, Inc. REIT | | | 12,642 | | | | 205,937 | |
| Valley National Bancorp | | | 15,305 | | | | 184,425 | |
| Hersha Hospitality Trust REIT | | | 9,789 | | | | 182,760 | |
| 1st Source Corp. | | | 3,323 | | | | 168,808 | |
| RLJ Lodging Trust REIT | | | 7,483 | | | | 164,625 | |
| Old National Bancorp | | | 8,989 | | | | 164,499 | |
| MBIA, Inc.* | | | 18,375 | | | | 159,863 | |
| Navigators Group, Inc. | | | 2,660 | | | | 155,211 | |
| iStar, Inc. REIT* | | | 13,092 | | | | 154,486 | |
| Flagstar Bancorp, Inc.* | | | 4,350 | | | | 154,338 | |
| Hancock Holding Co. | | | 2,899 | | | | 140,457 | |
| Cousins Properties, Inc. REIT | | | 14,190 | | | | 132,535 | |
| Capital Bank Financial Corp. — Class A | | | 2,890 | | | | 118,635 | |
| Sunstone Hotel Investors, Inc. REIT | | | 7,112 | | | | 114,290 | |
| Lexington Realty Trust REIT | | | 11,180 | | | | 114,260 | |
| IBERIABANK Corp. | | | 1,384 | | | | 113,696 | |
| MB Financial, Inc. | | | 2,462 | | | | 110,839 | |
| Summit Hotel Properties, Inc. REIT | | | 6,894 | | | | 110,235 | |
| LaSalle Hotel Properties REIT | | | 3,699 | | | | 107,345 | |
| Genworth Financial, Inc. — Class A* | | | 27,235 | | | | 104,855 | |
| Equity Commonwealth REIT* | | | 3,202 | | | | 97,341 | |
| Hanover Insurance Group, Inc. | | | 1,000 | | | | 96,930 | |
| Hilltop Holdings, Inc. | | | 3,682 | | | | 95,732 | |
| Tier REIT, Inc. REIT | | | 4,362 | | | | 84,187 | |
| Washington Federal, Inc. | | | 2,450 | | | | 82,443 | |
| Stifel Financial Corp. | | | 1,494 | | | | 79,869 | |
| Sterling Bancorp | | | 2,704 | | | | 66,654 | |
| ARMOUR Residential REIT, Inc. REIT | | | 2,315 | | | | 62,274 | |
| Invesco Mortgage Capital, Inc. REIT | | | 3,583 | | | | 61,377 | |
| Total Financial | | | | | | | 7,992,688 | |
| | | | | | | | | |
| Industrial - 13.4% | |
| Methode Electronics, Inc. | | | 5,199 | | | | 220,177 | |
| Louisiana-Pacific Corp.* | | | 7,688 | | | | 208,191 | |
| Sanmina Corp.* | | | 5,477 | | | | 203,470 | |
| Plexus Corp.* | | | 3,519 | | | | 197,346 | |
| Werner Enterprises, Inc. | | | 5,298 | | | | 193,643 | |
| GATX Corp. | | | 2,775 | | | | 170,829 | |
| TriMas Corp.* | | | 6,177 | | | | 166,779 | |
| Marten Transport Ltd. | | | 7,868 | | | | 161,687 | |
| Summit Materials, Inc. — Class A* | | | 4,606 | | | | 147,530 | |
| Argan, Inc. | | | 1,989 | | | | 133,760 | |
| Worthington Industries, Inc. | | | 2,858 | | | | 131,468 | |
| GasLog Ltd. | | | 6,992 | | | | 122,010 | |
| Crane Co. | | | 1,499 | | | | 119,905 | |
| Trinseo S.A. | | | 1,715 | | | | 115,077 | |
| Esterline Technologies Corp.* | | | 1,244 | | | | 112,147 | |
| ITT, Inc. | | | 2,498 | | | | 110,586 | |
| Greenbrier Companies, Inc. | | | 2,137 | | | | 102,897 | |
| Apogee Enterprises, Inc. | | | 2,008 | | | | 96,906 | |
| Scorpio Tankers, Inc. | | | 24,079 | | | | 82,591 | |
| Rand Logistics, Inc.* | | | 34,819 | | | | 11,194 | |
| Total Industrial | | | | | | | 2,808,193 | |
| | | | | | | | | |
| Consumer, Non-cyclical - 10.6% | |
| Sanderson Farms, Inc. | | | 2,145 | | | | 346,461 | |
| Lannett Company, Inc.* | | | 9,865 | | | | 182,009 | |
| AMN Healthcare Services, Inc.* | | | 3,938 | | | | 179,967 | |
| Premier, Inc. — Class A* | | | 5,405 | | | | 176,041 | |
| Fresh Del Monte Produce, Inc. | | | 3,612 | | | | 164,202 | |
| Dean Foods Co. | | | 15,013 | | | | 163,341 | |
| Molina Healthcare, Inc.* | | | 2,147 | | | | 147,627 | |
| HealthSouth Corp. | | | 3,050 | | | | 141,368 | |
| Emergent BioSolutions, Inc.* | | | 3,048 | | | | 123,292 | |
| Carriage Services, Inc. — Class A | | | 4,699 | | | | 120,294 | |
| AMAG Pharmaceuticals, Inc.* | | | 5,596 | | | | 103,246 | |
| Navigant Consulting, Inc.* | | | 5,940 | | | | 100,505 | |
| Community Health Systems, Inc.* | | | 12,809 | | | | 98,373 | |
| FTI Consulting, Inc.* | | | 2,544 | | | | 90,261 | |
| Universal Corp. | | | 1,498 | | | | 85,835 | |
| Total Consumer, Non-cyclical | | | | | | | 2,222,822 | |
| | | | | | | | | |
| Consumer, Cyclical - 9.6% | |
| UniFirst Corp. | | | 2,125 | | | | 321,937 | |
| Wabash National Corp. | | | 11,378 | | | | 259,646 | |
| Cooper Tire & Rubber Co. | | | 5,795 | | | | 216,733 | |
| International Speedway Corp. — Class A | | | 5,946 | | | | 214,056 | |
| Hawaiian Holdings, Inc.* | | | 4,481 | | | | 168,262 | |
| Meritage Homes Corp.* | | | 3,222 | | | | 143,057 | |
| Unifi, Inc.* | | | 3,498 | | | | 124,633 | |
| Asbury Automotive Group, Inc.* | | | 1,775 | | | | 108,453 | |
| Century Communities, Inc.* | | | 4,142 | | | | 102,307 | |
| Tenneco, Inc. | | | 1,680 | | | | 101,926 | |
| La-Z-Boy, Inc. | | | 3,019 | | | | 81,211 | |
| Caleres, Inc. | | | 2,045 | | | | 62,413 | |
| Deckers Outdoor Corp.* | | | 770 | | | | 52,676 | |
| DSW, Inc. — Class A | | | 2,004 | | | | 43,046 | |
| Genesco, Inc.* | | | 908 | | | | 24,153 | |
| Total Consumer, Cyclical | | | | | | | 2,024,509 | |
| | | | | | | | | |
| Utilities - 9.1% | |
| Avista Corp. | | | 7,683 | | | | 397,749 | |
| Portland General Electric Co. | | | 7,660 | | | | 349,602 | |
| SEE NOTES TO FINANCIAL STATEMENTS. | THE GUGGENHEIM FUNDS ANNUAL REPORT | 63 |
SCHEDULE OF INVESTMENTS (continued) | September 30, 2017 |
| SMALL CAP VALUE FUND | |
| | | Shares | | | Value | |
| | | | | | | |
| Spire, Inc. | | | 4,200 | | | $ | 313,531 | |
| Black Hills Corp. | | | 3,818 | | | | 262,946 | |
| ONE Gas, Inc. | | | 2,369 | | | | 174,453 | |
| Calpine Corp.* | | | 9,927 | | | | 146,423 | |
| ALLETE, Inc. | | | 1,391 | | | | 107,510 | |
| PNM Resources, Inc. | | | 1,960 | | | | 78,988 | |
| Southwest Gas Holdings, Inc. | | | 999 | | | | 77,542 | |
| Total Utilities | | | | | | | 1,908,744 | |
| | | | | | | | | |
| Communications - 6.0% | |
| Bankrate, Inc.* | | | 18,066 | | | | 252,021 | |
| Viavi Solutions, Inc.* | | | 25,599 | | | | 242,166 | |
| Ciena Corp.* | | | 6,858 | | | | 150,670 | |
| Time, Inc. | | | 10,850 | | | | 146,475 | |
| Infinera Corp.* | | | 12,200 | | | | 108,214 | |
| Scholastic Corp. | | | 2,678 | | | | 99,622 | |
| NeoPhotonics Corp.* | | | 17,137 | | | | 95,282 | |
| InterDigital, Inc. | | | 1,255 | | | | 92,556 | |
| Finisar Corp.* | | | 3,805 | | | | 84,357 | |
| Total Communications | | | | | | | 1,271,363 | |
| | | | | | | | | |
| Energy - 4.8% | |
| Rowan Companies plc — Class A* | | | 18,891 | | | | 242,750 | |
| Oasis Petroleum, Inc.* | | | 20,144 | | | | 183,713 | |
| Laredo Petroleum, Inc.* | | | 11,888 | | | | 153,712 | |
| Delek US Holdings, Inc. | | | 4,363 | | | | 116,623 | |
| Oceaneering International, Inc. | | | 4,240 | | | | 111,385 | |
| MRC Global, Inc.* | | | 5,304 | | | | 92,767 | |
| Gulfport Energy Corp.* | | | 5,583 | | | | 80,060 | |
| Jones Energy, Inc. — Class A* | | | 19,332 | | | | 37,117 | |
| Total Energy | | | | | | | 1,018,127 | |
| | | | | | | | | |
| Basic Materials - 2.5% | |
| Kaiser Aluminum Corp. | | | 2,709 | | | | 279,407 | |
| Reliance Steel & Aluminum Co. | | | 1,684 | | | | 128,270 | |
| Olin Corp. | | | 3,701 | | | | 126,759 | |
| Total Basic Materials | | | | | | | 534,436 | |
| | | | | | | | | |
| Technology - 2.4% | |
| Photronics, Inc.* | | | 14,292 | | | | 126,484 | |
| MicroStrategy, Inc. — Class A* | | | 857 | | | | 109,448 | |
| Cray, Inc.* | | | 5,362 | | | | 104,291 | |
| ManTech International Corp. — Class A | | | 2,096 | | | | 92,538 | |
| InnerWorkings, Inc.* | | | 5,611 | | | | 63,124 | |
| Total Technology | | | | | | | 495,885 | |
| | | | | | | | | |
| Total Common Stocks | | | | | | | | |
| (Cost $17,529,995) | | | | | | | 20,276,767 | |
| | | | | | | | | |
CONVERTIBLE PREFERRED STOCKS††† - 0.0% | |
Thermoenergy Corp.*,1,2 | | | 6,250 | | | | — | |
| Total Convertible Preferred Stocks | | | | | | | | |
| (Cost $5,968) | | | | | | | — | |
| | | | | | | | | |
EXCHANGE-TRADED FUNDS† - 2.3% | |
| iShares Russell 2000 Value ETF | | | 3,814 | | | | 473,394 | |
| Total Exchange-Traded Funds | | | | | | | | |
| (Cost $451,506) | | | | | | | 473,394 | |
| | | | | | | | | |
MONEY MARKET FUND† - 1.2% | |
Dreyfus Treasury Securities Cash Management Fund - Institutional Class 0.90%3 | | | 259,822 | | | | 259,822 | |
| Total Money Market Fund | | | | | | | | |
| (Cost $259,822) | | | | | | | 259,822 | |
| | | | | | | | | |
| Total Investments - 99.9% | | | | | | | | |
| (Cost $18,247,291) | | | | | | $ | 21,009,983 | |
| Other Assets & Liabilities, net - 0.1% | | | | | | | 17,338 | |
| Total Net Assets - 100.0% | | | | | | $ | 21,027,321 | |
| * | Non-income producing security. |
† | Value determined based on Level 1 inputs, unless otherwise noted — See Note 4. |
†† | Value determined based on Level 2 inputs — See Note 4. |
††† | Value determined based on Level 3 inputs — See Note 4. |
1 | Security was fair valued by the Valuation Committee at September 30, 2017. The total market value of fair valued securities amounts to $0, (cost $5,968) or 0.0% of total net assets. |
2 | PIPE (Private Investment in Public Equity) - Stock issued by a company in the secondary market as a means of raising capital more quickly and less expensively than through registration of a secondary public offering. |
3 | Rate indicated is the 7 day yield as of September 30, 2017. |
| | plc — Public Limited Company |
| | REIT — Real Estate Investment Trust |
| | |
| | See Sector Classification in Other Information section. |
64 | THE GUGGENHEIM FUNDS ANNUAL REPORT | SEE NOTES TO FINANCIAL STATEMENTS. |
SCHEDULE OF INVESTMENTS (concluded) | September 30, 2017 |
| SMALL CAP VALUE FUND | |
The following table summarizes the inputs used to value the Fund’s investments at September 30, 2017 (See Note 4 in the Notes to Financial Statements):
| Investments in Securities (Assets) | | Level 1
Quoted
Prices | | | Level 2
Significant
Observable
Inputs | | | Level 3
Significant
Unobservable
Inputs | | | Total | |
| Common Stocks | | $ | 20,059,176 | | | $ | 217,591 | | | $ | — | | | $ | 20,276,767 | |
| Convertible Preferred Stocks | | | — | | | | — | | | | — | * | | | — | * |
| Exchanged-Traded Funds | | | 473,394 | | | | — | | | | — | | | | 473,394 | |
| Money Market Fund | | | 259,822 | | | | — | | | | — | | | | 259,822 | |
| Total Assets | | $ | 20,792,392 | | | $ | 217,591 | | | $ | — | * | | $ | 21,009,983 | |
| * | Market value of security is $0. |
Transfers between investment levels may occur as the markets fluctuate and/or the availability of data used in an investment’s valuation changes. Transfers between valuation levels, if any, are in comparison to the valuation levels at the end of the previous fiscal year, and are effective using the fair value as of the end of the current fiscal period.
| SEE NOTES TO FINANCIAL STATEMENTS. | THE GUGGENHEIM FUNDS ANNUAL REPORT | 65 |
| STATEMENT OF ASSETS AND LIABILITIES |
| September 30, 2017 |
| Assets: | |
| Investments, at value (cost $18,247,291) | | $ | 21,009,983 | |
| Cash | | | 1,165 | |
| Prepaid expenses | | | 41,344 | |
| Receivables: | |
| Dividends | | | 24,392 | |
| Fund shares sold | | | 9,927 | |
| Investment Adviser | | | 1,862 | |
| Interest | | | 250 | |
| Total assets | | | 21,088,923 | |
| | | | | |
| Liabilities: | |
| Payable for: | |
| Fund shares redeemed | | | 33,309 | |
| Direct shareholders expense | | | 7,157 | |
| Transfer agent/maintenance fees | | | 6,799 | |
| Distribution and service fees | | | 5,756 | |
| Custodian fees | | | 3,005 | |
| Trustees’ fees* | | | 953 | |
| Miscellaneous | | | 4,623 | |
| Total liabilities | | | 61,602 | |
| Net assets | | $ | 21,027,321 | |
| | | | | |
| Net assets consist of: | |
| Paid in capital | | $ | 17,043,711 | |
| Undistributed net investment income | | | — | |
| Accumulated net realized gain on investments | | | 1,220,918 | |
| Net unrealized appreciation on investments | | | 2,762,692 | |
| Net assets | | $ | 21,027,321 | |
| | | | | |
| A-Class: | |
| Net assets | | $ | 11,942,845 | |
| Capital shares outstanding | | | 758,882 | |
| Net asset value per share | | $ | 15.74 | |
| Maximum offering price per share (Net asset value divided by 95.25%) | | $ | 16.52 | |
| | | | | |
| C-Class: | |
| Net assets | | $ | 4,281,147 | |
| Capital shares outstanding | | | 295,070 | |
| Net asset value per share | | $ | 14.51 | |
| | | | | |
| P-Class: | |
| Net assets | | $ | 13,807 | |
| Capital shares outstanding | | | 876 | |
| Net asset value per share | | $ | 15.76 | |
| | | | | |
| Institutional Class: | |
| Net assets | | $ | 4,789,522 | |
| Capital shares outstanding | | | 330,215 | |
| Net asset value per share | | $ | 14.50 | |
| STATEMENT OF OPERATIONS |
| Year Ended September 30, 2017 |
| Investment Income: | |
| Dividends | | $ | 299,635 | |
| Interest | | | 2,730 | |
| Total investment income | | | 302,365 | |
| | | | | |
| Expenses: | |
| Management fees | | | 173,017 | |
| Distribution and service fees: | |
| A-Class | | | 32,398 | |
| C-Class | | | 46,695 | |
| P-Class | | | 37 | |
| Transfer agent/maintenance fees: | |
| A-Class | | | 19,332 | |
| C-Class | | | 11,131 | |
| P-Class | | | 171 | |
| Institutional Class | | | 3,452 | |
| Registration fees | | | 55,213 | |
| Fund accounting/administration fees | | | 24,984 | |
| Trustees’ fees* | | | 7,155 | |
| Line of credit fees | | | 4,060 | |
| Custodian fees | | | 2,534 | |
| Recoupment of previously waived fees: | | | | |
| A-Class | | | 542 | |
| C-Class | | | 372 | |
| P-Class | | | 108 | |
| Institutional Class | | | 142 | |
| Miscellaneous | | | 37,439 | |
| Total expenses | | | 418,782 | |
| Less: | |
| Expenses reimbursed by Adviser: | | | | |
| A-Class | | | (21,803 | ) |
| C-Class | | | (12,015 | ) |
| P-Class | | | (145 | ) |
| Institutional Class | | | (4,542 | ) |
| Expenses waived by Adviser | | | (78,582 | ) |
| Total waived/reimbursed expenses | | | (117,087 | ) |
| Net expenses | | | 301,695 | |
| Net investment income | | | 670 | |
| | | | | |
| Net Realized and Unrealized Gain (Loss): | |
| Net realized gain (loss) on: | |
| Investments | | | 1,796,559 | |
| Net realized gain | | | 1,796,559 | |
| Net change in unrealized appreciation (depreciation) on: | |
| Investments | | | 1,216,874 | |
| Net change in unrealized appreciation (depreciation) | | | 1,216,874 | |
| Net realized and unrealized gain | | | 3,013,433 | |
| Net increase in net assets resulting from operations | | $ | 3,014,103 | |
| * | Relates to Trustees not deemed “interested persons” within the meaning of Section 2(a)(19) of the 1940 Act. |
66 | THE GUGGENHEIM FUNDS ANNUAL REPORT | SEE NOTES TO FINANCIAL STATEMENTS. |
| STATEMENTS OF CHANGES IN NET ASSETS |
| | | Year Ended
September 30,
2017 | | | Year Ended
September 30,
2016 | |
| Increase (Decrease) in Net Assets from Operations: | | | | | | |
| Net investment income (loss) | | $ | 670 | | | $ | (16,872 | ) |
| Net realized gain (loss) on investments | | | 1,796,559 | | | | (211,102 | ) |
| Net change in unrealized appreciation (depreciation) on investments | | | 1,216,874 | | | | 2,754,456 | |
| Net increase in net assets resulting from operations | | | 3,014,103 | | | | 2,526,482 | |
| | | | | | | | | |
| Distributions to shareholders from: | | | | | | | | |
| Net investment income | | | | | | | | |
| A-Class | | | (88,266 | ) | | | — | |
| P-Class | | | (72 | ) | | | — | |
| Institutional Class | | | (3,955 | ) | | | — | |
| Net realized gains | | | | | | | | |
| A-Class | | | — | | | | (955,328 | ) |
| C-Class | | | — | | | | (396,113 | ) |
| P-Class | | | — | | | | (707 | ) |
| Institutional Class | | | — | | | | (41,348 | ) |
| Total distributions to shareholders | | | (92,293 | ) | | | (1,393,496 | ) |
| | | | | | | | | |
| Capital share transactions: | | | | | | | | |
| Proceeds from sale of shares | | | | | | | | |
| A-Class | | | 3,674,284 | | | | 3,421,000 | |
| C-Class | | | 200,371 | | | | 750,596 | |
| P-Class | | | 10,168 | | | | 709 | |
| Institutional Class | | | 6,004,088 | | | | 272,695 | |
| Distributions reinvested | | | | | | | | |
| A-Class | | | 86,816 | | | | 939,682 | |
| C-Class | | | — | | | | 387,206 | |
| P-Class | | | 72 | | | | 707 | |
| Institutional Class | | | 3,294 | | | | 31,740 | |
| Cost of shares redeemed | | | | | | | | |
| A-Class | | | (7,098,702 | ) | | | (4,780,880 | ) |
| C-Class | | | (1,377,815 | ) | | | (1,836,314 | ) |
| P-Class | | | (8,947 | ) | | | (559 | ) |
| Institutional Class | | | (1,724,934 | ) | | | (489,765 | ) |
| Net decrease from capital share transactions | | | (231,305 | ) | | | (1,303,183 | ) |
| Net increase (decrease) in net assets | | | 2,690,505 | | | | (170,197 | ) |
| | | | | | | | | |
| Net assets: | | | | | | | | |
| Beginning of year | | | 18,336,816 | | | | 18,507,013 | |
| End of year | | $ | 21,027,321 | | | $ | 18,336,816 | |
| Undistributed net investment income at end of year | | $ | — | | | $ | — | |
| SEE NOTES TO FINANCIAL STATEMENTS. | THE GUGGENHEIM FUNDS ANNUAL REPORT | 67 |
STATEMENTS OF CHANGES IN NET ASSETS (concluded) |
| | | Year Ended
September 30,
2017 | | | Year Ended
September 30,
2016 | |
| Capital share activity: | | | | | | |
| Shares sold | | | | | | |
| A-Class | | | 251,276 | | | | 266,786 | |
| C-Class | | | 14,374 | | | | 65,317 | |
| P-Class | | | 675 | | | | 58 | |
| Institutional Class | | | 430,431 | | | | 23,593 | |
| Shares issued from reinvestment of distributions | | | | | | | | |
| A-Class | | | 5,894 | | | | 74,756 | |
| C-Class | | | — | | | | 33,151 | |
| P-Class | | | 5 | | | | 56 | |
| Institutional Class | | | 243 | | | | 2,743 | |
| Shares redeemed | | | | | | | | |
| A-Class | | | (474,537 | ) | | | (372,375 | ) |
| C-Class | | | (98,332 | ) | | | (152,218 | ) |
| P-Class | | | (581 | ) | | | (43 | ) |
| Institutional Class | | | (122,880 | ) | | | (42,731 | ) |
| Net increase (decrease) in shares | | | 6,568 | | | | (100,907 | ) |
68 | THE GUGGENHEIM FUNDS ANNUAL REPORT | SEE NOTES TO FINANCIAL STATEMENTS. |
This table is presented to show selected data for a share outstanding throughout each period and to assist shareholders in evaluating a Fund’s performance for the periods presented.
| A-Class | | Year Ended
September 30,
2017 | | | Year Ended
September 30,
2016 | | | Year Ended
September 30,
2015 | | | Year Ended
September 30,
2014 | | | Year Ended
September 30,
2013 | |
| Per Share Data | | | | | | | | | | | | | | | |
| Net asset value, beginning of period | | $ | 13.61 | | | $ | 12.78 | | | $ | 16.82 | | | $ | 17.81 | | | $ | 15.04 | |
| Income (loss) from investment operations: | |
Net investment income (loss)a | | | .02 | | | | .01 | | | | .02 | | | | (.03 | ) | | | (— | )b |
| Net gain (loss) on investments (realized and unrealized) | | | 2.20 | | | | 1.81 | | | | (.60 | ) | | | .26 | | | | 4.05 | |
| Total from investment operations | | | 2.22 | | | | 1.82 | | | | (.58 | ) | | | .23 | | | | 4.05 | |
| Less distributions from: | |
| Net investment income | | | (.09 | ) | | | — | | | | (.09 | ) | | | (.03 | ) | | | (.01 | ) |
| Net realized gains | | | — | | | | (.99 | ) | | | (3.37 | ) | | | (1.19 | ) | | | (1.27 | ) |
| Total distributions | | | (.09 | ) | | | (.99 | ) | | | (3.46 | ) | | | (1.22 | ) | | | (1.28 | ) |
| Net asset value, end of period | | $ | 15.74 | | | $ | 13.61 | | | $ | 12.78 | | | $ | 16.82 | | | $ | 17.81 | |
| | |
Total Returnc | | | 16.41 | % | | | 14.81 | % | | | (5.23 | %) | | | 1.07 | % | | | 29.39 | % |
| Ratios/Supplemental Data | |
| Net assets, end of period (in thousands) | | $ | 11,943 | | | $ | 13,283 | | | $ | 12,866 | | | $ | 17,342 | | | $ | 16,487 | |
| Ratios to average net assets: | |
| Net investment income (loss) | | | 0.15 | % | | | 0.12 | % | | | 0.13 | % | | | (0.14 | %) | | | (0.02 | %) |
Total expensesd | | | 1.87 | % | | | 2.29 | % | | | 1.99 | % | | | 1.85 | % | | | 1.91 | % |
Net expensese,f | | | 1.32 | %h | | | 1.32 | %h | | | 1.32 | %h | | | 1.32 | %h | | | 1.30 | % |
| Portfolio turnover rate | | | 48 | % | | | 64 | % | | | 62 | % | | | 45 | % | | | 34 | % |
| C-Class | | Year Ended
September 30,
2017 | | | Year Ended
September 30,
2016 | | | Year Ended
September 30,
2015 | | | Year Ended
September 30,
2014 | | | Year Ended
September 30,
2013 | |
| Per Share Data | | | | | | | | | | | | | | | |
| Net asset value, beginning of period | | $ | 12.57 | | | $ | 11.95 | | | $ | 15.96 | | | $ | 17.05 | | | $ | 14.54 | |
| Income (loss) from investment operations: | |
Net investment income (loss)a | | | (.08 | ) | | | (.08 | ) | | | (.09 | ) | | | (.15 | ) | | | (.12 | ) |
| Net gain (loss) on investments (realized and unrealized) | | | 2.02 | | | | 1.69 | | | | (.55 | ) | | | .25 | | | | 3.90 | |
| Total from investment operations | | | 1.94 | | | | 1.61 | | | | (.64 | ) | | | .10 | | | | 3.78 | |
| Less distributions from: | |
| Net realized gains | | | — | | | | (.99 | ) | | | (3.37 | ) | | | (1.19 | ) | | | (1.27 | ) |
| Total distributions | | | — | | | | (.99 | ) | | | (3.37 | ) | | | (1.19 | ) | | | (1.27 | ) |
| Net asset value, end of period | | $ | 14.51 | | | $ | 12.57 | | | $ | 11.95 | | | $ | 15.96 | | | $ | 17.05 | |
| | |
Total Returnc | | | 15.53 | % | | | 14.02 | % | | | (5.97 | %) | | | 0.30 | % | | | 28.34 | % |
| Ratios/Supplemental Data | |
| Net assets, end of period (in thousands) | | $ | 4,281 | | | $ | 4,762 | | | $ | 5,173 | | | $ | 8,527 | | | $ | 5,885 | |
| Ratios to average net assets: | |
| Net investment income (loss) | | | (0.60 | %) | | | (0.64 | %) | | | (0.65 | %) | | | (0.87 | %) | | | (0.75 | %) |
Total expensesd | | | 2.71 | % | | | 3.04 | % | | | 2.72 | % | | | 2.51 | % | | | 2.58 | % |
Net expensese,f | | | 2.07 | %h | | | 2.07 | %h | | | 2.08 | %h | | | 2.07 | %h | | | 2.05 | % |
| Portfolio turnover rate | | | 48 | % | | | 64 | % | | | 62 | % | | | 45 | % | | | 34 | % |
| SEE NOTES TO FINANCIAL STATEMENTS. | THE GUGGENHEIM FUNDS ANNUAL REPORT | 69 |
FINANCIAL HIGHLIGHTS (continued) |
This table is presented to show selected data for a share outstanding throughout each period and to assist shareholders in evaluating a Fund’s performance for the periods presented.
| P-Class | | Year Ended
September 30,
2017 | | | Year Ended
September 30,
2016 | | | Period Ended
September 30,
2015g | |
| Per Share Data | | | | | | | | | |
| Net asset value, beginning of period | | $ | 13.60 | | | $ | 12.77 | | | $ | 14.33 | |
| Income (loss) from investment operations: | |
Net investment income (loss)a | | | .01 | | | | .02 | | | | .04 | |
| Net gain (loss) on investments (realized and unrealized) | | | 2.22 | | | | 1.80 | | | | (1.60 | ) |
| Total from investment operations | | | 2.23 | | | | 1.82 | | | | (1.56 | ) |
| Less distributions from: | |
| Net investment income | | | (.07 | ) | | | — | | | | — | |
| Net realized gains | | | — | | | | (.99 | ) | | | — | |
| Total distributions | | | (.07 | ) | | | (.99 | ) | | | — | |
| Net asset value, end of period | | $ | 15.76 | | | $ | 13.60 | | | $ | 12.77 | |
| | |
Total Returnc | | | 16.35 | % | | | 14.88 | % | | | (10.82 | %) |
| Ratios/Supplemental Data | |
| Net assets, end of period (in thousands) | | $ | 14 | | | $ | 11 | | | $ | 9 | |
| Ratios to average net assets: | |
| Net investment income (loss) | | | 0.09 | % | | | 0.13 | % | | | 0.60 | % |
Total expensesd | | | 3.60 | % | | | 2.50 | % | | | 4.04 | % |
Net expensese,f,h | | | 1.32 | % | | | 1.32 | % | | | 1.31 | % |
| Portfolio turnover rate | | | 48 | % | | | 64 | % | | | 62 | % |
70 | THE GUGGENHEIM FUNDS ANNUAL REPORT | SEE NOTES TO FINANCIAL STATEMENTS. |
FINANCIAL HIGHLIGHTS (concluded) |
This table is presented to show selected data for a share outstanding throughout each period and to assist shareholders in evaluating a Fund’s performance for the periods presented.
| Institutional Class | | Year Ended
September 30,
2017 | | | Year Ended
September 30,
2016 | | | Year Ended
September 30,
2015 | | | Year Ended
September 30,
2014 | | | Year Ended
September 30,
2013 | |
| Per Share Data | | | | | | | | | | | | | | | |
| Net asset value, beginning of period | | $ | 12.54 | | | $ | 11.82 | | | $ | 17.04 | | | $ | 18.04 | | | $ | 15.21 | |
| Income (loss) from investment operations: | |
Net investment income (loss)a | | | .04 | | | | .04 | | | | .05 | | | | .01 | | | | .04 | |
| Net gain (loss) on investments (realized and unrealized) | | | 2.04 | | | | 1.67 | | | | (.49 | ) | | | .25 | | | | 4.10 | |
| Total from investment operations | | | 2.08 | | | | 1.71 | | | | (.44 | ) | | | .26 | | | | 4.14 | |
| Less distributions from: | |
| Net investment income | | | (.12 | ) | | | — | | | | (1.41 | ) | | | (.07 | ) | | | (.04 | ) |
| Net realized gains | | | — | | | | (.99 | ) | | | (3.37 | ) | | | (1.19 | ) | | | (1.27 | ) |
| Total distributions | | | (.12 | ) | | | (.99 | ) | | | (4.78 | ) | | | (1.26 | ) | | | (1.31 | ) |
| Net asset value, end of period | | $ | 14.50 | | | $ | 12.54 | | | $ | 11.82 | | | $ | 17.04 | | | $ | 18.04 | |
| | |
Total Returnc | | | 16.65 | % | | | 15.18 | % | | | (5.01 | %) | | | 1.21 | % | | | 29.74 | % |
| Ratios/Supplemental Data | |
| Net assets, end of period (in thousands) | | $ | 4,790 | | | $ | 281 | | | $ | 459 | | | $ | 753 | | | $ | 22,315 | |
| Ratios to average net assets: | |
| Net investment income (loss) | | | 0.30 | % | | | 0.30 | % | | | 0.33 | % | | | 0.05 | % | | | 0.23 | % |
Total expensesd | | | 1.56 | % | | | 2.09 | % | | | 1.70 | % | | | 1.33 | % | | | 1.34 | % |
Net expensese,f | | | 1.07 | %h | | | 1.07 | %h | | | 1.07 | %h | | | 1.07 | %h | | | 1.05 | % |
| Portfolio turnover rate | | | 48 | % | | | 64 | % | | | 62 | % | | | 45 | % | | | 34 | % |
a | Net investment income (loss) per share was computed using average shares outstanding throughout the period. |
b | Net investment income is less than $0.01 per share. |
c | Total return does not reflect the impact of any applicable sales charges. |
d | Does not include expenses of the underlying funds in which the Fund invests. |
e | Net expense information reflects the expense ratios after expense waivers and reimbursements, on applicable. |
f | The portion of the ratios of net expenses to average net assets attributable to recoupments of prior fee reductions or expense reimbursements is 0.00% for A-Class, 0.01% for C-Class, 0.74% for P-Class, and 0.00% for Institutional Class. |
g | Since commencement of operations: May 1, 2015. Percentage amounts for the period, except total return and portfolio turnover rate, have been annualized. |
h | Net expenses may include expenses that are excluded from the expense limitation agreement. Excluding these expenses, the operating expense ratios for the periods presented would be: |
| | | 09/30/17 | 09/30/16 | 09/30/15 | 09/30/14 |
| | A-Class | 1.30% | 1.30% | 1.30% | 1.30% |
| | C-Class | 2.05% | 2.05% | 2.05% | 2.05% |
| | P-Class | 1.30% | 1.30% | 1.30% | — |
| | Institutional Class | 1.05% | 1.05% | 1.05% | 1.05% |
| SEE NOTES TO FINANCIAL STATEMENTS. | THE GUGGENHEIM FUNDS ANNUAL REPORT | 71 |
MANAGERS’ COMMENTARY (Unaudited) | September 30, 2017 |
To Our Shareholders:
Guggenheim StylePlusTM—Large Core Fund (the “Fund”) is managed by a team of seasoned professionals, including Farhan Sharaff, Senior Managing Director and Assistant Chief Investment Officer, Equities; Jayson Flowers, Senior Managing Director and Portfolio Manager; Scott Hammond, Managing Director and Senior Portfolio Manager; and Qi Yan, Managing Director and Senior Portfolio Manager. In the following paragraphs, the investment team discusses performance for the fiscal year ended September 30, 2017.
For the year ended September 30, 2017, Guggenheim StylePlus—Large Core Fund returned 18.58%1, compared with the 18.61% return of its benchmark, the S&P 500 Index.
Investment Approach
Through a combination of actively managed individual equity, passive equity, and actively managed fixed income, the Fund seeks to exceed the total return of the S&P 500 Index. The actively managed equity and fixed income components seek to provide multiple sources of outperformance and take advantage of Guggenheim’s competencies in both fixed income and systematic stock selection.
The active and passive decisions seek to add value by tactically allocating to actively managed equity through quantitative selection models when stock picking opportunities are high. During periods when Guggenheim views these opportunities to be less attractive, the Fund seeks to increase its passive exposure to equities and the allocation to fixed-income securities. The prospective return during such periods is the equity index plus an “alpha” component coming from the yield of the fixed-income overlay.
Performance Review
Over the period, from 15-20% of the total equity position was allocated to actively managed equity and 80-85% to passive equity. Remaining Fund assets were invested in the Guggenheim Strategy Funds, short-term fixed-income investment companies advised by Guggenheim Investments, whose objective is to seek a high level of income consistent with the preservation of capital.
The Fund performed in-line with the S&P 500 Index for the one-year period ended September 30, 2017. The fixed income sleeve was the largest contributor, as positions in ABS, investment-grade corporates, and NA RMBS constituted the majority of the fixed income sleeve’s total return. The actively managed equity sleeve detracted from performance. The passive equity position, maintained through swap agreements and futures contracts, contributed to performance for the period.
When compared with the index, the total equity position (actively managed individual equity plus passive equity derivatives) was most overweight the Industrials and Consumer Staples sectors and most underweight the Financials and Consumer Discretionary sectors.
Performance displayed represents past performance which is no guarantee of future results.
1 | Performance figures are based on Class A shares and do not reflect taxes that a shareholder would pay on distributions or the redemption of shares. |
The opinions and forecast expressed may not actually come to pass. This information is subject to change at any time, based on market and other conditions, and should not be construed as a recommendation of any specific security or strategy.
| 72 | THE GUGGENHEIM FUNDS ANNUAL REPORT | |
PERFORMANCE REPORT AND FUND PROFILE (Unaudited) | September 30, 2017 |
STYLEPLUS—LARGE CORE FUND
OBJECTIVE: Seeks long-term growth of capital.
Holdings Diversification (Market Exposure as % of Net Assets)
“Holdings Diversification (Market Exposure as % of Net Assets)” excludes any temporary cash investments.
| Inception Dates: |
| A-Class | September 10, 1962 |
| C-Class | January 29, 1999 |
| P-Class | May 1, 2015 |
| Institutional Class | March 1, 2012 |
| Ten Largest Holdings (% of Total Net Assets) |
| Guggenheim Strategy Fund III | 32.3% |
| Guggenheim Strategy Fund II | 28.6% |
| Guggenheim Strategy Fund I | 9.4% |
| Guggenheim Limited Duration Fund - Institutional Class | 7.6% |
| Apple, Inc. | 0.6% |
| Cisco Systems, Inc. | 0.3% |
| Microsoft Corp. | 0.3% |
| Pfizer, Inc. | 0.3% |
| Alphabet, Inc. — Class C | 0.3% |
| Verizon Communications, Inc. | 0.3% |
| Top Ten Total | 80.0% |
| “Ten Largest Holdings” excludes any temporary cash or derivative investments. |
| | THE GUGGENHEIM FUNDS ANNUAL REPORT | 73 |
PERFORMANCE REPORT AND FUND PROFILE (Unaudited)(concluded) | September 30, 2017 |
Cumulative Fund Performance*
Average Annual Returns*
Periods Ended September 30, 2017
| | 1 Year | 5 Year | 10 Year |
| A-Class Shares | 18.58% | 13.74% | 5.89% |
A-Class Shares with sales charge‡ | 12.95% | 12.64% | 5.26% |
| C-Class Shares | 17.59% | 12.68% | 5.01% |
C-Class Shares with CDSC§ | 16.59% | 12.68% | 5.01% |
| S&P 500 Index | 18.61% | 14.22% | 7.44% |
| | | 1 Year | Since Inception
(05/01/15) |
| P-Class Shares | | 18.43% | 9.86% |
| S&P 500 Index | | 18.61% | 9.98% |
| | 1 Year | 5 Year | Since Inception
(03/01/12) |
| Institutional Class Shares | 18.96% | 14.02% | 12.88% |
| S&P 500 Index | 18.61% | 14.22% | 13.86% |
| * | The performance data above represents past performance that is not predictive of future results. The investment return and principal value of an investment in the Fund will fluctuate so that an investor’s shares, when redeemed, may be worth more or less than their original cost. Returns are historical and include changes in principal and reinvested dividends and capital gains and do not reflect the effect of taxes. The S&P 500 Index is an unmanaged index and, unlike the Fund, has no management fees or operating expenses to reduce its reported return. The graph is based on A-Class shares only; performance for C-Class, P-Class and Institutional Class will vary due to differences in fee structures. |
‡ | Effective February 22, 2011, the maximum sales charge decreased from 5.75% to 4.75%. A 5.75% maximum sales charge is used in the calculation of the 10 Year average annual returns (based on subscriptions made prior to February 22, 2011), and a 4.75% maximum sales charge will be used to calculate performance for periods based on subscriptions made on or after February 22, 2011. |
§ | Fund returns include a CDSC of 1% if redeemed within 12 months of purchase. |
| 74 | THE GUGGENHEIM FUNDS ANNUAL REPORT | |
| SCHEDULE OF INVESTMENTS | September 30, 2017 |
| STYLEPLUS—LARGE CORE FUND | |
| | | Shares | | | Value | |
| | | | | | | |
COMMON STOCKS† - 17.9% | |
| | | | | | | |
| Consumer, Non-cyclical - 5.7% | |
| Pfizer, Inc. | | | 20,281 | | | $ | 724,031 | |
| Abbott Laboratories | | | 10,979 | | | | 585,839 | |
| Merck & Company, Inc. | | | 8,113 | | | | 519,475 | |
| Amgen, Inc. | | | 2,542 | | | | 473,956 | |
| Sysco Corp. | | | 8,400 | | | | 453,180 | |
| Archer-Daniels-Midland Co. | | | 10,414 | | | | 442,699 | |
| UnitedHealth Group, Inc. | | | 2,204 | | | | 431,654 | |
| Cardinal Health, Inc. | | | 6,340 | | | | 424,273 | |
| JM Smucker Co. | | | 3,852 | | | | 404,190 | |
| Tyson Foods, Inc. — Class A | | | 5,341 | | | | 376,273 | |
| Cigna Corp. | | | 1,978 | | | | 369,767 | |
| Anthem, Inc. | | | 1,893 | | | | 359,443 | |
| Kroger Co. | | | 17,714 | | | | 355,343 | |
| Gilead Sciences, Inc. | | | 4,362 | | | | 353,409 | |
| McKesson Corp. | | | 2,227 | | | | 342,089 | |
| General Mills, Inc. | | | 6,592 | | | | 341,202 | |
| United Rentals, Inc.* | | | 2,365 | | | | 328,120 | |
| Humana, Inc. | | | 1,336 | | | | 325,490 | |
| Aetna, Inc. | | | 2,024 | | | | 321,836 | |
| Nielsen Holdings plc | | | 7,491 | | | | 310,502 | |
| Mylan N.V.* | | | 9,673 | | | | 303,442 | |
| HCA Healthcare, Inc.* | | | 3,753 | | | | 298,701 | |
| Johnson & Johnson | | | 2,110 | | | | 274,321 | |
| Altria Group, Inc. | | | 3,983 | | | | 252,602 | |
| Procter & Gamble Co. | | | 2,582 | | | | 234,910 | |
| Express Scripts Holding Co.* | | | 3,362 | | | | 212,882 | |
| Mondelez International, Inc. — Class A | | | 5,172 | | | | 210,294 | |
| AbbVie, Inc. | | | 2,153 | | | | 191,316 | |
| Kimberly-Clark Corp. | | | 1,615 | | | | 190,053 | |
| Zimmer Biomet Holdings, Inc. | | | 1,608 | | | | 188,281 | |
| Eli Lilly & Co. | | | 2,194 | | | | 187,675 | |
| Western Union Co. | | | 9,254 | | | | 177,677 | |
| AmerisourceBergen Corp. — Class A | | | 2,104 | | | | 174,106 | |
| Conagra Brands, Inc. | | | 4,803 | | | | 162,053 | |
| Centene Corp.* | | | 1,660 | | | | 160,638 | |
| DaVita, Inc.* | | | 2,485 | | | | 147,584 | |
| Kraft Heinz Co. | | | 1,733 | | | | 134,394 | |
| PepsiCo, Inc. | | | 1,184 | | | | 131,933 | |
| Medtronic plc | | | 1,584 | | | | 123,188 | |
| Molson Coors Brewing Co. — Class B | | | 1,472 | | | | 120,174 | |
| Colgate-Palmolive Co. | | | 1,643 | | | | 119,693 | |
| Total Consumer, Non-cyclical | | | | | | | 12,238,688 | |
| | | | | | | | | |
| Technology - 2.5% | |
| Apple, Inc. | | | 8,272 | | | | 1,274,882 | |
| Microsoft Corp. | | | 9,828 | | | | 732,087 | |
| Intel Corp. | | | 14,501 | | | | 552,198 | |
| International Business Machines Corp. | | | 3,501 | | | | 507,926 | |
| HP, Inc. | | | 22,615 | | | | 451,395 | |
| Oracle Corp. | | | 8,102 | | | | 391,732 | |
| NetApp, Inc. | | | 8,457 | | | | 370,078 | |
| Western Digital Corp. | | | 3,958 | | | | 341,971 | |
| Applied Materials, Inc. | | | 4,854 | | | | 252,845 | |
| QUALCOMM, Inc. | | | 2,947 | | | | 152,772 | |
| Seagate Technology plc | | | 3,730 | | | | 123,724 | |
| CA, Inc. | | | 3,571 | | | | 119,200 | |
| Broadcom Ltd. | | | 461 | | | | 111,811 | |
| Total Technology | | | | | | | 5,382,621 | |
| | | | | | | | | |
| Industrial - 2.4% | |
| United Technologies Corp. | | | 4,723 | | | | 548,246 | |
| Caterpillar, Inc. | | | 3,956 | | | | 493,353 | |
| Johnson Controls International plc | | | 10,960 | | | | 441,578 | |
| Republic Services, Inc. — Class A | | | 6,414 | | | | 423,708 | |
| FedEx Corp. | | | 1,691 | | | | 381,456 | |
| Norfolk Southern Corp. | | | 2,703 | | | | 357,445 | |
| Stericycle, Inc.* | | | 4,743 | | | | 339,694 | |
| Fluor Corp. | | | 7,952 | | | | 334,779 | |
| Ingersoll-Rand plc | | | 3,156 | | | | 281,421 | |
| Textron, Inc. | | | 5,196 | | | | 279,960 | |
| Jacobs Engineering Group, Inc. | | | 4,715 | | | | 274,743 | |
| Waste Management, Inc. | | | 3,468 | | | | 271,440 | |
| Cummins, Inc. | | | 1,411 | | | | 237,091 | |
| Corning, Inc. | | | 6,461 | | | | 193,313 | |
| Eaton Corporation plc | | | 1,708 | | | | 131,157 | |
| Deere & Co. | | | 1,004 | | | | 126,092 | |
| General Electric Co. | | | 4,703 | | | | 113,719 | |
| Total Industrial | | | | | | | 5,229,195 | |
| | | | | | | | | |
| Communications - 2.2% | |
| Cisco Systems, Inc. | | | 21,820 | | | | 733,807 | |
| Alphabet, Inc. — Class C* | | | 730 | | | | 700,150 | |
| Verizon Communications, Inc. | | | 13,950 | | | | 690,386 | |
| Amazon.com, Inc.* | | | 583 | | | | 560,467 | |
| AT&T, Inc. | | | 11,820 | | | | 462,989 | |
| Omnicom Group, Inc. | | | 5,755 | | | | 426,273 | |
| Facebook, Inc. — Class A* | | | 2,093 | | | | 357,631 | |
| Juniper Networks, Inc. | | | 6,933 | | | | 192,945 | |
| Comcast Corp. — Class A | | | 4,668 | | | | 179,625 | |
| Netflix, Inc.* | | | 980 | | | | 177,723 | |
| Expedia, Inc. | | | 953 | | | | 137,175 | |
| Viacom, Inc. — Class B | | | 4,491 | | | | 125,029 | |
| Total Communications | | | | | | | 4,744,200 | |
| | | | | | | | | |
| Consumer, Cyclical - 1.9% | |
| CVS Health Corp. | | | 8,078 | | | | 656,904 | |
| Wal-Mart Stores, Inc. | | | 6,382 | | | | 498,689 | |
| Ford Motor Co. | | | 38,343 | | | | 458,966 | |
| Walgreens Boots Alliance, Inc. | | | 5,461 | | | | 421,698 | |
| General Motors Co. | | | 9,395 | | | | 379,370 | |
| American Airlines Group, Inc. | | | 5,055 | | | | 240,061 | |
| Ralph Lauren Corp. — Class A | | | 2,680 | | | | 236,617 | |
| Southwest Airlines Co. | | | 4,202 | | | | 235,228 | |
| United Continental Holdings, Inc.* | | | 3,668 | | | | 223,308 | |
| Delta Air Lines, Inc. | | | 4,586 | | | | 221,137 | |
| Alaska Air Group, Inc. | | | 2,328 | | | | 177,557 | |
| Lowe’s Companies, Inc. | | | 1,455 | | | | 116,313 | |
| Home Depot, Inc. | | | 700 | | | | 114,492 | |
| Total Consumer, Cyclical | | | | | | | 3,980,340 | |
| SEE NOTES TO FINANCIAL STATEMENTS. | THE GUGGENHEIM FUNDS ANNUAL REPORT | 75 |
SCHEDULE OF INVESTMENTS (continued) | September 30, 2017 |
| STYLEPLUS—LARGE CORE FUND | |
| | | Shares | | | Value | |
| | | | | | | |
| Financial - 1.8% | |
| JPMorgan Chase & Co. | | | 5,851 | | | $ | 558,828 | |
| Prudential Financial, Inc. | | | 4,635 | | | | 492,794 | |
| Aflac, Inc. | | | 5,567 | | | | 453,098 | |
| Principal Financial Group, Inc. | | | 6,580 | | | | 423,357 | |
| Capital One Financial Corp. | | | 3,839 | | | | 325,010 | |
| Alliance Data Systems Corp. | | | 1,306 | | | | 289,344 | |
| Berkshire Hathaway, Inc. — Class B* | | | 1,367 | | | | 250,598 | |
| Lincoln National Corp. | | | 2,824 | | | | 207,508 | |
| Northern Trust Corp. | | | 1,725 | | | | 158,579 | |
| Charles Schwab Corp. | | | 2,914 | | | | 127,458 | |
| Discover Financial Services | | | 1,937 | | | | 124,898 | |
| Citigroup, Inc. | | | 1,705 | | | | 124,022 | |
| Wells Fargo & Co. | | | 2,210 | | | | 121,882 | |
| Bank of America Corp. | | | 4,614 | | | | 116,919 | |
| Total Financial | | | | | | | 3,774,295 | |
| | | | | | | | | |
| Energy - 0.9% | |
| ConocoPhillips | | | 11,121 | | | | 556,607 | |
| Anadarko Petroleum Corp. | | | 10,022 | | | | 489,575 | |
| Exxon Mobil Corp. | | | 4,476 | | | | 366,942 | |
| Marathon Oil Corp. | | | 22,725 | | | | 308,151 | |
| Noble Energy, Inc. | | | 4,892 | | | | 138,737 | |
| Valero Energy Corp. | | | 1,708 | | | | 131,396 | |
| Total Energy | | | | | | | 1,991,408 | |
| | | | | | | | | |
| Utilities - 0.4% | |
| FirstEnergy Corp. | | | 12,615 | | | | 388,921 | |
| American Electric Power Company, Inc. | | | 3,460 | | | | 243,030 | |
| Public Service Enterprise Group, Inc. | | | 4,179 | | | | 193,279 | |
| Total Utilities | | | | | | | 825,230 | |
| | | | | | | | | |
| Basic Materials - 0.1% | |
| DowDuPont, Inc. | | | 3,411 | | | | 236,144 | |
| | | | | | | | | |
| Total Common Stocks | | | | | | | | |
| (Cost $36,074,676) | | | | | | | 38,402,121 | |
| | | | | | | | | |
MUTUAL FUNDS† - 77.8% | |
Guggenheim Strategy Fund III1 | | | 2,763,471 | | | | 69,197,325 | |
Guggenheim Strategy Fund II1 | | | 2,451,254 | | | | 61,428,415 | |
Guggenheim Strategy Fund I1 | | | 803,810 | | | | 20,183,661 | |
Guggenheim Limited Duration Fund - Institutional Class1 | | | 654,936 | | | | 16,275,156 | |
| Total Mutual Funds | | | | | | | | |
| (Cost $165,811,494) | | | | | | | 167,084,557 | |
| | | | | | | | | |
MONEY MARKET FUND† - 3.9% | |
Dreyfus Treasury Securities Cash Management Fund - Institutional Class 0.90%2 | | | 8,267,908 | | | | 8,267,908 | |
| Total Money Market Fund | | | | | | | | |
| (Cost $8,267,908) | | | | | | | 8,267,908 | |
| | | | | | | | | |
| Total Investments - 99.6% | | | | | | | | |
| (Cost $210,154,078) | | | | | | $ | 213,754,586 | |
| Other Assets & Liabilities, net - 0.4% | | | | | | | 793,207 | |
| Total Net Assets - 100.0% | | | | | | $ | 214,547,793 | |
| Futures Contracts | |
| Description | | Contracts | | Expiration
Date | | Notional
Amount | | | Unrealized
Gain | |
Equity Futures Contracts Purchased† | | | | | | | | | | |
| S&P 500 Index Mini Futures Contracts | | | 17 | | Dec 2017 | | $ | 2,138,175 | | | $ | 25,140 | |
| Total Return Swap Agreements | |
| Counterparty | Index | | Financing
Rate Pay
(Receive) | | Payment
Frequency | Maturity
Date | | Units | | | Notional
Value | | | Unrealized
Gain | |
OTC Equity Index Swap Agreements†† | | | | | | | | | | | | |
| Deutsche Bank | S&P 500 Index | | | 1.61 | % | At Maturity | 09/06/18 | | | 35,878 | | | $ | 175,365,324 | | | $ | 3,603,841 | |
| * | Non-income producing security. |
† | Value determined based on Level 1 inputs — See Note 4. |
†† | Value determined based on Level 2 inputs — See Note 4. |
1 | Affiliated issuer. |
2 | Rate indicated is the 7 day yield as of September 30, 2017. |
| | plc — Public Limited Company |
| | |
| | See Sector Classification in Other Information section. |
76 | THE GUGGENHEIM FUNDS ANNUAL REPORT | SEE NOTES TO FINANCIAL STATEMENTS. |
SCHEDULE OF INVESTMENTS (concluded) | September 30, 2017 |
| STYLEPLUS—LARGE CORE FUND | |
The following table summarizes the inputs used to value the Fund’s investments at September 30, 2017 (See Note 4 in the Notes to Financial Statements):
| Investments in Securities (Assets) | | Level 1
Quoted
Prices | | | Level 1 -
Other* | | | Level 2 Significant Observable Inputs | | | Level 2 -
Other* | | | Level 3 Significant Unobservable Inputs | | | Total | |
| Common Stocks | | $ | 38,402,121 | | | $ | — | | | $ | — | | | $ | — | | | $ | — | | | $ | 38,402,121 | |
| Equity Futures Contracts | | | — | | | | 25,140 | | | | — | | | | — | | | | — | | | | 25,140 | |
| Equity Index Swap Agreements | | | — | | | | — | | | | — | | | | 3,603,841 | | | | — | | | | 3,603,841 | |
| Money Market Fund | | | 8,267,908 | | | | — | | | | — | | | | — | | | | — | | | | 8,267,908 | |
| Mutual Funds | | | 167,084,557 | | | | — | | | | — | | | | — | | | | — | | | | 167,084,557 | |
| Total Assets | | $ | 213,754,586 | | | $ | 25,140 | | | $ | — | | | $ | 3,603,841 | | | $ | — | | | $ | 217,383,567 | |
| * | Other financial instruments include futures contracts and/or swaps, which are reported as unrealized gain/loss at period end. |
Transfers between investment levels may occur as the markets fluctuate and/or the availability of data used in an investment’s valuation changes. Transfers between valuation levels, if any, are in comparison to the valuation levels at the end of the previous fiscal year, and are effective using the fair value as of the end of the current fiscal period.
For the year ended September 30, 2017, there were no transfers between levels.
Affiliated Transactions
Investments representing 5% or more of the outstanding voting shares of a portfolio company of a fund, or control of or by, or common control under GI, result in that portfolio company being considered an affiliated company of such fund, as defined in the 1940 Act.
The Fund may invest in the Guggenheim Strategy Funds Trust consisting of Guggenheim Strategy Fund I, Guggenheim Strategy Fund II, Guggenheim Strategy Fund III, and Guggenheim Variable Insurance Strategy Fund III (collectively, the “Cash Management Funds”), open-end management investment companies managed by GI. The Cash Management Funds, which launched on March 11, 2014, are offered as cash management options only to mutual funds, trusts, and other accounts managed by GI and/or its affiliates, and are not available to the public. The Cash Management Funds pay no investment management fees. The Cash Management Funds’ annual report on Form N-CSR dated September 30, 2016, is available publicly or upon request. This information is available from the EDGAR database on the SEC’s website at https://www.sec.gov/Archives/edgar/data/1601445/000089180416001923/gug65857-ncsr.htm.
Transactions during the year ended September 30, 2017, in which the portfolio company is an “affiliated person”, were as follows:
| Security Name | | Value
09/30/16 | | | Additions | | | Reductions | | | Realized Gain (Loss) | | | Change in Unrealized | | | Value
09/30/17 | | | Shares 09/30/17 | | | Investment Income | | | Capital
Gain
Distributions | |
| Guggenheim Limited Duration Fund - Institutional Class | | $ | 15,768,627 | | | $ | 415,440 | | | $ | — | | | $ | — | | | $ | 91,089 | | | $ | 16,275,156 | | | | 654,936 | | | $ | 415,159 | | | $ | 2,771 | |
| Guggenheim Strategy Fund I | | | 23,831,360 | | | | 399,281 | | | | (4,154,121 | ) | | | 31,496 | | | | 75,645 | | | | 20,183,661 | | | | 803,810 | | | | 399,789 | | | | — | |
| Guggenheim Strategy Fund II | | | 49,693,469 | | | | 11,458,243 | | | �� | — | | | | — | | | | 276,703 | | | | 61,428,415 | | | | 2,451,254 | | | | 1,327,297 | | | | — | |
| Guggenheim Strategy Fund III | | | 67,119,862 | | | | 1,913,377 | | | | — | | | | — | | | | 164,086 | | | | 69,197,325 | | | | 2,763,471 | | | | 1,917,875 | | | | — | |
| | | $ | 156,413,318 | | | $ | 14,186,341 | | | $ | (4,154,121 | ) | | $ | 31,496 | | | $ | 607,523 | | | $ | 167,084,557 | | | | | | | $ | 4,060,120 | | | $ | 2,771 | |
| SEE NOTES TO FINANCIAL STATEMENTS. | THE GUGGENHEIM FUNDS ANNUAL REPORT | 77 |
| STYLEPLUS—LARGE CORE FUND | |
| STATEMENT OF ASSETS AND LIABILITIES |
| September 30, 2017 |
| Assets: | |
| Investments in unaffiliated issuers, at value (cost $44,342,584) | | $ | 46,670,029 | |
| Investments in affiliated issuers, at value (cost $165,811,494) | | | 167,084,557 | |
| Segregated cash with broker | | | 233,000 | |
| Unrealized appreciation on swap agreements | | | 3,603,841 | |
| Prepaid expenses | | | 46,470 | |
| Receivables: | |
| Dividends | | | 359,128 | |
| Variation margin | | | 6,630 | |
| Fund shares sold | | | 5,422 | |
| Interest | | | 4,921 | |
| Total assets | | | 218,013,998 | |
| | | | | |
| Liabilities: | |
| Overdraft due to custodian bank | | | 17,463 | |
| Segregated cash due to broker | | | 2,750,000 | |
| Payable for: | |
| Securities purchased | | | 329,368 | |
| Management fees | | | 124,763 | |
| Distribution and service fees | | | 43,846 | |
| Fund shares redeemed | | | 43,283 | |
| Transfer agent/maintenance fees | | | 40,538 | |
| Fund accounting/administration fees | | | 13,947 | |
| Trustees’ fees* | | | 10,044 | |
| Miscellaneous | | | 92,953 | |
| Total liabilities | | | 3,466,205 | |
| Net assets | | $ | 214,547,793 | |
| | | | | |
| Net assets consist of: | |
| Paid in capital | | $ | 172,975,394 | |
| Undistributed net investment income | | | 1,806,496 | |
| Accumulated net realized gain on investments | | | 32,536,414 | |
| Net unrealized appreciation on investments | | | 7,229,489 | |
| Net assets | | $ | 214,547,793 | |
| | | | | |
| A-Class: | |
| Net assets | | $ | 206,032,568 | |
| Capital shares outstanding | | | 8,165,908 | |
| Net asset value per share | | $ | 25.23 | |
| Maximum offering price per share (Net asset value divided by 95.25%) | | $ | 26.49 | |
| | | | | |
| C-Class: | |
| Net assets | | $ | 2,376,137 | |
| Capital shares outstanding | | | 120,372 | |
| Net asset value per share | | $ | 19.74 | |
| | | | | |
| P-Class: | |
| Net assets | | $ | 507,627 | |
| Capital shares outstanding | | | 20,284 | |
| Net asset value per share | | $ | 25.03 | |
| | | | | |
| Institutional Class: | |
| Net assets | | $ | 5,631,461 | |
| Capital shares outstanding | | | 224,062 | |
| Net asset value per share | | $ | 25.13 | |
| * | Relates to Trustees not deemed “interested persons” within the meaning of Section 2(a)(19) of the 1940 Act. |
78 | THE GUGGENHEIM FUNDS ANNUAL REPORT | SEE NOTES TO FINANCIAL STATEMENTS. |
| STYLEPLUS—LARGE CORE FUND | |
| STATEMENT OF OPERATIONS |
| Year Ended September 30, 2017 |
| Investment Income: | |
| Dividends from securities of unaffiliated issuers | | $ | 817,379 | |
| Dividends from securities of affiliated issuers | | | 4,060,120 | |
| Interest | | | 35,634 | |
| Total investment income | | | 4,913,133 | |
| | | | | |
| Expenses: | |
| Management fees | | | 1,549,097 | |
| Distribution and service fees: | |
| A-Class | | | 496,076 | |
| C-Class | | | 26,583 | |
| P-Class | | | 1,290 | |
| Transfer agent/maintenance fees: | |
| A-Class | | | 202,063 | |
| C-Class | | | 5,627 | |
| P-Class | | | 966 | |
| Institutional Class | | | 648 | |
| Fund accounting/administration fees | | | 165,560 | |
| Line of credit fees | | | 30,560 | |
| Trustees’ fees* | | | 12,783 | |
| Custodian fees | | | 10,990 | |
| Tax expense | | | 7,142 | |
| Miscellaneous | | | 344,991 | |
| Total expenses | | | 2,854,376 | |
| Less: | |
| Expenses waived by Adviser | | | (70,828 | ) |
| Net expenses | | | 2,783,548 | |
| Net investment income | | | 2,129,585 | |
| | | | | |
| Net Realized and Unrealized Gain (Loss): | |
| Net realized gain (loss) on: | |
| Investments in unaffiliated issuers | | | 4,060,229 | |
| Investments in affiliated issuers | | | 31,496 | |
| Realized gain distributions received from investment company shares | | | 2,771 | |
| Swap agreements | | | 29,340,118 | |
| Futures contracts | | | 382,623 | |
| Net realized gain | | | 33,817,237 | |
| Net change in unrealized appreciation (depreciation) on: | |
| Investments in unaffiliated issuers | | | 787,720 | |
| Investments in affiliated issuers | | | 607,523 | |
| Swap agreements | | | (2,120,902 | ) |
| Futures contracts | | | (14,693 | ) |
| Net change in unrealized appreciation (depreciation) | | | (740,352 | ) |
| Net realized and unrealized gain | | | 33,076,885 | |
| Net increase in net assets resulting from operations | | $ | 35,206,470 | |
| * | Relates to Trustees not deemed “interested persons” within the meaning of Section 2(a)(19) of the 1940 Act. |
| SEE NOTES TO FINANCIAL STATEMENTS. | THE GUGGENHEIM FUNDS ANNUAL REPORT | 79 |
| STYLEPLUS—LARGE CORE FUND | |
| STATEMENTS OF CHANGES IN NET ASSETS |
| | | Year Ended
September 30,
2017 | | | Year Ended
September 30,
2016 | |
| Increase (Decrease) in Net Assets from Operations: | | | | | | |
| Net investment income | | $ | 2,129,585 | | | $ | 1,478,222 | |
| Net realized gain on investments | | | 33,817,237 | | | | 4,857,319 | |
| Net change in unrealized appreciation (depreciation) on investments | | | (740,352 | ) | | | 21,789,542 | |
| Net increase in net assets resulting from operations | | | 35,206,470 | | | | 28,125,083 | |
| | | | | | | | | |
| Distributions to shareholders from: | | | | | | | | |
| Net investment income | | | | | | | | |
| A-Class | | | (1,414,912 | ) | | | (1,021,091 | ) |
| P-Class | | | (3,434 | ) | | | (120 | ) |
| Institutional Class | | | (47,453 | ) | | | (18,603 | ) |
| Net realized gains | | | | | | | | |
| A-Class | | | (3,716,323 | ) | | | (19,593,831 | ) |
| C-Class | | | (65,682 | ) | | | (390,350 | ) |
| P-Class | | | (7,548 | ) | | | (1,552 | ) |
| Institutional Class | | | (86,390 | ) | | | (208,131 | ) |
| Total distributions to shareholders | | | (5,341,742 | ) | | | (21,233,678 | ) |
| | | | | | | | | |
| Capital share transactions: | | | | | | | | |
| Proceeds from sale of shares | | | | | | | | |
| A-Class | | | 11,047,318 | | | | 10,388,479 | |
| C-Class | | | 660,113 | | | | 970,129 | |
| P-Class | | | 384,046 | | | | 400,232 | |
| Institutional Class | | | 1,495,515 | | | | 5,594,239 | |
| Distributions reinvested | | | | | | | | |
| A-Class | | | 4,827,591 | | | | 19,338,091 | |
| C-Class | | | 63,911 | | | | 381,661 | |
| P-Class | | | 10,982 | | | | 1,672 | |
| Institutional Class | | | 133,180 | | | | 225,550 | |
| Cost of shares redeemed | | | | | | | | |
| A-Class | | | (27,532,534 | ) | | | (25,363,728 | ) |
| C-Class | | | (1,359,150 | ) | | | (1,501,528 | ) |
| P-Class | | | (364,348 | ) | | | (46,532 | ) |
| Institutional Class | | | (964,398 | ) | | | (1,831,412 | ) |
| Net increase (decrease) from capital share transactions | | | (11,597,774 | ) | | | 8,556,853 | |
| Net increase in net assets | | | 18,266,954 | | | | 15,448,258 | |
| | | | | | | | | |
| Net assets: | | | | | | | | |
| Beginning of year | | | 196,280,839 | | | | 180,832,581 | |
| End of year | | $ | 214,547,793 | | | $ | 196,280,839 | |
| Undistributed net investment income at end of year | | $ | 1,806,496 | | | $ | 1,127,190 | |
80 | THE GUGGENHEIM FUNDS ANNUAL REPORT | SEE NOTES TO FINANCIAL STATEMENTS. |
| STYLEPLUS—LARGE CORE FUND | |
| STATEMENTS OF CHANGES IN NET ASSETS |
| | | Year Ended
September 30,
2017 | | | Year Ended
September 30,
2016 | |
| Capital share activity: | | | | | | |
| Shares sold | | | | | | |
| A-Class | | | 482,212 | | | | 494,691 | |
| C-Class | | | 36,211 | | | | 59,504 | |
| P-Class | | | 16,486 | | | | 20,095 | |
| Institutional Class | | | 64,115 | | | | 266,874 | |
| Shares issued from reinvestment of distributions | | | | | | | | |
| A-Class | | | 223,506 | | | | 960,661 | |
| C-Class | | | 3,755 | | | | 23,881 | |
| P-Class | | | 513 | | | | 83 | |
| Institutional Class | | | 6,203 | | | | 11,274 | |
| Shares redeemed | | | | | | | | |
| A-Class | | | (1,183,096 | ) | | | (1,219,870 | ) |
| C-Class | | | (73,493 | ) | | | (90,686 | ) |
| P-Class | | | (15,340 | ) | | | (2,213 | ) |
| Institutional Class | | | (41,235 | ) | | | (97,608 | ) |
| Net increase (decrease) in shares | | | (480,163 | ) | | | 426,686 | |
| SEE NOTES TO FINANCIAL STATEMENTS. | THE GUGGENHEIM FUNDS ANNUAL REPORT | 81 |
| STYLEPLUS—LARGE CORE FUND | |
This table is presented to show selected data for a share outstanding throughout each period and to assist shareholders in evaluating a Fund’s performance for the periods presented.
| A-Class | | Year Ended
September 30,
2017 | | | Year Ended
September 30,
2016 | | | Year Ended
September 30,
2015 | | | Year Ended
September 30,
2014 | | | Year Ended
September 30,
2013 | |
| Per Share Data | | | | | | | | | | | | | | | |
| Net asset value, beginning of period | | $ | 21.86 | | | $ | 21.14 | | | $ | 24.53 | | | $ | 24.27 | | | $ | 21.25 | |
| Income (loss) from investment operations: | |
Net investment income (loss)a | | | .24 | | | | .16 | | | | .11 | | | | .20 | | | | .06 | |
| Net gain (loss) on investments (realized and unrealized) | | | 3.72 | | | | 3.04 | | | | (.12 | ) | | | 4.45 | | | | 3.04 | |
| Total from investment operations | | | 3.96 | | | | 3.20 | | | | (.01 | ) | | | 4.65 | | | | 3.10 | |
| Less distributions from: | |
| Net investment income | | | (.16 | ) | | | (.13 | ) | | | (.22 | ) | | | (.06 | ) | | | (.08 | ) |
| Net realized gains | | | (.43 | ) | | | (2.35 | ) | | | (3.16 | ) | | | (4.33 | ) | | | — | |
| Total distributions | | | (.59 | ) | | | (2.48 | ) | | | (3.38 | ) | | | (4.39 | ) | | | (.08 | ) |
| Net asset value, end of period | | $ | 25.23 | | | $ | 21.86 | | | $ | 21.14 | | | $ | 24.53 | | | $ | 24.27 | |
| | |
Total Returnb | | | 18.58 | % | | | 16.13 | % | | | (0.84 | %) | | | 21.59 | % | | | 14.64 | % |
| Ratios/Supplemental Data | |
| Net assets, end of period (in thousands) | | $ | 206,033 | | | $ | 188,979 | | | $ | 177,748 | | | $ | 192,850 | | | $ | 175,601 | |
| Ratios to average net assets: | |
| Net investment income (loss) | | | 1.03 | % | | | 0.79 | % | | | 0.48 | % | | | 0.86 | % | | | 0.26 | % |
Total expensesc | | | 1.38 | % | | | 1.33 | % | | | 1.32 | % | | | 1.41 | % | | | 1.37 | % |
Net expensesd | | | 1.34 | % | | | 1.31 | % | | | 1.32 | % | | | 1.39 | % | | | 1.37 | % |
| Portfolio turnover rate | | | 30 | % | | | 50 | % | | | 65 | % | | | 107 | % | | | 217 | % |
| C-Class | | Year Ended
September 30,
2017 | | | Year Ended
September 30,
2016 | | | Year Ended
September 30,
2015 | | | Year Ended
September 30,
2014 | | | Year Ended
September 30,
2013 | |
| Per Share Data | | | | | | | | | | | | | | | |
| Net asset value, beginning of period | | $ | 17.22 | | | $ | 17.17 | | | $ | 20.55 | | | $ | 21.12 | | | $ | 18.60 | |
| Income (loss) from investment operations: | |
Net investment income (loss)a | | | .03 | | | | (.02 | ) | | | (.08 | ) | | | (.02 | ) | | | (.15 | ) |
| Net gain (loss) on investments (realized and unrealized) | | | 2.92 | | | | 2.42 | | | | (.06 | ) | | | 3.78 | | | | 2.67 | |
| Total from investment operations | | | 2.95 | | | | 2.40 | | | | (.14 | ) | | | 3.76 | | | | 2.52 | |
| Less distributions from: | |
| Net investment income | | | — | | | | — | | | | (.08 | ) | | | — | | | | — | |
| Net realized gains | | | (.43 | ) | | | (2.35 | ) | | | (3.16 | ) | | | (4.33 | ) | | | — | |
| Total distributions | | | (.43 | ) | | | (2.35 | ) | | | (3.24 | ) | | | (4.33 | ) | | | — | |
| Net asset value, end of period | | $ | 19.74 | | | $ | 17.22 | | | $ | 17.17 | | | $ | 20.55 | | | $ | 21.12 | |
| | |
Total Returnb | | | 17.59 | % | | | 15.00 | % | | | (1.72 | %) | | | 20.40 | % | | | 13.55 | % |
| Ratios/Supplemental Data | |
| Net assets, end of period (in thousands) | | $ | 2,376 | | | $ | 2,650 | | | $ | 2,767 | | | $ | 3,042 | | | $ | 2,275 | |
| Ratios to average net assets: | |
| Net investment income (loss) | | | 0.19 | % | | | (0.14 | %) | | | (0.44 | %) | | | (0.08 | %) | | | (0.77 | %) |
Total expensesc | | | 2.23 | % | | | 2.27 | % | | | 2.25 | % | | | 2.36 | % | | | 2.34 | % |
Net expensesd | | | 2.20 | % | | | 2.25 | % | | | 2.25 | % | | | 2.34 | % | | | 2.34 | % |
| Portfolio turnover rate | | | 30 | % | | | 50 | % | | | 65 | % | | | 107 | % | | | 217 | % |
82 | THE GUGGENHEIM FUNDS ANNUAL REPORT | SEE NOTES TO FINANCIAL STATEMENTS. |
| STYLEPLUS—LARGE CORE FUND | |
FINANCIAL HIGHLIGHTS (continued) |
This table is presented to show selected data for a share outstanding throughout each period and to assist shareholders in evaluating a Fund’s performance for the periods presented.
| P-Class | | Year Ended
September 30,
2017 | | | Year Ended
September 30,
2016 | | | Period Ended
September 30,
2015e | |
| Per Share Data | | | | | | | | | |
| Net asset value, beginning of period | | $ | 21.75 | | | $ | 21.11 | | | $ | 23.12 | |
| Income (loss) from investment operations: | |
Net investment income (loss)a | | | .22 | | | | .21 | | | | .03 | |
| Net gain (loss) on investments (realized and unrealized) | | | 3.68 | | | | 2.97 | | | | (2.04 | ) |
| Total from investment operations | | | 3.90 | | | | 3.18 | | | | (2.01 | ) |
| Less distributions from: | |
| Net investment income | | | (.19 | ) | | | (.19 | ) | | | — | |
| Net realized gains | | | (.43 | ) | | | (2.35 | ) | | | — | |
| Total distributions | | | (.62 | ) | | | (2.54 | ) | | | — | |
| Net asset value, end of period | | $ | 25.03 | | | $ | 21.75 | | | $ | 21.11 | |
| | |
Total Returnb | | | 18.43 | % | | | 16.08 | % | | | (8.69 | %) |
| Ratios/Supplemental Data | |
| Net assets, end of period (in thousands) | | $ | 508 | | | $ | 405 | | | $ | 14 | |
| Ratios to average net assets: | |
| Net investment income (loss) | | | 0.93 | % | | | 1.02 | % | | | 0.31 | % |
Total expensesc | | | 1.47 | % | | | 1.22 | % | | | 1.38 | % |
Net expensesd | | | 1.44 | % | | | 1.19 | % | | | 1.38 | % |
| Portfolio turnover rate | | | 30 | % | | | 50 | % | | | 65 | % |
| SEE NOTES TO FINANCIAL STATEMENTS. | THE GUGGENHEIM FUNDS ANNUAL REPORT | 83 |
| STYLEPLUS—LARGE CORE FUND | |
FINANCIAL HIGHLIGHTS (concluded) |
This table is presented to show selected data for a share outstanding throughout each period and to assist shareholders in evaluating a Fund’s performance for the periods presented.
| Institutional Class | | Year Ended
September 30,
2017 | | | Year Ended
September 30,
2016 | | | Year Ended
September 30,
2015 | | | Year Ended
September 30,
2014 | | | Year Ended
September 30,
2013 | |
| Per Share Data | | | | | | | | | | | | | | | |
| Net asset value, beginning of period | | $ | 21.78 | | | $ | 21.00 | | | $ | 24.42 | | | $ | 24.25 | | | $ | 21.28 | |
| Income (loss) from investment operations: | |
Net investment income (loss)a | | | .32 | | | | .24 | | | | .12 | | | | .23 | | | | .06 | |
| Net gain (loss) on investments (realized and unrealized) | | | 3.69 | | | | 3.10 | | | | (.10 | ) | | | 4.38 | | | | 3.06 | |
| Total from investment operations | | | 4.01 | | | | 3.34 | | | | .02 | | | | 4.61 | | | | 3.12 | |
| Less distributions from: | |
| Net investment income | | | (.23 | ) | | | (.21 | ) | | | (.28 | ) | | | (.11 | ) | | | (.15 | ) |
| Net realized gains | | | (.43 | ) | | | (2.35 | ) | | | (3.16 | ) | | | (4.33 | ) | | | — | |
| Total distributions | | | (.66 | ) | | | (2.56 | ) | | | (3.44 | ) | | | (4.44 | ) | | | (.15 | ) |
| Net asset value, end of period | | $ | 25.13 | | | $ | 21.78 | | | $ | 21.00 | | | $ | 24.42 | | | $ | 24.25 | |
| | |
Total Returnb | | | 18.96 | % | | | 17.00 | % | | | (0.75 | %) | | | 21.50 | % | | | 14.79 | % |
| Ratios/Supplemental Data | |
| Net assets, end of period (in thousands) | | $ | 5,631 | | | $ | 4,247 | | | $ | 303 | | | $ | 80 | | | $ | 26 | |
| Ratios to average net assets: | |
| Net investment income (loss) | | | 1.35 | % | | | 1.11 | % | | | 0.52 | % | | | 0.97 | % | | | 0.26 | % |
Total expensesc | | | 1.05 | % | | | 0.99 | % | | | 1.25 | % | | | 1.39 | % | | | 1.25 | % |
Net expensesd | | | 1.01 | % | | | 0.97 | % | | | 1.25 | % | | | 1.37 | % | | | 1.25 | % |
| Portfolio turnover rate | | | 30 | % | | | 50 | % | | | 65 | % | | | 107 | % | | | 217 | % |
a | Net investment income (loss) per share was computed using average shares outstanding throughout the period. |
b | Total return does not reflect the impact of any applicable sales charges. |
c | Does not include expenses of the underlying funds in which the Fund invests. |
d | Net expense information reflects the expense ratios after expense waivers. |
e | Since commencement of operations: May 1, 2015. Percentage amounts for the period, except total return and portfolio turnover rate, have been annualized. |
84 | THE GUGGENHEIM FUNDS ANNUAL REPORT | SEE NOTES TO FINANCIAL STATEMENTS. |
MANAGERS’ COMMENTARY (Unaudited) | September 30, 2017 |
To Our Shareholders:
Guggenheim StylePlusTM—Mid Growth Fund (the “Fund”) is managed by a team of seasoned professionals, including Farhan Sharaff, Senior Managing Director and Assistant Chief Investment Officer, Equities; Jayson Flowers, Senior Managing Director and Portfolio Manager; Scott Hammond, Managing Director and Senior Portfolio Manager; and Qi Yan, Managing Director and Portfolio Manager. In the following paragraphs, the investment team discusses performance for the fiscal year ended September 30, 2017.
For the year ended September 30, 2017, Guggenheim StylePlus—Mid Growth Fund returned 17.54%1, compared with the 17.82% return of its benchmark, the Russell Midcap® Growth Index.
Investment Approach
Through a combination of actively managed individual equity, passive equity, and actively managed fixed income, the Fund seeks to exceed the total return of the Russell Midcap Growth Index. The actively managed equity and fixed income components seek to provide multiple sources of outperformance and take advantage of Guggenheim’s competencies in both fixed income and systematic stock selection.
The active and passive decisions seek to add value by tactically allocating to actively managed equity through quantitative selection models when stock picking opportunities are high. During periods when Guggenheim views these opportunities to be less attractive, the Fund seeks to increase its passive exposure to equities and the allocation to fixed-income securities. The prospective return during such periods is the equity index plus an “alpha” component coming from the yield of the fixed-income overlay.
Performance Review
Over the period, from 15-20% of the total equity position was allocated to actively managed equity and 80-85% to passive equity. Remaining Fund assets were invested in the Guggenheim Strategy Funds, short-term fixed-income investment companies advised by Guggenheim Investments, whose objective is to seek a high level of income consistent with the preservation of capital.
The Fund performed in-line with the Russell Midcap Growth Index for the one-year period ended September 30, 2017. The fixed income sleeve was the largest contributor, as positions in ABS, investment-grade corporates, and NA RMBS constituted the majority of the fixed income sleeve’s total return. The actively managed equity sleeve detracted from performance. The passive equity position, maintained through swap agreements and futures contracts, contributed to performance for the period.
When compared with the index, the total equity position (actively managed individual equity plus passive equity derivatives) was most overweight the Industrials and Consumer Staples sectors and most underweight the Materials and Financials sectors.
Performance displayed represents past performance which is no guarantee of future results.
1 | Performance figures are based on Class A shares and do not reflect taxes that a shareholder would pay on distributions or the redemption of shares. |
The opinions and forecast expressed may not actually come to pass. This information is subject to change at any time, based on market and other conditions, and should not be construed as a recommendation of any specific security or strategy.
| | THE GUGGENHEIM FUNDS ANNUAL REPORT | 85 |
PERFORMANCE REPORT AND FUND PROFILE (Unaudited) | September 30, 2017 |
STYLEPLUS—MID GROWTH FUND
OBJECTIVE: Seeks long-term growth of capital.
Holdings Diversification (Market Exposure as % of Net Assets)
“Holdings Diversification (Market Exposure as % of Net Assets)” excludes any temporary cash investments.
| Inception Dates: |
| A-Class | September 17, 1969 |
| C-Class | January 29, 1999 |
| P-Class | May 1, 2015 |
| Institutional Class | March 1, 2012 |
| Ten Largest Holdings (% of Total Net Assets) |
| Guggenheim Strategy Fund III | 33.0% |
| Guggenheim Strategy Fund II | 25.1% |
| Guggenheim Strategy Fund I | 9.5% |
| Guggenheim Limited Duration Fund - Institutional Class | 7.8% |
| Roper Technologies, Inc. | 0.4% |
| Parker-Hannifin Corp. | 0.4% |
| Omnicom Group, Inc. | 0.3% |
| Fidelity National Information Services, Inc. | 0.3% |
| Dr Pepper Snapple Group, Inc. | 0.3% |
| NetApp, Inc. | 0.3% |
| Top Ten Total | 77.4% |
| “Ten Largest Holdings” excludes any temporary cash or derivative investments. |
| 86 | THE GUGGENHEIM FUNDS ANNUAL REPORT | |
PERFORMANCE REPORT AND FUND PROFILE (Unaudited)(concluded) | September 30, 2017 |
Cumulative Fund Performance*
Average Annual Returns*
Periods Ended September 30, 2017
| | 1 Year | 5 Year | 10 Year |
| A-Class Shares | 17.54% | 12.87% | 6.76% |
A-Class Shares with sales charge‡ | 11.96% | 11.78% | 6.13% |
| C-Class Shares | 16.55% | 11.87% | 5.86% |
C-Class Shares with CDSC§ | 15.55% | 11.87% | 5.86% |
| Russell Midcap Growth Index | 17.82% | 14.18% | 8.20% |
| | | 1 Year | Since Inception
(05/01/15) |
| P-Class Shares | | 17.27% | 7.04% |
| Russell Midcap Growth Index | | 17.82% | 7.39% |
| | 1 Year | 5 Year | Since Inception
(03/01/12) |
| Institutional Class Shares | 17.88% | 12.96% | 11.69% |
| Russell Midcap Growth Index | 17.82% | 14.18% | 12.76% |
| * | The performance data above represents past performance that is not predictive of future results. The investment return and principal value of an investment in the Fund will fluctuate so that an investor’s shares, when redeemed, may be worth more or less than their original cost. Returns are historical and include changes in principal and reinvested dividends and capital gains and do not reflect the effect of taxes. The Russell Midcap Growth Index is an unmanaged index and, unlike the Fund, has no management fees or operating expenses to reduce its reported return. The graph is based on A-Class shares only; performance for C-Class, P-Class and Institutional Class will vary due to differences in fee structures. |
‡ | Effective February 22, 2011, the maximum sales charge decreased from 5.75% to 4.75%. A 5.75% maximum sales charge is used in the calculation of the 10 Year average annual returns (based on subscriptions made prior to February 22, 2011), and a 4.75% maximum sales charge will be used to calculate performance for periods based on subscriptions made on or after February 22, 2011. |
§ | Fund returns include a CDSC of 1% if redeemed within 12 months of purchase. |
| | THE GUGGENHEIM FUNDS ANNUAL REPORT | 87 |
| SCHEDULE OF INVESTMENTS | September 30, 2017 |
| STYLEPLUS—MID GROWTH FUND | |
| | | Shares | | | Value | |
| | | | | | | |
COMMON STOCKS† - 19.0% | |
| | | | | | | |
| Consumer, Non-cyclical - 6.7% | |
| Dr Pepper Snapple Group, Inc. | | | 2,807 | | | $ | 248,335 | |
| United Rentals, Inc.* | | | 1,571 | | | | 217,961 | |
| AmerisourceBergen Corp. — Class A | | | 2,626 | | | | 217,301 | |
| KAR Auction Services, Inc. | | | 4,326 | | | | 206,523 | |
| Quintiles IMS Holdings, Inc.* | | | 2,140 | | | | 203,449 | |
| Kellogg Co. | | | 2,952 | | | | 184,116 | |
| Western Union Co. | | | 9,316 | | | | 178,867 | |
| Live Nation Entertainment, Inc.* | | | 4,055 | | | | 176,595 | |
| Spectrum Brands Holdings, Inc. | | | 1,596 | | | | 169,048 | |
| Cintas Corp. | | | 1,163 | | | | 167,798 | |
| Sysco Corp. | | | 3,079 | | | | 166,112 | |
| Express Scripts Holding Co.* | | | 2,621 | | | | 165,962 | |
| Sabre Corp. | | | 8,772 | | | | 158,773 | |
| Baxter International, Inc. | | | 2,466 | | | | 154,741 | |
| McKesson Corp. | | | 1,005 | | | | 154,378 | |
| WellCare Health Plans, Inc.* | | | 888 | | | | 152,505 | |
| Incyte Corp.* | | | 1,259 | | | | 146,975 | |
| WEX, Inc.* | | | 1,237 | | | | 138,816 | |
| Illumina, Inc.* | | | 673 | | | | 134,062 | |
| HealthSouth Corp. | | | 2,880 | | | | 133,488 | |
| Robert Half International, Inc. | | | 2,634 | | | | 132,596 | |
| BioMarin Pharmaceutical, Inc.* | | | 1,408 | | | | 131,043 | |
| Kroger Co. | | | 6,515 | | | | 130,691 | |
| HCA Healthcare, Inc.* | | | 1,595 | | | | 126,946 | |
| Centene Corp.* | | | 1,241 | | | | 120,092 | |
| General Mills, Inc. | | | 2,262 | | | | 117,081 | |
| CoreLogic, Inc.* | | | 2,523 | | | | 116,613 | |
| QIAGEN N.V.* | | | 3,683 | | | | 116,015 | |
| Edwards Lifesciences Corp.* | | | 1,024 | | | | 111,933 | |
| Zoetis, Inc. | | | 1,683 | | | | 107,308 | |
| Humana, Inc. | | | 439 | | | | 106,954 | |
| Campbell Soup Co. | | | 2,266 | | | | 106,094 | |
| Henry Schein, Inc.* | | | 1,078 | | | | 88,385 | |
| Molina Healthcare, Inc.* | | | 1,177 | | | | 80,931 | |
| FleetCor Technologies, Inc.* | | | 474 | | | | 73,361 | |
| TreeHouse Foods, Inc.* | | | 1,075 | | | | 72,810 | |
| Boston Scientific Corp.* | | | 2,315 | | | | 67,529 | |
| Vantiv, Inc. — Class A* | | | 913 | | | | 64,339 | |
| Total System Services, Inc. | | | 871 | | | | 57,051 | |
| Gartner, Inc.* | | | 451 | | | | 56,109 | |
| ResMed, Inc. | | | 654 | | | | 50,332 | |
| CoStar Group, Inc.* | | | 182 | | | | 48,822 | |
| Hologic, Inc.* | | | 1,271 | | | | 46,633 | |
| Total Consumer, Non-cyclical | | | | | | | 5,605,473 | |
| | | | | | | | | |
| Industrial - 4.0% | |
| Roper Technologies, Inc. | | | 1,237 | | | | 301,085 | |
| Parker-Hannifin Corp. | | | 1,667 | | | | 291,758 | |
| Ingersoll-Rand plc | | | 2,633 | | | | 234,785 | |
| Cummins, Inc. | | | 1,332 | | | | 223,816 | |
| Hubbell, Inc. | | | 1,626 | | | | 188,648 | |
| Stanley Black & Decker, Inc. | | | 1,242 | | | | 187,505 | |
| Deere & Co. | | | 1,310 | | | | 164,523 | |
| Waste Management, Inc. | | | 2,087 | | | | 163,350 | |
| Zebra Technologies Corp. — Class A* | | | 1,504 | | | | 163,304 | |
| Dover Corp. | | | 1,602 | | | | 146,407 | |
| Snap-on, Inc. | | | 905 | | | | 134,854 | |
| Corning, Inc. | | | 3,957 | | | | 118,393 | |
| TransDigm Group, Inc. | | | 447 | | | | 114,276 | |
| Energizer Holdings, Inc. | | | 2,430 | | | | 111,902 | |
| Huntington Ingalls Industries, Inc. | | | 431 | | | | 97,596 | |
| Waters Corp.* | | | 483 | | | | 86,708 | |
| XPO Logistics, Inc.* | | | 1,257 | | | | 85,199 | |
| Masco Corp. | | | 2,137 | | | | 83,364 | |
| Stericycle, Inc.* | | | 1,110 | | | | 79,498 | |
| EMCOR Group, Inc. | | | 1,110 | | | | 77,012 | |
| Tech Data Corp.* | | | 763 | | | | 67,793 | |
| AMETEK, Inc. | | | 845 | | | | 55,804 | |
| Clean Harbors, Inc.* | | | 890 | | | | 50,463 | |
| Agilent Technologies, Inc. | | | 756 | | | | 48,535 | |
| Total Industrial | | | | | | | 3,276,578 | |
| | | | | | | | | |
| Technology - 3.4% | |
| Fidelity National Information Services, Inc. | | | 2,782 | | | | 259,810 | |
| NetApp, Inc. | | | 5,399 | | | | 236,260 | |
| Dell Technologies Incorporated Class V — Class V* | | | 2,718 | | | | 209,857 | |
| Lam Research Corp. | | | 1,072 | | | | 198,362 | |
| Cerner Corp.* | | | 2,458 | | | | 175,305 | |
| First Data Corp. — Class A* | | | 9,425 | | | | 170,027 | |
| Analog Devices, Inc. | | | 1,942 | | | | 167,342 | |
| ON Semiconductor Corp.* | | | 7,886 | | | | 145,654 | |
| Western Digital Corp. | | | 1,650 | | | | 142,560 | |
| CSRA, Inc. | | | 4,034 | | | | 130,177 | |
| DXC Technology Co. | | | 1,512 | | | | 129,851 | |
| Microsemi Corp.* | | | 2,396 | | | | 123,346 | |
| NCR Corp.* | | | 3,135 | | | | 117,625 | |
| KLA-Tencor Corp. | | | 1,088 | | | | 115,328 | |
| Skyworks Solutions, Inc. | | | 765 | | | | 77,954 | |
| Microchip Technology, Inc. | | | 775 | | | | 69,580 | |
| Fiserv, Inc.* | | | 504 | | | | 64,996 | |
| j2 Global, Inc. | | | 862 | | | | 63,685 | |
| ServiceNow, Inc.* | | | 507 | | | | 59,588 | |
| Black Knight Financial Services, Inc. — Class A* | | | 1,329 | | | | 57,213 | |
| Cypress Semiconductor Corp. | | | 3,546 | | | | 53,261 | |
| Qorvo, Inc.* | | | 673 | | | | 47,568 | |
| Total Technology | | | | | | | 2,815,349 | |
| | | | | | | | | |
| Consumer, Cyclical - 2.2% | |
| Lear Corp. | | | 1,147 | | | | 198,523 | |
| Hilton Worldwide Holdings, Inc. | | | 2,423 | | | | 168,278 | |
| American Airlines Group, Inc. | | | 2,967 | | | | 140,903 | |
| Lions Gate Entertainment Corp. — Class A* | | | 3,907 | | | | 130,689 | |
| Alaska Air Group, Inc. | | | 1,658 | | | | 126,456 | |
| Dollar Tree, Inc.* | | | 1,348 | | | | 117,033 | |
| BorgWarner, Inc. | | | 2,211 | | | | 113,270 | |
| Allison Transmission Holdings, Inc. | | | 2,482 | | | | 93,149 | |
| WW Grainger, Inc. | | | 503 | | | | 90,415 | |
| Delphi Automotive plc | | | 901 | | | | 88,658 | |
88 | THE GUGGENHEIM FUNDS ANNUAL REPORT | SEE NOTES TO FINANCIAL STATEMENTS. |
SCHEDULE OF INVESTMENTS (continued) | September 30, 2017 |
| STYLEPLUS—MID GROWTH FUND | |
| | | Shares | | | Value | |
| | | | | | | |
| Wynn Resorts Ltd. | | | 507 | | | $ | 75,502 | |
| Whirlpool Corp. | | | 408 | | | | 75,252 | |
| Harley-Davidson, Inc. | | | 1,344 | | | | 64,794 | |
| Toll Brothers, Inc. | | | 1,473 | | | | 61,085 | |
| Liberty Interactive Corporation QVC Group — Class A* | | | 2,321 | | | | 54,706 | |
| Southwest Airlines Co. | | | 935 | | | | 52,341 | |
| Dick’s Sporting Goods, Inc. | | | 1,807 | | | | 48,807 | |
| United Continental Holdings, Inc.* | | | 769 | | | | 46,817 | |
| HD Supply Holdings, Inc.* | | | 1,163 | | | | 41,949 | |
| Total Consumer, Cyclical | | | | | | | 1,788,627 | |
| | | | | | | | | |
| Communications - 1.5% | |
| Omnicom Group, Inc. | | | 3,584 | | | | 265,467 | |
| Expedia, Inc. | | | 1,626 | | | | 234,047 | |
| CommScope Holding Company, Inc.* | | | 4,325 | | | | 143,633 | |
| Zayo Group Holdings, Inc.* | | | 4,007 | | | | 137,921 | |
| CDW Corp. | | | 1,753 | | | | 115,698 | |
| Palo Alto Networks, Inc.* | | | 767 | | | | 110,525 | |
| Interpublic Group of Companies, Inc. | | | 5,033 | | | | 104,636 | |
| F5 Networks, Inc.* | | | 500 | | | | 60,280 | |
| Nexstar Media Group, Inc. — Class A | | | 773 | | | | 48,157 | |
| AMC Networks, Inc. — Class A* | | | 797 | | | | 46,601 | |
| Total Communications | | | | | | | 1,266,965 | |
| | | | | | | | | |
| Financial - 0.6% | |
| Alliance Data Systems Corp. | | | 967 | | | | 214,239 | |
| Air Lease Corp. — Class A | | | 1,897 | | | | 80,850 | |
| CBOE Holdings, Inc. | | | 469 | | | | 50,478 | |
| Sabra Health Care REIT, Inc. REIT | | | 2,245 | | | | 49,256 | |
| Digital Realty Trust, Inc. REIT | | | 401 | | | | 47,450 | |
| Progressive Corp. | | | 978 | | | | 47,355 | |
| Total Financial | | | | | | | 489,628 | |
| | | | | | | | | |
| Energy - 0.2% | |
| Williams Companies, Inc. | | | 2,613 | | | | 78,417 | |
| Devon Energy Corp. | | | 1,585 | | | | 58,185 | |
| ONEOK, Inc. | | | 940 | | | | 52,085 | |
| Total Energy | | | | | | | 188,687 | |
| | | | | | | | | |
| Basic Materials - 0.2% | |
| International Paper Co. | | | 1,368 | | | | 77,729 | |
| Univar, Inc.* | | | 2,549 | | | | 73,743 | |
| Total Basic Materials | | | | | | | 151,472 | |
| | | | | | | | | |
| Diversified - 0.2% | |
| HRG Group, Inc.* | | | 9,230 | | | | 144,080 | |
| | | | | | | | | |
| Total Common Stocks | | | | | | | | |
| (Cost $14,874,364) | | | | | | | 15,726,859 | |
| | | | | | | | | |
MUTUAL FUNDS† - 75.4% | |
Guggenheim Strategy Fund III1 | | | 1,091,634 | | | | 27,334,521 | |
Guggenheim Strategy Fund II1 | | | 830,883 | | | | 20,821,922 | |
Guggenheim Strategy Fund I1 | | | 315,077 | | | | 7,911,590 | |
Guggenheim Limited Duration Fund - Institutional Class1 | | | 260,476 | | | | 6,472,821 | |
| Total Mutual Funds | | | | | | | | |
| (Cost $62,077,746) | | | | | | | 62,540,854 | |
| | | | | | | | | |
MONEY MARKET FUND† - 5.3% | |
Dreyfus Treasury Securities Cash Management Fund - Institutional Class 0.90%2 | | | 4,390,665 | | | | 4,390,665 | |
| Total Money Market Fund | | | | | | | | |
| (Cost $4,390,665) | | | | | | | 4,390,665 | |
| | | | | | | | | |
| Total Investments - 99.7% | | | | | | | | |
| (Cost $81,342,775) | | | | | | $ | 82,658,378 | |
| Other Assets & Liabilities, net - 0.3% | | | | | | | 237,802 | |
| Total Net Assets - 100.0% | | | | | | $ | 82,896,180 | |
| Futures Contracts | |
| Description | | Contracts | | Expiration
Date | | Notional
Amount | | | Unrealized
Gain (Loss) | |
Equity Futures Contracts Purchased† | | | | | | | | | | |
| S&P MidCap 400 Index Mini Futures Contracts | | | 12 | | Dec 2017 | | $ | 2,154,000 | | | $ | 67,816 | |
| S&P 500 Index Mini Futures Contracts | | | 6 | | Dec 2017 | | | 754,650 | | | | 8,873 | |
| NASDAQ-100 Index Mini Futures Contracts | | | 6 | | Dec 2017 | | | 717,720 | | | | (1,180 | ) |
| | | | | | | | $ | 3,626,370 | | | $ | 75,509 | |
| Total Return Swap Agreements | |
| Counterparty | Index | | Financing
Rate Pay
(Receive) | | Payment
Frequency | Maturity
Date | | Units | | | Notional
Value | | | Unrealized
Gain | |
OTC Equity Index Swap Agreements†† | | | | | | | | | | | | |
Morgan Stanley
Capital Services, Inc. | Russell Midcap Growth Index | | | 1.51 | % | At Maturity | 09/06/18 | | | 24,181 | | | $ | 64,141,751 | | | $ | 2,040,788 | |
| SEE NOTES TO FINANCIAL STATEMENTS. | THE GUGGENHEIM FUNDS ANNUAL REPORT | 89 |
SCHEDULE OF INVESTMENTS (continued) | September 30, 2017 |
| STYLEPLUS—MID GROWTH FUND | |
| * | Non-income producing security. |
† | Value determined based on Level 1 inputs — See Note 4. |
†† | Value determined based on Level 2 inputs — See Note 4. |
1 | Affiliated issuer. |
2 | Rate indicated is the 7 day yield as of September 30, 2017. |
| | plc — Public Limited Company |
| | REIT — Real Estate Investment Trust |
| | |
| | See Sector Classification in Other Information section. |
The following table summarizes the inputs used to value the Fund’s investments at September 30, 2017 (See Note 4 in the Notes to Financial Statements):
| Investments in Securities (Assets) | | Level 1
Quoted
Prices | | | Level 1 -
Other* | | | Level 2 Significant Observable Inputs | | | Level 2 -
Other* | | | Level 3 Significant Unobservable Inputs | | | Total | |
| Common Stocks | | $ | 15,726,859 | | | $ | — | | | $ | — | | | $ | — | | | $ | — | | | $ | 15,726,859 | |
| Equity Futures Contracts | | | — | | | | 76,689 | | | | — | | | | — | | | | — | | | | 76,689 | |
| Equity Index Swap Agreements | | | — | | | | — | | | | — | | | | 2,040,788 | | | | — | | | | 2,040,788 | |
| Money Market Fund | | | 4,390,665 | | | | — | | | | — | | | | — | | | | — | | | | 4,390,665 | |
| Mutual Funds | | | 62,540,854 | | | | — | | | | — | | | | — | | | | — | | | | 62,540,854 | |
| Total Assets | | $ | 82,658,378 | | | $ | 76,689 | | | $ | — | | | $ | 2,040,788 | | | $ | — | | | $ | 84,775,855 | |
| | | | | | | | | | | | | | | | | | | | | | | | | |
| Investments in Securities (Liabilities) | | Level 1
Quoted
Prices | | | Level 1 -
Other* | | | Level 2 Significant Observable Inputs | | | Level 2 -
Other* | | | Level 3 Significant Unobservable Inputs | | | Total | |
| Equity Futures Contracts | | $ | — | | | $ | 1,180 | | | $ | — | | | $ | — | | | $ | — | | | $ | 1,180 | |
| * | Other financial instruments include futures contracts and/or swaps, which are reported as unrealized gain/loss at period end. |
Transfers between investment levels may occur as the markets fluctuate and/or the availability of data used in an investment’s valuation changes. Transfers between valuation levels, if any, are in comparison to the valuation levels at the end of the previous fiscal year, and are effective using the fair value as of the end of the current fiscal period.
For the year ended September 30, 2017, there were no transfers between levels.
Affiliated Transactions
Investments representing 5% or more of the outstanding voting shares of a portfolio company of a fund, or control of or by, or common control under GI, result in that portfolio company being considered an affiliated company of such fund, as defined in the 1940 Act.
The Fund may invest in the Guggenheim Strategy Funds Trust consisting of Guggenheim Strategy Fund I, Guggenheim Strategy Fund II, Guggenheim Strategy Fund III, and Guggenheim Variable Insurance Strategy Fund III (collectively, the “Cash Management Funds”), open-end management investment companies managed by GI. The Cash Management Funds, which launched on March 11, 2014, are offered as cash management options only to mutual funds, trusts, and other accounts managed by GI and/or its affiliates, and are not available to the public. The Cash Management Funds pay no investment management fees. The Cash Management Funds’ annual report on Form N-CSR dated September 30, 2016, is available publicly or upon request. This information is available from the EDGAR database on the SEC’s website at https://www.sec.gov/Archives/edgar/data/1601445/000089180416001923/gug65857-ncsr.htm.
90 | THE GUGGENHEIM FUNDS ANNUAL REPORT | SEE NOTES TO FINANCIAL STATEMENTS. |
SCHEDULE OF INVESTMENTS (concluded) | September 30, 2017 |
| STYLEPLUS—MID GROWTH FUND | |
Transactions during the year ended September 30, 2017, in which the portfolio company is an “affiliated person”, were as follows:
| Security Name | | Value
09/30/16 | | | Additions | | | Reductions | | | Realized
Gain (Loss) | | | Change in
Unrealized | | | Value
09/30/17 | | | Shares
09/30/17 | | | Investment
Income | | | Capital
Gain
Distributions | |
| Guggenheim Limited Duration Fund - Institutional Class | | $ | 6,271,368 | | | $ | 165,225 | | | $ | — | | | $ | — | | | $ | 36,228 | | | $ | 6,472,821 | | | | 260,476 | | | $ | 165,113 | | | $ | 1,102 | |
| Guggenheim Strategy Fund I | | | 8,222,675 | | | | 3,559,200 | | | | (3,909,320 | ) | | | 23,011 | | | | 16,024 | | | | 7,911,590 | | | | 315,077 | | | | 149,351 | | | | — | |
| Guggenheim Strategy Fund II | | | 20,250,726 | | | | 472,542 | | | | — | | | | — | | | | 98,654 | | | | 20,821,922 | | | | 830,883 | | | | 473,608 | | | | — | |
| Guggenheim Strategy Fund III | | | 26,513,876 | | | | 755,827 | | | | — | | | | — | | | | 64,818 | | | | 27,334,521 | | | | 1,091,634 | | | | 757,604 | | | | — | |
| | | $ | 61,258,645 | | | $ | 4,952,794 | | | $ | (3,909,320 | ) | | $ | 23,011 | | | $ | 215,724 | | | $ | 62,540,854 | | | | | | | $ | 1,545,676 | | | $ | 1,102 | |
| SEE NOTES TO FINANCIAL STATEMENTS. | THE GUGGENHEIM FUNDS ANNUAL REPORT | 91 |
| STYLEPLUS—MID GROWTH FUND | |
| STATEMENT OF ASSETS AND LIABILITIES |
| September 30, 2017 |
| Assets: | |
| Investments in unaffiliated issuers, at value (cost $19,265,029) | | $ | 20,117,524 | |
| Investments in affiliated issuers, at value (cost $62,077,746) | | | 62,540,854 | |
| Cash | | | 1,185 | |
| Segregated cash with broker | | | 128,850 | |
| Unrealized appreciation on swap agreements | | | 2,040,788 | |
| Prepaid expenses | | | 30,965 | |
| Receivables: | |
| Dividends | | | 130,523 | |
| Variation margin | | | 8,640 | |
| Interest | | | 2,325 | |
| Fund shares sold | | | 63 | |
| Total assets | | | 85,001,717 | |
| | | | | |
| Liabilities: | |
| Segregated cash due to broker | | | 1,642,982 | |
| Payable for: | |
| Securities purchased | | | 170,885 | |
| Fund shares redeemed | | | 163,286 | |
| Management fees | | | 47,886 | |
| Distribution and service fees | | | 18,889 | |
| Transfer agent/maintenance fees | | | 14,340 | |
| Fund accounting/administration fees | | | 5,362 | |
| Trustees’ fees* | | | 750 | |
| Miscellaneous | | | 41,157 | |
| Total liabilities | | | 2,105,537 | |
| Net assets | | $ | 82,896,180 | |
| | | | | |
| Net assets consist of: | |
| Paid in capital | | $ | 69,850,501 | |
| Undistributed net investment income | | | 410,853 | |
| Accumulated net realized gain on investments | | | 9,202,926 | |
| Net unrealized appreciation on investments | | | 3,431,900 | |
| Net assets | | $ | 82,896,180 | |
| | | | | |
| A-Class: | |
| Net assets | | $ | 77,048,570 | |
| Capital shares outstanding | | | 1,627,615 | |
| Net asset value per share | | $ | 47.34 | |
| Maximum offering price per share (Net asset value divided by 95.25%) | | $ | 49.70 | |
| | | | | |
| C-Class: | |
| Net assets | | $ | 3,984,376 | |
| Capital shares outstanding | | | 111,810 | |
| Net asset value per share | | $ | 35.64 | |
| | | | | |
| P-Class: | |
| Net assets | | $ | 120,501 | |
| Capital shares outstanding | | | 2,573 | |
| Net asset value per share | | $ | 46.83 | |
| | | | | |
| Institutional Class: | |
| Net assets | | $ | 1,742,733 | |
| Capital shares outstanding | | | 36,707 | |
| Net asset value per share | | $ | 47.48 | |
| * | Relates to Trustees not deemed “interested persons” within the meaning of Section 2(a)(19) of the 1940 Act. |
92 | THE GUGGENHEIM FUNDS ANNUAL REPORT | SEE NOTES TO FINANCIAL STATEMENTS. |
| STYLEPLUS—MID GROWTH FUND | |
| STATEMENT OF OPERATIONS |
| Year Ended September 30, 2017 |
| Investment Income: | |
| Dividends from securities of unaffiliated issuers | | $ | 190,974 | |
| Dividends from securities of affiliated issuers | | | 1,545,676 | |
| Interest | | | 14,548 | |
| Total investment income | | | 1,751,198 | |
| | | | | |
| Expenses: | |
| Management fees | | | 597,597 | |
| Distribution and service fees: | |
| A-Class | | | 188,644 | |
| C-Class | | | 38,168 | |
| P-Class | | | 283 | |
| Transfer agent/maintenance fees: | |
| A-Class | | | 78,473 | |
| C-Class | | | 7,850 | |
| P-Class | | | 339 | |
| Institutional Class | | | 225 | |
| Fund accounting/administration fees | | | 63,870 | |
| Registration fees | | | 63,743 | |
| Line of credit fees | | | 13,622 | |
| Custodian fees | | | 10,098 | |
| Trustees’ fees* | | | 8,765 | |
| Tax expense | | | 3,742 | |
| Miscellaneous | | | 115,460 | |
| Total expenses | | | 1,190,879 | |
| Less: | |
| Expenses waived by Adviser | | | (28,169 | ) |
| Net expenses | | | 1,162,710 | |
| Net investment income | | | 588,488 | |
| | | | | |
| Net Realized and Unrealized Gain (Loss): | |
| Net realized gain (loss) on: | |
| Investments in unaffiliated issuers | | | 1,228,124 | |
| Investments in affiliated issuers | | | 23,011 | |
| Realized gain distributions received from investment company shares | | | 1,102 | |
| Swap agreements | | | 10,374,134 | |
| Futures contracts | | | 301,765 | |
| Net realized gain | | | 11,928,136 | |
| Net change in unrealized appreciation (depreciation) on: | |
| Investments in unaffiliated issuers | | | 758,257 | |
| Investments in affiliated issuers | | | 215,724 | |
| Swap agreements | | | (621,402 | ) |
| Futures contracts | | | 75,509 | |
| Net change in unrealized appreciation (depreciation) | | | 428,088 | |
| Net realized and unrealized gain | | | 12,356,224 | |
| Net increase in net assets resulting from operations | | $ | 12,944,712 | |
| * | Relates to Trustees not deemed “interested persons” within the meaning of Section 2(a)(19) of the 1940 Act. |
| SEE NOTES TO FINANCIAL STATEMENTS. | THE GUGGENHEIM FUNDS ANNUAL REPORT | 93 |
| STYLEPLUS—MID GROWTH FUND | |
| STATEMENTS OF CHANGES IN NET ASSETS |
| | | Year Ended
September 30,
2017 | | | Year Ended
September 30,
2016 | |
| Increase (Decrease) in Net Assets from Operations: | | | | | | |
| Net investment income | | $ | 588,488 | | | $ | 330,289 | |
| Net realized gain (loss) on investments | | | 11,928,136 | | | | (2,408,876 | ) |
| Net change in unrealized appreciation (depreciation) on investments | | | 428,088 | | | | 10,387,058 | |
| Net increase in net assets resulting from operations | | | 12,944,712 | | | | 8,308,471 | |
| | | | | | | | | |
| Distributions to shareholders from: | | | | | | | | |
| Net investment income | | | | | | | | |
| A-Class | | | (439,170 | ) | | | (86,688 | ) |
| P-Class | | | (843 | ) | | | (63 | ) |
| Institutional Class | | | (931 | ) | | | (170 | ) |
| Net realized gains | | | | | | | | |
| A-Class | | | — | | | | (9,333,165 | ) |
| C-Class | | | — | | | | (773,702 | ) |
| P-Class | | | — | | | | (1,713 | ) |
| Institutional Class | | | — | | | | (7,288 | ) |
| Total distributions to shareholders | | | (440,944 | ) | | | (10,202,789 | ) |
| | | | | | | | | |
| Capital share transactions: | | | | | | | | |
| Proceeds from sale of shares | | | | | | | | |
| A-Class | | | 5,856,314 | | | | 3,894,517 | |
| C-Class | | | 312,663 | | | | 584,068 | |
| P-Class | | | 28,177 | | | | 82,974 | |
| Institutional Class | | | 1,622,366 | | | | 94,989 | |
| Distributions reinvested | | | | | | | | |
| A-Class | | | 412,205 | | | | 9,015,453 | |
| C-Class | | | — | | | | 758,694 | |
| P-Class | | | 843 | | | | 1,776 | |
| Institutional Class | | | 872 | | | | 6,154 | |
| Cost of shares redeemed | | | | | | | | |
| A-Class | | | (13,228,907 | ) | | | (12,325,038 | ) |
| C-Class | | | (677,278 | ) | | | (2,028,207 | ) |
| P-Class | | | (27,021 | ) | | | (272 | ) |
| Institutional Class | | | (62,579 | ) | | | (40,892 | ) |
| Net increase (decrease) from capital share transactions | | | (5,762,345 | ) | | | 44,216 | |
| Net increase (decrease) in net assets | | | 6,741,423 | | | | (1,850,102 | ) |
| | | | | | | | | |
| Net assets: | | | | | | | | |
| Beginning of year | | | 76,154,757 | | | | 78,004,859 | |
| End of year | | $ | 82,896,180 | | | $ | 76,154,757 | |
| Undistributed net investment income at end of year | | $ | 410,853 | | | $ | 259,567 | |
94 | THE GUGGENHEIM FUNDS ANNUAL REPORT | SEE NOTES TO FINANCIAL STATEMENTS. |
| STYLEPLUS—MID GROWTH FUND | |
STATEMENTS OF CHANGES IN NET ASSETS (concluded) |
| | | Year Ended
September 30,
2017 | | | Year Ended
September 30,
2016 | |
| Capital share activity: | | | | | | |
| Shares sold | | | | | | |
| A-Class | | | 142,987 | | | | 98,799 | |
| C-Class | | | 9,803 | | | | 19,452 | |
| P-Class | | | 630 | | | | 2,227 | |
| Institutional Class | | | 35,348 | | | | 2,436 | |
| Shares issued from reinvestment of distributions | | | | | | | | |
| A-Class | | | 10,323 | | | | 236,875 | |
| C-Class | | | — | | | | 26,225 | |
| P-Class | | | 21 | | | | 47 | |
| Institutional Class | | | 22 | | | | 161 | |
| Shares redeemed | | | | | | | | |
| A-Class | | | (306,993 | ) | | | (318,222 | ) |
| C-Class | | | (20,979 | ) | | | (67,971 | ) |
| P-Class | | | (607 | ) | | | (7 | ) |
| Institutional Class | | | (1,458 | ) | | | (1,090 | ) |
| Net decrease in shares | | | (130,903 | ) | | | (1,068 | ) |
| SEE NOTES TO FINANCIAL STATEMENTS. | THE GUGGENHEIM FUNDS ANNUAL REPORT | 95 |
| STYLEPLUS—MID GROWTH FUND | |
This table is presented to show selected data for a share outstanding throughout each period and to assist shareholders in evaluating a Fund’s performance for the periods presented.
| A-Class | | Year Ended
September 30,
2017 | | | Year Ended
September 30,
2016 | | | Year Ended
September 30,
2015 | | | Year Ended
September 30,
2014 | | | Year Ended
September 30,
2013 | |
| Per Share Data | | | | | | | | | | | | | | | |
| Net asset value, beginning of period | | $ | 40.52 | | | $ | 41.49 | | | $ | 45.82 | | | $ | 43.54 | | | $ | 36.40 | |
| Income (loss) from investment operations: | |
Net investment income (loss)a | | | .34 | | | | .19 | | | | .07 | | | | .16 | | | | (.16 | ) |
| Net gain (loss) on investments (realized and unrealized) | | | 6.72 | | | | 4.25 | | | | .63 | | | | 6.21 | | | | 7.30 | |
| Total from investment operations | | | 7.06 | | | | 4.44 | | | | .70 | | | | 6.37 | | | | 7.14 | |
| Less distributions from: | |
| Net investment income | | | (.24 | ) | | | (.05 | ) | | | — | | | | — | | | | — | |
| Net realized gains | | | — | | | | (5.36 | ) | | | (5.03 | ) | | | (4.09 | ) | | | — | |
| Total distributions | | | (.24 | ) | | | (5.41 | ) | | | (5.03 | ) | | | (4.09 | ) | | | — | |
| Net asset value, end of period | | $ | 47.34 | | | $ | 40.52 | | | $ | 41.49 | | | $ | 45.82 | | | $ | 43.54 | |
| | |
Total Returnb | | | 17.54 | % | | | 11.55 | % | | | 1.04 | % | | | 15.61 | % | | | 19.62 | % |
| Ratios/Supplemental Data | |
| Net assets, end of period (in thousands) | | $ | 77,049 | | | $ | 72,179 | | | $ | 73,178 | | | $ | 77,363 | | | $ | 70,767 | |
| Ratios to average net assets: | |
| Net investment income (loss) | | | 0.78 | % | | | 0.48 | % | | | 0.16 | % | | | 0.36 | % | | | (0.40 | %) |
Total expensesc | | | 1.45 | % | | | 1.45 | % | | | 1.47 | % | | | 1.67 | % | | | 1.57 | % |
Net expensesd | | | 1.42 | % | | | 1.43 | % | | | 1.47 | % | | | 1.65 | % | | | 1.57 | % |
| Portfolio turnover rate | | | 43 | % | | | 61 | % | | | 75 | % | | | 112 | % | | | 214 | % |
| C-Class | | Year Ended
September 30,
2017 | | | Year Ended
September 30,
2016 | | | Year Ended
September 30,
2015 | | | Year Ended
September 30,
2014 | | | Year Ended
September 30,
2013 | |
| Per Share Data | | | | | | | | | | | | | | | |
| Net asset value, beginning of period | | $ | 30.58 | | | $ | 32.78 | | | $ | 37.48 | | | $ | 36.63 | | | $ | 30.92 | |
| Income (loss) from investment operations: | |
Net investment income (loss)a | | | (.03 | ) | | | (.12 | ) | | | (.25 | ) | | | (.20 | ) | | | (.45 | ) |
| Net gain (loss) on investments (realized and unrealized) | | | 5.09 | | | | 3.28 | | | | .58 | | | | 5.14 | | | | 6.16 | |
| Total from investment operations | | | 5.06 | | | | 3.16 | | | | .33 | | | | 4.94 | | | | 5.71 | |
| Less distributions from: | |
| Net realized gains | | | — | | | | (5.36 | ) | | | (5.03 | ) | | | (4.09 | ) | | | — | |
| Total distributions | | | — | | | | (5.36 | ) | | | (5.03 | ) | | | (4.09 | ) | | | — | |
| Net asset value, end of period | | $ | 35.64 | | | $ | 30.58 | | | $ | 32.78 | | | $ | 37.48 | | | $ | 36.63 | |
| | |
Total Returnb | | | 16.55 | % | | | 10.55 | % | | | 0.20 | % | | | 14.56 | % | | | 18.47 | % |
| Ratios/Supplemental Data | |
| Net assets, end of period (in thousands) | | $ | 3,984 | | | $ | 3,760 | | | $ | 4,762 | | | $ | 4,329 | | | $ | 4,103 | |
| Ratios to average net assets: | |
| Net investment income (loss) | | | (0.08 | %) | | | (0.42 | %) | | | (0.68 | %) | | | (0.55 | %) | | | (1.36 | %) |
Total expensesc | | | 2.31 | % | | | 2.34 | % | | | 2.31 | % | | | 2.57 | % | | | 2.53 | % |
Net expensesd | | | 2.27 | % | | | 2.32 | % | | | 2.31 | % | | | 2.55 | % | | | 2.53 | % |
| Portfolio turnover rate | | | 43 | % | | | 61 | % | | | 75 | % | | | 112 | % | | | 214 | % |
96 | THE GUGGENHEIM FUNDS ANNUAL REPORT | SEE NOTES TO FINANCIAL STATEMENTS. |
| STYLEPLUS—MID GROWTH FUND | |
FINANCIAL HIGHLIGHTS (continued) |
This table is presented to show selected data for a share outstanding throughout each period and to assist shareholders in evaluating a Fund’s performance for the periods presented.
| P-Class | | Year Ended
September 30,
2017 | | | Year Ended
September 30,
2016 | | | Period Ended
September 30,
2015e | |
| Per Share Data | | | | | | | | | |
| Net asset value, beginning of period | | $ | 40.27 | | | $ | 41.48 | | | $ | 45.96 | |
| Income (loss) from investment operations: | |
Net investment income (loss)a | | | .24 | | | | .26 | | | | — | f |
| Net gain (loss) on investments (realized and unrealized) | | | 6.65 | | | | 4.09 | | | | (4.48 | ) |
| Total from investment operations | | | 6.89 | | | | 4.35 | | | | (4.48 | ) |
| Less distributions from: | |
| Net investment income | | | (.33 | ) | | | (.20 | ) | | | — | |
| Net realized gains | | | — | | | | (5.36 | ) | | | — | |
| Total distributions | | | (.33 | ) | | | (5.56 | ) | | | — | |
| Net asset value, end of period | | $ | 46.83 | | | $ | 40.27 | | | $ | 41.48 | |
| | |
Total Returnb | | | 17.27 | % | | | 11.36 | % | | | (9.75 | %) |
| Ratios/Supplemental Data | |
| Net assets, end of period (in thousands) | | $ | 121 | | | $ | 102 | | | $ | 11 | |
| Ratios to average net assets: | |
| Net investment income (loss) | | | 0.55 | % | | | 0.69 | % | | | 0.00 | % |
Total expensesc | | | 1.66 | % | | | 1.39 | % | | | 1.49 | % |
Net expensesd | | | 1.63 | % | | | 1.35 | % | | | 1.49 | % |
| Portfolio turnover rate | | | 43 | % | | | 61 | % | | | 75 | % |
| SEE NOTES TO FINANCIAL STATEMENTS. | THE GUGGENHEIM FUNDS ANNUAL REPORT | 97 |
| STYLEPLUS—MID GROWTH FUND | |
FINANCIAL HIGHLIGHTS (concluded) |
This table is presented to show selected data for a share outstanding throughout each period and to assist shareholders in evaluating a Fund’s performance for the periods presented.
| Institutional Class | | Year Ended
September 30,
2017 | | | Year Ended
September 30,
2016 | | | Year Ended
September 30,
2015 | | | Year Ended
September 30,
2014 | | | Year Ended
September 30,
2013 | |
| Per Share Data | | | | | | | | | | | | | | | |
| Net asset value, beginning of period | | $ | 40.59 | | | $ | 41.64 | | | $ | 45.96 | | | $ | 43.72 | | | $ | 36.46 | |
| Income (loss) from investment operations: | |
Net investment income (loss)a | | | .42 | | | | .19 | | | | .11 | | | | .11 | | | | (.07 | ) |
| Net gain (loss) on investments (realized and unrealized) | | | 6.78 | | | | 4.25 | | | | .60 | | | | 6.22 | | | | 7.33 | |
| Total from investment operations | | | 7.20 | | | | 4.44 | | | | .71 | | | | 6.33 | | | | 7.26 | |
| Less distributions from: | |
| Net investment income | | | (.31 | ) | | | (.13 | ) | | | — | | | | — | | | | — | |
| Net realized gains | | | — | | | | (5.36 | ) | | | (5.03 | ) | | | (4.09 | ) | | | — | |
| Total distributions | | | (.31 | ) | | | (5.49 | ) | | | (5.03 | ) | | | (4.09 | ) | | | — | |
| Net asset value, end of period | | $ | 47.48 | | | $ | 40.59 | | | $ | 41.64 | | | $ | 45.96 | | | $ | 43.72 | |
| | |
Total Returnb | | | 17.88 | % | | | 11.50 | % | | | 1.08 | % | | | 15.42 | % | | | 19.91 | % |
| Ratios/Supplemental Data | |
| Net assets, end of period (in thousands) | | $ | 1,743 | | | $ | 113 | | | $ | 54 | | | $ | 30 | | | $ | 21 | |
| Ratios to average net assets: | |
| Net investment income (loss) | | | 0.95 | % | | | 0.48 | % | | | 0.23 | % | | | 0.24 | % | | | (0.17 | %) |
Total expensesc | | | 1.26 | % | | | 1.46 | % | | | 1.41 | % | | | 1.81 | % | | | 1.33 | % |
Net expensesd | | | 1.22 | % | | | 1.44 | % | | | 1.41 | % | | | 1.79 | % | | | 1.33 | % |
| Portfolio turnover rate | | | 43 | % | | | 61 | % | | | 75 | % | | | 112 | % | | | 214 | % |
a | Net investment income (loss) per share was computed using average shares outstanding throughout the period. |
b | Total return does not reflect the impact of any applicable sales charges. |
c | Does not include expenses of the underlying funds in which the Fund invests. |
d | Net expense information reflects the expense ratios after expense waivers. |
e | Since commencement of operations: May 1, 2015. Percentage amounts for the period, except total return and portfolio turnover rate, have been annualized. |
f | Net investment income is less than $0.01 per share. |
98 | THE GUGGENHEIM FUNDS ANNUAL REPORT | SEE NOTES TO FINANCIAL STATEMENTS. |
MANAGERS’ COMMENTARY (Unaudited) | September 30, 2017 |
To Our Shareholders
Guggenheim World Equity Income Fund (the “Fund”) is managed by a team of seasoned professionals, Farhan Sharaff, Senior Managing Director and Assistant Chief Investment Officer, Equities; Jayson Flowers, Senior Managing Director and Portfolio Manager; and Scott Hammond, Managing Director and Senior Portfolio Manager; and Evan Einstein, Vice President and Quantitative Analyst. In the following paragraphs, the investment team discusses performance for the fiscal year ended September 30, 2017.
For the one year period ended September 30, 2017, Guggenheim World Equity Income Fund returned 12.31%1, compared with the 18.17% return of its benchmark, the MSCI World Index.
Performance Review
As has historically been the case, the defensive nature of the World Equity Income Fund means the fund tends to underperform during appreciating equity markets.
For the 12 months, the Fund benefited from stock selection in Consumer Staples and Health Care. Detracting most from performance was stock selection in Financials and Tech.
The Fund’s high-level views for much of the period were the attractiveness of banks, in both the U.S. and selectively in Europe, as well as, relatively speaking, foreign markets, due to ongoing monetary stimulus. The rewards were limited with banks as a group, detracting from the portfolio’s return relative to its MSCI World benchmark. However, we continue to believe there is value in this sector and remain committed to the position.
A long-running source of the Fund’s positive excess return has been a consistent underweight to the Energy sector. This worked against the portfolio, as crude rallied more than 20% twice during the period. Nonetheless, the global dynamics of crude oil have changed, with the U.S. becoming the marginal producer. The result of this new paradigm is subdued oil prices, affected in part by U.S. inventory levels and changes in rig count.
Some of the Fund’s underperformance was attributable to the tactical currency hedging strategy. While disappointing, this is in line with a U.S. dollar which peaked at the end of December and has retreated in 2017. Nevertheless, a strengthening U.S. dollar aligns with Guggenheim’s long-run macro thesis, and thus we believe the currency overlay remains highly applicable.
Another drag on relative return for the Fund was the outperformance of growth-oriented equities relative to value-oriented equities. The cumulative Growth/Value spread rivals its peak of the dot com bubble. While this was detrimental to portfolio returns for much of the period, we believe a reversal is due given valuations among growth names have reached an extreme point.
Portfolio Positioning
Positioning relative to sectors shows that Financials was the largest overweight of the period, followed by the cyclically defensive sectors of Utilities and Telecommunications Services. Materials and Consumer Discretionary were the largest underweights. Only the overweight to Financials contributed to return for the period.
From a geographic perspective, the Fund’s largest overweights were in Hong Kong and Canada. The largest underweights were in Japan and Germany.
Performance displayed represents past performance which is no guarantee of future results.
1 | Performance figures are based on Class A shares and do not reflect taxes that a shareholder would pay on distributions or the redemption of shares. |
The opinions and forecast expressed may not actually come to pass. This information is subject to change at any time, based on market and other conditions, and should not be construed as a recommendation of any specific security or strategy.
| | THE GUGGENHEIM FUNDS ANNUAL REPORT | 99 |
PERFORMANCE REPORT AND FUND PROFILE (Unaudited) | September 30, 2017 |
WORLD EQUITY INCOME FUND
OBJECTIVE: Seeks to provide total return, comprised of capital appreciation and income.
Holdings Diversification (Market Exposure as % of Net Assets)
“Holdings Diversification (Market Exposure as % of Net Assets)” excludes any temporary cash investments.
COUNTRY DIVERSIFICATION
At September 30, 2017, the investment diversification of the Fund by country was as follows:
| Country | | % of Common Stocks | | | Value | |
| United States | | | 51 | % | | $ | 46,123,799 | |
| Canada | | | 7 | % | | | 6,336,364 | |
| Japan | | | 6 | % | | | 5,287,726 | |
| Australia | | | 6 | % | | | 5,015,676 | |
| France | | | 4 | % | | | 3,855,637 | |
| Switzerland | | | 4 | % | | | 3,693,128 | |
| United Kingdom | | | 4 | % | | | 3,525,044 | |
| Other | | | 18 | % | | | 15,943,374 | |
| Total Securities | | | 100 | % | | $ | 89,780,748 | |
| Inception Dates: |
| A-Class | October 1, 1993 |
| C-Class | January 29, 1999 |
| P-Class | May 1, 2015 |
| Institutional Class | May 2, 2011 |
| Ten Largest Holdings (% of Total Net Assets) |
| Facebook, Inc. — Class A | 1.7% |
| Johnson & Johnson | 1.7% |
| Pfizer, Inc. | 1.3% |
| AbbVie, Inc. | 1.3% |
| Visa, Inc. — Class A | 1.2% |
| Merck & Company, Inc. | 1.2% |
| Apple, Inc. | 1.1% |
| 3M Co. | 1.1% |
| Gilead Sciences, Inc. | 1.1% |
| Roche Holding AG | 1.1% |
| Top Ten Total | 12.8% |
| “Ten Largest Holdings” excludes any temporary cash investments. |
| 100 | THE GUGGENHEIM FUNDS ANNUAL REPORT | |
PERFORMANCE REPORT AND FUND PROFILE (Unaudited)(concluded) | September 30, 2017 |
Cumulative Fund Performance*
Average Annual Returns*
Periods Ended September 30, 2017
| | 1 Year | 5 Year | 10 Year |
| A-Class Shares | 12.31% | 9.90% | 2.19% |
A-Class Shares with sales charge‡ | 6.94% | 8.83% | 1.59% |
| C-Class Shares | 11.46% | 9.07% | 1.43% |
C-Class Shares with CDSC§ | 10.46% | 9.07% | 1.43% |
| MSCI World Index | 18.17% | 10.99% | 4.22% |
| | | 1 Year | Since Inception
(05/01/15) |
| P-Class Shares | | 12.32% | 6.60% |
| MSCI World Index | | 18.17% | 6.90% |
| | 1 Year | 5 Year | Since Inception
(05/02/11) |
| Institutional Class Shares | 12.61% | 10.23% | 5.15% |
| MSCI World Index | 18.17% | 10.99% | 8.04% |
| * | The performance data above represents past performance that is not predictive of future results. The investment return and principal value of an investment in the Fund will fluctuate so that an investor’s shares, when redeemed, may be worth more or less than their original cost. Returns are historical and include changes in principal and reinvested dividends and capital gains and do not reflect the effect of taxes. The MSCI World Index is an unmanaged index and, unlike the Fund, has no management fees or operating expenses to reduce its reported return. The graph is based on A-Class shares only; performance for C-Class, P-Class and Institutional Class will vary due to differences in fee structures. |
‡ | Effective February 22, 2011, the maximum sales charge decreased from 5.75% to 4.75%. A 5.75% maximum sales charge is used in the calculation of the 1 Year, 5 Year and 10 Year average annual returns (based on subscriptions made prior to February 22, 2011), and a 4.75% maximum sales charge will be used to calculate performance for periods based on subscriptions made on or after February 22, 2011. |
§ | Fund returns include a CDSC of 1% if redeemed within 12 months of purchase. |
| | THE GUGGENHEIM FUNDS ANNUAL REPORT | 101 |
| SCHEDULE OF INVESTMENTS | September 30, 2017 |
| WORLD EQUITY INCOME FUND | |
| | | Shares | | | Value | |
| | | | | | | |
COMMON STOCKS† - 98.5% | |
| | | | | | | |
| Financial - 26.0% | |
| Visa, Inc. — Class A | | | 10,600 | | | $ | 1,115,544 | |
| Mastercard, Inc. — Class A | | | 6,900 | | | | 974,280 | |
| Banco Bilbao Vizcaya Argentaria S.A. | | | 97,900 | | | | 874,863 | |
| BNP Paribas S.A. | | | 10,100 | | | | 814,709 | |
| ING Groep N.V. | | | 43,500 | | | | 802,033 | |
| Credit Agricole S.A. | | | 43,400 | | | | 788,904 | |
| Cincinnati Financial Corp. | | | 10,300 | | | | 788,671 | |
| Intercontinental Exchange, Inc. | | | 11,400 | | | | 783,180 | |
| Chubb Ltd. | | | 5,200 | | | | 741,260 | |
| Commonwealth Bank of Australia ADR* | | | 12,100 | | | | 714,081 | |
| Swiss Re AG | | | 7,600 | | | | 688,404 | |
| Annaly Capital Management, Inc. REIT | | | 54,600 | | | | 665,573 | |
| Bank of Montreal | | | 8,400 | | | | 635,653 | |
| Hang Seng Bank Ltd. | | | 25,800 | | | | 628,855 | |
| AXA S.A. | | | 20,400 | | | | 616,991 | |
| Credit Suisse Group AG* | | | 38,100 | | | | 603,250 | |
| Henderson Land Development Company Ltd. | | | 86,240 | | | | 571,324 | |
| Westfield Corp. REIT | | | 92,500 | | | | 568,740 | |
| Kinnevik Investment AB — Class B | | | 17,200 | | | | 560,796 | |
| Everest Re Group Ltd. | | | 2,400 | | | | 548,136 | |
| Bank Hapoalim BM | | | 75,900 | | | | 530,933 | |
| MetLife, Inc. | | | 10,000 | | | | 519,500 | |
| Welltower, Inc. REIT | | | 6,900 | | | | 484,932 | |
| Hysan Development Company Ltd. — Class A* | | | 98,500 | | | | 463,402 | |
| RioCan Real Estate Investment Trust REIT | | | 23,400 | | | | 448,734 | |
| First Capital Realty, Inc. | | | 28,200 | | | | 444,739 | |
| H&R Real Estate Investment Trust REIT | | | 25,200 | | | | 434,988 | |
| Assurant, Inc. | | | 4,300 | | | | 410,736 | |
| Raiffeisen Bank International AG* | | | 11,100 | | | | 371,990 | |
| Intesa Sanpaolo SpA | | | 104,100 | | | | 368,121 | |
| JPMorgan Chase & Co. | | | 3,800 | | | | 362,938 | |
| National Australia Bank Ltd. ADR | | | 13,900 | | | | 343,385 | |
| Ascendas Real Estate Investment Trust REIT | | | 168,300 | | | | 330,032 | |
| Investec plc | | | 45,000 | | | | 328,285 | |
| Smart Real Estate Investment Trust REIT | | | 12,700 | | | | 299,621 | |
| Canadian Imperial Bank of Commerce | | | 3,000 | | | | 262,455 | |
| Liberty Property Trust REIT | | | 6,200 | | | | 254,572 | |
| KBC Group N.V. | | | 3,000 | | | | 254,225 | |
| Toronto-Dominion Bank | | | 4,000 | | | | 225,184 | |
| Reinsurance Group of America, Inc. — Class A | | | 1,600 | | | | 223,248 | |
| ASX Ltd. | | | 5,300 | | | | 217,927 | |
| CI Financial Corp. | | | 9,600 | | | | 209,945 | |
| Equity Residential REIT | | | 3,000 | | | | 197,790 | |
| Ageas | | | 4,200 | | | | 197,367 | |
| Wells Fargo & Co. | | | 3,500 | | | | 193,025 | |
| Prologis, Inc. REIT | | | 3,000 | | | | 190,380 | |
| U.S. Bancorp | | | 3,300 | | | | 176,847 | |
| Lloyds Banking Group plc | | | 181,900 | | | | 165,065 | |
| Nasdaq, Inc. | | | 2,000 | | | | 155,140 | |
| Marsh & McLennan Companies, Inc. | | | 1,400 | | | | 117,334 | |
| CME Group, Inc. — Class A | | | 400 | | | | 54,272 | |
| Total Financial | | | | | | | 23,722,359 | |
| | | | | | | | | |
| Consumer, Non-cyclical - 19.8% | |
| Johnson & Johnson | | | 11,600 | | | | 1,508,116 | |
| Pfizer, Inc. | | | 33,000 | | | | 1,178,100 | |
| AbbVie, Inc. | | | 13,100 | | | | 1,164,066 | |
| Merck & Company, Inc. | | | 16,400 | | | | 1,050,092 | |
| Gilead Sciences, Inc. | | | 12,300 | | | | 996,546 | |
| Roche Holding AG | | | 3,900 | | | | 995,734 | |
| Procter & Gamble Co. | | | 9,648 | | | | 877,775 | |
| Amgen, Inc. | | | 4,600 | | | | 857,670 | |
| Diageo plc | | | 26,000 | | | | 854,497 | |
| Wesfarmers Ltd. | | | 23,700 | | | | 768,191 | |
| Automatic Data Processing, Inc. | | | 6,900 | | | | 754,308 | |
| UnitedHealth Group, Inc. | | | 3,600 | | | | 705,060 | |
| Western Union Co. | | | 34,700 | | | | 666,240 | |
| Zoetis, Inc. | | | 9,100 | | | | 580,216 | |
| Stryker Corp. | | | 3,800 | | | | 539,676 | |
| Becton Dickinson and Co. | | | 2,600 | | | | 509,470 | |
| Cardinal Health, Inc. | | | 7,200 | | | | 481,824 | |
| Reed Elsevier plc | | | 20,000 | | | | 438,383 | |
| George Weston Ltd. | | | 4,700 | | | | 409,221 | |
| Woolworths Ltd. | | | 19,700 | | | | 389,489 | |
| Coca-Cola Amatil Ltd. | | | 60,200 | | | | 364,949 | |
| Orkla ASA | | | 35,000 | | | | 359,057 | |
| Swedish Match AB | | | 9,900 | | | | 347,212 | |
| Orion Oyj — Class B | | | 6,900 | | | | 320,168 | |
| MEIJI Holdings Company Ltd. | | | 3,700 | | | | 293,317 | |
| Eli Lilly & Co. | | | 3,400 | | | | 290,836 | |
| British American Tobacco plc | | | 3,000 | | | | 187,766 | |
| Quest Diagnostics, Inc. | | | 1,600 | | | | 149,824 | |
| Total Consumer, Non-cyclical | | | | | | | 18,037,803 | |
| | | | | | | | | |
| Technology - 11.9% | |
| Apple, Inc. | | | 6,600 | | | | 1,017,192 | |
| Microsoft Corp. | | | 12,800 | | | | 953,472 | |
| International Business Machines Corp. | | | 6,200 | | | | 899,496 | |
| Texas Instruments, Inc. | | | 9,100 | | | | 815,724 | |
| Paychex, Inc. | | | 13,600 | | | | 815,456 | |
| Canon, Inc. | | | 23,600 | | | | 806,452 | |
| Cie Generale des Etablissements Michelin — Class B* | | | 5,200 | | | | 759,012 | |
| Fidelity National Information Services, Inc. | | | 8,100 | | | | 756,459 | |
| Adobe Systems, Inc.* | | | 4,800 | | | | 716,064 | |
| CA, Inc. | | | 21,300 | | | | 710,994 | |
| Lam Research Corp. | | | 3,200 | | | | 592,128 | |
| Broadridge Financial Solutions, Inc. | | | 7,000 | | | | 565,740 | |
| Seagate Technology plc | | | 14,900 | | | | 494,233 | |
| Oracle Corporation Japan | | | 4,700 | | | | 369,250 | |
| NTT Data Corp. | | | 27,500 | | | | 294,259 | |
| Electronic Arts, Inc.* | | | 1,500 | | | | 177,090 | |
| Accenture plc — Class A | | | 800 | | | | 108,056 | |
| Total Technology | | | | | | | 10,851,077 | |
102 | THE GUGGENHEIM FUNDS ANNUAL REPORT | SEE NOTES TO FINANCIAL STATEMENTS. |
SCHEDULE OF INVESTMENTS (continued) | September 30, 2017 |
| WORLD EQUITY INCOME FUND | |
| | | Shares | | | Value | |
| | | | | | | |
| Industrial - 10.4% | |
| 3M Co. | | | 4,800 | | | $ | 1,007,520 | |
| Honeywell International, Inc. | | | 6,800 | | | | 963,832 | |
| United Parcel Service, Inc. — Class B | | | 6,300 | | | | 756,567 | |
| Pentair plc | | | 10,100 | | | | 686,396 | |
| FUJIFILM Holdings Corp. | | | 17,600 | | | | 683,071 | |
| TE Connectivity Ltd. | | | 8,000 | | | | 664,480 | |
| SKF AB — Class B | | | 27,900 | | | | 607,927 | |
| Skanska AB — Class B | | | 24,600 | | | | 569,843 | |
| Mizuho Financial Group, Inc. | | | 300,700 | | | | 526,733 | |
| MAN SE | | | 4,100 | | | | 462,722 | |
| Deere & Co. | | | 3,300 | | | | 414,447 | |
| Republic Services, Inc. — Class A | | | 5,700 | | | | 376,542 | |
| MTR Corporation Ltd. | | | 50,700 | | | | 295,963 | |
| Vinci S.A. | | | 3,000 | | | | 285,073 | |
| Harris Corp. | | | 2,000 | | | | 263,359 | |
| Raytheon Co. | | | 1,300 | | | | 242,554 | |
| Toyo Seikan Group Holdings Ltd. | | | 12,500 | | | | 208,852 | |
| BAE Systems plc | | | 20,200 | | | | 170,774 | |
| Lockheed Martin Corp. | | | 540 | | | | 167,557 | |
| Waste Management, Inc. | | | 1,200 | | | | 93,924 | |
| Total Industrial | | | | | | | 9,448,136 | |
| | | | | | | | | |
| Communications - 9.6% | |
| Facebook, Inc. — Class A* | | | 9,100 | | | | 1,554,917 | |
| AT&T, Inc. | | | 25,200 | | | | 987,085 | |
| Verizon Communications, Inc. | | | 19,000 | | | | 940,310 | |
| Shaw Communications, Inc. — Class B | | | 33,100 | | | | 761,804 | |
| Alphabet, Inc. — Class C* | | | 700 | | | | 671,377 | |
| Cisco Systems, Inc. | | | 16,800 | | | | 564,984 | |
| SES S.A. | | | 25,300 | | | | 553,484 | |
| BCE, Inc. | | | 11,500 | | | | 538,750 | |
| Telefonica Deutschland Holding AG | | | 91,200 | | | | 511,781 | |
| TELUS Corp. | | | 11,900 | | | | 427,987 | |
| Elisa Oyj | | | 8,600 | | | | 370,183 | |
| Amazon.com, Inc.* | | | 300 | | | | 288,405 | |
| Motorola Solutions, Inc. | | | 2,500 | | | | 212,175 | |
| Rogers Communications, Inc. — Class B | | | 3,900 | | | | 201,083 | |
| Kakaku.com, Inc. | | | 13,500 | | | | 172,049 | |
| Total Communications | | | | | | | 8,756,374 | |
| | | | | | | | | |
| Utilities - 7.3% | |
| Southern Co. | | | 16,060 | | | | 789,189 | |
| Duke Energy Corp. | | | 8,373 | | | | 702,662 | |
| CLP Holdings Ltd. | | | 68,137 | | | | 698,246 | |
| PPL Corp. | | | 18,254 | | | | 692,739 | |
| Dominion Energy, Inc. | | | 7,668 | | | | 589,899 | |
| WEC Energy Group, Inc. | | | 9,000 | | | | 565,020 | |
| CenterPoint Energy, Inc. | | | 16,000 | | | | 467,360 | |
| DTE Energy Co. | | | 3,993 | | | | 428,688 | |
| Emera, Inc. | | | 10,300 | | | | 390,087 | |
| NextEra Energy, Inc. | | | 2,000 | | | | 293,100 | |
| AGL Energy Ltd. | | | 14,300 | | | | 262,090 | |
| Engie S.A. | | | 15,300 | | | | 259,852 | |
| Entergy Corp. | | | 3,000 | | | | 229,080 | |
| Sempra Energy | | | 1,299 | | | | 148,255 | |
| SCANA Corp. | | | 2,789 | | | | 135,239 | |
| Total Utilities | | | | | | | 6,651,506 | |
| | | | | | | | | |
| Consumer, Cyclical - 6.2% | |
| Ford Motor Co. | | | 64,900 | | | | 776,853 | |
| Li & Fung Ltd. | | | 1,273,400 | | | | 639,021 | |
| Home Depot, Inc. | | | 3,800 | | | | 621,528 | |
| Berkeley Group Holdings plc | | | 11,500 | | | | 572,549 | |
| Sekisui House Ltd. | | | 30,700 | | | | 517,442 | |
| Iida Group Holdings Company Ltd. | | | 26,900 | | | | 479,572 | |
| Crown Resorts Ltd. | | | 44,000 | | | | 390,275 | |
| Harvey Norman Holdings Ltd. | | | 111,500 | | | | 339,283 | |
| LVMH Moet Hennessy Louis Vuitton SE | | | 1,200 | | | | 331,096 | |
| Compass Group plc | | | 14,807 | | | | 314,042 | |
| Vail Resorts, Inc. | | | 1,000 | | | | 228,120 | |
| Carnival plc | | | 3,500 | | | | 222,367 | |
| Yue Yuen Industrial Holdings Ltd. | | | 36,900 | | | | 140,296 | |
| McDonald’s Corp. | | | 700 | | | | 109,676 | |
| Total Consumer, Cyclical | | | | | | | 5,682,120 | |
| | | | | | | | | |
| Energy - 3.5% | |
| Woodside Petroleum Ltd. | | | 28,800 | | | | 657,266 | |
| OMV AG | | | 10,500 | | | | 611,683 | |
| Exxon Mobil Corp. | | | 5,200 | | | | 426,296 | |
| Repsol S.A. | | | 22,000 | | | | 405,366 | |
| TransCanada Corp. | | | 5,000 | | | | 247,101 | |
| EOG Resources, Inc. | | | 2,500 | | | | 241,850 | |
| Baker Hughes a GE Co. | | | 6,000 | | | | 219,720 | |
| Pembina Pipeline Corp. | | | 6,000 | | | | 210,503 | |
| Inter Pipeline Ltd. | | | 9,100 | | | | 188,509 | |
| Total Energy | | | | | | | 3,208,294 | |
| | | | | | | | | |
| Basic Materials - 3.2% | |
| DowDuPont, Inc. | | | 13,800 | | | | 955,374 | |
| LyondellBasell Industries N.V. — Class A | | | 7,600 | | | | 752,780 | |
| Mitsubishi Chemical Holdings Corp. | | | 68,400 | | | | 651,660 | |
| Nissan Chemical Industries Ltd. | | | 8,100 | | | | 285,069 | |
| Mondi plc | | | 10,100 | | | | 271,316 | |
| Total Basic Materials | | | | | | | 2,916,199 | |
| | | | | | | | | |
| Diversified - 0.6% | |
| Jardine Matheson Holdings Ltd. | | | 8,000 | | | | 506,880 | |
| | | | | | | | | |
| Total Common Stocks | | | | | | | | |
| (Cost $82,502,996) | | | | | | | 89,780,748 | |
| SEE NOTES TO FINANCIAL STATEMENTS. | THE GUGGENHEIM FUNDS ANNUAL REPORT | 103 |
SCHEDULE OF INVESTMENTS (concluded) | September 30, 2017 |
| WORLD EQUITY INCOME FUND | |
| | | Shares | | | Value | |
| | | | | | | |
MONEY MARKET FUND† - 2.0% | |
Goldman Sachs Financial Square Treasury Instruments Fund Institutional Shares 0.86%1 | | | 1,815,724 | | | $ | 1,815,724 | |
| Total Money Market Fund | | | | | | | | |
| (Cost $1,815,724) | | | | | | | 1,815,724 | |
| | | | | | | | | |
| Total Investments - 100.5% | | | | | | | | |
| (Cost $84,318,720) | | | | | | $ | 91,596,472 | |
| Other Assets & Liabilities, net - (0.5)% | | | | | | | (461,035 | ) |
| Total Net Assets - 100.0% | | | | | | $ | 91,135,437 | |
| * | Non-income producing security. |
† | Value determined based on Level 1 inputs — See Note 4. |
1 | Rate indicated is the 7 day yield as of September 30, 2017. |
| | ADR — American Depositary Receipt |
| | plc — Public Limited Company |
| | REIT — Real Estate Investment Trust |
| | |
| | See Sector Classification in Other Information section. |
The following table summarizes the inputs used to value the Fund’s investments at September 30, 2017 (See Note 4 in the Notes to Financial Statements):
| Investments in Securities (Assets) | | Level 1
Quoted
Prices | | | Level 2
Significant
Observable
Inputs | | | Level 3
Significant
Unobservable
Inputs | | | Total | |
| Common Stocks | | $ | 89,780,748 | | | $ | — | | | $ | — | | | $ | 89,780,748 | |
| Money Market Fund | | | 1,815,724 | | | | — | | | | — | | | | 1,815,724 | |
| Total Assets | | $ | 91,596,472 | | | $ | — | | | $ | — | | | $ | 91,596,472 | |
Transfers between investment levels may occur as the markets fluctuate and/or the availability of data used in an investment’s valuation changes. Transfers between valuation levels, if any, are in comparison to the valuation levels at the end of the previous fiscal year, and are effective using the fair value as of the end of the current fiscal period.
For the year ended September 30, 2017, there were no transfers between levels.
104 | THE GUGGENHEIM FUNDS ANNUAL REPORT | SEE NOTES TO FINANCIAL STATEMENTS. |
| STATEMENT OF ASSETS AND LIABILITIES |
| September 30, 2017 |
| Assets: | |
| Investments, at value (cost $84,318,720) | | $ | 91,596,472 | |
| Foreign currency, at value (cost $70,184) | | | 70,137 | |
| Prepaid expenses | | | 41,512 | |
| Receivables: | |
| Foreign taxes reclaim | | | 222,799 | |
| Dividends | | | 206,272 | |
| Fund shares sold | | | 62,165 | |
| Currency | | | 26,743 | |
| Interest | | | 386 | |
| Total assets | | | 92,226,486 | |
| | | | | |
| Liabilities: | |
| Overdraft due to custodian bank | | | 6,313 | |
| Payable for: | |
| Securities purchased | | | 886,875 | |
| Fund shares redeemed | | | 67,910 | |
| Transfer agent/maintenance fees | | | 23,220 | |
| Distribution and service fees | | | 21,739 | |
| Management fees | | | 13,487 | |
| Fund accounting/administration fees | | | 5,933 | |
| Trustees’ fees* | | | 65 | |
| Miscellaneous | | | 65,507 | |
| Total liabilities | | | 1,091,049 | |
| Net assets | | $ | 91,135,437 | |
| | | | | |
| Net assets consist of: | |
| Paid in capital | | $ | 89,453,472 | |
| Accumulated net investment loss | | | (32,174 | ) |
| Accumulated net realized loss on investments | | | (5,567,514 | ) |
| Net unrealized appreciation on investments | | | 7,281,653 | |
| Net assets | | $ | 91,135,437 | |
| | | | | |
| A-Class: | |
| Net assets | | $ | 80,597,822 | |
| Capital shares outstanding | | | 5,429,791 | |
| Net asset value per share | | $ | 14.84 | |
| Maximum offering price per share (Net asset value divided by 95.25%) | | $ | 15.58 | |
| | | | | |
| C-Class: | |
| Net assets | | $ | 6,449,270 | |
| Capital shares outstanding | | | 506,915 | |
| Net asset value per share | | $ | 12.72 | |
| | | | | |
| P-Class: | |
| Net assets | | $ | 354,553 | |
| Capital shares outstanding | | | 23,517 | |
| Net asset value per share | | $ | 15.08 | |
| | | | | |
| Institutional Class: | |
| Net assets | | $ | 3,733,792 | |
| Capital shares outstanding | | | 253,231 | |
| Net asset value per share | | $ | 14.74 | |
| STATEMENT OF OPERATIONS |
| Year Ended September 30, 2017 |
| Investment Income: | |
| Dividends (net of foreign withholding tax of $221,093) | | $ | 3,099,969 | |
| Interest | | | 5,243 | |
| Total investment income | | | 3,105,212 | |
| | | | | |
| Expenses: | |
| Management fees | | | 625,527 | |
| Distribution and service fees: | |
| A-Class | | | 201,041 | |
| C-Class | | | 59,176 | |
| P-Class | | | 426 | |
| Transfer agent/maintenance fees: | |
| A-Class | | | 66,440 | |
| C-Class | | | 10,717 | |
| P-Class | | | 784 | |
| Institutional Class | | | 1,414 | |
| Fund accounting/administration fees | | | 71,636 | |
| Line of credit fees | | | 20,628 | |
| Custodian fees | | | 11,310 | |
| Trustees’ fees* | | | 7,396 | |
| Recoupment of previously waived fees: | |
| A-Class | | | 9,101 | |
| C-Class | | | 144 | |
| Institutional Class | | | 788 | |
| Miscellaneous | | | 157,450 | |
| Total expenses | | | 1,243,978 | |
| Less: | |
| Expenses reimbursed by Adviser: | | | | |
| A-Class | | | (32,861 | ) |
| C-Class | | | (7,537 | ) |
| P-Class | | | (728 | ) |
| Institutional Class | | | (880 | ) |
| Expenses waived by Adviser | | | (59,211 | ) |
| Total waived/reimbursed expenses | | | (101,217 | ) |
| Net expenses | | | 1,142,761 | |
| Net investment income | | | 1,962,451 | |
| | | | | |
| Net Realized and Unrealized Gain (Loss): | |
| Net realized gain (loss) on: | |
| Investments | | | 6,040,095 | |
| Futures contracts | | | (343,593 | ) |
| Foreign currency transactions | | | (12,530 | ) |
| Net realized gain | | | 5,683,972 | |
| Net change in unrealized appreciation (depreciation) on: | |
| Investments | | | 2,673,287 | |
| Futures contracts | | | 19,765 | |
| Foreign currency translations | | | 8,172 | |
| Net change in unrealized appreciation (depreciation) | | | 2,701,224 | |
| Net realized and unrealized gain | | | 8,385,196 | |
| Net increase in net assets resulting from operations | | $ | 10,347,647 | |
| * | Relates to Trustees not deemed “interested persons” within the meaning of Section 2(a)(19) of the 1940 Act. |
| SEE NOTES TO FINANCIAL STATEMENTS. | THE GUGGENHEIM FUNDS ANNUAL REPORT | 105 |
| STATEMENTS OF CHANGES IN NET ASSETS |
| | | Year Ended
September 30,
2017 | | | Year Ended
September 30,
2016 | |
| Increase (Decrease) in Net Assets from Operations: | | | | | | |
| Net investment income | | $ | 1,962,451 | | | $ | 2,035,182 | |
| Net realized gain (loss) on investments | | | 5,683,972 | | | | (1,633,024 | ) |
| Net change in unrealized appreciation (depreciation) on investments | | | 2,701,224 | | | | 10,283,016 | |
| Net increase in net assets resulting from operations | | | 10,347,647 | | | | 10,685,174 | |
| | | | | | | | | |
| Distributions to shareholders from: | | | | | | | | |
| Net investment income | | | | | | | | |
| A-Class | | | (1,967,488 | ) | | | (1,891,462 | ) |
| C-Class | | | (114,346 | ) | | | (96,485 | ) |
| P-Class | | | (4,295 | ) | | | (3,486 | ) |
| Institutional Class | | | (76,242 | ) | | | (76,190 | ) |
| Total distributions to shareholders | | | (2,162,371 | ) | | | (2,067,623 | ) |
| | | | | | | | | |
| Capital share transactions: | | | | | | | | |
| Proceeds from sale of shares | | | | | | | | |
| A-Class | | | 13,238,403 | | | | 18,583,958 | |
| C-Class | | | 1,571,277 | | | | 1,520,462 | |
| P-Class | | | 257,778 | | | | 1,274,125 | |
| Institutional Class | | | 2,745,914 | | | | 2,057,895 | |
| Distributions reinvested | | | | | | | | |
| A-Class | | | 1,954,121 | | | | 1,834,883 | |
| C-Class | | | 105,916 | | | | 84,172 | |
| P-Class | | | 4,295 | | | | 3,486 | |
| Institutional Class | | | 64,249 | | | | 39,956 | |
| Cost of shares redeemed | | | | | | | | |
| A-Class | | | (22,525,744 | ) | | | (21,141,116 | ) |
| C-Class | | | (1,219,393 | ) | | | (2,663,968 | ) |
| P-Class | | | (59,428 | ) | | | (1,141,200 | ) |
| Institutional Class | | | (2,173,544 | ) | | | (4,137,425 | ) |
| Net decrease from capital share transactions | | | (6,036,156 | ) | | | (3,684,772 | ) |
| Net increase in net assets | | | 2,149,120 | | | | 4,932,779 | |
| | | | | | | | | |
| Net assets: | | | | | | | | |
| Beginning of year | | | 88,986,317 | | | | 84,053,538 | |
| End of year | | $ | 91,135,437 | | | $ | 88,986,317 | |
| Accumulated net investment loss at end of year | | $ | (32,174 | ) | | $ | (325,500 | ) |
106 | THE GUGGENHEIM FUNDS ANNUAL REPORT | SEE NOTES TO FINANCIAL STATEMENTS. |
STATEMENTS OF CHANGES IN NET ASSETS (concluded) |
| | | Year Ended
September 30,
2017 | | | Year Ended
September 30,
2016 | |
| Capital share activity: | | | | | | |
| Shares sold | | | | | | |
| A-Class | | | 954,221 | | | | 1,431,215 | |
| C-Class | | | 129,787 | | | | 135,606 | |
| P-Class | | | 17,585 | | | | 98,351 | |
| Institutional Class | | | 194,275 | | | | 158,922 | |
| Shares issued from reinvestment of distributions | | | | | | | | |
| A-Class | | | 136,806 | | | | 138,084 | |
| C-Class | | | 8,654 | | | | 7,362 | |
| P-Class | | | 295 | | | | 265 | |
| Institutional Class | | | 4,518 | | | | 3,033 | |
| Shares redeemed | | | | | | | | |
| A-Class | | | (1,611,230 | ) | | | (1,610,092 | ) |
| C-Class | | | (100,543 | ) | | | (236,515 | ) |
| P-Class | | | (4,084 | ) | | | (89,636 | ) |
| Institutional Class | | | (155,571 | ) | | | (323,244 | ) |
| Net decrease in shares | | | (425,287 | ) | | | (286,649 | ) |
| SEE NOTES TO FINANCIAL STATEMENTS. | THE GUGGENHEIM FUNDS ANNUAL REPORT | 107 |
This table is presented to show selected data for a share outstanding throughout each period and to assist shareholders in evaluating a Fund’s performance for the periods presented.
| A-Class | | Year Ended
September 30,
2017 | | | Year Ended
September 30,
2016 | | | Year Ended
September 30,
2015 | | | Year Ended
September 30,
2014 | | | Year Ended
September 30,
2013 | |
| Per Share Data | | | | | | | | | | | | | | | |
| Net asset value, beginning of period | | $ | 13.54 | | | $ | 12.28 | | | $ | 13.51 | | | $ | 12.60 | | | $ | 10.55 | |
| Income (loss) from investment operations: | |
Net investment income (loss)a | | | .31 | | | | .31 | | | | .29 | | | | .38 | | | | .18 | |
| Net gain (loss) on investments (realized and unrealized) | | | 1.34 | | | | 1.26 | | | | (1.18 | ) | | | .95 | | | | 2.16 | |
| Total from investment operations | | | 1.65 | | | | 1.57 | | | | (.89 | ) | | | 1.33 | | | | 2.34 | |
| Less distributions from: | |
| Net investment income | | | (.35 | ) | | | (.31 | ) | | | (.34 | ) | | | (.42 | ) | | | (.29 | ) |
| Total distributions | | | (.35 | ) | | | (.31 | ) | | | (.34 | ) | | | (.42 | ) | | | (.29 | ) |
| Net asset value, end of period | | $ | 14.84 | | | $ | 13.54 | | | $ | 12.28 | | | $ | 13.51 | | | $ | 12.60 | |
| | |
Total Returnb | | | 12.31 | % | | | 12.85 | % | | | (6.70 | %) | | | 10.62 | % | | | 22.58 | % |
| Ratios/Supplemental Data | |
| Net assets, end of period (in thousands) | | $ | 80,598 | | | $ | 80,575 | | | $ | 73,568 | | | $ | 78,783 | | | $ | 65,966 | |
| Ratios to average net assets: | |
| Net investment income (loss) | | | 2.23 | % | | | 2.36 | % | | | 2.21 | % | | | 2.81 | % | | | 1.59 | % |
Total expensesf | | | 1.34 | % | | | 1.48 | % | | | 1.48 | % | | | 1.66 | % | | | 1.93 | % |
Net expensesc,d | | | 1.24 | %g | | | 1.48 | %g | | | 1.43 | %g | | | 1.49 | %g | | | 1.59 | % |
| Portfolio turnover rate | | | 94 | % | | | 51 | % | | | 131 | % | | | 131 | % | | | 154 | % |
| C-Class | | Year Ended
September 30,
2017 | | | Year Ended
September 30,
2016 | | | Year Ended
September 30,
2015 | | | Year Ended
September 30,
2014 | | | Year Ended
September 30,
2013 | |
| Per Share Data | | | | | | | | | | | | | | | |
| Net asset value, beginning of period | | $ | 11.63 | | | $ | 10.55 | | | $ | 11.61 | | | $ | 10.79 | | | $ | 9.01 | |
| Income (loss) from investment operations: | |
Net investment income (loss)a | | | .19 | | | | .18 | | | | .17 | | | | .25 | | | | .08 | |
| Net gain (loss) on investments (realized and unrealized) | | | 1.13 | | | | 1.09 | | | | (1.02 | ) | | | .81 | | | | 1.84 | |
| Total from investment operations | | | 1.32 | | | | 1.27 | | | | (.85 | ) | | | 1.06 | | | | 1.92 | |
| Less distributions from: | |
| Net investment income | | | (.23 | ) | | | (.19 | ) | | | (.21 | ) | | | (.24 | ) | | | (.14 | ) |
| Total distributions | | | (.23 | ) | | | (.19 | ) | | | (.21 | ) | | | (.24 | ) | | | (.14 | ) |
| Net asset value, end of period | | $ | 12.72 | | | $ | 11.63 | | | $ | 10.55 | | | $ | 11.61 | | | $ | 10.79 | |
| | |
Total Returnb | | | 11.46 | % | | | 12.05 | % | | | (7.40 | %) | | | 9.79 | % | | | 21.57 | % |
| Ratios/Supplemental Data | |
| Net assets, end of period (in thousands) | | $ | 6,449 | | | $ | 5,455 | | | $ | 5,936 | | | $ | 5,337 | | | $ | 3,377 | |
| Ratios to average net assets: | |
| Net investment income (loss) | | | 1.53 | % | | | 1.59 | % | | | 1.50 | % | | | 2.13 | % | | | 0.80 | % |
Total expensesf | | | 2.19 | % | | | 2.35 | % | | | 2.28 | % | | | 2.62 | % | | | 2.89 | % |
Net expensesc,d | | | 1.99 | %g | | | 2.23 | %g | | | 2.23 | %g | | | 2.24 | %g | | | 2.35 | % |
| Portfolio turnover rate | | | 94 | % | | | 51 | % | | | 131 | % | | | 131 | % | | | 154 | % |
108 | THE GUGGENHEIM FUNDS ANNUAL REPORT | SEE NOTES TO FINANCIAL STATEMENTS. |
FINANCIAL HIGHLIGHTS (continued) |
This table is presented to show selected data for a share outstanding throughout each period and to assist shareholders in evaluating a Fund’s performance for the periods presented.
| P-Class | | Year Ended
September 30,
2017 | | | Year Ended
September 30,
2016 | | | Period Ended
September 30,
2015e | |
| Per Share Data | | | | | | | | | |
| Net asset value, beginning of period | | $ | 13.73 | | | $ | 12.33 | | | $ | 13.62 | |
| Income (loss) from investment operations: | |
Net investment income (loss)a | | | .33 | | | | .33 | | | | .12 | |
| Net gain (loss) on investments (realized and unrealized) | | | 1.35 | | | | 1.35 | | | | (1.29 | ) |
| Total from investment operations | | | 1.68 | | | | 1.68 | | | | (1.17 | ) |
| Less distributions from: | |
| Net investment income | | | (.33 | ) | | | (.28 | ) | | | (.12 | ) |
| Total distributions | | | (.33 | ) | | | (.28 | ) | | | (.12 | ) |
| Net asset value, end of period | | $ | 15.08 | | | $ | 13.73 | | | $ | 12.33 | |
| | |
Total Returnb | | | 12.32 | % | | | 13.73 | % | | | (8.64 | %) |
| Ratios/Supplemental Data | |
| Net assets, end of period (in thousands) | | $ | 355 | | | $ | 133 | | | $ | 9 | |
| Ratios to average net assets: | |
| Net investment income (loss) | | | 2.28 | % | | | 2.58 | % | | | 2.14 | % |
Total expensesf | | | 1.76 | % | | | 1.33 | % | | | 3.54 | % |
Net expensesc,g | | | 1.24 | % | | | 1.33 | % | | | 1.48 | % |
| Portfolio turnover rate | | | 94 | % | | | 51 | % | | | 131 | % |
| SEE NOTES TO FINANCIAL STATEMENTS. | THE GUGGENHEIM FUNDS ANNUAL REPORT | 109 |
FINANCIAL HIGHLIGHTS (concluded) |
This table is presented to show selected data for a share outstanding throughout each period and to assist shareholders in evaluating a Fund’s performance for the periods presented.
| Institutional Class | | Year Ended
September 30,
2017 | | | Year Ended
September 30,
2016 | | | Year Ended
September 30,
2015 | | | Year Ended
September 30,
2014 | | | Year Ended
September 30,
2013 | |
| Per Share Data | | | | | | | | | | | | | | | |
| Net asset value, beginning of period | | $ | 13.44 | | | $ | 12.23 | | | $ | 13.45 | | | $ | 12.53 | | | $ | 10.50 | |
| Income (loss) from investment operations: | |
Net investment income (loss)a | | | .35 | | | | .31 | | | | .36 | | | | .44 | | | | .28 | |
| Net gain (loss) on investments (realized and unrealized) | | | 1.33 | | | | 1.28 | | | | (1.21 | ) | | | .90 | | | | 2.10 | |
| Total from investment operations | | | 1.68 | | | | 1.59 | | | | (.85 | ) | | | 1.34 | | | | 2.38 | |
| Less distributions from: | |
| Net investment income | | | (.38 | ) | | | (.38 | ) | | | (.37 | ) | | | (.42 | ) | | | (.35 | ) |
| Total distributions | | | (.38 | ) | | | (.38 | ) | | | (.37 | ) | | | (.42 | ) | | | (.35 | ) |
| Net asset value, end of period | | $ | 14.74 | | | $ | 13.44 | | | $ | 12.23 | | | $ | 13.45 | | | $ | 12.53 | |
| | |
Total Returnb | | | 12.61 | % | | | 13.11 | % | | | (6.42 | %) | | | 10.83 | % | | | 23.17 | % |
| Ratios/Supplemental Data | |
| Net assets, end of period (in thousands) | | $ | 3,734 | | | $ | 2,824 | | | $ | 4,541 | | | $ | 911 | | | $ | 252 | |
| Ratios to average net assets: | |
| Net investment income (loss) | | | 2.50 | % | | | 2.42 | % | | | 2.70 | % | | | 3.27 | % | | | 2.42 | % |
Total expensesf | | | 1.09 | % | | | 1.30 | % | | | 1.23 | % | | | 1.33 | % | | | 1.73 | % |
Net expensesc,d | | | 0.98 | %g | | | 1.22 | %g | | | 1.23 | %g | | | 1.23 | %g | | | 1.26 | % |
| Portfolio turnover rate | | | 94 | % | | | 51 | % | | | 131 | % | | | 131 | % | | | 154 | % |
a | Net investment income (loss) per share was computed using average shares outstanding throughout the period. |
b | Total return does not reflect the impact of any applicable sales charges. |
c | Net expense information reflects the expense ratios after expense waivers and reimbursements, as applicable. |
d | The portion of the ratios of net expenses to average net assets attributable to recoupments of prior fee reductions or expense reimbursements is 0.01% for A-Class, 0.01% for C-Class and 0.03% for Institutional Class. |
e | Since commencement of operations: May 1, 2015. Percentage amounts for the period, except total return and portfolio turnover rate, have been annualized. |
f | Does not include expenses of the underlying funds in which the Fund invests. |
g | Net expenses may include expenses that are excluded from the expense limitation agreement and recouped amounts. Excluding these expenses, the operating expense ratios for the periods presented would be: |
| | | 9/30/17 | 9/30/16 | 9/30/15 | 9/30/14 |
| | A-Class | 1.22% | 1.46% | 1.46% | 1.46% |
| | C-Class | 1.97% | 2.21% | 2.21% | 2.21% |
| | P-Class | 1.22% | 1.32% | 1.46% | — |
| | Institutional Class | 0.96% | 1.21% | 1.21% | 1.21% |
110 | THE GUGGENHEIM FUNDS ANNUAL REPORT | SEE NOTES TO FINANCIAL STATEMENTS. |
| NOTES TO FINANCIAL STATEMENTS |
Note 1 – Organization and Significant Accounting Policies
Organization
Guggenheim Funds Trust (the “Trust”), a Delaware statutory trust, is registered with the SEC under the Investment Company Act of 1940 (“1940 Act”), as an open-ended investment company of the series type. Each series, in effect, is representing a separate Fund. The Trust is authorized to issue an unlimited number of shares. The Trust accounts for the assets of each Fund separately.
The Trust offers a combination of five separate classes of shares, A-Class shares, C-Class shares, P-Class shares, R6-Class shares and Institutional Class shares. Sales of shares of each Class are made without a front-end sales charge at the net asset value per share (“NAV”), with the exception of A-Class shares. A-Class shares are sold at the NAV, plus the applicable front-end sales charge. The sales charge varies depending on the amount purchased. A-Class share purchases of $1 million or more are exempt from the front-end sales charge but have a 1% contingent deferred sales charge (“CDSC”), if shares are redeemed within 12 months of purchase. C-Class shares have a 1% CDSC if shares are redeemed within 12 months of purchase. Institutional Class shares are offered primarily for direct investment by institutions such as pension and profit sharing plans, endowments, foundations and corporations. Institutional Class shares require a minimum initial investment of $2 million and a minimum account balance of $1 million. At September 30, 2017, the Trust consisted of nineteen funds.
This report covers the Alpha Opportunity Fund, Large Cap Value Fund, Market Neutral Real Estate Fund, Risk Managed Real Estate Fund, Small Cap Value Fund, StylePlus��Large Core Fund, StylePlus—Mid Growth Fund and World Equity Income Fund (the “Funds”), each a diversified investment company, with the exception of the Large Cap Value Fund, Market Neutral Real Estate Fund and Risk Managed Real Estate Fund, which are each a non-diversified investment company. Only A-Class, C-Class, P-Class and Institutional Class shares had been issued by the Funds.
Security Investors, LLC, which operates under the name Guggenheim Investments (“GI”) and Guggenheim Partners Investment Management, LLC (“GPIM”), provides advisory services. Guggenheim Funds Distributors, LLC (“GFD”) acts as principal underwriter for the Trust. GI, GPIM and GFD are affiliated entities.
Significant Accounting Policies
The Funds operate as investment companies and, accordingly, follow the investment company accounting and reporting guidance of the Financial Accounting Standards Board (“FASB”) Accounting Standards Codification Topic 946 Financial Services – Investment Companies.
The following significant accounting policies are in conformity with U.S. generally accepted accounting principles (“U.S. GAAP”) and are consistently followed by the Trust. This requires management to make estimates and assumptions that affect the reported amount of assets and liabilities, contingent assets and liabilities at the date of the financial statements, and the reported amounts of revenues and expenses during the reporting period. Actual results could differ from these estimates. All time references are based on Eastern Time.
The NAV of each Class of the Funds is calculated by dividing the market value of the Fund’s securities and other assets, less all liabilities, attributable to the Class by the number of outstanding shares of the Class.
(a) Valuation of Investments
The Board of Trustees of the Funds (the “Board”) has adopted policies and procedures for the valuation of the Funds’ investments (the “Valuation Procedures”). Pursuant to the Valuation Procedures, the Board has delegated to a valuation committee, consisting of representatives from Guggenheim’s investment management, fund administration, legal and compliance departments (the “Valuation Committee”), the day-to-day responsibility for implementing the Valuation Procedures, including, under most circumstances, the responsibility for determining the fair value of the Funds’ securities and/or other assets.
Valuations of the Funds’ securities are supplied primarily by pricing services appointed pursuant to the processes set forth in the Valuation Procedures. The Valuation Committee convenes monthly, or more frequently as needed, to review the valuation of all assets which have been fair valued for reasonableness. The Funds’ officers, through the Valuation Committee and consistent with the monitoring and review responsibilities set forth in the Valuation Procedures, regularly review procedures used and valuations provided by the pricing services.
If the pricing service cannot or does not provide a valuation for a particular investment or such valuation is deemed unreliable, such investment is fair valued by the Valuation Committee.
Equity securities listed on an exchange (New York Stock Exchange (“NYSE”) or American Stock Exchange) are valued at the last quoted sale price as of the close of business on the NYSE, usually 4:00 p.m. on the valuation date. Equity securities listed on the NASDAQ market system are valued at the NASDAQ Official Closing Price on the valuation date, which may not necessarily represent the last sale price. If there has been no sale on such exchange or NASDAQ on a given day, the security is valued at the closing bid price on that day.
| | THE GUGGENHEIM FUNDS ANNUAL REPORT | 111 |
NOTES TO FINANCIAL STATEMENTS (continued) |
Generally, trading in foreign securities markets is substantially completed each day at various times prior to the close of the NYSE. The values of foreign securities are determined as of the close of such foreign markets or the close of the NYSE, if earlier. All investments quoted in foreign currencies are valued in U.S. dollars on the basis of the foreign currency exchange rates prevailing at the close of U.S. business at 4:00 p.m. Investments in foreign securities may involve risks not present in domestic investments. The Valuation Committee will determine the current value of such foreign securities by taking into consideration certain factors which may include those discussed above, as well as the following factors, among others: the value of the securities traded on other foreign markets, ADR trading, closed-end fund trading, foreign currency exchange activity, and the trading prices of financial products that are tied to foreign securities such as World Equity Benchmark Securities. In addition, under the Valuation Procedures, the Valuation Committee, GI and GPIM are authorized to use prices and other information supplied by a third party pricing vendor in valuing foreign securities.
Open-end investment companies (“mutual funds”) are valued at their NAV as of the close of business, on the valuation date. Exchange-traded funds (“ETFs”) and closed-end investment companies (“CEFs”) are valued at the last quoted sale price.
The value of futures contracts is accounted for using the unrealized gain or loss on the contracts that is determined by marking the contracts to their current realized settlement prices. Financial futures contracts are valued at the 4:00 p.m. price on the valuation date. In the event that the exchange for a specific futures contract closes earlier than 4:00 p.m., the futures contract is valued at the Official Settlement Price of the exchange. However, the underlying securities from which the futures contract value is derived are monitored until 4:00 p.m. to determine if fair valuation would provide a more accurate valuation.
The values of over-the-counter (“OTC”) swap agreements entered into by a Fund are accounted for using the unrealized gains or losses on the agreements that are determined by marking the agreements to the last quoted value of the index that the swaps pertain to at the close of the NYSE. The swaps’ values are then adjusted to include dividends accrued, financing charges and/or interest associated with the swap agreements.
Investments for which market quotations are not readily available are fair-valued as determined in good faith by GI and GPIM under the direction of the Board using methods established or ratified by the Board. Valuations in accordance with these methods are intended to reflect each security’s (or asset’s) “fair value”. Each such determination is based on a consideration of all relevant factors, which are likely to vary from one pricing context to another. Examples of such factors may include, but are not limited to market prices; sale prices; broker quotes; and models which derive prices based on inputs such as prices of securities with comparable maturities and characteristics, or based on inputs such as anticipated cash flows or collateral, spread over Treasuries, and other information analysis.
In connection with futures contracts and other derivative investments, such factors may include obtaining information as to how (a) these contracts and other derivative investments trade in the futures or other derivative markets, respectively, and (b) the securities underlying these contracts and other derivative investments trade in the cash market.
(b) Short Sales
When a Fund engages in a short sale of a security, an amount equal to the proceeds is reflected as an asset and an equivalent liability. The amount of the liability is subsequently marked-to-market to reflect the market value of the short sale. The Fund maintains a segregated account of cash and/or securities as collateral for short sales.
Fees, if any, paid to brokers to borrow securities in connection with short sales are recorded as interest expense. In addition, the Fund must pay out the dividend rate of the equity or coupon rate of the obligation to the lender and record this as an expense. Short dividend or interest expense is a cost associated with the investment objective of short sales transactions, rather than an operational cost associated with the day-to-day management of any mutual fund. The Fund may also receive rebate income from the broker resulting from the investment of the proceeds from securities sold short.
(c) Futures Contracts
Upon entering into a futures contract, a Fund deposits and maintains as collateral such initial margin as required by the exchange on which the transaction is affected. Pursuant to the contract, the Fund agrees to receive from or pay to the broker an amount of cash equal to the daily fluctuation in value of the contract. Such receipts or payments are known as variation margin and are recorded by the Fund as unrealized gains or losses. When the contract is closed, the Fund records a realized gain or loss equal to the difference between the value of the contract at the time it was opened and the value at the time it was closed.
(d) Swap Agreements
Swap agreements are marked-to-market daily and the change, if any, is recorded as unrealized gain or loss. Payments received or made as a result of an agreement or termination of an agreement are recognized as realized gains or losses.
| 112 | THE GUGGENHEIM FUNDS ANNUAL REPORT | |
NOTES TO FINANCIAL STATEMENTS (continued) |
(e) Foreign Taxes
The Funds may be subject to foreign taxes (a portion of which may be reclaimable) on income, stock dividends, capital gains on investments or certain foreign currency transactions. All foreign taxes are recorded in accordance with the applicable foreign tax regulations and rates that exist in the foreign jurisdictions in which the Funds invest. These foreign taxes, if any, are paid by the Funds and reflected in their statement of operations as follows: foreign taxes withheld at source are presented as a reduction of income and foreign taxes on capital gains from sales of investments are included with the net realized gain (loss) on investments. Foreign taxes payable or deferred as of September 30, 2017, if any, are disclosed in the Funds’ statements of assets and liabilities.
(f) Security Transactions
Security transactions are recorded on the trade date for financial reporting purposes. Realized gains and losses from securities transactions are recorded using the identified cost basis. Proceeds from lawsuits related to investment holdings are recorded as realized gains in the respective Fund. Taxable non-cash dividends are recorded as dividend income. Interest income, including amortization of premiums and accretion of discounts, is accrued on a daily basis. Amendment fees are earned as compensation for evaluating and accepting changes to the original loan agreement and are recognized when received. Dividend income from REITs is recorded based on the income included in the distributions received from the REIT investments using published REIT classifications, including some management estimates when actual amounts are not available. Distributions received in excess of this estimated amount are recorded as a reduction of the cost of investments or reclassified to capital gains. The actual amounts of income, return of capital, and capital gains are only determined by each REIT after its fiscal year-end, and may differ from the estimated amounts.
(g) Distributions
Dividends from net investment income are declared quarterly in the World Equity Income Fund and Risk Managed Real Estate Fund. Dividends are reinvested in additional shares unless shareholders request payment in cash. Distributions of net investment income in the remaining Funds and distributions of net realized gains, if any, in all Funds are declared at least annually and recorded on the ex-dividend date and are determined in accordance with income tax regulations which may differ from U.S. GAAP.
(h) Class Allocations
Interest and dividend income, most expenses, all realized gains and losses, and all unrealized gains and losses are allocated to the classes based upon the value of the outstanding shares in each Class. Certain costs, such as distribution and service fees are charged directly to specific classes. In addition, certain expenses have been allocated to the individual Funds in the Trust on a pro rata basis upon the respective aggregate net assets of each Fund included in the Trust.
(i) Earnings Credits
Under the fee arrangement with the custodian, the Funds may earn credits based on overnight custody cash balances. These credits are utilized to reduce related custodial expenses. The custodian fees disclosed in the Statement of Operations are before the reduction in expense from the related earnings credits, if any. For the year ended September 30, 2017, there were no earnings credits received.
(j) Cash
The Funds may leave cash overnight in their cash account with the custodian. Periodically, a Fund may have cash due to the custodian bank as an overdraft balance. A fee is incurred on this overdraft, calculated by multiplying the overdraft by a rate based on the federal funds rate, which was 1.06% at September 30, 2017.
The accounting records of the Fund are maintained in U.S. dollars. All assets and liabilities initially expressed in foreign currencies are converted into U.S. dollars at prevailing exchange rates. Purchases and sales of investment securities, dividend and interest income, and certain expenses are translated at the rates of exchange prevailing on the respective dates of such transactions.
Changes in the relationship of these foreign currencies to the U.S. dollar can significantly affect the value of the investments and earnings of the Funds. Foreign investments may also subject the Funds to foreign government exchange restrictions, expropriation, taxation or other political, social or economic developments, all of which could affect the market and/or credit risk of the investments.
The Funds do not isolate that portion of the results of operations resulting from changes in the foreign exchange rates on investments from the fluctuations arising from changes in the market prices of securities held. Such fluctuations are included with the net realized and unrealized gain or loss on investments.
Reported net realized foreign exchange gains and losses arise from sales of foreign currencies and currency gains or losses realized between the trade and settlement dates on investment transactions. Net unrealized exchange gains and losses arise from changes in the fair values of assets and liabilities other than investments in securities at the fiscal period end, resulting from changes in exchange rates.
| | THE GUGGENHEIM FUNDS ANNUAL REPORT | 113 |
NOTES TO FINANCIAL STATEMENTS (continued) |
(k) Indemnifications
Under the Funds’ organizational documents, the Trustees and Officers are indemnified against certain liabilities arising out of the performance of their duties to the Trust. In addition, throughout the normal course of business, the Funds enter into contracts that contain a variety of representations and warranties which provide general indemnifications. The Funds’ maximum exposure under these arrangements is unknown, as this would involve future claims that may be made against the Funds and/or their affiliates that have not yet occurred. However, based on experience, the Funds expect the risk of loss to be remote.
Note 2 – Financial Instruments and Derivatives
As part of their investment strategy, the Funds utilize short sales and a variety of derivative instruments. These investments involve, to varying degrees, elements of market risk and risks in excess of the amounts recognized in the Statements of Assets and Liabilities. Valuation and accounting treatment of these instruments can be found under Significant Accounting Policies in Note 1 of these Notes to Financial Statements.
Short Sales
A short sale is a transaction in which a Fund sells a security it does not own. If the security sold short decreases in price between the time the Fund sells the security and closes its short position, the Fund will realize a gain on the transaction. Conversely, if the security increases in price during the period, the Fund will realize a loss on the transaction. The risk of such price increases is the principal risk of engaging in short sales.
Derivatives
Derivatives are instruments whose values depend on, or are derived from, in whole or in part, the value of one or more other assets, such as securities, currencies, commodities or indices. Derivative instruments may be used to increase investment flexibility (including to maintain cash reserves while maintaining exposure to certain other assets), for risk management (hedging) purposes, to facilitate trading, to reduce transaction costs and to pursue higher investment returns. Derivative instruments may also be used to mitigate certain investment risks, such as foreign currency exchange rate risk, interest rate risk and credit risk. U.S. GAAP requires disclosures to enable investors to better understand how and why a Fund uses derivative instruments, how these derivative instruments are accounted for and their effects on the Fund’s financial position and results of operations.
The Funds may utilize derivatives for the following purposes:
Hedge: an investment made in order to reduce the risk of adverse price movements in a security, by taking an offsetting position to protect against broad market moves.
Index Exposure: the use of an instrument to obtain exposure to a listed or other type of index.
Leverage: gaining total exposure to equities or other assets on the long and short sides at greater than 100% of invested capital.
For any Fund whose investment strategy consistently involves applying leverage, the value of the Fund’s shares will tend to increase or decrease more than the value of any increase or decrease in the underlying index or other asset. In addition, because an investment in derivative instruments generally requires a small investment relative to the amount of investment exposure assumed, an opportunity for increased net income is created; but, at the same time, leverage risk will increase. The Fund’s use of leverage, through borrowings or instruments such as derivatives, may cause the Fund to be more volatile and riskier than if they had not been leveraged.
Futures
A futures contract is an agreement to purchase (long) or sell (short) an agreed amount of securities or other instruments at a set price for delivery at a future date. There are significant risks associated with a Fund’s use of futures contracts, including (i) there may be an imperfect or no correlation between the changes in market value of the underlying asset and the prices of futures contracts; (ii) there may not be a liquid secondary market for a futures contract; (iii) trading restrictions or limitations may be imposed by an exchange; and (iv) government regulations may restrict trading in futures contracts. When investing in futures, there is minimal counterparty credit risk to a Fund because futures are exchange-traded and the exchange’s clearinghouse, as counterparty to all exchange-traded futures, guarantees against default. Cash deposits are shown as segregated cash with broker on the Statements of Assets and Liabilities; securities held as collateral are noted on the Schedules of Investments.
| 114 | THE GUGGENHEIM FUNDS ANNUAL REPORT | |
NOTES TO FINANCIAL STATEMENTS (continued) |
The following table represents the Funds’ use and volume of futures on a quarterly basis:
| | | | Average Notional | |
| Fund | Use | | Long | | | Short | |
| StylePlus—Large Core Fund | Index exposure | | $ | 1,424,856 | | | $ | — | |
| StylePlus—Mid Growth Fund | Index exposure | | | 1,603,910 | | | | — | |
| World Equity Income Fund | Hedge | | | — | | | | 6,464,495 | |
Swaps
A swap is an agreement that obligates two parties to exchange a series of cash flows at specified intervals based upon or calculated by reference to changes in specified prices or rates for a specified amount of an underlying asset. A Fund utilizing OTC swaps bears the risk of loss of the amount expected to be received under a swap agreement in the event of the default or bankruptcy of a swap agreement counterparty or if the underlying asset declines in value. Certain standardized swaps are subject to mandatory central clearing. Central clearing generally reduces counterparty credit risk and increases liquidity, but central clearing does not make swap transactions risk-free. Additionally, there is no guarantee that a Fund or an underlying fund could eliminate its exposure under an outstanding swap agreement by entering into an offsetting swap agreement with the same or another party.
Total return swaps involve commitments where single or multiple cash flows are exchanged based on the price of an underlying reference asset (such as index or basket) or a fixed or variable interest rate. Index swaps will usually be computed based on the current index value as of the close of regular trading on the NYSE or other exchange, with the swap value being adjusted to include dividends accrued, financing charges and/or interest associated with the swap agreement. A fund utilizing a total return index swap bears the risk of loss of the amount expected to be received under a swap agreement in the event of the default or bankruptcy of a swap agreement counterparty or if the underlying index declines in value.
The following table represents the Funds’ use and volume of total return swaps on a quarterly basis:
| | | | Average Notional | |
| Fund | Use | | Long | | | Short | |
| Alpha Opportunity Fund | Hedge, Leverage | | $ | 81,392,237 | | | $ | 137,205,812 | |
| Market Neutral Real Estate Fund | Leverage | | | — | | | | 4,804,802 | |
| Risk Managed Real Estate Fund | Leverage | | | 34,782,147 | | | | 34,661,670 | |
| StylePlus—Large Core Fund | Index exposure | | | 172,402,001 | | | | — | |
| StylePlus—Mid Growth Fund | Index exposure | | | 64,535,929 | | | | — | |
Derivative Investment Holdings Categorized by Risk Exposure
The following is a summary of the location of derivative investments on the Funds’ Statements of Assets and Liabilities as of September 30, 2017:
| Derivative Investment Type | Asset Derivatives | Liability Derivatives |
| Equity contracts | Variation margin | Variation margin |
| | Unrealized appreciation on swap agreements | Unrealized depreciation on swap agreements |
The following table sets forth the fair value of the Funds’ derivative investments categorized by primary risk exposure at September 30, 2017:
| Asset Derivative Investments Value | |
| Fund | | Futures
Equity
Contracts* | | | Swaps
Equity
Contracts | | | Total Value at
September 30,
2017 | |
| Alpha Opportunity Fund | | $ | — | | | $ | 3,550,074 | | | $ | 3,550,074 | |
| Risk Managed Real Estate Fund | | | — | | | | 735,430 | | | | 735,430 | |
| StylePlus—Large Core Fund | | | 25,140 | | | | 3,603,841 | | | | 3,628,981 | |
| StylePlus—Mid Growth Fund | | | 76,689 | | | | 2,040,788 | | | | 2,117,477 | |
| | THE GUGGENHEIM FUNDS ANNUAL REPORT | 115 |
NOTES TO FINANCIAL STATEMENTS (continued) |
| Liability Derivative Investments Value | |
| Fund | | Futures
Equity
Contracts* | | | Swaps
Equity
Contracts | | | Total Value at
September 30,
2017 | |
| Alpha Opportunity Fund | | $ | — | | | $ | 13,593,377 | | | $ | 13,593,377 | |
| Risk Managed Real Estate Fund | | | — | | | | 219,626 | | | | 219,626 | |
| Market Neutral Real Estate Fund | | | — | | | | 41,815 | | | | 41,815 | |
| StylePlus—Mid Growth Fund | | | 1,180 | | | | — | | | | 1,180 | |
| * | Includes cumulative appreciation (depreciation) of futures contracts as reported on the Schedules of Investments. Only current day’s variation margin is reported within the Statements of Assets and Liabilities. |
The following is a summary of the location of derivative investments on the Funds’ Statements of Operations for the year ended September 30, 2017:
| Derivative Investment Type | Location of Gain (Loss) on Derivatives |
| Equity/Currency contracts | Net realized gain (loss) on futures contracts |
| | Net change in unrealized appreciation (depreciation) on futures contracts |
| | Net realized gain (loss) on swap agreements |
| | Net change in unrealized appreciation (depreciation) on swap agreements |
The following is a summary of the Funds’ realized gain (loss) and change in unrealized appreciation (depreciation) on derivative investments recognized on the Statements of Operations categorized by primary risk exposure for the year ended September 30, 2017:
| Realized Gain (Loss) on Derivative Investments Recognized on the Statements of Operations | |
| Fund | | Futures
Equity
Contracts | | | Swaps
Equity
Contracts | | | Futures
Currency
Contracts | | | Total | |
| Alpha Opportunity Fund | | $ | — | | | $ | (61,617 | ) | | $ | — | | | $ | (61,617 | ) |
| Market Neutral Real Estate Fund | | | — | | | | (282,050 | ) | | | — | | | | (327,978 | ) |
| Risk Managed Real Estate Fund | | | — | | | | 3,115,658 | | | | — | | | | 3,115,658 | |
| StylePlus—Large Core Fund | | | 382,623 | | | | 29,340,118 | | | | — | | | | 29,722,741 | |
| StylePlus—Mid Growth Fund | | | 301,765 | | | | 10,374,134 | | | | — | | | | 10,675,899 | |
| World Equity Income Fund | | | — | | | | — | | | | (343,593 | ) | | | (343,593 | ) |
| Change in Unrealized Appreciation (Depreciation) on Derivative Investments Recognized on the Statements of Operations | |
| Fund | | Futures
Equity
Contracts | | | Swaps
Equity
Contracts | | | Futures
Currency
Contracts | | | Total | |
| Alpha Opportunity Fund | | $ | — | | | $ | (8,133,001 | ) | | $ | — | | | $ | (8,133,001 | ) |
| Market Neutral Real Estate Fund | | | — | | | | 223,020 | | | | — | | | | 223,020 | |
| Risk Managed Real Estate Fund | | | — | | | | (19,408 | ) | | | — | | | | (19,408 | ) |
| StylePlus—Large Core Fund | | | (14,693 | ) | | | (2,120,902 | ) | | | — | | | | (2,135,595 | ) |
| StylePlus—Mid Growth Fund | | | 75,509 | | | | (621,402 | ) | | | — | | | | (545,893 | ) |
| World Equity Income Fund | | | — | | | | — | | | | 19,765 | | | | 19,765 | |
In conjunction with the use of short sales and derivative instruments, the Funds are required to maintain collateral in various forms. The Funds use, where appropriate, depending on the financial instrument utilized and the broker involved, margin deposits at the broker, cash and/or securities segregated at the custodian bank, discount notes or the repurchase agreements allocated to the Funds.
| 116 | THE GUGGENHEIM FUNDS ANNUAL REPORT | |
NOTES TO FINANCIAL STATEMENTS (continued) |
There are several risks associated with exposure to foreign currencies, foreign issuers and emerging markets. A Fund’s indirect and direct exposure to foreign currencies subjects the Fund to the risk that those currencies will decline in value relative to the U.S. dollar, or in the case of short positions, that the U.S. dollar will decline in value relative to the currency being hedged. Currency rates in foreign countries may fluctuate significantly over short periods of time for a number of reasons, including changes in interest rates and the imposition of currency controls or other political developments in the U.S. or abroad. In addition, the Fund may incur transaction costs in connection with conversions between various currencies. The Fund may, but is not obligated to, engage in currency hedging transactions, which generally involve buying currency forward, options or futures contracts. However, not all currency risks may be effectively hedged, and in some cases the costs of hedging techniques may outweigh expected benefits. In such instances, the value of securities denominated in foreign currencies can change significantly when foreign currencies strengthen or weaken relative to the U.S. dollar.
Certain Funds may invest in securities of foreign companies directly, or in financial instruments, such as ADRs and exchange-traded funds, which are indirectly linked to the performance of foreign issuers. Foreign markets can be more volatile than the U.S. market due to increased risks of adverse issuer, political, regulatory, market, or economic developments and can perform differently from the U.S. market. Investing in securities of foreign companies directly, or in financial instruments that are indirectly linked to the performance of foreign issuers, may involve risks not typically associated with investing in U.S. issuers. The value of securities denominated in foreign currencies, and of dividends from such securities, can change significantly when foreign currencies strengthen or weaken relative to the U.S. dollar. Foreign securities markets generally have less trading volume and less liquidity than U.S. markets, and prices in some foreign markets may fluctuate more than those of securities traded on U.S. markets. Many foreign countries lack accounting and disclosure standards comparable to those that apply to U.S. companies, and it may be more difficult to obtain reliable information regarding a foreign issuer’s financial condition and operations. Transaction costs and costs associated with custody services are generally higher for foreign securities than they are for U.S. securities. Some foreign governments levy withholding taxes against dividend and interest income. Although in some countries portions of these taxes are recoverable, the non-recovered portion will reduce the income received by the Fund.
The Trust has established counterparty credit guidelines and enters into transactions only with financial institutions of investment grade or better. The Trust monitors the counterparty credit risk.
Note 3 – Offsetting
In the normal course of business, the Funds enter into transactions subject to enforceable master netting arrangements or other similar arrangements. Generally, the right to offset in those agreements allows the Funds to counteract the exposure to a specific counterparty with collateral received from or delivered to that counterparty based on the terms of the arrangements. These arrangements provide for the right to liquidate upon the occurrence of an event of default, credit event upon merger or additional termination event.
In order to better define their contractual rights and to secure rights that will help the Funds mitigate their counterparty risk, the Funds may enter into an International Swaps and Derivatives Association, Inc. Master Agreement (“ISDA Master Agreement”) or similar agreement with their derivative contract counterparties. An ISDA Master Agreement is a bilateral agreement between a Fund and a counterparty that governs OTC derivatives, including foreign exchange contracts, and typically contains, among other things, collateral posting terms and netting provisions in the event of a default and/or termination event. The provisions of the ISDA Master Agreement typically permit a single net payment in the event of a default (close-out netting) or similar event, including the bankruptcy or insolvency of the counterparty.
For derivatives traded under an ISDA Master Agreement, the collateral requirements are typically calculated by netting the mark-to-market amount for each transaction under such agreement and comparing that amount to the value of any collateral currently pledged by the Funds and the counterparty. For financial reporting purposes, cash collateral that has been pledged to cover obligations of the Funds and cash collateral received from the counterparty, if any, are reported separately on the Statements of Assets and Liabilities as segregated cash with broker/receivable for variation margin, or payable for swap settlement/variation margin. Generally, the amount of collateral due from or to a counterparty must exceed a minimum transfer amount threshold (e.g., $300,000) before a transfer is required to be made. To the extent amounts due to the Funds from their counterparties are not fully collateralized, contractually or otherwise, the Funds bear the risk of loss from counterparty nonperformance. The Funds attempt to mitigate counterparty risk by only entering into agreements with counterparties that they believe to be of good standing and by monitoring the financial stability of those counterparties.
For financial reporting purposes, the Funds do not offset derivative assets and derivative liabilities that are subject to netting arrangements in the Statements of Assets and Liabilities.
| | THE GUGGENHEIM FUNDS ANNUAL REPORT | 117 |
NOTES TO FINANCIAL STATEMENTS (continued) |
The following tables present derivative financial instruments and secured financing transactions that are subject to enforceable netting arrangements and offset in the Statements of Assets and Liabilities in conformity with U.S. GAAP:
| | | | | | | | | | | | | Gross Amounts Not Offset
in the Statements of
Assets and Liabilities | | | | |
| Fund | Instrument | | Gross
Amounts of
Recognized
Assets | | | Gross Amounts Offset In the Statements of Assets and Liabilities | | | Net Amount
of Assets
Presented
on the Statements
of Assets and Liabilities | | | Financial Instruments | | | Cash Collateral Received | | | Net Amount | |
| Alpha Opportunity Fund | Swap equity contracts | | $ | 3,550,074 | | | $ | — | | | $ | — | | | $ | 3,550,074 | | | $ | — | | | $ | — | |
| Risk Managed Real Estate Fund | Swap equity contracts | | | 735,430 | | | | — | | | | 735,430 | | | | 219,626 | | | | 515,804 | | | | — | |
| StylePlus—Large Core Fund | Swap equity contracts | | | 3,603,841 | | | | — | | | | 3,603,841 | | | | — | | | | — | | | | 3,603,841 | |
| StylePlus—Mid Growth Fund | Swap equity contracts | | | 2,040,788 | | | | — | | | | 2,040,788 | | | | — | | | | — | | | | 2,040,788 | |
| | | | | | | | | | | | | Gross Amounts Not Offset
in the Statements of
Assets and Liabilities | | | | |
| Fund | Instrument | | Gross
Amounts of
Recognized
Liabilities | | | Gross Amounts Offset In the Statements of Assets and Liabilities | | | Net Amount
of Liabilities Presented
on the Statements
of Assets and Liabilities | | | Financial Instruments | | | Cash Collateral Pledged | | | Net Amount | |
| Alpha Opportunity Fund | Swap equity contracts | | $ | 13,593,377 | | | $ | — | | | $ | 13,593,377 | | | $ | 13,593,377 | | | $ | — | | | $ | — | |
| Risk Managed Real Estate Fund | Swap equity contracts | | | 219,626 | | | | — | | | | 219,626 | | | | 219,626 | | | | — | | | | — | |
| Market Neutral Real Estate Fund | Swap equity contracts | | | 41,815 | | | | — | | | | 41,815 | | | | 41,815 | | | | — | | | | — | |
The following table presents deposits held by others in connection with derivative investments as of September 30, 2017. The derivatives tables following the Schedule of Investments list each counterparty for which cash collateral may have been pledged or received at period end. The Funds have the right to offset these deposits against any related liabilities outstanding with each counterparty.
| Counterparty | | Cash Pledged | | | Cash Received | |
| Risk Managed Real Estate Fund | | | | | | |
| Morgan Stanley | | $ | — | | | $ | 1,000,000 | |
| Risk Managed Real Estate Fund Total | | | — | | | | 1,000,000 | |
| StylePlus—Large Core Fund | | | | | | | | |
| Deutsche Bank | | | — | | | | 2,750,000 | |
| Morgan Stanley | | | 233,000 | | | | — | |
| StylePlus—Large Core Fund Total | | | 233,000 | | | | 2,750,000 | |
| StylePlus—Mid Growth Fund | | | | | | | | |
| Morgan Stanley | | | 128,850 | | | | 1,642,982 | |
| StylePlus—Mid Growth Fund Total | | | 128,850 | | | | 1,642,982 | |
| 118 | THE GUGGENHEIM FUNDS ANNUAL REPORT | |
NOTES TO FINANCIAL STATEMENTS (continued) |
Note 4 – Fair Value Measurement
In accordance with U.S. GAAP, fair value is defined as the price that the Funds would receive to sell an investment or pay to transfer a liability in an orderly transaction with an independent buyer in the principal market, or in the absence of a principal market, the most advantageous market for the investment or liability. U.S. GAAP establishes a three-tier fair value hierarchy based on the types of inputs used to value assets and liabilities and requires corresponding disclosure. The hierarchy and the corresponding inputs are summarized below:
Level 1 — | quoted prices in active markets for identical assets or liabilities. |
Level 2 — | significant other observable inputs (for example quoted prices for securities that are similar based on characteristics such as interest rates, prepayment speeds, credit risk, etc.). |
Level 3 — | significant unobservable inputs based on the best information available under the circumstances, to the extent observable inputs are not available, which may include assumptions. |
The types of inputs available depend on a variety of factors, such as the type of security and the characteristics of the markets in which it trades, if any. Fair valuation determinations that rely on fewer or no observable inputs require greater judgment. Accordingly, fair value determinations for Level 3 securities require the greatest amount of judgment.
The inputs or methodologies used for valuing securities are not necessarily an indication of the risk associated with investing in those securities. The suitability of the techniques and sources employed to determine fair valuation are regularly monitored and subject to change.
Note 5 – Fees and Other Transactions with Affiliates
Under the terms of an investment advisory contract, the Funds pay GI investment advisory fees calculated at the annualized rates below, based on the average daily net assets of the Funds:
| Fund | Management Fees
(as a % of Net Assets) |
| Alpha Opportunity Fund | | | 0.90% | ** |
| Large Cap Value Fund | | | 0.65% | |
| Market Neutral Real Estate Fund | | | 1.10% | |
| Risk Managed Real Estate Fund | | | 0.75% | |
| Small Cap Value Fund | | | 0.75% | * |
| StylePlus—Large Core Fund | | | 0.75% | |
| StylePlus—Mid Growth Fund | | | 0.75% | |
| World Equity Income Fund | | | 0.70% | |
| * | Rate effective February 1, 2017. Prior to February 1, 2017, the Fund paid GI 1.00% of the average daily net assets of the Fund. |
| ** | At a meeting held on May 23-24, 2017, the Board of Trustees of Guggenheim Funds Trust (the “Board”) approved a reduction in the advisory fee paid by the Alpha Opportunity Fund effective May 31, 2017 from 1.25% to 0.90%. The Board also approved an equivalent reduction in the expense limitation for each share class of the Fund, effective as of the same date. |
GI engages external service providers to perform other necessary services for the Trust, such as audit and accounting related services, legal services, custody, printing and mailing, etc., on a pass-through basis. Such expenses are allocated to various Funds within the complex based on relative net assets.
The Funds have adopted Distribution Plans related to the offering of A-Class, C-Class and P-Class shares pursuant to Rule 12b-1 under the 1940 Act. The plans provide for payments at an annual rate of 0.25% of the average daily net assets of each Fund’s A-Class and P-Class shares, and 1.00% of the average daily net assets of each Fund’s C-Class shares.
| | THE GUGGENHEIM FUNDS ANNUAL REPORT | 119 |
NOTES TO FINANCIAL STATEMENTS (continued) |
The investment advisory contracts for the following Funds provide that the total expenses be limited to a percentage of average net assets for each class of shares, exclusive of brokerage costs, dividends on securities sold short, expenses of other investment companies in which a Fund invests, interest, taxes, litigation, indemnification and extraordinary expenses. The limits are listed below:
| | Limit | Effective
Date | Contract
End Date |
| Alpha Opportunity Fund – A-Class | 1.76% | 5/31/17 | 02/01/19 |
| Alpha Opportunity Fund – C-Class | 2.51% | 5/31/17 | 02/01/19 |
| Alpha Opportunity Fund – P--Class | 1.76% | 5/31/17 | 02/01/19 |
| Alpha Opportunity Fund – Institutional Class | 1.51% | 5/31/17 | 02/01/19 |
| Large Cap Value Fund – A-Class | 1.15% | 11/30/12 | 02/01/19 |
| Large Cap Value Fund – C-Class | 1.90% | 11/30/12 | 02/01/19 |
| Large Cap Value Fund – P-Class | 1.15% | 05/01/15 | 02/01/19 |
| Large Cap Value Fund – Institutional Class | 0.90% | 06/05/13 | 02/01/19 |
| Market Neutral Real Estate Fund – A-Class | 1.65% | 02/26/16 | 02/01/19 |
| Market Neutral Real Estate Fund – C-Class | 2.40% | 02/26/16 | 02/01/19 |
| Market Neutral Real Estate Fund – P-Class | 1.65% | 02/26/16 | 02/01/19 |
| Market Neutral Real Estate Fund – Institutional Class | 1.40% | 02/26/16 | 02/01/19 |
| Risk Managed Real Estate Fund – A-Class | 1.30% | 03/26/14 | 02/01/19 |
| Risk Managed Real Estate Fund – C-Class | 2.05% | 03/26/14 | 02/01/19 |
| Risk Managed Real Estate Fund – P-Class | 1.30% | 05/01/15 | 02/01/19 |
| Risk Managed Real Estate Fund – Institutional Class | 1.10% | 03/26/14 | 02/01/19 |
| Small Cap Value Fund – A-Class | 1.30% | 11/30/12 | 02/01/19 |
| Small Cap Value Fund – C-Class | 2.05% | 11/30/12 | 02/01/19 |
| Small Cap Value Fund – P-Class | 1.30% | 05/01/15 | 02/01/19 |
| Small Cap Value Fund – Institutional Class | 1.05% | 11/30/12 | 02/01/19 |
| World Equity Income Fund – A-Class | 1.22% | 08/15/13 | 02/01/19 |
| World Equity Income Fund – C-Class | 1.97% | 08/15/13 | 02/01/19 |
| World Equity Income Fund – P-Class | 1.22% | 05/01/15 | 02/01/19 |
| World Equity Income Fund – Institutional Class | 0.97% | 08/15/13 | 02/01/19 |
| 120 | THE GUGGENHEIM FUNDS ANNUAL REPORT | |
NOTES TO FINANCIAL STATEMENTS (continued) |
GI and GPIM is entitled to reimbursement by the Funds for fees waived or expenses reimbursed during any of the previous 36 months, beginning on the date of the expense limitation agreement, if on any day the estimated operating expenses are less than the indicated percentages. At September 30, 2017, the amount of fees waived or expenses reimbursed that are subject to recoupment are presented in the following table:
| Fund | | Expires
2018 | | | Expires
2019 | | | Expires
2020 | | | Fund
Total | |
| Alpha Opportunity Fund | | | | | | | | | | | | |
| A-Class | | $ | 92,503 | | | $ | — | | | $ | 7,212 | | | $ | 99,715 | |
| C-Class | | | 12,810 | | | | 7,081 | | | | 1,244 | | | | 21,135 | |
| P-Class | | | — | | | | — | | | | 2,915 | | | | 2,915 | |
| Institutional Class | | | — | | | | — | | | | 7,310 | | | | 7,310 | |
| Large Cap Value Fund | | | | | | | | | | | | | | | | |
| A-Class | | | 95,743 | | | | 87,212 | | | | 78,038 | | | | 260,993 | |
| C-Class | | | 9,943 | | | | 9,306 | | | | 6,283 | | | | 25,531 | |
| P-Class | | | 79 | | | | 338 | | | | 762 | | | | 1,179 | |
| Institutional Class | | | 2,123 | | | | 1,129 | | | | 1,773 | | | | 5,025 | |
| Market Neutral Real Estate Fund | | | | | | | | | | | | | | | | |
| A-Class | | | — | | | | 997 | | | | 3,417 | | | | 4,414 | |
| C-Class | | | — | | | | 905 | | | | 4,410 | | | | 5,315 | |
| P-Class | | | — | | | | 979 | | | | 5,860 | | | | 6,839 | |
| Institutional Class | | | — | | | | 45,647 | | | | 151,686 | | | | 197,333 | |
| Risk Managed Real Estate Fund | | | | | | | | | | | | | | | | |
| A-Class | | | 2,334 | | | | 918 | | | | 1,219 | | | | 4,471 | |
| C-Class | | | 2,095 | | | | 2,257 | | | | 1,084 | | | | 5,436 | |
| P-Class | | | 81 | | | | 58 | | | | 1,443 | | | | 1,582 | |
| Institutional Class | | | — | | | | — | | | | 12,943 | | | | 12,943 | |
| Small Cap Value Fund | | | | | | | | | | | | | | | | |
| A-Class | | | 105,165 | | | | 123,706 | | | | 71,327 | | | | 300,198 | |
| C-Class | | | 44,550 | | | | 49,668 | | | | 29,870 | | | | 124,087 | |
| P-Class | | | 2 | | | | 116 | | | | 336 | | | | 454 | |
| Institutional Class | | | 4,007 | | | | 4,063 | | | | 15,554 | | | | 23,624 | |
| World Equity Income Fund | | | | | | | | | | | | | | | | |
| A-Class | | | — | | | | — | | | | 85,342 | | | | 85,342 | |
| C-Class | | | 2,930 | | | | 7,207 | | | | 12,042 | | | | 22,179 | |
| P-Class | | | — | | | | — | | | | 896 | | | | 896 | |
| Institutional Class | | | — | | | | 1,831 | | | | 2,937 | | | | 4,768 | |
For the year ended September 30, 2017, GI and GPIM recouped amounts from the Funds as follows:
| Alpha Opportunity Fund | | $ | 83,031 | |
| Large Cap Value Fund | | | 6,935 | |
| Market Neutral Real Estate Fund | | | 9,822 | |
| Risk Managed Real Estate Fund | | | 230 | |
| Small Cap Value Fund | | | 1,164 | |
| World Equity Income Fund | | | 10,033 | |
If a Fund invests in an affiliated fund, the investing Fund’s adviser has agreed to waive fees at the investing fund level. Fee waivers will be calculated at the investing Fund level without regard to any expense cap, if any, in effect for the investing Fund. Fees waived under this arrangement are not subject to reimbursement to GI or GPIM. For the year ended September 30, 2017, the following Funds waived fees related to investments in affiliated funds:
| Fund | | Amount | |
| StylePlus—Large Core Fund | | $ | 70,828 | |
| StylePlus—Mid Growth Fund | | | 28,169 | |
For the year ended September 30, 2017, GFD retained sales charges of $705,455 relating to sales of A-Class shares of the Trust.
| | THE GUGGENHEIM FUNDS ANNUAL REPORT | 121 |
NOTES TO FINANCIAL STATEMENTS (continued) |
Certain trustees and officers of the Trust are also officers of GI, GPIM and GFD.
MUFG Investor Services (US), LLC (“MUIS”) acts as the Trust’s administrator, transfer agent and accounting agent. As administrator, transfer agent and accounting agent, MUIS is responsible for maintaining the books and records of the Trust’s securities and cash. For providing the aforementioned administrative and accounting services, MUIS is entitled to receive a monthly fee equal to a percentage of the Funds’ fees and out of pocket expenses. For providing the aforementioned transfer agent services, MUIS is entitled to receive a monthly fee based on the number of transactions during the month and the number of accounts under management subject to certain minimum monthly fees and out of pocket expenses.
At September 30, 2017, GI and GPIM and its affiliates owned over twenty percent of the outstanding shares of the Funds, as follows:
| Fund | Percent of outstanding shares owned |
| Alpha Opportunity Fund | 72% |
| Market Neutral Real Estate Fund | 95% |
Note 6 – Federal Income Tax Information
The Funds intend to comply with the provisions of Subchapter M of the Internal Revenue Code applicable to regulated investment companies and will distribute substantially all taxable net investment income and capital gains sufficient to relieve the Funds from all, or substantially all, federal income, excise and state income taxes. Therefore, no provision for federal or state income tax or federal excise tax is required.
Tax positions taken or expected to be taken in the course of preparing the Funds’ tax returns are evaluated to determine whether the tax positions are “more-likely-than-not” of being sustained by the applicable tax authority. Tax positions not deemed to meet the more-likely-than-not threshold would be recorded as a tax benefit or expense in the current year. Management has analyzed the Funds’ tax positions taken, or to be taken, on federal income tax returns for all open tax years, and has concluded that no provision for income tax is required in the Funds’ financial statements. The Funds’ federal tax returns are subject to examination by the Internal Revenue Service for a period of three years after they are filed.
The tax character of distributions paid during the year ended September 30, 2017 was as follows:
| Fund | | Ordinary
Income | | | Long-Term
Capital Gain | | | Total
Distributions | |
| Alpha Opportunity Fund | | $ | — | | | $ | 57,679 | | | $ | 57,679 | |
| Large Cap Value Fund | | | 813,658 | | | | 2,028,231 | | | | 2,841,889 | |
| Risk Managed Real Estate Fund | | | 4,792,400 | | | | 392,669 | | | | 5,185,069 | |
| Small Cap Value Fund | | | 92,293 | | | | — | | | | 92,293 | |
| StylePlus—Large Core Fund | | | 4,562,047 | | | | 779,695 | | | | 5,341,742 | |
| StylePlus—Mid Growth Fund | | | 440,944 | | | | — | | | | 440,944 | |
| World Equity Income Fund | | | 2,162,371 | | | | — | | | | 2,162,371 | |
The tax character of distributions paid during the year ended September 30, 2016 was as follows:
| Fund | | Ordinary
Income | | | Long-Term
Capital Gain | | | Total
Distributions | |
| Alpha Opportunity Fund | | $ | — | | | $ | — | | | $ | — | |
| Large Cap Value Fund | | | 466,512 | | | | 3,681,038 | | | | 4,147,550 | |
| Risk Managed Real Estate Fund | | | 17,020,643 | | | | 111,921 | | | | 17,132,564 | |
| Small Cap Value Fund | | | 1,624 | | | | 1,391,872 | | | | 1,393,496 | |
| StylePlus—Large Core Fund | | | 2,555,903 | | | | 18,677,775 | | | | 21,233,678 | |
| StylePlus—Mid Growth Fund | | | 851,868 | | | | 9,350,921 | | | | 10,202,789 | |
| World Equity Income Fund | | | 2,067,623 | | | | — | | | | 2,067,623 | |
Note: For federal income tax purposes, short-term capital gain distributions are treated as ordinary income distributions.
| 122 | THE GUGGENHEIM FUNDS ANNUAL REPORT | |
NOTES TO FINANCIAL STATEMENTS (continued) |
The tax components of accumulated earnings/(deficit) as of September 30, 2017 were as follows:
| Fund | | Undistributed
Ordinary
Income | | | Undistributed
Long-Term
Capital Gain | | | Net Unrealized
Appreciation
(Depreciation) | | | Accumulated
Capital and
Other Losses | | | Other
Temporary
Differences | | | Total | |
| Alpha Opportunity Fund | | $ | 8,706,570 | | | $ | 2,160,169 | | | $ | (4,472,943 | ) | | $ | — | | | $ | — | | | $ | 6,393,796 | |
| Large Cap Value Fund | | | 2,009,256 | | | | 3,065,782 | | | | 10,033,626 | | | | — | | | | — | | | | 15,108,664 | |
| Market Neutral Real Estate Fund | | | 104,609 | | | | 189,297 | | | | 372,061 | | | | — | | | | — | | | | 665,967 | |
| Risk Managed Real Estate Fund | | | 4,109,371 | | | | 498,402 | | | | 6,544,565 | | | | — | | | | (552,277 | ) | | | 10,600,061 | |
| Small Cap Value Fund | | | 484,932 | | | | 767,347 | | | | 2,731,331 | | | | — | | | | — | | | | 3,983,610 | |
| StylePlus—Large Core Fund | | | 33,395,086 | | | | 1,293,989 | | | | 6,883,324 | | | | — | | | | — | | | | 41,572,399 | |
| StylePlus—Mid Growth Fund | | | 9,742,667 | | | | — | | | | 3,303,012 | | | | — | | | | — | | | | 13,045,679 | |
| World Equity Income Fund | | | — | | | | — | | | | 7,039,469 | | | | (5,357,504 | ) | | | — | | | | 1,681,965 | |
Capital Loss Carryforward amounts may be limited due to Federal income tax regulations.
For Federal income tax purposes, capital loss carryforwards represent realized losses of the Funds that may be carried forward and applied against future capital gains. For taxable years beginning on or before December 22, 2010, such capital losses may be carried forward for a maximum of eight years. Under the RIC Modernization Act of 2010, the Funds are permitted to carry forward capital losses incurred in taxable years beginning after December 22, 2010 for an unlimited period. However, any losses incurred during those taxable years must be utilized prior to the losses incurred in pre-enactment taxable years. As a result of this ordering rule, pre-enactment capital loss carryforwards may be more likely to expire unused. Additionally, post-enactment capital losses that are carried forward will retain their character as either short-term or long-term capital losses rather than being considered all short-term as under previous law. As of September 30, 2017, capital loss carryforwards for the Funds were as follows:
| Fund | | Expires in
2018 | | | Expires in
2019 | | |
Unlimited
| | | Total
Capital Loss
Carryforward | |
| Short-Term | | | Long-Term |
| World Equity Income Fund | | $ | (5,357,504 | ) | | $ | — | | | $ | — | | | $ | — | | | $ | (5,357,504 | ) |
For the year ended September 30, 2017, the following capital loss carryforward amounts expired or were utilized:
| Fund | | Expired | | | Utilized | | | Total | |
| Market Neutral Real Estate Fund | | $ | — | | | $ | 22,486 | | | $ | 22,486 | |
| Small Cap Value Fund | | | — | | | | 245,278 | | | | 245,278 | |
| StylePlus—Mid Growth Fund | | | — | | | | 2,408,332 | | | | 2,408,332 | |
| World Equity Income Fund | | | 10,463,901 | | | | 5,357,565 | | | | 15,821,466 | |
Net investment income and net realized gains (losses) may differ for financial statement and tax purposes because of temporary or permanent book/tax differences. These differences are primarily due to distributions in connection with redemption of fund shares, net operating losses, expiration of capital loss carryforward amounts, investments in swap agreements, non-deductible organization costs, the “mark-to-market” of certain Futures contracts, non-deductible expenses, securities sold short, dividend reclasses, investments in real estate investment trusts, dividend payable, losses deferred due to wash sales, foreign currency gains and losses, return of capital distributions received, taxable overdistributions, and the “mark-to-market” or disposition of certain Passive Foreign Investment Companies (PFICs). To the extent these differences are permanent, reclassifications are made to the appropriate capital accounts in the period that the differences arise. These reclassifications have no effect on net assets or NAV per share.
| | THE GUGGENHEIM FUNDS ANNUAL REPORT | 123 |
NOTES TO FINANCIAL STATEMENTS (continued) |
The following adjustments were made on the Statements of Assets and Liabilities as of September 30, 2017 for permanent book/tax differences:
| Fund | | Paid In
Capital | | | Undistributed
Net Investment
Income/(Loss) | | | Accumulated
Net Realized
Gain/(Loss) | |
| Alpha Opportunity Fund | | $ | 984,365 | | | $ | (167,898 | ) | | $ | (816,467 | ) |
| Large Cap Value Fund | | | 781,338 | | | | — | | | | (781,338 | ) |
| Market Neutral Real Estate Fund | | | (18,974 | ) | | | (292,325 | ) | | | 311,299 | |
| Risk Managed Real Estate Fund | | | 38,772 | | | | 1,981,250 | | | | (2,020,022 | ) |
| Small Cap Value Fund | | | 183,247 | | | | 91,623 | | | | (274,870 | ) |
| StylePlus—Large Core Fund | | | 970,830 | | | | 15,520 | | | | (986,350 | ) |
| StylePlus—Mid Growth Fund | | | 277,066 | | | | 3,742 | | | | (280,808 | ) |
| World Equity Income Fund | | | (10,814,233 | ) | | | 493,246 | | | | 10,320,987 | |
At September 30, 2017, the cost of securities for Federal income tax purposes, the aggregate gross unrealized gain for all securities for which there was an excess of value over tax cost and the aggregate gross unrealized loss for all securities for which there was an excess of tax cost over value, were as follows:
| Fund | | Tax
Cost | | | Tax
Unrealized
Gain | | | Tax
Unrealized
(Loss) | | | Net
Unrealized
Gain/(Loss) | |
| Alpha Opportunity Fund | | $ | 226,140,814 | | | $ | 15,887,298 | | | $ | (20,360,242 | ) | | $ | (4,472,944 | ) |
| Large Cap Value Fund | | | 55,447,961 | | | | 11,050,297 | | | | (1,016,671 | ) | | | 10,033,626 | |
| Market Neutral Real Estate Fund | | | 5,119,727 | | | | 510,963 | | | | (138,902 | ) | | | 372,061 | |
| Risk Managed Real Estate Fund | | | 110,207,435 | | | | 8,803,469 | | | | (2,258,904 | ) | | | 6,544,565 | |
| Small Cap Value Fund | | | 18,278,652 | | | | 3,928,343 | | | | (1,197,012 | ) | | | 2,731,331 | |
| StylePlus—Large Core Fund | | | 210,475,102 | | | | 7,863,054 | | | | (979,729 | ) | | | 6,883,325 | |
| StylePlus—Mid Growth Fund | | | 81,396,155 | | | | 3,719,632 | | | | (416,620 | ) | | | 3,303,012 | |
| World Equity Income Fund | | | 84,560,904 | | | | 8,139,075 | | | | (1,103,507 | ) | | | 7,035,568 | |
Note 7 – Securities Transactions
For the year ended September 30, 2017, the cost of purchases and proceeds from sales of investment securities, excluding government securities, short-term investments and derivatives, were as follows:
| Fund | | Purchases | | | Sales | |
| Alpha Opportunity Fund | | $ | 372,963,026 | | | $ | 233,987,073 | |
| Large Cap Value Fund | | | 25,310,645 | | | | 26,563,010 | |
| Market Neutral Real Estate Fund | | | 6,950,703 | | | | 6,515,133 | |
| Risk Managed Real Estate Fund | | | 130,637,054 | | | | 113,630,658 | |
| Small Cap Value Fund | | | 9,614,326 | | | | 9,939,101 | |
| StylePlus—Large Core Fund | | | 72,102,196 | | | | 61,720,435 | |
| StylePlus—Mid Growth Fund | | | 33,218,486 | | | | 32,180,568 | |
| World Equity Income Fund | | | 82,089,078 | | | | 89,316,273 | |
Note 8 – Line of Credit
The Trust, with the exception of Capital Stewardship Fund, and certain affiliated funds, secured a 364-day committed, $1,000,000,000 line of credit from Citibank, N.A., which was in place through October 6, 2017, at which time the line of credit was renewed with an increased commitment amount of $1,065,000,000. The funds that participate in the line of credit including the Fund, paid aggregate upfront costs of $ 982,952 to renew the line of credit. The commitment fee that may be paid by the Funds is at an annualized rate of 0.15% of the average daily amount of their unused commitment amount. These amounts are included within Line of Credit Fees on the Statements of Operations.
| 124 | THE GUGGENHEIM FUNDS ANNUAL REPORT | |
NOTES TO FINANCIAL STATEMENTS (concluded) |
A Fund may draw (borrow) from the line of credit as a temporary measure for emergency purposes, to facilitate redemption requests, or for other short-term liquidity purposes consistent with the Fund’s investment objective and program. For example, it may be advantageous for the Fund to borrow money rather than sell existing portfolio positions to meet redemption requests. Fees related to borrowings, if any, vary under this arrangement between the greater of Citibank’s “base rate”, 1 month LIBOR plus 1%, or the federal funds rate plus 1/2 of 1%.
The Funds did not have any borrowings under this agreement as of and for the period ended September 30, 2017.
Note 9 – Other Liabilities
StylePlus—Large Core Fund wrote put option contracts through Lehman Brothers Inc., (“LBI”) that were exercised prior to the option contracts’ expiration and prior to the bankruptcy filing by LBI, during September, 2008. However, these transactions have not settled and the securities have not been delivered to the Fund as of September 30, 2017.
Although the ultimate resolution of these transactions is uncertain, the Fund has recorded a liability equal to the difference between the strike price on the put options and the market price of the underlying security on the exercise date. The amount of the liability recorded in miscellaneous payables by the Fund as of September 30, 2017, was $18,615.
Note 10 – Large Shareholder Risk
As of September 30, 2017, 71.9% of the Alpha Opportunity Fund (the “Fund”) was held by Macro Opportunities Fund. The Fund may experience adverse effects if a large number of shares of the Fund are held by a single shareholder (e.g., an institutional investor, financial intermediary or another GI Fund). The Fund is subject to the risk that a redemption by those shareholders of all or a large portion of the Fund could cause the Fund to liquidate its assets at inopportune times, or at a loss or depressed value, which could adversely impact the Fund’s performance and cause the value of a shareholder’s investment to decline. Redemptions of a large number of shares also may increase transaction costs or, by necessitating a sale of portfolio securities, have adverse tax consequences for shareholders. They also potentially limit the use of any capital loss carryforwards and certain other losses to off set future realized capital gains (if any) and may limit or prevent a Fund’s use of tax equalization.
| | THE GUGGENHEIM FUNDS ANNUAL REPORT | 125 |
| REPORT OF INDEPENDENT REGISTERED PUBLIC ACCOUNTING FIRM |
The Board of Trustees and Shareholders
of Guggenheim Funds Trust
We have audited the accompanying statements of assets and liabilities, including the schedules of investments, of Guggenheim Alpha Opportunity Fund, Guggenheim Large Cap Value Fund, Guggenheim Market Neutral Real Estate Fund, Guggenheim Risk Managed Real Estate Fund, Guggenheim Small Cap Value Fund, Guggenheim StylePlus-Large Core Fund, Guggenheim StylePlus-Mid Growth Fund, and Guggenheim World Equity Income Fund (eight of the series constituting the Guggenheim Funds Trust) (the “Funds”) as of September 30, 2017, and the related statements of operations for the year then ended, and the statements of changes in net assets and the financial highlights for each of the years or periods indicated therein. These financial statements and financial highlights are the responsibility of the Funds’ management. Our responsibility is to express an opinion on these financial statements and financial highlights based on our audits.
We conducted our audits in accordance with the standards of the Public Company Accounting Oversight Board (United States). Those standards require that we plan and perform the audit to obtain reasonable assurance about whether the financial statements and financial highlights are free of material misstatement. We were not engaged to perform an audit of the Funds’ internal control over financial reporting. Our audits included consideration of internal control over financial reporting as a basis for designing audit procedures that are appropriate in the circumstances, but not for the purpose of expressing an opinion on the effectiveness of the Funds’ internal control over financial reporting. Accordingly, we express no such opinion. An audit also includes examining, on a test basis, evidence supporting the amounts and disclosures in the financial statements and financial highlights, assessing the accounting principles used and significant estimates made by management, and evaluating the overall financial statement presentation. Our procedures included confirmation of securities owned as of September 30, 2017, by correspondence with the custodian, transfer agent, and brokers or by other appropriate auditing procedures where replies from brokers were not received. We believe that our audits provide a reasonable basis for our opinion.
In our opinion, the financial statements and financial highlights referred to above present fairly, in all material respects, the financial position of the above listed Funds (eight of the series constituting the Guggenheim Funds Trust) at September 30, 2017, the results of their operations for the year then ended, and the changes in their net assets and their financial highlights for each of the years or periods indicated therein, in conformity with U.S. generally accepted accounting principles.
Tysons, Virginia
November 29, 2017
| 126 | THE GUGGENHEIM FUNDS ANNUAL REPORT | |
OTHER INFORMATION (Unaudited) |
Tax Information
This information is being provided as required by the Internal Revenue Code. Amounts shown may differ from those elsewhere in the report because of differences in tax and financial reporting practice.
In January 2018, shareholders will be advised on IRS Form 1099 DIV or substitute 1099 DIV as to the federal tax status of the distributions received by shareholders in the calendar year 2017.
The Funds’ investment income (dividend income plus short-term gains, if any) qualifies as follows:
Of the taxable ordinary income distributions paid during the fiscal year ending September 30, 2017, the following funds had the corresponding percentages qualify for the reduced tax rate pursuant to the Jobs and Growth Tax Relief and Reconciliation Act of 2003 or for the dividends received deduction for corporations. See the qualified dividend income and dividend received deduction columns, respectively, in the table below.
Additionally, of the taxable ordinary income distributions paid during the fiscal year ended September 30, 2017, the following funds had the corresponding percentages qualify as interest related dividends and qualified short-term capital gains as permitted by IRC Section 871(k)(1) and IRC Section 871(k)(2), respectively. See qualified interest income and qualified short-term capital gain columns, respectively, in the table below.
| Fund | Qualified
Dividend
Income | Dividend
Received
Deduction | Qualified
Interest
Income | Qualified
Short-Term
Capital Gain |
| Alpha Opportunity Fund | 0.00% | 0.00% | 0.00% | 0.00% |
| Large Cap Value Fund | 96.39% | 96.35% | 0.00% | 0.00% |
| Market Neutral Real Estate Fund | 0.00% | 0.00% | 0.00% | 0.00% |
| Risk Managed Real Estate Fund | 4.53% | 4.55% | 0.00% | 100.00% |
| Small Cap Value Fund | 42.04% | 41.16% | 0.00% | 100.00% |
| StylePlus—Large Core Fund | 11.74% | 11.72% | 0.01% | 100.00% |
| StylePlus—Mid Growth Fund | 26.17% | 26.11% | 0.08% | 0.00% |
| World Equity Income Fund | 100.00% | 70.79% | 0.00% | 0.00% |
With respect to the taxable year ended September 30, 2017, the Funds hereby designate as capital gain dividends the amounts listed below, or, if subsequently determined to be different, the net capital gain of such year:
| Fund | | From long-term capital gain: | | | From long-term capital gain,
using proceeds from shareholder redemptions: | |
| Alpha Opportunity Fund | | $ | 57,679 | | | $ | 1,030,394 | |
| Large Cap Value Fund | | | 2,028,231 | | | | 781,338 | |
| Market Neutral Real Estate Fund | | | — | | | | 12 | |
| Risk Managed Real Estate Fund | | | 392,669 | | | | 38,772 | |
| Small Cap Value Fund | | | — | | | | 184,871 | |
| StylePlus—Large Core Fund | | | 779,695 | | | | 977,972 | |
Proxy Voting Information
A description of the policies and procedures that the Trust uses to determine how to vote proxies relating to securities held in the Funds’ portfolios is available, without charge and upon request, by calling 800.820.0888. This information is also available from the EDGAR database on the SEC’s website at https://www.sec.gov.
Information regarding how the Funds voted proxies relating to portfolio securities during the most recent 12-month period ended June 30 is available without charge, upon request, by calling 800.820.0888. This information is also available from the EDGAR database on the SEC’s website at https://www.sec.gov.
| | THE GUGGENHEIM FUNDS ANNUAL REPORT | 127 |
OTHER INFORMATION (Unaudited)(continued) |
Sector Classification
Information in the “Schedule of Investments” is categorized by sectors using sector-level Classifications defined by the Bloomberg Industry Classification System, a widely recognized industry classification system provider. Each Fund’s registration statement has investment policies relating to concentration in specific sectors/industries. For purposes of these investment policies, the Funds usually classify sectors/industries based on industry-level Classifications used by widely recognized industry classification system providers such as Bloomberg Industry Classification System, Global Industry Classification Standards and Barclays Global Classification Scheme.
Quarterly Portfolio Schedules Information
The Trust files its complete schedule of portfolio holdings with the SEC for the first and third quarters of each fiscal year on Form N-Q; which are available on the SEC’s website at https://www.sec.gov. The Funds’ Forms N-Q may be reviewed and copied at the SEC’s Public Reference Room in Washington, DC, and that information on the operation of the Public Reference Room may be obtained by calling 800-SEC-0330. Copies of the portfolio holdings are also available to shareholders, without charge and upon request, by calling 800.820.0888.
Report of the Guggenheim Funds Trust Contracts Review Committee
Guggenheim Funds Trust (the “Trust”) was organized as a Delaware statutory trust on November 8, 2013, and is registered as an open-end management investment company under the Investment Company Act of 1940, as amended (the “1940 Act”). The Trust includes the following series:
● Guggenheim Alpha Opportunity Fund (“Alpha Opportunity Fund”) ● Guggenheim Diversified Income Fund (“Diversified Income Fund”) ● Guggenheim High Yield Fund (“High Yield Fund”) ● Guggenheim Large Cap Value Fund (“Large Cap Value Fund”) ● Guggenheim Macro Opportunities Fund (“Macro Opportunities Fund”) ● Guggenheim Mid Cap Value Fund (“Mid Cap Value Fund”) ● Guggenheim Municipal Income Fund (“Municipal Income Fund”) ● Guggenheim Small Cap Value Fund (“Small Cap Value Fund”) ● Guggenheim StylePlus—Mid Growth Fund (“StylePlus—Mid Growth Fund”) ● Guggenheim World Equity Income Fund (“World Equity Income Fund”) | ● Guggenheim Capital Stewardship Fund (“Capital Stewardship Fund”) ● Guggenheim Floating Rate Strategies Fund (“Floating Rate Strategies Fund”) ● Guggenheim Investment Grade Bond Fund (“Investment Grade Bond Fund”) ● Guggenheim Limited Duration Fund (“Limited Duration Fund”) ● Guggenheim Market Neutral Real Estate Fund (“Market Neutral Real Estate Fund”) ● Guggenheim Mid Cap Value Institutional Fund (“Mid Cap Value Institutional Fund”) ● Guggenheim Risk Managed Real Estate Fund (“Risk Managed Real Estate Fund”) ● Guggenheim StylePlus—Large Core Fund (“StylePlus—Large Core Fund”) ● Guggenheim Total Return Bond Fund (“Total Return Bond Fund”) |
Security Investors, LLC (“Security Investors”), an indirect subsidiary of Guggenheim Partners, LLC, a global, diversified financial services firm (“Guggenheim Partners”), serves as investment adviser to each of: (i) Alpha Opportunity Fund; (ii) High Yield Fund; (iii) Investment Grade Bond Fund; (iv) Large Cap Value Fund; (v) Mid Cap Value Fund; (vi) Mid Cap Value Institutional Fund; (vii) Municipal Income Fund; (viii) Small Cap Value Fund; (ix) StylePlus—Large Core Fund; (x) StylePlus—Mid Growth Fund; and (xi) World Equity Income Fund (collectively, the “SI-Advised Funds”). (Guggenheim Partners, Security Investors, Guggenheim Partners Investment Management, LLC (“GPIM”) and their affiliates may be referred to herein collectively as “Guggenheim.” “Guggenheim Investments” refers to the global asset management and investment advisory division of Guggenheim Partners and includes GPIM, Security Investors and Guggenheim Funds Investment Advisors, LLC and other affiliated investment management businesses of Guggenheim Partners.)
| 128 | THE GUGGENHEIM FUNDS ANNUAL REPORT | |
OTHER INFORMATION (Unaudited)(continued) |
Under the terms of investment management agreements between Security Investors and the Trust, with respect to the SI-Advised Funds, Security Investors also is responsible for overseeing the activities of GPIM, an indirect subsidiary of Guggenheim Partners, with respect to its service as investment sub-adviser to Municipal Income Fund, pursuant to an investment sub-advisory agreement between Security Investors and GPIM (the “GPIM Sub-Advisory Agreement”).
GPIM serves as investment adviser with respect to each of: (i) Diversified Income Fund; (ii) Floating Rate Strategies Fund; (iii) Limited Duration Fund; (iv) Macro Opportunities Fund; (v) Market Neutral Real Estate Fund; (vi) Risk Managed Real Estate Fund; and (vii) Total Return Bond Fund (collectively, the “GPIM-Advised Funds” and together with the SI-Advised Funds, the “Funds” and individually, a “Fund”).1 Under the supervision of the Board of Trustees of the Trust (the “Board,” with the members of the Board referred to individually as the “Trustees”), the Advisers regularly provide (or, as applicable, oversee the provision of) investment research, advice and supervision, along with a continuous investment program for the Funds, and direct the purchase and sale of securities and other investments for each Fund’s portfolio.
Following an initial two-year term, each of the Advisory Agreements continues in effect from year to year provided that such continuance is specifically approved at least annually by (i) the Board or a majority of the outstanding voting securities (as defined in the 1940 Act) of each Fund, and, in either event, (ii) the vote of a majority of the Trustees who are not “interested person[s],” as defined by the 1940 Act, of the Trust (the “Independent Trustees”) casting votes in person at a meeting called for such purpose. At meetings held in person on April 25, 2017 (the “April Meeting”) and on May 23, 2017 (the “May Meeting”), the members of the Contracts Review Committee of the Board (the “Committee”), consisting solely of the Independent Trustees, met separately from Guggenheim to consider the proposed renewal of the Advisory Agreements and the GPIM Sub-Advisory Agreement in connection with the Committee’s annual contract review schedule. GPIM also serves as investment adviser for the Capital Stewardship Fund, which is addressed in a separate report.2
As part of its review process, the Committee was represented by independent legal counsel to the Independent Trustees (“Independent Legal Counsel”). Independent Legal Counsel reviewed and discussed with the Committee various key aspects of the Trustees’ legal responsibilities relating to the proposed renewal of the Agreements and other principal contracts. The Committee took into account various materials received from Guggenheim and Independent Legal Counsel. Recognizing that the evaluation process with respect to the services provided by each of the Advisers is an ongoing one, the Committee also considered the variety of written materials, reports and oral presentations the Board receives throughout the year regarding performance and operating results of the Funds.
In connection with the contract review process, FUSE Research Network LLC (“FUSE”), an independent, third-party research provider, was engaged to prepare advisory contract renewal reports designed specifically to help the Board fulfill its advisory contract renewal responsibilities. The objective of the reports is to present the subject funds’ relative position regarding fees, expenses and total return performance, with peer group and universe comparisons. The Committee assessed the data provided in the FUSE reports as well as commentary and supporting data presented by Guggenheim, including, among other things, a summary of notable distinctions between certain Funds and the applicable peer group identified in the FUSE reports.
In addition, Guggenheim provided materials and data in response to formal requests for information sent by Independent Legal Counsel on behalf of the Independent Trustees. Guggenheim also made a presentation at the April Meeting. Throughout the process, the Committee asked questions of management and requested certain additional information, which Guggenheim provided following the April Meeting (collectively with the foregoing reports and materials, the “Contract Review Materials”). The Committee considered the Contract Review Materials in the context of its accumulated experience governing the Trust and weighed the factors and standards discussed with Independent Legal Counsel.
Following an analysis and discussion of the factors identified below and in the exercise of its business judgment, the Committee concluded that it was in the best interest of each Fund to recommend that the Board approve the renewal of each Advisory Agreement and the GPIM Sub-Advisory Agreement for an additional annual term.
1 | The investment management agreements pertaining to the SI-Advised Funds and the investment management agreements pertaining to the GPIM-Advised Funds are referred to herein together as the “Advisory Agreements” and, together with the GPIM Sub-Advisory Agreement, as the “Agreements.” In addition, unless the context indicates otherwise, GPIM, with respect to its service as investment adviser to the GPIM-Advised Funds, and Security Investors as to the SI-Advised Funds, are each referred to herein as the “Adviser” and together, the “Advisers.” |
2 | Because shares of the Capital Stewardship Fund are only offered for subscription and are held by a limited number of institutional/bank investors, and the Fund issues a shareholder report separate from the other series of the Trust, the factors considered by the Committee in evaluating the proposed renewal of an investment management agreement pertaining to the Capital Stewardship Fund, and the Concinnity Sub-Advisory Agreement, are addressed in a separate report of the Committee. Accordingly, references to the “Funds” should be understood as referring to all series of the Trust, excluding Capital Stewardship Fund. |
| | THE GUGGENHEIM FUNDS ANNUAL REPORT | 129 |
OTHER INFORMATION (Unaudited)(continued) |
Advisory Agreements
Nature, Extent and Quality of Services Provided by each Adviser: With respect to the nature, extent and quality of services currently provided by each Adviser, the Committee considered the qualifications, experience and skills of key personnel performing services for the Funds, including those personnel providing compliance oversight, as well as the supervisors and reporting lines for such personnel. In this connection, the Committee considered Guggenheim’s resources and related efforts to retain, attract and motivate capable personnel to serve the Funds and noted Guggenheim’s report on recent additions, departures and transitions in personnel who work on matters relating to the Funds or are significant to the operations of each Adviser. The Committee also considered the Advisers’ attention to relevant developments in the mutual fund industry and its observance of compliance and regulatory requirements, and noted that on a regular basis the Board receives and reviews information from the Trust’s Chief Compliance Officer regarding compliance policies and procedures established pursuant to Rule 38a-1 under the 1940 Act, as well as from Guggenheim’s Chief Risk Officer. In addition, the Committee noted Guggenheim’s implementation of additional controls and oversight processes relating to risk management, including the establishment of an Enterprise Risk Management Committee comprised of a multi-disciplinary team of senior personnel, as well as enhancements to the organization’s information security program.
In connection with the Committee’s evaluation of the overall package of services provided by each Adviser, the Committee considered Guggenheim’s administrative capabilities, including its role in monitoring and coordinating compliance responsibilities with the fund administrator, transfer agent, distributor, custodian and other service providers to the Funds. In this respect, the Committee took into account the initiatives undertaken by Guggenheim in connection with the outsourcing of its fund administration and transfer agency services business resulting from Guggenheim’s sale of Rydex Fund Services, LLC (“RFS”), formerly a Guggenheim affiliate and now known as MUFG Investor Services (US), LLC (“MUFG IS”), to Mitsubishi UFJ Trust and Banking Corporation, the trust banking arm of Mitsubishi UFJ Financial Group, a Japanese financial services organization (the “RFS Transaction”). In particular, the Committee considered Guggenheim’s establishment of the Office of Chief Financial Officer (“OCFO”), its structure and responsibilities, including its role in overseeing the services provided by MUFG IS. The Committee also considered the resources allocated by Guggenheim to support the OCFO and the detailed plans presented by management for functions for the OCFO both during and upon completion of the transition period with MUFG IS.
With respect to Municipal Income Fund, the Committee noted that although Security Investors delegated responsibility for the investment and reinvestment of the Fund’s assets to the Sub-Adviser, as affiliated companies, both the Adviser and Sub-Adviser are part of the Guggenheim organization. Further, the Committee took into account that investment advisory-related services are provided by many Guggenheim employees under different related legal entities and thus, the services provided by the Adviser on the one hand and the Sub-Adviser on the other, as well as the risks assumed by each party, are not provided by distinct legal entities. The Committee took into account information provided by Guggenheim describing the Adviser’s processes and activities for providing oversight of the Sub-Adviser’s investment strategies and compliance with investment restrictions, including information regarding the Adviser’s Sub-Advisory Oversight Committee.
With respect to Guggenheim’s resources and the ability of each Adviser to carry out its responsibilities under the applicable Advisory Agreement, the Chief Financial Officer of Guggenheim Investments reviewed with the Committee certain unaudited financial information concerning the holding company for Guggenheim Investments, Guggenheim Partners Investment Management Holdings, LLC (“GPIMH”). The Committee received the audited consolidated financial statements of GPIMH as supplemental information. (Thereafter, the Committee received the audited consolidated financial statements of GPIM.)
The Committee also considered the acceptability of the terms of each Advisory Agreement, including the scope of services required to be performed by each Adviser.
Based on the foregoing, and based on other information received (both oral and written) at the April Meeting and the May Meeting, as well as other considerations, including the Committee’s knowledge of how each Adviser performs its duties obtained through Board meetings, discussions and reports during the year, the Committee concluded that each Adviser and its personnel were qualified to serve the Funds in such capacity and may reasonably be expected to continue to provide a high quality of services under each Advisory Agreement with respect to the Funds.
Investment Performance: The Committee received, for each Fund, investment returns for the ten-year, five-year, three-year, one-year and three-month periods ended December 31, 2016, as applicable. In addition, the Committee received a comparison of each Fund’s performance to the performance of a benchmark, a universe of funds and a narrower peer group of similar funds based on asset levels as identified by FUSE, in each case for the same periods, as applicable. The Committee also received from FUSE representatives and considered a description of the methodology employed by FUSE for identifying each Fund’s peer group and universe for performance and expense comparisons.
| 130 | THE GUGGENHEIM FUNDS ANNUAL REPORT | |
OTHER INFORMATION (Unaudited)(continued) |
In seeking to evaluate Fund performance over a full market cycle, the Committee focused its attention on five-year and three-year performance rankings as compared to the relevant universe of funds. The Committee also considered more recent performance periods, including the one-year period and, as deemed appropriate, the since-inception and/or three-month period, for certain Funds such as for those Funds that were recently launched or had undergone recent changes in investment strategies, as well as circumstances in which enhancements were made to the portfolio management processes or techniques employed for a Fund. In this connection, the Committee made the following observations:
Alpha Opportunity Fund: The Fund’s Class A shares outperformed the performance universe median for the five-year and three-year periods, ranking in the 8th percentile for both periods. The Committee considered that the Fund re-opened to subscriptions with a new U.S. long/short equity investment strategy on January 28, 2015. In light of the foregoing, the Committee also considered the more recent one-year period ended December 31, 2016, and observed that the return of Fund’s Class A shares ranked in the 5th percentile of its performance universe, exceeding the performance universe median.
Diversified Income Fund:3 The Committee noted the Fund’s inception date of January 29, 2016, and observed that the Fund’s Class A shares ranked in the 22nd and 24th percentiles of its performance universe for the since-inception and three-month periods ended December 31, 2016, respectively, exceeding its performance universe median for both periods.
Floating Rate Strategies Fund: The returns of the Fund’s Class A shares ranked in the 6th and 10th percentiles of its performance universe for the five-year and three-year periods ended December 31, 2016, respectively, exceeding its performance universe median for each of these periods.
High Yield Fund: The returns of the Fund’s Class A shares ranked in the 3rd and 6th percentiles of its performance universe for the five-year and three-year periods ended December 31, 2016, respectively, exceeding its performance universe median for each of these periods.
Investment Grade Bond Fund: The returns of the Fund’s Class A shares ranked in the 2nd percentile of its performance universe for both the five-year and three-year periods ended December 31, 2016, exceeding its performance universe median for both of these periods.
Limited Duration Fund: The Committee noted the Fund’s inception date of December 16, 2013, and observed that the returns of the Fund’s Class A shares ranked in the 1st and 9th percentiles of its performance universe for the three-year and one-year periods ended December 31, 2016, respectively, exceeding its performance universe median for both of these periods.
Macro Opportunities Fund: The Committee observed that the returns of the Fund’s Class A shares ranked in the 1st and 8th percentiles of its performance universe for the five-year and three-year periods ended December 31, 2016, respectively, exceeding its performance universe median for both of these periods.
Market Neutral Real Estate Fund:4 The Committee noted the Fund’s inception date of February 26, 2016, and observed that the returns of the Fund’s Class A shares ranked in the 55th and 14th percentiles of its performance universe for the since-inception and three-month periods ended December 31, 2016, respectively, exceeding the performance universe median for the three-month period.
Risk Managed Real Estate Fund: The Committee noted the Fund’s inception date of March 28, 2014, and observed the returns of the Fund’s Class A shares ranked in the 3rd and 16th percentiles of its performance universe for the since-inception and one-year periods ended December 31, 2016, respectively, exceeding its performance universe median for both of these periods.
StylePlus—Large Core Fund: The returns of the Fund’s Class A shares ranked in the 46th and 1st percentiles of its performance universe for the five-year and three-year periods ended December 31, 2016, respectively. The Committee noted that the Fund implemented a strategy change and a new portfolio management team in May 2013.
3 | At a meeting held on August 20, 2015, the Board approved an investment management agreement dated November 17, 2015, between GPIM and the Trust, with respect to Diversified Income Fund, for an initial two-year term (the “Diversified Income Fund IMA”). The Committee determined to include the Diversified Income Fund IMA within the scope of its 2017 annual contract review in order to align the timing for review of such agreement with the process undertaken by the Committee for the Advisory Agreements, with respect to the other Funds, on a uniform schedule. |
4 | At a meeting held on November 10, 2015, the Board approved an investment management agreement dated November 17, 2015, between GPIM and the Trust, with respect to Market Neutral Real Estate Fund, for an initial two-year term (the “Market Neutral RE Fund IMA”). The Committee determined to include the Market Neutral RE Fund IMA within the scope of its 2017 annual contract review in order to align the timing for review of such agreement with the process undertaken by the Committee for the Advisory Agreements, with respect to the other Funds, on a uniform schedule. |
| | THE GUGGENHEIM FUNDS ANNUAL REPORT | 131 |
OTHER INFORMATION (Unaudited)(continued) |
StylePlus—Mid Growth Fund: The returns of the Fund’s Class A shares ranked in the 31st and 13th percentiles of its performance universe for the five-year and three-year periods ended December 31, 2016, respectively. The Committee noted that the Fund implemented a strategy change and a new portfolio management team in May 2013.
Total Return Bond Fund: The Committee observed that the returns of the Fund’s Class A shares ranked in the 1st and 2nd percentiles of its performance universe for the five-year and three-year periods ended December 31, 2016, respectively, and exceeded the performance universe median for each of these periods.
World Equity Income Fund: The returns of the Fund’s Class A shares ranked in the 43rd and 14th percentiles of its performance universe for the five-year and three-year periods ended December 31, 2016, respectively. The Committee noted that the Fund implemented a strategy change and a new portfolio management team in August 2013.
Value Funds: Large Cap Value Fund, Mid Cap Value Fund, Mid Cap Value Institutional Fund and Small Cap Value Fund
Large Cap Value Fund: The returns of the Class A shares exceeded the performance universe median for the five-year and three-year periods ended December 31, 2016, and ranked in the 37th and 25th percentiles, respectively.
Mid Cap Value Fund: The returns of the Class A shares underperformed the performance universe median for the five-year and three-year periods ended December 31, 2016, ranking in the 69th and 62nd percentiles, respectively. The Committee noted measures taken by the Adviser to remedy longer-term relative underperformance with respect to the Value Funds strategy, including strategy enhancements such as implementation of a refined stock selection process and additional risk controls to enforce the strategy’s sell discipline. In light of the foregoing, the Committee also considered the more recent one-year period ended December 31, 2016, and observed that the return of the Fund’s Class A shares exceeded the median of its performance universe, ranking in the 7th percentile.
Mid Cap Value Institutional Fund: The Fund’s returns underperformed the performance universe median for the five-year and three-year periods ended December 31, 2016, ranking in the 63rd and 58th percentiles, respectively. The Committee noted measures taken by the Adviser to remedy longer-term relative underperformance with respect to the Value Funds strategy, including strategy enhancements such as implementation of a refined stock selection process and additional risk controls to enforce the strategy’s sell discipline. In light of the foregoing, the Committee also considered the more recent one-year period ended December 31, 2016, and observed that the Fund’s return exceeded the median of its performance universe, ranking in the 9th percentile.
Small Cap Value Fund: The returns of the Class A shares underperformed the performance universe median for the five-year and three-year periods ended December 31, 2016, and ranked in the 67th and 71st percentiles, respectively. The Committee noted measures taken by the Adviser to remedy longer-term relative underperformance with respect to the Value Funds strategy, including strategy enhancements such as implementation of a refined stock selection process and additional risk controls to enforce the strategy’s sell discipline. In light of the foregoing, the Committee also considered the more recent one-year period ended December 31, 2016, and observed that the return of the Fund’s Class A shares exceeded the median of its performance universe, ranking in the 35th percentile.
After reviewing the foregoing and related factors, the Committee concluded that each Fund’s performance was acceptable.
Municipal Income Fund: The Committee considered that Security Investors does not directly manage the investment portfolio but has delegated such duties to GPIM. Based on the information provided and the review of the Fund’s investment performance, the Committee concluded that Security Investors had appropriately reviewed and monitored GPIM’s investment performance as Sub-Adviser to the Fund.
Comparative Fees, Costs of Services Provided and the Profits Realized by each Adviser from Its Relationship with the Funds: The Committee compared each Fund’s contractual advisory fee and total net expense ratio to the applicable peer group. The Committee also reviewed the median advisory fees and expense ratios, including expense ratio components (e.g., transfer agency fees, administration fees, other operating expenses, distribution fees and fee waivers/reimbursements) of the peer group of funds. The Committee also reviewed aggregated advisory and administrative fees compared to the peer group average and median.
| 132 | THE GUGGENHEIM FUNDS ANNUAL REPORT | |
OTHER INFORMATION (Unaudited)(continued) |
As part of its evaluation of each Fund’s advisory fee, the Committee considered how such fees compared to the advisory fee charged by the applicable Adviser to one or more other clients that it manages pursuant to similar investment strategies, to the extent applicable, noting that, in certain instances, Guggenheim charges a lower advisory fee to such other clients. In this connection, the Committee considered, among other things, Guggenheim’s representations about the significant differences between managing mutual funds as compared to other types of accounts. The Committee also considered Guggenheim’s explanation that lower fees are charged in certain instances due to various other factors, including the scope of contract, type of investors, differences in fee structure, applicable legal, governance and capital structures, tax status and historical pricing reasons. The Committee concluded that the information it received demonstrated that the aggregate services provided to each Fund at issue were sufficiently different from those provided to other clients with similar investment strategies and/or the risks borne by Guggenheim were sufficiently greater than those associated with managing other clients with similar investment strategies to support the difference in fees.
In further considering the comparative fee and expense data presented in the Contract Review Materials and addressed by Guggenheim, the Committee took into account those Funds with currently effective expense limitation agreements with the Adviser and made the following observations:
Alpha Opportunity Fund: The average contractual advisory fee percentile rank across all share classes of the Fund and the asset weighted total net expense ratio are in the second quartile (44th and 46th percentiles, respectively) of its peer group. The net effective management fee5 ranks in the third quartile (72nd percentile). The Committee considered the Adviser’s proposal, presented at the May Meeting, to reduce the Fund’s expense cap by 35 basis points across all share classes.
Diversified Income Fund: The average contractual advisory fee percentile rank across all share classes of the Fund and the net effective management fee are in the second quartile (35th and 27th percentiles, respectively) of its peer group and the asset weighted total net expense ratio is in the first quartile (1st percentile) of its peer group.
Floating Rate Strategies Fund: The average contractual advisory fee percentile rank across all share classes of the Fund is in fourth quartile (84th percentile) of its peer group and the net effective management fee is in the third quartile (69th percentile) of its peer group. The Fund’s asset weighted total net expense ratio is in the second quartile (48th percentile) of its peer group. The Committee considered the Fund’s strong performance and top decile performance universe rankings for the five- and three-year periods ended December 31, 2016.
High Yield Fund: The average contractual advisory fee percentile rank across all share classes of the Fund is in the second quartile (48th percentile) of its peer group and the net effective management fee is in the third quartile (75th percentile) of its peer group. The Fund’s asset weighted total net expense ratio is in the fourth quartile (81st percentile) of its peer group. The Committee considered the Fund’s strong performance and top decile performance universe rankings for the five- and three-year periods ended December 31, 2016.
Investment Grade Bond Fund: The average contractual advisory fee percentile rank across all share classes of the Fund, the net effective management fee and the asset weighted total net expense ratio each rank in the fourth quartile (85th, 89th and 94th percentiles, respectively) of its peer group. The Committee considered the Fund’s strong performance and top decile performance universe rankings for the five- and three-year periods ended December 31, 2016.
Large Cap Value Fund: The average contractual advisory fee percentile rank across all share classes of the Fund and the asset weighted total net expense ratio is in the second quartile (33rd and 39th percentiles, respectively) of its peer group. The net effective management fee is in the third quartile (55th percentile) of its peer group.
Limited Duration Fund: The net effective management fee is in the third quartile (71st percentile) of its peer group, as is the Fund’s asset weighted total net expense ratio (63rd percentile). The average contractual advisory fee percentile rank across all share classes of the Fund is in the fourth quartile (78th percentile). The Committee considered the Fund’s strong performance and top decile performance universe rankings for the three- and one-year periods ended December 31, 2016.
5 | The “net effective management fee” for Alpha Opportunity Fund and each of the other Funds represents the combined effective advisory fee and administration fee as a percentage of average net assets for the latest fiscal year, after any waivers and/or reimbursements, based on the Fund’s class level peer group percent rank, weighted by class level assets under management. |
| | THE GUGGENHEIM FUNDS ANNUAL REPORT | 133 |
OTHER INFORMATION (Unaudited)(continued) |
Macro Opportunities Fund: The average contractual advisory fee percentile rank across all share classes of the Fund and the net effective management fee rank in the fourth quartile (86th and 80th percentiles, respectively) of its peer group. The asset weighted total net expense ratio is in the third quartile (73rd percentile) of its peer group. The Committee noted that the Fund is categorized as a non-traditional bond fund which seeks to add value by investing in many non-traditional securities outside of fixed income, including equities, currencies, commodities and derivatives. In addition, the Committee considered the Fund’s strong performance and top decile performance universe rankings for the five- and three-year periods ended December 31, 2016.
Market Neutral Real Estate Fund: Each of the average contractual advisory fee percentile rank across all share classes of the Fund, the net effective management fee and the asset weighted total net expense ratio is in the third quartile (36th, 38th and 39th percentiles, respectively) of its peer group.
Mid Cap Value Fund: The average contractual advisory fee percentile rank across all share classes of the Fund is in the third quartile (71st percentile) of its peer group and the net effective management fee and asset weighted total net expense ratio are in the fourth quartile (76th and 86th percentiles, respectively) of its peer group as of December 31, 2016. The Committee noted that in November 2016 the Adviser recommended and the Board approved the elimination of the Fund’s advisory fee breakpoint and a reduction in the Fund’s contractual advisory fee from 1.00% to 0.75%, effective February 1, 2017, along with the conclusion that the reduction in the advisory fee would not result in any decrease in the nature, extent and quality of services provided to the Fund. Based upon the new contractual advisory fee rate, the Fund’s gross management fee6 peer group rankings would be 53rd percentile for Class A shares, 64th percentile for Class C shares, and 47th percentile for Class P shares.
Mid Cap Value Institutional Fund: The total net expense ratio is in the third quartile (68th percentile) and the contractual advisory fee and net effective management fee are in the fourth quartile (86th and 77th percentiles, respectively). The Committee considered the strategy enhancements implemented for the Fund and the Fund’s strong recent performance, including a top decile performance universe ranking for the one-year period ended December 31, 2016.
Municipal Income Fund: The average contractual advisory fee percentile rank across all share classes of the Fund and the asset weighted total net expense ratio are in the second quartile (49th and 27th percentiles, respectively) of its peer group and the net effective management fee is in the first quartile (22nd percentile).
Risk Managed Real Estate Fund: The average contractual advisory fee percentile rank across all share classes of the Fund is in the first quartile (23rd percentile) of its peer group and the net effective management fee and the asset weighted total net expense ratio are in the second quartile (50th and 28th percentiles, respectively) of its peer group.
StylePlus—Large Core Fund: The average contractual advisory fee percentile rank across all share classes of the Fund (58th percentile), the net effective management fee (75th percentile) and the asset weighted total net expense ratio (75th percentile) are in the third quartile of its peer group.
StylePlus—Mid Growth Fund: The average contractual advisory fee percentile rank across all share classes of the Fund is in the first quartile (25th percentile) of its peer group. The net effective management fee and asset weighted total net expense ratio are in the fourth quartile (77th and 85th percentiles, respectively) of its peer group.
Small Cap Value Fund: The average contractual advisory fee percentile rank across all share classes of the Fund is in the third quartile (72nd percentile) of its peer group and the net effective management fee is in the first quartile (16th percentile) as of December 31, 2016. The Fund’s asset weighted total net expense ratio is in the second quartile (36th percentile) of its peer group as of December 31, 2016. The Committee noted that in November 2016 the Adviser recommended and the Board approved a reduction in the Fund’s contractual advisory fee from 1.00% to 0.75%, effective February 1, 2017, along with the conclusion that the reduction in the advisory fee would not result in any decrease in the nature, extent and quality of services provided to the Fund. Based upon the new contractual advisory fee rate, the Fund’s gross management fee peer group rankings would be 25th percentile for Class A shares, 31st percentile for Class C shares, 18th percentile for Class I shares, and 29th percentile for Class P shares.
6 | The “gross management fee,” with respect to Mid Cap Value Fund and Small Cap Value Fund, is the sum of the advisory fee and the administration fee. |
| 134 | THE GUGGENHEIM FUNDS ANNUAL REPORT | |
OTHER INFORMATION (Unaudited)(continued) |
Total Return Bond Fund: The average contractual advisory fee percentile rank across all share classes of the Fund is in the fourth quartile (89th percentile) of its peer group and the net effective management fee and asset weighted total net expense ratio are in the second quartile (39th and 33rd percentiles, respectively) of its peer group. The Committee considered the Fund’s strong performance and top decile performance universe rankings for the five- and three-year periods ended December 31, 2016.
World Equity Income Fund: The average contractual advisory fee percentile rank across all share classes of the Fund and the net effective management fee are in the second quartile (32nd and 49th percentiles, respectively) of its peer group. The asset weighted total net expense ratio is in the third quartile (68th percentile) of its peer group. The Committee noted that in November 2016 the Adviser recommended and the Board approved a 24 basis point reduction in the Fund’s expense cap (across all share classes).
With respect to the costs of services provided and profits realized by Guggenheim Investments from its relationship with the Funds, the Committee reviewed a profitability analysis and data from management for each Fund setting forth the average assets under management for the twelve months ended December 31, 2016, ending assets under management of the Trust as of December 31, 2016, gross revenues received by Guggenheim Investments, expenses allocated to the Fund, expense waivers, earnings and the operating margin/profitability rate, including variance information relative to the foregoing amounts as of December 31, 2015. In addition, the Chief Financial Officer of Guggenheim Investments reviewed with, and addressed questions from, the Committee concerning the expense allocation methodology employed in producing the profitability analysis.
In the course of its review of Guggenheim Investments’ profitability, the Committee took into account the methods used by Guggenheim Investments to determine expenses and profit. The Committee also noted steps taken by management to refine its methodology in preparation for contract review, including, among other things, revisions to the process for allocating expenses for shared service functions, as previously reported to and discussed with the Board. The Committee considered all of the foregoing in evaluating the costs of services provided, the profitability to Guggenheim Investments and the profitability rates presented, and concluded that the profits were not unreasonable.
The Committee considered other benefits available to each Adviser because of its relationship with the Funds and noted Guggenheim’s statement that until the completion of the RFS Transaction on October 4, 2016, the Adviser may have benefited from arrangements whereby an affiliate received fees from the Funds for providing certain fund administration and transfer agency services. In addition, the Committee noted Guggenheim’s statement that it may benefit from marketing synergies arising from offering a broad spectrum of products, including the Funds.
Economies of Scale: The Committee received and considered information regarding whether there have been economies of scale with respect to the management of the Funds as Fund assets grow, whether the Funds have appropriately benefited from any economies of scale, and whether there is potential for realization of any further economies of scale. The Committee considered whether economies of scale in the provision of services to the Funds were being passed along to the shareholders. The Committee noted the Adviser’s statements, including that Guggenheim believes it is appropriately sharing potential economies of scale and that costs continue to increase in many key areas, including compensation of portfolio managers, key analysts and support staff, as well as for infrastructure needs, with respect to risk management oversight, valuation processes and disaster recovery systems, among other things, and that, in this regard, management’s costs for providing services have increased in recent years without regard to asset levels.
The Committee also noted the process employed by the Adviser to evaluate whether a breakpoint would be appropriate for a Fund, with consideration given to, among other things: (i) the Fund’s size and trends in asset levels over recent years; (ii) the competitiveness of the expense levels; (iii) whether expense waivers are in place; (iv) changes and trends in revenue and expenses; (v) whether there are any anticipated expenditures that may benefit the Fund in the future; (vi) Fund profit level margins; (vii) relative Fund performance; (viii) the nature, extent and quality of services management provides to the Fund; and (ix) the complexity of the Fund’s investment strategy and the resources required to support the Fund.
As part of its assessment of economies of scale, the Committee also considered Guggenheim’s view that it seeks to share economies of scale through a number of means, including expense limitations and/or advisory fees set at competitive rates pre-assuming future asset growth. Thus, the Committee considered the size of the Funds and the competitiveness of and/or other determinations made regarding the current advisory fee for each Fund, as well as whether a Fund is subject to an expense limitation. The Committee also took into account, the advisory fee breakpoints offered by the Adviser and approved by the Board with respect to several of the fixed income Funds, to take effect on May 1, 2017.
The Committee determined that, taking into account all relevant factors, the advisory fee for each Fund was reasonable.
| | THE GUGGENHEIM FUNDS ANNUAL REPORT | 135 |
OTHER INFORMATION (Unaudited)(concluded) |
Sub-Advisory Agreement
Nature, Extent and Quality of Services Provided by the Sub-Adviser: With respect to the nature, extent and quality of services provided by GPIM (referred to in this discussion as the “Sub-Adviser”), the Committee considered the qualifications, experience and skills of the Sub- Adviser’s portfolio management and other key personnel and information from the Sub-Adviser describing the scope of its services to Municipal Income Fund. With respect to Guggenheim’s resources and the Sub-Adviser’s ability to carry out its responsibilities under the Sub-Advisory Agreement, as noted above, the Committee considered the financial condition of GPIMH. (Thereafter, the Committee received the audited consolidated financial statements of GPIM.)
The Committee also considered the acceptability of the terms of the Sub-Advisory Agreement. Based on the foregoing, and based on other information received (both oral and written) at the April Meeting and at the May Meeting, as well as other considerations, including the Committee’s knowledge of how the Sub-Adviser performs its duties obtained through Board meetings, discussions and reports throughout the year, the Committee concluded that the Sub-Adviser and its personnel were qualified to serve Municipal Income Fund in such capacity and may reasonably be expected to continue to provide a high quality of services under the Sub-Advisory Agreement.
Investment Performance: The Committee considered that the Fund’s Class A shares ranked in the third quartile (64th and 52nd percentiles) of its performance universe for the five-year and three-year periods ended December 31, 2016, respectively. The Committee concluded that the investment performance of the Fund and the Sub-Adviser was acceptable.
Comparative Fees, Costs of Services Provided and the Profits Realized by the Sub-Adviser from Its Relationship with the Fund: The Committee considered that the Sub-Advisory Agreement is with an affiliate of the Adviser, that the Adviser compensates the Sub-Adviser from its own fees so that the sub-advisory fee rate for the Fund does not impact the fees paid by the Fund and that the Sub-Adviser’s revenues were included in the calculation of Guggenheim Investments’ profitability. Given its determination of the reasonableness of the advisory fee, the Committee concluded that the sub-advisory fee rate for the Fund was reasonable.
Economies of Scale: The Committee recognized that, because the Sub-Adviser’s fees are paid by the Adviser and not the Fund, the analysis of economies of scale was more appropriate in the context of the Committee’s consideration of the applicable Advisory Agreement, which was separately considered. (See “Advisory Agreements – Economies of Scale” above.)
Overall Conclusions
Based on the foregoing, the Committee determined that the investment advisory fees are fair and reasonable in light of the extent and quality of the services provided and other benefits received and that the continuation of the Agreements is in the best interest of each Fund. In reaching this conclusion, no single factor was determinative or conclusive and each Committee member, in the exercise of his business judgment, may attribute different weights to different factors. At the May Meeting, the Committee, constituting all of the Independent Trustees, recommended the renewal of each Advisory Agreement and the Sub-Advisory Agreement for an additional annual term.
Thereafter, on May 24, 2017, the Board, including all of the Independent Trustees, approved the renewal of each of the Advisory Agreements and the Sub-Advisory Agreement for an additional annual term.
| 136 | THE GUGGENHEIM FUNDS ANNUAL REPORT | |
INFORMATION ON BOARD OF TRUSTEES AND OFFICERS (Unaudited) |
Name, Address*
and Year of Birth | Position(s)
Held with
the Trust | Term of Office
and Length of
Time Served** | Principal Occupation(s)
During Past Five Years | Number of Portfolios in Fund Complex Overseen | Other Directorships
Held by Trustees |
| INDEPENDENT TRUSTEES | | | |
Randall C. Barnes
(1951) | Trustee | Since 2014 | Current: Private Investor (2001-present). Former: Senior Vice President and Treasurer, PepsiCo, Inc. (1993-1997); President, Pizza Hut International (1991-1993); Senior Vice President, Strategic Planning and New Business Development, PepsiCo, Inc. (1987-1990). | 96 | Current: Trustee, Purpose Investments Funds Inc. (2014-Present). |
Donald A. Chubb, Jr.
(1946 ) | Trustee and Chairman of the Valuation Oversight Committee | Since 1994 | Current: Retired. Former: Business broker and manager of commercial real estate, Griffith & Blair, Inc. (1997-2017). | 93 | Former: Midland Care, Inc. (2011-2016). |
Jerry B. Farley
(1946) | Trustee and Chair of the Audit Committee | Since 2005 | Current: President, Washburn University (1997-present). | 93 | Current: Westar Energy, Inc. (2004-present); CoreFirst Bank & Trust (2000-present). |
Roman Friedrich III
(1946) | Trustee and Chairman of the Contracts Review Committee | Since 2014 | Current: Founder and Managing Partner, Roman Friedrich & Company (1998-present). Former: Senior Managing Director, MLV & Co. LLC (2010-2011). | 93 | Current: Zincore Metals, Inc. (2009-present). Former: Axiom Gold and Silver Corp. (2011-2012). |
Robert B. Karn III
(1942)
| Trustee | Since 2014 | Current: Consultant (1998-present). Former: Arthur Andersen (1965-1997) and Managing Partner, Financial and Economic Consulting, St. Louis office (1987-1997). | 93 | Current: GP Natural Resource Partners, LLC (2002-present). Former: Peabody Energy Company (2003-Apr. 2017). |
Ronald A. Nyberg
(1953) | Trustee and Chairman of the Nominating and Governance Committee | Since 2014 | Current: Partner, Momkus McCluskey Roberts LLC (2016-present). Former: Partner, Nyberg & Cassioppi, LLC (2000-2016); Executive Vice President, General Counsel, and Corporate Secretary, Van Kampen Investments (1982-1999). | 98 | Current: Edward-Elmhurst Healthcare System (2012-present). |
| | THE GUGGENHEIM FUNDS ANNUAL REPORT | 137 |
INFORMATION ON BOARD OF TRUSTEES AND OFFICERS (Unaudited)(continued) |
Name, Address*
and Year of Birth | Position(s)
Held with
the Trust | Term of Office
and Length of
Time Served** | Principal Occupation(s)
During Past Five Years | Number of Portfolios in Fund Complex Overseen | Other Directorships
Held by Trustees |
| INDEPENDENT TRUSTEES - concluded | |
Maynard F. Oliverius
(1943)
| Trustee | Since 1998 | Current: Retired. Former: President and CEO, Stormont-Vail HealthCare (1996-2012). | 93 | Current: Robert J. Dole Institute of Politics (2016-present); Stormont-Vail Foundation (2013-present); University of Minnesota MHA Alumni Philanthropy Committee (2009-present); Fort Hays State University Foundation (1999-present). Former: Topeka Community Foundation (2009-2014). |
Ronald E. Toupin, Jr.
(1958)
| Trustee and Chairman of the Board | Since 2014 | Current: Portfolio Consultant (2010-present). Former: Vice President, Manager and Portfolio Manager, Nuveen Asset Management (1998-1999); Vice President, Nuveen Investment Advisory Corp. (1992-1999); Vice President and Manager, Nuveen Unit Investment Trusts (1991-1999); and Assistant Vice President and Portfolio Manager, Nuveen Unit Investment Trusts (1988-1999), each of John Nuveen & Co., Inc. (1982-1999). | 95 | Former: Bennett Group of Funds (2011-2013). |
| INTERESTED TRUSTEE | |
Donald C. Cacciapaglia***
(1951)
| Trustee | Since 2012 | Current: Vice Chairman, Guggenheim Investments (2010-present). Former: President and CEO, certain other funds in the Fund Complex (2012-November 2017); Chairman and CEO, Channel Capital Group, Inc. (2002-2010). | 226 | Current: Clear Spring Life Insurance Company (2015-present); Guggenheim Partners Japan, Ltd. (2014-present); Guggenheim Partners Investment Management Holdings, LLC (2014-present); Delaware Life (2013-present); Guggenheim Life and Annuity Company (2011-present); Paragon Life Insurance Company of Indiana (2011-present). |
| * | The business address of each Trustee is c/o Guggenheim Investments, 227 West Monroe Street, Chicago, Illinois 60606. |
| ** | Each Trustee serves an indefinite term, until his successor is elected and qualified. Time served includes time served in the respective position for the Predecessor Corporation. |
| *** | This Trustee is deemed to be an "interested person" of the Funds under the 1940 Act by reason of his position with the Funds' Investment Manager and/or the parent of the Investment Manager. |
| 138 | THE GUGGENHEIM FUNDS ANNUAL REPORT | |
INFORMATION ON BOARD OF TRUSTEES AND OFFICERS (Unaudited)(continued) |
Name, Address*
and Year of Birth | Position(s)
Held with
the Trust | Term of Office
and Length of
Time Served** | Principal Occupations
During Past Five Years |
| OFFICERS | | | |
Joanna M. Catalucci
(1966)
| AML Officer | Since 2016 | Current: Chief Compliance Officer, certain funds in the Fund Complex (2012-present); Senior Managing Director, Guggenheim Investments (2014-present); AML Officer, certain funds in the Fund Complex (2016-present). Former: Chief Compliance Officer and Secretary, certain other funds in the Fund Complex (2008-2012); Senior Vice President & Chief Compliance Officer, Security Investors, LLC and certain affiliates (2010-2012); Chief Compliance Officer and Senior Vice President, Rydex Advisors, LLC and certain affiliates (2010-2011). |
James M. Howley
(1972) | Assistant Treasurer | Since 2014 | Current: Managing Director, Guggenheim Investments (2004-present) ; Assistant Treasurer, certain other funds in the Fund Complex (2006-present). Former: Manager, Mutual Fund Administration of Van Kampen Investments, Inc. (1996-2004). |
Keith D. Kemp
(1960)
| Assistant Treasurer | Since 2016 | Current: Treasurer and Assistant Treasurer, certain other funds in the Fund Complex (2010-present); Managing Director, Guggenheim Investments (2015-present); Chief Financial Officer, Guggenheim Specialized Products, LLC (2016-present). Former: Managing Director and Director, Transparent Value, LLC (2010-2016); Director, Guggenheim Partners Investment Management, LLC (2010-2015); Chief Operating Officer, Macquarie Capital Investment Management (2007-2009). |
Amy J. Lee (1961) | President, Chief Executive Officer, and Chief Legal Officer | Since November 2017 (President and Chief Executive Officer) Since 2014 (Chief Legal Officer) | Current: President and Chief Executive Officer, certain other funds in the Fund Complex (November 2017-present); Chief Legal Officer, certain other funds in the Fund Complex (2014-present); Senior Managing Director, Guggenheim Investments (2012-present). Former: Vice President, Associate General Counsel and Assistant Secretary, Security Benefit Life Insurance Company and Security Benefit Corporation (2004-2012). |
Mark E. Mathiasen
(1978)
| Secretary | Since 2014 | Current: Secretary, certain other funds in the Fund Complex (2007-present); Managing Director, Guggenheim Investments (2007-present). |
Glenn McWhinnie
(1969)
| Assistant Treasurer | Since 2016 | Current: Vice President, Guggenheim Investments (2009-present). Former: Tax Compliance Manager, Ernst & Young LLP (1996-2009). |
Michael P. Megaris
(1984)
| Assistant Secretary | Since 2014 | Current: Assistant Secretary, certain other funds in the Fund Complex (2014-present); Vice President, Guggenheim Investments (2012-present). Former: J.D., University of Kansas School of Law (2009-2012). |
| | THE GUGGENHEIM FUNDS ANNUAL REPORT | 139 |
INFORMATION ON BOARD OF TRUSTEES AND OFFICERS (Unaudited)(concluded) |
Name, Address*
and Year of Birth | Position(s)
Held with
the Trust | Term of Office
and Length of
Time Served** | Principal Occupations
During Past Five Years |
| OFFICERS - concluded | |
Elisabeth Miller
(1968)
| Chief Compliance Officer | Since 2012 | Current: CCO, certain other funds in the Fund Complex (2012-present); CCO, Security Investors, LLC (2012-present); CCO, Guggenheim Funds Investment Advisors, LLC (2012-present); Managing Director, Guggenheim Investments (2012-present); Vice President, Guggenheim Funds Distributors, LLC (March 2014-present). Former: CCO, Guggenheim Distributors, LLC (2009-March 2014); Senior Manager, Security Investors, LLC (2004-2009); Senior Manager, Guggenheim Distributors, LLC (2004-2009). |
Adam J. Nelson
(1979)
| Assistant Treasurer | Since 2015 | Current: Vice President, Guggenheim Investments (2015-present); Assistant Treasurer, certain other funds in the Fund Complex (2015-present). Former: Assistant Vice President and Fund Administration Director, State Street Corporation (2013-2015); Fund Administration Assistant Director, State Street (2011-2013); Fund Administration Manager, State Street (2009-2011). |
Kimberly J. Scott
(1974)
| Assistant Treasurer | Since 2014 | Current: Director, Guggenheim Investments (2012-present); Assistant Treasurer, certain other funds in the Fund Complex (2012-present). Former: Financial Reporting Manager, Invesco, Ltd. (2010-2011); Vice President/Assistant Treasurer, Mutual Fund Administration for Van Kampen Investments, Inc./Morgan Stanley Investment Management (2009-2010); Manager of Mutual Fund Administration, Van Kampen Investments, Inc./Morgan Stanley Investment Management (2005-2009). |
Bryan Stone
(1979)
| Vice President | Since 2014 | Current: Vice President, certain other funds in the Fund Complex (2014-present); Director, Guggenheim Investments (2013-present). Former: Senior Vice President, Neuberger Berman Group LLC (2009-2013); Vice President, Morgan Stanley (2002-2009). |
John L. Sullivan
(1955)
| Chief Financial Officer and Treasurer | Since 2014 | Current: CFO, Chief Accounting Officer and Treasurer, certain other funds in the Fund Complex (2010-present); Senior Managing Director, Guggenheim Investments (2010-present). Former: Managing Director and CCO, each of the funds in the Van Kampen Investments fund complex (2004-2010); Managing Director and Head of Fund Accounting and Administration, Morgan Stanley Investment Management (2002-2004); CFO and Treasurer, Van Kampen Funds (1996-2004). |
Jon Szafran (1989) | Assistant Treasurer | Since November 2017 | Current: Vice President, Guggenheim Investments (July 2017-present); Assistant Treasurer, certain other funds in the Fund Complex (November 2017-present). Former: Assistant Treasurer of Henderson Global Funds and Manager of US Fund Administration, Henderson Global Investors (North America) Inc. (“HGINA”), (February-June 2017); Senior Analyst of US Fund Administration, HGINA (2014-January 2017); Senior Associate of Fund Administration, Cortland Capital Market Services, LLC (2013-2014); Experienced Associate, PricewaterhouseCoopers LLP (2012-2013). |
| * | The business address of each officer is c/o Guggenheim Investments, 227 West Monroe Street, Chicago, Illinois 60606. |
| ** | Each officer serves an indefinite term, until his or her successor is duly elected and qualified. Time served includes time served in the respective position for the Predecessor Corporation. |
| 140 | THE GUGGENHEIM FUNDS ANNUAL REPORT | |
GUGGENHEIM INVESTMENTS PRIVACY POLICIES (Unaudited) |
Guggenheim Investments as used herein refers to Guggenheim Partners, LLC, Guggenheim Funds Investment Advisors, LLC, Guggenheim Partners Investment Management, LLC, Guggenheim Funds Distributors, LLC and Security Investors, LLC as well as the funds in the Guggenheim Funds complex (the “funds”).
Our Commitment to You
When you become a Guggenheim Investments investor, you entrust us with not only your hard-earned money but also with personal and financial information about you. We recognize that your relationship with us is based on trust and that you expect us to act responsibly and in your best interests. Because we have access to personal information about you, we hold ourselves to high standards in its safekeeping and use. This means, most importantly, that we do not sell client or account information to anyone—whether you are a current or former Guggenheim Investments client.
The Information We Collect About You and How We Collect It
In the course of doing business with shareholders and investors, we collect nonpublic personal information about you. You typically provide personal information when you complete a Guggenheim Investments account application or when you request a transaction that involves Rydex and Guggenheim Funds or one of the Guggenheim affiliated companies. “Nonpublic personal information” is personally identifiable information about you. For example it includes your name and address, Social Security or taxpayer identification number, assets, income, account balance, bank account information and investment activity (e.g. purchase and redemption history).
How We Share Your Personal Information
As a matter of policy, we do not disclose your nonpublic personal information to nonaffiliated third parties except as required or permitted by law. As emphasized above, we do not sell information about current or former clients or their accounts to third parties. Nor do we share such information, except when necessary to complete transactions at your request or to make you aware of related investment products and services that we offer. Additional details about how we handle your personal information are provided below.
To complete certain transactions or account changes that you direct, it may be necessary to provide your personal information to companies, individuals or groups that are not affiliated with Guggenheim Investments. For example if you ask to transfer assets from another financial institution to Guggenheim Investments, we will need to provide certain information about you to that company to complete the transaction. In connection with servicing your accounts or to alert you to other Guggenheim Investments investment products and services, we may share your information within the Guggenheim Investments family of affiliated companies. This would include, for example, sharing your information within Guggenheim Investments so we can make you aware of new funds or the services offered through another Guggenheim Investments affiliated company. In certain instances, we may contract with nonaffiliated companies to perform services for us. Where necessary, we will disclose information we have about you to these third parties. In all such cases, we provide the third party with only the information necessary to carry out its assigned responsibilities and only for that purpose. And we require these third parties to treat your personal information with the same high degree of confidentiality that we do. In certain instances, we may share information with other financial institutions regarding individuals and entities in response to the U.S.A. Patriot Act. Finally we will share personal information about you if we are compelled by law to do so, if you direct us to do so with your consent, or in other circumstances as permitted by law.
How We Safeguard Your Personal Information
We maintain physical, electronic and procedural safeguards to protect your personal information. Within Guggenheim Investments, access to such information is limited to those who need it to perform their jobs such as servicing your account, resolving problems or informing you of new products and services.
| | THE GUGGENHEIM FUNDS ANNUAL REPORT | 141 |
9.30.2017
Guggenheim Funds Annual Report
| |
| Guggenheim Diversified Income Fund | | |
| Guggenheim High Yield Fund | | |
| Guggenheim Investment Grade Bond Fund | | |
| Guggenheim Limited Duration Fund | | |
| Guggenheim Municipal Income Fund | | |
| GuggenheimInvestments.com | SBINC-ANN-0917x0918 |
| DEAR SHAREHOLDER | 2 |
| ECONOMIC AND MARKET OVERVIEW | 4 |
| ABOUT SHAREHOLDERS’ FUND EXPENSES | 6 |
| DIVERSIFIED INCOME FUND | 9 |
| HIGH YIELD FUND | 21 |
| INVESTMENT GRADE BOND FUND | 45 |
| LIMITED DURATION FUND | 67 |
| MUNICIPAL INCOME FUND | 91 |
| NOTES TO FINANCIAL STATEMENTS | 104 |
| REPORT OF INDEPENDENT REGISTERED PUBLIC ACCOUNTING FIRM | 123 |
| OTHER INFORMATION | 124 |
| INFORMATION ON BOARD OF TRUSTEES AND OFFICERS | 134 |
| GUGGENHEIM INVESTMENTS PRIVACY POLICIES | 138 |
| | THE GUGGENHEIM FUNDS ANNUAL REPORT | 1 |
Dear Shareholder:
Security Investors, LLC, and Guggenheim Partners Investment Management, LLC, (the “Investment Advisers”) are pleased to present the shareholder report for a selection of our Funds (the “Funds”) for the annual fiscal period ended September 30, 2017.
The Investment Advisers are part of Guggenheim Investments, which represents the investment management businesses of Guggenheim Partners, LLC (“Guggenheim”), a global, diversified financial services firm.
Guggenheim Funds Distributors, LLC, is the distributor of the Funds. Guggenheim Funds Distributors, LLC, is affiliated with Guggenheim and the Investment Advisers.
We encourage you to read the Economic and Market Overview section of the report, which follows this letter, and then the Managers’ Commentary for each Fund.
We are committed to providing innovative investment solutions and appreciate the trust you place in us.
Sincerely,
Security Investors, LLC,
Guggenheim Partners Investment Management, LLC,
October 31, 2017
Read a prospectus and summary prospectus (if available) carefully before investing. It contains the investment objectives, risks, charges, expenses and other information, which should be considered carefully before investing. Obtain a prospectus and summary prospectus (if available) at guggenheiminvestments.com or call 800.820.0888.
This material is not intended as a recommendation or as investment advice of any kind, including in connection with rollovers, transfers, and distributions. Such material is not provided in a fiduciary capacity, may not be relied upon for or in connection with the making of investment decisions, and does not constitute a solicitation of an offer to buy or sell securities. All content has been provided for informational or educational purposes only and is not intended to be and should not be construed as legal or tax advice and/or a legal opinion. Always consult a financial, tax and/ or legal professional regarding your specific situation.
Diversified Income Fund may not be suitable for all investors. ● The Fund’s market value will change in response to interest rate changes and market conditions among other factors. In general, bond prices rise when interest rates fall and vice versa. ● The Fund’s exposure to high yield securities may subject the fund to greater volatility. ● Derivatives may pose risks in addition to and greater than those associated with investing directly in securities or other investments, including risks relating to leverage, imperfect correlations with underlying investments or the fund’s other portfolio holdings, high price volatility, lack of availability, counterparty credit, liquidity, valuation and legal restrictions. ● Stock prices, especially stock prices of smaller companies, can be volatile as they reflect changes in the issuing company’s financial conditions and changes in the overall market ● Some asset-backed securities, including mortgage-backed securities, may have structures that make their reaction to interest rates and other factors difficult to predict, making their prices very volatile and they are subject to liquidity risk.● The Fund’s investments in other investment vehicles subject the fund to those risks and expenses affecting the investment vehicle. ● The Fund’s investments in foreign securities carry additional risks when compared to U.S. securities, due to the impact of diplomatic, political or economic developments in the country in question (investments in emerging markets securities are generally subject to an even greater level of risks). ● Investments in syndicated bank loans generally offer a floating interest rate and involve special types of risks. ● Master limited partnerships (“MLPs”) are subject to certain risks inherent in the structure of MLPs, including tax risks, limited control and voting rights and potential conflicts of interest. MLPs that concentrate in a particular industry or a particular geographic region are subject to risks associated with such industry or region. ● The Fund’s investments in real estate securities subject the fund to the same risks as direct investments in real estate, which is particularly sensitive to economic downturns. ● The Fund’s investments and investment strategies, including investments in MLPs and certain investment vehicles, may be subject to special and complex federal income tax provisions that may adversely affect the fund and its distributions to shareholders. ● Leveraging will exaggerate the effect on NAV of any increase or decrease in the market value of the Fund’s portfolio. ● Please read the prospectus for more detailed information regarding these and other risks.
| 2 | THE GUGGENHEIM FUNDS ANNUAL REPORT | |
High Yield Fund may not be suitable for all investors. ● The Fund’s market value will change in response to interest rate changes and market conditions among other factors. In general, bond prices rise when interest rates fall and vice versa. ● The Fund’s exposure to high yield securities may subject the Fund to greater volatility. ● The Fund may invest in derivative instruments, which may be more volatile and less liquid, increasing the risk of loss when compared to traditional securities. Certain of the derivative instruments are also subject to the risks of counterparty default and adverse tax treatment. ●The Fund’s use of leverage, through borrowings or instruments such as derivatives, may cause the Fund to be more volatile than if it had not been leveraged. ● Instruments and strategies (such as borrowing transactions and reverse repurchase agreements) may provide leveraged exposure to a particular investment, which will magnify any gains or losses on those investments. ● The Fund may invest in foreign securities which carry additional risks when compared to U.S. securities, due to the impact of diplomatic, political, or economic developments in the country in question (investments in emerging markets securities are generally subject to an even greater level of risks). ● Investments in syndicated bank loans generally offer a floating interest rate and involve special types of risks. ● The Fund’s investments in other investment vehicles subject the Fund to those risks and expenses affecting the investment vehicle. ● The Fund’s investments in restricted securities may involve financial and liquidity risk. ● You may have a gain or loss when you sell your shares. ● It is important to note that the Fund is not guaranteed by the U.S. government. ● Please read the prospectus for more detailed information regarding these and other risks.
Investment Grade Bond Fund may not be suitable for all investors. ● The Fund’s market value will change in response to interest rate changes and market conditions among other factors. In general, bond prices rise when interest rates fall and vice versa. ● The Fund’s exposure to high yield securities may subject the Fund to greater volatility. ● When market conditions are deemed appropriate, the Fund may use leverage to the full extent permitted by its investment policies and restrictions and applicable law. Leveraging will exaggerate the effect on net asset value of any increase or decrease in the market value of the Fund’s portfolio. ● The Fund may invest in derivative instruments, which may be more volatile and less liquid, increasing the risk of loss when compared to traditional securities. Certain of the derivative instruments are also subject to the risks of counterparty default and adverse tax treatment. ● Instruments and strategies (such as borrowing transactions and reverse repurchase agreements) may provide leveraged exposure to a particular investment, which will magnify any gains or losses on those investments. ● Investments in reverse repurchase agreements expose the Fund to the many of the same risks as investments in derivatives. ● The Fund’s investments in other investment vehicles subject the Fund to those risks and expenses affecting the investment vehicle. ● The Fund’s investments in foreign securities carry additional risks when compared to U.S. securities, due to the impact of diplomatic, political or economic developments in the country in question (investments in emerging markets securities are generally subject to an even greater level of risks). ● Investments in syndicated bank loans generally offer a floating interest rate and involve special types of risks. ● The Fund’s investments in municipal securities can be affected by events that affect the municipal bond market. ● The Fund’s investments in real estate securities subject the Fund to the same risks as direct investments in real estate, which is particularly sensitive to economic downturns. ● The Fund’s investments in restricted securities may involve financial and liquidity risk. ● You may have a gain or loss when you sell your shares. ● It is important to note that the Fund is not guaranteed by the U.S. government. ● Please read the prospectus for more detailed information regarding these and other risks.
Limited Duration Fund may not be suitable for all investors. ● The Fund’s market value will change in response to interest rate changes and market conditions among other factors. In general, bond prices rise when interest rates fall and vice versa. ● The Fund’s exposure to high yield securities may subject the Fund to greater volatility. ● When market conditions are deemed appropriate, the Fund may use leverage to the full extent permitted by its investment policies and restrictions and applicable law. Leveraging will exaggerate the effect on net asset value of any increase or decrease in the market value of the Fund’s portfolio. ● The Fund may invest in derivative instruments, which may be more volatile and less liquid, increasing the risk of loss when compared to traditional securities. Certain of the derivative instruments are also subject to the risks of counterparty default and adverse tax treatment. ● Instruments and strategies (such as borrowing transactions and reverse repurchase agreements) may provide leveraged exposure to a particular investment, which will magnify any gains or losses on those investments. ● Investments in reverse repurchase agreements expose the Fund to the many of the same risks as investments in derivatives. ● The Fund’s investments in other investment vehicles subject the Fund to those risks and expenses affecting the investment vehicle. ● The Fund’s investments in foreign securities carry additional risks when compared to U.S. securities, due to the impact of diplomatic, political or economic developments in the country in question (investments in emerging markets securities are generally subject to an even greater level of risks). ● Investments in syndicated bank loans generally offer a floating interest rate and involve special types of risks. ● The Fund’s investments in municipal securities can be affected by events that affect the municipal bond market. ● The Fund’s investments in real estate securities subject the Fund to the same risks as direct investments in real estate, which is particularly sensitive to economic downturns. ● The Fund’s investments in restricted securities may involve financial and liquidity risk. ● You may have a gain or loss when you sell your shares. ● It is important to note that the Fund is not guaranteed by the U.S. government. ● Please read the prospectus for more detailed information regarding these and other risks.
Municipal Income Fund may not be suitable for all investors. ● The Fund will be significantly affected by events that affect the municipal bond market, which could include unfavorable legislative or political developments and adverse changes in the financial conditions of state and municipal issuers or the federal government in case it provides financial support to the municipality. Income from municipal bonds held by the Fund could be declared taxable because of changes in tax laws. The Fund may invest in securities that generate taxable income. A portion of the Fund’s otherwise tax-exempt dividends may be taxable to those shareholders subject to the alternative minimum tax. ● Certain sectors of the municipal bond market have special risks that can affect them more significantly than the market as a whole. Because many municipal instruments are issued to finance similar projects, conditions in these industries can significantly affect the Fund and the overall municipal market. ● Municipalities currently experience budget shortfalls, which could cause them to default on their debt and thus subject the Fund to unforeseen losses. ● Like other funds that hold bonds and other fixed-income investments, the Fund’s market value will change in response to interest rate changes and market conditions, among other factors. In general, bond prices rise when interest rates fall and vice versa. ● The Fund’s exposure to high-yield securities may subject the Fund to greater volatility. ● When market conditions are deemed appropriate, the Fund will leverage to the full extent permitted by its investment policies and restrictions and applicable law. Leveraging will exaggerate the effect on net asset value of any increase or decrease in the market value of the Fund’s portfolio. ● The Fund may invest in derivative instruments, which may be more volatile and less liquid, increasing the risk of loss when compared to traditional securities. Certain of the derivative instruments are also subject to the risks of counterparty default and adverse tax treatment. ●Instruments and strategies (such as reverse repurchase agreements, unfunded commitments, tender option bonds, and borrowings) may expose the Fund to many of the same risks as investments in derivatives and may provide leveraged exposure to a particular investment, which will magnify any gains or losses on those investments. ● The Fund’s investments in other investment vehicles subject the Fund to those risks and expenses affecting the investment vehicle. ● The Fund’s investments in foreign securities carry additional risks when compared to U.S. securities, due to the impact of diplomatic, political, or economic developments in the country in question (investments in emerging markets securities are generally subject to an even greater level of risks). ● Investments in syndicated bank loans generally offer a floating interest rate and involve special types of risks. ● The Fund is subject to active trading risks that may increase volatility and impact its ability to achieve its investment objective. ● You may have a gain or loss when you sell your shares. ● It is important to note that the Fund is not guaranteed by the U.S. government. ● Please read the prospectus for more detailed information regarding these and other risks.
| | THE GUGGENHEIM FUNDS ANNUAL REPORT | 3 |
ECONOMIC AND MARKET OVERVIEW (Unaudited) | September 30, 2017 |
Assuming no major geopolitical or other unforeseen shocks, we expect the U.S. economy will grow by between 2.0–2.5% in real terms in 2017 and 2018, supported by a strong labor market at home, a synchronized upswing in the global economy, and favorable financial conditions. Risks to our growth outlook are to the upside if Washington delivers on promises to cut taxes. Third quarter economic data was less distorted by the recent hurricanes than expected, and rebuilding efforts should be a positive for growth heading into 2018.
The labor market is steadily tightening, as seen in the drop in the unemployment rate to a cycle low of 4.2% in September, underscoring the robust—and unsustainable—underlying trend in hiring. Leading indicators, including hiring intentions surveys, point to further declines in the unemployment rate.
Meanwhile, inflation continues to be well below the Federal Reserve’s 2% longer-run goal, with core personal consumption expenditure inflation coming in at 1.3% in September. However, inflation lags GDP growth by about six quarters; because growth has accelerated over the past year, and the dollar has depreciated, inflation will likely move closer to 2% by the second quarter of 2018.
Economic and financial conditions are supportive enough for the Fed to continue to resume a quarterly pattern of rate increases in December, and to begin balance sheet normalization this year. The Fed announced in September 2017 that it would allow a maximum of $4 billion in Agency debt and mortgage-backed securities (MBS) and $6 billion in Treasuries to mature on a monthly basis starting in October 2017. The monthly cap will gradually rise to reach a maximum of $20 billion for MBS and $30 billion for Treasuries.
What impact might the start of balance sheet normalization have on fixed-income markets? According to Fed research, quantitative easing (QE) programs depressed the 10-year Treasury term premium by approximately 100 basis points. Theoretically, unwinding QE should remove that source of downward pressure on term premiums, resulting in a commensurate rise in Treasury yields, all else being equal. A normalization of term premiums will have a modest impact if it occurs over several years. However, four years ago we saw the impact it could have on bond markets if investors price this in abruptly. During the Taper Tantrum of 2013, 10-year Treasury yields rose by 137 basis points between May and September as then-Fed Chair Ben Bernanke first spoke of the potential that the Fed would soon taper purchases of Treasuries and MBS. This caused corporate bond yields to rise as well.
While we do not expect a sharp repricing in markets, it is important to consider the combined effect of slowly rising short-term rates and term premiums on corporate bond yields. An increase in term premiums in the Treasury market will likely raise borrowing costs for investment-grade corporate issuers, in turn raising costs for high-yield bonds as well.
For the 12 months ended September 30, 2017, the Standard & Poor’s 500® (“S&P 500”) Index* returned 18.61%. The MSCI Europe-Australasia-Far East (“EAFE”) Index* returned 19.10%. The return of the MSCI Emerging Markets Index* was 22.46%.
In the bond market, the Bloomberg Barclays U.S. Aggregate Bond Index* posted a 0.07% return for the period, while the Bloomberg Barclays U.S. Corporate High Yield Index* returned 8.88%. The return of the Bank of America Merrill Lynch 3-Month U.S. Treasury Bill Index* was 0.66% for the 12-month period.
The opinions and forecasts expressed may not actually come to pass. This information is subject to change at any time, based on market and other conditions, and should not be construed as a recommendation of any specific security or strategy.
*Index Definitions
The following indices are referenced throughout this report. Indices are unmanaged and not available for direct investment. Index performance does not reflect transaction costs, fees, or expenses.
Bank of America (“BofA”) Merrill Lynch 3-Month U.S. Treasury Bill Index is an unmanaged market Index of U.S. Treasury securities maturing in 90 days that assumes reinvestment of all income.
Bloomberg Barclays U.S. Aggregate Bond Index is a broad-based flagship benchmark that measures the investment grade, U.S. dollar-denominated, fixed-rate taxable bond market, including U.S. Treasuries, government-related and corporate securities, mortgage-backed securities or “MBS” (agency fixed-rate and hybrid adjustable-rate mortgage, or “ARM”, pass-throughs), asset-backed securities (“ABS”), and commercial mortgage-backed securities (“CMBS”) (agency and non-agency).
| 4 | THE GUGGENHEIM FUNDS ANNUAL REPORT | |
ECONOMIC AND MARKET OVERVIEW (Unaudited)(concluded) | September 30, 2017 |
Bloomberg Barclays U.S. Corporate High Yield Index measures the U.S. dollar-denominated, high yield, fixed-rate corporate bond market. Securities are classified as high yield if the middle rating of Moody’s, Fitch, and S&P is Ba1/BB +/BB + or below.
Bloomberg Barclays Municipal Bond Index is a broad market performance benchmark for the tax-exempt bond market. The bonds included in this index must have a minimum credit rating of at least Baa.
Bloomberg Barclays U.S. Aggregate Bond 1-3 Year Total Return Index measures the performance of publicly issued investment grade corporate, U.S. Treasury and government agency securities with remaining maturities of one to three years.
MSCI EAFE Index is a capitalization-weighted measure of stock markets in Europe, Australasia, and the Far East.
MSCI Emerging Markets Index is a free float-adjusted market capitalization-weighted index that is designed to measure equity market performance in the global emerging markets.
MSCI World Index is a free float-adjusted market capitalization weighted index that is designed to measure equity market performance of developed markets.
S&P 500 Index is a broad-based index, the performance of which is based on the performance of 500 widely held common stocks chosen for market size, liquidity, and industry group representation.
| | THE GUGGENHEIM FUNDS ANNUAL REPORT | 5 |
ABOUT SHAREHOLDERS’ FUND EXPENSES (Unaudited) | |
All mutual funds have operating expenses, and it is important for our shareholders to understand the impact of costs on their investments. Shareholders of a fund incur two types of costs: (i) transaction costs, including sales charges (loads) on purchase payments, reinvested dividends, other distributions, and exchange fees, and (ii) ongoing costs, including management fees, administrative services, and shareholder reports, among others. These ongoing costs, or operating expenses, are deducted from a fund’s gross income and reduce the investment return of the fund.
A fund’s expenses are expressed as a percentage of its average net assets, which is known as the expense ratio. The following examples are intended to help investors understand the ongoing costs (in dollars) of investing in a fund and to compare these costs with the ongoing costs of investing in other mutual funds.
The examples are based on an investment of $1,000 made at the beginning of the period and held for the entire six-month period beginning March 31, 2017 and ending September 30, 2017.
The following tables illustrate the Funds’ costs in two ways:
Table 1. Based on actual Fund return: This section helps investors estimate the actual expenses paid over the period. The “Ending Account Value” shown is derived from the Fund’s actual return, and the fifth column shows the dollar amount that would have been paid by an investor who started with $1,000 in the Fund. Investors may use the information here, together with the amount invested, to estimate the expenses paid over the period. Simply divide the Fund’s account value by $1,000 (for example, an $8,600 account value divided by $1,000 = 8.6), then multiply the result by the number provided under the heading “Expenses Paid During Period.”
Table 2. Based on hypothetical 5% return: This section is intended to help investors compare a Fund’s cost with those of other mutual funds. The table provides information about hypothetical account values and hypothetical expenses based on the Fund’s actual expense ratio and an assumed rate of return of 5% per year before expenses, which is not the Fund’s actual return. The hypothetical account values and expenses may not be used to estimate the actual ending account balance or expenses paid during the period. The example is useful in making comparisons because the U.S. Securities and Exchange Commission (the “SEC”) requires all mutual funds to calculate expenses based on the 5% return. Investors can assess a Fund’s costs by comparing this hypothetical example with the hypothetical examples that appear in shareholder reports of other funds.
The calculations illustrated above assume no shares were bought or sold during the period. Actual costs may have been higher or lower, depending on the amount of investment and the timing of any purchases or redemptions.
Please note that the expenses shown in the table are meant to highlight your ongoing costs only and do not reflect any transactional costs, such as sales charges (loads) on purchase payments, and contingent deferred sales charges (“CDSC”) on redemptions, if any. Therefore, the second table is useful in comparing ongoing costs only, and will not help you determine the relative total costs of owning different funds. In addition, if these transactional costs were included, your costs would have been higher.
More information about the Funds’ expenses, including annual expense ratios for periods up to five years (subject to the Fund’s inception date), can be found in the Financial Highlights section of this report. For additional information on operating expenses and other shareholder costs, please refer to the appropriate Fund prospectus.
| 6 | THE GUGGENHEIM FUNDS ANNUAL REPORT | |
ABOUT SHAREHOLDERS’ FUND EXPENSES (Unaudited)(continued) | |
| | Expense
Ratio1 | Fund
Return | Beginning
Account Value
March 31,
2017 | Ending
Account Value
September 30,
2017 | Expenses
Paid During
Period2 |
Table 1. Based on actual Fund return3 | | | | | |
| Diversified Income Fund | | | | | |
| A-Class | 0.81% | 3.76% | $ 1,000.00 | $ 1,037.60 | $ 4.14 |
| C-Class | 1.56% | 3.34% | 1,000.00 | 1,033.40 | 7.95 |
| P-Class | 0.82% | 3.71% | 1,000.00 | 1,037.10 | 4.19 |
| Institutional Class | 0.56% | 3.89% | 1,000.00 | 1,038.90 | 2.86 |
| High Yield Fund | | | | | |
| A-Class | 1.30% | 3.70% | 1,000.00 | 1,037.00 | 6.64 |
| C-Class | 2.03% | 3.41% | 1,000.00 | 1,034.10 | 10.35 |
| P-Class | 1.24% | 3.73% | 1,000.00 | 1,037.30 | 6.33 |
| Institutional Class | 0.97% | 3.87% | 1,000.00 | 1,038.70 | 4.96 |
R6-Class4 | 0.82% | 2.49% | 1,000.00 | 1,024.90 | 3.14 |
| Investment Grade Bond Fund | | | | | |
| A-Class | 1.03% | 3.16% | 1,000.00 | 1,031.60 | 5.25 |
| C-Class | 1.78% | 2.80% | 1,000.00 | 1,028.00 | 9.05 |
| P-Class | 1.01% | 3.15% | 1,000.00 | 1,031.50 | 5.14 |
| Institutional Class | 0.73% | 3.31% | 1,000.00 | 1,033.10 | 3.72 |
| Limited Duration Fund | | | | | |
| A-Class | 0.81% | 1.44% | 1,000.00 | 1,014.40 | 4.09 |
| C-Class | 1.56% | 1.07% | 1,000.00 | 1,010.70 | 7.86 |
| P-Class | 0.81% | 1.44% | 1,000.00 | 1,014.40 | 4.09 |
| Institutional Class | 0.56% | 1.57% | 1,000.00 | 1,015.70 | 2.83 |
| Municipal Income Fund | | | | | |
| A-Class | 0.82% | 3.40% | 1,000.00 | 1,034.00 | 4.18 |
| C-Class | 1.58% | 3.02% | 1,000.00 | 1,030.20 | 8.04 |
| P-Class | 0.82% | 3.45% | 1,000.00 | 1,034.50 | 4.18 |
| Institutional Class | 0.58% | 3.61% | 1,000.00 | 1,036.10 | 2.96 |
| | THE GUGGENHEIM FUNDS ANNUAL REPORT | 7 |
ABOUT SHAREHOLDERS’ FUND EXPENSES (Unaudited)(concluded) | |
| | Expense
Ratio1 | Fund
Return | Beginning
Account Value
March 31,
2017 | Ending
Account Value
September 30,
2017 | Expenses
Paid During
Period2 |
| Table 2. Based on hypothetical 5% return (before expenses) | | | |
| Diversified Income Fund | | | | | |
| A-Class | 0.81% | 5.00% | $ 1,000.00 | $ 1,021.01 | $ 4.10 |
| C-Class | 1.56% | 5.00% | 1,000.00 | 1,017.25 | 7.89 |
| P-Class | 0.82% | 5.00% | 1,000.00 | 1,020.96 | 4.15 |
| Institutional Class | 0.56% | 5.00% | 1,000.00 | 1,022.26 | 2.84 |
| High Yield Fund | | | | | |
| A-Class | 1.30% | 5.00% | 1,000.00 | 1,018.55 | 6.58 |
| C-Class | 2.03% | 5.00% | 1,000.00 | 1,014.89 | 10.25 |
| P-Class | 1.24% | 5.00% | 1,000.00 | 1,018.85 | 6.28 |
| Institutional Class | 0.97% | 5.00% | 1,000.00 | 1,020.21 | 4.91 |
| R6-Class | 0.82% | 5.00% | 1,000.00 | 1,020.96 | 4.15 |
| Investment Grade Bond Fund | | | | | |
| A-Class | 1.03% | 5.00% | 1,000.00 | 1,019.90 | 5.22 |
| C-Class | 1.78% | 5.00% | 1,000.00 | 1,016.14 | 9.00 |
| P-Class | 1.01% | 5.00% | 1,000.00 | 1,020.00 | 5.11 |
| Institutional Class | 0.73% | 5.00% | 1,000.00 | 1,021.41 | 3.70 |
| Limited Duration Fund | | | | | |
| A-Class | 0.81% | 5.00% | 1,000.00 | 1,021.01 | 4.10 |
| C-Class | 1.56% | 5.00% | 1,000.00 | 1,017.25 | 7.89 |
| P-Class | 0.81% | 5.00% | 1,000.00 | 1,021.01 | 4.10 |
| Institutional Class | 0.56% | 5.00% | 1,000.00 | 1,022.26 | 2.84 |
| Municipal Income Fund | | | | | |
| A-Class | 0.82% | 5.00% | 1,000.00 | 1,020.96 | 4.15 |
| C-Class | 1.58% | 5.00% | 1,000.00 | 1,017.15 | 7.99 |
| P-Class | 0.82% | 5.00% | 1,000.00 | 1,020.96 | 4.15 |
| Institutional Class | 0.58% | 5.00% | 1,000.00 | 1,022.16 | 2.94 |
1 | Annualized and excludes expenses of the underlying funds in which the Funds invest. |
2 | Expenses are equal to the Fund's annualized expense ratio, net of any applicable fee waivers, multiplied by the average account value over the period, multiplied by 183/365 (to reflect the one-half year period). |
3 | Actual cumulative return at net asset value for the period March 31, 2017 to September 30, 2017. |
4 | Since commencement of operations May 15, 2017 |
| 8 | THE GUGGENHEIM FUNDS ANNUAL REPORT | |
MANAGERS’ COMMENTARY (Unaudited) | September 30, 2017 |
To Our Shareholders
Guggenheim Diversified Income Fund (the “Fund”) is managed by a team of seasoned professionals, including Farhan Sharaff, Senior Managing Director and Assistant Chief Investment Officer, Equities; Jayson Flowers, Senior Managing Director and Portfolio Manager; Patrick Mitchell, Senior Managing Director and Portfolio Manager; and Gary McDaniel, CFA, Senior Managing Director and Senior Research Analyst. In the following paragraphs, the investment team discusses the market environment and the Fund’s performance for the fiscal year ended September 30, 2017.
For the one-year period ended September 30, 2017, Guggenheim Diversified Income Fund returned 7.00%1, compared with the 0.07% return of the Bloomberg Barclays U.S. Aggregate Bond Index. A 70/30 blend of the Bloomberg Barclays U.S. Aggregate Bond Index and MSCI World Index returned 5.19%. The inception date of the fund was January 29, 2016.
The Fund seeks to achieve high current income with consideration for capital appreciation. The Fund pursues its investment objective by constructing a broadly diversified global portfolio with exposure across multiple high-income asset classes that provide an opportunity for growth. The Fund seeks diversification by investing primarily in asset classes that Guggenheim Partners Investment Management, LLC (the “Investment Manager”) believes provide exposure to different geographic regions, different positions in issuers’ capital structures, and different investment styles.
To achieve its intended portfolio, the Investment Manager allocates the Fund’s assets among multiple underlying investment strategies, primarily high-income credit and equity strategies. The Fund may indirectly obtain exposure to these asset classes, and pursue its investment objective, by investing significantly in affiliated and unaffiliated investment vehicles, including other mutual funds, closed-end funds and exchange-traded funds (“ETFs”) managed by the Investment Manager or its affiliates.
The Fund’s allocation remained stable through the period, with about 73% in fixed income, 18% in alternative strategies, 7% in equity and 2% in cash and cash equivalents. Guggenheim’s fixed income, equity, and alternative strategy funds were the primary investment vehicles, with the largest holdings in Guggenheim High Yield Fund, Guggenheim S&P High Income Infrastructure ETF, and Guggenheim Limited Duration Fund.
For the period, strong returns from the Fund’s fixed income holdings and Guggenheim S&P High Income Infrastructure ETF contributed most to the Fund’s outperformance. For investment grade credit, demand continued to outpace supply during the period, as investment from Asia in both the front end and long end remains strong and supportive of spread tightening. High-yield bonds delivered a year of positive returns amid tighter spreads and improving credit conditions. Infrastructure securities responded to the demand for improved infrastructure as global populations expand and living standards rise, as well as their attractive yield potential for investors seeking to enhance income.
The Fund did increase exposure to high yield and decreased its exposure to bank loans over the period. The strengthening economy and the unabated investor need for income continues to underpin positive performance in high yield, but the chasm between strong and weak credits grows as borrowers take on increasing levels of debt. As for bank loans, after months of shortage, net supply increased sharply in mid-2017, which translated into weaker performance for the overall market.
Performance displayed represents past performance which is no guarantee of future results.
1 | Performance figures are based on Class A shares and do not reflect deduction of the sales charges or taxes that a shareholder would pay on distributions or the redemption of shares. |
The opinions and forecast expressed may not actually come to pass. This information is subject to change at any time, based on market and other conditions, and should not be construed as a recommendation of any specific security or strategy.
| | THE GUGGENHEIM FUNDS ANNUAL REPORT | 9 |
PERFORMANCE REPORT AND FUND PROFILE (Unaudited) | September 30, 2017 |
DIVERSIFIED INCOME FUND
Holdings Diversification (Market Exposure as % of Net Assets)
“Holdings Diversification (Market Exposure as % of Net Assets)” excludes any temporary cash investments.
| Inception Dates: |
| A-Class | January 29, 2016 |
| C-Class | January 29, 2016 |
| P-Class | January 29, 2016 |
| Institutional Class | January 29, 2016 |
| Ten Largest Holdings (% of Total Net Assets) |
| Guggenheim High Yield Fund - Institutional Class | 33.9% |
| Guggenheim Limited Duration Fund - Institutional Class | 26.7% |
| Guggenheim S&P High Income Infrastructure ETF | 10.2% |
| Guggenheim Investment Grade Bond Fund - Institutional Class | 6.8% |
| Guggenheim World Equity Income Fund - Institutional Class | 6.1% |
| Guggenheim Risk Managed Real Estate Fund - Institutional Class | 4.7% |
| BlackRock Enhanced Capital and Income Fund, Inc. | 0.3% |
| Avenue Income Credit Strategies Fund | 0.3% |
| First Trust Enhanced Equity Income Fund | 0.3% |
| Neuberger Berman High Yield Strategies Fund, Inc. | 0.3% |
| Top Ten Total | 89.6% |
| “Ten Largest Holdings” excludes any temporary cash or derivative investments. |
| 10 | THE GUGGENHEIM FUNDS ANNUAL REPORT | |
PERFORMANCE REPORT AND FUND PROFILE (Unaudited)(concluded) | September 30, 2017 |
Cumulative Fund Performance*
Average Annual Returns*
Periods Ended September 30, 2017
| | 1 Year | Since Inception
(01/29/16) |
| A-Class Shares | 7.00% | 11.02% |
A-Class Shares with sales charge† | 2.72% | 8.34% |
| C-Class Shares | 6.17% | 10.17% |
C-Class Shares with CDSC§ | 5.17% | 10.17% |
| P-Class Shares | 7.00% | 11.00% |
| Institutional Class Shares | 7.30% | 11.29% |
| Bloomberg Barclays U.S. Aggregate Bond Index | 0.07% | 2.63% |
| * | The performance data above represents past performance that is not predictive of future results. The investment return and principal value of an investment in the Fund will fluctuate so that an investor’s shares, when redeemed, may be worth more or less than their original cost. Returns are historical and include changes in principal and reinvested dividends and capital gains and do not reflect the effect of taxes. The Bloomberg Barclays U.S. Aggregate Bond Index is an unmanaged index and, unlike the Fund, has no management fees or operating expenses to reduce its reported return. The graph is based on A-Class shares only; performance for C-Class shares, P-Class shares and Institutional Class shares will vary due to differences in fee structures. |
† | Fund returns are calculated using the maximum sales charge of 4.00%. |
§ | Fund returns include a CDSC of 1% if redeemed within 12 months of purchase. |
| | THE GUGGENHEIM FUNDS ANNUAL REPORT | 11 |
| SCHEDULE OF INVESTMENTS | September 30, 2017 |
| DIVERSIFIED INCOME FUND | |
| | | Shares | | | Value | |
| | | | | | | |
EXCHANGE-TRADED FUNDS† - 10.2% | |
Guggenheim S&P High Income Infrastructure ETF1 | | | 21,275 | | | $ | 612,720 | |
| Total Exchange-Traded Funds | | | | | | | | |
| (Cost $447,192) | | | | | | | 612,720 | |
| | | | | | | | | |
MUTUAL FUNDS† - 78.2% | |
Guggenheim High Yield Fund - Institutional Class1 | | | 217,366 | | | | 2,038,895 | |
Guggenheim Limited Duration Fund - Institutional Class1 | | | 64,621 | | | | 1,605,844 | |
Guggenheim Investment Grade Bond Fund - Institutional Class1 | | | 21,995 | | | | 407,346 | |
Guggenheim World Equity Income Fund - Institutional Class1 | | | 24,964 | | | | 367,974 | |
Guggenheim Risk Managed Real Estate Fund - Institutional Class1 | | | 9,433 | | | | 283,359 | |
| Total Mutual Funds | | | | | | | | |
| (Cost $4,447,439) | | | | | | | 4,703,418 | |
| | | | | | | | | |
CLOSED-END FUNDS† - 9.3% | |
| BlackRock Enhanced Capital and Income Fund, Inc. | | | 1,076 | | | | 16,786 | |
| Avenue Income Credit Strategies Fund | | | 1,134 | | | | 16,727 | |
| First Trust Enhanced Equity Income Fund | | | 1,100 | | | | 16,555 | |
| Neuberger Berman High Yield Strategies Fund, Inc. | | | 1,346 | | | | 16,367 | |
| Western Asset High Income Fund II, Inc. | | | 2,108 | | | | 15,198 | |
| New America High Income Fund, Inc. | | | 1,517 | | | | 15,079 | |
| First Trust Strategic High Income Fund II | | | 1,100 | | | | 14,971 | |
| Reaves Utility Income Fund | | | 467 | | | | 14,804 | |
| AllianzGI Convertible & Income Fund | | | 2,064 | | | | 14,654 | |
| Eaton Vance Tax-Advantaged Global Dividend Income Fund | | | 850 | | | | 14,620 | |
| PIMCO Income Strategy Fund II | | | 1,364 | | | | 14,595 | |
| Eaton Vance Tax-Managed Diversified Equity Income Fund | | | 1,250 | | | | 14,575 | |
| John Hancock Investors Trust | | | 798 | | | | 14,476 | |
| BlackRock Multi-Sector Income Trust | | | 766 | | | | 14,324 | |
| Brookfield Real Assets Income Fund, Inc. | | | 600 | | | | 14,274 | |
| Ivy High Income Opportunities Fund | | | 890 | | | | 14,213 | |
| Eaton Vance Enhanced Equity Income Fund II | | | 946 | | | | 14,152 | |
| PIMCO Corporate & Income Strategy Fund | | | 800 | | | | 13,944 | |
| PIMCO Dynamic Credit and Mortgage Income Fund | | | 600 | | | | 13,836 | |
| DoubleLine Income Solutions Fund | | | 650 | | | | 13,813 | |
| AllianceBernstein Global High Income Fund, Inc. | | | 1,050 | | | | 13,703 | |
| Barings Global Short Duration High Yield Fund | | | 665 | | | | 13,699 | |
| Virtus Total Return Fund, Inc. | | | 1,050 | | | | 13,692 | |
| Pioneer High Income Trust | | | 1,350 | | | | 13,527 | |
| KKR Income Opportunities Fund | | | 750 | | | | 13,425 | |
| Invesco Dynamic Credit Opportunities Fund | | | 1,120 | | | | 13,350 | |
| Calamos Strategic Total Return Fund | | | 1,100 | | | | 13,343 | |
| BlackRock Credit Allocation Income Trust | | | 978 | | | | 13,271 | |
| Flaherty & Crumrine Dynamic Preferred and Income Fund, Inc. | | | 500 | | | | 13,250 | |
| Voya Global Advantage and Premium Opportunity Fund | | | 1,150 | | | | 13,237 | |
| Western Asset Premier Bond Fund | | | 951 | | | | 13,152 | |
| BlackRock Corporate High Yield Fund, Inc. | | | 1,150 | | | | 12,995 | |
| Flaherty & Crumrine Total Return Fund, Inc. | | | 600 | | | | 12,888 | |
| BlackRock Floating Rate Income Trust | | | 900 | | | | 12,699 | |
| Goldman Sachs MLP Energy and Renaissance Fund | | | 1,800 | | | | 12,510 | |
| Cohen & Steers Total Return Realty Fund, Inc. | | | 1,000 | | | | 12,460 | |
| Nuveen Short Duration Credit Opportunities Fund | | | 700 | | | | 12,166 | |
| Legg Mason BW Global Income Opportunities Fund, Inc. | | | 900 | | | | 12,096 | |
| Eaton Vance Tax-Managed Buy-Write Income Fund | | | 700 | | | | 11,725 | |
| Cohen & Steers Infrastructure Fund, Inc. | | | 500 | | | | 11,500 | |
| Total Closed-End Funds | | | | | | | | |
| (Cost $505,138) | | | | | | | 556,651 | |
| | | | | | | | | |
MONEY MARKET FUND† - 1.3% | |
Goldman Sachs Financial Square Treasury Instruments Fund 0.86%2 | | | 91,003 | | | | 91,003 | |
| Total Money Market Fund | | | | | | | | |
| (Cost $91,003) | | | | | | | 91,003 | |
| | | | | | | | | |
| Total Investments - 99.0% | | | | | | | | |
| (Cost $5,490,772) | | | | | | $ | 5,963,792 | |
| Other Assets & Liabilities, net - 1.0% | | | | | | | 52,475 | |
| Total Net Assets - 100.0% | | | | | | $ | 6,016,267 | |
† | Value determined based on Level 1 inputs — See Note 4. |
1 | Affiliated issuer. |
2 | Rate indicated is the 7 day yield as of September 30, 2017. |
| | |
| | See Sector Classification in Other Information section. |
12 | THE GUGGENHEIM FUNDS ANNUAL REPORT | SEE NOTES TO FINANCIAL STATEMENTS. |
SCHEDULE OF INVESTMENTS (concluded) | September 30, 2017 |
| DIVERSIFIED INCOME FUND | |
The following table summarizes the inputs used to value the Fund’s investments at September 30, 2017 (See Note 4 in the Notes to Financial Statements):
| Investments in Securities (Assets) | | Level 1
Quoted
Prices | | | Level 2
Significant
Observable
Inputs | | | Level 3
Significant
Unobservable
Inputs | | | Total | |
| Closed-End Funds | | $ | 556,651 | | | $ | — | | | $ | — | | | $ | 556,651 | |
| Exchange-Traded Funds | | | 612,720 | | | | — | | | | — | | | | 612,720 | |
| Money Market Fund | | | 91,003 | | | | — | | | | — | | | | 91,003 | |
| Mutual Funds | | | 4,703,418 | | | | — | | | | — | | | | 4,703,418 | |
| Total Assets | | $ | 5,963,792 | | | $ | — | | | $ | — | | | $ | 5,963,792 | |
Transfers between investment levels may occur as the markets fluctuate and/or the availability of data used in an investment’s valuation changes. Transfers between valuation levels, if any, are in comparison to the valuation levels at the end of the previous fiscal year, and are effective using the fair value as of the end of the current fiscal period.
For the year ended September 30, 2017, there were no transfers between levels.
Affiliated Transactions
Investments representing 5% or more of the outstanding voting shares of a portfolio company of a fund, or control of or by, or common control under GI, result in that portfolio company being considered an affiliated company of such fund, as defined in the 1940 Act.
The Fund may invest in the Guggenheim Strategy Funds Trust consisting of Guggenheim Strategy Fund I, Guggenheim Strategy Fund II, Guggenheim Strategy Fund III, and Guggenheim Variable Insurance Strategy Fund III (collectively, the “Cash Management Funds”), open-end management investment companies managed by GI. The Cash Management Funds, which launched on March 11, 2014, are offered as cash management options only to mutual funds, trusts, and other accounts managed by GI and/or its affiliates, and are not available to the public. The Cash Management Funds pay no investment management fees. The Cash Management Funds’ annual report on Form N-CSR dated September 30, 2016, is available publicly or upon request. This information is available from the EDGAR database on the SEC’s website at https://www.sec.gov/Archives/edgar/data/1601445/000089180416001923/gug65857-ncsr.htm.
Transactions during the year ended September 30, 2017, in which the portfolio company is an “affiliated person”, were as follows:
Affiliated issuers by Fund | | Value 09/30/16 | | | Additions | | | Reductions | | | Realized Gain (Loss) | | | Change in Unrealized | | | Value 09/30/17 | | | Shares 09/30/17 | | | Investment Income | | | Capital
Gain
Distributions | |
| Guggenheim High Yield Fund - Institutional Class | | $ | 1,189,250 | | | $ | 850,582 | | | $ | (51,496 | ) | | $ | 286 | | | $ | 50,273 | | | $ | 2,038,895 | | | | 217,366 | | | $ | 110,046 | | | $ | — | |
| Guggenheim Investment Grade Bond Fund - Institutional Class | | | 1,106,383 | | | | 40,263 | | | | (735,007 | ) | | | (163 | ) | | | (4,130 | ) | | | 407,346 | | | | 21,995 | | | | 25,425 | | | | — | |
| Guggenheim Limited Duration Fund - Institutional Class | | | 382,050 | | | | 1,223,094 | | | | (8,000 | ) | | | 222 | | | | 8,478 | | | | 1,605,844 | | | | 64,621 | | | | 36,190 | | | | — | |
| Guggenheim Risk Managed Real Estate Fund - Institutional Class | | | 262,695 | | | | 12,280 | | | | — | | | | — | | | | 8,384 | | | | 283,359 | | | | 9,433 | | | | 5,856 | | | | 6,424 | |
| Guggenheim S&P High Income Infrastructure ETF | | | 565,983 | | | | — | | | | — | | | | — | | | | 46,737 | | | | 612,720 | | | | 21,275 | | | | 28,930 | | | | — | |
| Guggenheim World Equity Income Fund - Institutional Class | | | 327,003 | | | | 9,238 | | | | — | | | | — | | | | 31,733 | | | | 367,974 | | | | 24,964 | | | | 9,282 | | | | — | |
| Guggenheim Floating Rate Strategies Fund - Institutional Class | | | 1,155,330 | | | | 1,822 | | | | (1,158,039 | ) | | | 29,329 | | | | (28,442 | ) | | | — | | | | — | | | | 2,027 | | | | — | |
| | | $ | 4,988,694 | | | $ | 2,137,279 | | | $ | (1,952,542 | ) | | $ | 29,674 | | | $ | 113,033 | | | $ | 5,316,138 | | | | | | | $ | 217,756 | | | $ | 6,424 | |
| SEE NOTES TO FINANCIAL STATEMENTS. | THE GUGGENHEIM FUNDS ANNUAL REPORT | 13 |
| STATEMENT OF ASSETS AND LIABILITIES |
| September 30, 2017 |
| Assets: | |
| Investments in unaffiliated issuers, at value (cost $596,141) | | $ | 647,654 | |
| Investments in affiliated issuers, at value (cost $4,894,631) | | | 5,316,138 | |
| Prepaid expenses | | | 37,594 | |
| Receivables: | |
| Investment adviser | | | 26,917 | |
| Dividends | | | 17,318 | |
| Interest | | | 41 | |
| Total assets | | | 6,045,662 | |
| | | | | |
| Liabilities: | |
| Payable for: | |
| Securities purchased | | | 16,255 | |
| Transfer agent/maintenance fees | | | 4,591 | |
| Professional fees | | | 4,310 | |
| Distribution and service fees | | | 166 | |
| Trustees’ fees* | | | 36 | |
| Miscellaneous | | | 4,037 | |
| Total liabilities | | | 29,395 | |
| Net assets | | $ | 6,016,267 | |
| | | | | |
| Net assets consist of: | |
| Paid in capital | | $ | 5,483,537 | |
| Undistributed net investment income | | | 20,966 | |
| Accumulated net realized gain on investments | | | 38,744 | |
| Net unrealized appreciation on investments | | | 473,020 | |
| Net assets | | $ | 6,016,267 | |
| | | | | |
| A-Class: | |
| Net assets | | $ | 137,545 | |
| Capital shares outstanding | | | 4,988 | |
| Net asset value per share | | $ | 27.58 | |
| Maximum offering price per share (Net asset value divided by 96.0%) | | $ | 28.73 | |
| | | | | |
| C-Class: | |
| Net assets | | $ | 136,602 | |
| Capital shares outstanding | | | 4,956 | |
| Net asset value per share | | $ | 27.56 | |
| | | | | |
| P-Class: | |
| Net assets | | $ | 123,143 | |
| Capital shares outstanding | | | 4,465 | |
| Net asset value per share | | $ | 27.58 | |
| | | | | |
| Institutional Class: | |
| Net assets | | $ | 5,618,977 | |
| Capital shares outstanding | | | 203,689 | |
| Net asset value per share | | $ | 27.59 | |
| * | Relates to Trustees not deemed “interested persons” within the meaning of Section 2(a)(19) of the 1940 Act. |
14 | THE GUGGENHEIM FUNDS ANNUAL REPORT | SEE NOTES TO FINANCIAL STATEMENTS. |
| STATEMENT OF OPERATIONS |
| Year Ended September 30, 2017 |
| Investment Income: | |
| Dividends from securities of unaffiliated issuers (net of foreign withholding tax of $32) | | $ | 35,116 | |
| Dividends from securities of affiliated issuers | | | 217,756 | |
| Interest | | | 215 | |
| Total investment income | | | 253,087 | |
| | | | | |
| Expenses: | |
| Management fees | | | 43,343 | |
| Distribution and service fees: | |
| A-Class | | | 342 | |
| C-Class | | | 1,274 | |
| P-Class | | | 293 | |
| Recoupment of previously waived fees: | |
| A-Class | | | 262 | |
| C-Class | | | 239 | |
| P-Class | | | 182 | |
| Institutional Class | | | 8,604 | |
| Transfer agent/maintenance fees: | |
| A-Class | | | 545 | |
| C-Class | | | 668 | |
| P-Class | | | 479 | |
| Institutional Class | | | 15,498 | |
| Registration fees | | | 78,860 | |
| Fund accounting/administration fees | | | 24,999 | |
| Professional fees | | | 20,474 | |
| Trustees’ fees* | | | 7,001 | |
| Line of credit fees | | | 1,427 | |
| Custodian fees | | | 896 | |
| Miscellaneous | | | 18,526 | |
| Total expenses | | | 223,912 | |
| Less: | |
| Expenses waived by Adviser | | | (70,397 | ) |
| Expenses reimbursed by Adviser: | | | | |
| A-Class | | | (2,872 | ) |
| C-Class | | | (2,953 | ) |
| P-Class | | | (2,537 | ) |
| Institutional Class | | | (108,848 | ) |
| Total waived/reimbursed expenses | | | (187,607 | ) |
| Net expenses | | | 36,305 | |
| Net investment income | | | 216,782 | |
| | | | | |
| Net Realized and Unrealized Gain (Loss): | |
| Net realized gain (loss) on: | |
| Investments in unaffiliated issuers | | | 41,775 | |
| Investments in affiliated issuers | | | 29,674 | |
| Realized gain distributions received from investment company shares | | | 6,424 | |
| Net realized gain | | | 77,873 | |
| Net change in unrealized appreciation (depreciation) on: | |
| Investments in unaffiliated issuers | | | (1,988 | ) |
| Investments in affiliated issuers | | | 113,033 | |
| Net change in unrealized appreciation (depreciation) | | | 111,045 | |
| Net realized and unrealized gain | | | 188,918 | |
| Net increase in net assets resulting from operations | | $ | 405,700 | |
| * | Relates to Trustees not deemed “interested persons” within the meaning of Section 2(a)(19) of the 1940 Act. |
| SEE NOTES TO FINANCIAL STATEMENTS. | THE GUGGENHEIM FUNDS ANNUAL REPORT | 15 |
| STATEMENTS OF CHANGES IN NET ASSETS |
| | | Year Ended
September 30,
2017 | | | Period Ended September 30,
2016a | |
| Increase in Net Assets from Operations: | | | | | | |
| Net investment income | | $ | 216,782 | | | $ | 159,987 | |
| Net realized gain on investments | | | 77,873 | | | | 50,887 | |
| Net change in unrealized appreciation (depreciation) on investments | | | 111,045 | | | | 361,975 | |
| Net increase in net assets resulting from operations | | | 405,700 | | | | 572,849 | |
| | | | | | | | | |
| Distributions to shareholders from: | | | | | | | | |
| Net investment income | | | | | | | | |
| A-Class | | | (4,691 | ) | | | (3,059 | ) |
| C-Class | | | (3,496 | ) | | | (2,279 | ) |
| P-Class | | | (4,011 | ) | | | (2,744 | ) |
| Institutional Class | | | (198,735 | ) | | | (136,669 | ) |
| Net realized gains | | | | | | | | |
| A-Class | | | (2,257 | ) | | | — | |
| C-Class | | | (1,912 | ) | | | — | |
| P-Class | | | (1,799 | ) | | | — | |
| Institutional Class | | | (84,531 | ) | | | — | |
| Total distributions to shareholders | | | (301,432 | ) | | | (144,751 | ) |
| | | | | | | | | |
| Capital share transactions: | | | | | | | | |
| Proceeds from sale of shares | | | | | | | | |
| A-Class | | | 17,750 | | | | 119,796 | |
| C-Class | | | 11,405 | | | | 107,000 | |
| P-Class | | | 11,813 | | | | 100,100 | |
| Institutional Class | | | — | | | | 4,700,000 | |
| Distributions reinvested | | | | | | | | |
| A-Class | | | 6,948 | | | | 3,059 | |
| C-Class | | | 5,408 | | | | 2,279 | |
| P-Class | | | 5,810 | | | | 2,744 | |
| Institutional Class | | | 283,266 | | | | 136,669 | |
| Cost of shares redeemed | | | | | | | | |
| A-Class | | | (21,762 | ) | | | (91 | ) |
| C-Class | | | (338 | ) | | | — | |
| P-Class | | | (7,955 | ) | | | — | |
| Institutional Class | | | — | | | | — | |
| Net increase from capital share transactions | | | 312,345 | | | | 5,171,556 | |
| Net increase in net assets | | | 416,613 | | | | 5,599,654 | |
| | | | | | | | | |
| Net assets: | | | | | | | | |
| Beginning of period | | | 5,599,654 | | | | — | |
| End of period | | $ | 6,016,267 | | | $ | 5,599,654 | |
| Undistributed net investment income at end of period | | $ | 20,966 | | | $ | 13,621 | |
16 | THE GUGGENHEIM FUNDS ANNUAL REPORT | SEE NOTES TO FINANCIAL STATEMENTS. |
STATEMENTS OF CHANGES IN NET ASSETS (concluded) |
| | | Year Ended
September 30,
2017 | | | Period Ended September 30,
2016a | |
| Capital share activity: | | | | | | |
| Shares sold | | | | | | |
| A-Class | | | 655 | | | | 4,757 | |
| C-Class | | | 421 | | | | 4,260 | |
| P-Class | | | 430 | | | | 4,004 | |
| Institutional Class | | | — | | | | 188,000 | |
| Shares issued from reinvestment of distributions | | | | | | | | |
| A-Class | | | 258 | | | | 116 | |
| C-Class | | | 201 | | | | 87 | |
| P-Class | | | 215 | | | | 104 | |
| Institutional Class | | | 10,492 | | | | 5,197 | |
| Shares redeemed | | | | | | | | |
| A-Class | | | (794 | ) | | | (4 | ) |
| C-Class | | | (13 | ) | | | — | |
| P-Class | | | (288 | ) | | | — | |
| Net increase in shares | | | 11,577 | | | | 206,521 | |
a | Since commencement of operations: January 29, 2016. |
| SEE NOTES TO FINANCIAL STATEMENTS. | THE GUGGENHEIM FUNDS ANNUAL REPORT | 17 |
This table is presented to show selected data for a share outstanding throughout each period and to assist shareholders in evaluating a Fund’s performance for the periods presented.
| A-Class | | Year Ended
September 30,
2017 | | | Period Ended
September 30,
2016a | |
| Per Share Data | | | | | | |
| Net asset value, beginning of period | | $ | 27.12 | | | $ | 25.00 | |
| Income (loss) from investment operations: | |
Net investment income (loss)b | | | .96 | | | | .76 | |
| Net gain (loss) on investments (realized and unrealized) | | | .89 | | | | 2.03 | |
| Total from investment operations | | | 1.85 | | | | 2.79 | |
| Less distributions from: | |
| Net investment income | | | (.95 | ) | | | (.67 | ) |
| Net realized gains | | | (.44 | ) | | | — | |
| Total distributions | | | (1.39 | ) | | | (.67 | ) |
| Net asset value, end of period | | $ | 27.58 | | | $ | 27.12 | |
| | |
Total Returnf | | | 7.00 | % | | | 11.29 | % |
| Ratios/Supplemental Data | |
| Net assets, end of period (in thousands) | | $ | 138 | | | $ | 132 | |
| Ratios to average net assets: | |
| Net investment income (loss) | | | 3.53 | % | | | 4.35 | % |
Total expensesc | | | 4.16 | % | | | 3.31 | % |
Net expensesd,e | | | 0.85 | %g | | | 0.77 | % |
| Portfolio turnover rate | | | 44 | % | | | 83 | % |
| C-Class | | Year Ended
September 30,
2017 | | | Period Ended
September 30,
2016a | |
| Per Share Data | | | | | | |
| Net asset value, beginning of period | | $ | 27.11 | | | $ | 25.00 | |
| Income (loss) from investment operations: | |
Net investment income (loss)b | | | .76 | | | | .63 | |
| Net gain (loss) on investments (realized and unrealized) | | | .87 | | | | 2.03 | |
| Total from investment operations | | | 1.63 | | | | 2.66 | |
| Less distributions from: | |
| Net investment income | | | (.74 | ) | | | (.55 | ) |
| Net realized gains | | | (.44 | ) | | | — | |
| Total distributions | | | (1.18 | ) | | | (.55 | ) |
| Net asset value, end of period | | $ | 27.56 | | | $ | 27.11 | |
| | |
Total Returnf | | | 6.17 | % | | | 10.74 | % |
| Ratios/Supplemental Data | |
| Net assets, end of period (in thousands) | | $ | 137 | | | $ | 118 | |
| Ratios to average net assets: | |
| Net investment income (loss) | | | 2.78 | % | | | 3.58 | % |
Total expensesc | | | 5.13 | % | | | 4.05 | % |
Net expensesd,e | | | 1.60 | %g | | | 1.52 | % |
| Portfolio turnover rate | | | 44 | % | | | 83 | % |
18 | THE GUGGENHEIM FUNDS ANNUAL REPORT | SEE NOTES TO FINANCIAL STATEMENTS. |
FINANCIAL HIGHLIGHTS (continued) |
This table is presented to show selected data for a share outstanding throughout each period and to assist shareholders in evaluating a Fund’s performance for the periods presented.
| P-Class | | Year Ended
September 30,
2017 | | | Period Ended
September 30,
2016a | |
| Per Share Data | | | | | | |
| Net asset value, beginning of period | | $ | 27.11 | | | $ | 25.00 | |
| Income (loss) from investment operations: | |
Net investment income (loss)b | | | .95 | | | | .74 | |
| Net gain (loss) on investments (realized and unrealized) | | | .89 | | | | 2.05 | |
| Total from investment operations | | | 1.84 | | | | 2.79 | |
| Less distributions from: | |
| Net investment income | | | (.93 | ) | | | (.68 | ) |
| Net realized gains | | | (.44 | ) | | | — | |
| Total distributions | | | (1.37 | ) | | | (.68 | ) |
| Net asset value, end of period | | $ | 27.58 | | | $ | 27.11 | |
| | |
Total Returnf | | | 7.00 | % | | | 11.27 | % |
| Ratios/Supplemental Data | |
| Net assets, end of period (in thousands) | | $ | 123 | | | $ | 111 | |
| Ratios to average net assets: | |
| Net investment income (loss) | | | 3.51 | % | | | 4.32 | % |
Total expensesc | | | 4.23 | % | | | 3.21 | % |
Net expensesd,e | | | 0.85 | %g | | | 0.80 | % |
| Portfolio turnover rate | | | 44 | % | | | 83 | % |
| | THE GUGGENHEIM FUNDS ANNUAL REPORT | 19 |
FINANCIAL HIGHLIGHTS (concluded) |
This table is presented to show selected data for a share outstanding throughout each period and to assist shareholders in evaluating a Fund’s performance for the periods presented.
| Institutional Class | | Year Ended
September 30,
2017 | | | Period Ended
September 30,
2016a | |
| Per Share Data | | | | | | |
| Net asset value, beginning of period | | $ | 27.11 | | | $ | 25.00 | |
| Income (loss) from investment operations: | |
Net investment income (loss)b | | | 1.03 | | | | .79 | |
| Net gain (loss) on investments (realized and unrealized) | | | .89 | | | | 2.04 | |
| Total from investment operations | | | 1.92 | | | | 2.83 | |
| Less distributions from: | |
| Net investment income | | | (1.00 | ) | | | (.72 | ) |
| Net realized gains | | | (.44 | ) | | | — | |
| Total distributions | | | (1.44 | ) | | | (.72 | ) |
| Net asset value, end of period | | $ | 27.59 | | | $ | 27.11 | |
| | |
Total Returnf | | | 7.30 | % | | | 11.44 | % |
| Ratios/Supplemental Data | |
| Net assets, end of period (in thousands) | | $ | 5,619 | | | $ | 5,239 | |
| Ratios to average net assets: | |
| Net investment income (loss) | | | 3.78 | % | | | 4.57 | % |
Total expensesc | | | 3.83 | % | | | 2.93 | % |
Net expensesd,e | | | 0.59 | %g | | | 0.54 | % |
| Portfolio turnover rate | | | 44 | % | | | 83 | % |
a | Since commencement of operations: January 29, 2016. Percentage amounts for the period, except total return and portfolio turnover rate, have been annualized. |
b | Net investment income (loss) per share was computed using average shares outstanding throughout the period. |
c | Does not include expenses of the underlying funds in which the Fund invests. |
d | Net expense information reflects the expense ratios after expense waivers. |
e | Net expenses may include expenses that are excluded from the expense limitation agreement and affiliated fund waivers. Excluding these expenses, the operating expense ratios for the years would be: |
| | | 09/30/17 | 09/30/16 | |
| | A-Class | 0.82% | 0.76% | |
| | C-Class | 1.57% | 1.52% | |
| | P-Class | 0.82% | 0.79% | |
| | Institutional Class | 0.57% | 0.54% | |
f | Total return does not reflect the impact of any applicable sales charges and has not been annualized. |
g | The portion of the ratios of net expenses to average net assets attributable to recoupments of prior fee reductions of expense reimbursements is 0.19% for A-Class, 0.19% for C-Class, 0.16% for P-Class, and 0.16% Institutional Class. |
20 | THE GUGGENHEIM FUNDS ANNUAL REPORT | SEE NOTES TO FINANCIAL STATEMENTS. |
MANAGERS’ COMMENTARY (Unaudited) | September 30, 2017 |
To Our Shareholders
Guggenheim High Yield Fund (the “Fund”) is managed by a team of seasoned professionals, including B. Scott Minerd, Chairman of Investments and Global Chief Investment Officer; Kevin H. Gundersen, Senior Managing Director and Portfolio Manager; Thomas J. Hauser, Senior Managing Director and Portfolio Manager; and Richard de Wet, Managing Director and Portfolio Manager. In the following paragraphs, the investment team discusses the market environment and the Fund’s performance for the fiscal year ended September 30, 2017.
For the one-year period ended September 30, 2017, Guggenheim High Yield Bond Fund returned 9.11%1, compared with the 8.88% return of its benchmark, the Bloomberg Barclays U.S. Corporate High Yield Index. Within the index, BB rated bonds returned 7.36%, B rated bonds returned 8.24%, and CCC bonds returned 14.40%.
The Fund outperformed the broader market from the beginning of the fourth quarter 2016. High-yield bonds delivered a year of positive returns amid tighter spreads and improving credit conditions. The market was on an upward trajectory throughout the period, similar to equity markets. However, there were a few pauses along the way due to the possibility of interest rate hikes and geopolitical concerns where we added to credits that we are comfortable with at lower levels. The strengthening economy and the unabated investor need for income continues to underpin positive performance in high yield.
Fund performance for the period was primarily a result of a stable and consistent credit selection process, as Guggenheim’s bottom-up, fundamental approach seeks the construction of portfolios that produce solid yield while at the same being defensively positioned. The portfolio has maintained a defensive stance to interest rate volatility with an underweight to duration. A sizable allocation to bank loans that are senior in the capital structure relative to most high yield bonds reduced volatility in returns. We believe credit selection will become increasingly important through the end of the year and expect the Fund to perform well in this type of environment.
The Fund’s allocation to B credits is its largest and the Fund has incrementally added to exposure, versus CCC credits. The Fund maintains a sizeable exposure to BB credits as well. Our research indicates that BB rated bonds have performed very well versus other fixed income areas, as the Federal Reserve tightens. At the end of the period, the Fund was positioned up in quality and exposure to CCC-rated credit was moderated.
The Fund has been positioned conservatively in terms of duration, with higher exposure to short-dated bonds and to floating rate securities (bank loans), which diversifies sources of return and may decrease volatility. Beginning with the post-election rally, bank loan exposure detracted from performance, even though bank loans performed well on a risk-adjusted basis, although not as vigorous in absolute terms. The combination of rising LIBOR rates and spread tightening could cause loan coupons to approach those of high yield bonds, as they have converged in each of the past three tightening cycles.
Exposure to strong energy and consumer non-cyclical issuers contributed to performance for the period. Within Energy, the fund was overweight midstream relative to E&P and oil field services companies as midstream is less susceptible to changes in underlying commodity prices, which contributed to outperformance. We continue to avoid highly levered industries and companies with heavy capital expenditure needs that can impair cash flow generation. Companies with strong cash flows, recurring revenue streams, and high-quality margins should remain the focus in the later stages of the credit cycle. The default rate continues to decline, supported by improving corporate fundamentals and excluding commodity sectors, default rates for high-yield bonds remain near post-crisis lows.
Performance displayed represents past performance which is no guarantee of future results.
1 | Performance figures are based on Class A shares and do not reflect deduction of the sales charges or taxes that a shareholder would pay on distributions or the redemption of shares. |
The opinions and forecast expressed may not actually come to pass. This information is subject to change at any time, based on market and other conditions, and should not be construed as a recommendation of any specific security or strategy.
| | THE GUGGENHEIM FUNDS ANNUAL REPORT | 21 |
PERFORMANCE REPORT AND FUND PROFILE (Unaudited) | September 30, 2017 |
HIGH YIELD FUND
OBJECTIVE: Seeks high current income. Capital appreciation is a secondary objective.
Holdings Diversification (Market Exposure as % of Net Assets)
“Holdings Diversification (Market Exposure as % of Net Assets)” excludes any temporary cash investments.
Portfolio Composition by Quality Rating1 |
| Rating | |
| Fixed Income Instruments | |
| AAA | 0.1% |
| AA | 0.1% |
| A | 0.1% |
| BBB | 4.9% |
| BB | 41.6% |
| B | 41.0% |
| CCC | 6.4% |
NR2 | 3.6% |
| Other Instruments | 2.2% |
| Total Investments | 100.0% |
| The chart above reflects percentages of the value of total investments. |
| Inception Dates: |
| A-Class | August 5, 1996 |
| C-Class | May 1, 2000 |
| P-Class | May 1, 2015 |
| Institutional Class | July 11, 2008 |
| R6-Class | May 15, 2017 |
| Ten Largest Holdings (% of Total Net Assets) |
| Vector Group Ltd., 6.13% | 1.7% |
| MDC Partners, Inc., 6.50% | 1.6% |
| SFR Group S.A., 7.38% | 1.4% |
| Unit Corp., 6.63% | 1.4% |
| Eldorado Gold Corp., 6.13% | 1.3% |
| Terraform Global Operating LLC, 9.75% | 1.3% |
| American Midstream Partners Limited Partnership / American Midstream Finance Corp., 8.50% | 1.3% |
| Valeant Pharmaceuticals International, Inc., 7.00% | 1.2% |
| EIG Investors Corp., 10.88% | 1.2% |
| DISH DBS Corp., 5.88% | 1.2% |
| Top Ten Total | 13.6% |
| “Ten Largest Holdings” excludes any temporary cash or derivative investments. |
1 | Source: BlackRock Solutions. Credit quality ratings are measured on a scale that generally ranges from AAA (highest) to D (lowest). All securities except for those labeled “NR” have been rated by a Nationally Recognized Statistical Rating Organization (“NRSRO”). For purposes of this presentation, when ratings are available from more than one agency, the highest rating is used. Guggenheim Investments converts ratings to the equivalent S&P rating. |
2 | NR securities do not necessarily indicate low credit quality. |
| 22 | THE GUGGENHEIM FUNDS ANNUAL REPORT | |
PERFORMANCE REPORT AND FUND PROFILE (Unaudited)(concluded) | September 30, 2017 |
Cumulative Fund Performance*
Average Annual Returns*
Periods Ended September 30, 2017
| | 1 Year | 5 Year | 10 Year |
| A-Class Shares | 9.11% | 7.00% | 7.39% |
A-Class Shares with sales charge† | 4.70% | 5.95% | 6.87% |
| C-Class Shares | 8.38% | 6.21% | 6.61% |
C-Class Shares with CDSC§ | 7.38% | 6.21% | 6.61% |
| Bloomberg Barclays U.S. Corporate High Yield Index | 8.88% | 6.36% | 7.84% |
| | 1 Year | 5 Year | Since Inception
(07/11/08) |
| Institutional Class Shares | 9.56% | 7.30% | 8.83% |
| Bloomberg Barclays U.S. Corporate High Yield Index | 8.88% | 6.36% | 9.03% |
| | | 1 Year | Since Inception
(05/01/15) |
| P-Class Shares | | 9.24% | 6.36% |
| Bloomberg Barclays U.S. Corporate High Yield Index | | 8.88% | 6.10% |
| | | | Since Inception
(05/15/17) |
| R6-Class Shares | | | 2.49% |
| Bloomberg Barclays U.S. Corporate High Yield Index | | | 7.15% |
| * | The performance data above represents past performance that is not predictive of future results. The investment return and principal value of an investment in the Fund will fluctuate so that an investor’s shares, when redeemed, may be worth more or less than their original cost. Returns are historical and include changes in principal and reinvested dividends and capital gains and do not reflect the effect of taxes. The Bloomberg Barclays U.S. Corporate High Yield Index is an unmanaged index and, unlike the Fund, has no management fees or operating expenses to reduce its reported return. The graph is based on A-Class shares only; performance for C-Class shares, P-Class shares and Institutional Class shares will vary due to differences in fee structures. |
† | Effective October 1, 2015, the maximum sales charge decreased from 4.75% to 4.00%. A 4.75% maximum sales charge is used in the calculation of the Average Annual Returns (based on subscriptions made prior to October 1, 2015), and a 4.00% maximum sales charge is used to calculate performance for periods based on subscriptions made on or after October 1, 2015. |
§ | Fund returns include a CDSC of 1% if redeemed within 12 months of purchase. |
| | THE GUGGENHEIM FUNDS ANNUAL REPORT | 23 |
| SCHEDULE OF INVESTMENTS | September 30, 2017 |
| HIGH YIELD FUND | |
| | | Shares | | | Value | |
| | | | | | | |
COMMON STOCKS† - 0.5% | |
| | | | | | | |
| Energy - 0.3% | |
| SandRidge Energy, Inc.* | | | 51,923 | | | $ | 1,043,132 | |
| Approach Resources, Inc.* | | | 51,060 | | | | 128,161 | |
| Titan Energy LLC* | | | 17,186 | | | | 77,337 | |
Stallion Oilfield Holdings Ltd.*,††† | | | 8,257 | | | | 5,161 | |
| Total Energy | | | | | | | 1,253,791 | |
| | | | | | | | | |
| Consumer, Cyclical - 0.1% | |
Metro-Goldwyn-Mayer, Inc.*,†† | | | 7,040 | | | | 673,644 | |
| | | | | | | | | |
| Technology - 0.1% | |
Aspect Software Parent, Inc.*,†††,1,2 | | | 64,681 | | | | 666,215 | |
| | | | | | | | | |
| Consumer, Non-cyclical - 0.0% | |
Targus Group International Equity, Inc*,†††,1,2 | | | 13,240 | | | | 19,667 | |
| Crimson Wine Group Ltd.* | | | 8 | | | | 86 | |
| Total Consumer, Non-cyclical | | | | | | | 19,753 | |
| | | | | | | | | |
| Communications - 0.0% | |
Cengage Learning Acquisitions, Inc.*,†† | | | 2,107 | | | | 16,329 | |
| | | | | | | | | |
| Diversified - 0.0% | |
| Leucadia National Corp. | | | 81 | | | | 2,045 | |
| | | | | | | | | |
| Total Common Stocks | | | | | | | | |
| (Cost $4,151,825) | | | | | | | 2,631,777 | |
| | | | | | | | | |
PREFERRED STOCKS†† - 0.5% | |
| Financial - 0.3% | |
Morgan Stanley 6.38%4,12 | | | 46,000 | | | | 1,303,640 | |
Aspen Insurance Holdings Ltd. 5.95%4,12 | | | 12,000 | | | | 334,320 | |
| Total Financial | | | | | | | 1,637,960 | |
| | | | | | | | | |
| Industrial - 0.2% | |
| Seaspan Corp. 6.38% due 04/30/19 | | | 36,120 | | | | 936,230 | |
| U.S. Shipping Corp.* | | | 14,718 | | | | 15,454 | |
| Total Industrial | | | | | | | 951,684 | |
| | | | | | | | | |
| Communications - 0.0% | |
| Medianews Group, Inc.* | | | 11,074 | | | | 254,702 | |
| Total Preferred Stocks | | | | | | | | |
| (Cost $2,894,608) | | | | | | | 2,844,346 | |
| | | | | | | | | |
WARRANTS† - 0.0% | |
| Comstock Resources, Inc. | | | | | | | | |
$0.01, 09/06/18†† | | | 9,075 | | | | 55,086 | |
| SandRidge Energy, Inc. | | | | | | | | |
| $41.34, 10/04/22 | | | 488 | | | | 366 | |
| SandRidge Energy, Inc. | | | | | | | | |
| $42.03, 10/04/22 | | | 205 | | | | 141 | |
| Total Warrants | | | | | | | | |
| (Cost $108,149) | | | | | | | 55,593 | |
| | | | | | | | | |
EXCHANGE-TRADED FUNDS† - 1.3% | |
| SPDR Bloomberg Barclays High Yield Bond ETF | | | 159,765 | | | | 5,962,429 | |
| SPDR Bloomberg Barclays Short Term High Yield Bond ETF | | | 44,814 | | | | 1,253,448 | |
| Total Exchange-Traded Funds | | | | | | | | |
| (Cost $7,156,157) | | | | | | | 7,215,877 | |
| | | | | | | | | |
MONEY MARKET FUND† - 0.3% | |
Dreyfus Treasury Securities Cash Management Fund - Institutional Class 0.90%5 | | | 1,425,125 | | | | 1,425,125 | |
| Total Money Market Fund | | | | | | | | |
| (Cost $1,425,125) | | | | | | | 1,425,125 | |
| | | | | | | | | |
| | | Face
Amount~ | | | | | |
| | | | | | | | | |
CORPORATE BONDS†† - 72.7% | |
| Communications - 16.0% | |
| DISH DBS Corp. | | | | | | | | |
| 5.88% due 11/15/24 | | | 6,350,000 | | | | 6,655,593 | |
| 7.75% due 07/01/26 | | | 2,725,000 | | | | 3,128,763 | |
| 5.88% due 07/15/22 | | | 700,000 | | | | 743,750 | |
| SFR Group S.A. | | | | | | | | |
7.38% due 05/01/266 | | | 7,200,000 | | | | 7,775,999 | |
6.25% due 05/15/246 | | | 1,050,000 | | | | 1,108,800 | |
6.00% due 05/15/226 | | | 400,000 | | | | 418,000 | |
| CCO Holdings LLC / CCO Holdings Capital Corp. | | | | | | | | |
| 5.13% due 05/01/27 | | | 4,550,000 | | | | 4,612,563 | |
| 5.00% due 02/01/28 | | | 3,500,000 | | | | 3,487,925 | |
| 5.88% due 04/01/24 | | | 1,000,000 | | | | 1,061,250 | |
| MDC Partners, Inc. | | | | | | | | |
6.50% due 05/01/246 | | | 8,880,000 | | | | 8,946,600 | |
| EIG Investors Corp. | | | | | | | | |
| 10.88% due 02/01/24 | | | 6,100,000 | | | | 6,710,000 | |
| CSC Holdings LLC | | | | | | | | |
| 5.25% due 06/01/24 | | | 2,050,000 | | | | 2,073,063 | |
| 6.75% due 11/15/21 | | | 1,750,000 | | | | 1,933,750 | |
6.63% due 10/15/256 | | | 1,100,000 | | | | 1,204,500 | |
5.50% due 04/15/276 | | | 550,000 | | | | 572,000 | |
| McGraw-Hill Global Education Holdings LLC / McGraw-Hill Global Education Finance | | | | | | | | |
7.88% due 05/15/246 | | | 5,294,000 | | | | 5,221,207 | |
| Cengage Learning, Inc. | | | | | | | | |
9.50% due 06/15/246 | | | 5,500,000 | | | | 4,784,999 | |
| Sirius XM Radio, Inc. | | | | | | | | |
5.00% due 08/01/276 | | | 2,350,000 | | | | 2,397,000 | |
5.38% due 07/15/266 | | | 1,350,000 | | | | 1,420,875 | |
5.38% due 04/15/256 | | | 575,000 | | | | 606,625 | |
| Inmarsat Finance plc | | | | | | | | |
4.88% due 05/15/226 | | | 2,950,000 | | | | 3,009,000 | |
24 | THE GUGGENHEIM FUNDS ANNUAL REPORT | SEE NOTES TO FINANCIAL STATEMENTS. |
SCHEDULE OF INVESTMENTS (continued) | September 30, 2017 |
| HIGH YIELD FUND | |
| | | Face
Amount~ | | | Value | |
| | | | | | | |
| Sprint Communications, Inc. | | | | | | |
7.00% due 03/01/206 | | | 1,375,000 | | | $ | 1,503,906 | |
9.00% due 11/15/186 | | | 1,000,000 | | | | 1,074,170 | |
| Virgin Media Secured Finance plc | | | | | | | | |
| 5.00% due 04/15/27 | | GBP | 1,600,000 | | | | 2,204,351 | |
5.25% due 01/15/266 | | | 250,000 | | | | 260,313 | |
| Midcontinent Communications / Midcontinent Finance Corp. | | | | | | | | |
6.88% due 08/15/236 | | | 1,950,000 | | | | 2,101,125 | |
| Zayo Group LLC / Zayo Capital, Inc. | | | | | | | | |
5.75% due 01/15/276 | | | 1,975,000 | | | | 2,093,500 | |
| Altice Financing S.A. | | | | | | | | |
6.63% due 02/15/236 | | | 1,700,000 | | | | 1,802,000 | |
| Charter Communications Operating LLC / Charter Communications Operating Capital | | | | | | | | |
| 4.20% due 03/15/28 | | | 1,300,000 | | | | 1,315,477 | |
| Nokia Oyj | | | | | | | | |
| 4.38% due 06/12/27 | | | 1,200,000 | | | | 1,234,500 | |
| Ziggo Secured Finance BV | | | | | | | | |
5.50% due 01/15/276 | | | 1,125,000 | | | | 1,152,776 | |
| Videotron Ltd. | | | | | | | | |
5.13% due 04/15/276 | | | 1,100,000 | | | | 1,143,670 | |
| T-Mobile USA, Inc. | | | | | | | | |
| 6.63% due 04/01/23 | | | 1,050,000 | | | | 1,105,146 | |
| Virgin Media Finance plc | | | | | | | | |
6.38% due 04/15/236 | | | 850,000 | | | | 887,188 | |
| AMC Networks, Inc. | | | | | | | | |
| 4.75% due 08/01/25 | | | 875,000 | | | | 883,750 | |
| TIBCO Software, Inc. | | | | | | | | |
11.38% due 12/01/216 | | | 800,000 | | | | 876,000 | |
| VeriSign, Inc. | | | | | | | | |
| 4.75% due 07/15/27 | | | 775,000 | | | | 798,250 | |
| EW Scripps Co. | | | | | | | | |
5.13% due 05/15/256 | | | 750,000 | | | | 765,000 | |
| Level 3 Financing, Inc. | | | | | | | | |
| 5.25% due 03/15/26 | | | 550,000 | | | | 563,580 | |
| Match Group, Inc. | | | | | | | | |
| 6.38% due 06/01/24 | | | 500,000 | | | | 544,375 | |
| Anixter, Inc. | | | | | | | | |
| 5.50% due 03/01/23 | | | 500,000 | | | | 543,750 | |
| Total Communications | | | | | | | 90,725,089 | |
| | | | | | | | | |
| Financial - 10.8% | |
| Jefferies Finance LLC / JFIN Company-Issuer Corp. | | | | | | | | |
6.88% due 04/15/226 | | | 3,865,000 | | | | 3,884,325 | |
7.38% due 04/01/206 | | | 3,600,000 | | | | 3,712,500 | |
7.25% due 08/15/246 | | | 2,500,000 | | | | 2,506,250 | |
7.50% due 04/15/216 | | | 1,800,000 | | | | 1,863,000 | |
| FBM Finance, Inc. | | | | | | | | |
8.25% due 08/15/216 | | | 6,052,000 | | | | 6,475,640 | |
| GEO Group, Inc. | | | | | | | | |
| 5.88% due 10/15/24 | | | 2,000,000 | | | | 2,084,999 | |
| 5.88% due 01/15/22 | | | 1,750,000 | | | | 1,813,438 | |
| 6.00% due 04/15/26 | | | 900,000 | | | | 946,125 | |
| Icahn Enterprises, LP / Icahn Enterprises Finance Corp. | | | | | | | | |
| 5.88% due 02/01/22 | | | 4,225,000 | | | | 4,351,750 | |
| Kennedy-Wilson, Inc. | | | | | | | | |
| 5.88% due 04/01/24 | | | 4,190,000 | | | | 4,315,700 | |
| Citigroup, Inc. | | | | | | | | |
6.25%4,12 | | | 1,900,000 | | | | 2,137,499 | |
5.95%4,12 | | | 850,000 | | | | 919,063 | |
6.30%4,12 | | | 700,000 | | | | 759,500 | |
| Greystar Real Estate Partners LLC | | | | | | | | |
8.25% due 12/01/226 | | | 3,189,000 | | | | 3,404,258 | |
| NewStar Financial, Inc. | | | | | | | | |
| 7.25% due 05/01/20 | | | 3,050,000 | | | | 3,141,500 | |
| American Equity Investment Life Holding Co. | | | | | | | | |
| 5.00% due 06/15/27 | | | 2,050,000 | | | | 2,124,565 | |
| JPMorgan Chase & Co. | | | | | | | | |
6.13%4,12 | | | 1,250,000 | | | | 1,376,563 | |
6.00%4,7,12 | | | 500,000 | | | | 543,750 | |
| Lincoln Finance Ltd. | | | | | | | | |
7.38% due 04/15/216 | | | 1,700,000 | | | | 1,789,250 | |
| Jefferies LoanCore LLC / JLC Finance Corp. | | | | | | | | |
6.88% due 06/01/206 | | | 1,700,000 | | | | 1,757,375 | |
| Fidelity & Guaranty Life Holdings, Inc. | | | | | | | | |
6.38% due 04/01/216 | | | 1,520,000 | | | | 1,558,000 | |
| Goldman Sachs Group, Inc. | | | | | | | | |
5.30% (3 Month USD LIBOR + 383 bps) 3,4 | | | 1,100,000 | | | | 1,181,125 | |
| iStar, Inc. | | | | | | | | |
| 4.63% due 09/15/20 | | | 575,000 | | | | 587,938 | |
| 5.25% due 09/15/22 | | | 575,000 | | | | 583,625 | |
| NFP Corp. | | | | | | | | |
6.88% due 07/15/256 | | | 1,000,000 | | | | 1,015,000 | |
| Capital One Financial Corp. | | | | | | | | |
3.75% due 07/28/267 | | | 900,000 | | | | 891,296 | |
| USIS Merger Sub, Inc. | | | | | | | | |
6.88% due 05/01/256 | | | 800,000 | | | | 815,000 | |
| PNC Financial Services Group, Inc. | | | | | | | | |
5.00%4,7,12 | | | 750,000 | | | | 785,625 | |
| Bank of America Corp. | | | | | | | | |
6.10%4,12 | | | 700,000 | | | | 771,750 | |
| SBA Communications Corp. | | | | | | | | |
| 4.00% due 10/01/22 | | | 700,000 | | | | 703,500 | |
| Wilton Re Finance LLC | | | | | | | | |
5.88%6,12 | | | 650,000 | | | | 685,750 | |
| Hospitality Properties Trust | | | | | | | | |
4.95% due 02/15/277 | | | 500,000 | | | | 523,825 | |
| EPR Properties | | | | | | | | |
| 5.75% due 08/15/22 | | | 450,000 | | | | 498,051 | |
| Compass Bank | | | | | | | | |
| 3.88% due 04/10/25 | | | 450,000 | | | | 449,056 | |
| Majid AL Futtaim Holding | | | | | | | | |
7.12%4 | | | 300,000 | | | | 311,633 | |
| Wells Fargo & Co. | | | | | | | | |
5.90%4,12 | | | 250,000 | | | | 272,188 | |
| Total Financial | | | | | | | 61,540,412 | |
| SEE NOTES TO FINANCIAL STATEMENTS. | THE GUGGENHEIM FUNDS ANNUAL REPORT | 25 |
SCHEDULE OF INVESTMENTS (continued) | September 30, 2017 |
| HIGH YIELD FUND | |
| | | Face
Amount~ | | | Value | |
| | | | | | | |
| Energy - 10.1% | |
| Unit Corp. | | | | | | |
| 6.63% due 05/15/21 | | | 7,750,000 | | | $ | 7,769,374 | |
| American Midstream Partners Limited Partnership / American Midstream Finance Corp. | | | | | | | | |
| 8.50% due 12/15/21 | | | 7,000,000 | | | | 7,227,499 | |
| QEP Resources, Inc. | | | | | | | | |
| 5.25% due 05/01/23 | | | 1,950,000 | | | | 1,896,375 | |
| 5.38% due 10/01/22 | | | 1,625,000 | | | | 1,596,563 | |
| 6.88% due 03/01/21 | | | 650,000 | | | | 684,125 | |
| Alta Mesa Holdings, LP / Alta Mesa Finance Services Corp. | | | | | | | | |
| 7.88% due 12/15/24 | | | 3,590,000 | | | | 3,877,199 | |
| Exterran Energy Solutions Limited Partnership / EES Finance Corp. | | | | | | | | |
| 8.13% due 05/01/25 | | | 2,925,000 | | | | 3,027,375 | |
| Covey Park Energy LLC / Covey Park Finance Corp. | | | | | | | | |
7.50% due 05/15/256 | | | 2,699,000 | | | | 2,796,839 | |
| Comstock Resources, Inc. | | | | | | | | |
| 10.00% due 03/15/20 | | | 2,700,000 | | | | 2,686,500 | |
| CONSOL Energy, Inc. | | | | | | | | |
| 8.00% due 04/01/23 | | | 1,300,000 | | | | 1,381,328 | |
| 5.88% due 04/15/22 | | | 1,050,000 | | | | 1,060,500 | |
| Antero Resources Corp. | | | | | | | | |
| 5.63% due 06/01/23 | | | 1,000,000 | | | | 1,042,500 | |
| 5.13% due 12/01/22 | | | 975,000 | | | | 996,938 | |
| 5.00% due 03/01/25 | | | 350,000 | | | | 355,250 | |
| Cheniere Corpus Christi Holdings LLC | | | | | | | | |
| 5.13% due 06/30/27 | | | 1,200,000 | | | | 1,236,000 | |
| 5.88% due 03/31/25 | | | 1,000,000 | | | | 1,076,250 | |
| Sabine Pass Liquefaction LLC | | | | | | | | |
6.25% due 03/15/227 | | | 1,861,000 | | | | 2,093,149 | |
| NGPL PipeCo LLC | | | | | | | | |
4.88% due 08/15/276 | | | 1,750,000 | | | | 1,833,738 | |
| Gibson Energy, Inc. | | | | | | | | |
5.25% due 07/15/246 | | CAD | 2,250,000 | | | | 1,798,565 | |
| EP Energy LLC / Everest Acquisition Finance, Inc. | | | | | | | | |
8.00% due 02/15/256 | | | 1,350,000 | | | | 1,051,313 | |
| 6.38% due 06/15/23 | | | 650,000 | | | | 399,750 | |
| Pattern Energy Group, Inc. | | | | | | | | |
5.88% due 02/01/246 | | | 1,375,000 | | | | 1,450,625 | |
| Legacy Reserves Limited Partnership / Legacy Reserves Finance Corp. | | | | | | | | |
| 6.63% due 12/01/21 | | | 1,090,000 | | | | 689,425 | |
| 8.00% due 12/01/20 | | | 965,000 | | | | 665,850 | |
| TerraForm Power Operating LLC | | | | | | | | |
6.37% due 02/01/236,8 | | | 1,250,000 | | | | 1,300,000 | |
| Callon Petroleum Co. | | | | | | | | |
| 6.13% due 10/01/24 | | | 1,050,000 | | | �� | 1,086,750 | |
| Murphy Oil USA, Inc. | | | | | | | | |
| 5.63% due 05/01/27 | | | 1,000,000 | | | | 1,075,000 | |
| PDC Energy, Inc. | | | | | | | | |
| 7.75% due 10/15/22 | | | 1,000,000 | | | | 1,041,250 | |
| Summit Midstream Holdings LLC / Summit Midstream Finance Corp. | | | | | | | | |
| 5.75% due 04/15/25 | | | 1,000,000 | | | | 1,015,000 | |
| Crestwood Midstream Partners Limited Partnership / Crestwood Midstream Finance Corp. | | | | | | | | |
| 5.75% due 04/01/25 | | | 700,000 | | | | 714,875 | |
| 6.25% due 04/01/23 | | | 250,000 | | | | 257,813 | |
| NuStar Logistics, LP | | | | | | | | |
| 5.63% due 04/28/27 | | | 550,000 | | | | 580,250 | |
| 6.75% due 02/01/21 | | | 250,000 | | | | 270,625 | |
| Murphy Oil Corp. | | | | | | | | |
| 5.75% due 08/15/25 | | | 625,000 | | | | 643,688 | |
| Trinidad Drilling Ltd. | | | | | | | | |
6.63% due 02/15/256 | | | 625,000 | | | | 584,375 | |
| Whiting Petroleum Corp. | | | | | | | | |
5.75% due 03/15/217 | | | 250,000 | | | | 245,625 | |
| BreitBurn Energy Partners Limited Partnership / BreitBurn Finance Corp. | | | | | | | | |
7.88% due 04/15/229 | | | 1,750,000 | | | | 87,500 | |
| Schahin II Finance Co. SPV Ltd. | | | | | | | | |
5.88% due 09/25/229,10 | | | 217,167 | | | | 21,717 | |
| SandRidge Energy, Inc. | | | | | | | | |
7.50% due 03/15/219 | | | 250,000 | | | | 25 | |
| Total Energy | | | | | | | 57,617,523 | |
| | | | | | | | | |
| Consumer, Non-cyclical - 9.6% | |
| Vector Group Ltd. | | | | | | | | |
6.13% due 02/01/256 | | | 9,535,000 | | | | 9,868,725 | |
| Valeant Pharmaceuticals International, Inc. | | | | | | | | |
7.00% due 03/15/246 | | | 6,400,000 | | | | 6,832,576 | |
6.50% due 03/15/226 | | | 1,300,000 | | | | 1,374,750 | |
| Tenet Healthcare Corp. | | | | | | | | |
| 7.50% due 01/01/22 | | | 3,015,000 | | | | 3,192,131 | |
| 5.13% due 05/01/25 | | | 2,600,000 | | | | 2,564,250 | |
| 4.63% due 07/15/24 | | | 1,350,000 | | | | 1,337,796 | |
| Great Lakes Dredge & Dock Corp. | | | | | | | | |
| 8.00% due 05/15/22 | | | 5,125,000 | | | | 5,317,187 | |
| WEX, Inc. | | | | | | | | |
4.75% due 02/01/236 | | | 3,030,000 | | | | 3,105,749 | |
| Post Holdings, Inc. | | | | | | | | |
5.50% due 03/01/256 | | | 2,700,000 | | | | 2,801,250 | |
| HCA, Inc. | | | | | | | | |
| 5.50% due 06/15/47 | | | 1,500,000 | | | | 1,554,375 | |
| 5.88% due 02/15/26 | | | 750,000 | | | | 805,313 | |
| 4.50% due 02/15/27 | | | 300,000 | | | | 306,750 | |
| Midas Intermediate Holdco II LLC / Midas Intermediate Holdco II Finance, Inc. | | | | | | | | |
7.88% due 10/01/226 | | | 2,477,000 | | | | 2,507,963 | |
| Halyard Health, Inc. | | | | | | | | |
| 6.25% due 10/15/22 | | | 1,800,000 | | | | 1,878,750 | |
| KeHE Distributors LLC / KeHE Finance Corp. | | | | | | | | |
7.63% due 08/15/216 | | | 1,470,000 | | | | 1,477,350 | |
| Central Garden & Pet Co. | | | | | | | | |
| 6.13% due 11/15/23 | | | 1,350,000 | | | | 1,437,750 | |
26 | THE GUGGENHEIM FUNDS ANNUAL REPORT | SEE NOTES TO FINANCIAL STATEMENTS. |
SCHEDULE OF INVESTMENTS (continued) | September 30, 2017 |
| HIGH YIELD FUND | |
| | | Face
Amount~ | | | Value | |
| | | | | | | |
| Avantor, Inc. | | | | | | |
| 4.75% due 10/01/24 | | EUR | 1,150,000 | | | $ | 1,383,384 | |
| Beverages & More, Inc. | | | | | | | |
11.50% due 06/15/226 | | | 1,400,000 | | | | 1,312,500 | |
| AMN Healthcare, Inc. | | | | | | | | |
5.13% due 10/01/246 | | | 950,000 | | | | 984,438 | |
| Nielsen Company Luxembourg SARL | | | | | | | | |
5.00% due 02/01/256 | | | 900,000 | | | | 937,125 | |
| Albertsons Companies LLC / Safeway Incorporated / New Albertson’s Inc / Albertson’s LLC | | | | | | | | |
| 6.63% due 06/15/24 | | | 925,000 | | | | 863,719 | |
| FAGE International S.A./ FAGE USA Dairy Industry, Inc. | | | | | | | | |
5.63% due 08/15/266 | | | 800,000 | | | | 832,000 | |
| Acadia Healthcare Company, Inc. | | | | | | | | |
| 6.50% due 03/01/24 | | | 600,000 | | | | 644,250 | |
| Endo Dac / Endo Finance LLC / Endo Finco, Inc. | | | | | | | | |
5.88% due 10/15/246 | | | 590,000 | | | | 618,025 | |
| DaVita, Inc. | | | | | | | | |
| 5.00% due 05/01/25 | | | 450,000 | | | | 443,943 | |
| Total Consumer, Non-cyclical | | | | | | | 54,382,049 | |
| | | | | | | | | |
| Consumer, Cyclical - 8.1% | |
| Ferrellgas, LP / Ferrellgas Finance Corp. | | | | | | | | |
6.75% due 01/15/227 | | | 5,443,000 | | | | 5,279,709 | |
| Ferrellgas Limited Partnership / Ferrellgas Finance Corp. | | | | | | | | |
| 6.50% due 05/01/21 | | | 2,606,000 | | | | 2,527,820 | |
| 6.75% due 06/15/23 | | | 2,600,000 | | | | 2,509,000 | |
| Seminole Hard Rock Entertainment Inc. / Seminole Hard Rock International LLC | | | | | | | | |
5.88% due 05/15/216 | | | 3,693,000 | | | | 3,729,930 | |
| Wynn Las Vegas LLC / Wynn Las Vegas Capital Corp. | | | | | | | | |
5.50% due 03/01/256 | | | 3,000,000 | | | | 3,123,750 | |
| Suburban Propane Partners Limited Partnership/Suburban Energy Finance Corp. | | | | | | | | |
| 5.88% due 03/01/27 | | | 1,800,000 | | | | 1,782,000 | |
| 5.75% due 03/01/25 | | | 1,350,000 | | | | 1,336,500 | |
| Delphi Jersey Holdings plc | | | | | | | | |
5.00% due 10/01/256 | | | 2,850,000 | | | | 2,899,875 | |
| Carrols Restaurant Group, Inc. | | | | | | | | |
8.00% due 05/01/226 | | | 2,550,000 | | | | 2,709,375 | |
| AMC Entertainment Holdings, Inc. | | | | | | | | |
6.13% due 05/15/277 | | | 1,900,000 | | | | 1,876,250 | |
| 5.88% due 11/15/26 | | | 500,000 | | | | 493,125 | |
| Nathan’s Famous, Inc. | | | | | | | | |
10.00% due 03/15/206 | | | 2,200,000 | | | | 2,299,000 | |
| WMG Acquisition Corp. | | | | | | | | |
6.75% due 04/15/226 | | | 2,000,000 | | | | 2,102,500 | |
| Tesla, Inc. | | | | | | | | |
5.30% due 08/15/256,7 | | | 2,100,000 | | | | 2,047,500 | |
| L Brands, Inc. | | | | | | | | |
| 6.75% due 07/01/36 | | | 1,050,000 | | | | 1,015,665 | |
| 7.60% due 07/15/37 | | | 700,000 | | | | 700,000 | |
| Lithia Motors, Inc. | | | | | | | | |
5.25% due 08/01/256 | | | 1,480,000 | | | | 1,537,350 | |
| Interval Acquisition Corp. | | | | | | | | |
| 5.63% due 04/15/23 | | | 1,331,000 | | | | 1,370,930 | |
| Suburban Propane Partners, LP / Suburban Energy Finance Corp. | | | | | | | | |
| 5.50% due 06/01/24 | | | 1,200,000 | | | | 1,206,000 | |
| PetSmart, Inc. | | | | | | | | |
5.88% due 06/01/256 | | | 1,250,000 | | | | 1,090,625 | |
| CalAtlantic Group, Inc. | | | | | | | | |
| 5.00% due 06/15/27 | | | 980,000 | | | | 990,413 | |
| TVL Finance plc | | | | | | | | |
| 8.50% due 05/15/23 | | GBP | 630,000 | | | | 932,227 | |
| Wabash National Corp. | | | | | | | | |
5.50% due 10/01/256 | | | 750,000 | | | | 764,063 | |
| Reliance Intermediate Holdings, LP | | | | | | | | |
6.50% due 04/01/236 | | | 625,000 | | | | 664,063 | |
| Allison Transmission, Inc. | | | | | | | | |
4.75% due 10/01/276 | | | 600,000 | | | | 604,500 | |
| QVC, Inc. | | | | | | | | |
| 4.85% due 04/01/24 | | | 400,000 | | | | 414,248 | |
| Total Consumer, Cyclical | | | | | | | 46,006,418 | |
| | | | | | | | | |
| Industrial - 5.0% | |
| Novelis Corp. | | | | | | | | |
5.88% due 09/30/266 | | | 2,600,000 | | | | 2,639,000 | |
6.25% due 08/15/246 | | | 2,300,000 | | | | 2,398,210 | |
| Grinding Media Inc. / MC Grinding Media Canada Inc. | | | | | | | | |
7.38% due 12/15/236 | | | 4,425,000 | | | | 4,801,124 | |
| Amsted Industries, Inc. | | | | | | | | |
5.38% due 09/15/246 | | | 3,898,000 | | | | 4,097,773 | |
5.00% due 03/15/226 | | | 500,000 | | | | 516,250 | |
| Tutor Perini Corp. | | | | | | | | |
6.88% due 05/01/256 | | | 2,800,000 | | | | 3,038,000 | |
| StandardAero Aviation Holdings, Inc. | | | | | | | | |
10.00% due 07/15/236 | | | 1,730,000 | | | | 1,915,975 | |
| BWAY Holding Co. | | | | | | | | |
5.50% due 04/15/246 | | | 1,500,000 | | | | 1,567,500 | |
| Standard Industries, Inc. | | | | | | | | |
5.50% due 02/15/236 | | | 1,150,000 | | | | 1,217,563 | |
5.00% due 02/15/276 | | | 300,000 | | | | 312,750 | |
| Summit Materials LLC / Summit Materials Finance Corp. | | | | | | | | |
| 8.50% due 04/15/22 | | | 1,050,000 | | | | 1,181,250 | |
| Ardagh Packaging Finance plc | | | | | | | | |
| 6.75% due 05/15/24 | | EUR | 850,000 | | | | 1,120,059 | |
| Reynolds Group Issuer Incorporated / Reynolds Group Issuer LLC / Reynolds Group Issuer Luxemburg | | | | | | | | |
| 5.75% due 10/15/20 | | | 800,000 | | | | 814,040 | |
| Infor US, Inc. | | | | | | | | |
| 5.75% due 05/15/22 | | EUR | 550,000 | | | | 678,747 | |
| SEE NOTES TO FINANCIAL STATEMENTS. | THE GUGGENHEIM FUNDS ANNUAL REPORT | 27 |
SCHEDULE OF INVESTMENTS (continued) | September 30, 2017 |
| HIGH YIELD FUND | |
| | | Face
Amount~ | | | Value | |
| | | | | | | |
| Actuant Corp. | | | | | | |
| 5.63% due 06/15/22 | | | 600,000 | | | $ | 615,750 | |
| Wrangler Buyer Corp. | | | | | | | | |
6.00% due 10/01/256 | | | 540,000 | | | | 549,450 | |
| Multi-Color Corp. | | | | | | | | |
4.88% due 11/01/256 | | | 440,000 | | | | 444,818 | |
| Ardagh Packaging Finance plc / Ardagh Holdings USA, Inc. | | | | | | | | |
7.25% due 05/15/246 | | | 375,000 | | | | 411,326 | |
| Reynolds Group Issuer | | | | | | | | |
| 6.88% due 02/15/21 | | | 259,254 | | | | 265,736 | |
| Total Industrial | | | | | | | 28,585,321 | |
| | | | | | | | | |
| Basic Materials - 4.9% | |
| Alcoa Nederland Holding B.V. | | | | | | | | |
7.00% due 09/30/266,7 | | | 4,925,000 | | | | 5,577,563 | |
6.75% due 09/30/246 | | | 2,600,000 | | | | 2,879,500 | |
| Eldorado Gold Corp. | | | | | | | | |
6.13% due 12/15/206 | | | 7,460,000 | | | | 7,581,225 | |
| Constellium N.V. | | | | | | | | |
7.88% due 04/01/216 | | | 2,200,000 | | | | 2,332,000 | |
| Kaiser Aluminum Corp. | | | | | | | | |
| 5.88% due 05/15/24 | | | 1,750,000 | | | | 1,872,500 | |
| Yamana Gold, Inc. | | | | | | | | |
| 4.95% due 07/15/24 | | | 1,625,000 | | | | 1,665,625 | |
| GCP Applied Technologies, Inc. | | | | | | | | |
9.50% due 02/01/236 | | | 1,248,000 | | | | 1,410,240 | |
| Commercial Metals Co. | | | | | | | | |
| 5.38% due 07/15/27 | | | 1,025,000 | | | | 1,076,250 | |
| Big River Steel LLC / BRS Finance Corp. | | | | | | | | |
7.25% due 09/01/256 | | | 900,000 | | | | 954,900 | |
| PQ Corp. | | | | | | | | |
6.75% due 11/15/226 | | | 800,000 | | | | 866,000 | |
| Valvoline, Inc. | | | | | | | | |
| 4.38% due 08/15/25 | | | 700,000 | | | | 713,125 | |
| Clearwater Paper Corp. | | | | | | | | |
5.38% due 02/01/256 | | | 600,000 | | | | 597,000 | |
| Mirabela Nickel Ltd. | | | | | | | | |
| 2.37% due 06/24/19 | | | 278,115 | | | | 25,030 | |
| Total Basic Materials | | | | | | | 27,550,958 | |
| | | | | | | | | |
| Utilities - 3.7% | |
| Terraform Global Operating LLC | | | | | | | | |
9.75% due 08/15/226 | | | 6,800,000 | | | | 7,548,000 | |
| LBC Tank Terminals Holding Netherlands BV | | | | | | | | |
6.88% due 05/15/236 | | | 5,640,000 | | | | 5,922,000 | |
| AES Corp. | | | | | | | | |
| 6.00% due 05/15/26 | | | 2,900,000 | | | | 3,121,125 | |
| 5.13% due 09/01/27 | | | 700,000 | | | | 717,500 | |
| 4.88% due 05/15/23 | | | 350,000 | | | | 360,500 | |
| AmeriGas Partners Limited Partnership / AmeriGas Finance Corp. | | | | | | | | |
| 5.50% due 05/20/25 | | | 2,200,000 | | | | 2,260,500 | |
| AmeriGas Partners, LP / AmeriGas Finance Corp. | | | | | | | | |
| 5.75% due 05/20/27 | | | 1,250,000 | | | | 1,278,125 | |
| Total Utilities | | | | | | | 21,207,750 | |
| | | | | | | | | |
| Technology - 3.1% | |
| Micron Technology, Inc. | | | | | | | | |
7.50% due 09/15/237 | | | 1,860,000 | | | | 2,066,925 | |
| 5.25% due 08/01/23 | | | 1,950,000 | | | | 2,033,850 | |
5.25% due 01/15/246 | | | 750,000 | | | | 789,375 | |
| First Data Corp. | | | | | | | | |
5.75% due 01/15/246 | | | 3,000,000 | | | | 3,138,750 | |
5.00% due 01/15/246 | | | 850,000 | | | | 882,555 | |
7.00% due 12/01/236 | | | 350,000 | | | | 373,730 | |
| NCR Corp. | | | | | | | | |
| 6.38% due 12/15/23 | | | 2,350,000 | | | | 2,506,510 | |
| Epicor Software | | | | | | | | |
9.58% (3 Month USD LIBOR + 825 bps) due 06/21/23†††,1,3 | | | 2,000,000 | | | | 1,954,000 | |
| Open Text Corp. | | | | | | | | |
5.88% due 06/01/266 | | | 750,000 | | | | 823,125 | |
| Ascend Learning LLC | | | | | | | | |
6.88% due 08/01/256 | | | 650,000 | | | | 685,750 | |
| Infor US, Inc. | | | | | | | | |
| 6.50% due 05/15/22 | | | 600,000 | | | | 622,122 | |
| Oracle Corp. | | | | | | | | |
3.85% due 07/15/367 | | | 550,000 | | | | 569,217 | |
| CDK Global, Inc. | | | | | | | | |
| 4.88% due 06/01/27 | | | 550,000 | | | | 565,125 | |
| Microsoft Corp. | | | | | | | | |
| 4.20% due 11/03/35 | | | 450,000 | | | | 500,286 | |
| Total Technology | | | | | | | 17,511,320 | |
| | | | | | | | | |
| Banks & Credit - 0.5% | |
| UPCB Finance VII LTD | | | | | | | | |
| 3.62% due 06/15/29 | | EUR | 2,600,000 | | | | 3,042,194 | |
| | | | | | | | | |
| Asset Backed - 0.5% | |
| Virgin Media Finance plc | | | | | | | | |
| 5.00% due 04/15/27 | | GBP | 2,000,000 | | | | 2,755,438 | |
| | | | | | | | | |
| Diversified - 0.4% | |
| HRG Group, Inc. | | | | | | | | |
| 7.88% due 07/15/19 | | | 2,035,000 | | | | 2,075,700 | |
| Total Corporate Bonds | | | | | | | | |
| (Cost $405,538,419) | | | | | | | 413,000,172 | |
| | | | | | | | | |
SENIOR FLOATING RATE INTERESTS††,3 - 28.6% | |
| Industrial - 6.4% | |
| Resource Label Group LLC | | | | | | | | |
| 5.83% (3 Month USD LIBOR + 450 bps) due 05/26/23 | | | 1,883,735 | | | | 1,876,671 | |
| 9.83% (3 Month USD LIBOR + 850 bps) due 11/26/23 | | | 1,500,000 | | | | 1,494,375 | |
| Diversitech Holdings, Inc. | | | | | | | | |
| 8.84% (1 Month USD LIBOR + 750 bps) due 06/02/25 | | | 2,650,000 | | | | 2,669,874 | |
28 | THE GUGGENHEIM FUNDS ANNUAL REPORT | SEE NOTES TO FINANCIAL STATEMENTS. |
SCHEDULE OF INVESTMENTS (continued) | September 30, 2017 |
| HIGH YIELD FUND | |
| | | Face
Amount~ | | | Value | |
| | | | | | | |
| Pregis Holding I Corp. | | | | | | |
| 4.83% (3 Month USD LIBOR + 350 bps) due 05/20/21 | | | 2,342,454 | | | $ | 2,336,597 | |
| Hayward Industries, Inc. | | | | | | | | |
| 9.49% (1 Month USD LIBOR + 825 bps) due 08/04/25 | | | 2,325,000 | | | | 2,301,750 | |
| RING Container Technologies Group LLC | | | | | | | | |
2.75% (3 Month USD LIBOR + 275 bps) due 09/28/2414 | | | 1,725,000 | | | | 1,729,313 | |
| Arctic Long Carriers | | | | | | | | |
| 5.74% (1 Month USD LIBOR + 450 bps) due 05/18/23 | | | 1,546,125 | | | | 1,556,762 | |
| Advanced Integration Technology LP | | | | | | | | |
| 5.99% (1 Month USD LIBOR + 475 bps) due 04/03/23 | | | 1,517,873 | | | | 1,510,283 | |
| DAE Aviation | | | | | | | | |
| 4.99% (1 Month USD LIBOR + 375 bps) due 07/07/22 | | | 1,446,310 | | | | 1,456,550 | |
| Hanjin International Corp. | | | | | | | | |
| 2.50% (3 Month USD LIBOR + 95 bps) due 09/20/20 | | | 1,450,000 | | | | 1,450,000 | |
| CPG International LLC | | | | | | | | |
| 5.08% (3 Month USD LIBOR + 375 bps) due 05/05/24 | | | 1,293,500 | | | | 1,301,584 | |
| VC GB Holdings, Inc. | | | | | | | | |
| 4.99% (1 Month USD LIBOR + 375 bps) due 02/28/24 | | | 1,243,875 | | | | 1,254,759 | |
| Recess Holdings, Inc. | | | | | | | | |
| 4.75% (3 Month USD LIBOR + 375 bps) due 09/30/24 | | | 1,233,333 | | | | 1,239,500 | |
| Wrangler Buyer Corp. | | | | | | | | |
3.00% (3 Month USD LIBOR + 300 bps) due 09/27/2414 | | | 1,200,000 | | | | 1,205,496 | |
| Milacron LLC | | | | | | | | |
| 4.24% (1 Month USD LIBOR + 300 bps) due 09/28/23 | | | 1,191,000 | | | | 1,195,466 | |
| ProAmpac PG Borrower LLC | | | | | | | | |
5.28% (3 Month USD LIBOR + 800 bps) and (1 Month USD LIBOR + 400 bps) due 11/20/2315 | | | 826,299 | | | | 833,017 | |
| 9.82% (3 Month USD LIBOR + 850 bps) due 11/18/24 | | | 350,000 | | | | 354,813 | |
| Imagine Print Solutions LLC | | | | | | | | |
| 6.09% (3 Month USD LIBOR + 475 bps) due 06/21/22 | | | 1,094,500 | | | | 1,094,500 | |
| HD Supply Waterworks Ltd. | | | | | | | | |
| 4.46% (6 Month USD LIBOR + 300 bps) due 08/01/24 | | | 1,050,000 | | | | 1,051,313 | |
| Dimora Brands, Inc. | | | | | | | | |
| 5.24% (3 Month USD LIBOR + 400 bps) due 08/24/24 | | | 1,000,000 | | | | 1,002,500 | |
| Pexco LLC | | | | | | | | |
| 4.81% (3 Month USD LIBOR + 350 bps) due 05/08/24 | | | 997,500 | | | | 995,006 | |
| SRS Distribution, Inc. | | | | | | | | |
| 9.99% (1 Month USD LIBOR + 875 bps) due 02/24/23 | | | 950,000 | | | | 972,563 | |
| American Bath Group LLC | | | | | | | | |
| 6.58% (3 Month USD LIBOR + 525 bps) due 09/30/23 | | | 942,857 | | | | 945,214 | |
| Bioplan USA, Inc. | | | | | | | | |
| 5.99% (1 Month USD LIBOR + 475 bps) due 09/23/21 | | | 786,133 | | | | 779,749 | |
| Optiv, Inc. | | | | | | | | |
| 4.56% (3 Month USD LIBOR + 325 bps) due 02/01/24 | | | 827,853 | | | | 776,112 | |
| ICSH Parent, Inc. | | | | | | | | |
| 5.32% (3 Month USD LIBOR + 400 bps) due 04/29/24 | | | 670,059 | | | | 673,410 | |
| ILPEA Parent, Inc. | | | | | | | | |
| 6.74% (1 Month USD LIBOR + 550 bps) due 03/02/23 | | | 645,938 | | | | 647,552 | |
| CPM Holdings, Inc. | | | | | | | | |
| 5.49% (3 Month USD LIBOR + 425 bps) due 04/11/22 | | | 579,924 | | | | 585,242 | |
| Consolidated Container Co. LLC | | | | | | | | |
| 4.74% (1 Month USD LIBOR + 350 bps) due 05/22/24 | | | 500,000 | | | | 502,710 | |
| Hardware Holdings LLC | | | | | | | | |
| 7.83% (3 Month USD LIBOR + 650 bps) due 03/30/20 | | | 499,500 | | | | 484,515 | |
| BWAY Holding Co. | | | | | | | | |
| 4.48% (1 Month USD LIBOR + 325 bps) due 04/03/24 | | | 399,000 | | | | 399,926 | |
| Kuehg Corp. - Kindercare | | | | | | | | |
| 5.08% (3 Month LIBOR + 375 bps) due 08/12/22 | | | 320,000 | | | | 318,602 | |
| Wencor Group | | | | | | | | |
4.74% (1 Month LIBOR + 350 bps) due 06/19/19†††,1 | | | 102,308 | | | | 98,187 | |
| NANA Development Corp. | | | | | | | | |
| 8.08% (3 Month USD LIBOR + 675 bps) due 03/15/18 | | | 3,361 | | | | 3,294 | |
| Total Industrial | | | | | | | 37,097,205 | |
| | | | | | | | | |
| Consumer, Non-cyclical - 5.4% | |
| CTI Foods Holding Co. LLC | | | | | | | | |
| 4.74% (1 Month USD LIBOR + 350 bps) due 06/29/20 | | | 1,840,000 | | | | 1,655,999 | |
| 8.49% (1 Month USD LIBOR + 725 bps) due 06/28/21 | | | 590,000 | | | | 472,738 | |
| Immucor, Inc. | | | | | | | | |
| 6.24% (1 Month USD LIBOR + 500 bps) due 06/15/21 | | | 2,094,750 | | | | 2,123,552 | |
| American Seafoods Group LLC / American Seafoods Finance, Inc. | | | | | | | | |
4.56% (3 Month USD LIBOR + 325 bps) and (1 Month USD LIBOR + 325 bps) due 08/21/2315 | | | 1,800,000 | | | | 1,802,249 | |
| Valeo Foods Group Ltd. | | | | | | | | |
3.75% (3 Month EURIBOR + 375 bps) due 08/19/2413 | | EUR | 1,200,000 | | | | 1,417,392 | |
| SEE NOTES TO FINANCIAL STATEMENTS. | THE GUGGENHEIM FUNDS ANNUAL REPORT | 29 |
SCHEDULE OF INVESTMENTS (continued) | September 30, 2017 |
| HIGH YIELD FUND | |
| | | Face
Amount~ | | | Value | |
| | | | | | | |
| Alegeus Technologies LLC | | | | | | |
6.33% (3 Month USD LIBOR + 500 bps) due 04/28/23†††,1 | | | 1,396,500 | | | $ | 1,383,528 | |
| Endo Luxembourg Finance Co. | | | | | | | | |
| 5.50% (1 Month USD LIBOR + 425 bps) due 04/29/24 | | | 1,296,750 | | | | 1,308,097 | |
| Albertson’s LLC | | | | | | | | |
| 3.99% (1 Month USD LIBOR + 275 bps) due 08/25/21 | | | 1,256,432 | | | | 1,210,296 | |
| Equian LLC | | | | | | | | |
| 5.07% (3 Month USD LIBOR + 375 bps) due 05/20/24 | | | 877,213 | | | | 888,178 | |
| 5.06% (3 Month USD LIBOR + 375 bps) due 05/20/24 | | | 270,588 | | | | 273,971 | |
| CareCore National LLC | | | | | | | | |
| 5.24% (1 Month USD LIBOR + 400 bps) due 03/05/21 | | | 1,139,870 | | | | 1,151,269 | |
| Change Healthcare Holdings, Inc. | | | | | | | | |
| 3.99% (1 Month USD LIBOR + 275 bps) due 03/01/24 | | | 1,144,250 | | | | 1,146,825 | |
| American Tire Distributors, Inc. | | | | | | | | |
| 5.49% (1 Month USD LIBOR + 425 bps) due 09/01/21 | | | 1,125,472 | | | | 1,135,320 | |
| Authentic Brands | | | | | | | | |
| 4.50% (3 Month USD LIBOR + 350 bps) due 09/27/24 | | | 1,125,000 | | | | 1,127,813 | |
| AI Aqua Zip Bidco Pty Ltd. | | | | | | | | |
| 4.74% (1 Month USD LIBOR + 350 bps) due 12/13/23 | | | 1,100,000 | | | | 1,102,750 | |
| ADMI Corp. | | | | | | | | |
| 5.07% (3 Month USD LIBOR + 375 bps) due 04/29/22 | | | 992,386 | | | | 1,001,069 | |
| Smart & Final Stores LLC | | | | | | | | |
| 4.83% (3 Month USD LIBOR + 350 bps) due 11/15/22 | | | 1,000,000 | | | | 961,560 | |
| IHC Holding Corp. | | | | | | | | |
8.08% (3 Month LIBOR + 675 bps) due 04/30/21†††,1 | | | 811,022 | | | | 803,754 | |
8.07% (3 Month USD LIBOR + 675 bps) due 04/30/21†††,1 | | | 154,221 | | | | 152,839 | |
| Reddy Ice Holdings, Inc. | | | | | | | | |
6.88% (Commercial Prime Lending Rate + 450 bps) and (3 Month USD LIBOR + 550 bps) due 05/01/1915 | | | 967,832 | | | | 950,411 | |
| Avantor, Inc. | | | | | | | | |
| 5.00% (3 Month USD LIBOR + 400 bps) due 09/20/24 | | | 900,000 | | | | 902,439 | |
| Project Ruby Ultimate Parent Corp. | | | | | | | | |
| 4.99% (1 Month USD LIBOR + 375 bps) due 02/09/24 | | | 894,887 | | | | 899,361 | |
| Surgery Center Holdings, Inc. | | | | | | | | |
| 4.49% (1 Month USD LIBOR + 325 bps) due 09/02/24 | | | 875,000 | | | | 867,344 | |
| Lineage Logistics LLC | | | | | | | | |
| 4.74% (1 Month USD LIBOR + 350 bps) due 04/07/21 | | | 825,136 | | | | 825,912 | |
| Arctic Glacier Group Holdings, Inc. | | | | | | | | |
| 5.49% (1 Month USD LIBOR + 425 bps) due 03/20/24 | | | 771,125 | | | | 774,981 | |
| Halyard Health | | | | | | | | |
| 3.99% (1 Month USD LIBOR + 275 bps) due 11/01/21 | | | 675,000 | | | | 680,063 | |
| JBS USA Lux SA | | | | | | | | |
| 3.80% (3 Month USD LIBOR + 250 bps) due 10/30/22 | | | 648,375 | | | | 640,270 | |
| PT Intermediate Holdings III LLC | | | | | | | | |
7.74% (1 Month USD LIBOR + 650 bps) due 06/23/22†††,1 | | | 604,450 | | | | 604,450 | |
| Sterigenics-Norion Holdings | | | | | | | | |
| 4.24% (1 Month USD LIBOR + 300 bps) due 05/15/22 | | | 547,250 | | | | 547,250 | |
| Give and Go Prepared Foods Corp. | | | | | | | | |
| 5.56% (3 Month USD LIBOR + 425 bps) due 07/29/23 | | | 500,000 | | | | 506,250 | |
| MPH Acquisition Holdings LLC | | | | | | | | |
| 4.33% (3 Month USD LIBOR + 300 bps) due 06/07/23 | | | 498,420 | | | | 502,004 | |
| NES Global Talent | | | | | | | | |
| 6.81% (3 Month USD LIBOR + 550 bps) due 10/03/19 | | | 464,252 | | | | 417,827 | |
| Packaging Coordinators Midco, Inc. | | | | | | | | |
6.36% (3 Month USD LIBOR + 400 bps) and (Commercial Prime Lending Rate + 900 bps) due 07/01/21†††,1,15 | | | 230,769 | | | | 209,111 | |
4.25% (3 Month EURIBOR + 425 bps) due 07/01/21†††,1,13 | | EUR | 57,692 | | | | 61,787 | |
| PT Intermediate Holdings III, LLC | | | | | | | | |
7.07% (1 Month USD LIBOR + 325 bps) due 06/23/22†††,1 | | | 151,667 | | | | 139,207 | |
| Targus Group International, Inc. | | | | | | | | |
(3 Month USD LIBOR + 450 bps) due 05/24/16†††,1,2,9 | | | 153,489 | | | | — | |
| Total Consumer, Non-cyclical | | | | | | | 30,647,866 | |
| | | | | | | | | |
| Consumer, Cyclical - 4.3% | |
| Eyemart Express | | | | | | | | |
| 4.25% (1 Month USD LIBOR + 300 bps) due 08/04/24 | | | 2,150,000 | | | | 2,143,292 | |
| Men’s Wearhouse | | | | | | | | |
4.77% (3 Month USD LIBOR + 700 bps) and (1 Month USD LIBOR + 350 bps) due 06/18/2115 | | | 1,556,483 | | | | 1,515,143 | |
| International Car Wash Group Ltd. | | | | | | | | |
4.50% (3 Month USD LIBOR + 350 bps) due 10/03/2414 | | | 1,500,000 | | | | 1,505,625 | |
| BC Equity Ventures LLC | | | | | | | | |
| 7.74% (1 Month USD LIBOR + 650 bps) due 08/31/22 | | | 1,432,508 | | | | 1,446,833 | |
| Sears Holdings Corp. | | | | | | | | |
| 5.74% (1 Month USD LIBOR + 450 bps) due 06/30/18 | | | 1,436,978 | | | | 1,417,219 | |
30 | THE GUGGENHEIM FUNDS ANNUAL REPORT | SEE NOTES TO FINANCIAL STATEMENTS. |
SCHEDULE OF INVESTMENTS (continued) | September 30, 2017 |
| HIGH YIELD FUND | |
| | | Face
Amount~ | | | Value | |
| | | | | | | |
| Leslie’s Poolmart, Inc. | | | | | | |
| 5.06% (3 Month USD LIBOR + 375 bps) due 08/16/23 | | | 1,240,602 | | | $ | 1,240,155 | |
| Truck Hero, Inc. | | | | | | | | |
| 5.33% (3 Month USD LIBOR + 400 bps) due 04/22/24 | | | 1,125,000 | | | | 1,123,121 | |
| Equinox Holdings, Inc. | | | | | | | | |
| 4.49% (1 Month USD LIBOR + 325 bps) due 03/08/24 | | | 1,047,375 | | | | 1,050,863 | |
| CH Hold Corp. | | | | | | | | |
| 4.24% (1 Month USD LIBOR + 300 bps) due 02/01/24 | | | 1,041,250 | | | | 1,049,059 | |
| BBB Industries, LLC | | | | | | | | |
| 5.74% (1 Month USD LIBOR + 450 bps) due 11/03/21 | | | 1,023,442 | | | | 1,033,677 | |
| Fitness International LLC | | | | | | | | |
| 7.50% (Commercial Prime Lending Rate + 325 bps) due 07/01/20 | | | 1,001,295 | | | | 1,005,941 | |
| Landry’s, Inc. | | | | | | | | |
4.00% (3 Month USD LIBOR + 325 bps) due 10/04/2314 | | | 1,000,000 | | | | 1,005,000 | |
| Mavis Tire | | | | | | | | |
6.49% (1 Month USD LIBOR + 525 bps) due 11/02/20†††,1 | | | 931,000 | | | | 922,907 | |
| Greektown Holdings LLC | | | | | | | | |
| 4.24% (1 Month USD LIBOR + 300 bps) due 04/25/24 | | | 897,750 | | | | 897,301 | |
| Talbots, Inc. | | | | | | | | |
| 5.74% (1 Month USD LIBOR + 450 bps) due 03/19/20 | | | 901,603 | | | | 865,539 | |
| Navistar Inc. | | | | | | | | |
| 5.24% (1 Month USD LIBOR + 400 bps) due 08/07/20 | | | 786,000 | | | | 789,600 | |
| Blue Nile, Inc. | | | | | | | | |
| 7.83% (3 Month USD LIBOR + 650 bps) due 02/17/23 | | | 765,313 | | | | 761,486 | |
| Accuride Corp. | | | | | | | | |
| 8.33% (3 Month USD LIBOR + 700 bps) due 11/17/23 | | | 749,785 | | | | 757,283 | |
| Belk, Inc. | | | | | | | | |
| 6.05% (3 Month USD LIBOR + 475 bps) due 12/12/22 | | | 776,428 | | | | 649,374 | |
| USIC Holding, Inc. | | | | | | | | |
| 5.00% (3 Month USD LIBOR + 350 bps) due 12/08/23 | | | 550,912 | | | | 554,124 | |
| National Vision, Inc. | | | | | | | | |
| 6.99% (1 Month USD LIBOR + 575 bps) due 03/11/22 | | | 450,000 | | | | 436,500 | |
| 4.24% (1 Month USD LIBOR + 300 bps) due 03/12/21 | | | 99,229 | | | | 99,435 | |
| Toys ‘R’ US, Inc. | | | | | | | | |
| 7.75% (3 Month USD LIBOR + 675 bps) due 01/29/19 | | | 500,000 | | | | 503,125 | |
| Penn Engineering & Manufacturing Corp. | | | | | | | | |
| 3.99% (1 Month USD LIBOR + 275 bps) due 06/27/24 | | | 498,750 | | | | 499,842 | |
| Acosta, Inc. | | | | | | | | |
4.43% (3 Month USD LIBOR + 325 bps) and (1 Month USD LIBOR + 325 bps) due 09/26/19†††,1,15 | | | 311,111 | | | | 294,630 | |
4.48% (1 Month USD LIBOR + 325 bps) due 09/26/19†††,1 | | | 200,000 | | | | 189,405 | |
| Station Casinos LLC | | | | | | | | |
| 3.74% (1 Month USD LIBOR + 250 bps) due 06/08/23 | | | 398,995 | | | | 399,103 | |
| Total Consumer, Cyclical | | | | | | | 24,155,582 | |
| | | | | | | | | |
| Technology - 4.0% | |
| MRI Software LLC | | | | | | | | |
7.33% (3 Month USD LIBOR + 600 bps) due 06/30/23†††,1,14 | | | 1,530,885 | | | | 1,523,231 | |
| 7.00% (3 Month USD LIBOR + 600 bps) due 06/30/23 | | | 696,528 | | | | 689,563 | |
| 7.32% (3 Month USD LIBOR + 600 bps) due 06/30/23 | | | 118,056 | | | | 118,056 | |
| AVSC Holding Corp. | | | | | | | | |
4.79% (3 Month USD LIBOR + 350 bps) and (2 Month USD LIBOR + 350 bps) due 04/29/2415 | | | 2,700,000 | | | | 2,710,124 | |
| Lytx, Inc. | | | | | | | | |
| 7.99% (1 Month USD LIBOR + 675 bps) due 08/31/23 | | | 1,894,737 | | | | 1,847,895 | |
| Verisure Cayman 2 | | | | | | | | |
3.00% (3 Month EURIBOR + 300 bps) due 10/21/2214 | | EUR | 1,400,000 | | | | 1,656,272 | |
| Viewpoint, Inc. | | | | | | | | |
| 5.70% (3 Month USD LIBOR + 425 bps) due 07/19/24 | | | 1,600,000 | | | | 1,602,000 | |
| Project Alpha (Qlik) | | | | | | | | |
| 4.81% (3 Month USD LIBOR + 350 bps) due 04/26/24 | | | 1,630,050 | | | | 1,589,299 | |
| TIBCO Software, Inc. | | | | | | | | |
| 4.74% (1 Month USD LIBOR + 350 bps) due 12/04/20 | | | 1,519,933 | | | | 1,523,732 | |
| Solera LLC | | | | | | | | |
| 4.49% (1 Month USD LIBOR + 325 bps) due 03/03/23 | | | 1,331,117 | | | | 1,334,365 | |
| Advanced Computer Software | | | | | | | | |
| 10.81% (3 Month USD LIBOR + 950 bps) due 01/31/23 | | | 800,000 | | | | 739,336 | |
| 6.82% (3 Month USD LIBOR + 550 bps) due 03/18/22 | | | 533,175 | | | | 526,511 | |
| Planview, Inc. | | | | | | | | |
6.49% (1 Month USD LIBOR + 525 bps) due 01/27/23†††,1 | | | 1,197,000 | | | | 1,181,118 | |
| Cypress Intermediate Holdings III, Inc. | | | | | | | | |
| 4.24% (1 Month USD LIBOR + 300 bps) due 04/29/24 | | | 1,147,125 | | | | 1,144,831 | |
| Kronos, Inc. | | | | | | | | |
| 4.81% (3 Month USD LIBOR + 350 bps) due 11/01/23 | | | 843,636 | | | | 848,082 | |
| SEE NOTES TO FINANCIAL STATEMENTS. | THE GUGGENHEIM FUNDS ANNUAL REPORT | 31 |
SCHEDULE OF INVESTMENTS (continued) | September 30, 2017 |
| HIGH YIELD FUND | |
| | | Face
Amount~ | | | Value | |
| | | | | | | |
| EIG Investors Corp. | | | | | | |
| 5.32% (3 Month USD LIBOR + 400 bps) due 02/09/23 | | | 839,720 | | | $ | 847,664 | |
| QuintilesIMS, Inc. | | | | | | | | |
| 3.32% (3 Month USD LIBOR + 200 bps) due 01/17/25 | | | 700,000 | | | | 703,248 | |
| Oberthur Technologies of America Corp. | | | | | | | | |
| 5.08% (3 Month USD LIBOR + 375 bps) due 01/10/24 | | | 715,702 | | | | 693,336 | |
| Masergy Holdings, Inc. | | | | | | | | |
| 5.08% (3 Month USD LIBOR + 375 bps) due 12/15/23 | | | 645,125 | | | | 647,273 | |
| Aspect Software, Inc. | | | | | | | | |
11.24% (1 Month USD LIBOR + 1000 bps) due 05/25/202 | | | 656,151 | | | | 645,489 | |
| GlobalLogic Holdings, Inc. | | | | | | | | |
| 5.83% (3 Month USD LIBOR + 450 bps) due 06/20/22 | | | 275,617 | | | | 276,306 | |
| Quorum Business Solutions | | | | | | | | |
| 6.06% (3 Month USD LIBOR + 475 bps) due 08/06/21 | | | 205,088 | | | | 198,935 | |
| Total Technology | | | | | | | 23,046,666 | |
| | | | | | | | | |
| Financial - 2.3% | |
| Misys Ltd. | | | | | | | | |
| 4.82% (3 Month USD LIBOR + 350 bps) due 06/13/24 | | | 2,050,000 | | | | 2,058,425 | |
| National Financial Partners Corp. | | | | | | | | |
| 4.74% (3 Month USD LIBOR + 350 bps) due 01/08/24 | | | 1,872,250 | | | | 1,883,951 | |
| Americold Realty Operating Partnership, LP | | | | | | | | |
| 4.99% (1 Month USD LIBOR + 375 bps) due 12/01/22 | | | 1,727,522 | | | | 1,744,797 | |
| Focus Financial Partners LLC | | | | | | | | |
| 4.55% (3 Month USD LIBOR + 325 bps) due 07/03/24 | | | 1,500,000 | | | | 1,511,250 | |
| Jane Street Group LLC | | | | | | | | |
| 5.74% (1 Month USD LIBOR + 450 bps) due 08/25/22 | | | 1,250,000 | | | | 1,260,163 | |
| Vantiv LLC | | | | | | | | |
2.00% (3 Month USD LIBOR + 200 bps) due 09/06/2414 | | | 1,171,283 | | | | 1,171,283 | |
| Acrisure LLC | | | | | | | | |
| 6.27% (2 Month USD LIBOR + 500 bps) due 11/22/23 | | | 995,000 | | | | 1,005,776 | |
| LPL Holdings, Inc. | | | | | | | | |
| 3.80% (6 Month USD LIBOR + 250 bps) due 03/11/24 | | | 997,500 | | | | 995,006 | |
| York Risk Services | | | | | | | | |
| 4.99% (1 Month USD LIBOR + 375 bps) due 10/01/21 | | | 727,500 | | | | 714,041 | |
| American Stock Transfer & Trust | | | | | | | | |
| 5.84% (3 Month USD LIBOR + 450 bps) due 06/26/20 | | | 551,222 | | | | 552,600 | |
| Integro Parent, Inc. | | | | | | | | |
| 7.06% (3 Month USD LIBOR + 575 bps) due 10/28/22 | | | 149,997 | | | | 149,247 | |
| Total Financial | | | | | | | 13,046,539 | |
| | | | | | | | | |
| Communications - 2.1% | |
| Market Track LLC | | | | | | | | |
5.58% (Commercial Prime Lending Rate + 325 bps) and (3 Month USD LIBOR + 425 bps) due 06/05/2415 | | | 2,493,750 | | | | 2,481,282 | |
| Interoute Finco plc | | | | | | | | |
3.25% (3 Month EURIBOR + 325 bps) due 09/28/2313 | | EUR | 1,600,000 | | | | 1,912,314 | |
| Mcgraw-Hill Global Education Holdings LLC | | | | | | | | |
| 5.24% (1 Month USD LIBOR + 400 bps) due 05/04/22 | | | 1,941,809 | | | | 1,904,701 | |
| Cengage Learning Acquisitions, Inc. | | | | | | | | |
| 5.49% (1 Month USD LIBOR + 425 bps) due 06/07/23 | | | 1,575,080 | | | | 1,448,790 | |
| Houghton Mifflin Co. | | | | | | | | |
| 4.24% (1 Month USD LIBOR + 300 bps) due 05/28/21 | | | 1,341,867 | | | | 1,291,547 | |
| GTT Communications, Inc. | | | | | | | | |
| 4.50% (1 Month USD LIBOR + 325 bps) due 01/09/24 | | | 1,091,750 | | | | 1,095,844 | |
| Altice US Finance I Corp. | | | | | | | | |
| 3.49% (1 Month USD LIBOR + 225 bps) due 07/28/25 | | | 648,375 | | | | 644,971 | |
| Anaren, Inc. | | | | | | | | |
| 9.58% (3 Month USD LIBOR + 825 bps) due 08/18/21 | | | 500,000 | | | | 495,000 | |
| Liberty Cablevision of Puerto Rico LLC | | | | | | | | |
| 4.80% (3 Month USD LIBOR + 350 bps) due 01/07/22 | | | 300,000 | | | | 279,000 | |
| Neustar, Inc. | | | | | | | | |
| 5.06% (3 Month USD LIBOR + 375 bps) due 08/08/24 | | | 250,000 | | | | 251,770 | |
| Univision Communications, Inc. | | | | | | | | |
| 3.99% (1 Month USD LIBOR + 275 bps) due 03/15/24 | | | 198,924 | | | | 197,060 | |
| Charter Communications Operating, LLC | | | | | | | | |
| 3.49% (1 Month USD LIBOR + 225 bps) due 01/15/24 | | | 148,492 | | | | 149,049 | |
| Total Communications | | | | | | | 12,151,328 | |
| | | | | | | | | |
| Utilities - 1.9% | |
| Bhi Investments LLC | | | | | | | | |
| 10.08% (3 Month USD LIBOR + 875 bps) due 02/28/25 | | | 1,500,000 | | | | 1,485,000 | |
| 5.83% (3 Month USD LIBOR + 450 bps) due 08/28/24 | | | 1,420,000 | | | | 1,405,800 | |
| Viva Alamo LLC | | | | | | | | |
| 5.57% (3 Month USD LIBOR + 425 bps) due 02/22/21 | | | 2,282,284 | | | | 2,168,170 | |
| Dynegy, Inc. | | | | | | | | |
| 4.49% (1 Month USD LIBOR + 325 bps) due 02/07/24 | | | 1,179,844 | | | | 1,184,622 | |
32 | THE GUGGENHEIM FUNDS ANNUAL REPORT | SEE NOTES TO FINANCIAL STATEMENTS. |
SCHEDULE OF INVESTMENTS (continued) | September 30, 2017 |
| HIGH YIELD FUND | |
| | | Face
Amount~ | | | Value | |
| | | | | | | |
| Invenergy Thermal Operating I, LLC | | | | | | |
| 6.83% (3 Month USD LIBOR + 550 bps) due 10/19/22 | | | 964,110 | | | $ | 915,905 | |
| Panda Power | | | | | | | | |
| 7.83% (3 Month USD LIBOR + 650 bps) due 08/21/20 | | | 975,726 | | | | 862,913 | |
| Exgen Texas Power LLC | | | | | | | | |
| 6.08% (3 Month USD LIBOR + 475 bps) due 09/18/21 | | | 1,344,814 | | | | 833,785 | |
| MRP Generation Holding | | | | | | | | |
| 8.33% (3 Month USD LIBOR + 700 bps) due 10/18/22 | | | 717,750 | | | | 671,096 | |
| Terraform AP Acquisition Holdings LLC | | | | | | | | |
| 5.58% (3 Month USD LIBOR + 425 bps) due 06/27/22 | | | 480,172 | | | | 488,575 | |
| Panda Temple II Power | | | | | | | | |
| 7.33% (3 Month USD LIBOR + 600 bps) due 04/03/19 | | | 511,101 | | | | 465,102 | |
| Stonewall | | | | | | | | |
| 6.83% (3 Month USD LIBOR + 550 bps) due 11/15/21 | | | 400,000 | | | | 376,000 | |
| Total Utilities | | | | | | | 10,856,968 | |
| | | | | | | | | |
| Energy - 1.2% | |
| Ultra Petroleum, Inc. | | | | | | | | |
| 4.31% (3 Month USD LIBOR + 300 bps) due 04/12/24 | | | 3,050,000 | | | | 3,042,376 | |
| Moss Creek Resources LLC | | | | | | | | |
9.50% (1 Month USD LIBOR + 800 bps) due 04/07/22†††,1 | | | 1,400,000 | | | | 1,382,500 | |
| Veresen Midstream LP | | | | | | | | |
| 4.74% (1 Month USD LIBOR + 350 bps) due 03/31/22 | | | 731,250 | | | | 736,734 | |
| Cactus Wellhead | | | | | | | | |
| 7.32% (3 Month USD LIBOR + 600 bps) due 07/31/20 | | | 683,923 | | | | 663,405 | |
| PSS Companies | | | | | | | | |
| 5.83% (3 Month USD LIBOR + 450 bps) due 01/28/20 | | | 528,563 | | | | 462,492 | |
| Summit Midstream Partners, LP | | | | | | | | |
| 7.24% (1 Month USD LIBOR + 600 bps) due 05/13/22 | | | 349,125 | | | | 353,489 | |
| Total Energy | | | | | | | 6,640,996 | |
| | | | | | | | | |
| Basic Materials - 1.0% | |
| A-Gas Ltd. | | | | | | | | |
6.06% (3 Month USD LIBOR + 475 bps) due 08/11/24†††,1 | | | 2,615,757 | | | | 2,564,485 | |
| EP Minerals LLC | | | | | | | | |
| 5.82% (3 Month USD LIBOR + 450 bps) due 08/20/20 | | | 1,598,926 | | | | 1,598,926 | |
| Big River Steel LLC | | | | | | | | |
| 6.33% (3 Month USD LIBOR + 500 bps) due 08/23/23 | | | 900,000 | | | | 909,000 | |
| PQ Corp. | | | | | | | | |
| 4.56% (3 Month USD LIBOR + 325 bps) due 11/04/22 | | | 346,507 | | | | 349,476 | |
| Total Basic Materials | | | | | | | 5,421,887 | |
| Total Senior Floating Rate Interests | | | | | | | | |
| (Cost $162,986,800) | | | | | | | 163,065,037 | |
| | | | | | | | | |
ASSET-BACKED SECURITIES†† - 1.4% | |
| Collateralized Loan Obligations - 1.4% | |
| OCP CLO Ltd. | | | | | | | | |
2014-6A, 6.25% (3 Month USD LIBOR + 495 bps) due 07/17/263,6 | | | 1,500,000 | | | | 1,457,765 | |
2014-6A, 4.95% (3 Month USD LIBOR + 365 bps) due 07/17/263,6 | | | 1,000,000 | | | | 1,001,002 | |
| Catamaran CLO Ltd. | | | | | | | | |
2014-1A, 5.81% (3 Month USD LIBOR + 450 bps) due 04/20/263,6 | | | 750,000 | | | | 710,234 | |
| WhiteHorse X Ltd. | | | | | | | | |
2015-10A, 6.60% (3 Month USD LIBOR + 530 bps) due 04/17/273,6 | | | 750,000 | | | | 687,205 | |
| WhiteHorse VII Ltd. | | | | | | | | |
2013-1A, 6.12% (3 Month USD LIBOR + 480 bps) due 11/24/253,6 | | | 600,000 | | | | 589,705 | |
| Eaton Vance CLO Ltd. | | | | | | | | |
2014-1A, 6.33% (3 Month USD LIBOR + 503 bps) due 07/15/263,6 | | | 600,000 | | | | 563,319 | |
| THL Credit Wind River CLO Ltd. | | | | | | | | |
2014-2A, 6.55% (3 Month USD LIBOR + 525 bps) due 07/15/263,6 | | | 500,000 | | | | 487,959 | |
| Regatta IV Funding Ltd. | | | | | | | | |
2014-1A, 6.26% (3 Month USD LIBOR + 495 bps) due 07/25/263,6 | | | 500,000 | | | | 487,618 | |
| Jamestown CLO III Ltd. | | | | | | | | |
2013-3A, 5.90% (3 Month USD LIBOR + 460 bps) due 01/15/263,6 | | | 500,000 | | | | 478,226 | |
| KVK CLO Ltd. | | | | | | | | |
2015-1A, 7.07% (3 Month USD LIBOR + 575 bps) due 05/20/273,6 | | | 500,000 | | | | 468,222 | |
| NewMark Capital Funding CLO Ltd. | | | | | | | | |
2014-2A, 5.96% (3 Month USD LIBOR + 480 bps) due 06/30/263,6 | | | 500,000 | | | | 465,725 | |
| MP CLO V Ltd. | | | | | | | | |
2014-1A, 7.20% (3 Month USD LIBOR + 590 bps) due 07/18/263,6 | | | 250,000 | | | | 230,004 | |
| Shackleton CLO | | | | | | | | |
2014-6A, 7.05% (3 Month USD LIBOR + 575 bps) due 07/17/263,6 | | | 250,000 | | | | 211,662 | |
| Total Collateralized Loan Obligations | | | | | | | 7,838,646 | |
| Total Asset-Backed Securities | | | | | | | | |
| (Cost $6,676,052) | | | | | | | 7,838,646 | |
| SEE NOTES TO FINANCIAL STATEMENTS. | THE GUGGENHEIM FUNDS ANNUAL REPORT | 33 |
SCHEDULE OF INVESTMENTS (continued) | September 30, 2017 |
| HIGH YIELD FUND | |
| | | Face
Amount~ | | | Value | |
| | | | | | | |
SENIOR FIXED RATE INTERESTS†† - 0.1% | |
| Consumer, Non-cyclical - 0.1% | |
| Hanger, Inc. | | | | | | |
| 11.50% due 08/01/19 | | | 575,000 | | | $ | 582,188 | |
| Total Senior Fixed Rate Interests | | | | | | | | |
| (Cost $567,799) | | | | | | | 582,188 | |
| | | | | | | | | |
| Total Investments - 105.4% | | | | | | | | |
| (Cost $591,504,934) | | | | | | $ | 598,658,761 | |
| Other Assets & Liabilities, net - (5.4)% | | | | | | | (30,838,945 | ) |
| Total Net Assets - 100.0% | | | | | | $ | 567,819,816 | |
FORWARD FOREIGN CURRENCY EXCHANGE CONTRACTS†† | |
| Counterparty | | Contracts to
Buy (Sell) | | Currency | Settlement
Date | | Settlement
Value | | | Value at
September 30,
2017 | | | Net Unrealized
Appreciation/
Depreciation | |
| Bank of America | | | (10,155,000 | ) | EUR | 10/12/17 | | $ | 12,170,331 | | | $ | 12,008,941 | | | $ | 161,390 | |
| Barclays | | | (2,265,000 | ) | CAD | 10/12/17 | | | 1,865,664 | | | | 1,815,389 | | | | 50,275 | |
| J.P. Morgan | | | 954,000 | | GBP | 10/12/17 | | | (1,290,975 | ) | | | (1,278,568 | ) | | | (12,407 | ) |
| Goldman Sachs | | | 1,218,000 | | EUR | 10/12/17 | | | (1,463,307 | ) | | | (1,440,363 | ) | | | (22,944 | ) |
| Barclays | | | (5,569,000 | ) | GBP | 10/12/17 | | | 7,342,592 | | | | 7,463,676 | | | | (121,084 | ) |
| | | | | | | | | | | | | | | | | $ | 55,230 | |
| ~ | The face amount is denominated in U.S. dollars unless otherwise indicated. |
| * | Non-income producing security. |
† | Value determined based on Level 1 inputs, unless otherwise noted — See Note 4. |
†† | Value determined based on Level 2 inputs, unless otherwise noted — See Note 4. |
††† | Value determined based on Level 3 inputs — See Note 4. |
1 | Security was fair valued by the Valuation Committee at September 30, 2017. The total market value of fair valued securities amounts to $14,151,019, (cost $15,248,419) or 2.5% of total net assets. |
2 | Affiliated issuer. |
3 | Variable rate security. Rate indicated is rate effective at September 30, 2017. |
4 | Perpetual maturity. |
5 | Rate indicated is the 7 day yield as of September 30, 2017. |
6 | Security is a 144A or Section 4(a)(2) security. These securities have been determined to be liquid under guidelines established by the Board of Trustees. The total market value of 144A or Section 4(a)(2) securities is $258,006,576 (cost $251,625,811), or 45.4% of total net assets. |
7 | All or a portion of this security is pledged as reversed repurchase agreements collateral at September 30, 2017 — See Note 6. |
8 | Security is a step up/step down bond. The coupon increases or decreases at regular intervals until the bond reaches full maturity. |
9 | Security is in default of interest and/or principal obligations. |
10 | Security is a 144A or Section 4(a)(2) security. These securities have been determined to be illiquid and restricted under guidelines established by the Board of Trustees. The total market value of 144A or Section 4(a)(2) illiquid and restricted securities is $21,717 (cost $139,296), or 0.0% of total net assets — See Note 10. |
11 | Term loan interests in the Fund's portfolio generally have variable rates. All or a portion of this security represents unsettled loan positions and may not have a stated coupon rate. |
12 | Security has a fixed rate coupon which will convert to a floating or variable rate coupon on a future date. |
13 | The underlying reference rate was negative at period end causing the effective rate to be equal to the spread amount listed. |
14 | This position was unsettled at period end. The underlying reference rate will not be applied to the effective rate until settlement occurs. |
15 | The effective rate shown is based on a weighted average of the underlying reference rates and spread amounts listed. |
| | CAD — Canadian Dollar |
| | EUR — Euro |
| | EURIBOR — European Interbank Offered Rate |
| | GBP — British Pound |
| | LIBOR — London Interbank Offered Rate |
| | plc — Public Limited Company |
| | |
| | See Sector Classification in Other Information section. |
34 | THE GUGGENHEIM FUNDS ANNUAL REPORT | SEE NOTES TO FINANCIAL STATEMENTS. |
SCHEDULE OF INVESTMENTS (continued) | September 30, 2017 |
| HIGH YIELD FUND | |
The following table summarizes the inputs used to value the Fund’s investments at September 30, 2017 (See Note 4 in the Notes to Financial Statements):
| Investments in Securities (Assets) | | Level 1
Quoted
Prices | | | Level 2
Significant
Observable
Inputs | | | Level 2 -
Other* | | | Level 3
Significant
Unobservable
Inputs | | | Total | |
| Asset Backed Securities | | $ | — | | | $ | 7,838,646 | | | $ | — | | | $ | — | | | $ | 7,838,646 | |
| Common Stocks | | | 1,250,761 | | | | 689,973 | | | | — | | | | 691,043 | | | | 2,631,777 | |
| Corporate Bonds | | | — | | | | 411,046,172 | | | | — | | | | 1,954,000 | | | | 413,000,172 | |
| Forward Foreign Currency Exchange Contracts | | | — | | | | — | | | | 211,665 | | | | — | | | | 211,665 | |
| Exchange-Traded Funds | | | 7,215,877 | | | | — | | | | — | | | | — | | | | 7,215,877 | |
| Money Market Fund | | | 1,425,125 | | | | — | | | | — | | | | — | | | | 1,425,125 | |
| Preferred Stocks | | | — | | | | 2,844,346 | | | | — | | | | — | | | | 2,844,346 | |
| Senior Fixed Rate Interests | | | — | | | | 582,188 | | | | — | | | | — | | | | 582,188 | |
| Senior Floating Rate Interests | | | — | | | | 151,553,898 | | | | — | | | | 11,511,139 | | | | 163,065,037 | |
| Warrants | | | 507 | | | | 55,086 | | | | — | | | | — | | | | 55,593 | |
| Total Assets | | $ | 9,892,270 | | | $ | 574,610,309 | | | $ | 211,665 | | | $ | 14,156,182 | | | $ | 598,870,426 | |
| | | | | | | | | | | | | | | | | | | | | |
| Investments in Securities (Liabilities) | | Level 1
Quoted
Prices | | | Level 2
Significant
Observable
Inputs | | | Level 2 -
Other* | | | Level 3
Significant
Unobservable
Inputs | | | Total | |
| Forward Foreign Currency Exchange Contracts | | $ | — | | | $ | — | | | $ | 156,435 | | | $ | — | | | $ | 156,435 | |
| Unfunded Loans (Note 9) | | | — | | | | — | | | | — | | | | 779,130 | | | | 779,130 | |
| Total Liabilities | | $ | — | | | $ | — | | | $ | 156,435 | | | $ | 779,130 | | | $ | 935,565 | |
| * | Other financial instruments include forward foreign currency exchange contracts, which are reported as unrealized gain/loss at period end. |
Transfers between investment levels may occur as the markets fluctuate and/or the availability of data used in an investment’s valuation changes. Transfers between valuation levels, if any, are in comparison to the valuation levels at the end of the previous fiscal year, and are effective using the fair value as of the end of the current fiscal period.
For the year ended September 30, 2017, High Yield Fund had securities with the total value $6,750,484 transfer out of Level 3 into Level 2 and securities with the total value of $500,161 transfer out of Level 2 into Level 3 due to change in securities valuation methods and availability of observable inputs. There were no other transfers between levels.
| SEE NOTES TO FINANCIAL STATEMENTS. | THE GUGGENHEIM FUNDS ANNUAL REPORT | 35 |
SCHEDULE OF INVESTMENTS (continued) | September 30, 2017 |
| HIGH YIELD FUND | |
Following is a reconciliation of Level 3 assets for which significant unobservable inputs were used to determine fair value for the period ended September 30, 2017:
LEVEL 3 - Fair value measurement using significant unobservable inputs
| | | Assets | | | | | | Liabilities |
| | | Senior Fixed Rate Interests | | | Senior
Floating Rate Interests | | | Common Stocks | | | Preferred Stocks | | | Corporate Bonds | | | Total
Assets | | | Unfunded
Loan Commitments | |
| HIGH YIELD FUND | | | | | | | | | | | | | | | | | | | | | |
| Beginning Balance | | $ | 80,401 | | | $ | 5,940,635 | | | $ | 1,029,981 | | | $ | 27,596 | | | $ | 4,465,758 | | | $ | 11,544,371 | | | $ | (1,141,424 | ) |
| Purchases/Fundings | | | 9,234 | | | | 11,944,295 | | | | 33,553 | | | | — | | | | 5,120,125 | | | | 17,107,207 | | | | 574,492 | |
| Sales, maturities and paydowns/Receipts | | | (66,733 | ) | | | (6,991,581 | ) | | | — | | | | — | | | | (962,378 | ) | | | (8,020,692 | ) | | | (727,539 | ) |
| Corporate actions | | | — | | | | — | | | | 427,339 | | | | — | | | | (427,339 | ) | | | — | | | | — | |
| Total realized gains or losses included in earnings | | | — | | | | (463,948 | ) | | | (403,453 | ) | | | — | | | | 21,138 | | | | (846,263 | ) | | | 304,032 | |
| Total change in unrealized gains or losses included in earnings | | | (22,902 | ) | | | 586,738 | | | | (401,538 | ) | | | (12,142 | ) | | | 471,726 | | | | 621,882 | | | | 211,309 | |
| Transfers into Level 3 | | | — | | | | 495,000 | | | | 5,161 | | | | — | | | | — | | | | 500,161 | | | | — | |
| Transfers out of Level 3 | | | — | | | | — | | | | — | | | | (15,454 | ) | | | (6,735,030 | ) | | | (6,750,484 | ) | | | — | |
| Ending Balance | | $ | — | | | $ | 11,511,139 | | | $ | 691,043 | | | $ | — | | | $ | 1,954,000 | | | $ | 14,156,182 | | | $ | (779,130 | ) |
| Net Change in unrealized appreciation (depreciation) for investments in securities still held at September 30, 2017 | | $ | — | | | $ | 53,858 | | | $ | (801,814 | ) | | $ | — | | | $ | (5,876 | ) | | $ | (753,832 | ) | | $ | 284,174 | |
The following is a summary of significant unobservable inputs used in the fair valuation of assets and liabilities categorized within Level 3 of the fair value hierarchy:
| Category | | Level 3 | | Valuation Technique | Unobservable
Inputs | | Input
Values | |
| Assets: | | | | | | | | |
| Common Stocks | | $ | 685,882 | | Enterprise Value | Valuation Multiple | | | 7.5x-9.1 | x |
| Common Stocks | | | 5,161 | | Option Adjusted Spread off the prior month end broker mark over the 3 month LIBOR | Indicative Quote | | | — | |
| Corporate Bonds | | | 1,954,000 | | Model Price | Market Comparable
Yields | | | 9.00 | % |
| Senior Floating Rate Interests | | | 10,128,639 | | Model Price | Purchase Price | | | — | |
| Senior Floating Rate Interests | | | 1,382,500 | | Model Price | Trade Price | | | — | |
| Total Assets | | $ | 14,156,182 | | | | | | | |
| Liabilities: | | | | | | | | | | |
| Unfunded Loan Commitments | | $ | 779,130 | | Model Price | Purchase Price | | | — | |
Any remaining Level 3 securities held by the Funds and excluded from the tables above, were not considered material to the Funds.
36 | THE GUGGENHEIM FUNDS ANNUAL REPORT | SEE NOTES TO FINANCIAL STATEMENTS. |
SCHEDULE OF INVESTMENTS (concluded) | September 30, 2017 |
| HIGH YIELD FUND | |
Affiliated Transactions
Investments representing 5% or more of the outstanding voting shares of a portfolio company of a fund, or control of or by, or common control under GI, result in that portfolio company being considered an affiliated company of such fund, as defined in the 1940 Act.
The Funds may invest in the Guggenheim Strategy Funds Trust consisting of Guggenheim Strategy Fund I, Guggenheim Strategy Fund II, Guggenheim Strategy Fund III, and Guggenheim Variable Insurance Strategy Fund III (collectively, the “Cash Management Funds”), open-end management investment companies managed by GI. The Cash Management Funds, which launched on March 11, 2014, are offered as cash management options only to mutual funds, trusts, and other accounts managed by GI and/or its affiliates, and are not available to the public. The Cash Management Funds pay no investment management fees. The Cash Management Funds’ annual report on Form N-CSR dated September 30, 2016, is available publicly or upon request. This information is available from the EDGAR database on the SEC’s website at https://www.sec.gov/Archives/edgar/data/1601445/000089180416001923/gug65857-ncsr.htm.
Transactions during the year ended September 30, 2017, in which the portfolio company is an “affiliated person”, were as follows:
| Security Name | | Value 09/30/16 | | | Additions | | | Reductions | | | Corporate
Actions | | | Realized Gain (Loss) | | | Change in Unrealized | | | Value 09/30/17 | | | Face
Amount 09/30/17 | | | Investment Income | |
| Aspect Software Parent, Inc. | | $ | 1,010,571 | | | $ | 33,552 | | | $ | — | | | $ | 427,339 | | | $ | — | | | $ | (805,247 | ) | | $ | 666,215 | | | | 64,681 | | | $ | — | |
| Aspect Software, Inc. 3.00% due 05/25/23 | | | 351,942 | | | | — | | | | — | | | | (427,339 | ) | | | — | | | | 75,397 | | | | — | | | | — | | | | — | |
| Aspect Software, Inc. 10.50% due 05/25/20 | | | 655,133 | | | | — | | | | (16,357 | ) | | | — | | | | — | | | | 6,713 | | | | 645,489 | | | | 656,151 | | | | 78,536 | |
| Targus Group International Equity, Inc | | | 19,330 | | | | — | | | | — | | | | — | | | | — | | | | 337 | | | | 19,667 | | | | 13,240 | | | | — | |
| Targus Group International, Inc. 7.50% due 12/31/19 | | | 80,401 | | | | 9,234 | | | | (71,439 | ) | | | — | | | | — | | | | (18,196 | ) | | | — | | | | — | | | | 9,166 | |
| Targus Group International, Inc. due 05/24/16 | | | — | | | | — | | | | — | | | | — | | | | — | | | | — | | | | — | | | | 153,489 | | | | — | |
| | | $ | 2,117,377 | | | $ | 42,786 | | | $ | (87,796 | ) | | $ | — | | | $ | — | | | $ | (740,996 | ) | | $ | 1,331,371 | | | | | | | $ | 87,702 | |
| SEE NOTES TO FINANCIAL STATEMENTS. | THE GUGGENHEIM FUNDS ANNUAL REPORT | 37 |
| STATEMENT OF ASSETS AND LIABILITIES |
| September 30, 2017 |
| Assets: | |
| Investments in unaffiliated issuers, at value (cost $589,005,669) | | $ | 597,327,390 | |
| Investments in affiliated issuers, at value (cost $2,499,265) | | | 1,331,371 | |
| Foreign currency, at value (cost $1,375,580) | | | 1,372,601 | |
| Cash | | | 534,038 | |
| Unrealized appreciation on forward foreign currency exchange contracts | | | 211,665 | |
| Prepaid expenses | | | 68,704 | |
| Receivables: | |
| Interest | | | 8,214,547 | |
| Securities sold | | | 3,688,443 | |
| Fund shares sold | | | 2,027,085 | |
| Foreign taxes reclaim | | | 33,598 | |
| Dividends | | | 8,806 | |
| Total assets | | | 614,818,248 | |
| | | | | |
| Liabilities: | |
| Unfunded loan commitments, at value (Note 9) (proceeds $1,535,293) | | | 779,130 | |
| Reverse Repurchase Agreements | | | 18,118,843 | |
| Unrealized depreciation on forward foreign currency exchange contracts | | | 156,435 | |
| Payable for: | |
| Securities purchased | | | 25,344,048 | |
| Fund shares redeemed | | | 1,974,145 | |
| Management fees | | | 242,768 | |
| Dividends distributed | | | 156,794 | |
| Distribution and service fees | | | 53,850 | |
| Fund accounting/administration fees | | | 36,922 | |
| Transfer agent/maintenance fees | | | 16,578 | |
| Interest from reverse repurchase agreements | | | 9,646 | |
| Trustees’ fees* | | | 1,206 | |
| Miscellaneous | | | 108,067 | |
| Total liabilities | | | 46,998,432 | |
| Net assets | | $ | 567,819,816 | |
| | | | | |
| Net assets consist of: | |
| Paid in capital | | $ | 562,496,288 | |
| Accumulated net investment loss | | | (832,460 | ) |
| Accumulated net realized loss on investments | | | (1,832,924 | ) |
| Net unrealized appreciation on investments | | | 7,988,912 | |
| Net assets | | $ | 567,819,816 | |
| | | | | |
| A-Class: | |
| Net assets | | $ | 126,097,117 | |
| Capital shares outstanding | | | 10,961,344 | |
| Net asset value per share | | $ | 11.50 | |
| Maximum offering price per share (Net asset value divided by 96.00%) | | $ | 11.98 | |
| | | | | |
| C-Class: | |
| Net assets | | $ | 30,460,601 | |
| Capital shares outstanding | | | 2,626,016 | |
| Net asset value per share | | $ | 11.60 | |
| | | | | |
| P-Class: | |
| Net assets | | $ | 16,882,836 | |
| Capital shares outstanding | | | 1,466,872 | |
| Net asset value per share | | $ | 11.51 | |
| | | | | |
| Institutional Class: | |
| Net assets | | $ | 194,280,133 | |
| Capital shares outstanding | | | 20,712,992 | |
| Net asset value per share | | $ | 9.38 | |
| | | | | |
| R6-Class**: | |
| Net assets | | $ | 200,099,129 | |
| Capital shares outstanding | | | 17,414,934 | |
| Net asset value per share | | $ | 11.49 | |
| * | Relates to Trustees not deemed “interested persons” within the meaning of Section 2(a)(19) of the 1940 Act. |
| ** | Since commencement of operations: May 15, 2017. |
38 | THE GUGGENHEIM FUNDS ANNUAL REPORT | SEE NOTES TO FINANCIAL STATEMENTS. |
| STATEMENT OF OPERATIONS |
| Year Ended September 30, 2017 |
| Investment Income: | |
| Dividends from securities of unaffiliated issuers | | $ | 377,166 | |
| Interest from securities of affiliated issuers | | | 87,702 | |
| Interest | | | 25,824,156 | |
| Total investment income | | | 26,289,024 | |
| | | | | |
| Expenses: | |
| Management fees | | | 2,310,471 | |
| Distribution and service fees: | |
| A-Class | | | 273,127 | |
| C-Class | | | 287,912 | |
| P-Class | | | 29,229 | |
| Transfer agent/maintenance fees: | |
| A-Class | | | 87,755 | |
| C-Class | | | 28,428 | |
| P-Class | | | 16,122 | |
| Institutional Class | | | 90,254 | |
| R6-Class** | | | 50 | |
| Interest expense | | | 406,505 | |
| Fund accounting/administration fees | | | 308,503 | |
| Recoupment of previously waived fees: | |
| A-Class | | | 96,745 | |
| C-Class | | | 17,894 | |
| P-Class | | | 168 | |
| Institutional Class | | | 4,457 | |
| Line of credit fees | | | 61,483 | |
| Custodian fees | | | 30,368 | |
| Trustees’ fees* | | | 10,674 | |
| Miscellaneous | | | 258,329 | |
| Total expenses | | | 4,318,474 | |
| Less: | |
| Expenses waived by Adviser | | | (31,400 | ) |
| Expenses reimbursed by Adviser: | | | | |
| A-Class | | | (10,239 | ) |
| C-Class | | | (1,922 | ) |
| P-Class | | | (5,907 | ) |
| Institutional Class | | | (989 | ) |
| Total waived/reimbursed expenses | | | (50,457 | ) |
| Net expenses | | | 4,268,017 | |
| Net investment income | | | 22,021,007 | |
| | | | | |
| Net Realized and Unrealized Gain (Loss): | |
| Net realized gain (loss) on: | |
| Investments in unaffiliated issuers | | | 3,582,292 | |
| Foreign currency transactions | | | (119,335 | ) |
| Forward currency exchange contracts | | | (677,624 | ) |
| Net realized gain | | | 2,785,333 | |
| Net change in unrealized appreciation (depreciation) on: | |
| Investments in unaffiliated issuers | | | 6,858,823 | |
| Investments in affiliated issuers | | | (740,996 | ) |
| Foreign currency translations | | | 27,873 | |
| Forward foreign currency exchange contracts | | | (28,410 | ) |
Net change in unrealized appreciation
(depreciation) | | | 6,117,290 | |
| Net realized and unrealized gain | | | 8,902,623 | |
| Net increase in net assets resulting from operations | | $ | 30,923,630 | |
| * | Relates to Trustees not deemed “interested persons” within the meaning of Section 2(a)(19) of the 1940 Act. |
| ** | Since commencement of operations: May 15, 2017. |
| SEE NOTES TO FINANCIAL STATEMENTS. | THE GUGGENHEIM FUNDS ANNUAL REPORT | 39 |
| STATEMENTS OF CHANGES IN NET ASSETS |
| | | Year Ended
September 30,
2017 | | | Year Ended
September 30,
2016 | |
| Increase (Decrease) in Net Assets from Operations: | | | | | | |
| Net investment income | | $ | 22,021,007 | | | $ | 13,635,030 | |
| Net realized gain (loss) on investments | | | 2,785,333 | | | | (3,898,866 | ) |
| Net change in unrealized appreciation (depreciation) on investments | | | 6,117,290 | | | | 16,190,861 | |
| Net increase in net assets resulting from operations | | | 30,923,630 | | | | 25,927,025 | |
| | | | | | | | | |
| Distributions to shareholders from: | | | | | | | | |
| Net investment income | | | | | | | | |
| A-Class | | | (6,233,282 | ) | | | (5,021,892 | ) |
| C-Class | | | (1,438,731 | ) | | | (1,046,425 | ) |
| P-Class | | | (655,980 | ) | | | (86,534 | ) |
| Institutional Class | | | (10,719,166 | ) | | | (8,343,089 | ) |
| R6-Class | | | (3,230,684 | ) | | | — | |
| Total distributions to shareholders | | | (22,277,843 | ) | | | (14,497,940 | ) |
| | | | | | | | | |
| Capital share transactions: | | | | | | | | |
| Proceeds from sale of shares | | | | | | | | |
| A-Class | | | 66,562,198 | | | | 38,862,308 | |
| C-Class | | | 9,648,007 | | | | 15,767,122 | |
| P-Class | | | 19,110,632 | | | | 3,039,848 | |
| Institutional Class | | | 188,107,688 | | | | 132,721,401 | |
| R6-Class* | | | 210,426,419 | | | | — | |
| Redemption fees collected | | | | | | | | |
| A-Class | | | 36,722 | | | | 58,517 | |
| C-Class | | | 9,668 | | | | 11,173 | |
| P-Class | | | 4,063 | | | | 214 | |
| Institutional Class | | | 60,375 | | | | 67,613 | |
| R6-Class* | | | 13,490 | | | | — | |
| Distributions reinvested | | | | | | | | |
| A-Class | | | 5,420,947 | | | | 4,590,806 | |
| C-Class | | | 1,180,598 | | | | 831,218 | |
| P-Class | | | 655,980 | | | | 86,534 | |
| Institutional Class | | | 8,878,248 | | | | 7,079,015 | |
| R6-Class* | | | 3,230,684 | | | | — | |
| Cost of shares redeemed | | | | | | | | |
| A-Class | | | (35,911,466 | ) | | | (32,283,621 | ) |
| C-Class | | | (8,147,384 | ) | | | (4,511,046 | ) |
| P-Class | | | (6,298,525 | ) | | | (161,209 | ) |
| Institutional Class | | | (149,297,447 | ) | | | (80,676,896 | ) |
| R6-Class* | | | (13,513,200 | ) | | | — | |
| Net increase from capital share transactions | | | 300,177,697 | | | | 85,482,997 | |
| Net increase in net assets | | | 308,823,484 | | | | 96,912,082 | |
| | | | | | | | | |
| Net assets: | | | | | | | | |
| Beginning of year | | | 258,996,332 | | | | 162,084,250 | |
| End of year | | $ | 567,819,816 | | | $ | 258,996,332 | |
| Accumulated net investment loss at end of year | | $ | (832,460 | ) | | $ | (37,049 | ) |
40 | THE GUGGENHEIM FUNDS ANNUAL REPORT | SEE NOTES TO FINANCIAL STATEMENTS. |
STATEMENTS OF CHANGES IN NET ASSETS (concluded) |
| | | Year Ended
September 30,
2017 | | | Year Ended
September 30,
2016 | |
| Capital share activity: | | | | | | |
| Shares sold | | | | | | |
| A-Class | | | 5,842,629 | | | | 3,698,743 | |
| C-Class | | | 839,412 | | | | 1,482,332 | |
| P-Class | | | 1,676,374 | | | | 290,517 | |
| Institutional Class | | | 20,277,090 | | | | 15,474,086 | |
| R6-Class* | | | 18,310,251 | | | | — | |
| Shares issued from reinvestment of distributions | | | | | | | | |
| A-Class | | | 475,619 | | | | 431,226 | |
| C-Class | | | 102,774 | | | | 77,164 | |
| P-Class | | | 57,411 | | | | 8,117 | |
| Institutional Class | | | 955,818 | | | | 813,446 | |
| R6-Class* | | | 284,121 | | | | — | |
| Shares redeemed | | | | | | | | |
| A-Class | | | (3,154,231 | ) | | | (3,117,471 | ) |
| C-Class | | | (709,632 | ) | | | (422,663 | ) |
| P-Class | | | (551,450 | ) | | | (14,985 | ) |
| Institutional Class | | | (16,097,185 | ) | | | (9,241,452 | ) |
| R6-Class* | | | (1,179,438 | ) | | | — | |
| Net increase in shares | | | 27,129,563 | | | | 9,479,060 | |
| * | Since commencement of operations: May 15, 2017. |
| SEE NOTES TO FINANCIAL STATEMENTS. | THE GUGGENHEIM FUNDS ANNUAL REPORT | 41 |
This table is presented to show selected data for a share outstanding throughout each period and to assist shareholders in evaluating a Fund’s performance for the periods presented.
| A-Class | | Year Ended
September 30,
2017 | | | Year Ended
September 30,
2016 | | | Year Ended
September 30,
2015 | | | Year Ended
September 30,
2014 | | | Year Ended
September 30,
2013 | |
| Per Share Data | | | | | | | | | | | | | | | |
| Net asset value, beginning of period | | $ | 11.16 | | | $ | 10.79 | | | $ | 12.02 | | | $ | 11.85 | | | $ | 11.95 | |
| Income (loss) from investment operations: | |
Net investment income (loss)a | | | .64 | | | | .67 | | | | .69 | | | | .72 | | | | .81 | |
| Net gain (loss) on investments (realized and unrealized) | | | .35 | | | | .41 | | | | (.97 | ) | | | .27 | | | | .27 | |
| Total from investment operations | | | .99 | | | | 1.08 | | | | (.28 | ) | | | .99 | | | | 1.08 | |
| Less distributions from: | |
| Net investment income | | | (.65 | ) | | | (.72 | ) | | | (.74 | ) | | | (.83 | ) | | | (.90 | ) |
| Net realized gains | | | — | | | | — | | | | (.22 | ) | | | — | | | | (.29 | ) |
| Total distributions | | | (.65 | ) | | | (.72 | ) | | | (.96 | ) | | | (.83 | ) | | | (1.19 | ) |
| Redemption fees collected | | | — | e | | | .01 | | | | .01 | | | | .01 | | | | .01 | |
| Net asset value, end of period | | $ | 11.50 | | | $ | 11.16 | | | $ | 10.79 | | | $ | 12.02 | | | $ | 11.85 | |
| | |
Total Returnb | | | 9.11 | % | | | 10.71 | % | | | (2.40 | %) | | | 9.18 | % | | | 9.54 | % |
| Ratios/Supplemental Data | |
| Net assets, end of period (in thousands) | | $ | 126,097 | | | $ | 87,045 | | | $ | 73,236 | | | $ | 82,854 | | | $ | 70,451 | |
| Ratios to average net assets: | |
| Net investment income (loss) | | | 5.63 | % | | | 6.32 | % | | | 6.01 | % | | | 5.91 | % | | | 6.84 | % |
Total expensesc | | | 1.31 | % | | | 1.25 | % | | | 1.27 | % | | | 1.32 | % | | | 1.41 | % |
Net expensesd,h | | | 1.29 | %i | | | 1.23 | % | | | 1.20 | % | | | 1.26 | % | | | 1.18 | % |
| Portfolio turnover rate | | | 62 | % | | | 55 | % | | | 72 | % | | | 97 | % | | | 101 | % |
| C-Class | | Year Ended
September 30,
2017 | | | Year Ended
September 30,
2016 | | | Year Ended
September 30,
2015 | | | Year Ended
September 30,
2014 | | | Year Ended
September 30,
2013 | |
| Per Share Data | | | | | | | | | | | | | | | |
| Net asset value, beginning of period | | $ | 11.26 | | | $ | 10.88 | | | $ | 12.12 | | | $ | 11.95 | | | $ | 12.03 | |
| Income (loss) from investment operations: | |
Net investment income (loss)a | | | .56 | | | | .60 | | | | .61 | | | | .63 | | | | .73 | |
| Net gain (loss) on investments (realized and unrealized) | | | .35 | | | | .41 | | | | (.98 | ) | | | .27 | | | | .27 | |
| Total from investment operations | | | .91 | | | | 1.01 | | | | (.37 | ) | | | .90 | | | | 1.00 | |
| Less distributions from: | |
| Net investment income | | | (.57 | ) | | | (.64 | ) | | | (.66 | ) | | | (.74 | ) | | | (.80 | ) |
| Net realized gains | | | — | | | | — | | | | (.22 | ) | | | — | | | | (.29 | ) |
| Total distributions | | | (.57 | ) | | | (.64 | ) | | | (.88 | ) | | | (.74 | ) | | | (1.09 | ) |
| Redemption fees collected | | | — | e | | | .01 | | | | .01 | | | | .01 | | | | .01 | |
| Net asset value, end of period | | $ | 11.60 | | | $ | 11.26 | | | $ | 10.88 | | | $ | 12.12 | | | $ | 11.95 | |
| | |
Total Returnb | | | 8.38 | % | | | 9.81 | % | | | (3.14 | %) | | | 8.46 | % | | | 8.69 | % |
| Ratios/Supplemental Data | |
| Net assets, end of period (in thousands) | | $ | 30,461 | | | $ | 26,941 | | | $ | 13,671 | | | $ | 14,674 | | | $ | 9,463 | |
| Ratios to average net assets: | |
| Net investment income (loss) | | | 4.92 | % | | | 5.52 | % | | | 5.25 | % | | | 5.14 | % | | | 6.10 | % |
Total expensesc | | | 2.05 | % | | | 2.01 | % | | | 2.01 | % | | | 2.09 | % | | | 2.17 | % |
Net expensesd,h | | | 2.03 | %i | | | 1.98 | % | | | 1.95 | % | | | 2.01 | % | | | 1.93 | % |
| Portfolio turnover rate | | | 62 | % | | | 55 | % | | | 72 | % | | | 97 | % | | | 101 | % |
42 | THE GUGGENHEIM FUNDS ANNUAL REPORT | SEE NOTES TO FINANCIAL STATEMENTS. |
FINANCIAL HIGHLIGHTS (continued) |
This table is presented to show selected data for a share outstanding throughout each period and to assist shareholders in evaluating a Fund’s performance for the periods presented.
| P-Class | | Year Ended
September 30,
2017 | | | Year Ended
September 30,
2016 | | | Period Ended
September 30,
2015f | |
| Per Share Data | | | | | | | | | |
| Net asset value, beginning of period | | $ | 11.17 | | | $ | 10.80 | | | $ | 11.53 | |
| Income (loss) from investment operations: | |
Net investment income (loss)a | | | .64 | | | | .67 | | | | .27 | |
| Net gain (loss) on investments (realized and unrealized) | | | .37 | | | | .42 | | | | (.73 | ) |
| Total from investment operations | | | 1.01 | | | | 1.09 | | | | (.46 | ) |
| Less distributions from: | |
| Net investment income | | | (.67 | ) | | | (.72 | ) | | | (.27 | ) |
| Total distributions | | | (.67 | ) | | | (.72 | ) | | | (.27 | ) |
| Redemption fees collected | | | — | e | | | — | e | | | — | e |
| Net asset value, end of period | | $ | 11.51 | | | $ | 11.17 | | | $ | 10.80 | |
| | |
Total Returnb | | | 9.24 | % | | | 10.74 | % | | | (4.06 | %) |
| Ratios/Supplemental Data | |
| Net assets, end of period (in thousands) | | $ | 16,883 | | | $ | 3,178 | | | $ | 10 | |
| Ratios to average net assets: | |
| Net investment income (loss) | | | 5.58 | % | | | 6.20 | % | | | 5.76 | % |
Total expensesc | | | 1.29 | % | | | 1.17 | % | | | 3.36 | % |
Net expensesd,h | | | 1.22 | %i | | | 1.17 | % | | | 1.19 | % |
| Portfolio turnover rate | | | 62 | % | | | 55 | % | | | 72 | % |
| Institutional Class | | Year Ended
September 30,
2017 | | | Year Ended
September 30,
2016 | | | Year Ended
September 30,
2015 | | | Year Ended
September 30,
2014 | | | Year Ended
September 30,
2013 | |
| Per Share Data | | | | | | | | | | | | | | | |
| Net asset value, beginning of period | | $ | 9.11 | | | $ | 8.81 | | | $ | 9.87 | | | $ | 9.74 | | | $ | 9.90 | |
| Income (loss) from investment operations: | |
Net investment income (loss)a | | | .56 | | | | .58 | | | | .58 | | | | .61 | | | | .70 | |
| Net gain (loss) on investments (realized and unrealized) | | | .28 | | | | .34 | | | | (.79 | ) | | | .23 | | | | .22 | |
| Total from investment operations | | | .84 | | | | .92 | | | | (.21 | ) | | | .84 | | | | .92 | |
| Less distributions from: | |
| Net investment income | | | (.57 | ) | | | (.62 | ) | | | (.64 | ) | | | (.72 | ) | | | (.80 | ) |
| Net realized gains | | | — | | | | — | | | | (.22 | ) | | | — | | | | (.29 | ) |
| Total distributions | | | (.57 | ) | | | (.62 | ) | | | (.86 | ) | | | (.72 | ) | | | (1.09 | ) |
| Redemption fees collected | | | — | e | | | — | e | | | .01 | | | | .01 | | | | .01 | |
| Net asset value, end of period | | $ | 9.38 | | | $ | 9.11 | | | $ | 8.81 | | | $ | 9.87 | | | $ | 9.74 | |
| | |
Total Returnb | | | 9.56 | % | | | 10.95 | % | | | (2.21 | %) | | | 9.50 | % | | | 9.97 | % |
| Ratios/Supplemental Data | |
| Net assets, end of period (in thousands) | | $ | 194,280 | | | $ | 141,833 | | | $ | 75,167 | | | $ | 36,880 | | | $ | 18,755 | |
| Ratios to average net assets: | |
| Net investment income (loss) | | | 6.00 | % | | | 6.58 | % | | | 6.21 | % | | | 6.12 | % | | | 7.12 | % |
Total expensesc | | | 0.94 | % | | | 0.95 | % | | | 0.94 | % | | | 1.01 | % | | | 1.01 | % |
Net expensesd,h | | | 0.93 | %i | | | 0.94 | % | | | 0.94 | % | | | 1.01 | % | | | 0.93 | % |
| Portfolio turnover rate | | | 62 | % | | | 55 | % | | | 72 | % | | | 97 | % | | | 101 | % |
| SEE NOTES TO FINANCIAL STATEMENTS. | THE GUGGENHEIM FUNDS ANNUAL REPORT | 43 |
FINANCIAL HIGHLIGHTS (concluded) |
This table is presented to show selected data for a share outstanding throughout each period and to assist shareholders in evaluating a Fund’s performance for the period presented.
| R6-Class | | Period Ended
September 30,
2017g | |
| Per Share Data | | | |
| Net asset value, beginning of period | | $ | 11.45 | |
| Income (loss) from investment operations: | |
Net investment income (loss)a | | | .24 | |
| Net gain (loss) on investments (realized and unrealized) | | | .04 | |
| Total from investment operations | | | 0.28 | |
| Less distributions from: | |
| Net investment income | | | (.24 | ) |
| Net realized gains | | | — | |
| Total distributions | | | (.24 | ) |
| Redemption fees collected | | | — | e |
| Net asset value, end of period | | $ | 11.49 | |
| | |
Total Returnb | | | 2.49 | % |
| Ratios/Supplemental Data | |
| Net assets, end of period (in thousands) | | $ | 200,099 | |
| Ratios to average net assets: | |
| Net investment income (loss) | | | 5.41 | % |
Total expensesc | | | 0.82 | % |
Net expensesd,h | | | 0.82 | % |
| Portfolio turnover rate | | | 62 | % |
a | Net investment income (loss) per share was computed using average shares outstanding throughout the period. |
b | Total return does not reflect the impact of any applicable sales charges and has not been annualized. |
c | Does not include expenses of the underlying funds in which the Fund invests. |
d | Net expense information reflects the expense ratios after expense waivers. |
e | Redemption fees collected are less than $0.01 per share. |
f | Since commencement of operations: May 1, 2015. Percentage amounts for the period, except total return and portfolio turnover rate, have been annualized. |
g | Since commencement of operations: May 15, 2017. Percentage amounts for the period, except total return and portfolio turnover rate, have been annualized |
h | Net expenses may include expenses that are excluded from the expense limitation agreement. Excluding these expenses, the operating expense ratios for the years would be: |
| | | 09/30/17 | 09/30/16 | 09/30/15 | 09/30/14 |
| | A-Class | 1.15% | 1.16% | 1.16% | 1.16% |
| | C-Class | 1.89% | 1.91% | 1.91% | 1.91% |
| | P-Class | 1.08% | 1.09% | 1.16% | N/A |
| | Institutional Class | 0.79% | 0.87% | 0.91% | 0.91% |
| | R6-Class | 0.79% | N/A | N/A | N/A |
i | The portion of the ratios of net expenses to average net assets attributable to recoupments of prior fee reductions of expense reimbursements is 0.09% for A-Class, 0.06% for C-Class, 0.00% for P-Class, and 0.00% Institutional Class. |
44 | THE GUGGENHEIM FUNDS ANNUAL REPORT | SEE NOTES TO FINANCIAL STATEMENTS. |
MANAGERS’ COMMENTARY (Unaudited) | September 30, 2017 |
To Our Shareholders
Guggenheim Investment Grade Bond Fund (the “Fund”) is managed by a team of seasoned professionals, including B. Scott Minerd, Chairman of Investments and Global Chief Investment Officer; Anne B. Walsh, Senior Managing Director and Assistant Chief Investment Officer; James W. Michal, Senior Managing Director and Portfolio Manager; Steven H. Brown, Managing Director and Portfolio Manager; and Adam Bloch, Director and Portfolio Manager. In the following paragraphs, the investment team discusses the market environment and the Fund’s performance for the fiscal year ended September 30, 2017.
For the one-year period ended September 30, 2017, Guggenheim Investment Grade Bond Fund returned 3.39%1, compared with the 0.07% return of its benchmark, the Bloomberg Barclays U.S. Aggregate Bond Index.
The Fund seeks to provide current income. The Fund pursues its investment objective by investing primarily in high-quality, investment-grade fixed-income securities across multiple sectors. The Fund employs a tactical sector allocation strategy, offering the opportunity to capitalize on total return potential created by changing market conditions.
In June 2017, the U.S. Federal Reserve (the “Fed”) delivered its fourth rate hike since the financial crisis, raising the fed funds rate target range to 1.00–1.25%. We anticipate over time the yield curve will bear flatten (the condition in which short-term rates rise faster than long-term rates). The Fund therefore maintained its “barbell” approach to duration management. Over half of the Portfolio had a floating rate based on LIBOR at period end. At the other end of the “barbell” are longer-term debt, with higher yields and higher credit quality. The strategy continued to employ fixed to floating swaps to reduce key rate exposure at the short and intermediate parts of the curve, which we believe may be vulnerable as the curve flattens.
The Fund rotated into higher quality assets and increased cash as market valuations signaled caution. Given spread tightening, the Fund moved up in credit quality and reduced its targets for below investment grade over the period. The allocation to high yield was materially reduced over the period. This was not due to the default cycle, but rather current valuation.
The Fund’s positive returns were largely attributable to the tightening of credit spreads and the Fund’s carry; losses attributable to the increase in interest rates over the period were mitigated by the Fund maintaining low duration over the period.
The Fund also uses derivatives to hedge against changes in interest rates and foreign asset exposure. For the period, returns from derivatives were negligible.
During the period, the Fund’s positive returns were largely driven by investments in collateralized loan obligations (“CLOs”), non-agency residential mortgage-backed securities (“NA-RMBS”) and preferred stocks (“preferred”).
CLOs offered attractive risk-adjusted returns. The Fund favored less credit risk and spread duration, specifically the shorter and higher-quality tranches. Investment-grade CLOs offered spread pickup versus investment-grade corporate bonds.
NA RMBS holdings were a positive contributor due to carry as well as price appreciation. Prices appreciated from spread tightening and improving market expectations for future cash flows. Impact from curve flattening was mitigated given the floating and low duration characteristics of the NA RMBS holdings.
The preferred sector continues to outperform the broader corporate market driven by continued demand for yield and a lack of supply from the domestic U.S. banks. We believe the technical backdrop remains positive for preferreds and have a preference for fixed-to-float preferreds with higher back-ends to provide protection if the securities extend past the call date.
The Fund invests excess cash into the Guggenheim Strategy Funds which, in turn, invest in a diversified portfolio of debt securities and financial instruments providing exposure to fixed income markets. The investment objective of the Guggenheim Strategy Funds is to seek a high level of income consistent with the preservation of capital. For the one -year period ended September 30, 2017, investment in the Guggenheim Strategy Funds has benefited Fund performance relative to investing in other short-term investments.
| | THE GUGGENHEIM FUNDS ANNUAL REPORT | 45 |
MANAGERS’ COMMENTARY (Unaudited)(concluded) | September 30, 2017 |
Performance displayed represents past performance which is no guarantee of future results.
1 | Performance figures are based on Class A shares and do not reflect deduction of the sales charges or taxes that a shareholder would pay on distributions or the redemption of shares. |
The opinions and forecast expressed may not actually come to pass. This information is subject to change at any time, based on market and other conditions, and should not be construed as a recommendation of any specific security or strategy.
| 46 | THE GUGGENHEIM FUNDS ANNUAL REPORT | |
PERFORMANCE REPORT AND FUND PROFILE (Unaudited) | September 30, 2017 |
INVESTMENT GRADE BOND FUND
OBJECTIVE: Seeks to provide current income.
Holdings Diversification (Market Exposure as % of Net Assets)
“Holdings Diversification (Market Exposure as % of Net Assets)” excludes any temporary cash investments.
Portfolio Composition by Quality Rating1 |
| Rating | |
| Fixed Income Instruments | |
| AAA | 33.2% |
| AA | 16.8% |
| A | 19.6% |
| BBB | 18.0% |
| BB | 1.0% |
| B | 2.3% |
| CCC | 1.6% |
| CC | 0.1% |
| C | 0.6% |
NR2 | 5.7% |
| Other Instruments | 1.1% |
| Total Investments | 100.0% |
| The chart above reflects percentages of the value of total investments. |
| Inception Dates: |
| A-Class | August 15, 1985 |
| C-Class | May 1, 2000 |
| P-Class | May 1, 2015 |
| Institutional Class | January 29, 2013 |
| Ten Largest Holdings (% of Total Net Assets) |
| U.S. Treasury Bond, 11/15/44 | 4.7% |
| U.S. Treasury Bond, 11/15/46 | 3.4% |
| Anchorage Credit Funding Ltd., 3.50% | 1.0% |
| Fortress Credit Opportunities III CLO, LP, 2.95% | 1.0% |
| Golub Capital Partners CLO Ltd., 3.80% | 1.0% |
| Station Place Securitization Trust, 2.14% | 0.9% |
| Bank of America Corp., 6.30% | 0.9% |
| Freddie Mac Multifamily Structured Pass Through Certificates, 3.02% | 0.8% |
| Capital Automotive LLC, 3.87% | 0.8% |
| Fortress Credit Opportunities VII CLO Ltd., 3.37% | 0.8% |
| Top Ten Total | 15.3% |
| “Ten Largest Holdings” excludes any temporary cash or derivative investments. |
1 | Source: BlackRock Solutions. Credit quality ratings are measured on a scale that generally ranges from AAA (highest) to D (lowest). All securities except for those labeled “NR” have been rated by a Nationally Recognized Statistical Rating Organization (“NRSRO”). For purposes of this presentation, when ratings are available from more than one agency, the highest rating is used. Guggenheim Investments converts ratings to the equivalent S&P rating. |
2 | NR securities do not necessarily indicate low credit quality. |
| | THE GUGGENHEIM FUNDS ANNUAL REPORT | 47 |
PERFORMANCE REPORT AND FUND PROFILE (Unaudited)(concluded) | September 30, 2017 |
Cumulative Fund Performance*
Average Annual Returns*
Periods Ended September 30, 2017
| | 1 Year | 5 Year | 10 Year |
| A-Class Shares | 3.39% | 4.71% | 3.96% |
A-Class Shares with sales charge† | (0.74%) | 3.70% | 3.46% |
| C-Class Shares | 2.59% | 3.94% | 3.20% |
C-Class Shares with CDSC§ | 1.59% | 3.94% | 3.20% |
| Bloomberg Barclays U.S. Aggregate Bond Index | 0.07% | 2.06% | 4.27% |
| | | 1 Year | Since Inception
(05/01/15) |
| P-Class Shares | | 3.33% | 4.00% |
| Bloomberg Barclays U.S. Aggregate Bond Index | | 0.07% | 2.24% |
| | | 1 Year | Since Inception (01/29/13) |
| Institutional Class Shares | | 3.67% | 4.86% |
| Bloomberg Barclays U.S. Aggregate Bond Index | | 0.07% | 2.33% |
| * | The performance data above represents past performance that is not predictive of future results. The investment return and principal value of an investment in the Fund will fluctuate so that an investor’s shares, when redeemed, may be worth more or less than their original cost. Returns are historical and include changes in principal and reinvested dividends and capital gains and do not reflect the effect of taxes. The Bloomberg Barclays U.S. Aggregate Bond Index is an unmanaged index and, unlike the Fund, has no management fees or operating expenses to reduce its reported return. The graph is based on A-Class shares only; performance for C-Class shares, P-Class shares and Institutional Class shares will vary due to differences in fee structures. |
† | Effective October 1, 2015, the maximum sales charge decreased from 4.75% to 4.00%. A 4.75% maximum sales charge is used in the calculation of the Average Annual Returns (based on subscriptions made prior to October 1, 2015), and a 4.00% maximum sales charge is used to calculate performance for periods based on subscriptions made on or after October 1, 2015. |
§ | Fund returns include a CDSC of 1% if redeemed within 12 months of purchase. |
| 48 | THE GUGGENHEIM FUNDS ANNUAL REPORT | |
| SCHEDULE OF INVESTMENTS | September 30, 2017 |
| INVESTMENT GRADE BOND FUND | |
| | | Shares | | | Value | |
| | | | | | | |
COMMON STOCKS† - 0.0% | |
| | | | | | | |
| Financial - 0.0% | |
| Rescap Liquidating Trust* | | | 5,199 | | | $ | 38,733 | |
| | | | | | | | | |
| Industrial - 0.0% | |
Constar International Holdings LLC*,†††,1 | | | 68 | | | | — | |
| | | | | | | | | |
| Total Common Stocks | | | | | | | | |
| (Cost $262,501) | | | | | | | 38,733 | |
| | | | | | | | | |
PREFERRED STOCKS††† - 0.9% | |
| Financial - 0.8% | |
Woodbourne Capital Trust I 3.13% (1 Month USD LIBOR + 250 bps) 2,3,4 | | | 950,000 | | | | 716,472 | |
Woodbourne Capital Trust II 3.13% (1 Month USD LIBOR + 250 bps) 2,3,4 | | | 950,000 | | | | 716,473 | |
Woodbourne Capital Trust III 2.72% (1 Month USD LIBOR + 250 bps) 2,3,4 | | | 950,000 | | | | 716,473 | |
Woodbourne Capital Trust IV 2.72% (1 Month USD LIBOR + 250 bps) 2,3,4 | | | 950,000 | | | | 716,473 | |
| Total Financial | | | | | | | 2,865,891 | |
| | | | | | | | | |
| Industrial - 0.1% | |
Seaspan Corp. 6.38% due 04/30/19†† | | | 12,920 | | | | 334,886 | |
Constar International Holdings LLC *,1 | | | 7 | | | | — | |
| Total Industrial | | | | | | | 334,886 | |
| Total Preferred Stocks | | | | | | | | |
| (Cost $4,141,354) | | | | | | | 3,200,777 | |
| | | | | | | | | |
MONEY MARKET FUND† - 0.3% | |
Dreyfus Treasury Securities Cash Management Fund - Institutional Class 0.90%5 | | | 969,501 | | | | 969,501 | |
| Total Money Market Fund | | | | | | | | |
| (Cost $969,501) | | | | | | | 969,501 | |
| | | | | | | | | |
| | | Face
Amount~ | | | | | |
| | | | | | | | | |
ASSET-BACKED SECURITIES†† - 43.3% | |
| Collateralized Loan Obligations - 30.3% | |
| Golub Capital Partners CLO Ltd. | | | | | | | | |
2016-33A, 3.80% (3 Month USD LIBOR + 248 bps) due 11/21/282,6 | | | 3,500,000 | | | | 3,490,731 | |
2015-25A, 3.11% (3 Month USD LIBOR + 180 bps) due 08/05/272,6 | | | 1,500,000 | | | | 1,502,469 | |
2014-21A, 3.76% (3 Month USD LIBOR + 245 bps) due 10/25/262,6 | | | 600,000 | | | | 592,312 | |
| Great Lakes CLO Ltd. | | | | | | | | |
2015-1A, 3.25% (3 Month USD LIBOR + 195 bps) due 07/15/262,6 | | | 1,000,000 | | | | 1,002,819 | |
2014-1A, 3.15% (3 Month USD LIBOR + 185 bps) due 04/15/252,6 | | | 1,000,000 | | | | 1,000,919 | |
2012-1A, 5.40% (3 Month USD LIBOR + 410 bps) due 01/15/232,6 | | | 1,000,000 | | | | 999,968 | |
2012-1A, 4.05% (3 Month USD LIBOR + 275 bps) due 01/15/232,6 | | | 1,000,000 | | | | 999,189 | |
2014-1A, 5.00% (3 Month USD LIBOR + 370 bps) due 04/15/252,6 | | | 250,000 | | | | 250,006 | |
| Fortress Credit Opportunities III CLO, LP | | | | | | | | |
2017-3A, 2.95% (3 Month USD LIBOR + 165 bps) due 04/28/262,6 | | | 3,500,000 | | | | 3,515,058 | |
2017-3A, 4.40% (3 Month USD LIBOR + 310 bps) due 04/28/262,6 | | | 300,000 | | | | 300,556 | |
2017-3A, 3.55% (3 Month USD LIBOR + 225 bps) due 04/28/262,6 | | | 300,000 | | | | 300,189 | |
| Shackleton CLO Ltd. | | | | | | | | |
2016-7A, 3.25% (3 Month USD LIBOR + 195 bps) due 04/15/272,6 | | | 1,500,000 | | | | 1,509,167 | |
2015-8A, 4.26% (3 Month USD LIBOR + 295 bps) due 10/20/272,6 | | | 1,000,000 | | | | 1,004,121 | |
2017-5A, 2.96% (3 Month USD LIBOR + 165 bps) due 05/07/262,6 | | | 1,000,000 | | | | 1,000,873 | |
| KVK CLO Ltd. | | | | | | | | |
2017-1A, 3.12% (3 Month USD LIBOR + 180 bps) due 05/15/262,6 | | | 1,600,000 | | | | 1,611,246 | |
2015-1A, 5.32% (3 Month USD LIBOR + 400 bps) due 05/20/272,6 | | | 1,250,000 | | | | 1,248,014 | |
2013-1A, due 04/14/256,7 | | | 1,000,000 | | | | 352,242 | |
| Fortress Credit Opportunities VII CLO Ltd. | | | | | | | | |
2016-7A, 3.37% (3 Month USD LIBOR + 205 bps) due 12/15/282,6 | | | 3,000,000 | | | | 3,011,945 | |
| Catamaran CLO Ltd. | | | | | | | | |
2016-1A, 3.22% (3 Month USD LIBOR + 195 bps) due 12/20/232,6 | | | 3,000,000 | | | | 3,000,795 | |
| PFP Ltd. | | | | | | | | |
2017-3, 2.28% (1 Month USD LIBOR + 105 bps) due 01/14/352,6 | | | 1,731,451 | | | | 1,734,152 | |
2015-2, 3.23% (1 Month USD LIBOR + 200 bps) due 07/14/342,6 | | | 1,000,000 | | | | 998,931 | |
| Fortress Credit Opportunities V CLO Ltd. | | | | | | | | |
2017-5A, 3.00% (3 Month USD LIBOR + 170 bps) due 10/15/262,6 | | | 1,500,000 | | | | 1,509,474 | |
2017-5A, 3.65% (3 Month USD LIBOR + 235 bps) due 10/15/262,6 | | | 1,000,000 | | | | 1,006,897 | |
| WhiteHorse VI Ltd. | | | | | | | | |
2016-1A, 3.21% (3 Month USD LIBOR + 190 bps) due 02/03/252,6 | | | 1,500,000 | | | | 1,501,137 | |
2016-1A, 4.06% (3 Month USD LIBOR + 275 bps) due 02/03/252,6 | | | 1,000,000 | | | | 1,011,622 | |
| CIFC Funding Ltd. | | | | | | | | |
2015-2A, 3.22% (3 Month USD LIBOR + 190 bps) due 12/05/242,6 | | | 1,500,000 | | | | 1,501,186 | |
2015-3A, 3.41% (3 Month USD LIBOR + 210 bps) due 10/19/272,6 | | | 1,000,000 | | | | 1,006,373 | |
| Fortress Credit BSL II Ltd. | | | | | | | | |
2017-2A, 2.96% (3 Month USD LIBOR + 165 bps) due 10/19/252,6 | | | 2,300,000 | | | | 2,310,854 | |
| Dryden XXVI Senior Loan Fund | | | | | | | | |
2013-26A, 3.80% (3 Month USD LIBOR + 250 bps) due 07/15/252,6 | | | 2,250,000 | | | | 2,258,879 | |
| SEE NOTES TO FINANCIAL STATEMENTS. | THE GUGGENHEIM FUNDS ANNUAL REPORT | 49 |
SCHEDULE OF INVESTMENTS (continued) | September 30, 2017 |
| INVESTMENT GRADE BOND FUND | |
| | | Face
Amount~ | | | Value | |
| | | | | | | |
| Venture XIX CLO Ltd. | | | | | | |
2016-19A, 3.30% (3 Month USD LIBOR + 200 bps) due 01/15/272,6 | | | 2,100,000 | | | $ | 2,132,596 | |
| TCP Waterman CLO Ltd. | | | | | | | | |
2016-1A, 3.30% (3 Month USD LIBOR + 205 bps) due 12/15/282,6 | | | 1,000,000 | | | | 1,016,873 | |
2016-1A, 3.55% (3 Month USD LIBOR + 230 bps) due 12/15/282,6 | | | 1,000,000 | | | | 1,004,729 | |
| OZLM Funding II Ltd. | | | | | | | | |
2016-2A, 4.06% (3 Month USD LIBOR + 275 bps) due 10/30/272,6 | | | 2,000,000 | | | | 2,010,540 | |
| Flagship CLO VIII Ltd. | | | | | | | | |
2017-8A, 3.00% (3 Month USD LIBOR + 170 bps) due 01/16/262,6 | | | 2,000,000 | | | | 2,010,135 | |
| Madison Park Funding XVI Ltd. | | | | | | | | |
2016-16A, 3.21% (3 Month USD LIBOR + 190 bps) due 04/20/262,6 | | | 2,000,000 | | | | 2,010,080 | |
| Flatiron CLO Ltd. | | | | | | | | |
2017-1A, 2.95% (3 Month USD LIBOR + 165 bps) due 01/17/262,6 | | | 1,000,000 | | | | 1,004,136 | |
2017-1A, 2.76% (3 Month USD LIBOR + 160 bps) due 07/17/262,6 | | | 1,000,000 | | | | 1,002,267 | |
| Hunt CRE Ltd. | | | | | | | | |
2017-FL1, 2.88% (1 Month USD LIBOR + 165 bps) due 08/15/342,6 | | | 1,000,000 | | | | 1,004,536 | |
2017-FL1, 2.23% (1 Month USD LIBOR + 100 bps) due 08/15/342,6 | | | 1,000,000 | | | | 1,000,603 | |
| Crown Point CLO III Ltd. | | | | | | | | |
2.78% (3 Month USD LIBOR + 145 bps) due 12/31/272 | | | 2,000,000 | | | | 2,000,426 | |
| FS Senior Funding Ltd. | | | | | | | | |
2015-1A, 3.10% (3 Month USD LIBOR + 180 bps) due 05/28/252,6 | | | 2,000,000 | | | | 2,000,030 | |
| Cerberus Loan Funding XVII Ltd. | | | | | | | | |
2016-3A, 3.69% (3 Month USD LIBOR + 253 bps) due 01/15/282,6 | | | 2,000,000 | | | | 1,998,291 | |
| Golub Capital Partners CLO 16 Ltd. | | | | | | | | |
2017-16A, 3.16% (3 Month USD LIBOR + 185 bps) due 07/25/292,6 | | | 2,000,000 | | | | 1,997,785 | |
| ABPCI Direct Lending Fund CLO I LLC | | | | | | | | |
2016-1A, 4.08% (3 Month USD LIBOR + 270 bps) due 12/22/282,6 | | | 2,000,000 | | | | 1,994,797 | |
| NXT Capital CLO LLC | | | | | | | | |
2017-1A, 3.13% (3 Month USD LIBOR + 170 bps) due 04/20/292,6 | | | 1,800,000 | | | | 1,797,981 | |
| Resource Capital Corporation Ltd. | | | | | | | | |
2017-CRE5, 2.03% (1 Month USD LIBOR + 80 bps) due 07/15/342,6 | | | 1,700,000 | | | | 1,703,713 | |
| Ivy Hill Middle Market Credit Fund VII Ltd. | | | | | | | | |
2013-7A, 3.61% (3 Month USD LIBOR + 230 bps) due 10/20/252,6 | | | 1,000,000 | | | | 999,977 | |
2013-7A, 4.76% (3 Month USD LIBOR + 345 bps) due 10/20/252,6 | | | 600,000 | | | | 599,980 | |
| Oaktree EIF I Ltd. | | | | | | | | |
2016-A1, 3.90% (3 Month USD LIBOR + 260 bps) due 10/18/272,6 | | | 1,500,000 | | | | 1,500,924 | |
| OZLM IX Ltd. | | | | | | | | |
2017-9A, 2.96% (3 Month USD LIBOR + 165 bps) due 01/20/272,6 | | | 1,400,000 | | | | 1,408,075 | |
| Grayson CLO Ltd. | | | | | | | | |
2006-1A, 1.72% (3 Month USD LIBOR + 41 bps) due 11/01/212,6 | | | 1,400,000 | | | | 1,395,159 | |
| Steele Creek CLO Ltd. | | | | | | | | |
2017-1A, 3.17% (3 Month USD LIBOR + 185 bps) due 08/21/262,6 | | | 1,100,000 | | | | 1,106,988 | |
| Oaktree EIF II Series A2 Ltd. | | | | | | | | |
2017-A2, 3.02% (3 Month USD LIBOR + 170 bps) due 11/15/252,6 | | | 1,100,000 | | | | 1,105,977 | |
| WhiteHorse VIII Ltd. | | | | | | | | |
2014-1A, 3.36% (3 Month USD LIBOR + 205 bps) due 05/01/262,6 | | | 1,100,000 | | | | 1,102,688 | |
| FDF II Ltd. | | | | | | | | |
2016-2A, 4.29% due 05/12/316 | | | 1,000,000 | | | | 1,024,134 | |
| AMMC CLO XI Ltd. | | | | | | | | |
2016-11A, 4.16% (3 Month USD LIBOR + 285 bps) due 10/30/232,6 | | | 1,000,000 | | | | 1,013,037 | |
| KKR CLO 15 Ltd. | | | | | | | | |
2016-15, 2.86% (3 Month USD LIBOR + 156 bps) due 10/18/282,6 | | | 1,000,000 | | | | 1,012,112 | |
| Nelder Grove CLO Ltd. | | | | | | | | |
2017-1A, 3.11% (3 Month USD LIBOR + 180 bps) due 08/28/262,6 | | | 1,000,000 | | | | 1,007,152 | |
| Betony CLO Ltd. | | | | | | | | |
2016-1A, 3.25% (3 Month USD LIBOR + 195 bps) due 04/15/272,6 | | | 1,000,000 | | | | 1,006,850 | |
| AIMCO CLO Series | | | | | | | | |
2015-AA, 3.60% (3 Month USD LIBOR + 230 bps) due 01/15/282,6 | | | 1,000,000 | | | | 1,006,616 | |
| Avery Point V CLO Ltd. | | | | | | | | |
2017-5A, 2.28% (3 Month USD LIBOR + 98 bps) due 07/17/262,6 | | | 1,000,000 | | | | 1,005,000 | |
| Recette CLO LLC | | | | | | | | |
2015-1A, 4.11% (3 Month USD LIBOR + 280 bps) due 10/20/272,6 | | | 1,000,000 | | | | 1,004,923 | |
| AMMC CLO XV Ltd. | | | | | | | | |
2016-15A, 3.22% (3 Month USD LIBOR + 190 bps) due 12/09/262,6 | | | 1,000,000 | | | | 1,004,218 | |
| Cerberus Loan Funding XVI, LP | | | | | | | | |
2016-2A, 3.65% (3 Month USD LIBOR + 235 bps) due 11/15/272,6 | | | 1,000,000 | | | | 1,003,024 | |
| Eaton Vance CLO Ltd. | | | | | | | | |
2017-1A, 2.90% (3 Month USD LIBOR + 160 bps) due 07/15/262,6 | | | 1,000,000 | | | | 1,002,331 | |
| Northwoods Capital XIV Ltd. | | | | | | | | |
2017-14A, 3.01% (3 Month USD LIBOR + 170 bps) due 11/12/252,6 | | | 1,000,000 | | | | 1,001,620 | |
| Venture XII CLO Ltd. | | | | | | | | |
2017-12A, 2.95% (3 Month USD LIBOR + 163 bps) due 02/28/262,6 | | | 1,000,000 | | | | 1,001,395 | |
| Fortress Credit Investments IV Ltd. | | | | | | | | |
2015-4A, 3.20% (3 Month USD LIBOR + 190 bps) due 07/17/232,6 | | | 1,000,000 | | | | 1,000,700 | |
50 | THE GUGGENHEIM FUNDS ANNUAL REPORT | SEE NOTES TO FINANCIAL STATEMENTS. |
SCHEDULE OF INVESTMENTS (continued) | September 30, 2017 |
| INVESTMENT GRADE BOND FUND | |
| | | Face
Amount~ | | | Value | |
| | | | | | | |
| Marathon CLO IV Ltd. | | | | | | |
2012-4A, 4.32% (3 Month USD LIBOR + 300 bps) due 05/20/232,6 | | | 1,000,000 | | | $ | 1,000,153 | |
| Figueroa CLO Ltd. | | | | | | | | |
2013-1A, 4.07% (3 Month USD LIBOR + 275 bps) due 03/21/242,6 | | | 1,000,000 | | | | 1,000,023 | |
| Mountain Hawk I CLO Ltd. | | | | | | | | |
2013-1A, 3.49% (3 Month USD LIBOR + 218 bps) due 01/20/242,6 | | | 1,000,000 | | | | 999,992 | |
| MONROE CAPITAL BSL CLO Ltd. | | | | | | | | |
2017-1A, 3.06% (3 Month USD LIBOR + 175 bps) due 05/22/272,6 | | | 1,000,000 | | | | 999,964 | |
| Garrison Funding Ltd. | | | | | | | | |
2016-2A, 4.47% (3 Month USD LIBOR + 315 bps) due 09/29/272,6 | | | 1,000,000 | | | | 999,951 | |
| Vibrant CLO II Ltd. | | | | | | | | |
2017-2A, 2.76% (3 Month USD LIBOR + 145 bps) due 07/24/242,6 | | | 1,000,000 | | | | 999,343 | |
| Atlas Senior Loan Fund IV Ltd. | | | | | | | | |
2017-2A, 2.77% (3 Month USD LIBOR + 145 bps) due 02/17/262,6 | | | 1,000,000 | | | | 998,855 | |
| Recette Clo Ltd. | | | | | | | | |
2017-1A, 2.63% (3 Month USD LIBOR + 130 bps) due 10/20/272,6 | | | 1,000,000 | | | | 998,712 | |
| Vibrant CLO III Ltd. | | | | | | | | |
2016-3A, 3.36% (3 Month USD LIBOR + 205 bps) due 04/20/262,6 | | | 1,000,000 | | | | 996,596 | |
| Dryden 37 Senior Loan Fund | | | | | | | | |
2015-37A, due 04/15/276,7 | | | 1,000,000 | | | | 920,584 | |
| Rockwall CDO II Ltd. | | | | | | | | |
2007-1A, 1.86% (3 Month USD LIBOR + 55 bps) due 08/01/242,6 | | | 825,089 | | | | 824,379 | |
| Newstar Trust | | | | | | | | |
2012-2A, 4.56% (3 Month USD LIBOR + 325 bps) due 01/20/232,6 | | | 750,000 | | | | 752,241 | |
| Black Diamond CLO Ltd. | | | | | | | | |
2013-1A, 4.56% (3 Month USD LIBOR + 325 bps) due 02/01/232,6 | | | 620,426 | | | | 620,649 | |
| Babson CLO Ltd. | | | | | | | | |
2014-IA, due 07/20/256,7 | | | 650,000 | | | | 321,179 | |
2012-2A, due 05/15/236,7 | | | 1,000,000 | | | | 205,727 | |
| Cent CLO | | | | | | | | |
2014-16A, 3.56% (3 Month USD LIBOR + 225 bps) due 08/01/242,6 | | | 500,000 | | | | 500,535 | |
| Cerberus Onshore II CLO LLC | | | | | | | | |
2014-1A, 4.00% (3 Month USD LIBOR + 270 bps) due 10/15/232,6 | | | 500,000 | | | | 500,077 | |
| ACIS CLO Ltd. | | | | | | | | |
2013-1A, 4.25% (3 Month USD LIBOR + 295 bps) due 04/18/242,6 | | | 500,000 | | | | 496,501 | |
| Treman Park CLO Ltd. | | | | | | | | |
2015-1A, due 04/20/276,7 | | | 500,000 | | | | 431,036 | |
| Halcyon Loan Advisors Funding Ltd. | | | | | | | | |
2012-2A, 5.83% (3 Month USD LIBOR + 450 bps) due 12/20/242,6 | | | 350,000 | | | | 349,987 | |
| Eastland CLO Ltd. | | | | | | | | |
2007-1A, 1.71% (3 Month USD LIBOR + 40 bps) due 05/01/222,6 | | | 318,795 | | | | 317,336 | |
| Gallatin CLO VII Ltd. | | | | | | | | |
2014-1A, 4.20% (3 Month USD LIBOR + 290 bps) due 07/15/232,6 | | | 250,000 | | | | 249,559 | |
| NewStar Arlington Senior Loan Program LLC | | | | | | | | |
2014-1A, 4.61% (3 Month USD LIBOR + 330 bps) due 07/25/252,6 | | | 250,000 | | | | 247,747 | |
| DIVCORE CLO Ltd. | | | | | | | | |
2013-1A, 5.13% (1 Month USD LIBOR + 390 bps) due 11/15/322,6 | | | 166,493 | | | | 166,460 | |
| Copper River CLO Ltd. | | | | | | | | |
2007-1A, due 01/20/214,7 | | | 700,000 | | | | 95,382 | |
| Keuka Park CLO Ltd. | | | | | | | | |
2013-1A, due 10/21/246,7 | | | 245,739 | | | | 28,278 | |
| Total Collateralized Loan Obligations | | | | | | | 108,555,768 | |
| | | | | | | | | |
| Transport-Aircraft - 5.1% | |
| Apollo Aviation Securitization Equity Trust | | | | | | | | |
| 2016-2, 4.21% due 11/15/41 | | | 2,218,080 | | | | 2,225,909 | |
2016-1A, 4.88% due 03/17/366 | | | 1,275,000 | | | | 1,309,628 | |
2014-1, 5.13% (WAC) due 12/15/292 | | | 1,049,380 | | | | 1,059,874 | |
2014-1, 7.38% (WAC) due 12/15/292 | | | 524,690 | | | | 528,625 | |
| Castlelake Aircraft Securitization Trust | | | | | | | | |
| 2017-1, 3.97% due 07/15/42 | | | 2,169,420 | | | | 2,166,077 | |
2015-1A, 4.70% due 12/15/406 | | | 1,168,270 | | | | 1,183,292 | |
| Willis Engine Securitization Trust II | | | | | | | | |
2012-A, 5.50% due 09/15/376 | | | 1,862,856 | | | | 1,840,847 | |
| Emerald Aviation Finance Ltd. | | | | | | | | |
2013-1, 4.65% due 10/15/386 | | | 885,343 | | | | 909,495 | |
2013-1, 6.35% due 10/15/386 | | | 177,069 | | | | 181,772 | |
| Falcon Aerospace Ltd. | | | | | | | | |
2017-1, 4.58% due 02/15/426 | | | 1,057,210 | | | | 1,073,413 | |
| AASET Trust | | | | | | | | |
2017-1A, 3.97% due 05/16/426 | | | 977,300 | | | | 983,874 | |
| ECAF I Ltd. | | | | | | | | |
2015-1A, 4.95% due 06/15/406 | | | 932,774 | | | | 933,874 | |
| Rise Ltd. | | | | | | | | |
| 2014-1A, 4.74% due 02/12/39 | | | 848,360 | | | | 856,844 | |
| AIM Aviation Finance Ltd. | | | | | | | | |
2015-1A, 4.21% due 02/15/406 | | | 815,476 | | | | 820,375 | |
| Raspro Trust | | | | | | | | |
2005-1A, 1.93% (3 Month USD LIBOR + 63 bps) due 03/23/242,6 | | | 792,279 | | | | 750,685 | |
| Turbine Engines Securitization Ltd. | | | | | | | | |
2013-1A, 5.13% due 12/13/484 | | | 636,478 | | | | 625,775 | |
| Diamond Head Aviation Ltd. | | | | | | | | |
2015-1, 3.81% due 07/14/286 | | | 605,736 | | | | 607,418 | |
| AABS Ltd. | | | | | | | | |
| 2013-1 A, 4.87% due 01/10/38 | | | 249,547 | | | | 252,043 | |
| Total Transport-Aircraft | | | | | | | 18,309,820 | |
| | | | | | | | | |
| Whole Business - 2.1% | |
| Taco Bell Funding LLC | | | | | | | | |
2016-1A, 4.97% due 05/25/466 | | | 1,930,500 | | | | 2,044,188 | |
| SEE NOTES TO FINANCIAL STATEMENTS. | THE GUGGENHEIM FUNDS ANNUAL REPORT | 51 |
SCHEDULE OF INVESTMENTS (continued) | September 30, 2017 |
| INVESTMENT GRADE BOND FUND | |
| | | Face
Amount~ | | | Value | |
| | | | | | | |
| Domino’s Pizza Master Issuer LLC | | | | | | |
2017-1A, 2.49% (3 Month USD LIBOR + 125 bps) due 07/25/472,6 | | | 1,000,000 | | | $ | 999,830 | |
2017-1A, 3.08% due 07/25/476 | | | 1,000,000 | | | | 995,290 | |
| Wendys Funding LLC | | | | | | | | |
2015-1A, 4.50% due 06/15/456 | | | 1,470,000 | | | | 1,510,234 | |
| Jimmy Johns Funding LLC | | | | | | | | |
2017-1A, 3.61% due 07/30/476 | | | 1,100,000 | | | | 1,105,808 | |
| Drug Royalty III Limited Partnership | | | | | | | | |
2016-1A, 3.98% due 04/15/276 | | | 729,380 | | | | 730,855 | |
| Total Whole Business | | | | | | | 7,386,205 | |
| | | | | | | | | |
| Collateralized Debt Obligations - 1.8% | |
| Anchorage Credit Funding Ltd. | | | | | | | | |
2016-4A, 3.50% due 02/15/356 | | | 3,750,000 | | | | 3,753,302 | |
2016-3A, 3.85% due 10/28/336 | | | 1,000,000 | | | | 1,003,944 | |
| Putnam Structured Product Funding Ltd. | | | | | | | | |
2003-1A, 2.23% (1 Month USD LIBOR + 100 bps) due 10/15/382,6 | | | 731,441 | | | | 690,506 | |
| Highland Park CDO I Ltd. | | | | | | | | |
2006-1A, 1.72% (3 Month USD LIBOR + 40 bps) due 11/25/512,6 | | | 480,457 | | | | 458,153 | |
| SRERS Funding Ltd. | | | | | | | | |
2011-RS, 1.48% (1 Month USD LIBOR + 25 bps) due 05/09/462,6 | | | 495,120 | | | | 356,560 | |
| N-Star REL CDO VIII Ltd. | | | | | | | | |
2006-8A, 1.60% (1 Month USD LIBOR + 36 bps) due 02/01/412,6 | | | 266,272 | | | | 264,975 | |
| RAIT CRE CDO I Ltd. | | | | | | | | |
2006-1X A1B, 1.56% (1 Month USD LIBOR + 33 bps) due 11/20/462 | | | 52,059 | | | | 51,966 | |
| Total Collateralized Debt Obligations | | | | | | | 6,579,406 | |
| | | | | | | | | |
| Net Lease - 1.6% | |
| Capital Automotive LLC | | | | | | | | |
2017-1A, 3.87% due 04/15/476 | | | 2,987,500 | | | | 3,012,742 | |
| Store Master Funding I-VII | | | | | | | | |
2016-1A, 3.96% due 10/20/466 | | | 2,853,264 | | | | 2,849,979 | |
| Total Net Lease | | | | | | | 5,862,721 | |
| | | | | | | | | |
| Transport-Container - 1.3% | |
| Textainer Marine Containers Ltd. | | | | | | | | |
2017-2A, 3.52% due 06/20/426 | | | 2,745,971 | | | | 2,735,007 | |
| Cronos Containers Program Ltd. | | | | | | | | |
2013-1A, 3.08% due 04/18/286 | | | 1,005,000 | | | | 1,001,175 | |
| Textainer Marine Containers V Ltd. | | | | | | | | |
2017-1A, 3.72% due 05/20/426 | | | 961,100 | | | | 972,797 | |
| Total Transport-Container | | | | | | | 4,708,979 | |
| | | | | | | | | |
| Automotive - 0.8% | |
| Hertz Vehicle Financing II, LP | | | | | | | | |
2015-1A, 2.73% due 03/25/216 | | | 1,700,000 | | | | 1,701,006 | |
| Hertz Vehicle Financing LLC | | | | | | | | |
2016-4A, 2.65% due 07/25/226 | | | 1,000,000 | | | | 984,643 | |
| Total Automotive | | | | | | | 2,685,649 | |
| | | | | | | | | |
| Insurance - 0.2% | |
| Chesterfield Financial Holdings LLC | | | | | | | | |
2014-1A, 4.50% due 12/15/346 | | | 550,500 | | | | 554,515 | |
| | | | | | | | | |
| Diversified Payment Rights - 0.1% | |
| CIC Receivables Master Trust | | | | | | | | |
REGD, 4.89% due 10/07/21††† | | | 238,682 | | | | 245,278 | |
| Total Asset-Backed Securities | | | | | | | | |
| (Cost $154,457,895) | | | | | | | 154,888,341 | |
| | | | | | | | | |
COLLATERALIZED MORTGAGE OBLIGATIONS†† - 22.5% | |
| Commercial Mortgage Backed Securities - 12.7% | |
| Fannie Mae | | | | | | | | |
| 2.91% due 07/01/27 | | | 2,800,000 | | | | 2,817,632 | |
| 2.94% due 10/01/32 | | | 2,600,000 | | | | 2,563,443 | |
| 3.09% due 10/01/29 | | | 2,000,000 | | | | 1,990,909 | |
| 2.96% due 11/01/29 | | | 1,548,519 | | | | 1,544,684 | |
| 2.86% due 09/01/29 | | | 1,450,000 | | | | 1,437,473 | |
| 3.12% due 10/01/32 | | | 1,200,000 | | | | 1,193,628 | |
3.08% due 10/01/32††† | | | 850,000 | | | | 840,524 | |
| 2.90% due 11/01/29 | | | 850,000 | | | | 833,000 | |
| 3.14% due 09/01/32 | | | 650,000 | | | | 650,993 | |
| 2.99% due 09/01/29 | | | 650,000 | | | | 637,723 | |
| 2.82% due 10/01/29 | | | 550,000 | | | | 539,347 | |
| 3.01% due 12/01/27 | | | 500,000 | | | | 501,328 | |
| 3.11% due 10/01/29 | | | 500,000 | | | | 499,690 | |
| 3.15% due 10/01/29 | | | 500,000 | | | | 498,440 | |
| Freddie Mac Multifamily Structured Pass Through Certificates | | | | | | | | |
| 2017-KW03, 3.02% due 06/25/27 | | | 3,000,000 | | | | 3,026,634 | |
| 2017-K062, 3.51% due 12/25/26 | | | 1,100,000 | | | | 1,152,759 | |
| 2017-K066, 3.20% due 06/25/27 | | | 1,000,000 | | | | 1,023,647 | |
| 2017-K067, 3.28% due 08/25/27 | | | 600,000 | | | | 614,848 | |
| Fannie Mae-Aces | | | | | | | | |
| 2017-M11, 2.98% due 08/25/29 | | | 2,500,000 | | | | 2,483,270 | |
2017-M8, 3.06% (WAC) due 05/25/272 | | | 750,000 | | | | 761,200 | |
| Cosmopolitan Hotel Trust | | | | | | | | |
2016-CSMO, 3.33% (1 Month USD LIBOR + 210 bps) due 11/15/332,6 | | | 1,500,000 | | | | 1,504,681 | |
2016-CSMO, 3.88% (1 Month USD LIBOR + 265 bps) due 11/15/332,6 | | | 1,000,000 | | | | 1,004,369 | |
| COMM Mortgage Trust | | | | | | | | |
2015-CR26, 4.64% (WAC) due 10/10/482 | | | 1,217,000 | | | | 1,185,864 | |
2015-CR26, 1.20% (WAC) due 10/10/482 | | | 10,072,089 | | | | 604,976 | |
| Hospitality Mortgage Trust | | | | | | | | |
2017-HIT, 2.08% (1 Month USD LIBOR + 85 bps) due 05/08/302,6 | | | 1,400,000 | | | | 1,401,747 | |
| Americold LLC Trust | | | | | | | | |
2010-ARTA, 7.44% due 01/14/296 | | | 1,250,000 | | | | 1,390,232 | |
| Morgan Stanley Capital I Trust | | | | | | | | |
2016-UB11, 1.81% (WAC) due 08/15/492 | | | 7,667,151 | | | | 769,995 | |
2017-H1, 1.62% (WAC) due 06/15/502 | | | 4,991,698 | | | | 489,014 | |
| SG Commercial Mortgage Securities Trust | | | | | | | | |
2016-C5, 2.18% (WAC) due 10/10/482 | | | 9,896,354 | | | | 1,193,844 | |
52 | THE GUGGENHEIM FUNDS ANNUAL REPORT | SEE NOTES TO FINANCIAL STATEMENTS. |
SCHEDULE OF INVESTMENTS (continued) | September 30, 2017 |
| INVESTMENT GRADE BOND FUND | |
| | | Face
Amount~ | | | Value | |
| | | | | | | |
| Wells Fargo Commercial Mortgage Trust | | | | | | |
2016-C32, 1.51% (WAC) due 01/15/592 | | | 6,367,731 | | | $ | 513,130 | |
2016-NXS5, 1.72% (WAC) due 01/15/592 | | | 4,933,067 | | | | 421,022 | |
2016-C37, 1.19% (WAC) due 12/15/492 | | | 3,868,588 | | | | 222,985 | |
| GE Business Loan Trust | | | | | | | | |
2007-1A, 1.40% (1 Month USD LIBOR + 17 bps) due 04/16/352,6 | | | 1,111,627 | | | | 1,072,575 | |
| Morgan Stanley Bank of America Merrill Lynch Trust | | | | | | | | |
2014-C19, 4.75% due 12/15/46†††,6 | | | 994,068 | | | | 1,004,952 | |
| UBS Commercial Mortgage Trust | | | | | | | | |
2017-C2, 1.31% (WAC) due 08/15/502 | | | 11,993,255 | | | | 1,002,648 | |
| JP Morgan Chase Commercial Mortgage Securities Trust | | | | | | | | |
2014-CBM, 3.18% (1 Month USD LIBOR + 195 bps) due 10/15/292,6 | | | 1,000,000 | | | | 1,000,000 | |
| GS Mortgage Securities Corporation Trust | | | | | | | | |
2017-STAY, 2.58% (1 Month USD LIBOR + 135 bps) due 07/15/322,6 | | | 1,000,000 | | | | 992,126 | |
| Citigroup Commercial Mortgage Trust | | | | | | | | |
2016-GC37, 1.81% (WAC) due 04/10/492 | | | 3,817,726 | | | | 440,460 | |
2016-C2, 1.94% (WAC) due 08/10/492 | | | 2,483,845 | | | | 298,965 | |
2016-P5, 1.70% (WAC) due 10/10/492 | | | 1,985,261 | | | | 194,843 | |
| JPMDB Commercial Mortgage Securities Trust | | | | | | | | |
2016-C2, 1.86% (WAC) due 06/15/492 | | | 8,888,380 | | | | 837,543 | |
| LSTAR Commercial Mortgage Trust | | | | | | | | |
2014-2, 5.01% (WAC) due 01/20/412,6 | | | 500,000 | | | | 502,839 | |
| JPMCC Commercial Mortgage Securities Trust | | | | | | | | |
2017-JP5, 1.27% (WAC) due 03/15/502 | | | 6,973,721 | | | | 500,395 | |
| BANK | | | | | | | | |
2017-BNK4, 1.62% (WAC) due 05/15/502 | | | 4,984,220 | | | | 496,557 | |
| CFCRE Commercial Mortgage Trust | | | | | | | | |
2016-C3, 1.24% (WAC) due 01/10/482 | | | 5,918,522 | | | | 416,585 | |
| CD Mortgage Trust | | | | | | | | |
2016-CD1, 1.57% (WAC) due 08/10/492 | | | 2,580,315 | | | | 244,646 | |
| Total Commercial Mortgage Backed Securities | | | | | | | 45,318,165 | |
| | | | | | | | | |
| Residential Mortgage Backed Securities - 8.7% | |
| American Home Mortgage Investment Trust | | | | | | | | |
2007-1, 2.08% due 05/25/478 | | | 10,805,776 | | | | 2,087,677 | |
2006-1, 1.64% (1 Month USD LIBOR + 40 bps) due 03/25/462 | | | 1,101,463 | | | | 1,030,434 | |
| GSAA Home Equity Trust | | | | | | | | |
2005-6, 1.67% (1 Month USD LIBOR + 43 bps) due 06/25/352 | | | 3,150,000 | | | | 2,877,087 | |
| Countrywide Asset-Backed Certificates | | | | | | | | |
2006-6, 1.41% (1 Month USD LIBOR + 17 bps) due 09/25/362 | | | 2,257,916 | | | | 2,119,324 | |
| LSTAR Commercial Mortgage Trust | | | | | | | | |
2016-7, 3.24% (1 Month USD LIBOR + 200 bps) due 12/01/212,6 | | | 1,986,733 | | | | 1,986,733 | |
| LSTAR Securities Investment Ltd. | | | | | | | | |
2016-4, 3.24% (1 Month USD LIBOR + 200 bps) due 10/01/212,6 | | | 1,979,090 | | | | 1,969,899 | |
| GCAT | | | | | | | | |
2017-1, 3.38% due 03/25/476 | | | 1,727,394 | | | | 1,720,431 | |
| Structured Asset Investment Loan Trust | | | | | | | | |
2005-11, 1.60% (1 Month USD LIBOR + 36 bps) due 01/25/362 | | | 1,484,092 | | | | 1,467,567 | |
| Banc of America Funding Trust | | | | | | | | |
2015-R4, 1.40% (1 Month USD LIBOR + 17 bps) due 01/27/352,6 | | | 771,738 | | | | 729,779 | |
2014-R7, 1.38% (1 Month USD LIBOR + 14 bps) due 09/26/362,6 | | | 657,016 | | | | 634,366 | |
| Nationstar Home Equity Loan Trust | | | | | | | | |
2007-B, 1.46% (1 Month USD LIBOR + 22 bps) due 04/25/372 | | | 1,312,321 | | | | 1,299,335 | |
| CSMC Series | | | | | | | | |
2015-12R, 1.73% (1 Month USD LIBOR + 50 bps) due 11/30/372,6 | | | 1,154,207 | | | | 1,137,234 | |
| NRPL Trust | | | | | | | | |
2014-2A, 3.75% (WAC) due 10/25/572,6 | | | 652,989 | | | | 654,453 | |
2015-1A, 3.88% due 11/01/546 | | | 432,418 | | | | 433,230 | |
| Towd Point Mortgage Trust | | | | | | | | |
2016-1, 2.75% (WAC) due 02/25/552,6 | | | 1,025,665 | | | | 1,031,117 | |
| Park Place Securities Incorporated Asset Backed Pass Through Certificates Ser | | | | | | | | |
2005-WHQ3, 2.18% (1 Month USD LIBOR + 95 bps) due 06/25/352 | | | 1,000,000 | | | | 1,000,627 | |
| Luminent Mortgage Trust | | | | | | | | |
2006-2, 1.44% (1 Month USD LIBOR + 20 bps) due 02/25/462 | | | 1,208,859 | | | | 981,074 | |
| CIM Trust | | | | | | | | |
2017-2, 3.24% (1 Month USD LIBOR + 200 bps) due 12/25/572,6 | | | 910,590 | | | | 919,095 | |
| RALI Series Trust | | | | | | | | |
2006-QO2, 1.46% (1 Month USD LIBOR + 22 bps) due 02/25/462 | | | 2,056,974 | | | | 917,177 | |
| VOLT LIV LLC | | | | | | | | |
2017-NPL1, 3.50% due 02/25/476 | | | 847,045 | | | | 852,250 | |
| Stanwich Mortgage Loan Company LLC | | | | | | | | |
2017-NPA1, 3.60% due 03/16/226 | | | 806,488 | | | | 806,488 | |
| CIT Mortgage Loan Trust | | | | | | | | |
2007-1, 2.69% (1 Month USD LIBOR + 145 bps) due 10/25/372,6 | | | 758,327 | | | | 763,547 | |
| Deutsche Alt-A Securities Mortgage Loan Trust Series | | | | | | | | |
2007-OA2, 1.66% (1 Year CMT Rate + 77 bps) due 04/25/472 | | | 811,276 | | | | 750,754 | |
| American Home Mortgage Assets Trust | | | | | | | | |
2007-1, 1.59% (1 Year CMT Rate + 70 bps) due 02/25/472 | | | 961,383 | | | | 641,101 | |
| MASTR Adjustable Rate Mortgages Trust | | | | | | | | |
2003-5, 2.89% (WAC) due 11/25/332 | | | 657,791 | | | | 626,084 | |
| Stanwich Mortgage Loan Co. | | | | | | | | |
2016-NPA1, 3.84% (WAC) due 10/16/462,6 | | | 583,136 | | | | 582,242 | |
| Washington Mutual Mortgage Pass-Through Certificates WMALT Series Trust | | | | | | | | |
2006-AR9, 1.73% (1 Year CMT Rate + 84 bps) due 11/25/462 | | | 566,291 | | | | 454,488 | |
| SEE NOTES TO FINANCIAL STATEMENTS. | THE GUGGENHEIM FUNDS ANNUAL REPORT | 53 |
SCHEDULE OF INVESTMENTS (continued) | September 30, 2017 |
| INVESTMENT GRADE BOND FUND | |
| | | Face
Amount~ | | | Value | |
| | | | | | | |
| Bayview Opportunity Master Fund IVb Trust | | | | | | |
2017-RN1, 3.60% (WAC) due 02/28/322,6 | | | 449,415 | | | $ | 449,807 | |
| UUCFC Manufactured Housing Contract | | | | | | | | |
| 1997-2, 7.38% due 10/15/28 | | | 183,116 | | | | 194,277 | |
| Nomura Resecuritization Trust | | | | | | | | |
2012-1R, 1.68% (1 Month USD LIBOR + 44 bps) due 08/27/472,6 | | | 31,496 | | | | 31,450 | |
| Total Residential Mortgage Backed Securities | | | | | | | 31,149,127 | |
| | | | | | | | | |
| Military Housing - 1.1% | |
| GMAC Commercial Mortgage Asset Corp. | | | | | | | | |
2007-HCKM, 6.11% due 08/10/52†††,4 | | | 1,506,437 | | | | 1,664,558 | |
2003-PRES, 6.24% due 10/10/416 | | | 1,387,491 | | | | 1,571,976 | |
| Capmark Military Housing Trust | | | | | | | | |
2007-ROBS, 6.06% due 10/10/524 | | | 478,736 | | | | 492,567 | |
2007-AETC, 5.75% due 02/10/524 | | | 333,734 | | | | 333,317 | |
| Total Military Housing | | | | | | | 4,062,418 | |
| Total Collateralized Mortgage Obligations | | | | | | | | |
| (Cost $80,067,011) | | | | | | | 80,529,710 | |
| | | | | | | | | |
CORPORATE BONDS†† - 11.2% | |
| Financial - 6.8% | |
| Station Place Securitization Trust | | | | | | | | |
2.14% (1 Month USD LIBOR + 90 bps) due 07/24/182,6 | | | 3,300,000 | | | | 3,300,000 | |
1.99% (1 Month USD LIBOR + 75 bps) due 08/24/182,6 | | | 1,300,000 | | | | 1,300,000 | |
2.36% (1 Month USD LIBOR + 113 bps) due 02/25/492,6 | | | 333,333 | | | | 333,362 | |
| Citigroup, Inc. | | | | | | | | |
5.95%3,12 | | | 2,450,000 | | | | 2,649,062 | |
5.90%3,12 | | | 500,000 | | | | 538,750 | |
6.25%3,12 | | | 450,000 | | | | 506,250 | |
| Bank of America Corp. | | | | | | | | |
6.30%3,12 | | | 2,750,000 | | | | 3,107,499 | |
6.10%3,12 | | | 250,000 | | | | 275,625 | |
| Hospitality Properties Trust | | | | | | | | |
| 5.25% due 02/15/26 | | | 1,100,000 | | | | 1,179,677 | |
| 4.95% due 02/15/27 | | | 400,000 | | | | 419,060 | |
| American Equity Investment Life Holding Co. | | | | | | | | |
| 5.00% due 06/15/27 | | | 1,460,000 | | | | 1,513,105 | |
| KeyCorp | | | | | | | | |
5.00% (3 Month USD LIBOR + 361 bps) 2,3 | | | 1,250,000 | | | | 1,293,750 | |
| Mid-Atlantic Military Family Communities LLC | | | | | | | | |
5.30% due 08/01/506 | | | 1,268,085 | | | | 1,254,885 | |
| Aurora Military Housing LLC | | | | | | | | |
6.89% due 01/15/47†††,6 | | | 750,000 | | | | 924,071 | |
| JPMorgan Chase & Co. | | | | | | | | |
6.00%3,12 | | | 800,000 | | | | 870,000 | |
| Credit Suisse Group AG | | | | | | | | |
2.52% (3 Month USD LIBOR + 120 bps) due 12/14/232,6 | | | 850,000 | | | | 855,594 | |
| MetLife, Inc. | | | | | | | | |
| 10.75% due 08/01/39 | | | 500,000 | | | | 836,250 | |
| Voya Financial, Inc. | | | | | | | | |
5.65%12 | | | 700,000 | | | | 743,400 | |
| Wilton Re Finance LLC | | | | | | | | |
5.88%6,12 | | | 475,000 | | | | 501,125 | |
| BBC Military Housing-Navy Northeast LLC | | | | | | | | |
6.30% due 10/15/49††† | | | 415,000 | | | | 447,491 | |
| Pacific Northwest Communities LLC | | | | | | | | |
5.91% due 06/15/504 | | | 400,000 | | | | 441,308 | |
| Wells Fargo & Co. | | | | | | | | |
5.88%3,12 | | | 200,000 | | | | 222,600 | |
5.90%3,12 | | | 200,000 | | | | 217,750 | |
| Atlantic Marine Corporations Communities LLC | | | | | | | | |
5.43% due 12/01/504 | | | 378,571 | | | | 377,451 | |
| ACC Group Housing LLC | | | | | | | | |
6.35% due 07/15/544 | | | 300,000 | | | | 350,637 | |
| Cadence Bank North America | | | | | | | | |
6.25%12 | | | 80,000 | | | | 82,400 | |
| Total Financial | | | | | | | 24,541,102 | |
| | | | | | | | | |
| Energy - 1.2% | |
| Buckeye Partners, LP | | | | | | | | |
| 3.95% due 12/01/26 | | | 1,523,000 | | | | 1,502,503 | |
| 4.35% due 10/15/24 | | | 339,000 | | | | 349,098 | |
| ConocoPhillips | | | | | | | | |
| 6.50% due 02/01/39 | | | 700,000 | | | | 933,331 | |
| Equities Corp. | | | | | | | | |
2.11% (3 Month USD LIBOR + 77 bps) due 10/01/202 | | | 900,000 | | | | 901,854 | |
| Sunoco Logistics Partners Operations, LP | | | | | | | | |
| 3.90% due 07/15/26 | | | 715,000 | | | | 709,331 | |
| Hess Corp. | | | | | | | | |
| 4.30% due 04/01/27 | | | 350,000 | | | | 346,916 | |
| Total Energy | | | | | | | 4,743,033 | |
| | | | | | | | | |
| Communications - 1.0% | |
| Discovery Communications LLC | | | | | | | | |
| 3.95% due 03/20/28 | | | 1,950,000 | | | | 1,936,025 | |
| AT&T, Inc. | | | | | | | | |
2.20% (3 Month USD LIBOR + 89 bps) due 02/14/232 | | | 1,250,000 | | | | 1,247,214 | |
| SFR Group S.A. | | | | | | | | |
7.38% due 05/01/266 | | | 350,000 | | | | 378,000 | |
| Total Communications | | | | | | | 3,561,239 | |
| | | | | | | | | |
| Consumer, Non-cyclical - 0.9% | |
| Offutt AFB America First Community LLC | | | | | | | | |
5.46% due 09/01/506 | | | 1,911,815 | | | | 2,020,635 | |
| NYU Hospitals Center | | | | | | | | |
| 4.37% due 07/01/47 | | | 1,000,000 | | | | 1,057,664 | |
| Total Consumer, Non-cyclical | | | | | | | 3,078,299 | |
| | | | | | | | | |
| Basic Materials - 0.7% | |
| Yamana Gold, Inc. | | | | | | | | |
| 4.95% due 07/15/24 | | | 1,485,000 | | | | 1,522,125 | |
54 | THE GUGGENHEIM FUNDS ANNUAL REPORT | SEE NOTES TO FINANCIAL STATEMENTS. |
SCHEDULE OF INVESTMENTS (continued) | September 30, 2017 |
| INVESTMENT GRADE BOND FUND | |
| | | Face
Amount~ | | | Value | |
| | | | | | | |
| BHP Billiton Finance USA Ltd. | | | | | | |
6.75% (USD 5 Year Swap Rate + 509 bps) due 10/19/752,6 | | | 750,000 | | | $ | 883,125 | |
| Total Basic Materials | | | | | | | 2,405,250 | |
| | | | | | | | | |
| Consumer, Cyclical - 0.4% | |
| Northern Group Housing LLC | | | | | | | | |
6.80% due 08/15/534 | | | 600,000 | | | | 737,568 | |
| HP Communities LLC | | | | | | | | |
5.78% due 03/15/464 | | | 500,000 | | | | 546,080 | |
| Total Consumer, Cyclical | | | | | | | 1,283,648 | |
| | | | | | | | | |
| Technology - 0.2% | |
| Micron Technology, Inc. | | | | | | | | |
| 7.50% due 09/15/23 | | | 510,000 | | | | 566,738 | |
| | | | | | | | | |
| Industrial - 0.0% | |
| Constar International, Inc | | | | | | | | |
11.00% due 12/31/17†††,1 | | | 4,091 | | | | — | |
| Total Corporate Bonds | | | | | | | | |
| (Cost $38,870,056) | | | | | | | 40,179,309 | |
| | | | | | | | | |
U.S. GOVERNMENT SECURITIES†† - 8.1% | |
| U.S. Treasury Bond | | | | | | | | |
due 11/15/449 | | | 37,435,600 | | | | 16,991,649 | |
due 11/15/469 | | | 28,444,000 | | | | 12,110,850 | |
| Total U.S. Treasury Bond | | | | | | | 29,102,499 | |
| Total U.S. Government Securities | | | | | | | | |
| (Cost $28,656,887) | | | | | | | 29,102,499 | |
| | | | | | | | | |
FEDERAL AGENCY BONDS†† - 3.8% | |
| Fannie Mae Principal Strips | | | | | | | | |
due 05/15/309 | | | 3,150,000 | | | | 2,153,273 | |
due 05/15/299,10 | | | 1,750,000 | | | | 1,242,242 | |
due 01/15/309 | | | 1,000,000 | | | | 691,495 | |
| Total Fannie Mae Principal Strips | | | | | | | 4,087,010 | |
| Freddie Mac Principal Strips | | | | | | | | |
due 03/15/319 | | | 2,950,000 | | | | 1,950,786 | |
due 07/15/329 | | | 2,700,000 | | | | 1,704,298 | |
| Total Freddie Mac Principal Strips | | | | | | | 3,655,084 | |
Freddie Mac10 | | | | | | | | |
due 12/14/299 | | | 2,900,000 | | | | 2,018,017 | |
due 01/02/349 | | | 850,000 | | | | 508,080 | |
| Total Freddie Mac | | | | | | | 2,526,097 | |
| Freddie Mac Strips | | | | | | | | |
due 09/15/299 | | | 2,600,000 | | | | 1,826,131 | |
| Tennessee Valley Authority | | | | | | | | |
| 5.38% due 04/01/56 | | | 600,000 | | | | 817,235 | |
| 4.25% due 09/15/65 | | | 700,000 | | | | 796,793 | |
| Total Tennessee Valley Authority | | | | | | | 1,614,028 | |
| Total Federal Agency Bonds | | | | | | | | |
| (Cost $13,800,593) | | | | | | | 13,708,350 | |
| | | | | | | | | |
SENIOR FLOATING RATE INTERESTS††,2 - 2.9% | |
| Technology - 1.1% | |
| Epicor Software | | | | | | | | |
| 4.99% (1 Month USD LIBOR + 375 bps) due 06/01/22 | | | 1,232,084 | | | | 1,233,625 | |
| Equinix, Inc. | | | | | | | | |
2.50% (2 Month EURIBOR + 250 bps) due 01/05/2413 | | EUR | 995,000 | | | | 1,179,583 | |
| Internet Brands, Inc. | | | | | | | | |
| 4.82% (3 Month USD LIBOR + 350 bps) due 09/13/24 | | | 684,271 | | | | 679,707 | |
| Compucom Systems, Inc. | | | | | | | | |
| 4.49% (1 Month USD LIBOR + 325 bps) due 05/11/20 | | | 702,678 | | | | 611,772 | |
| EIG Investors Corp. | | | | | | | | |
| 5.32% (3 Month USD LIBOR + 400 bps) due 02/09/23 | | | 260,603 | | | | 263,068 | |
| Total Technology | | | | | | | 3,967,755 | |
| | | | | | | | | |
| Communications - 0.5% | |
| Cengage Learning Acquisitions, Inc. | | | | | | | | |
| 5.49% (1 Month USD LIBOR + 425 bps) due 06/07/23 | | | 1,563,830 | | | | 1,438,442 | |
| Proquest LLC | | | | | | | | |
| 4.99% (1 Month USD LIBOR + 375 bps) due 10/24/21 | | | 489,842 | | | | 494,535 | |
| Total Communications | | | | | | | 1,932,977 | |
| | | | | | | | | |
| Consumer, Non-cyclical - 0.5% | |
| Packaging Coordinators Midco, Inc. | | | | | | | | |
| 5.34% (3 Month USD LIBOR + 400 bps) due 06/30/23 | | | 691,250 | | | | 689,522 | |
| American Tire Distributors, Inc. | | | | | | | | |
| 5.49% (1 Month USD LIBOR + 425 bps) due 09/01/21 | | | 518,354 | | | | 522,890 | |
| DJO Finance LLC | | | | | | | | |
| 4.49% (1 Month USD LIBOR + 325 bps) due 06/08/20 | | | 493,703 | | | | 492,878 | |
| CareCore National LLC | | | | | | | | |
| 5.24% (1 Month USD LIBOR + 400 bps) due 03/05/21 | | | 120,574 | | | | 121,780 | |
| NES Global Talent | | | | | | | | |
| 6.81% (3 Month USD LIBOR + 550 bps) due 10/03/19 | | | 115,618 | | | | 104,056 | |
| Total Consumer, Non-cyclical | | | | | | | 1,931,126 | |
| | | | | | | | | |
| Financial - 0.4% | |
| Misys Ltd. | | | | | | | | |
| 4.82% (3 Month USD LIBOR + 350 bps) due 06/13/24 | | | 1,250,000 | | | | 1,255,138 | |
| American Stock Transfer & Trust | | | | | | | | |
| 5.84% (3 Month USD LIBOR + 450 bps) due 06/26/20 | | | 93,666 | | | | 93,900 | |
| Total Financial | | | | | | | 1,349,038 | |
| SEE NOTES TO FINANCIAL STATEMENTS. | THE GUGGENHEIM FUNDS ANNUAL REPORT | 55 |
SCHEDULE OF INVESTMENTS (continued) | September 30, 2017 |
| INVESTMENT GRADE BOND FUND | |
| | | Face
Amount~ | | | Value | |
| | | | | | | |
| Consumer, Cyclical - 0.3% | |
| Petco Animal Supplies, Inc. | | | | | | |
| 4.31% (3 Month USD LIBOR + 300 bps) due 01/26/23 | | | 1,184,962 | | | $ | 975,129 | |
| | | | | | | | | |
| Industrial - 0.1% | |
| Wrangler Buyer Corp. | | | | | | | | |
| 3.00% (3 Month USD LIBOR + 300 bps) due 09/27/24 | | | 200,000 | | | | 200,916 | |
| Total Senior Floating Rate Interests | | | | | | | | |
| (Cost $10,573,346) | | | | | | | 10,356,941 | |
| | | | | | | | | |
MUNICIPAL BONDS†† - 1.3% | |
| California - 0.5% | |
| Newport Mesa Unified School District General Obligation Unlimited | | | | | | | | |
due 08/01/419 | | | 1,540,000 | | | | 616,693 | |
due 08/01/469 | | | 750,000 | | | | 242,040 | |
| Beverly Hills Unified School District California General Obligation Unlimited | | | | | | | | |
due 08/01/399 | | | 1,410,000 | | | | 595,443 | |
| Cypress School District General Obligation Unlimited | | | | | | | | |
due 08/01/489 | | | 1,000,000 | | | | 265,570 | |
| Total California | | | | | | | 1,719,746 | |
| | | | | | | | | |
| Ohio - 0.4% | |
| American Municipal Power, Inc. Revenue Bonds | | | | | | | | |
| 8.08% due 02/15/50 | | | 1,030,000 | | | | 1,702,683 | |
| | | | | | | | | |
| Illinois - 0.4% | |
| State of Illinois General Obligation Unlimited | | | | | | | | |
| 5.65% due 12/01/38 | | | 500,000 | | | | 563,915 | |
| 5.10% due 06/01/33 | | | 500,000 | | | | 538,445 | |
| Total Illinois | | | | | | | 1,102,360 | |
| Total Municipal Bonds | | | | | | | | |
| (Cost $4,305,128) | | | | | | | 4,524,789 | |
| | | | | | | | | |
FOREIGN GOVERNMENT DEBT†† - 0.4% | |
| Kenya Government International Bond | | | | | | | | |
6.88% due 06/24/246 | | | 510,000 | | | | 520,577 | |
| Senegal Government International Bond | | | | | | | | |
6.25% due 05/23/336 | | | 500,000 | | | | 514,145 | |
| Dominican Republic International Bond | | | | | | | | |
6.85% due 01/27/456 | | | 450,000 | | | | 503,438 | |
| Total Foreign Government Debt | | | | | | | | |
| (Cost $1,481,471) | | | | | | | 1,538,160 | |
| | | | | | | | | |
COMMERCIAL PAPER†† - 9.3% | |
| Anthem, Inc. | | | | | | | | |
1.36% due 10/16/176,9,11 | | | 5,500,000 | | | | 5,496,883 | |
| Hewlett-Packard Co. | | | | | | | | |
1.47% due 10/16/176,9,11 | | | 5,500,000 | | | | 5,496,631 | |
| Dr Pepper Snapple Group, Inc. | | | | | | | | |
1.35% due 10/03/176,9,11 | | | 5,000,000 | | | | 4,999,625 | |
| E.I. Du Pont de Nemours & Co. | | | | | | | | |
1.35% due 10/06/179,11 | | | 5,000,000 | | | | 4,999,063 | |
| Marriott International, Inc. | | | | | | | | |
1.41% due 10/26/179,11 | | | 5,000,000 | | | | 4,995,104 | |
| McKesson Corp. | | | | | | | | |
1.35% due 10/23/179,11 | | | 3,980,000 | | | | 3,976,717 | |
| Molex Electronics Tech | | | | | | | | |
1.36% due 10/10/179,11 | | | 2,500,000 | | | | 2,499,150 | |
| Amphenol Corp. | | | | | | | | |
1.35% due 10/02/179,11 | | | 800,000 | | | | 799,970 | |
| Total Commercial Paper | | | | | | | | |
| (Cost $33,263,143) | | | | | | | 33,263,143 | |
| | | | | | | | | |
| | | Contracts | | | | | |
| | | | | | | | | |
OTC OPTIONS PURCHASED†† - 0.0% | |
| Call options on: | | | | | | | | |
Bank of America Merrill Lynch
iShares 20+ Year Treasury Bond ETF
Expiring October 2017 with strike price
of $130.00 (Notional Value $28,482,708) | | | 2,283 | | | | 20,547 | |
| Total Call options | | | | | | | 20,547 | |
| Put options on: | | | | | | | | |
Bank of America Merrill Lynch
iShares iBoxx High Yield Corporate
Bond ETF Expiring October
2017 with strike price of $84.00
(Notional Value $38,477,460) | | | 4,335 | | | | 15,173 | |
| Total Put options | | | | | | | 15,173 | |
| Total OTC Options Purchased | | | | | | | | |
| (Cost $550,095) | | | | | | | 35,720 | |
| | | | | | | | | |
| Total Investments - 104.0% | | | | | | | | |
| (Cost $371,398,981) | | | | | | $ | 372,335,973 | |
| | | | | | | | | |
OTC OPTIONS WRITTEN†† - 0.0% | | | | | | | | |
| Call options on: | | | | | | | | |
Bank of America Merrill Lynch
iShares 20+ Year Treasury Bond ETF
Expiring October 2017 with strike price
of $133.00 (Notional Value $28,482,708) | | | 2,283 | | | | (7,991 | ) |
| Total OTC Options Written | | | | | | | | |
| (Premiums received $164,376) | | | | | | | (7,991 | ) |
| Other Assets & Liabilities, net - (4.0)% | | | | | | | (14,303,752 | ) |
| Total Net Assets - 100.0% | | | | | | $ | 358,024,230 | |
56 | THE GUGGENHEIM FUNDS ANNUAL REPORT | SEE NOTES TO FINANCIAL STATEMENTS. |
SCHEDULE OF INVESTMENTS (continued) | September 30, 2017 |
| INVESTMENT GRADE BOND FUND | |
CENTRALLY CLEARED INTEREST RATE SWAPS†† | | | | | | | |
| Counterparty | Exchange | Floating
Rate Type | Floating
Rate Index | Fixed
Rate | Payment Frequency | Maturity
Date | | Notional
Amount | | | Market
Value | | | Unrealized
Gain (Loss) | |
| Merrill Lynch | CME | Receive | 3-Month USD-LIBOR | 2.24% | Quarterly | 08/11/27 | | $ | (14,700,000 | ) | | $ | 157,003 | | | $ | 157,003 | |
| Merrill Lynch | CME | Receive | 3-Month USD-LIBOR | 1.90% | Quarterly | 09/07/24 | | | (2,900,000 | ) | | | 46,285 | | | | 46,285 | |
| Merrill Lynch | CME | Receive | 3-Month USD-LIBOR | 2.17% | Quarterly | 08/22/27 | | | (2,300,000 | ) | | | 28,988 | | | | 28,988 | |
| Merrill Lynch | CME | Receive | 3-Month USD-LIBOR | 1.90% | Quarterly | 08/11/22 | | | (5,100,000 | ) | | | 25,539 | | | | 25,539 | |
| Merrill Lynch | CME | Receive | 3-Month USD-LIBOR | 1.71% | Quarterly | 08/11/20 | | | (7,600,000 | ) | | | 23,817 | | | | 23,817 | |
| Merrill Lynch | CME | Receive | 3-Month USD-LIBOR | 2.19% | Quarterly | 08/15/27 | | | (2,200,000 | ) | | | 22,669 | | | | 22,669 | |
| Merrill Lynch | CME | Receive | 3-Month USD-LIBOR | 2.15% | Quarterly | 08/21/27 | | | (1,500,000 | ) | | | 20,316 | | | | 20,316 | |
| Merrill Lynch | CME | Receive | 3-Month USD-LIBOR | 2.03% | Quarterly | 08/18/24 | | | (2,500,000 | ) | | | 17,714 | | | | 17,714 | |
| Merrill Lynch | CME | Receive | 3-Month USD-LIBOR | 2.07% | Quarterly | 05/26/24 | | | (4,590,000 | ) | | | 15,987 | | | | 15,987 | |
| Merrill Lynch | CME | Receive | 3-Month USD-LIBOR | 2.24% | Quarterly | 08/17/27 | | | (2,000,000 | ) | | | 12,386 | | | | 12,386 | |
| Merrill Lynch | CME | Receive | 3-Month USD-LIBOR | 2.16% | Quarterly | 02/13/24 | | | (6,200,000 | ) | | | (17,568 | ) | | | (17,568 | ) |
| | | | | | | | | | | | | | | | | $ | 353,136 | |
FORWARD FOREIGN CURRENCY EXCHANGE CONTRACTS†† | |
| Counterparty | Contracts to Sell | | Currency | Settlement
Date | | Settlement
Value | | | Value at
September 30,
2017 | | | Net
Unrealized Appreciation | |
| Bank of America | (1,008,000) | | EUR | 10/12/17 | | $ | 1,208,044 | | | $ | 1,192,025 | | | $ | 16,019 | |
| ~ | The face amount is denominated in U.S. dollars unless otherwise indicated. |
| * | Non-income producing security. |
† | Value determined based on Level 1 inputs, unless otherwise noted — See Note 4. |
†† | Value determined based on Level 2 inputs, unless otherwise noted — See Note 4. |
††† | Value determined based on Level 3 inputs, unless otherwise noted — See Note 4. |
1 | Security was fair valued by the Valuation Committee at September 30, 2017. The total market value of fair valued securities amounts to $0, (cost $4,146) or 0.0% of total net assets. |
2 | Variable rate security. Rate indicated is rate effective at September 30, 2017. |
3 | Perpetual maturity. |
4 | Security is a 144A or Section 4(a)(2) security. These securities have been determined to be illiquid and restricted under guidelines established by the Board of Trustees. The total market value of 144A or Section 4(a)(2) illiquid and restricted securities is $8,988,687 (cost $10,085,688), or 2.5% of total net assets— See Note 10. |
5 | Rate indicated is the 7 day yield as of September 30, 2017. |
6 | Security is a 144A or Section 4(a)(2) security. These securities have been determined to be liquid under guidelines established by the Board of Trustees. The total market value of 144A or Section 4(a)(2) securities is $199,751,704 (cost $198,259,340), or 55.8% of total net assets. |
7 | Security has no stated coupon. However, it is expected to receive residual cash flow payments on defined deal dates. |
8 | Security is an interest-only strip. Rate indicated is effective yield at September 30, 2017. |
9 | Zero coupon rate security. |
10 | On September 7, 2008, the issuer was placed in conservatorship by the Federal Housing Finance Agency (FHFA). As conservator, the FHFA has full powers to control the assets and operations of the firm. |
11 | Rate indicated is the effective yield at the time of purchase. |
12 | Security has a fixed rate coupon which will convert to a floating or variable rate coupon on a future date. |
13 | The underlying reference rate was negative at period end causing the effective rate to be equal to the spread amount listed. |
| | CME — Chicago Mercantile Exchange |
| | CMT — Constant Maturity Treasury |
| | EUR — Euro |
| | EURIBOR — European Interbank Offered Rate |
| | LIBOR — London Interbank Offered Rate |
| | WAC — Weighted Average Coupon |
| | |
| | See Sector Classification in Other Information section. |
| SEE NOTES TO FINANCIAL STATEMENTS. | THE GUGGENHEIM FUNDS ANNUAL REPORT | 57 |
SCHEDULE OF INVESTMENTS (continued) | September 30, 2017 |
| INVESTMENT GRADE BOND FUND | |
The following table summarizes the inputs used to value the Fund’s investments at September 30, 2017 (See Note 4 in the Notes to Financial Statements):
| Investments in Securities (Assets) | | Level 1
Quoted
Prices | | | Level 2
Significant
Observable
Inputs | | | Level 2 -
Other* | | | Level 3
Significant
Unobservable
Inputs | | | Total | |
| Asset Backed Securities | | $ | — | | | $ | 154,643,063 | | | $ | — | | | $ | 245,278 | | | $ | 154,888,341 | |
| Collateralized Mortgage Obligations | | | — | | | | 77,019,676 | | | | — | | | | 3,510,034 | | | | 80,529,710 | |
| Commercial Paper | | | — | | | | 33,263,143 | | | | — | | | | — | | | | 33,263,143 | |
| Common Stocks | | | 38,733 | | | | — | | | | — | | | | — | ** | | | 38,733 | |
| Corporate Bonds | | | — | | | | 38,807,747 | | | | — | | | | 1,371,562 | | | | 40,179,309 | |
| Forward Foreign Currency Exchange Contracts | | | — | | | | — | | | | 16,019 | | | | — | | | | 16,019 | |
| Federal Agency Bonds | | | — | | | | 13,708,350 | | | | — | | | | — | | | | 13,708,350 | |
| Foreign Government Debt | | | — | | | | 1,538,160 | | | | — | | | | — | | | | 1,538,160 | |
| Interest Rate Swaps | | | — | | | | — | | | | 370,704 | | | | — | | | | 370,704 | |
| Money Market Fund | | | 969,501 | | | | — | | | | — | | | | — | | | | 969,501 | |
| Municipal Bonds | | | — | | | | 4,524,789 | | | | — | | | | — | | | | 4,524,789 | |
| Options Purchased | | | — | | | | 35,720 | | | | — | | | | — | | | | 35,720 | |
| Preferred Stocks | | | — | | | | 334,886 | | | | — | | | | 2,865,891 | | | | 3,200,777 | |
| Senior Floating Rate Interests | | | — | | | | 10,356,941 | | | | — | | | | — | | | | 10,356,941 | |
| U.S. Government Securities | | | — | | | | 29,102,499 | | | | — | | | | — | | | | 29,102,499 | |
| Total Assets | | $ | 1,008,234 | | | $ | 363,334,974 | | | $ | 386,723 | | | $ | 7,992,765 | | | $ | 372,722,696 | |
| | | | | | | | | | | | | | | | | | | | | |
| Investments in Securities (Liabilities) | | Level 1
Quoted
Prices | | | Level 2
Significant
Observable
Inputs | | | Level 2 -
Other* | | | Level 3
Significant
Unobservable
Inputs | | | Total | |
| Interest Rate Swaps | | $ | — | | | $ | — | | | $ | 17,568 | | | $ | — | | | $ | 17,568 | |
| Options Written | | | — | | | | 7,991 | | | | — | | | | — | | | | 7,991 | |
| Total Liabilities | | $ | — | | | $ | 7,991 | | | $ | 17,568 | | | $ | — | | | $ | 25,559 | |
| * | Other financial instruments include forward foreign currency exchange contracts and swaps, which are reported as unrealized gain/loss at period end. |
| ** | Market value of security is $0. |
Transfers between investment levels may occur as the markets fluctuate and/or the availability of data used in an investment’s valuation changes. Transfers between valuation levels, if any, are in comparison to the valuation levels at the end of the previous fiscal year, and are effective using the fair value as of the end of the current fiscal period.
For the year ended September 30, 2017, Investment Grade Bond Fund had securities with the total value $1,003,944 transfer out of Level 3 into Level 2 due to changes in securities’ valuation methods using observable inputs. There were no other transfers between levels.
58 | THE GUGGENHEIM FUNDS ANNUAL REPORT | SEE NOTES TO FINANCIAL STATEMENTS. |
SCHEDULE OF INVESTMENTS (concluded) | September 30, 2017 |
| INVESTMENT GRADE BOND FUND | |
Following is a reconciliation of Level 3 assets for which significant unobservable inputs were used to determine fair value for the period ended September 30, 2017:
LEVEL 3 - Fair value measurement using significant unobservable inputs
| | | Collateralized Mortgage Obligation | | | Asset-Backed Securities | | | Common Stocks | | | Preferred Stocks | | | Corporate Bonds | | | Total | |
| INVESTMENT GRADE BOND FUND | | | | | | | | | | | | | | | | | | |
| Assets: | | | | | | | | | | | | | | | | | | |
| Beginning Balance | | $ | — | | | $ | 1,304,702 | | | $ | — | | | $ | 2,282,127 | | | $ | 1,384,591 | | | $ | 4,971,420 | |
| Purchases | | | 3,610,508 | | | | — | | | | — | | | | — | | | | — | | | | 3,610,508 | |
| Sales, maturities and paydowns | | | — | | | | (49,351 | ) | | | — | | | | — | | | | — | | | | (49,351 | ) |
| Total realized gains or losses included in earnings | | | — | | | | — | | | | — | | | | — | | | | — | | | | — | |
| Total change in unrealized gains or losses included in earnings | | | (100,474 | ) | | | (6,129 | ) | | | — | | | | 583,764 | | | | (13,029 | ) | | | 464,132 | |
| Transfers into Level 3 | | | — | | | | — | | | | — | | | | — | | | | — | | | | — | |
| Transfers out of Level 3 | | | — | | | | (1,003,944 | ) | | | — | | | | — | | | | — | | | | (1,003,944 | ) |
| Ending Balance | | $ | 3,510,034 | | | $ | 245,278 | | | $ | — | | | $ | 2,865,891 | | | $ | 1,371,562 | | | $ | 7,992,765 | |
| Net Change in unrealized appreciation (depreciation) for investments in securities still held at September 30, 2017 | | $ | (79,858 | ) | | $ | 4,016 | | | $ | — | | | $ | 583,764 | | | $ | (11,597 | ) | | $ | 496,324 | |
The following is a summary of significant unobservable inputs used in the fair valuation of assets and liabilities categorized within Level 3 of the fair value hierarchy:
| Category | | Level 3 | | Valuation Technique | Unobservable
Inputs |
| Asset Backed Securities | | $ | 245,278 | | Option Adjusted Spread off the prior month end broker mark over the 3 month LIBOR | Indicative Quote |
| Collateralized Mortgage Obligations | | | 3,510,034 | | Option Adjusted Spread off the prior month end broker mark over the 3 month LIBOR | Indicative Quote |
| Corporate Bonds | | | 1,371,562 | | Option Adjusted Spread off the prior month end broker mark over the 3 month LIBOR | Indicative Quote |
| Preferred Stocks | | | 2,865,891 | | Option Adjusted Spread off the prior month end broker mark over the 3 month LIBOR | Indicative Quote |
| Total | | $ | 7,992,765 | | | |
Any remaining Level 3 securities held by the Funds and excluded from the tables above, were not considered material to the Funds.
| SEE NOTES TO FINANCIAL STATEMENTS. | THE GUGGENHEIM FUNDS ANNUAL REPORT | 59 |
| INVESTMENT GRADE BOND FUND | |
| STATEMENT OF ASSETS AND LIABILITIES |
| September 30, 2017 |
| Assets: | |
| Investments, at value (cost $371,398,981) | | $ | 372,335,973 | |
| Foreign currency, at value (cost $6,639) | | | 6,639 | |
| Segregated cash with broker | | | 1,146,541 | |
| Cash | | | 82,051 | |
| Unrealized appreciation on forward foreign currency exchange contracts | | | 16,019 | |
| Prepaid expenses | | | 47,504 | |
| Receivables: | |
| Securities sold | | | 1,787,690 | |
| Interest | | | 1,416,385 | |
| Fund shares sold | | | 390,435 | |
| Dividends | | | 1,674 | |
| Total assets | | | 377,230,911 | |
| | | | | |
| Liabilities: | |
| Options written, at value (premiums received $164,376) | | | 7,991 | |
| Due to broker | | | 85,000 | |
| Variation margin on swap agreements | | | 52 | |
| Payable for: | |
| Securities purchased | | | 18,609,979 | |
| Fund shares redeemed | | | 203,615 | |
| Management fees | | | 90,690 | |
| Distribution and service fees | | | 61,626 | |
| Fund accounting/administration fees | | | 23,363 | |
| Dividends distributed | | | 19,809 | |
| Transfer agent/maintenance fees | | | 12,604 | |
| Recoupment of previously waived expenses | | | 2,398 | |
| Trustees’ fees* | | | 303 | |
| Miscellaneous | | | 89,251 | |
| Total liabilities | | | 19,206,681 | |
| Net assets | | | 358,024,230 | |
| | | | | |
| Net assets consist of: | |
| Paid in capital | | $ | 360,391,057 | |
| Accumulated net investment loss | | | 347,181 | |
| Accumulated net realized loss on investments | | | (4,176,540 | ) |
| Net unrealized appreciation on investments | | | 1,462,532 | |
| Net assets | | $ | 358,024,230 | |
| | | | | |
| A-Class: | |
| Net assets | | $ | 170,623,716 | |
| Capital shares outstanding | | | 9,198,651 | |
| Net asset value per share | | $ | 18.55 | |
| Maximum offering price per share (Net asset value divided by 96.00%) | | $ | 19.32 | |
| | | | | |
| C-Class: | |
| Net assets | | $ | 28,083,289 | |
| Capital shares outstanding | | | 1,520,369 | |
| Net asset value per share | | $ | 18.47 | |
| | | | | |
| P-Class: | |
| Net assets | | $ | 17,302,948 | |
| Capital shares outstanding | | | 932,083 | |
| Net asset value per share | | $ | 18.56 | |
| | | | | |
| Institutional Class: | |
| Net assets | | $ | 142,014,277 | |
| Capital shares outstanding | | | 7,666,920 | |
| Net asset value per share | | $ | 18.52 | |
| * | Relates to Trustees not deemed “interested persons” within the meaning of Section 2(a)(19) of the 1940 Act. |
60 | THE GUGGENHEIM FUNDS ANNUAL REPORT | SEE NOTES TO FINANCIAL STATEMENTS. |
| INVESTMENT GRADE BOND FUND | |
| STATEMENT OF OPERATIONS |
| Year Ended September 30, 2017 |
| Investment Income: | |
| Dividends | | $ | 179,529 | |
| Interest | | | 13,062,010 | |
| Total investment income | | | 13,241,539 | |
| | | | | |
| Expenses: | |
| Management fees | | | 1,570,486 | |
| Distribution and service fees: | |
| A-Class | | | 412,256 | |
| C-Class | | | 306,961 | |
| P-Class | | | 12,906 | |
| Recoupment of previously waived fees: | |
| A-Class | | | 89,303 | |
| C-Class | | | 9,862 | |
| P-Class | | | 601 | |
| Institutional Class | | | 23,559 | |
| Transfer agent/maintenance fees: | |
| A-Class | | | 132,041 | |
| C-Class | | | 42,649 | |
| P-Class | | | 7,172 | |
| Institutional Class | | | 26,792 | |
| Fund accounting/administration fees | | | 251,747 | |
| Line of credit fees | | | 63,437 | |
| Custodian fees | | | 22,437 | |
| Short interest expense | | | 13,161 | |
| Trustees’ fees* | | | 12,408 | |
| Miscellaneous | | | 234,990 | |
| Total expenses | | | 3,232,768 | |
| Less: | |
| Expenses waived by Adviser | | | (75,571 | ) |
| Expenses reimbursed by Adviser: | | | | |
| A-Class | | | (46,546 | ) |
| C-Class | | | (14,795 | ) |
| P-Class | | | (3,264 | ) |
| Institutional Class | | | (11,962 | ) |
| Total waived/reimbursed expenses | | | (152,138 | ) |
| Net expenses | | | 3,080,630 | |
| Net investment income | | | 10,160,909 | |
| | | | | |
| Net Realized and Unrealized Gain (Loss): | |
| Net realized gain (loss) on: | |
| Investments | | | 1,181,572 | |
| Swap agreements | | | (56,926 | ) |
| Foreign currency transactions | | | (25,201 | ) |
| Forward currency exchange contracts | | | (115,574 | ) |
| Options purchased | | | 134,689 | |
| Options written | | | (80,268 | ) |
| Net realized gain | | | 1,038,292 | |
| Net change in unrealized appreciation (depreciation) on: | |
| Investments | | | (202,429 | ) |
| Swap agreements | | | 353,136 | |
| Options purchased | | | (514,375 | ) |
| Options written | | | 156,385 | |
| Forward foreign currency exchange contracts | | | 16,019 | |
| Net change in unrealized appreciation (depreciation) | | | (191,264 | ) |
| Net realized and unrealized gain | | | 847,028 | |
| Net increase in net assets resulting from operations | | $ | 11,007,937 | |
| * | Relates to Trustees not deemed “interested persons” within the meaning of Section 2(a)(19) of the 1940 Act. |
| SEE NOTES TO FINANCIAL STATEMENTS. | THE GUGGENHEIM FUNDS ANNUAL REPORT | 61 |
| INVESTMENT GRADE BOND FUND | |
| STATEMENTS OF CHANGES IN NET ASSETS |
| | | Year Ended
September 30,
2017 | | | Year Ended
September 30,
2016 | |
| Increase (Decrease) in Net Assets from Operations: | | | | | | |
| Net investment income | | $ | 10,160,909 | | | $ | 6,639,023 | |
| Net realized gain on investments | | | 1,038,292 | | | | 2,098,723 | |
| Net change in unrealized appreciation (depreciation) on investments | | | (191,264 | ) | | | 4,628,363 | |
| Net increase in net assets resulting from operations | | | 11,007,937 | | | | 13,366,109 | |
| | | | | | | | | |
| Distributions to shareholders from: | | | | | | | | |
| Net investment income | | | | | | | | |
| A-Class | | | (5,543,696 | ) | | | (4,978,867 | ) |
| C-Class | | | (809,552 | ) | | | (868,592 | ) |
| P-Class | | | (165,374 | ) | | | (57,008 | ) |
| Institutional Class | | | (4,160,219 | ) | | | (1,157,024 | ) |
| Total distributions to shareholders | | | (10,678,841 | ) | | | (7,061,491 | ) |
| | | | | | | | | |
| Capital share transactions: | | | | | | | | |
| Proceeds from sale of shares | | | | | | | | |
| A-Class | | | 68,572,987 | | | | 66,630,224 | |
| C-Class | | | 5,322,726 | | | | 19,854,556 | |
| P-Class | | | 18,599,465 | | | | 3,885,131 | |
| Institutional Class | | | 85,698,634 | | | | 85,970,913 | |
| Distributions reinvested | | | | | | | | |
| A-Class | | | 5,078,949 | | | | 4,737,216 | |
| C-Class | | | 705,067 | | | | 761,108 | |
| P-Class | | | 165,374 | | | | 57,008 | |
| Institutional Class | | | 4,051,788 | | | | 893,933 | |
| Cost of shares redeemed | | | | | �� | | | |
| A-Class | | | (61,989,844 | ) | | | (31,331,066 | ) |
| C-Class | | | (13,889,018 | ) | | | (9,542,796 | ) |
| P-Class | | | (4,553,931 | ) | | | (946,105 | ) |
| Institutional Class | | | (31,294,035 | ) | | | (12,097,691 | ) |
| Net increase from capital share transactions | | | 76,468,162 | | | | 128,872,431 | |
| Net increase in net assets | | | 76,797,258 | | | | 135,177,049 | |
| | | | | | | | | |
| Net assets: | | | | | | | | |
| Beginning of year | | | 281,226,972 | | | | 146,049,923 | |
| End of year | | $ | 358,024,230 | | | $ | 281,226,972 | |
| Undistributed net income investment at end of period/Accumulated net investment loss at end of year | | $ | 347,181 | | | $ | (747,212 | ) |
62 | THE GUGGENHEIM FUNDS ANNUAL REPORT | SEE NOTES TO FINANCIAL STATEMENTS. |
| INVESTMENT GRADE BOND FUND | |
STATEMENTS OF CHANGES IN NET ASSETS (concluded) |
| | | Year Ended
September 30,
2017 | | | Year Ended
September 30,
2016 | |
| Capital share activity: | | | | | | |
| Shares sold | | | | | | |
| A-Class | | | 3,734,365 | | | | 3,676,365 | |
| C-Class | | | 291,471 | | | | 1,100,204 | |
| P-Class | | | 1,004,493 | | | | 214,391 | |
| Institutional Class | | | 4,668,101 | | | | 4,719,258 | |
| Shares issued from reinvestment of distributions | | | | | | | | |
| A-Class | | | 276,636 | | | | 261,551 | |
| C-Class | | | 38,586 | | | | 42,199 | |
| P-Class | | | 8,989 | | | | 3,148 | |
| Institutional Class | | | 220,822 | | | | 48,739 | |
| Shares redeemed | | | | | | | | |
| A-Class | | | (3,377,947 | ) | | | (1,727,722 | ) |
| C-Class | | | (760,143 | ) | | | (529,935 | ) |
| P-Class | | | (247,641 | ) | | | (51,857 | ) |
| Institutional Class | | | (1,710,778 | ) | | | (661,553 | ) |
| Net increase in shares | | | 4,146,954 | | | | 7,094,788 | |
| SEE NOTES TO FINANCIAL STATEMENTS. | THE GUGGENHEIM FUNDS ANNUAL REPORT | 63 |
| INVESTMENT GRADE BOND FUND | |
This table is presented to show selected data for a share outstanding throughout each period and to assist shareholders in evaluating a Fund’s performance for the periods presented.
| A-Class | | Year Ended
September 30,
2017 | | | Year Ended
September 30,
2016 | | | Year Ended
September 30,
2015 | | | Year Ended
September 30,
2014 | | | Year Ended
September 30,
2013 | |
| Per Share Data | | | | | | | | | | | | | | | |
| Net asset value, beginning of period | | $ | 18.55 | | | $ | 18.10 | | | $ | 18.50 | | | $ | 17.81 | | | $ | 17.92 | |
| Income (loss) from investment operations: | |
Net investment income (loss)a | | | .59 | | | | .64 | | | | .69 | | | | .65 | | | | .61 | |
| Net gain (loss) on investments (realized and unrealized) | | | .02 | | | | .50 | | | | (.30 | ) | | | .83 | | | | (.04 | ) |
| Total from investment operations | | | .61 | | | | 1.14 | | | | .39 | | | | 1.48 | | | | .57 | |
| Less distributions from: | |
| Net investment income | | | (.61 | ) | | | (.69 | ) | | | (.79 | ) | | | (.79 | ) | | | (.68 | ) |
| Total distributions | | | (.61 | ) | | | (.69 | ) | | | (.79 | ) | | | (.79 | ) | | | (.68 | ) |
| Net asset value, end of period | | $ | 18.55 | | | $ | 18.55 | | | $ | 18.10 | | | $ | 18.50 | | | $ | 17.81 | |
| | |
Total Returnb | | | 3.39 | % | | | 6.50 | % | | | 2.12 | % | | | 8.47 | % | | | 3.21 | % |
| Ratios/Supplemental Data | |
| Net assets, end of period (in thousands) | | $ | 170,624 | | | $ | 158,932 | | | $ | 115,019 | | | $ | 99,565 | | | $ | 83,642 | |
| Ratios to average net assets: | |
| Net investment income (loss) | | | 3.19 | % | | | 3.55 | % | | | 3.72 | % | | | 3.55 | % | | | 3.40 | % |
Total expensesc | | | 1.07 | % | | | 1.08 | % | | | 1.17 | % | | | 1.19 | % | | | 1.21 | % |
Net expensesd,h | | | 1.02 | %e | | | 1.03 | % | | | 1.07 | % | | | 1.05 | % | | | 1.04 | % |
| Portfolio turnover rate | | | 81 | % | | | 100 | % | | | 57 | % | | | 61 | % | | | 119 | % |
| C-Class | | Year Ended
September 30,
2017 | | | Year Ended
September 30,
2016 | | | Year Ended
September 30,
2015 | | | Year Ended
September 30,
2014 | | | Year Ended
September 30,
2013 | |
| Per Share Data | | | | | | | | | | | | | | | |
| Net asset value, beginning of period | | $ | 18.48 | | | $ | 18.02 | | | $ | 18.42 | | | $ | 17.73 | | | $ | 17.82 | |
| Income (loss) from investment operations: | |
Net investment income (loss)a | | | .45 | | | | .51 | | | | .55 | | | | .51 | | | | .48 | |
| Net gain (loss) on investments (realized and unrealized) | | | .02 | | | | .51 | | | | (.30 | ) | | | .83 | | | | (.05 | ) |
| Total from investment operations | | | .47 | | | | 1.02 | | | | .25 | | | | 1.34 | | | | .43 | |
| Less distributions from: | |
| Net investment income | | | (.48 | ) | | | (.56 | ) | | | (.65 | ) | | | (.65 | ) | | | (.52 | ) |
| Total distributions | | | (.48 | ) | | | (.56 | ) | | | (.65 | ) | | | (.65 | ) | | | (.52 | ) |
| Net asset value, end of period | | $ | 18.47 | | | $ | 18.48 | | | $ | 18.02 | | | $ | 18.42 | | | $ | 17.73 | |
| | |
Total Returnb | | | 2.59 | % | | | 5.78 | % | | | 1.36 | % | | | 7.69 | % | | | 2.42 | % |
| Ratios/Supplemental Data | |
| Net assets, end of period (in thousands) | | $ | 28,083 | | | $ | 36,040 | | | $ | 24,111 | | | $ | 20,673 | | | $ | 17,876 | |
| Ratios to average net assets: | |
| Net investment income (loss) | | | 2.47 | % | | | 2.81 | % | | | 3.00 | % | | | 2.80 | % | | | 2.65 | % |
Total expensesc | | | 1.85 | % | | | 1.90 | % | | | 1.99 | % | | | 1.99 | % | | | 2.03 | % |
Net expensesd,h | | | 1.77 | %e | | | 1.77 | % | | | 1.82 | % | | | 1.80 | % | | | 1.79 | % |
| Portfolio turnover rate | | | 81 | % | | | 100 | % | | | 57 | % | | | 61 | % | | | 119 | % |
64 | THE GUGGENHEIM FUNDS ANNUAL REPORT | SEE NOTES TO FINANCIAL STATEMENTS. |
| INVESTMENT GRADE BOND FUND | |
FINANCIAL HIGHLIGHTS (continued) |
This table is presented to show selected data for a share outstanding throughout each period and to assist shareholders in evaluating a Fund’s performance for the periods presented.
| P-Class | | Year Ended
September 30,
2017 | | | Year Ended
September 30,
2016 | | | Period Ended
September 30,
2015f | |
| Per Share Data | | | | | | | | | |
| Net asset value, beginning of period | | $ | 18.57 | | | $ | 18.12 | | | $ | 18.45 | |
| Income (loss) from investment operations: | |
Net investment income (loss)a | | | .56 | | | | .59 | | | | .25 | |
| Net gain (loss) on investments (realized and unrealized) | | | .05 | | | | .55 | | | | (.26 | ) |
| Total from investment operations | | | .61 | | | | 1.14 | | | | (.01 | ) |
| Less distributions from: | |
| Net investment income | | | (.62 | ) | | | (.69 | ) | | | (.32 | ) |
| Total distributions | | | (.62 | ) | | | (.69 | ) | | | (.32 | ) |
| Net asset value, end of period | | $ | 18.56 | | | $ | 18.57 | | | $ | 18.12 | |
| | |
Total Returnb | | | 3.33 | % | | | 6.51 | % | | | (0.11 | %) |
| Ratios/Supplemental Data | |
| Net assets, end of period (in thousands) | | $ | 17,303 | | | $ | 3,087 | | | $ | 10 | |
| Ratios to average net assets: | |
| Net investment income (loss) | | | 3.06 | % | | | 3.25 | % | | | 3.25 | % |
Total expensesc | | | 1.13 | % | | | 0.98 | % | | | 3.29 | % |
Net expensesd,h | | | 1.01 | %e | | | 0.98 | % | | | 1.09 | % |
| Portfolio turnover rate | | | 81 | % | | | 100 | % | | | 57 | % |
| SEE NOTES TO FINANCIAL STATEMENTS. | THE GUGGENHEIM FUNDS ANNUAL REPORT | 65 |
| INVESTMENT GRADE BOND FUND | |
FINANCIAL HIGHLIGHTS (concluded) |
This table is presented to show selected data for a share outstanding throughout each period and to assist shareholders in evaluating a Fund’s performance for the periods presented.
| Institutional Class | | Year Ended
September 30,
2017 | | | Year Ended
September 30,
2016 | | | Year Ended
September 30,
2015 | | | Year Ended
September 30,
2014 | | | Period Ended
September 30,
2013g | |
| Per Share Data | | | | | | | | | | | | | | | |
| Net asset value, beginning of period | | $ | 18.53 | | | $ | 18.07 | | | $ | 18.47 | | | $ | 17.80 | | | $ | 18.00 | |
| Income (loss) from investment operations: | |
Net investment income (loss)a | | | .64 | | | | .62 | | | | .74 | | | | .68 | | | | .46 | |
| Net gain (loss) on investments (realized and unrealized) | | | .02 | | | | .58 | | | | (.31 | ) | | | .83 | | | | (.21 | ) |
| Total from investment operations | | | .66 | | | | 1.20 | | | | .43 | | | | 1.51 | | | | .25 | |
| Less distributions from: | |
| Net investment income | | | (.67 | ) | | | (.74 | ) | | | (.83 | ) | | | (.84 | ) | | | (.45 | ) |
| Total distributions | | | (.67 | ) | | | (.74 | ) | | | (.83 | ) | | | (.84 | ) | | | (.45 | ) |
| Net asset value, end of period | | $ | 18.52 | | | $ | 18.53 | | | $ | 18.07 | | | $ | 18.47 | | | $ | 17.80 | |
| | |
Total Returnb | | | 3.67 | % | | | 6.83 | % | | | 2.37 | % | | | 8.64 | % | | | 1.35 | % |
| Ratios/Supplemental Data | |
| Net assets, end of period (in thousands) | | $ | 142,014 | | | $ | 83,168 | | | $ | 6,910 | | | $ | 5,909 | | | $ | 174 | |
| Ratios to average net assets: | |
| Net investment income (loss) | | | 3.51 | % | | | 3.41 | % | | | 4.01 | % | | | 3.72 | % | | | 3.85 | % |
Total expensesc | | | 0.74 | % | | | 0.76 | % | | | 0.94 | % | | | 0.88 | % | | | 1.17 | % |
Net expensesd,h | | | 0.70 | %e | | | 0.76 | % | | | 0.82 | % | | | 0.78 | % | | | 0.82 | % |
| Portfolio turnover rate | | | 81 | % | | | 100 | % | | | 57 | % | | | 61 | % | | | 119 | % |
a | Net investment income (loss) per share was computed using average shares outstanding throughout the period. |
b | Total return does not reflect the impact of any applicable sales charges and has not been annualized. |
c | Does not include expenses of the underlying funds in which the Fund invests. |
d | Net expense information reflects the expense ratios after expense waivers. |
e | The portion of the ratios of net expenses to average net assets attributable to recoupments of prior fee reductions of expense reimbursements is 0.05% for A-Class, 0.03% for C-Class, 0.01% for P-Class, and 0.02% Institutional Class. |
f | Since commencement of operations: May 1, 2015. Percentage amounts for the period, except total return and portfolio turnover rate, have been annualized. |
g | Since commencement of operations: January 29, 2013. Percentage amounts for the period, except total return and portfolio turnover rate, have been annualized. |
h | Net expenses may include expenses that are excluded from the expense limitation agreement. Excluding these expenses, the operating expense ratios for the years would be: |
| | | 09/30/17 | 09/30/16 | 09/30/15 | 09/30/14 | 09/30/13 |
| | A-Class | 1.00% | 1.00% | 1.00% | 1.00% | 1.02% |
| | C-Class | 1.75% | 1.74% | 1.75% | 1.75% | 1.77% |
| | P-Class | 0.99% | 0.97% | 1.00% | N/A | N/A |
| | Institutional Class | 0.68% | 0.75% | 0.75% | 0.75% | 0.77% |
66 | THE GUGGENHEIM FUNDS ANNUAL REPORT | SEE NOTES TO FINANCIAL STATEMENTS. |
MANAGERS’ COMMENTARY (Unaudited) | September 30, 2017 |
To Our Shareholders
Guggenheim Limited Duration Fund (the “Fund”) is managed by a team of seasoned professionals, including Anne B. Walsh, Senior Managing Director and Assistant Chief Investment Officer; James W. Michal, Senior Managing Director and Portfolio Manager; Steven H. Brown, CFA, Managing Director and Portfolio Manager; and Adam Bloch, Director and Portfolio Manager. In the following paragraphs, the investment team discusses the market environment and the Fund’s performance for the fiscal year ended September 30, 2017.
For the one-year period ended September 30, 2017, Guggenheim Limited Duration Fund returned 2.95%1, compared with the 0.69% return of its benchmark, the Bloomberg Barclays U.S. Aggregate Bond 1-3 Year Total Return Index.
The Fund seeks to provide a high level of income consistent with the preservation of capital. It invests at least 80% of its assets in a diversified portfolio of debt securities.
In June, the U.S. Federal Reserve (the “Fed”) delivered its fourth rate hike since the financial crisis, raising the fed funds rate target range to 1.00–1.25%. As long as the unemployment rate continues to decline, we believe the Fed will feel compelled to continue hiking to stay ahead of potential inflationary pressures, given the lags associated with monetary policy effects. The Fund is positioned for a rising interest rate environment with over 70% floating rate at September 30, 2017.
During the period, returns were chiefly driven by the portfolio’s investments in collateralized loan obligations (“CLOs”) and non-agency residential mortgage back securities (“NA RMBS”).
The Fund rotated into higher quality assets and increased cash as market valuations signaled caution.
The Fund’s positive returns were largely attributable to the tightening of credit spreads and the Fund’s carry; losses attributable to the increase in interest rates over the period were mitigated by the Fund maintaining low duration over the period.
The Fund also uses derivatives to hedge against changes in interest rates and foreign asset exposure. For the period, derivatives as a whole detracted slightly from return.
CLOs offered attractive risk-adjusted returns. The Fund favored less credit risk and spread duration, specifically the shorter and higher-quality tranches. Investment-grade CLOs offered spread pickup versus investment-grade corporate bonds.
NA RMBS holdings were a positive contributor due to carry as well as price appreciation. Prices appreciated from spread tightening and improving market expectations for future cash flows. Impact from curve flattening was mitigated given the floating and low duration characteristics of the NA RMBS holdings.
The Fund will continue to focus on allocating to structured credit that may help shield investors from interest rate volatility without having to sacrifice yield.
The Fund invests excess cash into the Guggenheim Strategy Funds which, in turn, invest in a diversified portfolio of debt securities and financial instruments providing exposure to fixed income markets. The investment objective of the Guggenheim Strategy Funds is to seek a high level of income consistent with the preservation of capital. For the one -year period ended September 30, 2017, investment in the Guggenheim Strategy Funds has benefited Fund performance relative to investing in other short-term investments.
Performance displayed represents past performance which is no guarantee of future results.
1 | Performance figures are based on Class A shares and do not reflect deduction of the sales charges or taxes that a shareholder would pay on distributions or the redemption of shares. |
The opinions and forecast expressed may not actually come to pass. This information is subject to change at any time, based on market and other conditions, and should not be construed as a recommendation of any specific security or strategy.
| | THE GUGGENHEIM FUNDS ANNUAL REPORT | 67 |
PERFORMANCE REPORT AND FUND PROFILE (Unaudited) | September 30, 2017 |
LIMITED DURATION FUND
OBJECTIVE: Seeks to provide a high level of income consistent with preservation of capital.
Holdings Diversification (Market Exposure as % of Net Assets)
“Holdings Diversification (Market Exposure as % of Net Assets)” excludes any temporary cash investments or investments in Guggenheim Strategy Funds Trust mutual funds.
| Inception Dates: |
| A-Class | December 16, 2013 |
| C-Class | December 16, 2013 |
| P-Class | May 1, 2015 |
| Institutional Class | December 16, 2013 |
| Ten Largest Holdings (% of Total Net Assets) |
| Government of United Kingdom, 10/02/17 | 2.0% |
| Republic of Portugal, 11/17/17 | 1.9% |
| Kingdom of Denmark 4.00% | 1.9% |
| Republic of Italy | 1.9% |
| Republic of France, 10/04/17 | 1.7% |
| Government of Japan, 12/11/17 | 1.7% |
| State of Israel, 10/31/17 | 1.5% |
| Kingdom of Spain, 10/13/17 | 1.5% |
| United Mexican States 01/04/18 | 1.2% |
| Guggenheim Floating Rate Strategies Fund - Institutional Class | 1.2% |
| Top Ten Total | 16.5% |
| “Ten Largest Holdings” excludes any temporary cash or derivative investments. |
Portfolio Composition by Quality Rating1 |
| Rating | |
| Fixed Income Instruments | |
| AAA | 27.5% |
| AA | 13.8% |
| A | 22.7% |
| BBB | 20.2% |
| BB | 2.5% |
| B | 2.5% |
| CCC | 0.3% |
| CC | 0.1% |
NR2 | 6.2% |
| Other Instruments | 4.2% |
| Total Investments | 100.0% |
| The chart above reflects percentages of the value of total investments. |
1 | Source: BlackRock Solutions. Credit quality ratings are measured on a scale that generally ranges from AAA (highest) to D (lowest). All securities except for those labeled “NR” have been rated by a Nationally Recognized Statistical Rating Organization (“NRSRO”). For purposes of this presentation, when ratings are available from more than one agency, the highest rating is used. Guggenheim Investments converts ratings to the equivalent S&P rating. |
2 | NR securities do not necessarily indicate low credit quality. |
| 68 | THE GUGGENHEIM FUNDS ANNUAL REPORT | |
PERFORMANCE REPORT AND FUND PROFILE (Unaudited)(concluded) | September 30, 2017 |
Cumulative Fund Performance*
Average Annual Returns*
Periods Ended September 30, 2017
| | 1 Year | Since Inception
(12/16/13) |
| A-Class Shares | 2.95% | 2.64% |
A-Class Shares with sales charge† | 0.62% | 2.02% |
| Bloomberg Barclays U.S. Aggregate Bond 1-3 Year Total Return Index | 0.69% | 1.01% |
| | | Since Inception
(12/16/13) |
| C-Class Shares | 2.18% | 1.87% |
C-Class Shares with CDSC§ | 1.18% | 1.87% |
| Bloomberg Barclays U.S. Aggregate Bond 1-3 Year Total Return Index | 0.69% | 1.01% |
| | | Since Inception
(05/01/15) |
| P-Class Shares | 2.93% | 2.65% |
| Bloomberg Barclays U.S. Aggregate Bond 1-3 Year Total Return Index | 0.69% | 1.00% |
| | | Since Inception
(12/16/13) |
| Institutional Class Shares | 3.21% | 2.91% |
| Bloomberg Barclays U.S. Aggregate Bond 1-3 Year Total Return Index | 0.69% | 1.01% |
| * | The performance data above represents past performance that is not predictive of future results. The investment return and principal value of an investment in the Fund will fluctuate so that an investor’s shares, when redeemed, may be worth more or less than their original cost. Returns are historical and include changes in principal and reinvested dividends and capital gains and do not reflect the effect of taxes. The Bloomberg Barclays U.S. Aggregate Bond 1-3 Year Total Return Index is an unmanaged index and, unlike the Fund, has no management fees or operating expenses to reduce its reported return. |
† | Fund returns are calculated using the maximum sales charge of 2.25%. |
§ | Fund returns include a CDSC of 1% if redeemed within 12 months of purchase. |
| | THE GUGGENHEIM FUNDS ANNUAL REPORT | 69 |
| SCHEDULE OF INVESTMENTS | September 30, 2017 |
| LIMITED DURATION FUND | |
| | | Shares | | | Value | |
| | | | | | | |
MUTUAL FUNDS† - 2.8% | |
Guggenheim Floating Rate Strategies Fund - Institutional Class1 | | | 1,047,559 | | | $ | 27,278,433 | |
Guggenheim Strategy Fund II1 | | | 572,612 | | | | 14,349,646 | |
Guggenheim Strategy Fund I1 | | | 501,781 | | | | 12,599,724 | |
Guggenheim Strategy Fund III1 | | | 374,644 | | | | 9,381,097 | |
| Total Mutual Funds | | | | | | | | |
| (Cost $63,434,615) | | | | | | | 63,608,900 | |
| | | | | | | | | |
MONEY MARKET FUND† - 1.5% | |
Dreyfus Treasury Securities Cash Management Fund - Institutional Class 0.90%2 | | | 34,712,289 | | | | 34,712,289 | |
| Total Money Market Fund | | | | | | | | |
| (Cost $34,712,289) | | | | | | | 34,712,289 | |
| | | | | | | | | |
| | | Face
Amount~ | | | | | |
| | | | | | | | | |
ASSET-BACKED SECURITIES†† - 36.6% | |
| Collateralized Loan Obligations - 28.8% | |
| CIFC Funding Ltd. | | | | | | | | |
2017-3A, 2.26% (3 Month USD LIBOR + 95 bps) due 07/22/263,4 | | | 14,500,000 | | | | 14,499,782 | |
2016-1A, 3.26% (3 Month USD LIBOR + 195 bps) due 01/22/273,4 | | | 8,500,000 | | | | 8,530,321 | |
2017-4A, 2.68% (3 Month USD LIBOR + 138 bps) due 10/17/263,4 | | | 5,000,000 | | | | 5,022,194 | |
2015-2A, 3.22% (3 Month USD LIBOR + 190 bps) due 12/05/243,4 | | | 2,000,000 | | | | 2,001,582 | |
2015-2A, 4.02% (3 Month USD LIBOR + 270 bps) due 12/05/243,4 | | | 1,990,000 | | | | 1,993,576 | |
| Telos CLO Ltd. | | | | | | | | |
2017-6A, 2.57% (3 Month USD LIBOR + 127 bps) due 01/17/273,4 | | | 19,900,000 | | | | 19,963,226 | |
2013-4A, 4.05% (3 Month USD LIBOR + 275 bps) due 07/17/243,4 | | | 500,000 | | | | 503,751 | |
| Venture XVI CLO Ltd. | | | | | | | | |
2017-16A, 2.42% (3 Month USD LIBOR + 112 bps) due 04/15/263,4 | | | 20,000,000 | | | | 20,091,564 | |
| Fortress Credit BSL II Ltd. | | | | | | | | |
2017-2A, 2.46% (3 Month USD LIBOR + 115 bps) due 10/19/253,4 | | | 19,000,000 | | | | 19,067,862 | |
| Fortress Credit Opportunities III CLO, LP | | | | | | | | |
2017-3A, 2.95% (3 Month USD LIBOR + 165 bps) due 04/28/263,4 | | | 15,000,000 | | | | 15,064,537 | |
2017-3A, 4.00% due 04/28/264 | | | 1,800,000 | | | | 1,802,487 | |
2017-3A, 3.55% (3 Month USD LIBOR + 225 bps) due 04/28/263,4 | | | 1,000,000 | | | | 1,000,630 | |
| Great Lakes CLO Ltd. | | | | | | | | |
2014-1A, 3.15% (3 Month USD LIBOR + 185 bps) due 04/15/253,4 | | | 10,000,000 | | | | 10,009,189 | |
2015-1A, 3.25% (3 Month USD LIBOR + 195 bps) due 07/15/263,4 | | | 5,000,000 | | | | 5,014,094 | |
2012-1A, 3.13% (3 Month USD LIBOR + 183 bps) due 01/15/233,4 | | | 2,345,764 | | | | 2,347,059 | |
2014-1A, 5.00% (3 Month USD LIBOR + 370 bps) due 04/15/253,4 | | | 250,000 | | | | 250,006 | |
| Fortress Credit Opportunities VII CLO Ltd. | | | | | | | | |
2016-7A, 3.37% (3 Month USD LIBOR + 205 bps) due 12/15/283,4 | | | 17,000,000 | | | | 17,067,690 | |
| Golub Capital Partners CLO Ltd. | | | | | | | | |
2016-33A, 3.80% (3 Month USD LIBOR + 248 bps) due 11/21/283,4 | | | 9,000,000 | | | | 8,976,164 | |
2015-25A, 3.11% (3 Month USD LIBOR + 180 bps) due 08/05/273,4 | | | 5,000,000 | | | | 5,008,229 | |
2015-23A, 3.46% (3 Month USD LIBOR + 215 bps) due 05/05/273,4 | | | 1,000,000 | | | | 1,011,294 | |
2015-24A, 5.06% (3 Month USD LIBOR + 375 bps) due 02/05/273,4 | | | 1,000,000 | | | | 1,000,970 | |
2014-21A, 3.76% (3 Month USD LIBOR + 245 bps) due 10/25/263,4 | | | 500,000 | | | | 493,593 | |
2014-18A, 4.81% (3 Month USD LIBOR + 350 bps) due 04/25/263,4 | | | 250,000 | | | | 249,605 | |
2014-18A, 5.31% (3 Month USD LIBOR + 400 bps) due 04/25/263,4 | | | 250,000 | | | | 245,506 | |
| Oaktree EIF II Series A2 Ltd. | | | | | | | | |
2017-A2, 2.47% (3 Month USD LIBOR + 115 bps) due 11/15/253,4 | | | 14,600,000 | | | | 14,631,568 | |
| Hunt CRE Ltd. | | | | | | | | |
2017-FL1, 2.23% (1 Month USD LIBOR + 100 bps) due 08/15/343,4 | | | 14,600,000 | | | | 14,608,808 | |
| Vibrant CLO II Ltd. | | | | | | | | |
2017-2A, 2.21% (3 Month USD LIBOR + 90 bps) due 07/24/243,4 | | | 8,600,000 | | | | 8,593,871 | |
2017-2A, 2.76% (3 Month USD LIBOR + 145 bps) due 07/24/243,4 | | | 4,850,000 | | | | 4,846,812 | |
| Steele Creek CLO Ltd. | | | | | | | | |
2017-1A, 2.65% (3 Month USD LIBOR + 133 bps) due 08/21/263,4 | | | 11,300,000 | | | | 11,349,296 | |
2017-1A, 3.17% (3 Month USD LIBOR + 185 bps) due 08/21/263,4 | | | 2,000,000 | | | | 2,012,706 | |
| TICP CLO Ltd. | | | | | | | | |
2014-3A, 2.49% (3 Month USD LIBOR + 118 bps) due 01/20/273,4 | | | 13,350,000 | | | | 13,343,914 | |
| Vibrant CLO III Ltd. | | | | | | | | |
2016-3A, 2.79% (3 Month USD LIBOR + 148 bps) due 04/20/263,4 | | | 8,800,000 | | | | 8,859,168 | |
2016-3A, 3.36% (3 Month USD LIBOR + 205 bps) due 04/20/263,4 | | | 4,000,000 | | | | 3,986,386 | |
| KVK CLO Ltd. | | | | | | | | |
2017-1A, 3.12% (3 Month USD LIBOR + 180 bps) due 05/15/263,4 | | | 5,600,000 | | | | 5,639,361 | |
2017-2A, 2.48% (3 Month USD LIBOR + 118 bps) due 07/15/263,4 | | | 5,000,000 | | | | 5,005,924 | |
2017-2A, 3.85% (3 Month USD LIBOR + 255 bps) due 07/15/263,4 | | | 1,000,000 | | | | 1,002,974 | |
2013-1A, due 04/14/254,5 | | | 750,000 | | | | 264,181 | |
70 | THE GUGGENHEIM FUNDS ANNUAL REPORT | SEE NOTES TO FINANCIAL STATEMENTS. |
SCHEDULE OF INVESTMENTS (continued) | September 30, 2017 |
| LIMITED DURATION FUND | |
| | | Face
Amount~ | | | Value | |
| | | | | | | |
| Palmer Square CLO Ltd. | | | | | | |
2017-1A, 2.29% (3 Month USD LIBOR + 97 bps) due 05/15/253,4 | | | 11,305,989 | | | $ | 11,319,619 | |
| Fortress Credit Opportunities V CLO Ltd. | | | | | | | | |
2017-5A, 3.00% (3 Month USD LIBOR + 170 bps) due 10/15/263,4 | | | 5,200,000 | | | | 5,232,843 | |
2017-5A, 3.40% due 10/15/264 | | | 4,000,000 | | | | 4,016,183 | |
2017-5A, 3.65% (3 Month USD LIBOR + 235 bps) due 10/15/263,4 | | | 1,000,000 | | | | 1,006,897 | |
2017-5A, 4.45% (3 Month USD LIBOR + 315 bps) due 10/15/263,4 | | | 1,000,000 | | | | 1,003,100 | |
| Figueroa CLO Ltd. | | | | | | | | |
2017-2A, 2.58% (3 Month USD LIBOR + 125 bps) due 06/20/273,4 | | | 10,000,000 | | | | 10,019,342 | |
2013-1A, 4.07% (3 Month USD LIBOR + 275 bps) due 03/21/243,4 | | | 500,000 | | | | 500,012 | |
| Carlyle Global Market Strategies CLO Ltd. | | | | | | | | |
2013-2A, 2.45% (3 Month USD LIBOR + 115 bps) due 04/18/253,4 | | | 7,762,363 | | | | 7,765,050 | |
2013-4A, 2.77% (3 Month USD LIBOR + 147 bps) due 10/15/253,4 | | | 2,000,000 | | | | 1,999,229 | |
| PFP Ltd. | | | | | | | | |
2017-3, 2.28% (1 Month USD LIBOR + 105 bps) due 01/14/353,4 | | | 6,678,455 | | | | 6,688,873 | |
2015-2, 3.23% (1 Month USD LIBOR + 200 bps) due 07/14/343,4 | | | 3,000,000 | | | | 2,996,793 | |
| Resource Capital Corporation Ltd. | | | | | | | | |
2017-CRE5, 2.03% (1 Month USD LIBOR + 80 bps) due 07/15/343,4 | | | 9,500,000 | | | | 9,520,748 | |
| Jamestown CLO III Ltd. | | | | | | | | |
2017-3A, 2.44% (3 Month USD LIBOR + 114 bps) due 01/15/263,4 | | | 9,400,000 | | | | 9,416,298 | |
| ACIS CLO Ltd. | | | | | | | | |
2013-1A, 2.17% (3 Month USD LIBOR + 87 bps) due 04/18/243,4 | | | 4,855,161 | | | | 4,854,118 | |
2014-4A, 2.73% (3 Month USD LIBOR + 142 bps) due 05/01/263,4 | | | 4,000,000 | | | | 4,008,698 | |
| ABPCI Direct Lending Fund CLO I LLC | | | | | | | | |
2016-1A, 4.08% (3 Month USD LIBOR + 270 bps) due 12/22/283,4 | | | 8,000,000 | | | | 7,979,189 | |
| NXT Capital CLO LLC | | | | | | | | |
2017-1A, 3.13% (3 Month USD LIBOR + 170 bps) due 04/20/293,4 | | | 7,700,000 | | | | 7,691,362 | |
| Seneca Park CLO Limited | | | | | | | | |
2017-1A, 2.80% (3 Month USD LIBOR + 150 bps) due 07/17/263,4 | | | 4,000,000 | | | | 4,013,995 | |
2017-1A, 2.42% (3 Month USD LIBOR + 112 bps) due 07/17/263,4 | | | 3,500,000 | | | | 3,513,056 | |
| Northwoods Capital X Ltd. | | | | | | | | |
2017-10A, 2.86% (3 Month USD LIBOR + 155 bps) due 11/04/253,4 | | | 4,000,000 | | | | 4,001,249 | |
2017-10A, 2.39% (3 Month USD LIBOR + 108 bps) due 11/04/253,4 | | | 3,500,000 | | | | 3,505,194 | |
| TICP CLO II Ltd. | | | | | | | | |
2017-2A, 2.86% (3 Month USD LIBOR + 155 bps) due 07/20/263,4 | | | 4,000,000 | | | | 3,999,925 | |
| TICP CLO II Ltd. | | | | | | | | |
2017-2A, 2.47% (3 Month USD LIBOR + 116 bps) due 07/20/263,4 | | | 3,500,000 | | | | 3,500,803 | |
| ABPCI Direct Lending Fund CLO II LLC | | | | | | | | |
2017-1A, 3.25% (3 Month USD LIBOR + 178 bps) due 07/20/293,4 | | | 7,500,000 | | | | 7,489,955 | |
| Crown Point CLO III Ltd. | | | | | | | | |
2015-3A, 2.27% (3 Month USD LIBOR + 91 bps) due 12/31/273 | | | 7,270,000 | | | | 7,271,277 | |
| Woodmont Trust | | | | | | | | |
2017-3A, 3.30% (3 Month USD LIBOR + 173 bps) due 10/18/293,4 | | | 4,700,000 | | | | 4,693,407 | |
2017-2A, 3.03% (3 Month USD LIBOR + 180 bps) due 07/18/283,4 | | | 2,500,000 | | | | 2,496,952 | |
| Flagship CLO VIII Ltd. | | | | | | | | |
2017-8A, 3.00% (3 Month USD LIBOR + 170 bps) due 01/16/263,4 | | | 6,900,000 | | | | 6,934,965 | |
| Cerberus Loan Funding XVII Ltd. | | | | | | | | |
2016-3A, 3.69% (3 Month USD LIBOR + 253 bps) due 01/15/283,4 | | | 6,500,000 | | | | 6,494,446 | |
| A Voce CLO Ltd. | | | | | | | | |
2017-1A, 2.46% (3 Month USD LIBOR + 116 bps) due 07/15/263,4 | | | 6,400,000 | | | | 6,401,501 | |
| Avery Point V CLO Ltd. | | | | | | | | |
2017-5A, 2.28% (3 Month USD LIBOR + 98 bps) due 07/17/263,4 | | | 6,300,000 | | | | 6,331,500 | |
| Venture XIX CLO Ltd. | | | | | | | | |
2016-19A, 3.30% (3 Month USD LIBOR + 200 bps) due 01/15/273,4 | | | 6,100,000 | | | | 6,194,683 | |
| Crown Point CLO II Ltd. | | | | | | | | |
2013-2A, 3.23% (3 Month USD LIBOR + 193 bps) due 12/31/233,4 | | | 6,000,000 | | | | 6,034,527 | |
| Catamaran CLO Ltd. | | | | | | | | |
2016-1A, 3.22% (3 Month USD LIBOR + 195 bps) due 12/20/233,4 | | | 3,250,000 | | | | 3,250,861 | |
2014-1A, 3.96% (3 Month USD LIBOR + 265 bps) due 04/20/263,4 | | | 2,750,000 | | | | 2,769,289 | |
| Cent CDO 14 Ltd. | | | | | | | | |
2007-14A, 2.00% (3 Month USD LIBOR + 70 bps) due 04/15/213,4 | | | 6,000,000 | | | | 5,798,303 | |
| Northwoods Capital Ltd. | | | | | | | | |
2017-14A, 2.61% (3 Month USD LIBOR + 130 bps) due 11/12/253,4 | | | 5,700,000 | | | | 5,710,798 | |
| GoldenTree Loan Opportunities VII Ltd. | | | | | | | | |
2013-7A, 2.46% (3 Month USD LIBOR + 115 bps) due 04/25/253,4 | | | 5,681,745 | | | | 5,703,166 | |
| Cent CLO LP | | | | | | | | |
2017-21A, 2.53% (3 Month USD LIBOR + 121 bps) due 07/27/263,4 | | | 5,500,000 | | | | 5,514,617 | |
| Cent CLO 20 Ltd. | | | | | | | | |
2017-20A, 2.94% (3 Month USD LIBOR + 163 bps) due 01/25/263,4 | | | 3,250,000 | | | | 3,249,093 | |
2017-20A, 2.41% (3 Month USD LIBOR + 110 bps) due 01/25/263,4 | | | 2,100,000 | | | | 2,102,428 | |
| Galaxy XVIII CLO Ltd. | | | | | | | | |
2017-18A, 2.47% (3 Month USD LIBOR + 117 bps) due 10/15/263,4 | | | 5,300,000 | | | | 5,309,557 | |
| SEE NOTES TO FINANCIAL STATEMENTS. | THE GUGGENHEIM FUNDS ANNUAL REPORT | 71 |
SCHEDULE OF INVESTMENTS (continued) | September 30, 2017 |
| LIMITED DURATION FUND | |
| | | Face
Amount~ | | | Value | |
| | | | | | | |
| OZLM IX Ltd. | | | | | | |
2017-9A, 2.96% (3 Month USD LIBOR + 165 bps) due 01/20/273,4 | | | 5,100,000 | | | $ | 5,129,417 | |
| Venture XII CLO Ltd. | | | | | | | | |
2017-12A, 2.95% (3 Month USD LIBOR + 163 bps) due 02/28/263,4 | | | 5,100,000 | | | | 5,107,112 | |
| Flagship CLO | | | | | | | | |
2017-8A, 2.55% (3 Month USD LIBOR + 125 bps) due 01/16/263,4 | | | 5,000,000 | | | | 5,013,647 | |
| Atlas Senior Loan Fund IV Ltd. | | | | | | | | |
2017-2A, 2.77% (3 Month USD LIBOR + 145 bps) due 02/17/263,4 | | | 5,000,000 | | | | 4,994,276 | |
| Regatta V Funding Ltd. | | | | | | | | |
2017-1A, 2.47% (3 Month USD LIBOR + 116 bps) due 10/25/263,4 | | | 4,900,000 | | | | 4,901,251 | |
| Symphony CLO XIV Ltd. | | | | | | | | |
2017-14A, 3.15% (3 Month USD LIBOR + 185 bps) due 07/14/263,4 | | | 4,700,000 | | | | 4,718,893 | |
| Sound Point CLO IV Ltd. | | | | | | | | |
2017-3A, 2.41% (3 Month USD LIBOR + 110 bps) due 01/21/263,4 | | | 4,700,000 | | | | 4,716,455 | |
| Golub Capital Partners CLO 16 Ltd. | | | | | | | | |
2017-16A, 3.01% (3 Month USD LIBOR + 170 bps) due 07/25/293,4 | | | 4,700,000 | | | | 4,693,521 | |
| Oaktree EIF I Ltd. | | | | | | | | |
2016-A1, 3.90% (3 Month USD LIBOR + 260 bps) due 10/18/273,4 | | | 4,500,000 | | | | 4,502,772 | |
| Shackleton CLO Ltd. | | | | | | | | |
2016-7A, 3.25% (3 Month USD LIBOR + 195 bps) due 04/15/273,4 | | | 4,250,000 | | | | 4,275,974 | |
| TICP CLO I Ltd. | | | | | | | | |
2017-1A, 2.91% (3 Month USD LIBOR + 160 bps) due 04/26/263,4 | | | 4,250,000 | | | | 4,256,593 | |
| FDF II Ltd. | | | | | | | | |
2016-2A, 4.29% due 05/12/314 | | | 4,000,000 | | | | 4,096,535 | |
| Cerberus Loan Funding XVI, LP | | | | | | | | |
2016-2A, 3.35% (3 Month USD LIBOR + 205 bps) due 11/15/273,4 | | | 4,000,000 | | | | 4,075,566 | |
| TCP Waterman CLO Ltd. | | | | | | | | |
2016-1A, 3.30% (3 Month USD LIBOR + 205 bps) due 12/15/283,4 | | | 4,000,000 | | | | 4,067,493 | |
| Newstar Commercial Loan Funding LLC | | | | | | | | |
2017-1A, 3.77% (3 Month USD LIBOR + 250 bps) due 03/20/273,4 | | | 3,000,000 | | | | 3,013,630 | |
2016-1A, 5.07% (3 Month USD LIBOR + 375 bps) due 02/25/283,4 | | | 1,000,000 | | | | 1,000,940 | |
| WhiteHorse VI Ltd. | | | | | | | | |
2016-1A, 3.21% (3 Month USD LIBOR + 190 bps) due 02/03/253,4 | | | 4,000,000 | | | | 4,003,032 | |
| FS Senior Funding Ltd. | | | | | | | | |
2015-1A, 3.95% (3 Month USD LIBOR + 265 bps) due 05/28/253,4 | | | 2,000,000 | | | | 2,001,016 | |
2015-1A, 3.10% (3 Month USD LIBOR + 180 bps) due 05/28/253,4 | | | 2,000,000 | | | | 2,000,030 | |
| Cent CLO Ltd. | | | | | | | | |
2013-19A, 2.64% (3 Month USD LIBOR + 133 bps) due 10/29/253,4 | | | 3,850,000 | | | | 3,852,302 | |
| Fortress Credit Opportunities VI CLO Ltd. | | | | | | | | |
2015-6A, 3.22% (3 Month USD LIBOR + 190 bps) due 10/10/263,4 | | | 2,750,000 | | | | 2,749,903 | |
2015-6A, 4.02% (3 Month USD LIBOR + 270 bps) due 10/10/263,4 | | | 1,000,000 | | | | 1,001,355 | |
| OZLM VIII Ltd. | | | | | | | | |
2017-8A, 2.43% (3 Month USD LIBOR + 113 bps) due 10/17/263,4 | | | 3,750,000 | | | | 3,748,037 | |
| Anchorage Capital CLO 4 Ltd. | | | | | | | | |
2017-4A, 2.99% (3 Month USD LIBOR + 168 bps) due 07/28/263,4 | | | 3,500,000 | | | | 3,511,167 | |
| WhiteHorse VIII Ltd. | | | | | | | | |
2014-1A, 2.81% (3 Month USD LIBOR + 150 bps) due 05/01/263,4 | | | 3,450,000 | | | | 3,451,724 | |
| Flagship VII Ltd. | | | | | | | | |
2017-7A, 2.43% (3 Month USD LIBOR + 112 bps) due 01/20/263,4 | | | 3,300,000 | | | | 3,313,557 | |
| FDF I Ltd. | | | | | | | | |
2015-1A, 4.40% due 11/12/304 | | | 3,000,000 | | | | 3,020,642 | |
| Marathon CLO VII Ltd. | | | | | | | | |
2017-7A, 2.96% (3 Month USD LIBOR + 165 bps) due 10/28/253,4 | | | 3,000,000 | | | | 3,010,513 | |
| Fifth Street SLF II Ltd. | | | | | | | | |
2015-2A, 3.23% (3 Month USD LIBOR + 192 bps) due 09/29/273,4 | | | 3,000,000 | | | | 3,005,839 | |
| Northwoods Capital XIV Ltd. | | | | | | | | |
2017-14A, 3.01% (3 Month USD LIBOR + 170 bps) due 11/12/253,4 | | | 3,000,000 | | | | 3,004,860 | |
| Regatta IV Funding Ltd. | | | | | | | | |
2017-1A, 2.33% (3 Month USD LIBOR + 102 bps) due 07/25/263,4 | | | 3,000,000 | | | | 2,999,953 | |
| Venture XVII CLO Ltd. | | | | | | | | |
2017-17A, 2.38% (3 Month USD LIBOR + 108 bps) due 07/15/263,4 | | | 2,800,000 | | | | 2,796,741 | |
| Bsprt Issuer Ltd. | | | | | | | | |
2017-FL1, 2.67% (1 Month USD LIBOR + 135 bps) due 06/15/273,4 | | | 2,700,000 | | | | 2,703,714 | |
| Ares XXVI CLO Ltd. | | | | | | | | |
2013-1A, 4.05% (3 Month USD LIBOR + 275 bps) due 04/15/253,4 | | | 2,500,000 | | | | 2,499,963 | |
| Nelder Grove CLO Ltd. | | | | | | | | |
2017-1A, 3.11% (3 Month USD LIBOR + 180 bps) due 08/28/263,4 | | | 2,400,000 | | | | 2,417,166 | |
| AMMC CLO XV Ltd. | | | | | | | | |
2016-15A, 3.22% (3 Month USD LIBOR + 190 bps) due 12/09/263,4 | | | 2,400,000 | | | | 2,410,123 | |
| KKR CLO 15 Ltd. | | | | | | | | |
2016-15, 2.86% (3 Month USD LIBOR + 156 bps) due 10/18/283,4 | | | 2,300,000 | | | | 2,327,858 | |
| Voya CLO Ltd. | | | | | | | | |
2013-1A, 4.20% (3 Month USD LIBOR + 290 bps) due 04/15/243,4 | | | 2,300,000 | | | | 2,300,086 | |
72 | THE GUGGENHEIM FUNDS ANNUAL REPORT | SEE NOTES TO FINANCIAL STATEMENTS. |
SCHEDULE OF INVESTMENTS (continued) | September 30, 2017 |
| LIMITED DURATION FUND | |
| | | Face
Amount~ | | | Value | |
| | | | | | | |
| AIMCO CLO Series | | | | | | |
2017-AA, 2.41% (3 Month USD LIBOR + 110 bps) due 07/20/263,4 | | | 2,200,000 | | | $ | 2,199,964 | |
| RFTI Issuer Ltd. | | | | | | | | |
2015-FL1, 2.98% (1 Month USD LIBOR + 175 bps) due 08/15/303,4 | | | 2,155,908 | | | | 2,155,283 | |
| Garrison Funding Ltd. | | | | | | | | |
2016-2A, 3.52% (3 Month USD LIBOR + 220 bps) due 09/29/273,4 | | | 2,000,000 | | | | 2,014,871 | |
| OCP CLO Ltd. | | | | | | | | |
2016-2A, 3.31% (3 Month USD LIBOR + 200 bps) due 11/22/253,4 | | | 2,000,000 | | | | 2,012,381 | |
| OZLM Funding II Ltd. | | | | | | | | |
2016-2A, 4.06% (3 Month USD LIBOR + 275 bps) due 10/30/273,4 | | | 2,000,000 | | | | 2,010,540 | |
| Madison Park Funding XVI Ltd. | | | | | | | | |
2016-16A, 3.21% (3 Month USD LIBOR + 190 bps) due 04/20/263,4 | | | 2,000,000 | | | | 2,010,080 | |
| Dryden XXIV Senior Loan Fund | | | | | | | | |
2015-24RA, 4.02% (3 Month USD LIBOR + 270 bps) due 11/15/233,4 | | | 2,000,000 | | | | 2,007,289 | |
| OHA Loan Funding Ltd. | | | | | | | | |
2017-1A, 2.76% (3 Month USD LIBOR + 145 bps) due 07/23/253,4 | | | 2,000,000 | | | | 1,999,964 | |
| Crestline Denali CLO Ltd. | | | | | | | | |
2017-1A, 2.42% (3 Month USD LIBOR + 105 bps) due 10/26/273,4 | | | 2,000,000 | | | | 1,999,582 | |
| Regatta III Funding Ltd. | | | | | | | | |
2017-1A, 2.35% (3 Month USD LIBOR + 105 bps) due 04/15/263,4 | | | 2,000,000 | | | | 1,997,796 | |
| Recette Clo Ltd. | | | | | | | | |
2017-1A, 2.63% (3 Month USD LIBOR + 130 bps) due 10/20/273,4 | | | 2,000,000 | | | | 1,997,423 | |
| LCM XXII Ltd. | | | | | | | | |
2016-22A, 2.58% (3 Month USD LIBOR + 128 bps) due 10/20/283,4 | | | 1,916,667 | | | | 1,917,189 | |
| Flatiron CLO Ltd. | | | | | | | | |
2017-1A, 2.76% (3 Month USD LIBOR + 160 bps) due 07/17/263,4 | | | 1,700,000 | | | | 1,703,854 | |
| Madison Park Funding XIV Ltd. | | | | | | | | |
2017-14A, 2.86% (3 Month USD LIBOR + 155 bps) due 07/20/263,4 | | | 1,600,000 | | | | 1,602,233 | |
| Tralee CLO III Ltd. | | | | | | | | |
2016-3A, 3.31% (3 Month USD LIBOR + 200 bps) due 07/20/263,4 | | | 1,600,000 | | | | 1,600,156 | |
| Betony CLO Ltd. | | | | | | | | |
2016-1A, 3.25% (3 Month USD LIBOR + 195 bps) due 04/15/273,4 | | | 1,500,000 | | | | 1,510,275 | |
| Cereberus ICQ Levered LLC | | | | | | | | |
2015-1A, 3.35% (3 Month USD LIBOR + 205 bps) due 11/06/253,4 | | | 1,413,945 | | | | 1,414,592 | |
| Dryden 37 Senior Loan Fund | | | | | | | | |
2015-37A, due 04/15/274,5 | | | 1,500,000 | | | | 1,380,876 | |
| Dryden 30 Senior Loan Fund | | | | | | | | |
2013-30A, 4.17% (3 Month USD LIBOR + 285 bps) due 11/15/253,4 | | | 1,330,000 | | | | 1,331,174 | |
| Symphony CLO XII Ltd. | | | | | | | | |
2017-12A, 2.80% (3 Month USD LIBOR + 150 bps) due 10/15/253,4 | | | 1,250,000 | | | | 1,251,399 | |
| Highbridge Loan Management Ltd. | | | | | | | | |
2014-2014, 3.36% (3 Month USD LIBOR + 205 bps) due 07/28/253,4 | | | 1,250,000 | | | | 1,250,013 | |
| Venture VII CDO Ltd. | | | | | | | | |
2006-7A, 1.54% (3 Month USD LIBOR + 23 bps) due 01/20/223,4 | | | 1,114,520 | | | | 1,108,495 | |
| Kingsland V Ltd. | | | | | | | | |
2007-5A, 2.10% (3 Month USD LIBOR + 80 bps) due 07/14/213,4 | | | 1,070,000 | | | | 1,051,823 | |
| Fortress Credit Investments IV Ltd. | | | | | | | | |
2015-4A, 3.20% (3 Month USD LIBOR + 190 bps) due 07/17/233,4 | | | 1,000,000 | | | | 1,000,700 | |
| Cent CLO | | | | | | | | |
2014-16A, 3.56% (3 Month USD LIBOR + 225 bps) due 08/01/243,4 | | | 500,000 | | | | 500,535 | |
2014-16A, 4.51% (3 Month USD LIBOR + 320 bps) due 08/01/243,4 | | | 500,000 | | | | 500,059 | |
| Benefit Street Partners CLO Ltd. | | | | | | | | |
2015-IA, 4.40% (3 Month USD LIBOR + 310 bps) due 10/15/253,4 | | | 1,000,000 | | | | 1,000,048 | |
| Ivy Hill Middle Market Credit Fund VII Ltd. | | | | | | | | |
2013-7A, 3.61% (3 Month USD LIBOR + 230 bps) due 10/20/253,4 | | | 1,000,000 | | | | 999,977 | |
| Resource Capital Corp. | | | | | | | | |
2015-CRE3, 4.38% (1 Month USD LIBOR + 315 bps) due 03/15/323,4 | | | 1,000,000 | | | | 998,394 | |
| Madison Park Funding V Ltd. | | | | | | | | |
2007-5A, 2.77% (3 Month USD LIBOR + 145 bps) due 02/26/213,4 | | | 1,000,000 | | | | 983,577 | |
| OHA Credit Partners IX Ltd. | | | | | | | | |
2013-9A, due 10/20/254,5 | | | 1,000,000 | | | | 888,294 | |
| Treman Park CLO Ltd. | | | | | | | | |
2015-1A, due 04/20/274,5 | | | 1,000,000 | | | | 862,073 | |
| Rockwall CDO II Ltd. | | | | | | | | |
2007-1A, 1.86% (3 Month USD LIBOR + 55 bps) due 08/01/243,4 | | | 750,081 | | | | 749,435 | |
| Airlie CLO Ltd. | | | | | | | | |
2006-2A, 2.76% (3 Month USD LIBOR + 145 bps) due 12/20/203,4 | | | 742,168 | | | | 741,891 | |
| LMREC, Inc. | | | | | | | | |
2016-CRE2, 2.94% (1 Month USD LIBOR + 170 bps) due 11/24/313,4 | | | 534,000 | | | | 537,348 | |
| ALM XIV Ltd. | | | | | | | | |
2014-14A, 4.76% (3 Month USD LIBOR + 345 bps) due 07/28/263,4 | | | 500,000 | | | | 501,312 | |
| Halcyon Loan Advisors Funding Ltd. | | | | | | | | |
2012-1A, 4.32% (3 Month USD LIBOR + 300 bps) due 08/15/233,4 | | | 500,000 | | | | 501,049 | |
| Cerberus Onshore II CLO LLC | | | | | | | | |
2014-1A, 4.00% (3 Month USD LIBOR + 270 bps) due 10/15/233,4 | | | 500,000 | | | | 500,077 | |
| SEE NOTES TO FINANCIAL STATEMENTS. | THE GUGGENHEIM FUNDS ANNUAL REPORT | 73 |
SCHEDULE OF INVESTMENTS (continued) | September 30, 2017 |
| LIMITED DURATION FUND | |
| | | Face
Amount~ | | | Value | |
| | | | | | | |
| NZCG Funding Ltd. | | | | | | |
2015-2A, 3.67% (3 Month USD LIBOR + 235 bps) due 04/27/273,4 | | | 500,000 | | | $ | 500,021 | |
| Gallatin CLO VII Ltd. | | | | | | | | |
2014-1A, 4.20% (3 Month USD LIBOR + 290 bps) due 07/15/233,4 | | | 500,000 | | | | 499,117 | |
| NewStar Arlington Senior Loan Program LLC | | | | | | | | |
2014-1A, 4.61% (3 Month USD LIBOR + 330 bps) due 07/25/253,4 | | | 250,000 | | | | 247,747 | |
2014-1A, 5.56% (3 Month USD LIBOR + 425 bps) due 07/25/253,4 | | | 250,000 | | | | 240,236 | |
| Kingsland IV Ltd. | | | | | | | | |
2007-4A, 2.75% (3 Month USD LIBOR + 145 bps) due 04/16/213,4 | | | 250,000 | | | | 245,152 | |
| Babson CLO Ltd. | | | | | | | | |
2012-2A, due 05/15/234,5 | | | 750,000 | | | | 154,295 | |
| Copper River CLO Ltd. | | | | | | | | |
2007-1A, due 01/20/215,6 | | | 500,000 | | | | 68,130 | |
| Keuka Park CLO Ltd. | | | | | | | | |
2013-1A, due 10/21/244,5 | | | 491,478 | | | | 56,556 | |
| Total Collateralized Loan Obligations | | | | | | | 657,160,712 | |
| | | | | | | | | |
| Transport-Aircraft - 2.0% | |
| Apollo Aviation Securitization Equity Trust | | | | | | | | |
| 2016-2, 4.21% due 11/15/41 | | | 6,099,720 | | | | 6,121,252 | |
2016-1A, 4.88% due 03/17/364 | | | 4,505,000 | | | | 4,627,353 | |
2014-1, 5.13% (WAC) due 12/15/293 | | | 874,484 | | | | 883,228 | |
2014-1, 7.38% (WAC) due 12/15/293 | | | 349,793 | | | | 352,417 | |
| Castlelake Aircraft Securitization Trust | | | | | | | | |
| 2017-1, 3.97% due 07/15/42 | | | 5,719,380 | | | | 5,710,566 | |
2015-1A, 4.70% due 12/15/404 | | | 4,673,079 | | | | 4,733,168 | |
| AASET Trust | | | | | | | | |
2017-1A, 3.97% due 05/16/424 | | | 7,818,400 | | | | 7,870,997 | |
| Raspro Trust | | | | | | | | |
2005-1A, 1.93% (3 Month USD LIBOR + 63 bps) due 03/23/243,4 | | | 4,753,675 | | | | 4,504,107 | |
| Falcon Aerospace Ltd. | | | | | | �� | | |
2017-1, 4.58% due 02/15/424 | | | 3,604,125 | | | | 3,659,362 | |
| Harbour Aircraft Investments Ltd. | | | | | | | | |
| 2016-1A, 4.70% due 07/15/41 | | | 1,737,595 | | | | 1,769,618 | |
| AIM Aviation Finance Ltd. | | | | | | | | |
2015-1A, 4.21% due 02/15/404 | | | 1,630,952 | | | | 1,640,749 | |
| ECAF I Ltd. | | | | | | | | |
2015-1A, 3.47% due 06/15/404 | | | 1,292,570 | | | | 1,283,552 | |
| Diamond Head Aviation Ltd. | | | | | | | | |
2015-1, 3.81% due 07/14/284 | | | 1,211,472 | | | | 1,214,836 | |
| Atlas Ltd. | | | | | | | | |
| 2014-1 A, 4.87% due 12/15/39 | | | 833,300 | | | | 834,346 | |
| AABS Ltd. | | | | | | | | |
| 2013-1 A, 4.87% due 01/10/38 | | | 499,095 | | | | 504,086 | |
| Rise Ltd. | | | | | | | | |
| 2014-1A, 4.74% due 02/12/39 | | | 339,344 | | | | 342,737 | |
| Total Transport-Aircraft | | | | | | | 46,052,374 | |
| | | | | | | | | |
| Whole Business - 1.7% | |
| Domino’s Pizza Master Issuer LLC | | | | | | | | |
2017-1A, 3.08% due 07/25/474 | | | 6,950,000 | | | | 6,917,265 | |
2017-1A, 2.49% (3 Month USD LIBOR + 125 bps) due 07/25/473,4 | | | 5,250,000 | | | | 5,249,108 | |
| Taco Bell Funding LLC | | | | | | | | |
2016-1A, 4.38% due 05/25/464 | | | 3,663,000 | | | | 3,812,341 | |
2016-1A, 4.97% due 05/25/464 | | | 3,465,000 | | | | 3,669,054 | |
| Jimmy Johns Funding LLC | | | | | | | | |
2017-1A, 3.61% due 07/30/474 | | | 6,200,000 | | | | 6,232,735 | |
| DB Master Finance LLC | | | | | | | | |
2015-1A, 3.98% due 02/20/454 | | | 3,812,250 | | | | 3,900,046 | |
| Miramax LLC | | | | | | | | |
2014-1A, 3.34% due 07/20/264 | | | 2,764,048 | | | | 2,772,801 | |
| Wendys Funding LLC | | | | | | | | |
2015-1A, 3.37% due 06/15/454 | | | 1,726,760 | | | | 1,742,249 | |
2015-1A, 4.08% due 06/15/454 | | | 764,400 | | | | 782,769 | |
| Sonic Capital LLC | | | | | | | | |
2016-1A, 4.47% due 05/20/464 | | | 1,988,333 | | | | 2,004,021 | |
| Drug Royalty III Limited Partnership | | | | | | | | |
2016-1A, 3.98% due 04/15/274 | | | 1,458,760 | | | | 1,461,711 | |
| Drug Royalty II Limited Partnership 2 | | | | | | | | |
2014-1, 3.48% due 07/15/234 | | | 661,270 | | | | 661,548 | |
| Total Whole Business | | | | | | | 39,205,648 | |
| | | | | | | | | |
| Transport-Container - 1.4% | |
| Textainer Marine Containers Ltd. | | | | | | | | |
2017-2A, 3.52% due 06/20/424 | | | 13,827,926 | | | | 13,772,711 | |
| Global SC Finance II SRL | | | | | | | | |
2013-1A, 2.98% due 04/17/284 | | | 8,807,708 | | | | 8,732,865 | |
2013-2A, 3.67% due 11/17/284 | | | 1,793,600 | | | | 1,808,497 | |
| Textainer Marine Containers V Ltd. | | | | | | | | |
2017-1A, 3.72% due 05/20/424 | | | 3,748,290 | | | | 3,793,907 | |
| Cronos Containers Program Ltd. | | | | | | | | |
2013-1A, 3.08% due 04/18/284 | | | 2,467,833 | | | | 2,458,442 | |
| CLI Funding V LLC | | | | | | | | |
2013-1A, 2.83% due 03/18/284 | | | 1,869,000 | | | | 1,850,945 | |
| Total Transport-Container | | | | | | | 32,417,367 | |
| | | | | | | | | |
| Net Lease - 1.2% | |
| Capital Automotive LLC | | | | | | | | |
2017-1A, 3.87% due 04/15/474 | | | 12,149,167 | | | | 12,251,814 | |
| Store Master Funding I LLC | | | | | | | | |
2015-1A, 4.17% due 04/20/454 | | | 9,187,625 | | | | 9,470,604 | |
2015-1A, 3.75% due 04/20/454 | | | 1,778,250 | | | | 1,824,582 | |
| Store Master Funding LLC | | | | | | | | |
2013-1A, 4.16% due 03/20/434 | | | 2,311,052 | | | | 2,337,774 | |
| Capital Automotive REIT | | | | | | | | |
2014-1A, 3.66% due 10/15/444 | | | 1,000,000 | | | | 1,011,847 | |
| Spirit Master Funding LLC | | | | | | | | |
2014-1A, 5.05% due 07/20/404 | | | 443,258 | | | | 455,592 | |
| Total Net Lease | | | | | | | 27,352,213 | |
| | | | | | | | | |
| Collateralized Debt Obligations - 0.9% | |
| Anchorage Credit Funding Ltd. | | | | | | | | |
2016-4A, 3.50% due 02/15/354 | | | 11,650,000 | | | | 11,660,256 | |
2016-3A, 3.85% due 10/28/334 | | | 1,500,000 | | | | 1,505,916 | |
74 | THE GUGGENHEIM FUNDS ANNUAL REPORT | SEE NOTES TO FINANCIAL STATEMENTS. |
SCHEDULE OF INVESTMENTS (continued) | September 30, 2017 |
| LIMITED DURATION FUND | |
| | | Face
Amount~ | | | Value | |
| | | | | | | |
| RB Commercial Trust | | | | | | |
2012-RS1, 5.35% due 01/26/224 | | | 3,339,941 | | | $ | 3,437,153 | |
| Putnam Structured Product Funding Ltd. | | | | | | | | |
2003-1A, 2.23% (1 Month USD LIBOR + 100 bps) due 10/15/383,4 | | | 2,194,324 | | | | 2,071,518 | |
| H2 Asset Funding Ltd. | | | | | | | | |
3.13% (1 Month USD LIBOR + 190 bps) due 03/19/373 | | | 1,000,000 | | | | 997,772 | |
| Wrightwood Capital Real Estate CDO Ltd. | | | | | | | | |
2005-1A, 1.75% (3 Month USD LIBOR + 43 bps) due 11/21/403,4 | | | 219,217 | | | | 217,512 | |
| Total Collateralized Debt Obligations | | | | | | | 19,890,127 | |
| | | | | | | | | |
| Automotive - 0.5% | |
| Hertz Vehicle Financing LLC | | | | | | | | |
2016-4A, 2.65% due 07/25/224 | | | 4,500,000 | | | | 4,430,895 | |
2016-2A, 2.95% due 03/25/224 | | | 2,000,000 | | | | 1,994,097 | |
| Hertz Vehicle Financing II, LP | | | | | | | | |
2015-1A, 2.73% due 03/25/214 | | | 5,600,000 | | | | 5,603,314 | |
| Total Automotive | | | | | | | 12,028,306 | |
| | | | | | | | | |
| Transport-Rail - 0.1% | |
| TRIP Rail Master Funding LLC | | | | | | | | |
2017-1A, 2.71% due 08/15/474 | | | 1,961,165 | | | | 1,965,999 | |
| | | | | | | | | |
| Insurance - 0.0% | |
| Chesterfield Financial Holdings LLC | | | | | | | | |
2014-1A, 4.50% due 12/15/344 | | | 550,500 | | | | 554,515 | |
| Total Asset-Backed Securities | | | | | | | | |
| (Cost $833,165,483) | | | | | | | 836,627,261 | |
| | | | | | | | | |
CORPORATE BONDS†† - 19.8% | |
| Financial - 14.3% | |
| Station Place Securitization Trust | | | | | | | | |
1.99% (1 Month USD LIBOR + 75 bps) due 08/24/183,4 | | | 21,900,000 | | | | 21,900,000 | |
2.14% (1 Month USD LIBOR + 90 bps) due 07/24/183,4 | | | 19,600,000 | | | | 19,600,000 | |
2.24% (1 Month USD LIBOR + 100 bps) due 08/24/183,4 | | | 6,550,000 | | | | 6,550,000 | |
2.14% (1 Month USD LIBOR + 90 bps) due 02/25/493,4 | | | 6,366,667 | | | | 6,367,205 | |
2.49% (1 Month USD LIBOR + 125 bps) due 02/25/493,4 | | | 3,333,333 | | | | 3,333,614 | |
2.36% (1 Month USD LIBOR + 113 bps) due 02/25/493,4 | | | 1,000,000 | | | | 1,000,085 | |
| Capital One Financial Corp. | | | | | | | | |
2.07% (3 Month USD LIBOR + 76 bps) due 05/12/203 | | | 22,900,000 | | | | 23,016,653 | |
| Citigroup, Inc. | | | | | | | | |
6.25%7,12 | | | 13,057,000 | | | | 14,689,125 | |
5.95%7,12 | | | 6,250,000 | | | | 6,757,813 | |
5.95%7,12 | | | 645,000 | | | | 694,181 | |
| Sumitomo Mitsui Trust Bank Ltd. | | | | | | | | |
1.76% (3 Month USD LIBOR + 44 bps) due 09/19/193,4 | | | 14,350,000 | | | | 14,358,635 | |
2.21% (3 Month USD LIBOR + 91 bps) due 10/18/193,4 | | | 7,600,000 | | | | 7,672,821 | |
| Bank of America Corp. | | | | | | | | |
6.30%7,12 | | | 9,151,000 | | | | 10,340,630 | |
6.10%7,12 | | | 6,750,000 | | | | 7,441,875 | |
1.97% (3 Month USD LIBOR + 65 bps) due 10/01/213 | | | 4,200,000 | | | | 4,212,667 | |
| Mitsubishi UFJ Financial Group, Inc. | | | | | | | | |
2.10% (3 Month USD LIBOR + 79 bps) due 07/25/223 | | | 14,650,000 | | | | 14,705,075 | |
2.38% (3 Month USD LIBOR + 106 bps) due 09/13/213 | | | 5,990,000 | | | | 6,079,874 | |
3.20% (3 Month USD LIBOR + 188 bps) due 03/01/213 | | | 1,100,000 | | | | 1,144,464 | |
| Citizens Bank North America/Providence RI | | | | | | | | |
2.13% (3 Month USD LIBOR + 81 bps) due 05/26/223 | | | 12,200,000 | | | | 12,166,553 | |
1.89% (3 Month USD LIBOR + 57 bps) due 05/26/203 | | | 8,050,000 | | | | 8,066,905 | |
| Goldman Sachs Group, Inc. | | | | | | | | |
2.06% (3 Month USD LIBOR + 73 bps) due 12/27/203 | | | 15,700,000 | | | | 15,762,957 | |
2.52% (3 Month USD LIBOR + 120 bps) due 09/15/203 | | | 1,000,000 | | | | 1,018,935 | |
| Mizuho Financial Group, Inc. | | | | | | | | |
2.20% (3 Month USD LIBOR + 88 bps) due 09/11/223 | | | 16,450,000 | | | | 16,496,012 | |
| Morgan Stanley | | | | | | | | |
2.11% (3 Month USD LIBOR + 80 bps) due 02/14/203 | | | 13,650,000 | | | | 13,719,463 | |
2.30% (3 Month USD LIBOR + 98 bps) due 06/16/203 | | | 1,650,000 | | | | 1,670,741 | |
| Credit Agricole S.A. | | | | | | | | |
2.29% (3 Month USD LIBOR + 97 bps) due 06/10/203,4 | | | 11,550,000 | | | | 11,718,191 | |
| JPMorgan Chase & Co. | | | | | | | | |
2.00% (3 Month USD LIBOR + 68 bps) due 06/01/213 | | | 8,100,000 | | | | 8,141,067 | |
6.10%7,12 | | | 1,600,000 | | | | 1,765,984 | |
6.00%7,12 | | | 1,400,000 | | | | 1,522,500 | |
| Wells Fargo & Co. | | | | | | | | |
5.88%7,12 | | | 4,950,000 | | | | 5,509,350 | |
5.90%7,12 | | | 4,725,000 | | | | 5,144,344 | |
| Bank of Nova Scotia | | | | | | | | |
1.98% (3 Month USD LIBOR + 66 bps) due 06/14/193 | | | 6,750,000 | | | | 6,797,452 | |
| KeyCorp | | | | | | | | |
5.00% (3 Month USD LIBOR + 361 bps) 3,7 | | | 6,350,000 | | | | 6,572,250 | |
| Sumitomo Mitsui Financial Group, Inc. | | | | | | | | |
2.28% (3 Month USD LIBOR + 97 bps) due 01/11/223 | | | 5,000,000 | | | | 5,041,499 | |
3.00% (3 Month USD LIBOR + 168 bps) due 03/09/213 | | | 1,000,000 | | | | 1,033,813 | |
| SEE NOTES TO FINANCIAL STATEMENTS. | THE GUGGENHEIM FUNDS ANNUAL REPORT | 75 |
SCHEDULE OF INVESTMENTS (continued) | September 30, 2017 |
| LIMITED DURATION FUND | |
| | | Face
Amount~ | | | Value | |
| | | | | | | |
| Huntington National Bank | | | | | | |
1.83% (3 Month USD LIBOR + 51 bps) due 03/10/203 | | | 6,000,000 | | | $ | 6,037,988 | |
| UBS Group Funding Switzerland AG | | | | | | | | |
3.08% (3 Month USD LIBOR + 178 bps) due 04/14/213,4 | | | 5,700,000 | | | | 5,904,185 | |
| Swedbank AB | | | | | | | | |
2.02% (3 Month USD LIBOR + 70 bps) due 03/14/223,4 | | | 5,800,000 | | | | 5,842,752 | |
| Santander UK plc | | | | | | | | |
2.80% (3 Month USD LIBOR + 148 bps) due 03/14/193 | | | 5,700,000 | | | | 5,793,163 | |
| Danske Bank A/S | | | | | | | | |
1.90% (3 Month USD LIBOR + 58 bps) due 09/06/193,4 | | | 5,600,000 | | | | 5,628,422 | |
| Credit Suisse Group AG | | | | | | | | |
2.52% (3 Month USD LIBOR + 120 bps) due 12/14/233,4 | | | 5,250,000 | | | | 5,284,550 | |
| Westpac Banking Corp. | | | | | | | | |
2.16% (3 Month USD LIBOR + 85 bps) due 01/11/223 | | | 5,000,000 | | | | 5,044,383 | |
| Voya Financial, Inc. | | | | | | | | |
5.65% due 05/15/5312 | | | 2,400,000 | | | | 2,548,800 | |
| Citizens Financial Group, Inc. | | | | | | | | |
5.50% (3 Month USD LIBOR + 396 bps) 3,7 | | | 1,000,000 | | | | 1,042,500 | |
| Northern Trust Corp. | | | | | | | | |
4.60% (3 Month USD LIBOR + 320 bps) 3,7 | | | 1,000,000 | | | | 1,025,000 | |
| American Equity Investment Life Holding Co. | | | | | | | | |
| 5.00% due 06/15/27 | | | 500,000 | | | | 518,187 | |
| Fidelity & Guaranty Life Holdings, Inc. | | | | | | | | |
6.38% due 04/01/214 | | | 330,000 | | | | 338,250 | |
| US Bancorp | | | | | | | | |
5.30%7,12 | | | 200,000 | | | | 218,000 | |
| Total Financial | | | | | | | 330,871,708 | |
| | | | | | | | | |
| Communications - 2.5% | |
| AT&T, Inc. | | | | | | | | |
2.20% (3 Month USD LIBOR + 89 bps) due 02/14/233 | | | 20,500,000 | | | | 20,454,302 | |
| Verizon Communications, Inc. | | | | | | | | |
1.86% (3 Month USD LIBOR + 55 bps) due 05/22/203 | | | 13,650,000 | | | | 13,668,823 | |
2.32% (3 Month USD LIBOR + 100 bps) due 03/16/223 | | | 2,300,000 | | | | 2,333,299 | |
| Discovery Communications LLC | | | | | | | | |
2.04% (3 Month USD LIBOR + 71 bps) due 09/20/193 | | | 11,000,000 | | | | 11,067,254 | |
| Deutsche Telekom International Finance BV | | | | | | | | |
1.88% (3 Month USD LIBOR + 58 bps) due 01/17/203,4 | | | 9,400,000 | | | | 9,429,487 | |
| Total Communications | | | | | | | 56,953,165 | |
| | | | | | | | | |
| Consumer, Non-cyclical - 1.3% | |
| Kraft Heinz Foods Co. | | | | | | | | |
1.88% (3 Month USD LIBOR + 57 bps) due 02/10/213 | | | 16,200,000 | | | | 16,214,562 | |
| Allergan Funding SCS | | | | | | | | |
2.57% (3 Month USD LIBOR + 126 bps) due 03/12/203 | | | 11,300,000 | | | | 11,510,367 | |
| Aetna, Inc. | | | | | | | | |
1.97% (3 Month USD LIBOR + 65 bps) due 12/08/173 | | | 3,000,000 | | | | 3,003,204 | |
| Total Consumer, Non-cyclical | | | | | | | 30,728,133 | |
| | | | | | | | | |
| Energy - 0.8% | |
| Equities Corp. | | | | | | | | |
2.11% (3 Month USD LIBOR + 77 bps) due 10/01/203 | | | 11,450,000 | | | | 11,473,586 | |
| Phillips 66 | | | | | | | | |
1.95% (3 Month USD LIBOR + 65 bps) due 04/15/193 | | | 4,100,000 | | | | 4,105,163 | |
| Buckeye Partners, LP | | | | | | | | |
| 3.95% due 12/01/26 | | | 2,000,000 | | | | 1,973,084 | |
| Sunoco Logistics Partners Operations, LP | | | | | | | | |
| 3.90% due 07/15/26 | | | 250,000 | | | | 248,018 | |
| Schahin II Finance Co. SPV Ltd. | | | | | | | | |
5.88% due 09/25/226,8 | | | 390,900 | | | | 39,090 | |
| Total Energy | | | | | | | 17,838,941 | |
| | | | | | | | | |
| Industrial - 0.4% | |
| Reynolds Group Issuer | | | | | | | | |
4.80% (3 Month USD LIBOR + 350 bps) due 07/15/213,4 | | | 5,500,000 | | | | 5,610,000 | |
| CNH Industrial Capital LLC | | | | | | | | |
| 3.88% due 07/16/18 | | | 1,550,000 | | | | 1,567,437 | |
| 3.63% due 04/15/18 | | | 850,000 | | | | 855,568 | |
| Total Industrial | | | | | | | 8,033,005 | |
| | | | | | | | | |
| Diversified - 0.1% | |
| HRG Group, Inc. | | | | | | | | |
| 7.88% due 07/15/19 | | | 1,740,000 | | | | 1,774,800 | |
| | | | | | | | | |
| Basic Materials - 0.1% | |
| Yamana Gold, Inc. | | | | | | | | |
| 4.95% due 07/15/24 | | | 1,375,000 | | | | 1,409,375 | |
| | | | | | | | | |
| Consumer, Cyclical - 0.0% | |
| Seminole Hard Rock Entertainment Inc. / Seminole Hard Rock International LLC | | | | | | | | |
5.88% due 05/15/214 | | | 275,000 | | | | 277,750 | |
| Total Corporate Bonds | | | | | | | | |
| (Cost $451,119,799) | | | | | | | 454,254,082 | |
76 | THE GUGGENHEIM FUNDS ANNUAL REPORT | SEE NOTES TO FINANCIAL STATEMENTS. |
SCHEDULE OF INVESTMENTS (continued) | September 30, 2017 |
| LIMITED DURATION FUND | |
| | | Face
Amount~ | | | Value | |
| | | | | | | | |
FOREIGN GOVERNMENT DEBT†† - 20.1% | |
| Government of United Kingdom | | | | | | | |
due 10/02/1711 | | GBP | 33,670,000 | | | $ | 45,111,069 | |
| Republic of Portugal | | | | | | | | |
due 11/17/1711 | | EUR | 37,490,000 | | | | 44,329,344 | |
| Kingdom Of Denmark | | | | | | | | |
| 4.00% due 11/15/17 | | DKK | 273,900,000 | | | | 43,741,082 | |
| Republic of Italy | | | | | | | | |
due 11/30/1711 | | EUR | 36,910,000 | | | | 43,651,822 | |
| Government of Japan | | | | | | | | |
due 12/11/1711 | | JPY | 4,265,000,000 | | | | 37,913,849 | |
due 10/16/1711 | | JPY | 619,250,000 | | | | 5,503,686 | |
| Total Government of Japan | | | | | | | 43,417,535 | |
| Republic Of Hungary | | | | | | | | |
due 02/28/1811 | | HUF | 6,315,170,000 | | | | 23,945,315 | |
| 2.50% due 06/22/18 | | HUF | 2,925,000,000 | | | | 11,281,106 | |
due 11/24/1711 | | HUF | 1,725,000,000 | | | | 6,604,824 | |
due 05/23/1811 | | HUF | 250,000,000 | | | | 947,754 | |
| Republic Of Total Hungary | | | | | | | 42,778,999 | |
| State of Israel | | | | | | | | |
| 1.25% due 10/31/17 | | ILS | 118,350,000 | | | | 33,893,434 | |
| 4.00% due 01/31/18 | | ILS | 21,340,000 | | | | 6,275,601 | |
| Total State of Israel | | | | | | | 40,169,035 | |
| Republic Of France | | | | | | | | |
due 10/04/1711 | | EUR | 32,900,000 | | | | 38,884,993 | |
| Kingdom of Spain | | | | | | | | |
due 10/13/1711 | | EUR | 28,520,000 | | | | 33,712,690 | |
| United Mexican States | | | | | | | | |
due 01/04/1811 | | MXN | 52,100,000 | | | | 28,071,605 | |
due 12/21/1711 | | MXN | 27,400,000 | | | | 14,803,809 | |
| Total United Mexican States | | | | | | | 42,875,414 | |
| Czech Republic Government Bond | | | | | | | | |
| 0.85% due 03/17/18 | | CZK | 288,820,000 | | | | 13,203,881 | |
due 11/09/1711 | | CZK | 150,000,000 | | | | 6,834,568 | |
| Total Czech Republic Government Bond | | | | | | | 20,038,449 | |
| Kingdom Of Spain | | | | | | | | |
due 12/08/1711 | | EUR | 8,470,000 | | | | 10,020,127 | |
| Republic of Slovenia | | | | | | | | |
| 1.75% due 10/09/17 | | EUR | 2,990,000 | | | | 3,533,861 | |
| Kenya Government International Bond | | | | | | | | |
6.88% due 06/24/244 | | | 3,370,000 | | | | 3,439,894 | |
| Dominican Republic International Bond | | | | | | | | |
5.95% due 01/25/274 | | | 2,350,000 | | | | 2,526,250 | |
| Kingdom of Hungary | | | | | | | | |
| 4.00% due 04/25/18 | | HUF | 628,230,000 | | | | 2,435,337 | |
| Total Foreign Government Debt | | | | | | | | |
| (Cost $461,756,663) | | | | | | | 460,665,901 | |
| | | | | | | | | |
COLLATERALIZED MORTGAGE OBLIGATIONS†† - 16.7% | |
| Residential Mortgage Backed Securities - 10.8% | |
| CIT Mortgage Loan Trust | | | | | | | | |
2007-1, 2.59% (1 Month USD LIBOR + 135 bps) due 10/25/373,4 | | | 17,111,363 | | | | 17,196,776 | |
2007-1, 2.69% (1 Month USD LIBOR + 145 bps) due 10/25/373,4 | | | 1,219,075 | | | | 1,227,467 | |
| Structured Asset Securities Corporation Mortgage Loan Trust | | | | | | | | |
2008-BC4, 1.87% (1 Month USD LIBOR + 63 bps) due 11/25/373 | | | 14,951,598 | | | | 14,887,630 | |
2007-BC1, 1.37% (1 Month USD LIBOR + 13 bps) due 02/25/373 | | | 478,058 | | | | 471,126 | |
| JP Morgan Mortgage Acquisition Trust | | | | | | | | |
2006-HE2, 1.38% (1 Month USD LIBOR + 14 bps) due 07/25/363 | | | 14,303,708 | | | | 14,143,048 | |
| Fannie Mae Connecticut Avenue Securities | | | | | | | | |
2016-C01, 3.19% (1 Month USD LIBOR + 195 bps) due 08/25/283 | | | 8,925,270 | | | | 9,004,449 | |
2016-C02, 3.39% (1 Month USD LIBOR + 215 bps) due 09/25/283 | | | 3,130,670 | | | | 3,164,964 | |
| FirstKey Master Funding | | | | | | | | |
2017-R1, 1.46% (1 Month USD LIBOR + 22 bps) due 11/03/41†††,3,4 | | | 12,315,256 | | | | 12,158,258 | |
| Bayview Opportunity Master Fund IVb Trust | | | | | | | | |
2017-RPL1, 3.10% due 07/28/324 | | | 5,656,762 | | | | 5,656,581 | |
2017-RN1, 3.60% (WAC) due 02/28/323,4 | | | 3,685,201 | | | | 3,688,417 | |
2017-NPL1, 3.60% due 01/28/324 | | | 2,327,328 | | | | 2,321,313 | |
| Bear Stearns Asset Backed Securities I Trust | | | | | | | | |
2006-HE9, 1.38% (1 Month USD LIBOR + 14 bps) due 11/25/363 | | | 5,547,810 | | | | 5,391,608 | |
2006-HE3, 1.60% (1 Month USD LIBOR + 36 bps) due 04/25/363 | | | 4,000,000 | | | | 3,940,548 | |
| Freddie Mac Structured Agency Credit Risk Debt Notes | | | | | | | | |
2015-DNA1, 3.09% (1 Month USD LIBOR + 185 bps) due 10/25/273 | | | 4,750,000 | | | | 4,852,524 | |
2014-DN1, 3.44% (1 Month USD LIBOR + 220 bps) due 02/25/243 | | | 2,972,433 | | | | 3,067,886 | |
2015-DNA1, 2.14% (1 Month USD LIBOR + 90 bps) due 10/25/273 | | | 1,357,280 | | | | 1,359,021 | |
| Countrywide Asset-Backed Certificates | | | | | | | | |
2006-6, 1.41% (1 Month USD LIBOR + 17 bps) due 09/25/363 | | | 6,021,109 | | | | 5,651,531 | |
2006-5, 1.53% (1 Month USD LIBOR + 29 bps) due 08/25/363 | | | 2,720,216 | | | | 2,667,432 | |
| Nationstar Home Equity Loan Trust | | | | | | | | |
2007-B, 1.46% (1 Month USD LIBOR + 22 bps) due 04/25/373 | | | 8,131,902 | | | | 8,051,433 | |
| First NLC Trust | | | | | | | | |
2005-4, 1.63% (1 Month USD LIBOR + 39 bps) due 02/25/363 | | | 8,222,512 | | | | 7,787,260 | |
| SEE NOTES TO FINANCIAL STATEMENTS. | THE GUGGENHEIM FUNDS ANNUAL REPORT | 77 |
SCHEDULE OF INVESTMENTS (continued) | September 30, 2017 |
| LIMITED DURATION FUND | |
| | | Face
Amount~ | | | Value | |
| | | | | | | |
| GCAT | | | | | | |
2017-1, 3.38% due 03/25/474 | | | 7,364,155 | | | $ | 7,334,468 | |
| Park Place Securities Incorporated Asset Backed Pass Through Certificates Ser | | | | | | | | |
2005-WHQ3, 2.18% (1 Month USD LIBOR + 95 bps) due 06/25/353 | | | 7,025,000 | | | | 7,029,405 | |
| CSMC Series | | | | | | | | |
2015-12R, 1.73% (1 Month USD LIBOR + 50 bps) due 11/30/373,4 | | | 6,037,392 | | | | 5,948,610 | |
2014-2R, 1.43% (1 Month USD LIBOR + 20 bps) due 02/27/463,4 | | | 345,641 | | | | 325,919 | |
| CWABS Incorporated Asset-Backed Certificates Trust | | | | | | | | |
2004-4, 1.96% (1 Month USD LIBOR + 72 bps) due 07/25/343 | | | 5,827,889 | | | | 5,858,598 | |
| LSTAR Commercial Mortgage Trust | | | | | | | | |
2016-7, 3.24% (1 Month USD LIBOR + 200 bps) due 12/01/213,4 | | | 5,754,675 | | | | 5,754,675 | |
| LSTAR Securities Investment Limited | | | | | | | | |
2017-6, 2.99% (1 Month USD LIBOR + 175 bps) due 09/01/223,4 | | | 5,500,000 | | | | 5,495,380 | |
| Credit-Based Asset Servicing & Securitization LLC | | | | | | | | |
2006-CB2, 1.43% (1 Month USD LIBOR + 19 bps) due 12/25/363 | | | 5,498,586 | | | | 5,407,684 | |
| GSMSC Resecuritization Trust | | | | | | | | |
2015-5R, 1.37% (1 Month USD LIBOR + 14 bps) due 02/26/373,4 | | | 2,996,827 | | | | 2,824,802 | |
2015-7R, 1.39% (1 Month USD LIBOR + 15 bps) due 09/26/373,4 | | | 2,714,725 | | | | 2,582,021 | |
| LSTAR Securities Investment Ltd. | | | | | | | | |
2016-4, 3.24% (1 Month USD LIBOR + 200 bps) due 10/01/213,4 | | | 3,414,873 | | | | 3,399,014 | |
2016-5, 3.24% (1 Month USD LIBOR + 200 bps) due 11/01/213,4 | | | 1,882,562 | | | | 1,883,289 | |
| Stanwich Mortgage Loan Co. | | | | | | | | |
2016-NPA1, 3.84% (WAC) due 10/16/463,4 | | | 4,665,086 | | | | 4,657,939 | |
| CIM Trust | | | | | | | | |
2017-2, 3.24% (1 Month USD LIBOR + 200 bps) due 12/25/573,4 | | | 4,552,950 | | | | 4,595,473 | |
| Ellington Loan Acquisition Trust | | | | | | | | |
2007-2, 2.19% (1 Month USD LIBOR + 95 bps) due 05/25/373,4 | | | 4,579,999 | | | | 4,587,406 | |
| GSAMP TRUST | | | | | | | | |
2002-HE2, 2.28% (1 Month USD LIBOR + 104 bps) due 10/20/323,4 | | | 4,351,120 | | | | 4,372,167 | |
| Popular ABS Mortgage Pass-Through Trust | | | | | | | | |
2005-2, 1.42% (1 Month USD LIBOR + 18 bps) due 04/25/353 | | | 4,360,450 | | | | 4,347,707 | |
| Banc of America Funding Trust | | | | | | | | |
2015-R4, 1.40% (1 Month USD LIBOR + 17 bps) due 01/27/353,4 | | | 4,321,731 | | | | 4,086,764 | |
| Soundview Home Loan Trust | | | | | | | | |
2005-OPT3, 1.71% (1 Month USD LIBOR + 47 bps) due 11/25/353 | | | 4,000,000 | | | | 3,911,076 | |
2003-1, 4.61% (1 Month USD LIBOR + 338 bps) due 08/25/313 | | | 121,506 | | | | 120,319 | |
| Stanwich Mortgage Loan Company LLC | | | | | | | | |
2017-NPA1, 3.60% due 03/16/224 | | | 3,830,818 | | | | 3,830,818 | |
| VOLT LIV LLC | | | | | | | | |
2017-NPL1, 3.50% due 02/25/474 | | | 3,599,940 | | | | 3,622,064 | |
| New Residential Mortgage Loan Trust | | | | | | | | |
2017-5A, 2.74% (1 Month USD LIBOR + 150 bps) due 06/25/573,4 | | | 3,355,327 | | | | 3,448,927 | |
| Bayview Opportunity Master Fund IIIb Trust | | | | | | | | |
2017-RN3, 3.23% due 05/28/324 | | | 2,513,182 | | | | 2,515,230 | |
| NRPL Trust | | | | | | | | |
2014-2A, 3.75% (WAC) due 10/25/573,4 | | | 1,246,615 | | | | 1,249,411 | |
2015-1A, 3.88% due 11/01/544 | | | 1,153,114 | | | | 1,155,280 | |
| Morgan Stanley Capital I Incorporated Trust | | | | | | | | |
2006-HE1, 1.53% (1 Month USD LIBOR + 29 bps) due 01/25/363 | | | 2,034,570 | | | | 2,010,179 | |
| ACE Securities Corporation Home Equity Loan Trust Series | | | | | | | | |
2005-HE2, 2.26% (1 Month USD LIBOR + 102 bps) due 04/25/353 | | | 2,000,000 | | | | 2,002,578 | |
| Towd Point Mortgage Trust | | | | | | | | |
2016-1, 2.75% (WAC) due 02/25/553,4 | | | 1,870,330 | | | | 1,880,272 | |
| VOLT XL LLC | | | | | | | | |
2015-NP14, 4.38% due 11/27/454 | | | 1,837,507 | | | | 1,843,767 | |
| First Franklin Mortgage Loan Trust | | | | | | | | |
2004-FF10, 2.51% (1 Month USD LIBOR + 128 bps) due 07/25/343 | | | 1,766,944 | | | | 1,790,764 | |
| Deutsche Alt-A Securities Mortgage Loan Trust Series | | | | | | | | |
2006-AF1, 1.54% (1 Month USD LIBOR + 30 bps) due 04/25/363 | | | 1,874,619 | | | | 1,713,750 | |
| Morgan Stanley ABS Capital I Incorporated Trust | | | | | | | | |
2006-NC1, 1.62% (1 Month USD LIBOR + 38 bps) due 12/25/353 | | | 1,500,000 | | | | 1,457,701 | |
| Nomura Resecuritization Trust | | | | | | | | |
2015-4R, 1.87% (1 Month USD LIBOR + 43 bps) due 03/26/363,4 | | | 1,466,023 | | | | 1,406,519 | |
2012-1R, 1.68% (1 Month USD LIBOR + 44 bps) due 08/27/473,4 | | | 47,243 | | | | 47,175 | |
| Structured Asset Investment Loan Trust | | | | | | | | |
2005-2, 1.97% (1 Month USD LIBOR + 74 bps) due 03/25/353 | | | 872,691 | | | | 874,051 | |
2005-1, 1.96% (1 Month USD LIBOR + 72 bps) due 02/25/353,4 | | | 426,355 | | | | 425,330 | |
| Encore Credit Receivables Trust | | | | | | | | |
2005-4, 1.68% (1 Month USD LIBOR + 44 bps) due 01/25/363 | | | 1,077,390 | | | | 1,070,585 | |
| Nationstar HECM Loan Trust | | | | | | | | |
2016-3A, 2.01% due 08/25/264 | | | 509,197 | | | | 515,742 | |
78 | THE GUGGENHEIM FUNDS ANNUAL REPORT | SEE NOTES TO FINANCIAL STATEMENTS. |
SCHEDULE OF INVESTMENTS (continued) | September 30, 2017 |
| LIMITED DURATION FUND | |
| | | Face
Amount~ | | | Value | |
| | | | | | | |
| UCFC Manufactured Housing Contract | | | | | | |
| 1997-2, 7.38% due 10/15/28 | | | 468,777 | | | $ | 497,349 | |
| BCAP LLC | | | | | | | | |
2014-RR3, 1.38% (WAC) due 10/26/363,4 | | | 480,202 | | | | 472,912 | |
| LVII Resecuritization Trust | | | | | | | | |
2009-3, 5.66% (WAC) due 11/27/373,4 | | | 417,107 | | | | 417,053 | |
| GSAMP Trust | | | | | | | | |
2005-HE6, 1.68% (1 Month USD LIBOR + 44 bps) due 11/25/353 | | | 372,358 | | | | 373,301 | |
| First Frankin Mortgage Loan Trust | | | | | | | | |
2006-FF4, 1.43% (1 Month USD LIBOR + 19 bps) due 03/25/363 | | | 345,947 | | | | 345,407 | |
| Accredited Mortgage Loan Trust | | | | | | | | |
2007-1, 1.37% (1 Month USD LIBOR + 13 bps) due 02/25/373 | | | 180,999 | | | | 179,925 | |
| GreenPoint Mortgage Funding Trust | | | | | | | | |
2005-HE4, 1.71% (1 Month USD LIBOR + 47 bps) due 07/25/303 | | | 149,929 | | | | 149,699 | |
| Morgan Stanley Re-REMIC Trust | | | | | | | | |
2010-R5, 2.51% due 06/26/364 | | | 160,301 | | | | 135,461 | |
| Total Residential Mortgage Backed Securities | | | | | | | 246,643,238 | |
| | | | | | | | | |
| Commercial Mortgage Backed Securities - 5.8% | |
| BHMS Mortgage Trust | | | | | | | | |
2014-ATLS, 4.24% due 07/05/334 | | | 15,000,000 | | | | 15,297,432 | |
2014-ATLS, 2.73% (1 Month USD LIBOR + 150 bps) due 07/05/333,4 | | | 1,300,000 | | | | 1,299,999 | |
| Hospitality Mortgage Trust | | | | | | | | |
2017-HIT, 2.08% (1 Month USD LIBOR + 85 bps) due 05/08/303,4 | | | 15,500,000 | | | | 15,519,341 | |
| Cosmopolitan Hotel Trust | | | | | | | | |
2016-CSMO, 2.63% (1 Month USD LIBOR + 140 bps) due 11/15/333,4 | | | 10,000,000 | | | | 10,061,174 | |
2016-CSMO, 3.33% (1 Month USD LIBOR + 210 bps) due 11/15/333,4 | | | 2,000,000 | | | | 2,006,241 | |
| Chicago Skyscraper Trust | | | | | | | | |
2017-SKY, 2.03% (1 Month USD LIBOR + 80 bps) due 02/15/193,4 | | | 9,000,000 | | | | 9,011,214 | |
| Wells Fargo Commercial Mortgage Trust | | | | | | | | |
2016-C37, 1.19% (WAC) due 12/15/493 | | | 38,537,085 | | | | 2,221,270 | |
2017-C38, 1.24% (WAC) due 07/15/503 | | | 25,971,784 | | | | 2,055,542 | |
2016-C32, 1.51% (WAC) due 01/15/593 | | | 23,052,172 | | | | 1,857,609 | |
2015-LC22, 1.05% (WAC) due 09/15/583 | | | 24,473,406 | | | | 1,290,647 | |
2017-RB1, 1.44% (WAC) due 03/15/503 | | | 9,983,765 | | | | 954,423 | |
2016-NXS5, 1.72% (WAC) due 01/15/593 | | | 6,906,293 | | | | 589,431 | |
| Americold LLC Trust | | | | | | | | |
2010-ARTA, 7.44% due 01/14/294 | | | 3,500,000 | | | | 3,892,649 | |
2010-ARTA, 6.81% due 01/14/294 | | | 2,605,000 | | | | 2,888,475 | |
| JP Morgan Chase Commercial Mortgage Securities Trust | | | | | | | | |
2016-WIKI, 4.14% (WAC) due 10/05/313,4 | | | 3,000,000 | | | | 2,992,077 | |
2014-CBM, 3.18% (1 Month USD LIBOR + 195 bps) due 10/15/293,4 | | | 1,100,000 | | | | 1,100,000 | |
2014-FL5, 3.33% (1 Month USD LIBOR + 210 bps) due 07/15/313,4 | | | 1,000,000 | | | | 990,410 | |
| GS Mortgage Securities Corporation Trust | | | | | | | | |
2017-STAY, 2.08% (1 Month USD LIBOR + 85 bps) due 07/15/323,4 | | | 2,800,000 | | | | 2,777,201 | |
2017-STAY, 2.33% (1 Month USD LIBOR + 110 bps) due 07/15/323,4 | | | 2,300,000 | | | | 2,281,569 | |
| JPMDB Commercial Mortgage Securities Trust | | | | | | | | |
2017-C5, 1.18% (WAC) due 03/15/503 | | | 57,866,103 | | | | 4,169,640 | |
2016-C2, 1.86% (WAC) due 06/15/493 | | | 8,888,380 | | | | 837,543 | |
| Banc of America Commercial Mortgage Trust | | | | | | | | |
2017-BNK3, 1.30% (WAC) due 02/15/503 | | | 33,782,441 | | | | 2,671,124 | |
2016-UB10, 2.16% (WAC) due 04/15/263 | | | 19,309,135 | | | | 2,171,957 | |
| DBJPM Mortgage Trust | | | | | | | | |
2017-C6, 1.19% (WAC) due 06/10/503 | | | 63,049,224 | | | | 4,625,026 | |
| BANK | | | | | | | | |
2017-BNK7, 0.83% (WAC) due 09/15/603 | | | 35,200,000 | | | | 2,114,781 | |
2017-BNK4, 1.62% (WAC) due 05/15/503 | | | 14,354,555 | | | | 1,430,085 | |
2017-BNK6, 1.02% (WAC) due 07/15/603 | | | 15,584,419 | | | | 985,764 | |
| CGGS Commercial Mortgage Trust | | | | | | | | |
2016-RNDA, 4.39% due 02/10/334 | | | 4,339,015 | | | | 4,375,598 | |
| Morgan Stanley Capital I Trust | | | | | | | | |
2017-H1, 1.62% (WAC) due 06/15/503 | | | 30,998,442 | | | | 3,036,775 | |
2015-XLF1, 3.44% (1 Month USD LIBOR + 220 bps) due 08/13/193,4 | | | 1,135,000 | | | | 1,139,493 | |
| JPMCC Commercial Mortgage Securities Trust | | | | | | | | |
2017-JP5, 1.27% (WAC) due 03/15/503 | | | 48,268,110 | | | | 3,463,449 | |
| VSD | | | | | | | | |
| 2017-PLT1 A, 3.60% due 12/25/43 | | | 3,295,149 | | | | 3,297,022 | |
| Citigroup Commercial Mortgage Trust | | | | | | | | |
2017-P7, 1.29% (WAC) due 04/14/503 | | | 23,270,953 | | | | 1,915,358 | |
2016-C2, 1.94% (WAC) due 08/10/493 | | | 6,756,059 | | | | 813,185 | |
2016-GC37, 1.81% (WAC) due 04/10/493 | | | 3,817,726 | | | | 440,460 | |
| GAHR Commercial Mortgage Trust | | | | | | | | |
2015-NRF, 3.49% (WAC) due 12/15/343,4 | | | 2,753,165 | | | | 2,708,030 | |
2015-NRF, 2.53% (1 Month USD LIBOR + 130 bps) due 12/15/343,4 | | | 286,710 | | | | 286,371 | |
| UBS Commercial Mortgage Trust | | | | | | | | |
2017-C2, 1.31% (WAC) due 08/15/503 | | | 33,181,339 | | | | 2,773,993 | |
| Morgan Stanley Bank of America Merrill Lynch Trust | | | | | | | | |
2015-C27, 1.17% (WAC) due 12/15/473 | | | 36,851,120 | | | | 2,235,522 | |
| CD Commercial Mortgage Trust | | | | | | | | |
2017-CD4, 1.48% (WAC) due 05/10/503 | | | 17,272,366 | | | | 1,587,158 | |
| SEE NOTES TO FINANCIAL STATEMENTS. | THE GUGGENHEIM FUNDS ANNUAL REPORT | 79 |
SCHEDULE OF INVESTMENTS (continued) | September 30, 2017 |
| LIMITED DURATION FUND | |
| | | Face
Amount~ | | | Value | |
| | | | | | | |
| CGMS Commercial Mortgage Trust | | | | | | |
2017-B1, 1.00% (WAC) due 08/15/503 | | | 22,492,457 | | | $ | 1,418,820 | |
| JPMBB Commercial Mortgage Securities Trust | | | | | | | | |
2013-C17, 1.04% (WAC) due 01/15/473 | | | 31,744,481 | | | | 1,261,100 | |
| CSAIL Commercial Mortgage Trust | | | | | | | | |
2016-C6, 1.97% (WAC) due 01/15/493 | | | 9,949,003 | | | | 1,076,305 | |
| GS Mortgage Securities Trust | | | | | | | | |
2017-GS6, 1.20% (WAC) due 05/10/503 | | | 11,591,530 | | | | 961,703 | |
| Americold LLC | | | | | | | | |
2010-ARTA, 4.95% due 01/14/294 | | | 840,000 | | | | 901,755 | |
| CD Mortgage Trust | | | | | | | | |
2016-CD1, 1.57% (WAC) due 08/10/493 | | | 7,046,245 | | | | 668,071 | |
| LSTAR Commercial Mortgage Trust | | | | | | | | |
2014-2, 4.21% (WAC) due 01/20/413,4 | | | 500,000 | | | | 500,342 | |
| GE Business Loan Trust | | | | | | | | |
2007-1A, 1.40% (1 Month USD LIBOR + 17 bps) due 04/16/353,4 | | | 375,174 | | | | 361,994 | |
| Total Commercial Mortgage Backed Securities | | | | | | | 133,315,128 | |
| | | | | | | | | |
| Government Agency - 0.1% | |
| Freddie Mac Multifamily Structured Pass Through Certificates | | | | | | | | |
2013-K035, 0.55% (WAC) due 08/25/233,10 | | | 110,250,544 | | | | 2,253,951 | |
| Total Collateralized Mortgage Obligations | | | | | | | | |
| (Cost $376,971,502) | | | | | | | 382,212,317 | |
| | | | | | | | | |
SENIOR FLOATING RATE INTERESTS†† - 1.7% | |
| Technology - 0.5% | |
| MA Financeco LLC | | | | | | | | |
3.81% (3 Month USD LIBOR + 250 bps) due 11/19/213 | | | 5,000,000 | | | | 4,993,750 | |
| Epicor Software | | | | | | | | |
4.99% (1 Month USD LIBOR + 375 bps) due 06/01/223 | | | 4,245,050 | | | | 4,250,357 | |
| Internet Brands, Inc. | | | | | | | | |
4.82% (3 Month USD LIBOR + 350 bps) due 09/13/243 | | | 1,095,628 | | | | 1,088,320 | |
| Eze Castle Software, Inc. | | | | | | | | |
4.33% (3 Month USD LIBOR + 300 bps) due 04/06/203 | | | 201,946 | | | | 201,861 | |
| Total Technology | | | | | | | 10,534,288 | |
| | | | | | | | | |
| Financial - 0.3% | |
| Misys Ltd. | | | | | | | | |
4.82% (3 Month USD LIBOR + 350 bps) due 06/13/243 | | | 7,950,000 | | | | 7,982,675 | |
| | | | | | | | | |
| Consumer, Non-cyclical - 0.3% | |
| DJO Finance LLC | | | | | | | | |
4.49% (1 Month USD LIBOR + 325 bps) due 06/08/203 | | | 1,999,996 | | | | 1,996,655 | |
| Smart & Final Stores LLC | | | | | | | | |
4.83% (3 Month USD LIBOR + 350 bps) due 11/15/223 | | | 1,770,796 | | | | 1,702,727 | |
| Albertson’s LLC | | | | | | | | |
4.33% (3 Month USD LIBOR + 300 bps) due 12/21/223 | | | 1,237,547 | | | | 1,191,362 | |
| American Tire Distributors, Inc. | | | | | | | | |
5.49% (1 Month USD LIBOR + 425 bps) due 09/01/213 | | | 682,994 | | | | 688,970 | |
| Grocery Outlet, Inc. | | | | | | | | |
4.83% (3 Month USD LIBOR + 350 bps) due 10/21/213 | | | 666,610 | | | | 664,110 | |
| Total Consumer, Non-cyclical | | | | | | | 6,243,824 | |
| | | | | | | | | |
| Communications - 0.2% | |
| Cengage Learning Acquisitions, Inc. | | | | | | | | |
5.49% (1 Month USD LIBOR + 425 bps) due 06/07/233 | | | 4,298,301 | | | | 3,953,663 | |
| Neustar, Inc. | | | | | | | | |
4.56% (3 Month USD LIBOR + 650 bps) and (2 Month USD LIBOR + 325 bps) due 01/08/203,13 | | | 687,130 | | | | 692,283 | |
| Total Communications | | | | | | | 4,645,946 | |
| | | | | | | | | |
| Industrial - 0.2% | |
| Filtration Group Corp. | | | | | | | | |
| 4.24% (2 Month LIBOR + 300 bps) due 11/23/20 | | | 2,629,948 | | | | 2,643,098 | |
| CHI Overhead Doors, Inc. | | | | | | | | |
4.58% (3 Month USD LIBOR + 325 bps) due 07/29/223 | | | 994,481 | | | | 990,751 | |
| Engility Corp. | | | | | | | | |
3.99% (1 Month USD LIBOR + 275 bps) due 08/12/203 | | | 900,000 | | | | 904,950 | |
| Total Industrial | | | | | | | 4,538,799 | |
| | | | | | | | | |
| Consumer, Cyclical - 0.2% | |
| Caesars Growth Properties Holdings LLC | | | | | | | | |
4.24% (1 Month USD LIBOR + 300 bps) due 05/08/213 | | | 1,492,500 | | | | 1,493,903 | |
| Advantage Sales & Marketing LLC | | | | | | | | |
4.49% (1 Month USD LIBOR + 325 bps) due 07/23/213 | | | 1,079,814 | | | | 1,014,690 | |
| PetSmart Inc | | | | | | | | |
4.24% (1 Month USD LIBOR + 300 bps) due 03/11/223 | | | 787,909 | | | | 664,468 | |
| National Vision, Inc. | | | | | | | | |
4.24% (1 Month USD LIBOR + 300 bps) due 03/12/213 | | | 590,816 | | | | 592,045 | |
| Fitness International LLC | | | | | | | | |
7.50% (Commercial Prime Lending Rate + 325 bps) due 07/01/203 | | | 208,407 | | | | 209,374 | |
| BJ’s Wholesale Club, Inc. | | | | | | | | |
4.98% (1 Month USD LIBOR + 375 bps) due 02/03/243 | | | 212,468 | | | | 203,361 | |
| Total Consumer, Cyclical | | | | | | | 4,177,841 | |
| Total Senior Floating Rate Interests | | | | | | | | |
| (Cost $38,603,385) | | | | | | | 38,123,373 | |
80 | THE GUGGENHEIM FUNDS ANNUAL REPORT | SEE NOTES TO FINANCIAL STATEMENTS. |
SCHEDULE OF INVESTMENTS (continued) | September 30, 2017 |
| LIMITED DURATION FUND | |
| | | Face
Amount~ | | | Value | |
| | | | | | | |
COMMERCIAL PAPER†† - 1.5% | |
| Marriott International, Inc. | | | | | | |
1.47% due 11/03/179,11 | | | 25,000,000 | | | $ | 24,965,625 | |
| Hewlett-Packard Co. | | | | | | | | |
1.52% due 10/24/179,11 | | | 10,000,000 | | | | 9,992,104 | |
| Total Commercial Paper | | | | | | | | |
| (Cost $34,955,914) | | | | | | | 34,957,729 | |
| | | Contracts | | | | |
| | | | | | | |
OTC OPTIONS PURCHASED†† - 0.0% | |
| Put options on: | | | | | | |
Bank of America Merrill Lynch
iShares iBoxx High Yield Corporate
Bond ETF Expiring October
2017 with strike price of $84.00
(Notional Value $235,666,676) | | | 26,551 | | | | 92,929 | |
| Total OTC Put Options Purchased | | | | | | | | |
| (Cost $1,062,040) | | | | | | | 92,929 | |
| | | | | | | | | |
| Total Investments - 100.7% | | | | | | | | |
| (Cost $2,295,781,690) | | | | | | $ | 2,305,254,781 | |
| Other Assets & Liabilities, net - (0.7)% | | | | | | | (15,089,857 | ) |
| Total Net Assets - 100.0% | | | | | | $ | 2,290,164,924 | |
FORWARD FOREIGN CURRENCY EXCHANGE CONTRACTS†† | |
| Counterparty | | Contracts to
Buy (Sell) | | Currency | Settlement
Date | | Settlement
Value | | | Value at
September 30,
2017 | | | Net Unrealized Appreciation/
Depreciation | |
| Citigroup | | | (521,000,000 | ) | MXN | 01/04/18 | | $ | 29,029,921 | | | $ | 28,188,778 | | | $ | 841,143 | |
| Citigroup | | | (4,265,000,000 | ) | JPY | 12/11/17 | | | 38,854,853 | | | | 38,032,801 | | | | 822,052 | |
| Goldman Sachs | | | (37,490,000 | ) | EUR | 11/17/17 | | | 45,011,693 | | | | 44,429,199 | | | | 582,494 | |
| Goldman Sachs | | | (36,910,000 | ) | EUR | 11/30/17 | | | 44,350,392 | | | | 43,772,709 | | | | 577,683 | |
| Citigroup | | | (6,315,170,000 | ) | HUF | 02/28/18 | | | 24,634,222 | | | | 24,167,360 | | | | 466,862 | |
| Citigroup | | | (32,900,000 | ) | EUR | 10/04/17 | | | 39,352,812 | | | | 38,886,745 | | | | 466,067 | |
| Citigroup | | | (274,000,000 | ) | MXN | 12/21/17 | | | 15,290,776 | | | | 14,855,965 | | | | 434,811 | |
| Citigroup | | | (33,670,000 | ) | GBP | 10/02/17 | | | 45,493,893 | | | | 45,111,069 | | | | 382,824 | |
| Barclays | | | (2,183,250,000 | ) | HUF | 6/22/2018 | | | 8,525,323 | | | | 8,369,666 | | | | 155,657 | |
| Goldman Sachs | | | (814,875,000 | ) | HUF | 6/22/2018 | | | 3,196,214 | | | | 3,123,889 | | | | 72,325 | |
| Citigroup | | | (284,856,000 | ) | DKK | 11/15/17 | | | 45,535,795 | | | | 45,363,162 | | | | 172,633 | |
| Goldman Sachs | | | (8,470,000 | ) | EUR | 12/08/17 | | | 10,180,813 | | | | 10,049,955 | | | | 130,858 | |
| Citigroup | | | (1,841,437,500 | ) | HUF | 11/24/17 | | | 7,136,525 | | | | 7,006,279 | | | | 130,246 | |
| J.P. Morgan | | | (712,600,000 | ) | MXN | 11/09/17 | | | 39,017,713 | | | | 38,891,128 | | | | 126,585 | |
| Goldman Sachs | | | (653,359,200 | ) | HUF | 04/25/18 | | | 2,561,180 | | | | 2,504,705 | | | | 56,475 | |
| Goldman Sachs | | | (250,000,000 | ) | HUF | 05/23/18 | | | 978,588 | | | | 958,395 | | | | 20,193 | |
| Goldman Sachs | | | (619,250,000 | ) | JPY | 10/16/17 | | | 5,521,475 | | | | 5,507,136 | | | | 14,339 | |
| Deutsche Bank | | | (74,925,000 | ) | ILS | 10/31/17 | | | 21,245,074 | | | | 21,238,677 | | | | 6,397 | |
| Goldman Sachs | | | (11,793,600 | ) | ILS | 01/31/18 | | | 3,301,217 | | | | 3,356,430 | | | | (55,213 | ) |
| Citigroup | | | (10,400,000 | ) | ILS | 01/31/18 | | | 2,894,739 | | | | 2,959,815 | | | | (65,076 | ) |
| Citigroup | | | (27,854,770 | ) | CZK | 03/19/18 | | | 1,152,905 | | | | 1,284,343 | | | | (131,438 | ) |
| Deutsche Bank | | | (3,042,325 | ) | EUR | 10/10/17 | | | 3,425,414 | | | | 3,597,291 | | | | (171,877 | ) |
| Goldman Sachs | | | (70,595,000 | ) | CZK | 03/19/18 | | | 3,046,171 | | | | 3,255,034 | | | | (208,863 | ) |
| Citigroup | | | (44,904,375 | ) | ILS | 10/31/17 | | | 12,491,133 | | | | 12,728,855 | | | | (237,722 | ) |
| Morgan Stanley | | | (150,000,000 | ) | CZK | 11/09/17 | | | 6,607,638 | | | | 6,845,871 | | | | (238,233 | ) |
| Goldman Sachs | | | 712,600,000 | | MXN | 11/09/17 | | | (38,891,128 | ) | | | (39,583,391 | ) | | | (692,263 | ) |
| Bank of America | | | (192,825,200 | ) | CZK | 03/19/18 | | | 7,941,861 | | | | 8,890,893 | | | | (949,032 | ) |
| Citigroup | | | (28,520,000 | ) | EUR | 10/13/17 | | | 32,753,538 | | | | 33,728,861 | | | | (975,323 | ) |
| | | | | | | | | | | | | | | | | $ | 1,734,604 | |
| SEE NOTES TO FINANCIAL STATEMENTS. | THE GUGGENHEIM FUNDS ANNUAL REPORT | 81 |
SCHEDULE OF INVESTMENTS (continued) | September 30, 2017 |
| LIMITED DURATION FUND | |
| ~ | The face amount is denominated in U.S. dollars unless otherwise indicated. |
† | Value determined based on Level 1 inputs — See Note 4. |
†† | Value determined based on Level 2 inputs, unless otherwise noted — See Note 4. |
††† | Value determined based on Level 3 inputs — See Note 4. |
1 | Affiliated issuer. |
2 | Rate indicated is the 7 day yield as of September 30, 2017. |
3 | Variable rate security. Rate indicated is rate effective at September 30, 2017. |
4 | Security is a 144A or Section 4(a)(2) security. These securities have been determined to be liquid under guidelines established by the Board of Trustees. The total market value of 144A or Section 4(a)(2) securities is $1,156,113,151 (cost $1,150,180,776), or 50.5% of total net assets. |
5 | Security has no stated coupon. However, it is expected to receive residual cash flow payments on defined deal dates. |
6 | Security is a 144A or Section 4(a)(2) security. These securities have been determined to be illiquid and restricted under guidelines established by the Board of Trustees. The total market value of 144A or Section 4(a)(2) illiquid and restricted securities is $107,220 (cost $658,275), or 0.0% of total net assets. See Note 10. |
7 | Perpetual maturity. |
8 | Security is in default of interest and/or principal obligations. |
9 | Rate indicated is the effective yield at the time of purchase. |
10 | Maturity date indicated is next interest reset date. |
11 | Zero coupon rate security. |
12 | Security has a fixed rate coupon which will convert to a floating or variable rate coupon on a future date. |
13 | The effective rate shown is based on a weighted average of the underlying reference rates and spread amounts listed. |
| | plc — Public Limited Company |
| | LIBOR — London Interbank Offered Rate |
| | WAC — Weighted Average Coupon |
| | CZK — Czech Koruna |
| | DKK — Danish Krone |
| | EUR — Euro |
| | GBP — British Pound |
| | HUF — Hungarian Forint |
| | ILS — Israeli New Shekel |
| | JPY — Japanese Yen |
| | MXN — Mexican Peso |
| | |
| | See Sector Classification in Other Information section. |
The following table summarizes the inputs used to value the Fund’s investments at September 30, 2017 (See Note 4 in the Notes to Financial Statements):
| Investments in Securities (Assets) | | Level 1
Quoted
Prices | | | Level 2
Significant
Observable
Inputs | | | Level 2 -
Other* | | | Level 3
Significant
Unobservable
Inputs | | | Total | |
| Asset Backed Securities | | $ | — | | | $ | 836,627,261 | | | $ | — | | | $ | — | | | $ | 836,627,261 | |
| Collateralized Mortgage Obligations | | | — | | | | 370,054,059 | | | | — | | | | 12,158,258 | | | | 382,212,317 | |
| Commercial Paper | | | — | | | | 34,957,729 | | | | — | | | | — | | | | 34,957,729 | |
| Corporate Bonds | | | — | | | | 454,254,082 | | | | — | | | | — | | | | 454,254,082 | |
| Forward Foreign Currency Exchange Contracts | | | — | | | | — | | | | 5,459,644 | | | | — | | | | 5,459,644 | |
| Foreign Government Debt | | | — | | | | 460,665,901 | | | | — | | | | — | | | | 460,665,901 | |
| Money Market Fund | | | 34,712,289 | | | | — | | | | — | | | | — | | | | 34,712,289 | |
| Mutual Funds | | | 63,608,900 | | | | — | | | | — | | | | — | | | | 63,608,900 | |
| Options Purchased | | | — | | | | 92,929 | | | | — | | | | — | | | | 92,929 | |
| Senior Floating Rate Interests | | | — | | | | 38,123,373 | | | | — | | | | — | | | | 38,123,373 | |
| Total Assets | | $ | 98,321,189 | | | $ | 2,194,775,334 | | | $ | 5,459,644 | | | $ | 12,158,258 | | | $ | 2,310,714,425 | |
| | | | | | | | | | | | | | | | | | | | | |
| Investments in Securities (Liabilities) | | Level 1
Quoted
Prices | | | Level 2
Significant
Observable
Inputs | | | Level 2 -
Other* | | | Level 3
Significant
Unobservable
Inputs | | | Total | |
| Forward Foreign Currency Exchange Contracts | | $ | — | | | $ | — | | | $ | 3,725,040 | | | $ | — | | | $ | 3,725,040 | |
| * | Other financial instruments include forward foreign currency exchange contracts, which are reported as unrealized gain/loss at period end. |
82 | THE GUGGENHEIM FUNDS ANNUAL REPORT | SEE NOTES TO FINANCIAL STATEMENTS. |
SCHEDULE OF INVESTMENTS (concluded) | September 30, 2017 |
| LIMITED DURATION FUND | |
Transfers between investment levels may occur as the markets fluctuate and/or the availability of data used in an investment’s valuation changes. Transfers between valuation levels, if any, are in comparison to the valuation levels at the end of the previous fiscal year, and are effective using the fair value as of the end of the current fiscal period.
For the year ended September 30, 2017, Limited Duration Fund had securities with the total value $2,021,658 transfer out of Level 3 into Level 2 due to changes in securities’ valuation methods using observable inputs. There were no other transfers between levels.
Affiliated Transactions
Investments representing 5% or more of the outstanding voting shares of a portfolio company of a fund, or control of or by, or common control under GI, result in that portfolio company being considered an affiliated company of such fund, as defined in the 1940 Act. The Fund may invest in the Guggenheim Strategy Funds Trust consisting of Guggenheim Strategy Fund I, Guggenheim Strategy Fund II, Guggenheim Strategy Fund III, and Guggenheim Variable Insurance Strategy Fund III (collectively, the “Cash Management Funds”), open-end management investment companies managed by GI. The Cash Management Funds, which launched on March 11, 2014, are offered as cash management options only to mutual funds, trusts, and other accounts managed by GI and/or its affiliates, and are not available to the public. The Cash Management Funds pay no investment management fees. The Cash Management Funds’ annual report on Form N-CSR dated September 30, 2016, is available publicly or upon request. This information is available from the EDGAR database on the SEC’s website at https://www.sec.gov/Archives/edgar/data/1601445/000089180416001923/gug65857-ncsr.htm.
Transactions during the year ended September 30, 2017, in which the portfolio company is an “affiliated person”, were as follows:
| Security Name | | Value
09/30/16 | | | Additions | | | Reductions | | | Realized
Gain | | | Change in
Unrealized | | | Value
09/30/17 | | | Shares
09/30/17 | | | Investment
Income | |
| Guggenheim Floating Rate Strategies Fund - Institutional Class | | $ | 1,283,886 | | | $ | 26,050,406 | | | $ | — | | | $ | — | | | $ | (55,859 | ) | | $ | 27,278,433 | | | | 1,047,559 | | | $ | 548,177 | |
| Guggenheim Strategy Fund I | | | 12,071,811 | | | | 1,968,133 | | | | (1,500,000 | ) | | | 9,790 | | | | 49,990 | | | | 12,599,724 | | | | 501,781 | | | | 218,270 | |
| Guggenheim Strategy Fund II | | | 5,047,051 | | | | 9,248,082 | | | | — | | | | — | | | | 54,513 | | | | 14,349,646 | | | | 572,612 | | | | 247,848 | |
| Guggenheim Strategy Fund III | | | — | | | | 9,368,095 | | | | — | | | | — | | | | 13,002 | | | | 9,381,097 | | | | 374,644 | | | | 117,512 | |
| | | $ | 18,402,748 | | | $ | 46,634,716 | | | $ | (1,500,000 | ) | | $ | 9,790 | | | $ | 61,646 | | | $ | 63,608,900 | | | | | | | $ | 1,131,807 | |
| SEE NOTES TO FINANCIAL STATEMENTS. | THE GUGGENHEIM FUNDS ANNUAL REPORT | 83 |
| STATEMENT OF ASSETS AND LIABILITIES |
| September 30, 2017 |
| Assets: | |
| Investments in unaffiliated issuers, at value (cost $2,232,347,075) | | $ | 2,241,645,881 | |
| Investments in affiliated issuers, at value (cost $63,434,615) | | | 63,608,900 | |
| Segregated cash with broker | | | 1,545,001 | |
| Unrealized appreciation on forward foreign currency exchange contracts | | | 5,459,644 | |
| Cash | | | 718,250 | |
| Prepaid expenses | | | 110,519 | |
| Receivables: | |
| Fund shares sold | | | 12,351,378 | |
| Interest | | | 8,685,375 | |
| Securities sold | | | 1,409,534 | |
| Dividends | | | 232,755 | |
| Total assets | | | 2,335,767,237 | |
| | | | | |
| Liabilities: | |
| Segregated cash due to broker | | | 1,300,000 | |
| Unrealized depreciation of forward foreign currency exchange contracts | | | 3,725,040 | |
| Payable for: | |
| Securities purchased | | | 33,004,923 | |
| Fund shares redeemed | | | 6,117,105 | |
| Management fees | | | 511,471 | |
| Dividends distributed | | | 425,122 | |
| Distribution and service fees | | | 160,065 | |
| Fund accounting/administration fees | | | 146,970 | |
| Transfer agent/maintenance fees | | | 50,929 | |
| Trustees’ fees* | | | 1,667 | |
| Miscellaneous | | | 159,021 | |
| Total liabilities | | | 45,602,313 | |
| Net assets | | $ | 2,290,164,924 | |
| | | | | |
| Net assets consist of: | |
| Paid in capital | | $ | 2,277,366,723 | |
| Accumulated net investment loss | | | 1,533,069 | |
| Accumulated net realized gain on investments | | | 64,494 | |
| Net unrealized appreciation on investments | | | 11,200,638 | |
| Net assets | | $ | 2,290,164,924 | |
| | | | | |
| A-Class: | |
| Net assets | | $ | 509,409,757 | |
| Capital shares outstanding | | | 20,492,696 | |
| Net asset value per share | | $ | 24.86 | |
| Maximum offering price per share (Net asset value divided by 97.75%) | | $ | 25.43 | |
| | | | | |
| C-Class: | |
| Net assets | | $ | 50,743,411 | |
| Capital shares outstanding | | | 2,042,594 | |
| Net asset value per share | | $ | 24.84 | |
| | | | | |
| P-Class: | |
| Net assets | | $ | 92,502,842 | |
| Capital shares outstanding | | | 3,721,371 | |
| Net asset value per share | | $ | 24.86 | |
| | | | | |
| Institutional Class: | |
| Net assets | | $ | 1,637,508,914 | |
| Capital shares outstanding | | | 65,893,035 | |
| Net asset value per share | | $ | 24.85 | |
| * | Relates to Trustees not deemed “interested persons” within the meaning of Section 2(a)(19) of the 1940 Act. |
84 | THE GUGGENHEIM FUNDS ANNUAL REPORT | SEE NOTES TO FINANCIAL STATEMENTS. |
| STATEMENT OF OPERATIONS |
| Year Ended September 30, 2017 |
| Investment Income: | |
| Dividends from securities of unaffiliated issuers | | $ | 49,892 | |
| Dividends from securities of affiliated issuers | | | 1,131,807 | |
| Interest | | | 39,959,769 | |
| Total investment income | | | 41,141,468 | |
| | | | | |
| Expenses: | |
| Management fees | | | 6,336,020 | |
| Distribution and service fees: | |
| A-Class | | | 827,948 | |
| C-Class | | | 349,633 | |
| P-Class | | | 96,259 | |
| Recoupment of previously waived fees: | |
| C-Class | | | 15 | |
| P-Class | | | 903 | |
| Transfer agent/maintenance fees: | |
| A-Class | | | 120,445 | |
| C-Class | | | 27,911 | |
| P-Class | | | 38,198 | |
| Institutional Class | | | 314,187 | |
| Fund accounting/administration fees | | | 1,127,600 | |
| Line of credit fees | | | 202,445 | |
| Custodian fees | | | 36,654 | |
| Trustees’ fees* | | | 24,819 | |
| Miscellaneous | | | 385,173 | |
| Total expenses | | | 9,888,210 | |
| Less: | |
| Expenses waived by Adviser | | | (352,549 | ) |
| Expenses reimbursed by Adviser: | | | | |
| A-Class | | | (96,046 | ) |
| C-Class | | | (23,273 | ) |
| P-Class | | | (26,280 | ) |
| Institutional | | | (262,096 | ) |
| Total waived/reimbursed expenses | | | (760,244 | ) |
| Net expenses | | | 9,127,966 | |
| Net investment income | | | 32,013,502 | |
| | | | | |
| Net Realized and Unrealized Gain (Loss): | |
| Net realized gain (loss) on: | |
| Investments in unaffiliated issuers | | | 16,583,420 | |
| Investments in affiliated issuers | | | 9,790 | |
| Foreign currency transactions | | | 243,643 | |
| Forward currency exchange contracts | | | (12,535,247 | ) |
| Options purchased | | | (774,250 | ) |
| Net realized gain | | | 3,527,356 | |
| Net change in unrealized appreciation (depreciation) on: | |
| Investments in unaffiliated issuers | | | 6,660,146 | |
| Investments in affiliated issuers | | | 61,646 | |
| Options purchased | | | (969,111 | ) |
| Foreign currency translations | | | (7,057 | ) |
| Forward foreign currency exchange contracts | | | 1,734,604 | |
| Net change in unrealized appreciation (depreciation) | | | 7,480,228 | |
| Net realized and unrealized gain | | | 11,007,584 | |
| Net increase in net assets resulting from operations | | $ | 43,021,086 | |
| * | Relates to Trustees not deemed “interested persons” within the meaning of Section 2(a)(19) of the 1940 Act. |
| SEE NOTES TO FINANCIAL STATEMENTS. | THE GUGGENHEIM FUNDS ANNUAL REPORT | 85 |
| STATEMENTS OF CHANGES IN NET ASSETS |
| | | Year Ended
September 30,
2017 | | | Year Ended
September 30,
2016 | |
| Increase (Decrease) in Net Assets from Operations: | | | | | | |
| Net investment income | | $ | 32,013,502 | | | $ | 15,051,006 | |
| Net realized gain on investments | | | 3,527,356 | | | | 329,409 | |
| Net change in unrealized appreciation (depreciation) on investments | | | 7,480,228 | | | | 5,500,562 | |
| Net increase in net assets resulting from operations | | | 43,021,086 | | | | 20,880,977 | |
| | | | | | | | | |
| Distributions to shareholders from: | | | | | | | | |
| Net investment income | | | | | | | | |
| A-Class | | | (7,270,962 | ) | | | (5,091,611 | ) |
| C-Class | | | (515,105 | ) | | | (443,426 | ) |
| P-Class | | | (748,808 | ) | | | (58,350 | ) |
| Institutional Class | | | (24,283,348 | ) | | | (9,932,238 | ) |
| Net realized gains | | | | | | | | |
| A-Class | | | (40,107 | ) | | | — | |
| C-Class | | | (4,814 | ) | | | — | |
| P-Class | | | (512 | ) | | | — | |
| Institutional Class | | | (103,662 | ) | | | — | |
| Total distributions to shareholders | | | (32,967,318 | ) | | | (15,525,625 | ) |
| | | | | | | | | |
| Capital share transactions: | | | | | | | | |
| Proceeds from sale of shares | | | | | | | | |
| A-Class | | | 442,378,068 | | | | 197,623,014 | |
| C-Class | | | 36,743,002 | | | | 24,267,204 | |
| P-Class | | | 103,833,454 | | | | 1,976,882 | |
| Institutional Class | | | 1,621,228,591 | | | | 545,334,586 | |
| Distributions reinvested | | | | | | | | |
| A-Class | | | 5,865,169 | | | | 4,329,140 | |
| C-Class | | | 373,493 | | | | 327,005 | |
| P-Class | | | 744,376 | | | | 58,350 | |
| Institutional Class | | | 21,805,737 | | | | 8,366,742 | |
| Cost of shares redeemed | | | | | | | | |
| A-Class | | | (156,887,800 | ) | | | (105,025,329 | ) |
| C-Class | | | (13,395,699 | ) | | | (8,309,387 | ) |
| P-Class | | | (14,043,133 | ) | | | (3,110,231 | ) |
| Institutional Class | | | (489,428,410 | ) | | | (257,307,806 | ) |
| Net increase from capital share transactions | | | 1,559,216,848 | | | | 408,530,170 | |
| Net increase in net assets | | | 1,569,270,616 | | | | 413,885,522 | |
| | | | | | | | | |
| Net assets: | | | | | | | | |
| Beginning of year | | | 720,894,308 | | | | 307,008,786 | |
| End of year | | $ | 2,290,164,924 | | | $ | 720,894,308 | |
| Undistributed net investment income at end of period/Accumulated net investment loss at end of year | | $ | 1,533,069 | | | $ | (949,706 | ) |
86 | THE GUGGENHEIM FUNDS ANNUAL REPORT | SEE NOTES TO FINANCIAL STATEMENTS. |
STATEMENTS OF CHANGES IN NET ASSETS (concluded) |
| | | Year Ended
September 30,
2017 | | | Year Ended
September 30,
2016 | |
| Capital share activity: | | | | | | |
| Shares sold | | | | | | |
| A-Class | | | 17,860,279 | | | | 8,081,165 | |
| C-Class | | | 1,483,714 | | | | 992,734 | |
| P-Class | | | 4,191,187 | | | | 80,811 | |
| Institutional Class | | | 65,477,150 | | | | 22,327,682 | |
| Shares issued from reinvestment of distributions | | | | | | | | |
| A-Class | | | 236,786 | | | | 176,965 | |
| C-Class | | | 15,094 | | | | 13,376 | |
| P-Class | | | 30,001 | | | | 2,393 | |
| Institutional Class | | | 880,322 | | | | 341,766 | |
| Shares redeemed | | | | | | | | |
| A-Class | | | (6,338,198 | ) | | | (4,296,150 | ) |
| C-Class | | | (541,349 | ) | | | (340,015 | ) |
| P-Class | | | (566,399 | ) | | | (127,607 | ) |
| Institutional Class | | | (19,752,906 | ) | | | (10,535,961 | ) |
| Net increase in shares | | | 62,975,681 | | | | 16,717,159 | |
| SEE NOTES TO FINANCIAL STATEMENTS. | THE GUGGENHEIM FUNDS ANNUAL REPORT | 87 |
This table is presented to show selected data for a share outstanding throughout each period and to assist shareholders in evaluating a Fund’s performance for the periods presented.
| A-Class | | Year Ended
September 30,
2017 | | | Year Ended
September 30,
2016 | | | Year Ended
September 30,
2015 | | | Period Ended
September 30,
2014a | |
| Per Share Data | | | | | | | | | | | | |
| Net asset value, beginning of period | | $ | 24.71 | | | $ | 24.65 | | | $ | 24.97 | | | $ | 25.00 | |
| Income (loss) from investment operations: | |
Net investment income (loss)b | | | .53 | | | | .67 | | | | .69 | | | | .52 | |
| Net gain (loss) on investments (realized and unrealized) | | | .20 | | | | .08 | | | | (.16 | ) | | | (.08 | ) |
| Total from investment operations | | | .73 | | | | .75 | | | | .53 | | | | .44 | |
| Less distributions from: | |
| Net investment income | | | (.58 | ) | | | (.69 | ) | | | (.84 | ) | | | (.47 | ) |
| Net realized gains | | | — | c | | | — | | | | (.01 | ) | | | — | |
| Total distributions | | | (.58 | ) | | | (.69 | ) | | | (.85 | ) | | | (.47 | ) |
| Net asset value, end of period | | $ | 24.86 | | | $ | 24.71 | | | $ | 24.65 | | | $ | 24.97 | |
| | |
Total Returni | | | 2.95 | % | | | 3.16 | % | | | 2.15 | % | | | 1.75 | % |
| Ratios/Supplemental Data | |
| Net assets, end of period (in thousands) | | $ | 509,410 | | | $ | 215,856 | | | $ | 117,628 | | | $ | 17,035 | |
| Ratios to average net assets: | |
| Net investment income (loss) | | | 2.14 | % | | | 2.73 | % | | | 2.79 | % | | | 2.67 | % |
Total expensesd | | | 0.86 | % | | | 0.93 | % | | | 0.99 | % | | | 1.14 | % |
Net expensese,h | | | 0.81 | % | | | 0.84 | % | | | 0.87 | % | | | 0.83 | % |
| Portfolio turnover rate | | | 55 | % | | | 39 | % | | | 26 | % | | | 40 | % |
| C-Class | | Year Ended
September 30,
2017 | | | Year Ended
September 30,
2016 | | | Year Ended
September 30,
2015 | | | Period Ended
September 30,
2014a | |
| Per Share Data | | | | | | | | | | | | |
| Net asset value, beginning of period | | $ | 24.70 | | | $ | 24.63 | | | $ | 24.96 | | | $ | 25.00 | |
| Income (loss) from investment operations: | |
Net investment income (loss)b | | | .35 | | | | .48 | | | | .49 | | | | .38 | |
| Net gain (loss) on investments (realized and unrealized) | | | .18 | | | | .10 | | | | (.16 | ) | | | (.09 | ) |
| Total from investment operations | | | .53 | | | | .58 | | | | .33 | | | | .29 | |
| Less distributions from: | |
| Net investment income | | | (.39 | ) | | | (.51 | ) | | | (.65 | ) | | | (.33 | ) |
| Net realized gains | | | — | c | | | — | | | | (.01 | ) | | | — | |
| Total distributions | | | (.39 | ) | | | (.51 | ) | | | (.66 | ) | | | (.33 | ) |
| Net asset value, end of period | | $ | 24.84 | | | $ | 24.70 | | | $ | 24.63 | | | $ | 24.96 | |
| | |
Total Returni | | | 2.18 | % | | | 2.39 | % | | | 1.37 | % | | | 1.13 | % |
| Ratios/Supplemental Data | |
| Net assets, end of period (in thousands) | | $ | 50,743 | | | $ | 26,802 | | | $ | 10,323 | | | $ | 643 | |
| Ratios to average net assets: | |
| Net investment income (loss) | | | 1.41 | % | | | 1.98 | % | | | 1.96 | % | | | 1.93 | % |
Total expensesd | | | 1.65 | % | | | 1.73 | % | | | 1.76 | % | | | 2.14 | % |
Net expensese,h | | | 1.56 | %f | | | 1.58 | % | | | 1.62 | % | | | 1.56 | % |
| Portfolio turnover rate | | | 55 | % | | | 39 | % | | | 26 | % | | | 40 | % |
88 | THE GUGGENHEIM FUNDS ANNUAL REPORT | SEE NOTES TO FINANCIAL STATEMENTS. |
FINANCIAL HIGHLIGHTS (continued) |
This table is presented to show selected data for a share outstanding throughout each period and to assist shareholders in evaluating a Fund’s performance for the periods presented.
| P-Class | | Year Ended
September 30,
2017 | | | Year Ended
September 30,
2016 | | | Period Ended
September 30,
2015g | |
| Per Share Data | | | | | | | | | |
| Net asset value, beginning of period | | $ | 24.72 | | | $ | 24.65 | | | $ | 24.86 | |
| Income (loss) from investment operations: | |
Net investment income (loss)b | | | .47 | | | | .68 | | | | .25 | |
| Net gain (loss) on investments (realized and unrealized) | | | .24 | | | | .08 | | | | (.17 | ) |
| Total from investment operations | | | .71 | | | | .76 | | | | .08 | |
| Less distributions from: | |
| Net investment income | | | (.57 | ) | | | (.69 | ) | | | (.29 | ) |
| Net realized gains | | | — | c | | | — | | | | — | |
| Total distributions | | | (.57 | ) | | | (.69 | ) | | | (.29 | ) |
| Net asset value, end of period | | $ | 24.86 | | | $ | 24.72 | | | $ | 24.65 | |
| | |
Total Returni | | | 2.93 | % | | | 3.17 | % | | | 0.32 | % |
| Ratios/Supplemental Data | |
| Net assets, end of period (in thousands) | | $ | 92,503 | | | $ | 1,646 | | | $ | 2,736 | |
| Ratios to average net assets: | |
| Net investment income (loss) | | | 1.89 | % | | | 2.76 | % | | | 2.39 | % |
Total expensesd | | | 0.92 | % | | | 0.94 | % | | | 0.94 | % |
Net expensese,h | | | 0.81 | %f | | | 0.84 | % | | | 0.88 | % |
| Portfolio turnover rate | | | 55 | % | | | 39 | % | | | 26 | % |
| SEE NOTES TO FINANCIAL STATEMENTS. | THE GUGGENHEIM FUNDS ANNUAL REPORT | 89 |
FINANCIAL HIGHLIGHTS (concluded) |
This table is presented to show selected data for a share outstanding throughout each period and to assist shareholders in evaluating a Fund’s performance for the periods presented.
| Institutional Class | | Year Ended
September 30,
2017 | | | Year Ended
September 30,
2016 | | | Year Ended
September 30,
2015 | | | Period Ended
September 30,
2014a | |
| Per Share Data | | | | | | | | | | | | |
| Net asset value, beginning of period | | $ | 24.71 | | | $ | 24.64 | | | $ | 24.96 | | | $ | 25.00 | |
| Income (loss) from investment operations: | |
Net investment income (loss)b | | | .59 | | | | .73 | | | | .78 | | | | .57 | |
| Net gain (loss) on investments (realized and unrealized) | | | .19 | | | | .09 | | | | (.19 | ) | | | (.08 | ) |
| Total from investment operations | | | .78 | | | | .82 | | | | .59 | | | | .49 | |
| Less distributions from: | |
| Net investment income | | | (.64 | ) | | | (.75 | ) | | | (.90 | ) | | | (.53 | ) |
| Net realized gains | | | — | c | | | — | | | | (.01 | ) | | | — | |
| Total distributions | | | (.64 | ) | | | (.75 | ) | | | (.91 | ) | | | (.53 | ) |
| Net asset value, end of period | | $ | 24.85 | | | $ | 24.71 | | | $ | 24.64 | | | $ | 24.96 | |
| | |
Total Returni | | | 3.21 | % | | | 3.43 | % | | | 2.41 | % | | | 1.98 | % |
| Ratios/Supplemental Data | |
| Net assets, end of period (in thousands) | | $ | 1,637,509 | | | $ | 476,591 | | | $ | 176,322 | | | $ | 69,150 | |
| Ratios to average net assets: | |
| Net investment income (loss) | | | 2.36 | % | | | 2.97 | % | | | 3.14 | % | | | 2.90 | % |
Total expensesd | | | 0.61 | % | | | 0.67 | % | | | 0.73 | % | | | 0.96 | % |
Net expensese,h | | | 0.56 | % | | | 0.58 | % | | | 0.62 | % | | | 0.57 | % |
| Portfolio turnover rate | | | 55 | % | | | 39 | % | | | 26 | % | | | 40 | % |
a | Since commencement of operations: December 16, 2013. Percentage amounts for the period, except total return and portfolio turnover rate, have been annualized. |
b | Net investment income (loss) per share was computed using average shares outstanding throughout the period. |
c | Distributions from realized gains are less than $0.01 per share. |
d | Does not include expenses of the underlying funds in which the Fund invests. |
e | Net expense information reflects the expense ratios after expense waivers. |
f | The portion of the ratios of net expenses to average net assets attributable to recoupments of prior fee reductions of expense reimbursements is 0.00% for C-Class and 0.00% for P-Class. |
g | Since commencement of operations: May 1, 2015. Percentage amounts for the period, except total return and portfolio turnover rate, have been annualized. |
h | Net expenses may include expenses that are excluded from the expense limitation agreement. Excluding these expenses, the net expense ratios for the years would be: |
| | | 09/30/17 | 09/30/16 | 09/30/15 | 09/30/14 |
| | A-Class | 0.79% | 0.80% | 0.80% | 0.79% |
| | C-Class | 1.54% | 1.55% | 1.55% | 1.52% |
| | P-Class | 0.79% | 0.80% | 0.80% | N/A |
| | Institutional Class | 0.54% | 0.55% | 0.55% | 0.54% |
i | Total return does not reflect the impact of any applicable sales charges and has not been annualized. |
90 | THE GUGGENHEIM FUNDS ANNUAL REPORT | SEE NOTES TO FINANCIAL STATEMENTS. |
MANAGERS’ COMMENTARY (Unaudited) | September 30, 2017 |
To Our Shareholders
Guggenheim Investments Municipal Income Fund (the “Fund”) is managed by a team of seasoned professionals, including B. Scott Minerd, Chairman of Investments and Global Chief Investment Officer; Anne B. Walsh, Senior Managing Director and Assistant Chief Investment Officer; James E. Pass, Senior Managing Director and Portfolio Manager; Jeffrey S. Carefoot, CFA, Senior Managing Director and Portfolio Manager; and Allen Li, CFA, Managing Director and Portfolio Manager. In the following paragraphs, the investment team discusses the market environment and the Fund’s performance for the fiscal year ended September 30, 2017.
For the one-year period ended September 30, 2017, the Guggenheim Municipal Income Fund returned 0.94%1, compared with the 0.87% return of the Bloomberg Barclays Municipal Bond Index, the Fund’s benchmark.
Total returns in municipal credit were positive for the year, despite some months of negative returns when interest rates jumped. Supply and demand technical continue to drive spread compression and returns. The municipal market has become increasingly focused on the political drama of Illinois and Chicago, eleventh-hour passages of 2018 budgets, and the restructuring of Puerto Rico’s debt complex. As the themes that led to these issuers’ credit deterioration extend to other municipalities, we expect the watch list of weaker credits in the municipal market to expand. Inescapable structural pension issues and reconciliation of far-reaching federal policies (e.g., healthcare) will continue to put pressure on cash-strapped municipalities.
Following 2016’s record-setting year for municipal debt issuance of approximately $446 billion, year-to-date supply ending September 30 has declined by approximately 15% year over year, reflecting policy uncertainties, new political landscapes, and fewer refinancing opportunities. Supply could also decline in 2017, closer to 10-year averages, while the five-year trend of refundings exceeding new money supply should also continue.
As for demand, municipal bond mutual funds experienced net inflows of $15 billion for the first nine months of 2017. With the exception of Puerto Rico credits, the level of municipal bond defaults has been declining over the past few years, and is nearing pre-financial crisis levels.
Credit selection and curve positioning positively influenced the Fund’s return for the period. Among the best performers were bonds backed by state taxes and essential service revenues, as well as healthcare and higher education issuers. The Fund continues to overweight education, utilities and heath care compared with the benchmark, while underweighting below-investment-grade bonds.
Longer-maturity bonds continue to outperform the short-end, and lower-quality bonds continue to outperform higher quality. The best relative value in duration appears at the long end of the curve, where as of September 30, 2017, 30 year tax-exempt bond yields are 99.5% of that of Treasuries, compared with 70.3% at the five-year point of the curve.
The portfolio focuses on higher quality bonds. The Fund does maintain a 12% allocation to floating rate securities, indexed to LIBOR or the tax-exempt floating rate benchmark. To the extent that the Fed continues to raise rates, the Fund should expect a boost to aggregate income given this exposure.
The Fund’s Puerto Rico credits remain under pressure. Debt recoveries in Puerto Rico will hinge on legal decisions surrounding the priority of numerous stakeholders’ claims to Puerto Rico’s available resources. Implications of restructuring proceedings may impact the broader municipal market.
Given increased market volatility and idiosyncratic weakness, the Fund continues to seek attractive risk-adjusted investment opportunities. Its focus continues to be on credit discipline, and bonds supported by dedicated revenue streams and/or statutory liens, with an emphasis on higher quality bonds.
Performance displayed represents past performance which is no guarantee of future results.
1 | Performance figures are based on Class A shares and do not reflect deduction of the sales charges or taxes that a shareholder would pay on distributions or the redemption of shares. |
The opinions and forecast expressed may not actually come to pass. This information is subject to change at any time, based on market and other conditions, and should not be construed as a recommendation of any specific security or strategy.
| | THE GUGGENHEIM FUNDS ANNUAL REPORT | 91 |
PERFORMANCE REPORT AND FUND PROFILE (Unaudited) | September 30, 2017 |
MUNICIPAL INCOME FUND
OBJECTIVE: Seeks to provide current income with an emphasis on income exempt from federal income tax, while also considering capital appreciation.
Holdings Diversification (Market Exposure as % of Net Assets)
“Holdings Diversification (Market Exposure as % of Net Assets)” excludes any temporary cash investments.
Portfolio Composition by Quality Rating1 |
| Rating | |
| Fixed Income Instruments | |
| AAA | 8.3% |
| AA | 63.7% |
| A | 11.7% |
| BBB | 9.8% |
| BB | 3.2% |
| B | 0.6% |
NR2 | 1.1% |
| Other Instruments | 1.6% |
| Total Investments | 100.0% |
| The chart above reflects percentages of the value of total investments. |
| Inception Dates: |
| A-Class | April 28, 2004 |
| C-Class | January 13, 2012 |
| P-Class | May 1, 2015 |
| Institutional Class | January 13, 2012 |
| Ten Largest Holdings (% of Total Net Assets) |
| New York City Water & Sewer System Revenue Bonds, 0.82% | 5.1% |
| City of Detroit Michigan Sewage Disposal System Revenue Revenue Bonds, 1.50% | 3.4% |
| Detroit Wayne County Stadium Authority Revenue Bonds, 5.00% | 3.1% |
| Puerto Rico Electric Power Authority Revenue Bonds, 1.41% | 2.7% |
| Stockton Public Financing Authority Revenue Bonds, 6.25% | 2.3% |
| North Texas Tollway Authority Revenue Bonds, 5.75% | 2.3% |
| Tustin Unified School District General Obligation Unlimited, 6.00% | 2.2% |
| Massachusetts Development Finance Agency Revenue Bonds, 6.88% | 2.1% |
| Detroit City School District General Obligation Unlimited, 5.00% | 2.1% |
| Hudson County Improvement Authority Revenue Bonds, 6.00% | 2.0% |
| Top Ten Total | 27.3% |
| “Ten Largest Holdings” excludes any temporary cash investments. |
1 | Source: BlackRock Solutions. Credit quality ratings are measured on a scale that generally ranges from AAA (highest) to D (lowest). All securities except for those labeled “NR” have been rated by a Nationally Recognized Statistical Rating Organization (“NRSRO”). For purposes of this presentation, when ratings are available from more than one agency, the highest rating is used. Guggenheim Investments converts ratings to the equivalent S&P rating. |
2 | NR securities do not necessarily indicate low credit quality. |
| 92 | THE GUGGENHEIM FUNDS ANNUAL REPORT | |
PERFORMANCE REPORT AND FUND PROFILE (Unaudited)(concluded) | September 30, 2017 |
Cumulative Fund Performance*
Average Annual Returns*
Periods Ended September 30, 2017
| | 1 Year | 5 Year | 10 Year |
| A-Class Shares~ | 0.94% | 2.72% | 2.35% |
A-Class Shares with sales charge† | (3.13%) | 1.73% | 1.85% |
| Bloomberg Barclays Municipal Bond Index | 0.87% | 3.01% | 4.52% |
| | | 1 Year | Since Inception
(01/13/12) |
| C-Class Shares | | 0.12% | 2.93% |
C-Class Shares with CDSC§ | | (0.88%) | 2.93% |
| Institutional Class Shares | | 1.19% | 3.97% |
| Bloomberg Barclays Municipal Bond Index | | 0.87% | 3.39% |
| | | 1 Year | Since Inception
(05/01/15) |
| P-Class Shares | | 0.89% | 2.38% |
| Bloomberg Barclays Municipal Bond Index | | 0.87% | 3.23% |
| * | The performance data above represents past performance that is not predictive of future results. The investment return and principal value of an investment in the Fund will fluctuate so that an investor’s shares, when redeemed, may be worth more or less than their original cost. Returns are historical and include changes in principal and reinvested dividends and capital gains and do not reflect the effect of taxes. The Bloomberg Barclays Municipal Bond Index is an unmanaged index and, unlike the Fund, has no management fees or operating expenses to reduce its reported return. The graph is based on A-Class shares only; performance for C-Class shares, P-Class shares and Institutional Class shares will vary due to differences in fee structures. |
† | Effective October 1, 2015, the maximum sales charge decreased from 4.75% to 4.00%. A 4.75% maximum sales charge is used in the calculation of the Average Annual Returns (based on subscriptions made prior to October 1, 2015), and a 4.00% maximum sales charge is used to calculate performance for periods based on subscriptions made on or after October 1, 2015. |
§ | Fund returns include a CDSC of 1% if redeemed within 12 months of purchase. |
| ~ | Effective January 13, 2012, the Fund acquired all of the assets and liabilities of the TS&W/Claymore Tax-Advantage Balanced Fund (“TYW”), a registered closed-end management investment company. The A-Class performance prior to that date reflects performance of TYW. |
| | THE GUGGENHEIM FUNDS ANNUAL REPORT | 93 |
| SCHEDULE OF INVESTMENTS | September 30, 2017 |
| MUNICIPAL INCOME FUND | |
| | | Shares | | | Value | |
| | | | | | | |
MONEY MARKET FUND† - 1.6% | |
Dreyfus Tax Exempt Cash Management Institutional Shares 0.64%1 | | | 848,238 | | | $ | 848,238 | |
| Total Money Market Fund | | | | | | | | |
| (Cost $848,238) | | | | | | | 848,238 | |
| | | | | | | | | |
| | | Face
Amount | | | | | |
| | | | | | | | | |
MUNICIPAL BONDS†† - 97.4% | |
| California - 15.5% | |
| Stockton Public Financing Authority Revenue Bonds | | | | | | | | |
| 6.25% due 10/01/38 | | $ | 1,000,000 | | | | 1,232,850 | |
| 6.25% due 10/01/40 | | | 250,000 | | | | 306,315 | |
| Tustin Unified School District General Obligation Unlimited | | | | | | | | |
| 6.00% due 08/01/36 | | | 1,000,000 | | | | 1,183,470 | |
| College of the Sequoias Tulare Area Improvement District No. 3 General Obligation Unlimited | | | | | | | | |
6.85% due 08/01/422 | | | 1,000,000 | | | | 638,310 | |
| State of California General Obligation Unlimited | | | | | | | | |
| 5.00% due 03/01/26 | | | 500,000 | | | | 604,660 | |
| Sacramento Municipal Utility District Revenue Bonds | | | | | | | | |
| 5.00% due 08/15/37 | | | 500,000 | | | | 580,075 | |
| Newport Mesa Unified School District General Obligation Unlimited | | | | | | | | |
due 08/01/393 | | | 1,300,000 | | | | 570,648 | |
| Los Angeles Department of Water & Power System Revenue Bonds | | | | | | | | |
| 5.00% due 07/01/43 | | | 500,000 | | | | 566,260 | |
| Kings Canyon Unified School District General Obligation Unlimited | | | | | | | | |
| 5.00% due 08/01/28 | | | 445,000 | | | | 531,041 | |
| San Diego Unified School District General Obligation Unlimited | | | | | | | | |
due 07/01/393 | | | 1,000,000 | | | | 418,730 | |
| Riverside County Public Financing Authority Tax Allocation | | | | | | | | |
| 5.00% due 10/01/28 | | | 300,000 | | | | 366,549 | |
| Oakland Unified School District/Alameda County General Obligation Unlimited | | | | | | | | |
| 5.00% due 08/01/22 | | | 300,000 | | | | 337,113 | |
| M-S-R Energy Authority Revenue Bonds | | | | | | | | |
| 6.13% due 11/01/29 | | | 200,000 | | | | 253,648 | |
| Alameda Corridor Transportation Authority Revenue Bonds | | | | | | | | |
| 5.00% due 10/01/35 | | | 200,000 | | | | 232,390 | |
| Stanton Redevelopment Agency Tax Allocation | | | | | | | | |
| 5.00% due 12/01/40 | | | 180,000 | | | | 206,341 | |
| Culver Redevelopment Agency Tax Allocation | | | | | | |
due 11/01/233 | | | 195,000 | | | | 165,089 | |
| Total California | | | | | | | 8,193,489 | |
| | | | | | | | | |
| New York - 11.4% | |
| New York City Water & Sewer System Revenue Bonds | | | | | | | | |
0.82% (VRDN + 0 bps) due 06/15/484 | | | 2,700,000 | | | | 2,700,000 | |
| 5.00% due 06/15/39 | | | 500,000 | | | | 579,175 | |
| New York State Dormitory Authority Revenue Bonds | | | | | | | | |
| 5.00% due 10/01/41 | | | 350,000 | | | | 392,259 | |
5.00% due 12/01/275 | | | 200,000 | | | | 229,346 | |
| New York City Transitional Finance Authority Future Tax Secured Revenue Bonds | | | | | | | | |
| 5.00% due 11/01/29 | | | 500,000 | | | | 608,585 | |
| City of New York New York General Obligation Unlimited | | | | | | | | |
| 5.00% due 08/01/28 | | | 500,000 | | | | 602,480 | |
| New York Transportation Development Corp. Revenue Bonds | | | | | | | | |
| 5.00% due 07/01/34 | | | 200,000 | | | | 219,920 | |
| 5.00% due 08/01/26 | | | 200,000 | | | | 214,730 | |
| New York State Urban Development Corp. Revenue Bonds | | | | | | | | |
| 5.00% due 03/15/35 | | | 250,000 | | | | 289,823 | |
| Westchester County Healthcare Corp. Revenue Bonds | | | | | | | | |
| 5.00% due 11/01/44 | | | 200,000 | | | | 212,898 | |
| Total New York | | | | | | | 6,049,216 | |
| | | | | | | | | |
| Texas - 10.8% | |
| North Texas Tollway Authority Revenue Bonds | | | | | | | | |
| 5.75% due 01/01/40 | | | 1,205,000 | | | | 1,219,605 | |
| 5.75% due 01/01/40 | | | 265,000 | | | | 267,944 | |
due 01/01/363 | | | 1,000,000 | | | | 526,030 | |
| Dallas Area Rapid Transit Revenue Bonds | | | | | | | | |
| 5.00% due 12/01/35 | | | 500,000 | | | | 583,410 | |
| 5.00% due 12/01/41 | | | 200,000 | | | | 231,618 | |
| Texas Tech University Revenue Bonds | | | | | | | | |
| 5.00% due 08/15/32 | | | 500,000 | | | | 564,025 | |
| Birdville Independent School District General Obligation Unlimited | | | | | | | | |
| 5.00% due 02/15/27 | | | 305,000 | | | | 365,585 | |
| Clint Independent School District General Obligation Unlimited | | | | | | | | |
| 5.00% due 08/15/31 | | | 300,000 | | | | 353,085 | |
| State of Texas General Obligation Unlimited | | | | | | | | |
| 5.00% due 10/01/29 | | | 250,000 | | | | 300,260 | |
| Texas Municipal Gas Acquisition & Supply Corporation I Revenue Bonds | | | | | | | | |
| 6.25% due 12/15/26 | | | 200,000 | | | | 244,032 | |
| Central Texas Regional Mobility Authority Revenue Bonds | | | | | | | | |
| 5.00% due 01/01/27 | | | 200,000 | | | | 237,572 | |
94 | THE GUGGENHEIM FUNDS ANNUAL REPORT | SEE NOTES TO FINANCIAL STATEMENTS. |
SCHEDULE OF INVESTMENTS (continued) | September 30, 2017 |
| MUNICIPAL INCOME FUND | |
| | | Face
Amount | | | Value | |
| | | | | | | |
| Texas Water Development Board Revenue Bonds | | | | | | |
| 5.00% due 10/15/46 | | $ | 200,000 | | | $ | 232,164 | |
| Central Texas Turnpike System Revenue Bonds | | | | | | | | |
| 5.00% due 08/15/34 | | | 200,000 | | | | 223,630 | |
| Arlington Higher Education Finance Corp. Revenue Bonds | | | | | | | | |
| 5.00% due 12/01/46 | | | 200,000 | | | | 216,256 | |
| Harris County-Houston Sports Authority Revenue Bonds | | | | | | | | |
due 11/15/533 | | | 1,000,000 | | | | 185,430 | |
| Total Texas | | | | | | | 5,750,646 | |
| | | | | | | | | |
| Michigan - 10.0% | |
| City of Detroit Michigan Sewage Disposal System Revenue Bonds | | | | | | | | |
1.50% (3 Month USD LIBOR + 60 bps) due 07/01/324 | | | 2,000,000 | | | | 1,821,279 | |
| Detroit Wayne County Stadium Authority Revenue Bonds | | | | | | | | |
| 5.00% due 10/01/26 | | | 1,490,000 | | | | 1,632,444 | |
| Detroit City School District General Obligation Unlimited | | | | | | | | |
| 5.00% due 05/01/32 | | | 1,000,000 | | | | 1,105,440 | |
| 5.00% due 05/01/30 | | | 300,000 | | | | 333,054 | |
| City of Detroit Michigan Water Supply System Revenue Bonds | | | | | | | | |
| 4.75% due 07/01/29 | | | 230,000 | | | | 236,049 | |
| 5.00% due 07/01/41 | | | 200,000 | | | | 212,634 | |
| Total Michigan | | | | | | | 5,340,900 | |
| | | | | | | | | |
| Illinois - 6.3% | |
| Southern Illinois University Revenue Bonds | | | | | | | | |
| 5.00% due 04/01/32 | | | 1,000,000 | | | | 970,880 | |
| Will County Township High School District No. 204 Joliet General Obligation Ltd. | | | | | | | | |
| 6.25% due 01/01/31 | | | 500,000 | | | | 575,515 | |
| City of Chicago Illinois Wastewater Transmission Revenue Bonds | | | | | | | | |
| 5.25% due 01/01/42 | | | 400,000 | | | | 457,576 | |
| Chicago O’Hare International Airport Revenue Bonds | | | | | | | | |
| 5.00% due 01/01/34 | | | 300,000 | | | | 342,840 | |
| Chicago Board of Education General Obligation Unlimited | | | | | | | | |
| 5.25% due 12/01/26 | | | 320,000 | | | | 321,962 | |
| Metropolitan Water Reclamation District of Greater Chicago General Obligation Unlimited | | | | | | | | |
| 5.00% due 12/01/25 | | | 200,000 | | | | 239,862 | |
| University of Illinois Revenue Bonds | | | | | | | | |
| 6.00% due 10/01/29 | | | 200,000 | | | | 235,696 | |
| Metropolitan Pier & Exposition Authority Revenue Bonds | | | | | | | | |
due 06/15/453 | | | 500,000 | | | | 153,800 | |
| City of Chicago Illinois General Obligation Unlimited | | | | | | | | |
| 5.00% due 01/01/23 | | | 70,000 | | | | 70,550 | |
| 5.00% due 01/01/22 | | | 5,000 | | | | 5,035 | |
| Total Illinois | | | | | | | 3,373,716 | |
| | | | | | | | | |
| Pennsylvania - 5.9% | |
| Pennsylvania Economic Development Financing Authority Revenue Bonds | | | | | | | | |
| 5.00% due 02/01/27 | | | 500,000 | | | | 586,425 | |
| 5.00% due 03/15/31 | | | 500,000 | | | | 586,205 | |
| Pennsylvania Turnpike Commission Revenue Bonds | | | | | | | | |
2.21% (SIFMA Municipal Swap Index + 127 bps) due 12/01/204 | | | 500,000 | | | | 510,340 | |
1.92% (SIFMA Municipal Swap Index + 98 bps) due 12/01/214 | | | 500,000 | | | | 507,180 | |
| Pittsburgh Water & Sewer Authority Revenue Bonds | | | | | | | | |
| 5.25% due 09/01/36 | | | 500,000 | | | | 577,325 | |
| Reading School District General Obligation Unlimited | | | | | | | | |
| 5.00% due 02/01/27 | | | 300,000 | | | | 350,025 | |
| Total Pennsylvania | | | | | | | 3,117,500 | |
| | | | | | | | | |
| Puerto Rico - 3.8% | |
| Puerto Rico Electric Power Authority Revenue Bonds | | | | | | | | |
1.41% (3 Month USD LIBOR + 52 bps) due 07/01/294 | | | 1,845,000 | | | | 1,454,229 | |
| Puerto Rico Highway & Transportation Authority Revenue Bonds | | | | | | | | |
| 5.25% due 07/01/41 | | | 250,000 | | | | 290,858 | |
| Puerto Rico Public Buildings Authority Revenue Bonds | | | | | | | | |
| 6.00% due 07/01/23 | | | 250,000 | | | | 279,545 | |
| Total Puerto Rico | | | | | | | 2,024,632 | |
| | | | | | | | | |
| New Jersey - 3.7% | |
| Hudson County Improvement Authority Revenue Bonds | | | | | | | | |
| 6.00% due 01/01/40 | | | 1,000,000 | | | | 1,084,750 | |
| New Jersey Health Care Facilities Financing Authority Revenue Bonds | | | | | | | | |
| 5.00% due 07/01/41 | | | 300,000 | | | | 326,583 | |
| 5.00% due 07/01/36 | | | 200,000 | | | | 219,754 | |
| New Jersey Turnpike Authority Revenue Bonds | | | | | | | | |
| 5.00% due 01/01/31 | | | 300,000 | | | | 362,037 | |
| Total New Jersey | | | | | | | 1,993,124 | |
| | | | | | | | | |
| Washington - 3.5% | |
| Greater Wenatchee Regional Events Center Public Facilities District Revenue Bonds | | | | | | | | |
| 5.00% due 09/01/27 | | | 500,000 | | | | 520,425 | |
| 5.25% due 09/01/32 | | | 500,000 | | | | 514,705 | |
| SEE NOTES TO FINANCIAL STATEMENTS. | THE GUGGENHEIM FUNDS ANNUAL REPORT | 95 |
SCHEDULE OF INVESTMENTS (continued) | September 30, 2017 |
| MUNICIPAL INCOME FUND | |
| | | Face
Amount | | | Value | |
| | | | | | | |
| King County School District No. 409 Tahoma General Obligation Unlimited | | | | | | |
| 5.00% due 12/01/27 | | $ | 325,000 | | | $ | 393,705 | |
| Central Puget Sound Regional Transit Authority Revenue Bonds | | | | | | | | |
| 5.00% due 11/01/41 | | | 200,000 | | | | 232,994 | |
| State of Washington General Obligation Unlimited | | | | | | | | |
| 5.00% due 06/01/41 | | | 195,000 | | | | 217,725 | |
| Total Washington | | | | | | | 1,879,554 | |
| | | | | | | | | |
| District of Columbia - 2.7% | |
| District of Columbia General Obligation Unlimited | | | | | | | | |
| 5.00% due 06/01/41 | | | 285,000 | | | | 331,065 | |
| 5.00% due 06/01/32 | | | 275,000 | | | | 321,230 | |
| 5.00% due 06/01/31 | | | 175,000 | | | | 211,134 | |
| District of Columbia Water & Sewer Authority Revenue Bonds | | | | | | | | |
| 5.00% due 10/01/45 | | | 500,000 | | | | 574,535 | |
| Total District of Columbia | | | | | | | 1,437,964 | |
| | | | | | | | | |
| Florida - 2.4% | |
| School Board of Miami-Dade County Certificate Of Participation | | | | | | | | |
| 5.00% due 05/01/27 | | | 500,000 | | | | 595,310 | |
| Miami Beach Redevelopment Agency Tax Allocation | | | | | | | | |
| 5.00% due 02/01/40 | | | 300,000 | | | | 341,253 | |
| City of Jacksonville Florida Revenue Bonds | | | | | | | | |
| 5.00% due 10/01/29 | | | 300,000 | | | | 340,674 | |
| Total Florida | | | | | | | 1,277,237 | |
| | | | | | | | | |
| Louisiana - 2.4% | |
| Louisiana Local Government Environmental Facilities & Community Development Authority Revenue Bonds | | | | | | | | |
| 5.00% due 10/01/37 | | | 500,000 | | | | 566,515 | |
| 5.00% due 10/01/26 | | | 150,000 | | | | 180,441 | |
| City of Shreveport Louisiana Water & Sewer Revenue Bonds | | | | | | | | |
| 5.00% due 12/01/35 | | | 250,000 | | | | 293,065 | |
| Louisiana Public Facilities Authority Revenue Bonds | | | | | | | | |
| 5.00% due 07/01/39 | | | 200,000 | | | | 223,814 | |
| Total Louisiana | | | | | | | 1,263,835 | |
| | | | | | | | | |
| Massachusetts - 2.1% | |
| Massachusetts Development Finance Agency Revenue Bonds | | | | | | | | |
| 6.88% due 01/01/41 | | | 1,000,000 | | | | 1,141,310 | |
| | | | | | | | | |
| Colorado - 1.9% | |
| University of Colorado Revenue Bonds | | | | | | | | |
| 5.00% due 06/01/37 | | | 285,000 | | | | 324,120 | |
| 5.00% due 06/01/41 | | | 200,000 | | | | 230,666 | |
| Auraria Higher Education Center Revenue Bonds | | | | | | | | |
| 5.00% due 04/01/28 | | | 390,000 | | | | 461,694 | |
| Total Colorado | | | | | | | 1,016,480 | |
| | | | | | | | | |
| North Carolina - 1.8% | |
| North Carolina Turnpike Authority Revenue Bonds | | | | | | | | |
| 5.00% due 01/01/27 | | | 800,000 | | | | 967,992 | |
| | | | | | | | | |
| West Virginia - 1.7% | |
| West Virginia Higher Education Policy Commission Revenue Bonds | | | | | | | | |
| 5.00% due 04/01/29 | | | 500,000 | | | | 565,020 | |
| West Virginia Hospital Finance Authority Revenue Bonds | | | | | | | | |
| 5.00% due 06/01/42 | | | 300,000 | | | | 334,035 | |
| Total West Virginia | | | | | | | 899,055 | |
| | | | | | | | | |
| Arizona - 1.5% | |
| Arizona State University Revenue Bonds | | | | | | | | |
| 5.00% due 07/01/34 | | | 500,000 | | | | 583,390 | |
| Salt Verde Financial Corp. Revenue Bonds | | | | | | | | |
| 5.00% due 12/01/32 | | | 200,000 | | | | 238,992 | |
| Total Arizona | | | | | | | 822,382 | |
| | | | | | | | | |
| Mississippi - 1.5% | |
| Mississippi Development Bank Revenue Bonds | | | | | | | | |
| 6.50% due 10/01/31 | | | 500,000 | | | | 560,770 | |
| 6.25% due 10/01/26 | | | 230,000 | | | | 259,334 | |
| Total Mississippi | | | | | | | 820,104 | |
| | | | | | | | | |
| Georgia - 1.5% | |
| City of Atlanta Georgia Water & Wastewater Revenue Bonds | | | | | | | | |
| 5.00% due 11/01/40 | | | 500,000 | | | | 577,310 | |
| Savannah Economic Development Authority Revenue Bonds | | | | | | | | |
| 5.00% due 12/01/28 | | | 200,000 | | | | 238,630 | |
| Total Georgia | | | | | | | 815,940 | |
| | | | | | | | | |
| Ohio - 1.5% | |
| University of Cincinnati Revenue Bonds | | | | | | | | |
| 5.00% due 06/01/36 | | | 500,000 | | | | 582,665 | |
| American Municipal Power, Inc. Revenue Bonds | | | | | | | | |
| 5.00% due 02/15/41 | | | 200,000 | | | | 225,638 | |
| Total Ohio | | | | | | | 808,303 | |
| | | | | | | | | |
| Virginia - 1.2% | |
| County of Fairfax Virginia General Obligation Unlimited | | | | | | | | |
| 5.00% due 10/01/32 | | | 300,000 | | | | 359,943 | |
96 | THE GUGGENHEIM FUNDS ANNUAL REPORT | SEE NOTES TO FINANCIAL STATEMENTS. |
SCHEDULE OF INVESTMENTS (concluded) | September 30, 2017 |
| MUNICIPAL INCOME FUND | |
| | | Face
Amount | | | Value | |
| | | | | | | |
| Virginia College Building Authority Revenue Bonds | | | | | | |
| 5.00% due 02/01/28 | | $ | 250,000 | | | $ | 298,953 | |
| Total Virginia | | | | | | | 658,896 | |
| | | | | | | | | |
| Maryland - 1.0% | |
| Maryland State Transportation Authority Revenue Bonds | | | | | | | | |
| 5.00% due 07/01/35 | | | 500,000 | | | | 514,875 | |
| | | | | | | | | |
| Indiana - 0.9% | |
| Indiana Finance Authority Revenue Bonds | | | | | | | | |
| 5.50% due 04/01/24 | | | 400,000 | | | | 457,056 | |
| | | | | | | | | |
| Kentucky - 0.8% | |
| Kentucky Economic Development Finance Authority Revenue Bonds | | | | | | | | |
| 5.00% due 07/01/37 | | | 200,000 | | | | 218,024 | |
| City of Ashland Kentucky Revenue Bonds | | | | | | | | |
| 5.00% due 02/01/22 | | | 200,000 | | | | 212,118 | |
| Total Kentucky | | | | | | | 430,142 | |
| | | | | | | | | |
| South Carolina - 0.7% | |
| Anderson County School District No. 5 General Obligation Unlimited | | | | | | | | |
| 5.00% due 03/01/27 | | | 300,000 | | | | 365,982 | |
| | | | | | | | | |
| Nevada - 0.5% | |
| Las Vegas Valley Water District General Obligation Ltd. | | | | | | | | |
| 5.00% due 06/01/27 | | | 230,000 | | | | 276,071 | |
| | | | | | | | | |
| Vermont - 0.4% | |
| Vermont Educational & Health Buildings Financing Agency Revenue Bonds | | | | | | | | |
| 5.00% due 12/01/46 | | | 200,000 | | | | 220,846 | |
| Total Municipal Bonds | | | | | | | | |
| (Cost $50,520,014) | | | | | | | 51,917,247 | |
| | | | | | | | | |
| Total Investments - 99.0% | | | | | | | | |
| (Cost $51,368,252) | | | | | | $ | 52,765,485 | |
| Other Assets & Liabilities, net - 1.0% | | | | | | | 542,356 | |
| Total Net Assets - 100.0% | | | | | | $ | 53,307,841 | |
† | Value determined based on Level 1 inputs — See Note 4. |
†† | Value determined based on Level 2 inputs — See Note 4. |
1 | Rate indicated is the 7 day yield as of September 30, 2017. |
2 | Security is a step up/step down bond. The coupon increases or decreases at regular intervals until the bond reaches full maturity. |
3 | Zero coupon rate security. |
4 | Variable rate security. Rate indicated is rate effective at September 30, 2017. |
5 | Security is a 144A or Section 4(a)(2) security. These securities have been determined to be liquid under guidelines established by the Board of Trustees. The total market value of 144A or Section 4(a)(2) securities is $229,346 (cost $218,411), or 0.4% of total net assets. |
| | LIBOR — London Interbank Offered Rate |
| | SIFMA — Securities Industry and Financial Markets Association |
| | VRDN — Variable Rate Demand Note |
| | |
| | See Sector Classification in Other Information section. |
The following table summarizes the inputs used to value the Fund’s investments at September 30, 2017 (See Note 4 in the Notes to Financial Statements):
| Investments in Securities (Assets) | | Level 1
Quoted
Prices | | | Level 2
Significant
Observable
Inputs | | | Level 3
Significant
Unobservable
Inputs | | | Total | |
| Money Market Fund | | $ | 848,238 | | | $ | — | | | $ | — | | | $ | 848,238 | |
| Municipal Bonds | | | — | | | | 51,917,247 | | | | — | | | | 51,917,247 | |
| Total Assets | | $ | 848,238 | | | $ | 51,917,247 | | | $ | — | | | $ | 52,765,485 | |
Transfers between investment levels may occur as the markets fluctuate and/or the availability of data used in an investment’s valuation changes. Transfers between valuation levels, if any, are in comparison to the valuation levels at the end of the previous fiscal year, and are effective using the fair value as of the end of the current fiscal period.
For the year ended September 30, 2017, there were no transfers between levels.
| SEE NOTES TO FINANCIAL STATEMENTS. | THE GUGGENHEIM FUNDS ANNUAL REPORT | 97 |
| STATEMENT OF ASSETS AND LIABILITIES |
| September 30, 2017 |
| Assets: | |
| Investments, at value (cost $51,368,252) | | $ | 52,765,485 | |
| Prepaid expenses | | | 32,941 | |
| Receivables: | |
| Interest | | | 622,217 | |
| Fund shares sold | | | 9,598 | |
| Total assets | | | 53,430,241 | |
| | | | | |
| Liabilities: | |
| Payable for: | |
| Distributions to Shareholders | | | 34,074 | |
| Fund shares redeemed | | | 33,637 | |
| Transfer agent/maintenance fees | | | 16,468 | |
| Distribution and service fees | | | 10,061 | |
| Direct shareholders expense | | | 8,001 | |
| Custodian fees | | | 7,560 | |
| Fund accounting/administration fees | | | 3,605 | |
| Management fees | | | 1,831 | |
| Trustees’ fees* | | | 907 | |
| Miscellaneous | | | 6,256 | |
| Total liabilities | | | 122,400 | |
| Net assets | | $ | 53,307,841 | |
| | | | | |
| Net assets consist of: | |
| Paid in capital | | $ | 52,130,973 | |
| Accumulated net investment loss | | | (1 | ) |
| Accumulated net realized loss on investments | | | (220,364 | ) |
| Net unrealized appreciation on investments | | | 1,397,233 | |
| Net assets | | $ | 53,307,841 | |
| | | | | |
| A-Class: | |
| Net assets | | $ | 33,514,776 | |
| Capital shares outstanding | | | 2,638,200 | |
| Net asset value per share | | $ | 12.70 | |
| Maximum offering price per share (Net asset value divided by 96.00%) | | $ | 13.23 | |
| | | | | |
| C-Class: | |
| Net assets | | $ | 3,768,475 | |
| Capital shares outstanding | | | 296,860 | |
| Net asset value per share | | $ | 12.69 | |
| | | | | |
| P-Class: | |
| Net assets | | $ | 110,938 | |
| Capital shares outstanding | | | 8,734 | |
| Net asset value per share | | $ | 12.70 | |
| | | | | |
| Institutional Class: | |
| Net assets | | $ | 15,913,652 | |
| Capital shares outstanding | | | 1,252,403 | |
| Net asset value per share | | $ | 12.71 | |
| STATEMENT OF OPERATIONS |
| Year Ended September 30, 2017 |
| Investment Income: | |
| Interest | | $ | 1,705,794 | |
| Total investment income | | | 1,705,794 | |
| | | | | |
| Expenses: | |
| Management fees | | | 283,378 | |
| Distribution and service fees: | |
| A-Class | | | 84,219 | |
| C-Class | | | 41,888 | |
| P-Class | | | 426 | |
| Recoupment of previously waived fees: | |
| P-Class | | | 74 | |
| Transfer agent/maintenance fees | |
| A-Class | | | 45,977 | |
| C-Class | | | 4,876 | |
| P-Class | | | 367 | |
| Institutional Class | | | 15,071 | |
| Registration fees | | | 58,795 | |
| Fund accounting/administration fees | | | 45,456 | |
| Line of credit fees | | | 13,334 | |
| Trustees’ fees* | | | 8,849 | |
| Custodian fees | | | 938 | |
| Miscellaneous | | | 46,678 | |
| Total expenses | | | 650,326 | |
| Less: | |
| Expenses waived by Adviser | | | (132,587 | ) |
| Expenses reimbursed by Adviser: | | | | |
| A-Class | | | (46,025 | ) |
| C-Class | | | (4,963 | ) |
| P-Class | | | (232 | ) |
| Institutional Class | | | (15,636 | ) |
| Total waived/reimbursed expenses | | | (199,443 | ) |
| Net expenses | | | 450,883 | |
| Net investment income | | | 1,254,911 | |
| | | | | |
| Net Realized and Unrealized Gain (Loss): | |
| Net realized gain (loss) on: | |
| Investments | | | 97,853 | |
| Net change in unrealized appreciation (depreciation) on: | |
| Investments | | | (1,468,356 | ) |
| Net realized and unrealized loss | | | (1,370,503 | ) |
| Net decrease in net assets resulting from operations | | $ | (115,592 | ) |
| * | Relates to Trustees not deemed “interested persons” within the meaning of Section 2(a)(19) of the 1940 Act. |
98 | THE GUGGENHEIM FUNDS ANNUAL REPORT | SEE NOTES TO FINANCIAL STATEMENTS. |
| STATEMENTS OF CHANGES IN NET ASSETS |
| | | Year Ended
September 30,
2017 | | | Year Ended
September 30,
2016 | |
| Increase (Decrease) in Net Assets from Operations: | | | | | | |
| Net investment income | | $ | 1,254,911 | | | $ | 1,364,886 | |
| Net realized gain on investments | | | 97,853 | | | | 647,792 | |
| Net change in unrealized appreciation (depreciation) on investments | | | (1,468,356 | ) | | | 1,067,522 | |
| Net increase (decrease) in net assets resulting from operations | | | (115,592 | ) | | | 3,080,200 | |
| | | | | | | | | |
| Distributions to shareholders from: | | | | | | | | |
| Net investment income | | | | | | | | |
| A-Class | | | (738,549 | ) | | | (1,005,003 | ) |
| C-Class | | | (60,391 | ) | | | (54,384 | ) |
| P-Class | | | (3,433 | ) | | | (803 | ) |
| Institutional Class | | | (452,538 | ) | | | (304,697 | ) |
| Total distributions to shareholders | | | (1,254,911 | ) | | | (1,364,887 | ) |
| | | | | | | | | |
| Capital share transactions: | | | | | | | | |
| Proceeds from sale of shares | | | | | | | | |
| A-Class | | | 5,199,658 | | | | 19,465,560 | |
| C-Class | | | 635,500 | | | | 5,088,386 | |
| P-Class | | | 1,524,469 | | | | 79,344 | |
| Institutional Class | | | 8,142,777 | | | | 18,451,425 | |
| Distributions reinvested | | | | | | | | |
| A-Class | | | 452,402 | | | | 617,221 | |
| C-Class | | | 39,874 | | | | 38,398 | |
| P-Class | | | 3,433 | | | | 803 | |
| Institutional Class | | | 328,132 | | | | 207,229 | |
| Cost of shares redeemed | | | | | | | | |
| A-Class | | | (12,747,143 | ) | | | (29,246,762 | ) |
| C-Class | | | (1,820,406 | ) | | | (2,681,765 | ) |
| P-Class | | | (1,502,111 | ) | | | (6,443 | ) |
| Institutional Class | | | (16,080,038 | ) | | | (3,358,813 | ) |
| Net increase (decrease) from capital share transactions | | | (15,823,453 | ) | | | 8,654,583 | |
| Net increase (decrease) in net assets | | | (17,193,956 | ) | | | 10,369,896 | |
| | | | | | | | | |
| Net assets: | | | | | | | | |
| Beginning of year | | | 70,501,797 | | | | 60,131,901 | |
| End of year | | $ | 53,307,841 | | | $ | 70,501,797 | |
| Accumulated net investment loss at end of year | | $ | (1 | ) | | $ | (1 | ) |
| SEE NOTES TO FINANCIAL STATEMENTS. | THE GUGGENHEIM FUNDS ANNUAL REPORT | 99 |
STATEMENTS OF CHANGES IN NET ASSETS (concluded) |
| | | Year Ended
September 30,
2017 | | | Year Ended
September 30,
2016 | |
| Capital share activity: | | | | | | |
| Shares sold | | | | | | |
| A-Class | | | 409,886 | | | | 1,533,459 | |
| C-Class | | | 50,491 | | | | 399,596 | |
| P-Class | | | 122,127 | | | | 6,189 | |
| Institutional Class | | | 644,462 | | | | 1,437,935 | |
| Shares issued from reinvestment of distributions | | | | | | | | |
| A-Class | | | 36,078 | | | | 48,393 | |
| C-Class | | | 3,184 | | | | 3,006 | |
| P-Class | | | 274 | | | | 63 | |
| Institutional Class | | | 26,193 | | | | 16,176 | |
| Shares redeemed | | | | | | | | |
| A-Class | | | (1,016,892 | ) | | | (2,292,204 | ) |
| C-Class | | | (146,400 | ) | | | (210,501 | ) |
| P-Class | | | (120,222 | ) | | | (496 | ) |
| Institutional Class | | | (1,293,270 | ) | | | (262,663 | ) |
| Net increase (decrease) in shares | | | (1,284,089 | ) | | | 678,953 | |
100 | THE GUGGENHEIM FUNDS ANNUAL REPORT | SEE NOTES TO FINANCIAL STATEMENTS. |
This table is presented to show selected data for a share outstanding throughout each period and to assist shareholders in evaluating a Fund’s performance for the periods presented.
| A-Class | | Year Ended
September 30,
2017 | | | Year Ended
September 30,
2016 | | | Year Ended
September 30,
2015 | | | Year Ended
September 30,
2014 | | | Year Ended
September 30,
2013 | |
| Per Share Data | | | | | | | | | | | | | | | |
| Net asset value, beginning of period | | $ | 12.86 | | | $ | 12.52 | | | $ | 12.51 | | | $ | 11.59 | | | $ | 12.59 | |
| Income (loss) from investment operations: | |
Net investment income (loss)a | | | .27 | | | | .26 | | | | .29 | | | | .36 | | | | .38 | |
| Net gain (loss) on investments (realized and unrealized) | | | (.15 | ) | | | .34 | | | | .01 | | | | .92 | | | | (1.00 | ) |
| Total from investment operations | | | .12 | | | | .60 | | | | .30 | | | | 1.28 | | | | (.62 | ) |
| Less distributions from: | |
| Net investment income | | | (.28 | ) | | | (.26 | ) | | | (.29 | ) | | | (.36 | ) | | | (.38 | ) |
| Total distributions | | | (.28 | ) | | | (.26 | ) | | | (.29 | ) | | | (.36 | ) | | | (.38 | ) |
| Net asset value, end of period | | $ | 12.70 | | | $ | 12.86 | | | $ | 12.52 | | | $ | 12.51 | | | $ | 11.59 | |
| | |
Total Returnb | | | 0.94 | % | | | 4.85 | % | | | 2.39 | % | | | 11.20 | % | | | (5.09 | %) |
| Ratios/Supplemental Data | |
| Net assets, end of period (in thousands) | | $ | 33,515 | | | $ | 41,283 | | | $ | 49,086 | | | $ | 44,090 | | | $ | 50,463 | |
| Ratios to average net assets: | |
| Net investment income (loss) | | | 2.19 | % | | | 2.06 | % | | | 2.28 | % | | | 3.00 | % | | | 3.04 | % |
| Total expenses | | | 1.20 | % | | | 1.18 | % | | | 1.17 | % | | | 1.29 | % | | | 1.14 | % |
Net expensesc,f | | | 0.82 | % | | | 0.81 | % | | | 0.81 | % | | | 0.83 | % | | | 0.82 | % |
| Portfolio turnover rate | | | 31 | % | | | 61 | % | | | 80 | % | | | 173 | % | | | 91 | % |
| C-Class | | Year Ended
September 30,
2017 | | | Year Ended
September 30,
2016 | | | Year Ended
September 30,
2015 | | | Year Ended
September 30,
2014 | | | Year Ended
September 30,
2013 | |
| Per Share Data | | | | | | | | | | | | | | | |
| Net asset value, beginning of period | | $ | 12.86 | | | $ | 12.52 | | | $ | 12.50 | | | $ | 11.59 | | | $ | 12.58 | |
| Income (loss) from investment operations: | |
Net investment income (loss)a | | | .18 | | | | .16 | | | | .19 | | | | .27 | | | | .28 | |
| Net gain (loss) on investments (realized and unrealized) | | | (.17 | ) | | | .35 | | | | .02 | | | | .91 | | | | (.98 | ) |
| Total from investment operations | | | .01 | | | | .51 | | | | .21 | | | | 1.18 | | | | (.70 | ) |
| Less distributions from: | |
| Net investment income | | | (.18 | ) | | | (.17 | ) | | | (.19 | ) | | | (.27 | ) | | | (.29 | ) |
| Total distributions | | | (.18 | ) | | | (.17 | ) | | | (.19 | ) | | | (.27 | ) | | | (.29 | ) |
| Net asset value, end of period | | $ | 12.69 | | | $ | 12.86 | | | $ | 12.52 | | | $ | 12.50 | | | $ | 11.59 | |
| | |
Total Returnb | | | 0.12 | % | | | 4.06 | % | | | 1.71 | % | | | 10.28 | % | | | (5.70 | %) |
| Ratios/Supplemental Data | |
| Net assets, end of period (in thousands) | | $ | 3,768 | | | $ | 5,008 | | | $ | 2,472 | | | $ | 1,082 | | | $ | 1,495 | |
| Ratios to average net assets: | |
| Net investment income (loss) | | | 1.44 | % | | | 1.26 | % | | | 1.54 | % | | | 2.24 | % | | | 2.30 | % |
| Total expenses | | | 1.92 | % | | | 1.89 | % | | | 1.87 | % | | | 2.08 | % | | | 1.93 | % |
Net expensesc,f | | | 1.57 | % | | | 1.56 | % | | | 1.56 | % | | | 1.58 | % | | | 1.57 | % |
| Portfolio turnover rate | | | 31 | % | | | 61 | % | | | 80 | % | | | 173 | % | | | 91 | % |
| SEE NOTES TO FINANCIAL STATEMENTS. | THE GUGGENHEIM FUNDS ANNUAL REPORT | 101 |
FINANCIAL HIGHLIGHTS (continued) |
This table is presented to show selected data for a share outstanding throughout each period and to assist shareholders in evaluating a Fund’s performance for the periods presented.
| P-Class | | Year Ended
September 30,
2017 | | | Year Ended
September 30,
2016 | | | Period Ended
September 30,
2015d | |
| Per Share Data | | | | | | | | | |
| Net asset value, beginning of period | | $ | 12.86 | | | $ | 12.52 | | | $ | 12.64 | |
| Income (loss) from investment operations: | |
Net investment income (loss)a | | | .25 | | | | .26 | | | | .13 | |
| Net gain (loss) on investments (realized and unrealized) | | | (.14 | ) | | | .34 | | | | (.12 | ) |
| Total from investment operations | | | .11 | | | | .60 | | | | .01 | |
| Less distributions from: | |
| Net investment income | | | (.27 | ) | | | (.26 | ) | | | (.13 | ) |
| Total distributions | | | (.27 | ) | | | (.26 | ) | | | (.13 | ) |
| Net asset value, end of period | | $ | 12.70 | | | $ | 12.86 | | | $ | 12.52 | |
| | |
Total Returnb | | | 0.89 | % | | | 4.86 | % | | | 0.06 | % |
| Ratios/Supplemental Data | |
| Net assets, end of period (in thousands) | | $ | 111 | | | $ | 84 | | | $ | 10 | |
| Ratios to average net assets: | |
| Net investment income (loss) | | | 2.01 | % | | | 2.00 | % | | | 2.46 | % |
| Total expenses | | | 1.27 | % | | | 1.21 | % | | | 3.17 | % |
Net expensesc,f | | | 0.82 | %e | | | 0.79 | % | | | 0.81 | % |
| Portfolio turnover rate | | | 31 | % | | | 61 | % | | | 80 | % |
102 | THE GUGGENHEIM FUNDS ANNUAL REPORT | SEE NOTES TO FINANCIAL STATEMENTS. |
FINANCIAL HIGHLIGHTS (concluded) |
This table is presented to show selected data for a share outstanding throughout each period and to assist shareholders in evaluating a Fund’s performance for the periods presented.
| Institutional Class | | Year Ended
September 30,
2017 | | | Year Ended
September 30,
2016 | | | Year Ended
September 30,
2015 | | | Year Ended
September 30,
2014 | | | Year Ended
September 30,
2013 | |
| Per Share Data | | | | | | | | | | | | | | | |
| Net asset value, beginning of period | | $ | 12.87 | | | $ | 12.53 | | | $ | 12.51 | | | $ | 11.60 | | | $ | 12.59 | |
| Income (loss) from investment operations: | |
Net investment income (loss)a | | | .30 | | | | .29 | | | | .32 | | | | .39 | | | | .40 | |
| Net gain (loss) on investments (realized and unrealized) | | | (.15 | ) | | | .34 | | | | .02 | | | | .91 | | | | (.98 | ) |
| Total from investment operations | | | .15 | | | | .63 | | | | .34 | | | | 1.30 | | | | (.58 | ) |
| Less distributions from: | |
| Net investment income | | | (.31 | ) | | | (.29 | ) | | | (.32 | ) | | | (.39 | ) | | | (.41 | ) |
| Total distributions | | | (.31 | ) | | | (.29 | ) | | | (.32 | ) | | | (.39 | ) | | | (.41 | ) |
| Net asset value, end of period | | $ | 12.71 | | | $ | 12.87 | | | $ | 12.53 | | | $ | 12.51 | | | $ | 11.60 | |
| | |
Total Returnb | | | 1.19 | % | | | 5.11 | % | | | 2.73 | % | | | 11.38 | % | | | (4.76 | %) |
| Ratios/Supplemental Data | |
| Net assets, end of period (in thousands) | | $ | 15,914 | | | $ | 24,126 | | | $ | 8,564 | | | $ | 6,451 | | | $ | 6,343 | |
| Ratios to average net assets: | |
| Net investment income (loss) | | | 2.43 | % | | | 2.24 | % | | | 2.53 | % | | | 3.23 | % | | | 3.35 | % |
| Total expenses | | | 0.88 | % | | | 0.84 | % | | | 0.89 | % | | | 0.97 | % | | | 0.93 | % |
Net expensesc,f | | | 0.57 | % | | | 0.56 | % | | | 0.56 | % | | | 0.58 | % | | | 0.57 | % |
| Portfolio turnover rate | | | 31 | % | | | 61 | % | | | 80 | % | | | 173 | % | | | 91 | % |
a | Net investment income (loss) per share was computed using average shares outstanding throughout the period. |
b | Total return does not reflect the impact of any applicable sales charges and has not been annualized. |
c | Net expense information reflects the expense ratios after expense waivers. |
d | Since commencement of operations: May 1, 2015. Percentage amounts for the period, except total return and portfolio turnover rate, have been annualized. |
e | The portion of the ratios of net expenses to average net assets attributable to recoupments of prior fee reductions of expense reimbursements is 0.04% for P-Class. |
f | Net expenses may include expenses that are excluded from the expense limitation agreement. Excluding these expenses, the net expense ratios for the years would be: |
| | | 09/30/17 | 09/30/16 | 09/30/15 | 09/30/14 |
| | A-Class | 0.80% | 0.80% | 0.80% | 0.80% |
| | C-Class | 1.55% | 1.55% | 1.55% | 1.54% |
| | P-Class | 0.80% | 0.78% | 0.81% | — |
| | Institutional Class | 0.55% | 0.55% | 0.55% | 0.55% |
| SEE NOTES TO FINANCIAL STATEMENTS. | THE GUGGENHEIM FUNDS ANNUAL REPORT | 103 |
| NOTES TO FINANCIAL STATEMENTS |
Note 1 – Organization and Significant Accounting Policies
Organization
Guggenheim Funds Trust (the “Trust”), a Delaware statutory trust, is registered with the SEC under the Investment Company Act of 1940 (“1940 Act”), as an open-ended investment company of the series type. Each series, in effect, is representing a separate Fund. The Trust is authorized to issue an unlimited number of shares. The Trust accounts for the assets of each Fund separately.
The Trust offers a combination of five separate classes of shares, A-Class shares, C-Class shares, P-Class shares, R6-Class shares and Institutional Class shares. Sales of shares of each Class are made without a front-end sales charge at the net asset value per share (“NAV”), with the exception of A-Class shares. A-Class shares are sold at the NAV, plus the applicable front-end sales charge. The sales charge varies depending on the amount purchased. A-Class share purchases of $1 million or more are exempt from the front-end sales charge but have a 1% contingent deferred sales charge (“CDSC”), if shares are redeemed within 12 months of purchase. C-Class shares have a 1% CDSC if shares are redeemed within 12 months of purchase. Institutional Class shares are offered primarily for direct investment by institutions such as pension and profit sharing plans, endowments, foundations and corporations. Institutional Class shares require a minimum initial investment of $2 million and a minimum account balance of $1 million. At September 30, 2017, the Trust consisted of nineteen funds.
Effective May 15, 2017, the High Yield Fund started to offer R6-Class shares. R6-Class shares of the Fund are offered primarily through qualified retirement and benefit plans. Class R6 shares are also offered through certain other plans and platforms sponsored by financial intermediaries. Certain institutional investors and others deemed appropriate by GI may also be eligible to purchase Class R6 shares subject to a $2,000,000 minimum initial investment.
As of January 1, 2012, A-Class, C-Class and Institutional Class shares of High Yield Fund are subject to a 2% redemption fee when shares are redeemed or exchanged within 90 days of purchase.
This report covers the Diversified Income Fund, High Yield Fund, Investment Grade Bond Fund, Limited Duration Fund, and Municipal Income Fund (the “Funds”), each a diversified investment company. Only A-Class, C-Class, P-Class, and Institutional Class shares had been issued by the Funds. R6-Class shares had been issued by the High Yield Fund only.
Security Investors, LLC and Guggenheim Partners Investment Management, LLC, which operate under the name Guggenheim Investments (“GI”), provides advisory services. Guggenheim Funds Distributors, LLC (“GFD” or the “Distributor”) acts as principal underwriter for the Trust. GI and GFD are affiliated entities.
Guggenheim Partners Investment Management (“GPIM”), an affiliate of GI, serves as investment sub-advisor (the “Sub-Advisor”) to the Municipal Income Fund and is responsible for the day-to-day management of the Fund’s portfolio.
Significant Accounting Policies
The Funds operate as investment companies and, accordingly, follow the investment company accounting and reporting guidance of the Financial Accounting Standards Board (“FASB”) Accounting Standards Codification Topic 946 Financial Services – Investment Companies.
The following significant accounting policies are in conformity with U.S. generally accepted accounting principles (“U.S. GAAP”) and are consistently followed by the Trust. This requires management to make estimates and assumptions that affect the reported amount of assets and liabilities, contingent assets and liabilities at the date of the financial statements, and the reported amounts of revenues and expenses during the reporting period. Actual results could differ from these estimates. All time references are based on Eastern Time.
The NAV of each Class of the Funds is calculated by dividing the market value of the Fund’s securities and other assets, less all liabilities, attributable to the Class by the number of outstanding shares of the Class.
(a) Valuation of Investments
The Board of Trustees of the Funds (the “Board”) has adopted policies and procedures for the valuation of the Funds’ investments (the “Valuation Procedures”). Pursuant to the Valuation Procedures, the Board has delegated to a valuation committee, consisting of representatives from Guggenheim’s investment management, fund administration, legal and compliance departments (the “Valuation Committee”), the day-to-day responsibility for implementing the Valuation Procedures, including, under most circumstances, the responsibility for determining the fair value of the Funds’ securities and/or other assets.
Valuations of the Funds’ securities are supplied primarily by pricing services appointed pursuant to the processes set forth in the Valuation Procedures. The Valuation Committee convenes monthly, or more frequently as needed, to review the valuation of all assets which have been fair valued for reasonableness. The Funds’ officers, through the Valuation Committee and consistent with the monitoring and review responsibilities set forth in the Valuation Procedures, regularly review procedures used and valuations provided by the pricing services.
| 104 | THE GUGGENHEIM FUNDS ANNUAL REPORT | |
NOTES TO FINANCIAL STATEMENTS (continued) |
If the pricing service cannot or does not provide a valuation for a particular investment or such valuation is deemed unreliable, such investment is fair valued by the Valuation Committee.
Equity securities listed on an exchange (New York Stock Exchange (“NYSE”) or American Stock Exchange) are valued at the last
quoted sales price as of the close of business on the NYSE, usually 4:00 p.m. on the valuation date. Equity securities listed on the NASDAQ market system are valued at the NASDAQ Official Closing Price on the valuation date, which may not necessarily represent the last sale price. If there has been no sale on such exchange or NASDAQ on a given day, the security is valued at the closing bid price on that day.
Generally, trading in foreign securities markets is substantially completed each day at various times prior to the close of the NYSE. The values of foreign securities are determined as of the close of such foreign markets or the close of the NYSE, if earlier. All investments quoted in foreign currencies are valued in U.S. dollars on the basis of the foreign currency exchange rates prevailing at the close of U.S. business. Investments in foreign securities may involve risks not present in domestic investments. The Valuation Committee will determine the current value of such foreign securities by taking into consideration certain factors which may include those discussed above, as well as the following factors, among others: the value of the securities traded on other foreign markets, ADR trading, closed-end fund trading, foreign currency exchange activity, and the trading prices of financial products that are tied to foreign securities. In addition, the Board has authorized the Valuation Committee and GI to use prices and other information supplied by a third party pricing vendor in valuing foreign securities.
Open-end investment companies (“mutual funds”) are valued at their NAV as of the close of business, on the valuation date. Exchange-traded funds (“ETFs”) and closed-end investment companies (“CEFs”) are valued at the last quoted sale price.
U.S. Government securities are valued by either independent pricing services, the last traded fill price, or at the reported bid price at the close of business.
Debt securities with a maturity of greater than 60 days at acquisition are valued at prices that reflect broker-dealer supplied valuations or are obtained from independent pricing services, which may consider the trade activity, treasury spreads, yields or price of bonds of comparable quality, coupon, maturity, and type, as well as prices quoted by dealers who make markets in such securities. Short-term debt securities with a maturity of 60 days or less at acquisition are valued at amortized cost, provided such amount approximates market value. Money market funds are valued at their NAV.
Typically, loans are valued using information provided by an independent third party pricing service which uses broker quotes. If the pricing service cannot or does not provide a valuation for a particular investment or such valuation is deemed unreliable, such investment is fair valued by the Valuation Committee.
Listed options are valued at the Official Settlement Price listed by the exchange, usually as of 4:00 p.m. Long options are valued using the bid price and short options are valued using the ask price. In the event that a settlement price is not available, fair valuation is enacted. Over-the-counter (“OTC”) options are valued using the average bid price (for long options) or average ask price (for short options) obtained from one or more security dealers.
The value of interest rate swap agreements entered into by a Fund is accounted for using the unrealized gain or loss on the agreements that is determined using the spread priced off the previous day’s Chicago Mercantile Exchange (“CME”) price.
Investments for which market quotations are not readily available are fair-valued as determined in good faith by GI under the direction of the Board using methods established or ratified by the Board. Valuations in accordance with these methods are intended to reflect each security’s (or asset’s) “fair value”. Each such determination is based on a consideration of all relevant factors, which are likely to vary from one pricing context to another. Examples of such factors may include, but are not limited to market prices; sale prices; broker quotes; and models which derive prices based on inputs such as prices of securities with comparable maturities and characteristics, or based on inputs such as anticipated cash flows or collateral, spread over Treasuries, and other information analysis.
In connection with futures contracts and other derivative investments, such factors may include obtaining information as to how (a) these contracts and other derivative investments trade in the futures or other derivative markets, respectively, and (b) the securities underlying these contracts and other derivative investments trade in the cash market.
(b) U.S. Government and Agency Obligations
Certain U.S. Government and Agency Obligations are traded on a discount basis; the interest rates shown on the Schedules of Investments reflect the effective rates paid at the time of purchase by the Funds. Other securities bear interest at the rates shown, payable at fixed dates through maturity.
(c) Senior Loans
Senior loans in which the Funds invest generally pay interest rates which are periodically adjusted by reference to a base short-term floating rate, plus a premium. These base lending rates are generally (i) the lending rate offered by one or more major
| | THE GUGGENHEIM FUNDS ANNUAL REPORT | 105 |
NOTES TO FINANCIAL STATEMENTS (continued) |
European banks, such as the one-month or three-month London Inter-Bank Offered Rate (LIBOR), (ii) the prime rate offered by one or more major United States banks, or (iii) the bank’s certificate of deposit rate. Senior floating rate interests often require prepayments from excess cash flows or permit the borrower to repay at its election. The rate at which the borrower repays cannot be predicted with accuracy. As a result, the actual remaining maturity may be substantially less than the stated maturities shown. The interest rate indicated is the rate in effect at September 30, 2017.
(d) Interests in Securities
The Funds may purchase and sell interests in securities on a when-issued and delayed delivery basis, with payment and delivery scheduled for a future date. No income accrues to the Fund on such interests or securities in connection with such transactions prior to the date the Funds actually take delivery of such interests or securities. These transactions are subject to market fluctuations and are subject to the risk that the value at delivery may be more or less than the trade date purchase price. Although the Funds will generally purchase these securities with the intention of acquiring such securities, they may sell such securities before the settlement date.
(e) Swap Agreements
Swap agreements are marked-to-market daily and the change, if any, is recorded as unrealized gain or loss. Payments received or made as a result of an agreement or termination of an agreement are recognized as realized gains or losses
(f) Options
Upon the purchase of an option, the premium paid is recorded as an investment, the value of which is marked-to-market daily. If a purchased option expires, the Fund realizes a loss in the amount of the cost of the option. When the Fund enters into a closing sale transaction, it realizes a gain or loss depending on whether the proceeds from the closing sale transaction are greater or less than the cost of the option. If the Fund exercises a put option, it realizes a gain or loss from the sale of the underlying security and the proceeds from such sale will be decreased by the premium originally paid. When the Fund exercises a call option, the cost of the security purchased by the Fund upon exercise increases by the premium originally paid.
When the Fund writes (sells) an option, an amount equal to the premium received is entered in that Fund’s accounting records as an asset and equivalent liability. The amount of the liability is subsequently marked-to-market to reflect the current value of the option written. When a written option expires, or if the Fund enters into a closing purchase transaction, it realizes a gain (or loss if the cost of a closing purchase transaction exceeds the premium received when the option was sold).
(g) Forward foreign currency exchange contracts
Forward foreign currency exchange contracts are valued daily based on the applicable exchange rate of the underlying currency. The change in value of the contract is recorded as unrealized appreciation or depreciation until the contract is closed. When the contract is closed, the Funds record a realized gain or loss equal to the difference between the value at the time the contract was opened and the value at the time it was closed.
(h) Foreign Taxes
The Funds may be subject to foreign taxes (a portion of which may be reclaimable) on income, stock dividends, capital gains on investments or certain foreign currency transactions. All foreign taxes are recorded in accordance with the applicable foreign tax regulations and rates that exist in the foreign jurisdictions in which the Funds invest. These foreign taxes, if any, are paid by the Funds and reflected in their statement of operations as follows: foreign taxes withheld at source are presented as a reduction of income and foreign taxes on capital gains from sales of investments are included with the net realized gain (loss) on investments. Foreign taxes payable or deferred as of September 30, 2017, if any, are disclosed in the Funds’ statements of assets and liabilities.
(i) Security Transactions
Security transactions are recorded on the trade date for financial reporting purposes. Realized gains and losses from securities transactions are recorded using the identified cost basis. Proceeds from lawsuits related to investment holdings are recorded as realized gains in the respective Fund. Dividend income is recorded on the ex-dividend date, net of applicable taxes withheld by foreign countries. Taxable non-cash dividends are recorded as dividend income. Interest income, including amortization of premiums and accretion of discounts, is accrued on a daily basis. Interest income also includes paydown gains and losses on mortgage-backed and asset-backed securities and senior and subordinated loans. Amendment fees are earned as compensation for evaluating and accepting changes to the original loan agreement and are recognized when received. Dividend income from Real Estate Investment Trust (“REIT”) is recorded based on the income included in the distributions received from the REIT investments using published REIT classifications, including some management estimates when actual amounts are not available. Distributions received in excess of this estimated amount are recorded as a reduction of the cost of investments or reclassified to capital gains. The actual amounts of income, return of capital, and capital gains are only determined by each REIT after its fiscal year-end, and may differ from the estimated amounts.
| 106 | THE GUGGENHEIM FUNDS ANNUAL REPORT | |
NOTES TO FINANCIAL STATEMENTS (continued) |
(j) Distributions
The Funds declare dividends from investment income daily. Each Fund pays its shareholders from its net investment income monthly and distributes any net capital gains that it has realized, at least annually. Distributions to shareholders are recorded on the ex-dividend date. Dividends are reinvested in additional shares unless shareholders request payment in cash. The character of distributions made during the year from net investment income or net realized gains may differ from their ultimate characterization for federal income tax purposes.
(k) Class Allocation
Interest and dividend income, most expenses, all realized gains and losses, and all unrealized gains and losses are allocated to the classes based upon the value of the outstanding shares in each Class. Certain costs, such as distribution and service fees are charged directly to specific classes. In addition, certain expenses have been allocated to the individual Funds in the Trust on a pro rata basis upon the respective aggregate net assets of each Fund included in the Trust.
(l) Earnings Credits
Under the fee arrangement with the custodian, the Funds may earn credits based on overnight custody cash balances. These credits are utilized to reduce related custodial expenses. The custodian fees disclosed in the Statement of Operations are before the reduction in expense from the related earnings credits, if any. For the year ended September 30, 2017, there were no earnings credits received.
(m) Cash
The Funds may leave cash overnight in their cash account with the custodian. Periodically, a Fund may have cash due to the custodian bank as an overdraft balance. A fee is incurred on this overdraft, calculated by multiplying the overdraft by a rate based on the federal funds rate, which was 1.06% at September 30, 2017.
(n) Currency Translation
The accounting records of the Funds are maintained in U.S. dollars. All assets and liabilities initially expressed in foreign currencies are converted into U.S. dollars at prevailing exchange rates. Purchases and sales of investment securities, dividend and interest income, and certain expenses are translated at the rates of exchange prevailing on the respective dates of such transactions. Changes in the relationship of these foreign currencies to the U.S. dollar can significantly affect the value of the investments and earnings of the Funds. Foreign investments may also subject the Funds to foreign government exchange restrictions, expropriation, taxation or other political, social or economic developments, all of which could affect the market and/or credit risk of the investments. The Funds do not isolate that portion of the results of operations resulting from changes in the foreign exchange rates on investments from the fluctuations arising from changes in the market prices of Securities held. Such fluctuations are included with the net realized and unrealized gain or loss on investments. Reported net realized foreign exchange gains and losses arise from sales of foreign currencies and currency gains or losses realized between the trade and settlement dates on investment transactions. Net unrealized exchange gains and losses arise from changes in the fair values of assets and liabilities other than investments in securities at the fiscal period end, resulting from changes in exchange rates.
(o) Indemnifications
Under the Funds’ organizational documents, the Trustees and Officers are indemnified against certain liabilities arising out of the performance of their duties to the Trust. In addition, throughout the normal course of business, the Funds enter into contracts that contain a variety of representations and warranties which provide general indemnifications. The Funds’ maximum exposure under these arrangements is unknown, as this would involve future claims that may be made against the Funds and/or their affiliates that have not yet occurred. However, based on experience, the Funds expect the risk of loss to be remote.
Note 2 – Financial Instruments and Derivatives
As part of their investment strategy, the Funds utilize a variety of derivative instruments. These investments involve, to varying degrees, elements of market risk and risks in excess of the amounts recognized in the Statements of Assets and Liabilities. Valuation and accounting treatment of these instruments can be found under Significant Accounting Policies in Note 1 of these Notes to Financial Statements.
Derivatives
Derivatives are instruments whose values depend on, or are derived from, in whole or in part, the value of one or more other assets, such as securities, currencies, commodities or indices. Derivative instruments may be used to increase investment flexibility (including to maintain cash reserves while maintaining exposure to certain other assets), for risk management (hedging) purposes, to facilitate trading, to reduce transaction costs and to pursue higher investment returns. Derivative instruments may also be used to mitigate certain investment risks, such as foreign currency exchange rate risk, interest rate risk and credit risk. U.S. GAAP requires disclosures to enable investors to better understand how and why a Fund uses derivative instruments, how these derivative instruments are accounted for and their effects on the Fund’s financial position and results of operations.
| | THE GUGGENHEIM FUNDS ANNUAL REPORT | 107 |
NOTES TO FINANCIAL STATEMENTS (continued) |
The Funds may utilize derivatives for the following purposes:
Duration: the use of an instrument to manage the interest rate risk of a portfolio.
Hedge: an investment made in order to reduce the risk of adverse price movements in a security, by taking an offsetting position to protect against broad market moves.
Options Purchased and Written
A call option on a security gives the purchaser of the option the right to buy, and the writer of a call option the obligation to sell, the underlying security. The purchaser of a put option has the right to sell, and the writer of the put option the obligation to buy, the underlying security at any time during the option period. The risk associated with purchasing options is limited to the premium originally paid.
The risk in writing a call option is that a Fund may incur a loss if the market price of the underlying security increases and the option is exercised. The risk in writing a put option is that a Fund may incur a loss if the market price of the underlying security decreases and the option is exercised. In addition, there may be an imperfect correlation between the movement in prices of options and the underlying securities where a Fund may not be able to enter into a closing transaction because of an illiquid secondary market; or, for OTC options, a Fund may be at risk because of the counterparty’s inability to perform.
The following table represents the Funds’ use, and volume of call/put options on a quarterly basis:
| | | | Average Number of Contracts | |
| Fund | Use | | Purchased | | | Written | |
| Investment Grade Bond Fund | Duration, Hedge | | | 3,669 | | | | 1,840 | |
| Limited Duration Fund | Duration, Hedge | | | 10,509 | | | | — | |
Swaps
A swap is an agreement that obligates two parties to exchange a series of cash flows at specified intervals based upon or calculated by reference to changes in specified prices or rates for a specified amount of an underlying asset. A Fund utilizing OTC swaps bears the risk of loss of the amount expected to be received under a swap agreement in the event of the default or bankruptcy of a swap agreement counterparty or if the underlying asset declines in value. Certain standardized swaps are subject to mandatory central clearing and are executed on a multi-lateral or other trade facility platform, such as a registered exchange. There is limited counterparty credit risk with respect to centrally-cleared swaps as the transaction is facilitated through a central clearinghouse, much like an exchange-traded futures contract. Upon entering into a centrally cleared swap transaction, the Fund is required to deposit with its clearing broker an amount of cash or securities as an initial margin. Subsequent variation margin payments or receipts are made or received by the Fund, depending on fluctuations in the fair value of the reference entity. For Funds utilizing interest rate swaps, the exchange bears the risk of loss. Additionally, there is no guarantee that a Fund or an underlying fund could eliminate its exposure under an outstanding swap agreement by entering into an offsetting swap agreement with the same or another party.
Interest rate swaps involve the exchange by the Fund with another party for its respective commitment to pay or receive a fixed or variable interest rate on a notional amount of principal. Interest rate swaps are generally centrally-cleared. Central clearing generally reduces counterparty credit risk and increases liquidity, but central clearing does not make interest rate swap transactions risk free.
The following table represents the Funds’ use and volume of interest rate swaps on a quarterly basis:
| | | | Average Notional | |
| Fund | Use | | Long | | | Short | |
| Investment Grade Bond Fund | Duration, Hedge | | $ | — | | | $ | 17,145,000 | |
| 108 | THE GUGGENHEIM FUNDS ANNUAL REPORT | |
NOTES TO FINANCIAL STATEMENTS (continued) |
Forward Foreign Currency Exchange Contracts
A forward foreign currency exchange contract is an agreement between two parties to exchange two designated currencies at a specific time in the future. Certain types of contracts may be cash settled, in an amount equal to the change in exchange rates during the term of the contract. The contracts can be used to hedge or manage exposure to foreign currency risks with portfolio investments or to gain exposure to foreign currencies.
The market value of a forward foreign currency exchange contract changes with fluctuations in foreign currency exchange rates. Furthermore, the Funds may be exposed to risk if the counterparties cannot meet the contract terms or if the currency value changes unfavorably as compared to the U.S. dollar.
The following table represents the Funds’ use, and volume of forward currency exchange contracts on a quarterly basis:
| | | | Average Settlement | |
| Fund | Use | | Purchased | | | Sold | |
| High Yield Fund | Hedge | | $ | 1,349,497 | | | $ | 17,881,441 | |
| Investment Grade Bond Fund | Hedge | | | — | | | | 860,985 | |
| Limited Duration Fund | Hedge | | | 9,722,782 | | | | 229,916,855 | |
Derivative Investment Holdings Categorized by Risk Exposure
The following is a summary of the location of derivative investments on the Funds’ Statements of Assets and Liabilities as of September 30, 2017:
| Derivative Investment Type | Asset Derivatives | Liability Derivatives |
| Currency contracts | Unrealized appreciation on forward foreign currency exchange contracts | Unrealized appreciation on forward foreign currency exchange contracts |
| Interest rate contracts | Investments in unaffiliate issuers, at value | Options written, at value |
| | | Variation margin swap agreements |
The following table sets forth the fair value of the Funds’ derivative investments categorized by primary risk exposure at September 30, 2017:
| Asset Derivative Investments Value | |
| Fund | | Swaps
Interest
Rate
Contracts | | | Options
Written
Interest
Rate
Contracts | | | Options
Purchased
Interest
Rate
Contracts | | | Forward
Foreign
Currency
Exchange
Contracts | | | Total Value at September 30,
2017 | |
| High Yield Fund | | $ | — | | | $ | — | | | $ | — | | | $ | 211,665 | | | $ | 211,665 | |
| Investment Grade Bond Fund | | | 370,704 | * | | | — | | | | 35,720 | | | | 16,019 | | | | 422,443 | |
| Limited Duration Fund | | | — | | | | — | | | | 92,929 | | | | 5,459,644 | | | | 5,552,573 | |
| Liability Derivative Investments Value | |
| Fund | | Swaps
Interest
Rate
Contracts | | | Options
Written
Interest
Rate
Contracts | | | Options
Purchased
Interest
Rate
Contracts | | | Forward
Foreign
Currency
Exchange
Contracts | | | Total Value at September 30,
2017 | |
| High Yield Fund | | $ | — | | | $ | — | | | $ | — | | | $ | 156,435 | | | $ | 156,435 | |
| Investment Grade Bond Fund | | | 17,568 | * | | | 7,991 | | | | — | | | | — | | | | 25,559 | |
| Limited Duration Fund | | | — | | | | — | | | | — | | | | 3,725,040 | | | | 3,725,040 | |
| * | Includes cumulative appreciation (depreciation) of swap agreements as reported on the Schedule of Investments. Only current day’s variation margin is reported within the Statement of Assets and Liabilities. |
| | THE GUGGENHEIM FUNDS ANNUAL REPORT | 109 |
NOTES TO FINANCIAL STATEMENTS (continued) |
The following is a summary of the location of derivative investments on the Funds’ Statements of Operations for the year ended September 30, 2017:
| Derivative Investment Type | Location of Gain (Loss) on Derivatives |
| Interest Rate/Currency contracts | Net realized gain (loss) on swap agreements |
| | Net change in unrealized appreciation (depreciation) on swap agreements |
| | Net change in unrealized appreciation (depreciation) on forward foreign currency exchange contracts |
| | Net realized gain (loss) on options purchased |
| | Net change in unrealized appreciation (depreciation) on options purchased |
| | Net realized gain (loss) on options written |
| | Net change in unrealized appreciation (depreciation) on options written |
The following is a summary of the Funds’ realized gain (loss) and change in unrealized appreciation (depreciation) on derivative investments recognized on the Statements of Operations categorized by primary risk exposure for the year ended September 30, 2017:
| Realized Gain (Loss) on Derivative Investments Recognized on the Statements of Operations | |
| Fund | | Swaps
Interest
Rate
Contracts | | | Options
Written
Interest
Rate
Contracts | | | Options
Purchased
Interest
Rate
Contracts | | | Forward
Foreign
Currency Exchange Contracts | | | Total | |
| High Yield Fund | | $ | — | | | $ | — | | | $ | — | | | $ | (677,624 | ) | | $ | (677,624 | ) |
| Investment Grade Bond Fund | | | (56,926 | ) | | | (80,268 | ) | | | 134,689 | | | | (115,574 | ) | | | (118,079 | ) |
| Limited Duration Fund | | | — | | | | — | | | | (774,250 | ) | | | (12,535,247 | ) | | | (13,309,497 | ) |
| Change in Unrealized Appreciation (Depreciation) on Derivative Investments Recognized on the Statements of Operations | |
| Fund | | Swaps
Interest
Rate
Contracts | | | Options
Written
Interest
Rate
Contracts | | | Options
Purchased
Interest
Rate
Contracts | | | Forward
Foreign
Currency Exchange Contracts | | | Total | |
| High Yield Fund | | $ | — | | | $ | — | | | $ | — | | | $ | (28,410 | ) | | $ | (28,410 | ) |
| Investment Grade Bond Fund | | | 353,136 | | | | 156,385 | | | | (514,375 | ) | | | 16,019 | | | | 11,165 | |
| Limited Duration Fund | | | — | | | | — | | | | (969,111 | ) | | | 1,734,604 | | | | 765,493 | |
In conjunction with the use of short sales and derivative instruments, the Funds are required to maintain collateral in various forms. The Funds use, where appropriate, depending on the financial instrument utilized and the broker involved, margin deposits at the broker, cash and/or securities segregated at the custodian bank, discount notes or the repurchase agreements allocated to the Funds.
The Trust has established counterparty credit guidelines and enters into transactions only with financial institutions of investment grade or better. The Trust monitors the counterparty credit risk.
Note 3 – Offsetting
In the normal course of business, the Funds enter into transactions subject to enforceable master netting arrangements or other similar arrangements. Generally, the right to offset in those agreements allows the Funds to counteract the exposure to a specific counterparty with collateral received from or delivered to that counterparty based on the terms of the arrangements. These arrangements provide for the right to liquidate upon the occurrence of an event of default, credit event upon merger or additional termination event.
| 110 | THE GUGGENHEIM FUNDS ANNUAL REPORT | |
NOTES TO FINANCIAL STATEMENTS (continued) |
In order to better define their contractual rights and to secure rights that will help the Funds mitigate their counterparty risk, the Funds may enter into an International Swaps and Derivatives Association, Inc. Master Agreement (“ISDA Master Agreement”) or similar agreement with their derivative contract counterparties. An ISDA Master Agreement is a bilateral agreement between a Fund and a counterparty that governs OTC derivatives, including foreign exchange contracts, and typically contains, among other things, collateral posting terms and netting provisions in the event of a default and/or termination event. The provisions of the ISDA Master Agreement typically permit a single net payment in the event of a default (close-out netting) or similar event, including the bankruptcy or insolvency of the counterparty.
For derivatives traded under an ISDA Master Agreement, the collateral requirements are typically calculated by netting the mark-to-market amount for each transaction under such agreement and comparing that amount to the value of any collateral currently pledged by the Funds and the counterparty. For financial reporting purposes, cash collateral that has been pledged to cover obligations of the Funds and cash collateral received from the counterparty, if any, are reported separately on the Statements of Assets and Liabilities as segregated cash with broker/receivable for variation margin, or payable for swap settlement/variation margin. Generally, the amount of collateral due from or to a counterparty must exceed a minimum transfer amount threshold (e.g., $300,000) before a transfer is required to be made. To the extent amounts due to the Funds from their counterparties are not fully collateralized, contractually or otherwise, the Funds bear the risk of loss from counterparty nonperformance. The Funds attempt to mitigate counterparty risk by only entering into agreements with counterparties that they believe to be of good standing and by monitoring the financial stability of those counterparties.
For financial reporting purposes, the Funds do not offset derivative assets and derivative liabilities that are subject to netting arrangements in the Statements of Assets and Liabilities.
The following table presents reverse repurchase agreements that are subject to netting arrangements and offset in the Statements of Assets of Liabilities in conformity with U.S. GAAP:
| Fund | Instrument | | Gross Amounts of Recognized Assets1 | | | Gross Amounts Offset In the Statements of Assets and Liabilities | | | Net Amount of Assets Presented
on the Statements of Assets and Liabilities | | | Gross Amounts Not Offset
in the Statements of
Assets and Liabilities | | | Net
Amount | |
| Financial Instruments | | | Cash
Collateral
Pledged |
| High Yield Fund | Forward currency
exchange contracts | | $ | 211,665 | | | $ | — | | | $ | 211,665 | | | $ | 50,275 | | | $ | — | | | $ | 161,390 | |
| Investment Grade Bond Fund | Forward currency
exchange contracts | | | 16,019 | | | | — | | | | 16,019 | | | | — | | | | 16,019 | | | | — | |
| | Options Interest
Rate Contracts | | | 35,720 | | | | — | | | | 35,720 | | | | 7,991 | | | | 27,729 | | | | — | |
| Limited Duration Fund | Forward currency
exchange contracts | | | 5,459,644 | | | | — | | | | 5,459,644 | | | | 2,372,295 | | | | 498,028 | | | | 2,589,321 | |
| | Options Interest
Rate Contracts | | | 92,929 | | | | — | | | | 92,929 | | | | 92,929 | | | | — | | | | — | |
| Fund | Instrument | Gross Amounts of Recognized Liabilities1 | | Gross Amounts Offset In the Statements of Assets and Liabilities | | Net Amount
of Liabilities Presented
on the Statements of Assets and Liabilities | | Gross Amounts Not Offset
in the Statements of
Assets and Liabilities | | Net
Amount | |
| Financial Instruments | | Cash
Collateral
Pledged |
| High Yield Fund | Forward currency exchange contracts | | $ | 156,435 | | | $ | — | | | $ | 156,435 | | | $ | 50,275 | | | $ | — | | | $ | 106,160 | |
| Investment Grade Bond Fund | Options Interest Rate Contracts | | | 7,991 | | | | — | | | | 7,991 | | | | 7,991 | | | | — | | | | — | |
| Limited Duration Fund | Forward currency exchange contracts | | | 3,725,040 | | | | — | | | | 3,725,040 | | | | 2,465,224 | | | | 1,238,713 | | | | 21,103 | |
1 | Exchanged traded and centrally cleared derivatives are excluded from these reported amounts. |
| | THE GUGGENHEIM FUNDS ANNUAL REPORT | 111 |
NOTES TO FINANCIAL STATEMENTS (continued) |
The following table presents deposits held by others in connection with derivative investments as of September 30, 2017. The derivative tables following the Schedule of Investments list each counterparty for which cash collateral may have been pledged or recovered at period end. The Funds have the right to offset these deposits against any related liabilities outstanding with each counterparty.
| Counterparty | | Cash Pledged | | | Cash Received | |
| Investment Grade Bond Fund | | | | | | |
| Bank of America Merrill Lynch | | $ | 1,146,541 | | | $ | 85,000 | |
| Investment Grade Bond Fund Total | | | 1,146,541 | | | | 85,000 | |
| Limited Duration Fund | | | | | | | | |
| Deutsche Bank | | | 310,000 | | | | — | |
| Morgan Stanley | | | 320,000 | | | | — | |
| Goldman Sachs Group | | | — | | | | 1,300,000 | |
| Bank of America Merrill Lynch | | | 835,000 | | | | — | |
| JP Morgan Chase and Co. | | | 80,000 | | | | — | |
| Limited Duration Fund Total | | | 1,545,001 | | | | 1,300,000 | |
Note 4 – Fair Value Measurement
In accordance with U.S. GAAP, fair value is defined as the price that the Funds would receive to sell an investment or pay to transfer a liability in an orderly transaction with an independent buyer in the principal market, or in the absence of a principal market, the most advantageous market for the investment or liability. U.S. GAAP establishes a three-tier fair value hierarchy based on the types of inputs used to value assets and liabilities and requires corresponding disclosure. The hierarchy and the corresponding inputs are summarized below:
Level 1 — | quoted prices in active markets for identical assets or liabilities. |
Level 2 — | significant other observable inputs (for example quoted prices for securities that are similar based on characteristics such as interest rates, prepayment speeds, credit risk, etc.). |
Level 3 — | significant unobservable inputs based on the best information available under the circumstances, to the extent observable inputs are not available, which may include assumptions. |
The types of inputs available depend on a variety of factors, such as the type of security and the characteristics of the markets in which it trades, if any. Fair valuation determinations that rely on fewer or no observable inputs require greater judgment. Accordingly, fair value determinations for Level 3 securities require the greatest amount of judgment.
Independent pricing services are used to value a majority of the Funds’ investments. When values are not available from a pricing service, they will be determined under the valuation policies that have been reviewed and approved by the Board. In any event, values are determined using a variety of sources and techniques, including: market prices; broker quotes; and models which derive prices based on inputs such as prices of securities with comparable maturities and characteristics or based on inputs such as anticipated cash flows or collateral spread over Treasuries, and other information and analysis. A significant portion of the Funds’ assets and liabilities are categorized as Level 2 or Level 3, as indicated in this report. Significant changes in an indicative quote would generally result in significant changes in the fair value of the security.
Indicative quotes from broker-dealers, adjusted for fluctuations in criteria such as credit spreads and interest rates, may be also used to value the Funds’ assets and liabilities, i.e. prices provided by a broker-dealer or other market participant who has not committed to trade at that price. Although indicative quotes are typically received from established market participants, the Funds may not have the transparency to view the underlying inputs which support the market quotations.
Certain fixed income securities are valued by obtaining a monthly indicative quote from a broker-dealer, adjusted for fluctuations in criteria such as credit spreads and interest rates. The Funds’ fair valuation guidelines categorize these securities as Level 3.
The inputs or methodologies used for valuing securities are not necessarily an indication of the risk associated with investing in those securities. The suitability of the techniques and sources employed to determine fair valuation are regularly monitored and subject to change.
| 112 | THE GUGGENHEIM FUNDS ANNUAL REPORT | |
NOTES TO FINANCIAL STATEMENTS (continued) |
Note 5 – Fees and Other Transactions with Affiliates
Under the terms of an investment advisory contract, the Funds pay GI investment advisory fees calculated at the annualized rates below, based on the average daily net assets of the Funds:
| Fund | Management Fees
(as a % of Net Assets) |
| Diversified Income Fund | 0.75% |
| High Yield Fund | 0.60% |
| Investment Grade Bond Fund | 0.50%* |
| Limited Duration Fund | 0.45% |
| Municipal Income Fund | 0.50% |
| * | At a meeting that occurred on November 16, 2016, the Board approved to add an advisory fee breakpoint (“breakpoint”) to the Investment Grade Bond Fund (the “Fund”). Effective January 30, 2017, a breakpoint of 5 basis points (0.05%) on average daily net assets above $5 billion will apply to the Fund’s advisory fees. |
GI engages external service providers to perform other necessary services for the Trust, such as audit and accounting related services, legal services, custody, printing and mailing, etc., on a pass-through basis. Such expenses are allocated to various Funds within the complex based on relative net assets.
The Funds have adopted Distribution Plans related to the offering of A-Class, C-Class and P-Class shares pursuant to Rule 12b-1 under the 1940 Act. The plans provide for payments at an annual rate of 0.25% of the average daily net assets of each Fund’s A-Class and P-Class shares, and 1.00% of the average daily net assets of each Fund’s C-Class shares.
The investment advisory contracts for the following Funds provide that the total expenses be limited to a percentage of average net assets for each class of shares, exclusive of brokerage costs, dividends on securities sold short, expenses of other investment companies in which a Fund invests, interest, taxes, litigation, indemnification and extraordinary expenses. The limits are listed below:
| | Limit | Effective
Date | Contract
End Date |
| Diversified Income Fund — A-Class** | 1.30% | 01/29/16 | 02/01/19 |
| Diversified Income Fund — C-Class** | 2.05% | 01/29/16 | 02/01/19 |
| Diversified Income Fund — P-Class** | 1.30% | 01/29/16 | 02/01/19 |
| Diversified Income Fund — Institutional Class** | 1.05% | 01/29/16 | 02/01/19 |
| High Yield Fund — A-Class | 1.16% | 11/30/12 | 02/01/19 |
| High Yield Fund — C-Class | 1.91% | 11/30/12 | 02/01/19 |
| High Yield Fund — P-Class* | 1.16% | 05/01/15 | 02/01/19 |
| High Yield Fund — R6-Class*** | 0.91% | 05/15/17 | 02/01/19 |
| High Yield Fund — Institutional Class | 0.91% | 11/30/12 | 02/01/19 |
| Investment Grade Bond Fund — A-Class | 1.00% | 11/30/12 | 02/01/19 |
| Investment Grade Bond Fund — C-Class | 1.75% | 11/30/12 | 02/01/19 |
| Investment Grade Bond Fund — P-Class* | 1.00% | 05/01/15 | 02/01/19 |
| Investment Grade Bond Fund — Institutional Class | 0.75% | 11/30/12 | 02/01/19 |
| Limited Duration Fund — A-Class | 0.80% | 12/01/13 | 02/01/19 |
| Limited Duration Fund — C-Class | 1.55% | 12/01/13 | 02/01/19 |
| Limited Duration Fund — P-Class* | 0.80% | 05/01/15 | 02/01/19 |
| Limited Duration Fund — Institutional Class | 0.55% | 12/01/13 | 02/01/19 |
| Municipal Income Fund — A-Class | 0.80% | 11/30/12 | 02/01/19 |
| Municipal Income Fund — C-Class | 1.55% | 11/30/12 | 02/01/19 |
| Municipal Income Fund — P-Class* | 0.80% | 05/01/15 | 02/01/19 |
| Municipal Income Fund — Institutional Class | 0.55% | 11/30/12 | 02/01/19 |
| * | Since the commencement of operations: May 1, 2015 |
| ** | Since the commencement of operations: January 29, 2016 |
| *** | Since the commencement of operations: May 15, 2017 |
| | THE GUGGENHEIM FUNDS ANNUAL REPORT | 113 |
NOTES TO FINANCIAL STATEMENTS (continued) |
GI is entitled to reimbursement by the Funds for fees waived or expenses reimbursed during any of the previous 36 months, beginning on the date of the expense limitation agreement, if on any day the estimated operating expenses are less than the indicated percentages. At September 30, 2017 the amount of fees waived or expenses reimbursed that are subject to recoupment are presented in the following table:
| Fund | | Expires
2018 | | | Expires
2019 | | | Expires
2020 | | | Fund
Total | |
| Diversified Income Fund | | | | | | | | | | | | |
| A-Class | | $ | — | | | $ | 1,312 | | | $ | 3,873 | | | $ | 5,185 | |
| C-Class | | | — | | | | 1,196 | | | | 3,893 | | | | 5,089 | |
| P-Class | | | — | | | | 1,156 | | | | 3,402 | | | | 4,558 | |
| Institutional Class | | | — | | | | 53,207 | | | | 148,686 | | | | 201,893 | |
| High Yield Fund | | | | | | | | | | | | | | | | |
| A-Class | | $ | 15,898 | | | $ | 12,450 | | | $ | 19,016 | | | $ | 47,364 | |
| C-Class | | | 2,190 | | | | 4,537 | | | | 5,167 | | | | 11,894 | |
| P-Class | | | — | | | | — | | | | 8,410 | | | | 8,410 | |
| R6-Class | | | — | | | | — | | | | — | | | | — | |
| Institutional Class | | | — | | | | 7,071 | | | | 17,696 | | | | 24,767 | |
| Investment Grade Bond Fund | | | | | | | | | | | | | | | | |
| A-Class | | $ | 109,791 | | | $ | 73,385 | | | $ | 77,376 | | | $ | 260,552 | |
| C-Class | | | 40,125 | | | | 35,023 | | | | 25,128 | | | | 100,276 | |
| P-Class | | | — | | | | — | | | | 5,909 | | | | 5,909 | |
| Institutional Class | | | — | | | | — | | | | 26,962 | | | | 26,962 | |
| Limited Duration Fund | | | | | | | | | | | | | | | | |
| A-Class | | $ | 66,925 | | | $ | 171,814 | | | $ | 152,459 | | | $ | 391,198 | |
| C-Class | | | 5,382 | | | | 31,279 | | | | 31,774 | | | | 68,435 | |
| P-Class | | | — | | | | 1,275 | | | | 41,567 | | | | 42,845 | |
| Institutional Class | | | 107,741 | | | | 287,680 | | | | 442,161 | | | | 837,582 | |
| Municipal Income Fund | | | | | | | | | | | | | | | | |
| A-Class | | $ | 181,845 | | | $ | 178,718 | | | $ | 125,964 | | | $ | 486,527 | |
| C-Class | | | 6,114 | | | | 13,957 | | | | 14,699 | | | | 34,770 | |
| P-Class | | | 22 | | | | 169 | | | | 758 | | | | 949 | |
| Institutional Class | | | 26,091 | | | | 36,640 | | | | 58,022 | | | | 120,753 | |
For the year ended September 30, 2017, GI recouped amounts from the Funds as follows:
| Diversified Income Fund | | $ | 9,287 | |
| High Yield Fund | | | 119,264 | |
| Investment Grade Bond Fund | | | 123,325 | |
| Limited Duration Fund | | | 918 | |
| Municipal Income Fund | | | 74 | |
If a Fund invests in an affiliated fund, the investing Fund’s adviser has agreed to waive fees at the investing fund level. Fee waivers will be calculated at the investing Fund level without regard to any expense cap, if any, in effect for the investing Fund. Fees waived under this arrangement are not subject to reimbursement to GI. For the year ended September 30, 2017, the Diversified Income Fund and Limited Duration Fund waived $27,753 and $92,283, respectively, related to investments in affiliated funds.
For the year ended September 30, 2017, GFD retained sales charges of $705,455 relating to sales of A-Class shares of the Trust.
Certain trustees and officers of the Trust are also officers of GI and GFD.
At September 30, 2017, GI and its affiliates owned over twenty percent of the outstanding shares of the Funds, as follows:
| Fund | Percent of
Outstanding
Shares Owned |
| Diversified Income Fund | 99% |
| 114 | THE GUGGENHEIM FUNDS ANNUAL REPORT | |
NOTES TO FINANCIAL STATEMENTS (continued) |
MUFG Investor Services (US), LLC (“MUIS”) acts as the Trust’s administrator, transfer agent and accounting agent. As administrator, transfer agent and accounting agent, MUIS is responsible for maintaining the books and records of the Trust’s securities and cash. For providing the aforementioned administrative and accounting services, MUIS is entitled to receive a monthly fee equal to a percentage of the Funds’ fees and out of pocket expenses. For providing the aforementioned transfer agent services, MUIS is entitled to receive a monthly fee based on the number of transactions during the month and the number of accounts under management subject to certain minimum monthly fees and out of pocket expenses.
Note 6 – Reverse Repurchase Agreements
Each of the Funds may enter into reverse repurchase agreements. Under a reverse repurchase agreement, a Fund sells securities and agrees to repurchase them at a particular price at a future date. In the event the buyer of securities under a reverse repurchase agreement files for bankruptcy or becomes insolvent, such buyer or its trustee or receiver may receive an extension of time to determine whether to enforce the Fund’s obligation to repurchase the securities, and the Fund’s use of the proceeds of the reverse repurchase agreement may effectively be restricted pending such decision.
For the year ended September 30, 2017, the following Funds entered into reverse repurchase agreements:
| Fund | | Number
of Days
Outstanding | | | Balance at
September 30,
2017 | | | Average
Balance
Outstanding | | | Average
Interest
Rate | |
| High Yield Fund | | | 360 | | | $ | 18,118,843 | | | $ | 28,881,543 | | | | 1.41 | % |
| Investment Grade Bond Fund | | | 183 | | | | — | | | | 14,629,398 | | | | 0.20 | % |
The following table presents reverse repurchase agreements that are subject to netting arrangements and off set in the Statements of Assets of Liabilities in conformity with U.S. GAAP:
| Fund | | Gross Amounts of Recognized Liabilities | | | Gross Amounts Offset In the Statements of Assets and Liabilities | | | Net Amount
of Liabilities Presented
on the Statements of Assets and Liabilities | | | Gross Amounts Not Offset
in the Statements of
Assets and Liabilities | | | Net
Amount | |
| Financial Instruments | | | Cash
Collateral
Pledged |
| High Yield Fund | | $ | 18,118,843 | | | $ | — | | | $ | 18,118,843 | | | $ | 18,118,843 | | | $ | — | | | $ | — | |
The following is a summary of the remaining contractual maturities of the reverse repurchase agreements outstanding as of year-end, aggregated by asset class of the related collateral pledged by the Funds:
Sum of Collateral Loan Amount
| Portfolio Name | Asset
Type | | For disclosure
Overnight and Continuous | | | Up to
30 days | | | Grand
Total | |
| High Yield Fund | Corporate Bonds | | $ | 6,869,875 | | | $ | 11,248,968 | | | $ | 18,118,843 | |
| Gross amount of recognized liabilities for reverse repurchase agreements | | | | | | | | | | | $ | 18,118,843 | |
Note 7 – Federal Income Tax Information
The Funds intend to comply with the provisions of Subchapter M of the Internal Revenue Code applicable to regulated investment companies and will distribute substantially all taxable net investment income and capital gains sufficient to relieve the Funds from all, or substantially all, federal income, excise and state income taxes. Therefore, no provision for federal or state income tax or federal excise tax is required.
| | THE GUGGENHEIM FUNDS ANNUAL REPORT | 115 |
NOTES TO FINANCIAL STATEMENTS (continued) |
Tax positions taken or expected to be taken in the course of preparing the Funds' tax returns are evaluated to determine whether the tax positions are "more-likely-than-not" of being sustained by the applicable tax authority. Tax positions not deemed to meet the more-likely-than-not threshold would be recorded as a tax benefit or expense in the current year. Management has analyzed the Funds' tax positions taken, or to be taken, on federal income tax returns for all open tax years, and has concluded that no provision for income tax is required in the Funds' financial statements. The Funds' federal tax returns are subject to examination by the Internal Revenue Service for a period of three years after they are filed.
The tax character of distributions paid during the year ended September 30, 2017 was as follows:
| Fund | | Ordinary
Income | | | Tax-Exempt
Income | | | Total
Distributions | |
| Diversified Income Fund | | $ | 301,432 | | | $ | — | | | $ | 301,432 | |
| High Yield Fund | | | 22,277,843 | | | | — | | | | 22,277,843 | |
| Investment Grade Bond Fund | | | 10,678,841 | | | | — | | | | 10,678,841 | |
| Limited Duration Fund | | | 32,967,318 | | | | — | | | | 32,967,318 | |
| Municipal Income Fund | | | 131,130 | | | | 1,123,781 | | | | 1,254,911 | |
The tax character of distributions paid during the year ended September 30, 2016 was as follows:
| Fund | | Ordinary
Income | | | Tax-Exempt
Income | | | Total
Distributions | |
| Diversified Income Fund | | $ | 144,751 | | | $ | — | | | $ | 144,751 | |
| High Yield Fund | | | 14,497,940 | | | | — | | | | 14,497,940 | |
| Investment Grade Bond Fund | | | 7,061,491 | | | | — | | | | 7,061,491 | |
| Limited Duration Fund | | | 15,525,625 | | | | — | | | | 15,525,625 | |
| Municipal Income Fund | | | 134,138 | | | | 1,230,749 | | | | 1,364,887 | |
Diversified Income Fund commenced operations on January 29, 2016.
Note: For federal income tax purposes, short-term capital gain distributions are treated as ordinary income distributions.
The tax components of accumulated earnings/(deficit) as of September 30, 2017 were as follows:
| Fund | | Undistributed Ordinary Income | | | Undistributed Tax-Exempt Income | | | Undistributed Long-Term Capital Gain | | | Net Unrealized Appreciation (Depreciation) | | | Accumulated Capital and Other Losses | | | Other Temporary Differences | | | Total | |
| Diversified Income Fund | | $ | 38,128 | | | $ | — | | | $ | 21,848 | | | $ | 472,754 | | | $ | — | | | $ | — | | | $ | 532,730 | |
| High Yield Fund | | | 1,049,271 | | | | — | | | | — | | | | 8,381,935 | | | | (1,637,529 | ) | | | (2,470,149 | ) | | | 5,323,528 | |
| Investment Grade Bond Fund | | | — | | | | — | | | | — | | | | (69,428 | ) | | | (1,539,777 | ) | | | (757,622 | ) | | | (2,366,827 | ) |
| Limited Duration Fund | | | 7,656,460 | | | | — | | | | 555,478 | | | | 8,187,690 | | | | — | | | | (3,601,427 | ) | | | 12,798,201 | |
| Municipal Income Fund | | | — | | | | 104,841 | | | | — | | | | 1,397,233 | | | | (220,364 | ) | | | (104,842 | ) | | | 1,176,868 | |
For Federal income tax purposes, capital loss carryforwards represent realized losses of the Funds that may be carried forward and applied against future capital gains. For taxable years beginning on or before December 22, 2010, such capital losses may be carried forward for a maximum of eight years. Under the RIC Modernization Act of 2010, the Funds are permitted to carry forward capital losses incurred in taxable years beginning after December 22, 2010 for an unlimited period. However, any losses incurred during those taxable years must be utilized prior to the losses incurred in pre-enactment taxable years. As a result of this ordering rule, pre-enactment capital loss carryforwards may be more
| 116 | THE GUGGENHEIM FUNDS ANNUAL REPORT | |
NOTES TO FINANCIAL STATEMENTS (continued) |
likely to expire unused. Additionally, post-enactment capital losses that are carried forward will retain their character as either short-term or long-term capital losses rather than being considered all short-term as under previous law. As of September 30, 2017, capital loss carryforwards for the Funds were as follows:
| Fund | | Expires in
2018 | | | Unlimited | | | Total
Capital Loss
Carryforward | |
| Short-Term | | | Long-Term |
| High Yield Fund | | $ | — | | | $ | — | | | $ | (1,637,529 | ) | | $ | (1,637,529 | ) |
| Investment Grade Bond Fund | | | (1,528,707 | ) | | | — | | | | — | | | | (1,528,707 | ) |
For the year ended September 30, 2017, the following capital loss carryforward amounts expired or were utilized:
| Fund | | Expired | | | Utilized | | | Total | |
| High Yield Fund | | $ | — | | | $ | 3,500,046 | | | $ | 3,500,046 | |
| Investment Grade Bond Fund | | | 17,723,877 | | | | 1,973,501 | | | | 19,697,378 | |
| Limited Duration Fund | | | — | | | | 14,848 | | | | 14,848 | |
| Municipal Income Fund | | | 27,176,627 | | | | 318,217 | | | | 27,494,844 | |
Net investment income and net realized gains (losses) may differ for financial statement and tax purposes because of temporary or permanent book/tax differences. These differences are primarily due to investments in swaps, losses deferred due to wash sales, foreign currency gains and losses, reclasses of distributions received and paid, income accruals on certain investments, income recharacterization from certain investments, dividends payable, paydown reclasses, “mark-to-market” of forward foreign currency exchange contracts, and the “mark-to-market” or disposition of certain Passive Foreign Investment Companies (PFICs). Additional differences may result from the tax treatment of the expiration of capital loss carryforward amounts, post-October loss deferrals, and bond premium/discount amortization. To the extent these differences are permanent, reclassifications are made to the appropriate capital accounts in the period that the differences arise. These reclassifications have no effect on net assets or NAV per share.
The following adjustments were made on the Statements of Assets and Liabilities as of September 30, 2017 for permanent book/tax differences:
| Fund | | Paid In
Capital | | | Undistributed
Net Investment
Income/(Loss) | | | Accumulated
Net Realized
Gain/(Loss) | |
| Diversified Income Fund | | $ | — | | | $ | 1,496 | | | $ | (1,496 | ) |
| High Yield Fund | | | (1 | ) | | | (538,575 | ) | | | 538,576 | |
| Investment Grade Bond Fund | | | (17,723,877 | ) | | | 1,612,325 | | | | 16,111,552 | |
| Limited Duration Fund | | | 1 | | | | 3,287,496 | | | | (3,287,497 | ) |
| Municipal Income Fund | | | (27,176,627 | ) | | | — | | | | 27,176,627 | |
At September 30, 2017, the cost of securities for Federal income tax purposes, the aggregate gross unrealized gain for all securities for which there was an excess of value over tax cost and the aggregate gross unrealized loss for all securities for which there was an excess of tax cost over value, were as follows:
| Fund | | Tax
Cost | | | Tax
Unrealized
Gain | | | Tax
Unrealized
(Loss) | | | Net
Unrealized
Gain/(Loss) | |
| Diversified Income Fund | | $ | 5,491,038 | | | $ | 475,183 | | | $ | (2,429 | ) | | $ | 472,754 | |
| High Yield Fund | | | 591,056,681 | | | | 15,908,213 | | | | (8,306,133 | ) | | | 7,602,080 | |
| Investment Grade Bond Fund | | | 372,750,545 | | | | 6,273,209 | | | | (6,342,637 | ) | | | (69,428 | ) |
| Limited Duration Fund | | | 2,297,232,667 | | | | 11,889,798 | | | | (3,695,051 | ) | | | 8,194,747 | |
| Municipal Income Fund | | | 51,368,252 | | | | 1,710,607 | | | | (313,374 | ) | | | 1,397,233 | |
| | THE GUGGENHEIM FUNDS ANNUAL REPORT | 117 |
NOTES TO FINANCIAL STATEMENTS (continued) |
Pursuant to Federal income tax regulations applicable to regulated investment companies, the Funds have elected to treat net capital losses and certain ordinary losses realized between November 1 and September 30 of each year as occurring on the first day of the following tax year. The Funds have also elected to treat certain ordinary losses realized between January 1 and September 30 of each year as occurring on the first day of the following tax year. For the year ended September 30, 2017, the following losses reflected in the accompanying financial statements were deferred for Federal income tax purposes until October 1, 2017:
| Fund | | Ordinary | | | Capital | |
| Investment Grade Bond Fund | | $ | (11,070 | ) | | $ | — | |
| Municipal Income Fund | | | — | | | | (220,364 | ) |
Note 8 – Securities Transactions
For the year ended September 30, 2017, the cost of purchases and proceeds from sales of investment securities, excluding government securities, short-term investments and derivatives, were as follows:
| Fund | | Purchases | | | Sales | |
| Diversified Income Fund | | $ | 2,725,494 | | | $ | 2,508,448 | |
| High Yield Fund | | | 547,351,598 | | | | 261,193,696 | |
| Investment Grade Bond Fund | | | 324,631,047 | | | | 247,856,775 | |
| Limited Duration Fund | | | 1,731,719,680 | | | | 654,476,396 | |
| Municipal Income Fund | | | 16,507,607 | | | | 27,292,576 | |
The Funds are permitted to purchase or sell securities from or to certain affiliated funds under specified conditions outlined in procedures adopted by the Board of the Trust. The procedures have been designed to ensure that any purchase or sale of securities by a Fund from or to another fund or portfolio that is or could be considered an affiliate by virtue of having a common investment adviser (or affiliated investment advisers), common Trustees and/or common officers complies with Rule 17a-7 of the 1940 Act. Further, as defined under these procedures, each transaction is effected at the current market price to save costs, where permissible. For the year ended September 30, 2017, the Funds engaged in purchases and sales of securities, pursuant to Rule 17a-7 of the 1940 Act, as follows:
| Fund | | Purchases | | | Sales | | | Realized
Gain | |
| High Yield Fund | | $ | 48,366,878 | | | $ | 4,950,000 | | | $ | 160,918 | |
| Investment Grade Bond Fund | | | 1,244,420 | | | | 2,103,469 | | | | 79,968 | |
| Limited Duration Fund | | | 1,104,708 | | | | 1,349,084 | | | | 111,600 | |
Note 9 – Loan Commitments
Pursuant to the terms of certain loan agreements, certain Funds held unfunded loan commitments as of September 30, 2017. The Funds are obligated to fund these loan commitments at the borrower’s discretion.
| 118 | THE GUGGENHEIM FUNDS ANNUAL REPORT | |
NOTES TO FINANCIAL STATEMENTS (continued) |
The unfunded loan commitments as of September 30, 2017, were as follows:
| Borrower | Maturity Date | | Face Amount | | | Value | |
| High Yield Fund | | | | | | | |
| Acosta, Inc. | 09/26/19 | | $ | 488,889 | | | $ | 25,900 | |
| Advantage Sales & Marketing LLC | 07/25/19 | | | 1,100,000 | | | | 51,405 | |
| BBB Industries, LLC | 11/04/19 | | | 1,000,000 | | | | 57,697 | |
| Beacon Roofing Supply, Inc. | 02/28/18 | | | 9,800,000 | | | | — | |
| Cypress Intermediate Holdings III, Inc. | 04/27/22 | | | 750,000 | | | | 85,243 | |
| Epicor Software | 06/01/20 | | | 1,000,000 | | | | 66,293 | |
| Hillman Group, Inc. | 06/30/19 | | | 1,000,000 | | | | 37,822 | |
| ICSH Parent, Inc. | 04/29/24 | | | 79,941 | | | | — | |
| Learning Care Group (US), Inc. | 05/05/19 | | | 500,000 | | | | 31,398 | |
| Lytx, Inc. | 08/31/22 | | | 105,263 | | | | 12,949 | |
| MRI Software LLC | 06/30/23 | | | 472,223 | | | | — | |
| National Technical Systems | 06/12/21 | | | 250,000 | | | | 19,269 | |
| Packaging Coordinators Midco, Inc. | 07/01/21 | | | 1,200,467 | | | | 112,626 | |
| Pro Mach Group, Inc. | 10/22/19 | | | 900,000 | | | | 44,708 | |
| PT Intermediate Holdings III, LLC | 06/23/22 | | | 98,333 | | | | 8,079 | |
| Recess Holdings, Inc. | 09/30/24 | | | 166,667 | | | | — | |
| Signode Industrial Group US, Inc. | 05/01/19 | | | 1,800,000 | | | | 71,140 | |
| Solera LLC | 03/03/21 | | | 1,250,000 | | | | 120,456 | |
| Vantiv LLC | 09/08/24 | | | 328,717 | | | | — | |
| Wencor Group | 06/19/19 | | | 847,692 | | | | 34,145 | |
| | | | | | | | $ | 779,130 | |
| | THE GUGGENHEIM FUNDS ANNUAL REPORT | 119 |
NOTES TO FINANCIAL STATEMENTS (continued) |
Note 10 – Restricted Securities
The securities below are considered illiquid and restricted under guidelines established by the Board:
| Fund | Restricted Securities | Acquisition Date | | Cost | | | Value | |
| High Yield Fund | Schahin II Finance Co. SPV Ltd. | | | | | | | |
| | 5.88% due 09/25/22 | 03/12/15 | | $ | 139,296 | | | $ | 21,717 | |
| | | | | | | | | | | |
| Investment Grade Bond Fund | GMAC Commercial Mortgage Asset Corp. | | | | | | | | | |
| | 2007-HCKM, 6.11% due 08/10/52 | 10/07/16 | | | 1,735,921 | | | | 1,664,558 | |
| | Northern Group Housing LLC | | | | | | | | | |
| | 6.80% due 08/15/53 | 07/25/13 | | | 600,000 | | | | 737,568 | |
| | Woodbourne Capital Trust II | 01/20/06 | | | 954,589 | | | | 716,473 | |
| | Woodbourne Capital Trust III | 01/20/06 | | | 954,589 | | | | 716,473 | |
| | Woodbourne Capital Trust IV | 01/20/06 | | | 954,589 | | | | 716,473 | |
| | Woodbourne Capital Trust I | 01/20/06 | | | 954,589 | | | | 716,472 | |
| | Turbine Engines Securitization Ltd. | | | | | | | | | |
| | 2013-1A, 5.13% due 12/13/48 | 11/27/13 | | | 630,978 | | | | 625,775 | |
| | HP Communities LLC | | | | | | | | | |
| | 5.78% due 03/15/46 | 08/23/16 | | | 592,558 | | | | 546,080 | |
| | Capmark Military Housing Trust | | | | | | | | | |
| | 2007-ROBS, 6.06% due 10/10/52 | 04/23/15 | | | 470,396 | | | | 492,567 | |
| | Highland Park COO I Ltd. | | | | | | | | | |
| | 2006-1A, 1.72% due 11/25/51 | 07/01/16 | | | 446,200 | | | | 458,153 | |
| | Pacific Northwest Communities LLC | | | | | | | | | |
| | 5.91% due 06/15/50 | 05/22/14 | | | 400,000 | | | | 441,308 | |
| | Atlantic Marine Corporations Communities LLC | | | | | | | | | |
| | 5.43% due 12/01/50 | 07/25/14 | | | 364,374 | | | | 377,451 | |
| | ACC Group Housing LLC | | | | | | | | | |
| | 6.35% due 07/15/54 | 06/03/14 | | | 300,000 | | | | 350,637 | |
| | Capmark Military Housing Trust | | | | | | | | | |
| | 2007-AETC, 5.75% due 02/10/52 | 09/18/14 | | | 330,380 | | | | 333,317 | |
| | Copper River CLO Ltd. | | | | | | | | | |
| | 2007-1A, due 01/20/21 | 05/09/14 | | | 396,527 | | | | 95,382 | |
| | | | | | 10,085,688 | | | | 8,988,687 | |
| | | | | | | | | | | |
| Limited Duration Fund | Copper River CLO Ltd. | | | | | | | | | |
| | 2007-1A, due 01/20/21 | 05/09/14 | | | 283,239 | | | | 68,130 | |
| | Schahin II Finance Co. SPV Ltd. | | | | | | | | | |
| | 5.88% due 09/25/22 | 01/08/14 | | | 375,036 | | | | 39,090 | |
| | | | | | 658,275 | | | | 107,220 | |
Note 11 – Line of Credit
The Trust, with the exception of Capital Stewardship Fund, and certain affiliated funds, secured a 364-day committed, $1,000,000,000 line of credit from Citibank, N.A., which was in place through October 6, 2017, at which time the line of credit was renewed with an increased commitment amount of $1,065,000,000. The funds that participate in the line of credit including the Fund, paid aggregate upfront costs of $982,952 to renew the line of credit. The commitment fee that may be paid by the Funds is at an annualized rate of 0.15% of the average daily amount of their unused commitment amount. These amounts are included within Line of Credit Fees on the Statements of Operations.
A Fund may draw (borrow) from the line of credit as a temporary measure for emergency purposes, to facilitate redemption requests, or for other short-term liquidity purposes consistent with the Fund’s investment objective and program. For example, it may be advantageous for the Fund to borrow money rather than sell existing portfolio positions to meet redemption requests. Fees related to borrowings, if any, vary under this arrangement between the greater of Citibank’s “base rate”, 1 month LIBOR plus 1%, or the federal funds rate plus 1/2 of 1%.
The Funds did not have any borrowings under this agreement as of and for the period ended September 30, 2017.
| 120 | THE GUGGENHEIM FUNDS ANNUAL REPORT | |
NOTES TO FINANCIAL STATEMENTS (continued) |
The allocated interest expense amount for each Fund is referenced in the Statement of Operations under “Line of Credit fees.”
Note 12 – Legal Proceedings
Motors Liquidation Company
On or about June of 2015, the Guggenheim High Yield Fund was served and became a party to the case entitled Official Committee of Unsecured Creditors of Motors Liquidation Company v. JPMorgan Chase Bank, N.A., et al., Adversary Proceeding No. 09-00504 (MG) (Bankr. S.D.N.Y.), brought by the Motors Liquidation Avoidance Action Trust (the “Motors Trust”). The lawsuit was initially filed in the United States Bankruptcy Court for the Southern District of New York on July 31, 2009 by the Official Committee of Unsecured Creditors of Motors Liquidation Company (f/k/a General Motors) against the former holders of an approximately $1.5 billion term loan issued pursuant to a term loan agreement, dated as of November 29, 2006 (the “Term Loan”), between General Motors, as borrower, JPMorgan Chase Bank, N.A., as administrative agent (“JPMorgan”), and various institutions as lenders, including the Guggenheim High Yield Fund (f/k/a Security Income Fund – High Yield Series). The Term Loan lenders received a full repayment of the Term Loan pursuant to a June 1, 2009 court order issued in connection with the General Motors chapter 11 bankruptcy filing. The plaintiff is seeking a court order that the lenders return at least a portion of the proceeds received in 2009 based on the contention that certain UCC financing statements securing the indebtedness due under the Term Loan were terminated (thus releasing collateral secured by the UCC financing statement), rendering the Term Loan under-secured or completely unsecured. As a result, the lawsuit alleges that the Term Loan lenders were at least partially unsecured creditors at the time General Motors filed for bankruptcy, and should not have been paid as fully secured creditors.
After being served, the Guggenheim High Yield Fund filed a motion to dismiss the lawsuit on November 19, 2015. On June 30, 2016, the Bankruptcy Court denied the motion to dismiss, holding that the orders extending the time to serve defendants were valid. On July 14, 2016, the Guggenheim High Yield Fund filed a motion for leave to file an interlocutory appeal of the Bankruptcy Court’s decision, which was denied on March 8, 2017.
On December 18, 2015, the Guggenheim High Yield Fund filed cross-claims against co-defendant JPMorgan related to JPMorgan’s actions as administrative agent in connection with the Term Loan and the termination of the UCC financing statements. Discovery is currently stayed pending the outcome of the below referenced mediation.
On November 10, 2016, the Motors Trust filed a stipulation and proposed order dismissing its third claim for relief as set forth in its amended complaint, which was so ordered on November 17, 2016.
On April 24, 2017, a trial in commenced in the Bankruptcy Court for the Southern District of New York on the collateral status and valuation of 40 representative assets (the “Representative Asset Trial”). The evidentiary potion of the trial concluded on May 5, 2017, and closing arguments were held on June 5, 2017.
On September 26, 2017, the Bankruptcy Court issued its decision. The Court held that 33 of the 40 assets at issue (the “Representative Assets”) were fixtures and that the majority of the Representative Assets should be valued on a going concern basis. The Avoidance Trust sought leave to appeal portions of the decision on October 10, 2017.
The parties have agreed to attend a mediation in front of David Geronemus, Esq. on December 12-13, 2017 in an attempt to consensually resolve the dispute. The mediation will focus on applying the Bankruptcy Court’s decision to the remaining assets.
This lawsuit does not allege any wrongdoing on the part of the Guggenheim High Yield Fund and the Fund intends to vigorously defend the matter. If the plaintiff is successful, it is reasonably possible that the Guggenheim High Yield Fund will be required to make payments in some amount (but not likely to exceed approximately $1,000,000), although the Fund may recover some or all of this amount from its cross-claims against co-defendant JPMorgan. At this stage of the proceedings, the Guggenheim High Yield Fund is unable to make a reliable prediction as to the outcome of this lawsuit or the affect, if any, on the Fund’s net asset value.
| | THE GUGGENHEIM FUNDS ANNUAL REPORT | 121 |
NOTES TO FINANCIAL STATEMENTS (concluded) |
Note 13 – Subsequent Event
At a meeting that occurred on November 14 – 15, 2017, the Board approved the following changes, effective November 20, 2017:
| | ● | The advisory fee for Investment Grade Bond Fund was reduced from 0.50% to 0.39%. |
| | ● | The advisory fee for Limited Duration Fund was reduced from 0.45% to 0.39%. |
| | ● | The advisory fee breakpoint of 5 basis points (0.05%) on average daily net assets above $5 billion for the Investment Grade Bond Fund was removed as the breakpoint is no longer necessary or applicable in light of the aforementioned advisory fee reduction. |
| | ● | The total expenses limits, as a percentage of average net assets for each class of shares, exclusive of brokerage costs, dividends on securities sold short, expenses of other investment companies in which a Fund invests, interest, taxes, litigation, indemnification and extraordinary expenses, were reduced. The limits are listed below: |
| | Limit | Effective
Date | Contract
End Date |
| Investment Grade Bond Fund — A-Class | 0.79% | 11/30/12 | 02/01/20 |
| Investment Grade Bond Fund — C-Class | 1.54% | 11/30/12 | 02/01/20 |
| Investment Grade Bond Fund — P-Class | 0.79% | 05/01/15 | 02/01/20 |
| Investment Grade Bond Fund — Institutional Class | 0.50% | 11/30/12 | 02/01/20 |
| Limited Duration Fund — A-Class | 0.75% | 12/01/13 | 02/01/20 |
| Limited Duration Fund — C-Class | 1.50% | 12/01/13 | 02/01/20 |
| Limited Duration Fund — P-Class | 0.75% | 05/01/15 | 02/01/20 |
| Limited Duration Fund — Institutional Class | 0.50% | 12/01/13 | 02/01/20 |
The terms of the investment management agreement are otherwise unchanged.
| 122 | THE GUGGENHEIM FUNDS ANNUAL REPORT | |
| REPORT OF INDEPENDENT REGISTERED PUBLIC ACCOUNTING FIRM |
The Board of Trustees and Shareholders
of Guggenheim Funds Trust
We have audited the accompanying statements of assets and liabilities, including the schedules of investments, of Guggenheim Diversified Income Fund, Guggenheim High Yield Fund, Guggenheim Investment Grade Bond Fund, Guggenheim Limited Duration Fund, and Guggenheim Municipal Income Fund (five of the series constituting the Guggenheim Funds Trust) (the “Funds”) as of September 30, 2017, and the related statements of operations for the year then ended, and the statements of changes in net assets and the financial highlights for each of the years or periods indicated therein. These financial statements and financial highlights are the responsibility of the Funds’ management. Our responsibility is to express an opinion on these financial statements and financial highlights based on our audits.
We conducted our audits in accordance with the standards of the Public Company Accounting Oversight Board (United States). Those standards require that we plan and perform the audit to obtain reasonable assurance about whether the financial statements and financial highlights are free of material misstatement. We were not engaged to perform an audit of the Funds’ internal control over financial reporting. Our audits included consideration of internal control over financial reporting as a basis for designing audit procedures that are appropriate in the circumstances, but not for the purpose of expressing an opinion on the effectiveness of the Funds’ internal control over financial reporting. Accordingly, we express no such opinion. An audit also includes examining, on a test basis, evidence supporting the amounts and disclosures in the financial statements and financial highlights, assessing the accounting principles used and significant estimates made by management, and evaluating the overall financial statement presentation. Our procedures included confirmation of securities owned as of September 30, 2017, by correspondence with the custodians, transfer agent, brokers, and paying agents or by other appropriate auditing procedures where replies from brokers or paying agents were not received. We believe that our audits provide a reasonable basis for our opinion.
In our opinion, the financial statements and financial highlights referred to above present fairly, in all material respects, the financial position of the above listed Funds (five of the series constituting the Guggenheim Funds Trust) at September 30, 2017, the results of their operations for the year then ended, and the changes in their net assets and their financial highlights for each of the years or periods indicated therein, in conformity with U.S. generally accepted accounting principles.
Tysons, Virginia
November 29, 2017
| | THE GUGGENHEIM FUNDS ANNUAL REPORT | 123 |
OTHER INFORMATION (Unaudited) |
Federal Income Tax Information
This information is being provided as required by the Internal Revenue Code. Amounts shown may differ from those elsewhere in the report because of differences in tax and financial reporting practice.
In January 2018, shareholders will be advised on IRS Form 1099 DIV or substitute 1099 DIV as to the federal tax status of the distributions received by shareholders in the calendar year 2017.
The Funds’ investment income (dividend income plus short-term gains, if any) qualifies as follows:
Municipal Income Fund designates $1,123,781 as tax-exempt interest income according to IRC Section 852(b)(5)(A).
Of the taxable ordinary income distributions paid during the fiscal year ending September 30, 2017, the following funds had the corresponding percentages qualify for the reduced tax rate pursuant to the Jobs and Growth Tax Relief and Reconciliation Act of 2003 or for the dividends received deduction for corporations. See the qualified dividend income and dividend received deduction columns, respectively, in the table below.
Additionally, of the taxable ordinary income distributions paid during the fiscal year ended September 30, 2017, the following funds had the corresponding percentages qualify as interest related dividends and qualified short-term capital gains as permitted by IRC Section 871(k)(1) and IRC Section 871(k)(2), respectively. See qualified interest income and qualified short-term capital gain columns, respectively, in the table below.
| Fund | Qualified
Dividend
Income | Dividend
Received
Deduction | Qualified
Interest
Income | Qualified
Short-Term
Capital Gain |
| Diversified Income Fund | 25.23% | 25.17% | 0.06% | 100.00% |
| High Yield Fund | 1.37% | 1.36% | 95.93% | 0.00% |
| Investment Grade Bond Fund | 0.18% | 0.18% | 77.69% | 0.00% |
| Limited Duration Fund | 0.04% | 0.04% | 77.82% | 100.00% |
| Municipal Income Fund | 0.00% | 0.00% | 0.00% | 0.00% |
Proxy Voting Information
A description of the policies and procedures that the Trust uses to determine how to vote proxies relating to securities held in the Funds’ portfolios is available, without charge and upon request, by calling 800.820.0888. This information is also available from the EDGAR database on the SEC’s website at https://www.sec.gov.
Information regarding how the Funds voted proxies relating to portfolio securities during the most recent 12-month period ended June 30 is available without charge, upon request, by calling 800.820.0888. This information is also available from the EDGAR database on the SEC’s website at https://www.sec.gov.
Sector Classification
Information in the “Schedule of Investments” is categorized by sectors using sector-level Classifications defined by the Bloomberg Industry Classification System, a widely recognized industry classification system provider. Each Fund’s registration statement has investment policies relating to concentration in specific sectors/industries. For purposes of these investment policies, the Funds usually classify sectors/industries based on industry-level Classifications used by widely recognized industry classification system providers such as Bloomberg Industry Classification System, Global Industry Classification Standards and Barclays Global Classification Scheme.
Quarterly Portfolio Schedules Information
The Trust files its complete schedule of portfolio holdings with the SEC for the first and third quarters of each fiscal year on Form N-Q; which are available on the SEC’s website at https://www.sec.gov. The Funds’ Forms N-Q may be reviewed and copied at the SEC’s Public Reference Room in Washington, DC, and that information on the operation of the Public Reference Room may be obtained by calling 800-SEC-0330. Copies of the portfolio holdings are also available to shareholders, without charge and upon request, by calling 800.820.0888.
| 124 | THE GUGGENHEIM FUNDS ANNUAL REPORT | |
OTHER INFORMATION (Unaudited)(continued) |
Report of the Guggenheim Funds Trust Contracts Review Committee
Guggenheim Funds Trust (the “Trust”) was organized as a Delaware statutory trust on November 8, 2013, and is registered as an open-end management investment company under the Investment Company Act of 1940, as amended (the “1940 Act”). The Trust includes the following series:
● Guggenheim Alpha Opportunity Fund (“Alpha Opportunity Fund”) ● Guggenheim Diversified Income Fund (“Diversified Income Fund”) ● Guggenheim High Yield Fund (“High Yield Fund”) ● Guggenheim Large Cap Value Fund (“Large Cap Value Fund”) ● Guggenheim Macro Opportunities Fund (“Macro Opportunities Fund”) ● Guggenheim Mid Cap Value Fund (“Mid Cap Value Fund”) ● Guggenheim Municipal Income Fund (“Municipal Income Fund”) ● Guggenheim Small Cap Value Fund (“Small Cap Value Fund”) ● Guggenheim StylePlus—Mid Growth Fund (“StylePlus—Mid Growth Fund”) ● Guggenheim World Equity Income Fund (“World Equity Income Fund”) | ● Guggenheim Capital Stewardship Fund (“Capital Stewardship Fund”) ● Guggenheim Floating Rate Strategies Fund (“Floating Rate Strategies Fund”) ● Guggenheim Investment Grade Bond Fund (“Investment Grade Bond Fund”) ● Guggenheim Limited Duration Fund (“Limited Duration Fund”) ● Guggenheim Market Neutral Real Estate Fund (“Market Neutral Real Estate Fund”) ● Guggenheim Mid Cap Value Institutional Fund (“Mid Cap Value Institutional Fund”) ● Guggenheim Risk Managed Real Estate Fund (“Risk Managed Real Estate Fund”) ● Guggenheim StylePlus—Large Core Fund (“StylePlus—Large Core Fund”) ● Guggenheim Total Return Bond Fund (“Total Return Bond Fund”) |
Security Investors, LLC (“Security Investors”), an indirect subsidiary of Guggenheim Partners, LLC, a global, diversified financial services firm (“Guggenheim Partners”), serves as investment adviser to each of: (i) Alpha Opportunity Fund; (ii) High Yield Fund; (iii) Investment Grade Bond Fund; (iv) Large Cap Value Fund; (v) Mid Cap Value Fund; (vi) Mid Cap Value Institutional Fund; (vii) Municipal Income Fund; (viii) Small Cap Value Fund; (ix) StylePlus—Large Core Fund; (x) StylePlus—Mid Growth Fund; and (xi) World Equity Income Fund (collectively, the “SI-Advised Funds”). (Guggenheim Partners, Security Investors, Guggenheim Partners Investment Management, LLC (“GPIM”) and their affiliates may be referred to herein collectively as “Guggenheim.” “Guggenheim Investments” refers to the global asset management and investment advisory division of Guggenheim Partners and includes GPIM, Security Investors and Guggenheim Funds Investment Advisors, LLC and other affiliated investment management businesses of Guggenheim Partners.)
Under the terms of investment management agreements between Security Investors and the Trust, with respect to the SI-Advised Funds, Security Investors also is responsible for overseeing the activities of GPIM, an indirect subsidiary of Guggenheim Partners, with respect to its service as investment sub-adviser to Municipal Income Fund, pursuant to an investment sub-advisory agreement between Security Investors and GPIM (the “GPIM Sub-Advisory Agreement”).
GPIM serves as investment adviser with respect to each of: (i) Diversified Income Fund; (ii) Floating Rate Strategies Fund; (iii) Limited Duration Fund; (iv) Macro Opportunities Fund; (v) Market Neutral Real Estate Fund; (vi) Risk Managed Real Estate Fund; and (vii) Total Return Bond Fund (collectively, the “GPIM-Advised Funds” and together with the SI-Advised Funds, the “Funds” and individually, a “Fund”).1 Under the supervision
1 | The investment management agreements pertaining to the SI-Advised Funds and the investment management agreements pertaining to the GPIM-Advised Funds are referred to herein together as the “Advisory Agreements” and, together with the GPIM Sub-Advisory Agreement, as the “Agreements.” In addition, unless the context indicates otherwise, GPIM, with respect to its service as investment adviser to the GPIM-Advised Funds, and Security Investors as to the SI-Advised Funds, are each referred to herein as the “Adviser” and together, the “Advisers.” |
| | THE GUGGENHEIM FUNDS ANNUAL REPORT | 125 |
OTHER INFORMATION (Unaudited)(continued) |
of the Board of Trustees of the Trust (the “Board,” with the members of the Board referred to individually as the “Trustees”), the Advisers regularly provide (or, as applicable, oversee the provision of) investment research, advice and supervision, along with a continuous investment program for the Funds, and direct the purchase and sale of securities and other investments for each Fund’s portfolio.
Following an initial two-year term, each of the Advisory Agreements continues in effect from year to year provided that such continuance is specifically approved at least annually by (i) the Board or a majority of the outstanding voting securities (as defined in the 1940 Act) of each Fund, and, in either event, (ii) the vote of a majority of the Trustees who are not “interested person[s],” as defined by the 1940 Act, of the Trust (the “Independent Trustees”) casting votes in person at a meeting called for such purpose. At meetings held in person on April 25, 2017 (the “April Meeting”) and on May 23, 2017 (the “May Meeting”), the members of the Contracts Review Committee of the Board (the “Committee”), consisting solely of the Independent Trustees, met separately from Guggenheim to consider the proposed renewal of the Advisory Agreements and the GPIM Sub-Advisory Agreement in connection with the Committee’s annual contract review schedule. GPIM also serves as investment adviser for the Capital Stewardship Fund, which is addressed in a separate report.2
As part of its review process, the Committee was represented by independent legal counsel to the Independent Trustees (“Independent Legal Counsel”). Independent Legal Counsel reviewed and discussed with the Committee various key aspects of the Trustees’ legal responsibilities relating to the proposed renewal of the Agreements and other principal contracts. The Committee took into account various materials received from Guggenheim and Independent Legal Counsel. Recognizing that the evaluation process with respect to the services provided by each of the Advisers is an ongoing one, the Committee also considered the variety of written materials, reports and oral presentations the Board receives throughout the year regarding performance and operating results of the Funds.
In connection with the contract review process, FUSE Research Network LLC (“FUSE”), an independent, third-party research provider, was engaged to prepare advisory contract renewal reports designed specifically to help the Board fulfill its advisory contract renewal responsibilities. The objective of the reports is to present the subject funds’ relative position regarding fees, expenses and total return performance, with peer group and universe comparisons. The Committee assessed the data provided in the FUSE reports as well as commentary and supporting data presented by Guggenheim, including, among other things, a summary of notable distinctions between certain Funds and the applicable peer group identified in the FUSE reports.
In addition, Guggenheim provided materials and data in response to formal requests for information sent by Independent Legal Counsel on behalf of the Independent Trustees. Guggenheim also made a presentation at the April Meeting. Throughout the process, the Committee asked questions of management and requested certain additional information, which Guggenheim provided following the April Meeting (collectively with the foregoing reports and materials, the “Contract Review Materials”). The Committee considered the Contract Review Materials in the context of its accumulated experience governing the Trust and weighed the factors and standards discussed with Independent Legal Counsel.
Following an analysis and discussion of the factors identified below and in the exercise of its business judgment, the Committee concluded that it was in the best interest of each Fund to recommend that the Board approve the renewal of each Advisory Agreement and the GPIM Sub-Advisory Agreement for an additional annual term.
Advisory Agreements
Nature, Extent and Quality of Services Provided by each Adviser: With respect to the nature, extent and quality of services currently provided by each Adviser, the Committee considered the qualifications, experience and skills of key personnel performing services for the Funds, including those personnel providing compliance oversight, as well as the supervisors and reporting lines for such personnel. In this connection, the Committee considered Guggenheim’s resources and related efforts to retain, attract and motivate capable personnel to serve the Funds and noted Guggenheim’s report on recent additions, departures and transitions in personnel who work on matters relating to the Funds or are significant to the operations of each Adviser. The Committee also considered the Advisers’ attention to relevant developments in the mutual fund industry and its observance of compliance and regulatory requirements, and noted that on a regular basis the Board receives and reviews information from the Trust’s Chief Compliance Officer regarding compliance policies and procedures established pursuant to Rule 38a-1 under
2 | Because shares of the Capital Stewardship Fund are only offered for subscription and are held by a limited number of institutional/bank investors, and the Fund issues a shareholder report separate from the other series of the Trust, the factors considered by the Committee in evaluating the proposed renewal of an investment management agreement pertaining to the Capital Stewardship Fund, and the Concinnity Sub-Advisory Agreement, are addressed in a separate report of the Committee. Accordingly, references to the “Funds” should be understood as referring to all series of the Trust, excluding Capital Stewardship Fund. |
| 126 | THE GUGGENHEIM FUNDS ANNUAL REPORT | |
OTHER INFORMATION (Unaudited)(continued) |
the 1940 Act, as well as from Guggenheim’s Chief Risk Officer. In addition, the Committee noted Guggenheim’s implementation of additional controls and oversight processes relating to risk management, including the establishment of an Enterprise Risk Management Committee comprised of a multi-disciplinary team of senior personnel, as well as enhancements to the organization’s information security program.
In connection with the Committee’s evaluation of the overall package of services provided by each Adviser, the Committee considered Guggenheim’s administrative capabilities, including its role in monitoring and coordinating compliance responsibilities with the fund administrator, transfer agent, distributor, custodian and other service providers to the Funds. In this respect, the Committee took into account the initiatives undertaken by Guggenheim in connection with the outsourcing of its fund administration and transfer agency services business resulting from Guggenheim’s sale of Rydex Fund Services, LLC (“RFS”), formerly a Guggenheim affiliate and now known as MUFG Investor Services (US), LLC (“MUFG IS”), to Mitsubishi UFJ Trust and Banking Corporation, the trust banking arm of Mitsubishi UFJ Financial Group, a Japanese financial services organization (the “RFS Transaction”). In particular, the Committee considered Guggenheim’s establishment of the Office of Chief Financial Officer (“OCFO”), its structure and responsibilities, including its role in overseeing the services provided by MUFG IS. The Committee also considered the resources allocated by Guggenheim to support the OCFO and the detailed plans presented by management for functions for the OCFO both during and upon completion of the transition period with MUFG IS.
With respect to Municipal Income Fund, the Committee noted that although Security Investors delegated responsibility for the investment and reinvestment of the Fund’s assets to the Sub-Adviser, as affiliated companies, both the Adviser and Sub-Adviser are part of the Guggenheim organization. Further, the Committee took into account that investment advisory-related services are provided by many Guggenheim employees under different related legal entities and thus, the services provided by the Adviser on the one hand and the Sub-Adviser on the other, as well as the risks assumed by each party, are not provided by distinct legal entities. The Committee took into account information provided by Guggenheim describing the Adviser’s processes and activities for providing oversight of the Sub-Adviser’s investment strategies and compliance with investment restrictions, including information regarding the Adviser’s Sub-Advisory Oversight Committee.
With respect to Guggenheim’s resources and the ability of each Adviser to carry out its responsibilities under the applicable Advisory Agreement, the Chief Financial Officer of Guggenheim Investments reviewed with the Committee certain unaudited financial information concerning the holding company for Guggenheim Investments, Guggenheim Partners Investment Management Holdings, LLC (“GPIMH”). The Committee received the audited consolidated financial statements of GPIMH as supplemental information. (Thereafter, the Committee received the audited consolidated financial statements of GPIM.)
The Committee also considered the acceptability of the terms of each Advisory Agreement, including the scope of services required to be performed by each Adviser.
Based on the foregoing, and based on other information received (both oral and written) at the April Meeting and the May Meeting, as well as other considerations, including the Committee’s knowledge of how each Adviser performs its duties obtained through Board meetings, discussions and reports during the year, the Committee concluded that each Adviser and its personnel were qualified to serve the Funds in such capacity and may reasonably be expected to continue to provide a high quality of services under each Advisory Agreement with respect to the Funds.
Investment Performance: The Committee received, for each Fund, investment returns for the ten-year, five-year, three-year, one-year and three-month periods ended December 31, 2016, as applicable. In addition, the Committee received a comparison of each Fund’s performance to the performance of a benchmark, a universe of funds and a narrower peer group of similar funds based on asset levels as identified by FUSE, in each case for the same periods, as applicable. The Committee also received from FUSE representatives and considered a description of the methodology employed by FUSE for identifying each Fund’s peer group and universe for performance and expense comparisons.
In seeking to evaluate Fund performance over a full market cycle, the Committee focused its attention on five-year and three-year performance rankings as compared to the relevant universe of funds. The Committee also considered more recent performance periods, including the one-year period and, as deemed appropriate, the since-inception and/or three-month period, for certain Funds such as for those Funds that were recently launched or had undergone recent changes in investment strategies, as well as circumstances in which enhancements were made to the portfolio management processes or techniques employed for a Fund. In this connection, the Committee made the following observations:
| | THE GUGGENHEIM FUNDS ANNUAL REPORT | 127 |
OTHER INFORMATION (Unaudited)(continued) |
Alpha Opportunity Fund: The Fund’s Class A shares outperformed the performance universe median for the five-year and three-year periods, ranking in the 8th percentile for both periods. The Committee considered that the Fund re-opened to subscriptions with a new U.S. long/short equity investment strategy on January 28, 2015. In light of the foregoing, the Committee also considered the more recent one-year period ended December 31, 2016, and observed that the return of Fund’s Class A shares ranked in the 5th percentile of its performance universe, exceeding the performance universe median.
Diversified Income Fund:3 The Committee noted the Fund’s inception date of January 29, 2016, and observed that the Fund’s Class A shares ranked in the 22nd and 24th percentiles of its performance universe for the since-inception and three-month periods ended December 31, 2016, respectively, exceeding its performance universe median for both periods.
Floating Rate Strategies Fund: The returns of the Fund’s Class A shares ranked in the 6th and 10th percentiles of its performance universe for the five-year and three-year periods ended December 31, 2016, respectively, exceeding its performance universe median for each of these periods.
High Yield Fund: The returns of the Fund’s Class A shares ranked in the 3rd and 6th percentiles of its performance universe for the five-year and three-year periods ended December 31, 2016, respectively, exceeding its performance universe median for each of these periods.
Investment Grade Bond Fund: The returns of the Fund’s Class A shares ranked in the 2nd percentile of its performance universe for both the five-year and three-year periods ended December 31, 2016, exceeding its performance universe median for both of these periods.
Limited Duration Fund: The Committee noted the Fund’s inception date of December 16, 2013, and observed that the returns of the Fund’s Class A shares ranked in the 1st and 9th percentiles of its performance universe for the three-year and one-year periods ended December 31, 2016, respectively, exceeding its performance universe median for both of these periods.
Macro Opportunities Fund: The Committee observed that the returns of the Fund’s Class A shares ranked in the 1st and 8th percentiles of its performance universe for the five-year and three-year periods ended December 31, 2016, respectively, exceeding its performance universe median for both of these periods.
Market Neutral Real Estate Fund:4 The Committee noted the Fund’s inception date of February 26, 2016, and observed that the returns of the Fund’s Class A shares ranked in the 55th and 14th percentiles of its performance universe for the since-inception and three-month periods ended December 31, 2016, respectively, exceeding the performance universe median for the three-month period.
Risk Managed Real Estate Fund: The Committee noted the Fund’s inception date of March 28, 2014, and observed the returns of the Fund’s Class A shares ranked in the 3rd and 16th percentiles of its performance universe for the since-inception and one-year periods ended December 31, 2016, respectively, exceeding its performance universe median for both of these periods.
StylePlus—Large Core Fund: The returns of the Fund’s Class A shares ranked in the 46th and 1st percentiles of its performance universe for the five-year and three-year periods ended December 31, 2016, respectively. The Committee noted that the Fund implemented a strategy change and a new portfolio management team in May 2013.
StylePlus—Mid Growth Fund: The returns of the Fund’s Class A shares ranked in the 31st and 13th percentiles of its performance universe for the five-year and three-year periods ended December 31, 2016, respectively. The Committee noted that the Fund implemented a strategy change and a new portfolio management team in May 2013.
3 | At a meeting held on August 20, 2015, the Board approved an investment management agreement dated November 17, 2015, between GPIM and the Trust, with respect to Diversified Income Fund, for an initial two-year term (the “Diversified Income Fund IMA”). The Committee determined to include the Diversified Income Fund IMA within the scope of its 2017 annual contract review in order to align the timing for review of such agreement with the process undertaken by the Committee for the Advisory Agreements, with respect to the other Funds, on a uniform schedule. |
4 | At a meeting held on November 10, 2015, the Board approved an investment management agreement dated November 17, 2015, between GPIM and the Trust, with respect to Market Neutral Real Estate Fund, for an initial two-year term (the “Market Neutral RE Fund IMA”). The Committee determined to include the Market Neutral RE Fund IMA within the scope of its 2017 annual contract review in order to align the timing for review of such agreement with the process undertaken by the Committee for the Advisory Agreements, with respect to the other Funds, on a uniform schedule. |
| 128 | THE GUGGENHEIM FUNDS ANNUAL REPORT | |
OTHER INFORMATION (Unaudited)(continued) |
Total Return Bond Fund: The Committee observed that the returns of the Fund’s Class A shares ranked in the 1st and 2nd percentiles of its performance universe for the five-year and three-year periods ended December 31, 2016, respectively, and exceeded the performance universe median for each of these periods.
World Equity Income Fund: The returns of the Fund’s Class A shares ranked in the 43rd and 14th percentiles of its performance universe for the five-year and three-year periods ended December 31, 2016, respectively. The Committee noted that the Fund implemented a strategy change and a new portfolio management team in August 2013.
Value Funds: Large Cap Value Fund, Mid Cap Value Fund, Mid Cap Value Institutional Fund and Small Cap Value Fund
Large Cap Value Fund: The returns of the Class A shares exceeded the performance universe median for the five-year and three-year periods ended December 31, 2016, and ranked in the 37th and 25th percentiles, respectively.
MidCap Value Fund: The returns of the Class A shares underperformed the performance universe median for the five-year and three-year periods ended December 31, 2016, ranking in the 69th and 62nd percentiles, respectively. The Committee noted measures taken by the Adviser to remedy longer-term relative underperformance with respect to the Value Funds strategy, including strategy enhancements such as implementation of a refined stock selection process and additional risk controls to enforce the strategy’s sell discipline. In light of the foregoing, the Committee also considered the more recent one-year period ended December 31, 2016, and observed that the return of the Fund’s Class A shares exceeded the median of its performance universe, ranking in the 7th percentile.
Mid Cap Value Institutional Fund: The Fund’s returns underperformed the performance universe median for the five-year and three-year periods ended December 31, 2016, ranking in the 63rd and 58th percentiles, respectively. The Committee noted measures taken by the Adviser to remedy longer-term relative underperformance with respect to the Value Funds strategy, including strategy enhancements such as implementation of a refined stock selection process and additional risk controls to enforce the strategy’s sell discipline. In light of the foregoing, the Committee also considered the more recent one-year period ended December 31, 2016, and observed that the Fund’s return exceeded the median of its performance universe, ranking in the 9th percentile.
Small Cap Value Fund: The returns of the Class A shares underperformed the performance universe median for the five-year and three-year periods ended December 31, 2016, and ranked in the 67th and 71st percentiles, respectively. The Committee noted measures taken by the Adviser to remedy longer-term relative underperformance with respect to the Value Funds strategy, including strategy enhancements such as implementation of a refined stock selection process and additional risk controls to enforce the strategy’s sell discipline. In light of the foregoing, the Committee also considered the more recent one-year period ended December 31, 2016, and observed that the return of the Fund’s Class A shares exceeded the median of its performance universe, ranking in the 35th percentile.
After reviewing the foregoing and related factors, the Committee concluded that each Fund’s performance was acceptable.
Municipal Income Fund: The Committee considered that Security Investors does not directly manage the investment portfolio but has delegated such duties to GPIM. Based on the information provided and the review of the Fund’s investment performance, the Committee concluded that Security Investors had appropriately reviewed and monitored GPIM’s investment performance as Sub-Adviser to the Fund.
Comparative Fees, Costs of Services Provided and the Profits Realized by each Adviser from Its Relationship with the Funds: The Committee compared each Fund’s contractual advisory fee and total net expense ratio to the applicable peer group. The Committee also reviewed the median advisory fees and expense ratios, including expense ratio components (e.g., transfer agency fees, administration fees, other operating expenses, distribution fees and fee waivers/reimbursements) of the peer group of funds. The Committee also reviewed aggregated advisory and administrative fees compared to the peer group average and median.
As part of its evaluation of each Fund’s advisory fee, the Committee considered how such fees compared to the advisory fee charged by the applicable Adviser to one or more other clients that it manages pursuant to similar investment strategies, to the extent applicable, noting that, in certain instances, Guggenheim charges a lower advisory fee to such other clients. In this connection, the Committee considered, among other things, Guggenheim’s representations about the significant differences between managing mutual funds as compared to other types of accounts. The Committee also considered Guggenheim’s explanation that lower fees are charged in certain instances due to various other factors, including the scope of contract, type of investors, differences in fee structure, applicable legal, governance and capital structures, tax
| | THE GUGGENHEIM FUNDS ANNUAL REPORT | 129 |
OTHER INFORMATION (Unaudited)(continued) |
status and historical pricing reasons. The Committee concluded that the information it received demonstrated that the aggregate services provided to each Fund at issue were sufficiently different from those provided to other clients with similar investment strategies and/or the risks borne by Guggenheim were sufficiently greater than those associated with managing other clients with similar investment strategies to support the difference in fees.
In further considering the comparative fee and expense data presented in the Contract Review Materials and addressed by Guggenheim, the Committee took into account those Funds with currently effective expense limitation agreements with the Adviser and made the following observations:
Alpha Opportunity Fund: The average contractual advisory fee percentile rank across all share classes of the Fund and the asset weighted total net expense ratio are in the second quartile (44th and 46th percentiles, respectively) of its peer group. The net effective management fee ranks in the third quartile (72nd percentile). The Committee considered the Adviser’s proposal, presented at the May Meeting, to reduce the Fund’s expense cap by 35 basis points across all share classes.
Diversified Income Fund: The average contractual advisory fee percentile rank across all share classes of the Fund and the net effective management fee5 are in the second quartile (35th and 27th percentiles, respectively) of its peer group and the asset weighted total net expense ratio is in the first quartile (1st percentile) of its peer group.
Floating Rate Strategies Fund: The average contractual advisory fee percentile rank across all share classes of the Fund is in fourth quartile (84th percentile) of its peer group and the net effective management fee is in the third quartile (69th percentile) of its peer group. The Fund’s asset weighted total net expense ratio is in the second quartile (48th percentile) of its peer group. The Committee considered the Fund’s strong performance and top decile performance universe rankings for the five- and three-year periods ended December 31, 2016.
High Yield Fund: The average contractual advisory fee percentile rank across all share classes of the Fund is in the second quartile (48th percentile) of its peer group and the net effective management fee is in the third quartile (75th percentile) of its peer group. The Fund’s asset weighted total net expense ratio is in the fourth quartile (81st percentile) of its peer group. The Committee considered the Fund’s strong performance and top decile performance universe rankings for the five- and three-year periods ended December 31, 2016.
Investment Grade Bond Fund: The average contractual advisory fee percentile rank across all share classes of the Fund, the net effective management fee and the asset weighted total net expense ratio each rank in the fourth quartile (85th, 89th and 94th percentiles, respectively) of its peer group. The Committee considered the Fund’s strong performance and top decile performance universe rankings for the five- and three-year periods ended December 31, 2016.
Large Cap Value Fund: The average contractual advisory fee percentile rank across all share classes of the Fund and the asset weighted total net expense ratio is in the second quartile (33rd and 39th percentiles, respectively) of its peer group. The net effective management fee is in the third quartile (55th percentile) of its peer group.
Limited Duration Fund: The net effective management fee is in the third quartile (71st percentile) of its peer group, as is the Fund’s asset weighted total net expense ratio (63rd percentile). The average contractual advisory fee percentile rank across all share classes of the Fund is in the fourth quartile (78th percentile). The Committee considered the Fund’s strong performance and top decile performance universe rankings for the three- and one-year periods ended December 31, 2016.
Macro Opportunities Fund: The average contractual advisory fee percentile rank across all share classes of the Fund and the net effective management fee rank in the fourth quartile (86th and 80th percentiles, respectively) of its peer group. The asset weighted total net expense ratio is in the third quartile (73rd percentile) of its peer group. The Committee noted that the Fund is categorized as a non-traditional bond fund which seeks to add value by investing in many non-traditional securities outside of fixed income, including equities, currencies, commodities and derivatives. In addition, the Committee considered the Fund’s strong performance and top decile performance universe rankings for the five- and three-year periods ended December 31, 2016.
5 | The “net effective management fee” for Alpha Opportunity Fund and each of the other Funds represents the combined effective advisory fee and administration fee as a percentage of average net assets for the latest fiscal year, after any waivers and/or reimbursements, based on the Fund’s class level peer group percent rank, weighted by class level assets under management. |
| 130 | THE GUGGENHEIM FUNDS ANNUAL REPORT | |
OTHER INFORMATION (Unaudited)(continued) |
Market Neutral Real Estate Fund: Each of the average contractual advisory fee percentile rank across all share classes of the Fund, the net effective management fee and the asset weighted total net expense ratio is in the third quartile (36th, 38th and 39th percentiles, respectively) of its peer group.
Mid Cap Value Fund: The average contractual advisory fee percentile rank across all share classes of the Fund is in the third quartile (71st percentile) of its peer group and the net effective management fee and asset weighted total net expense ratio are in the fourth quartile (76th and 86th percentiles, respectively) of its peer group as of December 31, 2016. The Committee noted that in November 2016 the Adviser recommended and the Board approved the elimination of the Fund’s advisory fee breakpoint and a reduction in the Fund’s contractual advisory fee from 1.00% to 0.75%, effective February 1, 2017, along with the conclusion that the reduction in the advisory fee would not result in any decrease in the nature, extent and quality of services provided to the Fund. Based upon the new contractual advisory fee rate, the Fund’s gross management fee6 peer group rankings would be 53rd percentile for Class A shares, 64th percentile for Class C shares, and 47th percentile for Class P shares.
Mid Cap Value Institutional Fund: The total net expense ratio is in the third quartile (68th percentile) and the contractual advisory fee and net effective management fee are in the fourth quartile (86th and 77th percentiles, respectively). The Committee considered the strategy enhancements implemented for the Fund and the Fund’s strong recent performance, including a top decile performance universe ranking for the one-year period ended December 31, 2016.
Municipal Income Fund: The average contractual advisory fee percentile rank across all share classes of the Fund and the asset weighted total net expense ratio are in the second quartile (49th and 27th percentiles, respectively) of its peer group and the net effective management fee is in the first quartile (22nd percentile).
Risk Managed Real Estate Fund: The average contractual advisory fee percentile rank across all share classes of the Fund is in the first quartile (23rd percentile) of its peer group and the net effective management fee and the asset weighted total net expense ratio are in the second quartile (50th and 28th percentiles, respectively) of its peer group.
StylePlus—Large Core Fund: The average contractual advisory fee percentile rank across all share classes of the Fund (58th percentile), the net effective management fee (75th percentile) and the asset weighted total net expense ratio (75th percentile) are in the third quartile of its peer group.
StylePlus—Mid Growth Fund: The average contractual advisory fee percentile rank across all share classes of the Fund is in the first quartile (25th percentile) of its peer group. The net effective management fee and asset weighted total net expense ratio are in the fourth quartile (77th and 85th percentiles, respectively) of its peer group.
Small Cap Value Fund: The average contractual advisory fee percentile rank across all share classes of the Fund is in the third quartile (72nd percentile) of its peer group and the net effective management fee is in the first quartile (16th percentile) as of December 31, 2016. The Fund’s asset weighted total net expense ratio is in the second quartile (36th percentile) of its peer group as of December 31, 2016. The Committee noted that in November 2016 the Adviser recommended and the Board approved a reduction in the Fund’s contractual advisory fee from 1.00% to 0.75%, effective February 1, 2017, along with the conclusion that the reduction in the advisory fee would not result in any decrease in the nature, extent and quality of services provided to the Fund. Based upon the new contractual advisory fee rate, the Fund’s gross management fee peer group rankings would be 25th percentile for Class A shares, 31st percentile for Class C shares, 18th percentile for Class I shares, and 29th percentile for Class P shares.
Total Return Bond Fund: The average contractual advisory fee percentile rank across all share classes of the Fund is in the fourth quartile (89th percentile) of its peer group and the net effective management fee and asset weighted total net expense ratio are in the second quartile (39th and 33rd percentiles, respectively) of its peer group. The Committee considered the Fund’s strong performance and top decile performance universe rankings for the five- and three-year periods ended December 31, 2016.
6 | The “gross management fee,” with respect to Mid Cap Value Fund and Small Cap Value Fund, is the sum of the advisory fee and the administration fee. |
| | THE GUGGENHEIM FUNDS ANNUAL REPORT | 131 |
OTHER INFORMATION (Unaudited)(continued) |
World Equity Income Fund: The average contractual advisory fee percentile rank across all share classes of the Fund and the net effective management fee are in the second quartile (32nd and 49th percentiles, respectively) of its peer group. The asset weighted total net expense ratio is in the third quartile (68th percentile) of its peer group. The Committee noted that in November 2016 the Adviser recommended and the Board approved a 24 basis point reduction in the Fund’s expense cap (across all share classes).
With respect to the costs of services provided and profits realized by Guggenheim Investments from its relationship with the Funds, the Committee reviewed a profitability analysis and data from management for each Fund setting forth the average assets under management for the twelve months ended December 31, 2016, ending assets under management of the Trust as of December 31, 2016, gross revenues received by Guggenheim Investments, expenses allocated to the Fund, expense waivers, earnings and the operating margin/profitability rate, including variance information relative to the foregoing amounts as of December 31, 2015. In addition, the Chief Financial Officer of Guggenheim Investments reviewed with, and addressed questions from, the Committee concerning the expense allocation methodology employed in producing the profitability analysis.
In the course of its review of Guggenheim Investments’ profitability, the Committee took into account the methods used by Guggenheim Investments to determine expenses and profit. The Committee also noted steps taken by management to refine its methodology in preparation for contract review, including, among other things, revisions to the process for allocating expenses for shared service functions, as previously reported to and discussed with the Board. The Committee considered all of the foregoing in evaluating the costs of services provided, the profitability to Guggenheim Investments and the profitability rates presented, and concluded that the profits were not unreasonable.
The Committee considered other benefits available to each Adviser because of its relationship with the Funds and noted Guggenheim’s statement that until the completion of the RFS Transaction on October 4, 2016, the Adviser may have benefited from arrangements whereby an affiliate received fees from the Funds for providing certain fund administration and transfer agency services. In addition, the Committee noted Guggenheim’s statement that it may benefit from marketing synergies arising from offering a broad spectrum of products, including the Funds.
Economies of Scale: The Committee received and considered information regarding whether there have been economies of scale with respect to the management of the Funds as Fund assets grow, whether the Funds have appropriately benefited from any economies of scale, and whether there is potential for realization of any further economies of scale. The Committee considered whether economies of scale in the provision of services to the Funds were being passed along to the shareholders. The Committee noted the Adviser’s statements, including that Guggenheim believes it is appropriately sharing potential economies of scale and that costs continue to increase in many key areas, including compensation of portfolio managers, key analysts and support staff, as well as for infrastructure needs, with respect to risk management oversight, valuation processes and disaster recovery systems, among other things, and that, in this regard, management’s costs for providing services have increased in recent years without regard to asset levels.
The Committee also noted the process employed by the Adviser to evaluate whether a breakpoint would be appropriate for a Fund, with consideration given to, among other things: (i) the Fund’s size and trends in asset levels over recent years; (ii) the competitiveness of the expense levels; (iii) whether expense waivers are in place; (iv) changes and trends in revenue and expenses; (v) whether there are any anticipated expenditures that may benefit the Fund in the future; (vi) Fund profit level margins; (vii) relative Fund performance; (viii) the nature, extent and quality of services management provides to the Fund; and (ix) the complexity of the Fund’s investment strategy and the resources required to support the Fund.
As part of its assessment of economies of scale, the Committee also considered Guggenheim’s view that it seeks to share economies of scale through a number of means, including expense limitations and/or advisory fees set at competitive rates pre-assuming future asset growth. Thus, the Committee considered the size of the Funds and the competitiveness of and/or other determinations made regarding the current advisory fee for each Fund, as well as whether a Fund is subject to an expense limitation. The Committee also took into account, the advisory fee breakpoints offered by the Adviser and approved by the Board with respect to several of the fixed income Funds, to take effect on May 1, 2017.
The Committee determined that, taking into account all relevant factors, the advisory fee for each Fund was reasonable.
Sub-Advisory Agreement
Nature, Extent and Quality of Services Provided by the Sub-Adviser: With respect to the nature, extent and quality of services provided by GPIM (referred to in this discussion as the “Sub-Adviser”), the Committee considered the qualifications, experience and skills of the Sub- Adviser’s portfolio management and other key personnel and information from the Sub-Adviser describing the scope of its services
| 132 | THE GUGGENHEIM FUNDS ANNUAL REPORT | |
OTHER INFORMATION (Unaudited)(concluded) |
to Municipal Income Fund. With respect to Guggenheim’s resources and the Sub-Adviser’s ability to carry out its responsibilities under the Sub-Advisory Agreement, as noted above, the Committee considered the financial condition of GPIMH. (Thereafter, the Committee received the audited consolidated financial statements of GPIM.)
The Committee also considered the acceptability of the terms of the Sub-Advisory Agreement. Based on the foregoing, and based on other information received (both oral and written) at the April Meeting and at the May Meeting, as well as other considerations, including the Committee’s knowledge of how the Sub-Adviser performs its duties obtained through Board meetings, discussions and reports throughout the year, the Committee concluded that the Sub-Adviser and its personnel were qualified to serve Municipal Income Fund in such capacity and may reasonably be expected to continue to provide a high quality of services under the Sub-Advisory Agreement.
Investment Performance: The Committee considered that the Fund’s Class A shares ranked in the third quartile (64th and 52nd percentiles) of its performance universe for the five-year and three-year periods ended December 31, 2016, respectively. The Committee concluded that the investment performance of the Fund and the Sub-Adviser was acceptable.
Comparative Fees, Costs of Services Provided and the Profits Realized by the Sub--Adviser from Its Relationship with the Fund: The Committee considered that the Sub-Advisory Agreement is with an affiliate of the Adviser, that the Adviser compensates the Sub-Adviser from its own fees so that the sub-advisory fee rate for the Fund does not impact the fees paid by the Fund and that the Sub-Adviser’s revenues were included in the calculation of Guggenheim Investments’ profitability. Given its determination of the reasonableness of the advisory fee, the Committee concluded that the sub-advisory fee rate for the Fund was reasonable.
Economies of Scale: The Committee recognized that, because the Sub--Adviser’s fees are paid by the Adviser and not the Fund, the analysis of economies of scale was more appropriate in the context of the Committee’s consideration of the applicable Advisory Agreement, which was separately considered. (See “Advisory Agreements – Economies of Scale” above.)
Overall Conclusions
Based on the foregoing, the Committee determined that the investment advisory fees are fair and reasonable in light of the extent and quality of the services provided and other benefits received and that the continuation of the Agreements is in the best interest of each Fund. In reaching this conclusion, no single factor was determinative or conclusive and each Committee member, in the exercise of his business judgment, may attribute different weights to different factors. At the May Meeting, the Committee, constituting all of the Independent Trustees, recommended the renewal of each Advisory Agreement and the Sub-Advisory Agreement for an additional annual term.
Thereafter, on May 24, 2017, the Board, including all of the Independent Trustees, approved the renewal of each of the Advisory Agreements and the Sub-Advisory Agreement for an additional annual term.
| | THE GUGGENHEIM FUNDS ANNUAL REPORT | 133 |
INFORMATION ON BOARD OF TRUSTEES AND OFFICERS (Unaudited) |
Name, Address*
and Year of Birth | Position(s)
Held with
the Trust | Term of Office and Length of Time Served** | Principal Occupation(s)
During Past Five Years | Number of Portfolios
in Fund Complex Overseen | Other Directorships
Held by Trustees |
| INDEPENDENT TRUSTEES | | | |
Randall C. Barnes
(1951) | Trustee | Since 2014 | Current: Private Investor (2001-present). Former: Senior Vice President and Treasurer, PepsiCo, Inc. (1993-1997); President, Pizza Hut International (1991-1993); Senior Vice President, Strategic Planning and New Business Development, PepsiCo, Inc. (1987-1990). | 96 | Current: Trustee, Purpose Investments Funds (2014-Present). |
Donald A. Chubb, Jr.
(1946) | Trustee and Chairman of the Valuation Oversight Committee | Since 1994 | Current: Retired. Former: Business broker and manager of commercial real estate, Griffith & Blair, Inc. (1997-2017). | 93 | Former: Midland Care, Inc. (2011-2016). |
Jerry B. Farley
(1946) | Trustee and Chair of the Audit Committee | Since 2005 | Current: President, Washburn University (1997-present). | 93 | Current: Westar Energy, Inc. (2004-present); CoreFirst Bank & Trust (2000-present). |
Roman Friedrich III
(1946) | Trustee and Chairman of the Contracts Review Committee | Since 2014 | Current: Founder and Managing Partner, Roman Friedrich & Company (1998-present). Former: Senior Managing Director, MLV & Co. LLC (2010-2011). | 93 | Current: Zincore Metals, Inc. (2009-present). Former: Axiom Gold and Silver Corp. (2011-2012). |
Robert B. Karn III
(1942) | Trustee | Since 2014 | Current: Consultant (1998-present). Former: Arthur Andersen (1965-1997) and Managing Partner, Financial and Economic Consulting, St. Louis office (1987-1997). | 93 | Current: GP Natural Resource Partners, LLC (2002- present). Former: Peabody Energy Company (2003- April 2017). |
Ronald A. Nyberg
(1953) | Trustee and Chairman of the Nominating and Governance Committee | Since 2014 | Current: Partner, Momkus McCluskey Roberts, LLC (2016-present). Former: Partner, Nyberg & Cassioppi, LLC (2000-2016); Executive Vice President, General Counsel, and Corporate Secretary, Van Kampen Investments (1982-1999). | 98 | Current: Edward-Elmhurst Healthcare System (2012-present). |
| 134 | THE GUGGENHEIM FUNDS ANNUAL REPORT | |
INFORMATION ON BOARD OF TRUSTEES AND OFFICERS (Unaudited)(continued) |
Name, Address*
and Year of Birth | Position(s)
Held with
the Trust | Term of Office and Length of Time Served** | Principal Occupation(s)
During Past Five Years | Number of Portfolios
in Fund Complex Overseen | Other Directorships
Held by Trustees |
| INDEPENDENT TRUSTEES - concluded | | |
Maynard F. Oliverius
(1943) | Trustee | Since 1998 | Current: Retired. Former: President and CEO, Stormont-Vail HealthCare (1996-2012). | 93 | Current: Robert J. Dole Institute of Politics (2016-present); Stormont-Vail Foundation (2013-present); University of Minnesota MHA Alumni Philanthropy Committee (2009-present); Fort Hays State University Foundation (1999-present). Former: Topeka Community Foundation (2009-2014). |
Ronald E. Toupin, Jr.
(1958) | Trustee and Chairman of the Board | Since 2014 | Current: Portfolio Consultant (2010-present). Former: Vice President, Manager and Portfolio Manager, Nuveen Asset Management (1998-1999); Vice President, Nuveen Investment Advisory Corp. (1992-1999); Vice President and Manager, Nuveen Unit Investment Trusts (1991-1999); and Assistant Vice President and Portfolio Manager, Nuveen Unit Investment Trusts (1988-1999), each of John Nuveen & Co., Inc. (1982-1999). | 95 | Former: Bennett Group of Funds (2011-2013). |
| INTERESTED TRUSTEE | |
Donald C. Cacciapaglia***
(1951) | Trustee | Since 2012 | Current: Vice Chairman, Guggenheim Investments (2010-present). Former: President and CEO, certain other funds in the Fund Complex (2012-November 2017); Chairman and CEO, Channel Capital Group, Inc. (2002-2010). | 226 | Current: Clear Spring Life Insurance Company (2015-present); Guggenheim Partners Japan, Ltd. (2014-present); Guggenheim Partners Investment Management Holdings, LLC (2014-present); Delaware Life (2013-present); Guggenheim Life and Annuity Company (2011-present); Paragon Life Insurance Company of Indiana (2011-present). |
| * | The business address of each Trustee is c/o Guggenheim Investments, 227 West Monroe Street, Chicago, Illinois 60606. |
| ** | Each Trustee serves an indefinite term, until his successor is elected and qualified. Time served includes time served in the respective position for the Predecessor Corporation. |
| *** | This Trustee is deemed to be an "interested person" of the Funds under the 1940 Act by reason of his position with the Funds' Investment Manager and/or the parent of the Investment Manager. |
| | THE GUGGENHEIM FUNDS ANNUAL REPORT | 135 |
INFORMATION ON BOARD OF TRUSTEES AND OFFICERS (Unaudited)(continued) |
Name, Address*
and Year of Birth | Position(s)
Held with
the Trust | Term of Office and Length of Time Served** | Principal Occupations
During Past Five Years |
| OFFICERS | | | |
Joanna M. Catalucci
(1966) | AML Officer | Since 2016 | Current: Chief Compliance Officer, certain funds in the Fund Complex (2012-present); Senior Managing Director, Guggenheim Investments (2014-present); AML Officer, certain funds in the Fund Complex (2016-present). Former: Chief Compliance Officer and Secretary, certain other funds in the Fund Complex (2008-2012); Senior Vice President & Chief Compliance Officer, Security Investors, LLC and certain affiliates (2010-2012); Chief Compliance Officer and Senior Vice President, Rydex Advisors, LLC and certain affiliates (2010-2011). |
James M. Howley
(1972) | Assistant Treasurer | Since 2014 | Current: Managing Director, Guggenheim Investments (2004-present) ; Assistant Treasurer, certain other funds in the Fund Complex (2006-present). Former: Manager of Mutual Fund Administration, Van Kampen Investments, Inc. (1996-2004). |
Keith D. Kemp
(1960) | Assistant Treasurer | Since 2016 | Current: Treasurer and Assistant Treasurer, certain other funds in the Fund Complex (2010-present); Managing Director, Guggenheim Investments (2015-present); Chief Financial Officer, Guggenheim Specialized Products, LLC (2016-present). Former: Managing Director and Director, Transparent Value, LLC (2010-2016); Director, Guggenheim Partners Investment Management, LLC (2010-2015); Chief Operating Officer, Macquarie Capital Investment Management (2007-2009). |
Amy J. Lee
(1961) | President, Chief Executive Officer, and Chief Legal Officer | Since
November 2017 (President and Chief Executive Officer) Since 2014 (Chief Legal Officer) | Current: President and Chief Executive Officer, certain other funds in the Fund Complex (November 2017-present); Chief Legal Officer, certain other funds in the Fund Complex (2014-present); Senior Managing Director, Guggenheim Investments (2012-present). Former: Vice President, Associate General Counsel and Assistant Secretary, Security Benefit Life Insurance Company and Security Benefit Corporation (2004-2012). |
Mark E. Mathiasen
(1978) | Secretary | Since 2014 | Current: Secretary, certain other funds in the Fund Complex (2007-present); Managing Director, Guggenheim Investments (2007-present). |
Glenn McWhinnie
(1969) | Assistant Treasurer | Since 2016 | Current: Vice President, Guggenheim Investments (2009-present). Former: Tax Compliance Manager, Ernst & Young LLP (1996-2009). |
Michael P. Megaris
(1984) | Assistant Secretary | Since 2014 | Current: Assistant Secretary, certain other funds in the Fund Complex (2014-present); Vice President, Guggenheim Investments (2012-present). Former: J.D., University of Kansas School of Law (2009-2012). |
| 136 | THE GUGGENHEIM FUNDS ANNUAL REPORT | |
INFORMATION ON BOARD OF TRUSTEES AND OFFICERS (Unaudited)(concluded) |
Name, Address*
and Year of Birth | Position(s)
Held with
the Trust | Term of Office and Length of Time Served** | Principal Occupations
During Past Five Years |
| OFFICERS - concluded | |
Elisabeth Miller
(1968) | Chief Compliance Officer | Since 2012 | Current: CCO, certain other funds in the Fund Complex (2012-present); CCO, Security Investors, LLC (2012-present); CCO, Guggenheim Funds Investment Advisors, LLC (2012-present); Managing Director, Guggenheim Investments (2012-present); Vice President, Guggenheim Funds Distributors, LLC (2014-present). Former: CCO, Guggenheim Distributors, LLC (2009-2014); Senior Manager, Security Investors, LLC (2004-2009); Senior Manager, Guggenheim Distributors, LLC (2004-2009). |
Adam J. Nelson
(1979) | Assistant Treasurer | Since 2015 | Current: Vice President, Guggenheim Investments (2015-present); Assistant Treasurer, certain other funds in the Fund Complex (2015-present). Former: Assistant Vice President and Fund Administration Director, State Street Corporation (2013-2015); Fund Administration Assistant Director, State Street (2011-2013); Fund Administration Manager, State Street (2009-2011). |
Kimberly J. Scott
(1974) | Assistant Treasurer | Since 2014 | Current: Director, Guggenheim Investments (2012-present) ; Assistant Treasurer, certain other funds in the Fund Complex (2012-present). Former: Financial Reporting Manager, Invesco, Ltd. (2010-2011); Vice President/Assistant Treasurer of Mutual Fund Administration, Van Kampen Investments, Inc./Morgan Stanley Investment Management (2009-2010); Manager of Mutual Fund Administration, Van Kampen Investments, Inc./Morgan Stanley Investment Management (2005-2009). |
Bryan Stone
(1979) | Vice President | Since 2014 | Current: Vice President, certain other funds in the Fund Complex (2014-present); Director, Guggenheim Investments (2013-present). Former: Senior Vice President, Neuberger Berman Group LLC (2009-2013); Vice President, Morgan Stanley (2002-2009). |
John L. Sullivan
(1955) | Chief Financial Officer and Treasurer | Since 2014 | Current: CFO, Chief Accounting Officer and Treasurer, certain other funds in the Fund Complex (2010-present); Senior Managing Director, Guggenheim Investments (2010-present). Former: Managing Director and CCO, each of the funds in the Van Kampen Investments fund complex (2004-2010); Managing Director and Head of Fund Accounting and Administration, Morgan Stanley Investment Management (2002-2004); CFO and Treasurer, Van Kampen Funds (1996-2004). |
Jon Szafran (1989) | Assistant Treasurer | Since
November 2017 | Current: Vice President, Guggenheim Investments (July 2017-present); Assistant Treasurer, certain other funds in the Fund Complex (November 2017-present). Former: Assistant Treasurer of Henderson Global Funds and Manager of US Fund Administration, Henderson Global Investors (North America) Inc. (“HGINA”), (February-June 2017); Senior Analyst of US Fund Administration, HGINA (2014-January 2017); Senior Associate of Fund Administration, Cortland Capital Market Services, LLC (2013-2014); Experienced Associate, PricewaterhouseCoopers LLP (2012-2013). |
| * | The business address of each officer is c/o Guggenheim Investments, 227 West Monroe Street, Chicago, Illinois 60606. |
| ** | Each officer serves an indefinite term, until his or her successor is duly elected and qualified. Time served includes time served in the respective position for the Predecessor Corporation. |
| | THE GUGGENHEIM FUNDS ANNUAL REPORT | 137 |
GUGGENHEIM INVESTMENTS PRIVACY POLICIES (Unaudited) |
Guggenheim Investments as used herein refers to Guggenheim Partners, LLC, Guggenheim Funds Investment Advisors, LLC, Guggenheim Partners Investment Management, LLC, Guggenheim Funds Distributors, LLC and Security Investors, LLC as well as the funds in the Guggenheim Funds complex (the “funds”).
Our Commitment to You
When you become a Guggenheim Investments investor, you entrust us with not only your hard-earned money but also with personal and financial information about you. We recognize that your relationship with us is based on trust and that you expect us to act responsibly and in your best interests. Because we have access to personal information about you, we hold ourselves to high standards in its safekeeping and use. This means, most importantly, that we do not sell client or account information to anyone—whether you are a current or former Guggenheim Investments client.
The Information We Collect About You and How We Collect It
In the course of doing business with shareholders and investors, we collect nonpublic personal information about you. You typically provide personal information when you complete a Guggenheim Investments account application or when you request a transaction that involves Rydex and Guggenheim Funds or one of the Guggenheim affiliated companies. “Nonpublic personal information” is personally identifiable information about you. For example it includes your name and address, Social Security or taxpayer identification number, assets, income, account balance, bank account information and investment activity (e.g. purchase and redemption history).
How We Share Your Personal Information
As a matter of policy, we do not disclose your nonpublic personal information to nonaffiliated third parties except as required or permitted by law. As emphasized above, we do not sell information about current or former clients or their accounts to third parties. Nor do we share such information, except when necessary to complete transactions at your request or to make you aware of related investment products and services that we offer. Additional details about how we handle your personal information are provided below.
To complete certain transactions or account changes that you direct, it may be necessary to provide your personal information to companies, individuals or groups that are not affiliated with Guggenheim Investments. For example if you ask to transfer assets from another financial institution to Guggenheim Investments, we will need to provide certain information about you to that company to complete the transaction. In connection with servicing your accounts or to alert you to other Guggenheim Investments investment products and services, we may share your information within the Guggenheim Investments family of affiliated companies. This would include, for example, sharing your information within Guggenheim Investments so we can make you aware of new funds or the services offered through another Guggenheim Investments affiliated company. In certain instances, we may contract with nonaffiliated companies to perform services for us. Where necessary, we will disclose information we have about you to these third parties. In all such cases, we provide the third party with only the information necessary to carry out its assigned responsibilities and only for that purpose. And we require these third parties to treat your personal information with the same high degree of confidentiality that we do. In certain instances, we may share information with other financial institutions regarding individuals and entities in response to the U.S.A. Patriot Act. Finally we will share personal information about you if we are compelled by law to do so, if you direct us to do so with your consent, or in other circumstances as permitted by law.
How We Safeguard Your Personal Information
We maintain physical, electronic and procedural safeguards to protect your personal information. Within Guggenheim Investments, access to such information is limited to those who need it to perform their jobs such as servicing your account, resolving problems or informing you of new products and services.
| 138 | THE GUGGENHEIM FUNDS ANNUAL REPORT | |
This page intentionally left blank.
This page intentionally left blank.
This page intentionally left blank.
9.30.2017
Guggenheim Funds Annual Report
| Guggenheim Mid Cap Value Fund | | |
| GuggenheimInvestments.com | SBMCV-ANN-0917x0918 |
| DEAR SHAREHOLDER | 2 |
| ECONOMIC AND MARKET OVERVIEW | 3 |
| ABOUT SHAREHOLDERS’ FUND EXPENSES | 5 |
| MID CAP VALUE FUND | 8 |
| NOTES TO FINANCIAL STATEMENTS | 23 |
| REPORT OF INDEPENDENT REGISTERED PUBLIC ACCOUNTING FIRM | 32 |
| OTHER INFORMATION | 33 |
| INFORMATION ON BOARD OF TRUSTEES AND OFFICERS | 49 |
| GUGGENHEIM INVESTMENTS PRIVACY POLICIES | 56 |
| | THE GUGGENHEIM FUNDS ANNUAL REPORT | 1 |
Dear Shareholder:
Security Investors, LLC, (the “Investment Adviser”) is pleased to present the shareholder report for Guggenheim Mid Cap Value Fund (the “Fund”) for the annual fiscal period ended September 30, 2017.
The Investment Adviser is part of Guggenheim Investments, which represents the investment management businesses of Guggenheim Partners, LLC (“Guggenheim”), a global, diversified financial services firm.
Guggenheim Funds Distributors, LLC is the distributor of the Fund. Guggenheim Funds Distributors, LLC is affiliated with Guggenheim and the Investment Adviser.
We encourage you to read the Economic and Market Overview section of the report, which follows this letter, and then the Managers’ Commentary for the Fund.
We are committed to providing innovative investment solutions and appreciate the trust you place in us.
Sincerely,
Security Investors, LLC
October 31, 2017
Read a prospectus and summary prospectus (if available) carefully before investing. It contains the investment objectives, risks, charges, expenses and other information, which should be considered carefully before investing. Obtain a prospectus and summary prospectus (if available) at guggenheiminvestments.com or call 800.820.0888.
This material is not intended as a recommendation or as investment advice of any kind, including in connection with rollovers, transfers, and distributions. Such material is not provided in a fiduciary capacity, may not be relied upon for or in connection with the making of investment decisions, and does not constitute a solicitation of an offer to buy or sell securities. All content has been provided for informational or educational purposes only and is not intended to be and should not be construed as legal or tax advice and/or a legal opinion. Always consult a financial, tax and/ or legal professional regarding your specific situation.
Mid Cap Value Fund may not be suitable for all investors. ● An investment in the Fund will fluctuate and is subject to investment risks, which means investors could lose money. ● The intrinsic value of the underlying stocks may never be realized, or the stock may decline in value. ● Investments in small- and/or mid-sized company securities may present additional risks such as less predictable earnings, higher volatility and less liquidity than larger, more established companies.
| 2 | THE GUGGENHEIM FUNDS ANNUAL REPORT | |
ECONOMIC AND MARKET OVERVIEW (Unaudited) | September 30, 2017 |
Over the past few months, the equity markets have faced massive hurricanes in the South, rising tensions with North Korea and ongoing uncertainty surrounding domestic policy. Despite it all, the major stock indices continue to trade at or near record levels. The market’s resiliency seems to underscore that, at the end of the day, it’s fundamentals that drive equity markets and not political headlines or geopolitical tensions.
A noticeable shift in market sentiment during the third quarter led to a rotation into cyclical and small capitalization stocks. Value factors also began to outperform in September, a significant change from year-to-date performance. From a macro standpoint, the primary drivers of the value trade include rising inflationary expectations, economic growth and the prospects of tax reform.
Outside the U.S., both the European and emerging markets outperformed the Standard & Poor’s 500® (“S&P 500”) Index* on a dollar denominated basis. Renewed interest in both regions reflected attractive relative valuation and the synchronized global economic expansion.
Assuming no major geopolitical or other unforeseen shocks, we expect the U.S. economy will grow by between 2.0–2.5% in real terms in 2017 and 2018, supported by a strong labor market at home, a synchronized upswing in the global economy, and favorable financial conditions. Risks to our growth outlook are to the upside if Washington delivers on promises to cut taxes. Third quarter economic data was less distorted by the recent hurricanes than expected, and rebuilding efforts should be a positive for growth heading into 2018.
The labor market is steadily tightening, as seen in the drop in the unemployment rate to a cycle low of 4.2% in September, underscoring the robust—and unsustainable—underlying trend in hiring. Leading indicators, including hiring intentions surveys, point to further declines in the unemployment rate. Meanwhile, inflation continues to be well below the U.S. Federal Reserve’s (the “Fed”) 2% longer-run goal, with core personal consumption expenditure inflation coming in at 1.3% in September. However, inflation lags Gross Domestic Product (“GDP”) growth by about six quarters; because growth has accelerated over the past year, and the dollar has depreciated, inflation will likely move closer to 2% by the second quarter of 2018.
The firming U.S. economy, coupled with synchronized global growth and stabilization in the U.S. dollar, is likely to be supportive of the U.S. earnings environment. On the valuation front, while elevated relative to long-term averages, multiples still remain well below extreme levels. Economic and financial conditions are supportive enough for the Fed to continue to resume a quarterly pattern of rate increases in December, and to begin balance sheet normalization this year. Interest rates are expected to remain supportive of risk assets.
For the 12 months ended September 30, 2017, the S&P 500 returned 18.61%. The MSCI Europe-Australasia-Far East (“EAFE”) Index* returned 19.10%. The return of the MSCI Emerging Markets Index* was 22.46%.
| | THE GUGGENHEIM FUNDS ANNUAL REPORT | 3 |
ECONOMIC AND MARKET OVERVIEW (Unaudited)(concluded) | September 30, 2017 |
In the bond market, the Bloomberg Barclays U.S. Aggregate Bond Index* posted a 0.07% return for the period, while the Bloomberg Barclays U.S. Corporate High Yield Index* returned 8.88%. The return of the Bank of America (“BofA”) Merrill Lynch 3-Month U.S. Treasury Bill Index* was 0.66% for the 12-month period.
The opinions and forecasts expressed may not actually come to pass. This information is subject to change at any time, based on market and other conditions, and should not be construed as a recommendation of any specific security or strategy.
*Index Definitions
Indices are unmanaged and not available for direct investment. Index performance does not reflect transaction costs, fees, or expenses.
Bloomberg Barclays U.S. Aggregate Bond Index is a broad-based flagship benchmark that measures the investment grade, U.S. dollar-denominated, fixed-rate taxable bond market, including U.S. Treasuries, government-related and corporate securities, mortgage-backed securities or “MBS” (agency fixed-rate and hybrid adjustable-rate mortgage, or “ARM”, pass-throughs), asset-backed securities (“ABS”), and commercial mortgage-backed securities (“CMBS”) (agency and non-agency).
Bloomberg Barclays U.S. Corporate High Yield Index measures the U.S. dollar-denominated, high yield, fixed-rate corporate bond market. Securities are classified as high yield if the middle rating of Moody’s, Fitch, and S&P is Ba1/BB +/BB + or below.
BofA Merrill Lynch 3-Month U.S. Treasury Bill Index is an unmanaged market Index of U.S. Treasury securities maturing in 90 days that assumes reinvestment of all income.
MSCI EAFE Index is a capitalization-weighted measure of stock markets in Europe, Australasia, and the Far East.
MSCI Emerging Markets Index is a free float-adjusted market capitalization-weighted index that is designed to measure equity market performance in the global emerging markets.
Russell 2500® Value Index measures the performance of the small-to mid-cap value segment of the U.S. equity universe. It includes those Russell 2500 companies with lower price-to-book ratios and lower forecasted growth values.
S&P 500® Index is a broad-based index, the performance of which is based on the performance of 500 widely held common stocks chosen for market size, liquidity, and industry group representation.
| 4 | THE GUGGENHEIM FUNDS ANNUAL REPORT | |
ABOUT SHAREHOLDERS’ FUND EXPENSES (Unaudited) |
All mutual funds have operating expenses, and it is important for our shareholders to understand the impact of costs on their investments. Shareholders of a fund incur two types of costs: (i) transaction costs, including sales charges (loads) on purchase payments, reinvested dividends, other distributions, and exchange fees, and (ii) ongoing costs, including management fees, administrative services, and shareholder reports, among others. These ongoing costs, or operating expenses, are deducted from a fund’s gross income and reduce the investment return of the fund.
A fund’s expenses are expressed as a percentage of its average net assets, which is known as the expense ratio. The following examples are intended to help investors understand the ongoing costs (in dollars) of investing in a fund and to compare these costs with the ongoing costs of investing in other mutual funds.
The examples are based on an investment of $1,000 made at the beginning of the period and held for the entire six-month period beginning March 31, 2017 and ending September 30, 2017.
The following tables illustrate the Fund’s costs in two ways:
Table 1. Based on actual Fund return: This section helps investors estimate the actual expenses paid over the period. The “Ending Account Value” shown is derived from the Fund’s actual return, and the fifth column shows the dollar amount that would have been paid by an investor who started with $1,000 in the Fund. Investors may use the information here, together with the amount invested, to estimate the expenses paid over the period. Simply divide the Fund’s account value by $1,000 (for example, an $8,600 account value divided by $1,000 = 8.6), then multiply the result by the number provided under the heading “Expenses Paid During Period.”
Table 2. Based on hypothetical 5% return: This section is intended to help investors compare a Fund’s cost with those of other mutual funds. The table provides information about hypothetical account values and hypothetical expenses based on the Fund’s actual expense ratio and an assumed rate of return of 5% per year before expenses, which is not the Fund’s actual return. The hypothetical account values and expenses may not be used to estimate the actual ending account balance or expenses paid during the period. The example is useful in making comparisons because the U.S. Securities and Exchange Commission (the “SEC”) requires all mutual funds to calculate expenses based on the 5% return. Investors can assess a Fund’s costs by comparing this hypothetical example with the hypothetical examples that appear in shareholder reports of other funds.
The calculations illustrated above assume no shares were bought or sold during the period. Actual costs may have been higher or lower, depending on the amount of investment and the timing of any purchases or redemptions.
| | THE GUGGENHEIM FUNDS ANNUAL REPORT | 5 |
ABOUT SHAREHOLDERS’ FUND EXPENSES (Unaudited)(continued) |
Please note that the expenses shown in the table are meant to highlight your ongoing costs only and do not reflect any transactional costs, such as sales charges (loads) on purchase payments, and contingent deferred sales charges (“CDSC”) on redemptions, if any. Therefore, the second table is useful in comparing ongoing costs only, and will not help you determine the relative total costs of owning different funds. In addition, if these transactional costs were included, your costs would have been higher.
More information about the Fund’s expenses, including annual expense ratios for periods up to five years (subject to the Fund’s inception date), can be found in the Financial Highlights section of this report. For additional information on operating expenses and other shareholder costs, please refer to the Fund’s prospectus.
| 6 | THE GUGGENHEIM FUNDS ANNUAL REPORT | |
ABOUT SHAREHOLDERS’ FUND EXPENSES (Unaudited)(concluded) |
| Expense
Ratio1 | Fund
Return | Beginning
Account Value
March 31,
2017 | Ending
Account Value
September 30,
2017 | Expenses
Paid During
Period2 |
Table 1. Based on actual Fund return3 |
| Mid Cap Value Fund |
| A-Class | 1.22% | 5.93% | $ 1,000.00 | $ 1,059.30 | $ 6.30 |
| C-Class | 1.99% | 5.49% | 1,000.00 | 1,054.90 | 10.25 |
| P-Class | 1.21% | 5.91% | 1,000.00 | 1,059.10 | 6.25 |
| | | | | | |
| Table 2. Based on hypothetical 5% return (before expenses) |
| Mid Cap Value Fund | | | | | |
| A-Class | 1.22% | 5.00% | $ 1,000.00 | $ 1,018.95 | $ 6.17 |
| C-Class | 1.99% | 5.00% | 1,000.00 | 1,015.09 | 10.05 |
| P-Class | 1.21% | 5.00% | 1,000.00 | 1,019.00 | 6.12 |
1 | Annualized and excludes expenses of the underlying funds in which the Fund invests. |
2 | Expenses are equal to the Fund's annualized expense ratio, net of any applicable fee waivers, multiplied by the average account value over the period, multiplied by 183/365 (to reflect the one-half year period). |
3 | Actual cumulative return at net asset value for the period March 31, 2017 to September 30, 2017. |
| | THE GUGGENHEIM FUNDS ANNUAL REPORT | 7 |
MANAGERS’ COMMENTARY (Unaudited) | September 30, 2017 |
To Our Shareholders:
Guggenheim Mid Cap Value Fund (the “Fund”) is managed by a team of seasoned professionals led by James Schier, CFA, Managing Director and Senior Portfolio Manager; Scott Hammond, Managing Director and Portfolio Manager; Farhan Sharaff, Assistant Chief Investment Officer, Equities, and Portfolio Manager; Gregg Strohkorb, CFA, Portfolio Manager; and David Toussaint, CFA, CPA, Director and Senior Equity Research Analyst. In the following paragraphs, the team discusses performance of the Fund for the fiscal year ended September 30, 2017.
For the year ended September 30, 2017, the Guggenheim Mid Cap Value Fund returned 20.62%1, compared with the 15.75% return of its benchmark, the Russell 2500 Value Index.
Strategy and Market Overview
Our investment approach focuses on understanding how companies make money and how easily companies can improve returns, maintain existing high levels of profitability, or benefit from change that occurs within the industries in which they operate. In today’s rapidly changing environment marked by very sharp and quick, but constrained volatility, our long-term orientation and discipline are a competitive advantage. This should become especially critical when the environment of indiscriminant valuation expansion subsides, and fundamentals once again become a more dominant factor in the market.
Performance Review
Most of the performance differential was due to positive stock selection in Financials and Industrials. Negative impact from stock selection in the Tech sector was more than offset by a contribution from its overweight relative to the benchmark. An overweight in Consumer Staples detracted, but was more than offset by positive stock selection in that sector.
Among the top individual contributors on an absolute basis were Zions Bancorporation, Keycorp, and Wintrust Financial Corp. The strategy’s asset-sensitive bank holdings performed particularly well as short term interest rates were hiked three times during the period.
The leading individual detractors from the Fund’s return on an absolute basis were energy names, affected by the volatility in oil prices over the period, including Whiting Petroleum Corp., Chesapeake Energy Corp., and Gulfport Energy Corp.
Portfolio Positioning
While this strategy is very balanced relative to the benchmark, it does possess defensive characteristics in virtue of emphasizing relatively larger companies found in the benchmark as well as modest overweights in health care and utilities.
The largest relative sector exposures for the year were an underweight in Financials, which detracted from return for the year, and an overweight in Utilities, which contributed to return.
| 8 | THE GUGGENHEIM FUNDS ANNUAL REPORT | |
MANAGERS’ COMMENTARY (Unaudited)(concluded) | September 30, 2017 |
Portfolio and Market Outlook
As the period began, election results drove the market, as investors discounted the possibility of a stronger economy brought about by reduced regulation and tax cuts, and became comfortable with the notion that any interest rate increases would be gradual. While optimism that the President’s agenda would be quickly enacted faded in the early part of 2017, it was renewed in the middle of the year, helped by talk of tax cuts and a solid U.S. economy. The market has remained resilient and buoyant. We believe the bias in the market will continue to be to the upside, but expect volatility could likely resurface.
Our portfolios tend to reflect a bias toward companies with balance sheet quality. We continue to find niche companies with what we believe to be attractive growth opportunities, and, as such, are constructive on the outlook.
Performance displayed represents past performance which is no guarantee of future results.
1 | Performance figures are based on Class A shares and do not reflect taxes that a shareholder would pay on distributions or the redemption of shares. |
The opinions and forecast expressed may not actually come to pass. This information is subject to change at any time, based on market and other conditions, and should not be construed as a recommendation of any specific security or strategy.
| | THE GUGGENHEIM FUNDS ANNUAL REPORT | 9 |
PERFORMANCE REPORT AND FUND PROFILE (Unaudited) | September 30, 2017 |
MID CAP VALUE FUND
Holdings Diversification (Market Exposure as % of Net Assets)
“Holdings Diversification (Market Exposure as % of Net Assets)” excludes any temporary cash investments.
| Inception Dates: |
| A-Class | May 1, 1997 |
| C-Class | January 29, 1999 |
| P-Class | May 1, 2015 |
| Ten Largest Holdings (% of Total Net Assets) |
| Zions Bancorporation | 2.4% |
| KeyCorp | 2.2% |
| WestRock Co. | 2.1% |
| Wintrust Financial Corp. | 2.0% |
| OGE Energy Corp. | 1.7% |
| Huntington Bancshares, Inc. | 1.6% |
| Emergent BioSolutions, Inc. | 1.6% |
| Carlisle Companies, Inc. | 1.5% |
| PVH Corp. | 1.5% |
| Unum Group | 1.5% |
| Top Ten Total | 18.1% |
| “Ten Largest Holdings” excludes any temporary cash investments. |
10 | THE GUGGENHEIM FUNDS ANNUAL REPORT | |
PERFORMANCE REPORT AND FUND PROFILE (Unaudited)(concluded) | September 30, 2017 |
Cumulative Fund Performance*
Average Annual Returns*
Periods Ended September 30, 2017
| 1 Year | 5 Year | 10 Year |
| A-Class Shares | 20.62% | 12.05% | 7.71% |
A-Class Shares with sales charge† | 14.89% | 10.96% | 7.07% |
| C-Class Shares | 19.63% | 11.20% | 6.91% |
C-Class Shares with CDSC§ | 18.63% | 11.20% | 6.91% |
| Russell 2500 Value Index | 15.75% | 13.25% | 7.59% |
| | 1 Year | Since Inception
(05/01/15) |
| P-Class Shares | | 20.57% | 10.21% |
| Russell 2500 Value Index | | 15.75% | 8.82% |
| * | The performance data above represents past performance that is not predictive of future results. The investment return and principal value of an investment in the Fund will fluctuate so that an investor’s shares, when redeemed, may be worth more or less than their original cost. Returns are historical and include changes in principal and reinvested dividends and capital gains and do not reflect the effect of taxes. The Russell 2500 Value Index is an unmanaged index and, unlike the Fund, has no management fees or operating expenses to reduce its reported return. The graph is based on A-Class shares only; performance for C-Class and P-Class will vary due to difference in fee structures. |
† | Effective February 22, 2011, the maximum sales charge decreased from 5.75% to 4.75%. A 5.75% maximum sales charge is used in the calculation of the 1 Year, 5 Year and 10 Year average annual returns (based on subscriptions made prior to February 22, 2011), and a 4.75% maximum sales charge will be used to calculate performance for periods based on subscriptions made on or after February 22, 2011. |
§ | Fund returns include a CDSC of 1% if redeemed within 12 months of purchase. |
| | THE GUGGENHEIM FUNDS ANNUAL REPORT | 11 |
| SCHEDULE OF INVESTMENTS | September 30, 2017 |
| MID CAP VALUE FUND | |
| | | Shares | | | Value | |
| | | | | | | |
COMMON STOCKS† - 97.8% | |
| | | | | | | |
| Financial - 29.0% | |
| Zions Bancorporation | | | 257,324 | | | $ | 12,140,547 | |
| KeyCorp | | | 593,073 | | | | 11,161,634 | |
| Wintrust Financial Corp. | | | 128,582 | | | | 10,069,256 | |
| Huntington Bancshares, Inc. | | | 587,475 | | | | 8,201,151 | |
| Unum Group | | | 152,454 | | | | 7,794,973 | |
| E*TRADE Financial Corp.* | | | 171,255 | | | | 7,468,430 | |
| Radian Group, Inc. | | | 345,826 | | | | 6,463,488 | |
| Equity Commonwealth REIT* | | | 211,651 | | | | 6,434,191 | |
| First American Financial Corp. | | | 128,697 | | | | 6,430,989 | |
| Alexandria Real Estate Equities, Inc. REIT | | | 43,643 | | | | 5,192,208 | |
| Prosperity Bancshares, Inc. | | | 73,237 | | | | 4,813,868 | |
| Alleghany Corp.* | | | 8,225 | | | | 4,556,732 | |
| Howard Hughes Corp.* | | | 37,553 | | | | 4,428,625 | |
| Cousins Properties, Inc. REIT | | | 450,768 | | | | 4,210,173 | |
| Sun Communities, Inc. REIT | | | 49,124 | | | | 4,208,944 | |
| EastGroup Properties, Inc. REIT | | | 45,858 | | | | 4,041,007 | |
| IBERIABANK Corp. | | | 46,833 | | | | 3,847,331 | |
| Lexington Realty Trust REIT | | | 305,773 | | | | 3,125,000 | |
| National Storage Affiliates Trust REIT | | | 127,313 | | | | 3,086,067 | |
| Redwood Trust, Inc. REIT | | | 183,428 | | | | 2,988,042 | |
| Customers Bancorp, Inc.* | | | 84,893 | | | | 2,769,210 | |
| Camden Property Trust REIT | | | 30,148 | | | | 2,757,035 | |
| Piedmont Office Realty Trust, Inc. — Class A REIT | | | 129,331 | | | | 2,607,313 | |
| Umpqua Holdings Corp. | | | 132,309 | | | | 2,581,349 | |
| LaSalle Hotel Properties REIT | | | 88,742 | | | | 2,575,293 | |
| DCT Industrial Trust, Inc. REIT | | | 43,087 | | | | 2,495,599 | |
| First Industrial Realty Trust, Inc. REIT | | | 81,846 | | | | 2,462,746 | |
| Popular, Inc. | | | 68,265 | | | | 2,453,444 | |
| CoreCivic, Inc. REIT | | | 82,972 | | | | 2,221,160 | |
| Federal Agricultural Mortgage Corp. — Class C | | | 27,313 | | | | 1,986,748 | |
| Physicians Realty Trust REIT | | | 68,047 | | | | 1,206,473 | |
| Total Financial | | | | | | | 146,779,026 | |
| | | | | | | | | |
| Industrial - 17.4% | |
| WestRock Co. | | | 185,477 | | | | 10,522,111 | |
| Carlisle Companies, Inc. | | | 78,205 | | | | 7,843,180 | |
| Crane Co. | | | 84,101 | | | | 6,727,239 | |
| Covenant Transportation Group, Inc. — Class A* | | | 220,735 | | | | 6,396,900 | |
| Harris Corp. | | | 41,737 | | | | 5,495,928 | |
| Celadon Group, Inc. | | | 754,880 | | | | 5,095,440 | |
| Oshkosh Corp. | | | 56,483 | | | | 4,662,107 | |
| Scorpio Tankers, Inc. | | | 1,225,835 | | | | 4,204,614 | |
| FLIR Systems, Inc. | | | 100,054 | | | | 3,893,101 | |
| Kirby Corp.* | | | 57,341 | | | | 3,781,639 | |
| Owens-Illinois, Inc.* | | | 132,137 | | | | 3,324,567 | |
| Gentex Corp. | | | 141,289 | | | | 2,797,522 | |
| ITT, Inc. | | | 62,668 | | | | 2,774,312 | |
| Dycom Industries, Inc.* | | | 31,470 | | | | 2,702,644 | |
| Valmont Industries, Inc. | | | 16,650 | | | | 2,632,365 | |
| Crown Holdings, Inc.* | | | 43,784 | | | | 2,614,780 | |
| Golar LNG Ltd. | | | 112,363 | | | | 2,540,527 | |
| US Concrete, Inc.* | | | 32,243 | | | | 2,460,141 | |
| Fabrinet* | | | 66,364 | | | | 2,459,450 | |
| GasLog Ltd. | | | 117,256 | | | | 2,046,117 | |
| American Outdoor Brands Corp.* | | | 108,021 | | | | 1,647,320 | |
| TriMas Corp.* | | | 56,886 | | | | 1,535,922 | |
| Total Industrial | | | | | | | 88,157,926 | |
| | | | | | | | | |
| Consumer, Cyclical - 11.2% | |
| PVH Corp. | | | 62,095 | | | | 7,827,695 | |
| UniFirst Corp. | | | 51,219 | | | | 7,759,679 | |
12 | THE GUGGENHEIM FUNDS ANNUAL REPORT | SEE NOTES TO FINANCIAL STATEMENTS. |
SCHEDULE OF INVESTMENTS (continued) | September 30, 2017 |
| MID CAP VALUE FUND | |
| | | Shares | | | Value | |
| | | | | | | |
| DR Horton, Inc. | | | 192,435 | | | $ | 7,683,929 | |
| American Eagle Outfitters, Inc. | | | 430,820 | | | | 6,160,726 | |
| Goodyear Tire & Rubber Co. | | | 128,617 | | | | 4,276,515 | |
| Caleres, Inc. | | | 114,701 | | | | 3,500,675 | |
| Deckers Outdoor Corp.* | | | 46,980 | | | | 3,213,902 | |
| GMS, Inc.* | | | 84,945 | | | | 3,007,053 | |
| PACCAR, Inc. | | | 40,635 | | | | 2,939,536 | |
| CalAtlantic Group, Inc. | | | 77,252 | | | | 2,829,741 | |
| Unifi, Inc.* | | | 66,241 | | | | 2,360,167 | |
| JetBlue Airways Corp.* | | | 126,845 | | | | 2,350,438 | |
| Penske Automotive Group, Inc. | | | 28,239 | | | | 1,343,329 | |
| Asbury Automotive Group, Inc.* | | | 21,468 | | | | 1,311,695 | |
| Total Consumer, Cyclical | | | | | | | 56,565,080 | |
| | | | | | | | | |
| Consumer, Non-cyclical - 11.0% | |
| Emergent BioSolutions, Inc.* | | | 196,152 | | | | 7,934,349 | |
| Perrigo Company plc | | | 74,614 | | | | 6,316,076 | |
| Bunge Ltd. | | | 69,993 | | | | 4,861,714 | |
| Hormel Foods Corp. | | | 143,383 | | | | 4,608,329 | |
| Myriad Genetics, Inc.* | | | 113,534 | | | | 4,107,660 | |
| Premier, Inc. — Class A* | | | 124,090 | | | | 4,041,611 | |
| Dermira, Inc.* | | | 147,075 | | | | 3,971,025 | |
| Sanderson Farms, Inc. | | | 23,361 | | | | 3,773,269 | |
| Acadia Healthcare Company, Inc.* | | | 70,950 | | | | 3,388,572 | |
| Eagle Pharmaceuticals, Inc.* | | | 52,957 | | | | 3,158,355 | |
| HealthSouth Corp. | | | 64,208 | | | | 2,976,041 | |
| Fresh Del Monte Produce, Inc. | | | 48,817 | | | | 2,219,221 | |
| ACCO Brands Corp.* | | | 137,976 | | | | 1,641,914 | |
| SP Plus Corp.* | | | 33,188 | | | | 1,310,926 | |
| Quest Diagnostics, Inc. | | | 13,575 | | | | 1,271,163 | |
| Total Consumer, Non-cyclical | | | | 55,580,225 | |
| | | | | | | | | |
| Utilities - 10.4% | |
| OGE Energy Corp. | | | 232,818 | | | | 8,388,432 | |
| Ameren Corp. | | | 113,039 | | | | 6,538,176 | |
| Avista Corp. | | | 123,279 | | | | 6,382,154 | |
| Portland General Electric Co. | | | 124,750 | | | | 5,693,590 | |
| Black Hills Corp. | | | 75,090 | | | | 5,171,448 | |
| Pinnacle West Capital Corp. | | | 59,980 | | | | 5,071,909 | |
| UGI Corp. | | | 88,586 | | | | 4,151,140 | |
| Calpine Corp.* | | | 278,143 | | | | 4,102,609 | |
| AES Corp. | | | 349,829 | | | | 3,855,116 | |
| ONE Gas, Inc. | | | 43,958 | | | | 3,237,067 | |
| Total Utilities | | | | | | | 52,591,641 | |
| | | | | | | | | |
| Energy - 6.4% | |
| Rowan Companies plc — Class A* | | | 448,805 | | | | 5,767,145 | |
| Andeavor | | | 49,344 | | | | 5,089,834 | |
| Marathon Oil Corp. | | | 339,473 | | | | 4,603,254 | |
| Whiting Petroleum Corp.* | | | 705,618 | | | | 3,852,674 | |
| Oasis Petroleum, Inc.* | | | 404,334 | | | | 3,687,526 | |
| Hess Corp. | | | 59,710 | | | | 2,799,802 | |
| Range Resources Corp. | | | 126,451 | | | | 2,474,646 | |
| MRC Global, Inc.* | | | 81,949 | | | | 1,433,288 | |
| WildHorse Resource Development Corp.* | | | 105,589 | | | | 1,406,445 | |
| Gulfport Energy Corp.* | | | 90,204 | | | | 1,293,525 | |
| Total Energy | | | | | | | 32,408,139 | |
| | | | | | | | | |
| Communications - 4.8% | |
| Scripps Networks Interactive, Inc. — Class A | | | 68,419 | | | | 5,876,507 | |
| Infinera Corp.* | | | 507,849 | | | | 4,504,621 | |
| Ciena Corp.* | | | 156,637 | | | | 3,441,315 | |
| Finisar Corp.* | | | 148,244 | | | | 3,286,569 | |
| Viavi Solutions, Inc.* | | | 347,381 | | | | 3,286,224 | |
| Time, Inc. | | | 181,671 | | | | 2,452,559 | |
| Oclaro, Inc.* | | | 159,958 | | | | 1,380,438 | |
| Total Communications | | | | | | | 24,228,233 | |
| | | | | | | | | |
| Technology - 3.8% | |
| CSRA, Inc. | | | 164,143 | | | | 5,296,894 | |
| Qorvo, Inc.* | | | 62,174 | | | | 4,394,459 | |
| Cray, Inc.* | | | 211,248 | | | | 4,108,773 | |
| Maxwell Technologies, Inc.* | | | 578,897 | | | | 2,969,742 | |
| SEE NOTES TO FINANCIAL STATEMENTS. | THE GUGGENHEIM FUNDS ANNUAL REPORT | 13 |
SCHEDULE OF INVESTMENTS (continued) | September 30, 2017 |
| MID CAP VALUE FUND | |
| | | Shares | | | Value | |
| | | | | | | |
| Cirrus Logic, Inc.* | | | 48,704 | | | $ | 2,596,897 | |
| Total Technology | | | | | | | 19,366,765 | |
| | | | | | | | | |
| Basic Materials - 3.8% | |
| Nucor Corp. | | | 110,347 | | | | 6,183,845 | |
| Reliance Steel & Aluminum Co. | | | 68,300 | | | | 5,202,411 | |
| Westlake Chemical Corp. | | | 46,660 | | | | 3,876,980 | |
| Olin Corp. | | | 74,493 | | | | 2,551,385 | |
| United States Steel Corp. | | | 56,292 | | | | 1,444,453 | |
| Total Basic Materials | | | | | | | 19,259,074 | |
| | | | | | | | | |
| Total Common Stocks | | | | | | | | |
| (Cost $415,477,116) | | | | | | | 494,936,109 | |
| | | | | | | | | |
CONVERTIBLE PREFERRED STOCKS††† - 0.0% | |
Thermoenergy Corp.*,1,2 | | | 858,334 | | | | 8 | |
| Total Convertible Preferred Stocks | | | | | |
| (Cost $819,654) | | | | | | | 8 | |
| | | | | | | | | |
MONEY MARKET FUND† - 2.2% | |
Dreyfus Treasury Securities Cash Management Fund — Institutional Class 0.90%3 | | | 11,310,472 | | | | 11,310,472 | |
| Total Money Market Fund | | | | | | | | |
| (Cost $11,310,472) | | | | | | | 11,310,472 | |
| | | | | | | | | |
| Total Investments - 100.0% | | | | | |
| (Cost $427,607,242) | | | | | | $ | 506,246,589 | |
| Other Assets & Liabilities, net - 0.0% | | | | (127,229 | ) |
| Total Net Assets - 100.0% | | | | | | $ | 506,119,360 | |
| * | Non-income producing security. |
† | Value determined based on Level 1 inputs — See Note 4. |
††† | Value determined based on Level 3 inputs — See Note 4. |
1 | Security was fair valued by the Valuation Committee at September 30, 2017. The total market value of fair valued securities amounts to $8, (cost $819,654) or 0.0% of total net assets. |
2 | PIPE (Private Investment in Public Equity) — Stock issued by a company in the secondary market as a means of raising capital more quickly and less expensively than through registration of a secondary public offering. |
3 | Rate indicated is the 7 day yield as of September 30, 2017. |
| | plc — Public Limited Company |
| | REIT — Real Estate Investment Trust |
| | |
| | See Sector Classification in Other Information section. |
14 | THE GUGGENHEIM FUNDS ANNUAL REPORT | SEE NOTES TO FINANCIAL STATEMENTS. |
SCHEDULE OF INVESTMENTS (concluded) | September 30, 2017 |
| MID CAP VALUE FUND | |
The following table summarizes the inputs used to value the Fund’s investments at September 30, 2017 (See Note 4 in the Notes to Financial Statements):
| Investments in Securities (Assets) | | Level 1
Quoted
Prices | | | Level 2
Significant
Observable
Inputs | | | Level 3
Significant
Unobservable Inputs | | | Total | |
| Common Stocks | | $ | 494,936,109 | | | $ | — | | | $ | — | | | $ | 494,936,109 | |
| Convertible Preferred Stocks | | | — | | | | — | | | | 8 | | | | 8 | |
| Money Market Fund | | | 11,310,472 | | | | — | | | | — | | | | 11,310,472 | |
| Total Assets | | $ | 506,246,581 | | | $ | — | | | $ | 8 | | | $ | 506,246,589 | |
Transfers between investment levels may occur as the markets fluctuate and/or the availability of data used in an investment’s valuation changes. Transfers between valuation levels, if any, are in comparison to the valuation levels at the end of the previous fiscal year, and are effective using the fair value as of the end of the current fiscal period.
For the year ended September 30, 2017, there were no transfers between levels.
| SEE NOTES TO FINANCIAL STATEMENTS. | THE GUGGENHEIM FUNDS ANNUAL REPORT | 15 |
| STATEMENT OF ASSETS AND LIABILITIES |
| MID CAP VALUE FUND |
September 30, 2017
| Assets: | |
| Investments, at value (cost $427,607,242) | | $ | 506,246,589 | |
| Cash | | | 3,090 | |
| Prepaid expenses | | | 37,413 | |
| Receivables: | |
| Securities sold | | | 3,274,240 | |
| Dividends | | | 557,243 | |
| Fund shares sold | | | 24,282 | |
| Interest | | | 4,935 | |
| Total assets | | | 510,147,792 | |
| | | | | |
| Liabilities: | |
| Payable for: | |
| Securities purchased | | | 2,222,068 | |
| Fund shares redeemed | | | 669,377 | |
| Management fees | | | 271,984 | |
| Distribution and service fees | | | 154,669 | |
| Trustees’ fees* | | | 32,579 | |
| Fund accounting/administration fees | | | 32,511 | |
| Transfer agent/maintenance fees | | | 26,259 | |
| Due to advisor | | | 7,184 | |
| Miscellaneous | | | 611,801 | |
| Total liabilities | | | 4,028,432 | |
| Net assets | | $ | 506,119,360 | |
| | | | | |
| Net assets consist of: | |
| Paid in capital | | $ | 393,258,480 | |
| Accumulated net investment loss | | | — | |
| Accumulated net realized gain on investments | | | 34,221,533 | |
| Net unrealized appreciation on investments | | | 78,639,347 | |
| Net assets | | $ | 506,119,360 | |
| | | | | |
| A-Class: | |
| Net assets | | $ | 396,407,598 | |
| Capital shares outstanding | | | 11,208,524 | |
| Net asset value per share | | $ | 35.37 | |
| Maximum offering price per share (Net asset value divided by 95.25%) | | $ | 37.13 | |
| | | | | |
| C-Class: | |
| Net assets | | $ | 87,508,400 | |
| Capital shares outstanding | | | 3,323,108 | |
| Net asset value per share | | $ | 26.33 | |
| | | | | |
| P-Class: | |
| Net assets | | $ | 22,203,362 | |
| Capital shares outstanding | | | 631,751 | |
| Net asset value per share | | $ | 35.15 | |
| * | Relates to Trustees not deemed “interested persons” within the meaning of Section 2(a) (19) of the 1940 Act. |
16 | THE GUGGENHEIM FUNDS ANNUAL REPORT | SEE NOTES TO FINANCIAL STATEMENTS. |
| STATEMENT OF OPERATIONS |
| MID CAP VALUE FUND |
Year Ended September 30, 2017
| Investment Income: | |
| Dividends (net of foreign withholding tax of $27,589) | | $ | 7,148,495 | |
| Interest | | | 36,334 | |
| Total investment income | | | 7,184,829 | |
| | | | | |
| Expenses: | |
| Management fees | | | 4,083,532 | |
| Distribution and service fees: | |
| A-Class | | | 1,044,151 | |
| C-Class | | | 946,038 | |
| P-Class | | | 25,384 | |
| Transfer agent/maintenance fees: | |
| A-Class | | | 368,941 | |
| C-Class | | | 127,102 | |
| P-Class | | | 6,172 | |
| Fund accounting/administration fees | | | 418,769 | |
| Line of credit fees | | | 100,063 | |
| Custodian fees | | | 10,715 | |
| Trustees’ fees* | | | 2,735 | |
| Recoupment of previously waived fees: | |
| A-Class | | | 6,151 | |
| C-Class | | | 842 | |
| P-Class | | | 191 | |
| Miscellaneous | | | 272,127 | |
| Total expenses | | | 7,412,913 | |
| Less: | |
| Expenses reimbursed by Adviser: | | | | |
| A-Class | | | (17,463 | ) |
| C-Class | | | (4,051 | ) |
| P-Class | | | (1,017 | ) |
| Expenses waived by Adviser | | | (10,875 | ) |
| Total waived/reimbursed expenses | | | (33,406 | ) |
| Net expenses | | | 7,379,507 | |
| Net investment loss | | | (194,678 | ) |
| | | | | |
| Net Realized and Unrealized Gain (Loss): | |
| Net realized gain (loss) on: | |
| Investments | | | 81,130,196 | |
| Net realized gain | | | 81,130,196 | |
| Net change in unrealized appreciation (depreciation) on: | |
| Investments | | | 16,183,764 | |
| Net change in unrealized appreciation (depreciation) | | | 16,183,764 | |
| Net realized and unrealized gain | | | 97,313,960 | |
| Net increase in net assets resulting from operations | | $ | 97,119,282 | |
| * | Relates to Trustees not deemed “interested persons” within the meaning of Section 2(a) (19) of the 1940 Act. |
| SEE NOTES TO FINANCIAL STATEMENTS. | THE GUGGENHEIM FUNDS ANNUAL REPORT | 17 |
| STATEMENTS OF CHANGES IN NET ASSETS |
| MID CAP VALUE FUND | |
| | | Year Ended
September 30,
2017 | | | Year Ended
September 30,
2016 | |
| Increase (Decrease) in Net Assets from Operations: | | | | | | |
| Net investment income (loss) | | $ | (194,678 | ) | | $ | 4,724,687 | |
| Net realized gain on investments | | | 81,130,196 | | | | 17,533,078 | |
| Net change in unrealized appreciation (depreciation) on investments | | | 16,183,764 | | | | 53,021,430 | |
| Net increase in net assets resulting from operations | | | 97,119,282 | | | | 75,279,195 | |
| | | | | | | | | |
| Distributions to shareholders from: | | | | | | | | |
| Net investment income | | | | | | | | |
| A-Class | | | (4,950,405 | ) | | | — | |
| C-Class | | | (780,189 | ) | | | — | |
| P-Class | | | (49,828 | ) | | | — | |
| Net realized gains | | | | | | | | |
| A-Class | | | (8,613,768 | ) | | | (71,175,868 | ) |
| C-Class | | | (2,669,531 | ) | | | (23,558,203 | ) |
| P-Class | | | (67,525 | ) | | | (15,730 | ) |
| Total distributions to shareholders | | | (17,131,246 | ) | | | (94,749,801 | ) |
| | | | | | | | | |
| Capital share transactions: | | | | | | | | |
| Proceeds from sale of shares | | | | | | | | |
| A-Class | | | 33,025,435 | | | | 32,844,791 | |
| C-Class | | | 5,060,778 | | | | 5,397,137 | |
| P-Class | | | 21,412,776 | | | | 4,471,143 | |
| Distributions reinvested | | | | | | | | |
| A-Class | | | 12,673,600 | | | | 65,228,180 | |
| C-Class | | | 3,069,526 | | | | 20,922,534 | |
| P-Class | | | 117,352 | | | | 15,730 | |
| Cost of shares redeemed | | | | | | | | |
| A-Class | | | (121,812,207 | ) | | | (156,281,880 | ) |
| C-Class | | | (32,586,919 | ) | | | (45,239,145 | ) |
| P-Class | | | (4,311,641 | ) | | | (1,301,763 | ) |
| Net decrease from capital share transactions | | | (83,351,300 | ) | | | (73,943,273 | ) |
| Net decrease in net assets | | | (3,363,264 | ) | | | (93,413,879 | ) |
| | | | | | | | | |
| Net assets: | | | | | | | | |
| Beginning of year | | | 509,482,624 | | | | 602,896,503 | |
| End of year | | $ | 506,119,360 | | | $ | 509,482,624 | |
| Accumulated net investment loss/Undistributed net investment income at end of year | | $ | — | | | $ | 5,780,421 | |
18 | THE GUGGENHEIM FUNDS ANNUAL REPORT | SEE NOTES TO FINANCIAL STATEMENTS. |
STATEMENTS OF CHANGES IN NET ASSETS (concluded) |
| MID CAP VALUE FUND | |
| | | Year Ended
September 30,
2017 | | | Year Ended
September 30,
2016 | |
| Capital share activity: | | | | | | |
| Shares sold | | | | | | |
| A-Class | | | 1,025,109 | | | | 1,179,023 | |
| C-Class | | | 210,740 | | | | 256,114 | |
| P-Class | | | 649,430 | | | | 157,411 | |
| Shares issued from reinvestment of distributions | | | | | | | | |
| A-Class | | | 398,539 | | | | 2,398,977 | |
| C-Class | | | 128,809 | | | | 1,015,657 | |
| P-Class | | | 3,715 | | | | 581 | |
| Shares redeemed | | | | | | | | |
| A-Class | | | (3,691,342 | ) | | | (5,552,921 | ) |
| C-Class | | | (1,325,827 | ) | | | (2,098,789 | ) |
| P-Class | | | (134,810 | ) | | | (46,438 | ) |
| Net decrease in shares | | | (2,735,637 | ) | | | (2,690,385 | ) |
| SEE NOTES TO FINANCIAL STATEMENTS. | THE GUGGENHEIM FUNDS ANNUAL REPORT | 19 |
| FINANCIAL HIGHLIGHTS |
| MID CAP VALUE FUND | |
This table is presented to show selected data for a share outstanding throughout each period and to assist shareholders in evaluating a Fund’s performance for the periods presented.
| A-Class | | Year Ended
Sept. 30,
2017 | | | Year Ended
Sept. 30,
2016 | | | Year Ended
Sept. 30,
2015 | | | Year Ended
Sept. 30,
2014 | | | Year Ended
Sept. 30,
2013 | |
| Per Share Data | | | | | | | | | | | | | | | |
| Net asset value, beginning of period | | $ | 30.27 | | | $ | 30.86 | | | $ | 37.73 | | | $ | 38.15 | | | $ | 33.05 | |
| Income (loss) from investment operations: | |
Net investment income (loss)a | | | (.03 | ) | | | .30 | | | | .06 | | | | .03 | | | | .04 | |
| Net gain (loss) on investments (realized and unrealized) | | | 6.09 | | | | 3.95 | | | | (2.24 | ) | | | 2.04 | | | | 8.59 | |
| Total from investment operations | | | 6.12 | | | | 4.25 | | | | (2.18 | ) | | | 2.07 | | | | 8.63 | |
| Less distributions from: | |
| Net investment income | | | (.37 | ) | | | — | | | | — | | | | — | | | | — | |
| Net realized gains | | | (.65 | ) | | | (4.84 | ) | | | (4.69 | ) | | | (2.49 | ) | | | (3.53 | ) |
| Total distributions | | | (1.02 | ) | | | (4.84 | ) | | | (4.69 | ) | | | (2.49 | ) | | | (3.53 | ) |
| Net asset value, end of period | | $ | 35.37 | | | $ | 30.27 | | | $ | 30.86 | | | $ | 37.73 | | | $ | 38.15 | |
| | |
Total Returnb | | | 20.62 | % | | | 15.51 | % | | | (6.83 | %) | | | 5.52 | % | | | 28.93 | % |
| Ratios/Supplemental Data | |
| Net assets, end of period (in thousands) | | $ | 396,408 | | | $ | 407,883 | | | $ | 476,792 | | | $ | 1,017,208 | | | $ | 1,038,762 | |
| Ratios to average net assets: | |
| Net investment income (loss) | | | 0.11 | % | | | 1.04 | % | | | 0.18 | % | | | 0.08 | % | | | 0.11 | % |
Total expensesf | | | 1.27 | %g | | | 1.49 | % | | | 1.42 | % | | | 1.39 | % | | | 1.39 | % |
Net expensesc | | | 1.27 | %d | | | 1.49 | % | | | 1.42 | % | | | 1.39 | % | | | 1.39 | % |
| Portfolio turnover rate | | | 55 | % | | | 52 | % | | | 84 | % | | | 35 | % | | | 23 | % |
20 | THE GUGGENHEIM FUNDS ANNUAL REPORT | SEE NOTES TO FINANCIAL STATEMENTS. |
FINANCIAL HIGHLIGHTS (continued) |
| MID CAP VALUE FUND | |
This table is presented to show selected data for a share outstanding throughout each period and to assist shareholders in evaluating a Fund’s performance for the periods presented.
| C-Class | | Year Ended
Sept. 30,
2017 | | | Year Ended
Sept. 30,
2016 | | | Year Ended
Sept. 30,
2015 | | | Year Ended
Sept. 30,
2014 | | | Year Ended
Sept. 30,
2013 | |
| Per Share Data | | | | | | | | | | | | | | | |
| Net asset value, beginning of period | | $ | 22.78 | | | $ | 24.54 | | | $ | 31.14 | | | $ | 32.13 | | | $ | 28.57 | |
| Income (loss) from investment operations: | |
Net investment income (loss)a | | | (.17 | ) | | | .06 | | | | (.15 | ) | | | (.21 | ) | | | (.18 | ) |
| Net gain (loss) on investments (realized and unrealized) | | | 4.55 | | | | 3.02 | | | | (1.76 | ) | | | 1.71 | | | | 7.27 | |
| Total from investment operations | | | 4.38 | | | | 3.08 | | | | (1.91 | ) | | | 1.50 | | | | 7.09 | |
| Less distributions from: | |
| Net investment income | | | (.18 | ) | | | — | | | | — | | | | — | | | | — | |
| Net realized gains | | | (.65 | ) | | | (4.84 | ) | | | (4.69 | ) | | | (2.49 | ) | | | (3.53 | ) |
| Total distributions | | | (.83 | ) | | | (4.84 | ) | | | (4.69 | ) | | | (2.49 | ) | | | (3.53 | ) |
| Net asset value, end of period | | $ | 26.33 | | | $ | 22.78 | | | $ | 24.54 | | | $ | 31.14 | | | $ | 32.13 | |
| | |
Total Returnb | | | 19.63 | % | | | 14.64 | % | | | (7.49 | %) | | | 4.74 | % | | | 27.98 | % |
| Ratios/Supplemental Data | |
| Net assets, end of period (in thousands) | | $ | 87,508 | | | $ | 98,176 | | | $ | 126,047 | | | $ | 192,942 | | | $ | 219,695 | |
| Ratios to average net assets: | |
| Net investment income (loss) | | | (0.68 | %) | | | 0.27 | % | | | (0.53 | %) | | | (0.65 | %) | | | (0.62 | %) |
Total expensesf | | | 2.07 | %g | | | 2.27 | % | | | 2.12 | % | | | 2.12 | % | | | 2.12 | % |
Net expensesc | | | 2.06 | %d | | | 2.27 | % | | | 2.12 | % | | | 2.12 | % | | | 2.12 | % |
| Portfolio turnover rate | | | 55 | % | | | 52 | % | | | 84 | % | | | 35 | % | | | 23 | % |
| SEE NOTES TO FINANCIAL STATEMENTS. | THE GUGGENHEIM FUNDS ANNUAL REPORT | 21 |
FINANCIAL HIGHLIGHTS (concluded) |
| MID CAP VALUE FUND | |
This table is presented to show selected data for a share outstanding throughout each period and to assist shareholders in evaluating a Fund’s performance for the periods presented.
| P-Class | | Year Ended
Sept. 30,
2017 | | | Year Ended
Sept. 30,
2016 | | | Period Ended
Sept. 30,
2015e | |
| Per Share Data | | | | | | | | | |
| Net asset value, beginning of period | | $ | 30.18 | | | $ | 30.77 | | | $ | 33.91 | |
| Income (loss) from investment operations: | |
Net investment income (loss)a | | | (.01 | ) | | | .14 | | | | .10 | |
| Net gain (loss) on investments (realized and unrealized) | | | 6.10 | | | | 4.11 | | | | (3.24 | ) |
| Total from investment operations | | | 6.09 | | | | 4.25 | | | | (3.14 | ) |
| Less distributions from: | |
| Net investment income | | | (.47 | ) | | | — | | | | — | |
| Net realized gains | | | (.65 | ) | | | (4.84 | ) | | | — | |
| Total distributions | | | (1.12 | ) | | | (4.84 | ) | | | — | |
| Net asset value, end of period | | $ | 35.15 | | | $ | 30.18 | | | $ | 30.77 | |
| | |
Total Returnb | | | 20.57 | % | | | 15.61 | % | | | (9.26 | %) |
| Ratios/Supplemental Data | |
| Net assets, end of period (in thousands) | | $ | 22,203 | | | $ | 3,423 | | | $ | 57 | |
| Ratios to average net assets: | |
| Net investment income (loss) | | | 0.02 | % | | | 0.48 | % | | | 0.71 | % |
Total expensesf | | | 1.25 | %g | | | 1.32 | % | | | 1.32 | % |
Net expensesc | | | 1.23 | %d | | | 1.32 | % | | | 1.32 | % |
| Portfolio turnover rate | | | 55 | % | | | 52 | % | | | 84 | % |
a | Net investment income (loss) per share was computed using average shares outstanding throughout the period. |
b | Total return does not reflect the impact of any applicable sales charges and has not been annualized. |
c | Net expense information reflects the expense ratios after expense waivers and reimbursements, as applicable. |
d | The portion of the ratios of net expenses to average net assets attributable to recoupments of prior fee reductions or expense reimbursements is less than 0.01% for each share class. |
e | Since commencement of operations: May 1, 2015. Percentage amounts for the period, except total return and portfolio turnover rate, have been annualized. |
f | Does not include expenses of the underlying funds in which the Fund invests. |
g | Net expenses may include expenses that are excluded from the expense limitation agreement and affiliated fund waivers. Excluding these expenses, the net expense ratios for the year would be: |
| 09/30/17 |
| A-Class | 1.25% |
| C-Class | 2.04% |
| P-Class | 1.21% |
22 | THE GUGGENHEIM FUNDS ANNUAL REPORT | SEE NOTES TO FINANCIAL STATEMENTS. |
| NOTES TO FINANCIAL STATEMENTS |
Note 1 – Organization and Significant Accounting Policies
Organization
Guggenheim Funds Trust (the “Trust”), a Delaware statutory trust, is registered with the SEC under the Investment Company Act of 1940 (“1940 Act”), as an open-ended investment company of the series type. Each series, in effect, is representing a separate Fund. The Trust is authorized to issue an unlimited number of shares. The Trust accounts for the assets of each Fund separately.
The Trust offers a combination of five separate classes of shares, A-Class shares, C-Class shares, P-Class shares, R6-Class shares and Institutional Class shares. Sales of shares of each Class are made without a front-end sales charge at the net asset value per share (“NAV”), with the exception of A-Class shares. A-Class shares are sold at the NAV, plus the applicable front-end sales charge. The sales charge varies depending on the amount purchased. A-Class share purchases of $1 million or more are exempt from the front-end sales charge but have a 1% contingent deferred sales charge (“CDSC”), if shares are redeemed within 12 months of purchase. C-Class shares have a 1% CDSC if shares are redeemed within 12 months of purchase. Institutional Class shares are offered primarily for direct investment by institutions such as pension and profit sharing plans, endowments, foundations and corporations. Institutional Class shares require a minimum initial investment of $2 million and a minimum account balance of $1 million. At September 30, 2017, the Trust consisted of nineteen funds (the “Funds”).
This report covers the Mid Cap Value Fund (the “Fund”), a diversified investment company. Only A-Class, C-Class and P-Class shares had been issued by the Fund.
Security Investors, LLC which operates under the name Guggenheim Investments (“GI”), provides advisory services. Guggenheim Funds Distributors, LLC (“GFD”) acts as principal underwriter for the Trust. GI and GFD are affiliated entities.
Significant Accounting Policies
The Fund operates as an investment company and, accordingly, follows the investment company accounting and reporting guidance of the Financial Accounting Standards Board (“FASB”) Accounting Standards Codification Topic 946 Financial Services – Investment Companies.
The following significant accounting policies are in conformity with U.S. generally accepted accounting principles (“U.S. GAAP”) and are consistently followed by the Trust. This requires management to make estimates and assumptions that affect the reported amount of assets and liabilities, contingent assets and liabilities at the date of the financial statements, and the reported amounts of revenues and expenses during the reporting period. Actual results could differ from these estimates. All time references are based on Eastern Time.
The NAV of each Class of the Fund is calculated by dividing the market value of the Fund’s securities and other assets, less all liabilities, attributable to the Class by the number of outstanding shares of the Class.
| | THE GUGGENHEIM FUNDS ANNUAL REPORT | 23 |
NOTES TO FINANCIAL STATEMENTS (continued) |
(a) Valuation of Investments
The Board of Trustees of the Fund (the “Board”) has adopted policies and procedures for the valuation of the Fund’s investments (the “Valuation Procedures”). Pursuant to the Valuation Procedures, the Board has delegated to a valuation committee, consisting of representatives from Guggenheim’s investment management, fund administration, legal and compliance departments (the “Valuation Committee”), the day-to-day responsibility for implementing the Valuation Procedures, including, under most circumstances, the responsibility for determining the fair value of the Fund’s securities and/or other assets.
Valuations of the Fund’s securities are supplied primarily by pricing services appointed pursuant to the processes set forth in the Valuation Procedures. The Valuation Committee convenes monthly, or more frequently as needed, to review the valuation of all assets which have been fair valued for reasonableness. The Fund’s officers, through the Valuation Committee and consistent with the monitoring and review responsibilities set forth in the Valuation Procedures, regularly review procedures used and valuations provided by the pricing services.
If the pricing service cannot or does not provide a valuation for a particular investment or such valuation is deemed unreliable, such investment is fair valued by the Valuation Committee.
Equity securities listed on an exchange (New York Stock Exchange (“NYSE”) or American Stock Exchange) are valued at the last quoted sale price as of the close of business on the NYSE, usually 4:00 p.m. on the valuation date. Equity securities listed on the NASDAQ market system are valued at the NASDAQ Official Closing Price on the valuation date, which may not necessarily represent the last sale price. If there has been no sale on such exchange or NASDAQ on a given day, the security is valued at the closing bid price on that day.
Open-end investment companies (“Mutual Funds”) are valued at their NAV as of the close of business, on the valuation date.
Investments for which market quotations are not readily available are fair-valued as determined in good faith by GI under the direction of the Board using methods established or ratified by the Board. Valuations in accordance with these methods are intended to reflect each security’s (or asset’s) “fair value”. Each such determination is based on a consideration of all relevant factors, which are likely to vary from one pricing context to another. Examples of such factors may include, but are not limited to market prices; sale prices; broker quotes; and models which derive prices based on inputs such as prices of securities with comparable maturities and characteristics, or based on inputs such as anticipated cash flows or collateral, spread over Treasuries, and other information analysis.
(b) Foreign Taxes
The Fund may be subject to foreign taxes (a portion of which may be reclaimable) on income, stock dividends, capital gains on investments or certain foreign currency transactions. All foreign taxes are recorded in accordance with the applicable foreign tax regulations and rates that exist
| 24 | THE GUGGENHEIM FUNDS ANNUAL REPORT | |
NOTES TO FINANCIAL STATEMENTS (continued) |
in the foreign jurisdictions in which the Fund invest. These foreign taxes, if any, are paid by the Fund and reflected in their statement of operations as follows: foreign taxes withheld at source are presented as a reduction of income and foreign taxes on capital gains from sales of investments are included with the net realized gain (loss) on investments. Foreign taxes payable or deferred as of September 30, 2017, if any, are disclosed in the Fund’s statements of assets and liabilities.
(c) Security Transactions
Security transactions are recorded on the trade date for financial reporting purposes. Realized gains and losses from securities transactions are recorded using the identified cost basis. Proceeds from lawsuits related to investment holdings are recorded as realized gains in the Fund. Dividend income is recorded on the ex-dividend date, net of applicable taxes withheld by foreign countries. Taxable non-cash dividends are recorded as dividend income. Interest income, including amortization of premiums and accretion of discounts, is accrued on a daily basis. Amendment fees are earned as compensation for evaluating and accepting changes to the original loan agreement and are recognized when received. Dividend income from REITs is recorded based on the income included in the distributions received from the REIT investments using published REIT classifications, including some management estimates when actual amounts are not available. Distributions received in excess of this estimated amount are recorded as a reduction of the cost of investments or reclassified to capital gains. The actual amounts of income, return of capital, and capital gains are only determined by each REIT after its fiscal year-end, and may differ from the estimated amounts.
(d) Distributions
Distributions of net investment income and net realized gains, if any, are declared and paid at least annually. Dividends are reinvested in additional shares unless shareholders request payment in cash. Distributions are recorded on the ex-dividend date and are determined in accordance with income tax regulations which may differ from U.S. GAAP.
(e) Class Allocations
Interest and dividend income, most expenses, all realized gains and losses, and all unrealized gains and losses are allocated to the classes based upon the value of the outstanding shares in each Class. Certain costs, such as distribution and service fees are charged directly to specific classes. In addition, certain expenses have been allocated to the individual Funds in the Trust on a pro rata basis upon the respective aggregate net assets of each Fund included in the Trust.
(f) Earnings Credits
Under the fee arrangement with the custodian, the Fund may earn credits based on overnight custody cash balances. These credits are utilized to reduce related custodial expenses. The custodian fees disclosed in the Statement of Operations are before the reduction in expense from the related earnings credits, if any. For the year ended September 30, 2017, there were no earnings credits received.
| | THE GUGGENHEIM FUNDS ANNUAL REPORT | 25 |
NOTES TO FINANCIAL STATEMENTS (continued) |
(g) Cash
The Fund may leave cash overnight in its cash account with the custodian. Periodically, the Fund may have cash due to the custodian bank as an overdraft balance. A fee is incurred on this overdraft, calculated by multiplying the overdraft by a rate based on the federal funds rate, which was 1.06% at September 30, 2017.
(h) Indemnifications
Under the Fund’s organizational documents, its Trustees and Officers are indemnified against certain liabilities arising out of the performance of their duties to the Trust. In addition, throughout the normal course of business, the Fund enters into contracts that contain a variety of representations and warranties which provide general indemnifications. The Fund’s maximum exposure under these arrangements is unknown, as this would involve future claims that may be made against the Fund and/or its affiliates that have not yet occurred. However, based on experience, the Fund expects the risk of loss to be remote.
Note 2 – Fees and Other Transactions with Affiliates
Under the terms of an investment advisory contract, the Fund pays GI investment advisory fees calculated at an annualized rate of 0.75% of the average daily net assets of the Fund. Prior to February 1, 2017, the Fund paid GI investment advisory fees calculated at 1.00% of the average daily net assets of $200 million or less and 0.75% of the average daily net assets of the Fund in excess of $200 million.
GI engages external service providers to perform other necessary services for the Trust, such as audit and accounting related services, legal services, custody, printing and mailing, etc., on a pass-through basis. Such expenses are allocated to various Funds within the complex based on relative net assets.
The Fund has adopted Distribution Plans related to the offering of A-Class, C-Class and P-Class shares pursuant to Rule 12b-1 under the 1940 Act. The plans provide for payments at an annual rate of 0.25% of the average daily net assets of the Fund’s A-Class and P-Class shares, and 1.00% of the average daily net assets of the Fund’s C-Class shares.
The investment advisory contracts for the following Fund provides that the total expenses be limited to a percentage of average net assets for each class of shares, exclusive of brokerage costs, dividends on securities sold short, expenses of other investment companies in which a Fund invests, interest, taxes, litigation, indemnification and extraordinary expenses. The limits are listed below:
| Limit | Effective
Date | Contract
End Date |
| Mid Cap Value Fund – A-Class | 1.42% | 01/30/17 | 02/01/19 |
| Mid Cap Value Fund – C-Class | 2.12% | 01/30/17 | 02/01/19 |
| Mid Cap Value Fund – P-Class | 1.32% | 01/30/17 | 02/01/19 |
| 26 | THE GUGGENHEIM FUNDS ANNUAL REPORT | |
NOTES TO FINANCIAL STATEMENTS (continued) |
GI is entitled to reimbursement by the Funds for fees waived or expenses reimbursed during any of the previous 36 months, beginning on the date of the expense limitation agreement, if on any day the estimated operating expenses are less than the indicated percentages. At September 30, 2017, the amount of fees waived or expenses reimbursed that are subject to recoupment are presented in the following table:
| Fund | | Expires
2018 | | | Expires
2019 | | | Expires
2020 | | | Fund
Total | |
| Mid Cap Value Fund | | | | | | | | | | | | |
| A-Class | | $ | — | | | $ | — | | | $ | 19,356 | | | $ | 19,356 | |
| C-Class | | | — | | | | — | | | | 4,988 | | | | 4,988 | |
| P-Class | | | — | | | | — | | | | 1,878 | | | | 1,878 | |
For the year ended September 30, 2017, GI recouped amounts from the Fund as follows:
| Mid Cap Value Fund | | $ | 7,184 | |
For the year ended September 30, 2017, GFD retained sales charges of $705,455 relating to sales of A-Class shares of the Trust.
Certain trustees and officers of the Trust are also officers of GI and GFD.
MUFG Investor Services (US), LLC (“MUIS”) acts as the Trust’s administrator, transfer agent and accounting agent. As administrator, transfer agent and accounting agent, MUIS is responsible for maintaining the books and records of the Trust’s securities and cash. For providing the aforementioned administrative and accounting services, MUIS is entitled to receive a monthly fee equal to a percentage of the Fund’s fees and out of pocket expenses. For providing the aforementioned transfer agent services, MUIS is entitled to receive a monthly fee based on the number of transactions during the month and the number of accounts under management subject to certain minimum monthly fees and out of pocket expenses.
Note 3 – Federal Income Tax Information
The Fund intends to comply with the provisions of Subchapter M of the Internal Revenue Code applicable to regulated investment companies and will distribute substantially all taxable net investment income and capital gains sufficient to relieve the Fund from all, or substantially all, federal income, excise and state income taxes. Therefore, no provision for federal or state income tax or federal excise tax is required.
Tax positions taken or expected to be taken in the course of preparing the Fund’s tax returns are evaluated to determine whether the tax positions are “more-likely-than-not” of being sustained by the applicable tax authority. Tax positions not deemed to meet the more-likely-than-not threshold would be recorded as a tax benefit or expense in the current year. Management has analyzed the Fund’s tax positions taken, or to be taken, on federal income tax returns for all open tax years, and
| | THE GUGGENHEIM FUNDS ANNUAL REPORT | 27 |
NOTES TO FINANCIAL STATEMENTS (continued) |
has concluded that no provision for income tax is required in the Fund’s financial statements. The Fund’s federal tax returns are subject to examination by the Internal Revenue Service for a period of three years after they are filed.
The tax character of distributions paid during the year ended September 30, 2017 was as follows:
| Fund | | Ordinary
Income | | | Long-Term
Capital Gain | | | Total
Distributions | |
| Mid Cap Value Fund | | $ | 5,247,650 | | | $ | 11,883,596 | | | $ | 17,131,246 | |
The tax character of distributions paid during the year ended September 30, 2016 was as follows:
| Fund | | Ordinary
Income | | | Long-Term
Capital Gain | | | Total
Distributions | |
| Mid Cap Value Fund | | $ | — | | | $ | 94,749,801 | | | $ | 94,749,801 | |
Note: For federal income tax purposes, short-term capital gain distributions are treated as ordinary income distributions.
The tax components of accumulated earnings/(deficit) as of September 30, 2017 were as follows:
| Fund | | Undistributed
Ordinary
Income | | | Undistributed
Long-Term
Capital Gain | | | Net Unrealized
Appreciation/
(Depreciation) | | | Accumulated
Capital and
Other Losses | | | Total | |
| Mid Cap Value Fund | | $ | 16,468,914 | | | $ | 18,184,188 | | | $ | 78,207,778 | | | $ | — | | | $ | 112,860,880 | |
For Federal income tax purposes, capital loss carryforwards represent realized losses of the Fund that may be carried forward and applied against future capital gains. Under the RIC Modernization Act of 2010, the Fund is permitted to carry forward capital losses incurred in taxable years beginning after December 22, 2010 for an unlimited period and such capital loss carryforwards will retain their character as either short-term or long-term capital losses. As of September 30, 2017, the Fund had no capital loss carryforwards.
Net investment income and net realized gains (losses) may differ for financial statement and tax purposes because of temporary or permanent book/tax differences. These differences are primarily due to distributions in connection with redemption of fund shares, distribution reclasses, and losses deferred due to wash sales. To the extent these differences are permanent, reclassifications are made to the appropriate capital accounts in the period that the differences arise. These reclassifications have no effect on net assets or NAV per share.
| 28 | THE GUGGENHEIM FUNDS ANNUAL REPORT | |
NOTES TO FINANCIAL STATEMENTS (continued) |
The following adjustments were made on the Statement of Assets and Liabilities as of September 30, 2017 for permanent book/tax differences:
| Fund | | Paid In
Capital | | | Undistributed
Net Investment
Income/(Loss) | | | Accumulated
Net Realized
Gain/(Loss) | |
| Mid Cap Value Fund | | $ | 42,566,257 | | | $ | 3,075,419 | | | $ | (45,641,676 | ) |
At September 30, 2017, the cost of securities for Federal income tax purposes, the aggregate gross unrealized gain for all securities for which there was an excess of value over tax cost, and the aggregate gross unrealized loss for all securities for which there was an excess of tax cost over value, were as follows:
| Fund | | Tax
Cost | | | Tax
Unrealized
Gain | | | Tax
Unrealized
(Loss) | | | Net
Unrealized
Gain/(Loss) | |
| Mid Cap Value Fund | | $ | 428,038,811 | | | $ | 96,585,299 | | | $ | (18,377,521 | ) | | $ | 78,207,778 | |
Note 4 – Fair Value Measurement
In accordance with U.S. GAAP, fair value is defined as the price that the Fund would receive to sell an investment or pay to transfer a liability in an orderly transaction with an independent buyer in the principal market, or in the absence of a principal market, the most advantageous market for the investment or liability. U.S. GAAP establishes a three-tier fair value hierarchy based on the types of inputs used to value assets and liabilities and requires corresponding disclosure. The hierarchy and the corresponding inputs are summarized below:
| Level 1 — | quoted prices in active markets for identical assets or liabilities. |
| Level 2 — | significant other observable inputs (for example quoted prices for securities that are similar based on characteristics such as interest rates, prepayment speeds, credit risk, etc.). |
| Level 3 — | significant unobservable inputs based on the best information available under the circumstances, to the extent observable inputs are not available, which may include assumptions. |
The types of inputs available depend on a variety of factors, such as the type of security and the characteristics of the markets in which it trades, if any. Fair valuation determinations that rely on fewer or no observable inputs require greater judgment. Accordingly, fair value determinations for Level 3 securities require the greatest amount of judgment.
The inputs or methodologies used for valuing securities are not necessarily an indication of the risk associated with investing in those securities. The suitability of the techniques and sources employed to determine fair valuation are regularly monitored and subject to change.
| | THE GUGGENHEIM FUNDS ANNUAL REPORT | 29 |
NOTES TO FINANCIAL STATEMENTS (continued) |
Note 5 – Securities Transactions
For the year ended September 30, 2017, the cost of purchases and proceeds from sales of investment securities, excluding government securities, short-term investments and derivatives, were as follows:
| Fund | | Purchases | | | Sales | |
| Mid Cap Value Fund | | $ | 282,708,105 | | | $ | 392,659,023 | |
The Fund is permitted to purchase or sell securities from or to certain affiliated funds under specified conditions outlined in procedures adopted by the Board of the Trust. The procedures have been designed to ensure that any purchase or sale of securities by a Fund from or to another fund or portfolio that is or could be considered an affiliate by virtue of having a common investment adviser (or affiliated investment advisers), common Trustees and/or common officers complies with Rule 17a-7 of the 1940 Act. Further, as defined under these procedures, each transaction is effected at the current market price to save costs, where permissible. For the year ended September 30, 2017, the Fund did not engage in purchases and sales of securities, pursuant to Rule 17a-7 of the 1940 Act.
Note 6 – Line of Credit
The Trust, with the exception of Capital Stewardship Fund, and certain affiliated funds, secured a 364-day committed, $1,000,000,000 line of credit from Citibank, N.A., which was in place through October 6, 2017, at which time the line of credit was renewed with an increased commitment amount of $1,065,000,000. The funds that participate in the line of credit including the Fund, paid aggregate upfront costs of $982,952 to renew the line of credit. The commitment fee that may be paid by the Funds is at an annualized rate of 0.15% of the average daily amount of their unused commitment amount. These amounts are included within Line of Credit Fees on the Statement of Operations.
A Fund may draw (borrow) from the line of credit as a temporary measure for emergency purposes, to facilitate redemption requests, or for other short-term liquidity purposes consistent with the Fund’s investment objective and program. For example, it may be advantageous for the Fund to borrow money rather than sell existing portfolio positions to meet redemption requests. Fees related to borrowings, if any, vary under this arrangement between the greater of Citibank’s “base rate”, 1 month LIBOR plus 1%, or the federal funds rate plus 1/2 of 1%.
The Fund did not have any borrowings under this agreement as of and for the period ended September 30, 2017.
| 30 | THE GUGGENHEIM FUNDS ANNUAL REPORT | |
NOTES TO FINANCIAL STATEMENTS (concluded) |
Note 7 – Other Liabilities
The Fund wrote put option contracts through Lehman Brothers Inc., (“LBI”) that were exercised prior to the option contracts’ expiration and prior to the bankruptcy filing by LBI, during September, 2008. However, these transactions have not settled and the securities have not been delivered to the Fund as of September 30, 2017.
Although the ultimate resolution of these transactions is uncertain, the Fund has recorded a liability equal to the difference between the strike price on the put options and the market price of the underlying security on the exercise date. The amount of the liability recorded in miscellaneous payables by the Fund as of September 30, 2017, was $473,594.
| | THE GUGGENHEIM FUNDS ANNUAL REPORT | 31 |
| REPORT OF INDEPENDENT REGISTERED PUBLIC ACCOUNTING FIRM |
The Board of Trustees and Shareholders
of Guggenheim Funds Trust
We have audited the accompanying statement of assets and liabilities, including the schedule of investments, of Guggenheim Mid Cap Value Fund (one of the series constituting the Guggenheim Funds Trust) (the “Fund”) as of September 30, 2017, and the related statement of operations for the year then ended, the statements of changes in net assets for each of the two years in the period then ended, and the financial highlights for each of the years or periods indicated therein. These financial statements and financial highlights are the responsibility of the Fund’s management. Our responsibility is to express an opinion on these financial statements and financial highlights based on our audits.
We conducted our audits in accordance with the standards of the Public Company Accounting Oversight Board (United States). Those standards require that we plan and perform the audit to obtain reasonable assurance about whether the financial statements and financial highlights are free of material misstatement. We were not engaged to perform an audit of the Fund’s internal control over financial reporting. Our audits included consideration of internal control over financial reporting as a basis for designing audit procedures that are appropriate in the circumstances, but not for the purpose of expressing an opinion on the effectiveness of the Fund’s internal control over financial reporting. Accordingly, we express no such opinion. An audit also includes examining, on a test basis, evidence supporting the amounts and disclosures in the financial statements and financial highlights, assessing the accounting principles used and significant estimates made by management, and evaluating the overall financial statement presentation. Our procedures included confirmation of securities owned as of September 30, 2017, by correspondence with the custodian. We believe that our audits provide a reasonable basis for our opinion.
In our opinion, the financial statements and financial highlights referred to above present fairly, in all material respects, the financial position of the Guggenheim Mid Cap Value Fund (one of the series constituting Guggenheim Funds Trust) at September 30, 2017, the results of its operations for the year then ended, the changes in its net assets for each of the two years in the period then ended, and its financial highlights for each of the years or periods indicated therein, in conformity with U.S. generally accepted accounting principles.
Tysons, Virginia
November 29, 2017
| 32 | THE GUGGENHEIM FUNDS ANNUAL REPORT | |
OTHER INFORMATION (Unaudited) |
Federal Income Tax Information
This information is being provided as required by the Internal Revenue Code. Amounts shown may differ from those elsewhere in the report because of differences in tax and financial reporting practice.
In January 2018, shareholders will be advised on IRS Form 1099 DIV or substitute 1099 DIV as to the federal tax status of the distributions received by shareholders in the calendar year 2017.
The Fund’s investment income (dividend income plus short-term gains, if any) qualifies as follows:
Of the taxable ordinary income distributions paid during the fiscal year ending September 30, 2017, the Fund had the corresponding percentages qualify for the reduced tax rate pursuant to the Jobs and Growth Tax Relief and Reconciliation Act of 2003 or for the dividends received deduction for corporations. See the qualified dividend income and dividend received deduction columns, respectively, in the table below.
| Fund | | Qualified
Dividend
Income | | | Dividend
Received
Deduction | |
| Mid Cap Value Fund | | | 58.87 | % | | | 58.33 | % |
With respect to the taxable year ended September 30, 2017, the Fund hereby designates as capital gain dividends the amounts listed below, or, if subsequently determined to be different, the net capital gain of such year:
| Fund | | From long-term
capital gain: | | | From long-term capital gain, using proceeds from shareholder redemptions: | |
| Mid Cap Value Fund | | $ | 11,883,596 | | | $ | 42,566,257 | |
Proxy Voting Information
A description of the policies and procedures that the Trust uses to determine how to vote proxies relating to securities held in the Funds’ portfolios is available, without charge and upon request, by calling 800.820.0888. This information is also available from the EDGAR database on the SEC’s website at https://www.sec.gov.
Information regarding how the Funds voted proxies relating to portfolio securities during the most recent 12-month period ended June 30 is available without charge, upon request, by calling 800.820.0888. This information is also available from the EDGAR database on the SEC’s website at https://www.sec.gov.
| | THE GUGGENHEIM FUNDS ANNUAL REPORT | 33 |
OTHER INFORMATION (Unaudited)(continued) |
Sector Classification
Information in the “Schedule of Investments” is categorized by sectors using sector-level Classifications defined by the Bloomberg Industry Classification System, a widely recognized industry classification system provider. Each Fund’s registration statement has investment policies relating to concentration in specific sectors/industries. For purposes of these investment policies, the Funds usually classify sectors/industries based on industry-level Classifications used by widely recognized industry classification system providers such as Bloomberg Industry Classification System, Global Industry Classification Standards and Barclays Global Classification Scheme.
Quarterly Portfolio Schedules Information
The Trust files its complete schedule of portfolio holdings with the SEC for the first and third quarters of each fiscal year on Form N-Q; which are available on the SEC’s website at https://www.sec.gov. The Funds’ Forms N-Q may be reviewed and copied at the SEC’s Public Reference Room in Washington, DC, and that information on the operation of the Public Reference Room may be obtained by calling 800-SEC-0330. Copies of the portfolio holdings are also available to shareholders, without charge and upon request, by calling 800.820.0888.
Report of the Guggenheim Funds Trust Contracts Review Committee
Guggenheim Funds Trust (the “Trust”) was organized as a Delaware statutory trust on November 8, 2013, and is registered as an open-end management investment company under the Investment Company Act of 1940, as amended (the “1940 Act”). The Trust includes the following series:
● Guggenheim Alpha Opportunity Fund (“Alpha Opportunity Fund”) ● Guggenheim Diversified Income Fund (“Diversified Income Fund”) ● Guggenheim High Yield Fund (“High Yield Fund”) ● Guggenheim Large Cap Value Fund (“Large Cap Value Fund”) ● Guggenheim Macro Opportunities Fund (“Macro Opportunities Fund”) | ● Guggenheim Capital Stewardship Fund (“Capital Stewardship Fund”) ● Guggenheim Floating Rate Strategies Fund (“Floating Rate Strategies Fund”) ● Guggenheim Investment Grade Bond Fund (“Investment Grade Bond Fund”) ● Guggenheim Limited Duration Fund (“Lim-ited Duration Fund”) ● Guggenheim Market Neutral Real Estate Fund (“Market Neutral Real Estate Fund”) |
| 34 | THE GUGGENHEIM FUNDS ANNUAL REPORT | |
OTHER INFORMATION (Unaudited)(continued) |
● Guggenheim Mid Cap Value Fund (“Mid Cap Value Fund”) ● Guggenheim Municipal Income Fund (“Municipal Income Fund”) ● Guggenheim Small Cap Value Fund (“Small Cap Value Fund”) ● Guggenheim StylePlus—Mid Growth Fund (“StylePlus—Mid Growth Fund”) ● Guggenheim World Equity Income Fund (“World Equity Income Fund”) | ● Guggenheim Mid Cap Value Institutional Fund (“Mid Cap Value Institutional Fund”) ● Guggenheim Risk Managed Real Estate Fund (“Risk Managed Real Estate Fund”) ● Guggenheim StylePlus—Large Core Fund (“StylePlus—Large Core Fund”) ● Guggenheim Total Return Bond Fund (“Total Return Bond Fund”) |
Security Investors, LLC (“Security Investors”), an indirect subsidiary of Guggenheim Partners, LLC, a global, diversified financial services firm (“Guggenheim Partners”), serves as investment adviser to each of: (i) Alpha Opportunity Fund; (ii) High Yield Fund; (iii) Investment Grade Bond Fund; (iv) Large Cap Value Fund; (v) Mid Cap Value Fund; (vi) Mid Cap Value Institutional Fund; (vii) Municipal Income Fund; (viii) Small Cap Value Fund; (ix) StylePlus—Large Core Fund; (x) StylePlus—Mid Growth Fund; and (xi) World Equity Income Fund (collectively, the “SI-Advised Funds”). (Guggenheim Partners, Security Investors, Guggenheim Partners Investment Management, LLC (“GPIM”) and their affiliates may be referred to herein collectively as “Guggenheim.” “Guggenheim Investments” refers to the global asset management and investment advisory division of Guggenheim Partners and includes GPIM, Security Investors and Guggenheim Funds Investment Advisors, LLC and other affiliated investment management businesses of Guggenheim Partners.)
Under the terms of investment management agreements between Security Investors and the Trust, with respect to the SI-Advised Funds, Security Investors also is responsible for overseeing the activities of GPIM, an indirect subsidiary of Guggenheim Partners, with respect to its service as investment sub-adviser to Municipal Income Fund, pursuant to an investment sub-advisory agreement between Security Investors and GPIM (the “GPIM Sub-Advisory Agreement”).
GPIM serves as investment adviser with respect to each of: (i) Diversified Income Fund; (ii) Floating Rate Strategies Fund; (iii) Limited Duration Fund; (iv) Macro Opportunities Fund; (v) Market Neutral Real Estate Fund; (vi) Risk Managed Real Estate Fund; and (vii) Total Return Bond Fund (collectively, the “GPIM-Advised Funds” and together with the SI-Advised Funds, the “Funds” and individually, a “Fund”).1 Under the supervision of the Board of Trustees of the
1 | The investment management agreements pertaining to the SI-Advised Funds and the investment management agreements pertaining to the GPIM-Advised Funds are referred to herein together as the “Advisory Agreements” and, together with the GPIM Sub-Advisory Agreement, as the “Agreements.” In addition, unless the context indicates otherwise, GPIM, with respect to its service as investment adviser to the GPIM-Advised Funds, and Security Investors as to the SI-Advised Funds, are each referred to herein as the “Adviser” and together, the “Advisers.” |
| | THE GUGGENHEIM FUNDS ANNUAL REPORT | 35 |
OTHER INFORMATION (Unaudited)(continued) |
Trust (the “Board,” with the members of the Board referred to individually as the “Trustees”), the Advisers regularly provide (or, as applicable, oversee the provision of) investment research, advice and supervision, along with a continuous investment program for the Funds, and direct the purchase and sale of securities and other investments for each Fund’s portfolio.
Following an initial two-year term, each of the Advisory Agreements continues in effect from year to year provided that such continuance is specifically approved at least annually by (i) the Board or a majority of the outstanding voting securities (as defined in the 1940 Act) of each Fund, and, in either event, (ii) the vote of a majority of the Trustees who are not “interested person[s],” as defined by the 1940 Act, of the Trust (the “Independent Trustees”) casting votes in person at a meeting called for such purpose. At meetings held in person on April 25, 2017 (the “April Meeting”) and on May 23, 2017 (the “May Meeting”), the members of the Contracts Review Committee of the Board (the “Committee”), consisting solely of the Independent Trustees, met separately from Guggenheim to consider the proposed renewal of the Advisory Agreements and the GPIM Sub-Advisory Agreement in connection with the Committee’s annual contract review schedule. GPIM also serves as investment adviser for the Capital Stewardship Fund, which is addressed in a separate report.2
As part of its review process, the Committee was represented by independent legal counsel to the Independent Trustees (“Independent Legal Counsel”). Independent Legal Counsel reviewed and discussed with the Committee various key aspects of the Trustees’ legal responsibilities relating to the proposed renewal of the Agreements and other principal contracts. The Committee took into account various materials received from Guggenheim and Independent Legal Counsel. Recognizing that the evaluation process with respect to the services provided by each of the Advisers is an ongoing one, the Committee also considered the variety of written materials, reports and oral presentations the Board receives throughout the year regarding performance and operating results of the Funds.
In connection with the contract review process, FUSE Research Network LLC (“FUSE”), an independent, third-party research provider, was engaged to prepare advisory contract renewal reports designed specifically to help the Board fulfill its advisory contract renewal responsibilities. The objective of the reports is to present the subject funds’ relative position regarding fees, expenses and total return performance, with peer group and universe comparisons. The Committee assessed the data provided in the FUSE reports as well as commentary and supporting data presented by Guggenheim, including, among other things, a summary of notable distinctions between certain Funds and the applicable peer group identified in the FUSE reports.
2 | Because shares of the Capital Stewardship Fund are only offered for subscription and are held by a limited number of institutional/bank investors, and the Fund issues a shareholder report separate from the other series of the Trust, the factors considered by the Committee in evaluating the proposed renewal of an investment management agreement pertaining to the Capital Stewardship Fund, and the Concinnity Sub-Advisory Agreement, are addressed in a separate report of the Committee. Accordingly, references to the “Funds” should be understood as referring to all series of the Trust, excluding Capital Stewardship Fund. |
| 36 | THE GUGGENHEIM FUNDS ANNUAL REPORT | |
OTHER INFORMATION (Unaudited)(continued) |
In addition, Guggenheim provided materials and data in response to formal requests for information sent by Independent Legal Counsel on behalf of the Independent Trustees. Guggenheim also made a presentation at the April Meeting. Throughout the process, the Committee asked questions of management and requested certain additional information, which Guggenheim provided following the April Meeting (collectively with the foregoing reports and materials, the “Contract Review Materials”). The Committee considered the Contract Review Materials in the context of its accumulated experience governing the Trust and weighed the factors and standards discussed with Independent Legal Counsel.
Following an analysis and discussion of the factors identified below and in the exercise of its business judgment, the Committee concluded that it was in the best interest of each Fund to recommend that the Board approve the renewal of each Advisory Agreement and the GPIM Sub-Advisory Agreement for an additional annual term.
Advisory Agreements
Nature, Extent and Quality of Services Provided by each Adviser: With respect to the nature, extent and quality of services currently provided by each Adviser, the Committee considered the qualifications, experience and skills of key personnel performing services for the Funds, including those personnel providing compliance oversight, as well as the supervisors and reporting lines for such personnel. In this connection, the Committee considered Guggenheim’s resources and related efforts to retain, attract and motivate capable personnel to serve the Funds and noted Guggenheim’s report on recent additions, departures and transitions in personnel who work on matters relating to the Funds or are significant to the operations of each Adviser. The Committee also considered the Advisers’ attention to relevant developments in the mutual fund industry and its observance of compliance and regulatory requirements, and noted that on a regular basis the Board receives and reviews information from the Trust’s Chief Compliance Officer regarding compliance policies and procedures established pursuant to Rule 38a-1 under the 1940 Act, as well as from Guggenheim’s Chief Risk Officer. In addition, the Committee noted Guggenheim’s implementation of additional controls and oversight processes relating to risk management, including the establishment of an Enterprise Risk Management Committee comprised of a multi-disciplinary team of senior personnel, as well as enhancements to the organization’s information security program.
In connection with the Committee’s evaluation of the overall package of services provided by each Adviser, the Committee considered Guggenheim’s administrative capabilities, including its role in monitoring and coordinating compliance responsibilities with the fund administrator, transfer agent, distributor, custodian and other service providers to the Funds. In this respect, the Committee took into account the initiatives undertaken by Guggenheim in connection with the outsourcing of its fund administration and transfer agency services business resulting from Guggenheim’s sale of Rydex Fund Services, LLC (“RFS”), formerly a Guggenheim affiliate and now known as MUFG Investor Services (US), LLC (“MUFG IS”), to Mitsubishi UFJ Trust and Banking Corporation, the trust banking arm of Mitsubishi UFJ Financial Group, a Japanese
| | THE GUGGENHEIM FUNDS ANNUAL REPORT | 37 |
OTHER INFORMATION (Unaudited)(continued) |
financial services organization (the “RFS Transaction”). In particular, the Committee considered Guggenheim’s establishment of the Office of Chief Financial Officer (“OCFO”), its structure and responsibilities, including its role in overseeing the services provided by MUFG IS. The Committee also considered the resources allocated by Guggenheim to support the OCFO and the detailed plans presented by management for functions for the OCFO both during and upon completion of the transition period with MUFG IS.
With respect to Municipal Income Fund, the Committee noted that although Security Investors delegated responsibility for the investment and reinvestment of the Fund’s assets to the Sub-Adviser, as affiliated companies, both the Adviser and Sub-Adviser are part of the Guggenheim organization. Further, the Committee took into account that investment advisory-related services are provided by many Guggenheim employees under different related legal entities and thus, the services provided by the Adviser on the one hand and the Sub-Adviser on the other, as well as the risks assumed by each party, are not provided by distinct legal entities. The Committee took into account information provided by Guggenheim describing the Adviser’s processes and activities for providing oversight of the Sub-Adviser’s investment strategies and compliance with investment restrictions, including information regarding the Adviser’s Sub-Advisory Oversight Committee.
With respect to Guggenheim’s resources and the ability of each Adviser to carry out its responsibilities under the applicable Advisory Agreement, the Chief Financial Officer of Guggenheim Investments reviewed with the Committee certain unaudited financial information concerning the holding company for Guggenheim Investments, Guggenheim Partners Investment Management Holdings, LLC (“GPIMH”). The Committee received the audited consolidated financial statements of GPIMH as supplemental information. (Thereafter, the Committee received the audited consolidated financial statements of GPIM.)
The Committee also considered the acceptability of the terms of each Advisory Agreement, including the scope of services required to be performed by each Adviser.
Based on the foregoing, and based on other information received (both oral and written) at the April Meeting and the May Meeting, as well as other considerations, including the Committee’s knowledge of how each Adviser performs its duties obtained through Board meetings, discussions and reports during the year, the Committee concluded that each Adviser and its personnel were qualified to serve the Funds in such capacity and may reasonably be expected to continue to provide a high quality of services under each Advisory Agreement with respect to the Funds.
Investment Performance: The Committee received, for each Fund, investment returns for the ten-year, five-year, three-year, one-year and three-month periods ended December 31, 2016, as applicable. In addition, the Committee received a comparison of each Fund’s performance to the performance of a benchmark, a universe of funds and a narrower peer group of similar funds based on asset levels as identified by FUSE, in each case for the same periods, as applicable.
| 38 | THE GUGGENHEIM FUNDS ANNUAL REPORT | |
OTHER INFORMATION (Unaudited)(continued) |
The Committee also received from FUSE representatives and considered a description of the methodology employed by FUSE for identifying each Fund’s peer group and universe for performance and expense comparisons.
In seeking to evaluate Fund performance over a full market cycle, the Committee focused its attention on five-year and three-year performance rankings as compared to the relevant universe of funds. The Committee also considered more recent performance periods, including the one-year period and, as deemed appropriate, the since-inception and/or three-month period, for certain Funds such as for those Funds that were recently launched or had undergone recent changes in investment strategies, as well as circumstances in which enhancements were made to the portfolio management processes or techniques employed for a Fund. In this connection, the Committee made the following observations:
Alpha Opportunity Fund: The Fund’s Class A shares outperformed the performance universe median for the five-year and three-year periods, ranking in the 8th percentile for both periods. The Committee considered that the Fund re-opened to subscriptions with a new U.S. long/short equity investment strategy on January 28, 2015. In light of the foregoing, the Committee also considered the more recent one-year period ended December 31, 2016, and observed that the return of Fund’s Class A shares ranked in the 5th percentile of its performance universe, exceeding the performance universe median.
Diversified Income Fund:3 The Committee noted the Fund’s inception date of January 29, 2016, and observed that the Fund’s Class A shares ranked in the 22nd and 24th percentiles of its performance universe for the since-inception and three-month periods ended December 31, 2016, respectively, exceeding its performance universe median for both periods.
Floating Rate Strategies Fund: The returns of the Fund’s Class A shares ranked in the 6th and 10th percentiles of its performance universe for the five-year and three-year periods ended December 31, 2016, respectively, exceeding its performance universe median for each of these periods.
High Yield Fund: The returns of the Fund’s Class A shares ranked in the 3rd and 6th percentiles of its performance universe for the five-year and three-year periods ended December 31, 2016, respectively, exceeding its performance universe median for each of these periods.
Investment Grade Bond Fund: The returns of the Fund’s Class A shares ranked in the 2nd percentile of its performance universe for both the five-year and three-year periods ended December 31, 2016, exceeding its performance universe median for both of these periods.
3 | At a meeting held on August 20, 2015, the Board approved an investment management agreement dated November 17, 2015, between GPIM and the Trust, with respect to Diversified Income Fund, for an initial two-year term (the “Diversified Income Fund IMA”). The Committee determined to include the Diversified Income Fund IMA within the scope of its 2017 annual contract review in order to align the timing for review of such agreement with the process undertaken by the Committee for the Advisory Agreements, with respect to the other Funds, on a uniform schedule. |
| | THE GUGGENHEIM FUNDS ANNUAL REPORT | 39 |
OTHER INFORMATION (Unaudited)(continued) |
Limited Duration Fund: The Committee noted the Fund’s inception date of December 16, 2013, and observed that the returns of the Fund’s Class A shares ranked in the 1st and 9th percentiles of its performance universe for the three-year and one-year periods ended December 31, 2016, respectively, exceeding its performance universe median for both of these periods.
Macro Opportunities Fund: The Committee observed that the returns of the Fund’s Class A shares ranked in the 1st and 8th percentiles of its performance universe for the five-year and three-year periods ended December 31, 2016, respectively, exceeding its performance universe median for both of these periods.
Market Neutral Real Estate Fund:4 The Committee noted the Fund’s inception date of February 26, 2016, and observed that the returns of the Fund’s Class A shares ranked in the 55th and 14th percentiles of its performance universe for the since-inception and three-month periods ended December 31, 2016, respectively, exceeding the performance universe median for the three-month period.
Risk Managed Real Estate Fund: The Committee noted the Fund’s inception date of March 28, 2014, and observed the returns of the Fund’s Class A shares ranked in the 3rd and 16th percentiles of its performance universe for the since-inception and one-year periods ended December 31, 2016, respectively, exceeding its performance universe median for both of these periods.
StylePlus—Large Core Fund: The returns of the Fund’s Class A shares ranked in the 46th and 1st percentiles of its performance universe for the five-year and three-year periods ended December 31, 2016, respectively. The Committee noted that the Fund implemented a strategy change and a new portfolio management team in May 2013.
StylePlus—Mid Growth Fund: The returns of the Fund’s Class A shares ranked in the 31st and 13th percentiles of its performance universe for the five-year and three-year periods ended December 31, 2016, respectively. The Committee noted that the Fund implemented a strategy change and a new portfolio management team in May 2013.
Total Return Bond Fund: The Committee observed that the returns of the Fund’s Class A shares ranked in the 1st and 2nd percentiles of its performance universe for the five-year and three-year periods ended December 31, 2016, respectively, and exceeded the performance universe median for each of these periods.
4 | At a meeting held on November 10, 2015, the Board approved an investment management agreement dated November 17, 2015, between GPIM and the Trust, with respect to Market Neutral Real Estate Fund, for an initial two-year term (the “Market Neutral RE Fund IMA”). The Committee determined to include the Market Neutral RE Fund IMA within the scope of its 2017 annual contract review in order to align the timing for review of such agreement with the process undertaken by the Committee for the Advisory Agreements, with respect to the other Funds, on a uniform schedule. |
| 40 | THE GUGGENHEIM FUNDS ANNUAL REPORT | |
OTHER INFORMATION (Unaudited)(continued) |
World Equity Income Fund: The returns of the Fund’s Class A shares ranked in the 43rd and 14th percentiles of its performance universe for the five-year and three-year periods ended December 31, 2016, respectively. The Committee noted that the Fund implemented a strategy change and a new portfolio management team in August 2013.
Value Funds: Large Cap Value Fund, Mid Cap Value Fund, Mid Cap Value Institutional Fund and Small Cap Value Fund
Large Cap Value Fund: The returns of the Class A shares exceeded the performance universe median for the five-year and three-year periods ended December 31, 2016, and ranked in the 37th and 25th percentiles, respectively.
Mid Cap Value Fund: The returns of the Class A shares underperformed the performance universe median for the five-year and three-year periods ended December 31, 2016, ranking in the 69th and 62nd percentiles, respectively. The Committee noted measures taken by the Adviser to remedy longer-term relative underperformance with respect to the Value Funds strategy, including strategy enhancements such as implementation of a refined stock selection process and additional risk controls to enforce the strategy’s sell discipline. In light of the foregoing, the Committee also considered the more recent one-year period ended December 31, 2016, and observed that the return of the Fund’s Class A shares exceeded the median of its performance universe, ranking in the 7th percentile.
Mid Cap Value Institutional Fund: The Fund’s returns underperformed the performance universe median for the five-year and three-year periods ended December 31, 2016, ranking in the 63rd and 58th percentiles, respectively. The Committee noted measures taken by the Adviser to remedy longer-term relative underperformance with respect to the Value Funds strategy, including strategy enhancements such as implementation of a refined stock selection process and additional risk controls to enforce the strategy’s sell discipline. In light of the foregoing, the Committee also considered the more recent one-year period ended December 31, 2016, and observed that the Fund’s return exceeded the median of its performance universe, ranking in the 9th percentile.
Small Cap Value Fund: The returns of the Class A shares underperformed the performance universe median for the five-year and three-year periods ended December 31, 2016, and ranked in the 67th and 71st percentiles, respectively. The Committee noted measures taken by the Adviser to remedy longer-term relative underperformance with respect to the Value Funds strategy, including strategy enhancements such as implementation of a refined stock selection process and additional risk controls to enforce the strategy’s sell discipline. In light of the foregoing, the Committee also considered the more recent one-year period ended December 31, 2016, and observed that the return of the Fund’s Class A shares exceeded the median of its performance universe, ranking in the 35th percentile.
After reviewing the foregoing and related factors, the Committee concluded that each Fund’s performance was acceptable.
| | THE GUGGENHEIM FUNDS ANNUAL REPORT | 41 |
OTHER INFORMATION (Unaudited)(continued) |
Municipal Income Fund: The Committee considered that Security Investors does not directly manage the investment portfolio but has delegated such duties to GPIM. Based on the information provided and the review of the Fund’s investment performance, the Committee concluded that Security Investors had appropriately reviewed and monitored GPIM’s investment performance as Sub-Adviser to the Fund.
Comparative Fees, Costs of Services Provided and the Profits Realized by each Adviser from Its Relationship with the Funds: The Committee compared each Fund’s contractual advisory fee and total net expense ratio to the applicable peer group. The Committee also reviewed the median advisory fees and expense ratios, including expense ratio components (e.g., transfer agency fees, administration fees, other operating expenses, distribution fees and fee waivers/reimbursements) of the peer group of funds. The Committee also reviewed aggregated advisory and administrative fees compared to the peer group average and median.
As part of its evaluation of each Fund’s advisory fee, the Committee considered how such fees compared to the advisory fee charged by the applicable Adviser to one or more other clients that it manages pursuant to similar investment strategies, to the extent applicable, noting that, in certain instances, Guggenheim charges a lower advisory fee to such other clients. In this connection, the Committee considered, among other things, Guggenheim’s representations about the significant differences between managing mutual funds as compared to other types of accounts. The Committee also considered Guggenheim’s explanation that lower fees are charged in certain instances due to various other factors, including the scope of contract, type of investors, differences in fee structure, applicable legal, governance and capital structures, tax status and historical pricing reasons. The Committee concluded that the information it received demonstrated that the aggregate services provided to each Fund at issue were sufficiently different from those provided to other clients with similar investment strategies and/or the risks borne by Guggenheim were sufficiently greater than those associated with managing other clients with similar investment strategies to support the difference in fees.
In further considering the comparative fee and expense data presented in the Contract Review Materials and addressed by Guggenheim, the Committee took into account those Funds with currently effective expense limitation agreements with the Adviser and made the following observations:
Alpha Opportunity Fund: The average contractual advisory fee percentile rank across all share classes of the Fund and the asset weighted total net expense ratio are in the second quartile (44th and 46th percentiles, respectively) of its peer group. The net effective management fee5 ranks in the third quartile (72nd percentile). The Committee considered the Adviser’s proposal, presented at the May Meeting, to reduce the Fund’s expense cap by 35 basis points across all share classes.
5 | The “net effective management fee” for Alpha Opportunity Fund and each of the other Funds represents the combined effective advisory fee and administration fee as a percentage of average net assets for the latest fiscal year, after any waivers and/or reimbursements, based on the Fund’s class level peer group percent rank, weighted by class level assets under management. |
| 42 | THE GUGGENHEIM FUNDS ANNUAL REPORT | |
OTHER INFORMATION (Unaudited)(continued) |
Diversified Income Fund: The average contractual advisory fee percentile rank across all share classes of the Fund and the net effective management fee are in the second quartile (35th and 27th percentiles, respectively) of its peer group and the asset weighted total net expense ratio is in the first quartile (1st percentile) of its peer group.
Floating Rate Strategies Fund: The average contractual advisory fee percentile rank across all share classes of the Fund is in fourth quartile (84th percentile) of its peer group and the net effective management fee is in the third quartile (69th percentile) of its peer group. The Fund’s asset weighted total net expense ratio is in the second quartile (48th percentile) of its peer group. The Committee considered the Fund’s strong performance and top decile performance universe rankings for the five- and three-year periods ended December 31, 2016.
High Yield Fund: The average contractual advisory fee percentile rank across all share classes of the Fund is in the second quartile (48th percentile) of its peer group and the net effective management fee is in the third quartile (75th percentile) of its peer group. The Fund’s asset weighted total net expense ratio is in the fourth quartile (81st percentile) of its peer group. The Committee considered the Fund’s strong performance and top decile performance universe rankings for the five- and three-year periods ended December 31, 2016.
Investment Grade Bond Fund: The average contractual advisory fee percentile rank across all share classes of the Fund, the net effective management fee and the asset weighted total net expense ratio each rank in the fourth quartile (85th, 89th and 94th percentiles, respectively) of its peer group. The Committee considered the Fund’s strong performance and top decile performance universe rankings for the five- and three-year periods ended December 31, 2016.
Large Cap Value Fund: The average contractual advisory fee percentile rank across all share classes of the Fund and the asset weighted total net expense ratio is in the second quartile (33rd and 39th percentiles, respectively) of its peer group. The net effective management fee is in the third quartile (55th percentile) of its peer group.
Limited Duration Fund: The net effective management fee is in the third quartile (71st percentile) of its peer group, as is the Fund’s asset weighted total net expense ratio (63rd percentile). The average contractual advisory fee percentile rank across all share classes of the Fund is in the fourth quartile (78th percentile). The Committee considered the Fund’s strong performance and top decile performance universe rankings for the three- and one-year periods ended December 31, 2016.
Macro Opportunities Fund: The average contractual advisory fee percentile rank across all share classes of the Fund and the net effective management fee rank in the fourth quartile (86th and 80th percentiles, respectively) of its peer group. The asset weighted total net expense ratio is in the third quartile (73rd percentile) of its peer group. The Committee noted that the Fund is categorized as a non-traditional bond fund which seeks to add value by investing in many non-
| | THE GUGGENHEIM FUNDS ANNUAL REPORT | 43 |
OTHER INFORMATION (Unaudited)(continued) |
traditional securities outside of fixed income, including equities, currencies, commodities and derivatives. In addition, the Committee considered the Fund’s strong performance and top decile performance universe rankings for the five- and three-year periods ended December 31, 2016.
Market Neutral Real Estate Fund: Each of the average contractual advisory fee percentile rank across all share classes of the Fund, the net effective management fee and the asset weighted total net expense ratio is in the third quartile (36th, 38th and 39th percentiles, respectively) of its peer group.
Mid Cap Value Fund: The average contractual advisory fee percentile rank across all share classes of the Fund is in the third quartile (71st percentile) of its peer group and the net effective management fee and asset weighted total net expense ratio are in the fourth quartile (76th and 86th percentiles, respectively) of its peer group as of December 31, 2016. The Committee noted that in November 2016 the Adviser recommended and the Board approved the elimination of the Fund’s advisory fee breakpoint and a reduction in the Fund’s contractual advisory fee from 1.00% to 0.75%, effective February 1, 2017, along with the conclusion that the reduction in the advisory fee would not result in any decrease in the nature, extent and quality of services provided to the Fund. Based upon the new contractual advisory fee rate, the Fund’s gross management fee6 peer group rankings would be 53rd percentile for Class A shares, 64th percentile for Class C shares, and 47th percentile for Class P shares.
Mid Cap Value Institutional Fund: The total net expense ratio is in the third quartile (68th percentile) and the contractual advisory fee and net effective management fee are in the fourth quartile (86th and 77th percentiles, respectively). The Committee considered the strategy enhancements implemented for the Fund and the Fund’s strong recent performance, including a top decile performance universe ranking for the one-year period ended December 31, 2016.
Municipal Income Fund: The average contractual advisory fee percentile rank across all share classes of the Fund and the asset weighted total net expense ratio are in the second quartile (49th and 27th percentiles, respectively) of its peer group and the net effective management fee is in the first quartile (22nd percentile).
Risk Managed Real Estate Fund: The average contractual advisory fee percentile rank across all share classes of the Fund is in the first quartile (23rd percentile) of its peer group and the net effective management fee and the asset weighted total net expense ratio are in the second quartile (50th and 28th percentiles, respectively) of its peer group.
StylePlus—Large Core Fund: The average contractual advisory fee percentile rank across all share classes of the Fund (58th percentile), the net effective management fee (75th percentile) and the asset weighted total net expense ratio (75th percentile) are in the third quartile of its peer group.
6 | The “gross management fee,” with respect to Mid Cap Value Fund and Small Cap Value Fund, is the sum of the advisory fee and the administration fee. |
| 44 | THE GUGGENHEIM FUNDS ANNUAL REPORT | |
OTHER INFORMATION (Unaudited)(continued) |
StylePlus—Mid Growth Fund: The average contractual advisory fee percentile rank across all share classes of the Fund is in the first quartile (25th percentile) of its peer group. The net effective management fee and asset weighted total net expense ratio are in the fourth quartile (77th and 85th percentiles, respectively) of its peer group.
Small Cap Value Fund: The average contractual advisory fee percentile rank across all share classes of the Fund is in the third quartile (72nd percentile) of its peer group and the net effective management fee is in the first quartile (16th percentile) as of December 31, 2016. The Fund’s asset weighted total net expense ratio is in the second quartile (36th percentile) of its peer group as of December 31, 2016. The Committee noted that in November 2016 the Adviser recommended and the Board approved a reduction in the Fund’s contractual advisory fee from 1.00% to 0.75%, effective February 1, 2017, along with the conclusion that the reduction in the advisory fee would not result in any decrease in the nature, extent and quality of services provided to the Fund. Based upon the new contractual advisory fee rate, the Fund’s gross management fee peer group rankings would be 25th percentile for Class A shares, 31st percentile for Class C shares, 18th percentile for Class I shares, and 29th percentile for Class P shares.
Total Return Bond Fund: The average contractual advisory fee percentile rank across all share classes of the Fund is in the fourth quartile (89th percentile) of its peer group and the net effective management fee and asset weighted total net expense ratio are in the second quartile (39th and 33rd percentiles, respectively) of its peer group. The Committee considered the Fund’s strong performance and top decile performance universe rankings for the five- and three-year periods ended December 31, 2016.
World Equity Income Fund: The average contractual advisory fee percentile rank across all share classes of the Fund and the net effective management fee are in the second quartile (32nd and 49th percentiles, respectively) of its peer group. The asset weighted total net expense ratio is in the third quartile (68th percentile) of its peer group. The Committee noted that in November 2016 the Adviser recommended and the Board approved a 24 basis point reduction in the Fund’s expense cap (across all share classes).
With respect to the costs of services provided and profits realized by Guggenheim Investments from its relationship with the Funds, the Committee reviewed a profitability analysis and data from management for each Fund setting forth the average assets under management for the twelve months ended December 31, 2016, ending assets under management of the Trust as of December 31, 2016, gross revenues received by Guggenheim Investments, expenses allocated to the Fund, expense waivers, earnings and the operating margin/profitability rate, including variance information relative to the foregoing amounts as of December 31, 2015. In addition, the Chief Financial Officer of Guggenheim Investments reviewed with, and addressed questions from, the Committee concerning the expense allocation methodology employed in producing the profitability analysis.
| | THE GUGGENHEIM FUNDS ANNUAL REPORT | 45 |
OTHER INFORMATION (Unaudited)(continued) |
In the course of its review of Guggenheim Investments’ profitability, the Committee took into account the methods used by Guggenheim Investments to determine expenses and profit. The Committee also noted steps taken by management to refine its methodology in preparation for contract review, including, among other things, revisions to the process for allocating expenses for shared service functions, as previously reported to and discussed with the Board. The Committee considered all of the foregoing in evaluating the costs of services provided, the profitability to Guggenheim Investments and the profitability rates presented, and concluded that the profits were not unreasonable.
The Committee considered other benefits available to each Adviser because of its relationship with the Funds and noted Guggenheim’s statement that until the completion of the RFS Transaction on October 4, 2016, the Adviser may have benefited from arrangements whereby an affiliate received fees from the Funds for providing certain fund administration and transfer agency services. In addition, the Committee noted Guggenheim’s statement that it may benefit from marketing synergies arising from offering a broad spectrum of products, including the Funds.
Economies of Scale: The Committee received and considered information regarding whether there have been economies of scale with respect to the management of the Funds as Fund assets grow, whether the Funds have appropriately benefited from any economies of scale, and whether there is potential for realization of any further economies of scale. The Committee considered whether economies of scale in the provision of services to the Funds were being passed along to the shareholders. The Committee noted the Adviser’s statements, including that Guggenheim believes it is appropriately sharing potential economies of scale and that costs continue to increase in many key areas, including compensation of portfolio managers, key analysts and support staff, as well as for infrastructure needs, with respect to risk management oversight, valuation processes and disaster recovery systems, among other things, and that, in this regard, management’s costs for providing services have increased in recent years without regard to asset levels.
The Committee also noted the process employed by the Adviser to evaluate whether a breakpoint would be appropriate for a Fund, with consideration given to, among other things: (i) the Fund’s size and trends in asset levels over recent years; (ii) the competitiveness of the expense levels; (iii) whether expense waivers are in place; (iv) changes and trends in revenue and expenses; (v) whether there are any anticipated expenditures that may benefit the Fund in the future; (vi) Fund profit level margins; (vii) relative Fund performance; (viii) the nature, extent and quality of services management provides to the Fund; and (ix) the complexity of the Fund’s investment strategy and the resources required to support the Fund.
As part of its assessment of economies of scale, the Committee also considered Guggenheim’s view that it seeks to share economies of scale through a number of means, including expense limitations and/or advisory fees set at competitive rates pre-assuming future asset growth. Thus, the Committee considered the size of the Funds and the competitiveness of and/or other
| 46 | THE GUGGENHEIM FUNDS ANNUAL REPORT | |
OTHER INFORMATION (Unaudited)(continued) |
determinations made regarding the current advisory fee for each Fund, as well as whether a Fund is subject to an expense limitation. The Committee also took into account, the advisory fee breakpoints offered by the Adviser and approved by the Board with respect to several of the fixed income Funds, to take effect on May 1, 2017.
The Committee determined that, taking into account all relevant factors, the advisory fee for each Fund was reasonable.
Sub-Advisory Agreement
Nature, Extent and Quality of Services Provided by the Sub-Adviser: With respect to the nature, extent and quality of services provided by GPIM (referred to in this discussion as the “Sub-Adviser”), the Committee considered the qualifications, experience and skills of the Sub-Adviser’s portfolio management and other key personnel and information from the Sub-Adviser describing the scope of its services to Municipal Income Fund. With respect to Guggenheim’s resources and the Sub-Adviser’s ability to carry out its responsibilities under the Sub-Advisory Agreement, as noted above, the Committee considered the financial condition of GPIMH. (Thereafter, the Committee received the audited consolidated financial statements of GPIM.)
The Committee also considered the acceptability of the terms of the Sub-Advisory Agreement. Based on the foregoing, and based on other information received (both oral and written) at the April Meeting and at the May Meeting, as well as other considerations, including the Committee’s knowledge of how the Sub-Adviser performs its duties obtained through Board meetings, discussions and reports throughout the year, the Committee concluded that the Sub-Adviser and its personnel were qualified to serve Municipal Income Fund in such capacity and may reasonably be expected to continue to provide a high quality of services under the Sub-Advisory Agreement.
Investment Performance: The Committee considered that the Fund’s Class A shares ranked in the third quartile (64th and 52nd percentiles) of its performance universe for the five-year and three-year periods ended December 31, 2016, respectively. The Committee concluded that the investment performance of the Fund and the Sub-Adviser was acceptable.
Comparative Fees, Costs of Services Provided and the Profits Realized by the Sub-Adviser from Its Relationship with the Fund: The Committee considered that the Sub-Advisory Agreement is with an affiliate of the Adviser, that the Adviser compensates the Sub-Adviser from its own fees so that the sub-advisory fee rate for the Fund does not impact the fees paid by the Fund and that the Sub-Adviser’s revenues were included in the calculation of Guggenheim Investments’ profitability. Given its determination of the reasonableness of the advisory fee, the Committee concluded that the sub-advisory fee rate for the Fund was reasonable.
Economies of Scale: The Committee recognized that, because the Sub-Adviser’s fees are paid by the Adviser and not the Fund, the analysis of economies of scale was more appropriate in the context of the Committee’s consideration of the applicable Advisory Agreement, which was separately considered. (See “Advisory Agreements – Economies of Scale” above.)
| | THE GUGGENHEIM FUNDS ANNUAL REPORT | 47 |
OTHER INFORMATION (Unaudited)(concluded) |
Overall Conclusions
Based on the foregoing, the Committee determined that the investment advisory fees are fair and reasonable in light of the extent and quality of the services provided and other benefits received and that the continuation of the Agreements is in the best interest of each Fund. In reaching this conclusion, no single factor was determinative or conclusive and each Committee member, in the exercise of his business judgment, may attribute different weights to different factors. At the May Meeting, the Committee, constituting all of the Independent Trustees, recommended the renewal of each Advisory Agreement and the Sub-Advisory Agreement for an additional annual term.
Thereafter, on May 24, 2017, the Board, including all of the Independent Trustees, approved the renewal of each of the Advisory Agreements and the Sub-Advisory Agreement for an additional annual term.
| 48 | THE GUGGENHEIM FUNDS ANNUAL REPORT | |
INFORMATION ON BOARD OF TRUSTEES AND OFFICERS (Unaudited) |
Name, Address*
and Year of Birth | Position(s) Held
with the Trust | Term of Office
and Length of
Time Served** | Principal Occupation(s)
During Past Five Years | Number of Portfolios in Fund Complex Overseen | Other Directorships
Held by Trustees |
| INDEPENDENT TRUSTEES | | | |
Randall C. Barnes
(1951) | Trustee | Since 2014 | Current: Private Investor (2001-present).
Former: Senior Vice President and Treasurer, PepsiCo, Inc. (1993-1997); President, Pizza Hut International (1991-1993); Senior Vice President, Strategic Planning and New Business Development, PepsiCo, Inc. (1987-1990). | 96 | Current: Trustee, Purpose Investments Inc. (2014-Present). |
Donald A.
Chubb, Jr.
(1946 ) | Trustee and Chairman of the Valuation Oversight Committee | Since 1994 | Current: Retired Former: Business broker and manager of commercial real estate, Griffith & Blair, Inc. (1997-2017). | 93 | Former: Midland Care, Inc. (2011-2016). |
Jerry B. Farley
(1946) | Trustee and Chair of the Audit Committee | Since 2005 | Current: President, Washburn University (1997-present). | 93 | Current: Westar Energy, Inc. (2004-present); CoreFirst Bank & Trust (2000-present). |
Roman
Friedrich III
(1946) | Trustee and Chairman of the Contracts Review Committee | Since 2014 | Current: Founder and Managing Partner, Roman Friedrich & Company (1998-present).
Former: Senior Managing Director, MLV & Co. LLC (2010-2011). | 93 | Current: Zincore Metals, Inc. (2009-present).
Former: Axiom Gold and Silver Corp. (2011-2012).
|
| | THE GUGGENHEIM FUNDS ANNUAL REPORT | 49 |
INFORMATION ON BOARD OF TRUSTEES AND OFFICERS (Unaudited)(continued) |
Name, Address*
and Year of Birth | Position(s) Held
with the Trust | Term of Office
and Length of
Time Served** | Principal Occupation(s)
During Past Five Years | Number of Portfolios in Fund Complex Overseen | Other Directorships
Held by Trustees |
| INDEPENDENT TRUSTEES - continued | | |
Robert B. Karn III
(1942)
| Trustee | Since 2014 | Current: Consultant (1998-present).
Former: Arthur Andersen (1965-1997) and Managing Partner, Financial and Economic Consulting, St. Louis office (1987-1997). | 93 | Current: GP Natural Resource Partners, LLC (2002-present).
Former: Peabody Energy Company (2003-Apr. 2017). |
Ronald A. Nyberg
(1953) | Trustee and Chairman of the Nominating and Governance Committee | Since 2014 | Current: Partner, Momkus McCluskey Roberts, LLC (2016-present).
Former: Partner, Nyberg & Cassioppi, LLC (2000-2016); Executive Vice President, General Counsel, and Corporate Secretary, Van Kampen Investments (1982-1999). | 98 | Current: Edward-Elmhurst Healthcare System (2012-present). |
| 50 | THE GUGGENHEIM FUNDS ANNUAL REPORT | |
INFORMATION ON BOARD OF TRUSTEES AND OFFICERS (Unaudited)(continued) |
Name, Address*
and Year of Birth | Position(s) Held
with the Trust | Term of Office
and Length of
Time Served** | Principal Occupation(s)
During Past Five Years | Number of Portfolios in Fund Complex Overseen | Other Directorships
Held by Trustees |
| INDEPENDENT TRUSTEES - concluded | | |
Maynard F. Oliverius
(1943)
| Trustee | Since 1998 | Current: Retired.
Former: President and CEO, Stormont-Vail HealthCare (1996-2012).
| 93 | Current: Robert J. Dole Institute of Politics (2016-present); Stormont-Vail Foundation (2013-present); University of Minnesota MHA Alumni Philanthropy Committee (2009-present); Fort Hays State University Foundation (1999-present).
Former: Topeka Community Foundation (2009-2014). |
Ronald E.
Toupin, Jr.
(1958)
| Trustee and Chairman of the Board | Since 2014 | Current: Portfolio Consultant (2010-present).
Former: Vice President, Manager and Portfolio Manager, Nuveen Asset Management (1998-1999); Vice President, Nuveen Investment Advisory Corp. (1992-1999); Vice President and Manager, Nuveen Unit Investment Trusts (1991-1999); and Assistant Vice President and Portfolio Manager, Nuveen Unit Investment Trusts (1988-1999), each of John Nuveen & Co., Inc. (1982-1999). | 95 | Former: Bennett Group of Funds (2011-2013). |
| | THE GUGGENHEIM FUNDS ANNUAL REPORT | 51 |
INFORMATION ON BOARD OF TRUSTEES AND OFFICERS (Unaudited)(continued) |
Name, Address*
and Year of Birth | Position(s) Held with the Trust | Term of Office
and Length of
Time Served** | Principal Occupation(s)
During Past Five Years | Number of Portfolios in Fund Complex Overseen | Other Directorships
Held by Trustees |
| INTERESTED TRUSTEE | | |
Donald C. Cacciapaglia***
(1951)
| Trustee | Since 2012 | Current: Vice Chairman, Guggenheim Investments (2010-present).
Former: President and CEO, certain other funds in the Fund Complex (2012-November 2017); Chairman and CEO, Channel Capital Group, Inc. (2002-2010).
| 226 | Current: Clear Spring Life Insurance Company (2015-present); Guggenheim Partners Japan, Ltd. (2014-present); Guggenheim Partners Investment Management Holdings, LLC (2014-present); Delaware Life (2013-present); Guggenheim Life and Annuity Company (2011-present); Paragon Life Insurance Company of Indiana (2011-present). |
| * | The business address of each Trustee is c/o Guggenheim Investments, 227 West Monroe Street, Chicago, Illinois 60606. |
| ** | Each Trustee serves an indefinite term, until his successor is elected and qualified. Time served includes time served in the respective position for the Predecessor Corporation. |
| *** | This Trustee is deemed to be an "interested person" of the Funds under the 1940 Act by reason of his position with the Funds' Investment Manager and/or the parent of the Investment Manager. |
| 52 | THE GUGGENHEIM FUNDS ANNUAL REPORT | |
INFORMATION ON BOARD OF TRUSTEES AND OFFICERS (Unaudited)(continued) |
Name, Address*
and Year of Birth | Position(s) Held
with the Trust | Term of Office
and Length of
Time Served** | Principal Occupations
During Past Five Years |
| OFFICERS | | | |
Joanna M. Catalucci
(1966)
| AML Officer | Since 2016 | Current: Chief Compliance Officer, certain funds in the Fund Complex (2012-present); Senior Managing Director, Guggenheim Investments (2014-present); AML Officer, certain funds in the Fund Complex (2016-present).
Former: Chief Compliance Officer and Secretary, certain other funds in the Fund Complex (2008-2012); Senior Vice President & Chief Compliance Officer, Security Investors, LLC and certain affiliates (2010-2012); Chief Compliance Officer and Senior Vice President, Rydex Advisors, LLC and certain affiliates (2010-2011). |
James M. Howley
(1972) | Assistant Treasurer | Since 2014 | Current: Managing Director, Guggenheim Investments (2004-present) ; Assistant Treasurer, certain other funds in the Fund Complex (2006-present).
Former: Manager, Mutual Fund Administration of Van Kampen Investments, Inc. (1996-2004). |
Keith D. Kemp
(1960)
| Assistant Treasurer | Since 2016 | Current: Treasurer and Assistant Treasurer, certain other funds in the Fund Complex (2010-present); Managing Director, Guggenheim Investments (2015-present); Chief Financial Officer, Guggenheim Specialized Products, LLC (2016-present).
Former: Managing Director and Director, Transparent Value, LLC (2010-2016); Director, Guggenheim Partners Investment Management, LLC (2010-2015); Chief Operating Officer, Macquarie Capital Investment Management (2007-2009). |
Amy J. Lee
(1961)
| President, Chief Executive Officer, and Chief Legal Officer | Since November 2017 (President and Chief Executive Officer)
Since 2014 (Chief Legal Officer) | Current: President and Chief Executive Officer, certain other funds in the Fund Complex (November 2017-present); Chief Legal Officer, certain other funds in the Fund Complex (2014-present); Senior Managing Director, Guggenheim Investments (2012-present).
Former: Vice President, Associate General Counsel and Assistant Secretary, Security Benefit Life Insurance Company and Security Benefit Corporation (2004-2012). |
| | THE GUGGENHEIM FUNDS ANNUAL REPORT | 53 |
INFORMATION ON BOARD OF TRUSTEES AND OFFICERS (Unaudited)(continued) |
Name, Address*
and Year of Birth | Position(s) Held
with the Trust | Term of Office
and Length of
Time Served** | Principal Occupations
During Past Five Years |
| OFFICERS - continued | |
Mark E. Mathiasen
(1978)
| Secretary | Since 2014 | Current: Secretary, certain other funds in the Fund Complex (2007-present); Managing Director, Guggenheim Investments (2007-present). |
Glenn McWhinnie
(1969)
| Assistant Treasurer | Since 2016 | Current: Vice President, Guggenheim Investments (2009-present).
Former: Tax Compliance Manager, Ernst & Young LLP (1996-2009). |
Michael P. Megaris
(1984)
| Assistant Secretary | Since 2014 | Current: Assistant Secretary, certain other funds in the Fund Complex (2014-present); Vice President, Guggenheim Investments (2012-present).
Former: J.D., University of Kansas School of Law (2009-2012). |
Elisabeth Miller
(1968)
| Chief Compliance Officer | Since 2012 | Current: CCO, certain other funds in the Fund Complex (2012-present); CCO, Security Investors, LLC (2012-present); CCO, Guggenheim Funds Investment Advisors, LLC (2012-present); Managing Director, Guggenheim Investments (2012-present); Vice President, Guggenheim Funds Distributors, LLC (March 2014-present).
Former: CCO, Guggenheim Distributors, LLC (2009-March 2014); Senior Manager, Security Investors, LLC (2004-2009); Senior Manager, Guggenheim Distributors, LLC (2004-2009). |
Adam J. Nelson
(1979)
| Assistant
Treasurer | Since 2015 | Current: Vice President, Guggenheim Investments (2015-present); Assistant Treasurer, certain other funds in the Fund Complex (2015-present).
Former: Assistant Vice President and Fund Administration Director, State Street Corporation (2013-2015); Fund Administration Assistant Director, State Street (2011-2013); Fund Administration Manager, State Street (2009-2011). |
| 54 | THE GUGGENHEIM FUNDS ANNUAL REPORT | |
INFORMATION ON BOARD OF TRUSTEES AND OFFICERS (Unaudited)(concluded) |
Name, Address*
and Year of Birth | Position(s) Held
with the Trust | Term of Office
and Length of
Time Served** | Principal Occupations
During Past Five Years |
| OFFICERS - concluded | |
Kimberly J. Scott
(1974)
| Assistant Treasurer | Since 2014 | Current: Director, Guggenheim Investments (2012-present) ; Assistant Treasurer, certain other funds in the Fund Complex (2012-present).
Former: Financial Reporting Manager, Invesco, Ltd. (2010-2011); Vice President/Assistant Treasurer, Mutual Fund Administration for Van Kampen Investments, Inc./Morgan Stanley Investment Management (2009-2010); Manager of Mutual Fund Administration, Van Kampen Investments, Inc./Morgan Stanley Investment Management (2005-2009). |
Bryan Stone
(1979)
| Vice President | Since 2014 | Current: Vice President, certain other funds in the Fund Complex (2014-present); Director, Guggenheim Investments (2013-present).
Former: Senior Vice President, Neuberger Berman Group LLC (2009-2013); Vice President, Morgan Stanley (2002-2009). |
John L. Sullivan
(1955)
| Chief Financial Officer and Treasurer | Since 2014 | Current: CFO, Chief Accounting Officer and Treasurer, certain other funds in the Fund Complex (2010-present); Senior Managing Director, Guggenheim Investments (2010-present).
Former: Managing Director and CCO, each of the funds in the Van Kampen Investments fund complex (2004-2010); Managing Director and Head of Fund Accounting and Administration, Morgan Stanley Investment Management (2002-2004); CFO and Treasurer, Van Kampen Funds (1996-2004). |
Jon Szafran (1989) | Assistant Treasurer | Since November 2017 | Current: Vice President, Guggenheim Investments (July 2017-present); Assistant Treasurer, certain other funds in the Fund Complex (November 2017-present).
Former: Assistant Treasurer of Henderson Global Funds and Manager of US Fund Administration, Henderson Global Investors (North America) Inc. (“HGINA”), (February-June 2017); Senior Analyst of US Fund Administration, HGINA (2014-January 2017); Senior Associate of Fund Administration, Cortland Capital Market Services, LLC (2013-2014); Experienced Associate, PricewaterhouseCoopers LLP (2012-2013). |
| * | The business address of each officer is c/o Guggenheim Investments, 227 West Monroe Street, Chicago, Illinois 60606. |
| ** | Each officer serves an indefinite term, until his or her successor is duly elected and qualified. Time served includes time served in the respective position for the Predecessor Corporation. |
| | THE GUGGENHEIM FUNDS ANNUAL REPORT | 55 |
GUGGENHEIM INVESTMENTS PRIVACY POLICIES (Unaudited) |
Guggenheim Investments as used herein refers to Guggenheim Partners, LLC, Guggenheim Funds Investment Advisors, LLC, Guggenheim Partners Investment Management, LLC, Guggenheim Funds Distributors, LLC and Security Investors, LLC as well as the funds in the Guggenheim Funds complex (the “funds”).
Our Commitment to You
When you become a Guggenheim Investments investor, you entrust us with not only your hard-earned money but also with personal and financial information about you. We recognize that your relationship with us is based on trust and that you expect us to act responsibly and in your best interests. Because we have access to personal information about you, we hold ourselves to high standards in its safekeeping and use. This means, most importantly, that we do not sell client or account information to anyone—whether you are a current or former Guggenheim Investments client.
The Information We Collect About You and How We Collect It
In the course of doing business with shareholders and investors, we collect nonpublic personal information about you. You typically provide personal information when you complete a Guggenheim Investments account application or when you request a transaction that involves Rydex and Guggenheim Funds or one of the Guggenheim affiliated companies. “Nonpublic personal information” is personally identifiable information about you. For example it includes your name and address, Social Security or taxpayer identification number, assets, income, account balance, bank account information and investment activity (e.g. purchase and redemption history).
How We Share Your Personal Information
As a matter of policy, we do not disclose your nonpublic personal information to nonaffiliated third parties except as required or permitted by law. As emphasized above, we do not sell information about current or former clients or their accounts to third parties. Nor do we share such information, except when necessary to complete transactions at your request or to make you aware of related investment products and services that we offer. Additional details about how we handle your personal information are provided below.
To complete certain transactions or account changes that you direct, it may be necessary to provide your personal information to companies, individuals or groups that are not affiliated with Guggenheim Investments. For example if you ask to transfer assets from another financial institution to Guggenheim Investments, we will need to provide certain information about you to that company to complete the transaction. In connection with servicing your accounts or to alert you to other Guggenheim Investments investment products and services, we may share your information within the Guggenheim Investments family of affiliated companies. This would include, for example, sharing your information within Guggenheim Investments so we can make you aware of new funds or the services offered through another Guggenheim Investments
| 56 | THE GUGGENHEIM FUNDS ANNUAL REPORT | |
GUGGENHEIM INVESTMENTS PRIVACY POLICIES (Unaudited)(concluded) |
affiliated company. In certain instances, we may contract with nonaffiliated companies to perform services for us. Where necessary, we will disclose information we have about you to these third parties. In all such cases, we provide the third party with only the information necessary to carry out its assigned responsibilities and only for that purpose. And we require these third parties to treat your personal information with the same high degree of confidentiality that we do. In certain instances, we may share information with other financial institutions regarding individuals and entities in response to the U.S.A. Patriot Act. Finally we will share personal information about you if we are compelled by law to do so, if you direct us to do so with your consent, or in other circumstances as permitted by law.
How We Safeguard Your Personal Information
We maintain physical, electronic and procedural safeguards to protect your personal information. Within Guggenheim Investments, access to such information is limited to those who need it to perform their jobs such as servicing your account, resolving problems or informing you of new products and services.
| | THE GUGGENHEIM FUNDS ANNUAL REPORT | 57 |