UNITED STATES
SECURITIES AND EXCHANGE COMMISSION
Washington, D.C. 20549
FORM N-CSR
CERTIFIED SHAREHOLDER REPORT OF REGISTERED
MANAGEMENT INVESTMENT COMPANIES
Investment Company Act file number 811- 01136
Guggenheim Funds Trust
(Exact name of registrant as specified in charter)
805 King Farm Boulevard, Suite 600
Rockville, Maryland 20850
(Address of principal executive offices) (Zip code)
Amy J. Lee
Guggenheim Funds Trust
805 King Farm Boulevard, Suite 600
Rockville, Maryland 20850
(Name and address of agent for service)
Registrant's telephone number, including area code: 1-301-296-5100
Date of fiscal year end: September 30
Date of reporting period: September 30, 2016
Form N-CSR is to be used by management investment companies to file reports with the Commission not later than 10 days after the transmission to stockholders of any report that is required to be transmitted to stockholders under Rule 30e‑1 under the Investment Company Act of 1940 (17 CFR 270.30e‑1). The Commission may use the information provided on Form N‑CSR in its regulatory, disclosure review, inspection, and policymaking roles.
A registrant is required to disclose the information specified by Form N‑CSR, and the Commission will make this information public. A registrant is not required to respond to the collection of information contained in Form N‑CSR unless the Form displays a currently valid Office of Management and Budget (“OMB”) control number. Please direct comments concerning the accuracy of the information collection burden estimate and any suggestions for reducing the burden to Secretary, Securities and Exchange Commission, 450 Fifth Street, NW, Washington, DC 20549‑0609. The OMB has reviewed this collection of information under the clearance requirements of 44 U.S.C. §3507.
| Item 1. | Reports to Stockholders. |
The registrant’s annual report transmitted to shareholders pursuant to Rule 30e-1 under the Investment Company Act of 1940, as amended (the “Investment Company Act”), is as follows:
9.30.2016
Guggenheim Funds Annual Report
Guggenheim Funds Trust-Equity |
Guggenheim Alpha Opportunity Fund | | |
Guggenheim Large Cap Value Fund | | |
Guggenheim Market Neutral Real Estate Fund | | |
Guggenheim Risk Managed Real Estate Fund | | |
Guggenheim Small Cap Value Fund | | |
Guggenheim StylePlus—Large Core Fund | | |
Guggenheim StylePlus—Mid Growth Fund | | |
Guggenheim World Equity Income Fund | | |
GuggenheimInvestments.com | SBE-ANN-0916x0917 |

DEAR SHAREHOLDER | 2 |
ECONOMIC AND MARKET OVERVIEW | 4 |
ABOUT SHAREHOLDERS’ FUND EXPENSES | 6 |
ALPHA OPPORTUNITY FUND | 9 |
LARGE CAP VALUE FUND | 25 |
MARKET NEUTRAL REAL ESTATE FUND | 37 |
RISK MANAGED REAL ESTATE FUND | 48 |
SMALL CAP VALUE FUND | 62 |
STYLEPLUS—LARGE CORE FUND | 75 |
STYLEPLUS—MID GROWTH FUND | 88 |
WORLD EQUITY INCOME FUND | 101 |
NOTES TO FINANCIAL STATEMENTS | 114 |
REPORT OF INDEPENDENT REGISTERED PUBLIC ACCOUNTING FIRM | 130 |
OTHER INFORMATION | 131 |
INFORMATION ON BOARD OF TRUSTEES AND OFFICERS | 141 |
GUGGENHEIM INVESTMENTS PRIVACY POLICIES | 145 |
| | THE GUGGENHEIM FUNDS ANNUAL REPORT | 1 |
Dear Shareholder:
Security Investors, LLC, and Guggenheim Partners Investment Management, LLC (the “Investment Advisers”) are pleased to present the shareholder report for a selection of our Funds (the “Funds”) for the annual fiscal year ended September 30, 2016.
The Investment Advisers are part of Guggenheim Investments, which represents the investment management businesses of Guggenheim Partners, LLC (“Guggenheim”), a global, diversified financial services firm.
Guggenheim Funds Distributors, LLC is the distributor of the Funds. Guggenheim Funds Distributors, LLC is affiliated with Guggenheim and the Investment Advisers.
We encourage you to read the Economic and Market Overview section of the report, which follows this letter, and then the Managers’ Commentary for each Fund.
We are committed to providing innovative investment solutions and appreciate the trust you place in us.
Sincerely,

Donald C. Cacciapaglia
President and Chief Executive Officer
October 31, 2016
Read a prospectus and summary prospectus (if available) carefully before investing. It contains the investment objectives, risks, charges, expenses and other information, which should be considered carefully before investing. Obtain a prospectus and summary prospectus (if available) at guggenheiminvestments.com or call 800.820.0888.
Alpha Opportunity Fund is subject to a number of risks and is not suitable for all investors.● Investments in securities and derivatives, in general, are subject to market risks that may cause their prices to fluctuate over time. An investment in the fund may lose money. There can be no guarantee the Fund will achieve it investment objective. ● The fund’s use of derivatives such as futures, options and swap agreements may expose the fund to additional risks that it would not be subject to if it invested directly in the securities underlying those derivatives. ● Certain of the derivative instruments, such as swaps and structured notes, are also subject to the risks of counterparty default and adverse tax treatment. ● The more the fund invests in leveraged instruments, the more the leverage will magnify any gains or losses on those investments. ● The fund’s use of short selling involves increased risk and costs, including paying more for a security than it received from its sale and the risk of unlimited losses. ● In certain circumstances the fund may be subject to liquidity risk and it may be difficult for the fund to purchase and sell particular investments within a reasonable time at a fair price. ● In certain circumstances, it may be difficult for the fund to purchase and sell particular investments within a reasonable time at a fair price. ● The Fund’s fixed income investments will change in value in response to interest rate changes and other factors. ● See the prospectus for more information on these and additional risks.
Large Cap Value Fund may not be suitable for all investors. ● An investment in the Fund will fluctuate and is subject to investment risks, which means an investor could lose money. ● The intrinsic value of the underlying stocks may never be realized, or the stock may decline in value. The Fund is subject to risk that large-capitalization stocks may underperform other segments of the equity market or the equity markets as a whole.
Market Neutral Real Estate Fund may not be suitable for all investors. ● Investing involves risk, including the possible loss of principal. ● There are no assurances that any fund will achieve its objective and/or strategy. ● The fund’s investments in real estate securities subject the fund to the same risks as direct investments in real estate, which is particularly sensitive to economic downturns. ● The fund’s use of derivatives such as futures, options, and swap agreements may expose the fund to additional risks that it would not be subject to if it invested directly in the securities underlying those derivatives. ● When market conditions are deemed appropriate, the fund will leverage to the full extent permitted by its investment policies and restrictions and applicable law. Leveraging will exaggerate the effect on net asset value of any increase or decrease in the market value of the fund’s portfolio.
2 | THE GUGGENHEIM FUNDS ANNUAL REPORT | |
● The more the fund invests in leveraged instruments, the more the leverage will magnify any gains or losses on those investments. ● The fund’s use of short selling involves increased risk and costs. The fund risks paying more for a security than it received from its sale. ● The fund’s investments in other investment vehicles subject the fund to those risks and expenses affecting the investment vehicle. ● The fund’s investments in foreign securities carry additional risks when compared to U.S. securities, due to the impact of diplomatic, political, or economic developments in the country in question (investments in emerging markets securities are generally subject to an even greater level of risks). ● The fund may invest in derivative instruments, which may be more volatile and less liquid, increasing the risk of loss when compared to traditional securities. Certain of the derivative instruments are also subject to the risks of counterparty default and adverse tax treatment. ● Investing in sector funds is more volatile than investing in broadly diversified funds, as there is a greater risk due to the concentration of the funds’ holdings in issuers of the same or similar offerings. ● This fund is considered non-diversified and can invest a greater portion of its assets in securities of individual issuers than a diversified fund. As a result, changes in the market value of a single security could cause greater fluctuations in the value of fund shares than would occur in a more diversified fund. ● Short selling involves increased risks and costs. You risk paying more for a security than you received from its sale. This strategy may not be suitable for all investors. ● The fund is subject to active trading risks that may increase volatility and impact its ability to achieve its investment objective. ● You may have a gain or loss when you sell your shares. ● It is important to note that the fund is not guaranteed by the U.S. government. ● Please read the prospectus for more detailed information regarding these and other risks.
Risk Managed Real Estate Fund may not be suitable for all investors. ● Investments in securities in general are subject to market risks that may cause their prices to fluctuate over time ● Investing involves risk, including the possible loss of principal. ● There are no assurances that any fund will achieve its objective and/or strategy. ● The Fund’s investments in real estate securities subject the Fund to the same risks as direct investments in real estate, which is particularly sensitive to economic downturns. ● The Fund’s use of derivatives such as futures, options and swap agreements may expose the fund to additional risks that it would not be subject to if it invested directly in the securities underlying those derivatives. ● When market conditions are deemed appropriate, the Fund will leverage to the full extent permitted by its investment policies and restrictions and applicable law. Leveraging will exaggerate the effect on net asset value of any increase or decrease in the market value of the Fund’s portfolio. ● The more the Fund invests in leveraged instruments, the more the leverage will magnify any gains or losses on those investments. ● The Fund’s use of short selling involves increased risk and costs. The Fund risks paying more for a security than it received from its sale. ● The Fund’s investments in other investment vehicles subject the Fund to those risks and expenses affecting the investment vehicle. ● The Fund’s investments in foreign securities carry additional risks when compared to U.S. securities, due to the impact of diplomatic, political or economic developments in the country in question (investments in emerging markets securities are generally subject to an even greater level of risks). ● The Fund may invest in derivative instruments, which may be more volatile and less liquid, increasing the risk of loss when compared to traditional securities. Certain of the derivative instruments are also subject to the risks of counterparty default and adverse tax treatment. ● Investing in sector funds is more volatile than investing in broadly diversified funds, as there is a greater risk due to the concentration of the funds’ holdings in issuers of the same or similar offerings. ● This Fund is considered non-diversified and can invest a greater portion of its assets in securities of individual issuers than a diversified fund. As a result, changes in the market value of a single security could cause greater fluctuations in the value of fund shares than would occur in a more diversified fund. ● Short selling involves increased risks and costs. You risk paying more for a security than you received from its sale. This strategy may not be suitable for all investors. ● The Fund is subject to active trading risks that may increase volatility and impact its ability to achieve its investment objective. ● You may have a gain or loss when you sell you shares. ● It is important to note that the Fund is no guaranteed by the U.S. government. ● Please read the prospectus for more detailed information regarding these and other risks.
Small Cap Value Fund may not be suitable for all investors. ● An investment in the Fund will fluctuate and is subject to investment risks, which means investors could lose money. ● The intrinsic value of the underlying stocks may never be realized, or the stock may decline in value. ● Investing in securities of small-capitalization companies may involve a greater risk of loss and more abrupt fluctuations in market price than investments in larger-capitalization companies.
StylePlus—Large Core Fund may not be suitable for all investors. ● Investments in large capitalization stocks may underperform other segments of the equity market or the equity market as a whole. ● Growth stocks may be more volatile than other stocks because they are more sensitive to investor perceptions regarding the growth potential of the issuing companies. Value stocks are subject to the risk that the intrinsic value of the stock may never be realized by the market or that the price goes down. ● The Fund may invest in derivative instruments, which may be more volatile and less liquid, increasing the risk of loss when compared to traditional securities. Certain of the derivative instruments are also subject to the risks of counterparty default and adverse tax treatment. ● The Fund’s use of leverage, through borrowings or instruments such as derivatives, may cause the Fund to be more volatile than if it had not been leveraged. ● The Fund’s investments in other investment vehicles subject the Fund to those risks and expenses affecting the investment vehicle. ● The Fund may invest in foreign securities which carry additional risks when compared to U.S. securities, due to the impact of diplomatic, political or economic developments in the country in question (investments in emerging markets securities are generally subject to an even greater level of risks). ● The Fund may invest in fixed income securities whose market value will change in response to interest rate changes and market conditions among other factors. In general, bond prices rise when interest rates fall and vice versa. ● The Fund’s exposure to high yield securities may subject the Fund to greater volatility. ● The Fund may invest in bank loans and asset-backed securities, including mortgage backed, which involve special types of risks. ● The Fund may invest in restricted securities which may involve financial and liquidity risk. ● You may have a gain or loss when you sell your shares. ● It is important to note that the Fund is not guaranteed by the U.S. government. ● Please read the prospectus for more detailed information regarding these and other risks.
StylePlus—Mid Growth Fund may not be suitable for all investors. ● Investments in mid-sized company securities may present additional risks such as less predictable earnings, higher volatility and less liquidity than larger, more established companies. ● Growth stocks may be more volatile than other stocks because they are more sensitive to investor perceptions regarding the growth potential of the issuing companies. ● The Fund may invest in derivative instruments, which may be more volatile and less liquid, increasing the risk of loss when compared to traditional securities. Certain of the derivative instruments are also subject to the risks of counterparty default and adverse tax treatment. ● The Fund’s use of leverage, through borrowings or instruments such as derivatives, may cause the Fund to be more volatile than if it had not been leveraged. ● The Fund’s investments in other investment vehicles subject the Fund to those risks and expenses affecting the investment vehicle. ● The Fund may invest in foreign securities which carry additional risks when compared to U.S. securities, due to the impact of diplomatic, political or economic developments in the country in question (investments in emerging markets securities are generally subject to an even greater level of risks). ● The Fund may invest in fixed income securities whose market value will change in response to interest rate changes and market conditions, among other factors. In general, bond prices rise when interest rates fall and vice versa. ● The Fund’s exposure to high yield securities may subject the Fund to greater volatility. ● The Fund may invest in bank loans and asset-backed securities, including mortgage backed, which involve special types of risks. ● The Fund may invest in restricted securities which may involve financial and liquidity risk. ● You may have a gain or loss when you sell your shares. ● It is important to note that the Fund is not guaranteed by the U.S. government. ● Please read the prospectus for more detailed information regarding these and other risks.
World Equity Income Fund may not be suitable for all investors. ● Investments in securities in general are subject to market risks that may cause their prices to fluctuate over time. ● The Fund’s investments in foreign securities carry additional risks when compared to U.S. securities, due to the impact of diplomatic, political or economic developments in the country in question (investments in emerging markets are generally subject to an even greater level of risks). Additionally, the Fund’s exposure to foreign currencies subjects the fund to the risk that those currencies will decline in value relative to the U.S. Dollar. ● The Fund’s investments in derivatives may pose risks in addition to those associated with investing directly in securities or other investments, including illiquidity of the derivatives, imperfect correlations with underlying investments or the Fund’s other portfolio holdings, lack of availability and counterparty risk. ● The Fund’s use of leverage, through instruments such as derivatives, may cause the fund to be more volatile than if it had not been leveraged. ● The Fund’s investments in other investment vehicles subject the Fund to those risks and expenses affecting the investment vehicle. ● The Fund may have significant exposure to securities in a particular capitalization range e.g., large-, mid- or small-cap securities. As a result, the Fund may be subject to the risk that the pre-denominate capitalization range may underperform other segments of the equity market or the equity market as a whole. ● Please read the prospectus for more detailed information regarding these and other risks.
| | THE GUGGENHEIM FUNDS ANNUAL REPORT | 3 |
ECONOMIC AND MARKET OVERVIEW (Unaudited) | September 30, 2016 |
Economic growth continues to rebound, even though the rise in U.S. Gross Domestic Product (“GDP”) disappointed in the first half of 2016. There was a large headwind from inventory drawdowns, which should soon reverse after five quarters of dragging on growth. Real GDP growth is expected to be around 2.5 percent in the second half of the year, driven by consumption, housing, and a fading trade drag, and supporting the view that U.S. economic growth remains resilient to global weakness.
The euro zone economy is slowly improving, but inflation will likely persist well below the European Central Bank’s (“ECB”) target in the coming quarters due to substantial slack. The ECB has indicated that more quantitative easing is possible, but will soon need to alter the quantitative easing program in order to keep up their purchase pace. Both China and Japan need weaker currencies. Chinese growth and capital flows have stabilized for now, but surging construction and a credit boom raise the prospect of future instability. Japan’s economic prospects are weak, and inflation remains far from the Bank of Japan’s (“BOJ”) target. The surging yen could drive further policy easing, including an increase in fiscal stimulus.
It appears the U.S. Federal Reserve (the “Fed”) will move forward with raising rates in December, absent any economic or geopolitical surprise or a meaningful tightening of financial conditions over the fourth quarter. But key events could influence risk asset performance for the balance of the year: A continued recovery in oil prices following the Organization of Petroleum Exporting Countries (“OPEC”) agreement to keep production between 32.5 to 33 million barrels per day would help sustain the rally (although we are skeptical that they will adhere to any quota based on historical production levels). Global oil inventories remain high, but supply and demand are moving toward balance. A rebound in GDP growth would also lift U.S. equity and corporate bond prices higher.
The macroeconomic picture remains the same; we are not on the verge of a recession. But despite our positive outlook on the U.S. economy, valuations across risk assets argue for caution. Ongoing accommodation from central bankers across the globe has alleviated much of the initial macroeconomic tail risk posed by Brexit but may not be enough to dampen the seasonal volatility typically observed in the fourth quarter. Ongoing troubles in the banking sector, such as the woes afflicting Deutsche Bank and Wells Fargo, coupled with uncertainty surrounding upcoming political events, which include the new Trump administration, the Italian constitutional referendum, and key European elections, may create volatility for risk assets for the balance of the year.
For the 12 months ended September 30, 2016, the Standard & Poor’s 500® (“S&P 500®”) Index* returned 15.43%. The MSCI Europe-Australasia-Far East (“EAFE”) Index* returned 6.52%. The return of the MSCI Emerging Markets Index* was 16.78%.
In the bond market, the Bloomberg Barclays U.S. Aggregate Bond Index* posted a 5.19% return for the period, while the Bloomberg Barclays U.S. Corporate High Yield Index* returned 12.73%. The return of the Bank of America (“BofA”) Merrill Lynch 3-Month U.S. Treasury Bill Index* was 0.28% for the 12-month period.
The opinions and forecasts expressed may not actually come to pass. This information is subject to change at any time, based on market and other conditions, and should not be construed as a recommendation of any specific security or strategy.
*Index Definitions
The following indices are referenced throughout this report. Indices are unmanaged and not available for direct investment. Index performance does not reflect transaction costs, fees, or expenses.
BofA Merrill Lynch 3-Month U.S. Treasury Bill Index is an unmanaged market Index of U.S. Treasury securities maturing in 90 days that assumes reinvestment of all income.
Bloomberg Barclays U.S. Aggregate Bond Index is a broad-based flagship benchmark that measures the investment grade, U.S. dollar denominated, fixed-rate taxable bond market, including U.S. Treasuries, government-related and corporate securities, mortgage-backed securities or “MBS” (agency fixed-rate and hybrid adjustable-rate mortgage, or “ARM”, pass-throughs), asset-backed securities (“ABS”), and commercial mortgage-backed securities (“CMBS”) (agency and non-agency).
Bloomberg Barclays U.S. Corporate High Yield Index measures the U.S. dollar denominated, high yield, fixed-rate corporate bond market. Securities are classified as high yield if the middle rating of Moody’s, Fitch, and S&P is Ba1/BB +/BB + or below.
FTSE NAREIT Equity REITs Index is one of the FTSE NAREIT U.S. Real Estate Index Series that contains all Equity REITs not designated as Timber REITs or Infrastructure REITs. FTSE NAREIT U.S. Real Estate Index Series is designed to present investors with a comprehensive family of REIT performance indexes that spans the commercial real estate space across the U.S. economy. The index series provides investors with exposure to all investment and property sectors. In addition, the more narrowly focused property sector and sub-sector indexes provide the facility to concentrate commercial real estate exposure in more selected markets. The National Association of Real Estate Investment Trusts (“NAREIT”) is the trade association for REITs and publicly traded real estate companies with an interest in the U.S. property and investment markets.
4 | THE GUGGENHEIM FUNDS ANNUAL REPORT | |
ECONOMIC AND MARKET OVERVIEW (Unaudited)(concluded) | September 30, 2016 |
MSCI EAFE Index is a capitalization-weighted measure of stock markets in Europe, Australasia, and the Far East.
MSCI Emerging Markets Index is a free float-adjusted market capitalization-weighted index that is designed to measure equity market performance in the global emerging markets.
MSCI World Index is calculated with net dividends reinvested. It is a free float-adjusted market capitalization weighted index that is designed to measure the equity market performance of developed markets.
Russell 1000® Value Index is a measure of the performance for the large-cap value segment of the U.S. equity universe. It includes those Russell 1000 companies with lower price-to-book ratios and lower expected growth values.
Russell 2000® Value Index measures the performance of the small-cap value segment of the U.S. equity universe. It includes those Russell 2000 companies with lower price-to-book ratios and lower forecasted growth values.
Russell 3000® Index measures the performance of the largest 3,000 U.S. companies, representing approximately 98% of the investable U.S. equity market.
Russell Midcap Growth® Index measures the performance of the mid-cap growth segment of the U.S. equity universe. It includes those Russell Midcap Index companies with higher price-to-book ratios and higher forecasted growth values.
S&P 500® Index is a broad-based index, the performance of which is based on the performance of 500 widely held common stocks chosen for market size, liquidity, and industry group representation.
| | THE GUGGENHEIM FUNDS ANNUAL REPORT | 5 |
ABOUT SHAREHOLDERS’ FUND EXPENSES (Unaudited) | |
All mutual funds have operating expenses, and it is important for our shareholders to understand the impact of costs on their investments. Shareholders of a fund incur two types of costs: (i) transaction costs, including sales charges (loads) on purchase payments, reinvested dividends, other distributions, and exchange fees, and (ii) ongoing costs, including management fees, administrative services, and shareholder reports, among others. These ongoing costs, or operating expenses, are deducted from a fund’s gross income and reduce the investment return of the fund.
A fund’s expenses are expressed as a percentage of its average net assets, which is known as the expense ratio. The following examples are intended to help investors understand the ongoing costs (in dollars) of investing in a fund and to compare these costs with the ongoing costs of investing in other mutual funds.
The examples are based on an investment of $1,000 made at the beginning of the period and held for the entire six-month period beginning March 31, 2016 and ending September 30, 2016.
The following tables illustrate the Funds’ costs in two ways:
Table 1. Based on actual Fund return: This section helps investors estimate the actual expenses paid over the period. The “Ending Account Value” shown is derived from the Fund’s actual return, and the fifth column shows the dollar amount that would have been paid by an investor who started with $1,000 in the Fund. Investors may use the information here, together with the amount invested, to estimate the expenses paid over the period. Simply divide the Fund’s account value by $1,000 (for example, an $8,600 account value divided by $1,000 = 8.6), then multiply the result by the number provided under the heading “Expenses Paid During Period.”
Table 2. Based on hypothetical 5% return: This section is intended to help investors compare a Fund’s cost with those of other mutual funds. The table provides information about hypothetical account values and hypothetical expenses based on the Fund’s actual expense ratio and an assumed rate of return of 5% per year before expenses, which is not the Fund’s actual return. The hypothetical account values and expenses may not be used to estimate the actual ending account balance or expenses paid during the period. The example is useful in making comparisons because the U.S. Securities and Exchange Commission (the “SEC”) requires all mutual funds to calculate expenses based on the 5% return. Investors can assess a Fund’s costs by comparing this hypothetical example with the hypothetical examples that appear in shareholder reports of other funds.
The calculations illustrated above assume no shares were bought or sold during the period. Actual costs may have been higher or lower, depending on the amount of investment and the timing of any purchases or redemptions.
Please note that the expenses shown in the table are meant to highlight your ongoing costs only and do not reflect any transactional costs, such as sales charges (loads) on purchase payments, and contingent deferred sales charges (“CDSC”) on redemptions, if any. Therefore, the second table is useful in comparing ongoing costs only, and will not help you determine the relative total costs of owning different funds. In addition, if these transactional costs were included, your costs would have been higher.
More information about the Funds’ expenses, including annual expense ratios for periods up to five years (subject to the Fund’s inception date), can be found in the Financial Highlights section of this report. For additional information on operating expenses and other shareholder costs, please refer to the appropriate Fund prospectus.
6 | THE GUGGENHEIM FUNDS ANNUAL REPORT | |
ABOUT SHAREHOLDERS’ FUND EXPENSES (Unaudited)(continued) | |
| | Expense
Ratio1 | Fund
Return | Beginning
Account Value
March 31, 2016 | Ending
Account Value
September 30, 2016 | Expenses
Paid During
Period2 |
Table 1. Based on actual Fund return3 | | | | | |
Alpha Opportunity Fund | | | | | |
A-Class | 2.62% | (2.00%) | $ 1,000.00 | $ 980.00 | $ 13.00 |
C-Class | 3.60% | (2.36%) | 1,000.00 | 976.40 | 17.84 |
P-Class | 2.50% | (1.85%) | 1,000.00 | 981.50 | 12.42 |
Institutional Class | 2.19% | (1.65%) | 1,000.00 | 983.50 | 10.89 |
Large Cap Value Fund | | | | | |
A-Class | 1.16% | 9.20% | 1,000.00 | 1,092.00 | 6.08 |
C-Class | 1.91% | 8.80% | 1,000.00 | 1,088.00 | 10.00 |
P-Class | 1.16% | 9.24% | 1,000.00 | 1,092.40 | 6.08 |
Institutional Class | 0.92% | 9.33% | 1,000.00 | 1,093.30 | 4.83 |
Market Neutral Real Estate Fund | | | | | |
A-Class | 1.63% | (0.61%) | 1,000.00 | 993.90 | 8.15 |
C-Class | 2.37% | (0.94%) | 1,000.00 | 990.60 | 11.83 |
P-Class | 1.66% | (0.61%) | 1,000.00 | 993.90 | 8.30 |
Institutional Class | 1.38% | (0.45%) | 1,000.00 | 995.50 | 6.90 |
Risk Managed Real Estate Fund | | | | | |
A-Class | 1.74% | 4.38% | 1,000.00 | 1,043.80 | 8.91 |
C-Class | 2.50% | 3.99% | 1,000.00 | 1,039.90 | 12.78 |
P-Class | 1.76% | 4.37% | 1,000.00 | 1,043.70 | 9.02 |
Institutional Class | 1.43% | 4.53% | 1,000.00 | 1,045.30 | 7.33 |
Small Cap Value Fund | | | | | |
A-Class | 1.31% | 6.92% | 1,000.00 | 1,069.20 | 6.80 |
C-Class | 2.06% | 6.44% | 1,000.00 | 1,064.40 | 10.66 |
P-Class | 1.32% | 6.91% | 1,000.00 | 1,069.10 | 6.85 |
Institutional Class | 1.06% | 7.09% | 1,000.00 | 1,070.90 | 5.50 |
StylePlus—Large Core Fund | | | | | |
A-Class | 1.26% | 7.68% | 1,000.00 | 1,076.80 | 6.56 |
C-Class | 2.19% | 7.16% | 1,000.00 | 1,071.60 | 11.37 |
P-Class | 1.18% | 7.73% | 1,000.00 | 1,077.30 | 6.14 |
Institutional Class | 0.94% | 7.88% | 1,000.00 | 1,078.80 | 4.90 |
StylePlus—Mid Growth Fund | | | | | |
A-Class | 1.36% | 7.14% | 1,000.00 | 1,071.40 | 7.06 |
C-Class | 2.26% | 6.63% | 1,000.00 | 1,066.30 | 11.71 |
P-Class | 1.29% | 7.16% | 1,000.00 | 1,071.60 | 6.70 |
Institutional Class | 1.43% | 7.07% | 1,000.00 | 1,070.70 | 7.42 |
World Equity Income Fund | | | | | |
A-Class | 1.41% | 4.35% | 1,000.00 | 1,043.50 | 7.22 |
C-Class | 2.22% | 3.92% | 1,000.00 | 1,039.20 | 11.35 |
P-Class | 1.27% | 5.09% | 1,000.00 | 1,050.90 | 6.53 |
Institutional Class | 1.22% | 4.45% | 1,000.00 | 1,044.50 | 6.25 |
| | THE GUGGENHEIM FUNDS ANNUAL REPORT | 7 |
ABOUT SHAREHOLDERS’ FUND EXPENSES (Unaudited)(concluded) | |
| | Expense
Ratio1 | Fund
Return | Beginning
Account Value
March 31, 2016 | Ending
Account Value
September 30, 2016 | Expenses
Paid During
Period2 |
Table 2. Based on hypothetical 5% return (before expenses) | | | | |
Alpha Opportunity Fund | | | | | |
A-Class | 2.62% | 5.00% | $ 1,000.00 | $ 1,011.93 | $ 13.21 |
C-Class | 3.60% | 5.00% | 1,000.00 | 1,007.02 | 18.11 |
P-Class | 2.50% | 5.00% | 1,000.00 | 1,012.53 | 12.61 |
Institutional Class | 2.19% | 5.00% | 1,000.00 | 1,014.09 | 11.06 |
Large Cap Value Fund | | | | | |
A-Class | 1.16% | 5.00% | 1,000.00 | 1,019.25 | 5.87 |
C-Class | 1.91% | 5.00% | 1,000.00 | 1,015.49 | 9.65 |
P-Class | 1.16% | 5.00% | 1,000.00 | 1,019.25 | 5.87 |
Institutional Class | 0.92% | 5.00% | 1,000.00 | 1,020.46 | 4.66 |
Market Neutral Real Estate Fund | | | | | |
A-Class | 1.63% | 5.00% | 1,000.00 | 1,016.90 | 8.24 |
C-Class | 2.37% | 5.00% | 1,000.00 | 1,013.19 | 11.96 |
P-Class | 1.66% | 5.00% | 1,000.00 | 1,016.75 | 8.39 |
Institutional Class | 1.38% | 5.00% | 1,000.00 | 1,018.15 | 6.98 |
Risk Managed Real Estate Fund | | | | | |
A-Class | 1.74% | 5.00% | 1,000.00 | 1,016.34 | 8.80 |
C-Class | 2.50% | 5.00% | 1,000.00 | 1,016.29 | 12.61 |
P-Class | 1.76% | 5.00% | 1,000.00 | 1,019.60 | 8.90 |
Institutional Class | 1.43% | 5.00% | 1,000.00 | 1,017.90 | 7.23 |
Small Cap Value Fund | | | | | |
A-Class | 1.31% | 5.00% | 1,000.00 | 1,018.50 | 6.63 |
C-Class | 2.06% | 5.00% | 1,000.00 | 1,014.74 | 10.40 |
P-Class | 1.32% | 5.00% | 1,000.00 | 1,018.45 | 6.68 |
Institutional Class | 1.06% | 5.00% | 1,000.00 | 1,019.75 | 5.37 |
StylePlus—Large Core Fund | | | | | |
A-Class | 1.26% | 5.00% | 1,000.00 | 1,018.75 | 6.38 |
C-Class | 2.19% | 5.00% | 1,000.00 | 1,014.09 | 11.06 |
P-Class | 1.18% | 5.00% | 1,000.00 | 1,019.15 | 5.97 |
Institutional Class | 0.94% | 5.00% | 1,000.00 | 1,020.36 | 4.76 |
StylePlus—Mid Growth Fund | | | | | |
A-Class | 1.36% | 5.00% | 1,000.00 | 1,018.25 | 6.88 |
C-Class | 2.26% | 5.00% | 1,000.00 | 1,013.74 | 11.41 |
P-Class | 1.29% | 5.00% | 1,000.00 | 1,018.60 | 6.53 |
Institutional Class | 1.43% | 5.00% | 1,000.00 | 1,017.90 | 7.23 |
World Equity Income Fund | | | | | |
A-Class | 1.41% | 5.00% | 1,000.00 | 1,018.00 | 7.13 |
C-Class | 2.22% | 5.00% | 1,000.00 | 1,013.94 | 11.21 |
P-Class | 1.27% | 5.00% | 1,000.00 | 1,024.72 | 6.43 |
Institutional Class | 1.22% | 5.00% | 1,000.00 | 1,018.95 | 6.17 |
1 | This ratio represents annualized net expenses, which may include short dividend and interest expenses. Excluding these expenses, the operating expense ratio for the Alpha Opportunity Fund would be 2.11%, 2.87%, 1.81% and 1.42% and the Risk Managed Real Estate Fund would be 1.29%, 2.04%, 1.29% and 0.99% for the A-Class, C-Class, P-Class and Institutional Class, respectively. Excludes expenses of the underlying funds in which the Funds invest. |
2 | Expenses are equal to the Fund's annualized expense ratio, net of any applicable fee waivers, multiplied by the average account value over the period, multiplied by 183/365 (to reflect the one-half year period). |
3 | Actual cumulative return at net asset value for the period March 31, 2016 to September 30, 2016. |
8 | THE GUGGENHEIM FUNDS ANNUAL REPORT | |
MANAGERS’ COMMENTARY (Unaudited) | September 30, 2016 |
Dear Shareholder:
Guggenheim Alpha Opportunity Fund (the “Fund”) is managed by a team of seasoned professionals, including Farhan Sharaff, Senior Managing Director and Assistant Chief Investment Officer, Equities, and Portfolio Manager; Jayson Flowers, Senior Managing Director and Portfolio Manager; Samir Sanghani, CFA, Managing Director and Portfolio Manager; and Burak Hurmeydan, Ph.D., Vice President and Portfolio Manager. In the paragraphs below, the team discusses the performance of the Fund for the 12-month period ended September 30, 2016.
For the one year period ended September 30, 2016, the Guggenheim Alpha Opportunity Fund returned 3.70%1, compared with the 15.43% return of its benchmark, the S&P 500 Index. The Fund’s secondary benchmark is the Morningstar Long/Short Equity Category Average. Its return for the 12 months was 1.12%.
Investment Approach
For the period, the Fund was managed as an opportunistic long/short strategy, which employs forward-looking, fundamental analysis to measure the market’s expected return for each stock in the universe. Quantitative techniques are then applied to evaluate market- and company-specific risk factors embedded in each stock and to assess which specific risk factors (such as size, growth, or sectors) are being overvalued or undervalued by the market. Finally, a portfolio is constructed within guidelines that is long the stocks that give the portfolio both the broad risk characteristics and company-specific risks that are perceived to be undervalued and is short stocks for which those characteristics are perceived to be overpriced.
The Fund will ordinarily hold simultaneous long and short positions in equity securities or securities markets that provide exposure up to a level equal to 150% of the Fund’s net assets for both the long and short positions. The Fund intends to maintain a low overall net exposure (the difference between the notional value of long positions and the notional value of short positions), typically varying between 50% net long and 30% net short in order to maintain low correlation to traditional equity markets and lower-than-market volatility, and seek to provide consistent absolute return. The overall net exposure will change as market opportunities change, and may, based on the Fund’s view of current market conditions, be outside this range.
Performance Review
On average during the period, the Fund held about 132% of assets in long securities, and 95% short–for an average net-dollar exposure of 37%. The realized net beta (sensitivity of monthly Fund returns to broad market moves) averaged around 0.08 during the year. This low realized beta is partly by design (the Fund target net beta ranged in the 0.10 to 0.30 during the trailing year) and partly due to some significant alpha being produced during the January market drop (when the Fund ended with gains while the broad market declined more than 5%). For the period, the long positions averaged a return of +14.6%, compared to the Russell 3000 index return of +15.0%. Short positions averaged a return of 12.6%, so the short positions detracted from performance. Still, the shorts rose less than the market, thus providing the bulk of the fund’s “alpha” for the period.
The year ending September 30, 2016, included a broad market that ground higher as interest rates continued their long term trend of quantitative easing-led declines. With risk free rates declining in most major developed nations, the relative yield and return potential of stocks proved too attractive to resist. In most developed nations, stocks actually provided more income than long term government bonds, with a potential growth kicker that bonds could not provide.
However, looking inside the broad market moves, the trailing year was really a story of two halves. For the last quarter of 2015 and first quarter of 2016, global growth prospects looked grim, and the risk default of energy and materials companies was driving credit fears through the markets. In that environment, any tilt towards higher quality and lower volatility businesses paid off tremendously. The Fund’s tilt towards defensive sectors (Consumer Staples, Utilities, Telecom, and Health Care), close to zero net exposure in Energy, and net short in Materials–all paid off during those six months, with positive returns close to overall market levels and with fairly low net beta to that market.
During the final six months of the fiscal year, certain global economic indicators improved (including some key indicators in China–which serves as the largest marginal growth consumption story), leading to a rebound in risk-on sectors and low quality firms. The Fund gave back about 2% of its earlier gains despite the continued rise in the broad market.
| | THE GUGGENHEIM FUNDS ANNUAL REPORT | 9 |
MANAGERS’ COMMENTARY (Unaudited)(concluded) | September 30, 2016 |
For the full year, the strategy’s financial fundamental tilts provided some positive alpha–led by higher free cash flow and profitability biases. The Fund’s sector exposures also provided positive return to the Fund with long exposures to Utilities and short exposures to Consumer Discretionary being the largest contributors.
Derivatives in the Fund are used only to take an equity long or short position above 100% of NAV (that is, to increase leverage). Long side average exposure was 132% for the period.
Performance displayed represents past performance which is no guarantee of future results.
1 | Performance figures are based on Class A shares and do not reflect taxes that a shareholder would pay on distributions or the redemption of shares. |
The opinions and forecast expressed may not actually come to pass. This information is subject to change at any time, based on market and other conditions, and should not be construed as a recommendation of any specific security or strategy.
10 | THE GUGGENHEIM FUNDS ANNUAL REPORT | |
PERFORMANCE REPORT AND FUND PROFILE (Unaudited) | September 30, 2016 |
ALPHA OPPORTUNITY FUND
OBJECTIVE: Seeks long-term growth of capital.
Holdings Diversification (Market Exposure as % of Net Assets)
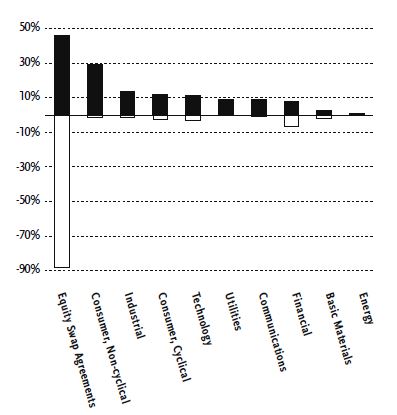
“Holdings Diversification (Market Exposure as % of Net Assets)” excludes any temporary cash investments.
Inception Dates: |
A-Class | July 7, 2003 |
C-Class | July 7, 2003 |
P-Class | May 1, 2015 |
Institutional Class | November 7, 2008 |
Ten Largest Long Holdings (% of Total Net Assets) |
Wal-Mart Stores, Inc. | 1.5% |
CVS Health Corp. | 1.5% |
Danaher Corp. | 1.4% |
Southwest Airlines Co. | 1.3% |
AT&T, Inc. | 1.3% |
Verizon Communications, Inc. | 1.2% |
Fluor Corp. | 1.1% |
HCA Holdings, Inc. | 1.0% |
UniFirst Corp. | 1.0% |
UGI Corp. | 1.0% |
Top Ten Total | 12.3% |
| | |
“Ten Largest Long Holdings” excludes any temporary cash or derivative investments. |
| | THE GUGGENHEIM FUNDS ANNUAL REPORT | 11 |
PERFORMANCE REPORT AND FUND PROFILE (Unaudited)(concluded) | September 30, 2016 |
Cumulative Fund Performance*
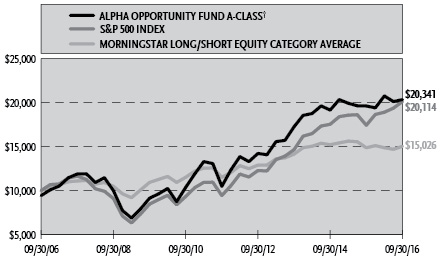
Average Annual Returns*
Periods Ended September 30, 2016
| | 1 Year | 5 Year | 10 Year |
A-Class Shares | 3.70% | 14.20% | 8.00% |
A-Class Shares with sales charge† | -1.24% | 13.09% | 7.36% |
C-Class Shares | 2.91% | 13.33% | 7.17% |
C-Class Shares with CDSC‡ | 1.91% | 13.33% | 7.17% |
S&P 500 Index | 15.43% | 16.37% | 7.24% |
Morningstar Long/Short Equity Category Average | 1.12% | 5.49% | 4.16% |
| | | 1 Year | Since Inception
(05/01/15) |
P-Class Shares | | 3.86% | -0.04% |
S&P 500 Index | | 15.43% | 4.28% |
Morningstar Long/Short Equity Category Average | | 1.12% | -3.11% |
| | 1 Year | 5 Year | Since Inception
(11/07/08) |
Institutional Class Shares | 4.20% | 14.66% | 13.31% |
S&P 500 Index | 15.43% | 16.37% | 13.75% |
Morningstar Long/Short Equity Category Average | 1.12% | 5.49% | 5.82% |
* | The performance data above represents past performance that is not predictive of future results. The investment return and principal value of an investment in the Fund will fluctuate so that an investor’s shares, when redeemed, may be worth more or less than their original cost. Returns are historical and include changes in principal and reinvested dividends and capital gains and do not reflect the effect of taxes. The S&P 500 Index and Morningstar Long/Short Equity Category Average are unmanaged indices and, unlike the Fund, have no management fees or operating expenses to reduce their reported returns. The graph is based on A-Class shares only; performance for C-Class, P-Class and Institutional Class will vary due to differences in fee structures. |
† | Effective February 22, 2011, the maximum sales charge decreased from 5.75% to 4.75%. A 5.75% maximum sales charge is used in the calculation of the 10 Year average annual return (based on subscriptions made prior to February 22, 2011), and a 4.75% maximum sales charge will be used to calculate performance for periods based on subscriptions made on or after February 22, 2011. |
‡ | Fund returns include a CDSC of 1% if redeemed within 12 months of purchase. |
12 | THE GUGGENHEIM FUNDS ANNUAL REPORT | |
SCHEDULE OF INVESTMENTS | September 30, 2016 |
ALPHA OPPORTUNITY FUND | |
| | | Shares | | | Value | |
| | | | | | | |
COMMON STOCKS† - 94.9% | |
| | | | | | | |
Consumer, Non-cyclical - 29.4% | |
Danaher Corp. | | | 13,550 | | | $ | 1,062,184 | |
HCA Holdings, Inc.*,1 | | | 10,891 | | | | 823,686 | |
United Natural Foods, Inc.* | | | 17,457 | | | | 698,978 | |
AbbVie, Inc.1 | | | 10,999 | | | | 693,707 | |
Sanderson Farms, Inc. | | | 7,142 | | | | 687,989 | |
Express Scripts Holding Co.*,1 | | | 9,750 | | | | 687,668 | |
Laboratory Corporation of America Holdings*,2 | | | 4,926 | | | | 677,226 | |
Pfizer, Inc. | | | 19,856 | | | | 672,523 | |
ManpowerGroup, Inc. | | | 9,255 | | | | 668,766 | |
AmerisourceBergen Corp. — Class A | | | 8,144 | | | | 657,872 | |
Tyson Foods, Inc. — Class A1 | | | 8,438 | | | | 630,065 | |
Quest Diagnostics, Inc.1 | | | 6,984 | | | | 591,056 | |
United Therapeutics Corp.*,1 | | | 4,889 | | | | 577,293 | |
DaVita, Inc.* | | | 8,570 | | | | 566,220 | |
JM Smucker Co.2 | | | 4,163 | | | | 564,253 | |
Dr Pepper Snapple Group, Inc.1 | | | 6,003 | | | | 548,134 | |
MEDNAX, Inc.* | | | 8,148 | | | | 539,805 | |
Dean Foods Co.1 | | | 31,771 | | | | 521,044 | |
Ingredion, Inc.1 | | | 3,842 | | | | 511,217 | |
Total System Services, Inc. | | | 10,552 | | | | 497,527 | |
Darling Ingredients, Inc.*,1 | | | 36,382 | | | | 491,521 | |
Flowers Foods, Inc.1 | | | 32,137 | | | | 485,911 | |
United Rentals, Inc.* | | | 5,714 | | | | 448,492 | |
Merck & Company, Inc.2 | | | 6,644 | | | | 414,652 | |
Charles River Laboratories International, Inc.*,1 | | | 4,789 | | | | 399,115 | |
Whole Foods Market, Inc. | | | 13,489 | | | | 382,413 | |
Johnson & Johnson2 | | | 3,061 | | | | 361,596 | |
Kimberly-Clark Corp. | | | 2,851 | | | | 359,625 | |
LifePoint Health, Inc.*,1 | | | 5,744 | | | | 340,217 | |
SpartanNash Co.1 | | | 11,657 | | | | 337,120 | |
Coty, Inc. — Class A* | | | 14,000 | | | | 329,000 | |
Post Holdings, Inc.* | | | 4,226 | | | | 326,120 | |
Universal Corp. | | | 5,559 | | | | 323,645 | |
Cambrex Corp.*,1 | | | 7,036 | | | | 312,821 | |
Emergent BioSolutions, Inc.* | | | 9,878 | | | | 311,454 | |
Becton Dickinson and Co. | | | 1,706 | | | | 306,619 | |
Robert Half International, Inc. | | | 7,993 | | | | 302,615 | |
ResMed, Inc.1 | | | 4,454 | | | | 288,575 | |
Deluxe Corp.1 | | | 4,256 | | | | 284,386 | |
RR Donnelley & Sons Co. | | | 17,596 | | | | 276,609 | |
Avery Dennison Corp. | | | 3,487 | | | | 271,254 | |
VCA, Inc.* | | | 3,823 | | | | 267,534 | |
SUPERVALU, Inc.* | | | 52,940 | | | | 264,171 | |
Chemed Corp.1 | | | 1,866 | | | | 263,237 | |
Hill-Rom Holdings, Inc. | | | 4,113 | | | | 254,924 | |
Intuitive Surgical, Inc.* | | | 350 | | | | 253,691 | |
Henry Schein, Inc.* | | | 1,518 | | | | 247,404 | |
Hain Celestial Group, Inc.* | | | 6,706 | | | | 238,599 | |
Baxter International, Inc. | | | 4,911 | | | | 233,764 | |
Air Methods Corp.*,1 | | | 7,419 | | | | 233,624 | |
Sysco Corp. | | | 4,711 | | | | 230,886 | |
Magellan Health, Inc.* | | | 4,199 | | | | 225,612 | |
Sarepta Therapeutics, Inc.* | | | 2,000 | | | | 122,820 | |
McKesson Corp. | | | 400 | | | | 66,700 | |
Total Consumer, Non-cyclical | | | | | | | 23,133,939 | |
| | | | | | | | | |
Industrial - 13.4% | |
Fluor Corp.1 | | | 16,844 | | | | 864,434 | |
WestRock Co. | | | 13,765 | | | | 667,327 | |
Huntington Ingalls Industries, Inc.1 | | | 3,670 | | | | 563,051 | |
Arrow Electronics, Inc.*,1 | | | 7,642 | | | | 488,859 | |
Boeing Co.2 | | | 3,413 | | | | 449,628 | |
ITT, Inc.1 | | | 12,154 | | | | 435,599 | |
Vishay Intertechnology, Inc.1 | | | 25,874 | | | | 364,565 | |
Crane Co.1 | | | 5,639 | | | | 355,313 | |
Trinity Industries, Inc. | | | 13,787 | | | | 333,370 | |
Methode Electronics, Inc.1 | | | 9,473 | | | | 331,271 | |
Sanmina Corp.* | | | 11,467 | | | | 326,465 | |
Barnes Group, Inc.1 | | | 7,993 | | | | 324,116 | |
Saia, Inc.*,1 | | | 10,488 | | | | 314,220 | |
Keysight Technologies, Inc.*,1 | | | 9,895 | | | | 313,573 | |
Jacobs Engineering Group, Inc.* | | | 5,932 | | | | 306,803 | |
Timken Co.1 | | | 8,526 | | | | 299,604 | |
FedEx Corp. | | | 1,637 | | | | 285,951 | |
Federal Signal Corp.1 | | | 21,493 | | | | 284,997 | |
Applied Industrial Technologies, Inc.1 | | | 5,935 | | | | 277,402 | |
ArcBest Corp.1 | | | 14,340 | | | | 272,747 | |
Mueller Industries, Inc.1 | | | 8,296 | | | | 268,956 | |
Waters Corp.* | | | 1,667 | | | | 264,203 | |
United Parcel Service, Inc. — Class B | | | 2,313 | | | | 252,950 | |
Rockwell Automation, Inc. | | | 2,030 | | | | 248,350 | |
Harris Corp.2 | | | 2,599 | | | | 238,094 | |
Rockwell Collins, Inc. | | | 2,820 | | | | 237,839 | |
Landstar System, Inc. | | | 3,446 | | | | 234,604 | |
Tech Data Corp.*,1 | | | 2,762 | | | | 233,969 | |
Werner Enterprises, Inc. | | | 10,036 | | | | 233,538 | |
Lockheed Martin Corp. | | | 969 | | | | 232,289 | |
Avnet, Inc.1 | | | 5,493 | | | | 225,542 | |
Total Industrial | | | | | | | 10,529,629 | |
| | | | | | | | | |
Consumer, Cyclical - 12.1% | |
Wal-Mart Stores, Inc.1 | | | 16,158 | | | | 1,165,315 | |
CVS Health Corp.1 | | | 13,076 | | | | 1,163,633 | |
Southwest Airlines Co. | | | 26,619 | | | | 1,035,213 | |
UniFirst Corp. | | | 6,155 | | | | 811,598 | |
Alaska Air Group, Inc. | | | 11,482 | | | | 756,205 | |
JetBlue Airways Corp.* | | | 34,985 | | | | 603,141 | |
Foot Locker, Inc. | | | 5,763 | | | | 390,270 | |
Hawaiian Holdings, Inc.* | | | 6,719 | | | | 326,543 | |
Polaris Industries, Inc. | | | 4,134 | | | | 320,137 | |
Scotts Miracle-Gro Co. — Class A1 | | | 3,597 | | | | 299,522 | |
General Motors Co. | | | 9,324 | | | | 296,224 | |
American Airlines Group, Inc. | | | 7,016 | | | | 256,856 | |
Big Lots, Inc. | | | 5,307 | | | | 253,409 | |
Dana, Inc.1 | | | 16,044 | | | | 250,126 | |
Thor Industries, Inc.1 | | | 2,931 | | | | 248,256 | |
Brunswick Corp.1 | | | 5,020 | | | | 244,876 | |
Macy’s, Inc.2 | | | 6,562 | | | | 243,122 | |
Staples, Inc. | | | 27,226 | | | | 232,782 | |
SEE NOTES TO FINANCIAL STATEMENTS. | THE GUGGENHEIM FUNDS ANNUAL REPORT | 13 |
SCHEDULE OF INVESTMENTS (continued) | September 30, 2016 |
ALPHA OPPORTUNITY FUND | |
| | | Shares | | | Value | |
| | | | | | | |
Skechers U.S.A., Inc. — Class A* | | | 10,064 | | | $ | 230,466 | |
Brinker International, Inc. | | | 4,542 | | | | 229,053 | |
Delta Air Lines, Inc. | | | 3,528 | | | | 138,862 | |
Total Consumer, Cyclical | | | | | | | 9,495,609 | |
| | | | | | | | | |
Technology - 11.4% | |
Intel Corp.2 | | | 18,976 | | | | 716,344 | |
HP, Inc.2 | | | 40,710 | | | | 632,227 | |
Apple, Inc.1 | | | 5,305 | | | | 599,730 | |
CA, Inc.1 | | | 17,609 | | | | 582,505 | |
NetApp, Inc. | | | 15,411 | | | | 552,022 | |
International Business Machines Corp.2 | | | 3,364 | | | | 534,371 | |
Tessera Technologies, Inc. | | | 13,619 | | | | 523,514 | |
Convergys Corp.1 | | | 16,810 | | | | 511,360 | |
Brocade Communications Systems, Inc.1 | | | 52,978 | | | | 488,987 | |
Oracle Corp.1 | | | 11,935 | | | | 468,807 | |
CACI International, Inc. — Class A*,1 | | | 3,592 | | | | 362,433 | |
Science Applications International Corp.1 | | | 5,188 | | | | 359,892 | |
Allscripts Healthcare Solutions, Inc.* | | | 25,983 | | | | 342,196 | |
NCR Corp.* | | | 9,328 | | | | 300,268 | |
Fidelity National Information Services, Inc. | | | 3,811 | | | | 293,561 | |
Sykes Enterprises, Inc.*,1 | | | 9,351 | | | | 263,044 | |
Mentor Graphics Corp. | | | 9,918 | | | | 262,232 | |
Seagate Technology plc | | | 6,474 | | | | 249,573 | |
Fiserv, Inc.* | | | 2,351 | | | | 233,854 | |
Broadridge Financial Solutions, Inc.1 | | | 3,443 | | | | 233,401 | |
VeriFone Systems, Inc.* | | | 14,640 | | | | 230,434 | |
Icad, Inc.*,1 | | | 40,332 | | | | 209,726 | |
Total Technology | | | | | | | 8,950,481 | |
| | | | | | | | | |
Utilities - 8.8% | |
UGI Corp.1 | | | 17,388 | | | | 786,633 | |
Ameren Corp.2 | | | 15,314 | | | | 753,143 | |
FirstEnergy Corp.2 | | | 18,887 | | | | 624,782 | |
Southwest Gas Corp.2 | | | 7,635 | | | | 533,381 | |
Pinnacle West Capital Corp.1 | | | 7,003 | | | | 532,158 | |
Duke Energy Corp.2 | | | 6,205 | | | | 496,648 | |
Edison International2 | | | 6,423 | | | | 464,062 | |
American Electric Power Company, Inc.1 | | | 7,090 | | �� | | 455,249 | |
AES Corp. | | | 27,785 | | | | 357,037 | |
Vectren Corp. | | | 6,485 | | | | 325,547 | |
Hawaiian Electric Industries, Inc. | | | 9,792 | | | | 292,291 | |
Xcel Energy, Inc. | | | 6,932 | | | | 285,182 | |
DTE Energy Co. | | | 2,986 | | | | 279,699 | |
OGE Energy Corp.1 | | | 7,987 | | | | 252,549 | |
PG&E Corp. | | | 4,125 | | | | 252,326 | |
American Water Works Company, Inc. | | | 3,072 | | | | 229,909 | |
Total Utilities | | | | | | | 6,920,596 | |
| | | | | | | | | |
Communications - 8.8% | |
AT&T, Inc.1 | | | 25,304 | | | | 1,027,595 | |
Verizon Communications, Inc.2 | | | 18,274 | | | | 949,883 | |
Juniper Networks, Inc. | | | 32,135 | | | | 773,168 | |
Time Warner, Inc.1 | | | 8,511 | | | | 677,561 | |
Discovery Communications, Inc. — Class A*,1 | | | 23,348 | | | | 628,528 | |
Viacom, Inc. — Class B1 | | | 14,170 | | | | 539,877 | |
Frontier Communications Corp. | | | 117,436 | | | | 488,534 | |
VeriSign, Inc.* | | | 6,040 | | | | 472,570 | |
AMC Networks, Inc. — Class A*,1 | | | 8,709 | | | | 451,649 | |
Comcast Corp. — Class A | | | 5,692 | | | | 377,607 | |
eBay, Inc.*,2 | | | 8,293 | | | | 272,839 | |
Ciena Corp.*,1 | | | 10,684 | | | | 232,911 | |
Total Communications | | | | | | | 6,892,722 | |
| | | | | | | | | |
Financial - 7.7% | |
Aflac, Inc.1 | | | 8,936 | | | | 642,230 | |
Prudential Financial, Inc.1 | | | 7,640 | | | | 623,806 | |
State Street Corp. | | | 7,303 | | | | 508,508 | |
Interactive Brokers Group, Inc. — Class A2 | | | 12,868 | | | | 453,854 | |
Discover Financial Services | | | 6,679 | | | | 377,698 | |
Selective Insurance Group, Inc.1 | | | 9,174 | | | | 365,676 | |
American Financial Group, Inc. | | | 4,458 | | | | 334,350 | |
Aspen Insurance Holdings Ltd.1 | | | 6,969 | | | | 324,686 | |
Old Republic International Corp. | | | 18,348 | | | | 323,292 | |
Hanover Insurance Group, Inc. | | | 4,064 | | | | 306,507 | |
MetLife, Inc.1 | | | 6,763 | | | | 300,480 | |
Signature Bank*,1 | | | 2,348 | | | | 278,121 | |
Bank of America Corp.2 | | | 15,982 | | | | 250,119 | |
RenaissanceRe Holdings Ltd. | | | 2,021 | | | | 242,843 | |
Alliance Data Systems Corp.* | | | 1,129 | | | | 242,204 | |
CNO Financial Group, Inc.1 | | | 15,349 | | | | 234,379 | |
Torchmark Corp. | | | 3,631 | | | | 231,985 | |
Home BancShares, Inc. | | | 1,981 | | | | 41,225 | |
Total Financial | | | | | | | 6,081,963 | |
| | | | | | | | | |
Basic Materials - 2.4% | |
Eastman Chemical Co. | | | 6,869 | | | | 464,894 | |
Nucor Corp. | | | 8,726 | | | | 431,500 | |
International Paper Co. | | | 8,911 | | | | 427,550 | |
Mosaic Co. | | | 11,454 | | | | 280,165 | |
Steel Dynamics, Inc. | | | 9,718 | | | | 242,853 | |
Total Basic Materials | | | | | | | 1,846,962 | |
| | | | | | | | | |
Energy - 0.9% | |
Rowan Companies plc — Class A | | | 17,853 | | | | 270,651 | |
Oasis Petroleum, Inc.* | | | 20,824 | | | | 238,851 | |
HollyFrontier Corp. | | | 7,493 | | | | 183,579 | |
Total Energy | | | | | | | 693,081 | |
| | | | | | | | | |
Total Common Stocks | | | | | | | | |
(Cost $71,281,146) | | | | | | | 74,544,982 | |
| | | | | | | | | |
SHORT-TERM INVESTMENTS† - 6.1% | |
Goldman Sachs Financial Square Treasury Instruments Fund - Institutional Class 0.15%3 | | | 4,805,034 | | | | 4,805,034 | |
Total Short-Term Investments | | | | | | | | |
(Cost $4,805,034) | | | | | | | 4,805,034 | |
| | | | | | | | | |
Total Investments - 101.0% | | | | | | | | |
(Cost $76,086,180) | | | | | | $ | 79,350,016 | |
14 | THE GUGGENHEIM FUNDS ANNUAL REPORT | SEE NOTES TO FINANCIAL STATEMENTS. |
SCHEDULE OF INVESTMENTS (continued) | September 30, 2016 |
ALPHA OPPORTUNITY FUND | |
| | | Shares | | | Value | |
| | | | | | | |
COMMON STOCKS SOLD SHORT† - (17.2)% | |
Communications - (0.5)% | |
Amazon.com, Inc.* | | | 523 | | | $ | (437,913 | ) |
| | | | | | | | | |
Industrial - (1.4)% | |
EnPro Industries, Inc. | | | 6,364 | | | | (361,602 | ) |
Louisiana-Pacific Corp.* | | | 37,885 | | | | (713,374 | ) |
Total Industrial | | | | | | | (1,074,976 | ) |
| | | | | | | | | |
Consumer, Non-cyclical - (1.5)% | |
Cantel Medical Corp. | | | 3,516 | | | | (274,178 | ) |
Monro Muffler Brake, Inc. | | | 4,941 | | | | (302,241 | ) |
Vertex Pharmaceuticals, Inc.* | | | 7,386 | | | | (644,133 | ) |
Total Consumer, Non-cyclical | | | | | | | (1,220,552 | ) |
| | | | | | | | | |
Basic Materials - (2.1)% | |
NewMarket Corp. | | | 677 | | | | (290,650 | ) |
Sensient Technologies Corp. | | | 5,127 | | | | (388,626 | ) |
Royal Gold, Inc. | | | 12,387 | | | | (959,125 | ) |
Total Basic Materials | | | | | | | (1,638,401 | ) |
| | | | | | | | | |
Consumer, Cyclical - (2.4)% | |
Crocs, Inc.* | | | 28,138 | | | | (233,546 | ) |
Pool Corp. | | | 2,532 | | | | (239,325 | ) |
LKQ Corp.* | | | 7,060 | | | | (250,347 | ) |
Popeyes Louisiana Kitchen, Inc.* | | | 4,795 | | | | (254,806 | ) |
Mobile Mini, Inc. | | | 8,620 | | | | (260,324 | ) |
Motorcar Parts of America, Inc.* | | | 9,309 | | | | (267,913 | ) |
Papa John’s International, Inc. | | | 4,631 | | | | (365,154 | ) |
Total Consumer, Cyclical | | | | | | | (1,871,415 | ) |
| | | | | | | | | |
Technology - (3.0)% | |
Ultimate Software Group, Inc.* | | | 1,457 | | | | (297,796 | ) |
CommVault Systems, Inc.* | | | 6,570 | | | | (349,064 | ) |
Silicon Laboratories, Inc.* | | | 6,653 | | | | (391,196 | ) |
Medidata Solutions, Inc.* | | | 8,759 | | | | (488,402 | ) |
Cypress Semiconductor Corp. | | | 65,779 | | | | (799,873 | ) |
Total Technology | | | | | | | (2,326,331 | ) |
| | | | | | | | | |
Financial - (6.3)% | |
Life Storage, Inc. | | | 2,590 | | | | (230,355 | ) |
Safety Insurance Group, Inc. | | | 3,786 | | | | (254,495 | ) |
American Assets Trust, Inc. | | | 6,306 | | | | (273,554 | ) |
Glacier Bancorp, Inc. | | | 10,385 | | | | (296,180 | ) |
Liberty Property Trust | | | 7,503 | | | | (302,746 | ) |
Community Bank System, Inc. | | | 6,315 | | | | (303,815 | ) |
Webster Financial Corp. | | | 8,553 | | | | (325,099 | ) |
Morgan Stanley | | | 10,912 | | | | (349,839 | ) |
Camden Property Trust | | | 4,314 | | | | (361,254 | ) |
Federal Realty Investment Trust | | | 2,508 | | | | (386,057 | ) |
EastGroup Properties, Inc. | | | 5,255 | | | | (386,558 | ) |
Boston Properties, Inc. | | | 3,268 | | | | (445,396 | ) |
Associated Banc-Corp. | | | 25,408 | | | | (497,743 | ) |
Valley National Bancorp | | | 53,709 | | | | (522,589 | ) |
Total Financial | | | | | | | (4,935,680 | ) |
| | | | | | | | | |
Total Common Stocks Sold Short | | | | | | | | |
(Proceeds $11,916,521) | | | | | | | (13,505,268 | ) |
Total Securities Sold Short - (17.2)% | | | | | | | | |
(Proceeds $11,916,521) | | | | | | $ | (13,505,268 | ) |
Other Assets & Liabilities, net - 16.2% | | | | | | | 12,750,137 | |
Total Net Assets - 100.0% | | | | | | $ | 78,594,885 | |
| | | | | | | Unrealized
Gain (Loss) | |
| | | | | | | | | |
OTC EQUITY SWAP AGREEMENTS †† | |
Morgan Stanley
February 2017 Alpha Opportunity Portfolio Long Custom Basket Swap 1.02%4
Terminating 02/03/17
(Notional Value $36,077,415) | | | | | | $ | 1,705,536 | |
Morgan Stanley
February 2017 Alpha Opportunity Portfolio Short Custom Basket Swap 0.05%5
Terminating 02/03/17
(Notional Value $69,238,333) | | | | | | $ | (3,615,837 | ) |
| | | | | | | | | |
| | | Shares | | | | | |
| | | | | | | | | |
CUSTOM BASKET OF LONG SECURITIES4 | |
WellCare Health Plans, Inc.* | | | 7,678 | | | | 295,505 | |
InterDigital, Inc. | | | 8,939 | | | | 290,442 | |
Cisco Systems, Inc. | | | 27,017 | | | | 187,635 | |
Energizer Holdings, Inc. | | | 11,328 | | | | 169,183 | |
SYNNEX Corp. | | | 5,435 | | | | 155,542 | |
Principal Financial Group, Inc. | | | 9,580 | | | | 143,137 | |
UnitedHealth Group, Inc. | | | 7,008 | | | | 108,736 | |
EMCOR Group, Inc. | | | 7,620 | | | | 97,907 | |
Biogen, Inc.* | | | 2,197 | | | | 91,997 | |
United Continental Holdings, Inc.* | | | 15,489 | | | | 84,169 | |
Cummins, Inc. | | | 4,754 | | | | 79,903 | |
QUALCOMM, Inc. | | | 3,702 | | | | 73,779 | |
Mallinckrodt plc* | | | 5,617 | | | | 68,988 | |
Lincoln National Corp. | | | 8,119 | | | | 66,247 | |
Teradyne, Inc. | | | 25,139 | | | | 64,738 | |
Teradata Corp.* | | | 9,499 | | | | 59,355 | |
Amgen, Inc. | | | 3,746 | | | | 57,618 | |
Western Union Co. | | | 20,465 | | | | 49,704 | |
CenterPoint Energy, Inc. | | | 20,392 | | | | 44,969 | |
Xerox Corp. | | | 74,136 | | | | 43,935 | |
Hologic, Inc.* | | | 8,444 | | | | 38,940 | |
Universal Health Services, Inc. — Class B | | | 4,561 | | | | 36,819 | |
Molina Healthcare, Inc.* | | | 11,822 | | | | 36,072 | |
WR Berkley Corp. | | | 4,570 | | | | 32,032 | |
Microsoft Corp. | | | 4,079 | | | | 31,020 | |
Scripps Networks Interactive, Inc. — Class A | | | 14,255 | | | | 25,883 | |
F5 Networks, Inc.* | | | 3,102 | | | | 25,108 | |
Allstate Corp. | | | 5,024 | | | | 24,363 | |
SEE NOTES TO FINANCIAL STATEMENTS. | THE GUGGENHEIM FUNDS ANNUAL REPORT | 15 |
SCHEDULE OF INVESTMENTS (continued) | September 30, 2016 |
ALPHA OPPORTUNITY FUND | |
| | | Shares | | | Unrealized
Gain (Loss) | |
| | | | | | | |
Citigroup, Inc. | | | 5,241 | | | $ | 22,883 | |
Everest Re Group Ltd. | | | 2,886 | | | | 20,825 | |
AECOM* | | | 14,354 | | | | 20,607 | |
McKesson Corp. | | | 3,318 | | | | 20,425 | |
DST Systems, Inc. | | | 1,934 | | | | 18,682 | |
Carlisle Companies, Inc. | | | 3,472 | | | | 15,321 | |
Agilent Technologies, Inc. | | | 7,262 | | | | 14,295 | |
Hartford Financial Services Group, Inc. | | | 5,554 | | | | 13,496 | |
Accenture plc — Class A | | | 2,506 | | | | 12,040 | |
Travelers Companies, Inc. | | | 6,835 | | | | 9,677 | |
PepsiCo, Inc. | | | 2,384 | | | | 8,967 | |
JPMorgan Chase & Co. | | | 5,856 | | | | 8,303 | |
Snap-on, Inc. | | | 1,517 | | | | 3,884 | |
Altria Group, Inc. | | | 5,504 | | | | 2,415 | |
Casey’s General Stores, Inc. | | | 3,528 | | | | 2,408 | |
Telephone & Data Systems, Inc. | | | 12,954 | | | | 1,346 | |
Public Service Enterprise Group, Inc. | | | 14,507 | | | | 517 | |
IPG Photonics Corp.* | | | 4,337 | | | | 421 | |
Best Buy Company, Inc. | | | 9,145 | | | | (786 | ) |
Synchrony Financial | | | 18,866 | | | | (1,768 | ) |
Archer-Daniels-Midland Co. | | | 13,211 | | | | (2,580 | ) |
Bed Bath & Beyond, Inc. | | | 7,965 | | | | (2,866 | ) |
Target Corp. | | | 5,083 | | | | (3,363 | ) |
Automatic Data Processing, Inc. | | | 2,633 | | | | (6,206 | ) |
Equity Residential | | | 3,616 | | | | (7,091 | ) |
Cardinal Health, Inc. | | | 8,967 | | | | (9,266 | ) |
Pitney Bowes, Inc. | | | 15,649 | | | | (11,446 | ) |
Consolidated Edison, Inc. | | | 9,973 | | | | (11,694 | ) |
Progressive Corp. | | | 16,124 | | | | (16,277 | ) |
Wells Fargo & Co. | | | 12,898 | | | | (19,762 | ) |
Delta Air Lines, Inc. | | | 14,930 | | | | (20,787 | ) |
The Gap, Inc. | | | 18,804 | | | | (22,140 | ) |
Campbell Soup Co. | | | 4,234 | | | | (34,591 | ) |
Level 3 Communications, Inc.* | | | 17,172 | | | | (46,916 | ) |
Cal-Maine Foods, Inc. | | | 11,447 | | | | (48,386 | ) |
CenturyLink, Inc. | | | 34,789 | | | | (54,865 | ) |
ATN International, Inc. | | | 5,623 | | | | (58,101 | ) |
Ford Motor Co. | | | 57,578 | | | | (62,418 | ) |
Gilead Sciences, Inc. | | | 14,067 | | | | (64,068 | ) |
Michael Kors Holdings Ltd.* | | | 17,306 | | | | (65,114 | ) |
Cognizant Technology Solutions Corp. — Class A* | | | 10,285 | | | | (74,265 | ) |
Kroger Co. | | | 31,450 | | | | (181,547 | ) |
First Solar, Inc.* | | | 7,466 | | | | (209,183 | ) |
Total Custom Basket of Long Securities | | | | | | | 1,644,752 | |
| | | | | | | | | |
CUSTOM BASKET OF SHORT SECURITIES5 | |
Hanesbrands, Inc. | | | (16,078 | ) | | | 87,410 | |
VF Corp. | | | (7,353 | ) | | | 51,922 | |
Alexion Pharmaceuticals, Inc.* | | | (4,386 | ) | | | 48,014 | |
Cree, Inc.* | | | (9,924 | ) | | | 39,747 | |
New York Community Bancorp, Inc. | | | (64,294 | ) | | | 39,337 | |
Kate Spade & Co.* | | | (19,530 | ) | | | 33,763 | |
Orbital ATK, Inc. | | | (3,310 | ) | | | 33,501 | |
Core-Mark Holding Company, Inc. | | | (8,575 | ) | | | 33,285 | |
Mattel, Inc. | | | (13,680 | ) | | | 30,782 | |
New Jersey Resources Corp. | | | (6,800 | ) | | | 29,470 | |
NIKE, Inc. — Class B | | | (11,384 | ) | | | 29,195 | |
Bank of the Ozarks, Inc. | | | (6,626 | ) | | | 28,808 | |
Macerich Co. | | | (3,319 | ) | | | 25,626 | |
Fortune Brands Home & Security, Inc. | | | (4,038 | ) | | | 23,961 | |
General Electric Co. | | | (27,739 | ) | | | 23,548 | |
AvalonBay Communities, Inc. | | | (2,552 | ) | | | 18,719 | |
FactSet Research Systems, Inc. | | | (1,738 | ) | | | 18,629 | |
Extra Space Storage, Inc. | | | (3,340 | ) | | | 18,524 | |
TripAdvisor, Inc.* | | | (8,934 | ) | | | 16,860 | |
Aerovironment, Inc.* | | | (12,029 | ) | | | 16,138 | |
UDR, Inc. | | | (11,998 | ) | | | 13,663 | |
Under Armour, Inc. — Class A* | | | (11,447 | ) | | | 13,573 | |
AutoNation, Inc.* | | | (5,721 | ) | | | 13,348 | |
Tempur Sealy International, Inc.* | | | (4,548 | ) | | | 13,314 | |
Dollar Tree, Inc.* | | | (4,073 | ) | | | 12,646 | |
Healthcare Realty Trust, Inc. | | | (7,719 | ) | | | 10,003 | |
salesforce.com, Inc.* | | | (3,763 | ) | | | 9,083 | |
Kilroy Realty Corp. | | | (3,423 | ) | | | 8,949 | |
Jones Lang LaSalle, Inc. | | | (2,018 | ) | | | 8,382 | |
NiSource, Inc. | | | (16,883 | ) | | | 8,035 | |
Intuit, Inc. | | | (3,298 | ) | | | 7,847 | |
Mohawk Industries, Inc.* | | | (1,129 | ) | | | 7,340 | |
Highwoods Properties, Inc. | | | (4,522 | ) | | | 7,002 | |
Essex Property Trust, Inc. | | | (1,398 | ) | | | 6,188 | |
Eversource Energy | | | (4,192 | ) | | | 5,227 | |
Equinix, Inc. | | | (1,050 | ) | | | 4,818 | |
Manhattan Associates, Inc.* | | | (4,027 | ) | | | 4,612 | |
Legg Mason, Inc. | | | (10,212 | ) | | | 3,945 | |
Panera Bread Co. — Class A* | | | (1,235 | ) | | | 3,342 | |
MDC Holdings, Inc. | | | (12,487 | ) | | | 3,043 | |
Paychex, Inc. | | | (3,984 | ) | | | 2,994 | |
Prologis, Inc. | | | (7,858 | ) | | | 2,938 | |
Northern Trust Corp. | | | (3,468 | ) | | | 2,409 | |
PNC Financial Services Group, Inc. | | | (3,783 | ) | | | 2,095 | |
Regeneron Pharmaceuticals, Inc.* | | | (574 | ) | | | 1,943 | |
Tractor Supply Co. | | | (3,444 | ) | | | 1,919 | |
3M Co. | | | (1,318 | ) | | | 1,560 | |
Moody’s Corp. | | | (2,141 | ) | | | 965 | |
Monster Beverage Corp.* | | | (1,594 | ) | | | 453 | |
McDonald’s Corp. | | | (2,862 | ) | | | 303 | |
Intercontinental Exchange, Inc. | | | (1,451 | ) | | | 122 | |
Financial Engines, Inc. | | | (8,034 | ) | | | 80 | |
Kennametal, Inc. | | | (12,181 | ) | | | (370 | ) |
Advance Auto Parts, Inc. | | | (1,576 | ) | | | (1,217 | ) |
Lennox International, Inc. | | | (1,673 | ) | | | (1,539 | ) |
Bottomline Technologies de, Inc.* | | | (10,062 | ) | | | (1,691 | ) |
Tiffany & Co. | | | (6,130 | ) | | | (1,739 | ) |
Eli Lilly & Co. | | | (5,810 | ) | | | (1,813 | ) |
Alphabet, Inc. — Class C* | | | (304 | ) | | | (2,561 | ) |
Priceline Group, Inc.* | | | (160 | ) | | | (2,568 | ) |
Wendy’s Co. | | | (32,138 | ) | | | (2,590 | ) |
Ecolab, Inc. | | | (3,382 | ) | | | (2,903 | ) |
Kite Realty Group Trust | | | (12,815 | ) | | | (3,467 | ) |
Fulton Financial Corp. | | | (22,421 | ) | | | (3,659 | ) |
AMETEK, Inc. | | | (4,967 | ) | | | (3,878 | ) |
16 | THE GUGGENHEIM FUNDS ANNUAL REPORT | SEE NOTES TO FINANCIAL STATEMENTS. |
SCHEDULE OF INVESTMENTS (continued) | September 30, 2016 |
ALPHA OPPORTUNITY FUND | |
| | | Shares | | | Unrealized
Loss | |
| | | | | | | |
Bob Evans Farms, Inc. | | | (8,255 | ) | | $ | (3,892 | ) |
Illinois Tool Works, Inc. | | | (3,079 | ) | | | (4,327 | ) |
Starbucks Corp. | | | (4,407 | ) | | | (4,353 | ) |
O’Reilly Automotive, Inc.* | | | (850 | ) | | | (4,537 | ) |
IDEXX Laboratories, Inc.* | | | (2,154 | ) | | | (4,595 | ) |
Sterling Bancorp | | | (13,838 | ) | | | (4,802 | ) |
Air Products & Chemicals, Inc. | | | (1,588 | ) | | | (4,885 | ) |
Arthur J Gallagher & Co. | | | (4,886 | ) | | | (5,378 | ) |
Hasbro, Inc. | | | (3,005 | ) | | | (5,526 | ) |
Edgewell Personal Care Co.* | | | (3,046 | ) | | | (5,533 | ) |
Facebook, Inc. — Class A* | | | (4,169 | ) | | | (5,934 | ) |
Sempra Energy | | | (3,800 | ) | | | (5,967 | ) |
Stericycle, Inc.* | | | (2,999 | ) | | | (6,403 | ) |
Expeditors International of Washington, Inc. | | | (4,661 | ) | | | (6,512 | ) |
Ross Stores, Inc. | | | (3,752 | ) | | | (6,587 | ) |
Electronic Arts, Inc.* | | | (3,127 | ) | | | (7,615 | ) |
Zoetis, Inc. | | | (5,643 | ) | | | (8,116 | ) |
Roper Technologies, Inc. | | | (1,546 | ) | | | (8,262 | ) |
CF Industries Holdings, Inc. | | | (16,232 | ) | | | (8,286 | ) |
J.C. Penney Company, Inc.* | | | (26,669 | ) | | | (8,334 | ) |
General Dynamics Corp. | | | (2,312 | ) | | | (8,470 | ) |
Expedia, Inc. | | | (3,168 | ) | | | (8,705 | ) |
International Flavors & Fragrances, Inc. | | | (1,702 | ) | | | (9,379 | ) |
Mastercard, Inc. — Class A | | | (4,943 | ) | | | (9,551 | ) |
Group 1 Automotive, Inc. | | | (3,881 | ) | | | (10,365 | ) |
Masco Corp. | | | (8,419 | ) | | | (10,610 | ) |
Taubman Centers, Inc. | | | (3,393 | ) | | | (10,836 | ) |
Dominion Resources, Inc. | | | (5,962 | ) | | | (10,901 | ) |
Alexandria Real Estate Equities, Inc. | | | (5,974 | ) | | | (11,123 | ) |
Donaldson Company, Inc. | | | (6,914 | ) | | | (11,159 | ) |
Acuity Brands, Inc. | | | (885 | ) | | | (11,180 | ) |
Genesee & Wyoming, Inc. — Class A* | | | (3,541 | ) | | | (11,641 | ) |
People’s United Financial, Inc. | | | (26,075 | ) | | | (13,113 | ) |
CME Group, Inc. — Class A | | | (5,047 | ) | | | (13,772 | ) |
Crown Castle International Corp. | | | (5,748 | ) | | | (14,154 | ) |
Pioneer Natural Resources Co. | | | (1,308 | ) | | | (14,390 | ) |
Weyerhaeuser Co. | | | (8,064 | ) | | | (14,683 | ) |
BlackRock, Inc. — Class A | | | (1,021 | ) | | | (14,734 | ) |
DCT Industrial Trust, Inc. | | | (5,291 | ) | | | (14,901 | ) |
SVB Financial Group* | | | (2,292 | ) | | | (15,055 | ) |
Microsemi Corp.* | | | (6,598 | ) | | | (15,248 | ) |
Devon Energy Corp. | | | (6,407 | ) | | | (16,592 | ) |
Weingarten Realty Investors | | | (6,031 | ) | | | (16,849 | ) |
Xylem, Inc. | | | (8,612 | ) | | | (17,195 | ) |
Simon Property Group, Inc. | | | (1,916 | ) | | | (18,206 | ) |
Equifax, Inc. | | | (1,751 | ) | | | (18,441 | ) |
B/E Aerospace, Inc. | | | (6,366 | ) | | | (19,050 | ) |
Pentair plc | | | (3,899 | ) | | | (19,093 | ) |
Netflix, Inc.* | | | (4,388 | ) | | | (19,454 | ) |
Invesco Ltd. | | | (16,517 | ) | | | (19,535 | ) |
Toll Brothers, Inc.* | | | (19,603 | ) | | | (20,156 | ) |
Edwards Lifesciences Corp.* | | | (3,865 | ) | | | (20,207 | ) |
NVIDIA Corp. | | | (4,566 | ) | | | (20,340 | ) |
MSCI, Inc. — Class A | | | (3,440 | ) | | | (20,892 | ) |
Wabtec Corp. | | | (3,105 | ) | | | (21,018 | ) |
Kansas City Southern | | | (4,065 | ) | | | (22,161 | ) |
Anadarko Petroleum Corp. | | | (4,027 | ) | | | (22,422 | ) |
Esterline Technologies Corp.* | | | (4,334 | ) | | | (22,423 | ) |
Wynn Resorts Ltd. | | | (7,932 | ) | | | (23,223 | ) |
American Tower Corp. — Class A | | | (2,602 | ) | | | (23,469 | ) |
Take-Two Interactive Software, Inc.* | | | (10,441 | ) | | | (23,600 | ) |
Trimble, Inc.* | | | (9,334 | ) | | | (24,202 | ) |
Alliant Energy Corp. | | | (6,071 | ) | | | (24,249 | ) |
Marriott Vacations Worldwide Corp. | | | (7,580 | ) | | | (24,538 | ) |
Red Hat, Inc.* | | | (5,215 | ) | | | (25,284 | ) |
Royal Caribbean Cruises Ltd. | | | (7,159 | ) | | | (27,504 | ) |
Realty Income Corp. | | | (6,494 | ) | | | (27,819 | ) |
Education Realty Trust, Inc. | | | (6,937 | ) | | | (27,908 | ) |
Ashland Global Holdings, Inc. | | | (3,850 | ) | | | (28,045 | ) |
Freeport-McMoRan, Inc. | | | (92,773 | ) | | | (28,212 | ) |
Electronics for Imaging, Inc.* | | | (6,014 | ) | | | (28,401 | ) |
SL Green Realty Corp. | | | (2,921 | ) | | | (29,396 | ) |
Four Corners Property Trust, Inc. | | | (13,445 | ) | | | (30,976 | ) |
Equity One, Inc. | | | (13,336 | ) | | | (32,277 | ) |
TransDigm Group, Inc.* | | | (1,432 | ) | | | (32,934 | ) |
Five Below, Inc.* | | | (9,609 | ) | | | (34,784 | ) |
Garmin Ltd. | | | (4,869 | ) | | | (36,206 | ) |
Domino’s Pizza, Inc. | | | (1,979 | ) | | | (37,044 | ) |
Welltower, Inc. | | | (4,944 | ) | | | (37,469 | ) |
Jack in the Box, Inc. | | | (3,636 | ) | | | (38,853 | ) |
Chipotle Mexican Grill, Inc. — Class A* | | | (1,936 | ) | | | (39,149 | ) |
Adobe Systems, Inc.* | | | (5,038 | ) | | | (40,705 | ) |
American International Group, Inc. | | | (10,303 | ) | | | (44,719 | ) |
Ulta Salon Cosmetics & Fragrance, Inc.* | | | (1,538 | ) | | | (45,068 | ) |
Navient Corp. | | | (18,785 | ) | | | (46,701 | ) |
Ventas, Inc. | | | (4,176 | ) | | | (47,672 | ) |
South Jersey Industries, Inc. | | | (12,177 | ) | | | (49,298 | ) |
Lexington Realty Trust | | | (27,923 | ) | | | (49,330 | ) |
Tyler Technologies, Inc.* | | | (1,711 | ) | | | (49,609 | ) |
Fortinet, Inc.* | | | (14,529 | ) | | | (49,909 | ) |
Caterpillar, Inc. | | | (7,277 | ) | | | (50,106 | ) |
Vornado Realty Trust | | | (5,022 | ) | | | (53,948 | ) |
Lithia Motors, Inc. — Class A | | | (4,326 | ) | | | (54,006 | ) |
Yum! Brands, Inc. | | | (5,445 | ) | | | (55,131 | ) |
Vulcan Materials Co. | | | (4,756 | ) | | | (55,810 | ) |
Duke Realty Corp. | | | (15,558 | ) | | | (55,922 | ) |
Sotheby’s | | | (9,258 | ) | | | (57,276 | ) |
Douglas Emmett, Inc. | | | (10,265 | ) | | | (57,412 | ) |
Nektar Therapeutics* | | | (23,551 | ) | | | (59,524 | ) |
FMC Corp. | | | (8,066 | ) | | | (61,830 | ) |
Mercury General Corp. | | | (8,400 | ) | | | (63,320 | ) |
Martin Marietta Materials, Inc. | | | (2,170 | ) | | | (64,116 | ) |
Cooper Companies, Inc. | | | (1,625 | ) | | | (72,247 | ) |
HCP, Inc. | | | (11,784 | ) | | | (73,972 | ) |
Dunkin’ Brands Group, Inc. | | | (8,518 | ) | | | (74,354 | ) |
Corning, Inc. | | | (31,023 | ) | | | (74,538 | ) |
Leucadia National Corp. | | | (27,398 | ) | | | (78,465 | ) |
Deere & Co. | | | (13,614 | ) | | | (79,180 | ) |
Copart, Inc.* | | | (7,228 | ) | | | (82,444 | ) |
CarMax, Inc.* | | | (11,616 | ) | | | (84,236 | ) |
Zebra Technologies Corp. — Class A* | | | (4,304 | ) | | | (84,277 | ) |
SEE NOTES TO FINANCIAL STATEMENTS. | THE GUGGENHEIM FUNDS ANNUAL REPORT | 17 |
SCHEDULE OF INVESTMENTS (concluded) | September 30, 2016 |
ALPHA OPPORTUNITY FUND | |
| | | Shares | | | Unrealized
Loss | |
| | | | | | | |
MDU Resources Group, Inc. | | | (13,101 | ) | | $ | (88,049 | ) |
PTC, Inc.* | | | (11,489 | ) | | | (93,829 | ) |
Semtech Corp.* | | | (14,051 | ) | | | (97,410 | ) |
Cintas Corp. | | | (6,397 | ) | | | (105,651 | ) |
S&P Global, Inc. | | | (2,954 | ) | | | (114,949 | ) |
Stillwater Mining Co.* | | | (40,598 | ) | | | (129,136 | ) |
Balchem Corp. | | | (7,334 | ) | | | (135,722 | ) |
Itron, Inc.* | | | (6,605 | ) | | | (142,430 | ) |
Autodesk, Inc.* | | | (14,386 | ) | | | (177,146 | ) |
Total Custom Basket of Short Securities | | | | | | | (3,493,452 | ) |
* | Non-income producing security. |
† | Value determined based on Level 1 inputs — See Note 4. |
†† | Value determined based on Level 2 inputs — See Note 4. |
1 | All or a portion of this security is pledged as short security collateral at September 30, 2016. |
2 | All or a portion of this security is pledged as equity index swap collateral at September 30, 2016. |
3 | Rate indicated is the 7 day yield as of September 30, 2016. |
4 | Total Return is based on the return of the custom basket of long securities +/- financing at a variable rate. Rate indicated is the rate effective at September 30, 2016. |
5 | Total Return is based on the return of the custom basket of short securities +/- financing at a variable rate. Rate indicated is the rate effective at September 30, 2016. |
| | plc — Public Limited Company |
| | |
| | See Sector Classification in Other Information section. |
The following table summarizes the inputs used to value the Fund’s investments at September 30, 2016 (See Note 4 in the Notes to Financial Statements):
Investments in Securities (Assets) | | Level 1 | | | Level 2 | | | Level 2 -
Other* | | | Level 3 | | | Total | |
Common Stocks | | $ | 74,544,982 | | | $ | — | | | $ | — | | | $ | — | | | $ | 74,544,982 | |
Equity Swap Agreements | | | — | | | | — | | | | 1,705,536 | | | | — | | | | 1,705,536 | |
Short-Term Investments | | | 4,805,034 | | | | — | | | | — | | | | — | | | | 4,805,034 | |
Total | | $ | 79,350,016 | | | $ | — | | | $ | 1,705,536 | | | $ | — | | | $ | 81,055,552 | |
| | | | | | | | | | | | | | | | | | | | |
Investments in Securities (Liabilities) | | Level 1 | | | Level 2 | | | Level 2 -
Other* | | | Level 3 | | | Total | |
Common Stocks | | $ | 13,505,268 | | | $ | — | | | $ | — | | | $ | — | | | $ | 13,505,268 | |
Equity Swap Agreements | | | — | | | | — | | | | 3,615,837 | | | | — | | | | 3,615,837 | |
Total | | $ | 13,505,268 | | | $ | — | | | $ | 3,615,837 | | | $ | — | | | $ | 17,121,105 | |
* | Other financial instruments include swaps which are reported as unrealized gain/loss at period end. |
Transfers between investment levels may occur as the markets fluctuate and/or the availability of data used in an investment’s valuation changes. Transfers between valuation levels, if any, are in comparison to the valuation levels at the end of the previous fiscal year, and are effective using the fair value as of the end of the previous fiscal period.
For the year ended September 30, 2016, there were no transfers between levels.
18 | THE GUGGENHEIM FUNDS ANNUAL REPORT | SEE NOTES TO FINANCIAL STATEMENTS. |
STATEMENT OF ASSETS AND LIABILITIES |
September 30, 2016 |
Assets: | |
Investments, at value (cost $76,086,180) | | $ | 79,350,016 | |
Segregated cash with broker | | | 14,872,524 | |
Unrealized appreciation on swap agreements | | | 1,705,536 | |
Prepaid expenses | | | 24,502 | |
Cash | | | 2,944 | |
Receivables: | |
Securities sold | | | 100,683 | |
Fund shares sold | | | 267,048 | |
Dividends | | | 79,493 | |
Investment Adviser | | | 34,988 | |
Total assets | | | 96,437,734 | |
| | | | | |
Liabilities: | |
Securities sold short, at value (proceeds $11,916,521) | | | 13,505,268 | |
Unrealized depreciation on swap agreements | | | 3,615,837 | |
Payable for: | |
Securities purchased | | | 330,017 | |
Swap settlement | | | 147,120 | |
Fund shares redeemed | | | 114,072 | |
Transfer agent/maintenance fees | | | 8,245 | |
Fund accounting/administration fees | | | 6,104 | |
Distribution and service fees | | | 5,543 | |
Trustees’ fees* | | | 3,790 | |
Miscellaneous | | | 106,853 | |
Total liabilities | | | 17,842,849 | |
Net assets | | $ | 78,594,885 | |
| | | | | |
Net assets consist of: | |
Paid in capital | | $ | 81,640,909 | |
Accumulated net investment loss | | | (657,245 | ) |
Accumulated net realized loss on investments | | | (2,153,567 | ) |
Net unrealized depreciation on investments | | | (235,212 | ) |
Net assets | | $ | 78,594,885 | |
| | | | | |
A-Class: | |
Net assets | | $ | 16,041,318 | |
Capital shares outstanding | | | 840,836 | |
Net asset value per share | | $ | 19.08 | |
Maximum offering price per share (Net asset value divided by 95.25%) | | $ | 20.03 | |
| | | | | |
C-Class: | |
Net assets | | $ | 1,549,836 | |
Capital shares outstanding | | | 91,393 | |
Net asset value per share | | $ | 16.96 | |
| | | | | |
P-Class: | |
Net assets | | $ | 4,453,328 | |
Capital shares outstanding | | | 233,065 | |
Net asset value per share | | $ | 19.11 | |
| | | | | |
Institutional Class: | |
Net assets | | $ | 56,550,403 | |
Capital shares outstanding | | | 2,108,631 | |
Net asset value per share | | $ | 26.82 | |
* | Relates to Trustees not deemed “interested persons” within the meaning of Section 2(a)(19) of the 1940 Act. |
SEE NOTES TO FINANCIAL STATEMENTS. | THE GUGGENHEIM FUNDS ANNUAL REPORT | 19 |
STATEMENT OF OPERATIONS |
Year Ended September 30, 2016 |
Investment Income: | |
Dividends | | $ | 1,246,215 | |
Interest | | | 4,548 | |
Total investment income | | | 1,250,763 | |
| | | | | |
Expenses: | |
Management fees | | | 920,524 | |
Transfer agent/maintenance fees: | |
A-Class | | | 20,063 | |
C-Class | | | 10,670 | |
P-Class | | | 1,120 | |
Institutional Class | | | 11,190 | |
Distribution and service fees: | |
A-Class | | | 37,609 | |
C-Class | | | 15,594 | |
P-Class | | | 6,534 | |
Fund accounting/administration fees | | | 68,823 | |
Short sales dividend expense | | | 363,789 | |
Prime broker interest expense | | | 61,449 | |
Custodian fees | | | 22,311 | |
Trustees’ fees* | | | 10,892 | |
Miscellaneous | | | 162,741 | |
Total expenses | | | 1,713,309 | |
Less: | |
Expenses waived by Adviser | | | (7,081 | ) |
Net expenses | | | 1,706,228 | |
Net investment loss | | | (455,465 | ) |
| | | | | |
Net Realized and Unrealized Gain (Loss): | |
Net realized gain (loss) on: | |
Investments | | $ | 3,038,796 | |
Swap agreements | | | (2,017,258 | ) |
Securities sold short | | | 209,795 | |
Net realized gain | | | 1,231,333 | |
Net change in unrealized appreciation (depreciation) on: | |
Investments | | | 6,094,173 | |
Securities sold short | | | (2,727,526 | ) |
Swap agreements | | | (1,825,091 | ) |
Net change in unrealized appreciation (depreciation) | | | 1,541,556 | |
Net realized and unrealized gain | | | 2,772,889 | |
Net increase in net assets resulting from operations | | $ | 2,317,424 | |
* | Relates to Trustees not deemed “interested persons” within the meaning of Section 2(a)(19) of the 1940 Act. |
20 | THE GUGGENHEIM FUNDS ANNUAL REPORT | SEE NOTES TO FINANCIAL STATEMENTS. |
STATEMENTS OF CHANGES IN NET ASSETS |
| | | Year Ended
September 30,
2016 | | | Year Ended
September 30,
2015 | |
Increase (Decrease) in Net Assets from Operations: | | | | | | |
Net investment loss | | $ | (455,465 | ) | | $ | (514,996 | ) |
Net realized gain on investments | | | 1,231,333 | | | | 666,067 | |
Net change in unrealized appreciation (depreciation) on investments | | | 1,541,556 | | | | (1,613,916 | ) |
Net increase (decrease) in net assets resulting from operations | | | 2,317,424 | | | | (1,462,845 | ) |
| | | | | | | | | |
Distributions to shareholders from: | | | | | | | | |
Net investment income | | | | | | | | |
A-Class | | | — | | | | (1,982 | ) |
C-Class | | | — | | | | (278 | ) |
Institutional Class | | | — | | | | (297 | ) |
Total distributions to shareholders | | | — | | | | (2,557 | ) |
| | | | | | | | | |
Capital share transactions: | | | | | | | | |
Proceeds from sale of shares | | | | | | | | |
A-Class | | | 13,416,725 | | | | 5,408,836 | |
B-Class | | | — | | | | 235 | |
C-Class | | | 1,144,266 | | | | 265,649 | |
P-Class | | | 6,055,462 | | | | 139,796 | * |
Institutional Class | | | 11,962,236 | | | | 50,445,467 | |
Distributions reinvested | | | | | | | | |
A-Class | | | — | | | | 1,956 | |
C-Class | | | — | | | | 273 | |
Institutional Class | | | — | | | | 297 | |
Cost of shares redeemed | | | | | | | | |
A-Class | | | (9,133,848 | ) | | | (2,010,069 | ) |
B-Class | | | — | | | | (93 | ) |
C-Class | | | (831,133 | ) | | | (182,978 | ) |
P-Class | | | (1,749,969 | ) | | | (4,920 | )* |
Institutional Class | | | (7,711,248 | ) | | | (225,328 | ) |
Net increase from capital share transactions | | | 13,152,491 | | | | 53,839,121 | |
Net increase in net assets | | | 15,469,915 | | | | 52,373,719 | |
| | | | | | | | | |
Net assets: | | | | | | | | |
Beginning of year | | | 63,124,970 | | | | 10,751,251 | |
End of year | | $ | 78,594,885 | | | $ | 63,124,970 | |
(Accumulated net investment loss)/Undistributed net investment income at end of year | | $ | (657,245 | ) | | $ | 85,210 | |
| | | | | | | | | |
Capital share activity: | | | | | | | | |
Shares sold | | | | | | | | |
A-Class | | | 702,394 | | | | 288,180 | |
C-Class | | | 68,002 | | | | 15,608 | |
P-Class | | | 317,616 | | | | 7,535 | * |
Institutional Class | | | 448,620 | | | | 1,897,857 | |
Shares issued from reinvestment of distributions | | | | | | | | |
A-Class | | | — | | | | 103 | |
C-Class | | | — | | | | 16 | |
Institutional Class | | | — | | | | 11 | |
Shares redeemed | | | | | | | | |
A-Class | | | (486,062 | ) | | | (107,421 | ) |
C-Class | | | (49,650 | ) | | | (11,312 | ) |
P-Class | | | (91,817 | ) | | | (269 | )* |
Institutional Class | | | (295,069 | ) | | | (8,239 | ) |
Net increase in shares | | | 614,034 | | | | 2,082,069 | |
* | Since commencement of operations: May 1, 2015. |
SEE NOTES TO FINANCIAL STATEMENTS. | THE GUGGENHEIM FUNDS ANNUAL REPORT | 21 |
This table is presented to show selected data for a share outstanding throughout each period and to assist shareholders in evaluating a Fund’s performance for the periods presented.
A-Class | | Year Ended
September 30,
2016 | | | Year Ended
September 30,
2015 | | | Year Ended
September 30,
2014 | | | Year Ended
September 30,
2013 | | | Year Ended
September 30,
2012 | |
Per Share Data | | | | | | | | | | | | | | | |
Net asset value, beginning of period | | $ | 18.39 | | | $ | 18.01 | | | $ | 16.22 | | | $ | 13.33 | | | $ | 9.82 | |
Income (loss) from investment operations: | |
Net investment income (loss)a | | | (.19 | ) | | | (.35 | ) | | | (.13 | ) | | | .03 | | | | (— | )b |
Net gain (loss) on investments (realized and unrealized) | | | .88 | | | | .73 | | | | 1.92 | | | | 2.86 | | | | 3.48 | |
Net increase from payments by affiliates | | | — | | | | — | | | | — | | | | — | | | | .03 | |
Total from investment operations | | | .69 | | | | .38 | | | | 1.79 | | | | 2.89 | | | | 3.51 | |
Less distributions from: | |
Net investment income | | | — | | | | (— | )c | | | — | | | | — | | | | — | |
Total distributions | | | — | | | | (— | )c | | | — | | | | — | | | | — | |
Net asset value, end of period | | $ | 19.08 | | | $ | 18.39 | | | $ | 18.01 | | | $ | 16.22 | | | $ | 13.33 | |
| | | | | | | | | | | | | | | | | | | | | |
Total Returne | | | 3.70 | % | | | 2.13 | % | | | 11.04 | % | | | 21.38 | % | | | 35.74 | %d |
Ratios/Supplemental Data | |
Net assets, end of period (in thousands) | | $ | 16,041 | | | $ | 11,485 | | | $ | 7,989 | | | $ | 7,749 | | | $ | 7,250 | |
Ratios to average net assets: | |
Net investment income (loss) | | | (1.02 | %) | | | (1.88 | %) | | | (0.73 | %) | | | 0.19 | % | | | (0.01 | %) |
Total expensesf | | | 2.69 | % | | | 3.92 | % | | | 3.25 | % | | | 3.99 | % | | | 2.99 | % |
Net expensesg,i | | | 2.69 | % | | | 2.94 | % | | | 2.12 | % | | | 2.14 | % | | | 2.21 | % |
Portfolio turnover rate | | | 235 | % | | | 124 | % | | | — | | | | 488 | % | | | 707 | % |
C-Class | | Year Ended
September 30,
2016 | | | Year Ended
September 30,
2015 | | | Year Ended
September 30,
2014 | | | Year Ended
September 30,
2013 | | | Year Ended
September 30,
2012 | |
Per Share Data | | | | | | | | | | | | | | | |
Net asset value, beginning of period | | $ | 16.47 | | | $ | 16.25 | | | $ | 14.74 | | | $ | 12.21 | | | $ | 9.07 | |
Income (loss) from investment operations: | |
Net investment income (loss)a | | | (.29 | ) | | | (.44 | ) | | | (.23 | ) | | | (.07 | ) | | | (.09 | ) |
Net gain (loss) on investments (realized and unrealized) | | | .78 | | | | .66 | | | | 1.74 | | | | 2.60 | | | | 3.21 | |
Net increase from payments by affiliates | | | — | | | | — | | | | — | | | | — | | | | .02 | |
Total from investment operations | | | .49 | | | | .22 | | | | 1.51 | | | | 2.53 | | | | 3.14 | |
Less distributions from: | |
Net investment income | | | — | | | | (— | )c | | | — | | | | — | | | | — | |
Total distributions | | | — | | | | (— | )c | | | — | | | | — | | | | — | |
Net asset value, end of period | | $ | 16.96 | | | $ | 16.47 | | | $ | 16.25 | | | $ | 14.74 | | | $ | 12.21 | |
| | |
Total Returne | | | 2.91 | % | | | 1.38 | % | | | 10.24 | % | | | 20.48 | % | | | 34.62 | %d |
Ratios/Supplemental Data | |
Net assets, end of period (in thousands) | | $ | 1,550 | | | $ | 1,203 | | | $ | 1,117 | | | $ | 1,206 | | | $ | 1,497 | |
Ratios to average net assets: | |
Net investment income (loss) | | | (1.72 | %) | | | (2.64 | %) | | | (1.46 | %) | | | (0.56 | %) | | | (0.76 | %) |
Total expensesf | | | 3.91 | % | | | 4.81 | % | | | 4.11 | % | | | 4.84 | % | | | 3.80 | % |
Net expensesg,i | | | 3.46 | % | | | 3.68 | % | | | 2.87 | % | | | 2.89 | % | | | 2.96 | % |
Portfolio turnover rate | | | 235 | % | | | 124 | % | | | — | | | | 488 | % | | | 707 | % |
22 | THE GUGGENHEIM FUNDS ANNUAL REPORT | SEE NOTES TO FINANCIAL STATEMENTS. |
FINANCIAL HIGHLIGHTS (continued) |
This table is presented to show selected data for a share outstanding throughout each period and to assist shareholders in evaluating a Fund’s performance for the periods presented.
P-Class | | Year Ended
September 30,
2016 | | | Period Ended
September 30,
2015h | |
Per Share Data | | | | | | |
Net asset value, beginning of period | | $ | 18.39 | | | $ | 19.11 | |
Income (loss) from investment operations: | |
Net investment income (loss)a | | | (.12 | ) | | | (.13 | ) |
Net gain (loss) on investments (realized and unrealized) | | | .84 | | | | (.59 | ) |
Total from investment operations | | | .72 | | | | (.72 | ) |
Net asset value, end of period | | $ | 19.11 | | | $ | 18.39 | |
| | |
Total Returne | | | 3.86 | % | | | (3.77 | %) |
Ratios/Supplemental Data | |
Net assets, end of period (in thousands) | | $ | 4,453 | | | $ | 134 | |
Ratios to average net assets: | |
Net investment income (loss) | | | (0.65 | %) | | | (1.77 | %) |
Total expensesf | | | 2.44 | % | | | 3.31 | % |
Net expensesg,i | | | 2.44 | % | | | 2.87 | % |
Portfolio turnover rate | | | 235 | % | | | 124 | % |
SEE NOTES TO FINANCIAL STATEMENTS. | THE GUGGENHEIM FUNDS ANNUAL REPORT | 23 |
FINANCIAL HIGHLIGHTS (concluded) |
This table is presented to show selected data for a share outstanding throughout each period and to assist shareholders in evaluating a Fund’s performance for the periods presented.
Institutional Class | | Year Ended
September 30,
2016 | | | Year Ended
September 30,
2015 | | | Year Ended
September 30,
2014 | | | Year Ended
September 30,
2013 | | | Year Ended
September 30,
2012 | |
Per Share Data | | | | | | | | | | | | | | | |
Net asset value, beginning of period | | $ | 25.73 | | | $ | 25.13 | | | $ | 22.58 | | | $ | 18.52 | | | $ | 13.53 | |
Income (loss) from investment operations: | |
Net investment income (loss)a | | | (.13 | ) | | | (.40 | ) | | | (.12 | ) | | | .09 | | | | .04 | |
Net gain (loss) on investments (realized and unrealized) | | | 1.22 | | | | 1.00 | | | | 2.67 | | | | 3.97 | | | | 4.82 | |
Net increase from payments by affiliates | | | — | | | | — | | | | — | | | | — | | | | .13 | |
Total from investment operations | | | 1.09 | | | | .60 | | | | 2.55 | | | | 4.06 | | | | 4.99 | |
Less distributions from: | |
Net investment income | | | — | | | | (— | )c | | | — | | | | — | | | | — | |
Total distributions | | | — | | | | (— | )c | | | — | | | | — | | | | — | |
Net asset value, end of period | | $ | 26.82 | | | $ | 25.73 | | | $ | 25.13 | | | $ | 22.58 | | | $ | 18.52 | |
| | |
Total Returne | | | 4.20 | % | | | 2.41 | % | | | 11.29 | % | | | 21.60 | % | | | 36.88 | %d |
Ratios/Supplemental Data | |
Net assets, end of period (in thousands) | | $ | 56,550 | | | $ | 50,304 | | | $ | 1,645 | | | $ | 1,740 | | | $ | 1,518 | |
Ratios to average net assets: | |
Net investment income (loss) | | | (0.49 | %) | | | (1.55 | %) | | | (0.48 | %) | | | 0.43 | % | | | 0.24 | % |
Total expensesf | | | 2.23 | % | | | 2.80 | % | | | 2.90 | % | | | 3.67 | % | | | 2.68 | % |
Net expensesg,i | | | 2.23 | % | | | 2.80 | % | | | 1.87 | % | | | 1.90 | % | | | 1.96 | % |
Portfolio turnover rate | | | 235 | % | | | 124 | % | | | — | | | | 488 | % | | | 707 | % |
a | Net investment income (loss) per share was computed using average shares outstanding throughout the period. |
b | Net investment income is less than $0.01 per share. |
c | Distributions from net investment income are less than $0.01 per share. |
d | For the year ended September 30, 2012, 0.30%, 0.22% and 0.96% of the Fund’s A-Class, C-Class and Institutional Class, respectively, total return consisted of a voluntary reimbursement by the Adviser for losses incurred during fund trading. Excluding this item, total return would have been 35.44%, 34.40% and 35.92% for the Fund’s A-Class, C-Class and Institutional Class, respectively. |
e | Total return does not reflect the impact of any applicable sales charges. |
f | Does not include expenses of the underlying funds in which the Fund invests. |
g | Net expense information reflects the expense ratios after expense waivers. |
h | Since commencement of operations: May 1, 2015. Percentage amounts for the period, except total return and portfolio turnover rate, have been annualized. |
i | Net expenses may include expenses that are excluded from the expense limitation agreement and recouped amounts. Excluding these expenses, the operating expense ratios for the periods presented would be: |
| | | 09/30/16 | 09/30/15 | 09/30/14 | 09/30/13 | 09/30/12 |
| | A-Class | 2.11% | 2.11% | 2.11% | 2.11% | 2.11% |
| | C-Class | 2.86% | 2.86% | 2.86% | 2.86% | 2.86% |
| | P-Class | 1.87% | 2.10% | — | — | — |
| | Institutional Class | 1.63% | 1.86% | 1.86% | 1.86% | 1.86% |
24 | THE GUGGENHEIM FUNDS ANNUAL REPORT | SEE NOTES TO FINANCIAL STATEMENTS. |
MANAGERS’ COMMENTARY (Unaudited) | September 30, 2016 |
To Our Shareholders:
Guggenheim Large Cap Value Fund (the “Fund”) is managed by a team of seasoned professionals led by James Schier, CFA, Managing Director and Senior Portfolio Manager; Scott Hammond, Managing Director and Portfolio Manager; Farhan Sharaff, Assistant Chief Investment Officer, Equities, and Portfolio Manager; and Gregg Strohkorb, CFA, Portfolio Manager. In the following paragraphs, the team discusses performance of the Fund for the fiscal year ended September 30, 2016.
For the one year period ended September 30, 2016, the Guggenheim Large Cap Value Fund returned 15.69%1, compared with the 16.20% return of its benchmark, the Russell 1000® Value Index.
Strategy and Market Overview
Our investment approach focuses on understanding how companies make money and how easily companies can improve returns, maintain existing high levels of profitability, or benefit from change that occurs in the industries in which they operate. In today’s rapidly changing environment marked by very sharp and quick, but constrained volatility, our long-term orientation and discipline are a competitive advantage. This should become especially critical when the environment of indiscriminant valuation expansion subsides and fundamentals once again become a more dominant factor in the market.
Performance Review
Most of the performance differential was due to stock selection. The largest positive impact was in the Health Care and Information Technology sectors, the latter the best-performing sector in the Fund. On the negative side, the largest impact was in the Consumer Staples and the Materials sectors, the latter the best-performing sector in the Index.
The top two individual contributors on an absolute basis were Chevron Corporation, the integrated oil company that responded well to the rebound in the price of oil, and Johnson & Johnson, a health care products company that had solid growth over the period. Another holding with strong performance was Kinder Morgan, which was purchased after the much of the oil price drop and responded well to the rebound in prices with strong results in its product pipelines and terminals segments.
The leading individual detractors from the Fund’s return on an absolute basis included Citigroup, Inc., a financial services company, and Bunge Ltd., an agribusiness and food company. Citigroup lost ground after the Fed raised its target Fed Funds rate in December in the face of slowing growth and an oil price slump. Bunge had to deal with price and margin volatility in its South American agribusiness exposure due to weather effects and a dollar that was weak through much of 2016.
Portfolio Positioning
The largest relative sector exposures for the year were underweights in Energy and Real Estate, and overweights in Tech and Materials. The underweights both detracted from Fund performance for the year, while the overweights contributed to performance.
The Fund has been underweight the REITs (Real Estate Investment Trust) industry, which was extracted from Financials to form a separate sector in September 2016 and continues to be fairly valued in our view. In Energy, the Fund continues to favor exploration and production companies rather than refiners or other sub-industries that have been less impacted by crude oil’s weakness. The Fund has focused on holdings that have manageable leverage and liquidity to weather the storm in commodity prices.
The overweights were driven by our bottom-up fundamental research having identified several companies with favorable risk-return profiles.
| | THE GUGGENHEIM FUNDS ANNUAL REPORT | 25 |
MANAGERS’ COMMENTARY (Unaudited)(concluded) | September 30, 2016 |
Portfolio and Market Outlook
During the quarter, investors began to gain confidence that commodity prices have seen a bottom, which suggested an end to the business pressure not only in energy but in several industrial and financial industries. In addition, the market appears to be getting comfortable with the notion that any interest rate increases will be gradual and enacted with extreme caution. Therefore, with the fear of a commodity-driven recession having ebbed, the fuel for a relief rally was present. With the economic environment proving to be steady but subdued, and a Fed that is acting with utmost caution, the markets appear fated to behave in a choppy manner while trading in a relatively narrow range.
Our portfolios tend to reflect a bias toward companies with balance sheet quality. We continue to find niche companies with what we believe to be attractive growth opportunities, and, as such, are constructive on the outlook.
Performance displayed represents past performance which is no guarantee of future results.
1 | Performance figures are based on Class A shares and do not reflect taxes that a shareholder would pay on distributions or the redemption of shares. |
The opinions and forecast expressed may not actually come to pass. This information is subject to change at any time, based on market and other conditions, and should not be construed as a recommendation of any specific security or strategy.
26 | THE GUGGENHEIM FUNDS ANNUAL REPORT | |
PERFORMANCE REPORT AND FUND PROFILE (Unaudited) | September 30, 2016 |
LARGE CAP VALUE FUND
OBJECTIVE: Seeks long-term growth of capital.
Holdings Diversification (Market Exposure as % of Net Assets)
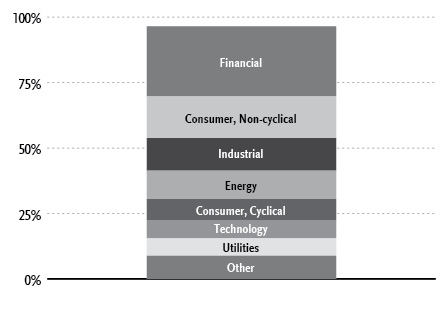
“Holdings Diversification (Market Exposure as % of Net Assets)” excludes any temporary cash investments.
Inception Dates: |
A-Class | August 7, 1944 |
C-Class | January 29, 1999 |
P-Class | May 1, 2015 |
Institutional Class | June 7, 2013 |
Ten Largest Holdings (% of Total Net Assets) |
JPMorgan Chase & Co. | 3.6% |
Johnson & Johnson | 3.0% |
Cisco Systems, Inc. | 2.6% |
Chevron Corp. | 2.5% |
Exxon Mobil Corp. | 2.3% |
QUALCOMM, Inc. | 2.1% |
Citigroup, Inc. | 2.1% |
Intel Corp. | 2.0% |
American International Group, Inc. | 2.0% |
Bank of America Corp. | 1.8% |
Top Ten Total | 24.0% |
| | |
“Ten Largest Holdings” excludes any temporary cash investments. |
| | THE GUGGENHEIM FUNDS ANNUAL REPORT | 27 |
PERFORMANCE REPORT AND FUND PROFILE (Unaudited)(concluded) | September 30, 2016 |
Cumulative Fund Performance*
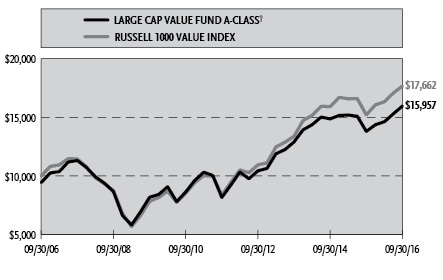
Average Annual Returns*
Periods Ended September 30, 2016
| | 1 Year | 5 Year | 10 Year |
A-Class Shares | 15.69% | 14.37% | 5.41% |
A-Class Shares with sales charge† | 10.20% | 13.25% | 4.78% |
C-Class Shares | 14.87% | 13.52% | 4.57% |
C-Class Shares with CDSC‡ | 13.87% | 13.52% | 4.57% |
Russell 1000 Value Index | 16.20% | 16.15% | 5.85% |
| | | 1 Year | Since Inception
(05/01/15) |
P-Class Shares | | 15.83% | 2.67% |
Russell 1000 Value Index | | 16.20% | 3.26% |
| | | 1 Year | Since Inception
(06/07/13) |
Institutional Class Shares | | 15.98% | 8.15% |
Russell 1000 Value Index | | 16.20% | 9.45% |
* | The performance data above represents past performance that is not predictive of future results. The investment return and principal value of an investment in the Fund will fluctuate so that an investor’s shares, when redeemed, may be worth more or less than their original cost. Returns are historical and include changes in principal and reinvested dividends and capital gains and do not reflect the effect of taxes. The Russell 1000 Value Index is an unmanaged index and, unlike the Fund, has no management fees or operating expenses to reduce its reported return. The graph is based on A-Class shares only; performance for C-Class, P-Class and Institutional Class will vary due to differences in fee structures. |
† | Effective February 22, 2011, the maximum sales charge decreased from 5.75% to 4.75%. A 5.75% maximum sales charge is used in the calculation of the 10 Year average annual return (based on subscriptions made prior to February 22, 2011), and a 4.75% maximum sales charge will be used to calculate performance for periods based on subscriptions made on or after February 22, 2011. |
‡ | Fund returns include a CDSC of 1% if redeemed within 12 months of purchase. |
28 | THE GUGGENHEIM FUNDS ANNUAL REPORT | |
SCHEDULE OF INVESTMENTS | September 30, 2016 |
LARGE CAP VALUE FUND | |
| | | Shares | | | Value | |
| | | | | | | |
COMMON STOCKS† - 96.5% | |
| | | | | | | |
Financial - 26.8% | |
JPMorgan Chase & Co. | | | 31,787 | | | $ | 2,116,695 | |
Citigroup, Inc. | | | 25,977 | | | | 1,226,894 | |
American International Group, Inc. | | | 19,370 | | | | 1,149,415 | |
Bank of America Corp. | | | 67,490 | | | | 1,056,219 | |
Wells Fargo & Co. | | | 23,015 | | | | 1,019,105 | |
Berkshire Hathaway, Inc. — Class B* | | | 7,014 | | | | 1,013,313 | |
Allstate Corp. | | | 13,296 | | | | 919,817 | |
SunTrust Banks, Inc. | | | 16,773 | | | | 734,657 | |
Assured Guaranty Ltd. | | | 24,484 | | | | 679,431 | |
Zions Bancorporation | | | 21,652 | | | | 671,645 | |
Sun Communities, Inc. | | | 7,881 | | | | 618,501 | |
BB&T Corp. | | | 16,038 | | | | 604,953 | |
Unum Group | | | 15,767 | | | | 556,733 | |
Piedmont Office Realty Trust, Inc. — Class A | | | 20,703 | | | | 450,704 | |
Charles Schwab Corp. | | | 13,649 | | | | 430,899 | |
Mastercard, Inc. — Class A | | | 2,998 | | | | 305,106 | |
KeyCorp | | | 25,002 | | | | 304,274 | |
Equity Residential | | | 4,532 | | | | 291,544 | |
Morgan Stanley | | | 8,519 | | | | 273,119 | |
Ally Financial, Inc. | | | 12,556 | | | | 244,465 | |
E*TRADE Financial Corp.* | | | 8,055 | | | | 234,562 | |
Prudential Financial, Inc. | | | 2,583 | | | | 210,902 | |
Regions Financial Corp. | | | 19,250 | | | | 189,998 | |
Hanover Insurance Group, Inc. | | | 2,338 | | | | 176,332 | |
T. Rowe Price Group, Inc. | | | 2,265 | | | | 150,623 | |
Hartford Financial Services Group, Inc. | | | 1,938 | | | | 82,985 | |
Total Financial | | | | | | | 15,712,891 | |
| | | | | | | | | |
Consumer, Non-cyclical - 15.9% | |
Johnson & Johnson | | | 14,664 | | | | 1,732,259 | |
Pfizer, Inc. | | | 25,702 | | | | 870,527 | |
HCA Holdings, Inc.* | | | 10,288 | | | | 778,081 | |
Zimmer Biomet Holdings, Inc. | | | 5,817 | | | | 756,326 | |
Medtronic plc | | | 8,583 | | | | 741,571 | |
Quest Diagnostics, Inc. | | | 8,697 | | | | 736,027 | |
Bunge Ltd. | | | 12,386 | | | | 733,623 | |
United Rentals, Inc.* | | | 6,016 | | | | 472,196 | |
Procter & Gamble Co. | | | 5,068 | | | | 454,853 | |
Philip Morris International, Inc. | | | 4,633 | | | | 450,420 | |
Mondelez International, Inc. — Class A | | | 9,916 | | | | 435,312 | |
Hershey Co. | | | 3,131 | | | | 299,324 | |
Merck & Company, Inc. | | | 4,722 | | | | 294,700 | |
UnitedHealth Group, Inc. | | | 2,051 | | | | 287,140 | |
Dr Pepper Snapple Group, Inc. | | | 2,983 | | | | 272,378 | |
Total Consumer, Non-cyclical | | | | | | | 9,314,737 | |
| | | | | | | | | |
Industrial - 12.4% | |
Republic Services, Inc. — Class A | | | 20,887 | | | | 1,053,749 | |
General Electric Co. | | | 26,811 | | | | 794,141 | |
Jabil Circuit, Inc. | | | 29,644 | | | | 646,832 | |
WestRock Co. | | | 12,721 | | | | 616,714 | |
FLIR Systems, Inc. | | | 19,031 | | | | 597,954 | |
Corning, Inc. | | | 20,220 | | | | 478,203 | |
Harris Corp. | | | 3,800 | | | | 348,118 | |
CSX Corp. | | | 10,858 | | | | 331,169 | |
Timken Co. | | | 9,174 | | | | 322,374 | |
Eaton Corporation plc | | | 4,622 | | | | 303,712 | |
Owens Corning | | | 5,635 | | | | 300,853 | |
CH Robinson Worldwide, Inc. | | | 4,261 | | | | 300,230 | |
Carlisle Companies, Inc. | | | 2,922 | | | | 299,710 | |
Honeywell International, Inc. | | | 2,534 | | | | 295,439 | |
Huntington Ingalls Industries, Inc. | | | 1,853 | | | | 284,287 | |
General Dynamics Corp. | | | 1,011 | | | | 156,867 | |
Spirit AeroSystems Holdings, Inc. — Class A* | | | 3,011 | | | | 134,110 | |
Total Industrial | | | | | | | 7,264,462 | |
| | | | | | | | | |
Energy - 10.9% | |
Chevron Corp. | | | 14,386 | | | | 1,480,607 | |
Exxon Mobil Corp. | | | 15,608 | | | | 1,362,266 | |
Kinder Morgan, Inc. | | | 36,145 | | | | 836,034 | |
Marathon Oil Corp. | | | 49,723 | | | | 786,121 | |
Hess Corp. | | | 10,503 | | | | 563,171 | |
Rowan Companies plc — Class A | | | 25,842 | | | | 391,765 | |
Apache Corp. | | | 5,271 | | | | 336,659 | |
Valero Energy Corp. | | | 6,256 | | | | 331,568 | |
QEP Resources, Inc. | | | 8,380 | | | | 163,661 | |
Whiting Petroleum Corp.* | | | 12,954 | | | | 113,218 | |
Total Energy | | | | | | | 6,365,070 | |
| | | | | | | | | |
Consumer, Cyclical - 8.1% | |
CVS Health Corp. | | | 10,563 | | | | 940,001 | |
Wal-Mart Stores, Inc. | | | 8,880 | | | | 640,426 | |
Lear Corp. | | | 5,220 | | | | 632,768 | |
Target Corp. | | | 7,523 | | | | 516,680 | |
Southwest Airlines Co. | | | 11,939 | | | | 464,308 | |
Goodyear Tire & Rubber Co. | | | 13,873 | | | | 448,098 | |
PVH Corp. | | | 3,280 | | | | 362,440 | |
PACCAR, Inc. | | | 5,153 | | | | 302,893 | |
J.C. Penney Company, Inc.* | | | 31,110 | | | | 286,834 | |
DR Horton, Inc. | | | 4,663 | | | | 140,823 | |
Total Consumer, Cyclical | | | | | | | 4,735,271 | |
| | | | | | | | | |
Technology - 6.9% | |
QUALCOMM, Inc. | | | 18,375 | | | | 1,258,688 | |
Intel Corp. | | | 30,932 | | | | 1,167,683 | |
Lam Research Corp. | | | 9,692 | | | | 917,929 | |
Micron Technology, Inc.* | | | 37,454 | | | | 665,932 | |
Total Technology | | | | | | | 4,010,232 | |
| | | | | | | | | |
Utilities - 6.7% | |
Edison International | | | 11,248 | | | | 812,668 | |
Public Service Enterprise Group, Inc. | | | 19,188 | | | | 803,402 | |
OGE Energy Corp. | | | 22,213 | | | | 702,375 | |
Ameren Corp. | | | 12,863 | | | | 632,602 | |
UGI Corp. | | | 11,068 | | | | 500,716 | |
Exelon Corp. | | | 9,831 | | | | 327,274 | |
Duke Energy Corp. | | | 2,116 | | | | 169,365 | |
Total Utilities | | | | | | | 3,948,402 | |
SEE NOTES TO FINANCIAL STATEMENTS. | THE GUGGENHEIM FUNDS ANNUAL REPORT | 29 |
SCHEDULE OF INVESTMENTS (concluded) | September 30, 2016 |
LARGE CAP VALUE FUND | |
| | | Shares | | | Value | |
| | | | | | | |
Communications - 5.7% | |
Cisco Systems, Inc. | | | 47,683 | | | $ | 1,512,505 | |
AT&T, Inc. | | | 13,603 | | | | 552,418 | |
Scripps Networks Interactive, Inc. — Class A | | | 7,345 | | | | 466,334 | |
Yahoo!, Inc.* | | | 9,052 | | | | 390,141 | |
Verizon Communications, Inc. | | | 5,184 | | | | 269,464 | |
Walt Disney Co. | | | 1,558 | | | | 144,676 | |
Total Communications | | | | | | | 3,335,538 | |
| | | | | | | | | |
Basic Materials - 3.1% | |
Dow Chemical Co. | | | 17,852 | | | | 925,269 | |
Reliance Steel & Aluminum Co. | | | 10,315 | | | | 742,989 | |
Freeport-McMoRan, Inc. | | | 13,123 | | | | 142,516 | |
Total Basic Materials | | | | | | | 1,810,774 | |
| | | | | | | | | |
Total Common Stocks | | | | | | | | |
(Cost $50,882,126) | | | | | | | 56,497,377 | |
| | | | | | | | | |
SHORT-TERM INVESTMENTS† - 4.8% | |
Dreyfus Treasury Securities Cash Management Fund - Institutional Class 0.16%1 | | | 2,805,387 | | | | 2,805,387 | |
Total Short-Term Investments | | | | | | | | |
(Cost $2,805,387) | | | | | | | 2,805,387 | |
| | | | | | | | | |
Total Investments - 101.3% | | | | | | | | |
(Cost $53,687,513) | | | | | | $ | 59,302,764 | |
Other Assets & Liabilities, net - (1.3)% | | | | | | | (740,416 | ) |
Total Net Assets - 100.0% | | | | | | $ | 58,562,348 | |
* | Non-income producing security. |
† | Value determined based on Level 1 inputs — See Note 4. |
1 | Rate indicated is the 7 day yield as of September 30, 2016. |
| | plc — Public Limited Company |
| | |
| | See Sector Classification in Other Information section. |
The following table summarizes the inputs used to value the Fund’s investments at September 30, 2016 (See Note 4 in the Notes to Financial Statements):
Investments in Securities (Assets) | | Level 1 | | | Level 2 | | | Level 3 | | | Total | |
Common Stocks | | $ | 56,497,377 | | | $ | — | | | $ | — | | | $ | 56,497,377 | |
Short-Term Investments | | | 2,805,387 | | | | — | | | | — | | | | 2,805,387 | |
Total | | $ | 59,302,764 | | | $ | — | | | $ | — | | | $ | 59,302,764 | |
Transfers between investment levels may occur as the markets fluctuate and/or the availability of data used in an investment’s valuation changes. Transfers between valuation levels, if any, are in comparison to the valuation levels at the end of the previous fiscal year, and are effective using the fair value as of the end of the previous fiscal period.
For the year ended September 30, 2016, there were no transfers between levels.
30 | THE GUGGENHEIM FUNDS ANNUAL REPORT | SEE NOTES TO FINANCIAL STATEMENTS. |
STATEMENT OF ASSETS AND LIABILITIES |
September 30, 2016 |
Assets: | |
Investments, at value (cost $53,687,513) | | $ | 59,302,764 | |
Prepaid expenses | | | 21,070 | |
Receivables: | |
Corporate action | | | 226,081 | |
Dividends | | | 72,986 | |
Fund shares sold | | | 173 | |
Total assets | | | 59,623,074 | |
| | | | | |
Liabilities: | |
Payable for: | |
Fund shares redeemed | | | 951,661 | |
Management fees | | | 29,145 | |
Transfer agent/maintenance fees | | | 21,904 | |
Distribution and service fees | | | 14,325 | |
Fund accounting/administration fees | | | 4,630 | |
Trustees’ fees* | | | 2,501 | |
Miscellaneous | | | 36,560 | |
Total liabilities | | | 1,060,726 | |
Net assets | | $ | 58,562,348 | |
| | | | | |
Net assets consist of: | |
Paid in capital | | $ | 50,201,740 | |
Undistributed net investment income | | | 813,658 | |
Accumulated net realized gain on investments | | | 1,931,699 | |
Net unrealized appreciation on investments | | | 5,615,251 | |
Net assets | | $ | 58,562,348 | |
| | | | | |
A-Class: | |
Net assets | | $ | 55,325,020 | |
Capital shares outstanding | | | 1,324,041 | |
Net asset value per share | | $ | 41.78 | |
Maximum offering price per share (Net asset value divided by 95.25%) | | $ | 43.86 | |
| | | | | |
C-Class: | |
Net assets | | $ | 3,075,123 | |
Capital shares outstanding | | | 79,502 | |
Net asset value per share | | $ | 38.68 | |
| | | | | |
P-Class: | |
Net assets | | $ | 122,587 | |
Capital shares outstanding | | | 2,937 | |
Net asset value per share | | $ | 41.74 | |
| | | | | |
Institutional Class: | |
Net assets | | $ | 39,618 | |
Capital shares outstanding | | | 947 | |
Net asset value per share | | $ | 41.84 | |
STATEMENT OF OPERATIONS |
Year Ended September 30, 2016 |
Investment Income: | |
Dividends (net of foreign withholding tax of $912) | | $ | 1,470,606 | |
Interest | | | 1,983 | |
Total investment income | | | 1,472,589 | |
| | | | | |
Expenses: | |
Management fees | | | 360,604 | |
Transfer agent/maintenance fees: | |
A-Class | | | 56,625 | |
C-Class | | | 7,120 | |
P-Class | | | 259 | |
Institutional Class | | | 380 | |
Distribution and service fees: | |
A-Class | | | 127,162 | |
C-Class | | | 35,455 | |
P-Class | | | 350 | |
Fund accounting/administration fees | | | 52,703 | |
Registration fees | | | 68,860 | |
Line of credit fees | | | 7,402 | |
Trustees’ fees* | | | 6,292 | |
Custodian fees | | | 421 | |
Tax expense | | | 6 | |
Miscellaneous | | | 44,769 | |
Total expenses | | | 768,408 | |
Less: | |
Expenses waived by Adviser | | | (97,985 | ) |
Net expenses | | | 670,423 | |
Net investment income | | | 802,166 | |
| | | | | |
Net Realized and Unrealized Gain (Loss): | |
Net realized gain (loss) on: | |
Investments | | | 2,362,410 | |
Net realized gain | | | 2,362,410 | |
Net change in unrealized appreciation (depreciation) on: | |
Investments | | | 5,158,045 | |
Net change in unrealized appreciation (depreciation) | | | 5,158,045 | |
Net realized and unrealized gain | | | 7,520,455 | |
Net increase in net assets resulting from operations | | $ | 8,322,621 | |
* | Relates to Trustees not deemed “interested persons” within the meaning of Section 2(a)(19) of the 1940 Act. |
SEE NOTES TO FINANCIAL STATEMENTS. | THE GUGGENHEIM FUNDS ANNUAL REPORT | 31 |
STATEMENTS OF CHANGES IN NET ASSETS |
| | | Year Ended
September 30,
2016 | | | Year Ended
September 30,
2015 | |
Increase (Decrease) in Net Assets from Operations: | | | | | | |
Net investment income | | $ | 802,166 | | | $ | 475,990 | |
Net realized gain on investments | | | 2,362,410 | | | �� | 8,151,325 | |
Net change in unrealized appreciation (depreciation) on investments | | | 5,158,045 | | | | (13,238,675 | ) |
Net increase (decrease) in net assets resulting from operations | | | 8,322,621 | | | | (4,611,360 | ) |
| | | | | | | | | |
Distributions to shareholders from: | | | | | | | | |
Net investment income | | | | | | | | |
A-Class | | | (433,473 | ) | | | (402,108 | ) |
B-Class | | | — | | | | (14,969 | ) |
C-Class | | | (6,564 | ) | | | (10,590 | ) |
P-Class | | | (6,451 | ) | | | — | * |
Institutional Class | | | (31,516 | ) | | | (35,334 | ) |
Net realized gains | | | | | | | | |
A-Class | | | (3,188,410 | ) | | | (1,529,881 | ) |
B-Class | | | — | | | | (41,043 | ) |
C-Class | | | (263,930 | ) | | | (138,586 | ) |
P-Class | | | (38,749 | ) | | | — | * |
Institutional Class | | | (178,457 | ) | | | (102,374 | ) |
Total distributions to shareholders | | | (4,147,550 | ) | | | (2,274,885 | ) |
| | | | | | | | | |
Capital share transactions: | | | | | | | | |
Proceeds from sale of shares | | | | | | | | |
A-Class | | | 13,212,897 | | | | 12,175,794 | |
B-Class | | | — | | | | 65,624 | |
C-Class | | | 638,542 | | | | 879,081 | |
P-Class | | | 4,067,215 | | | | 10,000 | * |
Institutional Class | | | 68,775 | | | | 264,341 | |
Distributions reinvested | | | | | | | | |
A-Class | | | 3,509,323 | | | | 1,855,957 | |
B-Class | | | — | | | | 55,872 | |
C-Class | | | 266,750 | | | | 146,562 | |
P-Class | | | 45,199 | | | | — | * |
Institutional Class | | | 209,973 | | | | 137,708 | |
Cost of shares redeemed | | | | | | | | |
A-Class | | | (11,004,700 | ) | | | (22,897,730 | ) |
B-Class | | | — | | | | (1,365,292 | ) |
C-Class | | | (1,369,222 | ) | | | (1,209,560 | ) |
P-Class | | | (3,997,610 | ) | | | — | * |
Institutional Class | | | (2,476,303 | ) | | | (887,546 | ) |
Net increase (decrease) from capital share transactions | | | 3,170,839 | | | | (10,769,189 | ) |
Net increase (decrease) in net assets | | | 7,345,910 | | | | (17,655,434 | ) |
| | | | | | | | | |
Net assets: | | | | | | | | |
Beginning of year | | | 51,216,438 | | | | 68,871,872 | |
End of year | | $ | 58,562,348 | | | $ | 51,216,438 | |
Undistributed net investment income at end of year | | $ | 813,658 | | | $ | 478,004 | |
32 | THE GUGGENHEIM FUNDS ANNUAL REPORT | SEE NOTES TO FINANCIAL STATEMENTS. |
STATEMENTS OF CHANGES IN NET ASSETS (concluded) |
| | | Year Ended
September 30,
2016 | | | Year Ended
September 30,
2015 | |
Capital share activity: | | | | | | |
Shares sold | | | | | | |
A-Class | | | 352,919 | | | | 283,554 | |
B-Class | | | — | | | | 1,656 | |
C-Class | | | 17,640 | | | | 21,744 | |
P-Class | | | 105,931 | | | | 229 | * |
Institutional Class | | | 1,722 | | | | 6,257 | |
Shares issued from reinvestment of distributions | | | | | | | | |
A-Class | | | 92,667 | | | | 43,212 | |
B-Class | | | — | | | | 1,419 | |
C-Class | | | 7,563 | | | | 3,646 | |
P-Class | | | 1,194 | | | | — | * |
Institutional Class | | | 5,548 | | | | 3,208 | |
Shares redeemed | | | | | | | | |
A-Class | | | (280,411 | ) | | | (544,300 | ) |
B-Class | | | — | | | | (34,996 | ) |
C-Class | | | (37,647 | ) | | | (30,302 | ) |
P-Class | | | (104,417 | ) | | | — | * |
Institutional Class | | | (71,269 | ) | | | (20,632 | ) |
Net increase (decrease) in shares | | | 91,440 | | | | (265,305 | ) |
* | Since commencement of operations: May 1, 2015. |
SEE NOTES TO FINANCIAL STATEMENTS. | THE GUGGENHEIM FUNDS ANNUAL REPORT | 33 |
This table is presented to show selected data for a share outstanding throughout each period and to assist shareholders in evaluating a Fund’s performance for the periods presented.
A-Class | | Year Ended
September 30,
2016 | | | Year Ended
September 30,
2015 | | | Year Ended
September 30,
2014 | | | Year Ended
September 30,
2013 | | | Year Ended
September 30,
2012 | |
Per Share Data | | | | | | | | | | | | | | | |
Net asset value, beginning of period | | $ | 39.11 | | | $ | 43.80 | | | $ | 38.28 | | | $ | 31.25 | | | $ | 24.58 | |
Income (loss) from investment operations: | |
Net investment income (loss)a | | | .58 | | | | .36 | | | | .30 | | | | .29 | | | | .25 | |
Net gain (loss) on investments (realized and unrealized) | | | 5.23 | | | | (3.36 | ) | | | 5.51 | | | | 7.03 | | | | 6.58 | |
Total from investment operations | | | 5.81 | | | | (3.00 | ) | | | 5.81 | | | | 7.32 | | | | 6.83 | |
Less distributions from: | |
Net investment income | | | (.37 | ) | | | (.35 | ) | | | (.29 | ) | | | (.29 | ) | | | (.16 | ) |
Net realized gains | | | (2.77 | ) | | | (1.34 | ) | | | — | | | | — | | | | — | |
Total distributions | | | (3.14 | ) | | | (1.69 | ) | | | (.29 | ) | | | (.29 | ) | | | (.16 | ) |
Net asset value, end of period | | $ | 41.78 | | | $ | 39.11 | | | $ | 43.80 | | | $ | 38.28 | | | $ | 31.25 | |
| | |
Total Returnb | | | 15.69 | % | | | (7.19 | %) | | | 15.25 | % | | | 23.62 | % | | | 27.90 | % |
Ratios/Supplemental Data | |
Net assets, end of period (in thousands) | | $ | 55,325 | | | $ | 45,318 | | | $ | 60,281 | | | $ | 47,307 | | | $ | 41,173 | |
Ratios to average net assets: | |
Net investment income (loss) | | | 1.48 | % | | | 0.85 | % | | | 0.72 | % | | | 0.82 | % | | | 0.86 | % |
Total expensesc | | | 1.34 | % | | | 1.35 | % | | | 1.48 | % | | | 1.48 | % | | | 1.65 | % |
Net expensesd | | | 1.17 | %g | | | 1.16 | %g | | | 1.17 | %g | | | 1.15 | % | | | 1.18 | % |
Portfolio turnover rate | | | 56 | % | | | 60 | % | | | 40 | % | | | 43 | % | | | 16 | % |
C-Class | | Year Ended
September 30,
2016 | | | Year Ended
September 30,
2015 | | | Year Ended
September 30,
2014 | | | Year Ended
September 30,
2013 | | | Year Ended
September 30,
2012 | |
Per Share Data | | | | | | | | | | | | | | | |
Net asset value, beginning of period | | $ | 36.38 | | | $ | 40.91 | | | $ | 35.86 | | | $ | 29.30 | | | $ | 23.08 | |
Income (loss) from investment operations: | |
Net investment income (loss)a | | | .27 | | | | .04 | | | | (.02 | ) | | | .02 | | | | .03 | |
Net gain (loss) on investments (realized and unrealized) | | | 4.87 | | | | (3.13 | ) | | | 5.16 | | | | 6.62 | | | | 6.19 | |
Total from investment operations | | | 5.14 | | | | (3.09 | ) | | | 5.14 | | | | 6.64 | | | | 6.22 | |
Less distributions from: | |
Net investment income | | | (.07 | ) | | | (.10 | ) | | | (.09 | ) | | | (.08 | ) | | | — | |
Net realized gains | | | (2.77 | ) | | | (1.34 | ) | | | — | | | | — | | | | — | |
Total distributions | | | (2.84 | ) | | | (1.44 | ) | | | (.09 | ) | | | (.08 | ) | | | — | |
Net asset value, end of period | | $ | 38.68 | | | $ | 36.38 | | | $ | 40.91 | | | $ | 35.86 | | | $ | 29.30 | |
| | |
Total Returnb | | | 14.87 | % | | | (7.89 | %) | | | 14.35 | % | | | 22.73 | % | | | 26.95 | % |
Ratios/Supplemental Data | |
Net assets, end of period (in thousands) | | $ | 3,075 | | | $ | 3,345 | | | $ | 3,963 | | | $ | 3,494 | | | $ | 2,257 | |
Ratios to average net assets: | |
Net investment income (loss) | | | 0.75 | % | | | 0.10 | % | | | (0.04 | %) | | | 0.08 | % | | | 0.12 | % |
Total expensesc | | | 2.18 | % | | | 2.16 | % | | | 2.33 | % | | | 2.47 | % | | | 2.45 | % |
Net expensesd | | | 1.92 | %g | | | 1.91 | %g | | | 1.92 | %g | | | 1.90 | % | | | 1.93 | % |
Portfolio turnover rate | | | 56 | % | | | 60 | % | | | 40 | % | | | 43 | % | | | 16 | % |
34 | THE GUGGENHEIM FUNDS ANNUAL REPORT | SEE NOTES TO FINANCIAL STATEMENTS. |
FINANCIAL HIGHLIGHTS (continued) |
This table is presented to show selected data for a share outstanding throughout each period and to assist shareholders in evaluating a Fund’s performance for the periods presented.
P-Class | | Year Ended
September 30,
2016 | | | Period Ended
September 30,
2015e | |
Per Share Data | | | | | | |
Net asset value, beginning of period | | $ | 39.13 | | | $ | 43.64 | |
Income (loss) from investment operations: | |
Net investment income (loss)a | | | 1.40 | | | | .22 | |
Net gain (loss) on investments (realized and unrealized) | | | 4.44 | | | | (4.73 | ) |
Total from investment operations | | | 5.84 | | | | (4.51 | ) |
Less distributions from: | |
Net investment income | | | (.46 | ) | | | — | |
Net realized gains | | | (2.77 | ) | | | — | |
Total distributions | | | (3.23 | ) | | | — | |
Net asset value, end of period | | $ | 41.74 | | | $ | 39.13 | |
| | |
Total Returnb | | | 15.83 | % | | | (10.38 | %) |
Ratios/Supplemental Data | |
Net assets, end of period (in thousands) | | $ | 123 | | | $ | 9 | |
Ratios to average net assets: | |
Net investment income (loss) | | | 3.61 | % | | | 1.21 | % |
Total expensesc | | | 1.41 | % | | | 3.29 | % |
Net expensesd,g | | | 1.17 | % | | | 1.16 | % |
Portfolio turnover rate | | | 56 | % | | | 60 | % |
SEE NOTES TO FINANCIAL STATEMENTS. | THE GUGGENHEIM FUNDS ANNUAL REPORT | 35 |
FINANCIAL HIGHLIGHTS (concluded) |
This table is presented to show selected data for a share outstanding throughout each period and to assist shareholders in evaluating a Fund’s performance for the periods presented.
Institutional Class | | Year Ended
September 30,
2016 | | | Year Ended
September 30,
2015 | | | Year Ended
September 30,
2014 | | | Period Ended
September 30,
2013f | |
Per Share Data | | | | | | | | | | | | |
Net asset value, beginning of period | | $ | 39.17 | | | $ | 43.87 | | | $ | 38.32 | | | $ | 36.84 | |
Income (loss) from investment operations: | |
Net investment income (loss)a | | | .83 | | | | .47 | | | | .40 | | | | .13 | |
Net gain (loss) on investments (realized and unrealized) | | | 5.10 | | | | (3.37 | ) | | | 5.51 | | | | 1.35 | |
Total from investment operations | | | 5.93 | | | | (2.90 | ) | | | 5.91 | | | | 1.48 | |
Less distributions from: | |
Net investment income | | | (.49 | ) | | | (.46 | ) | | | (.36 | ) | | | — | |
Net realized gains | | | (2.77 | ) | | | (1.34 | ) | | | — | | | | — | |
Total distributions | | | (3.26 | ) | | | (1.80 | ) | | | (.36 | ) | | | — | |
Net asset value, end of period | | $ | 41.84 | | | $ | 39.17 | | | $ | 43.87 | | | $ | 38.32 | |
| | |
Total Returnb | | | 15.98 | % | | | (6.97 | %) | | | 15.52 | % | | | 4.02 | % |
Ratios/Supplemental Data | |
Net assets, end of period (in thousands) | | $ | 40 | | | $ | 2,544 | | | $ | 3,339 | | | $ | 2,831 | |
Ratios to average net assets: | |
Net investment income (loss) | | | 2.13 | % | | | 1.09 | % | | | 0.96 | % | | | 1.12 | % |
Total expensesc | | | 1.04 | % | | | 0.98 | % | | | 1.08 | % | | | 1.12 | % |
Net expensesd | | | 0.92 | %g | | | 0.91 | %g | | | 0.92 | %g | | | 0.89 | % |
Portfolio turnover rate | | | 56 | % | | | 60 | % | | | 40 | % | | | 43 | % |
a | Net investment income (loss) per share was computed using average shares outstanding throughout the period. |
b | Total return does not reflect the impact of any applicable sales charges and has not been annualized. |
c | Does not include expenses of the underlying funds in which the Fund invests. |
d | Net expense information reflects the expense ratios after expense waivers and reimbursements, as applicable. |
e | Since commencement of operations: May 1, 2015. Percentage amounts for the period, except total return and portfolio turnover rate, have been annualized. |
f | Since commencement of operations: June 7, 2013. Percentage amounts for the period, except total return and portfolio turnover rate, have been annualized. |
g | Net expenses may include expenses that are excluded from the expense limitation agreement. Excluding these expenses, the operating expense ratios for the periods presented would be: |
| | | 09/30/16 | 09/30/15 | 09/30/14 |
| | A-Class | 1.15% | 1.15% | 1.15% |
| | C-Class | 1.90% | 1.90% | 1.90% |
| | P-Class | 1.15% | 1.15% | — |
| | Institutional Class | 0.90% | 0.90% | 0.90% |
36 | THE GUGGENHEIM FUNDS ANNUAL REPORT | SEE NOTES TO FINANCIAL STATEMENTS. |
MANAGERS’ COMMENTARY (Unaudited) | September 30, 2016 |
To Our Shareholders:
Guggenheim Market Neutral Real Estate Fund (the “Fund”) is managed by a team of seasoned professionals, including Jayson Flowers, Senior Managing Director and Portfolio Manager, and Thomas Youn, CFA, Managing Director and Portfolio Manager. In the following paragraphs, the investment team discusses performance for the abbreviated fiscal year ended September 30, 2016.
For the abbreviated fiscal ended September 30, 2016, the Guggenheim Market Neutral Real Estate Fund returned -2.20%1, compared with the 0.21% return of its benchmark, the Bank of American Merrill Lynch 3-Month U.S. Treasury Bill Index. The inception date of the Fund was February 26, 2016.
The Fund seeks to deliver strong risk-adjusted absolute returns with low correlation to the overall market by purchasing long and selling short publicly-traded real estate investment trusts (REITs) and other real estate operating companies based in the U.S.
Market Review
Despite all of the concern and anxiety over rising interest rates in late 2015, real estate investment trusts (REITs) generated robust gains through the September fiscal year end 2016. REITs outperformed the broad market with a 19.82% return compared to 15.43% for the S&P 500. There were three major drivers impacting REIT share prices: a sharp decline in global interest rates, a change in the GICS classification which promoted REITs to the 11th standalone sector in the S&P 500, and persistently strong fund flows from Japanese investors into U.S. REITs.
Following the Fed’s initial interest rate hike in December 2015, global interest rates declined sharply with an increasing amount of government debt priced at negative yields. U.S. investment-grade bond yields declined by 1.21% to 4.29% at the end of September, which provided support for income-oriented sectors such as REITs. The GICS classification change drove inflows into the REIT sector, as many diversified equity fund managers found themselves significantly underweight the newest stand alone sector (REITs) following the change in September. Lastly, Japanese REIT funds have provided persistently strong inflows into U.S. REITs likely due to the prevailing negative yields faced by Japanese investors.
The best-performing sectors for the trailing 12 months were net lease (40.30%), industrial (44.05%), and manufactured housing (29.57%). The net lease sector benefitted from the sharp decline in interest rates while the industrial and manufactured housing sectors benefitted by steadily improving fundamentals. The worst-performing sectors were hotels (0.86%), self storage (7.08%), and apartments (10.73%). All three sectors have shorter-term leases compared to the other major property types and exhibited the most pronounced deceleration or moderation in fundamentals.
In general, commercial real estate (CRE) fundamentals remained solid at period end as the market approached the latter innings of the CRE cycle. Property occupancy rates are at cyclical high levels, making further gains increasingly difficult to achieve. Valuations have surpassed prior peak levels with multiples at cyclical highs. Rental rate growth remains robust overall, although certain property types and geographies began to show signs of moderation primarily in areas where new construction has picked up meaningfully. Capital markets conditions at period end remained robust, with ample equity and debt capital earmarked for CRE, both domestically and from overseas although both debt and equity providers have become slightly more cautious in recent quarters.
Performance Review
The Fund underperformed its benchmark for the abbreviated fiscal year ended September 30, 2016. The Fund maintained a bias towards higher quality REITs with above-average growth prospects and lower leverage, which was generally unrewarded over the reporting period. Due to the sharp decline in global interest rates and credit spreads, many lower-quality REITs with higher leverage and dividend yields outperformed the average REIT, resulting in outsized losses from the short book.
Key performance contributors were concentrated within the residential, data center, industrial, and self storage sectors, where relative value pair-traded worked well. Key performance detractors were concentrated within the office and specialized REIT sectors, particularly on the short side. A short position in Government Properties Trust, an office REIT focused in government and government related tenants, gained 58.96%, resulting in -2.57% contribution. Similarly, a short position in Iron Mountain, a document storage provider, gained 30.73% resulting in -1.06% contribution.
| | THE GUGGENHEIM FUNDS ANNUAL REPORT | 37 |
MANAGERS’ COMMENTARY (Unaudited)(concluded) | September 30, 2016 |
Strategy
As of September 30, 2016 the Fund maintained 90.26% long exposure and 90.70% short exposure resulting in minimal exposure to equity REITs or the broad market. Portfolio construction remained defensively positioned against moderating CRE fundamentals. At the same time, the Fund is positioned defensively against the potential negative impact of rising interest rates.
Key sector overweights at period end include manufactured housing, industrial, wireless tower, and timber REITs. We believe these sectors present attractive growth prospects relative to current valuations and will prove defensive in the event of a downshift in economic growth. Key sector underweights are healthcare and net-lease REITs, due primarily to their long lease durations, higher sensitivity to interest rates, and rich relative valuation compared to historical norms.
Outlook
Following several years of steady recovery and improving fundamentals the outlook for REITs has become more muted. Simply put, we are entering the latter innings of this real estate cycle with fundamentals at or near cyclical highs across most metrics. As was the case in 2016, property values will likely continue to grind modestly higher due to underlying property cash flow growth while multiple expansion may prove difficult given the threat of rising interest rates and CRE’s relative valuation versus other asset classes. Despite the moderating outlook for CRE fundamentals, the outlook for REITs still remains positive as they will likely offer solid earnings and dividend growth over the coming year, an attractive dividend yield relative to other asset classes, and potential inflation protection through underlying rent growth.
Performance displayed represents past performance which is no guarantee of future results.
1 | Performance figures are based on Class A shares and do not reflect taxes that a shareholder would pay on distributions or the redemption of shares. |
The opinions and forecast expressed may not actually come to pass. This information is subject to change at any time, based on market and other conditions, and should not be construed as a recommendation of any specific security or strategy.
38 | THE GUGGENHEIM FUNDS ANNUAL REPORT | |
PERFORMANCE REPORT AND FUND PROFILE (Unaudited) | September 30, 2016 |
MARKET NEUTRAL REAL ESTATE FUND
OBJECTIVE: Seeks to provide capital appreciation, while limiting exposure to general stock market risk.
Holdings Diversification (Market Exposure as % of Net Assets)
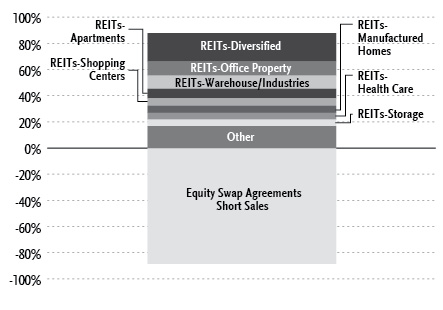
“Holdings Diversification (Market Exposure as % of Net Assets)” excludes any temporary cash investments.
Inception Dates: |
A-Class | February 26, 2016 |
C-Class | February 26, 2016 |
P-Class | February 26, 2016 |
Institutional Class | February 26, 2016 |
Ten Largest Holdings (% of Total Net Assets) |
National Storage Affiliates Trust | 5.0% |
Rexford Industrial Realty, Inc. | 4.1% |
Four Corners Property Trust, Inc. | 3.6% |
American Tower Corp. — Class A | 3.5% |
Gramercy Property Trust | 3.3% |
Hilton Worldwide Holdings, Inc. | 3.3% |
CyrusOne, Inc. | 3.2% |
Physicians Realty Trust | 3.1% |
Blackstone Mortgage Trust, Inc. — Class A | 3.0% |
Weyerhaeuser Co. | 3.0% |
Top Ten Total | 35.1% |
| | |
“Ten Largest Holdings” excludes any temporary cash or derivative investments. |
| | THE GUGGENHEIM FUNDS ANNUAL REPORT | 39 |
PERFORMANCE REPORT AND FUND PROFILE (Unaudited)(concluded) | September 30, 2016 |
Cumulative Fund Performance*
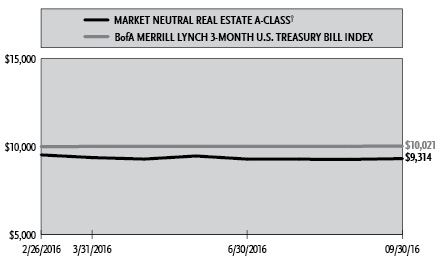
Average Annual Returns*
Period Ended September 30, 2016
| | | | Since Inception
(02/26/16) |
A-Class Shares | | | -2.20% |
A-Class Shares with sales charge† | | | -6.86% |
C-Class Shares | | | -2.60% |
C-Class Shares with CDSC‡ | | | -3.57% |
P-Class Shares | | | -2.20% |
Institutional Class Shares | | | -2.04% |
BofA Merrill Lynch 3-Month U.S. Treasury Bill Index | | | 0.21% |
* | The performance data above represents past performance that is not predictive of future results. The investment return and principal value of an investment in the Fund will fluctuate so that an investor’s shares, when redeemed, may be worth more or less than their original cost. Returns are historical and include changes in principal and reinvested dividends and capital gains and do not reflect the effect of taxes. The BofA Merrill Lynch 3-Month U.S. Treasury Bill Index is an unmanaged index and, unlike the Fund, has no management fees or operating expenses to reduce its reported return. The graph is based on A-Class shares only; performance for C-Class, P-Class and Institutional Class will vary due to differences in fee structures. |
† | Fund returns are calculated using the maximum sales charge of 4.75%. |
‡ | Fund returns include a CDSC of 1% if redeemed within 12 months of purchase. |
40 | THE GUGGENHEIM FUNDS ANNUAL REPORT | |
SCHEDULE OF INVESTMENTS | September 30, 2016 |
MARKET NEUTRAL REAL ESTATE FUND | |
| | | Shares | | | Value | |
| | | | | | | |
COMMON STOCKS† - 87.8% | |
| | | | | | | |
REITs - 79.0% | |
REITs-Diversified - 21.8% | |
American Tower Corp. — Class A3 | | | 1,516 | | | $ | 171,807 | |
Weyerhaeuser Co. | | | 4,603 | | | | 147,019 | |
American Assets Trust, Inc. | | | 3,275 | | | | 142,069 | |
Equinix, Inc.3 | | | 394 | | | | 141,939 | |
Cousins Properties, Inc. | | | 13,236 | | | | 138,184 | |
Liberty Property Trust | | | 3,054 | | | | 123,229 | |
Crown Castle International Corp.3 | | | 953 | | | | 89,782 | |
GEO Group, Inc. | | | 3,224 | | | | 76,667 | |
Corrections Corporation of America | | | 2,948 | | | | 40,889 | |
Total REITs-Diversified | | | | | | | 1,071,585 | |
| | | | | | | | | |
REITs-Office Property - 10.6% | |
Gramercy Property Trust | | | 17,014 | | | | 164,015 | |
Mack-Cali Realty Corp. | | | 3,379 | | | | 91,976 | |
Hudson Pacific Properties, Inc. | | | 2,747 | | | | 90,294 | |
Alexandria Real Estate Equities, Inc. | | | 827 | | | | 89,953 | |
First Potomac Realty Trust | | | 9,657 | | | | 88,362 | |
Total REITs-Office Property | | | | | | | 524,600 | |
| | | | | | | | | |
REITs-Warehouse/Industries - 10.2% | |
Rexford Industrial Realty, Inc. | | | 8,775 | | | | 200,860 | |
CyrusOne, Inc. | | | 3,288 | | | | 156,410 | |
EastGroup Properties, Inc. | | | 1,991 | | | | 146,458 | |
Total REITs-Warehouse/Industries | | | | | | | 503,728 | |
| | | | | | | | | |
REITs-Apartments - 7.2% | |
Colony Starwood Homes | | | 4,489 | | | | 128,834 | |
American Homes 4 Rent — Class A | | | 5,362 | | | | 116,034 | |
Equity Residential | | | 1,711 | | | | 110,069 | |
Total REITs-Apartments | | | | | | | 354,937 | |
| | | | | | | | | |
REITs-Shopping Centers - 5.8% | |
Federal Realty Investment Trust3 | | | 926 | | | | 142,539 | |
Acadia Realty Trust | | | 3,898 | | | | 141,264 | |
Total REITs-Shopping Centers | | | | | | | 283,803 | |
| | | | | | | | | |
REITs-Manufactured Homes - 5.4% | |
Sun Communities, Inc. | | | 1,865 | | | | 146,365 | |
Equity LifeStyle Properties, Inc. | | | 1,575 | | | | 121,559 | |
Total REITs-Manufactured Homes | | | | | | | 267,924 | |
| | | | | | | | | |
REITs-Health Care - 5.1% | |
Physicians Realty Trust | | | 7,178 | | | | 154,614 | |
Healthcare Trust of America, Inc. — Class A | | | 2,917 | | | | 95,153 | |
Total REITs-Health Care | | | | | | | 249,767 | |
| | | | | | | | | |
REITs-Storage - 5.0% | |
National Storage Affiliates Trust | | | 11,712 | | | | 245,249 | |
| | | | | | | | | |
REITs-Mortgage - 3.0% | |
Blackstone Mortgage Trust, Inc. — Class A | | | 5,020 | | | | 147,839 | |
| | | | | | | | | |
REITs-Regional Malls - 2.6% | |
General Growth Properties, Inc.3 | | | 4,609 | | | | 127,208 | |
| | | | | | | | | |
REITs-Hotels - 2.3% | |
Apple Hospitality REIT, Inc. | | | 6,112 | | | | 113,133 | |
Total REITs | | | | | | | 3,889,773 | |
| | | | | | | | | |
Real Estate - 3.6% | |
Real Estate Operations/Development - 3.6% | |
Four Corners Property Trust, Inc. | | | 8,289 | | | | 176,804 | |
| | | | | | | | | |
Lodging - 3.3% | |
Hotels & Motels - 3.3% | |
Hilton Worldwide Holdings, Inc. | | | 7,064 | | | | 161,978 | |
| | | | | | | | | |
Home Builders - 1.9% | |
Building-Residential/Commercial - 1.9% | |
LGI Homes, Inc.* | | | 2,587 | | | | 95,305 | |
| | | | | | | | | |
Total Common Stocks | | | | | | | | |
(Cost $4,052,672) | | | | | | | 4,323,860 | |
| | | | | | | | | |
SHORT-TERM INVESTMENTS† - 6.8% | |
Goldman Sachs Financial Square Treasury Instruments Fund - Institutional Class 0.15%1 | | | 333,376 | | | | 333,376 | |
Total Short-Term Investments | | | | | | | | |
(Cost $333,376) | | | | | | | 333,376 | |
| | | | | | | | | |
Total Investments - 94.6% | | | | | | | | |
(Cost $4,386,048) | | | | | | $ | 4,657,236 | |
Other Assets & Liabilities, net - 5.4% | | | | | | | 268,040 | |
Total Net Assets - 100.0% | | | | | | $ | 4,925,276 | |
| | | | | | | Unrealized
Gain (Loss) | |
| | | | | | | | | |
OTC EQUITY SWAP AGREEMENTS †† | |
Morgan Stanley
June 2017 Market Neutral Real
Estate Portfolio Short Custom
Basket Swap 0.05%2,
Terminating 06/15/17
(Notional Value $4,344,622) | | | | | | $ | (264,835 | ) |
| | | Shares | | | | | |
| | | | | | | | | |
CUSTOM BASKET OF SHORT SECURITIES | |
Investors Real Estate Trust | | | (30,074 | ) | | | 22,660 | |
Digital Realty Trust, Inc. | | | (1,830 | ) | | | 15,227 | |
Hersha Hospitality Trust | | | (5,100 | ) | | | 7,980 | |
Ramco-Gershenson Properties Trust | | | (8,105 | ) | | | 5,155 | |
Duke Realty Corp. | | | (4,121 | ) | | | 3,325 | |
Public Storage | | | (427 | ) | | | 3,067 | |
Macerich Co. | | | (1,642 | ) | | | 499 | |
National Retail Properties, Inc. | | | (1,928 | ) | | | 449 | |
Realty Income Corp. | | | (2,209 | ) | | | 105 | |
SEE NOTES TO FINANCIAL STATEMENTS. | THE GUGGENHEIM FUNDS ANNUAL REPORT | 41 |
SCHEDULE OF INVESTMENTS (concluded) | September 30, 2016 |
MARKET NEUTRAL REAL ESTATE FUND | |
| | | Shares | | | Unrealized
Loss | |
| | | | | | | |
Host Hotels & Resorts, Inc. | | | (7,649 | ) | | $ | (1,326 | ) |
Welltower, Inc. | | | (1,340 | ) | | | (2,076 | ) |
AvalonBay Communities, Inc. | | | (522 | ) | | | (2,394 | ) |
UDR, Inc. | | | (2,598 | ) | | | (2,790 | ) |
Forest City Realty Trust, Inc. — Class A | | | (6,123 | ) | | | (5,833 | ) |
iShares U.S. Real Estate ETF | | | (12,558 | ) | | | (6,011 | ) |
Kimco Realty Corp. | | | (3,842 | ) | | | (6,076 | ) |
Senior Housing Properties Trust | | | (6,563 | ) | | | (7,894 | ) |
Weingarten Realty Investors | | | (3,581 | ) | | | (12,222 | ) |
HCP, Inc. | | | (2,598 | ) | | | (16,521 | ) |
Lexington Realty Trust | | | (9,205 | ) | | | (17,459 | ) |
Piedmont Office Realty Trust, Inc. — Class A | | | (7,982 | ) | | | (18,867 | ) |
Government Properties Income Trust | | | (6,293 | ) | | | (30,459 | ) |
EPR Properties | | | (2,096 | ) | | | (34,799 | ) |
Iron Mountain, Inc. | | | (5,306 | ) | | | (41,977 | ) |
STAG Industrial, Inc. | | | (6,241 | ) | | | (43,875 | ) |
Douglas Emmett, Inc. | | | (4,672 | ) | | | (45,531 | ) |
Total Custom Basket of Short Securities | | | | | | | (237,643 | ) |
* | Non-income producing security. |
† | Value determined based on Level 1 inputs — See Note 4. |
†† | Value determined based on Level 2 inputs — See Note 4. |
1 | Rate indicated is the 7 day yield as of September 30, 2016. |
2 | Total return is based on the return of the custom basket of short securities +/- financing at a variable rate. Rate indicated is the rate effective at September 30, 2016. |
3 | All or a portion of this security is pledged as equity swap collateral at September 30, 2016. |
| | REIT — Real Estate Investment Trust |
| | |
| | See Sector Classification in Other Information section. |
The following table summarizes the inputs used to value the Fund’s investments at September 30, 2016 (See Note 4 in the Notes to Financial Statements):
Investments in Securities (Assets) | | Level 1 | | | Level 2 | | | Level 2 -
Other* | | | Level 3 | | | Total | |
Common Stocks | | $ | 4,323,860 | | | $ | — | | | $ | — | | | $ | — | | | $ | 4,323,860 | |
Short-Term Investments | | | 333,376 | | | | — | | | | — | | | | — | | | | 333,376 | |
Total | | $ | 4,657,236 | | | $ | — | | | $ | — | | | $ | — | | | $ | 4,657,236 | |
| | | | | | | | | | | | | | | | | | | | | |
Investments in Securities (Liabilities) | | Level 1 | | | Level 2 | | | Level 2 -
Other* | | | Level 3 | | | Total | |
Equity Swap Agreements | | $ | — | | | $ | — | | | $ | 264,835 | | | $ | — | | | $ | 264,835 | |
* | Other financial instruments include swaps which are reported as unrealized gain/loss at period end. |
Transfers between investment levels may occur as the markets fluctuate and/or the availability of data used in an investment’s valuation changes. Transfers between valuation levels, if any, are in comparison to the valuation levels at the end of the previous fiscal year, and are effective using the fair value as of the end of the previous fiscal period.
For the year ended September 30, 2016, there were no transfers between levels.
42 | THE GUGGENHEIM FUNDS ANNUAL REPORT | SEE NOTES TO FINANCIAL STATEMENTS. |
MARKET NEUTRAL REAL ESTATE FUND | |
STATEMENT OF ASSETS AND LIABILITIES |
September 30, 2016 |
Assets: | |
Investments, at value (cost $4,386,048) | | $ | 4,657,236 | |
Cash | | | 505,835 | |
Prepaid expenses | | | 57,336 | |
Receivables: | |
Dividends | | | 26,199 | |
Total assets | | | 5,246,606 | |
| | | | | |
Liabilities: | |
Unrealized depreciation on swap agreements | | | 264,835 | |
Payable for: | |
Swap settlement | | | 29,165 | |
Trustees’ fees* | | | 3,050 | |
Transfer agent/maintenance fees | | | 2,413 | |
Management fees | | | 172 | |
Distribution and service fees | | | 125 | |
Miscellaneous | | | 21,570 | |
Total liabilities | | | 321,330 | |
Net assets | | $ | 4,925,276 | |
| | | | | |
Net assets consist of: | |
Paid in capital | | $ | 4,695,842 | |
Undistributed net investment income | | | 264,835 | |
Accumulated net realized loss on investments | | | (41,754 | ) |
Net unrealized appreciation on investments | | | 6,353 | |
Net assets | | $ | 4,925,276 | |
| | | | | |
A-Class: | |
Net assets | | $ | 99,821 | |
Capital shares outstanding | | | 4,082 | |
Net asset value per share | | $ | 24.45 | |
Maximum offering price per share (Net asset value divided by 95.25%) | | $ | 25.67 | |
| | | | | |
C-Class: | |
Net assets | | $ | 97,396 | |
Capital shares outstanding | | | 4,000 | |
Net asset value per share | | $ | 24.35 | |
| | | | | |
P-Class: | |
Net assets | | $ | 123,701 | |
Capital shares outstanding | | | 5,059 | |
Net asset value per share | | $ | 24.45 | |
| | | | | |
Institutional Class: | |
Net assets | | $ | 4,604,358 | |
Capital shares outstanding | | | 188,000 | |
Net asset value per share | | $ | 24.49 | |
STATEMENT OF OPERATIONS |
Period Ended September 30, 2016** |
Investment Income: | |
Dividends | | $ | 94,930 | |
Interest | | | 648 | |
Total investment income | | | 95,578 | |
| | | | | |
Expenses: | |
Management fees | | | 31,765 | |
Transfer agent/maintenance fees: | |
A-Class | | | 57 | |
C-Class | | | 46 | |
P-Class | | | 42 | |
Institutional Class | | | 440 | |
Distribution and service fees: | |
A-Class | | | 147 | |
C-Class | | | 575 | |
P-Class | | | 156 | |
Fund accounting/administration fees | | | 14,725 | |
Registration fees | | | 15,306 | |
Professional fees | | | 15,276 | |
Custodian fees | | | 5,891 | |
Trustees’ fees* | | | 5,477 | |
Line of credit fees | | | 190 | |
Miscellaneous | | | 9,216 | |
Total expenses | | | 99,309 | |
Less: | |
Expenses waived by Adviser | | | (58,350 | ) |
Net expenses | | | 40,959 | |
Net investment income | | | 54,619 | |
| | | | | |
Net Realized and Unrealized Gain (Loss): | |
Net realized gain (loss) on: | |
Investments | | | 497,152 | |
Swap agreements | | | (660,631 | ) |
Net realized loss | | | (163,479 | ) |
Net change in unrealized appreciation (depreciation) on: | |
Investments | | | 271,188 | |
Swap agreements | | | (264,835 | ) |
Net change in unrealized appreciation (depreciation) | | | 6,353 | |
Net realized and unrealized loss | | | (157,126 | ) |
Net decrease in net assets resulting from operations | | $ | (102,507 | ) |
* | Relates to Trustees not deemed “interested persons” within the meaning of Section 2(a)(19) of the 1940 Act. |
** | Since commencement of operations: February 26, 2016. |
SEE NOTES TO FINANCIAL STATEMENTS. | THE GUGGENHEIM FUNDS ANNUAL REPORT | 43 |
MARKET NEUTRAL REAL ESTATE FUND | |
STATEMENTS OF CHANGES IN NET ASSETS |
| | | Period Ended
September 30,
2016a | |
Increase (Decrease) in Net Assets from Operations: | | | |
Net investment income | | $ | 54,619 | |
Net realized loss on investments | | | (163,479 | ) |
Net change in unrealized appreciation (depreciation) on investments | | | 6,353 | |
Net decrease in net assets resulting from operations | | | (102,507 | ) |
| | | | | |
Capital share transactions: | | | | |
Proceeds from sale of shares | | | | |
A-Class | | | 102,011 | |
C-Class | | | 100,000 | |
P-Class | | | 125,772 | |
Institutional Class | | | 4,700,000 | |
Net increase from capital share transactions | | | 5,027,783 | |
Net increase in net assets | | | 4,925,276 | |
| | | | | |
Net assets: | | | | |
Beginning of period | | | — | |
End of period | | $ | 4,925,276 | |
Undistributed net investment income at end of period | | $ | 264,835 | |
| | | | | |
Capital share activity: | | | | |
Shares sold | | | | |
A-Class | | | 4,082 | |
C-Class | | | 4,000 | |
P-Class | | | 5,059 | |
Institutional Class | | | 188,000 | |
Net increase in shares | | | 201,141 | |
a | Since commencement of operations: February 26, 2016. |
44 | THE GUGGENHEIM FUNDS ANNUAL REPORT | SEE NOTES TO FINANCIAL STATEMENTS. |
MARKET NEUTRAL REAL ESTATE FUND | |
This table is presented to show selected data for a share outstanding throughout each period and to assist shareholders in evaluating a Fund’s performance for the periods presented.
A-Class | | Period Ended
September 30,
2016a | |
Per Share Data | | | |
Net asset value, beginning of period | | $ | 25.00 | |
Income (loss) from investment operations: | | | | |
Net investment income (loss)b | | | .24 | |
Net gain (loss) on investments (realized and unrealized) | | | (.79 | ) |
Total from investment operations | | | (.55 | ) |
Net asset value, end of period | | $ | 24.45 | |
| | | | | |
Total Returnc | | | (2.20 | %) |
Ratios/Supplemental Data | |
Net assets, end of period (in thousands) | | $ | 100 | |
Ratios to average net assets: | | | | |
Net investment income (loss) | | | 1.66 | % |
Total expenses | | | 3.74 | % |
Net expensesd,e | | | 1.64 | % |
Portfolio turnover rate | | | 135 | % |
C-Class | | Period Ended
September 30,
2016a | |
Per Share Data | | | |
Net asset value, beginning of period | | $ | 25.00 | |
Income (loss) from investment operations: | | | | |
Net investment income (loss)b | | | .12 | |
Net gain (loss) on investments (realized and unrealized) | | | (.77 | ) |
Total from investment operations | | | (.65 | ) |
Net asset value, end of period | | $ | 24.35 | |
| | | | | |
Total Returnc | | | (2.60 | %) |
Ratios/Supplemental Data | |
Net assets, end of period (in thousands) | | $ | 97 | |
Ratios to average net assets: | | | | |
Net investment income (loss) | | | 0.93 | % |
Total expenses | | | 4.47 | % |
Net expensesd,e | | | 2.38 | % |
Portfolio turnover rate | | | 135 | % |
SEE NOTES TO FINANCIAL STATEMENTS. | THE GUGGENHEIM FUNDS ANNUAL REPORT | 45 |
MARKET NEUTRAL REAL ESTATE FUND | |
FINANCIAL HIGHLIGHTS (continued) |
This table is presented to show selected data for a share outstanding throughout each period and to assist shareholders in evaluating a Fund’s performance for the periods presented.
P-Class | | Period Ended
September 30,
2016a | |
Per Share Data | | | |
Net asset value, beginning of period | | $ | 25.00 | |
Income (loss) from investment operations: | | | | |
Net investment income (loss)b | | | .26 | |
Net gain (loss) on investments (realized and unrealized) | | | (.81 | ) |
Total from investment operations | | | (.55 | ) |
Net asset value, end of period | | $ | 24.45 | |
| | | | | |
Total Returnc | | | (2.20 | %) |
Ratios/Supplemental Data | |
Net assets, end of period (in thousands) | | $ | 124 | |
Ratios to average net assets: | | | | |
Net investment income (loss) | | | 1.64 | % |
Total expenses | | | 3.65 | % |
Net expensesd,e | | | 1.66 | % |
Portfolio turnover rate | | | 135 | % |
46 | THE GUGGENHEIM FUNDS ANNUAL REPORT | SEE NOTES TO FINANCIAL STATEMENTS. |
MARKET NEUTRAL REAL ESTATE FUND | |
FINANCIAL HIGHLIGHTS (concluded) |
This table is presented to show selected data for a share outstanding throughout each period and to assist shareholders in evaluating a Fund’s performance for the periods presented.
Institutional Class | | Period Ended
September 30,
2016a | |
Per Share Data | | | |
Net asset value, beginning of period | | $ | 25.00 | |
Income (loss) from investment operations: | | | | |
Net investment income (loss)b | | | .28 | |
Net gain (loss) on investments (realized and unrealized) | | | (.79 | ) |
Total from investment operations | | | (.51 | ) |
Net asset value, end of period | | $ | 24.49 | |
| | | | | |
Total Returnc | | | (2.04 | %) |
Ratios/Supplemental Data | |
Net assets, end of period (in thousands) | | $ | 4,604 | |
Ratios to average net assets: | | | | |
Net investment income (loss) | | | 1.92 | % |
Total expenses | | | 3.41 | % |
Net expensesd,e | | | 1.39 | % |
Portfolio turnover rate | | | 135 | % |
a | Since commencement of operations: February 26, 2016. Percentage amounts for the period, except total return and portfolio turnover rate, have been annualized. |
b | Net investment income (loss) per share was computed using average shares outstanding throughout the period. |
c | Total return does not reflect the impact of any applicable sales charges and has not been annualized. |
d | Net expense information reflects the expense ratios after expense waivers and reimbursements, as applicable. |
e | Net expenses may include expenses that are excluded from the expense limitation agreement and recouped amounts excluding these expenses, the operating expense ratios for the periods presented would be: |
| | | 09/30/16 |
| | A-Class | 1.63% |
| | C-Class | 2.37% |
| | P-Class | 1.65% |
| | Institutional Class | 1.38% |
SEE NOTES TO FINANCIAL STATEMENTS. | THE GUGGENHEIM FUNDS ANNUAL REPORT | 47 |
MANAGERS’ COMMENTARY (Unaudited) | September 30, 2016 |
To Our Shareholders:
Guggenheim Risk Managed Real Estate Fund (the “Fund”) is managed by a team of seasoned professionals, including Jayson Flowers, Senior Managing Director and Portfolio Manager; Thomas Youn, CFA, Managing Director and Portfolio Manager; and Gary McDaniel, CFA, Managing Director and Portfolio Manager. In the following paragraphs, the investment team discusses performance for the fiscal year ended September 30, 2016.
For the fiscal ended September 30, 2016, the Guggenheim Risk Managed Real Estate Fund returned 14.88%1, compared with the 19.82% return of its benchmark, the FTSE NAREIT Equity REITs Index.
Market Review
Despite all of the concern and anxiety over rising interest rates in late 2015, real estate investment trusts (REITs) generated robust gains through the September fiscal year end 2016. REITs outperformed the broad market with a 19.82% return compared to 15.43% for the S&P 500. There were three major drivers impacting REIT share prices: a sharp decline in global interest rates, a change in the GICS classification which promoted REITs to the 11th standalone sector in the S&P 500, and persistently strong fund flows from Japanese investors into U.S. REITs.
Following the Fed’s initial interest rate hike in December 2015, global interest rates declined sharply with an increasing amount of government debt priced at negative yields. U.S. investment-grade bond yields declined by 1.21% to 4.29% at the end of September, which provided support for income-oriented sectors such as REITs. The GICS classification change drove inflows into the REIT sector, as many diversified equity fund managers found themselves significantly underweight the newest stand alone sector (REITs) following the change in September. Lastly, Japanese REIT funds have provided persistently strong inflows into U.S. REITs likely due to the prevailing negative yields faced by Japanese investors.
The best-performing sectors for the trailing 12 months were net lease (40.30%), industrial (44.05%), and manufactured housing (29.57%). The net lease sector benefitted from the sharp decline in interest rates while the industrial and manufactured housing sectors benefitted by steadily improving fundamentals. The worst-performing sectors were hotels (0.86%), self storage (7.08%), and apartments (10.73%). All three sectors have shorter-term leases compared to the other major property types and exhibited the most pronounced deceleration or moderation in fundamentals.
In general, commercial real estate (CRE) fundamentals remained solid at period end as the market approached the latter innings of the CRE cycle. Property occupancy rates are at cyclical high levels, making further gains increasingly difficult to achieve. Valuations have surpassed prior peak levels with multiples at cyclical highs. Rental rate growth remains robust overall, although certain property types and geographies began to show signs of moderation primarily in areas where new construction has picked up meaningfully. Capital markets conditions at period end remained robust, with ample equity and debt capital earmarked for CRE, both domestically and from overseas although both debt and equity providers have become slightly more cautious in recent quarters.
Performance Review
The Fund underperformed its benchmark for the fiscal year ended September 30, 2016. Inception-to-date, the Fund has outperformed the benchmark index by 0.44% annually, net of fees, with a gain of 39.11% compared to 37.74% for the index. Consistent with the Fund’s objective, the Fund has also managed risk with a 13.1% reduction in daily volatility compared to the benchmark index since inception.
The Fund’s recent underperformance was primarily driven by the Fund’s allocation decision to maintain an average long-only sleeve weight of 89% and a long/short sleeve weight of 41% during the fiscal year. The less-than-full market exposure level against a nearly 20% gain in the index resulted in a -2.29% contribution to performance. The long-only sleeve underperformed the benchmark index slightly, resulting in a -0.23% contribution. Finally, the long/short sleeve lost 2.28% (absolute return) equating to a -0.93% contribution.
48 | THE GUGGENHEIM FUNDS ANNUAL REPORT | |
MANAGERS’ COMMENTARY (Unaudited)(concluded) | September 30, 2016 |
Strategy
The Fund entered 2016 with market exposure levels in the low-90% range, which is a relatively neutral level for the strategy. As the year progressed, the Fund reduced market exposure by modulating the long-only sleeve allocation down to 82% by early September. The reduced exposure target was driven by several fundamental indicators within our REIT risk allocation model which began to rollover over the course of 2016. Heading into 2017, we will continue to monitor these underlying fundamental indicators and make further adjustments as warranted.
Portfolio construction at the underlying sleeve level for the long-only and long/short strategies have remained defensively positioned against moderating CRE fundamentals since late 2015. At the same time, the portfolios are also positioned defensively against the potential negative impact of rising interest rates.
Key sector overweights at period end include manufactured housing, industrial, wireless tower, and timber REITs. We believe these sectors present attractive growth prospects relative to current valuations and will prove defensive in the event of a downshift in economic growth. Key sector underweights are healthcare and net-lease REITs, due primarily to their long lease durations, higher sensitivity to interest rates, and rich relative valuation compared to historical norms.
Outlook
Following several years of steady recovery and improving fundamentals the outlook for REITs has become more muted. Simply put, we are entering the latter innings of this real estate cycle with fundamentals at or near cyclical highs across most metrics. As was the case in 2016, property values will likely continue to grind modestly higher due to underlying property cash flow growth while multiple expansion may prove difficult given the threat of rising interest rates and CRE’s relative valuation versus other asset classes. Despite the moderating outlook for CRE fundamentals, the outlook for REITs still remains positive as they will likely offer solid earnings and dividend growth over the coming year, an attractive dividend yield relative to other asset classes, and potential inflation protection through underlying rent growth.
Performance displayed represents past performance which is no guarantee of future results.
1 | Performance figures are based on Class A shares and do not reflect taxes that a shareholder would pay on distributions or the redemption of shares. |
The opinions and forecast expressed may not actually come to pass. This information is subject to change at any time, based on market and other conditions, and should not be construed as a recommendation of any specific security or strategy.
| | THE GUGGENHEIM FUNDS ANNUAL REPORT | 49 |
PERFORMANCE REPORT AND FUND PROFILE (Unaudited) | September 30, 2016 |
RISK MANAGED REAL ESTATE FUND
OBJECTIVE: Seeks to provide total return, comprised of capital appreciation and current income.
Holdings Diversification (Market Exposure as % of Net Assets)

“Holdings Diversification (Market Exposure as % of Net Assets)” excludes any temporary cash investments.
Inception Dates: |
A-Class | March 28, 2014 |
C-Class | March 28, 2014 |
P-Class | May 1, 2015 |
Institutional Class | March 28, 2014 |
Ten Largest Long Holdings (% of Total Net Assets) |
Simon Property Group, Inc. | 6.7% |
Equinix, Inc. | 4.2% |
Prologis, Inc. | 3.3% |
Equity Residential | 3.1% |
National Storage Affiliates Trust | 2.7% |
Public Storage | 2.5% |
Ventas, Inc. | 2.3% |
Gramercy Property Trust | 2.3% |
Welltower, Inc. | 2.3% |
General Growth Properties, Inc. | 2.2% |
Top Ten Total | 31.6% |
| | |
“Ten Largest Long Holdings” excludes any temporary cash or derivative investments. |
50 | THE GUGGENHEIM FUNDS ANNUAL REPORT | |
PERFORMANCE REPORT AND FUND PROFILE (Unaudited)(concluded) | September 30, 2016 |
Cumulative Fund Performance*

Average Annual Returns*
Periods Ended September 30, 2016
| | | 1 Year | Since Inception
(03/28/14) |
| A-Class Shares | | 14.88% | 13.73% |
A-Class Shares with sales charge† | | 9.43% | 11.54% |
| C-Class Shares | | 14.00% | 12.86% |
C-Class Shares with CDSC‡ | | 13.02% | 12.86% |
| FTSE NAREIT Equity REITs Index | | 19.82% | 13.55% |
| | | 1 Year | Since Inception
(05/01/15) |
| P-Class Shares | | 14.87% | 7.44% |
| FTSE NAREIT Equity REITs Index | | 19.82% | 10.75% |
| | | 1 Year | Since Inception
(03/28/14) |
| Institutional Class Shares | | 15.20% | 14.06% |
| FTSE NAREIT Equity REITs Index | | 19.82% | 13.55% |
* | The performance data above represents past performance that is not predictive of future results. The investment return and principal value of an investment in the Fund will fluctuate so that an investor’s shares, when redeemed, may be worth more or less than their original cost. Returns are historical and include changes in principal and reinvested dividends and capital gains and do not reflect the effect of taxes. The FTSE NAREIT Equity REITs Index is an unmanaged index and, unlike the Fund, has no management fees or operating expenses to reduce its reported return. The graph is based on A-Class shares only; performance for C-Class, P-Class and Institutional Class will vary due to differences in fee structures. |
† | Fund returns are calculated using the maximum sales charge of 4.75%. |
‡ | Fund returns include a CDSC of 1% if redeemed within 12 months of purchase. |
| | THE GUGGENHEIM FUNDS ANNUAL REPORT | 51 |
SCHEDULE OF INVESTMENTS | September 30, 2016 |
RISK MANAGED REAL ESTATE FUND | |
| | | Shares | | | Value | |
| | | | | | | |
COMMON STOCKS† - 95.4% | |
| | | | | | | |
REITs - 91.3% | |
REITs-Diversified – 17.1% | |
Equinix, Inc. | | | 13,045 | | | $ | 4,699,462 | |
Vornado Realty Trust | | | 20,828 | | | | 2,108,003 | |
Cousins Properties, Inc. | | | 188,557 | | | | 1,968,535 | |
Liberty Property Trust | | | 46,854 | | | | 1,890,559 | |
American Tower Corp. — Class A1 | | | 14,703 | | | | 1,666,291 | |
Weyerhaeuser Co. | | | 48,396 | | | | 1,545,768 | |
Crown Castle International Corp. | | | 14,718 | | | | 1,386,583 | |
American Assets Trust, Inc.1 | | | 28,864 | | | | 1,252,120 | |
STORE Capital Corp. | | | 32,847 | | | | 968,001 | |
GEO Group, Inc. | | | 32,824 | | | | 780,555 | |
Digital Realty Trust, Inc. | | | 5,860 | | | | 569,123 | |
Corrections Corporation of America | | | 35,339 | | | | 490,152 | |
Total REITs-Diversified | | | | | | | 19,325,152 | |
| | | | | | | | | |
REITs-Office Property - 11.2% | |
Gramercy Property Trust | | | 268,162 | | | | 2,585,081 | |
Boston Properties, Inc.1 | | | 18,376 | | | | 2,504,465 | |
Alexandria Real Estate Equities, Inc.1 | | | 20,015 | | | | 2,177,032 | |
Mack-Cali Realty Corp. | | | 50,133 | | | | 1,364,620 | |
Hudson Pacific Properties, Inc. | | | 36,871 | | | | 1,211,950 | |
SL Green Realty Corp. | | | 10,929 | | | | 1,181,425 | |
First Potomac Realty Trust | | | 119,931 | | | | 1,097,369 | |
Highwoods Properties, Inc. | | | 10,797 | | | | 562,740 | |
Total REITs-Office Property | | | | | | | 12,684,682 | |
| | | | | | | | | |
REITs-Apartments - 11.1% | |
Equity Residential | | | 54,454 | | | | 3,503,026 | |
AvalonBay Communities, Inc.1 | | | 11,305 | | | | 2,010,481 | |
American Homes 4 Rent — Class A | | | 84,717 | | | | 1,833,276 | |
Colony Starwood Homes | | | 62,796 | | | | 1,802,245 | |
Essex Property Trust, Inc.1 | | | 4,251 | | | | 946,698 | |
Monogram Residential Trust, Inc. | | | 85,861 | | | | 913,561 | |
Camden Property Trust1 | | | 9,664 | | | | 809,263 | |
Mid-America Apartment Communities, Inc. | | | 8,295 | | | | 779,647 | |
Total REITs-Apartments | | | | | | | 12,598,197 | |
| | | | | | | | | |
REITs-Warehouse/Industries - 9.9% | |
Prologis, Inc.2 | | | 70,509 | | | | 3,775,051 | |
CyrusOne, Inc. | | | 49,239 | | | | 2,342,299 | |
Rexford Industrial Realty, Inc. | | | 90,871 | | | | 2,080,037 | |
EastGroup Properties, Inc. | | | 24,710 | | | | 1,817,668 | |
DCT Industrial Trust, Inc.1 | | | 24,590 | | | | 1,193,845 | |
Total REITs-Warehouse/Industries | | | | | | | 11,208,900 | |
| | | | | | | | | |
REITs-Health Care - 9.7% | |
Welltower, Inc. | | | 39,976 | | | | 2,989,006 | |
Ventas, Inc. | | | 37,208 | | | | 2,628,001 | |
Physicians Realty Trust | | | 99,002 | | | | 2,132,503 | |
Healthcare Trust of America, Inc. — Class A | | | 40,588 | | | | 1,323,981 | |
HCP, Inc.2 | | | 33,160 | | | | 1,258,422 | |
LTC Properties, Inc. | | | 13,081 | | | | 680,081 | |
Total REITs-Health Care | | | | | | | 11,011,994 | |
| | | | | | | | | |
REITs-Regional Malls - 9.5% | |
Simon Property Group, Inc. | | | 36,625 | | | | 7,581,741 | |
General Growth Properties, Inc.2 | | | 91,145 | | | | 2,515,602 | |
Tanger Factory Outlet Centers, Inc. | | | 17,635 | | | | 687,060 | |
Total REITs-Regional Malls | | | | | | | 10,784,403 | |
| | | | | | | | | |
REITs-Shopping Centers - 6.7% | |
Federal Realty Investment Trust1 | | | 16,194 | | | | 2,492,741 | |
Acadia Realty Trust | | | 43,424 | | | | 1,573,686 | |
Regency Centers Corp. | | | 19,549 | | | | 1,514,852 | |
Retail Opportunity Investments Corp. | | | 42,536 | | | | 934,091 | |
DDR Corp. | | | 34,211 | | | | 596,298 | |
Kimco Realty Corp. | | | 16,720 | | | | 484,044 | |
Total REITs-Shopping Centers | | | | | | | 7,595,712 | |
| | | | | | | | | |
REITs-Storage - 6.3% | |
Public Storage | | | 14,440 | | | | 3,222,142 | |
National Storage Affiliates Trust | | | 143,735 | | | | 3,009,811 | |
Extra Space Storage, Inc. | | | 10,779 | | | | 855,960 | |
Total REITs-Storage | | | | | | | 7,087,913 | |
| | | | | | | | | |
REITs-Manufactured Homes - 3.8% | |
Sun Communities, Inc. | | | 29,144 | | | | 2,287,221 | |
Equity LifeStyle Properties, Inc.1 | | | 25,659 | | | | 1,980,362 | |
Total REITs-Manufactured Homes | | | | | | | 4,267,583 | |
| | | | | | | | | |
REITs-Hotels - 2.5% | |
Apple Hospitality REIT, Inc. | | | 77,188 | | | | 1,428,750 | |
Sunstone Hotel Investors, Inc. | | | 57,992 | | | | 741,718 | |
Host Hotels & Resorts, Inc. | | | 40,255 | | | | 626,770 | |
Total REITs-Hotels | | | | | | | 2,797,238 | |
| | | | | | | | | |
REITs-Single Tenant - 2.2% | |
Realty Income Corp. | | | 18,401 | | | | 1,231,578 | |
Spirit Realty Capital, Inc. | | | 86,309 | | | | 1,150,499 | |
National Retail Properties, Inc. | | | 2,220 | | | | 112,887 | |
Total REITs-Single Tenant | | | | | | | 2,494,964 | |
| | | | | | | | | |
REITs-Mortgage - 1.3% | |
Blackstone Mortgage Trust, Inc. — Class A | | | 51,412 | | | | 1,514,083 | |
Total REITs | | | | | | | 103,370,821 | |
| | | | | | | | | |
Real Estate - 1.6% | |
Real Estate Operations/Development - 1.6% | |
Four Corners Property Trust, Inc. | | | 84,913 | | | | 1,811,194 | |
| | | | | | | | | |
Lodging - 1.6% | |
Hotels & Motels - 1.6% | |
Hilton Worldwide Holdings, Inc. | | | 78,420 | | | | 1,798,171 | |
| | | | | | | | | |
Home Builders – 0.9% | |
Building-Residential/Commerical – 0.9% | |
LGI Homes, Inc.* | | | 29,375 | | | | 1,082,175 | |
| | | | | | | | | |
Total Common Stocks | | | | | | | | |
(Cost $101,114,420) | | | | | | | 108,062,361 | |
52 | THE GUGGENHEIM FUNDS ANNUAL REPORT | SEE NOTES TO FINANCIAL STATEMENTS. |
SCHEDULE OF INVESTMENTS (continued) | September 30, 2016 |
RISK MANAGED REAL ESTATE FUND | |
| | Shares | | | Value | |
| | | | | | | |
SHORT-TERM INVESTMENTS† - 6.0% | |
Dreyfus Treasury Securities Cash Management Fund - Institutional Class 0.16%3 | | | 6,759,412 | | | $ | 6,759,412 | |
Total Short-Term Investments | | | | | | | | |
(Cost $6,759,412) | | | | | | | 6,759,412 | |
| | | | | | | | | |
Total Investments - 101.4% | | | | | | | | |
(Cost $107,873,832) | | | | | | $ | 114,821,773 | |
| | | | | | | | | |
COMMON STOCKS SOLD SHORT† - (12.4)% | |
| | | | | | | | | |
REITs – (12.4)% | |
REITs-Regional Malls – (0.5)% | |
Macerich Co. | | | (7,396 | ) | | | (598,115 | ) |
| | | | | | | | | |
REITs-Apartments – (0.7)% | |
UDR, Inc. | | | (11,065 | ) | | | (398,229 | ) |
AvalonBay Communities, Inc. | | | (2,271 | ) | | | (403,875 | ) |
Total REITs-Apartments | | | | | | | (802,104 | ) |
| | | | | | | | | |
REITs-Hotels – (0.8)% | |
Hersha Hospitality Trust | | | (21,280 | ) | | | (383,466 | ) |
Host Hotels & Resorts, Inc. | | | (31,657 | ) | | | (492,899 | ) |
Total REITs-Hotels | | | | | | | (876,365 | ) |
| | | | | | | | | |
REITs-Single Tenant – (0.9)% | |
National Retail Properties, Inc. | | | (7,917 | ) | | | (402,579 | ) |
Realty Income Corp. | | | (9,085 | ) | | | (608,059 | ) |
Total REITs-Single Tenant | | | | | | | (1,010,638 | ) |
| | | | | | | | | |
REITs-Storage – (1.1)% | |
Public Storage | | | (1,812 | ) | | | (404,330 | ) |
Iron Mountain, Inc. | | | (22,331 | ) | | | (838,082 | ) |
Total REITs-Storage | | | | | | | (1,242,412 | ) |
| | | | | | | | | |
REITs-Health Care – (1.3)% | |
HCP, Inc. | | | (10,134 | ) | | | (384,585 | ) |
Welltower, Inc. | | | (5,550 | ) | | | (414,974 | ) |
Senior Housing Properties Trust | | | (27,604 | ) | | | (626,887 | ) |
Total REITs-Health Care | | | | | | | (1,426,446 | ) |
| | | | | | | | | |
REITs-Shopping Centers – (1.5)% | |
Kimco Realty Corp. | | | (16,560 | ) | | | (479,412 | ) |
Weingarten Realty Investors | | | (16,094 | ) | | | (627,344 | ) |
Ramco-Gershenson Properties Trust | | | (33,561 | ) | | | (628,933 | ) |
Total REITs-Shopping Centers | | | | | | | (1,735,689 | ) |
| | | | | | | | | |
REITs-Office Property – (1.9)% | |
Government Properties Income Trust | | | (26,924 | ) | | | (609,021 | ) |
Douglas Emmett, Inc. | | | (19,648 | ) | | | (719,706 | ) |
Piedmont Office Realty Trust, Inc. — Class A | | | (35,266 | ) | | | (767,741 | ) |
Total REITs-Office Property | | | | | | | (2,096,468 | ) |
| | | | | | | | | |
REITs-Diversified – (3.7)% | |
Lexington Realty Trust | | | (37,535 | ) | | | (386,611 | ) |
Duke Realty Corp. | | | (17,914 | ) | | | (489,590 | ) |
Forest City Realty Trust, Inc. — Class A | | | (25,484 | ) | | | (589,445 | ) |
STAG Industrial, Inc. | | | (26,985 | ) | | | (661,402 | ) |
EPR Properties | | | (8,635 | ) | | | (679,920 | ) |
Investors Real Estate Trust | | | (122,220 | ) | | | (727,209 | ) |
Digital Realty Trust, Inc. | | | (7,576 | ) | | | (735,781 | ) |
Total REITs-Diversified | | | | | | | (4,269,958 | ) |
Total REITs | | | | | | | (14,058,195 | ) |
| | | | | | | | | |
Total Common Stocks Sold Short | | | | | | | | |
(Cost $13,725,144) | | | | | | | (14,058,195 | ) |
| | | | | | | | | |
EXCHANGE-TRADED FUNDS SOLD SHORT† - (3.7)% | |
iShares U.S. Real Estate ETF | | | (52,470 | ) | | | (4,231,181 | ) |
Total Exchange-Traded Funds Sold Short | | | | | | | | |
(Proceeds $4,264,774) | | | | | | | (4,231,181 | ) |
Total Securities Sold Short - (16.1)% | | | | | | | | |
(Proceeds $17,989,918) | | | | | | $ | (18,289,376 | ) |
Other Assets & Liabilities, net - 14.7% | | | | | | | 16,633,447 | |
Total Net Assets - 100.0% | | | | | | $ | 113,165,844 | |
| | | Unrealized
Gain (Loss) | |
| | | | |
OTC Equity SWAP AGREEMENTS †† | |
Morgan Stanley
June 2017 Risk Managed
Real Estate Portfolio Long
Custom Basket Swap 1.02%4,
Terminating 06/15/17
(Notional Value $32,729,679) | | $ | 1,959,554 | |
Morgan Stanley
June 2017 Risk Managed
Real Estate Portfolio Short
Custom Basket Swap 0.05%5,
Terminating 06/15/17
(Notional Value $32,853,211) | | $ | (1,424,342 | ) |
| | | Shares | | | | |
| | | | | | | |
CUSTOM BASKET OF LONG SECURITIES4 | |
Gramercy Property Trust | | | 130,349 | | | | 260,333 | |
Rexford Industrial Realty, Inc. | | | 63,947 | | | | 242,359 | |
Four Corners Property Trust, Inc. | | | 63,534 | | | | 206,150 | |
Equity LifeStyle Properties, Inc. | | | 12,179 | | | | 199,698 | |
EastGroup Properties, Inc. | | | 14,605 | | | | 185,543 | |
American Tower Corp. — Class A | | | 11,471 | | | | 181,062 | |
Sun Communities, Inc. | | | 14,056 | | | | 171,634 | |
Federal Realty Investment Trust | | | 7,426 | | | | 108,542 | |
Equinix, Inc. | | | 2,893 | | | | 88,456 | |
Hudson Pacific Properties, Inc. | | | 21,517 | | | | 77,961 | |
American Assets Trust, Inc. | | | 24,273 | | | | 73,079 | |
GEO Group, Inc. | | | 23,943 | | | | 70,923 | |
Cousins Properties, Inc. | | | 97,463 | | | | 67,351 | |
Acadia Realty Trust | | | 29,265 | | | | 51,801 | |
Physicians Realty Trust | | | 52,959 | | | | 45,534 | |
SEE NOTES TO FINANCIAL STATEMENTS. | THE GUGGENHEIM FUNDS ANNUAL REPORT | 53 |
SCHEDULE OF INVESTMENTS (continued) | September 30, 2016 |
RISK MANAGED REAL ESTATE FUND | |
| | | Shares | | | Unrealized
Gain (Loss) | |
| | | | | | | |
Healthcare Trust of America, Inc. — Class A | | | 21,266 | | | $ | 34,986 | |
Crown Castle International Corp. | | | 7,457 | | | | 34,509 | |
Alexandria Real Estate Equities, Inc. | | | 6,501 | | | | 34,035 | |
Liberty Property Trust | | | 21,814 | | | | 14,958 | |
Weyerhaeuser Co. | | | 34,005 | | | | 5,808 | |
Blackstone Mortgage Trust, Inc. — Class A | | | 37,061 | | | | (6,163 | ) |
Colony Starwood Homes | | | 34,631 | | | | (9,499 | ) |
CyrusOne, Inc. | | | 24,647 | | | | (12,960 | ) |
Mack-Cali Realty Corp. | | | 25,570 | | | | (13,734 | ) |
National Storage Affiliates Trust | | | 87,741 | | | | (17,115 | ) |
LGI Homes, Inc.* | | | 19,180 | | | | (30,184 | ) |
Apple Hospitality REIT, Inc. | | | 48,985 | | | | (38,107 | ) |
General Growth Properties, Inc. | | | 37,261 | | | | (42,672 | ) |
First Potomac Realty Trust | | | 71,066 | | | | (47,770 | ) |
American Homes 4 Rent — Class A | | | 42,008 | | | | (51,005 | ) |
Equity Residential | | | 14,016 | | | | (52,314 | ) |
Corrections Corporation of America | | | 21,925 | | | | (56,167 | ) |
Hilton Worldwide Holdings, Inc. | | | 53,882 | | | | (66,253 | ) |
Total Custom Basket of Long Securities | | | | | | | 1,710,779 | |
| | | | | | | | | |
CUSTOM BASKET OF SHORT SECURITIES5 | |
Investors Real Estate Trust | | | (219,691 | ) | | | 161,018 | |
Digital Realty Trust, Inc. | | | (13,609 | ) | | | 112,734 | |
Host Hotels & Resorts, Inc. | | | (56,828 | ) | | | 82,048 | |
Hersha Hospitality Trust | | | (38,251 | ) | | | 56,694 | |
iShares U.S. Real Estate ETF | | | (94,211 | ) | | | 54,548 | |
Ramco-Gershenson Properties Trust | | | (60,267 | ) | | | 43,629 | |
Duke Realty Corp. | | | (32,201 | ) | | | 25,983 | |
Public Storage | | | (3,257 | ) | | | 22,838 | |
Macerich Co. | | | (13,295 | ) | | | 18,518 | |
National Retail Properties, Inc. | | | (14,231 | ) | | | 3,316 | |
Realty Income Corp. | | | (16,329 | ) | | | 1,792 | |
AvalonBay Communities, Inc. | | | (4,082 | ) | | | (11,418 | ) |
UDR, Inc. | | | (19,889 | ) | | | (14,866 | ) |
Welltower, Inc. | | | (9,965 | ) | | | (15,439 | ) |
Kimco Realty Corp. | | | (29,767 | ) | | | (26,191 | ) |
Forest City Realty Trust, Inc. — Class A | | | (45,808 | ) | | | (33,209 | ) |
Senior Housing Properties Trust | | | (49,589 | ) | | | (52,465 | ) |
Weingarten Realty Investors | | | (28,899 | ) | | | (74,790 | ) |
HCP, Inc. | | | (18,216 | ) | | | (103,972 | ) |
Lexington Realty Trust | | | (67,469 | ) | | | (108,600 | ) |
Piedmont Office Realty Trust, Inc. — Class A | | | (63,322 | ) | | | (125,461 | ) |
Government Properties Income Trust | | | (48,346 | ) | | | (189,670 | ) |
Douglas Emmett, Inc. | | | (35,276 | ) | | | (211,367 | ) |
Iron Mountain, Inc. | | | (40,101 | ) | | | (252,091 | ) |
STAG Industrial, Inc. | | | (48,477 | ) | | | (257,853 | ) |
EPR Properties | | | (15,503 | ) | | | (327,860 | ) |
Total Custom Basket of Short Securities | | | | | | | (1,222,134 | ) |
* | Non-income producing security. |
† | Value determined based on Level 1 inputs — See Note 4. |
†† | Value determined based on Level 2 inputs — See Note 4. |
1 | All or a portion of this security is pledged as short security collateral at September 30, 2016. |
2 | All or a portion of this security is pledged as equity swap collateral at September 30, 2016. |
3 | Rate indicated is the 7 day yield as of September 30, 2016. |
4 | Total Return is based on the return of the custom basket of long securities +/ - financing at a variable rate. Rate indicated is rate effective at September 30, 2016. |
5 | Total Return is based on the return of the custom basket of short securities +/- financing at a variable rate. Rate indicated is rate effective at September 30, 2016. |
| | REIT — Real Estate Investment Trust |
| | |
| | See Sector Classification in Other Information section. |
54 | THE GUGGENHEIM FUNDS ANNUAL REPORT | SEE NOTES TO FINANCIAL STATEMENTS. |
SCHEDULE OF INVESTMENTS (concluded) | September 30, 2016 |
RISK MANAGED REAL ESTATE FUND | |
The following table summarizes the inputs used to value the Fund’s investments at September 30, 2016 (See Note 4 in the Notes to Financial Statements):
Investments in Securities (Assets) | | Level 1 | | | Level 2 | | | Level 2 -
Other* | | | Level 3 | | | Total | |
Common Stocks | | $ | 108,062,361 | | | $ | — | | | $ | — | | | $ | — | | | $ | 108,062,361 | |
Short-Term Investments | | | 6,759,412 | | | | — | | | | — | | | | — | | | | 6,759,412 | |
Equity Swap Agreements | | | — | | | | — | | | | 1,959,554 | | | | — | | | | 1,959,554 | |
Total | | $ | 114,821,773 | | | $ | — | | | $ | 1,959,554 | | | $ | — | | | $ | 116,781,327 | |
| | | | | | | | | | | | | | | | | | | | | |
Investments in Securities (Liabilities) | | Level 1 | | | Level 2 | | | Level 2 -
Other* | | | Level 3 | | | Total | |
Common Stocks | | $ | 14,058,195 | | | $ | — | | | $ | — | | | $ | — | | | $ | 14,058,195 | |
Exchange-Traded Funds | | | 4,231,181 | | | | — | | | | — | | | | — | | | | 4,231,181 | |
Equity Swap Agreements | | | — | | | | — | | | | 1,424,342 | | | | — | | | | 1,424,342 | |
Total | | $ | 18,289,376 | | | $ | — | | | $ | 1,424,342 | | | $ | — | | | $ | 19,713,718 | |
* | Other financial instruments include swaps which are reported as unrealized gain/loss at period end. |
Transfers between investment levels may occur as the markets fluctuate and/or the availability of data used in an investment’s valuation changes. Transfers between valuation levels, if any, are in comparison to the valuation levels at the end of the previous fiscal year, and are effective using the fair value as of the end of the previous fiscal period.
For the year ended September 30, 2016, there were no transfers between levels.
SEE NOTES TO FINANCIAL STATEMENTS. | THE GUGGENHEIM FUNDS ANNUAL REPORT | 55 |
RISK MANAGED REAL ESTATE FUND | |
STATEMENT OF ASSETS AND LIABILITIES |
September 30, 2016 |
Assets: | |
Investments, at value (cost $107,873,832) | | $ | 114,821,773 | |
Segregated cash with broker | | | 16,028,459 | |
Unrealized appreciation on swap agreements | | | 1,959,554 | |
Prepaid expenses | | | 20,513 | |
Cash | | | 10,776 | |
Receivables: | | | | |
Fund shares sold | | | 19,994 | |
Dividends | | | 515,343 | |
Total assets | | | 133,376,412 | |
| | | | | |
Liabilities: | |
Securities sold short, at value (proceeds $17,989,918) | | | 18,289,376 | |
Unrealized depreciation on swap agreements | | | 1,424,342 | |
Payable for: | |
Swap settlement | | | 282,254 | |
Dividends distributed | | | 72,878 | |
Management fees | | | 61,207 | |
Fund shares redeemed | | | 24,870 | |
Fund accounting/administration fees | | | 8,841 | |
Trustees’ fees* | | | 3,511 | |
Transfer agent/maintenance fees | | | 3,132 | |
Distribution and service fees | | | 532 | |
Miscellaneous | | | 39,625 | |
Total liabilities | | | 20,210,568 | |
Net assets | | $ | 113,165,844 | |
| | | | | |
Net assets consist of: | |
Paid in capital | | $ | 105,901,782 | |
Accumulated net investment loss | | | (481,337 | ) |
Accumulated net realized gain on investments | | | 561,704 | |
Net unrealized appreciation on investments | | | 7,183,695 | |
Net assets | | $ | 113,165,844 | |
| | | | | |
A-Class: | |
Net assets | | $ | 743,140 | |
Capital shares outstanding | | | 25,737 | |
Net asset value per share | | $ | 28.87 | |
Maximum offering price per share (Net asset value divided by 95.25%) | | $ | 30.31 | |
| | | | | |
C-Class: | |
Net assets | | $ | 517,869 | |
Capital shares outstanding | | | 18,003 | |
Net asset value per share | | $ | 28.77 | |
| | | | | |
P-Class: | |
Net assets | | $ | 82,246 | |
Capital shares outstanding | | | 2,835 | |
Net asset value per share | | $ | 29.01 | |
| | | | | |
Institutional Class: | |
Net assets | | $ | 111,822,589 | |
Capital shares outstanding | | | 3,832,773 | |
Net asset value per share | | $ | 29.18 | |
STATEMENT OF OPERATIONS |
Year Ended September 30, 2016 |
Investment Income: | |
Dividends | | $ | 2,666,267 | |
Interest | | | 4,640 | |
Total investment income | | | 2,670,907 | |
| | | | | |
Expenses: | |
Management fees | | | 831,617 | |
Transfer agent/maintenance fees: | |
A-Class | | | 1,243 | |
C-Class | | | 2,411 | |
P-Class | | | 88 | |
Institutional Class | | | 23,101 | |
Distribution and service fees: | |
A-Class | | | 1,504 | |
C-Class | | | 2,856 | |
P-Class | | | 137 | |
Fund accounting/administration fees | | | 105,337 | |
Short sales dividend expense | | | 499,879 | |
Registration fees | | | 69,816 | |
Prime broker interest expense | | | 33,057 | |
Line of credit fees | | | 14,576 | |
Custodian fees | | | 12,418 | |
Trustees’ fees* | | | 11,987 | |
Miscellaneous | | | 56,042 | |
Total expenses | | | 1,666,069 | |
Less: | |
Expenses waived by Adviser | | | (3,233 | ) |
Net expenses | | | 1,662,836 | |
Net investment income | | | 1,008,071 | |
| | | | | |
Net Realized and Unrealized Gain (Loss): | |
Net realized gain (loss) on: | |
Investments | | | 7,702,788 | |
Swap agreements | | | (1,524,233 | ) |
Securities sold short | | | (1,130,935 | ) |
Net realized gain | | | 5,047,620 | |
Net change in unrealized appreciation (depreciation) on: | |
Investments | | | 9,833,005 | |
Securities sold short | | | (944,265 | ) |
Swap agreements | | | 709,117 | |
Net change in unrealized appreciation (depreciation) | | | 9,597,857 | |
Net realized and unrealized gain | | | 14,645,477 | |
Net increase in net assets resulting from operations | | $ | 15,653,548 | |
* | Relates to Trustees not deemed “interested persons” within the meaning of Section 2(a)(19) of the 1940 Act. |
56 | THE GUGGENHEIM FUNDS ANNUAL REPORT | SEE NOTES TO FINANCIAL STATEMENTS. |
RISK MANAGED REAL ESTATE FUND | |
STATEMENTS OF CHANGES IN NET ASSETS |
| | | Year Ended
September 30,
2016 | | | Year Ended
September 30,
2015 | |
Increase (Decrease) in Net Assets from Operations: | | | | | | |
Net investment income (loss) | | $ | 1,008,071 | | | $ | (400,544 | ) |
Net realized gain on investments | | | 5,047,620 | | | | 13,509,189 | |
Net change in unrealized appreciation (depreciation) on investments | | | 9,597,857 | | | | (934,660 | ) |
Net increase in net assets resulting from operations | | | 15,653,548 | | | | 12,173,985 | |
| | | | | | | | | |
Distributions to shareholders from: | | | | | | | | |
Net investment income | | | | | | | | |
A-Class | | | (15,560 | ) | | | (2,130 | ) |
C-Class | | | (7,069 | ) | | | — | |
P-Class | | | (1,363 | ) | | | — | * |
Institutional Class | | | (3,816,066 | ) | | | (110,810 | ) |
Net realized gains | | | | | | | | |
A-Class | | | (43,834 | ) | | | (5,715 | ) |
C-Class | | | (32,752 | ) | | | (362 | ) |
P-Class | | | (4,335 | ) | | | — | * |
Institutional Class | | | (13,211,585 | ) | | | (534,120 | ) |
Total distributions to shareholders | | | (17,132,564 | ) | | | (653,137 | ) |
| | | | | | | | | |
Capital share transactions: | | | | | | | | |
Proceeds from sale of shares | | | | | | | | |
A-Class | | | 785,426 | | | | 1,724,691 | |
C-Class | | | 452,351 | | | | 205,333 | |
P-Class | | | 73,853 | | | | 30,035 | * |
Institutional Class | | | 3,584,478 | | | | 2,482,274 | |
Distributions reinvested | | | | | | | | |
A-Class | | | 54,041 | | | | 6,954 | |
C-Class | | | 39,469 | | | | 362 | |
P-Class | | | 5,698 | | | | — | * |
Institutional Class | | | 13,011,489 | | | | 488,786 | |
Cost of shares redeemed | | | | | | | | |
A-Class | | | (474,048 | ) | | | (1,496,971 | ) |
C-Class | | | (58,044 | ) | | | (164,753 | ) |
P-Class | | | (26,988 | ) | | | — | * |
Institutional Class | | | (9,175,287 | ) | | | (12,576,840 | ) |
Net increase (decrease) from capital share transactions | | | 8,272,438 | | | | (9,300,129 | ) |
Net increase in net assets | | | 6,793,422 | | | | 2,220,719 | |
| | | | | | | | | |
Net assets: | | | | | | | | |
Beginning of year | | | 106,372,422 | | | | 104,151,703 | |
End of year | | $ | 113,165,844 | | | $ | 106,372,422 | |
(Accumulated net investment loss)/Undistributed net investment income at end of year | | $ | (481,337 | ) | | $ | 2,679,256 | |
SEE NOTES TO FINANCIAL STATEMENTS. | THE GUGGENHEIM FUNDS ANNUAL REPORT | 57 |
RISK MANAGED REAL ESTATE FUND | |
STATEMENTS OF CHANGES IN NET ASSETS (concluded) |
| | | Year Ended
September 30,
2016 | | | Year Ended
September 30,
2015 | |
Capital share activity: | | | | | | |
Shares sold | | | | | | |
A-Class | | | 27,279 | | | | 56,206 | |
C-Class | | | 15,548 | | | | 6,656 | |
P-Class | | | 2,578 | | | | 999 | * |
Institutional Class | | | 132,744 | | | | 79,259 | |
Shares issued from reinvestment of distributions | | | | | | | | |
A-Class | | | 2,003 | | | | 229 | |
C-Class | | | 1,472 | | | | 12 | |
P-Class | | | 210 | | | | — | * |
Institutional Class | | | 477,316 | | | | 16,219 | |
Shares redeemed | | | | | | | | |
A-Class | | | (15,824 | ) | | | (48,126 | ) |
C-Class | | | (2,239 | ) | | | (5,377 | ) |
P-Class | | | (952 | ) | | | — | * |
Institutional Class | | | (317,907 | ) | | | (406,035 | ) |
Net increase (decrease) in shares | | | 322,228 | | | | (299,958 | ) |
* | Since commencement of operations: May 1, 2015. |
58 | THE GUGGENHEIM FUNDS ANNUAL REPORT | SEE NOTES TO FINANCIAL STATEMENTS. |
RISK MANAGED REAL ESTATE FUND | |
This table is presented to show selected data for a share outstanding throughout each period and to assist shareholders in evaluating a Fund’s performance for the periods presented.
A-Class | | Year Ended
September 30,
2016 | | | Year Ended
September 30,
2015 | | | Period Ended
September 30,
2014a | |
Per Share Data | | | | | | | | | |
Net asset value, beginning of period | | $ | 29.77 | | | $ | 26.99 | | | $ | 25.00 | |
Income (loss) from investment operations: | |
Net investment income (loss)b | | | .19 | | | | (.21 | ) | | | .02 | |
Net gain (loss) on investments (realized and unrealized) | | | 3.84 | | | | 3.18 | | | | 2.06 | |
Total from investment operations | | | 4.03 | | | | 2.97 | | | | 2.08 | |
Less distributions from: | |
Net investment income | | | (1.12 | ) | | | (.05 | ) | | | (.09 | ) |
Net realized gains | | | (3.81 | ) | | | (.14 | ) | | | — | |
Total distributions | | | (4.93 | ) | | | (.19 | ) | | | (.09 | ) |
Net asset value, end of period | | $ | 28.87 | | | $ | 29.77 | | | $ | 26.99 | |
| | |
Total Returnc | | | 14.88 | % | | | 10.97 | % | | | 8.35 | % |
Ratios/Supplemental Data | |
Net assets, end of period (in thousands) | | $ | 743 | | | $ | 366 | | | $ | 107 | |
Ratios to average net assets: | |
Net investment income (loss) | | | 0.66 | % | | | (0.67 | %) | | | 0.16 | % |
Total expensesd | | | 1.93 | % | | | 3.41 | % | | | 4.22 | %f |
Net expensese,h | | | 1.78 | % | | | 3.04 | % | | | 3.32 | % |
Portfolio turnover rate | | | 133 | % | | | 214 | % | | | 57 | % |
C-Class | | Year Ended
September 30,
2016 | | | Year Ended
September 30,
2015 | | | Period Ended
September 30,
2014a | |
Per Share Data | | | | | | | | | |
Net asset value, beginning of period | | $ | 29.56 | | | $ | 26.95 | | | $ | 25.00 | |
Income (loss) from investment operations: | |
Net investment income (loss)b | | | .02 | | | | (.43 | ) | | | (.23 | ) |
Net gain (loss) on investments (realized and unrealized) | | | 3.77 | | | | 3.18 | | | | 2.19 | |
Total from investment operations | | | 3.79 | | | | 2.75 | | | | 1.96 | |
Less distributions from: | |
Net investment income | | | (.77 | ) | | | — | | | | (.01 | ) |
Net realized gains | | | (3.81 | ) | | | (.14 | ) | | | — | |
Total distributions | | | (4.58 | ) | | | (.14 | ) | | | (.01 | ) |
Net asset value, end of period | | $ | 28.77 | | | $ | 29.56 | | | $ | 26.95 | |
| | |
Total Return | | | 14.00 | % | | | 10.20 | % | | | 7.85 | % |
Ratios/Supplemental Data | |
Net assets, end of period (in thousands) | | $ | 518 | | | $ | 95 | | | $ | 52 | |
Ratios to average net assets: | |
Net investment income (loss) | | | 0.08 | % | | | (1.42 | %) | | | (1.60 | %) |
Total expensesd | | | 3.32 | % | | | 5.76 | % | | | 9.33 | %f |
Net expensese,h | | | 2.53 | % | | | 3.76 | % | | | 2.67 | % |
Portfolio turnover rate | | | 133 | % | | | 214 | % | | | 57 | % |
SEE NOTES TO FINANCIAL STATEMENTS. | THE GUGGENHEIM FUNDS ANNUAL REPORT | 59 |
RISK MANAGED REAL ESTATE FUND | |
FINANCIAL HIGHLIGHTS (continued) |
This table is presented to show selected data for a share outstanding throughout each period and to assist shareholders in evaluating a Fund’s performance for the periods presented.
P-Class | | Year Ended
September 30,
2016 | | | Period Ended
September 30,
2015g | |
Per Share Data | | | | | | |
Net asset value, beginning of period | | $ | 29.77 | | | $ | 30.89 | |
Income (loss) from investment operations: | |
Net investment income (loss)b | | | .16 | | | | .04 | |
Net gain (loss) on investments (realized and unrealized) | | | 3.88 | | | | (1.16 | ) |
Total from investment operations | | | 4.04 | | | | (1.12 | ) |
Less distributions from: | |
Net investment income | | | (.99 | ) | | | — | |
Net realized gains | | | (3.81 | ) | | | — | |
Total distributions | | | (4.80 | ) | | | — | |
Net asset value, end of period | | $ | 29.01 | | | $ | 29.77 | |
| | |
Total Returnc | | | 14.87 | % | | | (3.63 | %) |
Ratios/Supplemental Data | |
Net assets, end of period (in thousands) | | $ | 82 | | | $ | 30 | |
Ratios to average net assets: | |
Net investment income (loss) | | | 0.56 | % | | | 0.30 | % |
Total expensesd | | | 1.88 | % | | | 4.04 | %f |
Net expensese,h | | | 1.78 | % | | | 2.94 | % |
Portfolio turnover rate | | | 133 | % | | | 214 | % |
60 | THE GUGGENHEIM FUNDS ANNUAL REPORT | SEE NOTES TO FINANCIAL STATEMENTS. |
RISK MANAGED REAL ESTATE FUND | |
FINANCIAL HIGHLIGHTS (concluded) |
This table is presented to show selected data for a share outstanding throughout each period and to assist shareholders in evaluating a Fund’s performance for the periods presented.
Institutional Class | | Year Ended
September 30,
2016 | | | Year Ended
September 30,
2015 | | | Period Ended
September 30,
2014a | |
Per Share Data | | | | | | | | | |
Net asset value, beginning of period | | $ | 29.90 | | | $ | 27.00 | | | $ | 25.00 | |
Income (loss) from investment operations: | |
Net investment income (loss)b | | | .26 | | | | (.11 | ) | | | .02 | |
Net gain (loss) on investments (realized and unrealized) | | | 3.89 | | | | 3.18 | | | | 2.09 | |
Total from investment operations | | | 4.15 | | | | 3.07 | | | | 2.11 | |
Less distributions from: | |
Net investment income | | | (1.06 | ) | | | (.03 | ) | | | (.11 | ) |
Net realized gains | | | (3.81 | ) | | | (.14 | ) | | | — | |
Total distributions | | | (4.87 | ) | | | (.17 | ) | | | (.11 | ) |
Net asset value, end of period | | $ | 29.18 | | | $ | 29.90 | | | $ | 27.00 | |
| | |
Total Returnc | | | 15.20 | % | | | 11.36 | % | | | 8.44 | % |
Ratios/Supplemental Data | |
Net assets, end of period (in thousands) | | $ | 111,823 | | | $ | 105,882 | | | $ | 103,993 | |
Ratios to average net assets: | |
Net investment income (loss) | | | 0.91 | % | | | (0.35 | %) | | | 0.11 | % |
Total expensesd | | | 1.50 | % | | | 2.70 | % | | | 2.69 | %f |
Net expensese,h | | | 1.50 | % | | | 2.70 | % | | | 2.58 | % |
Portfolio turnover rate | | | 133 | % | | | 214 | % | | | 57 | % |
a | Since commencement of operations: March 28, 2014. Percentage amounts for the period, except total return and portfolio turnover rate, have been annualized. |
b | Net investment income (loss) per share was computed using average shares outstanding throughout the period. |
c | Total return does not reflect the impact of any applicable sales charges and has not been annualized. |
d | Does not include expenses of the underlying funds in which the Fund invests. |
e | Net expense information reflects the expense ratios after expense waivers and reimbursements, as applicable. |
f | Due to limited length of Fund operations, ratios for this period are not indicative of future performance. |
g | Since commencement of operations: May 1, 2015. Percentage amounts for the period, except total return and portfolio turnover rate, have been annualized. |
h | Net expenses may include expenses that are excluded from the expense limitation agreement and recouped amounts. excluding these expenses, the operating expense ratios for the periods presented would be: |
| | | 09/30/16 | 09/30/15 | 09/30/14 |
| | A-Class | 1.29% | 1.30% | 1.30% |
| | C-Class | 2.03% | 2.05% | 2.05% |
| | P-Class | 1.28% | 1.30% | — |
| | Institutional Class | 1.00% | 0.99% | 1.10% |
SEE NOTES TO FINANCIAL STATEMENTS. | THE GUGGENHEIM FUNDS ANNUAL REPORT | 61 |
MANAGERS’ COMMENTARY (Unaudited) | September 30, 2016 |
To Our Shareholders:
Guggenheim Small Cap Value Fund (the “Fund”) is managed by a team of seasoned professionals led by James Schier, CFA, Managing Director and Senior Portfolio Manager; Scott Hammond, Managing Director and Portfolio Manager; Farhan Sharaff, Assistant Chief Investment Officer, Equities and Portfolio Manager; and Gregg Strohkorb, CFA, Portfolio Manager. In the following paragraphs, the team discusses performance of the Fund for the fiscal year ended September 30, 2016.
For the year ended September 30, 2016, the Guggenheim Small Cap Value Fund returned 14.81%1, compared with the 18.81% return of its benchmark, the Russell 2000 Value Index.
Strategy and Market Overview
Our investment approach focuses on understanding how companies make money and how easily companies can improve returns, maintain existing high levels of profitability, or benefit from change that occurs within the industry in which they operate. In today’s rapidly changing environment marked by very sharp and quick, but constrained volatility, our long-term orientation and discipline are a competitive advantage. This should become especially critical when the environment of indiscriminant valuation expansion subsides, and fundamentals once again become a more dominant factor in the market.
Performance Review
Most of the performance differential was due to stock selection. The largest negative impact was in Information Technology, followed by Materials, which were the top-performing sectors in the Index. On the positive side, the leading contributor to return was stock selection in Consumer Staples, which was the best-returning sector in the Fund, and Energy.
The top individual contributor on an absolute basis was Tech name Finisar, a provider of optical subsystems and components, which advanced on strong sales among telecom clients. Another was Black Hills Corp. in the Utility sector, which began 2016 at a depressed valuation that reflected concern about the company’s ownership of some oil and gas fields. However, an analyst upgrade, citing the beneficial de-risking impact of the company’s SourceGas acquisition, proved to be a significant catalyst for the shares. Another contributor for the period was Silicon Graphics International, which in August said it would be acquired by Hewlett Packard Enterprise.
The top individual detractor on an absolute basis was Tech name Everi Holdings, Inc., which replaced its CEO during the period and had lower earnings amid a gaming-supplier market facing weak industry fundamentals and more competition. Financials name Diebold Inc., an ATM maker that combined with German Wincor Nixdorf during the period, also had a second-quarter loss and forecasted flat revenues for 2016. Another detractor for the period was Celadon Group, which fell during the period due to a pessimistic outlook for pricing among long-haul trucking services.
Portfolio Positioning
The largest relative sector exposures for the year were an underweight in Financials and an overweight in Health Care. The underweight contributed to performance for the year, while the overweight detracted from performance. The other large underweight was in Real Estate, which detracted slightly from performance for the year.
The Fund has been underweight Financials for some time, as well as the REITs (Real Estate Investment Trust) industry, which was extracted from Financials to form a separate sector in September 2016 and continues to be fairly valued in our view. Toward the end of the period, the Fund trimmed its underweight in Financials by adding several banking names.
Relative underperformance in the overweighted Health Care sector was driven by fears of price controls, brought about by election year politics, severely pressuring biotechnology, device, and products stocks. Early in the period, leading hospital chains fell, citing poor admission trends and higher-than-expected labor costs, which served to punish all of the health-care-service names, especially those that are smaller or have more debt.
62 | THE GUGGENHEIM FUNDS ANNUAL REPORT | |
MANAGERS’ COMMENTARY (Unaudited)(concluded) | September 30, 2016 |
Portfolio and Market Outlook
During the quarter, investors began to gain confidence that commodity prices have seen a bottom, which suggested an end to the business pressure not only in energy but in several industrial and financial industries. In addition, the market appears to be getting comfortable with the notion that any interest rate increases will be gradual and enacted with extreme caution. Therefore, with the fear of a commodity-driven recession having ebbed, the fuel for a relief rally was present. With the economic environment proving to be steady but subdued, and a Fed that is acting with utmost caution, the markets appear fated to behave in a choppy manner while trading in a relatively narrow range.
Our portfolios tend to reflect a bias toward companies with balance sheet quality. We continue to find niche companies with what we believe to be attractive growth opportunities, and, as such, are constructive on the outlook.
Performance displayed represents past performance which is no guarantee of future results.
1 | Performance figures are based on Class A shares and do not reflect taxes that a shareholder would pay on distributions or the redemption of shares. |
The opinions and forecast expressed may not actually come to pass. This information is subject to change at any time, based on market and other conditions, and should not be construed as a recommendation of any specific security or strategy.
| | THE GUGGENHEIM FUNDS ANNUAL REPORT | 63 |
PERFORMANCE REPORT AND FUND PROFILE (Unaudited) | September 30, 2016 |
SMALL CAP VALUE FUND
OBJECTIVE: Seeks long-term capital appreciation.
Holdings Diversification (Market Exposure as % of Net Assets)

“Holdings Diversification (Market Exposure as % of Net Assets)” excludes any temporary cash investments.
Inception Dates: |
A-Class | July 11, 2008 |
C-Class | July 11, 2008 |
P-Class | May 1, 2015 |
Institutional Class | July 11, 2008 |
Ten Largest Holdings (% of Total Net Assets) |
Spire, Inc. | 1.8% |
Portland General Electric Co. | 1.8% |
Avista Corp. | 1.8% |
Trustmark Corp. | 1.7% |
DigitalGlobe, Inc. | 1.7% |
Emergent BioSolutions, Inc. | 1.7% |
Century Communities, Inc. | 1.7% |
Fulton Financial Corp. | 1.6% |
Cathay General Bancorp | 1.6% |
Berkshire Hills Bancorp, Inc. | 1.6% |
Top Ten Total | 17.0% |
| | |
“Ten Largest Holdings” excludes any temporary cash investments. |
64 | THE GUGGENHEIM FUNDS ANNUAL REPORT | |
PERFORMANCE REPORT AND FUND PROFILE (Unaudited)(concluded) | September 30, 2016 |
Cumulative Fund Performance*
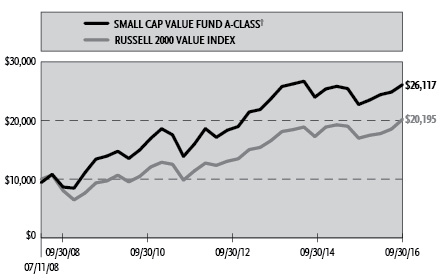
Average Annual Returns*
Periods Ended September 30, 2016
| | 1 Year | 5 Year | Since Inception
(07/11/08) |
A-Class Shares | 14.81% | 13.47% | 13.20% |
A-Class Shares with sales charge† | 9.33% | 12.37% | 12.38% |
C-Class Shares | 14.02% | 12.63% | 12.37% |
C-Class Shares with CDSC‡ | 13.02% | 12.63% | 12.37% |
Russell 2000 Value Index | 18.81% | 15.45% | 8.92% |
| | | 1 Year | Since Inception
(05/01/15) |
P-Class Shares | | 14.88% | 1.73% |
Russell 2000 Value Index | | 18.81% | 4.71% |
| | 1 Year | 5 Year | Since Inception
(07/11/08) |
Institutional Class Shares | 15.18% | 13.74% | 13.47% |
Russell 2000 Value Index | 18.81% | 15.45% | 8.92% |
* | The performance data above represents past performance that is not predictive of future results. The investment return and principal value of an investment in the Fund will fluctuate so that an investor’s shares, when redeemed, may be worth more or less than their original cost. Returns are historical and include changes in principal and reinvested dividends and capital gains and do not reflect the effect of taxes. The Russell 2000 Value Index is an unmanaged index and, unlike the Fund, has no management fees or operating expenses to reduce its reported return. The graph is based on A-Class Shares only; performance for C-Class, P-Class and Institutional Class will vary due to differences in fee structure. |
† | Effective February 22, 2011, the maximum sales charge decreased from 5.75% to 4.75%. A 5.75% maximum sales charge is used in the calculation of the 10 Year average annual return (based on subscriptions made prior to February 22, 2011), and a 4.75% maximum sales charge will be used to calculate performance for periods based on subscriptions made on or after February 22, 2011. |
‡ | Fund returns include a CDSC of 1% if redeemed within 12 months of purchase. |
| | THE GUGGENHEIM FUNDS ANNUAL REPORT | 65 |
SCHEDULE OF INVESTMENTS | September 30, 2016 |
SMALL CAP VALUE FUND | |
| | | Shares | | | Value | |
| | | | | | | |
COMMON STOCKS† - 98.8% | |
| | | | | | | |
Financial - 38.7% | |
Trustmark Corp. | | | 11,602 | | | $ | 319,750 | |
Fulton Financial Corp. | | | 20,015 | | | | 290,618 | |
Cathay General Bancorp | | | 9,350 | | | | 287,793 | |
Berkshire Hills Bancorp, Inc. | | | 10,359 | | | | 287,048 | |
Navigators Group, Inc. | | | 2,945 | | | | 285,430 | |
Equity Commonwealth* | | | 9,120 | | | | 275,606 | |
Wintrust Financial Corp. | | | 4,747 | | | | 263,790 | |
1st Source Corp. | | | 7,070 | | | | 252,364 | |
First Citizens BancShares, Inc. — Class A | | | 731 | | | | 214,833 | |
Hanmi Financial Corp. | | | 7,838 | | | | 206,453 | |
Argo Group International Holdings Ltd. | | | 3,564 | | | | 201,080 | |
Horace Mann Educators Corp. | | | 5,460 | | | | 200,109 | |
Prosperity Bancshares, Inc. | | | 3,506 | | | | 192,444 | |
Zions Bancorporation | | | 6,168 | | | | 191,331 | |
Endurance Specialty Holdings Ltd. | | | 2,768 | | | | 181,166 | |
Umpqua Holdings Corp. | | | 11,974 | | | | 180,209 | |
EastGroup Properties, Inc. | | | 2,330 | | | | 171,395 | |
Hanover Insurance Group, Inc. | | | 2,246 | | | | 169,393 | |
Farmer Mac — Class C | | | 3,975 | | | | 157,013 | |
Old National Bancorp | | | 11,062 | | | | 155,532 | |
Radian Group, Inc. | | | 11,320 | | | | 153,386 | |
EPR Properties | | | 1,931 | | | | 152,047 | |
Investors Bancorp, Inc. | | | 12,492 | | | | 150,029 | |
Valley National Bancorp | | | 15,305 | | | | 148,918 | |
Parkway Properties, Inc. | | | 8,706 | | | | 148,089 | |
Sun Communities, Inc. | | | 1,879 | | | | 147,464 | |
TriCo Bancshares | | | 5,304 | | | | 141,988 | |
FNB Corp. | | | 11,018 | | | | 135,521 | |
CubeSmart | | | 4,519 | | | | 123,188 | |
Lexington Realty Trust | | | 11,180 | | | | 115,154 | |
First Industrial Realty Trust, Inc. | | | 4,032 | | | | 113,783 | |
DCT Industrial Trust, Inc. | | | 2,156 | | | | 104,674 | |
Texas Capital Bancshares, Inc.* | | | 1,815 | | | | 99,680 | |
Webster Financial Corp. | | | 2,479 | | | | 94,227 | |
Hancock Holding Co. | | | 2,899 | | | | 94,015 | |
First Merchants Corp. | | | 3,511 | | | | 93,919 | |
MB Financial, Inc. | | | 2,462 | | | | 93,654 | |
Monogram Residential Trust, Inc. | | | 8,754 | | | | 93,143 | |
IBERIABANK Corp. | | | 1,384 | | | | 92,894 | |
Genworth Financial, Inc. — Class A* | | | 12,825 | | | | 63,612 | |
Stifel Financial Corp.* | | | 1,494 | | | | 57,444 | |
Washington Federal, Inc. | | | 1,781 | | | | 47,517 | |
Sterling Bancorp | | | 2,704 | | | | 47,320 | |
Janus Capital Group, Inc. | | | 3,253 | | | | 45,575 | |
Corrections Corporation of America | | | 3,031 | | | | 42,040 | |
Hope Bancorp, Inc. | | | 465 | | | | 8,077 | |
Total Financial | | | | | | | 7,090,715 | |
| | | | | | | | | |
Industrial - 12.0% | |
Oshkosh Corp. | | | 4,441 | | | | 248,696 | |
Marten Transport Ltd. | | | 11,600 | | | | 243,600 | |
Benchmark Electronics, Inc.* | | | 8,900 | | | | 222,055 | |
Owens-Illinois, Inc.* | | | 10,541 | | | | 193,849 | |
FLIR Systems, Inc. | | | 6,032 | | | | 189,525 | |
Werner Enterprises, Inc. | | | 5,298 | | | | 123,284 | |
Argan, Inc. | | | 1,989 | | | | 117,729 | |
Scorpio Tankers, Inc. | | | 22,984 | | | | 106,416 | |
Kirby Corp.* | | | 1,608 | | | | 99,953 | |
Sanmina Corp.* | | | 3,390 | | | | 96,513 | |
Ryder System, Inc. | | | 1,447 | | | | 95,430 | |
Esterline Technologies Corp.* | | | 1,244 | | | | 94,594 | |
Crane Co. | | | 1,499 | | | | 94,452 | |
ITT, Inc. | | | 2,480 | | | | 88,883 | |
Summit Materials, Inc. — Class A* | | | 4,552 | | | | 84,440 | |
AEP Industries, Inc. | | | 726 | | | | 79,403 | |
Rand Logistics, Inc.* | | | 34,819 | | | | 26,114 | |
Total Industrial | | | | | | | 2,204,936 | |
| | | | | | | | | |
Consumer, Non-cyclical - 11.4% | |
Emergent BioSolutions, Inc.* | | | 9,709 | | | | 306,124 | |
Navigant Consulting, Inc.* | | | 9,940 | | | | 200,986 | |
Sanderson Farms, Inc. | | | 1,901 | | | | 183,123 | |
Invacare Corp. | | | 15,923 | | | | 177,860 | |
Premier, Inc. — Class A* | | | 5,405 | | | | 174,798 | |
Surgical Care Affiliates, Inc.* | | | 2,903 | | | | 141,550 | |
HealthSouth Corp. | | | 3,050 | | | | 123,739 | |
FTI Consulting, Inc.* | | | 2,544 | | | | 113,361 | |
Carriage Services, Inc. — Class A | | | 4,310 | | | | 101,932 | |
Dean Foods Co. | | | 5,787 | | | | 94,907 | |
United Rentals, Inc.* | | | 1,155 | | | | 90,656 | |
Molina Healthcare, Inc.* | | | 1,448 | | | | 84,447 | |
Universal Corp. | | | 1,145 | | | | 66,662 | |
ICF International, Inc.* | | | 1,391 | | | | 61,649 | |
John B Sanfilippo & Son, Inc. | | | 994 | | | | 51,022 | |
Darling Ingredients, Inc.* | | | 3,076 | | | | 41,557 | |
Trevena, Inc.* | | | 5,578 | | | | 37,652 | |
Community Health Systems, Inc.* | | | 2,809 | | | | 32,416 | |
Total Consumer, Non-cyclical | | | | | | | 2,084,441 | |
| | | | | | | | | |
Consumer, Cyclical - 11.1% | |
Century Communities, Inc.* | | | 14,066 | | | | 302,559 | |
International Speedway Corp. — Class A | | | 8,164 | | | | 272,841 | |
J.C. Penney Company, Inc.* | | | 23,785 | | | | 219,298 | |
UniFirst Corp. | | | 1,628 | | | | 214,668 | |
Scotts Miracle-Gro Co. — Class A | | | 2,078 | | | | 173,035 | |
La-Z-Boy, Inc. | | | 5,790 | | | | 142,202 | |
Essendant, Inc. | | | 6,805 | | | | 139,639 | |
Unifi, Inc.* | | | 3,498 | | | | 102,946 | |
Wabash National Corp.* | | | 6,987 | | | | 99,495 | |
Tuesday Morning Corp.* | | | 14,740 | | | | 88,145 | |
Caleres, Inc. | | | 2,045 | | | | 51,718 | |
Genesco, Inc.* | | | 908 | | | | 49,450 | |
Tenneco, Inc.* | | | 822 | | | | 47,898 | |
Deckers Outdoor Corp.* | | | 770 | | | | 45,854 | |
DSW, Inc. — Class A | | | 2,004 | | | | 41,042 | |
Vista Outdoor, Inc.* | | | 914 | | | | 36,432 | |
Total Consumer, Cyclical | | | | | | | 2,027,222 | |
| | | | | | | | | |
Utilities - 8.0% | |
Spire, Inc. | | | 5,145 | | | | 327,942 | |
Portland General Electric Co. | | | 7,660 | | | | 326,240 | |
66 | THE GUGGENHEIM FUNDS ANNUAL REPORT | SEE NOTES TO FINANCIAL STATEMENTS. |
SCHEDULE OF INVESTMENTS (continued) | September 30, 2016 |
SMALL CAP VALUE FUND | |
| | | Shares | | | Value | |
| | | | | | | |
Avista Corp. | | | 7,683 | | | $ | 321,073 | |
Black Hills Corp. | | | 3,818 | | | | 233,738 | |
Calpine Corp.* | | | 9,927 | | | | 125,477 | |
ALLETE, Inc. | | | 1,391 | | | | 82,931 | |
ONE Gas, Inc. | | | 849 | | | | 52,502 | |
Total Utilities | | | | | | | 1,469,903 | |
| | | | | | | | | |
Energy - 5.5% | |
Oasis Petroleum, Inc.* | | | 20,144 | | | | 231,052 | |
Laredo Petroleum, Inc.* | | | 16,817 | | | | 216,939 | |
Gulfport Energy Corp.* | | | 4,906 | | | | 138,595 | |
Chesapeake Energy Corp.* | | | 18,597 | | | | 116,603 | |
Rowan Companies plc — Class A | | | 7,640 | | | | 115,822 | |
WPX Energy, Inc.* | | | 5,436 | | | | 71,701 | |
Jones Energy, Inc. — Class A* | | | 17,778 | | | | 63,290 | |
MRC Global, Inc.* | | | 3,144 | | | | 51,656 | |
Total Energy | | | | | | | 1,005,658 | |
| | | | | | | | | |
Technology - 5.1% | |
Maxwell Technologies, Inc.* | | | 44,589 | | | | 230,079 | |
IXYS Corp. | | | 14,972 | | | | 180,413 | |
ManTech International Corp. — Class A | | | 4,622 | | | | 174,203 | |
Brooks Automation, Inc. | | | 11,160 | | | | 151,887 | |
MKS Instruments, Inc. | | | 2,385 | | | | 118,606 | |
Photronics, Inc.* | | | 8,405 | | | | 86,656 | |
Total Technology | | | | | | | 941,844 | |
| | | | | | | | | |
Communications - 4.3% | |
DigitalGlobe, Inc.* | | | 11,395 | | | | 313,362 | |
Finisar Corp.* | | | 8,022 | | | | 239,056 | |
Bankrate, Inc.* | | | 18,066 | | | | 153,200 | |
Infinera Corp.* | | | 5,059 | | | | 45,683 | |
Time, Inc. | | | 2,850 | | | | 41,268 | |
Total Communications | | | | | | | 792,569 | |
| | | | | | | | | |
Basic Materials - 2.7% | |
Reliance Steel & Aluminum Co. | | | 2,412 | | | | 173,736 | |
Chemtura Corp.* | | | 3,411 | | | | 111,914 | |
Olin Corp. | | | 5,027 | | | | 103,154 | |
Landec Corp.* | | | 4,004 | | | | 53,694 | |
Ingevity Corp.* | | | 1,055 | | | | 48,636 | |
Total Basic Materials | | | | | | | 491,134 | |
| | | | | | | | | |
Total Common Stocks | | | | | | | | |
(Cost $16,556,638) | | | | | | | 18,108,422 | |
| | | | | | | | | |
CONVERTIBLE PREFERRED STOCKS††† - 0.0% | |
Thermoenergy Corp.*,1 | | | 6,250 | | | | 2 | |
Total Convertible Preferred Stocks | | | | | | | | |
(Cost $5,968) | | | | | | | 2 | |
| | | | | | | | | |
SHORT-TERM INVESTMENTS† - 5.4% | |
Dreyfus Treasury Securities Cash Management Fund - Institutional Class 0.16%2 | | | 992,656 | | | | 992,656 | |
Total Short-Term Investments | | | | | | | | |
(Cost $992,656) | | | | | | | 992,656 | |
| | | | | | | | | |
Total Investments - 104.2% | | | | | | | | |
(Cost $17,555,262) | | | | | | $ | 19,101,080 | |
Other Assets & Liabilities, net - (4.2)% | | | | | | | (764,264 | ) |
Total Net Assets - 100.0% | | | | | | $ | 18,336,816 | |
* | Non-income producing security. |
† | Value determined based on Level 1 inputs — See Note 4. |
††† | Value determined based on Level 3 inputs — See Note 4. |
1 | PIPE (Private Investment in Public Equity) — Stock issued by a company in the secondary market as a means of raising capital more quickly and less expensively than through registration of a secondary public offering. |
2 | Rate indicated is the 7 day yield as of September 30, 2016. |
| | plc — Public Limited Company |
| | |
| | See Sector Classification in Other Information section. |
SEE NOTES TO FINANCIAL STATEMENTS. | THE GUGGENHEIM FUNDS ANNUAL REPORT | 67 |
SCHEDULE OF INVESTMENTS (concluded) | September 30, 2016 |
SMALL CAP VALUE FUND | |
The following table summarizes the inputs used to value the Fund’s investments at September 30, 2016 (See Note 4 in the Notes to Financial Statements):
Investments in Securities (Assets) | | Level 1 | | | Level 2 | | | Level 3 | | | Total | |
Common Stocks | | $ | 18,108,422 | | | $ | — | | | $ | — | | | $ | 18,108,422 | |
Convertible Preferred Stocks | | | — | | | | — | | | | 2 | | | | 2 | |
Short-Term Investments | | | 992,656 | | | | — | | | | — | | | | 992,656 | |
Total | | $ | 19,101,078 | | | $ | — | | | $ | 2 | | | $ | 19,101,080 | |
Transfers between investment levels may occur as the markets fluctuate and/or the availability of data used in an investment’s valuation changes. Transfers between valuation levels, if any, are in comparison to the valuation levels at the end of the previous fiscal year, and are effective using the fair value as of the end of the previous fiscal period.
For the year ended September 30, 2016, there were no transfers between levels.
68 | THE GUGGENHEIM FUNDS ANNUAL REPORT | SEE NOTES TO FINANCIAL STATEMENTS. |
STATEMENT OF ASSETS AND LIABILITIES |
September 30, 2016 |
Assets: | |
Investments, at value (cost $17,555,262) | | $ | 19,101,080 | |
Prepaid expenses | | | 29,200 | |
Receivables: | |
Fund shares sold | | | 11,983 | |
Dividends | | | 24,957 | |
Investment adviser | | | 745 | |
Total assets | | | 19,167,965 | |
| | | | | |
Liabilities: | |
Payable for: | |
Fund shares redeemed | | | 782,992 | |
Transfer agent/maintenance fees | | | 8,165 | |
Distribution and service fees | | | 7,063 | |
Trustees’ fees* | | | 3,302 | |
Fund accounting/administration fees | | | 3,044 | |
Miscellaneous | | | 26,583 | |
Total liabilities | | | 831,149 | |
Net assets | | $ | 18,336,816 | |
| | | | | |
Net assets consist of: | |
Paid in capital | | $ | 17,091,769 | |
Undistributed net investment income | | | — | |
Accumulated net realized loss on investments | | | (300,771 | ) |
Net unrealized appreciation on investments | | | 1,545,818 | |
Net assets | | $ | 18,336,816 | |
| | | | | |
A-Class: | |
Net assets | | $ | 13,282,621 | |
Capital shares outstanding | | | 976,249 | |
Net asset value per share | | $ | 13.61 | |
Maximum offering price per share (Net asset value divided by 95.25%) | | $ | 14.28 | |
| | | | | |
C-Class: | |
Net assets | | $ | 4,762,493 | |
Capital shares outstanding | | | 379,028 | |
Net asset value per share | | $ | 12.57 | |
| | | | | |
P-Class: | |
Net assets | | $ | 10,567 | |
Capital shares outstanding | | | 777 | |
Net asset value per share | | $ | 13.60 | |
| | | | | |
Institutional Class: | |
Net assets | | $ | 281,135 | |
Capital shares outstanding | | | 22,421 | |
Net asset value per share | | $ | 12.54 | |
STATEMENT OF OPERATIONS |
Year Ended September 30, 2016 |
Investment Income: | |
Dividends (net of foreign withholding tax of $182) | | $ | 260,474 | |
Interest | | | 445 | |
Total investment income | | | 260,919 | |
| | | | | |
Expenses: | |
Management fees | | | 182,507 | |
Transfer agent/maintenance fees: | |
A-Class | | | 30,415 | |
C-Class | | | 12,309 | |
P-Class | | | 45 | |
Institutional Class | | | 963 | |
Distribution and service fees: | |
A-Class | | | 31,758 | |
C-Class | | | 51,387 | |
P-Class | | | 25 | |
Fund accounting/administration fees | | | 25,000 | |
Registration fees | | | 55,617 | |
Professional fees | | | 26,047 | |
Trustees’ fees* | | | 8,401 | |
Custodian fees | | | 5,402 | |
Line of credit fees | | | 2,806 | |
Miscellaneous | | | 22,662 | |
Total expenses | | | 455,344 | |
Less: | |
Expenses waived by Adviser | | | (177,553 | ) |
Net expenses | | | 277,791 | |
Net investment loss | | | (16,872 | ) |
| | | | | |
Net Realized and Unrealized Gain (Loss): | |
Net realized gain (loss) on: | |
Investments | | | (211,102 | ) |
Net realized loss | | | (211,102 | ) |
Net change in unrealized appreciation (depreciation) on: | |
Investments | | | 2,754,456 | |
Net change in unrealized appreciation (depreciation) | | | 2,754,456 | |
Net realized and unrealized gain | | | 2,543,354 | |
Net increase in net assets resulting from operations | | $ | 2,526,482 | |
* | Relates to Trustees not deemed “interested persons” within the meaning of Section 2(a)(19) of the 1940 Act. |
SEE NOTES TO FINANCIAL STATEMENTS. | THE GUGGENHEIM FUNDS ANNUAL REPORT | 69 |
STATEMENTS OF CHANGES IN NET ASSETS |
| | | Year Ended
September 30,
2016 | | | Year Ended
September 30,
2015 | |
Increase (Decrease) in Net Assets from Operations: | | | | | | |
Net investment loss | | $ | (16,872 | ) | | $ | (21,279 | ) |
Net realized gain (loss) on investments | | | (211,102 | ) | | | 2,580,686 | |
Net change in unrealized appreciation (depreciation) on investments | | | 2,754,456 | | | | (3,368,440 | ) |
Net increase (decrease) in net assets resulting from operations | | | 2,526,482 | | | | (809,033 | ) |
| | | | | | | | | |
Distributions to shareholders from: | | | | | | | | |
Net investment income | | | | | | | | |
A-Class | | | — | | | | (85,715 | ) |
Institutional Class | | | — | | | | (60,526 | ) |
Net realized gains | | | | | | | | |
A-Class | | | (955,328 | ) | | | (3,174,844 | ) |
C-Class | | | (396,113 | ) | | | (1,734,594 | ) |
P-Class | | | (707 | ) | | | — | * |
Institutional Class | | | (41,348 | ) | | | (145,234 | ) |
Total distributions to shareholders | | | (1,393,496 | ) | | | (5,200,913 | ) |
| | | | | | | | | |
Capital share transactions: | | | | | | | | |
Proceeds from sale of shares | | | | | | | | |
A-Class | | | 3,421,000 | | | | 4,411,252 | |
C-Class | | | 750,596 | | | | 563,350 | |
P-Class | | | 709 | | | | 10,100 | * |
Institutional Class | | | 272,695 | | | | 415,494 | |
Distributions reinvested | | | | | | | | |
A-Class | | | 939,682 | | | | 3,225,514 | |
C-Class | | | 387,206 | | | | 1,687,462 | |
P-Class | | | 707 | | | | — | * |
Institutional Class | | | 31,740 | | | | 119,479 | |
Cost of shares redeemed | | | | | | | | |
A-Class | | | (4,780,880 | ) | | | (8,280,585 | ) |
C-Class | | | (1,836,314 | ) | | | (3,649,333 | ) |
P-Class | | | (559 | ) | | | — | * |
Institutional Class | | | (489,765 | ) | | | (608,113 | ) |
Net decrease from capital share transactions | | | (1,303,183 | ) | | | (2,105,380 | ) |
Net decrease in net assets | | | (170,197 | ) | | | (8,115,326 | ) |
| | | | | | | | | |
Net assets: | | | | | | | | |
Beginning of year | | | 18,507,013 | | | | 26,622,339 | |
End of year | | $ | 18,336,816 | | | $ | 18,507,013 | |
Undistributed net investment income/(Accumulated net investment loss at end of year) | | $ | — | | | $ | (9,380 | ) |
70 | THE GUGGENHEIM FUNDS ANNUAL REPORT | SEE NOTES TO FINANCIAL STATEMENTS. |
STATEMENTS OF CHANGES IN NET ASSETS (concluded) |
| | | Year Ended
September 30,
2016 | | | Year Ended
September 30,
2015 | |
Capital share activity: | | | | | | |
Shares sold | | | | | | |
A-Class | | | 266,786 | | | | 298,616 | |
C-Class | | | 65,317 | | | | 41,676 | |
P-Class | | | 58 | | | | 706 | * |
Institutional Class | | | 23,593 | | | | 31,665 | |
Shares issued from reinvestment of distributions | | | | | | | | |
A-Class | | | 74,756 | | | | 230,223 | |
C-Class | | | 33,151 | | | | 127,935 | |
P-Class | | | 56 | | | | — | * |
Institutional Class | | | 2,743 | | | | 9,233 | |
Shares redeemed | | | | | | | | |
A-Class | | | (372,375 | ) | | | (552,933 | ) |
C-Class | | | (152,218 | ) | | | (271,052 | ) |
P-Class | | | (43 | ) | | | — | * |
Institutional Class | | | (42,731 | ) | | | (46,285 | ) |
Net decrease in shares | | | (100,907 | ) | | | (130,216 | ) |
* | Since commencement of operations: May 1, 2015. |
SEE NOTES TO FINANCIAL STATEMENTS. | THE GUGGENHEIM FUNDS ANNUAL REPORT | 71 |
This table is presented to show selected data for a share outstanding throughout each period and to assist shareholders in evaluating a Fund’s performance for the periods presented.
A-Class | | Year Ended
September 30,
2016 | | | Year Ended
September 30,
2015 | | | Year Ended
September 30,
2014 | | | Year Ended
September 30,
2013 | | | Year Ended
September 30,
2012 | |
Per Share Data | | | | | | | | | | | | | | | |
Net asset value, beginning of period | | $ | 12.78 | | | $ | 16.82 | | | $ | 17.81 | | | $ | 15.04 | | | $ | 11.66 | |
Income (loss) from investment operations: | |
Net investment income (loss)a | | | .01 | | | | .02 | | | | (.03 | ) | | | (— | )b | | | (.03 | ) |
Net gain (loss) on investments (realized and unrealized) | | | 1.81 | | | | (.60 | ) | | | .26 | | | | 4.05 | | | | 3.73 | |
Total from investment operations | | | 1.82 | | | | (.58 | ) | | | .23 | | | | 4.05 | | | | 3.70 | |
Less distributions from: | |
Net investment income | | | — | | | | (.09 | ) | | | (.03 | ) | | | (.01 | ) | | | — | |
Net realized gains | | | (.99 | ) | | | (3.37 | ) | | | (1.19 | ) | | | (1.27 | ) | | | (.32 | ) |
Total distributions | | | (.99 | ) | | | (3.46 | ) | | | (1.22 | ) | | | (1.28 | ) | | | (.32 | ) |
Net asset value, end of period | | $ | 13.61 | | | $ | 12.78 | | | $ | 16.82 | | | $ | 17.81 | | | $ | 15.04 | |
| | |
Total Returnc | | | 14.81 | % | | | (5.23 | %) | | | 1.07 | % | | | 29.39 | % | | | 32.19 | % |
Ratios/Supplemental Data | |
Net assets, end of period (in thousands) | | $ | 13,283 | | | $ | 12,866 | | | $ | 17,342 | | | $ | 16,487 | | | $ | 12,294 | |
Ratios to average net assets: | |
Net investment income (loss) | | | 0.12 | % | | | 0.13 | % | | | (0.14 | %) | | | (0.02 | %) | | | (0.24 | %) |
Total expenses | | | 2.29 | % | | | 1.99 | % | | | 1.85 | % | | | 1.91 | % | | | 2.14 | % |
Net expensesd | | | 1.32 | %f | | | 1.32 | %f | | | 1.32 | %f | | | 1.30 | % | | | 1.30 | % |
Portfolio turnover rate | | | 64 | % | | | 62 | % | | | 45 | % | | | 34 | % | | | 62 | % |
C-Class | | Year Ended
September 30,
2016 | | | Year Ended
September 30,
2015 | | | Year Ended
September 30,
2014 | | | Year Ended
September 30,
2013 | | | Year Ended
September 30,
2012 | |
Per Share Data | | | | | | | | | | | | | | | |
Net asset value, beginning of period | | $ | 11.95 | | | $ | 15.96 | | | $ | 17.05 | | | $ | 14.54 | | | $ | 11.36 | |
Income (loss) from investment operations: | |
Net investment income (loss)a | | | (.08 | ) | | | (.09 | ) | | | (.15 | ) | | | (.12 | ) | | | (.14 | ) |
Net gain (loss) on investments (realized and unrealized) | | | 1.69 | | | | (.55 | ) | | | .25 | | | | 3.90 | | | | 3.64 | |
Total from investment operations | | | 1.61 | | | | (.64 | ) | | | .10 | | | | 3.78 | | | | 3.50 | |
Less distributions from: | |
Net realized gains | | | (.99 | ) | | | (3.37 | ) | | | (1.19 | ) | | | (1.27 | ) | | | (.32 | ) |
Total distributions | | | (.99 | ) | | | (3.37 | ) | | | (1.19 | ) | | | (1.27 | ) | | | (.32 | ) |
Net asset value, end of period | | $ | 12.57 | | | $ | 11.95 | | | $ | 15.96 | | | $ | 17.05 | | | $ | 14.54 | |
| | |
Total Returnc | | | 14.02 | % | | | (5.97 | %) | | | 0.30 | % | | | 28.34 | % | | | 31.35 | % |
Ratios/Supplemental Data | |
Net assets, end of period (in thousands) | | $ | 4,762 | | | $ | 5,173 | | | $ | 8,527 | | | $ | 5,885 | | | $ | 3,026 | |
Ratios to average net assets: | |
Net investment income (loss) | | | (0.64 | %) | | | (0.65 | %) | | | (0.87 | %) | | | (0.75 | %) | | | (1.00 | %) |
Total expenses | | | 3.04 | % | | | 2.72 | % | | | 2.51 | % | | | 2.58 | % | | | 2.70 | % |
Net expensesd | | | 2.07 | %f | | | 2.08 | %f | | | 2.07 | %f | | | 2.05 | % | | | 2.05 | % |
Portfolio turnover rate | | | 64 | % | | | 62 | % | | | 45 | % | | | 34 | % | | | 62 | % |
72 | THE GUGGENHEIM FUNDS ANNUAL REPORT | SEE NOTES TO FINANCIAL STATEMENTS. |
FINANCIAL HIGHLIGHTS (continued) |
This table is presented to show selected data for a share outstanding throughout each period and to assist shareholders in evaluating a Fund’s performance for the periods presented.
P-Class | | Year Ended
September 30,
2016 | | | Period Ended
September 30,
2015e | |
Per Share Data | | | | | | |
Net asset value, beginning of period | | $ | 12.77 | | | $ | 14.33 | |
Income (loss) from investment operations: | |
Net investment income (loss)a | | | .02 | | | | .04 | |
Net gain (loss) on investments (realized and unrealized) | | | 1.80 | | | | (1.60 | ) |
Total from investment operations | | | 1.82 | | | | (1.56 | ) |
Less distributions from: | |
Net realized gains | | | (.99 | ) | | | — | |
Total distributions | | | (.99 | ) | | | — | |
Net asset value, end of period | | $ | 13.60 | | | $ | 12.77 | |
| | |
Total Returnc | | | 14.88 | % | | | (10.82 | %) |
Ratios/Supplemental Data | |
Net assets, end of period (in thousands) | | $ | 11 | | | $ | 9 | |
Ratios to average net assets: | |
Net investment income (loss) | | | 0.13 | % | | | 0.60 | % |
Total expenses | | | 2.50 | % | | | 4.04 | % |
Net expensesd,f | | | 1.32 | % | | | 1.31 | % |
Portfolio turnover rate | | | 64 | % | | | 62 | % |
SEE NOTES TO FINANCIAL STATEMENTS. | THE GUGGENHEIM FUNDS ANNUAL REPORT | 73 |
FINANCIAL HIGHLIGHTS (concluded) |
This table is presented to show selected data for a share outstanding throughout each period and to assist shareholders in evaluating a Fund’s performance for the periods presented.
Institutional Class | | Year Ended
September 30,
2016 | | | Year Ended
September 30,
2015 | | | Year Ended
September 30,
2014 | | | Year Ended
September 30,
2013 | | | Year Ended
September 30,
2012 | |
Per Share Data | | | | | | | | | | | | | | | |
Net asset value, beginning of period | | $ | 11.82 | | | $ | 17.04 | | | $ | 18.04 | | | $ | 15.21 | | | $ | 11.76 | |
Income (loss) from investment operations: | |
Net investment income (loss)a | | | .04 | | | | .05 | | | | .01 | | | | .04 | | | | — | b |
Net gain (loss) on investments (realized and unrealized) | | | 1.67 | | | | (.49 | ) | | | .25 | | | | 4.10 | | | | 3.77 | |
Total from investment operations | | | 1.71 | | | | (.44 | ) | | | .26 | | | | 4.14 | | | | 3.77 | |
Less distributions from: | |
Net investment income | | | — | | | | (1.41 | ) | | | (.07 | ) | | | (.04 | ) | | | — | |
Net realized gains | | | (.99 | ) | | | (3.37 | ) | | | (1.19 | ) | | | (1.27 | ) | | | (.32 | ) |
Total distributions | | | (.99 | ) | | | (4.78 | ) | | | (1.26 | ) | | | (1.31 | ) | | | (.32 | ) |
Net asset value, end of period | | $ | 12.54 | | | $ | 11.82 | | | $ | 17.04 | | | $ | 18.04 | | | $ | 15.21 | |
| | |
Total Returnc | | | 15.18 | % | | | (5.01 | %) | | | 1.21 | % | | | 29.74 | % | | | 32.51 | % |
Ratios/Supplemental Data | |
Net assets, end of period (in thousands) | | $ | 281 | | | $ | 459 | | | $ | 753 | | | $ | 22,315 | | | $ | 18,591 | |
Ratios to average net assets: | |
Net investment income (loss) | | | 0.30 | % | | | 0.33 | % | | | 0.05 | % | | | 0.23 | % | | | 0.02 | % |
Total expenses | | | 2.09 | % | | | 1.70 | % | | | 1.33 | % | | | 1.34 | % | | | 1.44 | % |
Net expensesd | | | 1.07 | %f | | | 1.07 | %f | | | 1.07 | %f | | | 1.05 | % | | | 1.05 | % |
Portfolio turnover rate | | | 64 | % | | | 62 | % | | | 45 | % | | | 34 | % | | | 62 | % |
a | Net investment income (loss) per share was computed using average shares outstanding throughout the period. |
b | Net investment income is less than $0.01 per share. |
c | Total return does not reflect the impact of any applicable sales charges. |
d | Net expense information reflects the expense ratios after expense waivers and reimbursements, as applicable. |
e | Since commencement of operations: May 1, 2015. Percentage amounts for the period, except total return and portfolio turnover rate, have been annualized. |
f | Net expenses may include expenses that are excluded from the expense limitation agreement. Excluding these expenses, the operating expense ratios for the periods presented would be: |
| | | 09/30/16 | 09/30/15 | 09/30/14 |
| | A-Class | 1.30% | 1.30% | 1.30% |
| | C-Class | 2.05% | 2.05% | 2.05% |
| | P-Class | 1.30% | 1.30% | — |
| | Institutional Class | 1.05% | 1.05% | 1.05% |
74 | THE GUGGENHEIM FUNDS ANNUAL REPORT | SEE NOTES TO FINANCIAL STATEMENTS. |
MANAGERS’ COMMENTARY (Unaudited) | September 30, 2016 |
To Our Shareholders:
Guggenheim StylePlusTM—Large Core Fund (the “Fund”) is managed by a team of seasoned professionals, including B. Scott Minerd, Global Chairman of Investments and Chief Investment Officer; Farhan Sharaff, Senior Managing Director and Assistant Chief Investment Officer, Equities; Jayson Flowers, Senior Managing Director and Portfolio Manager; Scott Hammond, Managing Director and Senior Portfolio Manager; and Qi Yan, Managing Director and Senior Portfolio Manager. In the following paragraphs, the investment team discusses performance for the fiscal year ended September 30, 2016.
For the year ended September 30, 2016, the Guggenheim StylePlus—Large Core Fund returned 16.13%1, compared with the 15.43% return of its benchmark, the S&P 500 Index.
Through a combination of an allocation to actively managed individual equity, passive equity, and actively managed fixed income, the Fund seeks to exceed the total return of the S&P 500 Index. The actively managed equity and fixed income components seek to provide multiple sources of outperformance and take advantage of Guggenheim’s competencies in both fixed income and systematic stock selection.
The allocation to actively managed individual equity via stocks, and passive equity via derivatives, is designed to provide exposure to large core equity. Remaining Fund assets are invested in the Guggenheim Strategy Funds, short-term fixed-income investment companies advised by Guggenheim Investments. The Strategy Funds invest in a diversified portfolio of debt securities and financial instruments providing exposure to fixed income markets. The investment objective of the Guggenheim Strategy Funds is to seek a high level of income consistent with the preservation of capital.
The passive equity position uses derivatives such as swap agreements to gain exposure to the index. The Fund’s fixed income component invests in a variety of fixed income sectors, including asset-backed securities (ABS), mortgage-backed securities, corporate bonds, and bank loans.
The active and passive decisions seek to add value by tactically allocating to actively managed equity through quantitative selection models when stock picking opportunities are high. During periods when Guggenheim views these opportunities to be less attractive, the Fund seeks to increase its passive exposure to equities and the allocation to fixed-income securities. The prospective return during such periods is the equity index plus an “alpha” component coming from the yield of the fixed-income overlay.
Performance Review
The Fund slightly outperformed the S&P 500 Index for the one-year period ended September 30, 2016. The fixed income sleeve was the largest positive contributor. The investments in the Guggenheim Strategy Funds benefited Fund performance relative to investing in other short-term investments. The actively managed equity sleeve contributed slightly to performance. The passive equity position, maintained through swap agreements and futures contracts also contributed to performance for the period.
For the Fund’s total equity position over the period, 15-20% was allocated to actively managed equity and 80-85% to passive equity. The actively managed equity sleeve increased slightly to 17% over the period, with a slightly lower allocation of 83% to the passive equity position, maintaining the total equity allocation at just below 100%.
When compared with the index, the total equity position (actively managed individual equity plus passive equity derivatives) was most overweight the Industrials and Health Care sectors and most underweight the Consumer Discretionary and Information Technology sectors.
Uncorrelated with the Fund’s active equity component, the fixed-income component was largely invested in ABS, investment-grade corporates, and NA RMBS. These positions constituted the majority of the fixed income sleeve’s total return.
Performance displayed represents past performance which is no guarantee of future results.
1 | Performance figures are based on Class A shares and do not reflect taxes that a shareholder would pay on distributions or the redemption of shares. |
The opinions and forecast expressed may not actually come to pass. This information is subject to change at any time, based on market and other conditions, and should not be construed as a recommendation of any specific security or strategy.
| | THE GUGGENHEIM FUNDS ANNUAL REPORT | 75 |
PERFORMANCE REPORT AND FUND PROFILE (Unaudited) | September 30, 2016 |
STYLEPLUS—LARGE CORE FUND
OBJECTIVE: Seeks long-term growth of capital.
Holdings Diversification (Market Exposure as % of Net Assets)
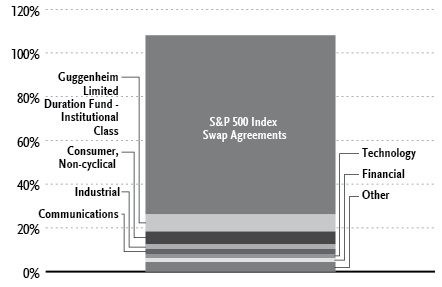
“Holdings Diversification (Market Exposure as % of Net Assets)” excludes any temporary cash investments or investments in Guggenheim Strategy Funds Trust mutual funds. Investments in those Funds do not provide “market exposure” to meet the Fund’s investment objective, but will significantly increase the portfolio’s exposure to certain other asset categories (and their associated risks), which may cause the Fund to deviate from its principal investment strategy, including: (i) high yield, high risk debt securities rated below the top four long-term rating categories by a nationally recognized statistical rating organization (also known as “junk bonds”); (ii) securities issued by the U.S. government or its agencies and instrumentalities; (iii) CLOs and similar investments; and (iv) other short-term fixed income securities.
Inception Dates: |
A-Class | September 10, 1962 |
C-Class | January 29, 1999 |
P-Class | May 1, 2015 |
Institutional Class | March 1, 2012 |
Ten Largest Holdings (% of Total Net Assets) |
Guggenheim Strategy Fund III | 34.2% |
Guggenheim Strategy Fund II | 25.3% |
Guggenheim Strategy Fund I | 12.1% |
Guggenheim Limited Duration Fund - Institutional Class | 8.0% |
Apple, Inc. | 0.7% |
Exxon Mobil Corp. | 0.5% |
AT&T, Inc. | 0.4% |
Pfizer, Inc. | 0.4% |
Verizon Communications, Inc. | 0.3% |
Merck & Company, Inc. | 0.3% |
Top Ten Total | 82.2% |
| | |
“Ten Largest Holdings” excludes any temporary cash or derivative investments. |
76 | THE GUGGENHEIM FUNDS ANNUAL REPORT | |
PERFORMANCE REPORT AND FUND PROFILE (Unaudited)(concluded) | September 30, 2016 |
Cumulative Fund Performance*
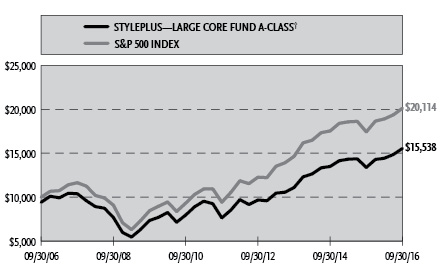
Average Annual Returns*
Periods Ended September 30, 2016
| | 1 Year | 5 Year | 10 Year |
A-Class Shares | 16.13% | 15.26% | 5.13% |
A-Class Shares with sales charge† | 10.63% | 14.14% | 4.51% |
C-Class Shares | 15.00% | 14.18% | 4.26% |
C-Class Shares with CDSC‡ | 14.00% | 14.18% | 4.26% |
S&P 500 Index | 15.43% | 16.37% | 7.24% |
| | | 1 Year | Since Inception
(05/01/15) |
P-Class Shares | | 16.08% | 4.19% |
S&P 500 Index | | 15.43% | 4.28% |
| | | 1 Year | Since Inception
(03/01/12) |
Institutional Class Shares | | 17.00% | 11.60% |
S&P 500 Index | | 15.43% | 12.85% |
* | The performance data above represents past performance that is not predictive of future results. The investment return and principal value of an investment in the Fund will fluctuate so that an investor’s shares, when redeemed, may be worth more or less than their original cost. Returns are historical and include changes in principal and reinvested dividends and capital gains and do not reflect the effect of taxes. The S&P 500 Index is an unmanaged index and, unlike the Fund, has no management fees or operating expenses to reduce its reported return. The graph is based on A-Class shares only; performance for C-Class, P-Class and Institutional Class will vary due to differences in fee structures. |
† | Effective February 22, 2011, the maximum sales charge decreased from 5.75% to 4.75%. A 5.75% maximum sales charge is used in the calculation of the 10 Year average annual return (based on subscriptions made prior to February 22, 2011), and a 4.75% maximum sales charge will be used to calculate performance for periods based on subscriptions made on or after February 22, 2011. |
‡ | Fund returns include a CDSC of 1% if redeemed within 12 months of purchase. |
| | THE GUGGENHEIM FUNDS ANNUAL REPORT | 77 |
SCHEDULE OF INVESTMENTS | September 30, 2016 |
STYLEPLUS—LARGE CORE FUND | |
| | | Shares | | | Value | |
| | | | | | | |
COMMON STOCKS† - 16.9% | |
| | | | | | | |
Consumer, Non-cyclical - 5.8% | |
Pfizer, Inc. | | | 20,337 | | | $ | 688,815 | |
Merck & Company, Inc. | | | 10,205 | | | | 636,894 | |
PepsiCo, Inc. | | | 5,576 | | | | 606,502 | |
Procter & Gamble Co. | | | 6,576 | | | | 590,167 | |
UnitedHealth Group, Inc. | | | 3,991 | | | | 558,740 | |
Amgen, Inc. | | | 3,214 | | | | 536,127 | |
Medtronic plc | | | 6,094 | | | | 526,522 | |
Gilead Sciences, Inc. | | | 6,429 | | | | 508,662 | |
AbbVie, Inc. | | | 8,002 | | | | 504,686 | |
Biogen, Inc.* | | | 1,450 | | | | 453,894 | |
Danaher Corp. | | | 5,215 | | | | 408,803 | |
Express Scripts Holding Co.* | | | 5,777 | | | | 407,452 | |
Becton Dickinson and Co. | | | 2,218 | | | | 398,641 | |
McKesson Corp. | | | 2,369 | | | | 395,031 | |
Zimmer Biomet Holdings, Inc. | | | 2,945 | | | | 382,909 | |
Cardinal Health, Inc. | | | 4,809 | | | | 373,659 | |
Archer-Daniels-Midland Co. | | | 8,702 | | | | 366,963 | |
HCA Holdings, Inc.* | | | 4,838 | | | | 365,898 | |
Kimberly-Clark Corp. | | | 2,888 | | | | 364,292 | |
Kroger Co. | | | 12,236 | | | | 363,164 | |
Allergan plc* | | | 1,452 | | | | 334,410 | |
General Mills, Inc. | | | 5,024 | | | | 320,933 | |
Sysco Corp. | | | 6,194 | | | | 303,568 | |
Johnson & Johnson | | | 2,075 | | | | 245,120 | |
Tyson Foods, Inc. — Class A | | | 3,269 | | | | 244,096 | |
Coty, Inc. — Class A* | | | 4,533 | | | | 106,525 | |
Thermo Fisher Scientific, Inc. | | | 632 | | | | 100,526 | |
Mondelez International, Inc. — Class A | | | 2,272 | | | | 99,741 | |
Abbott Laboratories | | | 2,257 | | | | 95,449 | |
Aetna, Inc. | | | 716 | | | | 82,662 | |
Anthem, Inc. | | | 571 | | | | 71,552 | |
Total Consumer, Non-cyclical | | | | | | | 11,442,403 | |
| | | | | | | | | |
Industrial - 2.2% | |
Union Pacific Corp. | | | 4,934 | | | | 481,213 | |
Boeing Co. | | | 3,556 | | | | 468,467 | |
United Parcel Service, Inc. — Class B | | | 4,244 | | | | 464,125 | |
Caterpillar, Inc. | | | 4,985 | | | | 442,518 | |
FedEx Corp. | | | 2,437 | | | | 425,695 | |
Emerson Electric Co. | | | 7,391 | | | | 402,883 | |
Eaton Corporation plc | | | 5,930 | | | | 389,660 | |
CSX Corp. | | | 12,759 | | | | 389,150 | |
Waste Management, Inc. | | | 5,799 | | | | 369,744 | |
Honeywell International, Inc. | | | 1,477 | | | | 172,203 | |
United Technologies Corp. | | | 1,548 | | | | 157,277 | |
General Electric Co. | | | 5,174 | | | | 153,254 | |
Total Industrial | | | | | | | 4,316,189 | |
| | | | | | | | | |
Communications - 2.2% | |
AT&T, Inc. | | | 17,731 | | | | 720,056 | |
Verizon Communications, Inc. | | | 12,606 | | | | 655,260 | |
Cisco Systems, Inc. | | | 19,324 | | | | 612,957 | |
Comcast Corp. — Class A | | | 9,173 | | | | 608,537 | |
Alphabet, Inc. — Class C* | | | 626 | | | | 486,584 | |
Time Warner, Inc. | | | 5,658 | | | | 450,433 | |
Twenty-First Century Fox, Inc. — Class B | | | 14,120 | | | | 349,329 | |
Amazon.com, Inc.* | | | 249 | | | | 208,490 | |
Facebook, Inc. — Class A* | | | 1,496 | | | | 191,892 | |
Total Communications | | | | | | | 4,283,538 | |
| | | | | | | | | |
Technology - 1.9% | |
Apple, Inc. | | | 12,150 | | | | 1,373,558 | |
Intel Corp. | | | 16,841 | | | | 635,748 | |
Oracle Corp. | | | 13,931 | | | | 547,210 | |
Microsoft Corp. | | | 8,065 | | | | 464,544 | |
HP, Inc. | | | 25,276 | | | | 392,536 | |
International Business Machines Corp. | | | 1,033 | | | | 164,092 | |
Cognizant Technology Solutions Corp. — Class A* | | | 2,400 | | | | 114,504 | |
Broadcom Ltd. | | | 593 | | | | 102,304 | |
Total Technology | | | | | | | 3,794,496 | |
| | | | | | | | | |
Financial - 1.8% | |
Citigroup, Inc. | | | 11,126 | | | | 525,481 | |
Wells Fargo & Co. | | | 10,248 | | | | 453,781 | |
MetLife, Inc. | | | 9,329 | | | | 414,487 | |
Prudential Financial, Inc. | | | 4,843 | | | | 395,431 | |
Travelers Companies, Inc. | | | 3,313 | | | | 379,504 | |
State Street Corp. | | | 5,409 | | | | 376,629 | |
Aflac, Inc. | | | 5,233 | | | | 376,096 | |
JPMorgan Chase & Co. | | | 2,985 | | | | 198,771 | |
Bank of America Corp. | | | 10,415 | | | | 162,995 | |
Berkshire Hathaway, Inc. — Class B* | | | 1,044 | | | | 150,827 | |
Chubb Ltd. | | | 758 | | | | 95,243 | |
Total Financial | | | | | | | 3,529,245 | |
| | | | | | | | | |
Consumer, Cyclical - 1.5% | |
Wal-Mart Stores, Inc. | | | 7,207 | | | | 519,769 | |
CVS Health Corp. | | | 5,534 | | | | 492,472 | |
Walgreens Boots Alliance, Inc. | | | 5,513 | | | | 444,458 | |
Ford Motor Co. | | | 33,807 | | | | 408,050 | |
General Motors Co. | | | 12,635 | | | | 401,414 | |
Delta Air Lines, Inc. | | | 9,979 | | | | 392,773 | |
Target Corp. | | | 4,802 | | | | 329,801 | |
Total Consumer, Cyclical | | | | | | | 2,988,737 | |
| | | | | | | | | |
Energy - 1.2% | |
Exxon Mobil Corp. | | | 11,200 | | | | 977,535 | |
Schlumberger Ltd. | | | 5,084 | | | | 399,806 | |
Phillips 66 | | | 4,843 | | | | 390,104 | |
Valero Energy Corp. | | | 6,488 | | | | 343,864 | |
Chevron Corp. | | | 991 | | | | 101,994 | |
Cabot Oil & Gas Corp. — Class A | | | 3,822 | | | | 98,608 | |
Total Energy | | | | | | | 2,311,911 | |
| | | | | | | | | |
Basic Materials - 0.2% | |
Dow Chemical Co. | | | 2,255 | | | | 116,876 | |
Nucor Corp. | | | 2,117 | | | | 104,686 | |
LyondellBasell Industries N.V. — Class A | | | 1,277 | | | | 103,003 | |
Total Basic Materials | | | | | | | 324,565 | |
78 | THE GUGGENHEIM FUNDS ANNUAL REPORT | SEE NOTES TO FINANCIAL STATEMENTS. |
SCHEDULE OF INVESTMENTS (continued) | September 30, 2016 |
STYLEPLUS—LARGE CORE FUND | |
| | | Shares | | | Value | |
| | | | | | | |
Utilities - 0.1% | |
Southern Co. | | | 1,834 | | | $ | 94,084 | |
NextEra Energy, Inc. | | | 754 | | | | 92,229 | |
Exelon Corp. | | | 1,968 | | | | 65,515 | |
Total Utilities | | | | | | | 251,828 | |
| | | | | | | | | |
Total Common Stocks | | | | | | | | |
(Cost $31,703,187) | | | | | | | 33,242,912 | |
| | | | | | | | | |
MUTUAL FUNDS† - 79.7% | |
Guggenheim Strategy Fund III1 | | | 2,686,944 | | | | 67,119,862 | |
Guggenheim Strategy Fund II1 | | | 1,992,521 | | | | 49,693,469 | |
Guggenheim Strategy Fund I1 | | | 953,636 | | | | 23,831,360 | |
Guggenheim Limited Duration Fund - Institutional Class1 | | | 638,148 | | | | 15,768,627 | |
Total Mutual Funds | | | | | | | | |
(Cost $155,747,778) | | | | | | | 156,413,318 | |
| | | | | | | | | |
SHORT-TERM INVESTMENTS† - 4.7% | |
Dreyfus Treasury Securities Cash Management Fund - Institutional Class 0.16%2, | | | 9,234,363 | | | | 9,234,363 | |
Total Short-Term Investments | | | | | | | | |
(Cost $9,234,363) | | | | | | | 9,234,363 | |
| | | | | | | | | |
Total Investments - 101.3% | | | | | | | | |
(Cost $196,685,328) | | | | | | $ | 198,890,593 | |
Other Assets & Liabilities, net - (1.3)% | | | | | | | (2,609,754 | ) |
Total Net Assets - 100.0% | | | | | | $ | 196,280,839 | |
| | | Contracts | | | Unrealized
Gain | |
| | | | | | | |
EQUITY FUTURES CONTRACTS PURCHASED† | |
December 2016 S&P 500 Index
Mini Futures Contracts
(Aggregate Value of
Contracts $2,268,263) | | | 21 | | | $ | 39,833 | |
| | | Units | | | | |
| | | | | | | |
OTC EQUITY INDEX SWAP AGREEMENTS†† | |
Deutsche Bank
August 2017 S&P 500
Index Swap 0.63%3,
Terminating 08/03/17
(Notional Value $160,766,842) | | | 39,010 | | | $ | 5,724,743 | |
* | Non-income producing security. |
† | Value determined based on Level 1 inputs — See Note 4. |
†† | Value determined based on Level 2 inputs — See Note 4. |
1 | Affiliated issuer — See Note 8. |
2 | Rate indicated is the 7 day yield as of September 30, 2016. |
3 | Total Return based on S&P 500 Index +/- financing at a variable rate. Rate indicated is the rate effective at September 30, 2016. |
| | plc — Public Limited Company |
| | |
| | See Sector Classification in Other Information section. |
SEE NOTES TO FINANCIAL STATEMENTS. | THE GUGGENHEIM FUNDS ANNUAL REPORT | 79 |
SCHEDULE OF INVESTMENTS (concluded) | September 30, 2016 |
STYLEPLUS—LARGE CORE FUND | |
The following table summarizes the inputs used to value the Fund’s investments at September 30, 2016 (See Note 4 in the Notes to Financial Statements):
Investments in Securities (Assets) | | Level 1 | | | Level 1 -
Other* | | | Level 2 | | | Level 2 -
Other* | | | Level 3 | | | Total | |
Common Stocks | | $ | 33,242,912 | | | $ | — | | | $ | — | | | $ | — | | | $ | — | | | $ | 33,242,912 | |
Equity Futures Contracts | | | — | | | | 39,833 | | | | — | | | | — | | | | — | | | | 39,833 | |
Equity Index Swap Agreements | | | — | | | | — | | | | — | | | | 5,724,743 | | | | — | | | | 5,724,743 | |
Mutual Funds | | | 156,413,318 | | | | — | | | | — | | | | — | | | | — | | | | 156,413,318 | |
Short-Term Investments | | | 9,234,363 | | | | — | | | | — | | | | — | | | | — | | | | 9,234,363 | |
Total | | $ | 198,890,593 | | | $ | 39,833 | | | $ | — | | | $ | 5,724,743 | | | $ | — | | | $ | 204,655,169 | |
* | Other financial instruments include futures contracts and/or swaps, which are reported as unrealized gain/loss at period end. |
Transfers between investment levels may occur as the markets fluctuate and/or the availability of data used in an investment’s valuation changes. Transfers between valuation levels, if any, are in comparison to the valuation levels at the end of the previous fiscal year, and are effective using the fair value as of the end of the previous fiscal period.
For the year ended September 30, 2016, there were no transfers between levels.
80 | THE GUGGENHEIM FUNDS ANNUAL REPORT | SEE NOTES TO FINANCIAL STATEMENTS. |
STYLEPLUS—LARGE CORE FUND | |
STATEMENT OF ASSETS AND LIABILITIES |
September 30, 2016 |
Assets: | |
Investments in unaffiliated issuers, at value (cost $40,937,550) | | $ | 42,477,275 | |
Investments in affiliated issuers, at value (cost $155,747,778) | | | 156,413,318 | |
Total investments (cost $196,685,328) | | | 198,890,593 | |
Unrealized appreciation on swap agreements | | | 5,724,743 | |
Segregated cash with broker | | | 233,000 | |
Prepaid expenses | | | 33,148 | |
Receivables: | |
Variation margin | | | 29,867 | |
Fund shares sold | | | 53,489 | |
Dividends | | | 325,016 | |
Total assets | | | 205,289,856 | |
| | | | | |
Liabilities: | |
Segregated cash due to broker | | | 4,460,000 | |
Overdraft due to custodian bank | | | 267 | |
Payable for: | |
Fund shares redeemed | | | 2,281,688 | |
Securities purchased | | | 1,983,796 | |
Management fees | | | 115,886 | |
Distribution and service fees | | | 41,635 | |
Fund accounting/administration fees | | | 15,412 | |
Transfer agent/maintenance fees | | | 14,452 | |
Trustees’ fees* | | | 10,605 | |
Miscellaneous | | | 85,276 | |
Total liabilities | | | 9,009,017 | |
Net assets | | $ | 196,280,839 | |
| | | | | |
Net assets consist of: | |
Paid in capital | | $ | 183,602,338 | |
Undistributed net investment income | | | 1,127,190 | |
Accumulated net realized gain on investments | | | 3,581,470 | |
Net unrealized appreciation on investments | | | 7,969,841 | |
Net assets | | $ | 196,280,839 | |
| | | | | |
A-Class: | |
Net assets | | $ | 188,979,234 | |
Capital shares outstanding | | | 8,643,286 | |
Net asset value per share | | $ | 21.86 | |
Maximum offering price per share (Net asset value divided by 95.25%) | | $ | 22.95 | |
| | | | | |
C-Class: | |
Net assets | | $ | 2,649,555 | |
Capital shares outstanding | | | 153,899 | |
Net asset value per share | | $ | 17.22 | |
| | | | | |
P-Class: | |
Net assets | | $ | 405,147 | |
Capital shares outstanding | | | 18,625 | |
Net asset value per share | | $ | 21.75 | |
| | | | | |
Institutional Class: | |
Net assets | | $ | 4,246,903 | |
Capital shares outstanding | | | 194,979 | |
Net asset value per share | | $ | 21.78 | |
* | Relates to Trustees not deemed “interested persons” within the meaning of Section 2(a)(19) of the 1940 Act. |
SEE NOTES TO FINANCIAL STATEMENTS. | THE GUGGENHEIM FUNDS ANNUAL REPORT | 81 |
STYLEPLUS—LARGE CORE FUND | |
STATEMENT OF OPERATIONS |
Year Ended September 30, 2016 |
Investment Income: | |
Dividends from securities of affiliated issuers | | $ | 3,248,318 | |
Dividends from securities of unaffiliated issuers | | | 715,151 | |
Interest | | | 13,285 | |
Total investment income | | | 3,976,754 | |
| | | | | |
Expenses: | |
Management fees | | | 1,420,817 | |
Transfer agent/maintenance fees: | |
A-Class | | | 198,427 | |
C-Class | | | 9,344 | |
P-Class | | | 23 | |
Institutional Class | | | 294 | |
Distribution and service fees: | |
A-Class | | | 460,469 | |
C-Class | | | 30,956 | |
P-Class | | | 759 | |
Fund accounting/administration fees | | | 179,968 | |
Line of credit fees | | | 35,271 | |
Trustees’ fees* | | | 16,303 | |
Custodian fees | | | 13,387 | |
Miscellaneous | | | 171,832 | |
Total expenses | | | 2,537,850 | |
Less: | |
Expenses waived by Adviser | | | (39,318 | ) |
Net expenses | | | 2,498,532 | |
Net investment income | | | 1,478,222 | |
| | | | | |
Net Realized and Unrealized Gain (Loss): | |
Net realized gain (loss) on: | |
Investments in unaffiliated issuers | | $ | 2,002,791 | |
Investments in affiliated issuers | | | (143,352 | ) |
Swap agreements | | | 2,699,260 | |
Futures contracts | | | 298,620 | |
Net realized gain | | | 4,857,319 | |
Net change in unrealized appreciation (depreciation) on: | |
Investments in unaffiliated issuers | | | 2,228,094 | |
Investments in affiliated issuers | | | 983,322 | |
Swap agreements | | | 18,504,722 | |
Futures contracts | | | 73,404 | |
Net change in unrealized appreciation (depreciation) | | | 21,789,542 | |
Net realized and unrealized gain | | | 26,646,861 | |
Net increase in net assets resulting from operations | | $ | 28,125,083 | |
* | Relates to Trustees not deemed “interested persons” within the meaning of Section 2(a)(19) of the 1940 Act. |
82 | THE GUGGENHEIM FUNDS ANNUAL REPORT | SEE NOTES TO FINANCIAL STATEMENTS. |
STYLEPLUS—LARGE CORE FUND | |
STATEMENTS OF CHANGES IN NET ASSETS |
| | | Year Ended
September 30,
2016 | | | Year Ended
September 30,
2015 | |
Increase (Decrease) in Net Assets from Operations: | | | | | | |
Net investment income | | $ | 1,478,222 | | | $ | 916,462 | |
Net realized gain on investments | | | 4,857,319 | | | | 21,563,771 | |
Net change in unrealized appreciation (depreciation) on investments | | | 21,789,542 | | | | (23,122,031 | ) |
Net increase (decrease) in net assets resulting from operations | | | 28,125,083 | | | | (641,798 | ) |
| | | | | | | | | |
Distributions to shareholders from: | | | | | | | | |
Net investment income | | | | | | | | |
A-Class | | | (1,021,091 | ) | | | (1,732,889 | ) |
C-Class | | | — | | | | (12,770 | ) |
P-Class | | | (120 | ) | | | — | * |
Institutional Class | | | (18,603 | ) | | | (1,276 | ) |
Net realized gains | | | | | | | | |
A-Class | | | (19,593,831 | ) | | | (24,703,723 | ) |
B-Class | | | — | | | | (495,181 | ) |
C-Class | | | (390,350 | ) | | | (513,717 | ) |
P-Class | | | (1,552 | ) | | | — | * |
Institutional Class | | | (208,131 | ) | | | (14,534 | ) |
Total distributions to shareholders | | | (21,233,678 | ) | | | (27,474,090 | ) |
| | | | | | | | | |
Capital share transactions: | | | | | | | | |
Proceeds from sale of shares | | | | | | | | |
A-Class | | | 10,388,479 | | | | 9,389,928 | |
B-Class | | | — | | | | 73,635 | |
C-Class | | | 970,129 | | | | 1,219,839 | |
P-Class | | | 400,232 | | | | 15,200 | * |
Institutional Class | | | 5,594,239 | | | | 299,886 | |
Distributions reinvested | | | | | | | | |
A-Class | | | 19,338,091 | | | | 24,669,740 | |
B-Class | | | — | | | | 493,058 | |
C-Class | | | 381,661 | | | | 522,705 | |
P-Class | | | 1,672 | | | | — | * |
Institutional Class | | | 225,550 | | | | 11,270 | |
Cost of shares redeemed | | | | | | | | |
A-Class | | | (25,363,728 | ) | | | (21,983,556 | ) |
B-Class | | | — | | | | (3,242,342 | ) |
C-Class | | | (1,501,528 | ) | | | (1,457,727 | ) |
P-Class | | | (46,532 | ) | | | — | * |
Institutional Class | | | (1,831,412 | ) | | | (67,861 | ) |
Net increase from capital share transactions | | | 8,556,853 | | | | 9,943,775 | |
Net increase (decrease) in net assets | | | 15,448,258 | | | | (18,172,113 | ) |
| | | | | | | | | |
Net assets: | | | | | | | | |
Beginning of year | | | 180,832,581 | | | | 199,004,694 | |
End of year | | $ | 196,280,839 | | | $ | 180,832,581 | |
Undistributed net investment income at end of year | | $ | 1,127,190 | | | $ | 688,782 | |
SEE NOTES TO FINANCIAL STATEMENTS. | THE GUGGENHEIM FUNDS ANNUAL REPORT | 83 |
STYLEPLUS—LARGE CORE FUND | |
STATEMENTS OF CHANGES IN NET ASSETS (concluded) |
| | | Year Ended
September 30,
2016 | | | Year Ended
September 30,
2015 | |
Capital share activity: | | | | | | |
Shares sold | | | | | | |
A-Class | | | 494,691 | | | | 407,154 | |
B-Class | | | — | | | | 4,630 | |
C-Class | | | 59,504 | | | | 63,123 | |
P-Class | | | 20,095 | | | | 660 | * |
Institutional Class | | | 266,874 | | | | 13,800 | |
Shares issued from reinvestment of distributions | | | | | | | | |
A-Class | | | 960,661 | | | | 1,097,897 | |
B-Class | | | — | | | | 30,473 | |
C-Class | | | 23,881 | | | | 28,423 | |
P-Class | | | 83 | | | | — | * |
Institutional Class | | | 11,274 | | | | 505 | |
Shares redeemed | | | | | | | | |
A-Class | | | (1,219,870 | ) | | | (959,415 | ) |
B-Class | | | — | | | | (200,041 | ) |
C-Class | | | (90,686 | ) | | | (78,357 | ) |
P-Class | | | (2,213 | ) | | | — | * |
Institutional Class | | | (97,608 | ) | | | (3,130 | ) |
Net increase in shares | | | 426,686 | | | | 405,722 | |
* | Since commencement of operations: May 1, 2015. |
84 | THE GUGGENHEIM FUNDS ANNUAL REPORT | SEE NOTES TO FINANCIAL STATEMENTS. |
STYLEPLUS—LARGE CORE FUND | |
This table is presented to show selected data for a share outstanding throughout each period and to assist shareholders in evaluating a Fund’s performance for the periods presented.
A-Class | | Year Ended
September 30,
2016 | | | Year Ended
September 30,
2015 | | | Year Ended
September 30,
2014 | | | Year Ended
September 30,
2013 | | | Year Ended
September 30,
2012 | |
Per Share Data | | | | | | | | | | | | | | | |
Net asset value, beginning of period | | $ | 21.14 | | | $ | 24.53 | | | $ | 24.27 | | | $ | 21.25 | | | $ | 16.79 | |
Income (loss) from investment operations: | |
Net investment income (loss)a | | | .16 | | | | .11 | | | | .20 | | | | .06 | | | | .06 | |
Net gain (loss) on investments (realized and unrealized) | | | 3.04 | | | | (.12 | ) | | | 4.45 | | | | 3.04 | | | | 4.42 | |
Total from investment operations | | | 3.20 | | | | (.01 | ) | | | 4.65 | | | | 3.10 | | | | 4.48 | |
Less distributions from: | |
Net investment income | | | (.13 | ) | | | (.22 | ) | | | (.06 | ) | | | (.08 | ) | | | (.02 | ) |
Net realized gains | | | (2.35 | ) | | | (3.16 | ) | | | (4.33 | ) | | | — | | | | — | |
Total distributions | | | (2.48 | ) | | | (3.38 | ) | | | (4.39 | ) | | | (.08 | ) | | | (.02 | ) |
Net asset value, end of period | | $ | 21.86 | | | $ | 21.14 | | | $ | 24.53 | | | $ | 24.27 | | | $ | 21.25 | |
| | |
Total Returnb | | | 16.13 | % | | | (0.84 | %) | | | 21.59 | % | | | 14.64 | % | | | 26.71 | % |
Ratios/Supplemental Data | |
Net assets, end of period (in thousands) | | $ | 188,979 | | | $ | 177,748 | | | $ | 192,850 | | | $ | 175,601 | | | $ | 171,907 | |
Ratios to average net assets: | |
Net investment income (loss) | | | 0.79 | % | | | 0.48 | % | | | 0.86 | % | | | 0.26 | % | | | 0.32 | % |
Total expensesc | | | 1.33 | % | | | 1.32 | % | | | 1.41 | % | | | 1.37 | % | | | 1.36 | % |
Net expensesd | | | 1.31 | % | | | 1.32 | % | | | 1.39 | % | | | 1.37 | % | | | 1.36 | % |
Portfolio turnover rate | | | 50 | % | | | 65 | % | | | 107 | % | | | 217 | % | | | 101 | % |
C-Class | | Year Ended
September 30,
2016 | | | Year Ended
September 30,
2015 | | | Year Ended
September 30,
2014 | | | Year Ended
September 30,
2013 | | | Year Ended
September 30,
2012 | |
Per Share Data | | | | | | | | | | | | | | | |
Net asset value, beginning of period | | $ | 17.17 | | | $ | 20.55 | | | $ | 21.12 | | | $ | 18.60 | | | $ | 14.81 | |
Income (loss) from investment operations: | |
Net investment income (loss)a | | | (.02 | ) | | | (.08 | ) | | | (.02 | ) | | | (.15 | ) | | | (.10 | ) |
Net gain (loss) on investments (realized and unrealized) | | | 2.42 | | | | (.06 | ) | | | 3.78 | | | | 2.67 | | | | 3.89 | |
Total from investment operations | | | 2.40 | | | | (.14 | ) | | | 3.76 | | | | 2.52 | | | | 3.79 | |
Less distributions from: | |
Net investment income | | | — | | | | (.08 | ) | | | — | | | | — | | | | — | |
Net realized gains | | | (2.35 | ) | | | (3.16 | ) | | | (4.33 | ) | | | — | | | | — | |
Total distributions | | | (2.35 | ) | | | (3.24 | ) | | | (4.33 | ) | | | — | | | | — | |
Net asset value, end of period | | $ | 17.22 | | | $ | 17.17 | | | $ | 20.55 | | | $ | 21.12 | | | $ | 18.60 | |
| | |
Total Returnb | | | 15.00 | % | | | (1.72 | %) | | | 20.40 | % | | | 13.55 | % | | | 25.59 | % |
Ratios/Supplemental Data | |
Net assets, end of period (in thousands) | | $ | 2,650 | | | $ | 2,767 | | | $ | 3,042 | | | $ | 2,275 | | | $ | 1,669 | |
Ratios to average net assets: | |
Net investment income (loss) | | | (0.14 | %) | | | (0.44 | %) | | | (0.08 | %) | | | (0.77 | %) | | | (0.55 | %) |
Total expensesc | | | 2.27 | % | | | 2.25 | % | | | 2.36 | % | | | 2.34 | % | | | 2.22 | % |
Net expensesd | | | 2.25 | % | | | 2.25 | % | | | 2.34 | % | | | 2.34 | % | | | 2.22 | % |
Portfolio turnover rate | | | 50 | % | | | 65 | % | | | 107 | % | | | 217 | % | | | 101 | % |
SEE NOTES TO FINANCIAL STATEMENTS. | THE GUGGENHEIM FUNDS ANNUAL REPORT | 85 |
STYLEPLUS—LARGE CORE FUND | |
FINANCIAL HIGHLIGHTS (continued) |
This table is presented to show selected data for a share outstanding throughout each period and to assist shareholders in evaluating a Fund’s performance for the periods presented.
P-Class | | Year Ended
September 30,
2016 | | | Period Ended
September 30,
2015e | |
Per Share Data | | | | | | |
Net asset value, beginning of period | | $ | 21.11 | | | $ | 23.12 | |
Income (loss) from investment operations: | |
Net investment income (loss)a | | | .21 | | | | .03 | |
Net gain (loss) on investments (realized and unrealized) | | | 2.97 | | | | (2.04 | ) |
Total from investment operations | | | 3.18 | | | | (2.01 | ) |
Less distributions from: | |
Net investment income | | | (.19 | ) | | | — | |
Net realized gains | | | (2.35 | ) | | | — | |
Total distributions | | | (2.54 | ) | | | — | |
Net asset value, end of period | | $ | 21.75 | | | $ | 21.11 | |
| | |
Total Returnb | | | 16.08 | % | | | (8.69 | %) |
Ratios/Supplemental Data | |
Net assets, end of period (in thousands) | | $ | 405 | | | $ | 14 | |
Ratios to average net assets: | |
Net investment income (loss) | | | 1.02 | % | | | 0.31 | % |
Total expensesc | | | 1.22 | % | | | 1.38 | % |
Net expensesd | | | 1.19 | % | | | 1.38 | % |
Portfolio turnover rate | | | 50 | % | | | 65 | % |
86 | THE GUGGENHEIM FUNDS ANNUAL REPORT | SEE NOTES TO FINANCIAL STATEMENTS. |
STYLEPLUS—LARGE CORE FUND | |
FINANCIAL HIGHLIGHTS (concluded) |
This table is presented to show selected data for a share outstanding throughout each period and to assist shareholders in evaluating a Fund’s performance for the periods presented.
Institutional Class | | Year Ended
September 30,
2016 | | | Year Ended
September 30,
2015 | | | Year Ended
September 30,
2014 | | | Year Ended
September 30,
2013 | | | Period Ended
September 30,
2012f | |
Per Share Data | | | | | | | | | | | | | | | |
Net asset value, beginning of period | | $ | 21.00 | | | $ | 24.42 | | | $ | 24.25 | | | $ | 21.28 | | | $ | 20.84 | |
Income (loss) from investment operations: | |
Net investment income (loss)a | | | .24 | | | | .12 | | | | .23 | | | | .06 | | | | .07 | |
Net gain (loss) on investments (realized and unrealized) | | | 3.10 | | | | (.10 | ) | | | 4.38 | | | | 3.06 | | | | .37 | |
Total from investment operations | | | 3.34 | | | | .02 | | | | 4.61 | | | | 3.12 | | | | .44 | |
Less distributions from: | |
Net investment income | | | (.21 | ) | | | (.28 | ) | | | (.11 | ) | | | (.15 | ) | | | — | |
Net realized gains | | | (2.35 | ) | | | (3.16 | ) | | | (4.33 | ) | | | — | | | | — | |
Total distributions | | | (2.56 | ) | | | (3.44 | ) | | | (4.44 | ) | | | (.15 | ) | | | — | |
Net asset value, end of period | | $ | 21.78 | | | $ | 21.00 | | | $ | 24.42 | | | $ | 24.25 | | | $ | 21.28 | |
| | |
Total Returnb | | | 17.00 | % | | | (0.75 | %) | | | 21.50 | % | | | 14.79 | % | | | 2.11 | % |
Ratios/Supplemental Data | |
Net assets, end of period (in thousands) | | $ | 4,247 | | | $ | 303 | | | $ | 80 | | | $ | 26 | | | $ | 10 | |
Ratios to average net assets: | |
Net investment income (loss) | | | 1.11 | % | | | 0.52 | % | | | 0.97 | % | | | 0.26 | % | | | 0.59 | % |
Total expensesc | | | 0.99 | % | | | 1.25 | % | | | 1.39 | % | | | 1.25 | % | | | 1.12 | % |
Net expensesd | | | 0.97 | % | | | 1.25 | % | | | 1.37 | % | | | 1.25 | % | | | 1.12 | % |
Portfolio turnover rate | | | 50 | % | | | 65 | % | | | 107 | % | | | 217 | % | | | 101 | % |
a | Net investment income (loss) per share was computed using average shares outstanding throughout the period. |
b | Total return does not reflect the impact of any applicable sales charges and has not been annualized. |
c | Does not include expenses of the underlying funds in which the Fund invests. |
d | Net expense information reflects the expense ratios after expense waivers. |
e | Since commencement of operations: May 1, 2015. Percentage amounts for the period, except total return and portfolio turnover rate, have been annualized. |
f | Since commencement of operations: March 1, 2012. Percentage amounts for the period, except total return and portfolio turnover rate, have been annualized. |
SEE NOTES TO FINANCIAL STATEMENTS. | THE GUGGENHEIM FUNDS ANNUAL REPORT | 87 |
MANAGERS’ COMMENTARY (Unaudited) | September 30, 2016 |
To Our Shareholders:
Guggenheim StylePlusTM—Mid Growth Fund (the “Fund”) is managed by a team of seasoned professionals, including B. Scott Minerd, Global Chairman of Investments and Chief Investment Officer; Farhan Sharaff, Senior Managing Director and Assistant Chief Investment Officer, Equities; Jayson Flowers, Senior Managing Director and Portfolio Manager; Scott Hammond, Managing Director and Senior Portfolio Manager; and Qi Yan, Managing Director and Portfolio Manager. In the following paragraphs, the investment team discusses performance for the fiscal year ended September 30, 2016.
For the year ended September 30, 2016, the Guggenheim StylePlus—Mid Growth Fund returned 11.55%1, compared with the 11.24% return of its benchmark, the Russell Midcap® Growth Index.
Through a combination of an allocation to actively managed individual equity, passive equity, and actively managed fixed income, the Fund seeks to exceed the total return of the Russell Midcap Growth Index. The actively managed equity and fixed income components seek to provide multiple sources of outperformance and take advantage of Guggenheim’s competencies in both fixed income and systematic stock selection.
The allocation to actively managed individual equity via stocks, and passive equity via derivatives, is designed to provide exposure to midcap growth equity. Remaining Fund assets are invested in the Guggenheim Strategy Funds, short-term fixed-income investment companies advised by Guggenheim Investments. The Strategy Funds invest in a diversified portfolio of debt securities and financial instruments providing exposure to fixed income markets. The investment objective of the Guggenheim Strategy Funds is to seek a high level of income consistent with the preservation of capital.
The passive equity position uses derivatives such as swap agreements to gain exposure to the index. The Fund’s fixed income component invests in a variety of fixed income sectors, including asset-backed securities (ABS), mortgage-backed securities, corporate bonds, and bank loans.
The active and passive decisions seek to add value by tactically allocating to actively managed equity through quantitative selection models when stock picking opportunities are high. During periods when Guggenheim views these opportunities to be less attractive, the Fund seeks to increase its passive exposure to equities and the allocation to fixed-income securities. The prospective return during such periods is the equity index plus an “alpha” component coming from the yield of the fixed-income overlay.
Performance Review
The Fund slightly outperformed the Russell Midcap Growth Index over the period. The fixed income sleeve was the largest positive contributor to performance. The investments in the Guggenheim Strategy Funds benefited Fund performance relative to investing in other short-term investments. The actively managed equity sleeve contributed slightly to performance. The passive equity position, maintained through swap agreements and futures contracts was a slight detractor from performance for the period.
For the Fund’s total equity position over the period, 15-20% was allocated to actively managed equity and 80-85% to passive equity. The actively managed equity sleeve increased from 16% to 18% over the period, while the allocation to the passive equity position increased from about 84% to almost 85%.
When compared with the index, the total equity position (actively managed individual equity plus passive equity derivatives) was most overweight the Industrials and Consumer Staples sectors and most underweight the Financials and Consumer Discretionary sectors.
Uncorrelated with the Fund’s active equity component, the fixed-income component was largely invested in ABS, investment-grade corporates, and non-Agency residential mortgage-backed securities. These positions constituted the majority of the fixed income sleeve’s total return.
Performance displayed represents past performance which is no guarantee of future results.
1 | Performance figures are based on Class A shares and do not reflect taxes that a shareholder would pay on distributions or the redemption of shares. |
The opinions and forecast expressed may not actually come to pass. This information is subject to change at any time, based on market and other conditions, and should not be construed as a recommendation of any specific security or strategy.
88 | THE GUGGENHEIM FUNDS ANNUAL REPORT | |
PERFORMANCE REPORT AND FUND PROFILE (Unaudited) | September 30, 2016 |
STYLEPLUS—MID GROWTH FUND
OBJECTIVE: Seeks long-term growth of capital.
Holdings Diversification (Market Exposure as % of Net Assets)
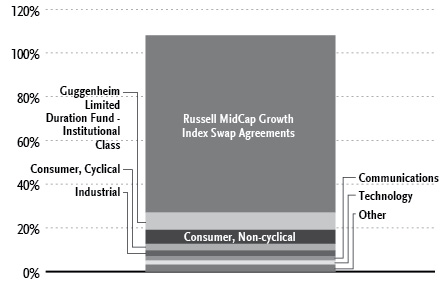
“Holdings Diversification (Market Exposure as % of Net Assets)” excludes any temporary cash investments or investments in Guggenheim Strategy Funds Trust mutual funds. Investments in those Funds do not provide “market exposure” to meet the Fund’s investment objective, but will significantly increase the portfolio’s exposure to certain other asset categories (and their associated risks), which may cause the Fund to deviate from its principal investment strategy, including: (i) high yield, high risk debt securities rated below the top four long-term rating categories by a nationally recognized statistical rating organization (also known as “junk bonds”); (ii) securities issued by the U.S. government or its agencies and instrumentalities; (iii) CLOs and similar investments; and (iv) other short-term fixed income securities.
Inception Dates: |
A-Class | September 17, 1969 |
C-Class | January 29, 1999 |
P-Class | May 1, 2015 |
Institutional Class | March 1, 2012 |
Ten Largest Holdings (% of Total Net Assets) |
Guggenheim Strategy Fund III | 34.8% |
Guggenheim Strategy Fund II | 26.6% |
Guggenheim Strategy Fund I | 10.8% |
Guggenheim Limited Duration Fund - Institutional Class | 8.2% |
Intuitive Surgical, Inc. | 0.3% |
Fidelity National Information Services, Inc. | 0.3% |
Expedia, Inc. | 0.3% |
Zimmer Biomet Holdings, Inc. | 0.3% |
AmerisourceBergen Corp. — Class A | 0.3% |
Nielsen Holdings plc | 0.3% |
Top Ten Total | 82.2% |
| | |
“Ten Largest Holdings” excludes any temporary cash or derivative investments. |
| | THE GUGGENHEIM FUNDS ANNUAL REPORT | 89 |
PERFORMANCE REPORT AND FUND PROFILE (Unaudited)(concluded) | September 30, 2016 |
Cumulative Fund Performance*
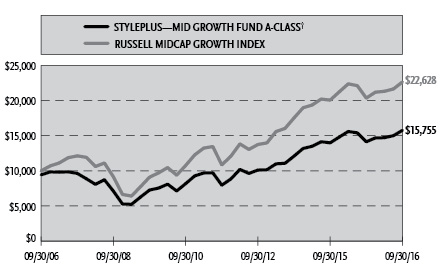
Average Annual Returns*
Periods Ended September 30, 2016
| | 1 Year | 5 Year | 10 Year |
A-Class Shares | 11.55% | 14.63% | 5.27% |
A-Class Shares with sales charge† | 6.25% | 13.52% | 4.65% |
C-Class Shares | 10.55% | 13.62% | 4.39% |
C-Class Shares with CDSC‡ | 9.61% | 13.62% | 4.39% |
Russell Midcap Growth Index | 11.24% | 15.85% | 8.51% |
| | | 1 Year | Since Inception
(05/01/15) |
P-Class Shares | | 11.36% | 0.36% |
Russell Midcap Growth Index | | 11.24% | 0.59% |
| | | 1 Year | Since Inception
(03/01/12) |
Institutional Class Shares | | 11.50% | 10.39% |
Russell Midcap Growth Index | | 11.24% | 11.68% |
* | The performance data above represents past performance that is not predictive of future results. The investment return and principal value of an investment in the Fund will fluctuate so that an investor’s shares, when redeemed, may be worth more or less than their original cost. Returns are historical and include changes in principal and reinvested dividends and capital gains and do not reflect the effect of taxes. The Russell Midcap Growth Index is an unmanaged index and, unlike the Fund, has no management fees or operating expenses to reduce its reported return. The graph is based on A-Class shares only; performance for C-Class, P-Class and Institutional Class will vary due to differences in fee structures. |
† | Effective February 22, 2011, the maximum sales charge decreased from 5.75% to 4.75%. A 5.75% maximum sales charge is used in the calculation of the 10 Year average annual return (based on subscriptions made prior to February 22, 2011), and a 4.75% maximum sales charge will be used to calculate performance for periods based on subscriptions made on or after February 22, 2011. |
‡ | Fund returns include a CDSC of 1% if redeemed within 12 months of purchase. |
90 | THE GUGGENHEIM FUNDS ANNUAL REPORT | |
SCHEDULE OF INVESTMENTS | September 30, 2016 |
STYLEPLUS—MID GROWTH FUND | |
| | | Shares | | | Value | |
| | | | | | | |
COMMON STOCKS† - 18.1% | |
| | | | | | | |
Consumer, Non-cyclical - 8.0% | |
Intuitive Surgical, Inc.* | | | 313 | | | $ | 226,871 | |
Zimmer Biomet Holdings, Inc. | | | 1,573 | | | | 204,522 | |
AmerisourceBergen Corp. — Class A | | | 2,487 | | | | 200,899 | |
Nielsen Holdings plc | | | 3,565 | | | | 190,977 | |
Hologic, Inc.* | | | 4,272 | | | | 165,882 | |
DaVita, Inc.* | | | 2,465 | | | | 162,863 | |
Laboratory Corporation of America Holdings* | | | 1,182 | | | | 162,501 | |
Cardinal Health, Inc. | | | 1,778 | | | | 138,151 | |
Total System Services, Inc. | | | 2,930 | | | | 138,149 | |
Zoetis, Inc. | | | 2,627 | | | | 136,630 | |
HCA Holdings, Inc.* | | | 1,795 | | | | 135,756 | |
Kellogg Co. | | | 1,736 | | | | 134,488 | |
Flowers Foods, Inc. | | | 8,862 | | | | 133,993 | |
Incyte Corp.* | | | 1,416 | | | | 133,514 | |
Molina Healthcare, Inc.* | | | 2,241 | | | | 130,695 | |
ConAgra Foods, Inc. | | | 2,747 | | | | 129,411 | |
Kroger Co. | | | 4,339 | | | | 128,782 | |
Dr Pepper Snapple Group, Inc. | | | 1,369 | | | | 125,003 | |
CR Bard, Inc. | | | 550 | | | | 123,354 | |
Tyson Foods, Inc. — Class A | | | 1,629 | | | | 121,637 | |
Equifax, Inc. | | | 900 | | | | 121,122 | |
ResMed, Inc. | | | 1,815 | | | | 117,594 | |
Henry Schein, Inc.* | | | 701 | | | | 114,249 | |
B&G Foods, Inc. | | | 2,184 | | | | 107,409 | |
HealthSouth Corp. | | | 2,576 | | | | 104,508 | |
Boston Scientific Corp.* | | | 4,141 | | | | 98,556 | |
Universal Health Services, Inc. — Class B | | | 779 | | | | 95,988 | |
Coty, Inc. — Class A* | | | 3,961 | | | | 93,084 | |
Robert Half International, Inc. | | | 2,425 | | | | 91,811 | |
RR Donnelley & Sons Co. | | | 5,759 | | | | 90,531 | |
KAR Auction Services, Inc. | | | 1,967 | | | | 84,896 | |
Hill-Rom Holdings, Inc. | | | 1,339 | | | | 82,991 | |
Charles River Laboratories International, Inc.* | | | 952 | | | | 79,340 | |
Constellation Brands, Inc. — Class A | | | 475 | | | | 79,083 | |
MEDNAX, Inc.* | | | 1,181 | | | | 78,241 | |
Post Holdings, Inc.* | | | 988 | | | | 76,244 | |
CoreLogic, Inc.* | | | 1,927 | | | | 75,577 | |
DexCom, Inc.* | | | 860 | | | | 75,388 | |
United Rentals, Inc.* | | | 919 | | | | 72,132 | |
Edwards Lifesciences Corp.* | | | 594 | | | | 71,613 | |
Sysco Corp. | | | 1,428 | | | | 69,986 | |
Campbell Soup Co. | | | 1,270 | | | | 69,469 | |
United Therapeutics Corp.* | | | 576 | | | | 68,014 | |
VCA, Inc.* | | | 959 | | | | 67,111 | |
Vertex Pharmaceuticals, Inc.* | | | 743 | | | | 64,797 | |
Verisk Analytics, Inc. — Class A* | | | 759 | | | | 61,692 | |
Avis Budget Group, Inc.* | | | 1,779 | | | | 60,860 | |
Global Payments, Inc. | | | 787 | | | | 60,410 | |
Western Union Co. | | | 2,825 | | | | 58,817 | |
Tenet Healthcare Corp.* | | | 2,480 | | | | 56,197 | |
Spectrum Brands Holdings, Inc. | | | 404 | | | | 55,626 | |
TreeHouse Foods, Inc.* | | | 603 | | | | 52,576 | |
Seattle Genetics, Inc.* | | | 966 | | | | 52,174 | |
Herbalife Ltd.* | | | 768 | | | | 47,608 | |
Centene Corp.* | | | 698 | | | | 46,738 | |
WellCare Health Plans, Inc.* | | | 390 | | | | 45,665 | |
S&P Global, Inc. | | | 360 | | | | 45,562 | |
Darling Ingredients, Inc.* | | | 3,151 | | | | 42,570 | |
Clorox Co. | | | 337 | | | | 42,186 | |
Alexion Pharmaceuticals, Inc.* | | | 344 | | | | 42,154 | |
Hain Celestial Group, Inc.* | | | 1,163 | | | | 41,380 | |
Pilgrim’s Pride Corp. | | | 1,884 | | | | 39,790 | |
ServiceMaster Global Holdings, Inc.* | | | 1,123 | | | | 37,823 | |
Total Consumer, Non-cyclical | | | | | | | 6,063,640 | |
| | | | | | | | | |
Consumer, Cyclical - 3.3% | |
PACCAR, Inc. | | | 2,552 | | | | 150,007 | |
Southwest Airlines Co. | | | 3,710 | | | | 144,281 | |
Liberty Interactive Corporation QVC Group — Class A* | | | 7,077 | | | | 141,611 | |
Alaska Air Group, Inc. | | | 2,071 | | | | 136,396 | |
Newell Brands, Inc. | | | 2,444 | | | | 128,701 | |
Dollar Tree, Inc.* | | | 1,556 | | | | 122,815 | |
Delphi Automotive plc | | | 1,671 | | | | 119,175 | |
Michael Kors Holdings Ltd.* | | | 2,301 | | | | 107,664 | |
Dollar General Corp. | | | 1,514 | | | | 105,965 | |
Lear Corp. | | | 808 | | | | 97,946 | |
O’Reilly Automotive, Inc.* | | | 347 | | | | 97,198 | |
WW Grainger, Inc. | | | 430 | | | | 96,682 | |
JetBlue Airways Corp.* | | | 5,532 | | | | 95,372 | |
Tesla Motors, Inc.* | | | 433 | | | | 88,345 | |
Fastenal Co. | | | 2,071 | | | | 86,526 | |
BorgWarner, Inc. | | | 2,409 | | | | 84,749 | |
The Gap, Inc. | | | 3,602 | | | | 80,108 | |
AutoZone, Inc.* | | | 93 | | | | 71,456 | |
Delta Air Lines, Inc. | | | 1,751 | | | | 68,919 | |
Whirlpool Corp. | | | 406 | | | | 65,837 | |
Under Armour, Inc. — Class A* | | | 1,565 | | | | 60,534 | |
Ross Stores, Inc. | | | 895 | | | | 57,549 | |
Casey’s General Stores, Inc. | | | 441 | | | | 52,986 | |
PulteGroup, Inc. | | | 2,502 | | | | 50,140 | |
AutoNation, Inc.* | | | 1,018 | | | | 49,587 | |
Polaris Industries, Inc. | | | 594 | | | | 45,999 | |
Harman International Industries, Inc. | | | 530 | | | | 44,759 | |
DR Horton, Inc. | | | 1,362 | | | | 41,132 | |
Marriott International, Inc. — Class A | | | 598 | | | | 40,263 | |
Total Consumer, Cyclical | | | | | | | 2,532,702 | |
| | | | | | | | | |
Industrial - 2.8% | |
Rockwell Automation, Inc. | | | 1,289 | | | | 157,696 | |
Spirit AeroSystems Holdings, Inc. — Class A* | | | 3,513 | | | | 156,468 | |
TransDigm Group, Inc.* | | | 530 | | | | 153,234 | |
Rockwell Collins, Inc. | | | 1,548 | | | | 130,558 | |
Agilent Technologies, Inc. | | | 2,619 | | | | 123,329 | |
Huntington Ingalls Industries, Inc. | | | 803 | | | | 123,196 | |
Stericycle, Inc.* | | | 1,388 | | | | 111,235 | |
AMERCO | | | 318 | | | | 103,105 | |
Roper Technologies, Inc. | | | 547 | | | | 99,811 | |
SEE NOTES TO FINANCIAL STATEMENTS. | THE GUGGENHEIM FUNDS ANNUAL REPORT | 91 |
SCHEDULE OF INVESTMENTS (continued) | September 30, 2016 |
STYLEPLUS—MID GROWTH FUND | |
| | | Shares | | | Value | |
| | | | | | | |
AMETEK, Inc. | | | 2,034 | | | $ | 97,185 | |
Carlisle Companies, Inc. | | | 825 | | | | 84,620 | |
Textron, Inc. | | | 2,082 | | | | 82,760 | |
Waste Management, Inc. | | | 1,211 | | | | 77,213 | |
Clean Harbors, Inc.* | | | 1,430 | | | | 68,611 | |
Energizer Holdings, Inc. | | | 1,317 | | | | 65,797 | |
Ingersoll-Rand plc | | | 893 | | | | 60,670 | |
Acuity Brands, Inc. | | | 206 | | | | 54,508 | |
Snap-on, Inc. | | | 329 | | | | 49,995 | |
SBA Communications Corp. — Class A* | | | 444 | | | | 49,799 | |
J.B. Hunt Transport Services, Inc. | | | 556 | | | | 45,114 | |
Wabtec Corp. | | | 545 | | | | 44,499 | |
Owens-Illinois, Inc.* | | | 2,374 | | | | 43,658 | |
Johnson Controls International plc | | | 924 | | | | 42,994 | |
Waters Corp.* | | | 269 | | | | 42,634 | |
Packaging Corporation of America | | | 508 | | | | 41,280 | |
Ball Corp. | | | 502 | | | | 41,139 | |
Total Industrial | | | | | | | 2,151,108 | |
| | | | | | | | | |
Communications - 1.9% | |
Expedia, Inc. | | | 1,766 | | | | 206,127 | |
IAC/InterActiveCorp | | | 2,387 | | | | 149,116 | |
Scripps Networks Interactive, Inc. — Class A | | | 2,339 | | | | 148,503 | |
Viacom, Inc. — Class B | | | 3,679 | | | | 140,170 | |
Palo Alto Networks, Inc.* | | | 823 | | | | 131,129 | |
DISH Network Corp. — Class A* | | | 2,291 | | | | 125,501 | |
Omnicom Group, Inc. | | | 1,413 | | | | 120,105 | |
Discovery Communications, Inc. — Class A* | | | 3,334 | | | | 89,751 | |
Ciena Corp.* | | | 3,895 | | | | 84,911 | |
AMC Networks, Inc. — Class A* | | | 1,589 | | | | 82,406 | |
Interpublic Group of Companies, Inc. | | | 3,163 | | | | 70,693 | |
Splunk, Inc.* | | | 891 | | | | 52,284 | |
Sinclair Broadcast Group, Inc. — Class A | | | 1,756 | | | | 50,713 | |
Total Communications | | | | | | | 1,451,409 | |
| | | | | | | | | |
Technology - 1.4% | |
Fidelity National Information Services, Inc. | | | 2,703 | | | | 208,212 | |
Cerner Corp.* | | | 2,377 | | | | 146,780 | |
Teradata Corp.* | | | 3,394 | | | | 105,214 | |
Electronic Arts, Inc.* | | | 846 | | | | 72,248 | |
Microchip Technology, Inc. | | | 1,147 | | | | 71,275 | |
Lam Research Corp. | | | 715 | | | | 67,718 | |
Activision Blizzard, Inc. | | | 1,442 | | | | 63,881 | |
SS&C Technologies Holdings, Inc. | | | 1,962 | | | | 63,078 | |
Cognizant Technology Solutions Corp. — Class A* | | | 1,236 | | | | 58,970 | |
Skyworks Solutions, Inc. | | | 689 | | | | 52,460 | |
Tableau Software, Inc. — Class A* | | | 857 | | | | 47,366 | |
Nuance Communications, Inc.* | | | 3,231 | | | | 46,850 | |
Pitney Bowes, Inc. | | | 2,496 | | | | 45,327 | |
NVIDIA Corp. | | | 641 | | | | 43,921 | |
Total Technology | | | | | | | 1,093,300 | |
| | | | | | | | | |
Financial - 0.3% | |
Alliance Data Systems Corp.* | | | 831 | | | | 178,274 | |
Iron Mountain, Inc. | | | 1,086 | | | | 40,758 | |
Total Financial | | | | | | | 219,032 | |
| | | | | | | | | |
Energy - 0.3% | |
Cabot Oil & Gas Corp. — Class A | | | 3,791 | | | | 97,808 | |
ONEOK, Inc. | | | 1,174 | | | | 60,332 | |
Diamondback Energy, Inc.* | | | 243 | | | | 23,459 | |
Continental Resources, Inc.* | | | 447 | | | | 23,226 | |
Total Energy | | | | | | | 204,825 | |
| | | | | | | | | |
Basic Materials - 0.1% | |
Steel Dynamics, Inc. | | | 1,438 | | | | 35,936 | |
| | | | | | | | | |
Total Common Stocks | | | | | | | | |
(Cost $13,657,714) | | | | | | | 13,751,952 | |
| | | | | | | | | |
MUTUAL FUNDS† - 80.4% | |
Guggenheim Strategy Fund III1 | | | 1,061,404 | | | | 26,513,876 | |
Guggenheim Strategy Fund II1 | | | 811,978 | | | | 20,250,726 | |
Guggenheim Strategy Fund I1 | | | 329,039 | | | | 8,222,675 | |
Guggenheim Limited Duration Fund - Institutional Class1 | | | 253,799 | | | | 6,271,368 | |
Total Mutual Funds | | | | | | | | |
(Cost $61,011,261) | | | | | | | 61,258,645 | |
| | | | | | | | | |
SHORT-TERM INVESTMENTS† - 3.6% | |
Dreyfus Treasury Securities Cash Management Fund - Institutional Shares 0.16%2 | | | 2,750,363 | | | | 2,750,363 | |
Total Short-Term Investments | | | | | | | | |
(Cost $2,750,363) | | | | | | | 2,750,363 | |
| | | | | | | | | |
Total Investments - 102.1% | | | | | | | | |
(Cost $77,419,338) | | | | | | $ | 77,760,960 | |
Other Assets & Liabilities, net - (2.1)% | | | | | | | (1,606,203 | ) |
Total Net Assets - 100.0% | | | | | | $ | 76,154,757 | |
| | | Units | | | Unrealized
Gain | |
| | | | | | | | | |
OTC EQUITY INDEX SWAP AGREEMENTS†† | |
Deutsche Bank
August 2017 Russell Midcap Growth
Index Swap 0.60%3,
Terminating 08/03/17
(Notional Value $63,280,937) | | | 28,105 | | | $ | 2,662,190 | |
92 | THE GUGGENHEIM FUNDS ANNUAL REPORT | SEE NOTES TO FINANCIAL STATEMENTS. |
SCHEDULE OF INVESTMENTS (concluded) | September 30, 2016 |
STYLEPLUS—MID GROWTH FUND | |
* | Non-income producing security. |
† | Value determined based on Level 1 inputs — See Note 4. |
†† | Value determined based on Level 2 inputs — See Note 4. |
1 | Affiliated issuer — See Note 8. |
2 | Rate indicated is the 7 day yield as of September 30, 2016. |
3 | Total Return based on Russell Midcap Growth Index +/- financing at a variable rate. Rate indicated is the rate effective at September 30, 2016. |
| | plc — Public Limited Company |
| | |
| | See Sector Classification in Other Information section. |
The following table summarizes the inputs used to value the Fund’s investments at September 30, 2016 (See Note 4 in the Notes to Financial Statements):
Investments in Securities (Assets) | | Level 1 | | | Level 2 | | | Level 2 -
Other* | | | Level 3 | | | Total | |
Common Stocks | | $ | 13,751,952 | | | $ | — | | | $ | — | | | $ | — | | | $ | 13,751,952 | |
Equity Index Swap Agreements | | | — | | | | — | | | | 2,662,190 | | | | — | | | | 2,662,190 | |
Mutual Funds | | | 61,258,645 | | | | — | | | | — | | | | — | | | | 61,258,645 | |
Short-Term Investments | | | 2,750,363 | | | | — | | | | — | | | | — | | | | 2,750,363 | |
Total | | $ | 77,760,960 | | | $ | — | | | $ | 2,662,190 | | | $ | — | | | $ | 80,423,150 | |
* | Other financial instruments include futures contracts and/or swaps, which are reported as unrealized gain/loss at period end. |
Transfers between investment levels may occur as the markets fluctuate and/or the availability of data used in an investment’s valuation changes. Transfers between valuation levels, if any, are in comparison to the valuation levels at the end of the previous fiscal year, and are effective using the fair value as of the end of the previous fiscal period.
For the year ended September 30, 2016, there were no transfers between levels.
SEE NOTES TO FINANCIAL STATEMENTS. | THE GUGGENHEIM FUNDS ANNUAL REPORT | 93 |
STYLEPLUS—MID GROWTH FUND | |
STATEMENT OF ASSETS AND LIABILITIES |
September 30, 2016 |
Assets: | |
Investments in unaffiliated issuers, at value (cost $16,408,077) | | $ | 16,502,315 | |
Investments in affiliated issuers, at value (cost $61,011,261) | | | 61,258,645 | |
Total investments (cost $77,419,338) | | | 77,760,960 | |
Unrealized appreciation on swap agreements | | | 2,662,190 | |
Segregated cash with broker | | | 68,850 | |
Prepaid expenses | | | 23,427 | |
Cash | | | 9,839 | |
Receivables: | |
Securities sold | | | 34,199 | |
Fund shares sold | | | 537 | |
Dividends | | | 154,862 | |
Total assets | | | 80,714,864 | |
| | | | | |
Liabilities: | |
Segregated cash due to broker | | | 2,180,000 | |
Payable for: | |
Fund shares redeemed | | | 1,657,803 | |
Securities purchased | | | 565,379 | |
Management fees | | | 45,395 | |
Transfer agent/maintenance fees | | | 26,718 | |
Distribution and service fees | | | 18,620 | |
Fund accounting/administration fees | | | 6,042 | |
Trustees’ fees* | | | 2,727 | |
Variation margin | | | 2,580 | |
Miscellaneous | | | 54,843 | |
Total liabilities | | | 4,560,107 | |
Net assets | | $ | 76,154,757 | |
| | | | | |
Net assets consist of: | |
Paid in capital | | $ | 75,335,780 | |
Undistributed net investment income | | | 259,567 | |
Accumulated net realized loss on investments | | | (2,444,402 | ) |
Net unrealized appreciation on investments | | | 3,003,812 | |
Net assets | | $ | 76,154,757 | |
| | | | | |
A-Class: | |
Net assets | | $ | 72,179,112 | |
Capital shares outstanding | | | 1,781,298 | |
Net asset value per share | | $ | 40.52 | |
Maximum offering price per share (Net asset value divided by 95.25%) | | $ | 42.54 | |
| | | | | |
C-Class: | |
Net assets | | $ | 3,760,356 | |
Capital shares outstanding | | | 122,986 | |
Net asset value per share | | $ | 30.58 | |
| | | | | |
P-Class: | |
Net assets | | $ | 101,843 | |
Capital shares outstanding | | | 2,529 | |
Net asset value per share | | $ | 40.27 | |
| | | | | |
Institutional Class: | |
Net assets | | $ | 113,446 | |
Capital shares outstanding | | | 2,795 | |
Net asset value per share | | $ | 40.59 | |
* | Relates to Trustees not deemed “interested persons” within the meaning of Section 2(a)(19) of the 1940 Act. |
94 | THE GUGGENHEIM FUNDS ANNUAL REPORT | SEE NOTES TO FINANCIAL STATEMENTS. |
STYLEPLUS—MID GROWTH FUND | |
STATEMENT OF OPERATIONS |
Year Ended September 30, 2016 |
Investment Income: | |
Dividends from securities of affiliated issuers | | $ | 1,309,165 | |
Dividends from securities of unaffiliated issuers (net of foreign withholding tax of $64) | | | 155,171 | |
Interest | | | 5,029 | |
Total investment income | | | 1,469,365 | |
| | | | | |
Expenses: | |
Management fees | | | 576,665 | |
Transfer agent/maintenance fees: | |
A-Class | | | 112,459 | |
C-Class | | | 13,686 | |
P-Class | | | 48 | |
Institutional Class | | | 259 | |
Distribution and service fees: | |
A-Class | | | 180,522 | |
C-Class | | | 45,721 | |
P-Class | | | 118 | |
Fund accounting/administration fees | | | 73,044 | |
Line of credit fees | | | 12,693 | |
Trustees’ fees* | | | 9,915 | |
Custodian fees | | | 6,854 | |
Miscellaneous | | | 122,749 | |
Total expenses | | | 1,154,733 | |
Less: | |
Expenses waived by Adviser | | | (15,657 | ) |
Net expenses | | | 1,139,076 | |
Net investment income | | | 330,289 | |
| | | | | |
Net Realized and Unrealized Gain (Loss): | |
Net realized gain (loss) on: | |
Investments in unaffiliated issuers | | $ | 438,470 | |
Investments in affiliated issuers | | | (48,339 | ) |
Swap agreements | | | (2,839,895 | ) |
Futures contracts | | | 40,888 | |
Net realized loss | | | (2,408,876 | ) |
Net change in unrealized appreciation (depreciation) on: | |
Investments in unaffiliated issuers | | | 936,619 | |
Investments in affiliated issuers | | | 376,063 | |
Swap agreements | | | 9,069,538 | |
Futures contracts | | | 4,838 | |
Net change in unrealized appreciation (depreciation) | | | 10,387,058 | |
Net realized and unrealized gain | | | 7,978,182 | |
Net increase in net assets resulting from operations | | $ | 8,308,471 | |
* | Relates to Trustees not deemed “interested persons” within the meaning of Section 2(a)(19) of the 1940 Act. |
SEE NOTES TO FINANCIAL STATEMENTS. | THE GUGGENHEIM FUNDS ANNUAL REPORT | 95 |
STYLEPLUS—MID GROWTH FUND | |
STATEMENTS OF CHANGES IN NET ASSETS |
| | | Year Ended
September 30,
2016 | | | Year Ended
September 30,
2015 | |
Increase (Decrease) in Net Assets from Operations: | | | | | | |
Net investment income | | $ | 330,289 | | | $ | 82,187 | |
Net realized gain (loss) on investments | | | (2,408,876 | ) | | | 11,053,603 | |
Net change in unrealized appreciation (depreciation) on investments | | | 10,387,058 | | | | (9,948,308 | ) |
Net increase in net assets resulting from operations | | | 8,308,471 | | | | 1,187,482 | |
| | | | | | | | | |
Distributions to shareholders from: | | | | | | | | |
Net investment income | | | | | | | | |
A-Class | | | (86,688 | ) | | | — | |
P-Class | | | (63 | ) | | | — | |
Institutional Class | | | (170 | ) | | | — | |
Net realized gains | | | | | | | | |
A-Class | | | (9,333,165 | ) | | | (8,445,226 | ) |
B-Class | | | — | | | | (244,616 | ) |
C-Class | | | (773,702 | ) | | | (583,423 | ) |
P-Class | | | (1,713 | ) | | | — | * |
Institutional Class | | | (7,288 | ) | | | (5,903 | ) |
Total distributions to shareholders | | | (10,202,789 | ) | | | (9,279,168 | ) |
| | | | | | | | | |
Capital share transactions: | | | | | | | | |
Proceeds from sale of shares | | | | | | | | |
A-Class | | | 3,894,517 | | | | 7,359,683 | |
B-Class | | | — | | | | 450 | |
C-Class | | | 584,068 | | | | 1,397,441 | |
P-Class | | | 82,974 | | | | 12,000 | * |
Institutional Class | | | 94,989 | | | | 57,374 | |
Distributions reinvested | | | | | | | | |
A-Class | | | 9,015,453 | | | | 8,149,102 | |
B-Class | | | — | | | | 243,630 | |
C-Class | | | 758,694 | | | | 567,893 | |
P-Class | | | 1,776 | | | | — | * |
Institutional Class | | | 6,154 | | | | 3,831 | |
Cost of shares redeemed | | | | | | | | |
A-Class | | | (12,325,038 | ) | | | (12,353,481 | ) |
B-Class | | | — | | | | (1,780,631 | ) |
C-Class | | | (2,028,207 | ) | | | (913,759 | ) |
P-Class | | | (272 | ) | | | — | * |
Institutional Class | | | (40,892 | ) | | | (31,110 | ) |
Net increase from capital share transactions | | | 44,216 | | | | 2,712,423 | |
Net decrease in net assets | | | (1,850,102 | ) | | | (5,379,263 | ) |
| | | | | | | | | |
Net assets: | | | | | | | | |
Beginning of year | | | 78,004,859 | | | | 83,384,122 | |
End of year | | $ | 76,154,757 | | | $ | 78,004,859 | |
Undistributed net investment income at end of year | | $ | 259,567 | | | $ | 86,921 | |
96 | THE GUGGENHEIM FUNDS ANNUAL REPORT | SEE NOTES TO FINANCIAL STATEMENTS. |
STYLEPLUS—MID GROWTH FUND | |
STATEMENTS OF CHANGES IN NET ASSETS (concluded) |
| | | Year Ended
September 30,
2016 | | | Year Ended
September 30,
2015 | |
Capital share activity: | | | | | | |
Shares sold | | | | | | |
A-Class | | | 98,799 | | | | 162,640 | |
B-Class | | | — | | | | 15 | |
C-Class | | | 19,452 | | | | 39,105 | |
P-Class | | | 2,227 | | | | 262 | |
Institutional Class | | | 2,436 | | | | 1,231 | |
Shares issued from reinvestment of distributions | | | | | | | | |
A-Class | | | 236,875 | | | | 187,770 | |
B-Class | | | — | | | | 8,692 | |
C-Class | | | 26,225 | | | | 16,446 | |
P-Class | | | 47 | | | | — | |
Institutional Class | | | 161 | | | | 88 | |
Shares redeemed | | | | | | | | |
A-Class | | | (318,222 | ) | | | (274,859 | ) |
B-Class | | | — | | | | (61,741 | ) |
C-Class | | | (67,971 | ) | | | (25,764 | ) |
P-Class | | | (7 | ) | | | — | |
Institutional Class | | | (1,090 | ) | | | (683 | ) |
Net increase (decrease) in shares | | | (1,068 | ) | | | 53,202 | |
* | Since commencement of operations: May 1, 2015. |
SEE NOTES TO FINANCIAL STATEMENTS. | THE GUGGENHEIM FUNDS ANNUAL REPORT | 97 |
STYLEPLUS—MID GROWTH FUND | |
This table is presented to show selected data for a share outstanding throughout each period and to assist shareholders in evaluating a Fund’s performance for the periods presented.
A-Class | | Year Ended
September 30,
2016 | | | Year Ended
September 30,
2015 | | | Year Ended
September 30,
2014 | | | Year Ended
September 30,
2013 | | | Year Ended
September 30,
2012 | |
Per Share Data | | | | | | | | | | | | | | | |
Net asset value, beginning of period | | $ | 41.49 | | | $ | 45.82 | | | $ | 43.54 | | | $ | 36.40 | | | $ | 28.67 | |
Income (loss) from investment operations: | |
Net investment income (loss)a | | | .19 | | | | .07 | | | | .16 | | | | (.16 | ) | | | (.25 | ) |
Net gain (loss) on investments (realized and unrealized) | | | 4.25 | | | | .63 | | | | 6.21 | | | | 7.30 | | | | 7.98 | |
Total from investment operations | | | 4.44 | | | | .70 | | | | 6.37 | | | | 7.14 | | | | 7.73 | |
Less distributions from: | |
Net investment income | | | (.05 | ) | | | — | | | | — | | | | — | | | | — | |
Net realized gains | | | (5.36 | ) | | | (5.03 | ) | | | (4.09 | ) | | | — | | | | — | |
Total distributions | | | (5.41 | ) | | | (5.03 | ) | | | (4.09 | ) | | | — | | | | — | |
Net asset value, end of period | | $ | 40.52 | | | $ | 41.49 | | | $ | 45.82 | | | $ | 43.54 | | | $ | 36.40 | |
| | |
Total Returnb | | | 11.55 | % | | | 1.04 | % | | | 15.61 | % | | | 19.62 | % | | | 26.96 | % |
Ratios/Supplemental Data | |
Net assets, end of period (in thousands) | | $ | 72,179 | | | $ | 73,178 | | | $ | 77,363 | | | $ | 70,767 | | | $ | 65,767 | |
Ratios to average net assets: | |
Net investment income (loss) | | | 0.48 | % | | | 0.16 | % | | | 0.36 | % | | | (0.40 | %) | | | (0.74 | %) |
Total expensesc | | | 1.45 | % | | | 1.47 | % | | | 1.67 | % | | | 1.57 | % | | | 1.62 | % |
Net expensesd | | | 1.43 | % | | | 1.47 | % | | | 1.65 | % | | | 1.57 | % | | | 1.62 | % |
Portfolio turnover rate | | | 61 | % | | | 75 | % | | | 112 | % | | | 214 | % | | | 149 | % |
C-Class | | Year Ended
September 30,
2016 | | | Year Ended
September 30,
2015 | | | Year Ended
September 30,
2014 | | | Year Ended
September 30,
2013 | | | Year Ended
September 30,
2012 | |
Per Share Data | | | | | | | | | | | | | | | |
Net asset value, beginning of period | | $ | 32.78 | | | $ | 37.48 | | | $ | 36.63 | | | $ | 30.92 | | | $ | 24.55 | |
Income (loss) from investment operations: | |
Net investment income (loss)a | | | (.12 | ) | | | (.25 | ) | | | (.20 | ) | | | (.45 | ) | | | (.46 | ) |
Net gain (loss) on investments (realized and unrealized) | | | 3.28 | | | | .58 | | | | 5.14 | | | | 6.16 | | | | 6.83 | |
Total from investment operations | | | 3.16 | | | | .33 | | | | 4.94 | | | | 5.71 | | | | 6.37 | |
Less distributions from: | |
Net realized gains | | | (5.36 | ) | | | (5.03 | ) | | | (4.09 | ) | | | — | | | | — | |
Total distributions | | | (5.36 | ) | | | (5.03 | ) | | | (4.09 | ) | | | — | | | | — | |
Net asset value, end of period | | $ | 30.58 | | | $ | 32.78 | | | $ | 37.48 | | | $ | 36.63 | | | $ | 30.92 | |
| | |
Total Returnb | | | 10.55 | % | | | 0.20 | % | | | 14.56 | % | | | 18.47 | % | | | 25.95 | % |
Ratios/Supplemental Data | |
Net assets, end of period (in thousands) | | $ | 3,760 | | | $ | 4,762 | | | $ | 4,329 | | | $ | 4,103 | | | $ | 4,346 | |
Ratios to average net assets: | |
Net investment income (loss) | | | (0.42 | %) | | | (0.68 | %) | | | (0.55 | %) | | | (1.36 | %) | | | (1.57 | %) |
Total expensesc | | | 2.34 | % | | | 2.31 | % | | | 2.57 | % | | | 2.53 | % | | | 2.45 | % |
Net expensesd | | | 2.32 | % | | | 2.31 | % | | | 2.55 | % | | | 2.53 | % | | | 2.45 | % |
Portfolio turnover rate | | | 61 | % | | | 75 | % | | | 112 | % | | | 214 | % | | | 149 | % |
98 | THE GUGGENHEIM FUNDS ANNUAL REPORT | SEE NOTES TO FINANCIAL STATEMENTS. |
STYLEPLUS—MID GROWTH FUND | |
FINANCIAL HIGHLIGHTS (continued) |
This table is presented to show selected data for a share outstanding throughout each period and to assist shareholders in evaluating a Fund’s performance for the periods presented.
P-Class | | Year Ended
September 30,
2016 | | | Period Ended
September 30,
2015e | |
Per Share Data | | | | | | |
Net asset value, beginning of period | | $ | 41.48 | | | $ | 45.96 | |
Income (loss) from investment operations: | |
Net investment income (loss)a | | | .26 | | | | — | f |
Net gain (loss) on investments (realized and unrealized) | | | 4.09 | | | | (4.48 | ) |
Total from investment operations | | | 4.35 | | | | (4.48 | ) |
Less distributions from: | |
Net investment income | | | (.20 | ) | | | — | |
Net realized gains | | | (5.36 | ) | | | — | |
Total distributions | | | (5.56 | ) | | | — | |
Net asset value, end of period | | $ | 40.27 | | | $ | 41.48 | |
| | |
Total Returnb | | | 11.36 | % | | | (9.75 | %) |
Ratios/Supplemental Data | |
Net assets, end of period (in thousands) | | $ | 102 | | | $ | 11 | |
Ratios to average net assets: | |
Net investment income (loss) | | | 0.69 | % | | | 0.00 | % |
Total expensesc | | | 1.39 | % | | | 1.49 | % |
Net expensesd | | | 1.35 | % | | | 1.49 | % |
Portfolio turnover rate | | | 61 | % | | | 75 | % |
SEE NOTES TO FINANCIAL STATEMENTS. | THE GUGGENHEIM FUNDS ANNUAL REPORT | 99 |
STYLEPLUS—MID GROWTH FUND | |
FINANCIAL HIGHLIGHTS (concluded) |
This table is presented to show selected data for a share outstanding throughout each period and to assist shareholders in evaluating a Fund’s performance for the periods presented.
Institutional Class | | Year Ended
September 30,
2016 | | | Year Ended
September 30,
2015 | | | Year Ended
September 30,
2014 | | | Year Ended
September 30,
2013 | | | Period Ended
September 30,
2012g | |
Per Share Data | | | | | | | | | | | | | | | |
Net asset value, beginning of period | | $ | 41.64 | | | $ | 45.96 | | | $ | 43.72 | | | $ | 36.46 | | | $ | 36.16 | |
Income (loss) from investment operations: | |
Net investment income (loss)a | | | .19 | | | | .11 | | | | .11 | | | | (.07 | ) | | | (.08 | ) |
Net gain (loss) on investments (realized and unrealized) | | | 4.25 | | | | .60 | | | | 6.22 | | | | 7.33 | | | | .38 | |
Total from investment operations | | | 4.44 | | | | .71 | | | | 6.33 | | | | 7.26 | | | | .30 | |
Less distributions from: | |
Net investment income | | | (.13 | ) | | | — | | | | — | | | | — | | | | — | |
Net realized gains | | | (5.36 | ) | | | (5.03 | ) | | | (4.09 | ) | | | — | | | | — | |
Total distributions | | | (5.49 | ) | | | (5.03 | ) | | | (4.09 | ) | | | — | | | | — | |
Net asset value, end of period | | $ | 40.59 | | | $ | 41.64 | | | $ | 45.96 | | | $ | 43.72 | | | $ | 36.46 | |
| | |
Total Returnb | | | 11.50 | % | | | 1.08 | % | | | 15.42 | % | | | 19.91 | % | | | 0.83 | % |
Ratios/Supplemental Data | |
Net assets, end of period (in thousands) | | $ | 113 | | | $ | 54 | | | $ | 30 | | | $ | 21 | | | $ | 10 | |
Ratios to average net assets: | |
Net investment income (loss) | | | 0.48 | % | | | 0.23 | % | | | 0.24 | % | | | (0.17 | %) | | | (0.41 | %) |
Total expensesc | | | 1.46 | % | | | 1.41 | % | | | 1.81 | % | | | 1.33 | % | | | 1.37 | % |
Net expensesd | | | 1.44 | % | | | 1.41 | % | | | 1.79 | % | | | 1.33 | % | | | 1.37 | % |
Portfolio turnover rate | | | 61 | % | | | 75 | % | | | 112 | % | | | 214 | % | | | 149 | % |
a | Net investment income (loss) per share was computed using average shares outstanding throughout the period. |
b | Total return does not reflect the impact of any applicable sales charges and has not been annualized. |
c | Does not include expenses of the underlying funds in which the Fund invests. |
d | Net expense information reflects the expense ratios after expense waivers. |
e | Since commencement of operations: May 1, 2015. Percentage amounts for the period, except total return and portfolio turnover rate, have been annualized. |
f | Net investment income is less than $0.01 per share. |
g | Since commencement of operations: March 1, 2012. Percentage amounts for the period, except total return and portfolio turnover rate, have been annualized. |
100 | THE GUGGENHEIM FUNDS ANNUAL REPORT | SEE NOTES TO FINANCIAL STATEMENTS. |
MANAGERS’ COMMENTARY (Unaudited) | September 30, 2016 |
To Our Shareholders
Guggenheim World Equity Income Fund (the “Fund”) is managed by a team of seasoned professionals, including Farhan Sharaff, Senior Managing Director and Assistant Chief Investment Officer, Equities, and Portfolio Manager; Ole Jakob Wold, Managing Director and Portfolio Manager; and Scott Hammond, Managing Director and Portfolio Manager. In the following paragraphs, the investment team discusses performance for the fiscal year ended September 30, 2016.
For the one year period ended September 30, 2016, the Guggenheim World Equity Income Fund returned 12.85%1, compared with the 11.37% return of its benchmark, the MSCI World Index.
The Fund seeks to deliver superior risk-adjusted returns by taking advantage of market inefficiencies that, at times, misprice stable companies. To identify the degree to which the market could potentially reward stability and other factors, the Fund’s investment team distills the global equity market down to 60 discrete fundamental stock characteristics which it uses to rank stocks it considers for the portfolio.
The Fund seeks to invest sensibly in a world with a rising number of risks; its focus on stable companies (those with factor characteristics like strong balance sheets, attractive earnings, healthy margins and lower market volatility) is designed to offer protection when the market sells off, but presents a challenge when companies lacking in these characteristics outperform.
Performance Review
The Fund benefited from good stock selection in Financials and Health Care. While the Fund is overweight defensive sectors and underweight cyclical sectors, it is near market weight in Health Care, and the Fund’s holdings gained more than twice the Index holdings over the period. Leading the sector’s impact on overall performance was the Fund’s largest holding, Johnson & Johnson, which returned almost 30% during the period.
A key factor in the outperformance of the Financials sector was the Fund’s increased exposure to European banks during the dislocation caused by the Brexit vote. We took advantage of the turmoil to buy quality companies that sold off in sympathy as a result of negative sentiment towards the entire sector.
The leading detractor from performance for the period was the underweight in Materials and poor stock selection in the Consumer Discretionary sector, where stocks historically tend to have higher volatility and lower yields than other sectors, thus not attractive candidates for inclusion in the Fund.
A strong patch of economic data in the U.S. in the last months of the period lifted economically sensitive securities in the Materials sector, along with Consumer Discretionary and Tech. Materials had also rallied strongly in February and March, led at that time by gold miners that saw substantial market gains in the first quarter on the back of a notable increase in gold prices.
A long-running source of the Fund’s positive excess return has been a consistent underweight to the Energy sector. This worked against the portfolio for much of the period, as crude rallied nearly 55% off January lows. Oil’s price may experience significant headwinds going forward in response to the recent increase in rig count, continued high inventory levels and increasing Iranian production.
Portfolio Positioning
Positioning relative to sectors shows that the cyclically defensive sectors of Utilities and Telecommunications Services were among the largest overweights for the period, while Consumer Discretionary and Energy were among the largest underweights. Of these stances, only the Energy underweight detracted from performance.
As the probability of a Fed rate hike in 2016 grew, the Fund reduced exposure in the Utilities and Telecom sectors. A year ago, the overweight was 9% and 8%, respectively. Today, active weights in these sectors are about 3.5%. Further, Utilities names being added have attractive yields north of 4% and trade at multiples south of 15 times earnings.
| | THE GUGGENHEIM FUNDS ANNUAL REPORT | 101 |
MANAGERS’ COMMENTARY (Unaudited)(concluded) | September 30, 2016 |
From a geographic perspective, the Fund’s largest overweight continued to be Australia, where markets gained in response to rising commodity prices. The Fund also benefited from a relatively large overweight to Japan. Equities there have performed well on a relative basis, driven by a surprisingly stronger currency on the back of easy monetary policy.
The largest underweights were Europe, the UK, and the U.S., although the Fund decreased its underweight position to European equities, and also added to the UK exposure in the Brexit aftermath.
We remain concerned about U.S. growth. The U.S. market has experienced roughly two and a half years of price appreciation that has been largely fueled by multiple expansion as opposed to increased corporate earnings. A significant decline in labor’s input to the economy as well as declining productivity has lowered the potential for growth going forward.
Performance displayed represents past performance which is no guarantee of future results.
1 | Performance figures are based on Class A shares and do not reflect taxes that a shareholder would pay on distributions or the redemption of shares. |
The opinions and forecast expressed may not actually come to pass. This information is subject to change at any time, based on market and other conditions, and should not be construed as a recommendation of any specific security or strategy.
102 | THE GUGGENHEIM FUNDS ANNUAL REPORT | |
PERFORMANCE REPORT AND FUND PROFILE (Unaudited) | September 30, 2016 |
WORLD EQUITY INCOME FUND
OBJECTIVE: Seeks to provide total return, comprised of capital appreciation and income.
Holdings Diversification (Market Exposure as % of Net Assets)

“Holdings Diversification (Market Exposure as % of Net Assets)” excludes any temporary cash investments.
COUNTRY DIVERSIFICATION
At September 30, 2016, the investment diversification of the Fund by country was as follows:
Country | % of Securities | Value |
United States | 54% | $48,088,080 |
United Kingdom | 8% | 7,057,673 |
Japan | 7% | 6,413,238 |
Canada | 5% | 4,382,163 |
Australia | 3% | 2,755,422 |
Switzerland | 3% | 2,701,038 |
Singapore | 3% | 2,697,796 |
Other | 17% | 14,428,473 |
Total Securities | 100% | $88,523,883 |
“Country Diversification” exclude any temporary cash or derivative investments.
Inception Dates: |
A-Class | October 1, 1993 |
C-Class | January 29, 1999 |
P-Class | May 1, 2015 |
Institutional Class | May 2, 2011 |
Ten Largest Holdings (% of Total Net Assets) |
Johnson & Johnson | 1.8% |
AT&T, Inc. | 1.6% |
Verizon Communications, Inc. | 1.4% |
Pfizer, Inc. | 1.4% |
Merck & Company, Inc. | 1.4% |
HSBC Holdings plc | 1.3% |
Procter & Gamble Co. | 1.3% |
International Business Machines Corp. | 1.3% |
Roche Holding AG | 1.3% |
UnitedHealth Group, Inc. | 1.2% |
Top Ten Total | 14.0% |
| | |
“Ten Largest Holdings” excludes any temporary cash or derivative investments. |
| | THE GUGGENHEIM FUNDS ANNUAL REPORT | 103 |
PERFORMANCE REPORT AND FUND PROFILE (Unaudited)(concluded) | September 30, 2016 |
Cumulative Fund Performance*

Average Annual Returns*
Periods Ended September 30, 2016
| | 1 Year | 5 Year | 10 Year |
A-Class Shares | 12.85% | 9.21% | 2.88% |
A-Class Shares with sales charge† | 7.51% | 8.16% | 2.27% |
C-Class Shares | 12.05% | 8.42% | 2.11% |
C-Class Shares with CDSC‡ | 11.05% | 8.42% | 2.11% |
MSCI World Index | 11.37% | 11.63% | 4.47% |
| | | 1 Year | Since Inception
(05/01/15) |
P-Class Shares | | 13.73% | 2.74% |
MSCI World Index | | 11.37% | -0.40% |
| | 1 Year | 5 Year | Since Inception
(05/02/11) |
Institutional Class Shares | 13.11% | 9.34% | 3.83% |
MSCI World Index | 11.37% | 11.63% | 6.26% |
* | The performance data above represents past performance that is not predictive of future results. The investment return and principal value of an investment in the Fund will fluctuate so that an investor’s shares, when redeemed, may be worth more or less than their original cost. Returns are historical and include changes in principal and reinvested dividends and capital gains and do not reflect the effect of taxes. The MSCI World Index is an unmanaged index and, unlike the Fund, has no management fees or operating expenses to reduce its reported return. The graph is based on A-Class shares only; performance for C-Class, P-Class and Institutional Class will vary due to differences in fee structures. |
† | Effective February 22, 2011, the maximum sales charge decreased from 5.75% to 4.75%. A 5.75% maximum sales charge is used in the calculation of the 10 Year average annual return (based on subscriptions made prior to February 22, 2011), and a 4.75% maximum sales charge will be used to calculate performance for periods based on subscriptions made on or after February 22, 2011. |
‡ | Fund returns include a CDSC of 1% if redeemed within 12 months of purchase. |
104 | THE GUGGENHEIM FUNDS ANNUAL REPORT | |
SCHEDULE OF INVESTMENTS | September 30, 2016 |
WORLD EQUITY INCOME FUND | |
| | | Shares | | | Value | |
| | | | | | | |
COMMON STOCKS† - 99.5% | |
| | | | | | | |
Consumer, Non-cyclical - 26.4% | |
Johnson & Johnson | | | 13,700 | | | $ | 1,618,380 | |
Pfizer, Inc. | | | 36,000 | | | | 1,219,319 | |
Merck & Company, Inc. | | | 19,500 | | | | 1,216,995 | |
Procter & Gamble Co. | | | 12,648 | | | | 1,135,177 | |
Roche Holding AG | | | 4,500 | | | | 1,116,407 | |
UnitedHealth Group, Inc. | | | 7,900 | | | | 1,106,000 | |
PepsiCo, Inc. | | | 9,761 | | | | 1,061,704 | |
GlaxoSmithKline plc | | | 46,600 | | | | 992,537 | |
Altria Group, Inc. | | | 14,426 | | | | 912,155 | |
Eli Lilly & Co. | | | 10,400 | | | | 834,704 | |
Automatic Data Processing, Inc. | | | 9,100 | | | | 802,620 | |
Diageo plc | | | 26,300 | | | | 753,650 | |
Sysco Corp. | | | 14,516 | | | | 711,429 | |
Kimberly-Clark Corp. | | | 5,588 | | | | 704,870 | |
Reynolds American, Inc. | | | 14,450 | | | | 681,318 | |
Clorox Co. | | | 5,221 | | | | 653,565 | |
Transurban Group | | | 74,100 | | | | 644,891 | |
Dr Pepper Snapple Group, Inc. | | | 7,042 | | | | 643,005 | |
Nissin Foods Holdings Company Ltd. | | | 10,318 | | | | 623,730 | |
Woolworths Ltd. | | | 34,380 | | | | 612,364 | |
Cardinal Health, Inc. | | | 7,400 | | | | 574,980 | |
Wm Morrison Supermarkets plc | | | 195,395 | | | | 551,689 | |
Otsuka Holdings Company Ltd. | | | 10,500 | | | | 475,169 | |
Novartis AG | | | 6,000 | | | | 471,887 | |
Philip Morris International, Inc. | | | 4,736 | | | | 460,434 | |
Asahi Group Holdings Ltd. | | | 10,667 | | | | 385,634 | |
Singapore Press Holdings Ltd.* | | | 128,200 | | | | 358,164 | |
ConAgra Foods, Inc. | | | 6,000 | | | | 282,660 | |
Hutchison Port Holdings Trust — Class U | | | 616,900 | | | | 274,521 | |
General Mills, Inc. | | | 3,827 | | | | 244,469 | |
Takeda Pharmaceutical Company Ltd. | | | 5,100 | | | | 242,565 | |
H&R Block, Inc. | | | 10,400 | | | | 240,760 | |
Coty, Inc. — Class A* | | | 8,719 | | | | 204,900 | |
Imperial Brands plc | | | 3,000 | | | | 154,512 | |
Atlantia SpA | | | 6,000 | | | | 152,249 | |
Colgate-Palmolive Co. | | | 1,855 | | | | 137,530 | |
RELX N.V. | | | 7,200 | | | | 129,361 | |
Anthem, Inc. | | | 400 | | | | 50,124 | |
Henry Schein, Inc.* | | | 300 | | | | 48,894 | |
Abbott Laboratories | | | 1,000 | | | | 42,290 | |
Total Consumer, Non-cyclical | | | | | | | 23,527,612 | |
| | | | | | | | | |
Financial - 23.9% | |
HSBC Holdings plc* | | | 158,900 | | | | 1,191,861 | |
Wells Fargo & Co. | | | 24,800 | | | | 1,098,144 | |
U.S. Bancorp | | | 21,000 | | | | 900,690 | |
Nordea Bank AB | | | 88,900 | | | | 882,341 | |
Marsh & McLennan Companies, Inc. | | | 11,500 | | | | 773,375 | |
Swedbank AB — Class A | | | 31,100 | | | | 730,805 | |
Cincinnati Financial Corp. | | | 9,600 | | | | 724,032 | |
CME Group, Inc. — Class A | | | 6,900 | | | | 721,188 | |
Skandinaviska Enskilda Banken AB — Class A | | | 67,200 | | | | 675,192 | |
Everest Re Group Ltd. | | | 3,500 | | | | 664,895 | |
Vicinity Centres | | | 256,058 | | | | 621,305 | |
AGNC Investment Corp. | | | 29,500 | | | | 576,430 | |
Allianz AG | | | 3,700 | | | | 549,026 | |
Singapore Exchange Ltd. | | | 99,500 | | | | 540,642 | |
Simon Property Group, Inc. | | | 2,600 | | | | 538,226 | |
Gecina S.A. | | | 3,400 | | | | 535,254 | |
Annaly Capital Management, Inc. | | | 49,700 | | | | 521,850 | |
RenaissanceRe Holdings Ltd. | | | 4,300 | | | | 516,688 | |
Government Properties Trust, Inc.* | | | 129,600 | | | | 501,953 | |
People’s United Financial, Inc. | | | 31,600 | | | | 499,912 | |
Japan Retail Fund Investment Corp. | | | 200 | | | | 493,270 | |
Ascendas Real Estate Investment Trust | | | 259,200 | | | | 478,965 | |
First Capital Realty, Inc. | | | 28,200 | | | | 472,547 | |
CapitaLand Mall Trust | | | 283,900 | | | | 451,745 | |
H&R Real Estate Investment Trust | | | 25,800 | | | | 441,182 | |
Lloyds Banking Group plc | | | 622,500 | | | | 440,207 | |
Axis Capital Holdings Ltd. | | | 8,100 | | | | 440,073 | |
Liberty Property Trust | | | 10,300 | | | | 415,605 | |
T. Rowe Price Group, Inc. | | | 6,200 | | | | 412,300 | |
Societe Generale S.A. | | | 10,100 | | | | 349,203 | |
Sampo Oyj — Class A | | | 7,300 | | | | 324,718 | |
Daito Trust Construction Company Ltd. | | | 2,000 | | | | 319,018 | |
ING Groep N.V. | | | 25,800 | | | | 318,497 | |
CI Financial Corp. | | | 16,000 | | | | 307,024 | |
Chubb Ltd. | | | 2,200 | | | | 276,430 | |
Hang Seng Bank Ltd. | | | 15,000 | | | | 267,851 | |
Bank of Montreal | | | 4,000 | | | | 262,166 | |
Suncorp Group Ltd. | | | 26,800 | | | | 248,420 | |
Federal Realty Investment Trust | | | 1,400 | | | | 215,502 | |
Intact Financial Corp. | | | 2,900 | | | | 209,681 | |
CNP Assurances | | | 12,400 | | | | 208,303 | |
JPMorgan Chase & Co. | | | 1,100 | | | | 73,249 | |
WR Berkley Corp. | | | 1,000 | | | | 57,760 | |
Tryg A/S | | | 700 | | | | 14,046 | |
Total Financial | | | | | | | 21,261,571 | |
| | | | | | | | | |
Consumer, Cyclical - 11.0% | |
Home Depot, Inc. | | | 8,200 | | | | 1,055,176 | |
Wal-Mart Stores, Inc. | | | 13,375 | | | | 964,604 | |
Mitsui & Company Ltd. | | | 66,500 | | | | 911,871 | |
McDonald’s Corp. | | | 7,600 | | | | 876,736 | |
Costco Wholesale Corp. | | | 4,945 | | | | 754,162 | |
Compass Group plc | | | 37,100 | | | | 719,016 | |
Next plc* | | | 10,800 | | | | 668,529 | |
Darden Restaurants, Inc. | | | 9,700 | | | | 594,804 | |
Lawson, Inc. | | | 7,288 | | | | 572,806 | |
Sankyo Company Ltd. | | | 14,600 | | | | 495,281 | |
WW Grainger, Inc. | | | 2,200 | | | | 494,648 | |
Yue Yuen Industrial Holdings Ltd. | | | 115,500 | | | | 476,523 | |
Berkeley Group Holdings plc | | | 11,500 | | | | 384,479 | |
Fastenal Co. | | | 7,100 | | | | 296,638 | |
Wolseley plc | | | 5,100 | | | | 287,860 | |
FamilyMart UNY Holdings Company Ltd. | | | 2,456 | | | | 163,241 | |
Mitsubishi Corp. | | | 1,800 | | | | 40,560 | |
Total Consumer, Cyclical | | | | | | | 9,756,934 | |
SEE NOTES TO FINANCIAL STATEMENTS. | THE GUGGENHEIM FUNDS ANNUAL REPORT | 105 |
SCHEDULE OF INVESTMENTS (continued) | September 30, 2016 |
WORLD EQUITY INCOME FUND | |
| | | Shares | | | Value | |
| | | | | | | |
Communications - 10.0% | |
AT&T, Inc. | | | 34,100 | | | $ | 1,384,802 | |
Verizon Communications, Inc. | | | 24,000 | | | | 1,247,520 | |
Shaw Communications, Inc. — Class B | | | 31,800 | | | | 650,939 | |
Thomson Reuters Corp. | | | 15,300 | | | | 632,791 | |
Telstra Corp., Ltd. | | | 158,500 | | | | 628,443 | |
Alphabet, Inc. — Class C* | | | 700 | | | | 544,103 | |
CenturyLink, Inc. | | | 19,700 | | | | 540,371 | |
Singapore Telecommunications Ltd. | | | 175,800 | | | | 511,773 | |
BCE, Inc. | | | 10,500 | | | | 485,019 | |
HKT Trust & HKT Ltd. | | | 318,500 | | | | 448,419 | |
StarHub Ltd. | | | 175,000 | | | | 440,150 | |
Bezeq The Israeli Telecommunication Corporation Ltd. | | | 186,000 | | | | 350,725 | |
Amazon.com, Inc.* | | | 300 | | | | 251,193 | |
Motorola Solutions, Inc. | | | 3,100 | | | | 236,468 | |
TDC A/S* | | | 35,000 | | | | 205,836 | |
SES S.A. | | | 7,200 | | | | 176,593 | |
Frontier Communications Corp. | | | 40,700 | | | | 169,312 | |
Comcast Corp. — Class A | | | 200 | | | | 13,268 | |
Total Communications | | | | | | | 8,917,725 | |
| | | | | | | | | |
Technology - 9.3% | |
International Business Machines Corp. | | | 7,100 | | | | 1,127,835 | |
Apple, Inc. | | | 8,800 | | | | 994,840 | |
Accenture plc — Class A | | | 8,100 | | | | 989,577 | |
Canon, Inc. | | | 29,700 | | | | 856,249 | |
Seagate Technology plc | | | 20,400 | | | | 786,420 | |
Fidelity National Information Services, Inc. | | | 9,800 | | | | 754,894 | |
Paychex, Inc. | | | 13,000 | | | | 752,310 | |
CA, Inc. | | | 20,400 | | | | 674,832 | |
Microsoft Corp. | | | 9,100 | | | | 524,160 | |
Oracle Corporation Japan | | | 7,700 | | | | 432,060 | |
NTT Data Corp. | | | 8,100 | | | | 401,785 | |
Total Technology | | | | | | | 8,294,962 | |
| | | | | | | | | |
Utilities - 7.4% | |
CLP Holdings Ltd. | | | 76,737 | | | | 792,976 | |
PPL Corp. | | | 20,654 | | | | 714,009 | |
Southern Co. | | | 13,260 | | | | 680,238 | |
Duke Energy Corp. | | | 7,973 | | | | 638,159 | |
Red Electrica Corporation S.A. | | | 28,500 | | | | 614,819 | |
Terna Rete Elettrica Nazionale SpA | | | 115,000 | | | | 592,665 | |
Snam SpA | | | 102,800 | | | | 569,976 | |
Dominion Resources, Inc. | | | 5,568 | | | | 413,535 | |
DTE Energy Co. | | | 3,493 | | | | 327,189 | |
CenterPoint Energy, Inc. | | | 12,712 | | | | 295,300 | |
SCANA Corp. | | | 3,489 | | | | 252,499 | |
Sempra Energy | | | 1,799 | | | | 192,835 | |
FirstEnergy Corp. | | | 5,100 | | | | 168,708 | |
SSE plc | | | 7,200 | | | | 146,353 | |
Severn Trent plc | | | 3,600 | | | | 116,858 | |
Fortis, Inc. | | | 1,357 | | | | 43,647 | |
Total Utilities | | | | | | | 6,559,766 | |
| | | | | | | | | |
Industrial - 6.9% | |
3M Co. | | | 4,900 | | | | 863,527 | |
Lockheed Martin Corp. | | | 3,402 | | | | 815,528 | |
Waste Management, Inc. | | | 12,200 | | | | 777,872 | |
Republic Services, Inc. — Class A | | | 14,300 | | | | 721,435 | |
MTR Corporation Ltd. | | | 111,000 | | | | 611,086 | |
Garmin Ltd. | | | 11,400 | | | | 548,454 | |
Honeywell International, Inc. | | | 4,400 | | | | 512,996 | |
CH Robinson Worldwide, Inc. | | | 6,100 | | | | 429,806 | |
CAE, Inc. | | | 14,200 | | | | 201,683 | |
General Electric Co. | | | 6,000 | | | | 177,720 | |
Fraport AG Frankfurt Airport Services Worldwide | | | 3,000 | | | | 164,061 | |
Northrop Grumman Corp. | | | 700 | | | | 149,765 | |
BAE Systems plc | | | 20,200 | | | | 137,085 | |
Total Industrial | | | | | | | 6,111,018 | |
| | | | | | | | | |
Energy - 3.4% | |
BP plc | | | 156,000 | | | | 909,938 | |
Exxon Mobil Corp. | | | 9,500 | | | | 829,160 | |
Neste Oyj | | | 14,200 | | | | 605,165 | |
Eni SpA | | | 19,800 | | | | 285,129 | |
Apache Corp. | | | 3,600 | | | | 229,932 | |
Royal Dutch Shell plc — Class B | | | 6,400 | | | | 165,684 | |
Total Energy | | | | | | | 3,025,008 | |
| | | | | | | | | |
Basic Materials - 1.2% | |
Potash Corporation of Saskatchewan, Inc. | | | 41,500 | | | | 675,484 | |
Rio Tinto plc | | | 8,100 | | | | 270,281 | |
BHP Billiton plc | | | 8,200 | | | | 123,522 | |
Total Basic Materials | | | | | | | 1,069,287 | |
| | | | | | | | | |
Total Common Stocks | | | | | | | | |
(Cost $83,919,417) | | | | | | | 88,523,883 | |
| | | | | | | | | |
SHORT-TERM INVESTMENTS† - 1.1% | |
Goldman Sachs Financial Square Treasury Instruments Fund - Institutional Class 0.15%1 | | | 987,932 | | | | 987,932 | |
Total Short-Term Investments | | | | | | | | |
(Cost $987,932) | | | | | | | 987,932 | |
| | | | | | | | | |
Total Investments - 100.6% | | | | | | | | |
(Cost $84,907,349) | | | | | | $ | 89,511,815 | |
Other Assets & Liabilities, net - (0.6)% | | | | | | | (525,498 | ) |
Total Net Assets - 100.0% | | | | | | $ | 88,986,317 | |
| | | Contracts | | | Unrealized
Loss | |
| | | | | | | | | |
CURRENCY FUTURES CONTRACTS SOLD SHORT† | |
December 2016 Canadian Dollar
Futures Contracts
(Aggregate Value of
Contracts $4,347,960) | | | 57 | | | $ | (19,765 | ) |
106 | THE GUGGENHEIM FUNDS ANNUAL REPORT | SEE NOTES TO FINANCIAL STATEMENTS. |
SCHEDULE OF INVESTMENTS (concluded) | September 30, 2016 |
WORLD EQUITY INCOME FUND | |
* | Non-income producing security. |
† | Value determined based on Level 1 inputs — See Note 4. |
1 | Rate indicated is the 7 day yield as of September 30, 2016. |
| | plc — Public Limited Company |
| | See Sector Classification in Other Information section. |
The following table summarizes the inputs used to value the Fund’s investments at September 30, 2016 (See Note 4 in the Notes to Financial Statements):
Investments in Securities (Assets) | | Level 1 | | | Level 1 -
Other* | | | Level 2 | | | Level 3 | | | Total | |
Common Stocks | | $ | 88,523,883 | | | $ | — | | | $ | — | | | $ | — | | | $ | 88,523,883 | |
Short-Term Investments | | | 987,932 | | | | — | | | | — | | | | — | | | | 987,932 | |
Total | | $ | 89,511,815 | | | $ | — | | | $ | — | | | $ | — | | | $ | 89,511,815 | |
| | | | | | | | | | | | | | | | | | | | | |
Investments in Securities (Liabilities) | | Level 1 | | | Level 1 -
Other* | | | Level 2 | | | Level 3 | | | Total | |
Currency Futures Contracts | | $ | — | | | $ | 19,765 | | | $ | — | | | $ | — | | | $ | 19,765 | |
* | Other financial instruments include futures contracts which are reported as unrealized gain/loss at period end. |
Transfers between investment levels may occur as the markets fluctuate and/or the availability of data used in an investment’s valuation changes. Transfers between valuation levels, if any, are in comparison to the valuation levels at the end of the previous fiscal year, and are effective using the fair value as of the end of the previous fiscal period.
For the year ended September 30, 2016, there were no transfers between levels.
SEE NOTES TO FINANCIAL STATEMENTS. | THE GUGGENHEIM FUNDS ANNUAL REPORT | 107 |
STATEMENT OF ASSETS AND LIABILITIES |
September 30, 2016 |
Assets: | |
Investments, at value (cost $84,907,349) | | $ | 89,511,815 | |
Foreign currency, at value (cost $54,748) | | | 54,668 | |
Segregated cash with broker | | | 541,325 | |
Prepaid expenses | | | 9,494 | |
Receivables: | |
Fund shares sold | | | 143,166 | |
Dividends | | | 259,040 | |
Foreign taxes reclaim | | | 219,085 | |
Total assets | | | 90,738,593 | |
| | | | | |
Liabilities: | |
Overdraft due to custodian bank | | | 6,174 | |
Payable for: | |
Fund shares redeemed | | | 1,558,365 | |
Management fees | | | 63,205 | |
Distribution and service fees | | | 21,646 | |
Transfer agent/maintenance fees | | | 20,970 | |
Dividends distributed | | | 16,620 | |
Variation margin | | | 9,690 | |
Fund accounting/administration fees | | | 7,058 | |
Trustees’ fees* | | | 3,631 | |
Miscellaneous | | | 44,917 | |
Total liabilities | | | 1,752,276 | |
Net assets | | $ | 88,986,317 | |
| | | | | |
Net assets consist of: | |
Paid in capital | | $ | 106,303,861 | |
Accumulated net investment loss | | | (325,500 | ) |
Accumulated net realized loss on investments | | | (21,572,473 | ) |
Net unrealized appreciation on investments | | | 4,580,429 | |
Net assets | | $ | 88,986,317 | |
| | | | | |
A-Class: | |
Net assets | | $ | 80,574,729 | |
Capital shares outstanding | | | 5,949,994 | |
Net asset value per share | | $ | 13.54 | |
Maximum offering price per share (Net asset value divided by 95.25%) | | $ | 14.22 | |
| | | | | |
C-Class: | |
Net assets | �� | $ | 5,454,586 | |
Capital shares outstanding | | | 469,017 | |
Net asset value per share | | $ | 11.63 | |
| | | | | |
P-Class: | |
Net assets | | $ | 133,438 | |
Capital shares outstanding | | | 9,721 | |
Net asset value per share | | $ | 13.73 | |
| | | | | |
Institutional Class: | |
Net assets | | $ | 2,823,564 | |
Capital shares outstanding | | | 210,009 | |
Net asset value per share | | $ | 13.44 | |
STATEMENT OF OPERATIONS |
Year Ended September 30, 2016 |
Investment Income: | |
Dividends (net of foreign withholding tax of $247,502) | | $ | 3,367,203 | |
Other income | | | 1,742 | |
Total investment income | | | 3,368,945 | |
| | | | | |
Expenses: | |
Management fees | | | 639,497 | |
Transfer agent/maintenance fees: | |
A-Class | | | 87,469 | |
C-Class | | | 15,522 | |
P-Class | | | 75 | |
Institutional Class | | | 6,900 | |
Distribution and service fees: | |
A-Class | | | 196,765 | |
C-Class | | | 58,761 | |
P-Class | | | 781 | |
Fund accounting/administration fees | | | 119,420 | |
Registration fees | | | 78,411 | |
Custodian fees | | | 17,085 | |
Line of credit fees | | | 11,868 | |
Trustees’ fees* | | | 10,559 | |
Tax expense | | | 365 | |
Miscellaneous | | | 99,976 | |
Total expenses | | | 1,343,454 | |
Less: | |
Expenses waived by Adviser | | | (9,691 | ) |
Net expenses | | | 1,333,763 | |
Net investment income | | | 2,035,182 | |
| | | | | |
Net Realized and Unrealized Gain (Loss): | |
Net realized gain (loss) on: | |
Investments | | | (889,620 | ) |
Futures contracts | | | (736,835 | ) |
Foreign currency | | | (6,569 | ) |
Net realized loss | | | (1,633,024 | ) |
Net change in unrealized appreciation (depreciation) on: | |
Investments | | | 10,293,441 | |
Futures contracts | | | (19,765 | ) |
Foreign currency | | | 9,340 | |
Net change in unrealized appreciation (depreciation) | | | 10,283,016 | |
Net realized and unrealized gain | | | 8,649,992 | |
Net increase in net assets resulting from operations | | $ | 10,685,174 | |
* | Relates to Trustees not deemed “interested persons” within the meaning of Section 2(a)(19) of the 1940 Act. |
108 | THE GUGGENHEIM FUNDS ANNUAL REPORT | SEE NOTES TO FINANCIAL STATEMENTS. |
STATEMENTS OF CHANGES IN NET ASSETS |
| | | Year Ended
September 30,
2016 | | | Year Ended
September 30,
2015 | |
Increase (Decrease) in Net Assets from Operations: | | | | | | |
Net investment income | | $ | 2,035,182 | | | $ | 2,011,185 | |
Net realized loss on investments | | | (1,633,024 | ) | | | (1,277,947 | ) |
Net change in unrealized appreciation (depreciation) on investments | | | 10,283,016 | | | | (6,974,344 | ) |
Net increase (decrease) in net assets resulting from operations | | | 10,685,174 | | | | (6,241,106 | ) |
| | | | | | | | | |
Distributions to shareholders from: | | | | | | | | |
Net investment income | | | | | | | | |
A-Class | | | (1,891,462 | ) | | | (2,093,228 | ) |
B-Class | | | — | | | | (37,182 | ) |
C-Class | | | (96,485 | ) | | | (113,425 | ) |
P-Class | | | (3,486 | ) | | | (87 | )* |
Institutional Class | | | (76,190 | ) | | | (100,864 | ) |
Total distributions to shareholders | | | (2,067,623 | ) | | | (2,344,786 | ) |
| | | | | | | | | |
Capital share transactions: | | | | | | | | |
Proceeds from sale of shares | | | | | | | | |
A-Class | | | 18,583,958 | | | | 21,530,432 | |
B-Class | | | — | | | | 426 | |
C-Class | | | 1,520,462 | | | | 2,875,991 | |
P-Class | | | 1,274,125 | | | | 10,001 | * |
Institutional Class | | | 2,057,895 | | | | 5,710,071 | |
Distributions reinvested | | | | | | | | |
A-Class | | | 1,834,883 | | | | 2,035,374 | |
B-Class | | | — | | | | 37,174 | |
C-Class | | | 84,172 | | | | 89,045 | |
P-Class | | | 3,486 | | | | 87 | * |
Institutional Class | | | 39,956 | | | | 44,847 | |
Cost of shares redeemed | | | | | | | | |
A-Class | | | (21,141,116 | ) | | | (21,295,826 | ) |
B-Class | | | — | | | | (1,916,762 | ) |
C-Class | | | (2,663,968 | ) | | | (1,746,534 | ) |
P-Class | | | (1,141,200 | ) | | | — | * |
Institutional Class | | | (4,137,425 | ) | | | (1,698,989 | ) |
Net increase (decrease) from capital share transactions | | | (3,684,772 | ) | | | 5,675,337 | |
Net increase (decrease) in net assets | | | 4,932,779 | | | | (2,910,555 | ) |
| | | | | | | | | |
Net assets: | | | | | | | | |
Beginning of year | | | 84,053,538 | | | | 86,964,093 | |
End of year | | $ | 88,986,317 | | | $ | 84,053,538 | |
Accumulated net investment loss at end of year | | $ | (325,500 | ) | | $ | (288,845 | ) |
SEE NOTES TO FINANCIAL STATEMENTS. | THE GUGGENHEIM FUNDS ANNUAL REPORT | 109 |
STATEMENTS OF CHANGES IN NET ASSETS (concluded) |
| | | Year Ended
September 30,
2016 | | | Year Ended
September 30,
2015 | |
Capital share activity: | | | | | | |
Shares sold | | | | | | |
A-Class | | | 1,431,215 | | | | 1,601,893 | |
B-Class | | | — | | | | 36 | |
C-Class | | | 135,606 | | | | 249,395 | |
P-Class | | | 98,351 | | | | 734 | * |
Institutional Class | | | 158,922 | | | | 430,264 | |
Shares issued from reinvestment of distributions | | | | | | | | |
A-Class | | | 138,084 | | | | 156,014 | |
B-Class | | | — | | | | 3,234 | |
C-Class | | | 7,362 | | | | 7,937 | |
P-Class | | | 265 | | | | 7 | * |
Institutional Class | | | 3,033 | | | | 3,463 | |
Shares redeemed | | | | | | | | |
A-Class | | | (1,610,092 | ) | | | (1,598,406 | ) |
B-Class | | | — | | | | (167,791 | ) |
C-Class | | | (236,515 | ) | | | (154,420 | ) |
P-Class | | | (89,636 | ) | | | — | * |
Institutional Class | | | (323,244 | ) | | | (130,120 | ) |
Net increase (decrease) in shares | | | (286,649 | ) | | | 402,240 | |
* | Since commencement of operations: May 1, 2015. |
110 | THE GUGGENHEIM FUNDS ANNUAL REPORT | SEE NOTES TO FINANCIAL STATEMENTS. |
This table is presented to show selected data for a share outstanding throughout each period and to assist shareholders in evaluating a Fund’s performance for the periods presented.
A-Class | | Year Ended
September 30,
2016 | | | Year Ended
September 30,
2015 | | | Year Ended
September 30,
2014 | | | Year Ended
September 30,
2013 | | | Year Ended
September 30,
2012 | |
Per Share Data | | | | | | | | | | | | | | | |
Net asset value, beginning of period | | $ | 12.28 | | | $ | 13.51 | | | $ | 12.60 | | | $ | 10.55 | | | $ | 9.70 | |
Income (loss) from investment operations: | |
Net investment income (loss)a | | | .31 | | | | .29 | | | | .38 | | | | .18 | | | | .15 | |
Net gain (loss) on investments (realized and unrealized) | | | 1.26 | | | | (1.18 | ) | | | .95 | | | | 2.16 | | | | .70 | |
Total from investment operations | | | 1.57 | | | | (.89 | ) | | | 1.33 | | | | 2.34 | | | | .85 | |
Less distributions from: | |
Net investment income | | | (.31 | ) | | | (.34 | ) | | | (.42 | ) | | | (.29 | ) | | | (— | )b |
Total distributions | | | (.31 | ) | | | (.34 | ) | | | (.42 | ) | | | (.29 | ) | | | (— | )b |
Net asset value, end of period | | $ | 13.54 | | | $ | 12.28 | | | $ | 13.51 | | | $ | 12.60 | | | $ | 10.55 | |
| | |
Total Returnc | | | 12.85 | % | | | (6.70 | %) | | | 10.62 | % | | | 22.58 | % | | | 8.82 | % |
Ratios/Supplemental Data | |
Net assets, end of period (in thousands) | | $ | 80,575 | | | $ | 73,568 | | | $ | 78,783 | | | $ | 65,966 | | | $ | 61,838 | |
Ratios to average net assets: | |
Net investment income (loss) | | | 2.36 | % | | | 2.21 | % | | | 2.81 | % | | | 1.59 | % | | | 1.45 | % |
Total expensesd | | | 1.48 | % | | | 1.48 | % | | | 1.66 | % | | | 1.93 | % | | | 2.05 | % |
Net expensese | | | 1.48 | %g | | | 1.43 | %g | | | 1.49 | %g | | | 1.59 | % | | | 1.63 | % |
Portfolio turnover rate | | | 51 | % | | | 131 | % | | | 131 | % | | | 154 | % | | | 41 | % |
C-Class | | Year Ended
September 30,
2016 | | | Year Ended
September 30,
2015 | | | Year Ended
September 30,
2014 | | | Year Ended
September 30,
2013 | | | Year Ended
September 30,
2012 | |
Per Share Data | | | | | | | | | | | | | | | |
Net asset value, beginning of period | | $ | 10.55 | | | $ | 11.61 | | | $ | 10.79 | | | $ | 9.01 | | | $ | 8.33 | |
Income (loss) from investment operations: | |
Net investment income (loss)a | | | .18 | | | | .17 | | | | .25 | | | | .08 | | | | .06 | |
Net gain (loss) on investments (realized and unrealized) | | | 1.09 | | | | (1.02 | ) | | | .81 | | | | 1.84 | | | | .62 | |
Total from investment operations | | | 1.27 | | | | (.85 | ) | | | 1.06 | | | | 1.92 | | | | .68 | |
Less distributions from: | |
Net investment income | | | (.19 | ) | | | (.21 | ) | | | (.24 | ) | | | (.14 | ) | | | — | |
Total distributions | | | (.19 | ) | | | (.21 | ) | | | (.24 | ) | | | (.14 | ) | | | — | |
Net asset value, end of period | | $ | 11.63 | | | $ | 10.55 | | | $ | 11.61 | | | $ | 10.79 | | | $ | 9.01 | |
| | |
Total Returnc | | | 12.05 | % | | | (7.40 | %) | | | 9.79 | % | | | 21.57 | % | | | 8.16 | % |
Ratios/Supplemental Data | |
Net assets, end of period (in thousands) | | $ | 5,455 | | | $ | 5,936 | | | $ | 5,337 | | | $ | 3,377 | | | $ | 3,015 | |
Ratios to average net assets: | |
Net investment income (loss) | | | 1.59 | % | | | 1.50 | % | | | 2.13 | % | | | 0.80 | % | | | 0.68 | % |
Total expensesd | | | 2.35 | % | | | 2.28 | % | | | 2.62 | % | | | 2.89 | % | | | 2.88 | % |
Net expensese | | | 2.23 | %g | | | 2.23 | %g | | | 2.24 | %g | | | 2.35 | % | | | 2.38 | % |
Portfolio turnover rate | | | 51 | % | | | 131 | % | | | 131 | % | | | 154 | % | | | 41 | % |
SEE NOTES TO FINANCIAL STATEMENTS. | THE GUGGENHEIM FUNDS ANNUAL REPORT | 111 |
FINANCIAL HIGHLIGHTS (continued) |
This table is presented to show selected data for a share outstanding throughout each period and to assist shareholders in evaluating a Fund’s performance for the periods presented.
P-Class | | Year Ended
September 30,
2016 | | | Period Ended
September 30,
2015f | |
Per Share Data | | | | | | |
Net asset value, beginning of period | | $ | 12.33 | | | $ | 13.62 | |
Income (loss) from investment operations: | |
Net investment income (loss)a | | | .33 | | | | .12 | |
Net gain (loss) on investments (realized and unrealized) | | | 1.35 | | | | (1.29 | ) |
Total from investment operations | | | 1.68 | | | | (1.17 | ) |
Less distributions from: | |
Net investment income | | | (.28 | ) | | | (.12 | ) |
Total distributions | | | (.28 | ) | | | (.12 | ) |
Net asset value, end of period | | $ | 13.73 | | | $ | 12.33 | |
| | |
Total Returnc | | | 13.73 | % | | | (8.64 | %) |
Ratios/Supplemental Data | |
Net assets, end of period (in thousands) | | $ | 133 | | | $ | 9 | |
Ratios to average net assets: | |
Net investment income (loss) | | | 2.58 | % | | | 2.14 | % |
Total expensesd | | | 1.33 | % | | | 3.54 | % |
Net expensese,g | | | 1.33 | % | | | 1.48 | % |
Portfolio turnover rate | | | 51 | % | | | 131 | % |
112 | THE GUGGENHEIM FUNDS ANNUAL REPORT | SEE NOTES TO FINANCIAL STATEMENTS. |
FINANCIAL HIGHLIGHTS (concluded) |
This table is presented to show selected data for a share outstanding throughout each period and to assist shareholders in evaluating a Fund’s performance for the periods presented.
Institutional Class | | Year Ended
September 30,
2016 | | | Year Ended
September 30,
2015 | | | Year Ended
September 30,
2014 | | | Year Ended
September 30,
2013 | | | Year Ended
September 30,
2012 | |
Per Share Data | | | | | | | | | | | | | | | |
Net asset value, beginning of period | | $ | 12.23 | | | $ | 13.45 | | | $ | 12.53 | | | $ | 10.50 | | | $ | 9.70 | |
Income (loss) from investment operations: | |
Net investment income (loss)a | | | .31 | | | | .36 | | | | .44 | | | | .28 | | | | .28 | |
Net gain (loss) on investments (realized and unrealized) | | | 1.28 | | | | (1.21 | ) | | | .90 | | | | 2.10 | | | | .52 | |
Total from investment operations | | | 1.59 | | | | (.85 | ) | | | 1.34 | | | | 2.38 | | | | .80 | |
Less distributions from: | |
Net investment income | | | (.38 | ) | | | (.37 | ) | | | (.42 | ) | | | (.35 | ) | | | (— | )b |
Total distributions | | | (.38 | ) | | | (.37 | ) | | | (.42 | ) | | | (.35 | ) | | | (— | )b |
Net asset value, end of period | | $ | 13.44 | | | $ | 12.23 | | | $ | 13.45 | | | $ | 12.53 | | | $ | 10.50 | |
| | |
Total Returnc | | | 13.11 | % | | | (6.42 | %) | | | 10.83 | % | | | 23.17 | % | | | 8.17 | % |
Ratios/Supplemental Data | |
Net assets, end of period (in thousands) | | $ | 2,824 | | | $ | 4,541 | | | $ | 911 | | | $ | 252 | | | $ | 90 | |
Ratios to average net assets: | |
Net investment income (loss) | | | 2.42 | % | | | 2.70 | % | | | 3.27 | % | | | 2.42 | % | | | 2.70 | % |
Total expensesd | | | 1.30 | % | | | 1.23 | % | | | 1.33 | % | | | 1.73 | % | | | 1.90 | % |
Net expensese | | | 1.22 | %g | | | 1.23 | %g | | | 1.23 | %g | | | 1.26 | % | | | 1.32 | % |
Portfolio turnover rate | | | 51 | % | | | 131 | % | | | 131 | % | | | 154 | % | | | 41 | % |
a | Net investment income (loss) per share was computed using average shares outstanding throughout the period. |
b | Distributions from net investment income are less than $0.01 per share. |
c | Total return does not reflect the impact of any applicable sales charges and has not been annualized. |
d | Does not include expenses of the underlying funds in which the Fund invests. |
e | Net expense information reflects the expense ratios after expense waivers and reimbursements, as applicable. |
f | Since commencement of operations: May 1, 2015. Percentage amounts for the period, except total return and portfolio turnover rate, have been annualized. |
g | Net expenses may include expenses that are excluded from the expense limitation agreement and recouped amounts. Excluding these expenses, the operating expense ratios for the periods presented would be: |
| | | 09/30/16 | 09/30/15 | 09/30/14 |
| | A-Class | 1.46% | 1.46% | 1.46% |
| | C-Class | 2.21% | 2.21% | 2.21% |
| | P-Class | 1.32% | 1.46% | — |
| | Institutional Class | 1.21% | 1.21% | 1.21% |
SEE NOTES TO FINANCIAL STATEMENTS. | THE GUGGENHEIM FUNDS ANNUAL REPORT | 113 |
NOTES TO FINANCIAL STATEMENTS |
1. Organization and Significant Accounting Policies
Organization
Guggenheim Funds Trust (the “Trust”), a Delaware statutory trust, is registered with the SEC under the Investment Company Act of 1940 (“1940 Act”), as an open-ended investment company of the series type. Each series, in effect, is representing a separate Fund. The Trust is authorized to issue an unlimited number of shares. The Trust accounts for the assets of each Fund separately.
The Trust offers a combination of four separate classes of shares, A-Class shares, C-Class shares, P-Class shares and Institutional Class shares. Sales of shares of each Class are made without a front-end sales charge at the net asset value per share (“NAV”), with the exception of A-Class shares. A-Class shares are sold at the NAV, plus the applicable front-end sales charge. The sales charge varies depending on the amount purchased, but will not exceed 4.75%. A-Class share purchases of $1 million or more are exempt from the front-end sales charge but have a 1% contingent deferred sales charge (“CDSC”), if shares are redeemed within 12 months of purchase. B-Class shares previously offered have been converted to A-Class shares effective July 31, 2014 for the Alpha Opportunity Fund, and effective August 8, 2015 for the other funds in the Trust. C-Class shares have a 1% CDSC if shares are redeemed within 12 months of purchase. Institutional Class shares are offered primarily for direct investment by institutions such as pension and profit sharing plans, endowments, foundations and corporations. Institutional Class shares require a minimum initial investment of $2 million and a minimum account balance of $1 million. At September 30, 2016, the Trust consisted of nineteen funds.
This report covers the Alpha Opportunity Fund, Large Cap Value Fund, Market Neutral Real Estate Fund, Risk Managed Real Estate Fund, Small Cap Value Fund, StylePlus—Large Core Fund, StylePlus—Mid Growth Fund and World Equity Income Fund (the “Funds”), each a diversified investment company, with the exception of the Large Cap Value Fund, Market Neutral Real Estate Fund and Risk Managed Real Estate Fund, which are each a non-diversified investment company.
Guggenheim Investments (“GI”) provides advisory services, and Rydex Fund Services, LLC (“RFS”) provides transfer agent, administrative and accounting services to the Trust. Guggenheim Funds Distributors, LLC (“GFD”) acts as principal underwriter for the Trust. GI and GFD are affiliated entities; RFS ceased to be an affiliate of GI as of October 4, 2016, when it was acquired by MUFG Investor Services. In connection with its acquisition, RFS changed its name to MUFG Investor Services (US), LLC (“MUIS”). This change has no impact on the financial statements of the Funds.
Significant Accounting Policies
The Funds operate as investment companies and, accordingly, follow the investment company accounting and reporting guidance of the Financial Accounting Standards Board (“FASB”) Accounting Standards Codification Topic 946 Financial Services – Investment Companies.
The following significant accounting policies are in conformity with U.S. generally accepted accounting principles (“U.S. GAAP”) and are consistently followed by the Trust. This requires management to make estimates and assumptions that affect the reported amount of assets and liabilities, contingent assets and liabilities at the date of the financial statements, and the reported amounts of revenues and expenses during the reporting period. Actual results could differ from these estimates. All time references are based on Eastern Time.
The NAV of each Class of the Funds is calculated by dividing the market value of the Fund’s securities and other assets, less all liabilities, attributable to the Class by the number of outstanding shares of the Class.
A. The Board of Trustees of the Funds (the “Board”) has adopted policies and procedures for the valuation of the Funds’ investments (the “Valuation Procedures”). Pursuant to the Valuation Procedures, the Board has delegated to a valuation committee, consisting of representatives from Guggenheim’s investment management, fund administration, legal and compliance departments (the “Valuation Committee”), the day-to-day responsibility for implementing the Valuation Procedures, including, under most circumstances, the responsibility for determining the fair value of the Funds’ securities and/or other assets.
Valuations of the Funds’ securities are supplied primarily by pricing services appointed pursuant to the processes set forth in the Valuation Procedures. The Valuation Committee convenes monthly, or more frequently as needed, to review the valuation of all assets which have been fair valued for reasonableness. The Funds’ officers, through the Valuation Committee and consistent with the monitoring and review responsibilities set forth in the Valuation Procedures, regularly review procedures used and valuations provided by the pricing services.
If the pricing service cannot or does not provide a valuation for a particular investment or such valuation is deemed unreliable, such investment is fair valued by the Valuation Committee.
Equity securities listed on an exchange (New York Stock Exchange (“NYSE”) or American Stock Exchange) are valued at the last quoted sales price as of the close of business on the NYSE, usually 4:00 p.m. on the valuation date. Equity securities listed on
114 | THE GUGGENHEIM FUNDS ANNUAL REPORT | |
NOTES TO FINANCIAL STATEMENTS (continued) |
the NASDAQ market system are valued at the NASDAQ Official Closing Price on the valuation date, which may not necessarily represent the last sale price. If there has been no sale on such exchange or NASDAQ on a given day, the security is valued at the closing bid price on that day.
Generally, trading in foreign securities markets is substantially completed each day at various times prior to the close of the NYSE. The values of foreign securities are determined as of the close of such foreign markets or the close of the NYSE, if earlier. All investments quoted in foreign currencies are valued in U.S. dollars on the basis of the foreign currency exchange rates prevailing at the close of business. Investments in foreign securities may involve risks not present in domestic investments. The Valuation Committee will determine the current value of such foreign securities by taking into consideration certain factors which may include those discussed above, as well as the following factors, among others: the value of the securities traded on other foreign markets, ADR trading, closed-end fund trading, foreign currency exchange activity, and the trading prices of financial products that are tied to foreign securities. In addition, the Board has authorized the Valuation Committee and GI to use prices and other information supplied by a third party pricing vendor in valuing foreign securities.
Open-end investment companies (“mutual funds”) are valued at their NAV as of the close of business, on the valuation date. Exchange-traded funds (“ETFs”) and closed-end investment companies (“CEFs”) are valued at the last quoted sales price.
Debt securities with a maturity of greater than 60 days at acquisition are valued at prices that reflect broker/dealer supplied valuations or are obtained from independent pricing services, which may consider the trade activity, treasury spreads, yields or price of bonds of comparable quality, coupon, maturity, and type, as well as prices quoted by dealers who make markets in such securities. Short-term debt securities with a maturity of 60 days or less at acquisition are valued at amortized cost, provided such amount approximates market value.
The value of futures contracts is accounted for using the unrealized gain or loss on the contracts that is determined by marking the contracts to their current realized settlement prices. Financial futures contracts are valued at the 4:00 p.m. price on the valuation date. In the event that the exchange for a specific futures contract closes earlier than 4:00 p.m., the futures contract is valued at the Official Settlement Price of the exchange. However, the underlying securities from which the futures contract value is derived are monitored until 4:00 p.m. to determine if fair valuation would provide a more accurate valuation.
The values of OTC swap agreements entered into by a Fund are accounted for using the unrealized gains or losses on the agreements that are determined by marking the agreements to the last quoted value of the index that the swaps pertain to at the close of the NYSE. The swaps’ values are then adjusted to include dividends accrued, financing charges and/or interest associated with the swap agreements.
The value of equity swaps with custom portfolio baskets shall be computed by using the last exchange sale price for each underlying equity security within the swap agreement. A custom portfolio equity swap will be adjusted to include dividends accrued, financing charges and/or interest, as applicable, under the swap agreement.
Investments for which market quotations are not readily available are fair-valued as determined in good faith by GI under the direction of the Board using methods established or ratified by the Board. Valuations in accordance with these methods are intended to reflect each security’s (or asset’s) “fair value.” Each such determination is based on a consideration of all relevant factors, which are likely to vary from one pricing context to another. Examples of such factors may include, but are not limited to: market prices; sale prices; broker quotes; and models which derive prices based on inputs such as prices of securities with comparable maturities and characteristics, or based on inputs such as anticipated cash flows or collateral, spread over Treasuries, and other information analysis.
In connection with futures contracts and other derivative investments, such factors may include obtaining information as to how (a) these contracts and other derivative investments trade in the futures or other derivative markets, respectively, and (b) the securities underlying these contracts and other derivative investments trade in the cash market.
B. The Funds may purchase and sell interests in securities on a when-issued and delayed delivery basis, with payment and delivery scheduled for a future date. No income accrues to the Fund on such interests or securities in connection with such transactions prior to the date the Funds actually take delivery of such interests or securities. These transactions are subject to market fluctuations and are subject to the risk that the value at delivery may be more or less than the trade date purchase price. Although the Funds will generally purchase these securities with the intention of acquiring such securities, they may sell such securities before the settlement date.
C. When a Fund engages in a short sale of a security, an amount equal to the proceeds is reflected as an asset and an equivalent liability. The amount of the liability is subsequently marked-to-
| | THE GUGGENHEIM FUNDS ANNUAL REPORT | 115 |
NOTES TO FINANCIAL STATEMENTS (continued) |
market to reflect the market value of the short sale. The Fund maintains a segregated account of cash and/or securities as collateral for short sales.
Fees, if any, paid to brokers to borrow securities in connection with short sales are recorded as interest expense. In addition, the Fund must pay out the dividend rate of the equity or coupon rate of the obligation to the lender and record this as an expense. Short dividend or interest expense is a cost associated with the investment objective of short sales transactions, rather than an operational cost associated with the day-to-day management of any mutual fund. The Fund may also receive rebate income from the broker resulting from the investment of the proceeds from securities sold short.
D. Upon entering into a futures contract, a Fund deposits and maintains as collateral such initial margin as required by the exchange on which the transaction is affected. Pursuant to the contract, the Fund agrees to receive from or pay to the broker an amount of cash equal to the daily fluctuation in value of the contract. Such receipts or payments are known as variation margin and are recorded by the Fund as unrealized gains or losses. When the contract is closed, the Fund records a realized gain or loss equal to the difference between the value of the contract at the time it was opened and the value at the time it was closed.
E. Swap agreements are marked-to-market daily and the change, if any, is recorded as unrealized gain or loss. Payments received or made as a result of an agreement or termination of an agreement are recognized as realized gains or losses.
F. Security transactions are recorded on the trade date for financial reporting purposes. Realized gains and losses from securities transactions are recorded using the identified cost basis. Proceeds from lawsuits related to investment holdings are recorded as realized gains in the respective Fund. Dividend income is recorded on the ex-dividend date, net of applicable taxes withheld by foreign countries. Taxable non-cash dividends are recorded as dividend income. Interest income, including amortization of premiums and accretion of discounts, is accrued on a daily basis. Interest income also includes paydown gains and losses on mortgage-backed and asset-backed securities and senior and subordinated loans. Amendment fees are earned as compensation for evaluating and accepting changes to the original loan agreement and are recognized when received. Dividend income from REITs is recorded based on the income included in the distributions received from the REIT investments using published REIT classifications, including some management estimates when actual amounts are not available. Distributions received in excess of this estimated amount are recorded as a reduction of the cost of investments or reclassified to capital gains. The actual amounts of income, return of capital, and capital gains are only determined by each REIT after its fiscal year-end, and may differ from the estimated amounts.
G. Dividends from net investment income are declared quarterly in the World Equity Income Fund and Risk Managed Real Estate Fund. Dividends are reinvested in additional shares unless shareholders request payment in cash. Distributions of net investment income in the remaining Funds and distributions of net realized gains, if any, in all Funds are declared at least annually and recorded on the ex-dividend date and are determined in accordance with income tax regulations which may differ from U.S. GAAP.
H. Interest and dividend income, most expenses, all realized gains and losses, and all unrealized gains and losses are allocated to the classes based upon the value of the outstanding shares in each Class. Certain costs, such as distribution and service fees are charged directly to specific classes. In addition, certain expenses have been allocated to the individual Funds in the Trust on a pro rata basis upon the respective aggregate net assets of each Fund included in the Trust.
I. Under the fee arrangement with the custodian, the Funds may earn credits based on overnight custody cash balances. These credits are utilized to reduce related custodial expenses. The custodian fees disclosed in the Statement of Operations are before the reduction in expense from the related earnings credits, if any. For the year ended September 30, 2016, there were no earnings credits received.
J. The Funds may leave cash overnight in their cash account with the custodian. Periodically, a Fund may have cash due to the custodian bank as an overdraft balance. A fee is incurred on this overdraft, calculated by multiplying the overdraft by a rate based on the federal funds rate, which was 0.29% at September 30, 2016.
K. The accounting records of the Fund are maintained in U.S. dollars. All assets and liabilities initially expressed in foreign currencies are converted into U.S. dollars at prevailing exchange rates. Purchases and sales of investment securities, dividend and interest income, and certain expenses are translated at the rates of exchange prevailing on the respective dates of such transactions.
Changes in the relationship of these foreign currencies to the U.S. dollar can significantly affect the value of the investments and earnings of the Funds. Foreign investments may also subject the Funds to foreign government exchange restrictions, expropriation, taxation or other political, social or economic developments, all of which could affect the market and/or credit risk of the investments.
The Funds do not isolate that portion of the results of operations resulting from changes in the foreign exchange rates on investments from the fluctuations arising from changes in the market prices of securities held. Such fluctuations are included with the net realized and unrealized gain or loss on investments.
116 | THE GUGGENHEIM FUNDS ANNUAL REPORT | |
NOTES TO FINANCIAL STATEMENTS (continued) |
Reported net realized foreign exchange gains and losses arise from sales of foreign currencies and currency gains or losses realized between the trade and settlement dates on investment transactions. Net unrealized exchange gains and losses arise from changes in the fair values of assets and liabilities other than investments in securities at the fiscal period end, resulting from changes in exchange rates.
L. Under the Funds’ organizational documents, the Trustees and Officers are indemnified against certain liabilities arising out of the performance of their duties to the Trust. In addition, throughout the normal course of business, the Funds enter into contracts that contain a variety of representations and warranties which provide general indemnifications. The Funds’ maximum exposure under these arrangements is unknown, as this would involve future claims that may be made against the Funds and/or their affiliates that have not yet occurred. However, based on experience, the Funds expect the risk of loss to be remote.
2. Financial Instruments and Derivatives
As part of their investment strategy, the Funds utilize short sales and a variety of derivative instruments. These investments involve, to varying degrees, elements of market risk and risks in excess of the amounts recognized in the Statements of Assets and Liabilities. Valuation and accounting treatment of these instruments can be found under Significant Accounting Policies in Note 1 of these Notes to Financial Statements.
Short Sales
A short sale is a transaction in which a Fund sells a security it does not own. If the security sold short decreases in price between the time the Fund sells the security and closes its short position, the Fund will realize a gain on the transaction. Conversely, if the security increases in price during the period, the Fund will realize a loss on the transaction. The risk of such price increases is the principal risk of engaging in short sales.
Derivatives
Derivatives are instruments whose values depend on, or are derived from, in whole or in part, the value of one or more other assets, such as securities, currencies, commodities or indices. Derivative instruments may be used to increase investment flexibility (including to maintain cash reserves while maintaining exposure to certain other assets), for risk management (hedging) purposes, to facilitate trading, to reduce transaction costs and to pursue higher investment returns. Derivative instruments may also be used to mitigate certain investment risks, such as foreign currency exchange rate risk, interest rate risk and credit risk. U.S. GAAP requires disclosures to enable investors to better understand how and why a Fund uses derivative instruments, how these derivative instruments are accounted for and their effects on the Fund’s financial position and results of operations. The Funds may utilize derivatives for the following purposes:
Duration: the use of an instrument to manage the interest rate risk of a portfolio.
Hedge: an investment made in order to reduce the risk of adverse price movements in a security, by taking an offsetting position to protect against broad market moves.
Income: the use of any instrument that distributes cash flows typically based upon some rate of interest.
Index Exposure: the use of an instrument to obtain exposure to a listed or other type of index.
Leverage: gaining total exposure to equities or other assets on the long and short sides at greater than 100% of invested capital.
Speculation: the use of an instrument to express macro-economic and other investment views.
For any Fund whose investment strategy consistently involves applying leverage, the value of the Fund’s shares will tend to increase or decrease more than the value of any increase or decrease in the underlying index or other asset. In addition, because an investment in derivative instruments generally requires a small investment relative to the amount of investment exposure assumed, an opportunity for increased net income is created; but, at the same time, leverage risk will increase. The Fund’s use of leverage, through borrowings or instruments such as derivatives, may cause the Fund to be more volatile and riskier than if they had not been leveraged.
Futures
A futures contract is an agreement to purchase (long) or sell (short) an agreed amount of securities or other instruments at a set price for delivery at a future date. There are significant risks associated with a Fund’s use of futures contracts, including (i) there may be an imperfect or no correlation between the changes in market value of the underlying asset and the prices of futures contracts; (ii) there may not be a liquid secondary market for a futures contract; (iii) trading restrictions or limitations may be imposed by an exchange; and (iv) government regulations may restrict trading in futures contracts. When investing in futures, there is minimal counterparty credit risk to a Fund because futures are exchange-traded and the exchange’s clearinghouse, as counterparty to all exchange-traded futures, guarantees against default. Cash deposits are shown as segregated cash with broker on the Statements of Assets and Liabilities; securities held as collateral are noted on the Schedules of Investments.
| | THE GUGGENHEIM FUNDS ANNUAL REPORT | 117 |
NOTES TO FINANCIAL STATEMENTS (continued) |
The following table represents the Funds’ use and volume of futures on a quarterly basis:
| | | | Average Notional | |
Fund | Use | | Long | | | Short | |
StylePlus—Large Core Fund | Index exposure | | $ | 2,242,422 | | | $ | — | |
StylePlus—Mid Growth Fund | Index exposure | | | 758,455 | | | | — | |
World Equity Income Fund | Hedge | | | — | | | | 4,878,803 | |
Swaps
A swap is an agreement that obligates two parties to exchange a series of cash flows at specified intervals based upon or calculated by reference to changes in specified prices or rates for a specified amount of an underlying asset. A Fund utilizing OTC swaps bears the risk of loss of the amount expected to be received under a swap agreement in the event of the default or bankruptcy of a swap agreement counterparty or if the underlying asset declines in value. Certain standardized swaps are subject to mandatory central clearing. Central clearing generally reduces counterparty credit risk and increases liquidity, but central clearing does not make swap transactions risk-free. Additionally, there is no guarantee that a Fund or an underlying fund could eliminate its exposure under an outstanding swap agreement by entering into an offsetting swap agreement with the same or another party.
Total return swaps involve commitments where single or multiple cash flows are exchanged based on the price of an underlying reference asset (such as index or basket) or a fixed or variable interest rate. Index swaps will usually be computed based on the current index value as of the close of regular trading on the NYSE or other exchange, with the swap value being adjusted to include dividends accrued, financing charges and/or interest associated with the swap agreement. A fund utilizing a total return index swap bears the risk of loss of the amount expected to be received under a swap agreement in the event of the default or bankruptcy of a swap agreement counterparty or if the underlying index declines in value.
The following table represents the Funds’ use and volume of total return swaps on a quarterly basis:
| | | | Average Notional | |
Fund | Use | | Long | | | Short | |
Alpha Opportunity Fund | Hedge, Leverage | | $ | 47,377,041 | | | $ | 56,311,969 | |
Market Neutral Real Estate Fund | Leverage | | | — | | | | 4,784,466 | |
Risk Managed Real Estate Fund | Leverage | | | 31,628,056 | | | | 32,087,421 | |
StylePlus—Large Core Fund | Index exposure | | | 157,172,226 | | | | — | |
StylePlus—Mid Growth Fund | Index exposure | | | 62,815,188 | | | | — | |
Derivative Investment Holdings Categorized by Risk Exposure
The following is a summary of the location of derivative investments on the Funds’ Statements of Assets and Liabilities as of September 30, 2016:
Derivative Investment Type | Asset Derivatives | Liability Derivatives |
Equity/Currency contracts | Variation margin | Variation margin |
| Unrealized appreciation on swap agreements | Unrealized depreciation on swap agreements |
The following table sets forth the fair value of the Funds’ derivative investments categorized by primary risk exposure at September 30, 2016:
Asset Derivative Investments Value | |
Fund | | Futures
Equity
Contracts* | | | Swaps
Equity
Contracts | | | Futures
Currency
Contracts* | | | Total Value at
September 30,
2016 | |
Alpha Opportunity Fund | | $ | — | | | $ | 1,705,536 | | | $ | — | | | $ | 1,705,536 | |
Risk Managed Real Estate Fund | | | — | | | | 1,959,554 | | | | — | | | | 1,959,554 | |
StylePlus—Large Core Fund | | | 39,833 | | | | 5,724,743 | | | | — | | | | 5,764,576 | |
StylePlus—Mid Growth Fund | | | — | | | | 2,662,190 | | | | — | | | | 2,662,190 | |
118 | THE GUGGENHEIM FUNDS ANNUAL REPORT | |
NOTES TO FINANCIAL STATEMENTS (continued) |
Liability Derivative Investments Value | |
Fund | | Futures
Equity
Contracts* | | | Swaps
Equity
Contracts | | | Futures
Currency
Contracts* | | | Total Value at
September 30,
2016 | |
Alpha Opportunity Fund | | $ | — | | | $ | 3,615,837 | | | $ | — | | | $ | 3,615,837 | |
Market Neutral Real Estate Fund | | | — | | | | 264,835 | | | | — | | | | 264,835 | |
Risk Managed Real Estate Fund | | | — | | | | 1,424,342 | | | | — | | | | 1,424,342 | |
World Equity Income Fund | | | — | | | | — | | | | 19,765 | | | | 19,765 | |
* | Includes cumulative appreciation (depreciation) of futures contracts as reported on the Schedules of Investments. Only current day’s variation margin is reported within the Statements of Assets and Liabilities. |
The following is a summary of the location of derivative investments on the Funds’ Statements of Operations for the year ended September 30, 2016:
Derivative Investment Type | Location of Gain (Loss) on Derivatives |
Equity/Currency contracts | Net realized gain (loss) on futures contracts |
| Net realized gain (loss) on swap agreements |
| Net change in unrealized appreciation (depreciation) on futures contracts |
| Net change in unrealized appreciation (depreciation) on swap agreements |
The following is a summary of the Funds’ realized gain (loss) and change in unrealized appreciation (depreciation) on derivative investments recognized on the Statements of Operations categorized by primary risk exposure for the year ended September 30, 2016:
Realized Gain (Loss) on Derivative Investments Recognized on the Statements of Operations | |
Fund | | Futures
Equity
Contracts | | | Swaps
Equity
Contracts | | | Futures
Currency
Contracts | | | Swaps
Currency
Contracts | | | Total | |
Alpha Opportunity Fund | | $ | — | | | $ | (2,017,258 | ) | | $ | — | | | $ | — | | | $ | (2,017,258 | ) |
Market Neutral Real Estate Fund | | | — | | | | (660,631 | ) | | | — | | | | — | | | | (660,631 | ) |
Risk Managed Real Estate Fund | | | — | | | | (1,524,233 | ) | | | — | | | | — | | | | (1,524,233 | ) |
StylePlus—Large Core Fund | | | 298,620 | | | | 2,699,260 | | | | — | | | | — | | | | 2,997,880 | |
StylePlus—Mid Growth Fund | | | 40,888 | | | | (2,839,895 | ) | | | — | | | | — | | | | (2,799,007 | ) |
World Equity Income Fund | | | (200 | ) | | | — | | | | (736,635 | ) | | | — | | | | (736,835 | ) |
Change in Unrealized Appreciation(Depreciation) on Derivative Investments Recognized on the Statements of Operations | |
Fund | | Futures
Equity
Contracts | | | Swaps
Equity
Contracts | | | Futures
Currency
Contracts | | | Swaps
Currency
Contracts | | | Total | |
Alpha Opportunity Fund | | $ | — | | | $ | (1,825,091 | ) | | $ | — | | | $ | — | | | $ | (1,825,091 | ) |
Market Neutral Real Estate Fund | | | — | | | | (264,835 | ) | | | — | | | | — | | | | (264,835 | ) |
Risk Managed Real Estate Fund | | | — | | | | 709,117 | | | | — | | | | — | | | | 709,117 | |
StylePlus—Large Core Fund | | | 73,404 | | | | 18,504,722 | | | | — | | | | — | | | | 18,578,126 | |
StylePlus—Mid Growth Fund | | | 4,838 | | | | 9,069,538 | | | | — | | | | — | | | | 9,074,376 | |
World Equity Income Fund | | | — | | | | — | | | | (19,765 | ) | | | — | | | | (19,765 | ) |
In conjunction with the use of short sales and derivative instruments, the Funds are required to maintain collateral in various forms. The Funds use, where appropriate, depending on the financial instrument utilized and the broker involved, margin deposits at the broker, cash and/or securities segregated at the custodian bank, discount notes or the repurchase agreements allocated to the Funds.
| | THE GUGGENHEIM FUNDS ANNUAL REPORT | 119 |
NOTES TO FINANCIAL STATEMENTS (continued) |
There are several risks associated with exposure to foreign currencies, foreign issuers and emerging markets. A Fund’s indirect and direct exposure to foreign currencies subjects the Fund to the risk that those currencies will decline in value relative to the U.S. dollar, or in the case of short positions, that the U.S. dollar will decline in value relative to the currency being hedged. Currency rates in foreign countries may fluctuate significantly over short periods of time for a number of reasons, including changes in interest rates and the imposition of currency controls or other political developments in the U.S. or abroad. In addition, the Fund may incur transaction costs in connection with conversions between various currencies. The Fund may, but is not obligated to, engage in currency hedging transactions, which generally involve buying currency forward, options or futures contracts. However, not all currency risks may be effectively hedged, and in some cases the costs of hedging techniques may outweigh expected benefits. In such instances, the value of securities denominated in foreign currencies can change significantly when foreign currencies strengthen or weaken relative to the U.S. dollar.
Certain Funds may invest in securities of foreign companies directly, or in financial instruments, such as ADRs and exchange-traded funds, which are indirectly linked to the performance of foreign issuers. Foreign markets can be more volatile than the U.S. market due to increased risks of adverse issuer, political, regulatory, market, or economic developments and can perform differently from the U.S. market. Investing in securities of foreign companies directly, or in financial instruments that are indirectly linked to the performance of foreign issuers, may involve risks not typically associated with investing in U.S. issuers. The value of securities denominated in foreign currencies, and of dividends from such securities, can change significantly when foreign currencies strengthen or weaken relative to the U.S. dollar. Foreign securities markets generally have less trading volume and less liquidity than U.S. markets, and prices in some foreign markets may fluctuate more than those of securities traded on U.S. markets. Many foreign countries lack accounting and disclosure standards comparable to those that apply to U.S. companies, and it may be more difficult to obtain reliable information regarding a foreign issuer’s financial condition and operations. Transaction costs and costs associated with custody services are generally higher for foreign securities than they are for U.S. securities. Some foreign governments levy withholding taxes against dividend and interest income. Although in some countries portions of these taxes are recoverable, the non-recovered portion will reduce the income received by the Fund.
The Trust has established counterparty credit guidelines and enters into transactions only with financial institutions of investment grade or better. The Trust monitors the counterparty credit risk.
3. Fees and Other Transactions with Affiliates
Under the terms of an investment advisory contract, the Funds pay GI investment advisory fees calculated at the annualized rates below, based on the average daily net assets of the Funds:
Fund | Management Fees
(as a % of Net Assets) |
Alpha Opportunity Fund | 1.25% |
Large Cap Value Fund | 0.65% |
Market Neutral Real Estate Fund | 1.10% |
Risk Managed Real Estate Fund | 0.75% |
Small Cap Value Fund | 1.00% |
StylePlus—Large Core Fund | 0.75% |
StylePlus—Mid Growth Fund | 0.75% |
World Equity Income Fund | 0.70% |
RFS was paid the following for providing transfer agent services to the Funds. Transfer agent fees were assessed to the applicable class of each Fund.
Annual charge per account | $5.00 – $8.00 |
Transaction fee | $0.60 – $1.10 |
Minimum annual charge per Fund† | $25,000 |
Certain out-of-pocket charges | Varies |
† | Not subject to the Funds during the first twelve months of operations. |
120 | THE GUGGENHEIM FUNDS ANNUAL REPORT | |
NOTES TO FINANCIAL STATEMENTS (continued) |
RFS also acted as the administrative agent for the Funds. As such it performed administrative, bookkeeping, accounting and pricing functions for each Fund. For these services, RFS received the following:
Fund | Fund Accounting/
Administrative Fees
(as a % of Net Assets) |
Alpha Opportunity Fund | 0.095% |
Large Cap Value Fund | 0.095% |
Market Neutral Real Estate Fund | 0.095% |
Risk Managed Real Estate Fund | 0.095% |
Small Cap Value Fund | 0.095% |
StylePlus—Large Core Fund | 0.095% |
StylePlus—Mid Growth Fund | 0.095% |
World Equity Income Fund* | 0.095% |
Minimum annual charge per Fund | $25,000 |
Certain out-of-pocket charges | Varies |
* | Effective July 1, 2016, the fund accounting/administrative fees for World Equity Income Fund was reduced from 0.15% to 0.095%. The minimum annual charge was also reduced from $60,000 to $25,000. |
GI engages external service providers to perform other necessary services for the Trust, such as audit and accounting related services, legal services, custody, printing and mailing, etc., on a pass-through basis. Such expenses are allocated to various Funds within the complex based on relative net assets.
The Funds have adopted Distribution Plans related to the offering of A-Class, C-Class and P-Class shares pursuant to Rule 12b-1 under the 1940 Act. The plans provide for payments at an annual rate of 0.25% of the average daily net assets of each Fund’s A-Class and P-Class shares, and 1.00% of the average daily net assets of each Fund’s C-Class shares.
The investment advisory contracts for the following Funds provide that the total expenses be limited to a percentage of average net assets for each class of shares, exclusive of brokerage costs, dividends on securities sold short, expenses of other investment companies in which a Fund invests, interest, taxes, litigation, indemnification and extraordinary expenses. The limits are listed below:
| | Limit | Effective
Date | Contract
End Date |
Alpha Opportunity Fund – A-Class | 2.11% | 11/30/12 | 02/01/17 |
Alpha Opportunity Fund – C-Class | 2.86% | 11/30/12 | 02/01/17 |
Alpha Opportunity Fund – P-Class | 2.11% | 05/01/15 | 02/01/17 |
Alpha Opportunity Fund – Institutional Class | 1.86% | 11/30/12 | 02/01/17 |
Large Cap Value Fund – A-Class | 1.15% | 11/30/12 | 02/01/17 |
Large Cap Value Fund – C-Class | 1.90% | 11/30/12 | 02/01/17 |
Large Cap Value Fund – P-Class | 1.15% | 05/01/15 | 02/01/17 |
Large Cap Value Fund – Institutional Class | 0.90% | 06/05/13 | 02/01/17 |
Market Neutral Real Estate Fund – A-Class* | 1.65% | 02/26/16 | 02/01/18 |
Market Neutral Real Estate Fund – C-Class* | 2.40% | 02/26/16 | 02/01/18 |
Market Neutral Real Estate Fund – P-Class* | 1.65% | 02/26/16 | 02/01/18 |
Market Neutral Real Estate Fund – Institutional Class* | 1.40% | 02/26/16 | 02/01/18 |
Risk Managed Real Estate Fund – A-Class | 1.30% | 03/26/14 | 02/01/17 |
Risk Managed Real Estate Fund – C-Class | 2.05% | 03/26/14 | 02/01/17 |
Risk Managed Real Estate Fund – P-Class | 1.30% | 05/01/15 | 02/01/17 |
Risk Managed Real Estate Fund – Institutional Class | 1.10% | 03/26/14 | 02/01/17 |
Small Cap Value Fund – A-Class | 1.30% | 11/30/12 | 02/01/17 |
Small Cap Value Fund – C-Class | 2.05% | 11/30/12 | 02/01/17 |
Small Cap Value Fund – P-Class | 1.30% | 05/01/15 | 02/01/17 |
Small Cap Value Fund – Institutional Class | 1.05% | 11/30/12 | 02/01/17 |
World Equity Income Fund – A-Class | 1.46% | 08/15/13 | 02/01/17 |
World Equity Income Fund – C-Class | 2.21% | 08/15/13 | 02/01/17 |
World Equity Income Fund – P-Class | 1.46% | 05/01/15 | 02/01/17 |
World Equity Income Fund – Institutional Class | 1.21% | 08/15/13 | 02/01/17 |
| | THE GUGGENHEIM FUNDS ANNUAL REPORT | 121 |
NOTES TO FINANCIAL STATEMENTS (continued) |
* | Commencement of operations: February 26, 2016. |
GI is entitled to reimbursement by the Funds for fees waived or expenses reimbursed during any of the previous 36 months, beginning on the date of the expense limitation agreement, if on any day the estimated operating expenses are less than the indicated percentages. At September 30, 2016, the amount of fees waived or expenses reimbursed that are subject to recoupment are presented in the following table:
Fund | | Expires
2017 | | | Expires
2018 | | | Expires
2019 | | | Fund
Total | |
Alpha Opportunity Fund | | | | | | | | | | | | |
A-Class | | $ | 75,155 | | | $ | 92,503 | | | $ | — | | | $ | 167,658 | |
C-Class | | | 14,688 | | | | 12,810 | | | | 7,081 | | | | 34,579 | |
P-Class | | | — | | | | — | | | | — | | | | — | |
Institutional Class | | | 8,795 | | | | — | | | | — | | | | 8,795 | |
Large Cap Value Fund | | | | | | | | | | | | | | | | |
A-Class | | | 178,803 | | | | 95,743 | | | | 87,212 | | | | 361,758 | |
C-Class | | | 14,886 | | | | 9,943 | | | | 9,306 | | | | 34,135 | |
P-Class | | | — | | | | 85 | | | | 338 | | | | 423 | |
Institutional Class | | | 5,264 | | | | 2,123 | | | | 1,129 | | | | 8,516 | |
Market Neutral Real Estate Fund | | | | | | | | | | | | | | | | |
A-Class | | | — | | | | — | | | | 1,232 | | | | 1,232 | |
C-Class | | | — | | | | — | | | | 1,202 | | | | 1,202 | |
P-Class | | | — | | | | — | | | | 1,242 | | | | 1,242 | |
Institutional Class | | | — | | | | — | | | | 54,674 | | | | 54,674 | |
Risk Managed Real Estate Fund | | | | | | | | | | | | | | | | |
A-Class | | | 143 | | | | 2,392 | | | | 918 | | | | 3,453 | |
C-Class | | | 2,092 | | | | 2,095 | | | | 2,257 | | | | 6,444 | |
P-Class | | | — | | | | 87 | | | | 58 | | | | 145 | |
Institutional Class | | | — | | | | — | | | | — | | | | — | |
Small Cap Value Fund | | | | | | | | | | | | | | | | |
A-Class | | | 104,388 | | | | 105,165 | | | | 123,706 | | | | 333,259 | |
C-Class | | | 37,530 | | | | 44,550 | | | | 49,668 | | | | 131,748 | |
P-Class | | | — | | | | 110 | | | | 116 | | | | 226 | |
Institutional Class | | | 57,627 | | | | 4,007 | | | | 4,063 | | | | 65,697 | |
World Equity Income Fund | | | | | | | | | | | | | | | | |
A-Class | | | 129,914 | | | | — | | | | — | | | | 129,914 | |
C-Class | | | 15,333 | | | | 2,930 | | | | 7,207 | | | | 25,470 | |
P-Class | | | — | | | | — | | | | — | | | | — | |
Institutional Class | | | 134 | | | | — | | | | 2,484 | | | | 2,618 | |
For the year ended September 30, 2016, GI recouped $14,944 from the Alpha Opportunity Fund and $23,517 from the World Equity Income Fund. These amounts are included in Management Fees in the Statement of Operations.
If a Fund invests in an affiliated fund, the investing Fund’s adviser has agreed to waive fees at the investing fund level. Fee waivers will be calculated at the investing Fund level without regard to any expense cap, if any, in effect for the investing Fund. Fees waived under this arrangement are not subject to reimbursement to GI. For the year September 30, 2016, the following Funds waived fees related to investments in affiliated funds.
Fund | | Amount | |
StylePlus—Large Core Fund | | $ | 39,318 | |
StylePlus—Mid Growth Fund | | | 15,657 | |
For the year ended September 30, 2016, GFD retained sales charges of $566,973 relating to sales of A-Class shares of the Trust.
Certain trustees and officers of the Trust are also officers of GI and GFD.
122 | THE GUGGENHEIM FUNDS ANNUAL REPORT | |
NOTES TO FINANCIAL STATEMENTS (continued) |
4. Fair Value Measurement
In accordance with U.S. GAAP, fair value is defined as the price that the Funds would receive to sell an investment or pay to transfer a liability in an orderly transaction with an independent buyer in the principal market, or in the absence of a principal market, the most advantageous market for the investment or liability. U.S. GAAP establishes a three-tier fair value hierarchy based on the types of inputs used to value assets and liabilities and requires corresponding disclosure. The hierarchy and the corresponding inputs are summarized below:
Level 1 — | quoted prices in active markets for identical assets or liabilities. |
Level 2 — | significant other observable inputs (for example quoted prices for securities that are similar based on characteristics such as interest rates, prepayment speeds, credit risk, etc.). |
Level 3 — | significant unobservable inputs based on the best information available under the circumstances, to the extent observable inputs are not available, which may include assumptions. |
The types of inputs available depend on a variety of factors, such as the type of security and the characteristics of the markets in which it trades, if any. Fair valuation determinations that rely on fewer or no observable inputs require greater judgment. Accordingly, fair value determinations for Level 3 securities require the greatest amount of judgment.
The inputs or methodologies used for valuing securities are not necessarily an indication of the risk associated with investing in those securities. The suitability of the techniques and sources employed to determine fair valuation are regularly monitored and subject to change.
5. Offsetting
In the normal course of business, the Funds enter into transactions subject to enforceable master netting arrangements or other similar arrangements. Generally, the right to offset in those agreements allows the Funds to counteract the exposure to a specific counterparty with collateral received from or delivered to that counterparty based on the terms of the arrangements. These arrangements provide for the right to liquidate upon the occurrence of an event of default, credit event upon merger or additional termination event.
In order to better define their contractual rights and to secure rights that will help the Funds mitigate their counterparty risk, the Funds may enter into an International Swaps and Derivatives Association, Inc. Master Agreement (“ISDA Master Agreement”) or similar agreement with their derivative contract counterparties. An ISDA Master Agreement is a bilateral agreement between a Fund and a counterparty that governs OTC derivatives, including foreign exchange contracts, and typically contains, among other things, collateral posting terms and netting provisions in the event of a default and/or termination event. The provisions of the ISDA Master Agreement typically permit a single net payment in the event of a default (close-out netting) or similar event, including the bankruptcy or insolvency of the counterparty.
For derivatives traded under an ISDA Master Agreement, the collateral requirements are typically calculated by netting the mark-to-market amount for each transaction under such agreement and comparing that amount to the value of any collateral currently pledged by the Funds and the counterparty. For financial reporting purposes, cash collateral that has been pledged to cover obligations of the Funds and cash collateral received from the counterparty, if any, are reported separately on the Statements of Assets and Liabilities as segregated cash with broker/receivable for variation margin, or payable for swap settlement/variation margin. Generally, the amount of collateral due from or to a counterparty must exceed a minimum transfer amount threshold (e.g., $300,000) before a transfer is required to be made. To the extent amounts due to the Funds from their counterparties are not fully collateralized, contractually or otherwise, the Funds bear the risk of loss from counterparty nonperformance. The Funds attempt to mitigate counterparty risk by only entering into agreements with counterparties that they believe to be of good standing and by monitoring the financial stability of those counterparties.
For financial reporting purposes, the Funds do not offset derivative assets and derivative liabilities that are subject to netting arrangements in the Statements of Assets and Liabilities.
| | THE GUGGENHEIM FUNDS ANNUAL REPORT | 123 |
NOTES TO FINANCIAL STATEMENTS (continued) |
The following tables present derivative financial instruments and secured financing transactions that are subject to enforceable netting arrangements and offset in the Statements of Assets and Liabilities in conformity with U.S. GAAP:
| | | | | | | | | | | | | Gross Amounts Not Offset
in the Statements of
Assets and Liabilities | | | | |
Fund | Instrument | | Gross
Amounts of
Recognized Assets1 | | | Gross Amounts Offset In the Statements of Assets and Liabilities | | | Net Amount of Assets Presented on the Statements of Assets and Liabilities | | | Financial
Instruments | | | Cash
Collateral
Received | | | Net
Amount | |
Alpha Opportunity Fund | Swap equity contracts | | $ | 1,705,536 | | | $ | — | | | $ | 1,705,536 | | | $ | 1,705,536 | | | $ | — | | | $ | — | |
Risk Managed Real Estate Fund | Swap equity contracts | | | 1,959,554 | | | | — | | | | 1,959,554 | | | | 1,424,342 | | | | — | | | | 535,212 | |
StylePlus—Large Core Fund | Swap equity contracts | | | 5,724,743 | | | | — | | | | 5,724,743 | | | | — | | | | 4,460,000 | | | | 1,264,743 | |
StylePlus—Mid Growth Fund | Swap equity contracts | | | 2,662,190 | | | | — | | | | 2,662,190 | | | | — | | | | 2,180,000 | | | | 482,190 | |
| | | | | | | | | | | | | Gross Amounts Not Offset
in the Statements of
Assets and Liabilities | | | | |
Fund | Instrument | | Gross
Amounts of
Recognized Liabilities1 | | | Gross Amounts Offset In the Statements of Assets and Liabilities | | | Net Amount of Liabilities Presented on the Statements of Assets and Liabilities | | | Financial
Instruments | | | Cash
Collateral
Pledged | | | Net
Amount | |
Alpha Opportunity Fund | Swap equity contracts | | $ | 3,615,837 | | | $ | — | | | $ | 3,615,837 | | | $ | 1,705,536 | | | $ | 1,910,301 | | | $ | — | |
Risk Managed Real Estate Fund | Swap equity contracts | | | 1,424,342 | | | | — | | | | 1,424,342 | | | | 1,424,342 | | | | — | | | | — | |
Market Neutral Real Estate Fund | Swap equity contracts | | | 264,835 | | | | — | | | | 264,835 | | | | — | | | | — | | | | 264,835 | |
1 | Exchange-traded futures are excluded from these reported amounts. |
6. Federal Income Tax Information
The Funds intend to comply with the provisions of Subchapter M of the Internal Revenue Code applicable to regulated investment companies and will distribute substantially all taxable net investment income and capital gains sufficient to relieve the Funds from all, or substantially all, federal income, excise and state income taxes. Therefore, no provision for federal or state income tax is required.
Tax positions taken or expected to be taken in the course of preparing the Funds’ tax returns are evaluated to determine whether the tax positions are “more-likely-than-not” of being sustained by the applicable tax authority. Tax positions not deemed to meet the more-likely-than-not threshold would be recorded as a tax benefit or expense in the current year. Management has analyzed the Funds’ tax positions taken, or to be taken, on federal income tax returns for all open tax years, and has concluded that no provision for income tax is required in the Funds’ financial statements. The Funds’ federal tax returns are subject to examination by the Internal Revenue Service for a period of three years after they are filed.
Tax basis capital losses in excess of capital gains are carried forward to offset future net capital gains.
For the year ended September 30, 2016, the following capital loss carryforward amounts were used or expired:
Fund | | Amount | |
Alpha Opportunity Fund | | $ | 3,661,254 | |
124 | THE GUGGENHEIM FUNDS ANNUAL REPORT | |
NOTES TO FINANCIAL STATEMENTS (continued) |
The tax character of distributions paid during the year ended September 30, 2016 was as follows:
Fund | | Ordinary
Income | | | Long-Term
Capital Gain | | | Total
Distributions | |
Alpha Opportunity Fund | | $ | — | | | $ | — | | | $ | — | |
Large Cap Value Fund | | | 466,512 | | | | 3,681,038 | | | | 4,147,550 | |
Market Neutral Real Estate Fund | | | — | | | | — | | | | — | |
Risk Managed Real Estate Fund | | | 17,020,643 | | | | 111,921 | | | | 17,132,564 | |
Small Cap Value Fund | | | 1,624 | | | | 1,391,872 | | | | 1,393,496 | |
StylePlus-Large Core Fund | | | 2,555,903 | | | | 18,677,775 | | | | 21,233,678 | |
StylePlus-Mid Growth Fund | | | 851,868 | | | | 9,350,921 | | | | 10,202,789 | |
World Equity Income Fund | | | 2,067,623 | | | | — | | | | 2,067,623 | |
Market Neutral Real Estate Fund commenced operations on February 26th, 2016.
The tax character of distributions paid during the year ended September 30, 2015 was as follows:
Fund | | Ordinary
Income | | | Long-Term
Capital Gain | | | Total
Distributions | |
Alpha Opportunity Fund | | $ | 2,557 | | | $ | — | | | $ | 2,557 | |
Large Cap Value Fund | | | 463,001 | | | | 1,811,884 | | | | 2,274,885 | |
Risk Managed Real Estate Fund | | | 538,258 | | | | 114,879 | | | | 653,137 | |
Small Cap Value Fund | | | — | | | | 5,200,913 | | | | 5,200,913 | |
StylePlus-Large Core Fund | | | 27,474,090 | | | | — | | | | 27,474,090 | |
StylePlus-Mid Growth Fund | | | 9,279,013 | | | | 155 | | | | 9,279,168 | |
World Equity Income Fund | | | 2,344,786 | | | | — | | | | 2,344,786 | |
Note: For federal income tax purposes, short-term capital gain distributions are treated as ordinary income distributions.
Tax components of accumulated earnings/(deficit) as of September 30, 2016, were as follows:
Fund | | Undistributed
Ordinary
Income | | | Undistributed
Long-Term
Capital Gain | | | Net Unrealized
Appreciation/
(Depreciation) | | | Accumulated
Capital and
Other Losses | | | Other Temporary
Differences | |
Alpha Opportunity Fund | | $ | 23,406 | | | $ | — | | | $ | (499,876 | ) | | $ | (2,569,554 | ) | | $ | — | |
Large Cap Value Fund | | | 813,658 | | | | 1,990,428 | | | | 5,556,522 | | | | — | | | | — | |
Market Neutral Real Estate Fund | | | — | | | | — | | | | 268,145 | | | | (38,711 | ) | | | — | |
Risk Managed Real Estate Fund | | | 2,652,402 | | | | 88,473 | | | | 4,907,449 | | | | — | | | | (384,262 | ) |
Small Cap Value Fund | | | — | | | | — | | | | 1,493,634 | | | | (248,587 | ) | | | — | |
StylePlus-Large Core Fund | | | 4,223,438 | | | | 779,695 | | | | 7,675,368 | | | | — | | | | — | |
StylePlus-Mid Growth Fund | | | 259,567 | | | | — | | | | 2,968,479 | | | | (2,409,069 | ) | | | — | |
World Equity Income Fund | | | 494,564 | | | | — | | | | 3,992,993 | | | | (21,346,093 | ) | | | (459,008 | ) |
| | THE GUGGENHEIM FUNDS ANNUAL REPORT | 125 |
NOTES TO FINANCIAL STATEMENTS (continued) |
For Federal income tax purposes, capital loss carryforwards represent realized losses of the Funds that may be carried forward and applied against future capital gains. For taxable years beginning on or before December 22, 2010, such capital losses may be carried forward for a maximum of eight years. Under the RIC Modernization Act of 2010, the Funds are permitted to carry forward capital losses incurred in taxable years beginning after December 22, 2010 for an unlimited period. However, any losses incurred during those taxable years must be utilized prior to the losses incurred in pre-enactment taxable years. As a result of this ordering rule, pre-enactment capital loss carryforwards may be more likely to expire unused. Additionally, post-enactment capital losses that are carried forward will retain their character as either short-term or long-term capital losses rather than being considered all short-term as under previous law. As of September 30, 2016, capital loss carryforwards for the Funds were as follows:
Fund | | Expires in
2017 | | | Expires in
2018 | | | Unlimited
Short-Term | | | Unlimited
Long-Term | | | Total
Capital Loss
Carryforward | |
Alpha Opportunity Fund | | $ | — | | | $ | — | | | $ | — | | | $ | — | | | $ | — | |
Large Cap Value Fund | | | — | | | | — | | | | — | | | | — | | | | — | |
Market Neutral Real Estate Fund | | | — | | | | — | | | | (38,711 | ) | | | — | | | | (38,711 | ) |
Risk Managed Real Estate Fund | | | — | | | | — | | | | — | | | | — | | | | — | |
Small Cap Value Fund | | | — | | | | — | | | | (106,878 | ) | | | (141,709 | ) | | | (248,587 | ) |
StylePlus-Large Core Fund | | | — | | | | — | | | | — | | | | — | | | | — | |
StylePlus-Mid Growth Fund | | | — | | | | — | | | | (1,792,223 | ) | | | (616,846 | ) | | | (2,409,069 | ) |
World Equity Income Fund | | | (12,374,457 | ) | | | (5,357,504 | ) | | | (3,375,450 | ) | | | (238,682 | ) | | | (21,346,093 | ) |
As of September 30, 2016 the following reclassifications were made to the capital accounts of the Funds, to reflect permanent book/tax differences and income and gains available for distributions under income tax regulations, which are primarily due to equalization accounting, net operating losses, non-deductible start-up costs, dividend reclasses, disposition of PFIC stock, foreign currency reclasses, and taxable overdistributions. Net investment income, net realized gains, and net assets were not affected by these changes.
On the Statements of Assets and Liabilities the following adjustments were made for permanent book/tax differences:
Fund | | Paid In
Capital | | | Undistributed
Net Investment
Income | | | Accumulated
Net Realized
Gain (Loss) | |
Alpha Opportunity Fund | | $ | (239,191 | ) | | $ | (286,990 | ) | | $ | 526,181 | |
Large Cap Value Fund | | | 315,977 | | | | 11,492 | | | | (327,469 | ) |
Market Neutral Real Estate Fund | | | (331,941 | ) | | | 210,216 | | | | 121,725 | |
Risk Managed Real Estate Fund | | | 288,694 | | | | (328,606 | ) | | | 39,912 | |
Small Cap Value Fund | | | (76,166 | ) | | | 26,252 | | | | 49,914 | |
StylePlus-Large Core Fund | | | 483,772 | | | | — | | | | (483,772 | ) |
StylePlus-Mid Growth Fund | | | (1 | ) | | | (70,722 | ) | | | 70,723 | |
World Equity Income Fund | | | 1 | | | | (4,214 | ) | | | 4,213 | |
At September 30, 2016, the cost of securities for Federal income tax purposes, the aggregate gross unrealized gain for all securities for which there was an excess of value over tax cost and the aggregate gross unrealized loss for all securities for which there was an excess of tax cost over value, were as follows:
Fund | | Tax
Cost | | | Tax
Unrealized
Gain | | | Tax
Unrealized
Loss | | | Net
Unrealized
Gain | |
Alpha Opportunity Fund | | $ | 78,261,144 | | | $ | 2,940,813 | | | $ | (1,851,941 | ) | | $ | 1,088,872 | |
Large Cap Value Fund | | | 53,746,242 | | | | 7,101,289 | | | | (1,544,767 | ) | | | 5,556,522 | |
Market Neutral Real Estate Fund | | | 4,389,091 | | | | 289,488 | | | | (21,343 | ) | | | 268,145 | |
Risk Managed Real Estate Fund | | | 109,614,866 | | | | 7,520,201 | | | | (2,313,294 | ) | | | 5,206,907 | |
Small Cap Value Fund | | | 17,607,446 | | | | 2,380,443 | | | | (886,809 | ) | | | 1,493,634 | |
StylePlus-Large Core Fund | | | 196,939,968 | | | | 2,894,606 | | | | (943,981 | ) | | | 1,950,625 | |
StylePlus-Mid Growth Fund | | | 77,454,671 | | | | 953,133 | | | | (646,844 | ) | | | 306,289 | |
World Equity Income Fund | | | 85,514,550 | | | | 7,431,333 | | | | (3,434,068 | ) | | | 3,997,265 | |
126 | THE GUGGENHEIM FUNDS ANNUAL REPORT | |
NOTES TO FINANCIAL STATEMENTS (continued) |
Pursuant to Federal income tax regulations applicable to investment companies, the Fund can elect to treat net capital losses and certain ordinary losses realized between November 1 and September 30 of each year as occurring on the first day of the following tax year. The Fund also can elect to treat certain ordinary losses realized between January 1 and September 30 of each year as occurring on the first day of the following tax year. The Fund has elected to defer the following late year losses:
Fund | | Ordinary | | | Capital | |
Guggenheim Alpha Opportunity Fund | | $ | 2,567,545 | | | $ | — | |
7. Securities Transactions
For the year ended September 30, 2016, the cost of purchases and proceeds from sales of investment securities, excluding government securities, short-term investments and derivatives, were as follows:
Fund | | Purchases | | | Sales | |
Alpha Opportunity Fund | | $ | 219,088,895 | | | $ | 198,970,321 | |
Large Cap Value Fund | | | 30,424,720 | | | | 31,646,284 | |
Market Neutral Real Estate Fund | | | 9,878,384 | | | | 6,291,138 | |
Risk Managed Real Estate Fund | | | 157,667,636 | | | | 173,265,980 | |
Small Cap Value Fund | | | 11,502,022 | | | | 13,652,798 | |
StylePlus—Large Core Fund | | | 99,764,307 | | | | 90,336,388 | |
StylePlus—Mid Growth Fund | | | 44,871,083 | | | | 47,270,183 | |
World Equity Income Fund | | | 43,646,654 | | | | 47,041,067 | |
The Funds are permitted to purchase or sell securities from or to certain affiliated funds under specified conditions outlined in procedures adopted by the Board. The procedures have been designed to ensure that any purchase or sale of securities by a Fund from or to another fund or portfolio that is or could be considered an affiliate by virtue of having a common investment adviser (or affiliated investment advisers), common Trustees and/or common officers complies with Rule 17a-7 of the 1940 Act. Further, as defined under these procedures, each transaction is effected at the current market price to save costs, where permissible. For the year ended September 30, 2016, the Funds did not engage in purchases and sales of securities, pursuant to Rule 17a-7 of the 1940 Act.
8. Affiliated Transactions
Investments representing 5% or more of the outstanding voting shares of a portfolio company of a fund, or control of or by, or common control under GI, result in that portfolio company being considered an affiliated company of such fund, as defined in the 1940 Act.
The Funds may invest in the Guggenheim Strategy Funds Trust consisting of Guggenheim Strategy Fund I, Guggenheim Strategy Fund II, Guggenheim Strategy Fund III, and Guggenheim Variable Insurance Strategy Fund III (collectively, the “Cash Management Funds”), open-end management investment companies managed by GI. The Cash Management Funds, which launched on March 11, 2014, are offered as cash management options only to mutual funds, trusts, and other accounts managed by GI and/or its affiliates, and are not available to the public. The Cash Management Funds pay no investment management fees. The Cash Management Funds’ annual report on Form N-CSR dated September 30, 2015, is available publicly or upon request. This information is available from the EDGAR database on the SEC’s website at http://www.sec.gov/Archives/edgar/data/1601445/000089180415000857/gug63224-ncsr.htm.
| | THE GUGGENHEIM FUNDS ANNUAL REPORT | 127 |
NOTES TO FINANCIAL STATEMENTS (continued) |
Transactions during the year ended September 30, 2016, in which the portfolio company is an “affiliated person,” were as follows:
Affiliated issuers by Fund | | Value
09/30/15 | | | Additions | | | Reductions | | | Value
09/30/16 | | | Shares
09/30/16 | | | Investment
Income | | | Realized
Gain (Loss) | |
StylePlus—Large Core Fund | | | | | | | | | | | | | | | | | | | | | |
Guggenheim Limited Duration Fund -
Institutional Class | | $ | — | | | $ | 15,421,583 | | | $ | — | | | $ | 15,768,627 | | | | 638,148 | | | $ | 269,446 | | | $ | — | |
Guggenheim Strategy Fund I | | | 42,522,683 | | | | 4,280,354 | | | | (23,040,275 | ) | | | 23,831,360 | | | | 953,636 | | | | 378,742 | | | | (25,192 | ) |
Guggenheim Strategy Fund II | | | 50,215,775 | | | | 8,286,305 | | | | (8,950,000 | ) | | | 49,693,469 | | | | 1,992,521 | | | | 981,130 | | | | (118,160 | ) |
Guggenheim Strategy Fund III | | | 50,309,143 | | | | 16,527,780 | | | | — | | | | 67,119,862 | | | | 2,686,944 | | | | 1,619,000 | | | | — | |
| | | $ | 143,047,601 | | | $ | 44,516,022 | | | $ | (31,990,275 | ) | | $ | 156,413,318 | | | | | | | $ | 3,248,318 | | | $ | (143,352 | ) |
| | | | | | | | | | | | | | | | | | | | | | | | | | | | | |
StylePlus—Mid Growth Fund | | | | | | | | | | | | | | | | | | | | | | | | | | | | |
Guggenheim Limited Duration Fund -
Institutional Class | | $ | — | | | $ | 6,133,143 | | | $ | — | | | $ | 6,271,368 | | | | 253,799 | | | $ | 107,293 | | | $ | — | |
Guggenheim Strategy Fund I | | | 17,393,825 | | | | 4,069,999 | | | | (13,268,521 | ) | | | 8,222,675 | | | | 329,039 | | | | 139,522 | | | | (65 | ) |
Guggenheim Strategy Fund II | | | 22,101,923 | | | | 1,721,875 | | | | (3,625,000 | ) | | | 20,250,726 | | | | 811,978 | | | | 419,681 | | | | (48,274 | ) |
Guggenheim Strategy Fund III | | | 22,457,513 | | | | 3,946,165 | | | | — | | | | 26,513,876 | | | | 1,061,404 | | | | 642,669 | | | | — | |
| | | $ | 61,953,261 | | | $ | 15,871,182 | | | $ | (16,893,521 | ) | | $ | 61,258,645 | | | | | | | $ | 1,309,165 | | | $ | (48,339 | ) |
9. Line of Credit
The Trust, with the exception of Capital Stewardship Fund, and certain affiliated funds, secured a 364-day committed, $800,000,000 line of credit from Citibank, N.A., which was in place through October 6, 2016, at which time the line of credit was renewed. A Fund may draw (borrow) from the line of credit as a temporary measure for emergency purposes, to facilitate redemption requests, or for other short-term liquidity purposes consistent with the Fund’s investment objective and program. For example, it may be advantageous for the Fund to borrow money rather than sell existing portfolio positions to meet redemption requests. Fees related to borrowings, if any, vary under this arrangement between the greater of Citibank’s “base rate”, LIBOR plus 1%, or the federal funds rate 0.29% at September 30, 2016, plus 1/2 of 1%. The funds paid upfront costs of $663,359 to renew the line of credit.
The commitment fee that may be paid by the Funds is at an annualized rate of 0.15% of the average daily amount of their unused commitment amount. The Funds did not have any borrowings under this agreement as of and for the period ended September 30, 2016.
On October 6, 2016, the Trust, with the exception of Capital Stewardship Fund, and certain affiliated funds, renewed the line of credit from Citibank, N.A., with an increased commitment amount to $1,000,000,000. Fees related to borrowings, if any, vary under this arrangement between the greater of Citibank’s “base rate”, LIBOR plus 1%, or the federal funds rate 0.29% at September 30, 2016, plus 1/2 of 1%. The funds will pay upfront costs of $2,032,388 to renew the line of credit. The commitment fee that may be paid by the Funds is at an annualized rate of 0.15% of the average daily amount of their unused commitment amount.
The allocated interest expense amount for each Fund is referenced in the Statement of Operations under “Line of credit fees” and the effect on the expense ratio is included in the Financial Highlights.
10. Other Liabilities
StylePlus—Large Core Fund wrote put option contracts through Lehman Brothers Inc., (“LBI”) that were exercised prior to the option contracts’ expiration and prior to the bankruptcy filing by LBI, during September, 2008. However, these transactions have not settled and the securities have not been delivered to the Fund as of September 30, 2016.
Although the ultimate resolution of these transactions is uncertain, the Fund has recorded a liability equal to the difference between the strike price on the put options and the market price of the underlying security on the exercise date. The amount of the liability recorded in miscellaneous payables by the Fund as of September 30, 2016, was $18,615.
128 | THE GUGGENHEIM FUNDS ANNUAL REPORT | |
NOTES TO FINANCIAL STATEMENTS (concluded) |
11. Large Shareholder Risk
As of September 30, 2016, 57.5% of the Alpha Opportunity Fund (the “Fund”) was held by Macro Opportunities Fund. The Fund may experience adverse effects if a large number of shares of the Fund are held by a single shareholder (e.g., an institutional investor, financial intermediary or another GI Fund). The Fund is subject to the risk that a redemption by those shareholders of all or a large portion of the Fund could cause the Fund to liquidate its assets at inopportune times, or at a loss or depressed value, which could adversely impact the Fund’s performance and cause the value of a shareholder’s investment to decline. Redemptions of a large number of shares also may increase transaction costs or, by necessitating a sale of portfolio securities, have adverse tax consequences for shareholders. They also potentially limit the use of any capital loss carryforwards and certain other losses to offset future realized capital gains (if any) and may limit or prevent a Fund’s use of tax equalization.
12. Subsequent Event
At a meeting that occurred on November 16, 2016, the Board approved the following changes:
Effective October 1, 2016, World Equity Income Fund reduced its class specific expense caps from 1.47%, 2.22%, 1.22% and 1.47% for A-Class, C-Class, Institutional Class and P-Class, respectively, to 1.22%, 1.97%, 0.97% and 1.22% for A-Class, C-Class, Institutional Class and P-Class, respectively.
Effective February 1, 2017, the Advisory Fee for the Small Cap Value Fund will be reduced from 1.00% to 0.75% on the average daily net assets of the Fund. The reduced Advisory Fee will not result in any decrease in the nature, quality and extent of services provided to the Fund under the advisory agreement.
For more information, please refer to the Funds’ prospectus, which can be obtained at guggenheiminvestments.com or by calling 800.820.0888.
| | THE GUGGENHEIM FUNDS ANNUAL REPORT | 129 |
REPORT OF INDEPENDENT REGISTERED PUBLIC ACCOUNTING FIRM |
The Board of Trustees and Shareholders
of Guggenheim Funds Trust
We have audited the accompanying statements of assets and liabilities, including the schedules of investments, of Guggenheim Alpha Opportunity Fund, Guggenheim Large Cap Value Fund, Guggenheim Market Neutral Real Estate Fund, Guggenheim Risk Managed Real Estate Fund, Guggenheim Small Cap Value Fund, Guggenheim StylePlus-Large Core Fund, Guggenheim StylePlus-Mid Growth Fund, and Guggenheim World Equity Income Fund (eight of the series constituting the Guggenheim Funds Trust) (the “Funds”) as of September 30, 2016, and the related statements of operations for the year then ended, and the statements of changes in net assets and the financial highlights for each of the years or periods indicated therein. These financial statements and financial highlights are the responsibility of the Funds’ management. Our responsibility is to express an opinion on these financial statements and financial highlights based on our audits.
We conducted our audits in accordance with the standards of the Public Company Accounting Oversight Board (United States). Those standards require that we plan and perform the audit to obtain reasonable assurance about whether the financial statements and financial highlights are free of material misstatement. We were not engaged to perform an audit of the Fund’s internal control over financial reporting. Our audits included consideration of internal control over financial reporting as a basis for designing audit procedures that are appropriate in the circumstances, but not for the purpose of expressing an opinion on the effectiveness of the Funds’ internal control over financial reporting. Accordingly, we express no such opinion. An audit also includes examining, on a test basis, evidence supporting the amounts and disclosures in the financial statements and financial highlights, assessing the accounting principles used and significant estimates made by management, and evaluating the overall financial statement presentation. Our procedures included confirmation of securities owned as of September 30, 2016, by correspondence with the custodian and transfer agent. We believe that our audits provide a reasonable basis for our opinion.
In our opinion, the financial statements and financial highlights referred to above present fairly, in all material respects, the financial position of the above listed Funds (eight of the series constituting the Guggenheim Funds Trust) at September 30, 2016, the results of their operations for the year then ended, and the changes in their net assets and their financial highlights for each of the years or periods indicated therein, in conformity with U.S. generally accepted accounting principles.

McLean, Virginia
November 29, 2016
130 | THE GUGGENHEIM FUNDS ANNUAL REPORT | |
OTHER INFORMATION (Unaudited) |
Tax Information
In January 2017, shareholders will be advised on IRS Form 1099 DIV or substitute 1099 DIV as to the federal tax status of the distributions received by shareholders in the calendar year 2016.
The Trust’s investment income(dividend income plus short-term gains, if any) qualifies as follows:
Of the ordinary income distributions paid during the year, the following funds had the corresponding percentages qualify for the dividends received deduction for corporations:
Fund | Dividend
Received Deduction |
Large Cap Value Fund | 100.00% |
Risk Managed Real Estate Fund | 1.13% |
Small Cap Value Fund | 100.00% |
StylePlus—Large Core Fund | 23.34% |
StylePlus—Mid Growth Fund | 21.12% |
World Equity Income Fund | 68.10% |
The following amounts of taxable ordinary income dividends paid during the fiscal year qualified for the lower income tax rate available to individuals under the Jobs and Growth Tax Relief Reconciliation Act of 2003:
Fund | Qualified
Dividend Income |
Large Cap Value Fund | 100.00% |
Risk Managed Real Estate Fund | 1.15% |
Small Cap Value Fund | 100.00% |
StylePlus—Large Core Fund | 23.35% |
StylePlus—Mid Growth Fund | 21.69% |
World Equity Income Fund | 100.00% |
Additionally, of the taxable ordinary income distributions paid during the fiscal year ending September 30, 2016, the Fund had the corresponding percentages qualify as interest related dividends and qualified short-term capital gains as permitted by IRC Section 871(k)(1) and IRC Section 871(k)(2), respectively:
Fund | Qualified
Interest | Qualified
Short-Term
Capital Gain |
Risk Managed Real Estate Fund | 0.00% | 100.00% |
Small Cap Value Fund | 0.00% | 100.00% |
StylePlus—Large Core Fund | 1.70% | 100.00% |
StylePlus—Mid Growth Fund | 0.00% | 100.00% |
With respect to the taxable year ended September 30, 2016, the Funds hereby designate as capital gain dividends the amounts listed below, or, if subsequently determined to be different, the net capital gain of such year:
Fund | | LTCG
Dividend | | | From Proceeds of Shareholder Redemptions | |
Large Cap Value Fund | | $ | 3,681,038 | | | $ | 315,978 | |
Risk Managed Real Estate Fund | | | 111,921 | | | | 288,695 | |
Small Cap Value Fund | | | 1,391,872 | | | | — | |
StylePlus—Large Core Fund | | | 18,677,775 | | | | 483,772 | |
StylePlus—Mid Growth Fund | | | 9,350,921 | | | | — | |
| | THE GUGGENHEIM FUNDS ANNUAL REPORT | 131 |
OTHER INFORMATION (Unaudited)(continued) |
Proxy Voting Information
A description of the policies and procedures that the Trust uses to determine how to vote proxies relating to securities held in the Funds’ portfolios is available, without charge and upon request, by calling 800.820.0888. This information is also available from the EDGAR database on the SEC’s website at https://www.sec.gov.
Information regarding how the Funds voted proxies relating to portfolio securities during the most recent 12-month period ended June 30 is available without charge, upon request, by calling 800.820.0888. This information is also available from the EDGAR database on the SEC’s website at https://www.sec.gov.
Sector Classification
Information in the “Schedule of Investments” is categorized by sectors using sector-level Classifications defined by the Bloomberg Industry Classification System, a widely recognized industry classification system provider. Each Fund’s registration statement has investment policies relating to concentration in specific sectors/industries. For purposes of these investment policies, the Funds usually classify sectors/industries based on industry-level Classifications used by widely recognized industry classification system providers such as Bloomberg Industry Classification System, Global Industry Classification Standards and Barclays Global Classification Scheme.
Quarterly Portfolio Schedules Information
The Trust files its complete schedule of portfolio holdings with the SEC for the first and third quarters of each fiscal year on Form N-Q; which are available on the SEC’s website at https://www.sec.gov. The Funds’ Forms N-Q may be reviewed and copied at the SEC’s Public Reference Room in Washington, DC, and that information on the operation of the Public Reference Room may be obtained by calling 800-SEC-0330. Copies of the portfolio holdings are also available to shareholders, without charge and upon request, by calling 800.820.0888.
Report of the Guggenheim Funds Trust Contracts Review Committee
Guggenheim Funds Trust (the “Trust”) was organized as a Delaware statutory trust on November 8, 2013, and is registered as an open-end management investment company under the Investment Company Act of 1940, as amended (the “1940 Act”). The Trust includes the following series:
● Guggenheim Alpha Opportunity Fund (“Alpha Opportunity Fund”) ● Guggenheim Diversified Income Fund (“Diversified Income Fund”) ● Guggenheim High Yield Fund (“High Yield Fund”) ● Guggenheim Large Cap Value Fund (“Large Cap Value Fund”) ● Guggenheim Macro Opportunities Fund (“Macro Opportunities Fund”) ● Guggenheim Mid Cap Value Fund (“Mid Cap Value Fund”) ● Guggenheim Municipal Income Fund (“Municipal Income Fund”) ● Guggenheim Small Cap Value Fund (“Small Cap Value Fund”) ● Guggenheim StylePlus—Mid Growth Fund (“StylePlus—Mid Growth Fund”) ● Guggenheim World Equity Income Fund (“World Equity Income Fund”) | ● Guggenheim Capital Stewardship Fund (“Capital Stewardship Fund”) ● Guggenheim Floating Rate Strategies Fund (“Floating Rate Strategies Fund”) ● Guggenheim Investment Grade Bond Fund (“Investment Grade Bond Fund”) ● Guggenheim Limited Duration Fund (“Limited Duration Fund”) ● Guggenheim Market Neutral Real Estate Fund (“Market Neutral Real Estate Fund”) ● Guggenheim Mid Cap Value Institutional Fund (“Mid Cap Value Institutional Fund”) ● Guggenheim Risk Managed Real Estate Fund (“Risk Managed Real Estate Fund”) ● Guggenheim StylePlus—Large Core Fund (“StylePlus—Large Core Fund”) ● Guggenheim Total Return Bond Fund (“Total Return Bond Fund”) |
132 | THE GUGGENHEIM FUNDS ANNUAL REPORT | |
OTHER INFORMATION (Unaudited)(continued) |
Security Investors, LLC (“Security Investors”), an indirect subsidiary of Guggenheim Partners, LLC, a global, diversified financial services firm (“Guggenheim Partners”), serves as investment adviser to each of: (i) Alpha Opportunity Fund; (ii) High Yield Fund; (iii) Investment Grade Bond Fund; (iv) Large Cap Value Fund; (v) Mid Cap Value Fund; (vi) Mid Cap Value Institutional Fund; (vii) Municipal Income Fund; (viii) Small Cap Value Fund; (ix) StylePlus—Large Core Fund; (x) StylePlus—Mid Growth Fund; and (xi) World Equity Income Fund (collectively, the “SI-Advised Funds”). (Guggenheim Partners, Security Investors, Guggenheim Partners Investment Management, LLC (“GPIM”) and their affiliates may be referred to herein collectively as “Guggenheim.” “Guggenheim Investments” refers to the global asset management and investment advisory division of Guggenheim Partners and includes GPIM, Security Investors and Guggenheim Funds Investment Advisors, LLC and other affiliated investment management businesses.) Under the terms of investment management agreements between Security Investors and the Trust, with respect to the SI-Advised Funds, Security Investors also is responsible for overseeing the activities of GPIM, an indirect subsidiary of Guggenheim Partners, with respect to its service as investment sub-adviser to Municipal Income Fund, pursuant to an investment sub-advisory agreement between Security Investors and GPIM (the “GPIM Sub-Advisory Agreement”).
GPIM serves as investment adviser with respect to each of: (i) Capital Stewardship Fund; (ii) Diversified Income Fund; (iii) Floating Rate Strategies Fund; (iv) Limited Duration Fund; (v) Macro Opportunities Fund; (vi) Market Neutral Real Estate Fund; (vii) Risk Managed Real Estate Fund; and (viii) Total Return Bond Fund (collectively, the “GPIM-Advised Funds” and together with the SI-Advised Funds, the “Funds” and individually, a “Fund”). Under the terms of investment management agreements between GPIM and the Trust, with respect to the GPIM-Advised Funds,1 GPIM also is responsible for overseeing the activities of Concinnity Advisors, LP (“Concinnity”) with respect to Concinnity’s service as investment sub-adviser to the Capital Stewardship Fund, pursuant to an investment sub-advisory agreement between GPIM and Concinnity (the “Concinnity Sub-Advisory Agreement”). Under the supervision of the Board of Trustees of the Trust (the “Board,” with the members of the Board referred to individually as the “Trustees”), the Advisers regularly provide (or, as applicable, oversee the provision of) investment research, advice and supervision, a continuous investment program, and direct the purchase and sale of securities and other investments for each Fund’s portfolio.
Following an initial two-year term, each of the Advisory Agreements continues in effect from year to year provided that such continuance is specifically approved at least annually by (i) the Board or a majority of the outstanding voting securities (as defined in the 1940 Act) of each Fund, and, in either event, (ii) the vote of a majority of the Trustees who are not “interested person[s],” as defined by the 1940 Act, of the Trust (the “Independent Trustees”) casting votes in person at a meeting called for such purpose. At meetings held in person on April 27, 2016 (the “April Meeting”) and on May 17, 2016 (the “May Meeting”), the members of the Contracts Review Committee of the Board (the “Committee”), consisting solely of the Independent Trustees, met separately from Guggenheim to consider the proposed renewal of the Advisory Agreements and the GPIM Sub-Advisory Agreement in connection with the Committee’s annual contract review schedule.2
As part of its review process, the Committee was represented by independent legal counsel to the Independent Trustees (“Independent Legal Counsel”). Independent Legal Counsel reviewed and discussed with the Committee various key aspects of the Trustees’ legal responsibilities relating to the proposed renewal of the Agreements and other principal contracts. The Committee took into account various materials received from Guggenheim and Independent Legal Counsel. Recognizing that the evaluation process with respect to the services provided by each of the Advisers is an ongoing one, the Committee also considered the variety of written materials, reports and oral presentations the Board received throughout the year regarding performance and operating results of the Funds.
In connection with the contract review process, FUSE Research Network LLC (“FUSE”), an independent, third-party research provider, was engaged to prepare advisory contract renewal reports designed specifically to help boards of directors/trustees fulfill their advisory contract renewal responsibilities. The objective of the reports is to present the subject funds’ relative position regarding fees, expenses and total return
1 | The investment management agreements pertaining to the SI-Advised Funds and the investment management agreements pertaining to the GPIM-Advised Funds are referred to herein together as the “Advisory Agreements” and, together with the GPIM Sub-Advisory Agreement, as the “Agreements.” In addition, unless the context indicates otherwise, GPIM, with respect to its service as investment adviser to the GPIM-Advised Funds, and Security Investors as to the SI-Advised Funds, are each referred to herein as the “Adviser” and together, the “Advisers.” |
2 | Since Diversified Income Fund is subject to an investment management agreement approved by the Board for an initial term of two years at an in-person meeting of the Board held on August 20, 2015 and the Fund launched in 2016, it was not included in the contract renewal process conducted at the meetings in April and May 2016. Similarly, Market Neutral Real Estate Fund is subject to an investment management agreement approved by the Board for an initial term of two years at an in-person Board meeting held on November 10, 2015, and the Fund launched in 2016. Consequently, Market Neutral Real Estate Fund also was not included in the scope of the 2016 contract renewal process. In addition, because shares of the Capital Stewardship Fund are only offered for subscription and are held by a limited number of institutional/bank investors, and the Fund issues a shareholder report separate from the other series of the Trust, the factors considered by the Committee in evaluating the proposed renewal of an investment management agreement pertaining to the Capital Stewardship Fund, and the Concinnity Sub-Advisory Agreement, are addressed in a separate report of the Committee. Accordingly, references hereafter to the “Funds” should be understood as referring to all series of the Trust, excluding: (i) Capital Stewardship Fund; (ii) Diversified Income Fund; and (iii) Market Neutral Real Estate Fund. |
| | THE GUGGENHEIM FUNDS ANNUAL REPORT | 133 |
OTHER INFORMATION (Unaudited)(continued) |
performance, with peer group and universe comparisons. The Committee assessed the data provided in the FUSE reports as well as commentary and supporting data presented by Guggenheim, including, among other things, a summary of notable distinctions between certain Funds and the applicable peer group identified in the FUSE reports, as well as a discussion of those instances in which FUSE adjusted a peer group after considering a request by management to re-evaluate the peer group constituent funds.
In addition, Guggenheim provided materials and data in response to formal requests for information sent by Independent Legal Counsel on behalf of the Independent Trustees. Guggenheim also made a presentation at the April Meeting which, among other things, addressed areas identified for discussion by the Independent Trustees and Independent Legal Counsel. Throughout the process, the Committee asked questions of management and requested certain additional information, which Guggenheim provided following the April Meeting (collectively with the foregoing reports and materials, the “Contract Review Materials”).
The Committee considered the Contract Review Materials in the context of its accumulated experience governing the Trust and weighed the factors and standards discussed with Independent Legal Counsel. Following an analysis and discussion of the factors identified below and in the exercise of its business judgment, the Committee concluded that it was in the best interest of each Fund to recommend that the Board approve the renewal of each Advisory Agreement and the GPIM Sub-Advisory Agreement for an additional annual term.
Advisory Agreements
Nature, Extent and Quality of Services Provided by each Adviser: With respect to the nature, extent and quality of services currently provided by each Adviser, the Committee considered the information provided by Guggenheim concerning the education, experience, professional affiliations, areas of responsibility and duties of key personnel performing services for the Funds, including those personnel providing compliance oversight, as well as the supervisors and reporting lines for such personnel. In this connection, the Committee considered Guggenheim’s resources and related efforts to retain, attract and motivate capable personnel to serve the Funds and noted Guggenheim’s report on recent additions, departures and transitions in personnel who work on matters relating to the Funds or are significant to the operations of each Adviser. The Committee also considered the Advisers’ attention to relevant developments in the mutual fund industry and its observance of compliance and regulatory requirements, and noted that on a regular basis the Board receives and reviews information from the Trust’s Chief Compliance Officer regarding compliance policies and procedures established pursuant to Rule 38a-1 under the 1940 Act, as well as from Guggenheim’s Chief Risk Officer. The Committee also noted updates by Guggenheim to certain compliance programs, including with respect to Code of Ethics monitoring, and the implementation of additional forensic testing. The Committee took into consideration the settlement of a regulatory matter concerning GPIM and remedial steps taken in response by Guggenheim to enhance its organizational structure for compliance. In this connection, the Committee considered information provided by Guggenheim regarding the findings of an independent compliance consultant retained to review GPIM’s compliance program and the consultant’s conclusion that the program is reasonably designed to prevent and detect violations of the Investment Advisers Act of 1940, as amended, and the rules promulgated thereunder. Moreover, in connection with the Committee’s evaluation of the overall package of services provided by each Adviser, the Committee considered each Adviser’s administrative capabilities, including its role in monitoring and coordinating compliance responsibilities with the fund administrator, transfer agent, distributor, custodian and other service providers to the Funds. In addition, because Municipal Income Fund is sub-advised, the Committee took into account information provided by Guggenheim describing the Adviser’s processes and activities for providing oversight of sub-advisers, including information regarding the Adviser’s Sub-Advisory Oversight Committee.
With respect to Guggenheim’s resources and the ability of each Adviser to carry out its responsibilities under the applicable Advisory Agreement, the Chief Financial Officer of Guggenheim Investments reviewed with the Committee certain unaudited financial information concerning the holding company for Guggenheim Investments, Guggenheim Partners Investment Management Holdings, LLC (“GPIMH”). (Thereafter, the Committee received the audited consolidated financial statements of GPIMH and the audited financial statements of GPIM as supplemental information.)
The Committee also considered the acceptability of the terms of each Advisory Agreement, including the scope of services required to be performed by each Adviser.
Based on the foregoing, and based on other information received (both oral and written) at the April Meeting and the May Meeting, as well as other considerations, including the Committee’s knowledge of how each Adviser performs its duties through Board meetings, discussions and reports during the year, the Committee concluded that each Adviser and its personnel were qualified to serve the Funds in such capacity and may reasonably be expected to continue to provide a high quality of services under each Advisory Agreement with respect to the Funds.
134 | THE GUGGENHEIM FUNDS ANNUAL REPORT | |
OTHER INFORMATION (Unaudited)(continued) |
Investment Performance: The Committee received, for each Fund, investment returns for the ten-year, five-year, three-year, one-year and three-month periods ended December 31, 2015, as applicable. In addition, the Committee received a comparison of each Fund’s performance to the performance of a benchmark, a universe of funds and a narrower peer group of similar funds with comparable asset levels as identified by FUSE, in each case for the same periods, as applicable. The Committee also received from FUSE representatives and considered a description of the methodology employed by FUSE for identifying each Fund’s peer group and universe for performance and expense comparisons.
In seeking to evaluate Fund performance over a full market cycle, the Committee generally focused its attention first on five-year and three-year performance rankings as compared to the relevant universe of funds. The Committee also considered more recent performance periods, including the one-year period and, as deemed appropriate, the three-month period, for certain Funds such as for those Funds that were recently launched or had undergone recent changes in investment strategies, as well as circumstances in which enhancements were made to the portfolio management processes or techniques employed for a Fund. In this connection, the Committee made the following observations:
Alpha Opportunity Fund: The Fund’s Class A shares outperformed the performance universe median for the five-year and three-year periods, ranking in the 6th and 9th percentiles, respectively. The Committee considered the limitations on portfolio management as a result of the 2008 Lehman bankruptcy, and subsequent changes to the Fund’s investment strategies, noting that the Fund re-opened to subscriptions with a new U.S. long/short equity investment strategy on January 28, 2015. In light of the foregoing, the Committee also considered more recent performance periods, including the one-year and three-month periods ended December 31, 2015, and observed that the Fund’s Class A shares ranked in the 72nd and 92nd percentiles, respectively of its performance universe. Given the limited period of time that the Adviser has managed the Fund pursuant to its new investment program, the Committee also took into account updated performance data provided by the Adviser in connection with the May Meeting and noted that the Fund’s net performance for the one-year and three-month periods ended March 31, 2016 ranked in the 6th and 1st percentiles, respectively of the Morningstar Long/Short Equity peer group.
Floating Rate Strategies Fund: The Committee noted the Fund’s inception date of November 30, 2011, and observed that the Fund’s Class A shares ranked in the 1st and 5th percentiles of its performance universe for the three-year and one-year periods ended December 31, 2015, respectively, outperforming its performance universe median for each of these periods.
High Yield Fund: The returns of the Fund’s Class A shares ranked in the 46th and 10th percentiles of its performance universe for the five-year and three-year periods ended December 31, 2015, respectively, and outperformed the performance universe median for each of these periods.
Investment Grade Bond Fund: The returns of the Fund’s Class A shares ranked in the 1st percentile of its performance universe for both the five-year and three-year periods ended December 31, 2015, outperforming its performance universe median for both of these periods.
Limited Duration Fund: The Committee noted the Fund’s inception date of December 16, 2013, and observed that the returns of the Fund’s Class A shares ranked in the 1st and 10th percentiles of the performance universe for the one-year and three-month periods ended December 31, 2015, respectively, outperforming the median returns.
Macro Opportunities Fund: The Committee noted the Fund’s inception date of November 30, 2011, and observed that the returns of the Fund’s Class A shares ranked in the 6th and 57th percentiles of the performance universe for the three-year and one-year periods ended December 31, 2015, respectively, and outperformed the performance universe median for the three-year period.
Municipal Income Fund: The Committee considered that Security Investors does not directly manage the investment portfolio but has delegated such duties to GPIM. Based on the information provided and the review of the Fund’s investment performance, the Committee concluded that Security Investors had appropriately reviewed and monitored GPIM’s investment performance as Sub-Adviser to the Fund.
Risk Managed Real Estate Fund: The Committee noted the Fund’s inception date of February 12, 2014, and observed the returns of the Fund’s Class A shares ranked in the 31st and 76th percentile of its performance universe for the one-year and three-month periods ended December 31, 2015, respectively.
StylePlus—Large Core Fund: The returns of the Fund’s Class A shares ranked in the 39th percentile of its performance universe for the three-year period ended December 31, 2015. The Committee noted that the Fund implemented a strategy change and a new portfolio management team in May 2013. In light of the foregoing, the Committee also considered more recent performance periods in addition to the three-year performance,
| | THE GUGGENHEIM FUNDS ANNUAL REPORT | 135 |
OTHER INFORMATION (Unaudited)(continued) |
including the one-year and three-month periods ended December 31, 2015, and observed that the returns of the Fund’s Class A shares exceeded the median of its performance universe for both periods, ranking in the 25th and 22nd percentiles for the one-year and three-month periods, respectively.
StylePlus—Mid Growth Fund: The returns of the Fund’s Class A shares ranked in the 45th percentile of its performance universe for the three-year period ended December 31, 2015. The Committee noted that the Fund implemented a strategy change and a new portfolio management team in May 2013. In light of the foregoing, the Committee considered more recent performance periods in addition to the three-year performance, including the one-year and three-month periods ended December 31, 2015, and observed that the returns of the Fund’s Class A shares exceeded the median of its performance universe for both periods, ranking in the 42nd and 45th percentiles for the one-year and three-month periods, respectively.
Total Return Bond Fund: The Committee noted the Fund’s inception date of November 30, 2011, and observed that the returns of the Fund’s Class A shares ranked in the 1st and 12th percentiles of its performance universe for the three-year and one-year periods ended December 31, 2015, respectively, and outperformed the performance universe median for each of these periods.
World Equity Income Fund: The returns of the Fund’s Class A shares ranked in the 66th percentile of its performance universe for the three-year period ended December 31, 2015. The Committee noted that the Fund implemented a strategy change and a new portfolio management team in August 2013. In light of the foregoing, the Committee considered more recent performance periods in addition to the three-year performance, including the one-year and three-month periods ended December 31, 2015, and observed that the returns of the Fund’s Class A shares exceeded the median of its performance universe for both periods, ranking in the 43rd and 39th percentiles for the one-year and three-month periods, respectively.
Value Funds: Large Cap Value Fund, Mid Cap Value Fund, Mid Cap Value Institutional Fund and Small Cap Value Fund
Large Cap Value Fund: The returns of the Class A shares underperformed the performance universe median for the five-year, three-year, one-year and three-month periods ended December 31, 2015, and ranked in the 83rd, 72nd, 72nd and 67th percentiles, respectively.
Mid Cap Value Fund: The returns of the Class A shares underperformed the performance universe median for the five-year, three-year, one-year and three-month periods ended December 31, 2015, and ranked in the 83rd, 79th, 75th and 81st percentiles, respectively.
Mid Cap Value Institutional Fund: The Fund’s returns underperformed the performance universe median for the five-year, three-year, one-year and three-month periods ended December 31, 2015, and ranked in the 82nd, 75th, 70th and 67th percentiles, respectively.
Small Cap Value Fund: The Fund underperformed its performance universe median for the five-year, three-year and one-year periods ended December 31, 2015, ranking in the 80th percentile for the five-year and three-year periods and in the 67th percentile for the one-year period. The Fund outperformed its performance universe median for three-month period ended December 31, 2015, and ranked in the 29th percentile.
In response to the Committee’s request, representatives from the Adviser provided information regarding, and discussed factors impacting, each Value Fund’s performance, including market trends and stock selection. The Adviser’s representatives also discussed the portfolio management team’s philosophy and processes and explained their expectations and strategies for the future. The Committee noted measures taken by the Adviser to remedy relative longer-term underperformance with respect to each of the Value Funds, including strategy enhancements such as implementation of a refined stock selection process and additional risk controls to enforce the strategy’s sell discipline. The Committee noted that the Adviser believes the enhancements to the portfolio management techniques employed for each Value Fund, used in conjunction with existing proprietary quantitative models, will help improve the Fund‘s performance results. In light of the foregoing, the Committee requested and the Adviser provided supplemental performance data to enable the Committee to evaluate the impact of the strategy enhancements. In this connection, the Committee considered that the data provided by the Adviser indicated that each Value Fund’s performance was improving, with performance for the first quarter of 2016 ranking better than the trailing one-year return. The Committee also considered the Adviser’s statement that it believes the improving trend in performance relative to peers reflects the enhancements implemented in the investment process. The Committee also noted Guggenheim’s commitment to monitor each Value Fund’s performance and update the Independent Trustees on a quarterly basis as to the impact of the process enhancements implemented to-date and advise on other steps that might be taken to further address each Fund’s performance, if necessary.
136 | THE GUGGENHEIM FUNDS ANNUAL REPORT | |
OTHER INFORMATION (Unaudited)(continued) |
After reviewing the foregoing and related factors, the Committee concluded that: (i) each Fund’s performance was acceptable; or (ii) it was satisfied with Guggenheim’s responses and efforts relating to investment performance.
Comparative Fees, Costs of Services Provided and the Profits Realized by each Adviser from Its Relationship with the Funds: The Committee compared each Fund’s contractual advisory fee and total net expense ratio to the applicable peer group. The Committee also reviewed the median advisory fees and expense ratios, including expense ratio components (e.g., transfer agency fees, administration fees, other operating expenses, distribution fees and fee waivers/reimbursements) of the peer group of funds. In response to a supplemental request, the Committee also received and reviewed aggregated advisory and administrative fees compared to the peer group average and median.
As part of its evaluation of each Fund’s advisory fee, the Committee considered how such fees compared to the advisory fee charged by the applicable Adviser to one or more other funds, separate accounts and/or other types of client portfolios and investment vehicles that it manages pursuant to a similar investment objective and strategies, to the extent applicable, noting that, in certain instances, Guggenheim charges a lower advisory fee to such other clients. In this connection, the Committee considered, among other things, Guggenheim’s representations about the significant differences between managing mutual funds as compared to other types of accounts, including the additional resources required to effectively manage mutual fund assets and the greater regulatory costs associated with the management of such assets. The Committee also considered Guggenheim’s explanation that lower fees are charged in certain instances due to various other factors, including the scope of contract, type of investors, applicable legal, governance and capital structures, tax status and historical pricing reasons. With respect to the difference in fees charged to a comparable client that is a mutual fund, as to which Guggenheim serves as sub-adviser, the Committee took into account the following: Guggenheim advises that it has less legal and regulatory exposure as a sub-adviser to an unaffiliated fund and does not take on the same business risk because Guggenheim is not the sponsor of that fund. The Committee concluded that the information it received demonstrated that the aggregate services provided to the Funds were sufficiently different from those provided to other clients with similar investment strategies and/or the risks borne by Guggenheim were sufficiently greater than those associated with managing other clients with similar investment strategies to support the difference in fees.
In further considering the comparative fee and expense data presented in the Contract Review Materials and addressed by Guggenheim, the Committee made the following observations:
Alpha Opportunity Fund: The average contractual advisory fee percentile rank across all share classes of the Fund and the asset weighted total net expense ratio are in the second quartile (27th and 46th percentiles, respectively) of its peer group. The Committee also considered that the Adviser had entered into an expense limitation agreement with respect to the Fund.
Floating Rate Strategies Fund: The average contractual advisory fee percentile rank across all share classes of the Fund is in the fourth quartile (83rd percentile) of its peer group and the asset weighted total net expense ratio is in the second quartile (45th percentile) of its peer group. The Committee also considered that the Adviser had entered into an expense limitation agreement with respect to the Fund.
High Yield Fund: The average contractual advisory fee percentile rank across all share classes of the Fund is in the second quartile (40th percentile) of its peer group and the asset weighted total net expense ratio is in the fourth quartile (77th percentile) of its peer group. The Committee also considered that the Adviser had entered into an expense limitation agreement with respect to the Fund.
Investment Grade Bond Fund: The average contractual advisory fee percentile rank across all share classes of the Fund is in the third quartile (54th percentile) of its peer group and the asset weighted total net expense ratio is in the fourth quartile (83rd percentile) of its peer group. The Committee also considered that the Adviser had entered into an expense limitation agreement with respect to the Fund.
Large Cap Value Fund: The average contractual advisory fee percentile rank across all share classes of the Fund is in the first quartile (22nd percentile) of its peer group and the asset weighted total net expense ratio is in the second quartile (35th percentile) of its peer group. The Committee also considered that the Adviser had entered into an expense limitation agreement with respect to the Fund.
Limited Duration Fund: The average contractual advisory fee percentile rank across all share classes of the Fund is in the third quartile (66th percentile) of its peer group, as is the Fund’s asset weighted total net expense ratio (63rd percentile). The Committee also considered that the Adviser had entered into an expense limitation agreement with respect to the Fund.
| | THE GUGGENHEIM FUNDS ANNUAL REPORT | 137 |
OTHER INFORMATION (Unaudited)(continued) |
Macro Opportunities Fund: The average contractual advisory fee percentile rank across all share classes of the Fund is in the fourth quartile (98th percentile) of its peer group, as is the Fund’s the asset weighted total net expense ratio (95th percentile). The Committee also considered that the Adviser had entered into an expense limitation agreement with respect to the Fund. In addition, the Committee noted that the Fund is categorized as a non-traditional bond fund which seeks to add value by investing in many non-traditional securities outside of fixed income, including equities, currencies, commodities and derivatives. In this connection, the Committee considered the Adviser’s statement that it supports the Fund with significant resources and a unique approach to drive performance for investors.
Mid Cap Value Fund: The average contractual advisory fee percentile rank across all share classes of the Fund is in the second quartile (37th percentile) of its peer group and the asset weighted total net expense ratio is in the fourth quartile (94th percentile) of its peer group.
Mid Cap Value Institutional Fund: The contractual advisory fee of the Fund is in the first quartile (6th percentile) of its peer group and the total net expense ratio is in the third quartile (63rd percentile) of its peer group.
Municipal Income Fund: The average contractual advisory fee percentile rank across all share classes of the Fund is in the second quartile (39th percentile) and the asset weighted total net expense ratio is in the 25th percentile of its peer group. The Committee also considered that the Adviser had entered into an expense limitation agreement with respect to the Fund.
Risk Managed Real Estate Fund: The average contractual advisory fee percentile rank across all share classes of the Fund and the asset weighted total net expense ratio are in the first quartile (1st percentile as to each) of its peer group.
StylePlus—Large Core Fund: The average contractual advisory fee percentile rank across all share classes of the Fund is in the third quartile (71st percentile) and the asset weighted total net expense ratio is in the fourth quartile (86th percentile) of its peer group.
StylePlus—Mid Growth Fund: The average contractual advisory fee percentile rank across all share classes of the Fund is in the second quartile (29th percentile) of its peer group and the asset weighted total net expense ratio is in the fourth quartile (92nd percentile) of its peer group.
Small Cap Value Fund: The average contractual advisory fee percentile rank across all share classes of the Fund is in the fourth quartile (75th percentile) of its peer group and the asset weighted total net expense ratio is in the first quartile (11th percentile) of its peer group. The Committee also considered that the Adviser had entered into an expense limitation agreement with respect to the Fund.
Total Return Bond Fund: The average contractual advisory fee percentile rank across all share classes of the Fund is in the fourth quartile (93rd percentile) of its peer group and the asset weighted total net expense ratio is in the third quartile (65th percentile) of its peer group. The Committee also considered that the Adviser had entered into an expense limitation agreement with respect to the Fund.
World Equity Income Fund: The average contractual advisory fee percentile rank across all share classes of the Fund is in the second quartile (31st percentile) of its peer group and the asset weighted total net expense ratio is in the fourth quartile (92nd percentile) of its peer group. The Committee also considered that the Adviser had entered into an expense limitation agreement with respect to the Fund.
With respect to the costs of services provided and profits realized by Guggenheim Investments from its relationship with the Funds, the Committee reviewed a profitability analysis and data from management for each Fund setting forth the average assets under management for the twelve months ended December 31, 2015, ending assets under management as of December 31, 2015, gross revenues received by Guggenheim Investments, expenses allocated to the Fund, earnings and the operating margin/profitability rate, including variance information relative to the foregoing amounts as of December 31, 2014. In addition, the Chief Financial Officer of Guggenheim Investments reviewed with, and addressed questions from, the Committee concerning the expense allocation methodology employed in producing the profitability analysis.
In the course of its review of Guggenheim Investments’ profitability, the Committee took into account the methods used by Guggenheim Investments to determine expenses and profit and reviewed a report from an independent accounting firm evaluating Guggenheim Investments’ approach to allocating costs and determining the profitability of Guggenheim Investments with respect to individual funds and the entire fund complex. In evaluating the costs of services provided and the profitability to Guggenheim Investments, based upon the profitability rates presented by Guggenheim Investments and the conclusion of the independent accounting firm that the methodology used for calculating such rates was reasonable, the Committee concluded that the profits were not unreasonable.
138 | THE GUGGENHEIM FUNDS ANNUAL REPORT | |
OTHER INFORMATION (Unaudited)(continued) |
The Committee considered other benefits available to each Adviser because of its relationship with the Funds and noted that Security Investors and GPIM may be deemed to benefit from arrangements whereby an affiliate, Rydex Fund Services, LLC, currently receives fees for (i) performing certain administrative functions and bookkeeping, accounting and pricing functions for the Funds pursuant to a Fund Accounting and Administration Agreement, and (ii) acting as transfer agent for the Funds and performing all shareholder servicing functions, including transferring record ownership, processing purchase and redemption transactions, answering inquiries, mailing shareholder communications, and acting as the dividend disbursing agent pursuant to a Transfer Agency Agreement. The Committee reviewed the compensation arrangements for the provision of the foregoing services, as well as Guggenheim’s profitability from providing such services. The Committee also noted Guggenheim’s statement that it may benefit from marketing synergies arising from offering a broad spectrum of products, including the Funds.
Economies of Scale: The Committee received and considered information regarding whether there have been economies of scale with respect to the management of the Funds as Fund assets grow, whether the Funds have appropriately benefited from any economies of scale, and whether there is potential for realization of any further economies of scale. The Committee considered whether economies of scale in the provision of services to the Funds were being passed along to the shareholders. The Committee noted the Adviser’s statement that Guggenheim continues to develop the infrastructure needed to support Fund asset growth and to achieve economies of scale across the firm’s various products and product lines. Thus, while Guggenheim may be benefiting from certain economies of scale and related cost efficiencies, it is concurrently realizing new costs and expenses associated with investment in infrastructure to support growth. The Committee took into account the additional information provided by Guggenheim at the Committee’s request regarding the investments made to support the growth of the organization, noting, among other things, enhancements to improve operational efficiency and further development of compliance-related functions, as well as Guggenheim’s view as to how such investments benefit the Funds.
As part of its assessment of economies of scale, the Committee also considered Guggenheim’s view that it seeks to share economies of scale through expense limitations and/or through advisory fees set at competitive rates pre-assuming future asset growth. Thus, the Committee considered the size of the Funds and the competitiveness of and/or other determinations made regarding the current advisory fee for each Fund, as well as whether a Fund is subject to an expense limitation.
As to the size of the Funds, the Committee took into account Guggenheim’s statement that generally the Funds’ assets are not sufficiently large to warrant breakpoints, with only three Funds—Floating Rate Strategies Fund, Macro Opportunities Fund, and Total Return Bond Fund—having assets in excess of (or approaching) $1 billion. With respect to the three Funds noted, the Committee considered the levels of profitability reported. The Committee also noted that each of the three Funds is subject to an expense limitation agreement, which results in a lower effective advisory fee.
The Committee determined that, taking into account all relevant factors, the advisory fee for each Fund was reasonable.
Sub-Advisory Agreement
Nature, Extent and Quality of Services Provided by the Sub-Adviser: With respect to the nature, extent and quality of services provided by GPIM (referred to in this discussion as the “Sub-Adviser”), the Committee considered the qualifications, experience and skills of the Sub-Adviser’s portfolio management and other key personnel and information from the Sub-Adviser describing the scope of its services to Municipal Income Fund. The Committee also considered the information provided by the Sub-Adviser concerning the Sub-Adviser’s business continuity and information security plans and controls, and compliance policies and procedures, among other things.
With respect to Guggenheim’s resources and the Sub-Adviser’s ability to carry out its responsibilities under the Sub-Advisory Agreement, as noted above, the Committee considered the financial condition of GPIMH. (Thereafter, the Committee received the audited financial statements of GPIM as supplemental information.)
The Committee also considered the acceptability of the terms of the Sub-Advisory Agreement. Based on the foregoing, and based on other information received (both oral and written) at the April Meeting and at the May Meeting, as well as other considerations, including the Committee’s knowledge of how the Sub-Adviser performs its duties through Board meetings, discussions and reports throughout the year, the Committee concluded that the Sub-Adviser and its personnel were qualified to serve Municipal Income Fund in such capacity and may reasonably be expected to continue to provide a high quality of services under the Sub-Advisory Agreement.
| | THE GUGGENHEIM FUNDS ANNUAL REPORT | 139 |
OTHER INFORMATION (Unaudited)(concluded) |
Investment Performance: The Committee considered that the Fund’s Class A shares ranked in the third quartile (65th and 68th percentiles) of its performance universe for the five-year and three-year periods ended December 31, 2015, respectively. On January 13, 2012, the Fund acquired the assets and assumed the liabilities of TS&W/Claymore Tax-Advantaged Balanced Fund (the “Predecessor Fund”), a closed-end fund which used different investment strategies and had different investment advisers. Class A shares of the Fund have assumed the performance, financial and other historical information of the Predecessor Fund’s common shares and the performance of Class A shares of the Fund reflects the performance of the Predecessor Fund. In light of the foregoing, the Committee took into account more recent periods and noted that Fund’s Class A shares ranked in the fourth quartile for the one-year period ended December 31, 2015, and outperformed the performance universe median for the three-month period ended December 31, 2015, ranking in the 39th percentile. In considering the Fund’s performance for the one-year period, the Committee considered Guggenheim’s explanation that the Fund is managed very conservatively and the portfolio management team opted to maintain short duration by allocating to floating rate securities, which was a drag on performance for the period as the Federal Reserve increased interest rates fewer times than had been expected by the team. In light of all the facts and circumstances, the Committee concluded that the investment performance of the Fund and the Sub-Adviser was acceptable.
Comparative Fees, Costs of Services Provided and the Profits Realized by the Sub-Adviser from Its Relationship with the Fund: The Committee reviewed the level of sub-advisory fees payable to GPIM, noting that the fees are paid by Security Investors and do not impact the fees paid by the Fund.
Economies of Scale: The Committee recognized that, because the Sub-Adviser’s fees are paid by the Adviser and not the Fund, the analysis of economies of scale was more appropriate in the context of the Committee’s consideration of the applicable Advisory Agreement, which was separately considered. (See “Advisory Agreements – Economies of Scale” above.)
Overall Conclusions
Based on the foregoing, the Committee determined that the investment advisory fees are fair and reasonable in light of the extent and quality of the services provided and other benefits received and that the continuation of the Agreements is in the best interest of each Fund. In reaching this conclusion, no single factor was determinative or conclusive and each Committee member, in the exercise of his business judgment, may attribute different weights to different factors. At the May Meeting, the Committee, constituting all of the Independent Trustees, recommended the renewal of each Advisory Agreement and the Sub-Advisory Agreement for an additional annual term.
140 | THE GUGGENHEIM FUNDS ANNUAL REPORT | |
INFORMATION ON BOARD OF TRUSTEES AND OFFICERS (Unaudited) |
A Board of Trustees oversees the Trust, as well as other trusts of GI, in which its members have no stated term of service, and continue to serve after election until resignation. The Statement of Additional Information includes further information about Fund Trustees and Officers, and can be obtained without charge by visiting guggenheiminvestments.com or by calling 800.820.0888.
Name, Address* and Year of Birth | Position(s)
Held with
the Trust | Term of Office and Length of Time Served** | Principal Occupation(s) During Past Five Years | Number of Portfolios in Fund Complex Overseen | Other
Directorships
Held by Trustees |
INDEPENDENT TRUSTEES | | | |
Randall C. Barnes (1951) | Trustee | Since 2014 | Current: Private Investor (2001-present). Former: Senior Vice President and Treasurer, PepsiCo, Inc. (1993-1997); President, Pizza Hut International (1991-1993); Senior Vice President, Strategic Planning and New Business Development, PepsiCo, Inc. (1987-1990). | 101 | Current: Trustee, Purpose Investments Inc. (2014-Present). |
Donald A. Chubb, Jr. (1946) | Trustee | Since 1994 | Current: Business broker and manager of commercial real estate, Griffith & Blair, Inc. (1997-present). | 97 | Current: Midland Care, Inc. (2011-present). |
Jerry B. Farley (1946) | Trustee | Since 2005 | Current: President, Washburn University (1997-present). | 97 | Current: Westar Energy, Inc. (2004-present); CoreFirst Bank & Trust (2000-present). |
Roman Friedrich III (1946) | Trustee and Chairman of the Contracts Review Committee | Since 2014 | Current: Founder and Managing Partner, Roman Friedrich & Company (1998-present). Former: Senior Managing Director, MLV & Co. LLC (2010-2011). | 97 | Current: Zincore Metals, Inc. (2009-present). Former: Axiom Gold and Silver Corp. (2011-2012). |
Robert B. Karn III (1942) | Trustee and Chairman of the Audit Committee | Since 2014 | Current: Consultant (1998-present). Former: Arthur Andersen (1965-1997) and Managing Partner, Financial and Economic Consulting, St. Louis office (1987-1997). | 97 | Current: Peabody Energy Company (2003-present); GP Natural Resource Partners, LLC (2002- present). |
Ronald A. Nyberg (1953) | Trustee and Chairman of the Nominating and Governance Committee | Since 2014 | Current: Partner, Momkus McCluskey Roberts, LLC (2016-present). Former: Partner, Nyberg & Cassioppi, LLC (2000-2016); Executive Vice President, General Counsel, and Corporate Secretary, Van Kampen Investments (1982-1999). | 103 | Current: Edward-Elmhurst Healthcare System (2012-present). |
Maynard F. Oliverius (1943) | Trustee | Since 1998 | Current: Retired. Former: President and CEO, Stormont-Vail HealthCare (1996-2012). | 97 | Current: Fort Hays State University Foundation (1999-present); Stormont-Vail Foundation (2013-present); University of Minnesota HealthCare Alumni Association Foundation (2009-present). Former: Topeka Community Foundation (2009-2014). |
| | THE GUGGENHEIM FUNDS ANNUAL REPORT | 141 |
INFORMATION ON BOARD OF TRUSTEES AND OFFICERS (Unaudited)(continued) |
Name, Address* and Year of Birth | Position(s)
Held with
the Trust | Term of Office and Length of Time Served** | Principal Occupation(s) During Past Five Years | Number of Portfolios in Fund Complex Overseen | Other
Directorships Held by Trustees |
INDEPENDENT TRUSTEES - concluded | | |
Ronald E. Toupin, Jr. (1958) | Trustee and Chairman of the Board | Since 2014 | Current: Portfolio Consultant (2010-present). Former: Vice President, Manager and Portfolio Manager, Nuveen Asset Management (1998-1999); Vice President, Nuveen Investment Advisory Corp. (1992-1999); Vice President and Manager, Nuveen Unit Investment Trusts (1991-1999); and Assistant Vice President and Portfolio Manager, Nuveen Unit Investment Trusts (1988-1999), each of John Nuveen & Co., Inc. (1982-1999). | 100 | Former: Bennett Group of Funds (2011-2013). |
INTERESTED TRUSTEE | |
Donald C. Cacciapaglia*** (1951) | President, Chief Executive Officer and Trustee | Since 2012 | Current: President and CEO, certain other funds in the Fund Complex (2012-present); Vice Chairman, Guggenheim Investments (2010-present). Former: Chairman and CEO, Channel Capital Group, Inc. (2002-2010). | 232 | Current: Clear Spring Life Insurance Company (2015-present); Guggenheim Partners Japan, Ltd. (2014-present); Guggenheim Partners Investment Management Holdings, LLC (2014-present); Delaware Life (2013-present); Guggenheim Life and Annuity Company (2011-present); Paragon Life Insurance Company of Indiana (2011-present). |
* | The business address of each Trustee is c/o Guggenheim Investments, 227 West Monroe Street, Chicago, Illinois 60606. |
** | Each Trustee serves an indefinite term, until his successor is elected and qualified. Time served includes time served in the respective position for the Predecessor Corporation. |
*** | This Trustee is deemed to be an “interested person” of the Funds under the 1940 Act by reason of his position with the Funds’ Investment Manager and/or the parent of the Investment Manager. |
142 | THE GUGGENHEIM FUNDS ANNUAL REPORT | |
INFORMATION ON BOARD OF TRUSTEES AND OFFICERS (Unaudited)(continued) |
Name, Address* and Year of Birth | Position(s)
Held with
the Trust | Term of Office and Length of Time Served** | Principal Occupations
During Past Five Years |
OFFICERS | | | |
William H. Belden, III (1965) | Vice President | Since 2014 | Current: Vice President, certain other funds in the Fund Complex (2006-present); Managing Director, Guggenheim Funds Investment Advisors, LLC (2005-present). Former: Vice President of Management, Northern Trust Global Investments (1999-2005). |
Joanna M. Catalucci (1966) | AML Officer | Since 2016 | Current: Chief Compliance Officer, certain funds in the Fund Complex (2012-present); Senior Managing Director, Guggenheim Investments (2012-present); AML Officer, certain funds in the Fund Complex (2016-present). Former: Chief Compliance Officer and Secretary, certain other funds in the Fund Complex (2008-2012); Senior Vice President & Chief Compliance Officer, Security Investors, LLC and certain affiliates (2010-2012); Chief Compliance Officer and Senior Vice President, Rydex Advisors, LLC and certain affiliates (2010-2011). |
James M. Howley (1972) | Assistant Treasurer | Since 2014 | Current: Director, Guggenheim Investments (2004-present) ; Assistant Treasurer, certain other funds in the Fund Complex (2006-present). Former: Manager, Mutual Fund Administration of Van Kampen Investments, Inc. (1996-2004). |
Keith D. Kemp (1960) | Assistant Treasurer | Since 2010 (Treasurer) Since 2016 (Assistant Treasurer) | Current: Managing Director of Transparent Value, LLC (2015-present); Managing Director of Guggenheim Investments (2015-present). Former: Director, Transparent Value, LLC (2010-2015); Director, Guggenheim Investments (2010-2015); Chief Operating Officer, Macquarie Capital Investment Management (2007-2009). |
Amy J. Lee (1961) | Vice President and Chief Legal Officer | Since 2007 (Vice President) Since 2014 (Chief Legal Officer) | Current: Chief Legal Officer, certain other funds in the Fund Complex (2013-present); Senior Managing Director, Guggenheim Investments (2012-present). Former: Vice President, Associate General Counsel and Assistant Secretary, Security Benefit Life Insurance Company and Security Benefit Corporation (2004-2012). |
Mark E. Mathiasen (1978) | Secretary | Since 2014 | Current: Secretary, certain other funds in the Fund Complex (2007-present); Managing Director, Guggenheim Investments (2007-present). |
Glenn McWhinnie (1969) | Assistant Treasurer | Since 2016 | Current: Vice President, Guggenheim Investments (2009-present). Former: Tax Compliance Manager, Ernst & Young LLP (1996-2009). |
Michael P. Megaris (1984) | Assistant Secretary | Since 2014 | Current: Assistant Secretary, certain other funds in the Fund Complex (2014-present); Vice President, Guggenheim Investments (2012-present). Former: J.D., University of Kansas School of Law (2009-2012). |
Elisabeth Miller (1968) | Chief Compliance Officer | Since 2012 | Current: CCO, certain other funds in the Fund Complex (2012-present); CCO, Security Investors, LLC (2012-present); CCO, Guggenheim Funds Investment Advisors, LLC (2012-present); Managing Director, Guggenheim Investments (2012-present); Vice President, Guggenheim Funds Distributors, LLC (2014-present). Former: CCO, Guggenheim Distributors, LLC (2009-2014); Senior Manager, Security Investors, LLC (2004-2009); Senior Manager, Guggenheim Distributors, LLC (2004-2009). |
| | THE GUGGENHEIM FUNDS ANNUAL REPORT | 143 |
INFORMATION ON BOARD OF TRUSTEES AND OFFICERS (Unaudited)(concluded) |
Name, Address* and Year of Birth | Position(s)
Held with the Trust | Term of Office and Length of Time Served** | Principal Occupations
During Past Five Years |
OFFICERS - concluded | |
Adam J. Nelson (1979) | Assistant Treasurer | Since 2015 | Current: Vice President, Guggenheim Investments (2015-present); Assistant Treasurer, certain other funds in the Fund Complex (2015-present). Former: Assistant Vice President and Fund Administration Director, State Street Corporation (2013-2015); Fund Administration Assistant Director, State Street (2011-2013); Fund Administration Manager, State Street (2009-2011). |
Kimberly J. Scott (1974) | Assistant Treasurer | Since 2014 | Current: Vice President, Guggenheim Investments (2012-present) ; Assistant Treasurer, certain other funds in the Fund Complex (2012-present). Former: Financial Reporting Manager, Invesco, Ltd. (2010-2011); Vice President/Assistant Treasurer, Mutual Fund Administration for Van Kampen Investments, Inc./Morgan Stanley Investment Management (2009-2010); Manager of Mutual Fund Administration, Van Kampen Investments, Inc./Morgan Stanley Investment Management (2005-2009). |
Bryan Stone (1979) | Vice President | Since 2014 | Current: Vice President, certain other funds in the Fund Complex (2014-present); Director, Guggenheim Investments (2013-present). Former: Senior Vice President, Neuberger Berman Group LLC (2009-2013); Vice President, Morgan Stanley (2002-2009). |
John L. Sullivan (1955) | Chief Financial Officer and Treasurer | Since 2014 | Current: CFO, Chief Accounting Officer and Treasurer, certain other funds in the Fund Complex (2010-present); Senior Managing Director, Guggenheim Investments (2010-present). Former: Managing Director and CCO, each of the funds in the Van Kampen Investments fund complex (2004-2010); Managing Director and Head of Fund Accounting and Administration, Morgan Stanley Investment Management (2002-2004); CFO and Treasurer, Van Kampen Funds (1996-2004). |
* | The business address of each officer is c/o Guggenheim Investments, 227 West Monroe Street, Chicago, Illinois 60606. |
** | Each officer serves an indefinite term, until his or her successor is duly elected and qualified. Time served includes time served in the respective position for the Predecessor Corporation. |
144 | THE GUGGENHEIM FUNDS ANNUAL REPORT | |
GUGGENHEIM INVESTMENTS PRIVACY POLICIES (Unaudited) |
Guggenheim Investments as used herein refers to Guggenheim Partners, LLC, Guggenheim Funds Investment Advisors, LLC, Guggenheim Partners Investment Management, LLC, Guggenheim Funds Distributors, LLC and Security Investors, LLC as well as the funds in the Guggenheim Funds complex (the “funds”).
Our Commitment to You
When you become a Guggenheim Investments investor, you entrust us with not only your hard-earned money but also with personal and financial information about you. We recognize that your relationship with us is based on trust and that you expect us to act responsibly and in your best interests. Because we have access to personal information about you, we hold ourselves to high standards in its safekeeping and use. This means, most importantly, that we do not sell client or account information to anyone—whether you are a current or former Guggenheim Investments client.
The Information We Collect About You and How We Collect It
In the course of doing business with shareholders and investors, we collect nonpublic personal information about you. You typically provide personal information when you complete a Guggenheim Investments account application or when you request a transaction that involves Rydex and Guggenheim Funds or one of the Guggenheim affiliated companies. “Nonpublic personal information” is personally identifiable information about you. For example it includes your name and address, Social Security or taxpayer identification number, assets, income, account balance, bank account information and investment activity (e.g. purchase and redemption history).
How We Share Your Personal Information
As a matter of policy, we do not disclose your nonpublic personal information to nonaffiliated third parties except as required or permitted by law. As emphasized above, we do not sell information about current or former clients or their accounts to third parties. Nor do we share such information, except when necessary to complete transactions at your request or to make you aware of related investment products and services that we offer. Additional details about how we handle your personal information are provided below.
To complete certain transactions or account changes that you direct, it may be necessary to provide your personal information to companies, individuals or groups that are not affiliated with Guggenheim Investments. For example if you ask to transfer assets from another financial institution to Guggenheim Investments, we will need to provide certain information about you to that company to complete the transaction. In connection with servicing your accounts or to alert you to other Guggenheim Investments investment products and services, we may share your information within the Guggenheim Investments family of affiliated companies. This would include, for example, sharing your information within Guggenheim Investments so we can make you aware of new funds or the services offered through another Guggenheim Investments affiliated company. In certain instances, we may contract with nonaffiliated companies to perform services for us. Where necessary, we will disclose information we have about you to these third parties. In all such cases, we provide the third party with only the information necessary to carry out its assigned responsibilities and only for that purpose. And we require these third parties to treat your personal information with the same high degree of confidentiality that we do. In certain instances, we may share information with other financial institutions regarding individuals and entities in response to the U.S.A. Patriot Act. Finally we will share personal information about you if we are compelled by law to do so, if you direct us to do so with your consent, or in other circumstances as permitted by law.
How We Safeguard Your Personal Information
We maintain physical, electronic and procedural safeguards to protect your personal information. Within Guggenheim Investments, access to such information is limited to those who need it to perform their jobs such as servicing your account, resolving problems or informing you of new products and services.
| | THE GUGGENHEIM FUNDS ANNUAL REPORT | 145 |
This page intentionally left blank.
This page intentionally left blank.
This page intentionally left blank.
This page intentionally left blank.
9.30.2016
Guggenheim Funds Annual Report
| |
Guggenheim Diversified Income Fund | | |
Guggenheim High Yield Fund | | |
Guggenheim Investment Grade Bond Fund | | |
Guggenheim Limited Duration Fund | | |
Guggenheim Municipal Income Fund | | |
GuggenheimInvestments.com | SBINC-ANN-0916x0917 |
DEAR SHAREHOLDER | 2 |
ECONOMIC AND MARKET OVERVIEW | 4 |
ABOUT SHAREHOLDERS’ FUND EXPENSES | 6 |
DIVERSIFIED INCOME FUND | 9 |
HIGH YIELD FUND | 19 |
INVESTMENT GRADE BOND FUND | 40 |
LIMITED DURATION FUND | 59 |
MUNICIPAL INCOME FUND | 78 |
NOTES TO FINANCIAL STATEMENTS | 90 |
REPORT OF INDEPENDENT REGISTERED PUBLIC ACCOUNTING FIRM | 109 |
OTHER INFORMATION | 110 |
INFORMATION ON BOARD OF TRUSTEES AND OFFICERS | 120 |
GUGGENHEIM INVESTMENTS PRIVACY POLICIES | 124 |
| | THE GUGGENHEIM FUNDS ANNUAL REPORT | 1 |
Dear Shareholder:
Security Investors, LLC, and Guggenheim Partners Investment Management, LLC, (the “Investment Advisers”) are pleased to present the shareholder report for a selection of our Funds (the “Funds”) for the annual fiscal period ended September 30, 2016.
The Investment Advisers are part of Guggenheim Investments, which represents the investment management businesses of Guggenheim Partners, LLC (“Guggenheim”), a global, diversified financial services firm.
Guggenheim Funds Distributors, LLC, is the distributor of the Funds. Guggenheim Funds Distributors, LLC is affiliated with Guggenheim and the Investment Advisers.
We encourage you to read the Economic and Market Overview section of the report, which follows this letter, and then the Managers’ Commentary for each Fund.
We are committed to providing innovative investment solutions and appreciate the trust you place in us.
Sincerely,

Donald C. Cacciapaglia
President and Chief Executive Officer
October 31, 2016
Read a prospectus and summary prospectus (if available) carefully before investing. It contains the investment objectives, risks, charges, expenses and other information, which should be considered carefully before investing. Obtain a prospectus and summary prospectus (if available) at guggenheiminvestments.com or call 800.820.0888.
Diversified Income Fund may not be suitable for all investors. ● The Fund’s market value will change in response to interest rate changes and market conditions among other factors. In general, bond prices rise when interest rates fall and vice versa. ● The Fund’s exposure to high yield securities may subject the fund to greater volatility. ● Derivatives may pose risks in addition to and greater than those associated with investing directly in securities or other investments, including risks relating to leverage, imperfect correlations with underlying investments or the fund’s other portfolio holdings, high price volatility, lack of availability, counterparty credit, liquidity, valuation and legal restrictions. ● Stock prices, especially stock prices of smaller companies, can be volatile as they reflect changes in the issuing company’s financial conditions and changes in the overall market ● Some asset-backed securities, including mortgage-backed securities, may have structures that make their reaction to interest rates and other factors difficult to predict, making their prices very volatile and they are subject to liquidity risk.● The Fund’s investments in other investment vehicles subject the fund to those risks and expenses affecting the investment vehicle. ● The Fund’s investments in foreign securities carry additional risks when compared to U.S. securities, due to the impact of diplomatic, political or economic developments in the country in question (investments in emerging markets securities are generally subject to an even greater level of risks). ● Investments in syndicated bank loans generally offer a floating interest rate and involve special types of risks. ● Master limited partnerships (“MLPs”) are subject to certain risks inherent in the structure of MLPs, including tax risks, limited control and voting rights and potential conflicts of interest. MLPs that concentrate in a particular industry or a particular geographic region are subject to risks associated with such industry or region. ● The Fund’s investments in real estate securities subject the fund to the same risks as direct investments in real estate, which is particularly sensitive to economic downturns. ● The Fund’s investments and investment strategies, including investments in MLPs and certain investment vehicles, may be subject to special and complex federal income tax provisions that may adversely affect the fund and its distributions to shareholders. ● Leveraging will exaggerate the effect on NAV of any increase or decrease in the market value of the Fund’s portfolio. ● Please read the prospectus for more detailed information regarding these and other risks.
2 | THE GUGGENHEIM FUNDS ANNUAL REPORT | |
High Yield Fund may not be suitable for all investors. ● The Fund’s market value will change in response to interest rate changes and market conditions among other factors. In general, bond prices rise when interest rates fall and vice versa. ● The Fund’s exposure to high yield securities may subject the Fund to greater volatility. ● The Fund may invest in derivative instruments, which may be more volatile and less liquid, increasing the risk of loss when compared to traditional securities. Certain of the derivative instruments are also subject to the risks of counterparty default and adverse tax treatment. ●The Fund’s use of leverage, through borrowings or instruments such as derivatives, may cause the Fund to be more volatile than if it had not been leveraged. ● Instruments and strategies (such as borrowing transactions and reverse repurchase agreements) may provide leveraged exposure to a particular investment, which will magnify any gains or losses on those investments. ● The Fund may invest in foreign securities which carry additional risks when compared to U.S. securities, due to the impact of diplomatic, political, or economic developments in the country in question (investments in emerging markets securities are generally subject to an even greater level of risks). ● Investments in syndicated bank loans generally offer a floating interest rate and involve special types of risks. ● The Fund’s investments in other investment vehicles subject the Fund to those risks and expenses affecting the investment vehicle. ● The Fund’s investments in restricted securities may involve financial and liquidity risk. ● You may have a gain or loss when you sell your shares. ● It is important to note that the Fund is not guaranteed by the U.S. government. ● Please read the prospectus for more detailed information regarding these and other risks.
Investment Grade Bond Fund may not be suitable for all investors. ● The Fund’s market value will change in response to interest rate changes and market conditions among other factors. In general, bond prices rise when interest rates fall and vice versa. ● The Fund’s exposure to high yield securities may subject the Fund to greater volatility. ● When market conditions are deemed appropriate, the Fund may use leverage to the full extent permitted by its investment policies and restrictions and applicable law. Leveraging will exaggerate the effect on net asset value of any increase or decrease in the market value of the Fund’s portfolio. ● The Fund may invest in derivative instruments, which may be more volatile and less liquid, increasing the risk of loss when compared to traditional securities. Certain of the derivative instruments are also subject to the risks of counterparty default and adverse tax treatment. ● Instruments and strategies (such as borrowing transactions and reverse repurchase agreements) may provide leveraged exposure to a particular investment, which will magnify any gains or losses on those investments. ● Investments in reverse repurchase agreements expose the Fund to the many of the same risks as investments in derivatives. ● The Fund’s investments in other investment vehicles subject the Fund to those risks and expenses affecting the investment vehicle. ● The Fund’s investments in foreign securities carry additional risks when compared to U.S. securities, due to the impact of diplomatic, political or economic developments in the country in question (investments in emerging markets securities are generally subject to an even greater level of risks). ● Investments in syndicated bank loans generally offer a floating interest rate and involve special types of risks. ● The Fund’s investments in municipal securities can be affected by events that affect the municipal bond market. ● The Fund’s investments in real estate securities subject the Fund to the same risks as direct investments in real estate, which is particularly sensitive to economic downturns. ● The Fund’s investments in restricted securities may involve financial and liquidity risk. ● You may have a gain or loss when you sell your shares. ● It is important to note that the Fund is not guaranteed by the U.S. government. ● Please read the prospectus for more detailed information regarding these and other risks.
Limited Duration Fund may not be suitable for all investors. ● The Fund’s market value will change in response to interest rate changes and market conditions among other factors. In general, bond prices rise when interest rates fall and vice versa. ● The Fund’s exposure to high yield securities may subject the Fund to greater volatility. ● When market conditions are deemed appropriate, the Fund may use leverage to the full extent permitted by its investment policies and restrictions and applicable law. Leveraging will exaggerate the effect on net asset value of any increase or decrease in the market value of the Fund’s portfolio. ● The Fund may invest in derivative instruments, which may be more volatile and less liquid, increasing the risk of loss when compared to traditional securities. Certain of the derivative instruments are also subject to the risks of counterparty default and adverse tax treatment. ● Instruments and strategies (such as borrowing transactions and reverse repurchase agreements) may provide leveraged exposure to a particular investment, which will magnify any gains or losses on those investments. ● Investments in reverse repurchase agreements expose the Fund to the many of the same risks as investments in derivatives. ● The Fund’s investments in other investment vehicles subject the Fund to those risks and expenses affecting the investment vehicle. ● The Fund’s investments in foreign securities carry additional risks when compared to U.S. securities, due to the impact of diplomatic, political or economic developments in the country in question (investments in emerging markets securities are generally subject to an even greater level of risks). ● Investments in syndicated bank loans generally offer a floating interest rate and involve special types of risks. ● The Fund’s investments in municipal securities can be affected by events that affect the municipal bond market. ● The Fund’s investments in real estate securities subject the Fund to the same risks as direct investments in real estate, which is particularly sensitive to economic downturns. ● The Fund’s investments in restricted securities may involve financial and liquidity risk. ● You may have a gain or loss when you sell your shares. ● It is important to note that the Fund is not guaranteed by the U.S. government. ● Please read the prospectus for more detailed information regarding these and other risks.
Municipal Income Fund may not be suitable for all investors. ● The Fund will be significantly affected by events that affect the municipal bond market, which could include unfavorable legislative or political developments and adverse changes in the financial conditions of state and municipal issuers or the federal government in case it provides financial support to the municipality. Income from municipal bonds held by the Fund could be declared taxable because of changes in tax laws. The Fund may invest in securities that generate taxable income. A portion of the Fund’s otherwise tax-exempt dividends may be taxable to those shareholders subject to the alternative minimum tax. ● Certain sectors of the municipal bond market have special risks that can affect them more significantly than the market as a whole. Because many municipal instruments are issued to finance similar projects, conditions in these industries can significantly affect the Fund and the overall municipal market. ● Municipalities currently experience budget shortfalls, which could cause them to default on their debt and thus subject the Fund to unforeseen losses. ● Like other funds that hold bonds and other fixed-income investments, the Fund’s market value will change in response to interest rate changes and market conditions, among other factors. In general, bond prices rise when interest rates fall and vice versa. ● The Fund’s exposure to high-yield securities may subject the Fund to greater volatility. ● When market conditions are deemed appropriate, the Fund will leverage to the full extent permitted by its investment policies and restrictions and applicable law. Leveraging will exaggerate the effect on net asset value of any increase or decrease in the market value of the Fund’s portfolio. ● The Fund may invest in derivative instruments, which may be more volatile and less liquid, increasing the risk of loss when compared to traditional securities. Certain of the derivative instruments are also subject to the risks of counterparty default and adverse tax treatment. ● Instruments and strategies (such as reverse repurchase agreements, unfunded commitments, tender option bonds, and borrowings) may expose the Fund to many of the same risks as investments in derivatives and may provide leveraged exposure to a particular investment, which will magnify any gains or losses on those investments. ● The Fund’s investments in other investment vehicles subject the Fund to those risks and expenses affecting the investment vehicle. ● The Fund’s investments in foreign securities carry additional risks when compared to U.S. securities, due to the impact of diplomatic, political, or economic developments in the country in question (investments in emerging markets securities are generally subject to an even greater level of risks). ● Investments in syndicated bank loans generally offer a floating interest rate and involve special types of risks. ● The Fund is subject to active trading risks that may increase volatility and impact its ability to achieve its investment objective. ● You may have a gain or loss when you sell your shares. ● It is important to note that the Fund is not guaranteed by the U.S. government. ● Please read the prospectus for more detailed information regarding these and other risks.
| | THE GUGGENHEIM FUNDS ANNUAL REPORT | 3 |
ECONOMIC AND MARKET OVERVIEW (Unaudited) | September 30, 2016 |
Economic growth continues to rebound, even though the rise in U.S. Gross Domestic Product (“GDP”) disappointed in the first half of 2016. There was a large headwind from inventory drawdowns, which should soon reverse after five quarters of dragging on growth. Real GDP growth is expected to be around 2.5 percent in the second half of the year, driven by consumption, housing, and a fading trade drag, and supporting the view that U.S. economic growth remains resilient to global weakness.
The euro zone economy is slowly improving, but inflation will likely persist well below the European Central Bank’s (“ECB”) target in the coming quarters due to substantial slack. The ECB has indicated that more quantitative easing is possible, but will soon need to alter the quantitative easing program in order to keep up their purchase pace. Both China and Japan need weaker currencies. Chinese growth and capital flows have stabilized for now, but surging construction and a credit boom raise the prospect of future instability. Japan’s economic prospects are weak, and inflation remains far from the Bank of Japan’s (“BOJ”) target. The surging yen could drive further policy easing, including an increase in fiscal stimulus.
It appears the U.S. Federal Reserve (the “Fed”) will move forward with raising rates in December, absent any economic or geopolitical surprise or a meaningful tightening of financial conditions over the fourth quarter. But key events could influence risk asset performance for the balance of the year: A continued recovery in oil prices following the Organization of Petroleum Exporting Countries (“OPEC”) agreement to keep production between 32.5 to 33 million barrels per day would help sustain the rally (although we are skeptical that they will adhere to any quota based on historical production levels). Global oil inventories remain high, but supply and demand are moving toward balance. A rebound in GDP growth would also lift U.S. equity and corporate bond prices higher.
The macroeconomic picture remains the same; we are not on the verge of a recession. But despite our positive outlook on the U.S. economy, valuations across risk assets argue for caution. Ongoing accommodation from central bankers across the globe has alleviated much of the initial macroeconomic tail risk posed by Brexit but may not be enough to dampen the seasonal volatility typically observed in the fourth quarter. Ongoing troubles in the banking sector, such as the woes afflicting Deutsche Bank and Wells Fargo, coupled with uncertainty surrounding upcoming political events, which include the new Trump administration, the Italian constitutional referendum, and key European elections, may create volatility for risk assets for the balance of the year.
For the 12 months ended September 30, 2016, the Standard & Poor’s 500® (“S&P 500”) Index* returned 15.43%. The MSCI Europe-Australasia-Far East (“EAFE”) Index* returned 6.52%. The return of the MSCI Emerging Markets Index* was 16.78%.
In the bond market, the Bloomberg Barclays U.S. Aggregate Bond Index* posted a 5.19% return for the period, while the Bloomberg Barclays U.S. Corporate High Yield Index* returned 12.73%. The return of the Bank of America (“BofA”) Merrill Lynch 3-Month U.S. Treasury Bill Index* was 0.28% for the 12-month period.
The opinions and forecasts expressed may not actually come to pass. This information is subject to change at any time, based on market and other conditions, and should not be construed as a recommendation of any specific security or strategy.
*Index Definitions
The following indices are referenced throughout this report. Indices are unmanaged and not available for direct investment. Index performance does not reflect transaction costs, fees, or expenses.
BofA Merrill Lynch 3-Month U.S. Treasury Bill Index is an unmanaged market Index of U.S. Treasury securities maturing in 90 days that assumes reinvestment of all income.
Bloomberg Barclays U.S. Aggregate Bond Index is a broad-based flagship benchmark that measures the investment grade, U.S. dollar denominated, fixed-rate taxable bond market, including U.S. Treasuries, government-related and corporate securities, mortgage-backed securities or “MBS” (agency fixed-rate and hybrid adjustable-rate mortgage, or “ARM”, pass-throughs), asset-backed securities (“ABS”), and commercial mortgage-backed securities (“CMBS”) (agency and non-agency).
Bloomberg Barclays U.S. Corporate High Yield Index measures the U.S. dollar-denominated, high yield, fixed-rate corporate bond market. Securities are classified as high yield if the middle rating of Moody’s, Fitch, and S&P is Ba1/BB +/BB + or below.
Bloomberg Barclays Municipal Bond Index is a broad market performance benchmark for the tax-exempt bond market. The bonds included in this index must have a minimum credit rating of at least Baa.
Bloomberg Barclays Municipal Long Bond Index is a sub-index of the Barclays Municipal Bond Index that is representative of the performance of municipal bonds with 22+ years to maturity.
4 | THE GUGGENHEIM FUNDS ANNUAL REPORT | |
ECONOMIC AND MARKET OVERVIEW (Unaudited)(concluded) | September 30, 2016 |
Bloomberg Barclays U.S. Aggregate Bond 1-3 Year Total Return Index measures the performance of publicly issued investment grade corporate, U.S. Treasury and government agency securities with remaining maturities of one to three years.
MSCI EAFE Index is a capitalization-weighted measure of stock markets in Europe, Australasia, and the Far East.
MSCI Emerging Markets Index is a free float-adjusted market capitalization-weighted index that is designed to measure equity market performance in the global emerging markets.
S&P 500® Index is a broad-based index, the performance of which is based on the performance of 500 widely held common stocks chosen for market size, liquidity, and industry group representation.
| | THE GUGGENHEIM FUNDS ANNUAL REPORT | 5 |
ABOUT SHAREHOLDERS’ FUND EXPENSES (Unaudited) | |
All mutual funds have operating expenses, and it is important for our shareholders to understand the impact of costs on their investments. Shareholders of a fund incur two types of costs: (i) transaction costs, including sales charges (loads) on purchase payments, reinvested dividends, other distributions, and exchange fees, and (ii) ongoing costs, including management fees, administrative services, and shareholder reports, among others. These ongoing costs, or operating expenses, are deducted from a fund’s gross income and reduce the investment return of the fund.
A fund’s expenses are expressed as a percentage of its average net assets, which is known as the expense ratio. The following examples are intended to help investors understand the ongoing costs (in dollars) of investing in a fund and to compare these costs with the ongoing costs of investing in other mutual funds.
The examples are based on an investment of $1,000 made at the beginning of the period and held for the entire six-month period beginning March 31, 2016 and ending September 30, 2016.
The following tables illustrate the Funds’ costs in two ways:
Table 1. Based on actual Fund return: This section helps investors estimate the actual expenses paid over the period. The “Ending Account Value” shown is derived from the Fund’s actual return, and the fifth column shows the dollar amount that would have been paid by an investor who started with $1,000 in the Fund. Investors may use the information here, together with the amount invested, to estimate the expenses paid over the period. Simply divide the Fund’s account value by $1,000 (for example, an $8,600 account value divided by $1,000 = 8.6), then multiply the result by the number provided under the heading “Expenses Paid During Period.”
Table 2. Based on hypothetical 5% return: This section is intended to help investors compare a Fund’s cost with those of other mutual funds. The table provides information about hypothetical account values and hypothetical expenses based on the Fund’s actual expense ratio and an assumed rate of return of 5% per year before expenses, which is not the Fund’s actual return. The hypothetical account values and expenses may not be used to estimate the actual ending account balance or expenses paid during the period. The example is useful in making comparisons because the U.S. Securities and Exchange Commission (the “SEC”) requires all mutual funds to calculate expenses based on the 5% return. Investors can assess a Fund’s costs by comparing this hypothetical example with the hypothetical examples that appear in shareholder reports of other funds.
The calculations illustrated above assume no shares were bought or sold during the period. Actual costs may have been higher or lower, depending on the amount of investment and the timing of any purchases or redemptions.
Please note that the expenses shown in the table are meant to highlight your ongoing costs only and do not reflect any transactional costs, such as sales charges (loads) on purchase payments, and contingent deferred sales charges (“CDSC”) on redemptions, if any. Therefore, the second table is useful in comparing ongoing costs only, and will not help you determine the relative total costs of owning different funds. In addition, if these transactional costs were included, your costs would have been higher.
More information about the Funds’ expenses, including annual expense ratios for periods up to five years (subject to the Fund’s inception date), can be found in the Financial Highlights section of this report. For additional information on operating expenses and other shareholder costs, please refer to the appropriate Fund prospectus.
6 | THE GUGGENHEIM FUNDS ANNUAL REPORT | |
ABOUT SHAREHOLDERS’ FUND EXPENSES (Unaudited)(continued) | |
| | Expense
Ratio1 | Fund
Return | Beginning
Account Value
March 31, 2016 | Ending
Account Value
September 30,
2016 | Expenses
Paid During
Period2 |
Table 1. Based on actual Fund return3 | | | | | |
Diversified Income Fund | | | | | |
A-Class | 0.77% | 8.44% | $ 1,000.00 | $ 1,084.40 | $ 4.02 |
C-Class | 1.52% | 8.04% | 1,000.00 | 1,080.40 | 7.93 |
P-Class | 0.80% | 8.42% | 1,000.00 | 1,084.20 | 4.18 |
Institutional Class | 0.54% | 8.51% | 1,000.00 | 1,085.10 | 2.82 |
High Yield Fund | | | | | |
A-Class | 1.23% | 11.29% | 1,000.00 | 1,112.90 | 6.51 |
C-Class | 1.98% | 10.88% | 1,000.00 | 1,108.80 | 10.47 |
P-Class | 1.17% | 11.38% | 1,000.00 | 1,113.80 | 6.20 |
Institutional Class | 0.94% | 11.48% | 1,000.00 | 1,114.80 | 4.98 |
Investment Grade Bond Fund | | | | | |
A-Class | 1.03% | 5.18% | 1,000.00 | 1,051.80 | 5.30 |
C-Class | 1.77% | 4.85% | 1,000.00 | 1,048.50 | 9.09 |
P-Class | 0.98% | 5.23% | 1,000.00 | 1,052.30 | 5.04 |
Institutional Class | 0.76% | 5.32% | 1,000.00 | 1,053.20 | 3.91 |
Limited Duration Fund | | | | | |
A-Class | 0.84% | 3.36% | 1,000.00 | 1,033.60 | 4.28 |
C-Class | 1.58% | 2.97% | 1,000.00 | 1,029.70 | 8.04 |
P-Class | 0.84% | 3.36% | 1,000.00 | 1,033.60 | 4.28 |
Institutional Class | 0.58% | 3.49% | 1,000.00 | 1,034.90 | 2.96 |
Municipal Income Fund | | | | | |
A-Class | 0.81% | 1.87% | 1,000.00 | 1,018.70 | 4.10 |
C-Class | 1.56% | 1.56% | 1,000.00 | 1,015.60 | 7.88 |
P-Class | 0.79% | 1.96% | 1,000.00 | 1,019.60 | 4.00 |
Institutional Class | 0.56% | 2.08% | 1,000.00 | 1,020.80 | 2.84 |
| | THE GUGGENHEIM FUNDS ANNUAL REPORT | 7 |
ABOUT SHAREHOLDERS’ FUND EXPENSES (Unaudited)(concluded) | |
| | Expense
Ratio1 | Fund
Return | Beginning
Account Value
March 31, 2016 | Ending
Account Value
September 30, 2016 | Expenses
Paid During
Period2 |
Table 2. Based on hypothetical 5% return (before expenses) | | | | |
Diversified Income Fund | | | | | |
A-Class | 0.77% | 5.00% | $ 1,000.00 | $ 1,021.21 | $ 3.90 |
C-Class | 1.52% | 5.00% | 1,000.00 | 1,017.45 | 7.69 |
P-Class | 0.80% | 5.00% | 1,000.00 | 1,021.06 | 4.05 |
Institutional Class | 0.54% | 5.00% | 1,000.00 | 1,022.36 | 2.74 |
High Yield Fund | | | | | |
A-Class | 1.23% | 5.00% | 1,000.00 | 1,018.90 | 6.23 |
C-Class | 1.98% | 5.00% | 1,000.00 | 1,015.14 | 10.00 |
P-Class | 1.17% | 5.00% | 1,000.00 | 1,019.20 | 5.92 |
Institutional Class | 0.94% | 5.00% | 1,000.00 | 1,020.36 | 4.76 |
Investment Grade Bond Fund | | | | | |
A-Class | 1.03% | 5.00% | 1,000.00 | 1,019.90 | 5.22 |
C-Class | 1.77% | 5.00% | 1,000.00 | 1,016.19 | 8.95 |
P-Class | 0.98% | 5.00% | 1,000.00 | 1,020.16 | 4.96 |
Institutional Class | 0.76% | 5.00% | 1,000.00 | 1,021.26 | 3.85 |
Limited Duration Fund | | | | | |
A-Class | 0.84% | 5.00% | 1,000.00 | 1,020.86 | 4.26 |
C-Class | 1.58% | 5.00% | 1,000.00 | 1,017.15 | 7.99 |
P-Class | 0.84% | 5.00% | 1,000.00 | 1,020.86 | 4.26 |
Institutional Class | 0.58% | 5.00% | 1,000.00 | 1,022.16 | 2.94 |
Municipal Income Fund | | | | | |
A-Class | 0.81% | 5.00% | 1,000.00 | 1,021.01 | 4.10 |
C-Class | 1.56% | 5.00% | 1,000.00 | 1,017.25 | 7.89 |
P-Class | 0.79% | 5.00% | 1,000.00 | 1,021.11 | 4.00 |
Institutional Class | 0.56% | 5.00% | 1,000.00 | 1,022.26 | 2.84 |
1 | Annualized and excludes expenses of the underlying funds in which the Funds invest. |
2 | Expenses are equal to the Fund's annualized expense ratio, net of any applicable fee waivers, multiplied by the average account value over the period, multiplied by 183/365 (to reflect the one-half year period). |
3 | Actual cumulative return at net asset value for the period March 31, 2016 to September 30, 2016. |
8 | THE GUGGENHEIM FUNDS ANNUAL REPORT | |
MANAGERS’ COMMENTARY(Unaudited) | September 30, 2016 |
To Our Shareholders
Guggenheim Diversified Income Fund (the “Fund”) is managed by a team of seasoned professionals, including Jayson Flowers, Senior Managing Director and Portfolio Manager; Farhan Sharaff, Senior Managing Director and Portfolio Manager; and Patrick Mitchell, Senior Managing Director and Portfolio Manager. In the following paragraphs, the investment team discusses the market environment and the Fund’s performance for the abbreviated fiscal year ended September 30, 2016.
For the abbreviated fiscal period ended September 30, 2016, Guggenheim Diversified Income Fund returned 11.29%1, compared with the 4.36% return of the Bloomberg Barclays U.S. Aggregate Bond Index. A 70/30 blend of the Bloomberg Barclays U.S. Aggregate Bond Index and MSCI World Index returned 7.65% for the abbreviated period. The inception date of the Fund was January 29, 2016.
The Fund seeks to achieve high current income with consideration for capital appreciation. The Fund pursues its investment objective by constructing a broadly diversified global portfolio with exposure across multiple high-income asset classes that provide an opportunity for growth. The Fund seeks diversification by investing primarily in asset classes that Guggenheim Partners Investment Management, LLC (the “Investment Manager”) believes provide exposure to different geographic regions, different positions in issuers’ capital structures and different investment styles.
To achieve its intended portfolio, the Investment Manager allocates the Fund’s assets among multiple underlying investment strategies, primarily high-income credit and equity strategies. The Fund may indirectly obtain exposure to these asset classes, and pursue its investment objective, by investing significantly in affiliated and unaffiliated investment vehicles, including other mutual funds, closed-end funds and exchange-traded funds (“ETFs”) managed by the Investment Manager or its affiliates.
For the abbreviated period, the Fund’s began deploying assets and quickly established an allocation that remained stable through the rest of the period, with about 75% in fixed income, 17% in alternative strategies, 8% in equity and 5% in cash and cash equivalents. Guggenheim’s fixed income, equity, and alternative strategy funds were the primary investment vehicles, with the largest holdings in Guggenheim High Yield Fund, Guggenheim Floating Rate Strategies Fund, and Guggenheim Investment Grade Bond Fund.
For the period, strong returns from the Fund’s fixed income holdings and Guggenheim S&P High Income Infrastructure ETF contributed most to the Fund’s outperformance. Fixed income securities benefited from the worldwide search for yield during much of the period, as did leveraged credit investments made in the dislocation following the low point in oil prices in February. Infrastructure securities responded to the demand for improved infrastructure as global populations expand and living standards rise, as well as their attractive yield potential for investors seeking to enhance income.
The Fund did reduce exposure to high yield and increase its exposure to bank loans over the period. The fundamental improvement in the high-yield market, we believe, has become reflected in current valuations. Through September, the loan market has delivered a stronger risk-adjusted return than most of the fixed-income market, including high-yield corporates, investment-grade corporates, Agency mortgage-backed securities, non-Agency CMBS, and even Treasurys. The Investment Manager believes the loan market currently looks more attractive than high-yield bonds as we go through the fourth quarter and look to reduce portfolio risk.
Performance displayed represents past performance which is no guarantee of future results.
1 | Performance figures are based on Class A shares and do not reflect deduction of the sales charges or taxes that a shareholder would pay on distributions or the redemption of shares. |
The opinions and forecast expressed may not actually come to pass. This information is subject to change at any time, based on market and other conditions, and should not be construed as a recommendation of any specific security or strategy.
| | THE GUGGENHEIM FUNDS ANNUAL REPORT | 9 |
PERFORMANCE REPORT AND FUND PROFILE (Unaudited) | September 30, 2016 |
DIVERSIFIED INCOME FUND
Holdings Diversification (Market Exposure as % of Net Assets)

“Holdings Diversification (Market Exposure as % of Net Assets)” excludes any temporary cash investments.
Inception Dates: |
A-Class | January 29, 2016 |
C-Class | January 29, 2016 |
P-Class | January 29, 2016 |
Institutional Class | January 29, 2016 |
Ten Largest Holdings (% of Total Net Assets) |
Guggenheim High Yield Fund - Institutional Class | 21.2% |
Guggenheim Floating Rate Strategies Fund - Institutional Class | 20.6% |
Guggenheim Investment Grade Bond Fund - Institutional Class | 19.8% |
Guggenheim S&P High Income Infrastructure ETF | 10.1% |
Guggenheim Limited Duration Fund - Institutional Class | 6.8% |
Guggenheim World Equity Income Fund - Institutional Class | 5.8% |
Guggenheim Risk Managed Real Estate Fund - Institutional Class | 4.7% |
Avenue Income Credit Strategies Fund | 0.3% |
ClearBridge Energy MLP Opportunity Fund, Inc. | 0.3% |
Tortoise Pipeline & Energy Fund, Inc. | 0.3% |
Top Ten Total | 89.9% |
“Ten Largest Holdings” excludes any temporary cash or derivative investments. |
10 | THE GUGGENHEIM FUNDS ANNUAL REPORT | |
PERFORMANCE REPORT AND FUND PROFILE (Unaudited)(concluded) | September 30, 2016 |
Cumulative Fund Performance*
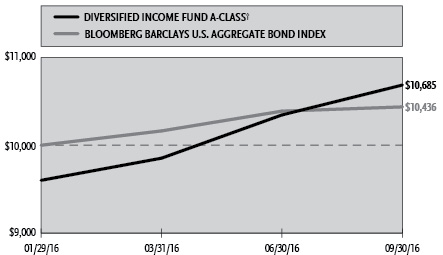
Average Annual Returns*
Periods Ended September 30, 2016
| | Since Inception
(01/29/16) |
A-Class Shares | 11.29% |
A-Class Shares with sales charge† | 6.85% |
C-Class Shares | 10.74% |
C-Class Shares with CDSC‡ | 9.74% |
P-Class Shares | 11.27% |
Institutional Class Shares | 11.44% |
Bloomberg Barclays U.S. Aggregate Bond Index | 4.36% |
* | The performance data above represents past performance that is not predictive of future results. The investment return and principal value of an investment in the Fund will fluctuate so that an investor’s shares, when redeemed, may be worth more or less than their original cost. Returns are historical and include changes in principal and reinvested dividends and capital gains and do not reflect the effect of taxes. The Bloomberg Barclays U.S. Aggregate Bond Index is an unmanaged index and, unlike the Fund, has no management fees or operating expenses to reduce its reported return. The graph is based on A-Class shares only; performance for C-Class shares, P-Class shares and Institutional Class shares will vary due to differences in fee structures. |
† | Fund returns are calculated using the maximum sales charge of 4.00%. |
‡ | Fund returns include a CDSC of 1% if redeemed within 12 months of purchase. |
| | THE GUGGENHEIM FUNDS ANNUAL REPORT | 11 |
SCHEDULE OF INVESTMENTS | September 30, 2016 |
DIVERSIFIED INCOME FUND | |
| | | Shares | | | Value | |
| | | | | | | |
EXCHANGE-TRADED FUNDS† - 10.1% | |
Guggenheim S&P High Income Infrastructure ETF1 | | | 21,275 | | | $ | 565,983 | |
Total Exchange-Traded Funds | | | | | | | | |
(Cost $447,192) | | | | | | | 565,983 | |
| | | | | | | | | |
MUTUAL FUNDS† - 78.9% | |
Guggenheim High Yield Fund - Institutional Class1 | | | 130,687 | | | | 1,189,250 | |
Guggenheim Floating Rate Strategies Fund - Institutional Class1 | | | 44,539 | | | | 1,155,330 | |
Guggenheim Investment Grade Bond Fund - Institutional Class1 | | | 59,708 | | | | 1,106,383 | |
Guggenheim Limited Duration Fund - Institutional Class1 | | | 15,461 | | | | 382,050 | |
Guggenheim World Equity Income Fund - Institutional Class1 | | | 24,312 | | | | 327,003 | |
Guggenheim Risk Managed Real Estate Fund - Institutional Class1 | | | 9,006 | | | | 262,695 | |
Total Mutual Funds | | | | | | | | |
(Cost $4,233,028) | | | | | | | 4,422,711 | |
| | | | | | | | | |
CLOSED-END FUNDS† - 8.9% | | | | | | | | |
Avenue Income Credit Strategies Fund | | | 1,134 | | | | 14,707 | |
ClearBridge Energy MLP Opportunity Fund, Inc. | | | 1,061 | | | | 14,110 | |
Tortoise Pipeline & Energy Fund, Inc. | | | 665 | | | | 14,084 | |
New America High Income Fund, Inc. | | | 1,517 | | | | 13,972 | |
AllianzGI Convertible & Income Fund | | | 2,064 | | | | 13,932 | |
Neuberger Berman High Yield Strategies Fund, Inc. | | | 1,146 | | | | 13,592 | |
LMP Capital and Income Fund, Inc. | | | 995 | | | | 13,562 | |
Legg Mason BW Global Income Opportunities Fund, Inc. | | | 995 | | | | 13,512 | |
Western Asset Worldwide Income Fund, Inc. | | | 1,153 | | | | 13,386 | |
Western Asset High Income Fund II, Inc. | | | 1,857 | | | | 13,333 | |
John Hancock Investors Trust | | | 798 | | | | 13,327 | |
Cohen & Steers REIT and Preferred Income Fund, Inc. | | | 659 | | | | 13,279 | |
John Hancock Premium Dividend Fund | | | 807 | | | | 13,235 | |
Invesco Dynamic Credit Opportunities Fund | | | 1,120 | | | | 13,171 | |
Calamos Convertible and High Income Fund | | | 1,195 | | | | 13,157 | |
Eaton Vance Floating-Rate Income Trust | | | 923 | | | | 13,107 | |
Deutsche High Income Opportunities Fund, Inc. | | | 926 | | | | 13,103 | |
Invesco High Income Trust II | | | 892 | | | | 13,032 | |
Eaton Vance Enhanced Equity Income Fund II | | | 946 | | | | 13,017 | |
PIMCO Income Strategy Fund II | | | 1,364 | | | | 12,999 | |
BlackRock Multi-Sector Income Trust | | | 761 | | | | 12,990 | |
BlackRock Credit Allocation Income Trust | | | 973 | | | | 12,990 | |
Blackstone / GSO Strategic Credit Fund | | | 868 | | | | 12,951 | |
Western Asset High Yield Defined Opportunity Fund, Inc. | | | 834 | | | | 12,852 | |
Nuveen Tax-Advantaged Dividend Growth Fund | | | 863 | | | | 12,816 | |
Ivy High Income Opportunities Fund | | | 890 | | | | 12,798 | |
AllianzGI Equity & Convertible Income Fund | | | 683 | | | | 12,786 | |
Voya Global Equity Dividend and Premium Opportunity Fund | | | 1,760 | | | | 12,778 | |
Western Asset Premier Bond Fund | | | 951 | | | | 12,762 | |
PIMCO Income Opportunity Fund | | | 551 | | | | 12,761 | |
Pioneer High Income Trust | | | 1,206 | | | | 12,675 | |
Nuveen Credit Strategies Income Fund | | | 1,488 | | | | 12,618 | |
Nuveen S&P 500 Dynamic Overwrite Fund | | | 902 | | | | 12,412 | |
Eaton Vance Tax-Managed Diversified Equity Income Fund | | | 1,151 | | | | 12,327 | |
BlackRock Enhanced Capital and Income Fund, Inc. | | | 875 | | | | 12,058 | |
Alpine Total Dynamic Dividend Fund | | | 1,572 | | | | 11,994 | |
PIMCO Dynamic Income Fund | | | 421 | | | | 11,990 | |
Wells Fargo Global Dividend Opportunity Fund | | | 2,043 | | | | 11,870 | |
Total Closed-End Funds | | | | | | | | |
(Cost $442,544) | | | | | | | 496,045 | |
| | | | | | | | | |
SHORT-TERM INVESTMENTS† - 1.3% | |
Goldman Sachs Financial Square Treasury Instruments Fund 0.15%2 | | | 72,303 | | | | 72,303 | |
Total Short-Term Investments | | | | | | | | |
(Cost $72,303) | | | | | | | 72,303 | |
| | | | | | | | | |
Total Investments - 99.2% | | | | | | | | |
(Cost $5,195,067) | | | | | | $ | 5,557,042 | |
Other Assets & Liabilities, net - 0.8% | | | | | | | 42,612 | |
Total Net Assets - 100.0% | | | | | | $ | 5,599,654 | |
† | Value determined based on Level 1 inputs — See Note 4. |
1 | Affiliated issuer — See Note 8. |
2 | Rate indicated is the 7 day yield as of September 30, 2016. |
| | REIT — Real Estate Investment Trust |
| | |
| | See Sector Classification in Other Information section. |
12 | THE GUGGENHEIM FUNDS ANNUAL REPORT | SEE NOTES TO FINANCIAL STATEMENTS. |
SCHEDULE OF INVESTMENTS (concluded) | September 30, 2016 |
DIVERSIFIED INCOME FUND | |
The following table summarizes the inputs used to value the Fund’s investments at September 30, 2016 (See Note 4 in the Notes to Financial Statements):
Investments in Securities (Assets) | | Level 1 | | | Level 2 | | | Level 3 | | | Total | |
Closed-End Funds | | $ | 496,045 | | | $ | — | | | $ | — | | | $ | 496,045 | |
Exchange-Traded Funds | | | 565,983 | | | | — | | | | — | | | | 565,983 | |
Mutual Funds | | | 4,422,711 | | | | — | | | | — | | | | 4,422,711 | |
Short-Term Investments | | | 72,303 | | | | — | | | | — | | | | 72,303 | |
Total | | $ | 5,557,042 | | | $ | — | | | $ | — | | | $ | 5,557,042 | |
Transfers between investment levels may occur as the markets fluctuate and/or the availability of data used in an investment’s valuation changes. Transfers between valuation levels, if any, are in comparison to the valuation levels at the end of the previous fiscal year, and are effective using the fair value as of the end of the previous fiscal period.
For the year ended September 30, 2016, there were no transfers between levels.
SEE NOTES TO FINANCIAL STATEMENTS. | THE GUGGENHEIM FUNDS ANNUAL REPORT | 13 |
STATEMENT OF ASSETS AND LIABILITIES | |
September 30, 2016 | |
| | |
Assets: | |
Investments in unaffiliated issuers, at value (cost $514,847) | | $ | 568,348 | |
Investments in affiliated issuers, at value (cost $4,680,220) | | | 4,988,694 | |
Total investments (cost $5,195,067) | | | 5,557,042 | |
Prepaid expenses | | | 61,302 | |
Receivables: | |
Dividends | | | 17,171 | |
Investment adviser | | | 4,981 | |
Total assets | | | 5,640,496 | |
| | | | | |
Liabilities: | |
Payable for: | |
Securities purchased | | | 16,750 | |
Professional fees | | | 10,779 | |
Direct shareholders expense | | | 3,725 | |
Transfer agent/maintenance fees | | | 2,479 | |
Trustees’ fees* | | | 2,231 | |
Custodian fees | | | 2,228 | |
Pricing fees | | | 1,994 | |
Distribution and service fees | | | 146 | |
Miscellaneous | | | 510 | |
Total liabilities | | | 40,842 | |
Net assets | | $ | 5,599,654 | |
| | | | | |
Net assets consist of: | |
Paid in capital | | $ | 5,171,192 | |
Undistributed net investment income | | | 13,621 | |
Accumulated net realized gain on investments | | | 52,866 | |
Net unrealized appreciation on investments | | | 361,975 | |
Net assets | | $ | 5,599,654 | |
| | | | | |
A-Class: | |
Net assets | | $ | 132,054 | |
Capital shares outstanding | | | 4,869 | |
Net asset value per share | | $ | 27.12 | |
Maximum offering price per share (Net asset value divided by 96.00%) | | $ | 28.25 | |
| | | | | |
C-Class: | |
Net assets | | $ | 117,831 | |
Capital shares outstanding | | | 4,347 | |
Net asset value per share | | $ | 27.11 | |
| | | | | |
P-Class: | |
Net assets | | $ | 111,372 | |
Capital shares outstanding | | | 4,108 | |
Net asset value per share | | $ | 27.11 | |
| | | | | |
Institutional Class: | |
Net assets | | $ | 5,238,397 | |
Capital shares outstanding | | | 193,197 | |
Net asset value per share | | $ | 27.11 | |
Period Ended September 30, 2016** | |
| | |
Investment Income: | |
Dividends from securities of affiliated issuers | | $ | 150,663 | |
Dividends from securities of unaffiliated issuers (net of foreign withholding tax of $32) | | | 29,098 | |
Interest | | | 415 | |
Total investment income | | | 180,176 | |
| | | | | |
Expenses: | |
Management fees | | | 26,442 | |
Transfer agent/maintenance fees: | |
A-Class | | | 105 | |
C-Class | | | 104 | |
P-Class | | | 39 | |
Institutional Class | | | 627 | |
Distribution and service fees: | |
A-Class | | | 194 | |
C-Class | | | 715 | |
P-Class | | | 176 | |
Fund accounting/administration fees | | | 16,643 | |
Registration fees | | | 16,466 | |
Professional fees | | | 15,992 | |
Legal fees | | | 11,377 | |
Trustees’ fees* | | | 4,661 | |
Custodian fees | | | 3,934 | |
Line of credit fees | | | 201 | |
Miscellaneous | | | 6,793 | |
Total expenses | | | 104,469 | |
Less: | |
Expenses waived by Adviser | | | (84,280 | ) |
Net expenses | | | 20,189 | |
Net investment income | | | 159,987 | |
| | | | | |
Net Realized and Unrealized Gain (Loss): | |
Net realized gain (loss) on: | |
Investments in unaffiliated issuers | | | 12,250 | |
Investments in affiliated issuers | | | 73,396 | |
Futures contracts | | | (34,759 | ) |
Net realized gain | | | 50,887 | |
Net change in unrealized appreciation (depreciation) on: | |
Investments in unaffiliated issuers | | | 53,501 | |
Investments in affiliated issuers | | | 308,474 | |
Net change in unrealized appreciation (depreciation) | | | 361,975 | |
Net realized and unrealized gain | | | 412,862 | |
Net increase in net assets resulting from operations | | $ | 572,849 | |
* | Relates to Trustees not deemed “interested persons” within the meaning of Section 2(a)(19) of the 1940 Act. |
** | Since commencement of operations: January 29, 2016. |
14 | THE GUGGENHEIM FUNDS ANNUAL REPORT | SEE NOTES TO FINANCIAL STATEMENTS. |
STATEMENTS OF CHANGES IN NET ASSETS |
| | | Period Ended September 30,
2016a | |
Increase (Decrease) in Net Assets from Operations: | | | |
Net investment income | | $ | 159,987 | |
Net realized gain on investments | | | 50,887 | |
Net change in unrealized appreciation (depreciation) on investments | | | 361,975 | |
Net increase in net assets resulting from operations | | | 572,849 | |
| | | | | |
Distributions to shareholders from: | | | | |
Net investment income | | | | |
A-Class | | | (3,059 | ) |
C-Class | | | (2,279 | ) |
P-Class | | | (2,744 | ) |
Institutional Class | | | (136,669 | ) |
Total distributions to shareholders | | | (144,751 | ) |
| | | | | |
Capital share transactions: | | | | |
Proceeds from sale of shares | | | | |
A-Class | | | 119,796 | |
C-Class | | | 107,000 | |
P-Class | | | 100,100 | |
Institutional Class | | | 4,700,000 | |
Distributions reinvested | | | | |
A-Class | | | 3,059 | |
C-Class | | | 2,279 | |
P-Class | | | 2,744 | |
Institutional Class | | | 136,669 | |
Cost of shares redeemed | | | | |
A-Class | | | (91 | ) |
C-Class | | | — | |
P-Class | | | — | |
Institutional Class | | | — | |
Net increase from capital share transactions | | | 5,171,556 | |
Net increase in net assets | | | 5,599,654 | |
| | | | | |
Net assets: | | | | |
Beginning of period | | | — | |
End of period | | $ | 5,599,654 | |
Undistributed net investment income at end of period | | $ | 13,621 | |
| | | | | |
Capital share activity: | | | | |
Shares sold | | | | |
A-Class | | | 4,757 | |
C-Class | | | 4,260 | |
P-Class | | | 4,004 | |
Institutional Class | | | 188,000 | |
Shares issued from reinvestment of distributions | | | | |
A-Class | | | 116 | |
C-Class | | | 87 | |
P-Class | | | 104 | |
Institutional Class | | | 5,197 | |
Shares redeemed | | | | |
A-Class | | | (4 | ) |
Net increase in shares | | | 206,521 | |
a | Since commencement of operations: January 29, 2016. |
SEE NOTES TO FINANCIAL STATEMENTS. | THE GUGGENHEIM FUNDS ANNUAL REPORT | 15 |
This table is presented to show selected data for a share outstanding throughout each period and to assist shareholders in evaluating a Fund’s performance for the periods presented.
A-Class | | Period Ended
September 30,
2016a | |
Per Share Data | | | |
Net asset value, beginning of period | | $ | 25.00 | |
Income (loss) from investment operations: | |
Net investment income (loss)b | | | .76 | |
Net gain (loss) on investments (realized and unrealized) | | | 2.03 | |
Total from investment operations | | | 2.79 | |
Less distributions from: | |
Net investment income | | | (.67 | ) |
Total distributions | | | (.67 | ) |
Net asset value, end of period | | $ | 27.12 | |
| | | | | |
Total Returnd | | | 11.29 | % |
Ratios/Supplemental Data | |
Net assets, end of period (in thousands) | | $ | 132 | |
Ratios to average net assets: | |
Net investment income (loss) | | | 4.35 | % |
Total expensesc | | | 3.31 | % |
Net expensese,f | | | 0.77 | % |
Portfolio turnover rate | | | 83 | % |
C-Class | | Period Ended
September 30,
2016a | |
Per Share Data | | | |
Net asset value, beginning of period | | $ | 25.00 | |
Income (loss) from investment operations: | |
Net investment income (loss)b | | | .63 | |
Net gain (loss) on investments (realized and unrealized) | | | 2.03 | |
Total from investment operations | | | 2.66 | |
Less distributions from: | |
Net investment income | | | (.55 | ) |
Total distributions | | | (.55 | ) |
Net asset value, end of period | | $ | 27.11 | |
| | | | | |
Total Returnd | | | 10.74 | % |
Ratios/Supplemental Data | |
Net assets, end of period (in thousands) | | $ | 118 | |
Ratios to average net assets: | |
Net investment income (loss) | | | 3.58 | % |
Total expensesc | | | 4.05 | % |
Net expensese,f | | | 1.52 | % |
Portfolio turnover rate | | | 83 | % |
16 | THE GUGGENHEIM FUNDS ANNUAL REPORT | SEE NOTES TO FINANCIAL STATEMENTS. |
FINANCIAL HIGHLIGHTS (continued) |
This table is presented to show selected data for a share outstanding throughout each period and to assist shareholders in evaluating a Fund’s performance for the periods presented.
P-Class | | Period Ended
September 30,
2016a | |
Per Share Data | | | |
Net asset value, beginning of period | | $ | 25.00 | |
Income (loss) from investment operations: | |
Net investment income (loss)b | | | .74 | |
Net gain (loss) on investments (realized and unrealized) | | | 2.05 | |
Total from investment operations | | | 2.79 | |
Less distributions from: | |
Net investment income | | | (.68 | ) |
Total distributions | | | (.68 | ) |
Net asset value, end of period | | $ | 27.11 | |
| | | | | |
Total Returnd | | | 11.27 | % |
Ratios/Supplemental Data | |
Net assets, end of period (in thousands) | | $ | 111 | |
Ratios to average net assets: | |
Net investment income (loss) | | | 4.32 | % |
Total expensesc | | | 3.21 | % |
Net expensese,f | | | 0.80 | % |
Portfolio turnover rate | | | 83 | % |
SEE NOTES TO FINANCIAL STATEMENTS. | THE GUGGENHEIM FUNDS ANNUAL REPORT | 17 |
FINANCIAL HIGHLIGHTS (concluded) |
This table is presented to show selected data for a share outstanding throughout each period and to assist shareholders in evaluating a Fund’s performance for the periods presented.
Institutional Class | | Period Ended
September 30,
2016a | |
Per Share Data | | | |
Net asset value, beginning of period | | $ | 25.00 | |
Income (loss) from investment operations: | |
Net investment income (loss)b | | | .79 | |
Net gain (loss) on investments (realized and unrealized) | | | 2.04 | |
Total from investment operations | | | 2.83 | |
Less distributions from: | |
Net investment income | | | (.72 | ) |
Total distributions | | | (.72 | ) |
Net asset value, end of period | | $ | 27.11 | |
| | | | | |
Total Returnd | | | 11.44 | % |
Ratios/Supplemental Data | |
Net assets, end of period (in thousands) | | $ | 5,238 | |
Ratios to average net assets: | |
Net investment income (loss) | | | 4.57 | % |
Total expensesc | | | 2.93 | % |
Net expensese,f | | | 0.54 | % |
Portfolio turnover rate | | | 83 | % |
a | Since commencement of operations: January 29, 2016. Percentage amounts for the period, except total return and portfolio turnover rate, have been annualized. |
b | Net investment income (loss) per share was computed using average shares outstanding throughout the period. |
c | Does not include expenses of the underlying funds in which the Fund invests. |
d | Total return does not reflect the impact of any applicable sales charges and has not been annualized. |
e | Net expense information reflects the expense ratios after expense waivers. |
f | Net expenses may include expenses that are excluded from the expense limitation agreement and affiliated fund waivers. Excluding these expenses, the operating expense ratios for the years would be: |
| | 09/30/16a |
A-Class | 0.76% |
C-Class | 1.52% |
P-Class | 0.79% |
Institutional Class | 0.54% |
18 | THE GUGGENHEIM FUNDS ANNUAL REPORT | SEE NOTES TO FINANCIAL STATEMENTS. |
MANAGERS’ COMMENTARY(Unaudited) | September 30, 2016 |
To Our Shareholders
Guggenheim High Yield Fund (the “Fund”) is managed by a team of seasoned professionals, including B. Scott Minerd, Chairman of Investments and Global Chief Investment Officer; Jeffrey B. Abrams, Senior Managing Director and Portfolio Manager; Kevin H. Gundersen, Senior Managing Director and Portfolio Manager; Thomas Hauser, Managing Director and Portfolio Manager; and Richard de Wet, Vice President and Portfolio Manager. In the following paragraphs, the investment team discusses the market environment and the Fund’s performance for the fiscal year ended September 30, 2016.
The Fund seeks to deliver high current income as well as capital appreciation. The Fund seeks to outperform the broad high yield market and has the flexibility to invest across a broad array of high yield securities. Investments are made through rigorous credit selection based on proprietary research that incorporates knowledge of companies, industries, and capital structures to develop a unique perspective on the worthiness of each investment.
For the one-year period ended September 30, 2016, Guggenheim High Yield Bond Fund returned 10.71%1. On a total return basis the Bloomberg Barclays U.S. Corporate High Yield Index returned 12.73% for the full year ended September 30, 2016. BB rated bonds returned 12.13%, B rated bonds returned 11.26%, and CCC bonds returned 16.12%.
The Fund outperformed the broader market from the beginning of the period through mid-February, but did not keep up with the vigorous market rally that began then, marked by the bottoming of oil prices and the beginning of a slew of downgrades by the credit ratings agencies primarily of commodity-related issuers. The downgrade of tens of billions of dollars’ worth of investment grade debt into the high yield universe (“fallen angels”) significantly increased the market’s exposure to commodity-related (specifically energy) issuers. The market was pricing in a high level of defaults at the time; but with the easing of concern over global growth, especially in China, and the beginning of a recovery in oil and metals pricing, the market rapidly snapped back, returning 21.37% from February 11 through the end of the period.
Fund performance for the period was primarily a result of a stable and consistent credit selection process, as Guggenheim’s bottom-up, fundamental approach results in the construction of portfolios that produce solid yield while at the same being defensively positioned. The portfolio has consistently maintained a defensive stance to interest rate volatility with an underweight to duration. A sizable allocation to bank loans that are senior in the capital structure to most high yield bonds reduced volatility in returns and contributed to performance as a whole. We believe the broader market outperformance since the February rally began may be somewhat overdone, as indicated by some weaker credits being swept up in the buying spree. We believe credit selection will become increasingly important through the end of the year and expect the Fund to perform well in this type of environment.
The Fund’s allocation to BB credits is its largest, and the Fund has incrementally added to exposure, versus B and CCC credits, since early 2015. This stance helped when higher-quality bonds were rewarded, especially in the volatile periods in the fourth quarter of 2015 and first quarter of 2016, but less so in the spring and summer rally in high yield. Our research indicates that BB rated bonds perform very well versus other fixed income areas, as the Federal Reserve tightens. At the end of the period, the Fund was positioned up in quality and was carefully managing exposure to CCC-rated credit.
The Fund has consistently been positioned conservatively in terms of duration, with higher exposure to short-dated bonds and overweight to floating rate securities (bank loans), which decreases volatility as well as diversifies sources of return. Beginning with the February rally, bank loan exposure detracted from performance, even though bank loans performed well on a risk-adjusted basis, although not as vigorous in absolute terms. We believe the loan market currently looks relatively attractive versus high-yield bonds at the beginning of the fourth quarter, as the threat of increasing interest rates and uncertainty over future government policy loom. A small exposure to investment grade corporates assisted with performance, as that market saw massive demand in line with record volumes of new issuance of over $1 trillion.
While the Fund’s underweight to energy worked against the Fund in the rebound in energy prices that began in February, we have been prudently seeking opportunities to add energy credit as we near the end of the commodity downgrade/default cycle. The Fund was roughly market neutral to the space at the end of the period, having bought a number of good credits at discounted prices. The near-term outlook for high-yield bond defaults is improving, as the upward trajectory in the 12-month trailing default rate slows, and appears to be reversing.
| | THE GUGGENHEIM FUNDS ANNUAL REPORT | 19 |
MANAGERS’ COMMENTARY(Unaudited)(concluded) | September 30, 2016 |
Overweights to technology and consumer non-cyclical issuers contributed to performance for the period. We continue to avoid highly levered industries and companies with heavy capital expenditure needs that can impair cash flow generation. Companies with strong cash flows, recurring revenue streams, and high-quality margins should remain the focus in the later stages of the credit cycle.
Performance displayed represents past performance which is no guarantee of future results.
1 | Performance figures are based on Class A shares and do not reflect deduction of the sales charges or taxes that a shareholder would pay on distributions or the redemption of shares. |
The opinions and forecast expressed may not actually come to pass. This information is subject to change at any time, based on market and other conditions, and should not be construed as a recommendation of any specific security or strategy.
20 | THE GUGGENHEIM FUNDS ANNUAL REPORT | |
PERFORMANCE REPORT AND FUND PROFILE (Unaudited) | September 30, 2016 |
HIGH YIELD FUND
OBJECTIVE: Seeks high current income. Capital appreciation is a secondary objective.
Holdings Diversification (Market Exposure as % of Net Assets)
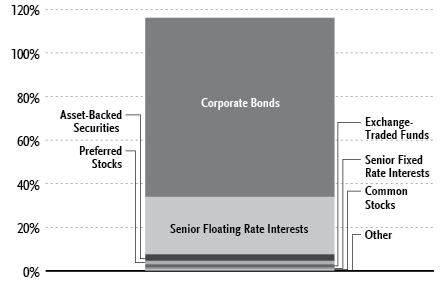
“Holdings Diversification (Market Exposure as % of Net Assets)” excludes any temporary cash investments.
Portfolio Composition by Quality Rating1 |
Rating | |
Fixed Income Instruments | |
AAA | 0.2% |
AA | 0.2% |
A | 0.7% |
BBB | 7.9% |
BB | 38.4% |
B | 37.5% |
CCC | 8.4% |
C | 0.1% |
NR2 | 3.3% |
Other Instruments | 3.3% |
Total Investments | 100.0% |
The chart above reflects percentages of the value of total investments. |
Inception Dates: |
A-Class | August 5, 1996 |
C-Class | May 1, 2000 |
P-Class | May 1, 2015 |
Institutional Class | July 11, 2008 |
Ten Largest Holdings (% of Total Net Assets) |
Vector Group Ltd. | 1.8% |
Kennedy-Wilson, Inc. | 1.8% |
SPDR Barclays High Yield Bond ETF | 1.4% |
WMG Acquisition Corp. | 1.3% |
Comstock Resources, Inc. | 1.2% |
Eldorado Gold Corp. | 1.1% |
American Equity Investment Life Holding Co. | 1.1% |
LBC Tank Terminals Holding Netherlands BV | 1.0% |
Midas Intermediate Holdco II LLC / Midas Intermediate Holdco II Finance, Inc. | 1.0% |
Micron Technology, Inc. | 1.0% |
Top Ten Total | 12.7% |
“Ten Largest Holdings” excludes any temporary cash or derivative investments. |
1 | Source: BlackRock Solutions. Credit quality ratings are measured on a scale that generally ranges from AAA (highest) to D (lowest). All securities except for those labeled “NR” have been rated by a Nationally Recognized Statistical Rating Organization (“NRSRO”). For purposes of this presentation, when ratings are available from more than one agency, the highest rating is used. Guggenheim Investments converts ratings to the equivalent S&P rating. |
2 | NR securities do not necessarily indicate low credit quality. |
| | THE GUGGENHEIM FUNDS ANNUAL REPORT | 21 |
PERFORMANCE REPORT AND FUND PROFILE (Unaudited)(concluded) | September 30, 2016 |
Cumulative Fund Performance*
Average Annual Returns*
Periods Ended September 30, 2016
| | 1 Year | 5 Year | 10 Year |
A-Class Shares | 10.71% | 8.92% | 7.14% |
A-Class Shares with sales charge† | 5.43% | 7.87% | 6.62% |
C-Class Shares | 9.81% | 8.09% | 6.35% |
C-Class Shares with CDSC‡ | 8.81% | 8.09% | 6.35% |
Bloomberg Barclays U.S. Corporate High Yield Index | 12.73% | 8.34% | 7.71% |
| | 1 Year | 5 Year | Since Inception
(07/11/08) |
Institutional Class Shares | 10.95% | 9.19% | 8.74% |
Bloomberg Barclays U.S. Corporate High Yield Index | 12.73% | 8.34% | 9.05% |
| | | 1 Year | Since Inception
(05/01/15) |
P-Class Shares | | 10.74% | 4.37% |
Bloomberg Barclays U.S. Corporate High Yield Index | | 12.73% | 4.17% |
* | The performance data above represents past performance that is not predictive of future results. The investment return and principal value of an investment in the Fund will fluctuate so that an investor’s shares, when redeemed, may be worth more or less than their original cost. Returns are historical and include changes in principal and reinvested dividends and capital gains and do not reflect the effect of taxes. The Bloomberg Barclays U.S. Corporate High Yield Index is an unmanaged index and, unlike the Fund, has no management fees or operating expenses to reduce its reported return. The graph is based on A-Class shares only; performance for C-Class shares, P-Class shares and Institutional Class shares will vary due to differences in fee structures. |
† | Effective October 1, 2015, the maximum sales charge decreased from 4.75% to 4.00%. A 4.75% maximum sales charge is used in the calculation of the Average Annual Returns (based on subscriptions made prior to October 1, 2015), and a 4.00% maximum sales charge will be used to calculate performance for periods based on subscriptions made on or after October 1, 2015. |
‡ | Fund returns include a CDSC of 1% if redeemed within 12 months of purchase. |
22 | THE GUGGENHEIM FUNDS ANNUAL REPORT | |
SCHEDULE OF INVESTMENTS | September 30, 2016 |
HIGH YIELD FUND | |
| | | Shares | | | Value | |
| | | | | | | |
COMMON STOCKS† - 0.8% | |
| | | | | | | |
Technology - 0.4% | |
Aspect Software Parent, Inc.*,†††,1 | | | 43,055 | | | $ | 1,010,571 | |
| | | | | | | | | |
Consumer, Cyclical - 0.2% | |
Metro-Goldwyn-Mayer, Inc.*,†† | | | 7,040 | | | | 563,200 | |
| | | | | | | | | |
Energy - 0.2% | |
Titan Energy LLC* | | | 17,186 | | | | 506,987 | |
Stallion Oilfield Holdings Ltd.*,†† | | | 8,257 | | | | 2,064 | |
Total Energy | | | | | | | 509,051 | |
| | | | | | | | | |
Communications - 0.0% | |
Cengage Learning Acquisitions, Inc.*,†† | | | 2,107 | | | | 51,095 | |
| | | | | | | | | |
Consumer, Non-cyclical - 0.0% | |
Targus Group International Equity, Inc*,†††,1 | | | 13,240 | | | | 19,330 | |
Crimson Wine Group Ltd.* | | | 8 | | | | 69 | |
Total Consumer, Non-cyclical | | | | | | | 19,399 | |
| | | | | | | | | |
Diversified - 0.0% | |
Leucadia National Corp. | | | 81 | | | | 1,542 | |
| | | | | | | | | |
Basic Materials - 0.0% | |
Mirabela Nickel Ltd.*,†††,1 | | | 1,044,540 | | | | 80 | |
| | | | | | | | | |
Total Common Stocks | | | | | | | | |
(Cost $2,512,648) | | | | | | | 2,154,938 | |
| | | | | | | | | |
PREFERRED STOCKS†† - 1.6% | |
Financial - 0.8% | |
Morgan Stanley 6.38%2,3 | | | 46,000 | | | | 1,282,020 | |
Aspen Insurance Holdings Ltd. 5.95%1,2,3 | | | 19,965 | | | | 583,178 | |
Total Financial | | | | | | | 1,865,198 | |
| | | | | | | | | |
Industrial - 0.7% | |
Seaspan Corp. 6.38% due 04/30/191 | | | 70,500 | | | | 1,790,700 | |
U.S. Shipping Corp. due *,††† | | | 14,718 | | | | 27,596 | |
Total Industrial | | | | | | | 1,818,296 | |
| | | | | | | | | |
Communications - 0.1% | |
Medianews Group, Inc. * | | | 11,074 | | | | 332,220 | |
Total Preferred Stocks | | | | | | | | |
(Cost $3,954,721) | | | | | | | 4,015,714 | |
| | | | | | | | | |
WARRANTS†† - 0.0% | |
Comstock Resources, Inc. | | | | | | | | |
$0.01, 09/06/18 | | | 9,075 | | | | 69,243 | |
Total Warrants | | | | | | | | |
(Cost $64,338) | | | | | | | 69,243 | |
| | | | | | | | | |
EXCHANGE-TRADED FUNDS† - 1.4% | |
SPDR Barclays High Yield Bond ETF | | | 102,000 | | | | 3,745,440 | |
Total Exchange-Traded Funds | | | | | | | | |
(Cost $3,647,709) | | | | | | | 3,745,440 | |
| | | | | | | | | |
SHORT-TERM INVESTMENTS† - 0.1% | |
Dreyfus Treasury Securities Cash Management Fund - Institutional Class 0.16%4 | | | 223,941 | | | | 223,941 | |
Total Short-Term Investments | | | | | | | | |
(Cost $223,941) | | | | | | | 223,941 | |
| | | Face
Amount11 | | | | |
| | | | | | | |
CORPORATE BONDS†† - 82.1% | |
Communications - 14.1% | |
DISH DBS Corp. | | | | | | |
5.88% due 11/15/246 | | $ | 2,300,000 | | | | 2,271,249 | |
7.75% due 07/01/26 | | | 1,425,000 | | | | 1,514,063 | |
5.88% due 07/15/22 | | | 1,250,000 | | | | 1,284,663 | |
CSC Holdings LLC | | | | | | | | |
6.75% due 11/15/21 | | | 2,250,000 | | | | 2,379,374 | |
5.25% due 06/01/24 | | | 1,550,000 | | | | 1,472,500 | |
5.50% due 04/15/277 | | | 550,000 | | | | 562,375 | |
SFR Group S.A. | | | | | | | | |
7.38% due 05/01/267 | | | 2,200,000 | | | | 2,248,817 | |
6.00% due 05/15/227 | | | 1,350,000 | | | | 1,377,000 | |
Sprint Communications, Inc. | | | | | | | | |
9.00% due 11/15/187 | | | 2,050,000 | | | | 2,262,688 | |
7.00% due 03/01/207 | | | 1,000,000 | | | | 1,072,500 | |
6.00% due 11/15/22 | | | 150,000 | | | | 139,125 | |
T-Mobile USA, Inc. | | | | | | | | |
6.50% due 01/15/26 | | | 2,050,000 | | | | 2,267,812 | |
MDC Partners, Inc. | | | | | | | | |
6.50% due 05/01/246,7 | | | 2,450,000 | | | | 2,266,250 | |
Sprint Corp. | | | | | | | | |
7.25% due 09/15/21 | | | 1,000,000 | | | | 1,003,750 | |
7.88% due 09/15/23 | | | 450,000 | | | | 452,813 | |
7.63% due 02/15/25 | | | 100,000 | | | | 99,000 | |
EIG Investors Corp. | | | | | | | | |
10.88% due 02/01/24†††,5 | | | 1,450,000 | | | | 1,204,584 | |
CCO Holdings LLC / CCO Holdings Capital Corp. | | | | | | | | |
5.88% due 04/01/24 | | | 1,000,000 | | | | 1,066,900 | |
Avaya, Inc. | | | | | | | | |
7.00% due 04/01/196,7 | | | 1,350,000 | | | | 995,625 | |
TIBCO Software, Inc. | | | | | | | | |
11.38% due 12/01/217 | | | 1,100,000 | | | | 979,000 | |
Comcast Corp. | | | | | | | | |
3.20% due 07/15/36 | | | 1,000,000 | | | | 978,098 | |
Sirius XM Radio, Inc. | | | | | | | | |
5.38% due 07/15/267 | | | 950,000 | | | | 976,125 | |
McGraw-Hill Global Education Holdings LLC / McGraw-Hill Global Education Finance | | | | | | | | |
7.88% due 05/15/247 | | | 900,000 | | | | 972,000 | |
Altice US Finance I Corp. | | | | | | | | |
5.38% due 07/15/237 | | | 900,000 | | | | 930,375 | |
SEE NOTES TO FINANCIAL STATEMENTS. | THE GUGGENHEIM FUNDS ANNUAL REPORT | 23 |
SCHEDULE OF INVESTMENTS (continued) | September 30, 2016 |
HIGH YIELD FUND | |
| | | Face
Amount11 | | | Value | |
| | | | | | | |
Inmarsat Finance plc | | | | | | |
4.88% due 05/15/227 | | $ | 850,000 | | | $ | 807,500 | |
Zayo Group LLC / Zayo Capital, Inc. | | | | | | | | |
6.38% due 05/15/25 | | | 700,000 | | | | 742,000 | |
Midcontinent Communications & Midcontinent Finance Corp. | | | | | | | | |
6.88% due 08/15/237 | | | 650,000 | | | | 692,250 | |
UPCB Finance IV Ltd. | | | | | | | | |
5.38% due 01/15/257 | | | 650,000 | | | | 653,023 | |
Ziggo Secured Finance BV | | | | | | | | |
5.50% due 01/15/277 | | | 650,000 | | | | 649,188 | |
Level 3 Financing, Inc. | | | | | | | | |
5.25% due 03/15/26 | | | 550,000 | | | | 567,875 | |
Match Group, Inc. | | | | | | | | |
6.38% due 06/01/24 | | | 500,000 | | | | 543,750 | |
Cogent Communications Group, Inc. | | | | | | | | |
5.38% due 03/01/227 | | | 400,000 | | | | 412,000 | |
Sirius XM Canada Holdings, Inc. | | | | | | | | |
5.63% due 04/23/217 | | CAD 500,000 | | | | 379,282 | |
CenturyLink, Inc. | | | | | | | | |
5.63% due 04/01/25 | | | 250,000 | | | | 239,375 | |
Total Communications | | | | | | | 36,462,929 | |
| | | | | | | | | |
Energy - 13.6% | |
Sabine Pass Liquefaction LLC | | | | | | | | |
6.25% due 03/15/22 | | | 2,261,000 | | | | 2,470,143 | |
5.00% due 03/15/27 | | | 1,050,000 | | | | 1,076,250 | |
5.63% due 02/01/21 | | | 1,000,000 | | | | 1,056,250 | |
5.88% due 06/30/26 | | | 800,000 | | | | 869,500 | |
Comstock Resources, Inc. | | | | | | | | |
10.00% due 03/15/20 | | | 3,300,000 | | | | 3,052,499 | |
Antero Resources Corp. | | | | | | | | |
5.63% due 06/01/23 | | | 1,000,000 | | | | 1,018,750 | |
6.00% due 12/01/20 | | | 750,000 | | | | 775,080 | |
5.38% due 11/01/21 | | | 350,000 | | | | 353,938 | |
5.13% due 12/01/22 | | | 300,000 | | | | 302,250 | |
Gibson Energy, Inc. | | | | | | | | |
6.75% due 07/15/216,7 | | | 2,200,000 | | | | 2,249,500 | |
CONSOL Energy, Inc. | | | | | | | | |
8.00% due 04/01/23 | | | 1,300,000 | | | | 1,261,000 | |
5.88% due 04/15/22 | | | 1,050,000 | | | | 966,000 | |
Crestwood Midstream Partners Limited Partnership / Crestwood Midstream Finance Corp. | | | | | | | | |
6.00% due 12/15/20 | | | 980,000 | | | | 987,350 | |
6.25% due 04/01/23 | | | 900,000 | | | | 911,250 | |
Halcon Resources Corp. | | | | | | | | |
8.63% due 02/01/206,7 | | | 1,875,000 | | | | 1,884,375 | |
Unit Corp. | | | | | | | | |
6.63% due 05/15/21 | | | 2,100,000 | | | | 1,771,875 | |
Whiting Petroleum Corp. | | | | | | | | |
5.00% due 03/15/19 | | | 1,275,000 | | | | 1,233,563 | |
5.75% due 03/15/216 | | | 500,000 | | | | 467,500 | |
TerraForm Power Operating LLC | | | | | | | | |
9.38% due 02/01/237,8 | | | 1,250,000 | | | | 1,284,375 | |
9.63% due 06/15/256,7,8 | | | 225,000 | | | | 236,250 | |
CONTOURGLOBAL LP | | | | | | | | |
5.13% due 06/15/21 | | EUR 1,300,000 | | | | 1,518,529 | |
PDC Energy, Inc. | | | | | | | | |
7.75% due 10/15/22 | | | 1,050,000 | | | | 1,120,875 | |
6.13% due 09/15/24 | | | 375,000 | | | | 388,125 | |
Legacy Reserves Limited Partnership / Legacy Reserves Finance Corp. | | | | | | | | |
6.63% due 12/01/21 | | | 1,090,000 | | | | 566,800 | |
8.00% due 12/01/20 | | | 965,000 | | | | 521,100 | |
BreitBurn Energy Partners Limited Partnership / BreitBurn Finance Corp. | | | | | | | | |
7.88% due 04/15/229 | | | 1,750,000 | | | | 892,500 | |
Keane Group Holdings LLC | | | | | | | | |
12.00% due 08/08/19†††,1 | | | 956,250 | | | | 877,359 | |
SandRidge Energy, Inc. | | | | | | | | |
8.75% due 06/01/207,9 | | | 2,375,000 | | | | 855,000 | |
7.50% due 03/15/219 | | | 250,000 | | | | 14,375 | |
EP Energy LLC / Everest Acquisition Finance, Inc. | | | | | | | | |
9.38% due 05/01/20 | | | 650,000 | | | | 459,875 | |
6.38% due 06/15/23 | | | 650,000 | | | | 388,375 | |
Summit Midstream Holdings LLC / Summit Midstream Finance Corp. | | | | | | | | |
7.50% due 07/01/21 | | | 400,000 | | | | 414,000 | |
5.50% due 08/15/22 | | | 350,000 | | | | 333,375 | |
QEP Resources, Inc. | | | | | | | | |
6.88% due 03/01/21 | | | 650,000 | | | | 677,625 | |
FTS International, Inc. | | | | | | | | |
8.35% due 06/15/202,7 | | | 700,000 | | | | 594,580 | |
Approach Resources, Inc. | | | | | | | | |
7.00% due 06/15/216 | | | 600,000 | | | | 480,000 | |
Callon Petroleum Co. | | | | | | | | |
6.13% due 10/01/24 | | | 400,000 | | | | 414,000 | |
Crestwood Midstream Partners, LP / Crestwood Midstream Finance Corp. | | | | | | | | |
6.13% due 03/01/22 | | | 350,000 | | | | 353,500 | |
DCP Midstream LLC | | | | | | | | |
5.35% due 03/15/207 | | | 150,000 | | | | 153,750 | |
Schahin II Finance Company SPV Ltd. | | | | | | | | |
5.88% due 09/25/225,9 | | | 217,167 | | | | 26,060 | |
SemGroup, LP | | | | | | | | |
8.75% due 11/15/15†††,1 | | | 1,300,000 | | | | 1 | |
Total Energy | | | | | | | 35,277,502 | |
| | | | | | | | | |
Financial - 11.3% | |
Kennedy-Wilson, Inc. | | | | | | | | |
5.88% due 04/01/246 | | | 4,550,000 | | | | 4,584,124 | |
Jefferies Finance LLC / JFIN Company-Issuer Corp. | | | | | | | | |
7.38% due 04/01/207 | | | 2,150,000 | | | | 2,096,250 | |
7.50% due 04/15/217 | | | 1,000,000 | | | | 972,500 | |
American Equity Investment Life Holding Co. | | | | | | | | |
6.63% due 07/15/216 | | | 2,650,000 | | | | 2,762,294 | |
Citigroup, Inc. | | | | | | | | |
6.25%2,3 | | | 1,400,000 | | | | 1,506,750 | |
6.30%2,3 | | | 700,000 | | | | 719,250 | |
24 | THE GUGGENHEIM FUNDS ANNUAL REPORT | SEE NOTES TO FINANCIAL STATEMENTS. |
SCHEDULE OF INVESTMENTS (continued) | September 30, 2016 |
HIGH YIELD FUND | |
| | | Face
Amount11 | | | Value | |
| | | | | | | |
NFP Corp. | | | | | | |
9.00% due 07/15/217 | | $ | 2,150,000 | | | $ | 2,208,856 | |
Lincoln Finance Ltd. | | | | | | | | |
6.88% due 04/15/21 | | EUR 1,600,000 | | | | 1,941,028 | |
GEO Group, Inc. | | | | | | | | |
5.88% due 01/15/22 | | | 900,000 | | | | 810,000 | |
6.00% due 04/15/26 | | | 600,000 | | | | 510,000 | |
NewStar Financial, Inc. | | | | | | | | |
7.25% due 05/01/206 | | | 1,200,000 | | | | 1,182,000 | |
Garfunkelux Holding Co. 3 S.A. | | | | | | | | |
8.50% due 11/01/22 | | GBP 700,000 | | | | 922,955 | |
Capital One Financial Corp. | | | | | | | | |
3.75% due 07/28/266 | | | 900,000 | | | | 903,190 | |
Goldman Sachs Group, Inc. | | | | | | | | |
5.30%2,3 | | | 850,000 | | | | 871,250 | |
FBM Finance, Inc. | | | | | | | | |
8.25% due 08/15/217 | | | 800,000 | | | | 836,000 | |
Icahn Enterprises Limited Partnership / Icahn Enterprises Finance Corp. | | | | | | | | |
6.00% due 08/01/20 | | | 800,000 | | | | 804,000 | |
Icahn Enterprises, LP / Icahn Enterprises Finance Corp. | | | | | | | | |
5.88% due 02/01/22 | | | 800,000 | | | | 768,000 | |
Greystar Real Estate Partners LLC | | | | | | | | |
8.25% due 12/01/227 | | | 710,000 | | | | 752,600 | |
Bank of America Corp. | | | | | | | | |
6.10%2,3 | | | 700,000 | | | | 729,750 | |
Cabot Financial Luxembourg S.A. | | | | | | | | |
7.50% due 10/01/23 | | GBP 550,000 | | | | 699,825 | |
Wilton Re Finance LLC | | | | | | | | |
5.88% due 03/30/332,7 | | | 650,000 | | | | 667,875 | |
EPR Properties | | | | | | | | |
5.75% due 08/15/226 | | | 450,000 | | | | 499,191 | |
HUB International Ltd. | | | | | | | | |
9.25% due 02/15/217 | | | 450,000 | | | | 468,225 | |
Compass Bank | | | | | | | | |
3.88% due 04/10/256 | | | 450,000 | | | | 440,185 | |
Majid AL Futtaim Holding | | | | | | | | |
7.13%3 | | | 300,000 | | | | 316,581 | |
Quicken Loans, Inc. | | | | | | | | |
5.75% due 05/01/257 | | | 250,000 | | | | 248,125 | |
Lock AS | | | | | | | | |
7.00% due 08/15/21 | | EUR 50,000 | | | | 58,485 | |
Total Financial | | | | | | | 29,279,289 | |
| | | | | | | | | |
Consumer, Non-cyclical - 9.8% | |
Vector Group Ltd. | | | | | | | | |
7.75% due 02/15/216 | | | 4,530,000 | | | | 4,777,790 | |
HCA, Inc. | | | | | | | | |
5.88% due 02/15/26 | | | 1,350,000 | | | | 1,439,437 | |
4.50% due 02/15/27 | | | 900,000 | | | | 905,625 | |
5.25% due 06/15/26 | | | 500,000 | | | | 531,250 | |
Midas Intermediate Holdco II LLC / Midas Intermediate Holdco II Finance, Inc. | | | | | | | | |
7.88% due 10/01/227 | | | 2,577,000 | | | | 2,622,098 | |
Central Garden & Pet Co. | | | | | | | | |
6.13% due 11/15/23 | | | 1,500,000 | | | | 1,605,000 | |
WEX, Inc. | | | | | | | | |
4.75% due 02/01/237 | | | 1,500,000 | | | | 1,479,375 | |
KeHE Distributors LLC / KeHE Finance Corp. | | | | | | | | |
7.63% due 08/15/217 | | | 1,470,000 | | | | 1,458,975 | |
Bumble Bee Holdco SCA | | | | | | | | |
9.63% due 03/15/187 | | | 1,424,000 | | | | 1,413,320 | |
ADT Corp. | | | | | | | | |
3.50% due 07/15/22 | | | 850,000 | | | | 818,125 | |
6.25% due 10/15/21 | | | 450,000 | | | | 489,375 | |
Halyard Health, Inc. | | | | | | | | |
6.25% due 10/15/22 | | | 1,250,000 | | | | 1,278,125 | |
Bumble Bee Holdings, Inc. | | | | | | | | |
9.00% due 12/15/177 | | | 1,250,000 | | | | 1,256,250 | |
Kinetic Concepts Incorporated / KCI USA Inc | | | | | | | | |
7.88% due 02/15/217 | | | 1,100,000 | | | | 1,190,750 | |
US Foods, Inc. | | | | | | | | |
5.88% due 06/15/247 | | | 600,000 | | | | 622,500 | |
AMN Healthcare, Inc. | | | | | | | | |
5.13% due 10/01/247 | | | 600,000 | | | | 606,000 | |
Post Holdings, Inc. | | | | | | | | |
5.00% due 08/15/267 | | | 600,000 | | | | 597,000 | |
Acadia Healthcare Company, Inc. | | | | | | | | |
6.50% due 03/01/24 | | | 400,000 | | | | 419,000 | |
5.63% due 02/15/23 | | | 150,000 | | | | 152,250 | |
Albertsons Companies LLC / Safeway Incorporated / New Albertson’s Inc / Albertson’s LLC | | | | | | | | |
6.63% due 06/15/24 | | | 500,000 | | | | 520,000 | |
Opal Acquisition, Inc. | | | | | | | | |
8.88% due 12/15/217 | | | 610,000 | | | | 500,200 | |
DaVita, Inc. | | | | | | | | |
5.00% due 05/01/25 | | | 450,000 | | | | 451,688 | |
R&R Ice Cream plc | | | | | | | | |
8.25% due 05/15/207 | | AUD 200,000 | | | | 159,286 | |
CHS/Community Health Systems, Inc. | | | | | | | | |
5.13% due 08/15/18 | | | 101,000 | | | | 102,010 | |
Total Consumer, Non-cyclical | | | | | | | 25,395,429 | |
| | | | | | | | | |
Technology - 9.7% | |
Micron Technology, Inc. | | | | | | | | |
5.25% due 08/01/236 | | | 2,650,000 | | | | 2,616,875 | |
7.50% due 09/15/236,7 | | | 1,760,000 | | | | 1,954,902 | |
First Data Corp. | | | | | | | | |
5.75% due 01/15/247 | | | 2,350,000 | | | | 2,414,625 | |
5.00% due 01/15/247 | | | 1,600,000 | | | | 1,624,000 | |
7.00% due 12/01/237 | | | 350,000 | | | | 370,125 | |
NCR Corp. | | | | | | | | |
6.38% due 12/15/23 | | | 2,350,000 | | | | 2,485,125 | |
5.88% due 12/15/21 | | | 1,300,000 | | | | 1,368,250 | |
Infor US, Inc. | | | | | | | | |
6.50% due 05/15/226 | | | 2,200,000 | | | | 2,227,500 | |
5.75% due 08/15/207 | | | 1,000,000 | | | | 1,050,000 | |
Open Text Corp. | | | | | | | | |
5.63% due 01/15/236,7 | | | 2,400,000 | | | | 2,447,999 | |
SEE NOTES TO FINANCIAL STATEMENTS. | THE GUGGENHEIM FUNDS ANNUAL REPORT | 25 |
SCHEDULE OF INVESTMENTS (continued) | September 30, 2016 |
HIGH YIELD FUND | |
| | | Face
Amount11 | | | Value | |
| | | | | | | |
5.88% due 06/01/267 | | $ | 600,000 | | | $ | 627,750 | |
Epicor Software | | | | | | | | |
9.25% due 06/21/23††† | | | 2,000,000 | | | | 1,954,000 | |
Cengage Learning, Inc. | | | | | | | | |
9.50% due 06/15/247 | | | 1,525,000 | | | | 1,551,688 | |
Quintiles IMS, Inc. | | | | | | | | |
3.50% due 10/15/247 | | EUR 800,000 | | | | 914,431 | |
Oracle Corp. | | | | | | | | |
3.85% due 07/15/366 | | | 550,000 | | | | 571,096 | |
Microsoft Corp. | | | | | | | | |
4.20% due 11/03/356 | | | 450,000 | | | | 503,041 | |
Aspect Software, Inc. | | | | | | | | |
3.00% due 05/25/23††† | | | 427,339 | | | | 351,942 | |
Total Technology | | | | | | | 25,033,349 | |
| | | | | | | | | |
Industrial - 8.5% | |
Novelis Corp. | | | | | | | | |
5.88% due 09/30/267 | | | 2,000,000 | | | | 2,047,500 | |
6.25% due 08/15/247 | | | 500,000 | | | | 530,625 | |
StandardAero Aviation Holdings, Inc. | | | | | | | | |
10.00% due 07/15/237 | | | 2,150,000 | | | | 2,307,122 | |
Ziggo Secured Finance BV | | | | | | | | |
4.25% due 01/15/27 | | EUR 1,650,000 | | | | 1,848,778 | |
Amsted Industries, Inc. | | | | | | | | |
5.38% due 09/15/247 | | | 1,650,000 | | | | 1,641,750 | |
Reynolds Group Issuer Incorporated / Reynolds Group Issuer LLC / Reynolds Group Issuer Lu | | | | | | | | |
5.75% due 10/15/20 | | | 800,000 | | | | 825,000 | |
4.13% due 07/15/212,7 | | | 550,000 | | | | 558,250 | |
Actuant Corp. | | | | | | | | |
5.63% due 06/15/22 | | | 1,100,000 | | | | 1,146,068 | |
Summit Materials LLC / Summit Materials Finance Corp. | | | | | | | | |
8.50% due 04/15/22 | | | 1,050,000 | | | | 1,144,500 | |
Ardagh Packaging Finance PLC | | | | | | | | |
6.75% due 05/15/24 | | EUR 850,000 | | | | 1,003,124 | |
Crown Americas LLC / Crown Americas Capital Corporation V | | | | | | | | |
4.25% due 09/30/26 | | | 950,000 | | | | 951,187 | |
Moto Finance plc | | | | | | | | |
6.38% due 09/01/20 | | GBP 650,000 | | | | 877,009 | |
Reliance Intermediate Holdings, LP | | | | | | | | |
6.50% due 04/01/237 | | | 825,000 | | | | 866,250 | |
Standard Industries, Inc. | | | | | | | | |
5.50% due 02/15/237 | | | 700,000 | | | | 731,500 | |
Reynolds Group Issuer, Inc. / Reynolds Group Issuer LLC | | | | | | | | |
5.13% due 07/15/237 | | | 700,000 | | | | 722,750 | |
Anixter, Inc. | | | | | | | | |
5.50% due 03/01/23 | | | 650,000 | | | | 680,875 | |
Ardagh Packaging Finance plc / Ardagh Holdings USA, Inc. | | | | | | | | |
7.25% due 05/15/247 | | | 600,000 | | | | 639,000 | |
Infor US, Inc. | | | | | | | | |
5.75% due 05/15/22 | | EUR 550,000 | | | | 604,789 | |
TransDigm, Inc. | | | | | | | | |
6.38% due 06/15/26 | | | 450,000 | | | | 464,625 | |
LMI Aerospace, Inc. | | | | | | | | |
7.38% due 07/15/19 | | | 436,000 | | | | 438,180 | |
Hexcel Corp. | | | | | | | | |
4.70% due 08/15/256 | | | 400,000 | | | | 434,754 | |
Reynolds Group Issuer Inc. / Reynolds Group Issuer LLC / Reynolds Group Issuer | | | | | | | | |
6.88% due 02/15/21 | | | 400,000 | | | | 415,000 | |
Coveris Holdings S.A. | | | | | | | | |
7.88% due 11/01/197 | | | 350,000 | | | | 357,875 | |
SBA Communications Corp. | | | | | | | | |
4.88% due 09/01/24 | | | 350,000 | | | | 352,625 | |
Moog, Inc. | | | | | | | | |
5.25% due 12/01/227 | | | 200,000 | | | | 206,750 | |
CEVA Group plc | | | | | | | | |
7.00% due 03/01/217 | | | 136,000 | | | | 110,160 | |
Total Industrial | | | | | | | 21,906,046 | |
| | | | | | | | | |
Consumer, Cyclical - 7.9% | |
WMG Acquisition Corp. | | | | | | | | |
6.75% due 04/15/226,7 | | | 3,300,000 | | | | 3,489,749 | |
5.00% due 08/01/237 | | | 550,000 | | | | 558,250 | |
6.00% due 01/15/217 | | | 350,000 | | | | 363,125 | |
5.63% due 04/15/227 | | | 350,000 | | | | 362,250 | |
Ferrellgas Limited Partnership / Ferrellgas Finance Corp. | | | | | | | | |
6.75% due 06/15/23 | | | 1,600,000 | | | | 1,408,000 | |
6.75% due 01/15/22 | | | 1,050,000 | | | | 934,500 | |
6.50% due 05/01/21 | | | 650,000 | | | | 594,750 | |
Wynn Las Vegas LLC / Wynn Las Vegas Capital Corp. | | | | | | | | |
5.50% due 03/01/257 | | | 2,400,000 | | | | 2,430,000 | |
L Brands, Inc. | | | | | | | | |
6.75% due 07/01/36 | | | 1,050,000 | | | | 1,129,401 | |
6.88% due 11/01/35 | | | 250,000 | | | | 272,500 | |
Nathan’s Famous, Inc. | | | | | | | | |
10.00% due 03/15/207 | | | 1,250,000 | | | | 1,375,000 | |
NPC International Incorporated / NPC Operating Company A Inc / NPC Operating Co B Inc | | | | | | | | |
10.50% due 01/15/20 | | | 1,129,000 | | | | 1,179,805 | |
Seminole Hard Rock Entertainment Inc. / Seminole Hard Rock International LLC | | | | | | | | |
5.88% due 05/15/217 | | | 1,000,000 | | | | 1,010,000 | |
TVL Finance PLC | | | | | | | | |
8.50% due 05/15/23 | | GBP 700,000 | | | | 957,175 | |
Suburban Propane Partners Limited Partnership/Suburban Energy Finance Corp. | | | | | | | | |
5.50% due 06/01/24 | | | 650,000 | | | | 659,750 | |
5.75% due 03/01/25 | | | 100,000 | | | | 101,250 | |
Wyndham Worldwide Corp. | | | | | | | | |
5.10% due 10/01/256 | | | 650,000 | | | | 710,568 | |
Carrols Restaurant Group, Inc. | | | | | | | | |
8.00% due 05/01/22 | | | 650,000 | | | | 702,813 | |
26 | THE GUGGENHEIM FUNDS ANNUAL REPORT | SEE NOTES TO FINANCIAL STATEMENTS. |
SCHEDULE OF INVESTMENTS (continued) | September 30, 2016 |
HIGH YIELD FUND | |
| | | Face
Amount11 | | | Value | |
| | | | | | | |
Interval Acquisition Corp. | | | | | | |
5.63% due 04/15/23 | | $ | 600,000 | | | $ | 619,500 | |
Group 1 Automotive, Inc. | | | | | | | | |
5.25% due 12/15/236,7 | | | 550,000 | | | | 552,063 | |
5.00% due 06/01/22 | | | 50,000 | | | | 50,156 | |
National CineMedia LLC | | | | | | | | |
5.75% due 08/15/26 | | | 450,000 | | | | 466,875 | |
QVC, Inc. | | | | | | | | |
4.85% due 04/01/24 | | | 400,000 | | | | 406,197 | |
Men’s Wearhouse, Inc. | | | | | | | | |
7.00% due 07/01/22 | | | 255,000 | | | | 237,150 | |
Total Consumer, Cyclical | | | | | | | 20,570,827 | |
| | | | | | | | | |
Basic Materials - 3.9% | |
Eldorado Gold Corp. | | | | | | | | |
6.13% due 12/15/206,7 | | | 2,900,000 | | | | 2,920,300 | |
Alcoa Nederland Holding BV | | | | | | | | |
6.75% due 09/30/247 | | | 1,100,000 | | | | 1,142,625 | |
7.00% due 09/30/267 | | | 625,000 | | | | 646,094 | |
Novelis, Inc. | | | | | | | | |
8.38% due 12/15/17 | | | 1,250,000 | | | | 1,262,500 | |
Constellium N.V. | | | | | | | | |
7.88% due 04/01/217 | | | 1,050,000 | | | | 1,120,875 | |
GCP Applied Technologies, Inc. | | | | | | | | |
9.50% due 02/01/237 | | | 880,000 | | | | 1,005,356 | |
PQ Corp. | | | | | | | | |
6.75% due 11/15/227 | | | 800,000 | | | | 848,000 | |
Yamana Gold, Inc. | | | | | | | | |
4.95% due 07/15/24 | | | 625,000 | | | | 645,612 | |
Cascades, Inc. | | | | | | | | |
5.75% due 07/15/237 | | | 350,000 | | | | 354,375 | |
Mirabela Nickel Ltd. | | | | | | | | |
9.50% due 06/24/19†††,1,9 | | | 278,115 | | | | 77,872 | |
1.00% due 09/10/44†††,1,9 | | | 5,561 | | | | — | |
Total Basic Materials | | | | | | | 10,023,609 | |
| | | | | | | | | |
Utilities - 2.5% | |
LBC Tank Terminals Holding Netherlands BV | | | | | | | | |
6.88% due 05/15/236,7 | | | 2,655,000 | | | | 2,641,725 | |
Terraform Global Operating LLC | | | | | | | | |
13.75% due 08/15/226,7 | | | 2,400,000 | | | | 2,472,000 | |
AES Corp. | | | | | | | | |
6.00% due 05/15/26 | | | 900,000 | | | | 951,750 | |
4.88% due 05/15/23 | | | 350,000 | | | | 355,250 | |
3.84% due 06/01/192 | | | 112,000 | | | | 112,280 | |
Total Utilities | | | | | | | 6,533,005 | |
| | | | | | | | | |
Diversified - 0.8% | |
HRG Group, Inc. | | | | | | | | |
7.88% due 07/15/19 | | | 1,885,000 | | | | 1,986,319 | |
Total Corporate Bonds | | | | | | | | |
(Cost $210,416,429) | | | | | | | 212,468,304 | |
| | | | | | | | | |
SENIOR FLOATING RATE INTERESTS†† - 26.2% | |
Technology - 5.6% | |
Greenway Medical Technologies | | | | | | | | |
6.00% due 11/04/201 | | | 1,337,173 | | | | 1,300,401 | |
9.25% due 11/04/211 | | | 550,000 | | | | 507,375 | |
Solera LLC | | | | | | | | |
5.75% due 03/03/23 | | | 1,094,001 | | | | 1,104,712 | |
5.10% due 03/03/21†††,1 | | | 791,667 | | | | 693,180 | |
EIG Investors Corp. | | | | | | | | |
6.00% due 02/09/231 | | | 1,435,427 | | | | 1,334,946 | |
The Active Network, Inc. | | | | | | | | |
5.50% due 11/13/20 | | | 1,246,242 | | | | 1,236,895 | |
TIBCO Software, Inc. | | | | | | | | |
6.50% due 12/04/20 | | | 1,233,853 | | | | 1,214,679 | |
Landslide Holdings, Inc. | | | | | | | | |
5.50% due 09/27/22 | | | 1,050,000 | | | | 1,056,563 | |
Sparta Holding Corp. | | | | | | | | |
6.50% due 07/28/20†††,1 | | | 859,551 | | | | 854,073 | |
Advanced Computer Software | | | | | | | | |
6.50% due 03/18/22 | | | 541,750 | | | | 516,017 | |
10.50% due 01/31/231 | | | 300,000 | | | | 276,000 | |
Diebold, Inc. | | | | | | | | |
5.25% due 11/06/23 | | | 700,000 | | | | 706,419 | |
Aspect Software, Inc. | | | | | | | | |
10.50% due 05/25/20 | | | 673,084 | | | | 655,133 | |
Verisure Cayman 2 | | | | | | | | |
4.50% due 10/21/22 | | EUR 500,000 | | | | 568,408 | |
Coherent Holding GmbH | | | | | | | | |
4.25% due 08/01/23 | | EUR 500,000 | | | | 568,346 | |
Solarwinds Holdings, Inc. | | | | | | | | |
5.50% due 02/03/23 | | | 423,938 | | | | 427,753 | |
GlobalLogic Holdings, Inc. | | | | | | | | |
6.25% due 06/02/19 | | | 343,733 | | | | 342,873 | |
Micron Technology, Inc. | | | | | | | | |
6.53% due 04/26/22 | | | 299,250 | | | | 302,296 | |
Flexera Software LLC | | | | | | | | |
8.00% due 04/02/21 | | | 250,000 | | | | 245,313 | |
Avaya, Inc. | | | | | | | | |
6.25% due 05/29/20 | | | 290,290 | | | | 213,848 | |
Quorum Business Solutions | | | | | | | | |
5.75% due 08/06/211 | | | 216,150 | | | | 212,908 | |
Total Technology | | | | | | | 14,338,138 | |
| | | | | | | | | |
Consumer, Cyclical - 5.0% | |
Men’s Wearhouse | | | | | | | | |
4.50% due 06/18/21 | | | 1,584,901 | | | | 1,568,069 | |
The Bay Club Co. | | | | | | | | |
7.50% due 08/31/22 | | | 1,221,938 | | | | 1,197,499 | |
7.50% due 08/31/17 | | | 275,000 | | | | 272,250 | |
Belk, Inc. | | | | | | | | |
5.75% due 12/12/22 | | | 1,592,748 | | | | 1,440,863 | |
Sky Bet | | | | | | | | |
6.25% due 02/25/22 | | GBP 950,000 | | | | 1,237,495 | |
Fitness International LLC | | | | | | | | |
6.00% due 07/01/20 | | | 1,157,914 | | | | 1,156,177 | |
SEE NOTES TO FINANCIAL STATEMENTS. | THE GUGGENHEIM FUNDS ANNUAL REPORT | 27 |
SCHEDULE OF INVESTMENTS (continued) | September 30, 2016 |
HIGH YIELD FUND | |
| | | Face
Amount11 | | | Value | |
| | | | | | | |
Sears Holdings Corp. | | | | | | |
5.50% due 06/30/18 | | $ | 1,012,149 | | | $ | 990,215 | |
Talbots, Inc. | | | | | | | | |
5.50% due 03/19/20 | | | 1,008,919 | | | | 983,444 | |
Mavis Tire | | | | | | | | |
6.25% due 11/02/20†††,1 | | | 938,125 | | | | 927,344 | |
Navistar, Inc. | | | | | | | | |
6.50% due 08/07/20 | | | 794,000 | | | | 795,493 | |
DLK Acquisitions BV | | | | | | | | |
8.50% due 08/28/19 | | EUR 700,000 | | | | 780,643 | |
National Vision, Inc. | | | | | | | | |
6.75% due 03/11/22 | | | 450,000 | | | | 419,400 | |
Alexander Mann Solutions Ltd. | | | | | | | | |
5.75% due 12/20/19 | | | 403,863 | | | | 397,805 | |
Amaya Holding B.V. | | | | | | | | |
5.00% due 08/01/21 | | | 298,489 | | | | 298,116 | |
Bass Pro Group LLC | | | | | | | | |
4.00% due 06/05/20 | | | 287,755 | | | | 286,857 | |
Advantage Sales & Marketing LLC | | | | | | | | |
3.39% due 07/25/19†††,1 | | | 82,500 | | | | 76,508 | |
Total Consumer, Cyclical | | | | | | | 12,828,178 | |
| | | | | | | | | |
Industrial - 4.4% | |
Flakt Woods | | | | | | | | |
2.88% due 03/20/17††† | | EUR 1,625,276 | | | | 1,807,383 | |
KC Merger Sub, Inc. | | | | | | | | |
6.00% due 08/12/22 | | | 1,330,528 | | | | 1,333,521 | |
CareCore National LLC | | | | | | | | |
5.50% due 03/05/21 | | | 1,174,070 | | | | 1,150,589 | |
Nielsen Finance LLC | | | | | | | | |
5.75% due 10/04/23 | | | 1,000,000 | | | | 1,004,220 | |
Camp International Holding Co. | | | | | | | | |
4.75% due 08/18/23 | | | 1,000,000 | | | | 998,000 | |
Advanced Integration Tech | | | | | | | | |
6.50% due 07/22/21 | | | 900,000 | | | | 902,250 | |
Leidos, Inc. | | | | | | | | |
3.27% due 08/16/23 | | | 720,000 | | | | 723,600 | |
SRS Distribution, Inc. | | | | | | | | |
9.75% due 02/24/23 | | | 700,000 | | | | 706,125 | |
Hardware Holdings LLC | | | | | | | | |
6.75% due 03/30/201 | | | 588,000 | | | | 573,300 | |
CPM Holdings, Inc. | | | | | | | | |
6.00% due 04/11/22 | | | 493,750 | | | | 495,809 | |
Atkore International, Inc. | | | | | | | | |
7.75% due 10/09/21 | | | 450,000 | | | | 450,189 | |
Transdigm, Inc. | | | | | | | | |
3.75% due 05/14/22 | | | 345,002 | | | | 345,196 | |
SIRVA Worldwide, Inc. | | | | | | | | |
7.50% due 03/27/191 | | | 312,011 | | | | 308,891 | |
Mast Global | | | | | | | | |
7.75% due 09/12/19†††,1 | | | 263,314 | | | | 262,006 | |
Hunter Defense Technologies | | | | | | | | |
7.00% due 08/05/19†††,1 | | | 243,333 | | | | 182,500 | |
Wencor Group | | | | | | | | |
4.04% due 06/19/19††† | | | 160,769 | | | | 150,540 | |
NANA Development Corp. | | | | | | | | |
8.00% due 03/15/181 | | | 33,333 | | | | 31,167 | |
CEVA Group Plc (United Kingdom) | | | | | | | | |
6.50% due 03/19/21 | | | 11,463 | | | | 9,166 | |
Total Industrial | | | | | | | 11,434,452 | |
| | | | | | | | | |
Consumer, Non-cyclical - 3.5% | |
Albertson’s LLC | | | | | | | | |
4.50% due 08/25/21 | | | 1,367,491 | | | | 1,377,431 | |
IHC Holding Corp. | | | | | | | | |
7.00% due 04/30/21†††,1 | | | 839,375 | | | | 829,761 | |
7.25% due 04/30/21†††,1 | | | 159,600 | | | | 157,340 | |
Give and Go Prepared Foods Corp. | | | | | | | | |
6.50% due 07/29/23 | | | 975,000 | | | | 969,521 | |
Reddy Ice Holdings, Inc. | | | | | | | | |
6.75% due 05/01/19 | | | 977,966 | | | | 924,178 | |
American Tire Distributors, Inc. | | | | | | | | |
5.25% due 09/01/21 | | | 937,016 | | | | 923,898 | |
Lineage Logistics LLC | | | | | | | | |
4.50% due 04/07/21 | | | 833,687 | | | | 823,266 | |
ABB Concise Optical Group LLC | | | | | | | | |
6.00% due 06/15/23 | | | 700,000 | | | | 706,125 | |
American Seafoods | | | | | | | | |
6.02% due 08/19/211 | | | 581,270 | | | | 575,457 | |
CTI Foods Holding Co. LLC | | | | | | | | |
8.25% due 06/28/21 | | | 590,000 | | | | 525,100 | |
Parts Town | | | | | | | | |
7.50% due 06/23/221 | | | 500,000 | | | | 500,000 | |
NES Global Talent | | | | | | | | |
6.50% due 10/03/191 | | | 491,165 | | | | 437,137 | |
Pelican Products, Inc. | | | | | | | | |
9.25% due 04/09/21 | | | 300,000 | | | | 267,000 | |
Arctic Glacier Holdings, Inc. | | | | | | | | |
6.00% due 05/10/19 | | | 137,397 | | | | 135,679 | |
Targus Group International, Inc. | | | | | | | | |
due 05/24/16†††,1,10 | | | 153,489 | | | | — | |
Total Consumer, Non-cyclical | | | | | | | 9,151,893 | |
| | | | | | | | | |
Utilities - 2.2% | |
TPF II Power LLC | | | | | | | | |
5.00% due 10/02/21 | | | 1,425,219 | | | | 1,438,403 | |
Exgen Texas Power LLC | | | | | | | | |
5.75% due 09/18/21 | | | 1,346,189 | | | | 1,095,461 | |
Invenergy Thermal Operating I, LLC | | | | | | | | |
6.50% due 10/19/22 | | | 1,039,872 | | | | 993,078 | |
Panda Power | | | | | | | | |
7.50% due 08/21/20 | | | 985,607 | | | | 967,127 | |
MRP Generation Holding | | | | | | | | |
8.00% due 09/29/22 | | | 725,000 | | | | 681,500 | |
Terraform AP Acquisition Holdings LLC | | | | | | | | |
7.00% due 06/26/22 | | | 493,580 | | | | 488,644 | |
Total Utilities | | | | | | | 5,664,213 | |
| | | | | | | | | |
Financial - 2.0% | |
Americold Realty Operating Partnership, LP | | | | | | | | |
5.75% due 12/01/22 | | | 1,493,756 | | | | 1,505,901 | |
Acrisure LLC | | | | | | | | |
6.50% due 05/19/22 | | | 1,204,879 | | | | 1,207,144 | |
28 | THE GUGGENHEIM FUNDS ANNUAL REPORT | SEE NOTES TO FINANCIAL STATEMENTS. |
SCHEDULE OF INVESTMENTS (continued) | September 30, 2016 |
HIGH YIELD FUND | |
| | | Face
Amount11 | | | Value | |
| | | | | | | |
York Risk Services | | | | | | |
4.75% due 10/01/211 | | $ | 735,000 | | | $ | 671,606 | |
American Stock Transfer & Trust | | | | | | | | |
5.75% due 06/26/20 | | | 557,074 | | | | 544,077 | |
Integro Parent, Inc. | | | | | | | | |
6.75% due 10/31/22 | | | 446,753 | | | | 435,584 | |
Safe-Guard | | | | | | | | |
6.25% due 08/19/21 | | | 346,714 | | | | 332,846 | |
LPL Financial Holdings, Inc. | | | | | | | | |
4.75% due 11/21/22 | | | 297,750 | | | | 299,364 | |
Cunningham Lindsey U.S., Inc. | | | | | | | | |
9.25% due 06/10/20 | | | 623,636 | | | | 241,659 | |
Total Financial | | | | | | | 5,238,181 | |
| | | | | | | | | |
Communications - 1.4% | |
Cengage Learning Acquisitions, Inc. | | | | | | | | |
5.25% due 06/07/23 | | | 996,308 | | | | 995,062 | |
Mitel Networks Corp. | | | | | | | | |
5.50% due 04/29/22 | | | 966,015 | | | | 971,753 | |
Match Group, Inc. | | | | | | | | |
5.50% due 11/16/22 | | | 511,875 | | | | 514,434 | |
Neptune Finco Corp. | | | | | | | | |
5.00% due 10/09/22 | | | 498,750 | | | | 499,269 | |
Anaren, Inc. | | | | | | | | |
9.25% due 08/18/211 | | | 500,000 | | | | 445,000 | |
MergerMarket Ltd. | | | | | | | | |
4.50% due 02/04/21 | | | 292,500 | | | | 288,113 | |
Total Communications | | | | | | | 3,713,631 | |
| | | | | | | | | |
Energy - 1.1% | |
Callon Petroleum Co. | | | | | | | | |
8.50% due 10/08/21 | | | 1,350,000 | | | | 1,362,933 | |
Veresen Midstream LP | | | | | | | | |
5.25% due 03/31/22 | | | 738,750 | | | | 731,976 | |
PSS Companies | | | | | | | | |
5.50% due 01/28/201 | | | 534,151 | | | | 389,930 | |
Cactus Wellhead | | | | | | | | |
7.00% due 07/31/20 | | | 440,335 | | | | 337,957 | |
Total Energy | | | | | | | 2,822,796 | |
| | | | | | | | | |
Basic Materials - 0.7% | |
Zep, Inc. | | | | | | | | |
5.50% due 06/27/22 | | | 987,500 | | | | 988,735 | |
PQ Corp. | | | | | | | | |
5.75% due 11/04/22 | | | 349,125 | | | | 351,527 | |
Azelis Finance S.A. | | | | | | | | |
6.50% due 12/16/22 | | | 248,125 | | | | 250,916 | |
Arch Coal, Inc. | | | | | | | | |
7.50% due 05/16/18 | | | 198,461 | | | | 151,491 | |
Total Basic Materials | | | | | | | 1,742,669 | |
| | | | | | | | | |
Electric - 0.3% | |
Panda Temple II Power | | | | | | | | |
7.25% due 04/03/19 | | | 507,694 | | | | 463,270 | |
Stonewall (Green Energy) | | | | | | | | |
6.50% due 11/12/21 | | | 400,000 | | | | 388,000 | |
Total Electric | | | | | | | 851,270 | |
Total Senior Floating Rate Interests | | | | | | | | |
(Cost $69,022,742) | | | | | | | 67,785,421 | |
| | | | | | | | | |
ASSET-BACKED SECURITIES†† - 3.0% | |
Collateralized Loan Obligations - 2.9% | |
OCP CLO Ltd. | | | | | | | | |
2014-6A, 5.63% due 07/17/262,7 | | | 1,500,000 | | | | 1,295,170 | |
2014-6A, 4.33% due 07/17/262,7 | | | 1,000,000 | | | | 942,989 | |
2013-4A, 5.71% due 10/24/252,7 | | | 500,000 | | | | 415,149 | |
Brightwood Capital Fund | | | | | | | | |
6.68% due 04/29/23 | | | 750,000 | | | | 742,691 | |
WhiteHorse X Ltd. | | | | | | | | |
2015-10A, 5.98% due 04/17/272,7 | | | 750,000 | | | | 612,688 | |
Catamaran CLO 2014-1 Ltd. | | | | | | | | |
2014-1A, 5.20% due 04/20/262,7 | | | 750,000 | | | | 604,045 | |
Eaton Vance CLO Ltd. | | | | | | | | |
2014-1A, 5.71% due 07/15/262,7 | | | 600,000 | | | | 484,519 | |
Longfellow Place CLO Ltd. | | | | | | | | |
2013-1A, 6.43% due 01/15/242,7 | | | 500,000 | | | | 461,742 | |
THL Credit Wind River CLO Ltd. | | | | | | | | |
2014-2A, 5.93% due 07/15/262,7 | | | 500,000 | | | | 444,355 | |
Jamestown CLO III Ltd. | | | | | | | | |
2013-3A, 5.28% due 01/15/262,7 | | | 500,000 | | | | 420,123 | |
KVK CLO Ltd. | | | | | | | | |
2015-1A, 6.56% due 05/20/272,7 | | | 500,000 | | | | 414,370 | |
Regatta IV Funding Ltd. | | | | | | | | |
2014-1A, 5.66% due 07/25/262,7 | | | 500,000 | | | | 408,425 | |
NewMark Capital Funding CLO Ltd. | | | | | | | | |
2014-2A, 5.64% due 06/30/262,7 | | | 500,000 | | | | 404,811 | |
Total Collateralized Loan Obligations | | | | | | | 7,651,077 | |
| | | | | | | | | |
Collateralized Debt Obligations - 0.1% | |
SRERS Funding Ltd. | | | | | | | | |
2011-RS, 0.76% due 05/09/462,7 | | | 133,189 | | | | 129,855 | |
Total Asset-Backed Securities | | | | | | | | |
(Cost $7,222,443) | | | | | | | 7,780,932 | |
| | | | | | | | | |
SENIOR FIXED RATE INTERESTS†† - 0.7% | |
Consumer, Non-cyclical - 0.3% | |
Hanger, Inc. | | | | | | | | |
11.50% due 08/01/19 | | | 575,000 | | | | 573,562 | |
Targus Group International, Inc. | | | | | | | | |
7.50% due 12/31/19†††,1 | | | 57,499 | | | | 80,401 | |
Total Consumer, Non-cyclical | | | | | | | 653,963 | |
| | | | | | | | | |
Communications - 0.2% | |
Lions Gate Entertainment Corp. | | | | | | | | |
5.00% due 03/17/22 | | | 610,000 | | | | 620,675 | |
SEE NOTES TO FINANCIAL STATEMENTS. | THE GUGGENHEIM FUNDS ANNUAL REPORT | 29 |
SCHEDULE OF INVESTMENTS (continued) | September 30, 2016 |
HIGH YIELD FUND | |
| | | Face
Amount11 | | | Value | |
| | | | | | | |
Financial - 0.2% | |
Magic Newco, LLC | | | | | | |
12.00% due 06/12/19 | | $ | 500,000 | | | $ | 525,000 | |
Total Senior Fixed Rate Interests | | | | | | | | |
(Cost $1,771,838) | | | | | | | 1,799,638 | |
| | | | | | | | | |
Total Investments - 115.9% | | | | | | | | |
(Cost $298,836,809) | | | | | | $ | 300,043,571 | |
Other Assets & Liabilities, net - (15.9)% | | | | | | | (41,047,239 | ) |
Total Net Assets - 100.0% | | | | | | $ | 258,996,332 | |
FORWARD FOREIGN CURRENCY EXCHANGE CONTRACTS†† | |
Contracts to Sell | | Contracts to
Buy (Sell) | | Currency | Settlement
Date | | Settlement
Value | | | Value at
September 30,
2016 | | | Net Unrealized Appreciation/(Depreciation) | |
Morgan Stanley | | | (3,178,000 | ) | GBP | 10/13/16 | | $ | 4,216,182 | | | $ | 4,120,651 | | | $ | 95,531 | |
Morgan Stanley | | | (509,000 | ) | CAD | 10/13/16 | | | 391,058 | | | | 388,126 | | | | 2,932 | |
Morgan Stanley | | | (836,000 | ) | EUR | 10/13/16 | | | 940,947 | | | | 939,548 | | | | 1,399 | |
Deutsche Bank | | | (525,000 | ) | EUR | 10/13/16 | | | 590,829 | | | | 590,027 | | | | 802 | |
Goldman Sachs | | | 85,000 | | EUR | 10/13/16 | | | (95,622 | ) | | | (95,528 | ) | | | (94 | ) |
J.P. Morgan | | | (214,000 | ) | AUD | 10/13/16 | | | 161,592 | | | | 163,770 | | | | (2,178 | ) |
J.P. Morgan | | | (9,280,000 | ) | EUR | 10/13/16 | | | 10,414,677 | | | | 10,429,429 | | | | (14,752 | ) |
| | | | | | | | | | | | | | | | | $ | 83,640 | |
* | Non-income producing security. |
† | Value determined based on Level 1 inputs, unless otherwise noted — See Note 4. |
†† | Value determined based on Level 2 inputs, unless otherwise noted — See Note 4. |
††† | Value determined based on Level 3 inputs — See Note 4. |
1 | Illiquid security. |
2 | Variable rate security. Rate indicated is rate effective at September 30, 2016. |
3 | Perpetual maturity. |
4 | Rate indicated is the 7 day yield as of September 30, 2016. |
5 | Security is a 144A or Section 4(a)(2) security. These securities are considered illiquid and restricted under guidelines established by the Board of Trustees. The total market value of 144A or Section 4(a)(2) illiquid and restricted securities is $1,230,644 (cost $1,425,835), or 0.5% of total net assets — See Note 12. |
6 | All or a portion of this security is pledged as reverse repurchase agreement collateral at September 30, 2016 — See Note 5. |
7 | Security is a 144A or Section 4(a)(2) security. These securities have been determined to be liquid under guidelines established by the Board of Trustees. The total market value of 144A or Section 4(a)(2) liquid securities is $112,068,494 (cost $109,356,585), or 43.3% of total net assets. |
8 | Security is a step up/step down bond. The coupon increases or decreases at regular intervals until the bond reaches full maturity. |
9 | Security is in default of interest and/or principal obligations. |
10 | Security with no rate was unsettled at September 30, 2016. |
11 | The face amount is denominated in U.S. dollars unless otherwise noted. |
| | plc — Public Limited Company |
| | REIT — Real Estate Investment Trust |
| | |
| | See Sector Classification in Other Information section. |
30 | THE GUGGENHEIM FUNDS ANNUAL REPORT | SEE NOTES TO FINANCIAL STATEMENTS. |
SCHEDULE OF INVESTMENTS (continued) | September 30, 2016 |
HIGH YIELD FUND | |
The following table summarizes the inputs used to value the Fund’s investments at September 30, 2016 (See Note 4 in the Notes to Financial Statements):
Investments in Securities (Assets) | | Level 1 | | | Level 2 | | | Level 2 -
Other* | | | Level 3 | | | Total | |
Asset-Backed Securities | | $ | — | | | $ | 7,780,932 | | | $ | — | | | $ | — | | | $ | 7,780,932 | |
Common Stocks | | | 508,598 | | | | 616,359 | | | | — | | | | 1,029,981 | | | | 2,154,938 | |
Corporate Bonds | | | — | | | | 208,002,546 | | | | — | | | | 4,465,758 | | | | 212,468,304 | |
Forward Foreign Currency Exchange Contracts | | | — | | | | — | | | | 100,664 | | | | — | | | | 100,664 | |
Exchange-Traded Funds | | | 3,745,440 | | | | — | | | | — | | | | — | | | | 3,745,440 | |
Preferred Stocks | | | — | | | | 3,988,118 | | | | — | | | | 27,596 | | | | 4,015,714 | |
Senior Fixed Rate Interests | | | — | | | | 1,719,237 | | | | — | | | | 80,401 | | | | 1,799,638 | |
Senior Floating Rate Interests | | | — | | | | 61,844,786 | | | | — | | | | 5,940,635 | | | | 67,785,421 | |
Short-Term Investments | | | 223,941 | | | | — | | | | — | | | | — | | | | 223,941 | |
Warrants | | | — | | | | 69,243 | | | | — | | | | — | | | | 69,243 | |
Total | | $ | 4,477,980 | | | $ | 284,021,221 | | | $ | 100,664 | | | $ | 11,544,371 | | | $ | 300,144,235 | |
| | | | | | | | | | | | | | | | | | | | | |
Investments in Securities (Liabilities) | | Level 1 | | | Level 2 | | | Level 2 -
Other* | | | Level 3 | | | Total | |
Forward Foreign Currency Exchange Contracts | | $ | — | | | $ | — | | | $ | 17,024 | | | $ | — | | | $ | 17,024 | |
* | Other financial instruments include forward foreign currency exchange contracts, which are reported as unrealized gain/loss at period end. |
The following is a summary of significant unobservable inputs used in the fair valuation of assets and liabilities categorized within Level 3 of the fair value hierarchy:
Category | | Ending Balance at 09/30/16 | | Valuation Technique | Unobservable
Inputs | | Input
Range | |
Common Stocks | | $ | 1,029,901 | | Enterprise Value | Valuation Multiple | | | 5.5x - 8.0 | x |
Common Stocks | | | 80 | | Model Price | Liquidation value | | | — | |
Corporate Bonds | | | 2,831,360 | | Model Price | Market Comparable Yields | | | 9.0% - 17.3 | % |
Corporate Bonds | | | 1,204,584 | | Option Adjusted Spread off the prior month end broker mark over the 3 month LIBOR | Indicative Quote | | | — | |
Corporate Bonds | | | 351,942 | | Enterprise Value | Valuation Multiple | | | 8.0 | x |
Corporate Bonds | | | 77,872 | | Model Price | Liquidation value | | | — | |
Preferred Stocks | | | 27,596 | | Option Adjusted Spread off the prior month end broker mark over the 3 month LIBOR | Indicative Quote | | | — | |
Senior Fixed Rate Interests | | | 80,401 | | Enterprise Value | Valuation Multiple | | | 5.5 | x |
Senior Floating Rate Interests | | | 2,963,651 | | Model Price | Purchase Price | | | — | |
Senior Floating Rate Interests | | | 1,989,883 | | Option Adjusted Spread off the prior month end broker mark over the 3 month LIBOR | Indicative Quote | | | — | |
Senior Floating Rate Interests | | | 987,101 | | Model Price | Market Comparable Yields | | | 5.7 | % |
Total | | $ | 11,544,371 | | | | | | | |
Any remaining Level 3 securities held by the Fund and excluded from the tables above, were not considered material to the Fund.
Transfers between investment levels may occur as the markets fluctuate and/or the availability of data used in an investment’s valuation changes. The Fund recognized transfers between the levels as of the beginning of the period. As of September 30, 2016, High Yield Fund had securities with a total value of $579,150 transfer out of Level 3 into Level 2 and a total value of $435,144 transfer into Level 3 from Level 2 due to changes in the securities valuation method. There were no other securities that transferred between levels.
SEE NOTES TO FINANCIAL STATEMENTS. | THE GUGGENHEIM FUNDS ANNUAL REPORT | 31 |
SCHEDULE OF INVESTMENTS (concluded) | September 30, 2016 |
HIGH YIELD FUND | |
Summary of Fair Value Level 3 Activity
Following is a reconciliation of Level 3 assets and liabilities for which significant unobservable inputs were used to determine fair value for the year ended September 30, 2016:
LEVEL 3 - Fair value measurement using significant unobservable inputs
| | | Senior Floating
Rate Interests | | | Senior Fixed Rate Interests | | | Common
Stocks | | | Preferred
Stocks | | | Corporate
Bonds | | | Total | |
HIGH YIELD FUND | | | | | | | | | | | | | | | | | | |
Assets: | | | | | | | | | | | | | | | | | | |
Beginning Balance | | $ | 7,046,155 | | | $ | 156,826 | | | $ | 73 | | | $ | 11,038 | | | $ | 3,256,186 | | | $ | 10,470,278 | |
Purchases | | | 2,042,306 | | | | 18,802 | | | | 1,227,069 | | | | — | | | | 1,710,838 | | | | 4,999,015 | |
Sales, maturities and paydowns | | | (2,833,790 | ) | | | (153,426 | ) | | | — | | | | — | | | | (367,000 | ) | | | (3,354,216 | ) |
Corporate actions | | | (66,618 | ) | | | 49,437 | | | | 17,181 | | | | — | | | | — | | | | — | |
Total realized gains or losses included in earnings | | | (5,357 | ) | | | 3,732 | | | | — | | | | — | | | | (231,429 | ) | | | (233,054 | ) |
Total change in unrealized gains or losses included in earnings | | | (98,055 | ) | | | 5,030 | | | | (214,342 | ) | | | 16,558 | | | | 97,163 | | | | (193,646 | ) |
Transfers into Level 3 | | | 435,144 | | | | — | | | | — | | | | — | | | | — | | | | 435,144 | |
Transfers out of Level 3 | | | (579,150 | ) | | | — | | | | — | | | | — | | | | — | | | | (579,150 | ) |
Ending Balance | | $ | 5,940,635 | | | $ | 80,401 | | | $ | 1,029,981 | | | $ | 27,596 | | | $ | 4,465,758 | | | $ | 11,544,371 | |
Net Change in unrealized appreciation (depreciation) for investments in securities still held at September 30, 2016 | | $ | (68,204 | ) | | $ | 5,725 | | | $ | (216,491 | ) | | $ | 16,558 | | | $ | (70,970 | ) | | $ | (333,382 | ) |
32 | THE GUGGENHEIM FUNDS ANNUAL REPORT | SEE NOTES TO FINANCIAL STATEMENTS. |
STATEMENT OF ASSETS AND LIABILITIES |
September 30, 2016 |
Assets: | |
Investments, at value (cost $298,836,809) | | $ | 300,043,571 | |
Foreign currency, at value (cost $9,282) | | | 9,282 | |
Cash | | | 766,402 | |
Unrealized appreciation on forward foreign currency exchange contracts | | | 100,664 | |
Prepaid expenses | | | 20,311 | |
Receivables: | |
Securities sold | | | 5,149,261 | |
Fund shares sold | | | 897,536 | |
Dividends | | | 7,425 | |
Foreign taxes reclaim | | | 11,833 | |
Interest | | | 4,369,841 | |
Total assets | | | 311,376,126 | |
| | | | | |
Liabilities: | |
Reverse Repurchase Agreements | | | 34,559,482 | |
Unfunded loan commitments, at value (Note 9) (proceeds $1,726,825) | | | 1,141,424 | |
Unrealized depreciation on forward foreign currency exchange contracts | | | 17,024 | |
Segregated cash due to broker | | | 250,000 | |
Payable for: | |
Fund shares redeemed | | | 10,596,166 | |
Securities purchased | | | 5,367,422 | |
Dividends distributed | | | 118,584 | |
Management fees | | | 80,806 | |
Transfer agent/maintenance fees | | | 50,541 | |
Distribution and service fees | | | 40,168 | |
Interest from reverse repurchase agreements | | | 27,778 | |
Fund accounting/administration fees | | | 20,819 | |
Trustees’ fees* | | | 5,941 | |
Miscellaneous | | | 103,639 | |
Total liabilities | | | 52,379,794 | |
Commitments and contingent liabilities (Note 15) | | | — | |
Net assets | | $ | 258,996,332 | |
| | | | | |
Net assets consist of: | |
Paid in capital | | $ | 262,318,592 | |
Accumulated net investment loss | | | (37,049 | ) |
Accumulated net realized loss on investments | | | (5,156,833 | ) |
Net unrealized appreciation on investments | | | 1,871,622 | |
Net assets | | $ | 258,996,332 | |
| | | | | |
A-Class: | |
Net assets | | $ | 87,044,589 | |
Capital shares outstanding | | | 7,797,327 | |
Net asset value per share | | $ | 11.16 | |
Maximum offering price per share (Net asset value divided by 96.00%) | | $ | 11.63 | |
| | | | | |
C-Class: | |
Net assets | | $ | 26,941,260 | |
Capital shares outstanding | | | 2,393,462 | |
Net asset value per share | | $ | 11.26 | |
| | | | | |
P-Class: | |
Net assets | | $ | 3,177,821 | |
Capital shares outstanding | | | 284,537 | |
Net asset value per share | | $ | 11.17 | |
| | | | | |
Institutional Class: | |
Net assets | | $ | 141,832,662 | |
Capital shares outstanding | | | 15,577,269 | |
Net asset value per share | | $ | 9.11 | |
* | Relates to Trustees not deemed “interested persons” within the meaning of Section 2(a)(19) of the 1940 Act. |
SEE NOTES TO FINANCIAL STATEMENTS. | THE GUGGENHEIM FUNDS ANNUAL REPORT | 33 |
STATEMENT OF OPERATIONS |
Year Ended September 30, 2016 |
Investment Income: | |
Interest | | $ | 15,785,630 | |
Dividends | | | 268,012 | |
Total investment income | | | 16,053,642 | |
| | | | | |
Expenses: | |
Management fees | | | 1,280,154 | |
Transfer agent/maintenance fees: | |
A-Class | | | 79,194 | |
C-Class | | | 20,536 | |
P-Class | | | 202 | |
Institutional Class | | | 81,905 | |
Distribution and service fees: | |
A-Class | | | 186,043 | |
C-Class | | | 180,955 | |
P-Class | | | 3,540 | |
Fund accounting/administration fees | | | 202,675 | |
Interest expense | | | 133,355 | |
Line of credit fees | | | 24,708 | |
Custodian fees | | | 20,499 | |
Trustees’ fees* | | | 13,833 | |
Prime broker interest expense | | | 256 | |
Miscellaneous | | | 219,272 | |
Total expenses | | | 2,447,127 | |
Less: | |
Expenses waived by Adviser | | | (28,515 | ) |
Net expenses | | | 2,418,612 | |
Net investment income | | | 13,635,030 | |
| | | | | |
Net Realized and Unrealized Gain (Loss): | |
Net realized gain (loss) on: | |
Investments | | $ | (4,559,789 | ) |
Foreign currency | | | 1,484 | |
Forward foreign currency exchange contracts | | | 659,439 | |
Net realized loss | | | (3,898,866 | ) |
Net change in unrealized appreciation (depreciation) on: | |
Investments | | | 16,092,231 | |
Foreign currency | | | (5,946 | ) |
Forward foreign currency exchange contracts | | | 104,576 | |
Net change in unrealized appreciation (depreciation) | | | 16,190,861 | |
Net realized and unrealized gain | | | 12,291,995 | |
Net increase in net assets resulting from operations | | $ | 25,927,025 | |
* | Relates to Trustees not deemed “interested persons” within the meaning of Section 2(a)(19) of the 1940 Act. |
34 | THE GUGGENHEIM FUNDS ANNUAL REPORT | SEE NOTES TO FINANCIAL STATEMENTS. |
STATEMENTS OF CHANGES IN NET ASSETS |
| | | Year Ended
September 30,
2016 | | | Year Ended
September 30,
2015 | |
Increase (Decrease) in Net Assets from Operations: | | | | | | |
Net investment income | | $ | 13,635,030 | | | $ | 8,972,189 | |
Net realized gain (loss) on investments | | | (3,898,866 | ) | | | 405,135 | |
Net change in unrealized appreciation (depreciation) on investments | | | 16,190,861 | | | | (13,898,198 | ) |
Net increase (decrease) in net assets resulting from operations | | | 25,927,025 | | | | (4,520,874 | ) |
| | | | | | | | | |
Distributions to shareholders from: | | | | | | | | |
Net investment income | | | | | | | | |
A-Class | | | (5,021,892 | ) | | | (4,807,748 | ) |
B-Class** | | | — | | | | (52,842 | ) |
C-Class | | | (1,046,425 | ) | | | (802,666 | ) |
P-Class | | | (86,534 | ) | | | (235 | )* |
Institutional Class | | | (8,343,089 | ) | | | (3,966,454 | ) |
Net realized gains | | | | | | | | |
A-Class | | | — | | | | (1,532,517 | ) |
B-Class** | | | — | | | | (20,686 | ) |
C-Class | | | — | | | | (263,521 | ) |
P-Class | | | — | | | | — | * |
Institutional Class | | | — | | | | (944,650 | ) |
Total distributions to shareholders | | | (14,497,940 | ) | | | (12,391,319 | ) |
| | | | | | | | | |
Capital share transactions: | | | | | | | | |
Proceeds from sale of shares | | | | | | | | |
A-Class | | | 38,862,308 | | | | 33,036,938 | |
B-Class** | | | — | | | | 7,076 | |
C-Class | | | 15,767,122 | | | | 5,046,504 | |
P-Class | | | 3,039,848 | | | | 10,001 | * |
Institutional Class | | | 132,721,401 | | | | 74,875,388 | |
Redemption fees collected | | | | | | | | |
A-Class | | | 58,517 | | | | 41,648 | |
B-Class** | | | — | | | | 490 | |
C-Class | | | 11,173 | | | | 8,074 | |
P-Class | | | 214 | | | | 1 | * |
Institutional Class | | | 67,613 | | | | 33,446 | |
Distributions reinvested | | | | | | | | |
A-Class | | | 4,590,806 | | | | 5,856,839 | |
B-Class** | | | — | | | | 66,438 | |
C-Class | | | 831,218 | | | | 824,962 | |
P-Class | | | 86,534 | | | | 235 | * |
Institutional Class | | | 7,079,015 | | | | 3,711,027 | |
Cost of shares redeemed | | | | | | | | |
A-Class | | | (32,283,621 | ) | | | (40,000,821 | ) |
B-Class** | | | — | | | | (1,185,413 | ) |
C-Class | | | (4,511,046 | ) | | | (5,333,911 | ) |
P-Class | | | (161,209 | ) | | | — | * |
Institutional Class | | | (80,676,896 | ) | | | (33,586,946 | ) |
Net increase from capital share transactions | | | 85,482,997 | | | | 43,411,976 | |
Net increase in net assets | | | 96,912,082 | | | | 26,499,783 | |
| | | | | | | | | |
Net assets: | | | | | | | | |
Beginning of year | | | 162,084,250 | | | | 135,584,467 | |
End of year | | $ | 258,996,332 | | | $ | 162,084,250 | |
Accumulated net investment loss/Undistributed net investment income at end of year | | $ | (37,049 | ) | | $ | 482,009 | |
SEE NOTES TO FINANCIAL STATEMENTS. | THE GUGGENHEIM FUNDS ANNUAL REPORT | 35 |
STATEMENTS OF CHANGES IN NET ASSETS (concluded) |
| | | Year Ended
September 30,
2016 | | | Year Ended
September 30,
2015 | |
Capital share activity: | | | | | | |
Shares sold | | | | | | |
A-Class | | | 3,698,743 | | | | 2,907,297 | |
B-Class** | | | — | | | | 574 | |
C-Class | | | 1,482,332 | | | | 437,537 | |
P-Class | | | 290,517 | | | | 867 | * |
Institutional Class | | | 15,474,086 | | | | 8,020,780 | |
Shares issued from reinvestment of distributions | | | | | | | | |
A-Class | | | 431,226 | | | | 512,078 | |
B-Class** | | | — | | | | 5,810 | |
C-Class | | | 77,164 | | | | 71,624 | |
P-Class | | | 8,117 | | | | 21 | * |
Institutional Class | | | 813,446 | | | | 399,647 | |
Shares redeemed | | | | | | | | |
A-Class | | | (3,117,471 | ) | | | (3,526,055 | ) |
B-Class** | | | — | | | | (104,833 | ) |
C-Class | | | (422,663 | ) | | | (463,316 | ) |
P-Class | | | (14,985 | ) | | | — | * |
Institutional Class | | | (9,241,452 | ) | | | (3,627,052 | ) |
Net increase in shares | | | 9,479,060 | | | | 4,634,979 | |
* | Since commencement of operations: May 1, 2015. |
** | B-Class shares previously offered have been converted to A-Class shares effective August 8, 2015. |
36 | THE GUGGENHEIM FUNDS ANNUAL REPORT | SEE NOTES TO FINANCIAL STATEMENTS. |
This table is presented to show selected data for a share outstanding throughout each period and to assist shareholders in evaluating a Fund’s performance for the periods presented.
A-Class | Year Ended
September 30,
2016 | | Year Ended
September 30,
2015 | | Year Ended
September 30,
2014 | | Year Ended
September 30,
2013 | | Period Ended
September 30,
2012a | | Year Ended
December 31,
2011 | |
Per Share Data | | | | | | | | | | | | | | | | | | |
Net asset value, beginning of period | | $ | 10.79 | | | $ | 12.02 | | | $ | 11.85 | | | $ | 11.95 | | | $ | 11.12 | | | $ | 12.89 | |
Income (loss) from investment operations: | |
Net investment income (loss)b | | | .67 | | | | .69 | | | | .72 | | | | .81 | | | | .58 | | | | .87 | |
Net gain (loss) on investments (realized and unrealized) | | | .41 | | | | (.97 | ) | | | .27 | | | | .27 | | | | .84 | | | | (1.30 | ) |
Total from investment operations | | | 1.08 | | | | (.28 | ) | | | .99 | | | | 1.08 | | | | 1.42 | | | | (.43 | ) |
Less distributions from: | |
Net investment income | | | (.72 | ) | | | (.74 | ) | | | (.83 | ) | | | (.90 | ) | | | (.59 | ) | | | (1.07 | ) |
Net realized gains | | | — | | | | (.22 | ) | | | — | | | | (.29 | ) | | | — | | | | (.27 | ) |
Total distributions | | | (.72 | ) | | | (.96 | ) | | | (.83 | ) | | | (1.19 | ) | | | (.59 | ) | | | (1.34 | ) |
Redemption fees collected | | | .01 | | | | .01 | | | | .01 | | | | .01 | | | | — | c | | | — | |
Net asset value, end of period | | $ | 11.16 | | | $ | 10.79 | | | $ | 12.02 | | | $ | 11.85 | | | $ | 11.95 | | | $ | 11.12 | |
| | |
Total Returng | | | 10.71 | % | | | (2.40 | %) | | | 9.18 | % | | | 9.54 | % | | | 12.93 | % | | | (3.50 | %) |
Ratios/Supplemental Data | |
Net assets, end of period (in thousands) | | $ | 87,045 | | | $ | 73,236 | | | $ | 82,854 | | | $ | 70,451 | | | $ | 64,174 | | | $ | 86,041 | |
Ratios to average net assets: | |
Net investment income (loss) | | | 6.32 | % | | | 6.01 | % | | | 5.91 | % | | | 6.84 | % | | | 7.19 | % | | | 6.92 | % |
Total expensesd | | | 1.25 | % | | | 1.27 | % | | | 1.32 | % | | | 1.41 | % | | | 1.44 | % | | | 1.34 | % |
Net expensese,h | | | 1.23 | % | | | 1.20 | % | | | 1.26 | % | | | 1.18 | % | | | 1.17 | % | | | 1.18 | % |
Portfolio turnover rate | | | 55 | % | | | 72 | % | | | 97 | % | | | 101 | % | | | 55 | % | | | 102 | % |
C-Class | Year Ended
September 30,
2016 | | Year Ended
September 30,
2015 | | Year Ended
September 30,
2014 | | Year Ended
September 30,
2013 | | Period Ended
September 30,
2012a | | Year Ended
December 31,
2011 | |
Per Share Data | | | | | | | | | | | | | | | | | | |
Net asset value, beginning of period | | $ | 10.88 | | | $ | 12.12 | | | $ | 11.95 | | | $ | 12.03 | | | $ | 11.20 | | | $ | 12.97 | |
Income (loss) from investment operations: | |
Net investment income (loss)b | | | .60 | | | | .61 | | | | .63 | | | | .73 | | | | .56 | | | | .79 | |
Net gain (loss) on investments (realized and unrealized) | | | .41 | | | | (.98 | ) | | | .27 | | | | .27 | | | | .80 | | | | (1.32 | ) |
Total from investment operations | | | 1.01 | | | | (.37 | ) | | | .90 | | | | 1.00 | | | | 1.36 | | | | (.53 | ) |
Less distributions from: | |
Net investment income | | | (.64 | ) | | | (.66 | ) | | | (.74 | ) | | | (.80 | ) | | | (.53 | ) | | | (.97 | ) |
Net realized gains | | | — | | | | (.22 | ) | | | — | | | | (.29 | ) | | | — | | | | (.27 | ) |
Total distributions | | | (.64 | ) | | | (.88 | ) | | | (.74 | ) | | | (1.09 | ) | | | (.53 | ) | | | (1.24 | ) |
Redemption fees collected | | | .01 | | | | .01 | | | | .01 | | | | .01 | | | | — | c | | | — | |
Net asset value, end of period | | $ | 11.26 | | | $ | 10.88 | | | $ | 12.12 | | | $ | 11.95 | | | $ | 12.03 | | | $ | 11.20 | |
| | |
Total Returng | | | 9.81 | % | | | (3.14 | %) | | | 8.46 | % | | | 8.69 | % | | | 12.33 | % | | | (4.30 | %) |
Ratios/Supplemental Data | |
Net assets, end of period (in thousands) | | $ | 26,941 | | | $ | 13,671 | | | $ | 14,674 | | | $ | 9,463 | | | $ | 9,054 | | | $ | 7,991 | |
Ratios to average net assets: | |
Net investment income (loss) | | | 5.52 | % | | | 5.25 | % | | | 5.14 | % | | | 6.10 | % | | | 6.37 | % | | | 6.32 | % |
Total expensesd | | | 2.01 | % | | | 2.01 | % | | | 2.09 | % | | | 2.17 | % | | | 2.19 | % | | | 2.08 | % |
Net expensese,h | | | 1.98 | % | | | 1.95 | % | | | 2.01 | % | | | 1.93 | % | | | 1.92 | % | | | 1.94 | % |
Portfolio turnover rate | | | 55 | % | | | 72 | % | | | 97 | % | | | 101 | % | | | 55 | % | | | 102 | % |
SEE NOTES TO FINANCIAL STATEMENTS. | THE GUGGENHEIM FUNDS ANNUAL REPORT | 37 |
FINANCIAL HIGHLIGHTS (continued) |
This table is presented to show selected data for a share outstanding throughout each period and to assist shareholders in evaluating a Fund’s performance for the periods presented.
P-Class | | Year Ended
September 30,
2016 | | | Period Ended
September 30,
2015f | |
Per Share Data | | | | | | |
Net asset value, beginning of period | | $ | 10.80 | | | $ | 11.53 | |
Income (loss) from investment operations: | |
Net investment income (loss)b | | | .67 | | | | .27 | |
Net gain (loss) on investments (realized and unrealized) | | | .42 | | | | (.73 | ) |
Total from investment operations | | | 1.09 | | | | (.46 | ) |
Less distributions from: | |
Net investment income | | | (.72 | ) | | | (.27 | ) |
Total distributions | | | (.72 | ) | | | (.27 | ) |
Redemption fees collected | | | — | c | | | — | c |
Net asset value, end of period | | $ | 11.17 | | | $ | 10.80 | |
| | |
Total Returng | | | 10.74 | % | | | (4.06 | %) |
Ratios/Supplemental Data | |
Net assets, end of period (in thousands) | | $ | 3,178 | | | $ | 10 | |
Ratios to average net assets: | |
Net investment income (loss) | | | 6.20 | % | | | 5.76 | % |
Total expensesd | | | 1.17 | % | | | 3.36 | % |
Net expensese,h | | | 1.17 | % | | | 1.19 | % |
Portfolio turnover rate | | | 55 | % | | | 72 | % |
38 | THE GUGGENHEIM FUNDS ANNUAL REPORT | SEE NOTES TO FINANCIAL STATEMENTS. |
FINANCIAL HIGHLIGHTS (concluded) |
This table is presented to show selected data for a share outstanding throughout each period and to assist shareholders in evaluating a Fund’s performance for the periods presented.
Institutional Class | Year Ended
September 30,
2016 | | Year Ended
September 30,
2015 | | | Year Ended
September 30,
2014 | Year Ended
September 30,
2013 | | Period Ended
September 30,
2012a | | Year Ended
December 31,
2011 | |
Per Share Data | | | | | | | | | | | | | | | | | | |
Net asset value, beginning of period | | $ | 8.81 | | | $ | 9.87 | | | $ | 9.74 | | | $ | 9.90 | | | $ | 9.26 | | | $ | 10.96 | |
Income (loss) from investment operations: | |
Net investment income (loss)b | | | .58 | | | | .58 | | | | .61 | | | | .70 | | | | .55 | | | | .79 | |
Net gain (loss) on investments (realized and unrealized) | | | .34 | | | | (.79 | ) | | | .23 | | | | .22 | | | | .64 | | | | (1.12 | ) |
Total from investment operations | | | .92 | | | | (.21 | ) | | | .84 | | | | .92 | | | | 1.19 | | | | (.33 | ) |
Less distributions from: | |
Net investment income | | | (.62 | ) | | | (.64 | ) | | | (.72 | ) | | | (.80 | ) | | | (.55 | ) | | | (1.10 | ) |
Net realized gains | | | — | | | | (.22 | ) | | | — | | | | (.29 | ) | | | — | | | | (.27 | ) |
Total distributions | | | (.62 | ) | | | (.86 | ) | | | (.72 | ) | | | (1.09 | ) | | | (.55 | ) | | | (1.37 | ) |
Redemption fees collected | | | — | c | | | .01 | | | | .01 | | | | .01 | | | | — | c | | | — | |
Net asset value, end of period | | $ | 9.11 | | | $ | 8.81 | | | $ | 9.87 | | | $ | 9.74 | | | $ | 9.90 | | | $ | 9.26 | |
| | |
Total Returng | | | 10.95 | % | | | (2.21 | %) | | | 9.50 | % | | | 9.97 | % | | | 13.17 | % | | | (3.30 | %) |
Ratios/Supplemental Data | |
Net assets, end of period (in thousands) | | $ | 141,833 | | | $ | 75,167 | | | $ | 36,880 | | | $ | 18,755 | | | $ | 9,974 | | | $ | 7,900 | |
Ratios to average net assets: | |
Net investment income (loss) | | | 6.58 | % | | | 6.21 | % | | | 6.12 | % | | | 7.12 | % | | | 7.42 | % | | | 7.61 | % |
Total expensesd | | | 0.95 | % | | | 0.94 | % | | | 1.01 | % | | | 1.01 | % | | | 1.11 | % | | | 1.08 | % |
Net expensese,h | | | 0.94 | % | | | 0.94 | % | | | 1.01 | % | | | 0.93 | % | | | 0.92 | % | | | 0.95 | % |
Portfolio turnover rate | | | 55 | % | | | 72 | % | | | 97 | % | | | 101 | % | | | 55 | % | | | 102 | % |
a | The Fund changed its fiscal year end from December 31 to September 30 in 2012. |
b | Net investment income (loss) per share was computed using average shares outstanding throughout the period. |
c | Redemption fees collected are less than $0.01 per share. |
d | Does not include expenses of the underlying funds in which the Fund invests. |
e | Net expense information reflects the expense ratios after expense waivers. |
f | Since commencement of operations: May 1, 2015. Percentage amounts for the period, except total return and portfolio turnover rate, have been annualized. |
g | Total return does not reflect the impact of any applicable sales charges and has not been annualized. |
h | Net expenses may include expenses that are excluded from the expense limitation agreement. Excluding these expenses, the operating expense ratios for the years would be: |
| | | 09/30/16 | 09/30/15 | 09/30/14 |
| | A-Class | 1.16% | 1.16% | 1.16% |
| | C-Class | 1.91% | 1.91% | 1.91% |
| | P-Class | 1.09% | 1.16% | — |
| | Institutional Class | 0.87% | 0.91% | 0.91% |
SEE NOTES TO FINANCIAL STATEMENTS. | THE GUGGENHEIM FUNDS ANNUAL REPORT | 39 |
MANAGERS’ COMMENTARY(Unaudited) | September 30, 2016 |
To Our Shareholders
Guggenheim Investment Grade Bond Fund (the “Fund”) is managed by a team of seasoned professionals, including B. Scott Minerd, Chairman of Investments and Global Chief Investment Officer; Anne B. Walsh, Senior Managing Director and Assistant Chief Investment Officer; Jeffrey B. Abrams, Senior Managing Director and Portfolio Manager; and James W. Michal, Senior Managing Director and Portfolio Manager. In the following paragraphs, the investment team discusses the market environment and the Fund’s performance for the fiscal year ended September 30, 2016.
For the one-year period ended September 30, 2016, Guggenheim Investment Grade Bond Fund returned 6.50%1, compared with the 5.19% return of its benchmark, the Bloomberg Barclays U.S. Aggregate Bond Index.
The Fund seeks to provide current income. In pursuit of its objective, the Fund will invest, under normal market conditions, at least 80% of its net assets in investment grade U.S. fixed-income securities. The Fund has the ability to adjust portfolio duration synthetically using interest rate hedges.
At the start of the period, the U.S. Federal Reserve (the Fed) announced a 25-basis-point increase in the federal funds target rate from 0–25 basis points to a range of 25–50 basis points on December 16, 2015. A number of other key events fueled the risk-off sentiment in the fourth quarter of 2015 that continued into 2016, but three were particularly damaging to risk assets. The first was the release of the much stronger-than-expected U.S. employment report in early November 2015, which boosted the odds that the Fed would begin raising interest rates. The second event was the European Central Bank’s (ECB) announcement of new stimulus measures at its December 2015 meeting, which disappointed market expectations. The third event was the December 2015 announcement by the Organization of Petroleum Exporting Countries (OPEC) that its members would continue to pump approximately 31.5 million barrels of crude oil per day. Risk assets rallied, however, in the latter half of the first quarter of 2016, led by a dovish pivot in Fed communication and positive economic data which helped to combat recession fears. By conveying a more cautious policy outlook, the Fed helped spur a reversal of dollar strength, a rally in crude oil, and spread tightening across risk assets.
The rally in risk assets that began in February 2016 was briefly interrupted in June by the UK’s vote to leave the European Union. Despite the two-day selloff following the UK vote, high-yield bonds and bank loans held up. Current valuations in energy bonds indicate that leveraged credit has further room to rally as we pass the worst of the commodity related distress, but volatility is expected to remain elevated. A positive outlook for the U.S. economy, a cautious Fed, and stabilizing oil prices support our constructive view on corporate credit assets.
The Fund’s positive returns were attributable to duration, the Fund’s carry, and the tightening of credit spreads. Positive returns were driven by good credit selection in ABS (asset-backed securities, including collateralized loan obligations, or CLOs), mortgage-backed securities (including commercial mortgage-backed securities and non-Agency residential mortgage-backed securities, or non-Agency RMBS), investment-grade bonds, high yield bonds, municipal bonds, and preferred securities.
Derivatives were used to manage duration and hedge currency risk.
The Fund held a majority of the portfolio in structured credit, including ABS and CLOs. Most of the Fund’s structured credit holdings feature floating rate coupons, yields higher than traditional securitized assets like auto or credit-card receivables, and, often, investment-grade ratings. The Fund believes that ABS and CLOs offer some downside protection, and amortizing structures to keep credit exposure lower over time. Floating rate instruments accounted for about half the Fund’s holdings at the end of the period.
Over the period, the Fund increased its exposure to bank loans and high yield corporate bonds, while exposure to municipal bonds, preferred securities, and non-Agency RMBS declined. The increase in below-investment-grade assets sought to take advantage of dislocations in the credit markets during the period.
The Fund maintains higher duration than the benchmark at the long end of the curve, mainly through long-maturity zero-coupon Treasury bonds. On the other end of the curve, short-term and floating rate assets are held, enabling the Fund to keep its effective duration at around 4.5 years for most of the period, compared with an average of 5.5 years for the Bloomberg Barclays U.S. Aggregate Bond Index. The Fund will continue to focus on allocating to structured credit that should shield investors from rate volatility without having to sacrifice yield.
40 | THE GUGGENHEIM FUNDS ANNUAL REPORT | |
MANAGERS’ COMMENTARY(Unaudited)(concluded) | September 30, 2016 |
The Fund invests excess cash into the Guggenheim Strategy Funds which, in turn, invest in a diversified portfolio of debt securities and financial instruments providing exposure to fixed income markets. The investment objective of the Guggenheim Strategy Funds is to seek a high level of income consistent with the preservation of capital. For the one -year period ended September 30, 2016, investment in the Guggenheim Strategy Funds has benefited Fund performance relative to investing in other short-term investments.
| | THE GUGGENHEIM FUNDS ANNUAL REPORT | 41 |
PERFORMANCE REPORT AND FUND PROFILE (Unaudited) | September 30, 2016 |
INVESTMENT GRADE BOND FUND
OBJECTIVE: Seeks to provide current income.
Holdings Diversification (Market Exposure as % of Net Assets)

“Holdings Diversification (Market Exposure as % of Net Assets)” excludes any temporary cash investments.
Portfolio Composition by Quality Rating1 |
Rating | |
Fixed Income Instruments | |
AAA | 24.8% |
AA | 14.6% |
A | 18.7% |
BBB | 18.3% |
BB | 5.0% |
B | 7.2% |
CCC | 2.4% |
CC | 0.2% |
NR2 | 7.6% |
Other Instruments | 1.2% |
Total Investments | 100.0% |
The chart above reflects percentages of the value of total investments. |
Inception Dates: |
A-Class | August 15, 1985 |
C-Class | May 1, 2000 |
P-Class | May 1, 2015 |
Institutional Class | January 29, 2013 |
Ten Largest Holdings (% of Total Net Assets) |
U.S. Treasury Notes | 4.9% |
U.S. Treasury Bonds | 4.2% |
Fannie Mae 1.88% due 09/24/26 | 1.4% |
GSAA Trust | 1.0% |
LSTAR Securities Investment Trust 2015-4 | 0.9% |
LSTAR Securities Investment Trust 2015-1 | 0.9% |
Countrywide Asset-Backed Certificates | 0.9% |
State of California General Obligation Unlimited | 0.8% |
Dryden XXVI Senior Loan Fund | 0.8% |
Fannie Mae Principal 0.00% due 05/15/30 | 0.8% |
Top Ten Total | 16.6% |
“Ten Largest Holdings” excludes any temporary cash investments. |
1 | Source: BlackRock Solutions. Credit quality ratings are measured on a scale that generally ranges from AAA (highest) to D (lowest). All securities except for those labeled “NR” have been rated by a Nationally Recognized Statistical Rating Organization (“NRSRO”). For purposes of this presentation, when ratings are available from more than one agency, the highest rating is used. Guggenheim Investments converts ratings to the equivalent S&P rating. |
2 | NR securities do not necessarily indicate low credit quality. |
42 | THE GUGGENHEIM FUNDS ANNUAL REPORT | |
PERFORMANCE REPORT AND FUND PROFILE (Unaudited)(concluded) | September 30, 2016 |
Cumulative Fund Performance*
Average Annual Returns*
Periods Ended September 30, 2016
| | 1 Year | 5 Year | 10 Year |
| A-Class Shares | 6.50% | 5.07% | 3.93% |
A-Class Shares with sales charge† | 1.45% | 4.05% | 3.42% |
| C-Class Shares | 5.78% | 4.31% | 3.18% |
C-Class Shares with CDSC‡ | 4.78% | 4.31% | 3.18% |
| Bloomberg Barclays U.S. Aggregate Bond Index | 5.19% | 3.08% | 4.79% |
| | | 1 Year | Since Inception (05/01/15) |
| P-Class Shares | | 6.51% | 4.48% |
| Bloomberg Barclays U.S. Aggregate Bond Index | | 5.19% | 3.79% |
| | | 1 Year | Since Inception (01/29/13) |
| Institutional Class Shares | | 6.83% | 5.19% |
| Bloomberg Barclays U.S. Aggregate Bond Index | | 5.19% | 2.95% |
* | The performance data above represents past performance that is not predictive of future results. The investment return and principal value of an investment in the Fund will fluctuate so that an investor’s shares, when redeemed, may be worth more or less than their original cost. Returns are historical and include changes in principal and reinvested dividends and capital gains and do not reflect the effect of taxes. The Bloomberg Barclays U.S. Aggregate Bond Index is an unmanaged index and, unlike the Fund, has no management fees or operating expenses to reduce its reported return. The graph is based on A-Class shares only; performance for C-Class shares, P-Class shares and Institutional Class shares will vary due to differences in fee structures. |
† | Effective October 1, 2015, the maximum sales charge decreased from 4.75% to 4.00%. A 4.75% maximum sales charge is used in the calculation of the Average Annual Returns (based on subscriptions made prior to October 1, 2015), and a 4.00% maximum sales charge will be used to calculate performance for periods based on subscriptions made on or after October 1, 2015. |
‡ | Fund returns include a CDSC of 1% if redeemed within 12 months of purchase. |
| | THE GUGGENHEIM FUNDS ANNUAL REPORT | 43 |
SCHEDULE OF INVESTMENTS | September 30, 2016 |
INVESTMENT GRADE BOND FUND | |
| | | Shares | | | Value | |
| | | | | | | |
COMMON STOCKS† - 0.0% | |
| | | | | | | |
Financial - 0.0% | |
Rescap Liquidating Trust* | | | 5,199 | | | $ | 50,950 | |
| | | | | | | | | |
Industrial - 0.0% | |
Constar International Holdings LLC*,†††,1 | | | 68 | | | | — | |
| | | | | | | | | |
Total Common Stocks | | | | | | | | |
(Cost $262,501) | | | | | | | 50,950 | |
| | | | | | | | | |
PREFERRED STOCKS†† - 1.0% | |
Financial - 0.8% | |
Woodbourne Capital Trust III 0.03%†††,2,3,6 | | | 950,000 | | | | 570,532 | |
Woodbourne Capital Trust IV 0.02%†††,2,3,6 | | | 950,000 | | | | 570,532 | |
Woodbourne Capital Trust I 0.02%†††,2,3,6 | | | 950,000 | | | | 570,531 | |
Woodbourne Capital Trust II 0.03%†††,2,3,6 | | | 950,000 | | | | 570,532 | |
Total Financial | | | | | | | 2,282,127 | |
| | | | | | | | | |
Industrial - 0.2% | |
Seaspan Corp. 6.38% due 04/30/191 | | | 22,000 | | | | 558,800 | |
Constar International Holdings LLC *,†††,1 | | | 7 | | | | — | |
Total Industrial | | | | | | | 558,800 | |
Total Preferred Stocks | | | | | | | | |
(Cost $4,368,354) | | | | | | | 2,840,927 | |
| | | | | | | | | |
SHORT-TERM INVESTMENTS† - 0.3% | |
Dreyfus Treasury Securities Cash Management Fund - Institutional Class 0.16%5 | | | 818,424 | | | | 818,424 | |
Total Short-Term Investments | | | | | | | | |
(Cost $818,424) | | | | | | | 818,424 | |
| | | Face
Amount | | | | |
| | | | | | | |
ASSET-BACKED SECURITIES†† - 33.2% | |
Collateralized Loan Obligations - 23.8% | |
CIFC Funding Ltd. | | | | | | |
2015-2A, 2.74% due 12/05/242,4 | | $ | 1,500,000 | | | | 1,497,232 | |
2013-4A, 4.08% due 11/27/242,4 | | | 1,000,000 | | | | 1,000,219 | |
2015-3A, 2.79% due 10/19/272,4 | | | 1,000,000 | | | | 998,911 | |
2014-3X INC, % due 07/22/267 | | | 500,000 | | | | 313,323 | |
Great Lakes CLO Ltd. | | | | | | | | |
2012-1A, 3.43% due 01/15/232,4 | | | 1,000,000 | | | | 997,174 | |
2015-1A, 2.63% due 07/15/262,4 | | | 1,000,000 | | | | 992,458 | |
2012-1A, 4.78% due 01/15/232,4 | | | 1,000,000 | | | | 984,882 | |
2014-1A, 4.38% due 04/15/252,4 | | | 250,000 | | | | 242,783 | |
Telos CLO Ltd. | | | | | | | | |
2013-3A, 3.68% due 01/17/242,4 | | | 1,250,000 | | | | 1,249,921 | |
2007-2A, 2.88% due 04/15/222,4 | | | 1,100,000 | | | | 1,061,644 | |
Golub Capital Partners CLO Ltd. | | | | | | | | |
2015-25A, 2.58% due 08/05/272,4 | | | 1,500,000 | | | | 1,460,622 | |
2014-21A, 3.16% due 10/25/262,4 | | | 600,000 | | | | 589,173 | |
2013-17A, 4.54% due 10/25/252,4 | | | 250,000 | | | | 248,552 | |
Dryden XXVI Senior Loan Fund | | | | | | |
2013-26A, 3.18% due 07/15/252,4 | | | 2,250,000 | | | | 2,236,275 | |
OCP CLO Ltd. | | | | | | | | |
2014-6A, 5.63% due 07/17/262,4 | | | 1,400,000 | | | | 1,208,825 | |
2016-11A, 3.03% due 04/26/282,4 | | | 1,000,000 | | | | 996,809 | |
Ivy Hill Middle Market Credit Fund VII Ltd. | | | | | | | | |
2013-7A, 3.00% due 10/20/252,4 | | | 1,000,000 | | | | 973,022 | |
2013-7A, 4.15% due 10/20/252,4 | | | 600,000 | | | | 570,850 | |
Venture CLO Ltd. | | | | | | | | |
2013-14A, 3.58% due 08/28/252,4 | | | 1,550,000 | | | | 1,532,199 | |
Oaktree EIF I Series A1 Ltd. | | | | | | | | |
2016-A1, 3.28% due 10/18/272,4 | | | 1,500,000 | | | | 1,518,140 | |
Cent CLO 20 Ltd. | | | | | | | | |
2014-20A, 2.71% due 01/25/262,4 | | | 1,500,000 | | | | 1,496,487 | |
Catamaran CLO 2014-2 Ltd. | | | | | | | | |
2014-2A, 3.68% due 10/18/262,4 | | | 1,500,000 | | | | 1,493,309 | |
Grayson CLO Ltd. | | | | | | | | |
2006-1A, 1.17% due 11/01/212,4 | | | 1,400,000 | | | | 1,344,629 | |
OZLM Funding Ltd. | | | | | | | | |
2012-2A, 4.01% due 10/30/232,4 | | | 1,250,000 | | | | 1,250,000 | |
Flagship CLO VI | | | | | | | | |
2007-1A, 3.25% due 06/10/212,4 | | | 1,250,000 | | | | 1,214,255 | |
WhiteHorse VIII Ltd. | | | | | | | | |
2014-1A, 2.81% due 05/01/262,4 | | | 1,100,000 | | | | 1,079,548 | |
Rockwall CDO Ltd. | | | | | | | | |
2007-1A, 1.31% due 08/01/242,4 | | | 1,100,000 | | | | 1,073,310 | |
Flagship CLO VIII Ltd. | | | | | | | | |
2014-8A, 3.81% due 01/16/262,4 | | | 1,050,000 | | | | 1,048,726 | |
Northwoods Capital XIV Ltd. | | | | | | | | |
2014-14A, 3.28% due 11/12/252,4 | | | 1,000,000 | | | | 1,009,433 | |
AIMCO CLO Series | | | | | | | | |
2015-AA, 2.98% due 01/15/282,4 | | | 1,000,000 | | | | 1,005,959 | |
Fortress Credit BSL II Ltd. | | | | | | | | |
2013-2A, 2.94% due 10/19/252,4 | | | 1,000,000 | | | | 1,005,928 | |
Vibrant CLO Limited | | | | | | | | |
2015-1A, 2.78% due 07/17/242,4 | | | 1,000,000 | | | | 1,003,306 | |
KKR CLO Ltd. | | | | | | | | |
2015-12, 2.98% due 07/15/272,4 | | | 1,000,000 | | | | 1,000,330 | |
Marathon CLO IV Ltd. | | | | | | | | |
2012-4A, 3.81% due 05/20/232,4 | | | 1,000,000 | | | | 1,000,138 | |
TICP CLO III Ltd. | | | | | | | | |
2014-3A, 3.05% due 01/20/272,4 | | | 1,000,000 | | | | 1,000,080 | |
Atrium XI | | | | | | | | |
2014-11A, 3.91% due 10/23/252,4 | | | 1,000,000 | | | | 1,000,078 | |
Mountain Hawk I CLO Ltd. | | | | | | | | |
2013-1A, 2.88% due 01/20/242,4 | | | 1,000,000 | | | | 1,000,022 | |
Figueroa CLO Ltd. | | | | | | | | |
2013-1A, 3.56% due 03/21/242,4 | | | 1,000,000 | | | | 1,000,010 | |
LCM XI, LP | | | | | | | | |
2012-11A, 3.64% due 04/19/222,4 | | | 1,000,000 | | | | 999,957 | |
TICP CLO I Ltd. | | | | | | | | |
2014-1A, 3.72% due 04/26/262,4 | | | 1,000,000 | | | | 999,916 | |
Garrison Funding Ltd. | | | | | | | | |
2016-2A, 4.01% due 09/29/272,4 | | | 1,000,000 | | | | 997,300 | |
PFP Ltd. | | | | | | | | |
2015-2, 2.53% due 07/14/342,4 | | | 1,000,000 | | | | 996,851 | |
44 | THE GUGGENHEIM FUNDS ANNUAL REPORT | SEE NOTES TO FINANCIAL STATEMENTS. |
SCHEDULE OF INVESTMENTS (continued) | September 30, 2016 |
INVESTMENT GRADE BOND FUND | |
| | | Face
Amount | | | Value | |
| | | | | | | |
Shackleton CLO Ltd. | | | | | | |
2015-8A, 3.65% due 10/20/272,4 | | $ | 1,000,000 | | | $ | 995,692 | |
Marea CLO Ltd. | | | | | | | | |
2015-1A, 2.48% due 10/15/232,4 | | | 1,000,000 | | | | 995,536 | |
Fortress Credit Investments IV Ltd. | | | | | | | | |
2015-4A, 2.58% due 07/17/232,4 | | | 1,000,000 | | | | 994,227 | |
ALM VII R Ltd. | | | | | | | | |
2013-7RA, 3.31% due 04/24/242,4 | | | 1,000,000 | | | | 993,067 | |
Fortress Credit Opportunities V CLO Ltd. | | | | | | | | |
2014-5A, 3.31% due 10/15/262,4 | | | 1,000,000 | | | | 992,558 | |
Recette CLO LLC | | | | | | | | |
2015-1A, 3.50% due 10/20/272,4 | | | 1,000,000 | | | | 991,781 | |
Avery Point II CLO Ltd. | | | | | | | | |
2013-2A, 3.43% due 07/17/252,4 | | | 1,000,000 | | | | 985,000 | |
MT Wilson CLO II Ltd. | | | | | | | | |
2007-2A, 3.41% due 07/11/202,4 | | | 1,000,000 | | | | 972,751 | |
Black Diamond CLO Ltd. | | | | | | | | |
2013-1A, 4.01% due 02/01/232,4 | | | 950,000 | | | | 956,012 | |
Dryden 37 Senior Loan Fund | | | | | | | | |
2015-37A, due 04/15/274,7 | | | 1,000,000 | | | | 892,326 | |
MCF CLO I LLC | | | | | | | | |
2013-1A, 4.25% due 04/20/232,4 | | | 900,000 | | | | 865,621 | |
Babson CLO Ltd. | | | | | | | | |
2012-2A, 0.00% due 05/15/234,7 | | | 1,000,000 | | | | 469,282 | |
2014-IA, 0.00% due 07/20/254,7 | | | 650,000 | | | | 395,343 | |
COA Summit CLO Limited | | | | | | | | |
2014-1A, 3.50% due 04/20/232,4 | | | 800,000 | | | | 799,716 | |
Saranac CLO II Ltd. | | | | | | | | |
2014-2A, 5.96% due 02/20/252,4 | | | 1,000,000 | | | | 791,798 | |
Cerberus Onshore II CLO LLC | | | | | | | | |
2014-1A, 2.98% due 10/15/232,4 | | | 500,000 | | | | 500,256 | |
2014-1A, 3.38% due 10/15/232,4 | | | 250,000 | | | | 249,708 | |
Newstar Trust | | | | | | | | |
2012-2A, 3.95% due 01/20/232,4 | | | 750,000 | | | | 749,418 | |
ACIS CLO Ltd. | | | | | | | | |
2013-1A, 3.63% due 04/18/242,4 | | | 500,000 | | | | 487,687 | |
2013-2A, 3.88% due 10/14/222,4 | | | 250,000 | | | | 249,528 | |
Fortress Credit Opportunities III CLO, LP | | | | | | | | |
2014-3A, 3.16% due 04/28/262,4 | | | 300,000 | | | | 297,735 | |
2014-3A, 3.91% due 04/28/262,4 | | | 300,000 | | | | 282,328 | |
KKR Financial CLO Ltd. | | | | | | | | |
2012-1A, 4.15% due 12/15/242,4 | | | 500,000 | | | | 500,297 | |
Cent CLO | | | | | | | | |
2014-16A, 3.01% due 08/01/242,4 | | | 500,000 | | | | 500,057 | |
MCF CLO III LLC | | | | | | | | |
2014-3A, 3.17% due 01/20/242,4 | | | 500,000 | | | | 479,645 | |
Treman Park CLO Ltd. | | | | | | | | |
2015-1A, due 04/20/274,7 | | | 500,000 | | | | 447,527 | |
Eastland CLO Ltd. | | | | | | | | |
2007-1A, 1.16% due 05/01/222,4 | | | 450,000 | | | | 425,111 | |
Westwood CDO I Ltd. | | | | | | | | |
2007-1A, 1.53% due 03/25/212,4 | | | 400,000 | | | | 378,526 | |
KVK CLO Ltd. | | | | | | | | |
2013-1A, due 04/14/254,7 | | | 1,000,000 | | | | 364,286 | |
Halcyon Loan Advisors Funding Ltd. | | | | | | | | |
2012-2A, 5.36% due 12/20/242,4 | | | 350,000 | | | | 329,962 | |
Newstar Commercial Loan Funding LLC | | | | | | | | |
2013-1A, 5.41% due 09/20/232,4 | | | 350,000 | | | | 326,008 | |
DIVCORE CLO Ltd. | | | | | | | | |
2013-1A, 4.42% due 11/15/322,4 | | | 300,000 | | | | 297,199 | |
ALM XIV Ltd. | | | | | | | | |
2014-14A, 3.69% due 07/28/262,4 | | | 250,000 | | | | 250,990 | |
TICC CLO LLC | | | | | | | | |
2012-1A, 5.58% due 08/25/232,4 | | | 250,000 | | | | 250,144 | |
Gallatin CLO VII Ltd. | | | | | | | | |
2014-1A, 3.58% due 07/15/232,4 | | | 250,000 | | | | 250,019 | |
Dryden XXIII Senior Loan Fund | | | | | | | | |
2014-23A, 3.63% due 07/17/232,4 | | | 250,000 | | | | 247,624 | |
NewStar Arlington Senior Loan Program LLC | | | | | | | | |
2014-1A, 4.01% due 07/25/252,4 | | | 250,000 | | | | 242,331 | |
Neuberger Berman CLO Ltd. | | | | | | | | |
2012-12A, due 07/25/234,7 | | | 450,000 | | | | 217,183 | |
Carlyle Global Market Strategies CLO Ltd. | | | | | | | | |
2012-3A, due 10/04/244,7 | | | 250,000 | | | | 197,608 | |
Copper River CLO Ltd. | | | | | | | | |
2007-1A, due 01/20/212,6,7 | | | 700,000 | | | | 155,601 | |
Keuka Park CLO Ltd. | | | | | | | | |
2013-1A, due 10/21/244,7 | | | 250,000 | | | | 119,609 | |
ICE EM CLO | | | | | | | | |
2007-1A, 1.80% due 08/15/222,4 | | | 59,908 | | | | 59,540 | |
Total Collateralized Loan Obligations | | | | | | | 66,639,223 | |
| | | | | | | | | |
Transport-Aircraft - 4.8% | |
Apollo Aviation Securitization Equity Trust | | | | | | | | |
2016-1A, 4.88% due 03/17/364 | | | 1,425,000 | | | | 1,407,188 | |
2014-1, 5.13% due 12/15/29 | | | 1,298,077 | | | | 1,263,678 | |
2014-1, 7.50% due 12/15/292 | | | 649,038 | | | | 644,171 | |
Castlelake Aircraft Securitization Trust | | | | | | | | |
2015-1A, 4.70% due 12/15/404 | | | 1,372,014 | | | | 1,358,294 | |
2014-1, 5.25% due 02/15/294 | | | 574,059 | | | | 568,318 | |
2014-1, 7.50% due 02/15/294 | | | 228,050 | | | | 226,339 | |
Willis Engine Securitization Trust II | | | | | | | | |
2012-A, 5.50% due 09/15/374 | | | 2,006,436 | | | | 1,986,370 | |
Emerald Aviation Finance Ltd. | | | | | | | | |
2013-1, 4.65% due 10/15/384 | | | 958,612 | | | | 986,809 | |
2013-1, 6.35% due 10/15/384 | | | 191,722 | | | | 192,010 | |
Rise Ltd. | | | | | | | | |
2014-1, 4.75% due 02/12/39 | | | 1,048,177 | | | | 1,035,599 | |
ECAF I Ltd. | | | | | | | | |
2015-1A, 4.95% due 06/15/404 | | | 991,172 | | | | 983,065 | |
AIM Aviation Finance Ltd. | | | | | | | | |
2015-1A, 4.21% due 02/15/404 | | | 886,905 | | | | 892,275 | |
Diamond Head Aviation Ltd. | | | | | | | | |
2015-1, 3.81% due 07/14/284 | | | 785,933 | | | | 786,935 | |
Turbine Engines Securitization Ltd. | | | | | | | | |
2013-1A, 5.13% due 12/13/486 | | | 762,568 | | | | 755,322 | |
AABS Ltd. | | | | | | | | |
2013-1, 4.88% due 01/15/38 | | | 281,017 | | | | 279,331 | |
Total Transport-Aircraft | | | | | | | 13,365,704 | |
| | | | | | | | | |
Collateralized Debt Obligations - 2.7% | |
Gramercy Real Estate CDO Ltd. | | | | | | | | |
2007-1A, 1.10% due 08/15/562,4 | | | 1,141,558 | | | | 1,077,809 | |
SEE NOTES TO FINANCIAL STATEMENTS. | THE GUGGENHEIM FUNDS ANNUAL REPORT | 45 |
SCHEDULE OF INVESTMENTS (continued) | September 30, 2016 |
INVESTMENT GRADE BOND FUND | |
| | | Face
Amount | | | Value | |
| | | | | | | |
2006-1A, 1.08% due 07/25/412,4 | | $ | 492,611 | | | $ | 486,520 | |
FDF II Ltd. | | | | | | | | |
2016-2A, 4.29% due 05/12/314 | | | 1,000,000 | | | | 1,018,462 | |
Anchorage Credit Funding 3 Ltd. | | | | | | | | |
2016-3A, 3.85% due 10/28/33†††,4 | | | 1,000,000 | | | | 1,014,089 | |
Triaxx Prime CDO Ltd. | | | | | | | | |
2006-2A, 0.79% due 10/02/392,4 | | | 913,771 | | | | 870,272 | |
Putnam Structured Product Funding Ltd. | | | | | | | | |
2003-1A, 1.52% due 10/15/382,4 | | | 1,000,000 | | | | 861,681 | |
Highland Park CDO I Ltd. | | | | | | | | |
2006-1A, 1.23% due 11/25/512,4 | | | 773,282 | | | | 710,194 | |
SRERS Funding Ltd. | | | | | | | | |
2011-RS, 0.76% due 05/09/462,4 | | | 846,292 | | | | 636,852 | |
N-Star REL CDO VIII Ltd. | | | | | | | | |
2006-8A, 0.89% due 02/01/412,4 | | | 500,000 | | | | 485,345 | |
RAIT CRE CDO I Ltd. | | | | | | | | |
2006-1X A1B, 0.86% due 11/20/46 | | | 478,562 | | | | 462,621 | |
N-Star Real Estate CDO IX Ltd. | | | | | | | | |
0.84% due 02/01/411 | | | 35,052 | | | | 34,989 | |
Total Collateralized Debt Obligations | | | | | | | 7,658,834 | |
| | | | | | | | | |
Whole Business - 1.6% | |
Taco Bell Funding LLC | | | | | | | | |
2016-1A, 4.97% due 05/25/464 | | | 1,950,000 | | | | 2,019,487 | |
Wendys Funding LLC | | | | | | | | |
2015-1A, 4.50% due 06/15/454 | | | 1,485,000 | | | | 1,482,796 | |
Drug Royalty III Limited Partnership 1 | | | | | | | | |
2016-1A, 3.98% due 04/15/274 | | | 972,530 | | | | 968,477 | |
Total Whole Business | | | | | | | 4,470,760 | |
| | | | | | | | | |
Insurance - 0.2% | |
Chesterfield Financial Holdings LLC | | | | | | | | |
2014-1A, 4.50% due 12/15/344 | | | 624,750 | | | | 624,966 | |
| | | | | | | | | |
Financial - 0.1% | |
Garanti Diversified Payment Rights Finance Co. | | | | | | | | |
2007-A, 0.85% due 07/09/172 | | | 416,000 | | | | 413,083 | |
Total Asset-Backed Securities | | | | | | | | |
(Cost $93,034,005) | | | | | | | 93,172,570 | |
| | | | | | | | | |
COLLATERALIZED MORTGAGE OBLIGATIONS†† - 19.9% | |
Residential Mortgage Backed Securities - 12.8% | |
LSTAR Securities Investment Trust | | | | | | | | |
2015-4, 2.52% due 04/01/202,4 | | | 2,635,882 | | | | 2,602,933 | |
2015-1, 2.53% due 01/01/202,4 | | | 2,507,177 | | | | 2,503,416 | |
2015-2, 2.52% due 01/01/202,4 | | | 1,762,821 | | | | 1,738,382 | |
2016-2, 2.53% due 03/01/212,4 | | | 1,716,235 | | | | 1,676,761 | |
2015-6, 2.53% due 05/01/202,4 | | | 1,590,760 | | | | 1,560,933 | |
2015-3, 2.53% due 03/01/202,4 | | | 1,238,140 | | | | 1,221,870 | |
2015-5, 2.53% due 04/01/202,4 | | | 906,012 | | | | 892,422 | |
2015-10, 2.52% due 11/01/202,4 | | | 868,950 | | | | 853,743 | |
GSAA Trust | | | | | | | | |
2005-6, 0.96% due 06/25/352 | | | 3,150,000 | | | | 2,834,499 | |
Countrywide Asset-Backed Certificates | | | | | | | | |
2006-6, 0.70% due 09/25/362 | | | 2,661,022 | | | | 2,471,800 | |
Banc of America Funding Trust | | | | | | | | |
2015-R4, 0.70% due 01/27/352,4 | | | 1,003,244 | | | | 935,423 | |
2014-R7, 0.66% due 09/26/362,4 | | | 839,787 | | | | 797,714 | |
LSTAR Securities Investment Ltd. | | | | | | | | |
2016-3, 2.53% due 09/01/212,4 | | | 1,700,000 | | | | 1,678,193 | |
Structured Asset Investment Loan Trust | | | | | | | | |
2005-11, 0.89% due 01/25/362 | | | 1,772,768 | | | | 1,596,102 | |
NRPL Trust | | | | | | | | |
2014-2A, 3.75% due 10/25/572,4 | | | 877,217 | | | | 873,707 | |
2015-1A, 3.88% due 11/01/544 | | | 572,314 | | | | 568,408 | |
CSMC Series | | | | | | | | |
2015-12R, 1.02% due 11/30/372,4 | | | 1,300,000 | | | | 1,221,668 | |
CIT Mortgage Loan Trust | | | | | | | | |
2007-1, 1.98% due 10/25/372,4 | | | 1,079,219 | | | | 1,057,257 | |
Banc of America Funding Ltd. | | | | | | | | |
2013-R1, 0.71% due 11/03/412,4 | | | 1,124,969 | | | | 1,024,908 | |
American Home Mortgage Investment Trust | | | | | | | | |
2006-1, 0.92% due 03/25/462 | | | 1,216,406 | | | | 1,007,672 | |
RALI Series Trust | | | | | | | | |
2006-QO2, 0.75% due 02/25/462 | | | 2,243,488 | | | | 987,314 | |
Luminent Mortgage Trust | | | | | | | | |
2006-2, 0.73% due 02/25/462 | | | 1,346,305 | | | | 922,384 | |
VOLT XLII LLC | | | | | | | | |
2016-NPL2, 4.25% due 03/26/464 | | | 852,942 | | | | 863,481 | |
VOLT XLI LLC | | | | | | | | |
2016-NPL1, 4.25% due 02/26/464,8 | | | 837,537 | | | | 845,131 | |
Deutsche Alt-A Securities Mortgage Loan Trust Series | | | | | | | | |
2007-OA2, 1.28% due 04/25/472 | | | 913,022 | | | | 775,914 | |
MASTR Adjustable Rate Mortgages Trust | | | | | | | | |
2003-5, 2.53% due 11/25/332 | | | 742,407 | | | | 664,917 | |
Nationstar HECM Loan Trust | | | | | | | | |
2016-1A, 2.98% due 02/25/264 | | | 664,441 | | | | 663,956 | |
American Home Mortgage Assets Trust | | | | | | | | |
2007-1, 1.21% due 02/25/472 | | | 1,054,247 | | | | 624,910 | |
Washington Mutual Mortgage Pass-Through Certificates WMALT Series Trust | | | | | | | | |
2006-AR9, 1.35% due 11/25/462 | | | 619,198 | | | | 444,233 | |
UCFC Manufactured Housing Contract | | | | | | | | |
1997-2, 7.38% due 10/15/28 | | | 223,597 | | | | 230,135 | |
Nomura Resecuritization Trust | | | | | | | | |
2012-1R, 0.96% due 08/27/472,4 | | | 131,293 | | | | 129,494 | |
GreenPoint Mortgage Funding Trust | | | | | | | | |
2007-AR1, 0.61% due 02/25/472 | | | 9,426 | | | | 9,346 | |
Total Residential Mortgage Backed Securities | | | | | | | 36,279,026 | |
| | | | | | | | | |
Commercial Mortgage Backed Securities - 5.5% | |
Citigroup Commercial Mortgage Trust | | | | | | | | |
2016-GC36, 4.92% due 02/10/492 | | | 1,400,000 | | | | 1,498,412 | |
2016-P5, 4.47% due 10/10/492 | | | 1,000,000 | | | | 1,001,930 | |
2016-GC37, 1.97% due 04/10/492 | | | 3,841,117 | | | | 495,901 | |
2016-C2, 1.95% due 08/10/492 | | | 2,498,863 | | | | 333,113 | |
JPMDB Commercial Mortgage Securities Trust | | | | | | | | |
2016-C2, 3.56% due 06/15/492 | | | 1,700,000 | | | | 1,628,239 | |
2016-C2, 1.87% due 06/15/492 | | | 8,935,988 | | | | 967,698 | |
46 | THE GUGGENHEIM FUNDS ANNUAL REPORT | SEE NOTES TO FINANCIAL STATEMENTS. |
SCHEDULE OF INVESTMENTS (continued) | September 30, 2016 |
INVESTMENT GRADE BOND FUND | |
| | | Face
Amount | | | Value | |
| | | | | | | |
Hilton USA Trust | | | | | | |
2013-HLF, 4.27% due 11/05/302,4 | | $ | 997,386 | | | $ | 997,871 | |
2013-HLT, 4.41% due 11/05/304 | | | 700,000 | | | | 700,154 | |
JP Morgan Chase Commercial Mortgage Securities Trust | | | | | | | | |
2016-JP2, 3.95% due 08/15/492 | | | 1,500,000 | | | | 1,489,865 | |
GS Mortgage Securities Corporation Trust | | | | | | | | |
2016-ICE2, 4.77% due 02/15/332,4 | | | 1,200,000 | | | | 1,208,403 | |
Motel 6 Trust | | | | | | | | |
2015-MTL6, 4.53% due 02/05/304 | | | 1,150,000 | | | | 1,153,824 | |
Wells Fargo Commercial Mortgage Trust | | | | | | | | |
2016-C32, 1.52% due 01/15/592 | | | 6,421,539 | | | | 585,850 | |
2016-NXS5, 1.74% due 01/15/592 | | | 4,976,057 | | | | 489,769 | |
Morgan Stanley Capital I Trust | | | | | | | | |
2016-UB11, 1.83% due 08/15/492 | | | 7,790,460 | | | | 869,850 | |
COMM Mortgage Trust | | | | | | | | |
2015-CR26, 1.21% due 10/10/482 | | | 10,142,040 | | | | 689,589 | |
LSTAR Commercial Mortgage Trust | | | | | | | | |
2014-2, 5.00% due 01/20/412,4 | | | 500,000 | | | | 511,014 | |
CFCRE Commercial Mortgage Trust | | | | | | | | |
2016-C3, 1.25% due 01/10/482 | | | 5,969,896 | | | | 465,610 | |
CD Mortgage Trust | | | | | | | | |
2016-CD1, 1.58% due 08/10/492 | | | 2,598,624 | | | | 273,705 | |
Total Commercial Mortgage Backed Securities | | | | | | | 15,360,797 | |
| | | | | | | | | |
Government Agency - 0.6% | |
Federal Home Loan Banks | | | | | | | | |
5.50% due 07/15/36 | | | 500,000 | | | | 724,741 | |
Freddie Mac. | | | | | | | | |
0.00% due 01/02/349 | | | 850,000 | | | | 512,505 | |
Freddie Mac | | | | | | | | |
6.75% due 03/15/31 | | | 287,000 | | | | 443,491 | |
Total Government Agency | | | | | | | 1,680,737 | |
| | | | | | | | | |
Military Housing - 0.5% | |
Capmark Military Housing Trust | | | | | | | | |
2007-ROBS, 6.06% due 10/10/526 | | | 482,404 | | | | 477,262 | |
2007-AETC, 5.75% due 02/10/526 | | | 336,629 | | | | 349,675 | |
GMAC Commercial Mortgage Asset Corp. | | | | | | | | |
2003-PRES, 6.24% due 10/10/416 | | | 469,927 | | | | 537,698 | |
Total Military Housing | | | | | | | 1,364,635 | |
| | | | | | | | | |
Mortgage Securities - 0.5% | |
SG Commercial Mortgage Securities Trust | | | | | | | | |
2016-C5, 2.20% due 10/10/482 | | | 9,986,413 | | | | 1,332,548 | |
Total Collateralized Mortgage Obligations | | | | | | | | |
(Cost $55,516,472) | | | | | | | 56,017,743 | |
| | | | | | | | | |
CORPORATE BONDS†† - 14.1% | |
Financial - 5.2% | |
Citigroup, Inc. | | | | | | | | |
5.88%2,3 | | | 2,000,000 | | | | 2,020,200 | |
5.90%2,3 | | | 500,000 | | | | 517,500 | |
6.25%2,3 | | | 100,000 | | | | 107,625 | |
Teachers Insurance & Annuity Association of America | | | | | | | | |
4.90% due 09/15/444 | | | 1,000,000 | | | | 1,124,713 | |
4.38% due 09/15/542,4 | | | 500,000 | | | | 506,250 | |
WP Carey, Inc. | | | | | | | | |
4.25% due 10/01/26 | | | 1,600,000 | | | | 1,622,214 | |
American Equity Investment Life Holding Co. | | | | | | | | |
6.63% due 07/15/21 | | | 1,458,000 | | | | 1,519,782 | |
Hospitality Properties Trust | | | | | | | | |
5.25% due 02/15/26 | | | 1,050,000 | | | | 1,110,314 | |
Aurora Military Housing LLC | | | | | | | | |
6.89% due 01/15/47†††,6 | | | 750,000 | | | | 936,111 | |
AmTrust Financial Services, Inc. | | | | | | | | |
6.13% due 08/15/231 | | | 840,000 | | | | 884,467 | |
Kennedy-Wilson, Inc. | | | | | | | | |
5.88% due 04/01/24 | | | 800,000 | | | | 806,000 | |
GEO Group, Inc. | | | | | | | | |
5.88% due 10/15/24 | | | 650,000 | | | | 559,000 | |
Wilton Re Finance LLC | | | | | | | | |
5.88% due 03/30/332,4 | | | 475,000 | | | | 488,063 | |
Pacific Northwest Communities LLC | | | | | | | | |
5.91% due 06/15/506 | | | 400,000 | | | | 468,652 | |
GMH Military Housing-Navy Northeast LLC | | | | | | | | |
6.30% due 10/15/49†††,1 | | | 415,000 | | | | 448,480 | |
Atlantic Marine Corporations Communities LLC | | | | | | | | |
5.43% due 12/01/506 | | | 382,483 | | | | 403,883 | |
Bank of America Corp. | | | | | | | | |
6.30% due 12/31/492,3 | | | 350,000 | | | | 380,188 | |
ACC Group Housing LLC | | | | | | | | |
6.35% due 07/15/546 | | | 300,000 | | | | 364,328 | |
CIC Receivables Master Trust | | | | | | | | |
4.89% due 10/07/21††† | | | 288,033 | | | | 290,613 | |
Cadence Bank North America | | | | | | | | |
6.25% due 06/28/292,6 | | | 200,000 | | | | 170,000 | |
TIG Holdings, Inc. | | | | | | | | |
8.60% due 01/15/276 | | | 34,000 | | | | 27,625 | |
Total Financial | | | | | | | 14,756,008 | |
| | | | | | | | | |
Energy - 2.7% | |
Sunoco Logistics Partners Operations, LP | | | | | | | | |
5.95% due 12/01/25 | | | 1,050,000 | | | | 1,216,884 | |
3.90% due 07/15/26 | | | 1,000,000 | | | | 1,019,713 | |
4.25% due 04/01/24 | | | 200,000 | | | | 207,749 | |
ConocoPhillips | | | | | | | | |
6.50% due 02/01/39 | | | 1,455,000 | | | | 1,878,153 | |
Halliburton Co. | | | | | | | | |
4.85% due 11/15/35 | | | 1,200,000 | | | | 1,286,207 | |
Gulfstream Natural Gas System LLC | | | | | | | | |
4.60% due 09/15/254 | | | 560,000 | | | | 587,168 | |
Husky Energy, Inc. | | | | | | | | |
4.00% due 04/15/24 | | | 500,000 | | | | 521,850 | |
Equities Corp. | | | | | | | | |
4.88% due 11/15/21 | | | 425,000 | | | | 465,358 | |
SEE NOTES TO FINANCIAL STATEMENTS. | THE GUGGENHEIM FUNDS ANNUAL REPORT | 47 |
SCHEDULE OF INVESTMENTS (continued) | September 30, 2016 |
INVESTMENT GRADE BOND FUND | |
| | | Face
Amount | | | Value | |
| | | | | | | |
Hess Corp. | | | | | | |
4.30% due 04/01/27 | | $ | 350,000 | | | $ | 352,725 | |
Total Energy | | | | | | | 7,535,807 | |
| | | | | | | | | |
Basic Materials - 1.6% | |
Newcrest Finance Pty Ltd. | | | | | | | | |
4.45% due 11/15/214 | | | 1,350,000 | | | | 1,427,715 | |
4.20% due 10/01/224 | | | 740,000 | | | | 770,942 | |
Yamana Gold, Inc. | | | | | | | | |
4.95% due 07/15/24 | | | 1,385,000 | | | | 1,430,677 | |
BHP Billiton Finance USA Ltd. | | | | | | | | |
6.75% due 10/19/752,4 | | | 750,000 | | | | 849,375 | |
Total Basic Materials | | | | | | | 4,478,709 | |
| | | | | | | | | |
Communications - 1.4% | |
CSC Holdings LLC | | | | | | | | |
6.75% due 11/15/21 | | | 800,000 | | | | 846,000 | |
6.63% due 10/15/254 | | | 470,000 | | | | 509,950 | |
Sprint Communications, Inc. | | | | | | | | |
7.00% due 03/01/204 | | | 975,000 | | | | 1,045,688 | |
DISH DBS Corp. | | | | | | | | |
5.88% due 07/15/22 | | | 600,000 | | | | 616,638 | |
5.88% due 11/15/24 | | | 200,000 | | | | 197,500 | |
Avaya, Inc. | | | | | | | | |
7.00% due 04/01/194 | | | 650,000 | | | | 479,375 | |
Inmarsat Finance plc | | | | | | | | |
4.88% due 05/15/224 | | | 200,000 | | | | 190,000 | |
Total Communications | | | | | | | 3,885,151 | |
| | | | | | | | | |
Consumer, Non-cyclical - 0.9% | |
Bumble Bee Holdings, Inc. | | | | | | | | |
9.00% due 12/15/174 | | | 1,100,000 | | | | 1,105,500 | |
Vector Group Ltd. | | | | | | | | |
7.75% due 02/15/21 | | | 850,000 | | | | 896,495 | |
Central Garden & Pet Co. | | | | | | | | |
6.13% due 11/15/23 | | | 305,000 | | | | 326,350 | |
Tenet Healthcare Corp. | | | | | | | | |
4.35% due 06/15/202 | | | 300,000 | | | | 301,530 | |
Total Consumer, Non-cyclical | | | | | | | 2,629,875 | |
| | | | | | | | | |
Government - 0.7% | |
Freddie Mac Strips | | | | | | | | |
0.00% due 09/15/299 | | | 2,600,000 | | | | 1,859,676 | |
| | | | | | | | | |
Consumer, Cyclical - 0.6% | |
Northern Group Housing LLC | | | | | | | | |
6.80% due 08/15/536 | | | 600,000 | | | | 790,146 | |
HP Communities LLC | | | | | | | | |
5.78% due 03/15/464 | | | 500,000 | | | | 579,885 | |
Wynn Las Vegas LLC / Wynn Las Vegas Capital Corp. | | | | | | | | |
5.50% due 03/01/254 | | | 400,000 | | | | 405,000 | |
Total Consumer, Cyclical | | | | | | | 1,775,031 | |
| | | | | | | | | |
Industrial - 0.4% | |
Molex Electronic Technologies LLC | | | | | | | | |
3.90% due 04/15/254 | | | 1,200,000 | | | | 1,225,003 | |
Constar International, Inc | | | | | | | | |
11.00% due 12/31/17†††,1 | | | 4,091 | | | | — | |
Total Industrial | | | | | | | 1,225,003 | |
| | | | | | | | | |
Utilities - 0.2% | |
AES Corp. | | | | | | | | |
6.00% due 05/15/26 | | | 600,000 | | | | 634,500 | |
| | | | | | | | | |
Diversified - 0.2% | |
HRG Group, Inc. | | | | | | | | |
7.88% due 07/15/19 | | | 435,000 | | | | 458,381 | |
| | | | | | | | | |
Technology - 0.2% | |
Micron Technology, Inc. | | | | | | | | |
7.50% due 09/15/234 | | | 400,000 | | | | 444,296 | |
Total Corporate Bonds | | | | | | | | |
(Cost $38,052,708) | | | | | | | 39,682,437 | |
| | | | | | | | | |
U.S. GOVERNMENT SECURITIES†† - 9.1% | |
U.S. Treasury Notes | | | | | | | | |
1.50% due 08/15/26 | | | 13,979,000 | | | | 13,843,026 | |
U.S. Treasury Bonds | | | | | | | | |
due 11/15/449 | | | 23,315,000 | | | | 11,808,838 | |
Total U.S. Government Securities | | | | | | | | |
(Cost $25,316,517) | | | | | | | 25,651,864 | |
| | | | | | | | | |
FEDERAL AGENCY SECURITIES†† - 5.7% | |
Fannie Mae10 | | | | | | | | |
1.88% due 09/24/26 | | | 4,000,000 | | | | 3,979,939 | |
2.13% due 04/24/26 | | | 500,000 | | | | 508,825 | |
Total Fannie Mae | | | | | | | 4,488,764 | |
Fannie Mae Principal | | | | | | | | |
0.00% due 05/15/309 | | | 3,150,000 | | | | 2,222,176 | |
0.00% due 05/15/299 | | | 1,750,000 | | | | 1,256,245 | |
0.00% due 01/15/309 | | | 600,000 | | | | 427,157 | |
Total Fannie Mae Principal | | | | | | | 3,905,578 | |
Freddie Mac Strips | | | | | | | | |
due 03/15/319 | | | 2,950,000 | | | | 2,020,072 | |
due 07/15/329 | | | 2,700,000 | | | | 1,750,405 | |
Total Freddie Mac Strips | | | | | | | 3,770,477 | |
Freddie Mac10 | | | | | | | | |
0.00% due 12/14/299 | | | 2,900,000 | | | | 2,077,713 | |
Tennessee Valley Authority | | | | | | | | |
5.38% due 04/01/56 | | | 600,000 | | | | 848,983 | |
4.25% due 09/15/65 | | | 700,000 | | | | 832,766 | |
Total Tennessee Valley Authority | | | | | | | 1,681,749 | |
Total Federal Agency Securities | | | | | | | | |
(Cost $15,298,855) | | | | | | | 15,924,281 | |
| | | | | | | | | |
SENIOR FLOATING RATE INTERESTS†† - 5.4% | |
Communications - 1.2% | |
Univision Communications, Inc. | | | | | | | | |
4.00% due 03/01/20 | | | 997,317 | | | | 998,773 | |
Cengage Learning Acquisitions, Inc. | | | | | | | | |
5.25% due 06/07/23 | | | 850,000 | | | | 848,938 | |
48 | THE GUGGENHEIM FUNDS ANNUAL REPORT | SEE NOTES TO FINANCIAL STATEMENTS. |
SCHEDULE OF INVESTMENTS (continued) | September 30, 2016 |
INVESTMENT GRADE BOND FUND | |
| | | Face
Amount | | | Value | |
| | | | | | | |
MergerMarket Ltd. | | | | | | |
4.50% due 02/04/21 | | $ | 585,000 | | | $ | 576,225 | |
Internet Brands | | | | | | | | |
4.75% due 07/08/21 | | | 498,988 | | | | 499,612 | |
Proquest LLC | | | | | | | | |
5.75% due 10/24/21 | | | 494,954 | | | | 494,954 | |
Total Communications | | | | | | | 3,418,502 | |
| | | | | | | | | |
Consumer, Non-cyclical - 1.2% | |
Phillips-Medsize Corp. | | | | | | | | |
4.75% due 06/16/21 | | | 947,577 | | | | 946,099 | |
Packaging Coordinators Midco, Inc. | | | | | | | | |
5.00% due 07/03/23 | | | 698,250 | | | | 698,250 | |
Albertson’s LLC | | | | | | | | |
4.50% due 08/25/21 | | | 339,729 | | | | 342,199 | |
4.75% due 12/21/22 | | | 248,752 | | | | 251,085 | |
American Tire Distributors, Inc. | | | | | | | | |
5.25% due 09/01/21 | | | 523,671 | | | | 516,339 | |
DJO Finance LLC | | | | | | | | |
4.25% due 06/08/20 | | | 498,741 | | | | 489,389 | |
NES Global Talent | | | | | | | | |
6.50% due 10/03/191 | | | 122,320 | | | | 108,865 | |
Total Consumer, Non-cyclical | | | | | | | 3,352,226 | |
| | | | | | | | | |
Technology - 0.9% | |
Compucom Systems, Inc. | | | | | | | | |
4.25% due 05/11/20 | | | 702,678 | | | | 497,727 | |
EIG Investors Corp. | | | | | | | | |
6.00% due 02/09/231 | | | 445,477 | | | | 414,294 | |
Landslide Holdings, Inc. | | | | | | | | |
5.50% due 09/27/22 | | | 400,000 | | | | 402,500 | |
Solera LLC | | | | | | | | |
5.75% due 03/03/23 | | | 398,000 | | | | 401,896 | |
Epicor Software | | | | | | | | |
4.75% due 06/01/22 | | | 399,369 | | | | 393,131 | |
Greenway Medical Technologies | | | | | | | | |
6.00% due 11/04/201 | | | 340,375 | | | | 331,015 | |
Total Technology | | | | | | | 2,440,563 | |
| | | | | | | | | |
Utilities - 0.7% | |
TPF II Power LLC | | | | | | | | |
5.00% due 10/02/21 | | | 1,280,430 | | | | 1,292,274 | |
The Dayton Power and Light Co. | | | | | | | | |
4.00% due 08/24/22 | | | 700,000 | | | | 706,566 | |
Total Utilities | | | | | | | 1,998,840 | |
| | | | | | | | | |
Industrial - 0.5% | |
Travelport Holdings LLC | | | | | | | | |
5.00% due 09/02/21 | | | 1,319,831 | | | | 1,325,255 | |
CareCore National LLC | | | | | | | | |
5.50% due 03/05/21 | | | 124,192 | | | | 121,708 | |
Total Industrial | | | | | | | 1,446,963 | |
| | | | | | | | | |
Consumer, Cyclical - 0.4% | |
PETCO Animal Supplies, Inc. | | | | | | | | |
5.00% due 01/26/23 | | | 1,196,992 | | | | 1,208,771 | |
| | | | | | | | | |
Financial - 0.3% | |
Global Payments, Inc. | | | | | | | | |
4.02% due 04/22/23 | | | 598,500 | | | | 604,037 | |
Magic Newco, LLC | | | | | | | | |
5.00% due 12/12/18 | | | 241,823 | | | | 242,023 | |
American Stock Transfer & Trust | | | | | | | | |
5.75% due 06/26/20 | | | 94,661 | | | | 92,452 | |
Total Financial | | | | | | | 938,512 | |
| | | | | | | | | |
Basic Materials - 0.2% | |
Hoffmaster Group, Inc. | | | | | | | | |
5.25% due 05/08/20 | | | 447,710 | | | | 447,710 | |
Total Senior Floating Rate Interests | | | | | | | | |
(Cost $15,361,998) | | | | | | | 15,252,087 | |
| | | | | | | | | |
FEDERAL AGENCY DISCOUNT NOTES†† - 2.8% | |
Federal Home Loan Bank11 | | | | | | | | |
0.22% due 10/25/16 | | | 4,000,000 | | | | 3,999,413 | |
0.21% due 10/31/16 | | | 4,000,000 | | | | 3,999,317 | |
Total Federal Home Loan Bank | | | | | | | 7,998,730 | |
Total Federal Agency Discount Notes | | | | | | | | |
(Cost $7,998,730) | | | | | | | 7,998,730 | |
| | | | | | | | | |
MUNICIPAL BONDS†† - 1.6% | |
California - 0.8% | |
State of California General Obligation Unlimited | | | | | | | | |
7.60% due 11/01/40 | | | 1,450,000 | | | | 2,350,638 | |
| | | | | | | | | |
Michigan - 0.4% | |
Detroit City School District General Obligation Unlimited | | | | | | | | |
7.75% due 05/01/39 | | | 850,000 | | | | 1,110,313 | |
| | | | | | | | | |
Illinois - 0.4% | |
State of Illinois General Obligation Unlimited | | | | | | | | |
6.90% due 03/01/35 | | | 500,000 | | | | 566,015 | |
5.65% due 12/01/38 | | | 500,000 | | | | 519,180 | |
Total Illinois | | | | | | | 1,085,195 | |
Total Municipal Bonds | | | | | | | | |
(Cost $4,344,397) | | | | | | | 4,546,146 | |
| | | | | | | | | |
FOREIGN GOVERNMENT BONDS†† - 1.0% | |
Kenya Government International Bond | | | | | | | | |
6.88% due 06/24/244 | | | 1,350,000 | | | | 1,323,000 | |
Dominican Republic International Bond | | | | | | | | |
6.85% due 01/27/454 | | | 700,000 | | | | 784,000 | |
Corporation Financiera de Desarrollo S.A. | | | | | | | | |
5.25% due 07/15/292,4 | | | 600,000 | | | | 646,500 | |
Total Foreign Government Bonds | | | | | | | | |
(Cost $2,682,902) | | | | | | | 2,753,500 | |
| | | | | | | | | |
COMMERCIAL PAPER†† - 6.4% | |
Wal - Mart Stores, Inc. | | | | | | | | |
0.31% due 10/11/16 | | | 4,000,000 | | | | 3,999,656 | |
SEE NOTES TO FINANCIAL STATEMENTS. | THE GUGGENHEIM FUNDS ANNUAL REPORT | 49 |
SCHEDULE OF INVESTMENTS (continued) | September 30, 2016 |
INVESTMENT GRADE BOND FUND | |
| | | Face
Amount | | | Value | |
| | | | | | | |
Hasbro, Inc. | | | | | | |
0.53% due 10/07/164 | | $ | 4,000,000 | | | $ | 3,999,600 | |
BAT International Finance plc | | | | | | | | |
0.78% due 10/20/164 | | | 4,000,000 | | | | 3,998,353 | |
American Water Capital Corp. | | | | | | | | |
0.69% due 10/03/16 | | | 2,000,000 | | | | 1,999,923 | |
Campbell Soup Co. | | | | | | | | |
0.55% due 10/06/164 | | | 2,000,000 | | | | 1,999,847 | |
General Mills, Inc. | | | | | | | | |
0.58% due 10/03/164 | | | 1,000,000 | | | | 999,968 | |
Nissan Motor Acceptance Corp. | | | | | | | | |
0.66% due 10/17/164 | | | 1,000,000 | | | | 999,707 | |
Total Commercial Paper | | | | | | | | |
(Cost $17,997,054) | | | | | | | 17,997,054 | |
| | | | | | | | | |
Total Investments - 100.5% | | | | | | | | |
(Cost $281,052,917) | | | | | | $ | 282,706,713 | |
Other Assets & Liabilities, net - (0.5)% | | | | | | | (1,479,741 | ) |
Total Net Assets - 100.0% | | | | | | $ | 281,226,972 | |
* | Non-income producing security. |
† | Value determined based on Level 1 inputs, unless otherwise noted — See Note 4. |
†† | Value determined based on Level 2 inputs, unless otherwise noted — See Note 4. |
††† | Value determined based on Level 3 inputs — See Note 4. |
1 | Illiquid security. |
2 | Variable rate security. Rate indicated is rate effective at September 30, 2016. |
3 | Perpetual maturity. |
4 | Security is a 144A or Section 4(a)(2) security. The total market value of 144A or Section 4(a)(2) securities is $142,585,820 (cost $141,206,322), or 50.7% of total net assets. These securities have been determined to be liquid under guidelines established by the Board of Trustees. |
5 | Rate indicated is the 7 day yield as of September 30, 2016. |
6 | Security is a 144A or Section 4(a)(2) security. These securities are considered illiquid and restricted under guidelines established by the Board of Trustees. The total market value of 144A or Section 4(a)(2) securities is $7,718,431 (cost $9,380,136), or 2.7% of total net assets — See Note 12. |
7 | Security has no stated coupon. However, it is expected to receive residual cash flow payments on defined deal dates. |
8 | Security is a step up/step down bond. The coupon increases or decreases at regular intervals until the bond reaches full maturity. |
9 | Zero coupon rate security. |
10 | On September 7, 2008, the issuer was placed in conservatorship by the Federal Housing Finance Agency (FHFA). As conservator, the FHFA has full powers to control the assets and operations of the firm. |
11 | The issuer operates under a Congressional charter; its securities are neither issued nor guaranteed by the U.S. Government. |
| | plc — Public Limited Company |
| | |
| | See Sector Classification in Other Information section. |
50 | THE GUGGENHEIM FUNDS ANNUAL REPORT | SEE NOTES TO FINANCIAL STATEMENTS. |
SCHEDULE OF INVESTMENTS (continued) | September 30, 2016 |
INVESTMENT GRADE BOND FUND | |
The following table summarizes the inputs used to value the Fund’s investments at September 30, 2016 (See Note 4 in the Notes to Financial Statements):
Investments in Securities (Assets) | | Level 1 | | | Level 2 | | | Level 3 | | | Total | |
Asset-Backed Securities | | $ | — | | | $ | 92,158,481 | | | $ | 1,014,089 | | | $ | 93,172,570 | |
Collateralized Mortgage Obligations | | | — | | | | 56,017,743 | | | | — | | | | 56,017,743 | |
Commercial Paper | | | — | | | | 17,997,054 | | | | — | | | | 17,997,054 | |
Common Stocks | | | 50,950 | | | | — | | | | — | | | | 50,950 | |
Corporate Bonds | | | — | | | | 38,007,233 | | | | 1,675,204 | | | | 39,682,437 | |
Federal Agency Discount Notes | | | — | | | | 7,998,730 | | | | — | | | | 7,998,730 | |
Federal Agency Securities | | | — | | | | 15,924,281 | | | | — | | | | 15,924,281 | |
Foreign Government Bonds | | | — | | | | 2,753,500 | | | | — | | | | 2,753,500 | |
Municipal Bonds | | | — | | | | 4,546,146 | | | | — | | | | 4,546,146 | |
Preferred Stocks | | | — | | | | 558,800 | | | | 2,282,127 | | | | 2,840,927 | |
Senior Floating Rate Interests | | | — | | | | 15,252,087 | | | | — | | | | 15,252,087 | |
Short-Term Investments | | | 818,424 | | | | — | | | | — | | | | 818,424 | |
U.S. Government Securities | | | — | | | | 25,651,864 | | | | — | | | | 25,651,864 | |
Total | | $ | 869,374 | | | $ | 276,865,919 | | | $ | 4,971,420 | | | $ | 282,706,713 | |
The following is a summary of significant unobservable inputs used in the fair valuation of assets and liabilities categorized within Level 3 of the fair value hierarchy:
Category | | Ending Balance at 09/30/16 | | Valuation Technique | Unobservable
Inputs | | Input
Range | |
Asset-Backed Securities | | $ | 1,014,089 | | Option Adjusted Spread off the prior month end broker mark over the 3 month LIBOR | Indicative Quote | | | — | |
Corporate Bonds | | | 1,675,204 | | Option Adjusted Spread off the prior month end broker mark over the 3 month LIBOR | Indicative Quote | | | — | |
Preferred Stocks | | | 2,282,127 | | Option Adjusted Spread off the prior month end broker mark over the 3 month LIBOR | Indicative Quote | | | — | |
Total | | $ | 4,971,420 | | | | | | | |
Any remaining Level 3 securities held by the Fund and excluded from the tables above, were not considered material to the Fund.
Transfers between investment levels may occur as the markets fluctuate and/or the availability of data used in an investment’s valuation changes. The Fund recognized transfers between the levels as of the beginning of the period. As of September 30, 2016, Investment Grade Bond Fund had securities with a total value of $1,185,665 transfer out of Level 3 into Level 2 due to changes in the securities valuation method. There were no other securities that transferred between levels.
SEE NOTES TO FINANCIAL STATEMENTS. | THE GUGGENHEIM FUNDS ANNUAL REPORT | 51 |
SCHEDULE OF INVESTMENTS (concluded) | September 30, 2016 |
INVESTMENT GRADE BOND FUND | |
Summary of Fair Value Level 3 Activity
Following is a reconciliation of Level 3 assets and liabilities for which significant unobservable inputs were used to determine fair value for the year ended September 30, 2016:
LEVEL 3 - Fair value measurement using significant unobservable inputs
| | | Collateralized Mortgage
Obligations | | | Asset-Backed
Securities | | | Common
Stocks | | | Preferred
Stocks | | | Corporate
Bonds | | | Total | |
INVESTMENT GRADE BOND | | | | | | | | | | | | | | | | | | |
Assets: | | | | | | | | | | | | | | | | | | |
Beginning Balance | | $ | 862,694 | | | $ | — | | | $ | — | | | $ | 1,742,414 | | | $ | 2,400,227 | | | $ | 5,005,335 | |
Purchases | | | — | | | | 1,000,000 | | | | — | | | | — | | | | 835,508 | | | | 1,835,508 | |
Sales, maturities and paydowns | | | — | | | | — | | | | — | | | | — | | | | (1,362,990 | ) | | | (1,362,990 | ) |
Total realized gains or losses included in earnings | | | — | | | | — | | | | — | | | | — | | | | (33,662 | ) | | | (33,662 | ) |
Total change in unrealized gains or losses included in earnings | | | — | | | | 14,089 | | | | — | | | | 539,713 | | | | 159,092 | | | | 712,894 | |
Transfers into Level 3 | | | — | | | | — | | | | — | | | | — | | | | — | | | | — | |
Transfers out of Level 3 | | | (862,694 | ) | | | — | | | | — | | | | — | | | | (322,971 | ) | | | (1,185,665 | ) |
Ending Balance | | $ | — | | | $ | 1,014,089 | | | $ | — | | | $ | 2,282,127 | | | $ | 1,675,204 | | | $ | 4,971,420 | |
Net Change in unrealized appreciation (depreciation) for investments in securities still held at September 30, 2016 | | $ | — | | | $ | 14,089 | | | $ | — | | | $ | 539,713 | | | $ | 109,527 | | | $ | 663,329 | |
52 | THE GUGGENHEIM FUNDS ANNUAL REPORT | SEE NOTES TO FINANCIAL STATEMENTS. |
INVESTMENT GRADE BOND FUND | |
STATEMENT OF ASSETS AND LIABILITIES |
September 30, 2016 |
Assets: | |
Investments, at value (cost $281,052,917) | | $ | 282,706,713 | |
Prepaid expenses | | | 19,000 | |
Receivables: | |
Securities sold | | | 1,191,851 | |
Fund shares sold | | | 868,345 | |
Interest | | | 1,343,030 | |
Total assets | | | 286,128,939 | |
| | | | | |
Liabilities: | |
Overdraft due to custodian bank | | | 915 | |
Payable for: | |
Securities purchased | | | 3,451,509 | |
Fund shares redeemed | | | 1,123,311 | |
Management fees | | | 115,191 | |
Distribution and service fees | | | 62,225 | |
Fund accounting/administration fees | | | 21,647 | |
Transfer agent/maintenance fees | | | 19,117 | |
Dividends distributed | | | 15,712 | |
Trustees’ fees* | | | 3,179 | |
Miscellaneous | | | 89,161 | |
Total liabilities | | | 4,901,967 | |
Net assets | | $ | 281,226,972 | |
| | | | | |
Net assets consist of: | |
Paid in capital | | $ | 301,646,772 | |
Accumulated net investment loss | | | (747,212 | ) |
Accumulated net realized loss on investments | | | (21,326,384 | ) |
Net unrealized appreciation on investments | | | 1,653,796 | |
Net assets | | $ | 281,226,972 | |
| | | | | |
A-Class: | |
Net assets | | $ | 158,932,250 | |
Capital shares outstanding | | | 8,565,597 | |
Net asset value per share | | $ | 18.55 | |
Maximum offering price per share (Net asset value divided by 96.00%) | | $ | 19.32 | |
| | | | | |
C-Class: | |
Net assets | | $ | 36,040,042 | |
Capital shares outstanding | | | 1,950,455 | |
Net asset value per share | | $ | 18.48 | |
| | | | | |
P-Class: | |
Net assets | | $ | 3,087,035 | |
Capital shares outstanding | | | 166,242 | |
Net asset value per share | | $ | 18.57 | |
| | | | | |
Institutional Class: | |
Net assets | | $ | 83,167,645 | |
Capital shares outstanding | | | 4,488,775 | |
Net asset value per share | | $ | 18.53 | |
STATEMENT OF OPERATIONS |
Year Ended September 30, 2016 |
Investment Income: | |
Interest | | $ | 8,603,621 | |
Dividends | | | 158,451 | |
Total investment income | | | 8,762,072 | |
| | | | | |
Expenses: | |
Management fees | | | 973,595 | |
Transfer agent/maintenance fees: | |
A-Class | | | 114,348 | |
C-Class | | | 42,880 | |
P-Class | | | 309 | |
Institutional Class | | | 13,162 | |
Distribution and service fees: | |
A-Class | | | 330,451 | |
C-Class | | | 288,357 | |
P-Class | | | 4,124 | |
Fund accounting/administration fees | | | 184,781 | |
Custodian fees | | | 39,245 | |
Interest expense | | | 28,777 | |
Line of credit fees | | | 21,440 | |
Trustees’ fees* | | | 8,395 | |
Miscellaneous | | | 181,593 | |
Total expenses | | | 2,231,457 | |
Less: | |
Expenses waived by Adviser | | | (108,408 | ) |
Net expenses | | | 2,123,049 | |
Net investment income | | | 6,639,023 | |
| | | | | |
Net Realized and Unrealized Gain (Loss): | |
Net realized gain (loss) on: | |
Investments in unaffiliated issuers | | | 2,194,706 | |
Investments in affiliated issuers | | | (4,449 | ) |
Futures contracts | | | (49,847 | ) |
Foreign currency | | | 7 | |
Forward currency exchange contracts | | | 5 | |
Options purchased | | | (57,363 | ) |
Options written | | | 15,664 | |
Net realized gain | | | 2,098,723 | |
Net change in unrealized appreciation (depreciation) on: | |
Investments in unaffiliated issuers | | | 4,662,137 | |
Investments in affiliated issuers | | | 1,620 | |
Options purchased | | | (42,971 | ) |
Options written | | | 7,577 | |
Net change in unrealized appreciation (depreciation) | | | 4,628,363 | |
Net realized and unrealized gain | | | 6,727,086 | |
Net increase in net assets resulting from operations | | $ | 13,366,109 | |
* | Relates to Trustees not deemed “interested persons” within the meaning of Section 2(a)(19) of the 1940 Act. |
SEE NOTES TO FINANCIAL STATEMENTS. | THE GUGGENHEIM FUNDS ANNUAL REPORT | 53 |
INVESTMENT GRADE BOND FUND | |
STATEMENTS OF CHANGES IN NET ASSETS |
| | | Year Ended
September 30,
2016 | | | Year Ended
September 30,
2015 | |
Increase (Decrease) in Net Assets from Operations: | | | | | | |
Net investment income | | $ | 6,639,023 | | | $ | 5,043,465 | |
Net realized gain (loss) on investments | | | 2,098,723 | | | | (2,824,809 | ) |
Net change in unrealized appreciation (depreciation) on investments | | | 4,628,363 | | | | 509,808 | |
Net increase in net assets resulting from operations | | | 13,366,109 | | | | 2,728,464 | |
| | | | | | | | | |
Distributions to shareholders from: | | | | | | | | |
Net investment income | | | | | | | | |
A-Class | | | (4,978,867 | ) | | | (4,661,405 | ) |
B-Class** | | | — | | | | (47,942 | ) |
C-Class | | | (868,592 | ) | | | (851,092 | ) |
P-Class | | | (57,008 | ) | | | (186 | )* |
Institutional Class | | | (1,157,024 | ) | | | (271,114 | ) |
Total distributions to shareholders | | | (7,061,491 | ) | | | (5,831,739 | ) |
| | | | | | | | | |
Capital share transactions: | | | | | | | | |
Proceeds from sale of shares | | | | | | | | |
A-Class | | | 66,630,224 | | | | 46,869,449 | |
B-Class** | | | — | | | | 52,221 | |
C-Class | | | 19,854,556 | | | | 10,722,431 | |
P-Class | | | 3,885,131 | | | | 47,999 | * |
Institutional Class | | | 85,970,913 | | | | 10,634,690 | |
Distributions reinvested | | | | | | | | |
A-Class | | | 4,737,216 | | | | 4,442,417 | |
B-Class** | | | — | | | | 47,722 | |
C-Class | | | 761,108 | | | | 740,294 | |
P-Class | | | 57,008 | | | | 186 | * |
Institutional Class | | | 893,933 | | | | 226,521 | |
Cost of shares redeemed | | | | | | | | |
A-Class | | | (31,331,066 | ) | | | (33,418,832 | ) |
B-Class** | | | — | | | | (2,196,898 | ) |
C-Class | | | (9,542,796 | ) | | | (7,495,634 | ) |
P-Class | | | (946,105 | ) | | | (37,888 | )* |
Institutional Class | | | (12,097,691 | ) | | | (9,741,384 | ) |
Net increase from capital share transactions | | | 128,872,431 | | | | 20,893,294 | |
Net increase in net assets | | | 135,177,049 | | | | 17,790,019 | |
| | | | | | | | | |
Net assets: | | | | | | | | |
Beginning of year | | | 146,049,923 | | | | 128,259,904 | |
End of year | | $ | 281,226,972 | | | $ | 146,049,923 | |
Accumulated net investment loss at end of year | | $ | (747,212 | ) | | $ | (338,751 | ) |
54 | THE GUGGENHEIM FUNDS ANNUAL REPORT | SEE NOTES TO FINANCIAL STATEMENTS. |
INVESTMENT GRADE BOND FUND | |
STATEMENTS OF CHANGES IN NET ASSETS (concluded) |
| | | Year Ended
September 30,
2016 | | | Year Ended
September 30,
2015 | |
Capital share activity: | | | | | | |
Shares sold | | | | | | |
A-Class | | | 3,676,365 | | | | 2,543,649 | |
B-Class** | | | — | | | | 2,821 | |
C-Class | | | 1,100,204 | | | | 584,251 | |
P-Class | | | 214,391 | | | | 2,628 | * |
Institutional Class | | | 4,719,258 | | | | 577,777 | |
Shares issued from reinvestment of distributions | | | | | | | | |
A-Class | | | 261,551 | | | | 241,345 | |
B-Class** | | | — | | | | 2,590 | |
C-Class | | | 42,199 | | | | 40,376 | |
P-Class | | | 3,148 | | | | 10 | * |
Institutional Class | | | 48,739 | | | | 12,321 | |
Shares redeemed | | | | | | | | |
A-Class | | | (1,727,722 | ) | | | (1,812,612 | ) |
B-Class** | | | — | | | | (120,112 | ) |
C-Class | | | (529,935 | ) | | | (409,164 | ) |
P-Class | | | (51,857 | ) | | | (2,078 | )* |
Institutional Class | | | (661,553 | ) | | | (527,752 | ) |
Net increase in shares | | | 7,094,788 | | | | 1,136,050 | |
* | Since commencement of operations: May 1, 2015. |
** | B-Class shares previously offered have been converted to A-Class shares effective August 8, 2015. |
SEE NOTES TO FINANCIAL STATEMENTS. | THE GUGGENHEIM FUNDS ANNUAL REPORT | 55 |
INVESTMENT GRADE BOND FUND | |
This table is presented to show selected data for a share outstanding throughout each period and to assist shareholders in evaluating a Fund’s performance for the periods presented.
A-Class | Year Ended
September 30,
2016 | | Year Ended
September 30,
2015 | | Year Ended
September 30,
2014 | | Year Ended
September 30,
2013 | | Period Ended
September 30,
2012a | | | Year Ended
December 31,
2011f | |
Per Share Data | | | | | | | | | | | | | | | | | | |
Net asset value, beginning of period | | $ | 18.10 | | | $ | 18.50 | | | $ | 17.81 | | | $ | 17.92 | | | $ | 17.41 | | | $ | 16.71 | |
Income (loss) from investment operations: | |
Net investment income (loss)b | | | .64 | | | | .69 | | | | .65 | | | | .61 | | | | .27 | | | | .42 | |
Net gain (loss) on investments (realized and unrealized) | | | .50 | | | | (.30 | ) | | | .83 | | | | (.04 | ) | | | .51 | | | | .74 | |
Total from investment operations | | | 1.14 | | | | .39 | | | | 1.48 | | | | .57 | | | | .78 | | | | 1.16 | |
Less distributions from: | |
Net investment income | | | (.69 | ) | | | (.79 | ) | | | (.79 | ) | | | (.68 | ) | | | (.27 | ) | | | (.46 | ) |
Total distributions | | | (.69 | ) | | | (.79 | ) | | | (.79 | ) | | | (.68 | ) | | | (.27 | ) | | | (.46 | ) |
Net asset value, end of period | | $ | 18.55 | | | $ | 18.10 | | | $ | 18.50 | | | $ | 17.81 | | | $ | 17.92 | | | $ | 17.41 | |
| | |
Total Returng | | | 6.50 | % | | | 2.12 | % | | | 8.47 | % | | | 3.21 | % | | | 4.51 | % | | | 6.94 | % |
Ratios/Supplemental Data | |
Net assets, end of period (in thousands) | | $ | 158,932 | | | $ | 115,019 | | | $ | 99,565 | | | $ | 83,642 | | | $ | 98,063 | | | $ | 108,999 | |
Ratios to average net assets: | |
Net investment income (loss) | | | 3.55 | % | | | 3.72 | % | | | 3.55 | % | | | 3.40 | % | | | 2.04 | % | | | 2.43 | % |
Total expensesh | | | 1.08 | % | | | 1.17 | % | | | 1.19 | % | | | 1.21 | % | | | 1.15 | % | | | 1.15 | % |
Net expensesc,i | | | 1.03 | % | | | 1.07 | % | | | 1.05 | % | | | 1.04 | % | | | 1.00 | % | | | 1.00 | % |
Portfolio turnover rate | | | 100 | % | | | 57 | % | | | 61 | % | | | 119 | % | | | 52 | % | | | 43 | % |
C-Class | Year Ended
September 30,
2016 | | Year Ended
September 30,
2015 | | Year Ended
September 30,
2014 | | Year Ended
September 30,
2013 | | Period Ended
September 30,
2012a | | | Year Ended
December 31,
2011 f | |
Per Share Data | | | | | | | | | | | | | | | | | | |
Net asset value, beginning of period | | $ | 18.02 | | | $ | 18.42 | | | $ | 17.73 | | | $ | 17.82 | | | $ | 17.31 | | | $ | 16.62 | |
Income (loss) from investment operations: | |
Net investment income (loss)b | | | .51 | | | | .55 | | | | .51 | | | | .48 | | | | .17 | | | | .29 | |
Net gain (loss) on investments (realized and unrealized) | | | .51 | | | | (.30 | ) | | | .83 | | | | (.05 | ) | | | .51 | | | | .73 | |
Total from investment operations | | | 1.02 | | | | .25 | | | | 1.34 | | | | .43 | | | | .68 | | | | 1.02 | |
Less distributions from: | |
Net investment income | | | (.56 | ) | | | (.65 | ) | | | (.65 | ) | | | (.52 | ) | | | (.17 | ) | | | (.33 | ) |
Total distributions | | | (.56 | ) | | | (.65 | ) | | | (.65 | ) | | | (.52 | ) | | | (.17 | ) | | | (.33 | ) |
Net asset value, end of period | | $ | 18.48 | | | $ | 18.02 | | | $ | 18.42 | | | $ | 17.73 | | | $ | 17.82 | | | $ | 17.31 | |
| | |
Total Returng | | | 5.78 | % | | | 1.36 | % | | | 7.69 | % | | | 2.42 | % | | | 3.95 | % | | | 6.32 | % |
Ratios/Supplemental Data | |
Net assets, end of period (in thousands) | | $ | 36,040 | | | $ | 24,111 | | | $ | 20,673 | | | $ | 17,876 | | | $ | 20,929 | | | $ | 22,035 | |
Ratios to average net assets: | |
Net investment income (loss) | | | 2.81 | % | | | 3.00 | % | | | 2.80 | % | | | 2.65 | % | | | 1.29 | % | | | 1.68 | % |
Total expensesh | | | 1.90 | % | | | 1.99 | % | | | 1.99 | % | | | 2.03 | % | | | 1.92 | % | | | 1.90 | % |
Net expensesc,i | | | 1.77 | % | | | 1.82 | % | | | 1.80 | % | | | 1.79 | % | | | 1.75 | % | | | 1.75 | % |
Portfolio turnover rate | | | 100 | % | | | 57 | % | | | 61 | % | | | 119 | % | | | 52 | % | | | 43 | % |
56 | THE GUGGENHEIM FUNDS ANNUAL REPORT | SEE NOTES TO FINANCIAL STATEMENTS. |
INVESTMENT GRADE BOND FUND | |
FINANCIAL HIGHLIGHTS (continued) |
This table is presented to show selected data for a share outstanding throughout each period and to assist shareholders in evaluating a Fund’s performance for the periods presented.
P-Class | | Year Ended
September 30,
2016 | | | Period Ended
September 30,
2015d | |
Per Share Data | | | | | | |
Net asset value, beginning of period | | $ | 18.12 | | | $ | 18.45 | |
Income (loss) from investment operations: | |
Net investment income (loss)b | | | .59 | | | | .25 | |
Net gain (loss) on investments (realized and unrealized) | | | .55 | | | | (.26 | ) |
Total from investment operations | | | 1.14 | | | | (.01 | ) |
Less distributions from: | |
Net investment income | | | (.69 | ) | | | (.32 | ) |
Total distributions | | | (.69 | ) | | | (.32 | ) |
Net asset value, end of period | | $ | 18.57 | | | $ | 18.12 | |
| | |
Total Returng | | | 6.51 | % | | | (0.11 | %) |
Ratios/Supplemental Data | |
Net assets, end of period (in thousands) | | $ | 3,087 | | | $ | 10 | |
Ratios to average net assets: | |
Net investment income (loss) | | | 3.25 | % | | | 3.25 | % |
Total expensesh | | | 0.98 | % | | | 3.29 | % |
Net expensesc,i | | | 0.98 | % | | | 1.09 | % |
Portfolio turnover rate | | | 100 | % | | | 57 | % |
SEE NOTES TO FINANCIAL STATEMENTS. | THE GUGGENHEIM FUNDS ANNUAL REPORT | 57 |
INVESTMENT GRADE BOND FUND | |
FINANCIAL HIGHLIGHTS (concluded) |
This table is presented to show selected data for a share outstanding throughout each period and to assist shareholders in evaluating a Fund’s performance for the periods presented.
Institutional Class | | Year Ended
September 30,
2016 | | | Year Ended
September 30,
2015 | | | Year Ended
September 30,
2014 | | | Period Ended
September 30,
2013e | |
Per Share Data | | | | | | | | | | | | |
Net asset value, beginning of period | | $ | 18.07 | | | $ | 18.47 | | | $ | 17.80 | | | $ | 18.00 | |
Income (loss) from investment operations: | |
Net investment income (loss)b | | | .62 | | | | .74 | | | | .68 | | | | .46 | |
Net gain (loss) on investments (realized and unrealized) | | | .58 | | | | (.31 | ) | | | .83 | | | | (.21 | ) |
Total from investment operations | | | 1.20 | | | | .43 | | | | 1.51 | | | | .25 | |
Less distributions from: | |
Net investment income | | | (.74 | ) | | | (.83 | ) | | | (.84 | ) | | | (.45 | ) |
Total distributions | | | (.74 | ) | | | (.83 | ) | | | (.84 | ) | | | (.45 | ) |
Net asset value, end of period | | $ | 18.53 | | | $ | 18.07 | | | $ | 18.47 | | | $ | 17.80 | |
| | |
Total Returng | | | 6.83 | % | | | 2.37 | % | | | 8.64 | % | | | 1.35 | % |
Ratios/Supplemental Data | |
Net assets, end of period (in thousands) | | $ | 83,168 | | | $ | 6,910 | | | $ | 5,909 | | | $ | 174 | |
Ratios to average net assets: | |
Net investment income (loss) | | | 3.41 | % | | | 4.01 | % | | | 3.72 | % | | | 3.85 | % |
Total expensesh | | | 0.76 | % | | | 0.94 | % | | | 0.88 | % | | | 1.17 | % |
Net expensesc,i | | | 0.76 | % | | | 0.82 | % | | | 0.78 | % | | | 0.82 | % |
Portfolio turnover rate | | | 100 | % | | | 57 | % | | | 61 | % | | | 119 | % |
a | The Fund changed its fiscal year end from December 31 to September 30 in 2012. |
b | Net investment income (loss) per share was computed using average shares outstanding throughout the period. |
c | Net expense information reflects the expense ratios after expense waivers. |
d | Since commencement of operations: May 1, 2015. Percentage amounts for the period, except total return and portfolio turnover rate, have been annualized. |
e | Since commencement of operations: January 29, 2013. Percentage amounts for the period, except total return and portfolio turnover rate, have been annualized. |
f | Per share amounts for the periods presented through April 8, 2011 have been restated to reflect a 1:4 reverse share split effective April 8, 2011. |
g | Total return does not reflect the impact of any applicable sales charges and has not been annualized. |
h | Does not include expenses of the underlying funds in which the Fund invests. |
i | Net expenses may include expenses that are excluded from the expense limitation agreement. Excluding these expenses, the operating expense ratios for the years would be: |
| | | 09/30/16 | 09/30/15 | 09/30/14 | 09/30/13 |
| | A-Class | 1.00% | 1.00% | 1.00% | 1.02% |
| | C-Class | 1.74% | 1.75% | 1.75% | 1.77% |
| | P-Class | 0.97% | 1.00% | — | — |
| | Institutional Class | 0.75% | 0.75% | 0.75% | 0.77% |
58 | THE GUGGENHEIM FUNDS ANNUAL REPORT | SEE NOTES TO FINANCIAL STATEMENTS. |
MANAGERS’ COMMENTARY(Unaudited) | September 30, 2016 |
To Our Shareholders
Guggenheim Limited Duration Fund (the “Fund”) is managed by a team of seasoned professionals, including Anne B. Walsh, Senior Managing Director and Assistant Chief Investment Officer; James W. Michal, Senior Managing Director and Portfolio Manager; and Steven H. Brown, CFA, Managing Director and Portfolio Manager. In the following paragraphs, the investment team discusses the market environment and the Fund’s performance for the fiscal year ended September 30, 2016.
For the one-year period ended September 30, 2016, Guggenheim Limited Duration Fund A returned 3.16%1, compared with the 1.33% return of its benchmark, the Bloomberg Barclays U.S. Aggregate Bond 1-3 Year Index.
The Fund seeks to provide a high level of income consistent with the preservation of capital. It invests at least 80% of its assets in a diversified portfolio of debt securities.
At the start of the period, the U.S. Federal Reserve (the Fed) announced a 25-basis-point increase in the federal funds target rate from 0–25 basis points to a range of 25–50 basis points on December 16, 2015. A number of other key events fueled the risk-off sentiment in the fourth quarter of 2015 that continued into 2016, but three were particularly damaging to risk assets. The first was the release of the much stronger-than-expected U.S. employment report in early November 2015, which boosted the odds that the Fed would begin raising interest rates. The second event was the European Central Bank’s (ECB) announcement of new stimulus measures at its December 2015 meeting, which disappointed market expectations. The third event was the December 2015 announcement by the Organization of Petroleum Exporting Countries (OPEC) that its members would continue to pump approximately 31.5 million barrels of crude oil per day. Risk assets rallied, however, in the latter half of the first quarter of 2016, led by a dovish pivot in Fed communication and positive economic data which helped to combat recession fears. By conveying a more cautious policy outlook, the Fed helped spur a reversal of dollar strength, a rally in crude oil, and spread tightening across risk assets.
The rally in risk assets that began in February 2016 was briefly interrupted in June by the UK’s vote to leave the European Union. Despite the two-day selloff following the UK vote, high-yield bonds and bank loans held up. Current valuations in energy bonds indicate that leveraged credit has further room to rally as we pass the worst of the commodity related distress, but volatility is expected to remain elevated. A positive outlook for the U.S. economy, a cautious Fed, and stabilizing oil prices support our constructive view on corporate credit assets.
A key to Fund performance for the period was strong carry over the period across asset classes, especially collateralized loan obligations, or CLOs, and non-agency residential mortgage-backed securities (non-Agency RMBS). Another contributor was spread tightening from investment grade corporate bonds and high yield corporate bonds. There were no significant detractors from performance for the period. Derivatives were used to hedge interest rates.
A majority of the Fund’s structured credit holdings feature floating rate coupons, yields higher than traditional securitized assets like auto or credit-card receivables, and, often, investment-grade ratings. The Fund believes that ABS and CLOs offer some downside protection, and amortizing structures to keep credit exposure lower over time. Floating rate instruments accounted for about half the Fund’s holdings at the end of the period.
Over the period, the Fund increased its exposure to investment grade corporate bonds, bank loans, and high yield corporate bonds, while exposure to CLOs, ABS, and preferred securities declined. The increase in investment-grade securities sought to take advantage of strong global demand for both short and long-term corporate bonds from investors in yield-starved Asia and Europe.
The Fund invests excess cash into the Guggenheim Strategy Funds which, in turn, invest in a diversified portfolio of debt securities and financial instruments providing exposure to fixed income markets. The investment objective of the Guggenheim Strategy Funds is to seek a high level of income consistent with the preservation of capital. For the one -year period ended September 30, 2016, investment in the Guggenheim Strategy Funds has benefited Fund performance relative to investing in other short-term investments.
Performance displayed represents past performance which is no guarantee of future results.
1 | Performance figures are based on Class A shares and do not reflect deduction of the sales charges or taxes that a shareholder would pay on distributions or the redemption of shares. |
The opinions and forecast expressed may not actually come to pass. This information is subject to change at any time, based on market and other conditions, and should not be construed as a recommendation of any specific security or strategy.
| | THE GUGGENHEIM FUNDS ANNUAL REPORT | 59 |
PERFORMANCE REPORT AND FUND PROFILE (Unaudited) | September 30, 2016 |
LIMITED DURATION FUND
OBJECTIVE: Seeks to provide a high level of income consistent with preservation of capital.
Holdings Diversification (Market Exposure as % of Net Assets)
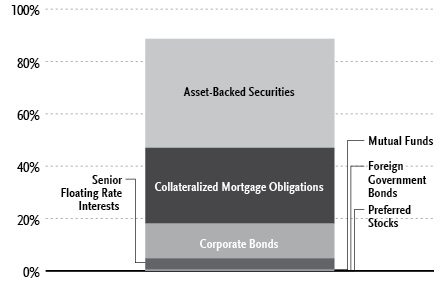
“Holdings Diversification (Market Exposure as % of Net Assets)” excludes any temporary cash investments or investments in Guggenheim Strategy Funds Trust mutual funds. Investments in those Funds do not provide “market exposure” to meet the Fund’s investment objective, but will significantly increase the portfolio’s exposure to certain other asset categories (and their associated risks), which may cause the Fund to deviate from its principal investment strategy, including: (i) high yield, high risk debt securities rated below the top four long-term rating categories by a nationally recognized statistical rating organization (also known as “junk bonds”); (ii) securities issued by the U.S. government or its agencies and instrumentalities; (iii) CLOs and similar investments; and (iv) other short-term fixed income securities.
Inception Dates: |
A-Class | December 16, 2013 |
C-Class | December 16, 2013 |
P-Class | May 1, 2015 |
Institutional Class | December 16, 2013 |
Ten Largest Holdings (% of Total Net Assets) |
TICP CLO III Ltd. | 1.9% |
Guggenheim Strategy Fund I | 1.7% |
Station Place Securitization Trust | 1.3% |
Venture XVI CLO Ltd. | 1.3% |
LSTAR Securities Investment Trust 2015-1 | 1.2% |
Nationstar HECM Loan Trust | 1.1% |
VOLT L LLC | 1.0% |
Bayview Opportunity Master Fund IIIa Trust | 1.0% |
Bank of Nova Scotia | 0.9% |
Countrywide Asset-Backed Certificates | 0.9% |
Top Ten Total | 12.3% |
“Ten Largest Holdings” excludes any temporary cash or derivative investments. |
Portfolio Composition by Quality Rating1 |
Rating | |
Fixed Income Instruments | |
AAA | 23.6% |
AA | 10.7% |
A | 17.8% |
BBB | 11.7% |
BB | 5.8% |
B | 6.6% |
CCC | 0.9% |
NR2 | 14.8% |
Other Instruments | 8.1% |
Total Investments | 100.0% |
The chart above reflects percentages of the value of total investments. |
1 | Source: BlackRock Solutions. Credit quality ratings are measured on a scale that generally ranges from AAA (highest) to D (lowest). All securities except for those labeled “NR” have been rated by a Nationally Recognized Statistical Rating Organization (“NRSRO”). For purposes of this presentation, when ratings are available from more than one agency, the highest rating is used. Guggenheim Investments converts ratings to the equivalent S&P rating. |
2 | NR securities do not necessarily indicate low credit quality. |
60 | THE GUGGENHEIM FUNDS ANNUAL REPORT | |
PERFORMANCE REPORT AND FUND PROFILE (Unaudited)(concluded) | September 30, 2016 |
Cumulative Fund Performance*
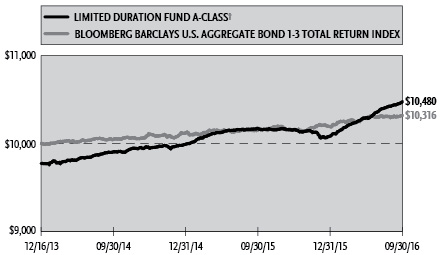
Average Annual Returns*
Periods Ended September 30, 2016
| | 1 Year | Since Inception (12/16/13) |
A-Class Shares | 3.16% | 2.53% |
A-Class Shares with sales charge† | 0.83% | 1.69% |
C-Class Shares | 2.39% | 1.75% |
C-Class Shares with CDSC‡ | 1.39% | 1.75% |
Institutional Class Shares | 3.43% | 2.80% |
Bloomberg Barclays U.S. Aggregate Bond 1-3 Total Return Index | 1.33% | 1.12% |
| 1 Year | Since Inception (05/01/15) |
P-Class Shares | 3.17% | 2.46% |
Bloomberg Barclays U.S. Aggregate Bond 1-3 Total Return Index | 1.33% | 1.22% |
* | The performance data above represents past performance that is not predictive of future results. The investment return and principal value of an investment in the Fund will fluctuate so that an investor’s shares, when redeemed, may be worth more or less than their original cost. Returns are historical and include changes in principal and reinvested dividends and capital gains and do not reflect the effect of taxes. The Bloomberg Barclays U.S. Aggregate Bond 1-3 Total Return Index is an unmanaged index and, unlike the Fund, has no management fees or operating expenses to reduce its reported return. The graph is based on A-Class shares only; performance for C-Class shares, P-Class shares and Institutional Class shares will vary due to differences in fee structures. |
† | Fund returns are calculated using the maximum sales charge of 2.25%. |
‡ | Fund returns include a CDSC of 1% if redeemed within 12 months of purchase. |
| | THE GUGGENHEIM FUNDS ANNUAL REPORT | 61 |
SCHEDULE OF INVESTMENTS | September 30, 2016 |
LIMITED DURATION FUND | |
| | | Shares | | | Value | |
| | | | | | | |
PREFERRED STOCKS†† - 0.1% | |
| | | | | | | |
Industrial - 0.1% | |
Seaspan Corp. 6.38% due 04/30/191 | | | 17,900 | | | $ | 454,660 | |
Total Preferred Stocks | | | | | | | | |
(Cost $450,922) | | | | | | | 454,660 | |
| | | | | | | | | |
MUTUAL FUNDS† - 2.6% | |
Guggenheim Strategy Fund I2 | | | 483,066 | | | | 12,071,811 | |
Guggenheim Strategy Fund II2 | | | 202,368 | | | | 5,047,051 | |
Guggenheim Floating Rate Strategies Fund - Institutional Class2 | | | 49,494 | | | | 1,283,886 | |
Total Mutual Funds | | | | | | | | |
(Cost $18,290,109) | | | | | | | 18,402,748 | |
| | | | | | | | | |
SHORT-TERM INVESTMENTS† - 1.8% | |
Dreyfus Treasury Securities Cash Management Fund - Institutional Class 0.16%3 | | | 13,045,743 | | | | 13,045,743 | |
Total Short-Term Investments | | | | | | | | |
(Cost $13,045,743) | | | | | | | 13,045,743 | |
| | | Face
Amount | | | | | |
| | | | | | | | | |
ASSET-BACKED SECURITIES†† - 41.6% | |
Collateralized Loan Obligations - 33.1% | |
TICP CLO III Ltd. | | | | | | | | |
2014-3A, 2.24% due 01/20/275,6 | | $ | 13,350,000 | | | | 13,344,186 | |
Golub Capital Partners CLO Ltd. | | | | | | | | |
2015-25A, 2.58% due 08/05/275,6 | | | 5,000,000 | | | | 4,868,742 | |
2014-10A, 2.45% due 10/20/215,6 | | | 1,500,000 | | | | 1,499,238 | |
2015-23A, 2.93% due 05/05/275,6 | | | 1,000,000 | | | | 999,932 | |
2015-24A, 4.53% due 02/05/275,6 | | | 1,000,000 | | | | 995,077 | |
2014-10A, 3.65% due 10/20/215,6 | | | 700,000 | | | | 699,718 | |
2014-21A, 3.16% due 10/25/265,6 | | | 500,000 | | | | 490,978 | |
2014-18A, 4.21% due 04/25/265,6 | | | 250,000 | | | | 247,523 | |
2014-18A, 4.71% due 04/25/265,6 | | | 250,000 | | | | 224,842 | |
Venture XVI CLO Ltd. | | | | | | | | |
2014-16A, 2.18% due 04/15/265,6 | | | 9,200,000 | | | | 9,190,789 | |
CIFC Funding Ltd. | | | | | | | | |
2015-2A, 2.74% due 12/05/245,6 | | | 2,000,000 | | | | 1,996,310 | |
2015-2A, 3.54% due 12/05/245,6 | | | 1,990,000 | | | | 1,990,296 | |
2013-3A, 5.00% due 01/29/255,6 | | | 1,400,000 | | | | 1,400,119 | |
2014-3X INC, due 07/22/267 | | | 2,000,000 | | | | 1,253,291 | |
2007-1A, 2.31% due 05/10/215,6 | | | 1,000,000 | | | | 973,766 | |
2013-3A, 3.75% due 01/29/255,6 | | | 600,000 | | | | 594,219 | |
OCP CLO Ltd. | | | | | | | | |
2016-11A, 3.03% due 04/26/285,6 | | | 3,750,000 | | | | 3,738,034 | |
2013-4A, 3.46% due 10/24/255,6 | | | 2,000,000 | | | | 1,970,847 | |
2016-11A, 4.08% due 04/26/285,6 | | | 1,500,000 | | | | 1,499,731 | |
Northwoods Capital XIV Ltd. | | | | | | | | |
2014-14A, 2.42% due 11/12/255,6 | | | 5,700,000 | | | | 5,702,991 | |
2014-14A, 3.28% due 11/12/255,6 | | | 1,000,000 | | | | 1,009,433 | |
Fortress Credit BSL II Ltd. | | | | | | | | |
2013-2A, 2.19% due 10/19/255,6 | | | 5,000,000 | | | | 5,011,241 | |
2013-2A, 2.94% due 10/19/255,6 | | | 1,500,000 | | | | 1,508,893 | |
GoldenTree Loan Opportunities VII Ltd. | | | | | | | | |
2013-7A, 1.86% due 04/25/255,6 | | | 5,750,000 | | | | 5,726,059 | |
Cent CDO 14 Ltd. | | | | | | | | |
2007-14A, 1.38% due 04/15/215,6 | | | 6,000,000 | | | | 5,571,707 | |
Acis CLO Ltd. | | | | | | | | |
2013-1A, 1.55% due 04/18/245,6 | | | 5,500,000 | | | | 5,433,968 | |
MT Wilson CLO II Ltd. | | | | | | | | |
2007-2A, 1.66% due 07/11/205,6 | | | 4,500,000 | | | | 4,444,530 | |
2007-2A, 3.41% due 07/11/205,6 | | | 1,000,000 | | | | 972,751 | |
Great Lakes CLO Ltd. | | | | | | | | |
2015-1A, 2.63% due 07/15/265,6 | | | 5,000,000 | | | | 4,962,288 | |
2014-1A, 4.38% due 04/15/255,6 | | | 250,000 | | | | 242,783 | |
Great Lakes CLO 2012-1 Ltd. | | | | | | | | |
2012-1A, 2.51% due 01/15/235,6 | | | 5,101,942 | | | | 5,080,730 | |
Oaktree EIF I Series A1 Ltd. | | | | | | | | |
2016-A1, 3.28% due 10/18/275,6 | | | 4,500,000 | | | | 4,554,420 | |
Black Diamond CLO Ltd. | | | | | | | | |
2013-1A, 2.16% due 02/01/235,6 | | | 4,375,145 | | | | 4,341,205 | |
Garrison Funding Ltd. | | | | | | | | |
2015-1A, 3.33% due 05/25/275,6 | | | 2,000,000 | | | | 2,004,386 | |
2016-2A, 3.06% due 09/29/275,6 | | | 2,000,000 | | | | 2,000,000 | |
RFTI Issuer Ltd. | | | | | | | | |
2015-FL1, 2.27% due 08/15/304,5 | | | 4,000,000 | | | | 3,992,052 | |
Fortress Credit Opportunities VI CLO Ltd. | | | | | | | | |
2015-6A, 2.75% due 10/10/265,6 | | | 2,750,000 | | | | 2,718,085 | |
2015-6A, 3.55% due 10/10/265,6 | | | 1,000,000 | | | | 990,762 | |
WhiteHorse VIII Ltd. | | | | | | | | |
2014-1A, 2.26% due 05/01/265,6 | | | 3,450,000 | | | | 3,414,635 | |
Voya CLO Ltd. | | | | | | | | |
2013-1A, 3.58% due 04/15/245,6 | | | 2,300,000 | | | | 2,289,268 | |
2015-3A, 3.63% due 10/15/225,6 | | | 1,000,000 | | | | 999,954 | |
Cavalry CLO II | | | | | | | | |
2013-2A, 2.03% due 01/17/245,6 | | | 3,000,000 | | | | 2,993,250 | |
PFP Ltd. | | | | | | | | |
2015-2, 2.53% due 07/14/345,6 | | | 3,000,000 | | | | 2,990,552 | |
Oak Hill Credit Partners X Ltd. | | | | | | | | |
2014-10A, 2.80% due 07/20/265,6 | | | 2,950,000 | | | | 2,950,239 | |
Fifth Street SLF II Ltd. | | | | | | | | |
2015-2A, 2.67% due 09/29/275,6 | | | 3,000,000 | | | | 2,942,188 | |
Resource Capital Corporation | | | | | | | | |
2014-CRE2, 3.03% due 04/15/325,6 | | | 2,000,000 | | | | 1,886,057 | |
2015-CRE3, 3.68% due 03/15/325,6 | | | 1,000,000 | | | | 952,869 | |
Venture VI CDO Ltd. | | | | | | | | |
2006-1A, 2.24% due 08/03/205,6 | | | 2,850,000 | | | | 2,700,575 | |
Catamaran CLO Ltd. | | | | | | | | |
2014-1A, 3.35% due 04/20/265,6 | | | 2,750,000 | | | | 2,678,215 | |
Babson CLO Ltd. | | | | | | | | |
2013-IIA, 3.33% due 01/18/255,6 | | | 2,250,000 | | | | 2,222,706 | |
2012-2A, 0.00% due 05/15/236,7 | | | 750,000 | | | | 351,961 | |
KKR CLO Ltd. | | | | | | | | |
2015-12, 2.98% due 07/15/275,6 | | | 2,500,000 | | | | 2,500,825 | |
Atrium XI | | | | | | | | |
2014-11A, 3.91% due 10/23/255,6 | | | 2,500,000 | | | | 2,500,194 | |
Arch Street CLO Ltd. | | | | | | | | |
2016-2A, 2.06% due 10/20/285,6 | | | 2,500,000 | | | | 2,499,526 | |
62 | THE GUGGENHEIM FUNDS ANNUAL REPORT | SEE NOTES TO FINANCIAL STATEMENTS. |
SCHEDULE OF INVESTMENTS (continued) | September 30, 2016 |
LIMITED DURATION FUND | |
| | | Face
Amount | | | Value | |
| | | | | | | |
Ares XXVI CLO Ltd. | | | | | | |
2013-1A, 3.43% due 04/15/255,6 | | $ | 2,500,000 | | | $ | 2,485,376 | |
LCM XXII Ltd. | | | | | | | | |
2016-22A, 2.13% due 10/20/285,6 | | | 2,300,000 | | | | 2,300,000 | |
Highbridge Loan Management Ltd. | | | | | | | | |
2014-2014, 2.79% due 07/28/255,6 | | | 1,250,000 | | | | 1,249,952 | |
2014-1A, 3.11% due 09/20/225,6 | | | 1,000,000 | | | | 1,001,393 | |
Northwoods Capital X Ltd. | | | | | | | | |
2013-10A, 2.67% due 11/04/255,6 | | | 2,250,000 | | | | 2,239,908 | |
Cent CLO Ltd. | | | | | | | | |
2014-20A, 2.19% due 01/25/265,6 | | | 2,100,000 | | | | 2,099,257 | |
Vibrant CLO Limited | | | | | | | | |
2015-1A, 2.78% due 07/17/245,6 | | | 2,000,000 | | | | 2,006,612 | |
Dryden XXIV Senior Loan Fund | | | | | | | | |
2015-24RA, 3.52% due 11/15/235,6 | | | 2,000,000 | | | | 2,005,049 | |
KKR CLO Trust | | | | | | | | |
2012-1A, 3.05% due 12/15/245,6 | | | 2,000,000 | | | | 2,000,619 | |
Carlyle Global Market Strategies CLO Ltd. | | | | | | | | |
2013-4A, 2.15% due 10/15/255,6 | | | 2,000,000 | | | | 1,998,235 | |
Venture XI CLO Ltd. | | | | | | | | |
2015-11A, 2.77% due 11/14/225,6 | | | 2,000,000 | | | | 1,996,323 | |
Marea CLO Ltd. | | | | | | | | |
2015-1A, 3.43% due 10/15/235,6 | | | 1,000,000 | | | | 999,955 | |
2015-1A, 2.48% due 10/15/235,6 | | | 1,000,000 | | | | 995,536 | |
Fortress Credit Funding V, LP | | | | | | | | |
2015-5A, 3.47% due 08/15/225,6 | | | 2,000,000 | | | | 1,990,665 | |
Steele Creek CLO Ltd. | | | | | | | | |
2014-1A, 3.06% due 08/21/265,6 | | | 2,000,000 | | | | 1,990,000 | |
Cereberus ICQ Levered LLC | | | | | | | | |
2015-1A, 2.73% due 11/06/255,6 | | | 2,000,000 | | | | 1,981,617 | |
FS Senior Funding Ltd. | | | | | | | | |
2015-1A, 3.32% due 05/28/255,6 | | | 2,000,000 | | | | 1,974,454 | |
Fortress Credit Opportunities V CLO Ltd. | | | | | | | | |
2014-5A, 3.31% due 10/15/265,6 | | | 1,000,000 | | | | 992,558 | |
2014-5A, 4.21% due 10/15/265,6 | | | 1,000,000 | | | | 961,204 | |
Airlie CLO Ltd. | | | | | | | | |
2006-2A, 2.15% due 12/20/205,6 | | | 2,000,000 | | | | 1,905,755 | |
West CLO Ltd. | | | | | | | | |
2012-1A, 3.16% due 10/30/235,6 | | | 1,800,000 | | | | 1,802,912 | |
Battalion CLO VII Ltd. | | | | | | | | |
2014-7A, 2.28% due 10/17/265,6 | | | 1,500,000 | | | | 1,502,466 | |
OFSI Fund V Ltd. | | | | | | | | |
2013-5A, 3.88% due 04/17/255,6 | | | 1,500,000 | | | | 1,499,954 | |
Tuolumne Grove CLO Ltd. | | | | | | | | |
2014-1A, 2.81% due 04/25/265,6 | | | 1,500,000 | | | | 1,497,864 | |
Flagship CLO VI | | | | | | | | |
2007-1A, 3.25% due 06/10/215,6 | | | 1,500,000 | | | | 1,457,106 | |
Shackleton I CLO Ltd. | | | | | | | | |
2012-1A, 2.35% due 08/14/235,6 | | | 1,400,000 | | | | 1,402,305 | |
Dryden 37 Senior Loan Fund | | | | | | | | |
2015-37A, 0.00% due 04/15/276,7 | | | 1,500,000 | | | | 1,338,489 | |
Dryden 30 Senior Loan Fund | | | | | | | | |
2013-30A, 3.67% due 11/15/255,6 | | | 1,330,000 | | | | 1,330,053 | |
Venture VII CDO Ltd. | | | | | | | | |
2006-7A, 0.93% due 01/20/225,6 | | | 1,296,386 | | | | 1,285,726 | |
Atlas Senior Loan Fund VI Ltd. | | | | | | | | |
2014-6A, 3.08% due 10/15/265,6 | | | 1,272,000 | | | | 1,271,945 | |
Cerberus Onshore II CLO LLC | | | | | | | | |
2014-1A, 2.98% due 10/15/235,6 | | | 500,000 | | | | 500,256 | |
2014-1A, 2.68% due 10/15/235,6 | | | 377,974 | | | | 377,740 | |
2014-1A, 3.38% due 10/15/235,6 | | | 250,000 | | | | 249,708 | |
Symphony CLO IX, LP | | | | | | | | |
2012-9A, 4.93% due 04/16/225,6 | | | 600,000 | | | | 600,729 | |
2012-9A, 3.93% due 04/16/225,6 | | | 500,000 | | | | 500,612 | |
Kingsland V Ltd. | | | | | | | | |
2007-5A, 1.47% due 07/14/215,6 | | | 1,070,000 | | | | 1,031,945 | |
Ares XXIII CLO Ltd. | | | | | | | | |
2014-1A, 3.89% due 04/19/235,6 | | | 1,000,000 | | | | 1,018,340 | |
Anchorage Capital CLO 4 Ltd. | | | | | | | | |
2014-4A, 2.90% due 07/28/265,6 | | | 1,000,000 | | | | 1,008,197 | |
Adirondack Park CLO Ltd. | | | | | | | | |
2013-1A, 3.68% due 04/15/245,6 | | | 1,000,000 | | | | 1,000,796 | |
Cent CLO | | | | | | | | |
2014-16A, 3.01% due 08/01/245,6 | | | 500,000 | | | | 500,057 | |
2014-16A, 3.96% due 08/01/245,6 | | | 500,000 | | | | 500,034 | |
Madison Park Funding VIII Ltd. | | | | | | | | |
2014-8A, 3.50% due 04/22/225,6 | | | 500,000 | | | | 500,037 | |
2014-8A, 2.90% due 04/22/225,6 | | | 500,000 | | | | 499,999 | |
Oaktree EIF II Series Ltd. | | | | | | | | |
2014-A2, 3.12% due 11/15/255,6 | | | 1,000,000 | | | | 1,000,018 | |
Symphony CLO X Ltd. | | | | | | | | |
2015-10A, 3.56% due 07/23/235,6 | | | 1,000,000 | | | | 1,000,001 | |
OZLM Funding Ltd. | | | | | | | | |
2012-2A, 4.01% due 10/30/235,6 | | | 1,000,000 | | | | 1,000,000 | |
ACAS CLO Ltd. | | | | | | | | |
2014-1A, 3.18% due 09/20/235,6 | | | 1,000,000 | | | | 999,997 | |
Regatta V Funding Ltd. | | | | | | | | |
2014-1A, 2.27% due 10/25/265,6 | | | 1,000,000 | | | | 999,931 | |
Black Diamond CLO Delaware Corp. | | | | | | | | |
2005-2A, 2.46% due 01/07/185,6 | | | 1,000,000 | | | | 998,983 | |
Shackleton II CLO Ltd. | | | | | | | | |
2012-2A, 4.75% due 10/20/235,6 | | | 1,000,000 | | | | 996,803 | |
Benefit Street Partners CLO Ltd. | | | | | | | | |
2015-IA, 3.78% due 10/15/255,6 | | | 1,000,000 | | | | 996,458 | |
Newstar Commercial Loan Funding LLC | | | | | | | | |
2016-1A, 4.58% due 02/25/285,6 | | | 1,000,000 | | | | 995,341 | |
CFIP CLO Ltd. | | | | | | | | |
2014-1A, 2.14% due 04/13/255,6 | | | 1,000,000 | | | | 995,183 | |
Fortress Credit Investments IV Ltd. | | | | | | | | |
2015-4A, 2.58% due 07/17/235,6 | | | 1,000,000 | | | | 994,227 | |
Fortress Credit Opportunities III CLO, LP | | | | | | | | |
2014-3A, 3.16% due 04/28/265,6 | | | 1,000,000 | | | | 992,451 | |
San Gabriel CLO Ltd. | | | | | | | | |
2007-1A, 3.10% due 09/10/215,6 | | | 1,000,000 | | | | 989,778 | |
Battalion CLO Ltd. | | | | | | | | |
2007-1A, 2.82% due 07/14/225,6 | | | 1,000,000 | | | | 985,961 | |
Duane Street CLO IV Ltd. | | | | | | | | |
2007-4A, 3.07% due 11/14/215,6 | | | 1,000,000 | | | | 983,681 | |
Rockwall CDO Ltd. | | | | | | | | |
2007-1A, 1.31% due 08/01/245,6 | | | 1,000,000 | | | | 975,736 | |
SEE NOTES TO FINANCIAL STATEMENTS. | THE GUGGENHEIM FUNDS ANNUAL REPORT | 63 |
SCHEDULE OF INVESTMENTS (continued) | September 30, 2016 |
LIMITED DURATION FUND | |
| | | Face
Amount | | | Value | |
| | | | | | | |
Ivy Hill Middle Market Credit Fund VII Ltd. | | | | | | |
2013-7A, 3.00% due 10/20/255,6 | | $ | 1,000,000 | | | $ | 973,022 | |
Madison Park Funding V Ltd. | | | | | | | | |
2007-5A, 2.28% due 02/26/215,6 | | | 1,000,000 | | | | 960,756 | |
Treman Park CLO Ltd. | | | | | | | | |
2015-1A, due 04/20/276,7 | | | 1,000,000 | | | | 895,054 | |
OHA Credit Partners IX Ltd. | | | | | | | | |
2013-9A, due 10/20/256,7 | | | 1,000,000 | | | | 875,411 | |
KVK CLO Ltd. | | | | | | | | |
2014-2A, 3.68% due 07/15/265,6 | | | 500,000 | | | | 489,482 | |
2013-1A, due 04/14/256,7 | | | 750,000 | | | | 273,215 | |
Race Point V CLO Ltd. | | | | | | | | |
2014-5A, 4.60% due 12/15/225,6 | | | 750,000 | | | | 749,673 | |
Madison Park Funding III Ltd. | | | | | | | | |
2006-3A, 2.13% due 10/25/205,6 | | | 750,000 | | | | 723,918 | |
Gramercy Park CLO Ltd. | | | | | | | | |
2014-1A, 3.63% due 07/17/235,6 | | | 700,000 | | | | 698,129 | |
Benefit Street Partners CLO V Ltd. | | | | | | | | |
2014-VA, 2.30% due 10/20/265,6 | | | 500,000 | | | | 500,844 | |
BlueMountain CLO Ltd. | | | | | | | | |
2012-2A, 3.56% due 11/20/245,6 | | | 500,000 | | | | 500,519 | |
NZCG Funding Ltd. | | | | | | | | |
2015-2A, 3.08% due 04/27/275,6 | | | 500,000 | | | | 500,242 | |
Gallatin CLO VII Ltd. | | | | | | | | |
2014-1A, 3.58% due 07/15/235,6 | | | 500,000 | �� | | | 500,039 | |
Figueroa CLO Ltd. | | | | | | | | |
2013-1A, 3.56% due 03/21/245,6 | | | 500,000 | | | | 500,005 | |
Halcyon Loan Advisors Funding Ltd. | | | | | | | | |
2012-1A, 3.82% due 08/15/235,6 | | | 500,000 | | | | 500,005 | |
LCM X, LP | | | | | | | | |
2014-10A, 3.53% due 04/15/225,6 | | | 500,000 | | | | 499,994 | |
Telos CLO Ltd. | | | | | | | | |
2013-4A, 3.43% due 07/17/245,6 | | | 500,000 | | | | 499,993 | |
ALM VII Ltd. | | | | | | | | |
2013-7R2A, 3.31% due 04/24/245,6 | | | 500,000 | | | | 496,565 | |
COA Summit CLO Limited | | | | | | | | |
2014-1A, 4.55% due 04/20/235,6 | | | 500,000 | | | | 492,678 | |
ALM XIV Ltd. | | | | | | | | |
2014-14A, 4.19% due 07/28/265,6 | | | 500,000 | | | | 487,578 | |
WhiteHorse IV Ltd. | | | | | | | | |
2007-4A, 2.13% due 01/17/205,6 | | | 500,000 | | | | 486,327 | |
Shasta CLO Ltd. | | | | | | | | |
2007-1A, 2.10% due 04/20/215,6 | | | 500,000 | | | | 485,297 | |
NewStar Arlington Senior Loan Program LLC | | | | | | | | |
2014-1A, 4.01% due 07/25/255,6 | | | 250,000 | | | | 242,331 | |
2014-1A, 4.96% due 07/25/255,6 | | | 250,000 | | | | 230,510 | |
Keuka Park CLO Ltd. | | | | | | | | |
2013-1A, due 10/21/246,7 | | | 500,000 | | | | 239,217 | |
Kingsland IV Ltd. | | | | | | | | |
2007-4A, 2.13% due 04/16/215,6 | | | 250,000 | | | | 234,550 | |
Neuberger Berman CLO Ltd. | | | | | | | | |
2012-12A, due 07/25/236,7 | | | 350,000 | | | | 168,920 | |
Copper River CLO Ltd. | | | | | | | | |
2007-1A, due 01/20/214,7 | | | 500,000 | | | | 111,143 | |
Total Collateralized Loan Obligations | | | | | | | 239,190,640 | |
| | | | | | | | | |
Transport-Aircraft - 2.9% | |
Castlelake Aircraft Securitization Trust | | | | | | | | |
2015-1A, 4.70% due 12/15/406 | | | 5,488,055 | | | | 5,433,173 | |
2014-1, 5.25% due 02/15/296 | | | 229,623 | | | | 227,327 | |
2014-1, 7.50% due 02/15/296 | | | 228,050 | | | | 226,339 | |
Apollo Aviation Securitization Equity Trust | | | | | | | | |
2016-1A, 4.88% due 03/17/366 | | | 4,275,000 | | | | 4,221,562 | |
2014-1, 5.13% due 12/15/29 | | | 1,081,731 | | | | 1,053,065 | |
2014-1, 7.50% due 12/15/295 | | | 432,692 | | | | 429,447 | |
ECAF I Ltd. | | | | | | | | |
2015-1A, 3.47% due 06/15/406 | | | 1,662,651 | | | | 1,655,962 | |
2015-1A, 5.80% due 06/15/406 | | | 926,702 | | | | 908,168 | |
Harbour Aircraft Investments Ltd. | | | | | | | | |
2016-1A, 4.70% due 07/15/41 | | | 1,957,000 | | | | 1,963,386 | |
AIM Aviation Finance Ltd. | | | | | | | | |
2015-1A, 4.21% due 02/15/406 | | | 1,773,810 | | | | 1,784,549 | |
Diamond Head Aviation Ltd. | | | | | | | | |
2015-1, 3.81% due 07/14/286 | | | 1,571,866 | | | | 1,573,871 | |
Atlas Ltd. | | | | | | | | |
2014-1 A, 4.88% due 12/15/39 | | | 890,600 | | | | 881,694 | |
Rise Ltd. | | | | | | | | |
2014-1, 4.75% due 02/12/39 | | | 419,271 | | | | 414,240 | |
AABS Ltd. | | | | | | | | |
2013-1, 4.88% due 01/15/38 | | | 281,017 | | | | 279,331 | |
Total Transport-Aircraft | | | | | | | 21,052,114 | |
| | | | | | | | | |
Collateralized Debt Obligations - 2.6% | |
FDF II Ltd. | | | | | | | | |
2016-2A, 4.29% due 05/12/316 | | | 4,000,000 | | | | 4,073,847 | |
Triaxx Prime CDO Ltd. | | | | | | | | |
2006-2A, 0.79% due 10/02/395,6 | | | 3,846,438 | | | | 3,663,334 | |
FDF I Ltd. | | | | | | | | |
2015-1A, 4.40% due 11/12/306 | | | 3,000,000 | | | | 3,152,275 | |
Putnam Structured Product Funding Ltd. | | | | | | | | |
2003-1A, 1.52% due 10/15/385,6 | | | 3,000,000 | | | | 2,585,043 | |
Gramercy Real Estate CDO Ltd. | | | | | | | | |
2006-1A, 1.08% due 07/25/415,6 | | | 1,604,958 | | | | 1,585,113 | |
2007-1A, 1.10% due 08/15/565,6 | | | 391,391 | | | | 369,535 | |
Anchorage Credit Funding 3 Ltd. | | | | | | | | |
2016-3A, 3.85% due 10/28/33†††,6 | | | 1,500,000 | | | | 1,521,134 | |
SRERS Funding Ltd. | | | | | | | | |
2011-RS, 0.76% due 05/09/465,6 | | | 1,145,427 | | | | 1,116,754 | |
Wrightwood Capital Real Estate CDO Ltd. | | | | | | | | |
2005-1A, 1.24% due 11/21/405,6 | | | 700,000 | | | | 673,548 | |
Helios Series I Multi Asset CBO Ltd. | | | | | | | | |
2001-1A, 1.79% due 12/13/365,6 | | | 17,552 | | | | 17,451 | |
Total Collateralized Debt Obligations | | | | | | | 18,758,034 | |
| | | | | | | | | |
Whole Business - 1.4% | |
Taco Bell Funding LLC | | | | | | | | |
2016-1A, 4.97% due 05/25/466 | | | 3,500,000 | | | | 3,624,719 | |
2016-1A, 4.38% due 05/25/466 | | | 1,800,000 | | | | 1,865,234 | |
Sonic Capital LLC | | | | | | | | |
2016-1A, 4.47% due 05/20/466 | | | 1,993,333 | | | | 2,043,830 | |
Drug Royalty III Limited Partnership 1 | | | | | | | | |
2016-1A, 3.98% due 04/15/276 | | | 1,945,061 | | | | 1,936,955 | |
64 | THE GUGGENHEIM FUNDS ANNUAL REPORT | SEE NOTES TO FINANCIAL STATEMENTS. |
SCHEDULE OF INVESTMENTS (continued) | September 30, 2016 |
LIMITED DURATION FUND | |
| | | Face
Amount | | | Value | |
| | | | | | | |
Miramax LLC | | | | | | |
2014-1A, 3.34% due 07/20/266 | | $ | 666,800 | | | $ | 668,506 | |
Total Whole Business | | | | | | | 10,139,244 | |
| | | | | | | | | |
Transport-Container - 0.8% | |
Global SC Finance II SRL | | | | | | | | |
2013-1A, 2.98% due 04/17/286 | | | 5,595,833 | | | | 5,414,850 | |
| | | | | | | | | |
Net Lease - 0.7% | |
STORE Master Funding LLC | | | | | | | | |
2012-1A, 5.77% due 08/20/426 | | | 3,760,075 | | | | 3,807,984 | |
2013-1A, 4.16% due 03/20/436 | | | 942,635 | | | | 933,749 | |
Total Net Lease | | | | | | | 4,741,733 | |
| | | | | | | | | |
Insurance - 0.1% | |
Chesterfield Financial Holdings LLC | | | | | | | | |
2014-1A, 4.50% due 12/15/346 | | | 624,750 | | | | 624,966 | |
| | | | | | | | | |
Financial - 0.0% | |
CCR Incorporated MT100 Payment Rights Master Trust | | | | | | | | |
2010-CX, 0.96% due 07/10/175 | | | 329,022 | | | | 326,952 | |
Total Asset-Backed Securities | | | | | | | | |
(Cost $299,226,029) | | | | | | | 300,248,533 | |
| | | | | | | | | |
COLLATERALIZED MORTGAGE OBLIGATIONS†† - 29.0% | |
Residential Mortgage Backed Securities - 22.6% | |
LSTAR Securities Investment Trust | | | | | | | | |
2015-1, 2.53% due 01/01/205,6 | | | 8,524,401 | | | | 8,511,614 | |
2015-4, 2.52% due 04/01/205,6 | | | 6,290,173 | | | | 6,211,546 | |
2016-2, 2.53% due 03/01/215,6 | | | 5,751,705 | | | | 5,619,416 | |
2015-6, 2.53% due 05/01/205,6 | | | 5,698,898 | | | | 5,592,044 | |
2015-10, 2.52% due 11/01/205,6 | | | 4,634,397 | | | | 4,553,295 | |
2015-2, 2.52% due 01/01/205,6 | | | 4,509,543 | | | | 4,447,024 | |
2015-3, 2.53% due 03/01/205,6 | | | 3,954,059 | | | | 3,902,102 | |
2015-5, 2.53% due 04/01/205,6 | | | 3,029,477 | | | | 2,984,035 | |
Nationstar HECM Loan Trust | | | | | | | | |
2016-1A, 2.98% due 02/25/266 | | | 7,946,715 | | | | 7,940,913 | |
2015-2A, 2.88% due 11/25/256 | | | 2,368,012 | | | | 2,369,196 | |
2016-3A, 2.01% due 08/25/26†††,6 | | | 948,507 | | | | 954,102 | |
Countrywide Asset-Backed Certificates | | | | | | | | |
2006-6, 0.70% due 09/25/365 | | | 7,096,058 | | | | 6,591,465 | |
2006-5, 0.82% due 08/25/365 | | | 3,591,607 | | | | 3,340,711 | |
VOLT L LLC | | | | | | | | |
2016-NP10, 3.50% due 09/25/466,8 | | | 7,200,000 | | | | 7,200,000 | |
Bayview Opportunity Master Fund IIIa Trust | | | | | | | | |
2016-RN3, 3.60% due 09/28/316,8 | | | 7,100,000 | | | | 7,097,974 | |
CSMC Series | | | | | | | | |
2015-12R, 1.02% due 11/30/375,6 | | | 6,800,000 | | | | 6,390,265 | |
2014-2R, 0.72% due 02/27/465,6 | | | 421,930 | | | | 394,727 | |
CWABS Incorporated Asset-Backed Certificates Trust | | | | | | | | |
2004-4, 1.25% due 07/25/345 | | | 6,845,668 | | | | 6,505,754 | |
GSMSC Resecuritization Trust | | | | | | | | |
2015-5R, 0.66% due 02/26/375,6 | | | 3,388,029 | | | | 3,008,459 | |
2015-7R, 0.67% due 09/26/375,6 | | | 3,263,860 | | | | 2,977,750 | |
Banc of America Funding Trust | | | | | | | | |
2015-R4, 0.70% due 01/27/355,6 | | | 5,618,164 | | | | 5,238,369 | |
VOLT XLI LLC | | | | | | | | |
2016-NPL1, 4.25% due 02/26/466,8 | | | 5,025,219 | | | | 5,070,784 | |
LSTAR Securities Investment Ltd. | | | | | | | | |
2016-3, 2.53% due 09/01/215,6 | | | 5,100,000 | | | | 5,034,579 | |
VOLT XXXIX LLC | | | | | | | | |
2015-NP13, 4.13% due 10/25/456,8 | | | 4,466,408 | | | | 4,501,976 | |
Banc of America Funding Ltd. | | | | | | | | |
2013-R1, 0.71% due 11/03/415,6 | | | 4,499,874 | | | | 4,099,633 | |
GCAT LLC | | | | | | | | |
2015-1, 3.63% due 05/26/206,8 | | | 3,664,136 | | | | 3,669,769 | |
VOLT XL LLC | | | | | | | | |
2015-NP14, 4.38% due 11/27/456,8 | | | 3,528,249 | | | | 3,561,892 | |
VOLT XLVIII LLC | | | | | | | | |
2016-NPL8, 3.50% due 07/25/466 | | | 3,480,428 | | | | 3,482,719 | |
NRPL Trust | | | | | | | | |
2014-2A, 3.75% due 10/25/575,6 | | | 1,674,686 | | | | 1,667,986 | |
2015-1A, 3.88% due 11/01/546 | | | 1,526,171 | | | | 1,515,755 | |
VOLT XXXVI LLC | | | | | | | | |
2015-NP10, 3.63% due 07/25/456,8 | | | 2,711,395 | | | | 2,715,698 | |
VOLT XXXIII LLC | | | | | | | | |
2015-NPL5, 3.50% due 03/25/556 | | | 2,270,456 | | | | 2,271,693 | |
First Franklin Mortgage Loan Trust | | | | | | | | |
2004-FF10, 1.80% due 07/25/345 | | | 2,186,547 | | | | 2,114,729 | |
Oak Hill Advisors Residential Loan Trust | | | | | | | | |
2015-NPL2, 3.72% due 07/25/556 | | | 1,876,171 | | | | 1,860,091 | |
Nomura Resecuritization Trust | | | | | | | | |
2015-4R, 1.31% due 03/26/365,6 | | | 1,709,371 | | | | 1,620,825 | |
2012-1R, 0.96% due 08/27/475,6 | | | 196,939 | | | | 194,241 | |
CIT Mortgage Loan Trust | | | | | | | | |
2007-1, 1.98% due 10/25/375,6 | | | 1,734,938 | | | | 1,699,633 | |
AJAX Mortgage Loan Trust | | | | | | | | |
2015-A, 3.88% due 11/25/546 | | | 1,691,894 | | | | 1,686,890 | |
VOLT XXVII LLC | | | | | | | | |
2014-NPL7, 3.38% due 08/27/576 | | | 1,618,931 | | | | 1,617,812 | |
Structured Asset Investment Loan Trust | | | | | | | | |
2005-2, 1.26% due 03/25/355 | | | 1,000,000 | | | | 950,330 | |
2005-1, 1.25% due 02/25/355,6 | | | 543,415 | | | | 523,757 | |
VOLT XXXIV LLC | | | | | | | | |
2015-NPL7, 3.25% due 02/25/556,8 | | | 1,419,947 | | | | 1,415,638 | |
Morgan Stanley ABS Capital I Incorporated Trust | | | | | | | | |
2006-NC1, 0.91% due 12/25/355 | | | 1,500,000 | | | | 1,344,718 | |
Vericrest Opportunity Loan Trust | | | | | | | | |
2015-NPL3, 3.38% due 10/25/586 | | | 1,323,513 | | | | 1,320,880 | |
VOLT XLII LLC | | | | | | | | |
2016-NPL2, 4.25% due 03/26/466 | | | 1,194,119 | | | | 1,208,873 | |
BCAP LLC | | | | | | | | |
2014-RR3, 0.66% due 10/26/365,6 | | | 1,160,971 | | | | 1,134,036 | |
Encore Credit Receivables Trust | | | | | | | | |
2005-4, 0.97% due 01/25/365 | | | 1,077,390 | | | | 1,026,689 | |
Ocwen Master Advance Receivables Trust | | | | | | | | |
2015-T3, 3.21% due 11/15/476 | | | 1,000,000 | | | | 982,326 | |
UCFC Manufactured Housing Contract | | | | | | | | |
1997-2, 7.38% due 10/15/28 | | | 572,408 | | | | 589,145 | |
SEE NOTES TO FINANCIAL STATEMENTS. | THE GUGGENHEIM FUNDS ANNUAL REPORT | 65 |
SCHEDULE OF INVESTMENTS (continued) | September 30, 2016 |
LIMITED DURATION FUND | |
| | | Face
Amount | | | Value | |
| | | | | | | |
First Frankin Mortgage Loan Trust | | | | | | |
2006-FF4, 0.71% due 03/25/365 | | $ | 596,636 | | | $ | 563,042 | |
Structured Asset Securities Corporation Mortgage Loan Trust | | | | | | | | |
2007-BC1, 0.66% due 02/25/375 | | | 573,969 | | | | 497,159 | |
GSAMP Trust | | | | | | | | |
2005-HE6, 0.97% due 11/25/355 | | | 450,000 | | | | 442,027 | |
GreenPoint Mortgage Funding Trust | | | | | | | | |
2005-HE4, 1.00% due 07/25/305 | | | 415,882 | | | | 406,222 | |
2007-AR1, 0.61% due 02/25/475 | | | 13,573 | | | | 13,458 | |
Accredited Mortgage Loan Trust | | | | | | | | |
2007-1, 0.66% due 02/25/375 | | | 267,135 | | | | 257,432 | |
Soundview Home Loan Trust | | | | | | | | |
2003-1, 3.90% due 08/25/315 | | | 159,602 | | | | 156,221 | |
Morgan Stanley Re-REMIC Trust | | | | | | | | |
2010-R5, 1.12% due 06/26/365,6 | | | 197,232 | | | | 142,871 | |
Total Residential Mortgage Backed Securities | | | | | | | 163,192,290 | |
| | | | | | | | | |
Commercial Mortgage Backed Securities - 6.4% | |
GS Mortgage Securities Corporation Trust | | | | | | | | |
2016-ICE2, 3.77% due 02/15/335,6 | | | 6,400,000 | | | | 6,465,052 | |
Hilton USA Trust | | | | | | | | |
2013-HLT, 5.61% due 11/05/305,6 | | | 1,800,000 | | | | 1,802,778 | |
2013-HLF, 4.27% due 11/05/305,6 | | | 1,541,414 | | | | 1,542,165 | |
2013-HLF, 3.27% due 11/05/305,6 | | | 1,360,072 | | | | 1,360,070 | |
Wells Fargo Commercial Mortgage Trust | | | | | | | | |
2016-C32, 1.52% due 01/15/595 | | | 23,246,968 | | | | 2,120,867 | |
2015-LC22, 1.07% due 09/15/585 | | | 24,766,044 | | | | 1,458,133 | |
2016-NXS5, 1.74% due 01/15/595 | | | 6,966,480 | | | | 685,677 | |
Americold 2010 LLC Trust | | | | | | | | |
2010-ARTA, 6.81% due 01/14/296 | | | 2,605,000 | | | | 2,928,766 | |
Freddie Mac Multifamily Structured Pass Through Certificates | | | | | | | | |
2013-K035, 0.43% due 08/25/235 | | | 112,413,789 | | | | 2,711,511 | |
JP Morgan Chase Commercial Mortgage Securities Trust | | | | | | | | |
2015-CSMO, 3.82% due 01/15/325,6 | | | 1,500,000 | | | | 1,495,979 | |
2014-FL5, 2.62% due 07/15/315,6 | | | 1,000,000 | | | | 984,052 | |
Banc of America Commercial Mortgage Trust | | | | | | | | |
2016-UB10, 2.17% due 06/15/495 | | | 19,464,624 | | | | 2,478,436 | |
Morgan Stanley Bank of America Merrill Lynch Trust | | | | | | | | |
2015-C27, 1.20% due 12/15/475 | | | 31,685,458 | | | | 2,126,192 | |
GAHR Commercial Mortgage Trust | | | | | | | | |
2015-NRF, 1.82% due 12/15/165,6 | | | 1,981,671 | | | | 1,986,598 | |
Hyatt Hotel Portfolio Trust | | | | | | | | |
2015-HYT, 3.57% due 11/15/295,6 | | | 1,900,000 | | | | 1,890,431 | |
BXHTL Mortgage Trust | | | | | | | | |
2015-JWRZ, 3.38% due 05/15/295,6 | | | 1,775,000 | | | | 1,748,295 | |
JPMBB Commercial Mortgage Securities Trust | | | | | | | | |
2013-C17, 1.19% due 01/15/475 | | | 33,987,566 | | | | 1,650,494 | |
Motel 6 Trust 2015-MTL | | | | | | | | |
2015-MTL6, 3.30% due 02/05/306 | | | 1,600,000 | | | | 1,603,745 | |
Citigroup Commercial Mortgage Trust | | | | | | | | |
2016-C2, 1.95% due 08/10/495 | | | 6,796,907 | | | | 906,067 | |
2016-GC37, 1.97% due 04/10/495 | | | 3,841,117 | | | | 495,901 | |
BHMS Mortgage Trust | | | | | | | | |
2014-ATLS, 2.02% due 07/05/335,6 | | | 1,300,000 | | | | 1,296,139 | |
CSAIL Commercial Mortgage Trust | | | | | | | | |
2016-C6, 1.98% due 01/15/495 | | | 9,988,850 | | | | 1,197,089 | |
Motel 6 Trust | | | | | | | | |
2015-MTL6, 5.28% due 02/05/306 | | | 1,000,000 | | | | 1,002,351 | |
Morgan Stanley Capital I Trust | | | | | | | | |
2015-XLF1, 2.73% due 08/13/195,6 | | | 1,000,000 | | | | 995,694 | |
CDGJ Commercial Mortgage Trust | | | | | | | | |
2014-BXCH, 3.02% due 12/15/275,6 | | | 1,000,000 | | | | 986,648 | |
JPMDB Commercial Mortgage Securities Trust | | | | | | | | |
2016-C2, 1.87% due 06/15/495 | | | 8,935,988 | | | | 967,699 | |
CD Mortgage Trust | | | | | | | | |
2016-CD1, 1.58% due 08/10/495 | | | 7,096,243 | | | | 747,425 | |
Total Commercial Mortgage Backed Securities | | | | | | | 45,634,254 | |
| | | | | | | | | |
Total Collateralized Mortgage Obligations | | | | | | | | |
(Cost $207,557,672) | | | | | | | 208,826,544 | |
| | | | | | | | | |
CORPORATE BONDS†† - 13.2% | |
Financial - 4.8% | |
Citigroup, Inc. | | | | | | | | |
6.25%5,9 | | | 3,800,000 | | | | 4,089,749 | |
5.88%5,9 | | | 1,995,000 | | | | 2,015,150 | |
5.95%5,9 | | | 995,000 | | | | 1,013,755 | |
Bank of Nova Scotia | | | | | | | | |
1.52% due 06/14/195 | | | 6,750,000 | | | | 6,772,450 | |
Santander UK plc | | | | | | | | |
2.34% due 03/14/195 | | | 5,700,000 | | | | 5,796,074 | |
Danske Bank A/S | | | | | | | | |
1.42% due 09/06/195,6 | | | 5,600,000 | | | | 5,594,960 | |
Berkshire Hathaway Finance Corp. | | | | | | | | |
1.54% due 03/15/195 | | | 2,600,000 | | | | 2,635,082 | |
American Equity Investment Life Holding Co. | | | | | | | | |
6.63% due 07/15/21 | | | 1,300,000 | | | | 1,355,088 | |
Bank of America Corp. | | | | | | | | |
6.30%5,9 | | | 1,200,000 | | | | 1,303,500 | |
Montpelier Re Holdings Ltd. | | | | | | | | |
4.70% due 10/15/22 | | | 1,000,000 | | | | 1,033,790 | |
H2 Asset Funding Ltd. | | | | | | | | |
2.43% due 03/19/37 | | | 1,000,000 | | | | 995,697 | |
Citizens Financial Group, Inc. | | | | | | | | |
5.50%5,9 | | | 1,000,000 | | | | 980,000 | |
Fifth Third Bancorp | | | | | | | | |
4.90% due 12/31/495,9 | | | 1,000,000 | | | | 969,000 | |
Total Financial | | | | | | | 34,554,295 | |
| | | | | | | | | |
Consumer, Non-cyclical - 3.5% | |
UnitedHealth Group, Inc. | | | | | | | | |
1.45% due 07/17/17 | | | 6,500,000 | | | | 6,515,495 | |
Kraft Heinz Foods Co. | | | | | | | | |
2.25% due 06/05/17 | | | 5,700,000 | | | | 5,735,585 | |
Tenet Healthcare Corp. | | | | | | | | |
4.35% due 06/15/205 | | | 2,700,000 | | | | 2,713,770 | |
6.25% due 11/01/18 | | | 975,000 | | | | 1,040,813 | |
66 | THE GUGGENHEIM FUNDS ANNUAL REPORT | SEE NOTES TO FINANCIAL STATEMENTS. |
SCHEDULE OF INVESTMENTS (continued) | September 30, 2016 |
LIMITED DURATION FUND | |
| | | Face
Amount | | | Value | |
| | | | | | | |
Aetna, Inc. | | | | | | |
1.49% due 12/08/175 | | $ | 3,000,000 | | | $ | 3,007,107 | |
Vector Group Ltd. | | | | | | | | |
7.75% due 02/15/21 | | | 2,374,000 | | | | 2,503,858 | |
Bumble Bee Holdings, Inc. | | | | | | | | |
9.00% due 12/15/176 | | | 2,016,000 | | | | 2,026,080 | |
Central Garden & Pet Co. | | | | | | | | |
6.13% due 11/15/23 | | | 1,440,000 | | | | 1,540,800 | |
Total Consumer, Non-cyclical | | | | | | | 25,083,508 | |
| | | | | | | | | |
Commercial Mortgage Backed Securities - 1.3% | |
Station Place Securitization Trust | | | | | | | | |
1.53% due 02/25/17†††,5 | | | 9,600,000 | | | | 9,595,293 | |
| | | | | | | | | |
Communications - 0.9% | |
Sprint Communications, Inc. | | | | | | | | |
9.00% due 11/15/186 | | | 3,043,000 | | | | 3,358,711 | |
CSC Holdings LLC | | | | | | | | |
6.75% due 11/15/21 | | | 2,050,000 | | | | 2,167,875 | |
eBay, Inc. | | | | | | | | |
2.50% due 03/09/18 | | | 1,300,000 | | | | 1,318,385 | |
Total Communications | | | | | | | 6,844,971 | |
| | | | | | | | | |
Basic Materials - 0.9% | |
Newcrest Finance Pty Ltd. | | | | | | | | |
4.45% due 11/15/216 | | | 5,590,000 | | | | 5,911,800 | |
Yamana Gold, Inc. | | | | | | | | |
4.95% due 07/15/24 | | | 750,000 | | | | 774,734 | |
Total Basic Materials | | | | | | | 6,686,534 | |
| | | | | | | | | |
Industrial - 0.8% | |
CNH Industrial Capital LLC | | | | | | | | |
3.88% due 07/16/18 | | | 1,550,000 | | | | 1,577,125 | |
3.63% due 04/15/18 | | | 850,000 | | | | 860,625 | |
Ardagh Packaging Finance plc / Ardagh Holdings USA, Inc. | | | | | | | | |
4.07% due 05/15/215,6 | | | 1,500,000 | | | | 1,522,500 | |
Reynolds Group Issuer Incorporated / Reynolds Group Issuer LLC / Reynolds Group Issuer Lu | | | | | | | | |
4.13% due 07/15/215,6 | | | 1,100,000 | | | | 1,116,500 | |
Dynagas LNG Partners Limited Partnership / Dynagas Finance, Inc. | | | | | | | | |
6.25% due 10/30/191 | | | 600,000 | | | | 556,500 | |
Total Industrial | | | | | | | 5,633,250 | |
| | | | | | | | | |
Energy - 0.6% | |
TC PipeLines, LP | | | | | | | | |
4.65% due 06/15/21 | | | 1,500,000 | | | | 1,573,810 | |
Equities Corp. | | | | | | | | |
4.88% due 11/15/21 | | | 1,300,000 | | | | 1,423,447 | |
Husky Energy, Inc. | | | | | | | | |
7.25% due 12/15/19 | | | 750,000 | | | | 866,903 | |
Buckeye Partners, LP | | | | | | | | |
4.88% due 02/01/21 | | | 500,000 | | | | 538,668 | |
Schahin II Finance Company SPV Ltd. | | | | | | | | |
5.88% due 09/25/224,10 | | | 390,900 | | | | 46,908 | |
Total Energy | | | | | | | 4,449,736 | |
| | | | | | | | | |
Diversified - 0.3% | |
HRG Group, Inc. | | | | | | | | |
7.88% due 07/15/19 | | | 1,740,000 | | | | 1,833,525 | |
| | | | | | | | | |
Utilities - 0.1% | |
AES Corp. | | | | | | | | |
3.84% due 06/01/195 | | | 534,000 | | | | 535,335 | |
Total Corporate Bonds | | | | | | | | |
(Cost $93,970,111) | | | | | | | 95,216,447 | |
| | | | | | | | | |
SENIOR FLOATING RATE INTERESTS†† - 4.3% | |
Consumer, Non-cyclical - 1.1% | |
Albertson’s LLC | | | | | | | | |
4.50% due 08/25/21 | | | 1,891,276 | | | | 1,905,027 | |
4.75% due 12/21/22 | | | 1,243,758 | | | | 1,255,424 | |
DJO Finance LLC | | | | | | | | |
4.25% due 06/08/20 | | | 1,920,151 | | | | 1,884,149 | |
Phillips-Medsize Corp. | | | | | | | | |
4.75% due 06/16/21 | | | 1,147,066 | | | | 1,145,277 | |
American Tire Distributors, Inc. | | | | | | | | |
5.25% due 09/01/21 | | | 689,999 | | | | 680,339 | |
Dole Food Company, Inc. | | | | | | | | |
4.57% due 11/01/18 | | | 497,303 | | | | 498,193 | |
Grocery Outlet, Inc. | | | | | | | | |
5.00% due 10/21/21 | | | 396,975 | | | | 395,982 | |
Total Consumer, Non-cyclical | | | | | | | 7,764,391 | |
| | | | | | | | | |
Consumer, Cyclical - 1.1% | |
Smart & Final Stores LLC | | | | | | | | |
4.30% due 11/15/22 | | | 1,770,796 | | | | 1,770,248 | |
Advantage Sales & Marketing LLC | | | | | | | | |
4.25% due 07/23/21 | | | 1,538,228 | | | | 1,518,046 | |
BJ’s Wholesale Club, Inc. | | | | | | | | |
4.50% due 09/26/19 | | | 1,433,707 | | | | 1,436,245 | |
Petsmart, Inc. | | | | | | | | |
4.25% due 03/11/22 | | | 795,970 | | | | 796,885 | |
Acosta, Inc. | | | | | | | | |
4.25% due 09/26/21 | | | 796,833 | | | | 756,991 | |
National Vision, Inc. | | | | | | | | |
4.00% due 03/12/21 | | | 596,939 | | | | 589,328 | |
NPC International, Inc. | | | | | | | | |
4.75% due 12/28/18 | | | 396,665 | | | | 396,665 | |
Fitness International LLC | | | | | | | | |
6.00% due 07/01/20 | | | 241,006 | | | | 240,644 | |
Equinox Fitness | | | | | | | | |
5.00% due 01/31/20 | | | 174,109 | | | | 175,124 | |
Total Consumer, Cyclical | | | | | | | 7,680,176 | |
| | | | | | | | | |
Industrial - 0.9% | |
Travelport Holdings LLC | | | | | | | | |
5.00% due 09/02/21 | | | 3,640,396 | | | | 3,655,358 | |
Engility Corp. | | | | | | | | |
4.77% due 08/12/20 | | | 1,000,000 | | | | 1,009,170 | |
SEE NOTES TO FINANCIAL STATEMENTS. | THE GUGGENHEIM FUNDS ANNUAL REPORT | 67 |
SCHEDULE OF INVESTMENTS (continued) | September 30, 2016 |
LIMITED DURATION FUND | |
| | | Face
Amount | | | Value | |
| | | | | | | |
Exopack Holdings SA | | | | | | |
4.50% due 05/08/19 | | $ | 621,803 | | | $ | 620,640 | |
Camp International Holding Co. | | | | | | | | |
4.75% due 08/18/23 | | | 600,000 | | | | 598,800 | |
Filtration Group Corp. | | | | | | | | |
4.25% due 11/21/20 | | | 495,178 | | | | 496,911 | |
Dematic S.A. | | | | | | | | |
4.25% due 12/28/19 | | | 243,125 | | | | 242,882 | |
Total Industrial | | | | | | | 6,623,761 | |
| | | | | | | | | |
Communications - 0.6% | |
Cengage Learning Acquisitions, Inc. | | | | | | | | |
5.25% due 06/07/23 | | | 3,250,000 | | | | 3,245,937 | |
T-Mobile US, Inc. | | | | | | | | |
3.50% due 11/09/22 | | | 992,500 | | | | 1,000,083 | |
Total Communications | | | | | | | 4,246,020 | |
| | | | | | | | | |
Technology - 0.3% | |
Epicor Software | | | | | | | | |
4.75% due 06/01/22 | | | 1,118,714 | | | | 1,101,239 | |
Avaya, Inc. | | | | | | | | |
6.25% due 05/29/20 | | | 489,665 | | | | 360,722 | |
Infor (US), Inc. | | | | | | | | |
3.75% due 06/03/20 | | | 293,336 | | | | 291,429 | |
Deltek, Inc. | | | | | | | | |
5.00% due 06/25/22 | | | 290,163 | | | | 290,888 | |
Eze Castle Software, Inc. | | | | | | | | |
4.50% due 04/06/20 | | | 249,375 | | | | 248,335 | |
Sabre, Inc. | | | | | | | | |
4.00% due 02/19/19 | | | 161,718 | | | | 162,291 | |
Total Technology | | | | | | | 2,454,904 | |
| | | | | | | | | |
Basic Materials - 0.2% | |
Chromaflo Technologies | | | | | | | | |
4.50% due 12/02/19 | | | 1,689,950 | | | | 1,687,837 | |
| | | | | | | | | |
Financial - 0.1% | |
USI Holdings Corp. | | | | | | | | |
4.25% due 12/27/19 | | | 366,499 | | | | 366,774 | |
AMWINS Group LLC | | | | | | | | |
4.75% due 09/06/19 | | | 198,969 | | | | 200,026 | |
Magic Newco, LLC | | | | | | | | |
5.00% due 12/12/18 | | | 198,965 | | | | 199,130 | |
Total Financial | | | | | | | 765,930 | |
Total Senior Floating Rate Interests | | | | | | | | |
(Cost $31,151,801) | | | | | | | 31,223,019 | |
| | | | | | | | | |
FOREIGN GOVERNMENT BONDS†† - 0.2% | |
Kenya Government International Bond | | | | | | | | |
6.88% due 06/24/246 | | | 850,000 | | | | 833,000 | |
Corporation Financiera de Desarrollo S.A. | | | | | | | | |
5.25% due 07/15/295,6 | | | 350,000 | | | | 377,125 | |
Total Foreign Government Bonds | | | | | | | | |
(Cost $1,215,022) | | | | | | | 1,210,125 | |
| | | | | | | | | |
COMMERCIAL PAPER†† - 1.6% | |
BAT International Finance plc | | | | | | | | |
0.78% due 10/20/166 | | | 7,000,000 | | | | 6,997,118 | |
General Mills, Inc. | | | | | | | | |
0.60% due 10/07/16 | | | 4,775,000 | | | | 4,774,523 | |
Total Commercial Paper | | | | | | | | |
(Cost $11,771,641) | | | | | | | 11,771,641 | |
| | | | | | | | | |
REPURCHASE AGREEMENTS††,11 - 3.3% | |
Jefferies & Company, Inc. issued 09/12/16 at 3.62% due 10/12/16 | | | 4,996,000 | | | | 4,996,000 | |
Jefferies & Company, Inc. issued 09/15/16 at 3.62% due 10/14/16 | | | 4,068,000 | | | | 4,068,000 | |
Morgan Stanley issued 09/23/16 at 1.15% due 10/24/16 | | | 3,750,000 | | | | 3,750,000 | |
Jefferies & Company, Inc. issued 09/30/16 at 3.62% due 11/01/16 | | | 2,937,000 | | | | 2,937,000 | |
Jefferies & Company, Inc. issued 09/02/16 at 3.62% due 10/04/16 | | | 2,933,000 | | | | 2,933,000 | |
Morgan Stanley issued 09/26/16 at 1.15% due 10/26/16 | | | 2,756,250 | | | | 2,756,250 | |
Jefferies & Company, Inc. issued 09/28/16 at 1.20% due 10/12/16 | | | 2,400,000 | | | | 2,400,000 | |
Total Repurchase Agreements | | | | | | | | |
(Cost $23,840,250) | | | | | | | 23,840,250 | |
| | | | | | | | | |
Total Investments - 97.7% | | | | | | | | |
(Cost $700,519,300) | | | | | | $ | 704,239,710 | |
Other Assets & Liabilities, net - 2.3% | | | | | | | 16,654,598 | |
Total Net Assets - 100.0% | | | | | | $ | 720,894,308 | |
68 | THE GUGGENHEIM FUNDS ANNUAL REPORT | SEE NOTES TO FINANCIAL STATEMENTS. |
SCHEDULE OF INVESTMENTS (continued) | September 30, 2016 |
LIMITED DURATION FUND | |
† | Value determined based on Level 1 inputs — See Note 4. |
†† | Value determined based on Level 2 inputs, unless otherwise noted — See Note 4. |
††† | Value determined based on Level 3 inputs — See Note 4. |
1 | Illiquid security. |
2 | Affiliated issuer — See Note 8. |
3 | Rate indicated is the 7 day yield as of September 30, 2016. |
4 | Security is a 144A or Section 4(a)(2) security. These securities are considered illiquid and restricted under guidelines established by the Board of Trustees. The total market value of 144A or Section 4(a)(2) securities is $4,150,103 (cost $4,944,465), or 0.6% of total net assets — See Note 12. |
5 | Variable rate security. Rate indicated is rate effective at September 30, 2016. |
6 | Security is a 144A or Section 4(a)(2) security. The total market value of 144A or Section 4(a)(2) securities is $483,763,679 (cost $481,245,717), or 67.1% of total net assets. These securities have been determined to be liquid under guidelines established by the Board of Trustees. |
7 | Security has no stated coupon. However, it is expected to receive residual cash flow payments on defined deal dates. |
8 | Security is a step up/step down bond. The coupon increases or decreases at regular intervals until the bond reaches full maturity. |
9 | Perpetual maturity. |
10 | Security is in default of interest and/or principal obligations. |
11 | Repurchase Agreements — See Note 11. |
| | plc — Public Limited Company |
| | |
| | See Sector Classification in Other Information section. |
The following table summarizes the inputs used to value the Fund’s investments at September 30, 2016 (See Note 4 in the Notes to Financial Statements):
Investments in Securities (Assets) | | Level 1 | | | Level 2 | | | Level 3 | | | Total | |
Asset-Backed Securities | | $ | — | | | $ | 298,727,399 | | | $ | 1,521,134 | | | $ | 300,248,533 | |
Collateralized Mortgage Obligations | | | — | | | | 207,872,442 | | | | 954,102 | | | | 208,826,544 | |
Commercial Paper | | | — | | | | 11,771,641 | | | | — | | | | 11,771,641 | |
Corporate Bonds | | | — | | | | 85,621,154 | | | | 9,595,293 | | | | 95,216,447 | |
Foreign Government Bonds | | | — | | | | 1,210,125 | | | | — | | | | 1,210,125 | |
Mutual Funds | | | 18,402,748 | | | | — | | | | — | | | | 18,402,748 | |
Preferred Stocks | | | — | | | | 454,660 | | | | — | | | | 454,660 | |
Repurchase Agreements | | | — | | | | 23,840,250 | | | | — | | | | 23,840,250 | |
Senior Floating Rate Interests | | | — | | | | 31,223,019 | | | | — | | | | 31,223,019 | |
Short-Term Investments | | | 13,045,743 | | | | — | | | | — | | | | 13,045,743 | |
Total | | $ | 31,448,491 | | | $ | 660,720,690 | | | $ | 12,070,529 | | | $ | 704,239,710 | |
The following is a summary of significant unobservable inputs used in the fair valuation of assets and liabilities categorized within Level 3 of the fair value hierarchy:
Category | | Ending Balance at 09/30/16 | | Valuation Technique | Unobservable
Inputs | | Input
Range | |
Asset-Backed Securities | | $ | 1,521,134 | | Option Adjusted Spread off the prior month end broker mark over the 3 month LIBOR | Indicative Quote | | | — | |
Collateralized Mortgage Obligations | | | 954,102 | | Option Adjusted Spread off the prior month end broker mark over the 3 month LIBOR | Indicative Quote | | | — | |
Corporate Bonds | | | 9,595,293 | | Option Adjusted Spread off the prior month end broker mark over the 3 month LIBOR | Indicative Quote | | | — | |
Total | | $ | 12,070,529 | | | | | | | |
Any remaining Level 3 securities held by the Fund and excluded from the tables above, were not considered material to the Fund.
Transfers between investment levels may occur as the markets fluctuate and/or the availability of data used in an investment’s valuation changes. The Fund recognized transfers between the levels as of the beginning of the period. As of September 30, 2016, Limited Duration Fund had securities with a total value of $971,372 transfer out of Level 3 into Level 2 due to changes in the securities valuation method. There were no other securities that transferred between levels.
SEE NOTES TO FINANCIAL STATEMENTS. | THE GUGGENHEIM FUNDS ANNUAL REPORT | 69 |
SCHEDULE OF INVESTMENTS (concluded) | September 30, 2016 |
LIMITED DURATION FUND | |
Summary of Fair Value Level 3 Activity
Following is a reconciliation of Level 3 assets and liabilities for which significant unobservable inputs were used to determine fair value for the year ended September 30, 2016:
LEVEL 3 - Fair value measurement using significant unobservable inputs
| | | Collateralized
Mortgage
Obligations | | | Asset-Backed
Securities | | | Corporate
Bonds | | | Total | |
LIMITED DURATION | | | | | | | | | | | | |
Assets: | | | | | | | | | | | | |
Beginning Balance | | $ | — | | | $ | 971,372 | | | $ | — | | | $ | 971,372 | |
Purchases | | | 999,999 | | | | 1,500,000 | | | | 9,600,000 | | | | 12,099,999 | |
Sales, maturities and paydowns | | | (51,493 | ) | | | — | | | | — | | | | (51,493 | ) |
Total realized gains or losses included in earnings | | | — | | | | — | | | | — | | | | — | |
Total change in unrealized gains or losses included in earnings | | | 5,596 | | | | 21,134 | | | | (4,707 | ) | | | 22,023 | |
Transfers into Level 3 | | | — | | | | — | | | | — | | | | — | |
Transfers out of Level 3 | | | — | | | | (971,372 | ) | | | — | | | | (971,372 | ) |
Ending Balance | | $ | 954,102 | | | $ | 1,521,134 | | | $ | 9,595,293 | | | $ | 12,070,529 | |
Net Change in unrealized appreciation (depreciation) for investments in securities still held at September 30, 2016 | | $ | 5,596 | | | $ | 21,134 | | | $ | (4,707 | ) | | $ | 22,022 | |
70 | THE GUGGENHEIM FUNDS ANNUAL REPORT | SEE NOTES TO FINANCIAL STATEMENTS. |
STATEMENT OF ASSETS AND LIABILITIES |
September 30, 2016 |
Assets: | |
Investments in unaffiliated issuers, at value (cost $658,388,941) | | $ | 661,996,712 | |
Investments in affiliated issuers, at value (cost $18,290,109) | | | 18,402,748 | |
Repurchase agreements, at value (cost $23,840,250) | | | 23,840,250 | |
Total investments (cost $700,519,300) | | | 704,239,710 | |
Cash | | | 17,103,763 | |
Segregated cash with broker | | | 250,000 | |
Prepaid expenses | | | 73,659 | |
Receivables: | |
Securities sold | | | 238,468 | |
Fund shares sold | | | 7,584,780 | |
Dividends | | | 28,527 | |
Interest | | | 2,774,629 | |
Total assets | | | 732,293,536 | |
| | | | | |
Liabilities: | |
Payable for: | |
Securities purchased | | | 7,617,002 | |
Fund shares redeemed | | | 3,349,440 | |
Management fees | | | 143,958 | |
Dividends distributed | | | 106,711 | |
Distribution and service fees | | | 65,324 | |
Fund accounting/administration fees | | | 54,119 | |
Transfer agent/maintenance fees | | | 31,247 | |
Trustees’ fees* | | | 6,577 | |
Miscellaneous | | | 24,850 | |
Total liabilities | | | 11,399,228 | |
Net assets | | $ | 720,894,308 | |
| | | | | |
Net assets consist of: | |
Paid in capital | | $ | 718,149,874 | |
Accumulated net investment loss | | | (949,706 | ) |
Accumulated net realized gain on investments | | | (26,270 | ) |
Net unrealized appreciation on investments | | | 3,720,410 | |
Net assets | | $ | 720,894,308 | |
| | | | | |
A-Class: | |
Net assets | | $ | 215,855,739 | |
Capital shares outstanding | | | 8,733,829 | |
Net asset value per share | | $ | 24.71 | |
Maximum offering price per share (Net asset value divided by 97.75%) | | $ | 25.28 | |
| | | | | |
C-Class: | |
Net assets | | $ | 26,802,224 | |
Capital shares outstanding | | | 1,085,135 | |
Net asset value per share | | $ | 24.70 | |
| | | | | |
P-Class: | |
Net assets | | $ | 1,645,833 | |
Capital shares outstanding | | | 66,582 | |
Net asset value per share | | $ | 24.72 | |
| | | | | |
Institutional Class: | |
Net assets | | $ | 476,590,512 | |
Capital shares outstanding | | | 19,288,469 | |
Net asset value per share | | $ | 24.71 | |
* | Relates to Trustees not deemed “interested persons” within the meaning of Section 2(a)(19) of the 1940 Act. |
SEE NOTES TO FINANCIAL STATEMENTS. | THE GUGGENHEIM FUNDS ANNUAL REPORT | 71 |
STATEMENT OF OPERATIONS |
Year Ended September 30, 2016 |
Investment Income: | |
Interest | | $ | 18,503,541 | |
Dividends from securities of affiliated issuers | | | 274,568 | |
Dividends from securities of unaffiliated issuers | | | 31,875 | |
Total investment income | | | 18,809,984 | |
| | | | | |
Expenses: | |
Management fees | | | 2,380,567 | |
Transfer agent/maintenance fees: | |
A-Class | | | 80,621 | |
C-Class | | | 20,452 | |
P-Class | | | 505 | |
Institutional Class | | | 119,492 | |
Distribution and service fees: | |
A-Class | | | 452,815 | |
C-Class | | | 214,643 | |
P-Class | | | 5,128 | |
Fund accounting/administration fees | | | 502,557 | |
Interest expense | | | 149,503 | |
Line of credit fees | | | 36,599 | |
Trustees’ fees* | | | 26,109 | |
Custodian fees | | | 22,496 | |
Miscellaneous | | | 248,845 | |
Total expenses | | | 4,260,332 | |
Less: | |
Expenses waived by Adviser | | | (501,354 | ) |
Net expenses | | | 3,758,978 | |
Net investment income | | | 15,051,006 | |
| | | | | |
Net Realized and Unrealized Gain (Loss): | |
Net realized gain (loss) on: | |
Investments in unaffiliated issuers | | $ | 420,782 | |
Investments in affiliated issuers | | | (15,711 | ) |
Options purchased | | | (104,173 | ) |
Options written | | | 28,511 | |
Net realized gain | | | 329,409 | |
Net change in unrealized appreciation (depreciation) on: | |
Investments in unaffiliated issuers | | | 5,447,802 | |
Investments in affiliated issuers | | | 117,175 | |
Options purchased | | | (78,144 | ) |
Options written | | | 13,729 | |
Net change in unrealized appreciation (depreciation) | | | 5,500,562 | |
Net realized and unrealized gain | | | 5,829,971 | |
Net increase in net assets resulting from operations | | $ | 20,880,977 | |
* | Relates to Trustees not deemed “interested persons” within the meaning of Section 2(a)(19) of the 1940 Act. |
72 | THE GUGGENHEIM FUNDS ANNUAL REPORT | SEE NOTES TO FINANCIAL STATEMENTS. |
STATEMENTS OF CHANGES IN NET ASSETS |
| | | Year Ended
September 30,
2016 | | | Year Ended
September 30,
2015 | |
Increase (Decrease) in Net Assets from Operations: | | | | | | |
Net investment income | | $ | 15,051,006 | | | $ | 4,956,701 | |
Net realized gain (loss) on investments | | | 329,409 | | | | (272,435 | ) |
Net change in unrealized appreciation (depreciation) on investments | | | 5,500,562 | | | | (1,527,852 | ) |
Net increase in net assets resulting from operations | | | 20,880,977 | | | | 3,156,414 | |
| | | | | | | | | |
Distributions to shareholders from: | | | | | | | | |
Net investment income | | | | | | | | |
A-Class | | | (5,091,611 | ) | | | (1,877,597 | ) |
C-Class | | | (443,426 | ) | | | (92,400 | ) |
P-Class | | | (58,350 | ) | | | (14,688 | )* |
Institutional Class | | | (9,932,238 | ) | | | (3,607,196 | ) |
Net realized gains | | | | | | | | |
A-Class | | | — | | | | (10,524 | ) |
C-Class | | | — | | | | (358 | ) |
P-Class | | | — | | | | — | * |
Institutional Class | | | — | | | | (24,979 | ) |
Total distributions to shareholders | | | (15,525,625 | ) | | | (5,627,742 | ) |
| | | | | | | | | |
Capital share transactions: | | | | | | | | |
Proceeds from sale of shares | | | | | | | | |
A-Class | | | 197,623,014 | | | | 123,676,382 | |
C-Class | | | 24,267,204 | | | | 10,713,529 | |
P-Class | | | 1,976,882 | | | | 2,751,295 | * |
Institutional Class | | | 545,334,586 | | | | 144,227,876 | |
Distributions reinvested | | | | | | | | |
A-Class | | | 4,329,140 | | | | 1,735,098 | |
C-Class | | | 327,005 | | | | 77,547 | |
P-Class | | | 58,350 | | | | 14,688 | * |
Institutional Class | | | 8,366,742 | | | | 3,470,791 | |
Cost of shares redeemed | | | | | | | | |
A-Class | | | (105,025,329 | ) | | | (23,872,067 | ) |
C-Class | | | (8,309,387 | ) | | | (1,041,909 | ) |
P-Class | | | (3,110,231 | ) | | | (14,275 | )* |
Institutional Class | | | (257,307,806 | ) | | | (39,087,053 | ) |
Net increase from capital share transactions | | | 408,530,170 | | | | 222,651,902 | |
Net increase in net assets | | | 413,885,522 | | | | 220,180,574 | |
| | | | | | | | | |
Net assets: | | | | | | | | |
Beginning of year | | | 307,008,786 | | | | 86,828,212 | |
End of year | | $ | 720,894,308 | | | $ | 307,008,786 | |
Accumulated net investment loss at end of year | | $ | (949,706 | ) | | $ | (503,382 | ) |
SEE NOTES TO FINANCIAL STATEMENTS. | THE GUGGENHEIM FUNDS ANNUAL REPORT | 73 |
STATEMENTS OF CHANGES IN NET ASSETS (concluded) |
| | | Year Ended
September 30,
2016 | | | Year Ended
September 30,
2015 | |
Capital share activity: | | | | | | |
Shares sold | | | | | | |
A-Class | | | 8,081,165 | | | | 4,981,438 | |
C-Class | | | 992,734 | | | | 432,133 | |
P-Class | | | 80,811 | | | | 110,968 | * |
Institutional Class | | | 22,327,682 | | | | 5,820,359 | |
Shares issued from reinvestment of distributions | | | | | | | | |
A-Class | | | 176,965 | | | | 69,980 | |
C-Class | | | 13,376 | | | | 3,131 | |
P-Class | | | 2,393 | | | | 594 | * |
Institutional Class | | | 341,766 | | | | 139,945 | |
Shares redeemed | | | | | | | | |
A-Class | | | (4,296,150 | ) | | | (961,747 | ) |
C-Class | | | (340,015 | ) | | | (42,003 | ) |
P-Class | | | (127,607 | ) | | | (577 | )* |
Institutional Class | | | (10,535,961 | ) | | | (1,575,206 | ) |
Net increase in shares | | | 16,717,159 | | | | 8,979,015 | |
* | Since commencement of operations: May 1, 2015. |
74 | THE GUGGENHEIM FUNDS ANNUAL REPORT | SEE NOTES TO FINANCIAL STATEMENTS. |
This table is presented to show selected data for a share outstanding throughout each period and to assist shareholders in evaluating a Fund’s performance for the periods presented.
A-Class | | Year Ended
September 30,
2016 | | | Year Ended
September 30,
2015 | | | Period Ended
September 30,
2014a | |
Per Share Data | | | | | | | | | |
Net asset value, beginning of period | | $ | 24.65 | | | $ | 24.97 | | | $ | 25.00 | |
Income (loss) from investment operations: | |
Net investment income (loss)b | | | .67 | | | | .69 | | | | .52 | |
Net gain (loss) on investments (realized and unrealized) | | | .08 | | | | (.16 | ) | | | (.08 | ) |
Total from investment operations | | | .75 | | | | .53 | | | | .44 | |
Less distributions from: | |
Net investment income | | | (.69 | ) | | | (.84 | ) | | | (.47 | ) |
Net realized gains | | | — | | | | (.01 | ) | | | — | |
Total distributions | | | (.69 | ) | | | (.85 | ) | | | (.47 | ) |
Net asset value, end of period | | $ | 24.71 | | | $ | 24.65 | | | $ | 24.97 | |
| | |
Total Returnc | | | 3.16 | % | | | 2.15 | % | | | 1.75 | % |
Ratios/Supplemental Data | |
Net assets, end of period (in thousands) | | $ | 215,856 | | | $ | 117,628 | | | $ | 17,035 | |
Ratios to average net assets: | |
Net investment income (loss) | | | 2.73 | % | | | 2.79 | % | | | 2.67 | % |
Total expensesd | | | 0.93 | % | | | 0.99 | % | | | 1.14 | % |
Net expensese,g | | | 0.84 | % | | | 0.87 | % | | | 0.83 | % |
Portfolio turnover rate | | | 39 | % | | | 26 | % | | | 40 | % |
C-Class | | Year Ended
September 30,
2016 | | | Year Ended
September 30,
2015 | | | Period Ended
September 30,
2014a | |
Per Share Data | | | | | | | | | |
Net asset value, beginning of period | | $ | 24.63 | | | $ | 24.96 | | | $ | 25.00 | |
Income (loss) from investment operations: | |
Net investment income (loss)b | | | .48 | | | | .49 | | | | .38 | |
Net gain (loss) on investments (realized and unrealized) | | | .10 | | | | (.16 | ) | | | (.09 | ) |
Total from investment operations | | | .58 | | | | .33 | | | | .29 | |
Less distributions from: | |
Net investment income | | | (.51 | ) | | | (.65 | ) | | | (.33 | ) |
Net realized gains | | | — | | | | (.01 | ) | | | — | |
Total distributions | | | (.51 | ) | | | (.66 | ) | | | (.33 | ) |
Net asset value, end of period | | $ | 24.70 | | | $ | 24.63 | | | $ | 24.96 | |
| | |
Total Returnc | | | 2.39 | % | | | 1.37 | % | | | 1.13 | % |
Ratios/Supplemental Data | |
Net assets, end of period (in thousands) | | $ | 26,802 | | | $ | 10,323 | | | $ | 643 | |
Ratios to average net assets: | |
Net investment income (loss) | | | 1.98 | % | | | 1.96 | % | | | 1.93 | % |
Total expensesd | | | 1.73 | % | | | 1.76 | % | | | 2.14 | % |
Net expensese,g | | | 1.58 | % | | | 1.62 | % | | | 1.56 | % |
Portfolio turnover rate | | | 39 | % | | | 26 | % | | | 40 | % |
SEE NOTES TO FINANCIAL STATEMENTS. | THE GUGGENHEIM FUNDS ANNUAL REPORT | 75 |
FINANCIAL HIGHLIGHTS (continued) |
This table is presented to show selected data for a share outstanding throughout each period and to assist shareholders in evaluating a Fund’s performance for the periods presented.
P-Class | | Year Ended
September 30,
2016 | | | Period Ended
September 30,
2015f | |
Per Share Data | | | | | | |
Net asset value, beginning of period | | $ | 24.65 | | | $ | 24.86 | |
Income (loss) from investment operations: | |
Net investment income (loss)b | | | .68 | | | | .25 | |
Net gain (loss) on investments (realized and unrealized) | | | .08 | | | | (.17 | ) |
Total from investment operations | | | .76 | | | | .08 | |
Less distributions from: | |
Net investment income | | | (.69 | ) | | | (.29 | ) |
Total distributions | | | (.69 | ) | | | (.29 | ) |
Net asset value, end of period | | $ | 24.72 | | | $ | 24.65 | |
| | |
Total Returnc | | | 3.17 | % | | | 0.32 | % |
Ratios/Supplemental Data | |
Net assets, end of period (in thousands) | | $ | 1,646 | | | $ | 2,736 | |
Ratios to average net assets: | |
Net investment income (loss) | | | 2.76 | % | | | 2.39 | % |
Total expensesd | | | 0.94 | % | | | 0.94 | % |
Net expensese,g | | | 0.84 | % | | | 0.88 | % |
Portfolio turnover rate | | | 39 | % | | | 26 | % |
76 | THE GUGGENHEIM FUNDS ANNUAL REPORT | SEE NOTES TO FINANCIAL STATEMENTS. |
FINANCIAL HIGHLIGHTS (concluded) |
This table is presented to show selected data for a share outstanding throughout each period and to assist shareholders in evaluating a Fund’s performance for the periods presented.
Institutional Class | | Year Ended
September 30,
2016 | | | Year Ended
September 30,
2015 | | | Period Ended
September 30,
2014a | |
Per Share Data | | | | | | | | | |
Net asset value, beginning of period | | $ | 24.64 | | | $ | 24.96 | | | $ | 25.00 | |
Income (loss) from investment operations: | |
Net investment income (loss)b | | | .73 | | | | .78 | | | | .57 | |
Net gain (loss) on investments (realized and unrealized) | | | .09 | | | | (.19 | ) | | | (.08 | ) |
Total from investment operations | | | .82 | | | | .59 | | | | .49 | |
Less distributions from: | |
Net investment income | | | (.75 | ) | | | (.90 | ) | | | (.53 | ) |
Net realized gains | | | — | | | | (.01 | ) | | | — | |
Total distributions | | | (.75 | ) | | | (.91 | ) | | | (.53 | ) |
Net asset value, end of period | | $ | 24.71 | | | $ | 24.64 | | | $ | 24.96 | |
| | |
Total Returnc | | | 3.43 | % | | | 2.41 | % | | | 1.98 | % |
Ratios/Supplemental Data | |
Net assets, end of period (in thousands) | | $ | 476,591 | | | $ | 176,322 | | | $ | 69,150 | |
Ratios to average net assets: | |
Net investment income (loss) | | | 2.97 | % | | | 3.14 | % | | | 2.90 | % |
Total expensesd | | | 0.67 | % | | | 0.73 | % | | | 0.96 | % |
Net expensese,g | | | 0.58 | % | | | 0.62 | % | | | 0.57 | % |
Portfolio turnover rate | | | 39 | % | | | 26 | % | | | 40 | % |
a | Since commencement of operations: December 16, 2013. Percentage amounts for the period, except total return and portfolio turnover rate, have been annualized. |
b | Net investment income (loss) per share was computed using average shares outstanding throughout the period. |
c | Total return does not reflect the impact of any applicable sales charges and has not been annualized. |
d | Does not include expenses of the underlying funds in which the Fund invests. |
e | Net expense information reflects the expense ratios after expense waivers. |
f | Since commencement of operations: May 1, 2015. Percentage amounts for the period, except total return and portfolio turnover rate, have been annualized. |
g | Net expenses may include expenses that are excluded from the expense limitation agreement and affiliated fund waivers. Excluding these expenses, the operating expense ratios for the years would be: |
| | | 09/30/16 | 09/30/15 | 09/30/14 |
| | A-Class | 0.80% | 0.80% | 0.79% |
| | C-Class | 1.55% | 1.55% | 1.52% |
| | P-Class | 0.80% | 0.80% | — |
| | Institutional Class | 0.55% | 0.55% | 0.54% |
SEE NOTES TO FINANCIAL STATEMENTS. | THE GUGGENHEIM FUNDS ANNUAL REPORT | 77 |
MANAGERS’ COMMENTARY(Unaudited) | September 30, 2016 |
To Our Shareholders
Guggenheim Municipal Income Fund (the “Fund”) is managed by a team of seasoned professionals, including B. Scott Minerd, Chairman of Investments and Global Chief Investment Officer; Anne B. Walsh, Senior Managing Director and Assistant Chief Investment Officer; and James E. Pass, Senior Managing Director and Portfolio Manager. In the following paragraphs, the investment team discusses the market environment and the Fund’s performance for the fiscal year ended September 30, 2016.
For the one-year period ended September 30, 2016, the Guggenheim Municipal Income Fund returned 5.11%1, compared with the 5.58% return of the Bloomberg Barclays Municipal Bond Index, the Fund’s benchmark.
The Fund seeks to provide current income with an emphasis on income exempt from federal income tax, while also considering capital appreciation. It invests in a diversified portfolio of primarily investment-grade municipal securities whose interest is free from federal income tax*. It employs an investment strategy that seeks to identify opportunities to capture attractive relative value.
The demand for income benefited the prices of many municipal bonds over the year, but weighed on yields. The sector rallied along with most risk assets after the Fed refrained from raising rates in September 2015, and picked up again after the December hike and February bottom in the price of oil.
The municipal curve began steepening in September 2016, along with the Treasury curve, as the market started pricing in a Fed rate hike in December 2016. At the end of the period, relative to Treasurys, munis appeared to be attractively valued at both the long and short end of the curve.
Over the period, sector technicals remained strong. Inflows to mutual funds have been positive for 52 consecutive weeks, aggregating to $58 billion. Some of this activity has come from active international investors, who, despite not being advantaged by tax-exemption, continued to favor U.S. munis over the negative yields of much sovereign debt in their own countries. Year to date supply has neared $334 billion, about six percent higher than a year ago. We expect total 2016 issuance of approximately $420 billion, compared with $400 billion in 2015. Refunding continues to be over half of the issuance.
With upgrades continuing to outnumber downgrades, credit quality in the municipal bond space remains high, even though revenue growth at the state and local levels has moderated.
Revenue bonds—utilities, transportation bonds, and water and sewer systems—outperformed general obligation (GO) bonds for the year, helping the Fund. Two of the Fund’s top 10 holdings at period end were Detroit water system bonds, with two others hospital bonds. Others included education, electric power, transportation, and California GO bonds. All these sectors had returns of from five to seven percent for the year.
From a maturity perspective, long-dated bonds performed best except in the most recent quarter, in which intermediate bonds outperformed. Lower quality issuers have continued to outperform higher quality issuers over the period. The Fund continues to focus on identifying attractive risk-adjusted investment opportunities among A rated bonds, as well as distressed credits that carry municipal bond insurance from certain providers.
* | Income may be subject to the federal Alternative Minimum Tax (AMT). Capital gains distributions, if any, are taxed as capital gains. This is not tax advice. Investors should consult with a tax advisor before making any tax-related investment decisions. |
Performance displayed represents past performance which is no guarantee of future results.
1 | Performance figures are based on Class A shares and do not reflect deduction of the sales charges or taxes that a shareholder would pay on distributions or the redemption of shares. |
The opinions and forecast expressed may not actually come to pass. This information is subject to change at any time, based on market and other conditions, and should not be construed as a recommendation of any specific security or strategy.
78 | THE GUGGENHEIM FUNDS ANNUAL REPORT | |
PERFORMANCE REPORT AND FUND PROFILE (Unaudited) | September 30, 2016 |
MUNICIPAL INCOME FUND
OBJECTIVE: Seeks to provide current income with an emphasis on income exempt from federal income tax, while also considering capital appreciation.
Holdings Diversification (Market Exposure as % of Net Assets)
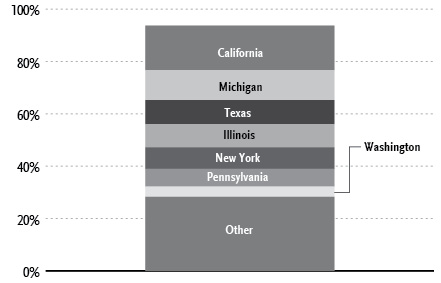
“Holdings Diversification (Market Exposure as % of Net Assets)” excludes any temporary cash investments.
Portfolio Composition by Quality Rating1 |
Rating | |
Fixed Income Instruments | |
AAA | 23.6% |
AA | 10.7% |
A | 17.8% |
BBB | 11.7% |
BB | 5.8% |
B | 6.6% |
CCC | 0.9% |
NR2 | 14.8% |
Other Instruments | 8.1% |
| Total Investments | 100.0% |
The chart above reflects percentages of the value of total investments.
Inception Dates: |
A-Class | April 28, 2004 |
C-Class | January 13, 2012 |
P-Class | May 1, 2015 |
Institutional Class | January 13, 2012 |
Ten Largest Holdings (% of Total Net Assets) |
City of Detroit Michigan Water Supply System Revenue Revenue Bonds | 3.6% |
Tustin Unified School District General Obligation Unlimited | 2.8% |
Arizona Health Facilities Authority Revenue Bonds | 2.6% |
City of Detroit Michigan Sewage Disposal System Revenue Revenue Bonds | 2.6% |
Regents of the University of California Medical Center Pooled Revenue Revenue Bonds | 2.5% |
Hudson County Improvement Authority Revenue Bonds | 2.4% |
Detroit Wayne County Stadium Authority Revenue Bonds | 2.4% |
Puerto Rico Electric Power Authority Revenue Bonds | 1.9% |
North Texas Tollway Authority Revenue Bonds | 1.8% |
State of California General Obligation Unlimited | 1.8% |
Top Ten Total | 24.4% |
“Ten Largest Holdings” excludes any temporary cash investments. |
1 | Source: BlackRock Solutions. Credit quality ratings are measured on a scale that generally ranges from AAA (highest) to D (lowest). All securities except for those labeled “NR” have been rated by a Nationally Recognized Statistical Rating Organization (“NRSRO”). For purposes of this presentation, when ratings are available from more than one agency, the highest rating is used. Guggenheim Investments converts ratings to the equivalent S&P rating. |
2 | NR securities do not necessarily indicate low credit quality. |
| | THE GUGGENHEIM FUNDS ANNUAL REPORT | 79 |
PERFORMANCE REPORT AND FUND PROFILE (Unaudited)(concluded) | September 30, 2016 |
Cumulative Fund Performance*
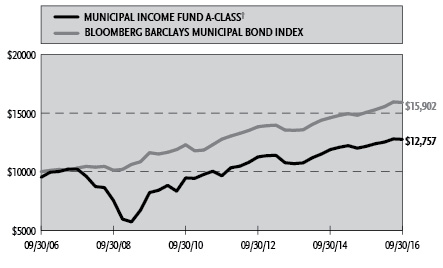
Average Annual Returns*
Periods Ended September 30, 2016
| | 1 Year | 5 Year | 10 Year |
A-Class Shares§ | 4.85% | 5.74% | 2.96% |
A-Class Shares with sales charge† | -0.10% | 4.72% | 2.47% |
Bloomberg Barclays Municipal Bond Index | 5.58% | 4.48% | 4.75% |
| | | 1 Year | Since Inception (01/13/12) |
C-Class Shares | | 4.06% | 3.54% |
C-Class Shares with CDSC‡ | | 3.06% | 3.54% |
Institutional Class Shares | | 5.11% | 4.57% |
Bloomberg Barclays Municipal Bond Index | | 5.58% | 3.94% |
| | | 1 Year | Since Inception (05/01/15) |
P-Class Shares | | 4.86% | 3.45% |
Bloomberg Barclays Municipal Bond Index | | 5.58% | 4.93% |
* | The performance data above represents past performance that is not predictive of future results. The investment return and principal value of an investment in the Fund will fluctuate so that an investor’s shares, when redeemed, may be worth more or less than their original cost. Returns are historical and include changes in principal and reinvested dividends and capital gains and do not reflect the effect of taxes. The Bloomberg Barclays Municipal Bond Index is an unmanaged index and, unlike the Fund, has no management fees or operating expenses to reduce its reported return. The graph is based on A-Class shares only; performance for C-Class shares, P-Class shares and Institutional Class shares will vary due to differences in fee structures. |
† | Effective October 1, 2015, the maximum sales charge decreased from 4.75% to 4.00%. A 4.75% maximum sales charge is used in the calculation of the Average Annual Returns (based on subscriptions made prior to October 1, 2015), and a 4.00% maximum sales charge will be used to calculate performance for periods based on subscriptions made on or after October 1, 2015. |
‡ | Fund returns include a CDSC of 1% if redeemed within 12 months of purchase. |
§ | Effective January 13, 2012, the Fund acquired all of the assets and liabilities of the TS&W/Claymore Tax-Advantage Balanced Fund (“TYW”), a registered closed-end management investment company. The A-Class performance prior to that date reflects performance of TYW. |
80 | THE GUGGENHEIM FUNDS ANNUAL REPORT | |
SCHEDULE OF INVESTMENTS | September 30, 2016 |
MUNICIPAL INCOME FUND | |
| | | Shares | | | Value | |
| | | | | | | |
SHORT-TERM INVESTMENTS† - 6.9% | |
Dreyfus Tax Exempt Cash Management Institutional Shares 0.55%1 | | | 4,874,210 | | | $ | 4,874,210 | |
Total Short-Term Investments | | | | | | | | |
(Cost $4,874,210) | | | | | | | 4,874,210 | |
| | | Face
Amount | | | | |
| | | | | | | |
MUNICIPAL BONDS†† - 93.7% | |
California - 17.1% | |
State of California General Obligation Unlimited | | | | | | |
5.00% due 03/01/26 | | $ | 1,000,000 | | | | 1,271,200 | |
5.00% due 06/01/17 | | | 880,000 | | | | 905,036 | |
Tustin Unified School District General Obligation Unlimited | | | | | | | | |
6.00% due 08/01/21 | | | 1,600,000 | | | | 1,976,303 | |
Regents of the University of California Medical Center Pooled Revenue Revenue Bonds | | | | | | | | |
1.29% due 05/15/432 | | | 2,000,000 | | | | 1,764,420 | |
Stockton Public Financing Authority Revenue Bonds | | | | | | | | |
6.25% due 10/01/38 | | | 1,000,000 | | | | 1,254,320 | |
6.25% due 10/01/40 | | | 250,000 | | | | 313,580 | |
San Diego Unified School District General Obligation Unlimited | | | | | | | | |
due 07/01/393 | | | 2,500,000 | | | | 1,079,050 | |
College of the Sequoias Tulare Area Improvement District No. 3 General Obligation Unlimited | | | | | | | | |
6.85% due 08/01/424 | | | 1,000,000 | | | | 661,300 | |
Sacramento Municipal Utility District Revenue Bonds | | | | | | | | |
5.00% due 08/15/37 | | | 500,000 | | | | 600,515 | |
Los Angeles Department of Water & Power Revenue Bonds | | | | | | | | |
5.00% due 07/01/43 | | | 500,000 | | | | 591,865 | |
Kings Canyon Unified School District General Obligation Unlimited | | | | | | | | |
5.00% due 08/01/28 | | | 445,000 | | | | 555,209 | |
Oakland Unified School District/Alameda County General Obligation Unlimited | | | | | | | | |
5.00% due 08/01/22 | | | 300,000 | | | | 349,581 | |
M-S-R Energy Authority Revenue Bonds | | | | | | | | |
6.13% due 11/01/29 | | | 200,000 | | | | 265,944 | |
Alameda Corridor Transportation Authority Revenue Bonds | | | | | | | | |
5.00% due 10/01/35 | | | 200,000 | | | | 243,022 | |
Culver Redevelopment Agency Tax Allocation | | | | | | | | |
due 11/01/233 | | | 195,000 | | | | 156,679 | |
Total California | | | | | | | 11,988,024 | |
| | |
Michigan - 11.7% | |
City of Detroit Michigan Water Supply System Revenue Revenue Bonds | | | | | | |
5.00% due 07/01/33 | | | 2,530,000 | | | | 2,541,266 | |
4.75% due 07/01/29 | | | 230,000 | | | | 241,650 | |
5.00% due 07/01/41 | | | 200,000 | | | | 220,006 | |
5.00% due 07/01/34 | | | 55,000 | | | | 55,204 | |
City of Detroit Michigan Sewage Disposal System Revenue Revenue Bonds | | | | | | | | |
1.03% due 07/01/322 | | | 2,000,000 | | | | 1,803,080 | |
Detroit Wayne County Stadium Authority Revenue Bonds | | | | | | | | |
5.00% due 10/01/26 | | | 1,490,000 | | | | 1,682,046 | |
Detroit City School District General Obligation Unlimited | | | | | | | | |
5.00% due 05/01/32 | | | 1,000,000 | | | | 1,127,340 | |
5.00% due 05/01/30 | | | 300,000 | | | | 340,152 | |
Total Michigan | | | | | | | 8,010,744 | |
| | | | | | | | | |
Texas - 9.1% | |
North Texas Tollway Authority Revenue Bonds | | | | | | | | |
5.75% due 01/01/18 | | | 1,205,000 | | | | 1,277,312 | |
5.75% due 01/01/18 | | | 1,030,000 | | | | 1,091,810 | |
5.75% due 01/01/40 | | | 265,000 | | | | 279,636 | |
Texas Tech University Revenue Bonds | | | | | | | | |
5.00% due 08/15/32 | | | 735,000 | | | | 858,318 | |
Dallas Area Rapid Transit Revenue Bonds | | | | | | | | |
5.00% due 12/01/35 | | | 500,000 | | | | 608,250 | |
County of Harris Texas Revenue Bonds | | | | | | | | |
1.22% due 08/15/352 | | | 500,000 | | | | 457,430 | |
Harris County-Houston Sports Authority Revenue Bonds | | | | | | | | |
due 11/15/533 | | | 2,000,000 | | | | 388,980 | |
Birdville Independent School District General Obligation Unlimited | | | | | | | | |
5.00% due 02/15/27 | | | 305,000 | | | | 381,701 | |
Clint Independent School District General Obligation Unlimited | | | | | | | | |
5.00% due 08/15/31 | | | 300,000 | | | | 367,110 | |
State of Texas General Obligation Unlimited | | | | | | | | |
5.00% due 10/01/29 | | | 250,000 | | | | 313,265 | |
Central Texas Regional Mobility Authority Revenue Bonds | | | | | | | | |
5.00% due 01/01/27 | | | 200,000 | | | | 248,538 | |
Central Texas Turnpike System Revenue Bonds | | | | | | | | |
5.00% due 08/15/34 | | | 200,000 | | | | 233,976 | |
Total Texas | | | | | | | 6,506,326 | |
| | | | | | | | | |
Illinois - 8.8% | |
Chicago O’Hare International Airport Revenue Bonds | | | | | | | | |
5.00% due 01/01/34 | | | 1,000,000 | | | | 1,187,810 | |
Will County Township High School District No. 204 Joliet General Obligation Ltd. | | | | | | | | |
6.25% due 01/01/31 | | | 1,000,000 | | | | 1,187,690 | |
Southern Illinois University Revenue Bonds | | | | | | | | |
5.00% due 04/01/32 | | | 1,000,000 | | | | 1,056,170 | |
SEE NOTES TO FINANCIAL STATEMENTS. | THE GUGGENHEIM FUNDS ANNUAL REPORT | 81 |
SCHEDULE OF INVESTMENTS (continued) | September 30, 2016 |
MUNICIPAL INCOME FUND | |
| | | Face
Amount | | | Value | |
| | | | | | | |
Chicago Transit Authority Revenue Bonds | | | | | | |
5.25% due 06/01/26 | | $ | 740,000 | | | $ | 776,586 | |
City of Chicago Illinois General Obligation Unlimited | | | | | | | | |
4.75% due 01/01/28 | | | 500,000 | | | | 501,585 | |
5.00% due 01/01/23 | | | 70,000 | | | | 73,037 | |
5.00% due 01/01/22 | | | 5,000 | | | | 5,040 | |
Illinois Finance Authority Revenue Bonds | | | | | | | | |
5.50% due 08/01/17 | | | 500,000 | | | | 519,215 | |
Chicago Board of Education General Obligation Unlimited | | | | | | | | |
5.25% due 12/01/26 | | | 320,000 | | | | 298,573 | |
Metropolitan Water Reclamation District of Greater Chicago General Obligation Unlimited | | | | | | | | |
5.00% due 12/01/25 | | | 200,000 | | | | 250,698 | |
University of Illinois Revenue Bonds | | | | | | | | |
6.00% due 10/01/29 | | | 200,000 | | | | 246,338 | |
Metropolitan Pier & Exposition Authority Revenue Bonds | | | | | | | | |
due 06/15/453 | | | 500,000 | | | | 154,195 | |
Total Illinois | | | | | | | 6,256,937 | |
| | | | | | | | | |
New York - 8.1% | |
Erie County Industrial Development Agency Revenue Bonds | | | | | | | | |
5.00% due 05/01/23 | | | 1,000,000 | | | | 1,232,890 | |
New York State Environmental Facilities Corp. Revenue Bonds | | | | | | | | |
4.00% due 03/15/17 | | | 995,000 | | | | 1,009,945 | |
New York State Urban Development Corp. Revenue Bonds | | | | | | | | |
5.00% due 12/15/16 | | | 500,000 | | | | 504,505 | |
5.00% due 03/15/35 | | | 250,000 | | | | 304,625 | |
New York City Transitional Finance Authority Future Tax Secured Revenue Revenue Bonds | | | | | | | | |
5.00% due 11/01/29 | | | 500,000 | | | | 629,650 | |
City of New York New York General Obligation Unlimited | | | | | | | | |
5.00% due 08/01/28 | | | 500,000 | | | | 628,915 | |
New York City Water & Sewer System Revenue Bonds | | | | | | | | |
5.00% due 06/15/39 | | | 500,000 | | | | 603,340 | |
New York Transportation Development Corp. Revenue Bonds | | | | | | | | |
5.00% due 07/01/34 | | | 200,000 | | | | 230,796 | |
5.00% due 08/01/26 | | | 200,000 | | | | 221,568 | |
New York State Dormitory Authority Revenue Bonds | | | | | | | | |
5.00% due 10/01/41 | | | 350,000 | | | | 407,463 | |
Total New York | | | | | | | 5,773,697 | |
| | | | | | | | | |
Pennsylvania - 6.7% | |
Pennsylvania Economic Development Financing Authority Revenue Bonds | | | | | | | | |
5.00% due 02/01/27 | | | 1,000,000 | | | | 1,218,440 | |
5.00% due 03/15/31 | | | 500,000 | | | | 613,545 | |
Pennsylvania Turnpike Commission Revenue Bonds | | | | | | | | |
2.11% due 12/01/202 | | | 500,000 | | | | 505,130 | |
1.82% due 12/01/212 | | | 500,000 | | | | 498,230 | |
County of Allegheny Pennsylvania General Obligation Unlimited | | | | | | | | |
1.06% due 11/01/262 | | | 1,000,000 | | | | 963,220 | |
Pittsburgh Water & Sewer Authority Revenue Bonds | | | | | | | | |
5.25% due 09/01/36 | | | 500,000 | | | | 595,965 | |
Reading School District General Obligation Unlimited | | | | | | | | |
5.00% due 02/01/27 | | | 300,000 | | | | 358,182 | |
Total Pennsylvania | | | | | | | 4,752,712 | |
| | | | | | | | | |
Washington - 4.0% | |
Greater Wenatchee Regional Events Center Public Facilities Dist Revenue Bonds | | | | | | | | |
5.00% due 09/01/275 | | | 500,000 | | | | 539,215 | |
5.25% due 09/01/325 | | | 500,000 | | | | 532,095 | |
King County Public Hospital District No. 1 General Obligation Ltd. | | | | | | | | |
5.00% due 12/01/37 | | | 1,000,000 | | | | 1,062,140 | |
King County School District No. 409 Tahoma General Obligation Unlimited | | | | | | | | |
5.00% due 12/01/27 | | | 325,000 | | | | 410,810 | |
State of Washington General Obligation Unlimited | | | | | | | | |
5.00% due 06/01/41 | | | 195,000 | | | | 224,554 | |
Total Washington | | | | | | | 2,768,814 | |
| | | | | | | | | |
Arizona - 4.0% | |
Arizona Health Facilities Authority Revenue Bonds | | | | | | | | |
1.24% due 01/01/372 | | | 2,000,000 | | | | 1,847,040 | |
Arizona State University Revenue Bonds | | | | | | | | |
5.00% due 07/01/34 | | | 500,000 | | | | 607,345 | |
Salt Verde Financial Corp. Revenue Bonds | | | | | | | | |
5.00% due 12/01/32 | | | 200,000 | | | | 249,482 | |
Total Arizona | | | | | | | 2,703,867 | |
| | | | | | | | | |
New Jersey - 3.9% | |
Hudson County Improvement Authority Revenue Bonds | | | | | | | | |
6.00% due 01/01/40 | | | 1,500,000 | | | | 1,686,480 | |
New Jersey Turnpike Authority Revenue Bonds | | | | | | | | |
0.92% due 01/01/242 | | | 1,000,000 | | | | 996,490 | |
Total New Jersey | | | | | | | 2,682,970 | |
| | | | | | | | | |
Massachusetts - 3.0% | |
Massachusetts Development Finance Agency Revenue Bonds | | | | | | | | |
6.88% due 01/01/41 | | | 1,000,000 | | | | 1,188,760 | |
82 | THE GUGGENHEIM FUNDS ANNUAL REPORT | SEE NOTES TO FINANCIAL STATEMENTS. |
SCHEDULE OF INVESTMENTS (continued) | September 30, 2016 |
MUNICIPAL INCOME FUND | |
| | | Face
Amount | | | Value | |
| | | | | | | |
Commonwealth of Massachusetts General Obligation Unlimited | | | | | | |
1.08% due 05/01/372 | | $ | 1,000,000 | | | $ | 948,250 | |
Total Massachusetts | | | | | | | 2,137,010 | |
| | | | | | | | | |
Ohio - 2.6% | |
Ohio Air Quality Development Authority Revenue Bonds | | | | | | | | |
4.25% due 08/01/292 | | | 1,000,000 | | | | 1,000,870 | |
University of Cincinnati Revenue Bonds | | | | | | | | |
5.00% due 06/01/36 | | | 500,000 | | | | 600,420 | |
American Municipal Power, Inc. Revenue Bonds | | | | | | | | |
5.00% due 02/15/41 | | | 200,000 | | | | 237,140 | |
Total Ohio | | | | | | | 1,838,430 | |
| | | | | | | | | |
Puerto Rico - 1.9% | |
Puerto Rico Electric Power Authority Revenue Bonds | | | | | | | | |
0.95% due 07/01/292,5 | | | 1,845,000 | | | | 1,330,430 | |
| | | | | | | | | |
Florida - 1.9% | |
School Board of Miami-Dade County Certificate Of Participation | | | | | | | | |
5.00% due 05/01/27 | | | 500,000 | | | | 616,180 | |
City of Jacksonville Florida Revenue Bonds | | | | | | | | |
5.00% due 10/01/29 | | | 300,000 | | | | 351,549 | |
Miami Beach Redevelopment Agency Tax Allocation | | | | | | | | |
5.00% due 02/01/40 | | | 300,000 | | | | 349,758 | |
Total Florida | | | | | | | 1,317,487 | |
| | | | | | | | | |
Maryland - 1.5% | |
Maryland State Transportation Authority Revenue Bonds | | | | | | | | |
5.00% due 07/01/35 | | | 1,000,000 | | | | 1,066,870 | |
| | | | | | | | | |
Louisiana - 1.3% | |
Louisiana Local Government Environmental Facilities & Community Development Auth Revenue Bonds | | | | | | | | |
5.00% due 10/01/37 | | | 620,000 | | | | 723,583 | |
Louisiana Public Facilities Authority Revenue Bonds | | | | | | | | |
5.00% due 07/01/39 | | | 200,000 | | | | 233,768 | |
Total Louisiana | | | | | | | 957,351 | |
| | | | | | | | | |
District of Columbia - 1.3% | |
District of Columbia Water & Sewer Authority Revenue Bonds | | | | | | | | |
5.00% due 10/01/45 | | | 500,000 | | | | 598,430 | |
District of Columbia General Obligation Unlimited | | | | | | | | |
5.00% due 06/01/32 | | | 275,000 | | | | 331,862 | |
Total District of Columbia | | | | | | | 930,292 | |
| | | | | | | | | |
Mississippi - 1.2% | |
Mississippi Development Bank Revenue Bonds | | | | | | | | |
6.50% due 10/01/31 | | | 500,000 | | | | 590,410 | |
6.25% due 10/01/26 | | | 230,000 | | | | 273,180 | |
Total Mississippi | | | | | | | 863,590 | |
| | | | | | | | | |
Georgia - 1.1% | |
City of Atlanta Georgia Water & Wastewater Revenue Revenue Bonds | | | | | | | | |
5.00% due 11/01/40 | | | 500,000 | | | | 598,605 | |
Savannah Economic Development Authority Revenue Bonds | | | | | | | | |
5.00% due 12/01/28 | | | 200,000 | | | | 245,442 | |
Total Georgia | | | | | | | 844,047 | |
| | | | | | | | | |
Colorado - 1.2% | |
Auraria Higher Education Center Revenue Bonds | | | | | | | | |
5.00% due 04/01/28 | | | 390,000 | | | | 484,774 | |
University of Colorado Revenue Bonds | | | | | | | | |
5.00% due 06/01/37 | | | 285,000 | | | | 333,772 | |
Total Colorado | | | | | | | 818,546 | |
| | | | | | | | | |
Virginia - 0.9% | |
County of Fairfax Virginia General Obligation Unlimited | | | | | | | | |
5.00% due 10/01/32 | | | 300,000 | | | | 379,020 | |
Virginia College Building Authority Revenue Bonds | | | | | | | | |
5.00% due 02/01/28 | | | 250,000 | | | | 310,970 | |
Total Virginia | | | | | | | 689,990 | |
| | | | | | | | | |
West Virginia - 0.8% | |
West Virginia Higher Education Policy Commission Revenue Bonds | | | | | | | | |
5.00% due 04/01/29 | | | 500,000 | | | | 583,970 | |
| | | | | | | | | |
Indiana - 0.7% | |
Greater Clark County School Building Corp. Revenue Bonds | | | | | | | | |
5.25% due 01/15/18 | | | 500,000 | | | | 528,365 | |
| | | | | | | | | |
South Carolina - 0.5% | |
Anderson County School District No. 5 General Obligation Unlimited | | | | | | | | |
5.00% due 03/01/27 | | | 300,000 | | | | 383,436 | |
| | | | | | | | | |
Nevada - 0.4% | |
Las Vegas Valley Water District General Obligation Ltd. | | | | | | | | |
5.00% due 06/01/27 | | | 230,000 | | | | 288,096 | |
Total Municipal Bonds | | | | | | | | |
(Cost $63,156,412) | | | | | | | 66,022,001 | |
| | | | | | | | | |
Total Investments - 100.6% | | | | | | | | |
(Cost $68,030,622) | | | | | | $ | 70,896,211 | |
Other Assets & Liabilities, net - (0.6)% | | | | | | | (394,414 | ) |
Total Net Assets - 100.0% | | | | | | $ | 70,501,797 | |
SEE NOTES TO FINANCIAL STATEMENTS. | THE GUGGENHEIM FUNDS ANNUAL REPORT | 83 |
SCHEDULE OF INVESTMENTS (concluded) | September 30, 2016 |
MUNICIPAL INCOME FUND | |
† | Value determined based on Level 1 inputs — See Note 4. |
†† | Value determined based on Level 2 inputs — See Note 4. |
1 | Rate indicated is the 7 day yield as of September 30, 2016. |
2 | Variable rate security. Rate indicated is rate effective at September 30, 2016. |
3 | Zero coupon rate security. |
4 | Security is a step up/step down bond. The coupon increases or decreases at regular intervals until the bond reaches full maturity. |
5 | Illiquid security. |
The following table summarizes the inputs used to value the Fund’s investments at September 30, 2016 (See Note 4 in the Notes to Financial Statements):
Investments in Securities (Assets) | | Level 1 | | | Level 2 | | | Level 3 | | | Total | |
Municipal Bonds | | $ | — | | | $ | 66,022,001 | | | $ | — | | | $ | 66,022,001 | |
Short-Term Investments | | | 4,874,210 | | | | — | | | | — | | | | 4,874,210 | |
Total | | $ | 4,874,210 | | | $ | 66,022,001 | | | $ | — | | | $ | 70,896,211 | |
Transfers between investment levels may occur as the markets fluctuate and/or the availability of data used in an investment’s valuation changes. Transfers between valuation levels, if any, are in comparison to the valuation levels at the end of the previous fiscal year, and are effective using the fair value as of the end of the previous fiscal period.
For the year ended September 30, 2016, there were no transfers between levels.
84 | THE GUGGENHEIM FUNDS ANNUAL REPORT | SEE NOTES TO FINANCIAL STATEMENTS. |
STATEMENT OF ASSETS AND LIABILITIES |
September 30, 2016 |
Assets: | |
Investments, at value (cost $68,030,622) | | $ | 70,896,211 | |
Prepaid expenses | | | 24,656 | |
Receivables: | |
Fund shares sold | | | 303,260 | |
Interest | | | 689,432 | |
Total assets | | | 71,913,559 | |
| | | | | |
Liabilities: | |
Overdraft due to custodian bank | | | 2 | |
Payable for: | |
Securities purchased | | | 1,227,450 | |
Fund shares redeemed | | | 66,086 | |
Dividends distributed | | | 33,893 | |
Transfer agent/maintenance fees | | | 19,996 | |
Distribution and service fees | | | 12,636 | |
Fund accounting/administration fees | | | 5,471 | |
Management fees | | | 4,315 | |
Trustees’ fees* | | | 2,441 | |
Miscellaneous | | | 39,472 | |
Total liabilities | | | 1,411,762 | |
Net assets | | $ | 70,501,797 | |
| | | | | |
Net assets consist of: | |
Paid in capital | | $ | 95,131,053 | |
Undistributed net investment loss | | | (1 | ) |
Accumulated net realized loss on investments | | | (27,494,844 | ) |
Net unrealized appreciation on investments | | | 2,865,589 | |
Net assets | | $ | 70,501,797 | |
| | | | | |
A-Class: | |
Net assets | | $ | 41,282,819 | |
Capital shares outstanding | | | 3,209,128 | |
Net asset value per share | | $ | 12.86 | |
Maximum offering price per share (Net asset value divided by 96.00%) | | $ | 13.40 | |
| | | | | |
C-Class: | |
Net assets | | $ | 5,008,462 | |
Capital shares outstanding | | | 389,585 | |
Net asset value per share | | $ | 12.86 | |
| | | | | |
P-Class: | |
Net assets | | $ | 84,305 | |
Capital shares outstanding | | | 6,555 | |
Net asset value per share | | $ | 12.86 | |
| | | | | |
Institutional Class: | |
Net assets | | $ | 24,126,211 | |
Capital shares outstanding | | | 1,875,018 | |
Net asset value per share | | $ | 12.87 | |
STATEMENT OF OPERATIONS |
Year Ended September 30, 2016 |
Investment Income: | |
Interest | | $ | 1,905,235 | |
Total investment income | | | 1,905,235 | |
| | | | | |
Expenses: | |
Management fees | | | 333,758 | |
Transfer agent/maintenance fees: | |
A-Class | | | 79,602 | |
C-Class | | | 6,011 | |
P-Class | | | 90 | |
Institutional Class | | | 12,230 | |
Distribution and service fees: | |
A-Class | | | 122,257 | |
C-Class | | | 43,188 | |
P-Class | | | 101 | |
Fund accounting/administration fees | | | 63,413 | |
Registration fees | | | 60,305 | |
Line of credit fees | | | 8,956 | |
Trustees’ fees* | | | 4,098 | |
Custodian fees | | | 45 | |
Miscellaneous | | | 35,780 | |
Total expenses | | | 769,834 | |
Less: | | | | |
Expenses waived by Adviser | | | (229,485 | ) |
Net expenses | | | 540,349 | |
Net investment income | | | 1,364,886 | |
| | | | | |
Net Realized and Unrealized Gain (Loss): | |
Net realized gain (loss) on: | |
Investments | | | 647,792 | |
Net realized gain | | | 647,792 | |
Net change in unrealized appreciation (depreciation) on: | |
Investments | | | 1,067,522 | |
Net change in unrealized appreciation (depreciation) | | | 1,067,522 | |
Net realized and unrealized gain | | | 1,715,314 | |
Net increase in net assets resulting from operations | | $ | 3,080,200 | |
* | Relates to Trustees not deemed “interested persons” within the meaning of Section 2(a)(19) of the 1940 Act. |
SEE NOTES TO FINANCIAL STATEMENTS. | THE GUGGENHEIM FUNDS ANNUAL REPORT | 85 |
STATEMENTS OF CHANGES IN NET ASSETS |
| | | Year Ended
September 30,
2016 | | | Year Ended
September 30,
2015 | |
Increase (Decrease) in Net Assets from Operations: | | | | | | |
Net investment income | | $ | 1,364,886 | | | $ | 1,376,249 | |
Net realized gain on investments | | | 647,792 | | | | 266,390 | |
Net change in unrealized appreciation (depreciation) on investments | | | 1,067,522 | | | | (419,085 | ) |
Net increase in net assets resulting from operations | | | 3,080,200 | | | | 1,223,554 | |
| | | | | | | | | |
Distributions to shareholders from: | | | | | | | | |
Net investment income | | | | | | | | |
A-Class | | | (1,005,003 | ) | | | (1,146,185 | ) |
C-Class | | | (54,384 | ) | | | (30,351 | ) |
P-Class | | | (803 | ) | | | (100 | )* |
Institutional Class | | | (304,697 | ) | | | (199,613 | ) |
Total distributions to shareholders | | | (1,364,887 | ) | | | (1,376,249 | ) |
| | | | | | | | | |
Capital share transactions: | | | | | | | | |
Proceeds from sale of shares | | | | | | | | |
A-Class | | | 19,465,560 | | | | 21,002,499 | |
C-Class | | | 5,088,386 | | | | 2,084,724 | |
P-Class | | | 79,344 | | | | 10,000 | * |
Institutional Class | | | 18,451,425 | | | | 4,945,093 | |
Distributions reinvested | | | | | | | | |
A-Class | | | 617,221 | | | | 704,334 | |
C-Class | | | 38,398 | | | | 21,242 | |
P-Class | | | 803 | | | | 100 | * |
Institutional Class | | | 207,229 | | | | 116,901 | |
Cost of shares redeemed | | | | | | | | |
A-Class | | | (29,246,762 | ) | | | (16,588,738 | ) |
C-Class | | | (2,681,765 | ) | | | (700,489 | ) |
P-Class | | | (6,443 | ) | | | — | * |
Institutional Class | | | (3,358,813 | ) | | | (2,933,434 | ) |
Net increase from capital share transactions | | | 8,654,583 | | | | 8,662,232 | |
Net increase in net assets | | | 10,369,896 | | | | 8,509,537 | |
| | | | | | | | | |
Net assets: | | | | | | | | |
Beginning of year | | | 60,131,901 | | | | 51,622,364 | |
End of year | | $ | 70,501,797 | | | $ | 60,131,901 | |
Accumulated net investment loss/Undistributed net investment income at end of year | | $ | (1 | ) | | $ | — | |
| | | | | | | | | |
Capital share activity: | | | | | | | | |
Shares sold | | | | | | | | |
A-Class | | | 1,533,459 | | | | 1,657,982 | |
C-Class | | | 399,596 | | | | 165,051 | |
P-Class | | | 6,189 | | | | 791 | * |
Institutional Class | | | 1,437,935 | | | | 391,788 | |
Shares issued from reinvestment of distributions | | | | | | | | |
A-Class | | | 48,393 | | | | 55,887 | |
C-Class | | | 3,006 | | | | 1,686 | |
P-Class | | | 63 | | | | 8 | * |
Institutional Class | | | 16,176 | | | | 9,270 | |
Shares redeemed | | | | | | | | |
A-Class | | | (2,292,204 | ) | | | (1,319,843 | ) |
C-Class | | | (210,501 | ) | | | (55,776 | ) |
P-Class | | | (496 | ) | | | — | * |
Institutional Class | | | (262,663 | ) | | | (233,057 | ) |
Net increase in shares | | | 678,953 | | | | 673,787 | |
* | Since commencement of operations: May 1, 2015. |
86 | THE GUGGENHEIM FUNDS ANNUAL REPORT | SEE NOTES TO FINANCIAL STATEMENTS. |
This table is presented to show selected data for a share outstanding throughout each period and to assist shareholders in evaluating a Fund’s performance for the periods presented.
A-Class† | Year Ended
September 30,
2016 | | Year Ended
September 30,
2015 | | Year Ended
September 30,
2014 | | Year Ended
September 30,
2013 | | Period Ended
September 30,
2012a | | Year Ended
December 31,
2011 | |
Per Share Data | | | | | | | | | | | | | | | | | | |
Net asset value, beginning of period | | $ | 12.52 | | | $ | 12.51 | | | $ | 11.59 | | | $ | 12.59 | | | $ | 11.82 | | | $ | 11.54 | |
Income (loss) from investment operations: | |
Net investment income (loss)b | | | .26 | | | | .29 | | | | .36 | | | | .38 | | | | .26 | | | | .64 | |
Distributions to preferred shareholders from: | | | | | | | | | | | | | | | | | | | | | | | | |
Net investment income | | | — | | | | — | | | | — | | | | — | | | | (.01 | ) | | | (.10 | ) |
Net gain (loss) on investments (realized and unrealized) | | | .34 | | | | .01 | | | | .92 | | | | (1.00 | ) | | | .78 | | | | .54 | |
Total from investment operations | | | .60 | | | | .30 | | | | 1.28 | | | | (.62 | ) | | | 1.03 | | | | 1.08 | |
Less distributions from: | |
Net investment income | | | (.26 | ) | | | (.29 | ) | | | (.36 | ) | | | (.38 | ) | | | (.26 | ) | | | (.80 | ) |
Total distributions | | | (.26 | ) | | | (.29 | ) | | | (.36 | ) | | | (.38 | ) | | | (.26 | ) | | | (.80 | ) |
Net asset value, end of period | | $ | 12.86 | | | $ | 12.52 | | | $ | 12.51 | | | $ | 11.59 | | | $ | 12.59 | | | $ | 11.82 | |
| | |
Total Returnf | | | 4.85 | % | | | 2.39 | % | | | 11.20 | % | | | (5.09 | %) | | | 8.91 | % | | | 9.64 | % |
Ratios/Supplemental Data | |
Net assets, end of period (in thousands) | | $ | 41,283 | | | $ | 49,086 | | | $ | 44,090 | | | $ | 50,463 | | | $ | 77,609 | | | $ | 182,150 | |
Ratios to average net assets: | |
Net investment income (loss) | | | 2.06 | % | | | 2.28 | % | | | 3.00 | % | | | 3.04 | % | | | 2.78 | % | | | 4.60 | % |
Total expenses | | | 1.18 | % | | | 1.17 | % | | | 1.29 | % | | | 1.14 | % | | | 1.15 | % | | | 2.09 | % |
Net expensesc,g | | | 0.81 | % | | | 0.81 | % | | | 0.83 | % | | | 0.82 | % | | | 0.87 | % | | | 2.09 | % |
Portfolio turnover rate | | | 61 | % | | | 80 | % | | | 173 | % | | | 91 | % | | | 121 | % | | | 104 | % |
C-Class | Year Ended
September 30,
2016 | | Year Ended
September 30,
2015 | | Year Ended
September 30,
2014 | | Year Ended
September 30,
2013 | | Period Ended
September 30,
2012d | |
Per Share Data | | | | | | | | | | | | | | | |
Net asset value, beginning of period | | $ | 12.52 | | | $ | 12.50 | | | $ | 11.59 | | | $ | 12.58 | | | $ | 11.98 | |
Income (loss) from investment operations: | |
Net investment income (loss)b | | | .16 | | | | .19 | | | | .27 | | | | .28 | | | | .20 | |
Net gain (loss) on investments (realized and unrealized) | | | .35 | | | | .02 | | | | .91 | | | | (.98 | ) | | | .62 | |
Total from investment operations | | | .51 | | | | .21 | | | | 1.18 | | | | (.70 | ) | | | .82 | |
Less distributions from: | |
Net investment income | | | (.17 | ) | | | (.19 | ) | | | (.27 | ) | | | (.29 | ) | | | (.22 | ) |
Total distributions | | | (.17 | ) | | | (.19 | ) | | | (.27 | ) | | | (.29 | ) | | | (.22 | ) |
Net asset value, end of period | | $ | 12.86 | | | $ | 12.52 | | | $ | 12.50 | | | $ | 11.59 | | | $ | 12.58 | |
| | |
Total Returnf | | | 4.06 | % | | | 1.71 | % | | | 10.28 | % | | | (5.70 | %) | | | 7.04 | % |
Ratios/Supplemental Data | |
Net assets, end of period (in thousands) | | $ | 5,008 | | | $ | 2,472 | | | $ | 1,082 | | | $ | 1,495 | | | $ | 1,176 | |
Ratios to average net assets: | |
Net investment income (loss) | | | 1.26 | % | | | 1.54 | % | | | 2.24 | % | | | 2.30 | % | | | 2.36 | % |
Total expenses | | | 1.89 | % | | | 1.87 | % | | | 2.08 | % | | | 1.93 | % | | | 1.94 | % |
Net expensesc,g | | | 1.56 | % | | | 1.56 | % | | | 1.58 | % | | | 1.57 | % | | | 1.55 | % |
Portfolio turnover rate | | | 61 | % | | | 80 | % | | | 173 | % | | | 91 | % | | | 121 | % |
SEE NOTES TO FINANCIAL STATEMENTS. | THE GUGGENHEIM FUNDS ANNUAL REPORT | 87 |
FINANCIAL HIGHLIGHTS (continued) |
This table is presented to show selected data for a share outstanding throughout each period and to assist shareholders in evaluating a Fund’s performance for the periods presented.
P-Class | | Year Ended
September 30,
2016 | | | Period Ended
September 30,
2015e | |
Per Share Data | | | | | | |
Net asset value, beginning of period | | $ | 12.52 | | | $ | 12.64 | |
Income (loss) from investment operations: | |
Net investment income (loss)b | | | .26 | | | | .13 | |
Net gain (loss) on investments (realized and unrealized) | | | .34 | | | | (.12 | ) |
Total from investment operations | | | .60 | | | | .01 | |
Less distributions from: | |
Net investment income | | | (.26 | ) | | | (.13 | ) |
Total distributions | | | (.26 | ) | | | (.13 | ) |
Net asset value, end of period | | $ | 12.86 | | | $ | 12.52 | |
| | |
Total Returnf | | | 4.86 | % | | | 0.06 | % |
Ratios/Supplemental Data | |
Net assets, end of period (in thousands) | | $ | 84 | | | $ | 10 | |
Ratios to average net assets: | |
Net investment income (loss) | | | 2.00 | % | | | 2.46 | % |
Total expenses | | | 1.21 | % | | | 3.17 | % |
Net expensesc,g | | | 0.79 | % | | | 0.81 | % |
Portfolio turnover rate | | | 61 | % | | | 80 | % |
88 | THE GUGGENHEIM FUNDS ANNUAL REPORT | SEE NOTES TO FINANCIAL STATEMENTS. |
FINANCIAL HIGHLIGHTS (concluded) |
This table is presented to show selected data for a share outstanding throughout each period and to assist shareholders in evaluating a Fund’s performance for the periods presented.
Institutional Class | | Year Ended
September 30,
2016 | | | Year Ended
September 30,
2015 | | | Year Ended
September 30,
2014 | | | Year Ended
September 30,
2013 | | | Period Ended
September 30,
2012d | |
Per Share Data | | | | | | | | | | | | | | | |
Net asset value, beginning of period | | $ | 12.53 | | | $ | 12.51 | | | $ | 11.60 | | | $ | 12.59 | | | $ | 11.98 | |
Income (loss) from investment operations: | |
Net investment income (loss)b | | | .29 | | | | .32 | | | | .39 | | | | .40 | | | | .29 | |
Net gain (loss) on investments (realized and unrealized) | | | .34 | | | | .02 | | | | .91 | | | | (.98 | ) | | | .62 | |
Total from investment operations | | | .63 | | | | .34 | | | | 1.30 | | | | (.58 | ) | | | .91 | |
Less distributions from: | |
Net investment income | | | (.29 | ) | | | (.32 | ) | | | (.39 | ) | | | (.41 | ) | | | (.30 | ) |
Total distributions | | | (.29 | ) | | | (.32 | ) | | | (.39 | ) | | | (.41 | ) | | | (.30 | ) |
Net asset value, end of period | | $ | 12.87 | | | $ | 12.53 | | | $ | 12.51 | | | $ | 11.60 | | | $ | 12.59 | |
| | |
Total Returnf | | | 5.11 | % | | | 2.73 | % | | | 11.38 | % | | | (4.76 | %) | | | 7.76 | % |
Ratios/Supplemental Data | |
Net assets, end of period (in thousands) | | $ | 24,126 | | | $ | 8,564 | | | $ | 6,451 | | | $ | 6,343 | | | $ | 1,051 | |
Ratios to average net assets: | |
Net investment income (loss) | | | 2.24 | % | | | 2.53 | % | | | 3.23 | % | | | 3.35 | % | | | 3.37 | % |
Total expenses | | | 0.84 | % | | | 0.89 | % | | | 0.97 | % | | | 0.93 | % | | | 0.86 | % |
Net expensesc,g | | | 0.56 | % | | | 0.56 | % | | | 0.58 | % | | | 0.57 | % | | | 0.55 | % |
Portfolio turnover rate | | | 61 | % | | | 80 | % | | | 173 | % | | | 91 | % | | | 121 | % |
† | Effective January 13, 2012, the Fund acquired all of the assets and liabilities of the TS&W/Claymore Tax-Advantage Balanced Fund (“TYW”), a registered closed-end management investment company. The A-Class financial highlights for the periods prior to that date reflect performance of TYW. |
a | Prior to January 13, 2012, the Fund’s fiscal year end was December 31. Percentage amounts for the period, except total return and portfolio turnover rate, have been annualized. |
b | Net investment income (loss) per share was computed using average shares outstanding throughout the period. |
c | Net expense information reflects the expense ratios after expense waivers. |
d | Since commencement of operations: January 13, 2012. Percentage amounts for the period, except total return and portfolio turnover rate, have been annualized. |
e | Since commencement of operations: May 1, 2015. Percentage amounts for the period, except total return and portfolio turnover rate, have been annualized. |
f | Total return does not reflect the impact of any applicable sales charges and has not been annualized. |
g | Net expenses may include expenses that are excluded from the expense limitation agreement. Excluding these expenses, the operating expense ratios for the years would be: |
| | | 09/30/16 | 09/30/15 | 09/30/14 |
| | A-Class | 0.80% | 0.80% | 0.80% |
| | C-Class | 1.55% | 1.55% | 1.54% |
| | P-Class | 0.78% | 0.81% | — |
| | Institutional Class | 0.55% | 0.55% | 0.55% |
SEE NOTES TO FINANCIAL STATEMENTS. | THE GUGGENHEIM FUNDS ANNUAL REPORT | 89 |
NOTES TO FINANCIAL STATEMENTS |
1. Organization and Significant Accounting Policies
Organization
Guggenheim Funds Trust (the “Trust”), a Delaware statutory trust, is registered with the SEC under the Investment Company Act of 1940 (“1940 Act”), as an open-ended investment company of the series type. Each series, in effect, is representing a separate Fund. The Trust is authorized to issue an unlimited number of shares. The Trust accounts for the assets of each Fund separately.
The Trust offers a combination of four separate classes of shares, A-Class shares, C-Class shares, P-Class shares and Institutional Class shares. Sales of shares of each Class are made without a front-end sales charge at the net asset value per share (“NAV”), with the exception of A-Class shares. A-Class shares are sold at the NAV, plus the applicable front-end sales charge. The sales charge varies depending on the amount purchased, but will not exceed 2.25% for the Limited Duration Fund and 4.00% for the remaining Funds. A-Class share purchases of $1 million or more are exempt from the front-end sales charge but have a 1% contingent deferred sales charge (“CDSC”), if shares are redeemed within 12 months of purchase. B-Class shares previously offered have been converted to A-Class shares effective August 8, 2015 for the funds in the Trust. C-Class shares have a 1% CDSC if shares are redeemed within 12 months of purchase. Institutional Class shares are offered primarily for direct investment by institutions such as pension and profit sharing plans, endowments, foundations and corporations. Institutional Class shares require a minimum initial investment of $2 million and a minimum account balance of $1 million. At September 30, 2016, the Trust consisted of nineteen funds.
As of January 1, 2012, A-Class, C-Class, P-Class and Institutional Class shares of High Yield Fund are subject to a 2% redemption fee when shares are redeemed or exchanged within 90 days of purchase.
This report covers the Diversified Income Fund, High Yield Fund, Investment Grade Bond Fund, Limited Duration Fund, and Municipal Income Fund (the “Funds”), each a diversified investment company.
Guggenheim Investments (“GI”) provides advisory services, and Rydex Fund Services, LLC (“RFS”) provides transfer agent, administrative and accounting services to the Trust. Guggenheim Funds Distributors, LLC (“GFD”) acts as principal underwriter for the Trust. GI and GFD are affiliated entities; RFS ceased to be an affiliate of GI as of October 4, 2016, when it was acquired by MUFG Investor Services. In connection with its acquisition, RFS changed its name to MUFG Investor Services (US), LLC (“MUIS”). This change has no impact on the financial statements of the Funds.
Guggenheim Partners Investment Management (“GPIM”), an affiliate of GI, serves as investment sub-advisor (the “Sub-Advisor”) to the Municipal Income Fund and is responsible for the day-to-day management of the Fund’s portfolio.
Significant Accounting Policies
The Funds operate as investment companies and, accordingly, follow the investment company accounting and reporting guidance of the Financial Accounting Standards Board (“FASB”) Accounting Standards Codification Topic 946 Financial Services – Investment Companies.
The following significant accounting policies are in conformity with U.S. generally accepted accounting principles (“U.S. GAAP”) and are consistently followed by the Trust. This requires management to make estimates and assumptions that affect the reported amount of assets and liabilities, contingent assets and liabilities at the date of the financial statements, and the reported amounts of revenues and expenses during the reporting period. Actual results could differ from these estimates. All time references are based on Eastern Time.
The NAV of each Class of the Funds is calculated by dividing the market value of the Fund’s securities and other assets, less all liabilities, attributable to the Class by the number of outstanding shares of the Class.
A. The Board of Trustees of the Funds (the “Board”) has adopted policies and procedures for the valuation of the Funds’ investments (the “Valuation Procedures”). Pursuant to the Valuation Procedures, the Board has delegated to a valuation committee, consisting of representatives from Guggenheim’s investment management, fund administration, legal and compliance departments (the “Valuation Committee”), the day-to-day responsibility for implementing the Valuation Procedures, including, under most circumstances, the responsibility for determining the fair value of the Funds’ securities and/or other assets.
Valuations of the Funds’ securities are supplied primarily by pricing services appointed pursuant to the processes set forth in the Valuation Procedures. The Valuation Committee convenes monthly, or more frequently as needed, to review the valuation of all assets which have been fair valued for reasonableness. The Funds’ officers, through the Valuation Committee and consistent with the monitoring and review responsibilities set forth in the Valuation Procedures, regularly review procedures used and valuations provided by the pricing services.
If the pricing service cannot or does not provide a valuation for a particular investment or such valuation is deemed unreliable, such investment is fair valued by the Valuation Committee.
90 | THE GUGGENHEIM FUNDS ANNUAL REPORT | |
NOTES TO FINANCIAL STATEMENTS (continued) |
Equity securities listed on an exchange (New York Stock Exchange (“NYSE”) or American Stock Exchange) are valued at the last quoted sales price as of the close of business on the NYSE, usually 4:00 p.m. on the valuation date. Equity securities listed on the NASDAQ market system are valued at the NASDAQ Official Closing Price on the valuation date, which may not necessarily represent the last sale price. If there has been no sale on such exchange or NASDAQ on a given day, the security is valued at the closing bid price on that day.
Generally, trading in foreign securities markets is substantially completed each day at various times prior to the close of the NYSE. The values of foreign securities are determined as of the close of such foreign markets or the close of the NYSE, if earlier. All investments quoted in foreign currencies are valued in U.S. dollars on the basis of the foreign currency exchange rates prevailing at the close of business. Investments in foreign securities may involve risks not present in domestic investments. The Valuation Committee will determine the current value of such foreign securities by taking into consideration certain factors which may include those discussed above, as well as the following factors, among others: the value of the securities traded on other foreign markets, ADR trading, closed-end fund trading, foreign currency exchange activity, and the trading prices of financial products that are tied to foreign securities. In addition, the Board has authorized the Valuation Committee and GI to use prices and other information supplied by a third party pricing vendor in valuing foreign securities.
Open-end investment companies (“mutual funds”) are valued at their NAV as of the close of business, on the valuation date. Exchange-traded funds (“ETFs”) and closed-end investment companies (“CEFs”) are valued at the last quoted sales price.
U.S. Government securities are valued by either independent pricing services, the last traded fill price, or at the reported bid price at the close of business.
Debt securities with a maturity of greater than 60 days at acquisition are valued at prices that reflect broker-dealer supplied valuations or are obtained from independent pricing services, which may consider the trade activity, treasury spreads, yields or price of bonds of comparable quality, coupon, maturity, and type, as well as prices quoted by dealers who make markets in such securities. Short-term debt securities with a maturity of 60 days or less at acquisition are valued at amortized cost, provided such amount approximates market value.
Repurchase agreements are valued at amortized cost, provided such amounts approximate market value.
Typically, loans are valued using information provided by an independent third party pricing service which uses broker quotes in a non-active market.
Investments for which market quotations are not readily available are fair- valued as determined in good faith by GI under the direction of the Board using methods established or ratified by the Board. Valuations in accordance with these methods are intended to reflect each security’s (or asset’s) “fair value.” Each such determination is based on a consideration of all relevant factors, which are likely to vary from one pricing context to another. Examples of such factors may include, but are not limited to: market prices; sale prices; broker quotes; and models which derive prices based on inputs such as prices of securities with comparable maturities and characteristics, or based on inputs such as anticipated cash flows or collateral, spread over Treasuries, and other information analysis.
In connection with futures contracts and other derivative investments, such factors may include obtaining information as to how (a) these contracts and other derivative investments trade in the futures or other derivative markets, respectively, and (b) the securities underlying these contracts and other derivative investments trade in the cash market.
B. Certain U.S. Government and Agency Obligations are traded on a discount basis; the interest rates shown on the Schedules of Investments reflect the effective rates paid at the time of purchase by the Funds. Other securities bear interest at the rates shown, payable at fixed dates through maturity.
C. Senior loans in which the Funds invest generally pay interest rates which are periodically adjusted by reference to a base short-term floating rate, plus a premium. These base lending rates are generally (i) the lending rate offered by one or more major European banks, such as the one-month or three-month London Inter-Bank Offered Rate (LIBOR), (ii) the prime rate offered by one or more major United States banks, or (iii) the bank’s certificate of deposit rate. Senior floating rate interests often require prepayments from excess cash flows or permit the borrower to repay at its election. The rate at which the borrower repays cannot be predicted with accuracy. As a result, the actual remaining maturity may be substantially less than the stated maturities shown. The interest rate indicated is the rate in effect at September 30, 2016.
D. The Funds may purchase and sell interests in securities on a when-issued and delayed delivery basis, with payment and delivery scheduled for a future date. No income accrues to the Fund on such interests or securities in connection with such transactions prior to the date the Funds actually take delivery of such interests or securities. These transactions are subject to market fluctuations and are subject to the risk that the value at delivery may be more
| | THE GUGGENHEIM FUNDS ANNUAL REPORT | 91 |
NOTES TO FINANCIAL STATEMENTS (continued) |
or less than the trade date purchase price. Although the Funds will generally purchase these securities with the intention of acquiring such securities, they may sell such securities before the settlement date.
E. Upon entering into a futures contract, a Fund deposits and maintains as collateral such initial margin as required by the exchange on which the transaction is affected. Pursuant to the contract, the Fund agrees to receive from or pay to the broker an amount of cash equal to the daily fluctuation in value of the contract. Such receipts or payments are known as variation margin and are recorded by the Fund as unrealized gains or losses. When the contract is closed, the Fund records a realized gain or loss equal to the difference between the value of the contract at the time it was opened and the value at the time it was closed.
F. Forward foreign currency exchange contracts are valued daily based on the applicable exchange rate of the underlying currency. The change in value of the contract is recorded as unrealized appreciation or depreciation until the contract is closed. When the contract is closed, the Funds record a realized gain or loss equal to the difference between the value at the time the contract was opened and the value at the time it was closed.
G. Security transactions are recorded on the trade date for financial reporting purposes. Realized gains and losses from securities transactions are recorded using the identified cost basis. Proceeds from lawsuits related to investment holdings are recorded as realized gains in the respective Fund. Dividend income is recorded on the ex-dividend date, net of applicable taxes withheld by foreign countries. Taxable non-cash dividends are recorded as dividend income. Interest income, including amortization of premiums and accretion of discounts, is accrued on a daily basis. Interest income also includes paydown gains and losses on mortgage-backed and asset-backed securities and senior and subordinated loans. Amendment fees are earned as compensation for evaluating and accepting changes to the original loan agreement and are recognized when received. Dividend income from REITs is recorded based on the income included in the distributions received from the REIT investments using published REIT classifications, including some management estimates when actual amounts are not available. Distributions received in excess of this estimated amount are recorded as a reduction of the cost of investments or reclassified to capital gains. The actual amounts of income, return of capital, and capital gains are only determined by each REIT after its fiscal year-end, and may differ from the estimated amounts.
H. The Funds declare dividends from investment income daily, except the Diversified Income Fund, which declares monthly. Each Fund pays its shareholders from its net investment income monthly and distributes any net capital gains that it has realized, at least annually. Distributions to shareholders are recorded on the ex-dividend date. Dividends are reinvested in additional shares unless shareholders request payment in cash. The character of distributions made during the year from net investment income or net realized gains may differ from their ultimate characterization for federal income tax purposes.
I. Interest and dividend income, most expenses, all realized gains and losses, and all unrealized gains and losses are allocated to the classes based upon the value of the outstanding shares in each Class. Certain costs, such as distribution and service fees are charged directly to specific classes. In addition, certain expenses have been allocated to the individual Funds in the Trust on a pro rata basis upon the respective aggregate net assets of each Fund included in the Trust.
J. Under the fee arrangement with the custodian, the Funds may earn credits based on overnight custody cash balances. These credits are utilized to reduce related custodial expenses. The custodian fees disclosed in the Statement of Operations are before the reduction in expense from the related earnings credits, if any. For the year ended September 30, 2016, there were no earnings credits received.
K. The Funds may leave cash overnight in their cash account with the custodian. Periodically, a Fund may have cash due to the custodian bank as an overdraft balance. A fee is incurred on this overdraft, calculated by multiplying the overdraft by a rate based on the federal funds rate, which was 0.29% at September 30, 2016.
L. The accounting records of the Funds are maintained in U.S. dollars. All assets and liabilities initially expressed in foreign currencies are converted into U.S. dollars at prevailing exchange rates. Purchases and sales of investment securities, dividend and interest income, and certain expenses are translated at the rates of exchange prevailing on the respective dates of such transactions. Changes in the relationship of these foreign currencies to the U.S. dollar can significantly affect the value of the investments and earnings of the Funds. Foreign investments may also subject the Funds to foreign government exchange restrictions, expropriation, taxation or other political, social or economic developments, all of which could affect the market and/or credit risk of the investments. The Funds do not isolate that portion of the results of operations resulting from changes in the foreign exchange rates on investments from the fluctuations arising from changes in the market prices of securities held. Such fluctuations are included with the net realized and unrealized gain or loss on investments. Reported net realized foreign exchange gains and losses arise from sales of foreign currencies and currency gains or losses realized between the trade and settlement dates on investment transactions. Net unrealized exchange gains and losses arise from changes in the fair values of assets and liabilities other than investments in securities at the fiscal period end, resulting from changes in exchange rates.
92 | THE GUGGENHEIM FUNDS ANNUAL REPORT | |
NOTES TO FINANCIAL STATEMENTS (continued) |
M. Under the Funds’ organizational documents, the Trustees and Officers are indemnified against certain liabilities arising out of the performance of their duties to the Trust. In addition, throughout the normal course of business, the Funds enter into contracts that contain a variety of representations and warranties which provide general indemnifications. The Funds’ maximum exposure under these arrangements is unknown, as this would involve future claims that may be made against the Funds and/or their affiliates that have not yet occurred. However, based on experience, the Funds expect the risk of loss to be remote.
2. Financial Instruments and Derivatives
As part of their investment strategy, the Funds utilize a variety of derivative instruments. These investments involve, to varying degrees, elements of market risk and risks in excess of the amounts recognized in the Statements of Assets and Liabilities. Valuation and accounting treatment of these instruments can be found under Significant Accounting Policies in Note 1 of these Notes to Financial Statements.
Derivatives
Derivatives are instruments whose values depend on, or are derived from, in whole or in part, the value of one or more other assets, such as securities, currencies, commodities or indices. Derivative instruments may be used to increase investment flexibility (including to maintain cash reserves while maintaining exposure to certain other assets), for risk management (hedging) purposes, to facilitate trading, to reduce transaction costs and to pursue higher investment returns. Derivative instruments may also be used to mitigate certain investment risks, such as foreign currency exchange rate risk, interest rate risk and credit risk. U.S. GAAP requires disclosures to enable investors to better understand how and why a Fund uses derivative instruments, how these derivative instruments are accounted for and their effects on the Fund’s financial position and results of operations. The Funds may utilize derivatives for the following purposes:
Duration: the use of an instrument to manage the interest rate risk of a portfolio.
Hedge: an investment made in order to reduce the risk of adverse price movements in a security, by taking an offsetting position to protect against broad market moves.
Options Purchased and Written
A call option on a security gives the purchaser of the option the right to buy, and the writer of a call option the obligation to sell, the underlying security. The purchaser of a put option has the right to sell, and the writer of the put option the obligation to buy, the underlying security at any time during the option period. The risk associated with purchasing options is limited to the premium originally paid.
The following table represents the Funds’ use and volume of call/put options purchased on a quarterly basis:
Fund | Use | Average Number of Contracts |
Investment Grade Bond Fund | Duration, Hedge | 145 |
Limited Duration Fund | Duration, Hedge | 264 |
The risk in writing a call option is that a Fund may incur a loss if the market price of the underlying security increases and the option is exercised. The risk in writing a put option is that a Fund may incur a loss if the market price of the underlying security decreases and the option is exercised. In addition, there may be an imperfect correlation between the movement in prices of options and the underlying securities where a Fund may not be able to enter into a closing transaction because of an illiquid secondary market; or, for OTC options, the Fund may be at risk because of the counterparty’s inability to perform.
The following tables represent the Funds’ use and activity of options written for the year ended September 30, 2016:
Fund | | Use |
Investment Grade Bond Fund | | Duration, Hedge |
Limited Duration Fund | | Duration, Hedge |
| | THE GUGGENHEIM FUNDS ANNUAL REPORT | 93 |
NOTES TO FINANCIAL STATEMENTS (continued) |
| | | Limited Duration Fund | | | Investment Grade Bond Fund | |
| | | Number of
Contracts | | | Premium
Amount | | | Number of
Contracts | | | Premium
Amount | |
Balance at September 30, 2015 | | | 1,056 | | | $ | 28,511 | | | | 581 | | | $ | 15,663 | |
Options Written | | | — | | | | — | | | | — | | | | — | |
Options terminated in closing purchase transactions | | | — | | | | — | | | | — | | | | — | |
Options expired | | | (1,056 | ) | | | (28,511 | ) | | | (581 | ) | | | (15,663 | ) |
Options exercised | | | — | | | | — | | | | — | | | | — | |
Balance at September 30, 2016 | | | — | | | $ | — | | | | — | | | $ | — | |
Futures
A futures contract is an agreement to purchase (long) or sell (short) an agreed amount of securities or other instruments at a set price for delivery at a future date. There are significant risks associated with a Fund’s use of futures contracts, including (i) there may be an imperfect or no correlation between the changes in market value of the underlying asset and the prices of futures contracts; (ii) there may not be a liquid secondary market for a futures contract; (iii) trading restrictions or limitations may be imposed by an exchange; and (iv) government regulations may restrict trading in futures contracts. When investing in futures, there is minimal counterparty credit risk to a Fund because futures are exchange traded and the exchange’s clearinghouse, as counterparty to all exchange-traded futures, guarantees against default. Cash deposits are shown as segregated cash with broker on the Statements of Assets and Liabilities; securities held as collateral are noted on the Schedules of Investments.
The following table represents the Funds’ use and volume of futures on a quarterly basis:
| | | | Average Notional | |
Fund | Use | | Long | | | Short | |
Diversified Income Fund | Hedge | | $ | — | | | $ | 239,225 | |
Forward Foreign Currency Exchange Contracts
A forward foreign currency exchange contract is an agreement between two parties to exchange two designated currencies at a specific time in the future. Certain types of contracts may be cash settled, in an amount equal to the change in exchange rates during the term of the contract. The contracts can be used to hedge or manage exposure to foreign currency risks with portfolio investments or to gain exposure to foreign currencies.
The market value of a forward foreign currency exchange contract changes with fluctuations in foreign currency exchange rates. Furthermore, the Funds may be exposed to risk if the counterparties cannot meet the contract terms or if the currency value changes unfavorably as compared to the U.S. dollar.
The following table represents the Funds’ use and volume of forward currency exchange contracts on a quarterly basis:
| | | | Average Settlement | |
Fund | Use | | Purchased | | | Sold | |
High Yield Fund | Hedge | | $ | 13,948,694 | | | $ | 347,220 | |
Derivative Investment Holdings Categorized by Risk Exposure
The following is a summary of the location of derivative investments on the Funds’ Statements of Assets and Liabilities as of September 30, 2016:
Derivative Investment Type | Asset Derivatives | Liability Derivatives |
Currency contracts | Unrealized appreciation on forward foreign currency exchange contracts | Unrealized depreciation on forward foreign currency exchange contracts |
94 | THE GUGGENHEIM FUNDS ANNUAL REPORT | |
NOTES TO FINANCIAL STATEMENTS (continued) |
The following table sets forth the fair value of the Funds’ derivative investments categorized by primary risk exposure at September 30, 2016:
Asset Derivative Investments Value | |
Fund | | Forward
Foreign
Currency
Exchange
Contracts | | | Total Value at
September 30,
2016 | |
High Yield Fund | | $ | 100,664 | | | $ | 100,664 | |
Liability Derivative Investments Value | |
Fund | | Forward
Foreign
Currency
Exchange
Contracts | | | Total Value at
September 30,
2016 | |
High Yield Fund | | $ | 17,024 | | | $ | 17,024 | |
The following is a summary of the location of derivative investments on the Funds’ Statements of Operations for the year ended September 30, 2016:
Derivative Investment Type | Location of Gain (Loss) on Derivatives |
Equity/Currency/Interest Rate contracts | Net realized gain (loss) on futures contracts |
| Net change in unrealized appreciation (depreciation) on futures contracts |
| Net realized gain (loss) on forward foreign currency exchange contracts |
| Net change in unrealized appreciation (depreciation) on on forward foreign currency exchange contracts |
| Net realized gain (loss) on options purchased |
| Net change in unrealized appreciation (depreciation) on options purchased |
| Net realized gain (loss) on options written |
| Net change in unrealized appreciation (depreciation) on options written |
The following is a summary of the Funds’ realized gain (loss) and change in unrealized appreciation (depreciation) on derivative investments recognized on the Statements of Operations categorized by primary risk exposure for the year ended September 30, 2016:
Realized Gain (Loss) on Derivative Investments Recognized on the Statements of Operations | |
Fund | | Futures
Equity
Contracts | | | Options
Written
Interest Rate
Contracts | | | Options
Purchased
Interest Rate
Contracts | | | Forward
Foreign
Currency
Exchange
Contracts | | | Total | |
Diversified Income Fund | | $ | (34,759 | ) | | $ | — | | | $ | — | | | $ | — | | | $ | (34,759 | ) |
High Yield Fund | | | — | | | | — | | | | — | | | | 659,439 | | | | 659,439 | |
Investment Grade Bond Fund | | | (49,847 | ) | | | 15,664 | | | | (57,363 | ) | | | 5 | | | | (91,541 | ) |
Limited Duration Fund | | | — | | | | 28,511 | | | | (104,173 | ) | | | — | | | | (75,662 | ) |
| | THE GUGGENHEIM FUNDS ANNUAL REPORT | 95 |
NOTES TO FINANCIAL STATEMENTS (continued) |
Change in Unrealized Appreciation (Depreciation) on Derivative Investments Recognized on the Statements of Operations | |
Fund | | Futures
Equity
Contracts | | | Options
Written
Interest Rate
Contracts | | | Options
Purchased
Interest Rate
Contracts | | | Forward
Foreign
Currency
Exchange
Contracts | | | Total | |
High Yield Fund | | $ | — | | | $ | — | | | $ | — | | | $ | 104,576 | | | $ | 104,576 | |
Investment Grade Bond Fund | | | — | | | | 7,577 | | | | (42,971 | ) | | | — | | | | (35,394 | ) |
Limited Duration Fund | | | — | | | | 13,729 | | | | (78,144 | ) | | | — | | | | (64,415 | ) |
In conjunction with the use of short sales and derivative instruments, the Funds are required to maintain collateral in various forms. The Funds use, where appropriate, depending on the financial instrument utilized and the broker involved, margin deposits at the broker, cash and/or securities segregated at the custodian bank, discount notes or the repurchase agreements allocated to the Funds.
The Trust has established counterparty credit guidelines and enters into transactions only with financial institutions of investment grade or better. The Trust monitors the counterparty credit risk.
3. Fees and Other Transactions with Affiliates
Under the terms of an investment advisory contract, the Funds pay GI investment advisory fees calculated at the annualized rates below, based on the average daily net assets of the Funds:
Fund | Management Fees
(as a % of Net Assets) |
Diversified Income Fund | 0.75% |
High Yield Fund | 0.60% |
Investment Grade Bond Fund | 0.50% |
Limited Duration Fund | 0.45% |
Municipal Income Fund | 0.50% |
RFS was paid the following for providing transfer agent services to the Funds. Transfer agent fees were assessed to the applicable class of each Fund.
Annual charge per account | $5.00 – $8.00 |
Transaction fee | $0.60 – $1.10 |
Minimum annual charge per Fund† | $25,000 |
Certain out-of-pocket charges | Varies |
† | Not subject to the Funds during the first twelve months of operations. |
RFS also acted as the administrative agent for the Funds. As such it performed administrative, bookkeeping, accounting and pricing functions for each Fund. For these services, RFS received the following:
Fund | Fund Accounting/
Administrative Fees
(as a % of Net Assets) |
Diversified Income Fund | 0.095% |
High Yield Fund | 0.095% |
Investment Grade Bond Fund | 0.095% |
Limited Duration Fund | 0.095% |
Municipal Income Fund | 0.095% |
| | |
Minimum annual charge per Fund | $25,000 |
Certain out-of-pocket charges | Varies |
96 | THE GUGGENHEIM FUNDS ANNUAL REPORT | |
NOTES TO FINANCIAL STATEMENTS (continued) |
GI engages external service providers to perform other necessary services for the Trust, such as audit and accounting related services, legal services, custody, printing and mailing, etc., on a pass-through basis. Such expenses are allocated to various Funds within the complex based on relative net assets.
The Funds have adopted Distribution Plans related to the offering of A-Class, C-Class and P-Class shares pursuant to Rule 12b-1 under the 1940 Act. The plans provide for payments at an annual rate of 0.25% of the average daily net assets of each Fund’s A-Class and P-Class shares, and 1.00% of the average daily net assets of each Fund’s C-Class shares.
The investment advisory contracts for the following Funds provide that the total expenses be limited to a percentage of average net assets for each class of shares, exclusive of brokerage costs, dividends on securities sold short, expenses of other investment companies in which a Fund invests, interest, taxes, litigation, indemnification and extraordinary expenses. The limits are listed below:
| | Limit | Effective
Date | Contract
End Date |
Diversified Income Fund — A-Class** | 1.30% | 01/29/16 | 02/01/17 |
Diversified Income Fund — C-Class** | 2.05% | 01/29/16 | 02/01/17 |
Diversified Income Fund — P-Class** | 1.30% | 01/29/16 | 02/01/17 |
Diversified Income Fund — Institutional Class** | 1.05% | 01/29/16 | 02/01/17 |
High Yield Fund — A-Class | 1.16% | 11/30/12 | 02/01/17 |
High Yield Fund — C-Class | 1.91% | 11/30/12 | 02/01/17 |
High Yield Fund — P-Class* | 1.16% | 05/01/15 | 02/01/17 |
High Yield Fund — Institutional Class | 0.91% | 11/30/12 | 02/01/17 |
Investment Grade Bond Fund — A-Class | 1.00% | 11/30/12 | 02/01/17 |
Investment Grade Bond Fund — C-Class | 1.75% | 11/30/12 | 02/01/17 |
Investment Grade Bond Fund — P-Class* | 1.00% | 05/01/15 | 02/01/17 |
Investment Grade Bond Fund — Institutional Class | 0.75% | 11/30/12 | 02/01/17 |
Limited Duration Fund — A-Class | 0.80% | 12/01/13 | 02/01/17 |
Limited Duration Fund — C-Class | 1.55% | 12/01/13 | 02/01/17 |
Limited Duration Fund — P-Class* | 0.80% | 05/01/15 | 02/01/17 |
Limited Duration Fund — Institutional Class | 0.55% | 12/01/13 | 02/01/17 |
Municipal Income Fund — A-Class | 0.80% | 11/30/12 | 02/01/17 |
Municipal Income Fund — C-Class | 1.55% | 11/30/12 | 02/01/17 |
Municipal Income Fund — P-Class* | 0.80% | 05/01/15 | 02/01/17 |
Municipal Income Fund — Institutional Class | 0.55% | 11/30/12 | 02/01/17 |
* | Since the commencement of operations: May 1, 2015 |
** | Since the commencement of operations: January 29, 2016 |
| | THE GUGGENHEIM FUNDS ANNUAL REPORT | 97 |
NOTES TO FINANCIAL STATEMENTS (continued) |
GI is entitled to reimbursement by the Funds for fees waived or expenses reimbursed during any of the previous 36 months, beginning on the date of the expense limitation agreement, if on any day the estimated operating expenses are less than the indicated percentages. At September 30, 2016, the amount of fees waived or expenses reimbursed that are subject to recoupment are presented in the following table:
Fund | | Expires
2017 | | | Expires
2018 | | | Expires
2019 | | | Fund
Total | |
Diversified Income Fund | | | | | | | | | | | | |
A-Class | | $ | — | | | $ | — | | | $ | 1,574 | | | $ | 1,574 | |
C-Class | | | — | | | | — | | | | 1,435 | | | | 1,435 | |
P-Class | | | — | | | | — | | | | 1,339 | | | | 1,339 | |
Institutional Class | | | — | | | | — | | | | 61,811 | | | | 61,811 | |
High Yield Fund | | | | | | | | | | | | | | | | |
A-Class | | $ | 58,145 | | | $ | 54,498 | | | $ | 12,450 | | | $ | 125,093 | |
C-Class | | | 10,598 | | | | 9,486 | | | | 4,537 | | | | 24,621 | |
P-Class | | | — | | | | — | | | | — | | | | — | |
Institutional Class | | | 0 | | | | — | | | | 11,528 | | | | 11,528 | |
Investment Grade Bond Fund | | | | | | | | | | | | | | | | |
A-Class | | $ | 128,797 | | | $ | 109,791 | | | $ | 73,385 | | | $ | 311,973 | |
C-Class | | | 35,654 | | | | 40,125 | | | | 35,023 | | | | 110,802 | |
P-Class | | | — | | | | 49 | | | | — | | | | 49 | |
Institutional Class | | | 26 | | | | 7,323 | | | | — | | | | 7,349 | |
Limited Duration Fund | | | | | | | | | | | | | | | | |
A-Class | | $ | 10,320 | | | $ | 66,925 | | | $ | 171,814 | | | $ | 249,059 | |
C-Class | | | 1,619 | | | | 5,382 | | | | 31,279 | | | | 38,280 | |
P-Class | | | — | | | | 338 | | | | 1,840 | | | | 2,178 | |
Institutional Class | | | 130,285 | | | | 107,741 | | | | 287,680 | | | | 525,706 | |
Municipal Income Fund | | | | | | | | | | | | | | | | |
A-Class | | $ | 211,139 | | | $ | 181,845 | | | $ | 178,718 | | | $ | 571,702 | |
C-Class | | | 4,679 | | | | 6,114 | | | | 13,957 | | | | 24,750 | |
P-Class | | | — | | | | 96 | | | | 169 | | | | 265 | |
Institutional Class | | | 26,455 | | | | 26,091 | | | | 36,640 | | | | 89,186 | |
If a Fund invests in an affiliated fund, the investing Fund’s adviser has agreed to waive fees at the investing fund level. Fee waivers will be calculated at the investing Fund level without regard to any expense cap, if any, in effect for the investing Fund. Fees waived under this arrangement are not subject to reimbursement to GI. For the year September 30, 2016, the Diversified Income Fund and Limited Duration Fund waived $18,122 and $8,742, respectively, related to investments in affiliated funds.
For the year ended September 30, 2016, GFD retained sales charges of $566,973 relating to sales of A-Class shares of the Trust.
Certain trustees and officers of the Trust are also officers of GI and GFD.
At September 30, 2016, GI and its affiliates owned over twenty percent of the outstanding shares of the Funds, as follows:
Fund | Percent of
outstanding shares owned |
Diversified Income Fund | 99% |
Investment Grade Bond Fund | 38% |
4. Fair Value Measurement
In accordance with U.S. GAAP, fair value is defined as the price that the Funds would receive to sell an investment or pay to transfer a liability in an orderly transaction with an independent buyer in the principal market, or in the absence of a principal market, the most advantageous market for the investment or liability. U.S. GAAP establishes a three-tier fair value hierarchy based on the types of inputs used to value assets and liabilities and requires corresponding disclosure. The hierarchy and the corresponding inputs are summarized below:
Level 1 — | quoted prices in active markets for identical assets or liabilities. |
98 | THE GUGGENHEIM FUNDS ANNUAL REPORT | |
NOTES TO FINANCIAL STATEMENTS (continued) |
Level 2 — | significant other observable inputs (for example quoted prices for securities that are similar based on characteristics such as interest rates, prepayment speeds, credit risk, etc.). |
Level 3 — | significant unobservable inputs based on the best information available under the circumstances, to the extent observable inputs are not available, which may include assumptions. |
The types of inputs available depend on a variety of factors, such as the type of security and the characteristics of the markets in which it trades, if any. Fair valuation determinations that rely on fewer or no observable inputs require greater judgment. Accordingly, fair value determinations for Level 3 securities require the greatest amount of judgment.
Independent pricing services are used to value a majority of the Funds’ investments. When values are not available from a pricing service, they may be computed by the Funds’ investment adviser or an affiliate. In any event, values may be determined using a variety of sources and techniques, including: market prices; broker quotes; and models which derive prices based on inputs such as prices of securities with comparable maturities and characteristics or based on inputs such as anticipated cash flows or collateral, spread over Treasuries, and other information and analysis. A significant portion of the Funds’ assets and liabilities are categorized as Level 2 or Level 3, as indicated in this report.
Indicative quotes from broker-dealers, adjusted for fluctuations in criteria such as credit spreads and interest rates, may be also used to value the Funds’ assets and liabilities, i.e. prices provided by a broker-dealer or other market participant who has not committed to trade at that price. Although indicative quotes are typically received from established market participants, the Funds may not have the transparency to view the underlying inputs which support the market quotations. Significant changes in an indicative quote would generally result in significant changes in the fair value of the security.
Certain fixed income securities are valued by obtaining a monthly indicative quote from a broker-dealer, adjusted for fluctuations in criteria such as credit spreads and interest rates.
The inputs or methodologies used for valuing securities are not necessarily an indication of the risk associated with investing in those securities. The suitability of the techniques and sources employed to determine fair valuation are regularly monitored and subject to change.
5. Reverse Repurchase Agreements
Each of the Funds may enter into reverse repurchase agreements. Under a reverse repurchase agreement, a Fund sells securities and agrees to repurchase them at a particular price at a future date. In the event the buyer of securities under a reverse repurchase agreement files for bankruptcy or becomes insolvent, such buyer or its trustee or receiver may receive an extension of time to determine whether to enforce the Fund’s obligation to repurchase the securities, and the Fund’s use of the proceeds of the reverse repurchase agreement may effectively be restricted pending such decision.
For the year ended September 30, 2016, the following Funds entered into reverse repurchase agreements:
Fund | | Number of Days
Outstanding | | | Balance at
September 30, 2016 | | | Average Balance
Outstanding | | | Average
Interest Rate | |
High Yield Fund | | | 366 | | | $ | 34,559,482 | | | $ | 17,553,975 | | | | 0.76 | % |
The following table presents reverse repurchase agreements that are subject to netting arrangements and offset in the Statements of Assets of Liabilities in conformity with U.S. GAAP:
| | THE GUGGENHEIM FUNDS ANNUAL REPORT | 99 |
NOTES TO FINANCIAL STATEMENTS (continued) |
| | | | | | | | | | | | | Gross Amounts Not Offset
in the Statements of
Assets and Liabilities | | | | |
Fund | Instrument | | Gross Amounts of Recognized Liabilities | | | Gross Amounts Offset In the Statements of Assets and Liabilities | | | Net Amount
of Liabilities Presented on the Statements
of Assets and
Liabilities | | | Financial Instruments | | | Cash
Collateral
Received | | | Net
Amount | |
High Yield Fund | Reverse repurchase agreements | | $ | 34,559,482 | | | $ | — | | | $ | 34,559,482 | | | $ | 34,559,482 | | | $ | — | | | $ | — | |
The following is a summary of the remaining contractual maturities of the reverse repurchase agreements outstanding as of year-end, aggregated by asset class of the related collateral pledged by the Fund:
| | | Overnight and Continuous | | | Up to 30 days | | | 31-90 days | | | Total | |
High Yield Fund | | | | | | | | | | | | |
Corporate Bonds | | $ | 13,401,581 | | | $ | 20,425,901 | | | $ | 732,000 | | | $ | 34,559,482 | |
Gross amount of recognized liabilities for reverse repurchase agreements | | | | | | | | | | | | | | $ | 34,559,482 | |
6. Federal Income Tax Information
The Funds intend to comply with the provisions of Subchapter M of the Internal Revenue Code applicable to regulated investment companies and will distribute substantially all taxable net investment income and capital gains sufficient to relieve the Funds from all, or substantially all, federal income, excise and state income taxes. Therefore, no provision for federal or state income tax is required.
Tax positions taken or expected to be taken in the course of preparing the Funds’ tax returns are evaluated to determine whether the tax positions are “more-likely-than-not” of being sustained by the applicable tax authority. Tax positions not deemed to meet the more-likely-than-not threshold would be recorded as a tax benefit or expense in the current year. Management has analyzed the Funds’ tax positions taken, or to be taken, on federal income tax returns for all open tax years, and has concluded that no provision for income tax is required in the Funds’ financial statements. The Funds’ federal tax returns are subject to examination by the Internal Revenue Service for a period of three years after they are filed.
Tax basis capital losses in excess of capital gains are carried forward to offset future net capital gains.
For the year ended September 30, 2016, the following capital loss carryforward amounts were used or expired:
Fund | | Amount | |
Investment Grade Bond Fund | | $ | 7,628,175 | |
Limited Duration Fund | | | 312,536 | |
Municipal Income Fund | | | 432,631 | |
The tax character of distributions paid during the year ended September 30, 2016 was as follows:
Fund | | Ordinary
Income | | | Tax-Exempt
Income | | | Long-Term
Capital Gain | | | Total
Distributions | |
Diversified Income Fund | | $ | 144,751 | | | $ | — | | | $ | — | | | $ | 144,751 | |
High Yield Fund | | | 14,497,940 | | | | — | | | | — | | | | 14,497,940 | |
Investment Grade Bond Fund | | | 7,061,491 | | | | — | | | | — | | | | 7,061,491 | |
Limited Duration Fund | | | 15,525,625 | | | | — | | | | — | | | | 15,525,625 | |
Municipal Income Fund | | | 134,138 | | | | 1,230,749 | | | | — | | | | 1,364,887 | |
The tax character of distributions paid during the year ended September 30, 2015 was as follows:
100 | THE GUGGENHEIM FUNDS ANNUAL REPORT | |
NOTES TO FINANCIAL STATEMENTS (continued) |
Fund | | Ordinary
Income | | | Tax-Exempt
Income | | | Long-Term
Capital Gain | | | Total
Distributions | |
High Yield Fund | | $ | 10,220,862 | | | $ | — | | | $ | 2,170,457 | | | $ | 12,391,319 | |
Investment Grade Bond Fund | | | 5,831,739 | | | | — | | | | — | | | | 5,831,739 | |
Limited Duration Fund | | | 5,627,742 | | | | — | | | | — | | | | 5,627,742 | |
Municipal Income Fund | | | 128,018 | | | | 1,248,231 | | | | — | | | | 1,376,249 | |
Diversified Income Fund commenced operations on January 29, 2016.
Note: For federal income tax purposes, short-term capital gain distributions are treated as ordinary income distributions.
Tax components of accumulated earnings/(deficit) as of September 30, 2016, were as follows:
Fund | | Undistributed
Ordinary
Income | | | Undistributed
Tax-Exempt
Income | | | Undistributed
Long-Term
Capital Gain | | | Net Unrealized
Appreciation/
(Depreciation) | | | Accumulated
Capital and
Other Losses | | | Other Temporary
Differences | |
Diversified Income Fund | | $ | 66,533 | | | $ | — | | | $ | — | | | $ | 361,929 | | | $ | — | | | $ | — | |
High Yield Fund | | | 1,048,574 | | | | — | | | | — | | | | 2,093,068 | | | | (5,137,575 | ) | | | (1,326,327 | ) |
Investment Grade Bond Fund | | | 508,297 | | | | — | | | | — | | | | 873,715 | | | | (21,226,085 | ) | | | (575,727 | ) |
Limited Duration Fund | | | 1,679,788 | | | | — | | | | — | | | | 2,566,062 | | | | (14,848 | ) | | | (1,486,568 | ) |
Municipal Income Fund | | | — | | | | 109,402 | | | | — | | | | 2,865,589 | | | | (27,494,844 | ) | | | (109,403 | ) |
For Federal income tax purposes, capital loss carryforwards represent realized losses of the Funds that may be carried forward and applied against future capital gains. For taxable years beginning on or before December 22, 2010, such capital losses may be carried forward for a maximum of eight years. Under the RIC Modernization Act of 2010, the Funds are permitted to carry forward capital losses incurred in taxable years beginning after December 22, 2010 for an unlimited period. However, any losses incurred during those taxable years must be utilized prior to the losses incurred in pre-enactment taxable years. As a result of this ordering rule, pre-enactment capital loss carryforwards may be more likely to expire unused. Additionally, post-enactment capital losses that are carried forward will retain their character as either short-term or long-term capital losses rather than being considered all short-term as under previous law. As of September 30, 2016, capital loss carryforwards for the Funds were as follows:
Fund | | Expires in
2016 | | | Expires in
2017 | | | Expires in
2018 | | | Unlimited Short-Term | | | Unlimited Long-Term | | | Total
Capital Loss Carryforward | |
Diversified Income Fund | | $ | — | | | $ | — | | | $ | — | | | $ | — | | | $ | — | | | $ | — | |
High Yield Fund | | | — | | | | — | | | | — | | | | — | | | | (5,137,575 | ) | | | (5,137,575 | ) |
Investment Grade Bond Fund | | | — | | | | (17,929,397 | ) | | | (1,528,707 | ) | | | — | | | | (1,767,981 | ) | | | (21,226,085 | ) |
Limited Duration Fund | | | — | | | | — | | | | — | | | | — | | | | (14,848 | ) | | | (14,848 | ) |
Guugenheim Municipal Income Fund | | | — | | | | (27,494,844 | ) | | | — | | | | — | | | | — | | | | (27,494,844 | ) |
As of September 30, 2016 the following reclassifications were made to the capital accounts of the Funds, to reflect permanent book/tax differences and income and gains available for distributions under income tax regulations, which are primarily due to the inherent differences between book and tax treatment of foreign currency reclasses, income accruals on certain investments, bond premium/discount amortization adjustments, non-deductible organization costs, income recharacterization from investments and paydown reclasses. Net investment income, net realized gains and net assets were not affected by these changes.
| | THE GUGGENHEIM FUNDS ANNUAL REPORT | 101 |
NOTES TO FINANCIAL STATEMENTS (continued) |
On the Statements of Assets and Liabilities the following adjustments were made for permanent book/tax differences:
Fund | | Paid In
Capital | | | Undistributed
Net Investment
Income | | | Accumulated
Net Realized
Gain (Loss) | |
Diversified Income Fund | | $ | (364 | ) | | $ | (1,615 | ) | | $ | 1,979 | |
High Yield Fund | | | 1 | | | | 343,852 | | | | (343,853 | ) |
Investment Grade Bond Fund | | | (7,628,177 | ) | | | 14,007 | | | | 7,614,170 | |
Limited Duration Fund | | | — | | | | 28,295 | | | | (28,295 | ) |
Municipal Income Fund | | | — | | | | — | | | | — | |
At September 30, 2016, the cost of securities for Federal income tax purposes, the aggregate gross unrealized gain for all securities for which there was an excess of value over tax cost and the aggregate gross unrealized loss for all securities for which there was an excess of tax cost over value, were as follows:
Fund | | Tax
Cost | | | Tax
Unrealized
Gain | | | Tax
Unrealized
Loss | | | Net
Unrealized
Gain | |
Diversified Income Fund | | $ | 5,195,113 | | | $ | 362,904 | | | $ | (975 | ) | | $ | 361,929 | |
High Yield Fund | | | 298,531,724 | | | | 10,573,614 | | | | (9,061,767 | ) | | | 1,511,847 | |
Investment Grade Bond Fund | | | 281,832,998 | | | | 6,532,894 | | | | (5,659,179 | ) | | | 873,715 | |
Limited Duration Fund | | | 701,673,648 | | | | 6,508,308 | | | | (3,942,246 | ) | | | 2,566,062 | |
Municipal Income Fund | | | 68,030,622 | | | | 3,069,098 | | | | (203,509 | ) | | | 2,865,589 | |
7. Securities Transactions
For the year ended September 30, 2016, the cost of purchases and proceeds from sales of investment securities, excluding government securities, short-term investments and derivatives, were as follows:
Fund | | Purchases | | | Sales | |
Diversified Income Fund | | $ | 9,388,153 | | | $ | 4,351,034 | |
High Yield Fund | | | 244,672,731 | | | | 127,045,939 | |
Investment Grade Bond Fund | | | 209,749,417 | | | | 111,672,734 | |
Limited Duration Fund | | | 551,736,786 | | | | 188,021,983 | |
Municipal Income Fund | | | 43,347,513 | | | | 36,909,255 | |
For the year ended September 30, 2016, the cost of purchases and proceeds from sales of government securities were as follows:
Fund | | Purchases | | | Sales | |
Investment Grade Bond Fund | | $ | 76,542,357 | | | $ | 77,358,248 | |
The Funds are permitted to purchase or sell securities from or to certain affiliated funds under specified conditions outlined in procedures adopted by the Board. The procedures have been designed to ensure that any purchase or sale of securities by a Fund from or to another fund or portfolio that is or could be considered an affiliate by virtue of having a common investment adviser (or affiliated investment advisers), common Trustees and/or common officers complies with Rule 17a-7 of the 1940 Act. Further, as defined under these procedures, each transaction is effected at the current market price to save costs, where permissible. For the year ended September 30, 2016, the Funds engaged in purchases and sales of securities, pursuant to Rule 17a-7 of the 1940 Act, as follows:
Fund | | Purchases | | | Sales | | | Realized
Gain (Loss) | |
High Yield Fund | | $ | 10,726,283 | | | $ | 4,223,335 | | | $ | 68,785 | |
Investment Grade Bond Fund | | | 1,303,311 | | | | 380,359 | | | | 9,388 | |
Limited Duration Fund | | | 3,619,553 | | | | 2,226,125 | | | | 33,258 | |
102 | THE GUGGENHEIM FUNDS ANNUAL REPORT | |
NOTES TO FINANCIAL STATEMENTS (continued) |
8. Affiliated Transactions
Investments representing 5% or more of the outstanding voting shares of a portfolio company of a fund, or control of or by, or common control under GI, result in that portfolio company being considered an affiliated company of such fund, as defined in the 1940 Act.
The Funds may invest in the Guggenheim Strategy Funds Trust consisting of Guggenheim Strategy Fund I, Guggenheim Strategy Fund II, Guggenheim Strategy Fund III, and Guggenheim Variable Insurance Strategy Fund III (collectively, the “Cash Management Funds”), open-end management investment companies managed by GI. The Cash Management Funds, which launched on March 11, 2014, are offered as cash management options only to mutual funds, trusts, and other accounts managed by GI and/or its affiliates, and are not available to the public. The Cash Management Funds pay no investment management fees. The Cash Management Funds’ annual report on Form N-CSR dated September 30, 2015, is available publicly or upon request. This information is available from the EDGAR database on the SEC’s website at http://www.sec.gov/Archives/edgar/data/1601445/000089180415000857/gug63224-ncsr.htm.
Transactions during the year ended September 30, 2016, in which the portfolio company is an “affiliated person,” were as follows:
Affiliated issuers by Fund | | Value
09/30/15 | | | Additions | | | Reductions | | | Value
09/30/16 | | | Shares
09/30/16 | | | Investment
Income | | | Realized
Gain (Loss) | |
Diversified Income Fund | | | | | | | | | | | | | | | | | | | | | |
Guggenheim Floating Rate Strategies Fund - Institutional Class | | $ | — | | | $ | 1,590,045 | | | $ | (467,963 | ) | | $ | 1,155,330 | | | | 44,539 | | | $ | 25,573 | | | $ | 4,805 | |
Guggenheim High Yield Fund -
Insitutional Class | | | — | | | | 1,766,984 | | | | (707,806 | ) | | | 1,189,250 | | | | 130,687 | | | | 61,582 | | | | 26,969 | |
Guggenheim Limited Duration Fund -
Institutional Class | | | — | | | | 912,884 | | | | (533,642 | ) | | | 382,050 | | | | 15,461 | | | | 7,920 | | | | (1,738 | ) |
Guggenheim World Equity Income Fund - Institutional Class | | | — | | | | 358,531 | | | | (58,294 | ) | | | 327,003 | | | | 24,312 | | | | 8,531 | | | | 3,072 | |
Guggenheim Risk Managed Real Estate Fund - Institutional Class | | | — | | | | 241,804 | | | | (2,469 | ) | | | 262,695 | | | | 9,006 | | | | 2,508 | | | | (17 | ) |
Guggenheim Investment Grade Bond Fund - Institutional Class | | | — | | | | 2,138,351 | | | | (1,065,686 | ) | | | 1,106,383 | | | | 59,708 | | | | 21,802 | | | | 27,198 | |
Guggenheim Total Return Bond Fund - Institutional Class | | | — | | | | 1,099,843 | | | | (1,102,285 | ) | | | — | | | | — | | | | 405 | | | | 2,443 | |
Guggenheim S&P High Income Infrastructure ETF | | | — | | | | 499,951 | | | | (63,423 | ) | | | 565,983 | | | | 21,275 | | | | 22,342 | | | | 10,664 | |
| | | $ | — | | | $ | 8,608,393 | | | $ | (4,001,568 | ) | | $ | 4,988,694 | | | | | | | $ | 150,663 | | | $ | 73,396 | |
| | | | | | | | | | | | | | | | | | | | | | | | | | | | | |
Investment Grade Bond Fund | | | | | | | | | | | | | | | | | | | | | | | | | | | | |
Guggenheim Strategy Fund I | | $ | 3,514,410 | | | $ | 7,217 | | | $ | (3,518,799 | ) | | $ | — | | | | — | | | $ | 7,217 | | | $ | (4,449 | ) |
| | | | | | | | | | | | | | | | | | | | | | | | | | | | | |
Limited Duration Fund | | | | | | | | | | | | | | | | | | | | | | | | | | | | |
Guggenheim BulletShares 2020 High Yield Corporate Bond ETF | | $ | — | | | $ | 4,001,294 | | | $ | (3,983,508 | ) | | $ | — | | | | — | | | $ | 15,126 | | | $ | (17,786 | ) |
Guggenheim Floating Rate Strategies Fund - Institutional Class | | | — | | | | 6,036,820 | | | | (4,800,000 | ) | | | 1,283,886 | | | | 49,494 | | | | 36,591 | | | | 23,149 | |
Guggenheim BulletShares 2019 High Yield Corporate Bond ETF | | | — | | | | 8,012,989 | | | | (7,998,212 | ) | | | — | | | | — | | | | 32,293 | | | | (14,776 | ) |
Guggenheim Strategy Fund I | | | 7,269,053 | | | | 14,415,795 | | | | (9,679,019 | ) | | | 12,071,811 | | | | 483,066 | | | | 165,033 | | | | (6,298 | ) |
Guggenheim Strategy Fund II | | | — | | | | 5,026,072 | | | | — | | | | 5,047,051 | | | | 202,368 | | | | 25,525 | | | | — | |
| | | $ | 7,269,053 | | | $ | 37,492,970 | | | $ | (26,460,739 | ) | | $ | 18,402,748 | | | | | | | $ | 274,568 | | | $ | (15,711 | ) |
9. Loan Commitments
Pursuant to the terms of certain loan agreements, certain Funds held unfunded loan commitments as of September 30, 2016. The Funds are obligated to fund these loan commitments at the borrower’s discretion.
| | THE GUGGENHEIM FUNDS ANNUAL REPORT | 103 |
NOTES TO FINANCIAL STATEMENTS (continued) |
The unfunded loan commitments as of September 30, 2016 were as follows:
Borrower | Maturity Date | | Face Amount | | | Value | |
High Yield Fund | | | | | | | |
Acosta, Inc. | 09/26/19 | | $ | 1,000,000 | | | $ | 79,501 | |
Acrisure LLC | 05/19/22 | | | 260,085 | | | | 3,769 | |
Advantage Sales & Marketing LLC | 07/25/19 | | | 1,017,500 | | | | 73,774 | |
Arch Coal, Inc. | 01/31/17 | | | 44,825 | | | | — | |
BBB Industries, LLC | 11/04/19 | | | 1,000,000 | | | | 85,774 | |
Deltek, Inc. | 06/25/20 | | | 800,000 | | | | 74,358 | |
Epicor Software | 06/01/20 | | | 1,000,000 | | | | 91,228 | |
Eyemart Express | 12/18/19 | | | 600,000 | | | | 46,790 | |
Hillman Group, Inc. | 06/30/19 | | | 1,000,000 | | | | 59,956 | |
Learning Care Group (US), Inc. | 05/05/19 | | | 500,000 | | | | 40,096 | |
National Technical Systems | 06/12/21 | | | 250,000 | | | | 24,461 | |
Packaging Coordinators Midco, Inc. | 07/01/21 | | | 1,500,000 | | | | 178,146 | |
Phillips-Medsize Corp. | 06/14/19 | | | 1,100,000 | | | | 69,289 | |
Pro Mach Group, Inc. | 10/22/19 | | | 900,000 | | | | 66,320 | |
PT Intermediate Holdings III, LLC | 06/23/22 | | | 250,000 | | | | 24,865 | |
Signode Industrial Group US, Inc. | 05/01/19 | | | 1,800,000 | | | | 115,863 | |
Solera LLC | 03/03/21 | | | 458,333 | | | | 57,019 | |
Wencor Group | 06/19/19 | | | 789,231 | | | | 50,215 | |
| | | | $ | 14,269,974 | | | $ | 1,141,424 | |
10. Line of Credit
The Trust, with the exception of Capital Stewardship Fund, and certain affiliated funds, secured a 364-day committed, $800,000,000 line of credit from Citibank, N.A., which was in place through October 6, 2016, at which time the line of credit was renewed. A Fund may draw (borrow) from the line of credit as a temporary measure for emergency purposes, to facilitate redemption requests, or for other short-term liquidity purposes consistent with the Fund’s investment objective and program. For example, it may be advantageous for the Fund to borrow money rather than sell existing portfolio positions to meet redemption requests. Fees related to borrowings, if any, vary under this arrangement between the greater of Citibank’s “base rate”, LIBOR plus 1%, or the federal funds rate 0.29% at September 30, 2016, plus 1/2 of 1%. The funds paid upfront costs of $663,359 to renew the line of credit.
The commitment fee that may be paid by the Funds is at an annualized rate of 0.15% of the average daily amount of their unused commitment amount. The Funds did not have any borrowings under this agreement as of and for the period ended September 30, 2016.
On October 6, 2016, the Trust, with the exception of Capital Stewardship Fund, and certain affiliated funds, renewed the line of credit from Citibank, N.A., with an increased commitment amount to $1,000,000,000. Fees related to borrowings, if any, vary under this arrangement between the greater of Citibank’s “base rate”, LIBOR plus 1%, or the federal funds rate 0.29% at September 30, 2016, plus 1/2 of 1%. The funds will pay upfront costs of $2,032,388 to renew the line of credit. The commitment fee that may be paid by the Funds is at an annualized rate of 0.15% of the average daily amount of their unused commitment amount.
The allocated interest expense amount for each Fund is referenced in the Statement of Operations under “Line of credit fees” and the effect on the expense ratio is included in the Financial Highlights.
104 | THE GUGGENHEIM FUNDS ANNUAL REPORT | |
NOTES TO FINANCIAL STATEMENTS (continued) |
11. Repurchase Agreements
In connection with transactions in repurchase agreements, it is the Funds’ policy that their custodian takes possession of the underlying collateral. The collateral is in the possession of the Funds’ custodian and is evaluated to ensure that its market value exceeds, at a minimum, 102% of the original face amount of the repurchase agreements.
| Fund | Counterparty and
Terms of Agreement | | | Face
Value | | | Repurchase
Price | | Collateral | | | Par
Value | | | Fair
Value |
| Limited Duration Fund | Jefferies & Company, Inc. | | | | | | | Neuberger Berman CLO Ltd. | | | | |
| | 1.02% - 3.62% | | | | | | | | 0.00% | | | | | | |
| | Due 10/04/16 -11/01/16 | | $ | 17,334,000 | | $ | 17,380,932 | | 01/23/24 - 07/15/27* | | $ | 14,875,913 | | $ | 9,240,501 |
| | | | | | | | | | American Money Management CLO Ltd. | | | | | | |
| | | | | | | | | | 0.00% | | | | | | |
| | | | | | | | | | 04/14/27* | | | 4,940,000 | | | 5,046,704 |
| | | | | | | | | | Cathedral Lake CLO Ltd. | | | | | | |
| | | | | | | | | | 0.00% | | | | | | |
| | | | | | | | | | 07/15/27* | | | 5,817,500 | | | 4,014,017 |
| | | | | | | | | | Whitehorse Ltd. | | | | | | |
| | | | | | | | | | 0.00% | | | | | | |
| | | | | | | | | | 02/03/25 | | | 11,732,500 | | | 2,933,008 |
| | | | | | | | | | JFIN CLO Ltd. | | | | | | |
| | | | | | | | | | 0.00% | | | | | | |
| | | | | | | | | | 10/19/26* | | | 3,737,500 | | | 2,541,986 |
| | | | | | | | | | City pf Plainfield NJ | | | | | | |
| | | | | | | | | | 1.50% | | | | | | |
| | | | | | | | | | 08/30/17 | | | 2,400,000 | | | 2,416,023 |
| | | | | | | | | | Cedar Funding CLO Ltd. | | | | | | |
| | | | | | | | | | 0.00% | | | | | | |
| | | | | | | | | | 07/17/28* | | | 476,125 | | | 394,998 |
| | | | | | | | | | | | | 43,979,538 | | | 26,587,237 |
| | | | | | | | | | | | | | | | |
| | Morgan Stanley | | | | | | | | Atlas Senior Loan Fund Ltd. | | | | | | |
| | 1.15% | | | | | | | | 0.00% | | | | | | |
| | Due 10/24/16 - 10/26/16 | | | 6,506,250 | | | 6,512,605 | | 01/30/24 | | | 5,625,000 | | | 2,963,813 |
| | | | | | | | | | Anchorage Capital CLO Ltd. | | | | |
| | | | | | | | | | 0.00% | | | | | | |
| | | | | | | | | | 10/15/26* | | | 7,500,000 | | | 4,500,000 |
| | | | | | | | | | | | | 13,125,000 | | | 7,463,813 |
In the event of counterparty default, the Funds have the right to collect the collateral to offset losses incurred. There is potential loss to the Funds in the event the Funds are delayed or prevented from exercising their rights to dispose of the collateral securities, including the risk of a possible decline in the value of the underlying securities during the period while the Funds seek to assert their rights. The Funds’ investment adviser, acting under the supervision of the Board of Trustees, reviews the value of the collateral and the creditworthiness of those banks and dealers with which the Funds enter into repurchase agreements to evaluate potential risks.
| | THE GUGGENHEIM FUNDS ANNUAL REPORT | 105 |
NOTES TO FINANCIAL STATEMENTS (continued) |
12. Restricted Securities
The securities below are considered illiquid and restricted under guidelines established by the Board:
Fund | | Restricted Securities | | Acquisition Date | | Cost | | | Value | |
High Yield Fund | | Schahin II Finance Company SPV Ltd. | | | | | | | | |
| | | 5.88% due 09/25/22 | | 03/12/15 | | $ | 139,296 | | | $ | 26,060 | |
| | | EIG Investors Corp. | | | | | | | | | | |
| | | 10.88% due 02/01/24 | | 05/16/16 | | | 1,286,539 | | | | 1,204,584 | |
| | | | | | | | 1,425,835 | | | | 1,230,644 | |
Investment Grade Bond Fund | | Aurora Military Housing LLC | | | | | | | | | | |
| | | 6.89% due 01/15/47 | | 12/02/15 | | | 834,717 | | | | 936,111 | |
| | | Northern Group Housing LLC | | | | | | | | | | |
| | | 6.80% due 08/15/53 | | 07/25/13 | | | 600,000 | | | | 790,146 | |
| | | Turbine Engines Securitization Ltd. | | | | | | | | | | |
| | | 5.13% due 12/13/48 | | 11/27/13 | | | 755,275 | | | | 755,322 | |
| | | Woodbourne Capital Trust I | | | | | | | | | | |
| | | 0.0002 | | 01/20/06 | | | 954,589 | | | | 570,532 | |
| | | Woodbourne Capital Trust II | | | | | | | | | | |
| | | 0.0003 | | 01/20/06 | | | 954,589 | | | | 570,532 | |
| | | Woodbourne Capital Trust III | | | | | | | | | | |
| | | 0.0003 | | 01/20/06 | | | 954,589 | | | | 570,532 | |
| | | Woodbourne Capital Trust IV | | | | | | | | | | |
| | | 0.0002 | | 01/20/06 | | | 954,589 | | | | 570,532 | |
| | | GMAC Commercial Mortgage Asset Corp. | | | | | | | | | | |
| | | 6.24% due 10/10/41 | | 04/03/14 | | | 448,422 | | | | 537,698 | |
| | | Capmark Military Housing Trust | | | | | | | | | | |
| | | 6.06% due 10/10/52 | | 04/23/15 | | | 473,935 | | | | 477,262 | |
| | | Pacific Northwest Communities LLC | | | | | | | | | | |
| | | 5.91% due 06/15/50 | | 05/22/14 | | | 400,000 | | | | 468,652 | |
| | | Atlantic Marine Corporations Communities LLC | | | | | | | | | | |
| | | 5.43% due 12/01/50 | | 07/25/14 | | | 367,995 | | | | 403,883 | |
| | | ACC Group Housing LLC | | | | | | | | | | |
| | | 6.35% due 07/15/54 | | 06/03/14 | | | 300,000 | | | | 364,328 | |
| | | Capmark Military Housing Trust | | | | | | | | | | |
| | | 5.75% due 02/10/52 | | 09/18/14 | | | 333,217 | | | | 349,675 | |
| | | Cadence Bank North America | | | | | | | | | | |
| | | 6.25% due 06/28/29 | | 06/06/14 | | | 200,000 | | | | 170,000 | |
| | | Copper River CLO Ltd. | | | | | | | | | | |
| | | 0.00% due 01/20/21 | | 05/09/14 | | | 819,000 | | | | 155,601 | |
| | | TIG Holdings, Inc. | | | | | | | | | | |
| | | 8.60% due 01/15/27 | | 06/29/05 | | | 29,222 | | | | 27,625 | |
| | | | | | | | 9,380,136 | | | | 7,718,431 | |
Limited Duration Fund | | RFTI Issuer Ltd. | | | | | | | | | | |
| | | 2.27% due 08/15/30 | | 10/14/15 | | | 3,984,429 | | | | 3,992,052 | |
| | | Copper River CLO Ltd. | | | | | | | | | | |
| | | 0.00% due 01/20/21 | | 05/09/14 | | | 585,000 | | | | 111,143 | |
| | | Schahin II Finance Company SPV Ltd. | | | | | | | | | | |
| | | 5.88% due 09/25/22 | | 01/08/14 | | | 375,036 | | | | 46,908 | |
| | | | | | | | 4,944,465 | | | | 4,150,103 | |
13. Offsetting
In the normal course of business, the Fund enters into transactions subject to enforceable master netting arrangements or other similar arrangements. Generally, the right to offset in those agreements allows the Fund to counteract the exposure to a specific counterparty with collateral received from or delivered to that counterparty based on the terms of the arrangements. These arrangements provide for the right to liquidate upon the occurrence of an event of default, credit event upon merger or additional termination event.
106 | THE GUGGENHEIM FUNDS ANNUAL REPORT | |
NOTES TO FINANCIAL STATEMENTS (continued) |
In order to better define their contractual rights and to secure rights that will help the Fund mitigate its counterparty risk, the Fund may enter into an International Swaps and Derivatives Association, Inc. Master Agreement (“ISDA Master Agreement”) or similar agreement with its derivative contract counterparties. An ISDA Master Agreement is a bilateral agreement between a Fund and a counterparty that governs OTC derivatives, including foreign exchange contracts, and typically contains, among other things, collateral posting terms and netting provisions in the event of a default and/or termination event. The provisions of the ISDA Master Agreement typically permit a single net payment in the event of a default (close-out netting) or similar event, including the bankruptcy or insolvency of the counterparty.
For derivatives traded under an ISDA Master Agreement, the collateral requirements are typically calculated by netting the mark-to-market amount for each transaction under such agreement and comparing that amount to the value of any collateral currently pledged by the Fund and the counterparty. For financial reporting purposes, cash collateral that has been pledged to cover obligations of the Fund and cash collateral received from the counterparty, if any, are reported separately on the Statement of Assets and Liabilities as segregated cash with broker/receivable for variation margin, or payable for swap settlement/variation margin. Generally, the amount of collateral due from or to a counterparty must exceed a minimum transfer amount threshold (e.g., $300,000) before a transfer is required to be made. To the extent amounts due to the Fund from its counterparties are not fully collateralized, contractually or otherwise, the Fund bears the risk of loss from counterparty nonperformance. The Fund attempts to mitigate counterparty risk by only entering into agreements with counterparties that they believe to be of good standing and by monitoring the financial stability of those counterparties.
For financial reporting purposes, the Fund does not offset derivative assets and derivative liabilities that are subject to netting arrangements in the Statement of Assets and Liabilities.
The following tables present derivative financial instruments and secured financing transactions that are subject to enforceable netting arrangements and off set in the Statement of Assets and Liabilities in conformity with U.S. GAAP:
| | | | | | | | | | | | | Gross Amounts Not Offset
in the Statements of
Assets and Liabilities | | | | |
Fund | Instrument | | Gross Amounts of Recognized Assets | | | Gross Amounts Offset In the Statements of Assets and Liabilities | | | Net Amount of Assets Presented on the Statements of Assets and Liabilities | | | Financial Instruments | | | Cash
Collateral
Received | | | Net
Amount | |
High Yield Fund | Forward foreign currency exchange contracts | | $ | 100,664 | | | $ | — | | | $ | 100,664 | | | $ | 17,024 | | | $ | — | | | $ | 83,640 | |
| | | | | | | | | | | | | Gross Amounts Not Offset
in the Statements of
Assets and Liabilities | | | | |
Fund | Instrument | | Gross Amounts of Recognized Liabilities | | | Gross Amounts Offset In the Statements of Assets and Liabilities | | | Net Amount of Liabilities Presented on the Statements of Assets and Liabilities | | | Financial Instruments | | | Cash
Collateral
Received | | | Net
Amount | |
High Yield Fund | Forward foreign currency exchange contracts | | $ | 17,024 | | | $ | — | | | $ | 17,024 | | | $ | 17,024 | | | $ | — | | | $ | — | |
14. P-Class Shares
Effective May 1, 2015, the Funds started to offer P-Class shares.
P-Class shares of the Funds are offered primarily through broker/dealers and other financial intermediaries with which GFD has an agreement for the use of P-Class shares of the Funds in investment products, programs or accounts. P-Class shares do not have a minimum initial investment amount, subsequent investment amount or a minimum account balance.
| | THE GUGGENHEIM FUNDS ANNUAL REPORT | 107 |
NOTES TO FINANCIAL STATEMENTS (concluded) |
15. Legal Proceedings
Motors Liquidation Company
On or about June of 2015, the Guggenheim High Yield Fund was served and became a party to the case entitled Official Committee of Unsecured Creditors of Motors Liquidation Company v. JPMorgan Chase Bank, N.A., et al., Adversary Proceeding No. 09-00504(MG) (Bankr. S.D.N.Y.), brought by the Motors Liquidation Avoidance Action Trust (the “Motors Trust”). The lawsuit was initially filed in the United States Bankruptcy Court for the Southern District of New York on July 31, 2009 by the Official Committee of Unsecured Creditors of Motors Liquidation Company (f/k/a General Motors) against the former holders of an approximately $1.5 billion term loan issued pursuant to a term loan agreement, dated as of November 29, 2006 (the “Term Loan”), between General Motors, as borrower, JPMorgan Chase Bank, N.A., as administrative agent (“JPMorgan”), and various institutions as lenders, including the Guggenheim High Yield Fund (f/k/a Security Income Fund – High Yield Series). The Term Loan lenders received a full repayment of the Term Loan pursuant to a June 1, 2009 court order issued in connection with the General Motors chapter 11 bankruptcy filing. The plaintiff is seeking a court order that the lenders return at least a portion of the proceeds received in 2009 based on the contention that certain UCC financing statements securing the indebtedness due under the Term Loan were terminated (thus releasing collateral secured by the UCC financing statement), rendering the Term Loan under-secured or completely unsecured. As a result, the lawsuit alleges that the Term Loan lenders were unsecured creditors at the time General Motors filed for bankruptcy, and should not have been paid as though they were fully secured creditors.
After being served, the Guggenheim High Yield Fund filed a motion to dismiss the lawsuit on November 19, 2015. On June 30, 2016, the Bankruptcy Court denied the motion to dismiss, holding that the orders extending the time to serve defendants were valid. On July 14, 2016, the Guggenheim High Yield Fund filed a motion for leave to file an interlocutory appeal of the Bankruptcy Court’s decision, a decision on that motion is still outstanding.
On December 18, 2015, the Guggenheim High Yield Fund filed cross-claims against co-defendant JPMorgan related to JPMorgan’s actions as administrative agent in connection with the Term Loan and the termination of the UCC financing statements. The Guggenheim High Yield Fund and JPMorgan are exchanging discovery on the cross-claims.
On June 15, 2016, the Guggenheim High Yield Fund and the Motors Trust filed preliminary briefs addressing legal issues relevant to valuing the Term Loan’s remaining collateral and the Term Loan lenders’ remaining security in the Term Loan. The parties are currently engaged in discovery relating to the valuation of this collateral. Pursuant to the current case management order, preliminary discovery on this issue is to be completed on January 13, 2017, with a trial on certain representative assets to begin shortly thereafter.
This lawsuit does not allege any wrongdoing on the part of the Guggenheim High Yield Fund and the Fund intends to vigorously defend the matter. If the plaintiff is successful, it is reasonably possible that the Guggenheim High Yield Fund will be required to make payments in some amount (but not likely to exceed approximately $1,000,000), although the Fund may recover some or all of this amount from its cross-claims against codefendant JPMorgan. At this stage of the proceedings, the Guggenheim High Yield Fund is unable to make a reliable prediction as to the outcome of this lawsuit or the effect, if any, on the Fund’s net asset value.
16. Subsequent Event
At a meeting that occurred on November 16, 2016, the Board approved the following changes:
Approval to add an advisory fee breakpoint (“breakpoint”) to the fixed income mutual funds. Effective on or about February 1, 2017, a breakpoint of 5 basis points (0.05%) on average daily net assets above $5 billion will apply to each of the following Funds’ advisory fees:
Floating Rate Strategies Fund
Investment Grade Bond Fund
Macro Opportunities Fund
Total Return Bond Fund
The introduction of advisory fee breakpoints will not result in any decrease in the nature, quality and extent of services provided to the Funds under the advisory agreements.
108 | THE GUGGENHEIM FUNDS ANNUAL REPORT | |
REPORT OF INDEPENDENT REGISTERED PUBLIC ACCOUNTING FIRM |
The Board of Trustees and Shareholders
of Guggenheim Funds Trust
We have audited the accompanying statements of assets and liabilities, including the schedules of investments, of Guggenheim High Yield Fund, Guggenheim Investment Grade Bond Fund, Guggenheim Limited Duration Fund, Guggenheim Diversified Income Fund, and Guggenheim Municipal Income Fund (five of the series constituting the Guggenheim Funds Trust) (the “Funds”) as of September 30, 2016, and the related statements of operations, statements of changes in net assets, and the financial highlights for each of the years or periods indicated therein. These financial statements and financial highlights are the responsibility of the Funds’ management. Our responsibility is to express an opinion on these financial statements and financial highlights based on our audits.
We conducted our audits in accordance with the standards of the Public Company Accounting Oversight Board (United States). Those standards require that we plan and perform the audit to obtain reasonable assurance about whether the financial statements and financial highlights are free of material misstatement. We were not engaged to perform an audit of the Funds’ internal control over financial reporting. Our audits included consideration of internal control over financial reporting as a basis for designing audit procedures that are appropriate in the circumstances, but not for the purpose of expressing an opinion on the effectiveness of the Funds’ internal control over financial reporting. Accordingly, we express no such opinion. An audit also includes examining, on a test basis, evidence supporting the amounts and disclosures in the financial statements and financial highlights, assessing the accounting principles used and significant estimates made by management, and evaluating the overall financial statement presentation. Our procedures included confirmation of securities owned as of September 30, 2016, by correspondence with the custodian, transfer agent, brokers, and paying agents or by other appropriate auditing procedures where replies from brokers or paying agents were not received. We believe that our audits provide a reasonable basis for our opinion.
In our opinion, the financial statements and financial highlights referred to above present fairly, in all material respects, the financial position of the above listed Funds (five of the series constituting the Guggenheim Funds Trust) at September 30, 2016, the results of their operations, the changes in their net assets, and their financial highlights for each of the years or periods indicated therein, in conformity with U.S. generally accepted accounting principles.
McLean, Virginia
November 29, 2016
| | THE GUGGENHEIM FUNDS ANNUAL REPORT | 109 |
OTHER INFORMATION (Unaudited) |
Tax Information
In January 2017, shareholders will be advised on IRS Form 1099 DIV or substitute 1099 DIV as to the federal tax status of the distributions received by shareholders in the calendar year 2016.
The Trust’s investment income(dividend income plus short-term gains, if any) qualifies as follows:
Of the ordinary income distributions paid during the year, the following funds had the corresponding percentages qualify for the dividends received deduction for corporations:
Fund | Dividend
Received Deduction |
Diversified Income Fund | 38.58% |
High Yield Fund | 1.35% |
Investment Grade Bond Fund | 0.10% |
Limited Duration Fund | 0.03% |
The following amounts of taxable ordinary income dividends paid during the fiscal year qualified for the lower income tax rate available to individuals under the Jobs and Growth Tax Relief Reconciliation Act of 2003:
Fund | Qualified
Dividend Income |
Diversified Income Fund | 38.90% |
High Yield Fund | 1.60% |
Investment Grade Bond Fund | 0.20% |
Limited Duration Fund | 0.03% |
Additionally, of the taxable ordinary income distributions paid during the fiscal year ending September 30, 2016, the Fund had the corresponding percentages qualify as interest related dividends and qualified short-term capital gains as permitted by IRC Section 871(k)(1) and IRC Section 871(k)(2), respectively.
Fund | Qualified
Interest | Qualified
Short-term |
High Yield Fund | 84.60% | 0.00% |
Investment Grade Bond Fund | 56.57% | 0.00% |
Limited Duration Fund | 64.53% | 0.00% |
Municipal Income Fund | 0.00% | 100.00% |
Municipal Income Fund designates $1,230,749 as tax-exempt interest income according to IRC Section 852(b)(5)(A).
Proxy Voting Information
A description of the policies and procedures that the Trust uses to determine how to vote proxies relating to securities held in the Funds’ portfolios is available, without charge and upon request, by calling 800.820.0888. This information is also available from the EDGAR database on the SEC’s website at https://www.sec.gov.
Information regarding how the Funds voted proxies relating to portfolio securities during the most recent 12-month period ended June 30 is available without charge, upon request, by calling 800.820.0888. This information is also available from the EDGAR database on the SEC’s website at https://www.sec.gov.
110 | THE GUGGENHEIM FUNDS ANNUAL REPORT | |
OTHER INFORMATION (Unaudited)(continued) |
Sector Classification
Information in the “Schedule of Investments” is categorized by sectors using sector-level Classifications defined by the Bloomberg Industry Classification System, a widely recognized industry classification system provider. Each Fund’s registration statement has investment policies relating to concentration in specific sectors/industries. For purposes of these investment policies, the Funds usually classify sectors/industries based on industry-level Classifications used by widely recognized industry classification system providers such as Bloomberg Industry Classification System, Global Industry Classification Standards and Barclays Global Classification Scheme.
Quarterly Portfolio Schedules Information
The Trust files its complete schedule of portfolio holdings with the SEC for the first and third quarters of each fiscal year on Form N-Q; which are available on the SEC’s website at https://www.sec.gov. The Funds’ Forms N-Q may be reviewed and copied at the SEC’s Public Reference Room in Washington, DC, and that information on the operation of the Public Reference Room may be obtained by calling 800-SEC-0330. Copies of the portfolio holdings are also available to shareholders, without charge and upon request, by calling 800.820.0888.
Report of the Guggenheim Funds Trust Contracts Review Committee
Guggenheim Funds Trust (the “Trust”) was organized as a Delaware statutory trust on November 8, 2013, and is registered as an open-end management investment company under the Investment Company Act of 1940, as amended (the “1940 Act”). The Trust includes the following series:
● Guggenheim Alpha Opportunity Fund (“Alpha Opportunity Fund”) ● Guggenheim Diversified Income Fund (“Diversified Income Fund”) ● Guggenheim High Yield Fund (“High Yield Fund”) ● Guggenheim Large Cap Value Fund (“Large Cap Value Fund”) ● Guggenheim Macro Opportunities Fund (“Macro Opportunities Fund”) ● Guggenheim Mid Cap Value Fund (“Mid Cap Value Fund”) ● Guggenheim Municipal Income Fund (“Municipal Income Fund”) ● Guggenheim Small Cap Value Fund (“Small Cap Value Fund”) ● Guggenheim StylePlus—Mid Growth Fund (“StylePlus—Mid Growth Fund”) ● Guggenheim World Equity Income Fund (“World Equity Income Fund”) | ● Guggenheim Capital Stewardship Fund (“Capital Stewardship Fund”) ● Guggenheim Floating Rate Strategies Fund (“Floating Rate Strategies Fund”) ● Guggenheim Investment Grade Bond Fund (“Investment Grade Bond Fund”) ● Guggenheim Limited Duration Fund (“Limited Duration Fund”) ● Guggenheim Market Neutral Real Estate Fund (“Market Neutral Real Estate Fund”) ● Guggenheim Mid Cap Value Institutional Fund (“Mid Cap Value Institutional Fund”) ● Guggenheim Risk Managed Real Estate Fund (“Risk Managed Real Estate Fund”) ● Guggenheim StylePlus—Large Core Fund (“StylePlus—Large Core Fund”) ● Guggenheim Total Return Bond Fund (“Total Return Bond Fund”) |
Security Investors, LLC (“Security Investors”), an indirect subsidiary of Guggenheim Partners, LLC, a global, diversified financial services firm (“Guggenheim Partners”), serves as investment adviser to each of: (i) Alpha Opportunity Fund; (ii) High Yield Fund; (iii) Investment Grade Bond Fund; (iv) Large Cap Value Fund; (v) Mid Cap Value Fund; (vi) Mid Cap Value Institutional Fund; (vii) Municipal Income Fund; (viii) Small Cap Value Fund; (ix) StylePlus—Large Core Fund; (x) StylePlus—Mid Growth Fund; and (xi) World Equity Income Fund (collectively, the “SI-Advised Funds”). (Guggenheim Partners, Security Investors, Guggenheim Partners Investment Management, LLC (“GPIM”) and their affiliates may be referred to herein collectively as “Guggenheim.” “Guggenheim Investments” refers to the global asset management and investment
| | THE GUGGENHEIM FUNDS ANNUAL REPORT | 111 |
OTHER INFORMATION (Unaudited)(continued) |
advisory division of Guggenheim Partners and includes GPIM, Security Investors and Guggenheim Funds Investment Advisors, LLC and other affiliated investment management businesses.) Under the terms of investment management agreements between Security Investors and the Trust, with respect to the SI-Advised Funds, Security Investors also is responsible for overseeing the activities of GPIM, an indirect subsidiary of Guggenheim Partners, with respect to its service as investment sub-adviser to Municipal Income Fund, pursuant to an investment sub-advisory agreement between Security Investors and GPIM (the “GPIM Sub-Advisory Agreement”).
GPIM serves as investment adviser with respect to each of: (i) Capital Stewardship Fund; (ii) Diversified Income Fund; (iii) Floating Rate Strategies Fund; (iv) Limited Duration Fund; (v) Macro Opportunities Fund; (vi) Market Neutral Real Estate Fund; (vii) Risk Managed Real Estate Fund; and (viii) Total Return Bond Fund (collectively, the “GPIM-Advised Funds” and together with the SI-Advised Funds, the “Funds” and individually, a “Fund”). Under the terms of investment management agreements between GPIM and the Trust, with respect to the GPIM-Advised Funds,1 GPIM also is responsible for overseeing the activities of Concinnity Advisors, LP (“Concinnity”) with respect to Concinnity’s service as investment sub-adviser to the Capital Stewardship Fund, pursuant to an investment sub-advisory agreement between GPIM and Concinnity (the “Concinnity Sub-Advisory Agreement”). Under the supervision of the Board of Trustees of the Trust (the “Board,” with the members of the Board referred to individually as the “Trustees”), the Advisers regularly provide (or, as applicable, oversee the provision of) investment research, advice and supervision, a continuous investment program, and direct the purchase and sale of securities and other investments for each Fund’s portfolio.
Following an initial two-year term, each of the Advisory Agreements continues in effect from year to year provided that such continuance is specifically approved at least annually by (i) the Board or a majority of the outstanding voting securities (as defined in the 1940 Act) of each Fund, and, in either event, (ii) the vote of a majority of the Trustees who are not “interested person[s],” as defined by the 1940 Act, of the Trust (the “Independent Trustees”) casting votes in person at a meeting called for such purpose. At meetings held in person on April 27, 2016 (the “April Meeting”) and on May 17, 2016 (the “May Meeting”), the members of the Contracts Review Committee of the Board (the “Committee”), consisting solely of the Independent Trustees, met separately from Guggenheim to consider the proposed renewal of the Advisory Agreements and the GPIM Sub-Advisory Agreement in connection with the Committee’s annual contract review schedule.2
As part of its review process, the Committee was represented by independent legal counsel to the Independent Trustees (“Independent Legal Counsel”). Independent Legal Counsel reviewed and discussed with the Committee various key aspects of the Trustees’ legal responsibilities relating to the proposed renewal of the Agreements and other principal contracts. The Committee took into account various materials received from Guggenheim and Independent Legal Counsel. Recognizing that the evaluation process with respect to the services provided by each of the Advisers is an ongoing one, the Committee also considered the variety of written materials, reports and oral presentations the Board received throughout the year regarding performance and operating results of the Funds.
In connection with the contract review process, FUSE Research Network LLC (“FUSE”), an independent, third-party research provider, was engaged to prepare advisory contract renewal reports designed specifically to help boards of directors/trustees fulfill their advisory contract renewal responsibilities. The objective of the reports is to present the subject funds’ relative position regarding fees, expenses and total return performance, with peer group and universe comparisons. The Committee assessed the data provided in the FUSE reports as well as commentary and supporting data presented by Guggenheim, including, among other things, a summary of notable distinctions between certain Funds and the applicable peer group identified in the FUSE reports, as well as a discussion of those instances in which FUSE adjusted a peer group after considering a request by management to re-evaluate the peer group constituent funds.
1 | The investment management agreements pertaining to the SI-Advised Funds and the investment management agreements pertaining to the GPIM-Advised Funds are referred to herein together as the “Advisory Agreements” and, together with the GPIM Sub-Advisory Agreement, as the “Agreements.” In addition, unless the context indicates otherwise, GPIM, with respect to its service as investment adviser to the GPIM-Advised Funds, and Security Investors as to the SI-Advised Funds, are each referred to herein as the “Adviser” and together, the “Advisers.” |
2 | Since Diversified Income Fund is subject to an investment management agreement approved by the Board for an initial term of two years at an in-person meeting of the Board held on August 20, 2015 and the Fund launched in 2016, it was not included in the contract renewal process conducted at the meetings in April and May 2016. Similarly, Market Neutral Real Estate Fund is subject to an investment management agreement approved by the Board for an initial term of two years at an in-person Board meeting held on November 10, 2015, and the Fund launched in 2016. Consequently, Market Neutral Real Estate Fund also was not included in the scope of the 2016 contract renewal process. In addition, because shares of the Capital Stewardship Fund are only offered for subscription and are held by a limited number of institutional/bank investors, and the Fund issues a shareholder report separate from the other series of the Trust, the factors considered by the Committee in evaluating the proposed renewal of an investment management agreement pertaining to the Capital Stewardship Fund, and the Concinnity Sub-Advisory Agreement, are addressed in a separate report of the Committee. Accordingly, references hereafter to the “Funds” should be understood as referring to all series of the Trust, excluding: (i) Capital Stewardship Fund; (ii) Diversified Income Fund; and (iii) Market Neutral Real Estate Fund. |
112 | THE GUGGENHEIM FUNDS ANNUAL REPORT | |
OTHER INFORMATION (Unaudited)(continued) |
In addition, Guggenheim provided materials and data in response to formal requests for information sent by Independent Legal Counsel on behalf of the Independent Trustees. Guggenheim also made a presentation at the April Meeting which, among other things, addressed areas identified for discussion by the Independent Trustees and Independent Legal Counsel. Throughout the process, the Committee asked questions of management and requested certain additional information, which Guggenheim provided following the April Meeting (collectively with the foregoing reports and materials, the “Contract Review Materials”).
The Committee considered the Contract Review Materials in the context of its accumulated experience governing the Trust and weighed the factors and standards discussed with Independent Legal Counsel. Following an analysis and discussion of the factors identified below and in the exercise of its business judgment, the Committee concluded that it was in the best interest of each Fund to recommend that the Board approve the renewal of each Advisory Agreement and the GPIM Sub-Advisory Agreement for an additional annual term.
Advisory Agreements
Nature, Extent and Quality of Services Provided by each Adviser: With respect to the nature, extent and quality of services currently provided by each Adviser, the Committee considered the information provided by Guggenheim concerning the education, experience, professional affiliations, areas of responsibility and duties of key personnel performing services for the Funds, including those personnel providing compliance oversight, as well as the supervisors and reporting lines for such personnel. In this connection, the Committee considered Guggenheim’s resources and related efforts to retain, attract and motivate capable personnel to serve the Funds and noted Guggenheim’s report on recent additions, departures and transitions in personnel who work on matters relating to the Funds or are significant to the operations of each Adviser. The Committee also considered the Advisers’ attention to relevant developments in the mutual fund industry and its observance of compliance and regulatory requirements, and noted that on a regular basis the Board receives and reviews information from the Trust’s Chief Compliance Officer regarding compliance policies and procedures established pursuant to Rule 38a-1 under the 1940 Act, as well as from Guggenheim’s Chief Risk Officer. The Committee also noted updates by Guggenheim to certain compliance programs, including with respect to Code of Ethics monitoring, and the implementation of additional forensic testing. The Committee took into consideration the settlement of a regulatory matter concerning GPIM and remedial steps taken in response by Guggenheim to enhance its organizational structure for compliance. In this connection, the Committee considered information provided by Guggenheim regarding the findings of an independent compliance consultant retained to review GPIM’s compliance program and the consultant’s conclusion that the program is reasonably designed to prevent and detect violations of the Investment Advisers Act of 1940, as amended, and the rules promulgated thereunder. Moreover, in connection with the Committee’s evaluation of the overall package of services provided by each Adviser, the Committee considered each Adviser’s administrative capabilities, including its role in monitoring and coordinating compliance responsibilities with the fund administrator, transfer agent, distributor, custodian and other service providers to the Funds. In addition, because Municipal Income Fund is sub-advised, the Committee took into account information provided by Guggenheim describing the Adviser’s processes and activities for providing oversight of sub-advisers, including information regarding the Adviser’s Sub-Advisory Oversight Committee.
With respect to Guggenheim’s resources and the ability of each Adviser to carry out its responsibilities under the applicable Advisory Agreement, the Chief Financial Officer of Guggenheim Investments reviewed with the Committee certain unaudited financial information concerning the holding company for Guggenheim Investments, Guggenheim Partners Investment Management Holdings, LLC (“GPIMH”). (Thereafter, the Committee received the audited consolidated financial statements of GPIMH and the audited financial statements of GPIM as supplemental information.)
The Committee also considered the acceptability of the terms of each Advisory Agreement, including the scope of services required to be performed by each Adviser.
Based on the foregoing, and based on other information received (both oral and written) at the April Meeting and the May Meeting, as well as other considerations, including the Committee’s knowledge of how each Adviser performs its duties through Board meetings, discussions and reports during the year, the Committee concluded that each Adviser and its personnel were qualified to serve the Funds in such capacity and may reasonably be expected to continue to provide a high quality of services under each Advisory Agreement with respect to the Funds.
Investment Performance: The Committee received, for each Fund, investment returns for the ten-year, five-year, three-year, one-year and three-month periods ended December 31, 2015, as applicable. In addition, the Committee received a comparison of each Fund’s performance to the performance of a benchmark, a universe of funds and a narrower peer group of similar funds with comparable asset levels as identified by FUSE, in each case for the same periods, as applicable. The Committee also received from FUSE representatives and considered a description of the methodology employed by FUSE for identifying each Fund’s peer group and universe for performance and expense comparisons.
| | THE GUGGENHEIM FUNDS ANNUAL REPORT | 113 |
OTHER INFORMATION (Unaudited)(continued) |
In seeking to evaluate Fund performance over a full market cycle, the Committee generally focused its attention first on five-year and three-year performance rankings as compared to the relevant universe of funds. The Committee also considered more recent performance periods, including the one-year period and, as deemed appropriate, the three-month period, for certain Funds such as for those Funds that were recently launched or had undergone recent changes in investment strategies, as well as circumstances in which enhancements were made to the portfolio management processes or techniques employed for a Fund. In this connection, the Committee made the following observations:
Alpha Opportunity Fund: The Fund’s Class A shares outperformed the performance universe median for the five-year and three-year periods, ranking in the 6th and 9th percentiles, respectively. The Committee considered the limitations on portfolio management as a result of the 2008 Lehman bankruptcy, and subsequent changes to the Fund’s investment strategies, noting that the Fund re-opened to subscriptions with a new U.S. long/short equity investment strategy on January 28, 2015. In light of the foregoing, the Committee also considered more recent performance periods, including the one-year and three-month periods ended December 31, 2015, and observed that the Fund’s Class A shares ranked in the 72nd and 92nd percentiles, respectively of its performance universe. Given the limited period of time that the Adviser has managed the Fund pursuant to its new investment program, the Committee also took into account updated performance data provided by the Adviser in connection with the May Meeting and noted that the Fund’s net performance for the one-year and three-month periods ended March 31, 2016 ranked in the 6th and 1st percentiles, respectively of the Morningstar Long/Short Equity peer group.
Floating Rate Strategies Fund: The Committee noted the Fund’s inception date of November 30, 2011, and observed that the Fund’s Class A shares ranked in the 1st and 5th percentiles of its performance universe for the three-year and one-year periods ended December 31, 2015, respectively, outperforming its performance universe median for each of these periods.
High Yield Fund: The returns of the Fund’s Class A shares ranked in the 46th and 10th percentiles of its performance universe for the five-year and three-year periods ended December 31, 2015, respectively, and outperformed the performance universe median for each of these periods.
Investment Grade Bond Fund: The returns of the Fund’s Class A shares ranked in the 1st percentile of its performance universe for both the five-year and three-year periods ended December 31, 2015, outperforming its performance universe median for both of these periods.
Limited Duration Fund: The Committee noted the Fund’s inception date of December 16, 2013, and observed that the returns of the Fund’s Class A shares ranked in the 1st and 10th percentiles of the performance universe for the one-year and three-month periods ended December 31, 2015, respectively, outperforming the median returns.
Macro Opportunities Fund: The Committee noted the Fund’s inception date of November 30, 2011, and observed that the returns of the Fund’s Class A shares ranked in the 6th and 57th percentiles of the performance universe for the three-year and one-year periods ended December 31, 2015, respectively, and outperformed the performance universe median for the three-year period.
Municipal Income Fund: The Committee considered that Security Investors does not directly manage the investment portfolio but has delegated such duties to GPIM. Based on the information provided and the review of the Fund’s investment performance, the Committee concluded that Security Investors had appropriately reviewed and monitored GPIM’s investment performance as Sub-Adviser to the Fund.
Risk Managed Real Estate Fund: The Committee noted the Fund’s inception date of February 12, 2014, and observed the returns of the Fund’s Class A shares ranked in the 31st and 76th percentile of its performance universe for the one-year and three-month periods ended December 31, 2015, respectively.
StylePlus—Large Core Fund: The returns of the Fund’s Class A shares ranked in the 39th percentile of its performance universe for the three-year period ended December 31, 2015. The Committee noted that the Fund implemented a strategy change and a new portfolio management team in May 2013. In light of the foregoing, the Committee also considered more recent performance periods in addition to the three-year performance, including the one-year and three-month periods ended December 31, 2015, and observed that the returns of the Fund’s Class A shares exceeded the median of its performance universe for both periods, ranking in the 25th and 22nd percentiles for the one-year and three-month periods, respectively.
StylePlus—Mid Growth Fund: The returns of the Fund’s Class A shares ranked in the 45th percentile of its performance universe for the three-year period ended December 31, 2015. The Committee noted that the Fund implemented a strategy change and a new portfolio management team in May 2013. In light of the foregoing, the Committee considered more recent performance periods in addition to the three-year
114 | THE GUGGENHEIM FUNDS ANNUAL REPORT | |
OTHER INFORMATION (Unaudited)(continued) |
performance, including the one-year and three-month periods ended December 31, 2015, and observed that the returns of the Fund’s Class A shares exceeded the median of its performance universe for both periods, ranking in the 42nd and 45th percentiles for the one-year and three-month periods, respectively.
Total Return Bond Fund: The Committee noted the Fund’s inception date of November 30, 2011, and observed that the returns of the Fund’s Class A shares ranked in the 1st and 12th percentiles of its performance universe for the three-year and one-year periods ended December 31, 2015, respectively, and outperformed the performance universe median for each of these periods.
World Equity Income Fund: The returns of the Fund’s Class A shares ranked in the 66th percentile of its performance universe for the three-year period ended December 31, 2015. The Committee noted that the Fund implemented a strategy change and a new portfolio management team in August 2013. In light of the foregoing, the Committee considered more recent performance periods in addition to the three-year performance, including the one-year and three-month periods ended December 31, 2015, and observed that the returns of the Fund’s Class A shares exceeded the median of its performance universe for both periods, ranking in the 43rd and 39th percentiles for the one-year and three-month periods, respectively.
Value Funds: Large Cap Value Fund, Mid Cap Value Fund, Mid Cap Value Institutional Fund and Small Cap Value Fund
Large Cap Value Fund: The returns of the Class A shares underperformed the performance universe median for the five-year, three-year, one-year and three-month periods ended December 31, 2015, and ranked in the 83rd, 72nd, 72nd and 67th percentiles, respectively.
Mid Cap Value Fund: The returns of the Class A shares underperformed the performance universe median for the five-year, three-year, one-year and three-month periods ended December 31, 2015, and ranked in the 83rd, 79th, 75th and 81st percentiles, respectively.
Mid Cap Value Institutional Fund: The Fund’s returns underperformed the performance universe median for the five-year, three-year, one-year and three-month periods ended December 31, 2015, and ranked in the 82nd, 75th, 70th and 67th percentiles, respectively.
Small Cap Value Fund: The Fund underperformed its performance universe median for the five-year, three-year and one-year periods ended December 31, 2015, ranking in the 80th percentile for the five-year and three-year periods and in the 67th percentile for the one-year period. The Fund outperformed its performance universe median for three-month period ended December 31, 2015, and ranked in the 29th percentile.
In response to the Committee’s request, representatives from the Adviser provided information regarding, and discussed factors impacting, each Value Fund’s performance, including market trends and stock selection. The Adviser’s representatives also discussed the portfolio management team’s philosophy and processes and explained their expectations and strategies for the future. The Committee noted measures taken by the Adviser to remedy relative longer-term underperformance with respect to each of the Value Funds, including strategy enhancements such as implementation of a refined stock selection process and additional risk controls to enforce the strategy’s sell discipline. The Committee noted that the Adviser believes the enhancements to the portfolio management techniques employed for each Value Fund, used in conjunction with existing proprietary quantitative models, will help improve the Fund‘s performance results. In light of the foregoing, the Committee requested and the Adviser provided supplemental performance data to enable the Committee to evaluate the impact of the strategy enhancements. In this connection, the Committee considered that the data provided by the Adviser indicated that each Value Fund’s performance was improving, with performance for the first quarter of 2016 ranking better than the trailing one-year return. The Committee also considered the Adviser’s statement that it believes the improving trend in performance relative to peers reflects the enhancements implemented in the investment process. The Committee also noted Guggenheim’s commitment to monitor each Value Fund’s performance and update the Independent Trustees on a quarterly basis as to the impact of the process enhancements implemented to-date and advise on other steps that might be taken to further address each Fund’s performance, if necessary.
After reviewing the foregoing and related factors, the Committee concluded that: (i) each Fund’s performance was acceptable; or (ii) it was satisfied with Guggenheim’s responses and efforts relating to investment performance.
| | THE GUGGENHEIM FUNDS ANNUAL REPORT | 115 |
OTHER INFORMATION (Unaudited)(continued) |
Comparative Fees, Costs of Services Provided and the Profits Realized by each Adviser from Its Relationship with the Funds: The Committee compared each Fund’s contractual advisory fee and total net expense ratio to the applicable peer group. The Committee also reviewed the median advisory fees and expense ratios, including expense ratio components (e.g., transfer agency fees, administration fees, other operating expenses, distribution fees and fee waivers/reimbursements) of the peer group of funds. In response to a supplemental request, the Committee also received and reviewed aggregated advisory and administrative fees compared to the peer group average and median.
As part of its evaluation of each Fund’s advisory fee, the Committee considered how such fees compared to the advisory fee charged by the applicable Adviser to one or more other funds, separate accounts and/or other types of client portfolios and investment vehicles that it manages pursuant to a similar investment objective and strategies, to the extent applicable, noting that, in certain instances, Guggenheim charges a lower advisory fee to such other clients. In this connection, the Committee considered, among other things, Guggenheim’s representations about the significant differences between managing mutual funds as compared to other types of accounts, including the additional resources required to effectively manage mutual fund assets and the greater regulatory costs associated with the management of such assets. The Committee also considered Guggenheim’s explanation that lower fees are charged in certain instances due to various other factors, including the scope of contract, type of investors, applicable legal, governance and capital structures, tax status and historical pricing reasons. With respect to the difference in fees charged to a comparable client that is a mutual fund, as to which Guggenheim serves as sub-adviser, the Committee took into account the following: Guggenheim advises that it has less legal and regulatory exposure as a sub-adviser to an unaffiliated fund and does not take on the same business risk because Guggenheim is not the sponsor of that fund. The Committee concluded that the information it received demonstrated that the aggregate services provided to the Funds were sufficiently different from those provided to other clients with similar investment strategies and/or the risks borne by Guggenheim were sufficiently greater than those associated with managing other clients with similar investment strategies to support the difference in fees.
In further considering the comparative fee and expense data presented in the Contract Review Materials and addressed by Guggenheim, the Committee made the following observations:
Alpha Opportunity Fund: The average contractual advisory fee percentile rank across all share classes of the Fund and the asset weighted total net expense ratio are in the second quartile (27th and 46th percentiles, respectively) of its peer group. The Committee also considered that the Adviser had entered into an expense limitation agreement with respect to the Fund.
Floating Rate Strategies Fund: The average contractual advisory fee percentile rank across all share classes of the Fund is in the fourth quartile (83rd percentile) of its peer group and the asset weighted total net expense ratio is in the second quartile (45th percentile) of its peer group. The Committee also considered that the Adviser had entered into an expense limitation agreement with respect to the Fund.
High Yield Fund: The average contractual advisory fee percentile rank across all share classes of the Fund is in the second quartile (40th percentile) of its peer group and the asset weighted total net expense ratio is in the fourth quartile (77th percentile) of its peer group. The Committee also considered that the Adviser had entered into an expense limitation agreement with respect to the Fund.
Investment Grade Bond Fund: The average contractual advisory fee percentile rank across all share classes of the Fund is in the third quartile (54th percentile) of its peer group and the asset weighted total net expense ratio is in the fourth quartile (83rd percentile) of its peer group. The Committee also considered that the Adviser had entered into an expense limitation agreement with respect to the Fund.
Large Cap Value Fund: The average contractual advisory fee percentile rank across all share classes of the Fund is in the first quartile (22nd percentile) of its peer group and the asset weighted total net expense ratio is in the second quartile (35th percentile) of its peer group. The Committee also considered that the Adviser had entered into an expense limitation agreement with respect to the Fund.
Limited Duration Fund: The average contractual advisory fee percentile rank across all share classes of the Fund is in the third quartile (66th percentile) of its peer group, as is the Fund’s asset weighted total net expense ratio (63rd percentile). The Committee also considered that the Adviser had entered into an expense limitation agreement with respect to the Fund.
Macro Opportunities Fund: The average contractual advisory fee percentile rank across all share classes of the Fund is in the fourth quartile (98th percentile) of its peer group, as is the Fund’s the asset weighted total net expense ratio (95th percentile). The Committee also considered that the Adviser had entered into an expense limitation agreement with respect to the Fund. In addition, the Committee noted that the Fund
116 | THE GUGGENHEIM FUNDS ANNUAL REPORT | |
OTHER INFORMATION (Unaudited)(continued) |
is categorized as a non-traditional bond fund which seeks to add value by investing in many non-traditional securities outside of fixed income, including equities, currencies, commodities and derivatives. In this connection, the Committee considered the Adviser’s statement that it supports the Fund with significant resources and a unique approach to drive performance for investors.
Mid Cap Value Fund: The average contractual advisory fee percentile rank across all share classes of the Fund is in the second quartile (37th percentile) of its peer group and the asset weighted total net expense ratio is in the fourth quartile (94th percentile) of its peer group.
Mid Cap Value Institutional Fund: The contractual advisory fee of the Fund is in the first quartile (6th percentile) of its peer group and the total net expense ratio is in the third quartile (63rd percentile) of its peer group.
Municipal Income Fund: The average contractual advisory fee percentile rank across all share classes of the Fund is in the second quartile (39th percentile) and the asset weighted total net expense ratio is in the 25th percentile of its peer group. The Committee also considered that the Adviser had entered into an expense limitation agreement with respect to the Fund.
Risk Managed Real Estate Fund: The average contractual advisory fee percentile rank across all share classes of the Fund and the asset weighted total net expense ratio are in the first quartile (1st percentile as to each) of its peer group.
StylePlus—Large Core Fund: The average contractual advisory fee percentile rank across all share classes of the Fund is in the third quartile (71st percentile) and the asset weighted total net expense ratio is in the fourth quartile (86th percentile) of its peer group.
StylePlus—Mid Growth Fund: The average contractual advisory fee percentile rank across all share classes of the Fund is in the second quartile (29th percentile) of its peer group and the asset weighted total net expense ratio is in the fourth quartile (92nd percentile) of its peer group.
Small Cap Value Fund: The average contractual advisory fee percentile rank across all share classes of the Fund is in the fourth quartile (75th percentile) of its peer group and the asset weighted total net expense ratio is in the first quartile (11th percentile) of its peer group. The Committee also considered that the Adviser had entered into an expense limitation agreement with respect to the Fund.
Total Return Bond Fund: The average contractual advisory fee percentile rank across all share classes of the Fund is in the fourth quartile (93rd percentile) of its peer group and the asset weighted total net expense ratio is in the third quartile (65th percentile) of its peer group. The Committee also considered that the Adviser had entered into an expense limitation agreement with respect to the Fund.
World Equity Income Fund: The average contractual advisory fee percentile rank across all share classes of the Fund is in the second quartile (31st percentile) of its peer group and the asset weighted total net expense ratio is in the fourth quartile (92nd percentile) of its peer group. The Committee also considered that the Adviser had entered into an expense limitation agreement with respect to the Fund.
With respect to the costs of services provided and profits realized by Guggenheim Investments from its relationship with the Funds, the Committee reviewed a profitability analysis and data from management for each Fund setting forth the average assets under management for the twelve months ended December 31, 2015, ending assets under management as of December 31, 2015, gross revenues received by Guggenheim Investments, expenses allocated to the Fund, earnings and the operating margin/profitability rate, including variance information relative to the foregoing amounts as of December 31, 2014. In addition, the Chief Financial Officer of Guggenheim Investments reviewed with, and addressed questions from, the Committee concerning the expense allocation methodology employed in producing the profitability analysis.
In the course of its review of Guggenheim Investments’ profitability, the Committee took into account the methods used by Guggenheim Investments to determine expenses and profit and reviewed a report from an independent accounting firm evaluating Guggenheim Investments’ approach to allocating costs and determining the profitability of Guggenheim Investments with respect to individual funds and the entire fund complex. In evaluating the costs of services provided and the profitability to Guggenheim Investments, based upon the profitability rates presented by Guggenheim Investments and the conclusion of the independent accounting firm that the methodology used for calculating such rates was reasonable, the Committee concluded that the profits were not unreasonable.
The Committee considered other benefits available to each Adviser because of its relationship with the Funds and noted that Security Investors and GPIM may be deemed to benefit from arrangements whereby an affiliate, Rydex Fund Services, LLC, currently receives fees for (i) performing certain administrative functions and bookkeeping, accounting and pricing functions for the Funds pursuant to a Fund Accounting
| | THE GUGGENHEIM FUNDS ANNUAL REPORT | 117 |
OTHER INFORMATION (Unaudited)(continued) |
and Administration Agreement, and (ii) acting as transfer agent for the Funds and performing all shareholder servicing functions, including transferring record ownership, processing purchase and redemption transactions, answering inquiries, mailing shareholder communications, and acting as the dividend disbursing agent pursuant to a Transfer Agency Agreement. The Committee reviewed the compensation arrangements for the provision of the foregoing services, as well as Guggenheim’s profitability from providing such services. The Committee also noted Guggenheim’s statement that it may benefit from marketing synergies arising from offering a broad spectrum of products, including the Funds.
Economies of Scale: The Committee received and considered information regarding whether there have been economies of scale with respect to the management of the Funds as Fund assets grow, whether the Funds have appropriately benefited from any economies of scale, and whether there is potential for realization of any further economies of scale. The Committee considered whether economies of scale in the provision of services to the Funds were being passed along to the shareholders. The Committee noted the Adviser’s statement that Guggenheim continues to develop the infrastructure needed to support Fund asset growth and to achieve economies of scale across the firm’s various products and product lines. Thus, while Guggenheim may be benefiting from certain economies of scale and related cost efficiencies, it is concurrently realizing new costs and expenses associated with investment in infrastructure to support growth. The Committee took into account the additional information provided by Guggenheim at the Committee’s request regarding the investments made to support the growth of the organization, noting, among other things, enhancements to improve operational efficiency and further development of compliance-related functions, as well as Guggenheim’s view as to how such investments benefit the Funds.
As part of its assessment of economies of scale, the Committee also considered Guggenheim’s view that it seeks to share economies of scale through expense limitations and/or through advisory fees set at competitive rates pre-assuming future asset growth. Thus, the Committee considered the size of the Funds and the competitiveness of and/or other determinations made regarding the current advisory fee for each Fund, as well as whether a Fund is subject to an expense limitation.
As to the size of the Funds, the Committee took into account Guggenheim’s statement that generally the Funds’ assets are not sufficiently large to warrant breakpoints, with only three Funds—Floating Rate Strategies Fund, Macro Opportunities Fund, and Total Return Bond Fund—having assets in excess of (or approaching) $1 billion. With respect to the three Funds noted, the Committee considered the levels of profitability reported. The Committee also noted that each of the three Funds is subject to an expense limitation agreement, which results in a lower effective advisory fee.
The Committee determined that, taking into account all relevant factors, the advisory fee for each Fund was reasonable.
Sub-Advisory Agreement
Nature, Extent and Quality of Services Provided by the Sub-Adviser: With respect to the nature, extent and quality of services provided by GPIM (referred to in this discussion as the “Sub-Adviser”), the Committee considered the qualifications, experience and skills of the Sub- Adviser’s portfolio management and other key personnel and information from the Sub-Adviser describing the scope of its services to Municipal Income Fund. The Committee also considered the information provided by the Sub-Adviser concerning the Sub-Adviser’s business continuity and information security plans and controls, and compliance policies and procedures, among other things.
With respect to Guggenheim’s resources and the Sub-Adviser’s ability to carry out its responsibilities under the Sub-Advisory Agreement, as noted above, the Committee considered the financial condition of GPIMH. (Thereafter, the Committee received the audited financial statements of GPIM as supplemental information.)
The Committee also considered the acceptability of the terms of the Sub-Advisory Agreement. Based on the foregoing, and based on other information received (both oral and written) at the April Meeting and at the May Meeting, as well as other considerations, including the Committee’s knowledge of how the Sub-Adviser performs its duties through Board meetings, discussions and reports throughout the year, the Committee concluded that the Sub-Adviser and its personnel were qualified to serve Municipal Income Fund in such capacity and may reasonably be expected to continue to provide a high quality of services under the Sub-Advisory Agreement.
Investment Performance: The Committee considered that the Fund’s Class A shares ranked in the third quartile (65th and 68th percentiles) of its performance universe for the five-year and three-year periods ended December 31, 2015, respectively. On January 13, 2012, the Fund acquired the assets and assumed the liabilities of TS&W/Claymore Tax-Advantaged Balanced Fund (the “Predecessor Fund”), a closed-end fund which used different investment strategies and had different investment advisers. Class A shares of the Fund have assumed the performance, financial and other historical information of the Predecessor Fund’s common shares and the performance of Class A shares of the Fund reflects
118 | THE GUGGENHEIM FUNDS ANNUAL REPORT | |
OTHER INFORMATION (Unaudited)(concluded) |
the performance of the Predecessor Fund. In light of the foregoing, the Committee took into account more recent periods and noted that Fund’s Class A shares ranked in the fourth quartile for the one-year period ended December 31, 2015, and outperformed the performance universe median for the three-month period ended December 31, 2015, ranking in the 39th percentile. In considering the Fund’s performance for the one-year period, the Committee considered Guggenheim’s explanation that the Fund is managed very conservatively and the portfolio management team opted to maintain short duration by allocating to floating rate securities, which was a drag on performance for the period as the Federal Reserve increased interest rates fewer times than had been expected by the team. In light of all the facts and circumstances, the Committee concluded that the investment performance of the Fund and the Sub-Adviser was acceptable.
Comparative Fees, Costs of Services Provided and the Profits Realized by the Sub- Adviser from Its Relationship with the Fund: The Committee reviewed the level of sub-advisory fees payable to GPIM, noting that the fees are paid by Security Investors and do not impact the fees paid by the Fund.
Economies of Scale: The Committee recognized that, because the Sub-Adviser’s fees are paid by the Adviser and not the Fund, the analysis of economies of scale was more appropriate in the context of the Committee’s consideration of the applicable Advisory Agreement, which was separately considered. (See “Advisory Agreements – Economies of Scale” above.)
Overall Conclusions
Based on the foregoing, the Committee determined that the investment advisory fees are fair and reasonable in light of the extent and quality of the services provided and other benefits received and that the continuation of the Agreements is in the best interest of each Fund. In reaching this conclusion, no single factor was determinative or conclusive and each Committee member, in the exercise of his business judgment, may attribute different weights to different factors. At the May Meeting, the Committee, constituting all of the Independent Trustees, recommended the renewal of each Advisory Agreement and the Sub-Advisory Agreement for an additional annual term.
| | THE GUGGENHEIM FUNDS ANNUAL REPORT | 119 |
INFORMATION ON BOARD OF TRUSTEES AND OFFICERS (Unaudited) |
A Board of Trustees oversees the Trust, as well as other trusts of GI, in which its members have no stated term of service, and continue to serve after election until resignation. The Statement of Additional Information includes further information about Fund Trustees and Officers, and can be obtained without charge by visiting guggenheiminvestments.com or by calling 800.820.0888.
Name, Address* and Year of Birth | Position(s)
Held with
the Trust | Term of Office and Length of Time Served** | Principal Occupation(s) During Past Five Years | Number of Portfolios in Fund Complex Overseen | Other
Directorships
Held by Trustees |
INDEPENDENT TRUSTEES | | | |
Randall C. Barnes (1951) | Trustee | Since 2014 | Current: Private Investor (2001-present). Former: Senior Vice President and Treasurer, PepsiCo, Inc. (1993-1997); President, Pizza Hut International (1991-1993); Senior Vice President, Strategic Planning and New Business Development, PepsiCo, Inc. (1987-1990). | 101 | Current: Trustee, Purpose Investments Inc. (2014-Present). |
Donald A. Chubb, Jr. (1946) | Trustee | Since 1994 | Current: Business broker and manager of commercial real estate, Griffith & Blair, Inc. (1997-present). | 97 | Current: Midland Care, Inc. (2011-present). |
Jerry B. Farley (1946) | Trustee | Since 2005 | Current: President, Washburn University (1997-present). | 97 | Current: Westar Energy, Inc. (2004-present); CoreFirst Bank & Trust (2000-present). |
Roman Friedrich III (1946) | Trustee and Chairman of the Contracts Review Committee | Since 2014 | Current: Founder and Managing Partner, Roman Friedrich & Company (1998-present). Former: Senior Managing Director, MLV & Co. LLC (2010-2011). | 97 | Current: Zincore Metals, Inc. (2009-present). Former: Axiom Gold and Silver Corp. (2011-2012). |
Robert B. Karn III (1942) | Trustee and Chairman of the Audit Committee | Since 2014 | Current: Consultant (1998-present). Former: Arthur Andersen (1965-1997) and Managing Partner, Financial and Economic Consulting, St. Louis office (1987-1997). | 97 | Current: Peabody Energy Company (2003-present); GP Natural Resource Partners, LLC (2002- present). |
Ronald A. Nyberg (1953) | Trustee and Chairman of the Nominating and Governance Committee | Since 2014 | Current: Partner, Momkus McCluskey Roberts, LLC (2016-present). Former: Partner, Nyberg & Cassioppi, LLC (2000-2016); Executive Vice President, General Counsel, and Corporate Secretary, Van Kampen Investments (1982-1999). | 103 | Current: Edward-Elmhurst Healthcare System (2012-present). |
120 | THE GUGGENHEIM FUNDS ANNUAL REPORT | |
INFORMATION ON BOARD OF TRUSTEES AND OFFICERS (Unaudited)(continued) |
Name, Address* and Year of Birth | Position(s)
Held with
the Trust | Term of Office and Length of Time Served** | Principal Occupation(s) During Past Five Years | Number of Portfolios in Fund Complex Overseen | Other
Directorships Held by Trustees |
INDEPENDENT TRUSTEES - concluded | | |
Maynard F. Oliverius (1943) | Trustee | Since 1998 | Current: Retired. Former: President and CEO, Stormont-Vail HealthCare (1996-2012). | 97 | Current: Fort Hays State University Foundation (1999-present); Stormont-Vail Foundation (2013-present); University of Minnesota Healthcare Alumni Association Foundation (2009-present). Former: Topeka Community Foundation (2009-2014). |
Ronald E. Toupin, Jr. (1958) | Trustee and Chairman of the Board | Since 2014 | Current: Portfolio Consultant (2010-present). Former: Vice President, Manager and Portfolio Manager, Nuveen Asset Management (1998-1999); Vice President, Nuveen Investment Advisory Corp. (1992-1999); Vice President and Manager, Nuveen Unit Investment Trusts (1991-1999); and Assistant Vice President and Portfolio Manager, Nuveen Unit Investment Trusts (1988-1999), each of John Nuveen & Co., Inc. (1982-1999). | 100 | Former: Bennett Group of Funds (2011-2013). |
INTERESTED TRUSTEE | |
Donald C. Cacciapaglia*** (1951) | President, Chief Executive Officer and Trustee | Since 2012 | Current: President and CEO, certain other funds in the Fund Complex (2012-present); Vice Chairman, Guggenheim Investments (2010-present). Former: Chairman and CEO, Channel Capital Group, Inc. (2002-2010). | 232 | Current: Clear Spring Life Insurance Company (2015-present); Guggenheim Partners Japan, Ltd. (2014-present); Guggenheim Partners Investment Management Holdings, LLC (2014-present); Delaware Life (2013-present); Guggenheim Life and Annuity Company (2011-present); Paragon Life Insurance Company of Indiana (2011-present). |
* | The business address of each Trustee is c/o Guggenheim Investments, 227 West Monroe Street, Chicago, Illinois 60606. |
** | Each Trustee serves an indefinite term, until his successor is elected and qualified. Time served includes time served in the respective position for the Predecessor Corporation. |
*** | This Trustee is deemed to be an "interested person" of the Funds under the 1940 Act by reason of his position with the Funds' Investment Manager and/or the parent of the Investment Manager. |
| | THE GUGGENHEIM FUNDS ANNUAL REPORT | 121 |
INFORMATION ON BOARD OF TRUSTEES AND OFFICERS (Unaudited)(continued) |
Name, Address* and Year of Birth | Position(s)
Held with
the Trust | Term of Office and Length of Time Served** | Principal Occupations
During Past Five Years |
OFFICERS | | | |
William H. Belden, III (1965) | Vice President | Since 2014 | Current: Vice President, certain other funds in the Fund Complex (2006-present); Managing Director, Guggenheim Funds Investment Advisors, LLC (2005-present). Former: Vice President of Management, Northern Trust Global Investments (1999-2005). |
Joanna M. Catalucci
(1966) | AML Officer
(2016-present) | | Current: Chief Compliance Officer, certain funds in the Fund Complex (2012-present); Senior Managing Director, Guggenheim Investments (2012-present); AML Officer, certain funds in the Fund Complex (2016-present).
Former: Chief Compliance Officer and Secretary, certain other funds in the Fund Complex (2008-2012); Senior Vice President & Chief Compliance Officer, Security Investors, LLC and certain affiliates (2010-2012); Chief Compliance Officer and Senior Vice President, Rydex Advisors, LLC and certain affiliates (2010-2011). |
James M. Howley (1972) | Assistant Treasurer | Since 2014 | Current: Director, Guggenheim Investments (2004-present) ; Assistant Treasurer, certain other funds in the Fund Complex (2006-present). Former: Manager, Mutual Fund Administration of Van Kampen Investments, Inc. (1996-2004). |
Keith D. Kemp (1960) | Assistant Treasurer | Since 2016 | Current: Managing Director of Transparent Value, LLC (2015-present); Managing Director of Guggenheim Investments (2015-present). Former: Director, Transparent Value, LLC (2010-2015); Director, Guggenheim Investments (2010-2015); Chief Operating Officer, Macquarie Capital Investment Management (2007-2009). |
Amy J. Lee (1961) | Vice President and Chief Legal Officer | Since 2007 (Vice President) Since 2014 (Chief Legal Officer) | Current: Chief Legal Officer, certain other funds in the Fund Complex (2013-present); Senior Managing Director, Guggenheim Investments (2012-present). Former: Vice President, Associate General Counsel and Assistant Secretary, Security Benefit Life Insurance Company and Security Benefit Corporation (2004-2012). |
Mark E. Mathiasen (1978) | Secretary | Since 2014 | Current: Secretary, certain other funds in the Fund Complex (2007-present); Managing Director, Guggenheim Investments (2007-present). |
Glenn McWhinnie (1969) | Assistant Treasurer | Since 2016 | Current: Vice President, Guggenheim Investments (2009-present). Former: Tax Compliance Manager, Ernst & Young LLP (1996-2009). |
Michael P. Megaris (1984) | Assistant Secretary | Since 2014 | Current: Assistant Secretary, certain other funds in the Fund Complex (2014-present); Vice President, Guggenheim Investments (2012-present). Former: J.D., University of Kansas School of Law (2009-2012). |
122 | THE GUGGENHEIM FUNDS ANNUAL REPORT | |
INFORMATION ON BOARD OF TRUSTEES AND OFFICERS (Unaudited)(concluded) |
Name, Address* and Year of Birth | Position(s)
Held with
the Trust | Term of Office and Length of Time Served** | Principal Occupations
During Past Five Years |
OFFICERS - concluded | |
Elisabeth Miller (1968) | Chief Compliance Officer | Since 2012 | Current: CCO, certain other funds in the Fund Complex (2012-present); CCO, Security Investors, LLC (2012-present); CCO, Guggenheim Funds Investment Advisors, LLC (2012-present); Managing Director, Guggenheim Investments (2012-present); Vice President, Guggenheim Funds Distributors, LLC (2014-present). Former: CCO, Guggenheim Distributors, LLC (2009-2014); Senior Manager, Security Investors, LLC (2004-2009); Senior Manager, Guggenheim Distributors, LLC (2004-2009). |
Adam J. Nelson (1979) | Assistant Treasurer | Since 2015 | Current: Vice President, Guggenheim Investments (2015-present); Assistant Treasurer, certain other funds in the Fund Complex (2015-present). Former: Assistant Vice President and Fund Administration Director, State Street Corporation (2013-2015); Fund Administration Assistant Director, State Street (2011-2013); Fund Administration Manager, State Street (2009-2011). |
Kimberly J. Scott (1974) | Assistant Treasurer | Since 2014 | Current: Vice President, Guggenheim Investments (2012-present) ; Assistant Treasurer, certain other funds in the Fund Complex (2012-present). Former: Financial Reporting Manager, Invesco, Ltd. (2010-2011); Vice President/Assistant Treasurer, Mutual Fund Administration for Van Kampen Investments, Inc./Morgan Stanley Investment Management (2009-2010); Manager of Mutual Fund Administration, Van Kampen Investments, Inc./Morgan Stanley Investment Management (2005-2009). |
Bryan Stone (1979) | Vice President | Since 2014 | Current: Vice President, certain other funds in the Fund Complex (2014-present); Director, Guggenheim Investments (2013-present). Former: Senior Vice President, Neuberger Berman Group LLC (2009-2013); Vice President, Morgan Stanley (2002-2009). |
John L. Sullivan (1955) | Chief Financial Officer and Treasurer | Since 2014 | Current: CFO, Chief Accounting Officer and Treasurer, certain other funds in the Fund Complex (2010-present); Senior Managing Director, Guggenheim Investments (2010-present). Former: Managing Director and CCO, each of the funds in the Van Kampen Investments fund complex (2004-2010); Managing Director and Head of Fund Accounting and Administration, Morgan Stanley Investment Management (2002-2004); CFO and Treasurer, Van Kampen Funds (1996-2004). |
* | The business address of each officer is c/o Guggenheim Investments, 227 West Monroe Street, Chicago, Illinois 60606. |
** | Each officer serves an indefinite term, until his or her successor is duly elected and qualified. Time served includes time served in the respective position for the Predecessor Corporation. |
| | THE GUGGENHEIM FUNDS ANNUAL REPORT | 123 |
GUGGENHEIM INVESTMENTS PRIVACY POLICIES (Unaudited) |
Guggenheim Investments as used herein refers to Guggenheim Partners, LLC, Guggenheim Funds Investment Advisors, LLC, Guggenheim Partners Investment Management, LLC, Guggenheim Funds Distributors, LLC and Security Investors, LLC as well as the funds in the Guggenheim Funds complex (the “funds”).
Our Commitment to You
When you become a Guggenheim Investments investor, you entrust us with not only your hard-earned money but also with personal and financial information about you. We recognize that your relationship with us is based on trust and that you expect us to act responsibly and in your best interests. Because we have access to personal information about you, we hold ourselves to high standards in its safekeeping and use. This means, most importantly, that we do not sell client or account information to anyone—whether you are a current or former Guggenheim Investments client.
The Information We Collect About You and How We Collect It
In the course of doing business with shareholders and investors, we collect nonpublic personal information about you. You typically provide personal information when you complete a Guggenheim Investments account application or when you request a transaction that involves Rydex and Guggenheim Funds or one of the Guggenheim affiliated companies. “Nonpublic personal information” is personally identifiable information about you. For example it includes your name and address, Social Security or taxpayer identification number, assets, income, account balance, bank account information and investment activity (e.g. purchase and redemption history).
How We Share Your Personal Information
As a matter of policy, we do not disclose your nonpublic personal information to nonaffiliated third parties except as required or permitted by law. As emphasized above, we do not sell information about current or former clients or their accounts to third parties. Nor do we share such information, except when necessary to complete transactions at your request or to make you aware of related investment products and services that we offer. Additional details about how we handle your personal information are provided below.
To complete certain transactions or account changes that you direct, it may be necessary to provide your personal information to companies, individuals or groups that are not affiliated with Guggenheim Investments. For example if you ask to transfer assets from another financial institution to Guggenheim Investments, we will need to provide certain information about you to that company to complete the transaction. In connection with servicing your accounts or to alert you to other Guggenheim Investments investment products and services, we may share your information within the Guggenheim Investments family of affiliated companies. This would include, for example, sharing your information within Guggenheim Investments so we can make you aware of new funds or the services offered through another Guggenheim Investments affiliated company. In certain instances, we may contract with nonaffiliated companies to perform services for us. Where necessary, we will disclose information we have about you to these third parties. In all such cases, we provide the third party with only the information necessary to carry out its assigned responsibilities and only for that purpose. And we require these third parties to treat your personal information with the same high degree of confidentiality that we do. In certain instances, we may share information with other financial institutions regarding individuals and entities in response to the U.S.A. Patriot Act. Finally we will share personal information about you if we are compelled by law to do so, if you direct us to do so with your consent, or in other circumstances as permitted by law.
How We Safeguard Your Personal Information
We maintain physical, electronic and procedural safeguards to protect your personal information. Within Guggenheim Investments, access to such information is limited to those who need it to perform their jobs such as servicing your account, resolving problems or informing you of new products and services.
124 | THE GUGGENHEIM FUNDS ANNUAL REPORT | |
This page intentionally left blank.
9.30.2016
Guggenheim Funds Annual Report
Fundamental Alpha |
Guggenheim Mid Cap Value Fund | | |
GuggenheimInvestments.com | MCV-ANN-0916-x0917 |

DEAR SHAREHOLDER | 2 |
ECONOMIC AND MARKET OVERVIEW | 3 |
ABOUT SHAREHOLDERS’ FUND EXPENSES | 5 |
MID CAP VALUE FUND | 8 |
NOTES TO FINANCIAL STATEMENTS | 23 |
REPORT OF INDEPENDENT REGISTERED PUBLIC ACCOUNTING FIRM | 31 |
OTHER INFORMATION | 32 |
INFORMATION ON BOARD OF TRUSTEES AND OFFICERS | 46 |
GUGGENHEIM INVESTMENTS PRIVACY POLICIES | 53 |
| | THE GUGGENHEIM FUNDS ANNUAL REPORT | 1 |
Dear Shareholder:
Security Investors, LLC, (the “Investment Adviser”) is pleased to present the shareholder report for Guggenheim Mid Cap Value Fund (the “Fund”) for the annual fiscal period ended September 30, 2016.
The Investment Adviser is part of Guggenheim Investments, which represents the investment management businesses of Guggenheim Partners, LLC (“Guggenheim”), a global, diversified financial services firm.
Guggenheim Funds Distributors, LLC is the distributor of the Fund. Guggenheim Funds Distributors, LLC is affiliated with Guggenheim and the Investment Adviser.
We encourage you to read the Economic and Market Overview section of the report, which follows this letter, and then the Managers’ Commentary for the Fund.
We are committed to providing innovative investment solutions and appreciate the trust you place in us.
Sincerely,

Donald C. Cacciapaglia
President and Chief Executive Officer
October 31, 2016
Read a prospectus and summary prospectus (if available) carefully before investing. It contains the investment objectives, risks, charges, expenses and other information, which should be considered carefully before investing. Obtain a prospectus and summary prospectus (if available) at guggenheiminvestments.com or call 800.820.0888.
Mid Cap Value Fund may not be suitable for all investors. ● An investment in the Fund will fluctuate and is subject to investment risks, which means investors could lose money. ● The intrinsic value of the underlying stocks may never be realized, or the stock may decline in value. ● Investments in small- and/or mid-sized company securities may present additional risks such as less predictable earnings, higher volatility and less liquidity than larger, more established companies.
2 | THE GUGGENHEIM FUNDS ANNUAL REPORT | |
ECONOMIC AND MARKET OVERVIEW (Unaudited) | September 30, 2016 |
Economic growth continues to rebound, even though the rise in U.S. Gross Domestic Product (“GDP”) disappointed in the first half of 2016. There was a large headwind from inventory drawdowns, which should soon reverse after five quarters of dragging on growth. Real GDP growth is expected to be around 2.5 percent in the second half of the year, driven by consumption, housing, and a fading trade drag, and supporting the view that U.S. economic growth remains resilient to global weakness.
The euro zone economy is slowly improving, but inflation will likely persist well below the European Central Bank’s (“ECB”) target in the coming quarters due to substantial slack. The ECB has indicated that more quantitative easing is possible, but will soon need to alter the quantitative easing program in order to keep up their purchase pace. Both China and Japan need weaker currencies. Chinese growth and capital flows have stabilized for now, but surging construction and a credit boom raise the prospect of future instability. Japan’s economic prospects are weak, and inflation remains far from the Bank of Japan’s (“BOJ”) target. The surging yen could drive further policy easing, including an increase in fiscal stimulus.
It appears the U.S. Federal Reserve (the “Fed”) will move forward with raising rates in December, absent any economic or geopolitical surprise or a meaningful tightening of financial conditions over the fourth quarter. But key events could influence risk asset performance for the balance of the year. A continued recovery in oil prices following the Organization of Petroleum Exporting Countries (“OPEC”) agreement to keep production between 32.5 to 33 million barrels per day would help sustain the rally (although we are skeptical that they will adhere to any quota based on historical production levels). Global oil inventories remain high, but supply and demand are moving toward balance. A rebound in GDP growth would also lift U.S. equity and corporate bond prices higher.
The macroeconomic picture remains the same; we are not on the verge of a recession. But despite our positive outlook on the U.S. economy, valuations across risk assets argue for caution. Ongoing accommodation from central bankers across the globe has alleviated much of the initial macroeconomic tail risk posed by Brexit but may not be enough to dampen the seasonal volatility typically observed in the fourth quarter. Ongoing troubles in the banking sector, such as the woes afflicting Deutsche Bank and Wells Fargo, coupled with uncertainty surrounding upcoming political events, which include the new Trump administration, the Italian constitutional referendum, and key European elections, may create volatility for risk assets for the balance of the year.
For the 12 months ended September 30, 2016, the Standard & Poor’s 500® (“S&P 500®”) Index* returned 15.43%. The MSCI Europe-Australasia-Far East (“EAFE”) Index* returned 6.52%. The return of the MSCI Emerging Markets Index* was 16.78%.
| | THE GUGGENHEIM FUNDS ANNUAL REPORT | 3 |
ECONOMIC AND MARKET OVERVIEW (Unaudited)(concluded) | September 30, 2016 |
In the bond market, the Bloomberg Barclays U.S. Aggregate Bond Index* posted a 5.19% return for the period, while the Bloomberg Barclays U.S. Corporate High Yield Index* returned 12.73%. The return of the Bank of America (“BofA”) Merrill Lynch 3-Month U.S. Treasury Bill Index* was 0.28% for the 12-month period.
The opinions and forecasts expressed may not actually come to pass. This information is subject to change at any time, based on market and other conditions, and should not be construed as a recommendation of any specific security or strategy.
*Index Definitions
The following indices are referenced throughout this report.
Indices are unmanaged and not available for direct investment. Index performance does not reflect transaction costs, fees, or expenses.
BofA Merrill Lynch 3-Month U.S. Treasury Bill Index is an unmanaged market Index of U.S. Treasury securities maturing in 90 days that assumes reinvestment of all income.
Bloomberg Barclays U.S. Aggregate Bond Index is a broad-based flagship benchmark that measures the investment grade, U.S. dollar-denominated, fixed-rate taxable bond market, including U.S. Treasuries, government-related and corporate securities, mortgage-backed securities or “MBS” (agency fixed-rate and hybrid adjustable-rate mortgage, or “ARM”, pass-throughs), asset-backed securities (“ABS”), and commercial mortgage-backed securities (“CMBS”) (agency and non-agency).
Bloomberg Barclays U.S. Corporate High Yield Index measures the U.S. dollar-denominated, high yield, fixed-rate corporate bond market. Securities are classified as high yield if the middle rating of Moody’s, Fitch, and S&P is Ba1/BB +/BB + or below.
MSCI EAFE Index is a capitalization-weighted measure of stock markets in Europe, Australasia, and the Far East.
MSCI Emerging Markets Index is a free float-adjusted market capitalization-weighted index that is designed to measure equity market performance in the global emerging markets.
Russell 2500® Value Index measures the performance of the small-to mid-cap value segment of the U.S. equity universe. It includes those Russell 2500 companies with lower price-to-book ratios and lower forecasted growth values.
S&P 500® Index is a broad-based index, the performance of which is based on the performance of 500 widely held common stocks chosen for market size, liquidity, and industry group representation.
4 | THE GUGGENHEIM FUNDS ANNUAL REPORT | |
ABOUT SHAREHOLDERS’ FUND EXPENSES (Unaudited) |
All mutual funds have operating expenses, and it is important for our shareholders to understand the impact of costs on their investments. Shareholders of a fund incur two types of costs: (i) transaction costs, including sales charges (loads) on purchase payments, reinvested dividends, other distributions, and exchange fees, and (ii) ongoing costs, including management fees, administrative services, and shareholder reports, among others. These ongoing costs, or operating expenses, are deducted from a fund’s gross income and reduce the investment return of the fund.
A fund’s expenses are expressed as a percentage of its average net assets, which is known as the expense ratio. The following examples are intended to help investors understand the ongoing costs (in dollars) of investing in a fund and to compare these costs with the ongoing costs of investing in other mutual funds.
The examples are based on an investment of $1,000 made at the beginning of the period and held for the entire six-month period beginning March 31, 2016 and ending September 30, 2016.
The following tables illustrate the Fund’s costs in two ways:
Table 1. Based on actual Fund return: This section helps investors estimate the actual expenses paid over the period. The “Ending Account Value” shown is derived from the Fund’s actual return, and the fifth column shows the dollar amount that would have been paid by an investor who started with $1,000 in the Fund. Investors may use the information here, together with the amount invested, to estimate the expenses paid over the period. Simply divide the Fund’s account value by $1,000 (for example, an $8,600 account value divided by $1,000 = 8.6), then multiply the result by the number provided under the heading “Expenses Paid During Period.”
Table 2. Based on hypothetical 5% return: This section is intended to help investors compare a Fund’s cost with those of other mutual funds. The table provides information about hypothetical account values and hypothetical expenses based on the Fund’s actual expense ratio and an assumed rate of return of 5% per year before expenses, which is not the Fund’s actual return. The hypothetical account values and expenses may not be used to estimate the actual ending account balance or expenses paid during the period. The example is useful in making comparisons because the U.S. Securities and Exchange Commission (the “SEC”) requires all mutual funds to calculate expenses based on the 5% return. Investors can assess a Fund’s costs by comparing this hypothetical example with the hypothetical examples that appear in shareholder reports of other funds.
The calculations illustrated above assume no shares were bought or sold during the period. Actual costs may have been higher or lower, depending on the amount of investment and the timing of any purchases or redemptions.
| | THE GUGGENHEIM FUNDS ANNUAL REPORT | 5 |
ABOUT SHAREHOLDERS’ FUND EXPENSES (Unaudited)(continued) |
Please note that the expenses shown in the table are meant to highlight your ongoing costs only and do not reflect any transactional costs, such as sales charges (loads) on purchase payments, and contingent deferred sales charges (“CDSC”) on redemptions, if any. Therefore, the second table is useful in comparing ongoing costs only, and will not help you determine the relative total costs of owning different funds. In addition, if these transactional costs were included, your costs would have been higher.
More information about the Fund’s expenses, including annual expense ratios for periods up to five years (subject to the Fund’s inception date), can be found in the Financial Highlights section of this report. For additional information on operating expenses and other shareholder costs, please refer to the Fund’s prospectus.
6 | THE GUGGENHEIM FUNDS ANNUAL REPORT | |
ABOUT SHAREHOLDERS’ FUND EXPENSES (Unaudited)(concluded) |
| | Expense
Ratio1 | Fund
Return | Beginning
Account Value
March 31,
2016 | Ending
Account Value
September 30,
2016 | Expenses
Paid During
Period2 |
Table 1. Based on actual Fund return3 |
Mid Cap Value Fund |
A-Class | 1.50% | 8.42% | $ 1,000.00 | $ 1,084.20 | $ 7.84 |
C-Class | 2.29% | 8.01% | 1,000.00 | 1,080.10 | 11.94 |
P-Class | 1.32% | 8.52% | 1,000.00 | 1,085.20 | 6.90 |
| |
Table 2. Based on hypothetical 5% return (before expenses) |
Mid Cap Value Fund |
A-Class | 1.50% | 5.00% | $ 1,000.00 | $ 1,017.55 | $ 7.59 |
C-Class | 2.29% | 5.00% | 1,000.00 | 1,013.59 | 11.56 |
P-Class | 1.32% | 5.00% | 1,000.00 | 1,018.45 | 6.68 |
1 | Annualized and excludes expenses of the underlying funds in which the Fund invests. |
2 | Expenses are equal to the Fund's annualized expense ratio, net of any applicable fee waivers, multiplied by the average account value over the period, multiplied by 183/365 (to reflect the one-half year period). |
3 | Actual cumulative return at net asset value for the period March 31, 2016 to September 30, 2016. |
| | THE GUGGENHEIM FUNDS ANNUAL REPORT | 7 |
MANAGERS’ COMMENTARY (Unaudited) | September 30, 2016 |
To Our Shareholders:
Guggenheim Mid Cap Value Fund (the “Fund”) is managed by a team of seasoned professionals led by James Schier, CFA, Managing Director and Senior Portfolio Manager; Scott Hammond, Managing Director and Portfolio Manager; Farhan Sharaff, Assistant Chief Investment Officer, Equities, and Portfolio Manager; and Gregg Strohkorb, CFA, Portfolio Manager. In the following paragraphs, the team discusses performance of the Fund for the fiscal year ended September 30, 2016.
For the year ended September 30, 2016, the Guggenheim Mid Cap Value Fund returned 15.51%1, compared with the 17.68% return of its benchmark, the Russell 2500 Value Index.
Strategy and Market Overview
Our investment approach focuses on understanding how companies make money and how easily companies can improve returns, maintain existing high levels of profitability, or benefit from change that occurs within the industries in which they operate. In today’s rapidly changing environment marked by very sharp and quick, but constrained volatility, our long-term orientation and discipline are a competitive advantage. This should become especially critical when the environment of indiscriminant valuation expansion subsides, and fundamentals once again become a more dominant factor in the market.
Performance Review
Most of the performance differential was due to stock selection. The largest negative impact was in the Materials sector, the best-performing sector in the Index, and in the Real Estate sector. The largest positive impact on return was in the Industrials sector, followed by Financials.
Among the top individual contributors on an absolute basis were Finisar, a provider of optical subsystems and components that advanced on strong sales among telecom clients, and Sonoco Products Co., a manufacturer of industrial and consumer packaging products. Another strong performer for the period was Industrials name DigitalGlobe, which benefitted from stronger-than-expected commercial as well as government business. Contributing to overall performance were the strategy’s asset-sensitive bank holdings, which performed particularly well late in the period in anticipation of a hike in short term interest rates.
The leading individual detractors from the Fund’s return on an absolute basis included Bunge Ltd., an agribusiness and food company not held in the Index, and Corrections Corporation of America, a Real Estate holding. Corrections Corporation was affected by increasing concern about the potential loss of federal funding, while Bunge faced price and margin volatility in its South American agribusiness exposure due to weather effects and a dollar that was weak through much of the period. Another underperformer was Consumer Discretionary name Essendant, Inc., which reported poor earnings late in the period.
8 | THE GUGGENHEIM FUNDS ANNUAL REPORT | |
MANAGERS’ COMMENTARY (Unaudited)(concluded) | September 30, 2016 |
Portfolio Positioning
The largest relative sector exposures for the year were an underweight in Real Estate and an overweight in Health Care. Both stances detracted from return for the period. The other large underweight was in Financials, which contributed to return for the year.
The Fund has been underweight Financials for some time, as well as the REITs (Real Estate Investment Trust) industry, which was extracted from Financials to form a separate sector in September 2016 and continues to be fairly valued in our view. Toward the end of the period, the Fund trimmed its underweight in Financials by adding several banking names.
Relative underperformance in the overweighted Health Care sector was driven by fears of price controls, brought about by election year politics, severely pressuring biotechnology, device, and products stocks. Early in the period, leading hospital chains fell, citing poor admission trends and higher-than-expected labor costs, which served to punish all of the health-care-service names, especially those that are smaller or have more debt.
Portfolio and Market Outlook
During the quarter, investors began to gain confidence that commodity prices have seen a bottom, which suggested an end to the business pressure not only in energy but in several industrial and financial industries. In addition, the market appears to be getting comfortable with the notion that any interest rate increases will be gradual and enacted with extreme caution. Therefore, with the fear of a commodity-driven recession having ebbed, the fuel for a relief rally was present. With the economic environment proving to be steady but subdued, and a Fed that is acting with utmost caution, the markets appear fated to behave in a choppy manner while trading in a relatively narrow range.
Our portfolios tend to reflect a bias toward companies with balance sheet quality. We continue to find niche companies with what we believe to be attractive growth opportunities, and, as such, are constructive on the outlook.
Performance displayed represents past performance which is no guarantee of future results.
1 | Performance figures are based on Class A shares and do not reflect deduction of the sales charges or taxes that a shareholder would pay on distributions or the redemption of shares. |
The opinions and forecast expressed may not actually come to pass. This information is subject to change at any time, based on market and other conditions, and should not be construed as a recommendation of any specific security or strategy.
| | THE GUGGENHEIM FUNDS ANNUAL REPORT | 9 |
PERFORMANCE REPORT AND FUND PROFILE (Unaudited) | September 30, 2016 |
MID CAP VALUE FUND
OBJECTIVE: Seeks long-term growth of capital.
Holdings Diversification (Market Exposure as % of Net Assets)

“Holdings Diversification (Market Exposure as % of Net Assets)” excludes any temporary cash investments.
Inception Dates: |
A-Class | May 1, 1997 |
C-Class | January 29, 1999 |
P-Class | May 1, 2015 |
Ten Largest Holdings (% of Total Net Assets) |
Zions Bancorporation | 2.3% |
DigitalGlobe, Inc. | 2.3% |
Alleghany Corp. | 1.9% |
Popular, Inc. | 1.8% |
Sonoco Products Co. | 1.7% |
WestRock Co. | 1.6% |
OGE Energy Corp. | 1.5% |
FLIR Systems, Inc. | 1.5% |
KeyCorp | 1.5% |
Wintrust Financial Corp. | 1.5% |
Top Ten Total | 17.6% |
| | |
“Ten Largest Holdings” excludes any temporary cash investments. |
10 | THE GUGGENHEIM FUNDS ANNUAL REPORT | |
PERFORMANCE REPORT AND FUND PROFILE (Unaudited)(concluded) | September 30, 2016 |
Cumulative Fund Performance*

Average Annual Returns*
Periods Ended September 30, 2016
| | 1 Year | 5 Year | 10 Year |
A-Class Shares | 15.51% | 12.69% | 7.00% |
A-Class Shares with sales charge† | 10.02% | 11.60% | 6.37% |
C-Class Shares | 14.64% | 11.87% | 6.21% |
C-Class Shares with CDSC‡ | 13.71% | 11.87% | 6.21% |
Russell 2500 Value Index | 17.68% | 16.29% | 6.92% |
| | | 1 Year | Since Inception
(05/01/15) |
P-Class Shares | | 15.61% | 3.44% |
Russell 2500 Value Index | | 17.68% | 4.18% |
* | The performance data above represents past performance that is not predictive of future results. The investment return and principal value of an investment in the Fund will fluctuate so that an investor’s shares, when redeemed, may be worth more or less than their original cost. Returns are historical and include changes in principal and reinvested dividends and capital gains and do not reflect the effect of taxes. The Russell 2500 Value Index is an unmanaged index and, unlike the Fund, has no management fees or operating expenses to reduce its reported return. The graph is based on A-Class shares only; performance for C-Class and P-Class will vary due to difference in fee structures. |
† | Effective February 22, 2011, the maximum sales charge decreased from 5.75% to 4.75%. A 5.75% maximum sales charge is used in the calculation of the 1 Year, 5 Year and 10 Year average annual returns (based on subscriptions made prior to February 22, 2011), and a 4.75% maximum sales charge will be used to calculate performance for periods based on subscriptions made on or after February 22, 2011. |
‡ | Fund returns include a CDSC of 1% if redeemed within 12 months of purchase. |
| | THE GUGGENHEIM FUNDS ANNUAL REPORT | 11 |
SCHEDULE OF INVESTMENTS | September 30, 2016 |
MID CAP VALUE FUND | |
| | | Shares | | | Value | |
| | | | | | | |
COMMON STOCKS† - 100.1% | |
| | | | | | | |
Financial - 32.2% | |
Zions Bancorporation | | | 372,431 | | | $ | 11,552,810 | |
Alleghany Corp.* | | | 18,760 | | | | 9,849,375 | |
Popular, Inc. | | | 238,806 | | | | 9,127,166 | |
KeyCorp | | | 632,734 | | | | 7,700,372 | |
Wintrust Financial Corp. | | | 136,985 | | | | 7,612,256 | |
Sun Communities, Inc. | | | 86,645 | | | | 6,799,900 | |
Fulton Financial Corp. | | | 456,532 | | | | 6,628,845 | |
Trustmark Corp. | | | 234,931 | | | | 6,474,698 | |
Assured Guaranty Ltd. | | | 230,060 | | | | 6,384,165 | |
Endurance Specialty Holdings Ltd. | | | 97,234 | | | | 6,363,965 | |
Huntington Bancshares, Inc. | | | 619,217 | | | | 6,105,480 | |
E*TRADE Financial Corp.* | | | 196,266 | | | | 5,715,266 | |
CubeSmart | | | 201,623 | | | | 5,496,243 | |
Alexandria Real Estate Equities, Inc. | | | 47,538 | | | | 5,170,709 | |
Parkway Properties, Inc. | | | 294,149 | | | | 5,003,474 | |
EastGroup Properties, Inc. | | | 65,008 | | | | 4,781,989 | |
Hanover Insurance Group, Inc. | | | 62,743 | | | | 4,732,077 | |
EPR Properties | | | 54,969 | | | | 4,328,259 | |
Radian Group, Inc. | | | 317,168 | | | | 4,297,626 | |
Prosperity Bancshares, Inc. | | | 76,194 | | | | 4,182,289 | |
Equity Commonwealth* | | | 137,452 | | | | 4,153,799 | |
Lexington Realty Trust | | | 330,030 | | | | 3,399,309 | |
First Industrial Realty Trust, Inc. | | | 115,802 | | | | 3,267,932 | |
DCT Industrial Trust, Inc. | | | 62,198 | | | | 3,019,713 | |
Unum Group | | | 83,906 | | | | 2,962,721 | |
PacWest Bancorp | | | 64,607 | | | | 2,772,286 | |
Monogram Residential Trust, Inc. | | | 252,517 | | | | 2,686,780 | |
Camden Property Trust | | | 30,148 | | | | 2,524,594 | |
Genworth Financial, Inc. — Class A* | | | 351,751 | | | | 1,744,685 | |
Apartment Investment & Management Co. — Class A | | | 32,403 | | | | 1,487,622 | |
Farmer Mac — Class C | | | 36,917 | | | | 1,458,222 | |
Hancock Holding Co. | | | 42,383 | | | | 1,374,481 | |
IBERIABANK Corp. | | | 20,179 | | | | 1,354,414 | |
Umpqua Holdings Corp. | | | 85,868 | | | | 1,292,313 | |
First Merchants Corp. | | | 48,190 | | | | 1,289,083 | |
Corrections Corporation of America | | | 82,972 | | | | 1,150,822 | |
Total Financial | | | | | | | 164,245,740 | |
| | | | | | | | | |
Industrial - 16.2% | |
Sonoco Products Co. | | | 165,664 | | | | 8,752,028 | |
WestRock Co. | | | 164,241 | | | | 7,962,404 | |
FLIR Systems, Inc. | | | 245,813 | | | | 7,723,444 | |
Oshkosh Corp. | | | 119,397 | | | | 6,686,232 | |
Gentex Corp. | | | 360,230 | | | | 6,325,639 | |
Corning, Inc. | | | 261,760 | | | | 6,190,624 | |
Owens-Illinois, Inc.* | | | 284,313 | | | | 5,228,516 | |
Huntington Ingalls Industries, Inc. | | | 23,219 | | | | 3,562,259 | |
Werner Enterprises, Inc. | | | 145,448 | | | | 3,384,575 | |
Scorpio Tankers, Inc. | | | 668,711 | | | | 3,096,132 | |
Kirby Corp.* | | | 45,098 | | | | 2,803,292 | |
Harris Corp. | | | 30,338 | | | | 2,779,264 | |
Crane Co. | | | 42,679 | | | | 2,689,204 | |
Ryder System, Inc. | | | 39,829 | | | | 2,626,723 | |
Spirit AeroSystems Holdings, Inc. — Class A* | | | 58,742 | | | | 2,616,369 | |
Owens Corning | | | 47,516 | | | | 2,536,879 | |
Orbital ATK, Inc. | | | 33,195 | | | | 2,530,455 | |
ITT, Inc. | | | 68,205 | | | | 2,444,467 | |
Summit Materials, Inc. — Class A* | | | 125,055 | | | | 2,319,770 | |
Total Industrial | | | | | | | 82,258,276 | |
| | | | | | | | | |
Consumer, Non-cyclical - 14.4% | |
Bunge Ltd. | | | 113,991 | | | | 6,751,687 | |
Emergent BioSolutions, Inc.* | | | 209,654 | | | | 6,610,391 | |
Navigant Consulting, Inc.* | | | 289,578 | | | | 5,855,266 | |
Quest Diagnostics, Inc. | | | 68,021 | | | | 5,756,617 | |
12 | THE GUGGENHEIM FUNDS ANNUAL REPORT | SEE NOTES TO FINANCIAL STATEMENTS. |
SCHEDULE OF INVESTMENTS (continued) | September 30, 2016 |
MID CAP VALUE FUND | |
| | | Shares | | | Value | |
| | | | | | | |
ICF International, Inc.* | | | 123,808 | | | $ | 5,487,171 | |
Sanderson Farms, Inc. | | | 54,652 | | | | 5,264,627 | |
HealthSouth Corp. | | | 111,036 | | | | 4,504,731 | |
United Rentals, Inc.* | | | 51,487 | | | | 4,041,215 | |
Premier, Inc. — Class A* | | | 124,090 | | | | 4,013,071 | |
Surgical Care Affiliates, Inc.* | | | 79,659 | | | | 3,884,172 | |
Patterson Companies, Inc. | | | 83,799 | | | | 3,849,726 | |
MEDNAX, Inc.* | | | 57,961 | | | | 3,839,916 | |
FTI Consulting, Inc.* | | | 71,943 | | | | 3,205,780 | |
Ingredion, Inc. | | | 17,827 | | | | 2,372,061 | |
Molina Healthcare, Inc.* | | | 40,095 | | | | 2,338,340 | |
Universal Corp. | | | 32,998 | | | | 1,921,144 | |
John B Sanfilippo & Son, Inc. | | | 27,488 | | | | 1,410,959 | |
Darling Ingredients, Inc.* | | | 84,767 | | | | 1,145,202 | |
Community Health Systems, Inc.* | | | 81,577 | | | | 941,399 | |
Total Consumer, Non-cyclical | | | | 73,193,475 | |
| | | | | | | | | |
Utilities - 9.1% | |
OGE Energy Corp. | | | 245,725 | | | | 7,769,824 | |
Black Hills Corp. | | | 105,216 | | | | 6,441,323 | |
Ameren Corp. | | | 120,583 | | | | 5,930,272 | |
Portland General Electric Co. | | | 131,042 | | | | 5,581,079 | |
Avista Corp. | | | 127,109 | | | | 5,311,885 | |
Pinnacle West Capital Corp. | | | 62,742 | | | | 4,767,765 | |
UGI Corp. | | | 92,499 | | | | 4,184,654 | |
Calpine Corp.* | | | 278,143 | | | | 3,515,728 | |
ONE Gas, Inc. | | | 24,103 | | | | 1,490,530 | |
AES Corp. | | | 104,029 | | | | 1,336,773 | |
Total Utilities | | | | | | | 46,329,833 | |
| | | | | | | | | |
Consumer, Cyclical - 7.4% | |
DR Horton, Inc. | | | 201,457 | | | | 6,084,001 | |
J.C. Penney Company, Inc.* | | | 651,631 | | | | 6,008,038 | |
PVH Corp. | | | 51,520 | | | | 5,692,960 | |
UniFirst Corp. | | | 39,320 | | | | 5,184,735 | |
Essendant, Inc. | | | 190,475 | | | | 3,908,547 | |
Caleres, Inc. | | | 116,750 | | | | 2,952,608 | |
CalAtlantic Group, Inc. | | | 84,934 | | | | 2,840,193 | |
Goodyear Tire & Rubber Co. | | | 44,751 | | | | 1,445,457 | |
La-Z-Boy, Inc. | | | 57,330 | | | | 1,408,025 | |
WESCO International, Inc.* | | | 21,468 | | | | 1,320,067 | |
Vista Outdoor, Inc.* | | | 25,206 | | | | 1,004,711 | |
Total Consumer, Cyclical | | | | | | | 37,849,342 | |
| | | | | | | | | |
Energy - 7.0% | |
Marathon Oil Corp. | | | 441,900 | | | | 6,986,439 | |
Oasis Petroleum, Inc.* | | | 553,200 | | | | 6,345,203 | |
Laredo Petroleum, Inc.* | | | 461,823 | | | | 5,957,517 | |
Chesapeake Energy Corp.* | | | 573,154 | | | | 3,593,676 | |
Apache Corp. | | | 48,781 | | | | 3,115,642 | |
Rowan Companies plc — Class A | | | 202,999 | | | | 3,077,465 | |
Gulfport Energy Corp.* | | | 90,204 | | | | 2,548,263 | |
Whiting Petroleum Corp.* | | | 239,799 | | | | 2,095,843 | |
WPX Energy, Inc.* | | | 156,129 | | | | 2,059,342 | |
Total Energy | | | | | | | 35,779,390 | |
| | | | | | | | | |
Technology - 6.5% | |
IXYS Corp. | | | 599,659 | | | | 7,225,890 | |
Micron Technology, Inc.* | | | 377,374 | | | | 6,709,710 | |
Maxwell Technologies, Inc.* | | | 1,112,324 | | | | 5,739,592 | |
CSRA, Inc. | | | 164,143 | | | | 4,415,447 | |
Lam Research Corp. | | | 44,542 | | | | 4,218,572 | |
MKS Instruments, Inc. | | | 68,075 | | | | 3,385,370 | |
ManTech International Corp. — Class A | | | 43,030 | | | | 1,621,801 | |
Total Technology | | | | | | | 33,316,382 | |
| | | | | | | | | |
Communications - 4.2% | |
DigitalGlobe, Inc.* | | | 418,120 | | | | 11,498,300 | |
Finisar Corp.* | | | 146,050 | | | | 4,352,290 | |
Scripps Networks Interactive, Inc. — Class A | | | 66,734 | | | | 4,236,942 | |
SEE NOTES TO FINANCIAL STATEMENTS. | THE GUGGENHEIM FUNDS ANNUAL REPORT | 13 |
SCHEDULE OF INVESTMENTS (continued) | September 30, 2016 |
MID CAP VALUE FUND | |
| | | Shares | | | Value | |
| | | | | | | |
Infinera Corp.* | | | 140,367 | | | $ | 1,267,514 | |
Total Communications | | | | | | | 21,355,046 | |
| | | | | | | | | |
Basic Materials - 3.1% | |
Reliance Steel & Aluminum Co. | | | 68,300 | | | | 4,919,649 | |
Freeport-McMoRan, Inc. | | | 362,127 | | | | 3,932,699 | |
Olin Corp. | | | 151,980 | | | | 3,118,629 | |
LyondellBasell Industries N.V. — Class A | | | 28,813 | | | | 2,324,057 | |
Landec Corp.* | | | 112,182 | | | | 1,504,361 | |
Total Basic Materials | | | | | | | 15,799,395 | |
| | | | | | | | | |
Total Common Stocks | | | | | | | | |
(Cost $446,851,893) | | | | | | | 510,126,879 | |
| | | | | | | | | |
CONVERTIBLE PREFERRED STOCKS††† - 0.0% | |
Thermoenergy Corp.* ,1, 3 | | | 858,334 | | | | 251 | |
Total Convertible Preferred Stocks | | | | | |
(Cost $819,654) | | | | | | | 251 | |
| | | | | | | | | |
SHORT-TERM INVESTMENTS† - 1.6% | |
Dreyfus Treasury
Securities Cash
Management
Fund - Institutional
Shares 0.16%2 | | | 8,155,026 | | | | 8,155,026 | |
Total Short-Term Investments | | | | | |
(Cost $8,155,026) | | | | | | | 8,155,026 | |
| | | | | | | | | |
Total Investments - 101.7% | | | | | | | | |
(Cost $455,826,573) | | | | | | $ | 518,282,156 | |
Other Assets & Liabilities, net - (1.7)% | | | | (8,799,532 | ) |
Total Net Assets - 100.0% | | | $ | 509,482,624 | |
* | Non-income producing security. |
† | Value determined based on Level 1 inputs — See Note 4. |
††† | Value determined based on Level 3 inputs — See Note 4. |
1 | PIPE (Private Investment in Public Equity) — Stock issued by a company in the secondary market as a means of raising capital more quickly and less expensively than through registration of a secondary public offering. |
2 | Rate indicated is the 7 day yield as of September 30, 2016. |
3 | Illquid Security. |
| | plc — Public Limited Company |
| | |
| | See Sector Classification in Other Information section. |
14 | THE GUGGENHEIM FUNDS ANNUAL REPORT | SEE NOTES TO FINANCIAL STATEMENTS. |
SCHEDULE OF INVESTMENTS (concluded) | September 30, 2016 |
MID CAP VALUE FUND | |
The following table summarizes the inputs used to value the Fund’s investments at September 30, 2016 (See Note 4 in the Notes to Financial Statements):
Investments in Securities (Assets) | | Level 1 | | | Level 2 | | | Level 3 | | | Total | |
Common Stocks | | $ | 510,126,879 | | | $ | — | | | $ | — | | | $ | 510,126,879 | |
Convertible Preferred Stocks | | | — | | | | — | | | | 251 | | | | 251 | |
Short Term Investments | | | 8,155,026 | | | | — | | | | — | | | | 8,155,026 | |
Total | | $ | 518,281,905 | | | $ | — | | | $ | 251 | | | $ | 518,282,156 | |
Transfers between investment levels may occur as the markets fluctuate and/or the availability of data used in an investment’s valuation changes. Transfers between valuation levels, if any, are in comparison to the valuation levels at the end of the previous fiscal year, and are effective using the fair value as of the end of the previous fiscal period.
For the year ended September 30, 2016, there were no transfers between levels.
SEE NOTES TO FINANCIAL STATEMENTS. | THE GUGGENHEIM FUNDS ANNUAL REPORT | 15 |
STATEMENT OF ASSETS AND LIABILITIES |
MID CAP VALUE FUND |
September 30, 2016
Assets: | |
Investments, at value (cost $455,826,573) | | $ | 518,282,156 | |
Prepaid expenses | | | 33,630 | |
Cash | | | 9,598 | |
Receivables: | |
Securities sold | | | 1,522,641 | |
Fund shares sold | | | 342,165 | |
Dividends | | | 751,952 | |
Foreign taxes reclaim | | | 13,049 | |
Total assets | | | 520,955,191 | |
| | | | | |
Liabilities: | |
Payable for: | |
Fund shares redeemed | | | 5,657,475 | |
Securities purchased | | | 4,366,713 | |
Management fees | | | 356,462 | |
Transfer agent/maintenance fees | | | 182,424 | |
Distribution and service fees | | | 167,267 | |
Trustees’ fees* | | | 50,007 | |
Fund accounting/administration fees | | | 39,960 | |
Miscellaneous | | | 652,259 | |
Total liabilities | | | 11,472,567 | |
Net assets | | $ | 509,482,624 | |
| | | | | |
Net assets consist of: | |
Paid in capital | | $ | 434,043,523 | |
Undistributed net investment income | | | 5,780,421 | |
Accumulated net realized gain on investments | | | 7,203,097 | |
Net unrealized appreciation on investments | | | 62,455,583 | |
Net assets | | $ | 509,482,624 | |
| | | | | |
A-Class: | |
Net assets | | $ | 407,882,830 | |
Capital shares outstanding | | | 13,476,218 | |
Net asset value per share | | $ | 30.27 | |
Maximum offering price per share (Net asset value divided by 95.25%) | | $ | 31.78 | |
| | | | | |
C-Class: | |
Net assets | | $ | 98,176,423 | |
Capital shares outstanding | | | 4,309,386 | |
Net asset value per share | | $ | 22.78 | |
| | | | | |
P-Class: | |
Net assets | | $ | 3,423,371 | |
Capital shares outstanding | | | 113,416 | |
Net asset value per share | | $ | 30.18 | |
* | Relates to Trustees not deemed “interested persons” within the meaning of Section 2(a)(19) of the 1940 Act. |
16 | THE GUGGENHEIM FUNDS ANNUAL REPORT | SEE NOTES TO FINANCIAL STATEMENTS. |
STATEMENT OF OPERATIONS |
MID CAP VALUE FUND |
Year Ended September 30, 2016
Investment Income: | |
Dividends (net of foreign withholding tax of $16,434) | | $ | 13,556,885 | |
Interest | | | 5,268 | |
Total investment income | | | 13,562,153 | |
| | | | | |
Expenses: | |
Management fees | | | 4,526,289 | |
Transfer agent/maintenance fees | |
A-Class | | | 780,848 | |
C-Class | | | 230,552 | |
P-Class | | | 434 | |
Distribution and service fees: | |
A-Class | | | 1,065,076 | |
C-Class | | | 1,095,540 | |
P-Class | | | 3,016 | |
Fund accounting/administration fees | | | 509,945 | |
Line of credit fees | | | 93,518 | |
Trustees’ fees* | | | 66,226 | |
Custodian fees | | | 24,244 | |
Miscellaneous | | | 441,778 | |
Total expenses | | | 8,837,466 | |
Net investment income | | | 4,724,687 | |
| | | | | |
Net Realized and Unrealized Gain (Loss): | |
Net realized gain (loss) on: | |
Investments | | | 17,533,078 | |
Net realized gain | | | 17,533,078 | |
Net change in unrealized appreciation (depreciation) on: | |
Investments | | | 53,021,430 | |
Net change in unrealized appreciation (depreciation) | | | 53,021,430 | |
Net realized and unrealized gain | | | 70,554,508 | |
Net increase in net assets resulting from operations | | $ | 75,279,195 | |
* | Relates to Trustees not deemed “interested persons” within the meaning of Section 2(a)(19) of the 1940 Act. |
SEE NOTES TO FINANCIAL STATEMENTS. | THE GUGGENHEIM FUNDS ANNUAL REPORT | 17 |
STATEMENTS OF CHANGES IN NET ASSETS |
MID CAP VALUE FUND | |
| | | Year Ended
September 30,
2016 | | | Year Ended
September 30,
2015 | |
Increase (Decrease) in Net Assets from Operations: | | | | | | |
Net investment income | | $ | 4,724,687 | | | $ | 430,814 | |
Net realized gain on investments | | | 17,533,078 | | | | 148,539,157 | |
Net change in unrealized appreciation (depreciation) on investments | | | 53,021,430 | | | | (179,558,088 | ) |
Net increase (decrease) in net assets resulting from operations | | | 75,279,195 | | | | (30,588,117 | ) |
| | | | | | | | | |
Distributions to shareholders from: | | | | | | | | |
Net realized gains | | | | | | | | |
A-Class | | | (71,175,868 | ) | | | (123,882,978 | ) |
B-Class | | | — | | | | (1,863,094 | ) |
C-Class | | | (23,558,203 | ) | | | (28,169,528 | ) |
P-Class | | | (15,730 | ) | | | — | * |
Total distributions to shareholders | | | (94,749,801 | ) | | | (153,915,600 | ) |
| | | | | | | | | |
Capital share transactions: | | | | | | | | |
Proceeds from sale of shares | | | | | | | | |
A-Class | | | 32,844,791 | | | | 95,234,863 | |
B-Class | | | — | | | | 61,226 | |
C-Class | | | 5,397,137 | | | | 9,969,782 | |
P-Class | | | 4,471,143 | | | | 62,301 | * |
Distributions reinvested | | | | | | | | |
A-Class | | | 65,228,180 | | | | 114,025,165 | |
B-Class | | | — | | | | 1,753,261 | |
C-Class | | | 20,922,534 | | | | 24,118,771 | |
P-Class | | | 15,730 | | | | — | * |
Cost of shares redeemed | | | | | | | | |
A-Class | | | (156,281,880 | ) | | | (604,909,941 | ) |
B-Class | | | — | | | | (12,817,123 | ) |
C-Class | | | (45,239,145 | ) | | | (63,102,815 | ) |
P-Class | | | (1,301,763 | ) | | | — | * |
Net decrease from capital share transactions | | | (73,943,273 | ) | | | (435,604,510 | ) |
Net decrease in net assets | | | (93,413,879 | ) | | | (620,108,227 | ) |
| | | | | | | | | |
Net assets: | | | | | | | | |
Beginning of year | | | 602,896,503 | | | | 1,223,004,730 | |
End of year | | $ | 509,482,624 | | | $ | 602,896,503 | |
Undistributed net investment income at end of year | | $ | 5,780,421 | | | $ | — | |
18 | THE GUGGENHEIM FUNDS ANNUAL REPORT | SEE NOTES TO FINANCIAL STATEMENTS. |
STATEMENTS OF CHANGES IN NET ASSETS (concluded) |
MID CAP VALUE FUND | |
| | | Year Ended
September 30,
2016 | | | Year Ended
September 30,
2015 | |
Capital share activity: | | | | | | |
Shares sold | | | | | | |
A-Class | | | 1,179,023 | | | | 2,752,607 | |
B-Class | | | — | | | | 2,355 | |
C-Class | | | 256,114 | | | | 363,138 | |
P-Class | | | 157,411 | | | | 1,862 | * |
Shares issued from reinvestment of distributions | | | | | | | | |
A-Class | | | 2,398,977 | | | | 3,380,581 | |
B-Class | | | — | | | | 68,273 | |
C-Class | | | 1,015,657 | | | | 893,949 | |
P-Class | | | 581 | | | | — | * |
Shares redeemed | | | | | | | | |
A-Class | | | (5,552,921 | ) | | | (17,642,149 | ) |
B-Class | | | — | | | | (501,001 | ) |
C-Class | | | (2,098,789 | ) | | | (2,316,755 | ) |
P-Class | | | (46,438 | ) | | | — | * |
Net decrease in shares | | | (2,690,385 | ) | | | (12,997,140 | ) |
* | Since the commencement of operations: May 1, 2015. |
SEE NOTES TO FINANCIAL STATEMENTS. | THE GUGGENHEIM FUNDS ANNUAL REPORT | 19 |
FINANCIAL HIGHLIGHTS |
MID CAP VALUE FUND | |
This table is presented to show selected data for a share outstanding throughout each period and to assist shareholders in evaluating a Fund’s performance for the periods presented.
A-Class | | Year Ended
Sept. 30,
2016 | | | Year Ended
Sept. 30,
2015 | | | Year Ended
Sept. 30,
2014 | | | Year Ended
Sept. 30,
2013 | | | Year Ended
Sept. 30,
2012 | |
Per Share Data | | | | | | | | | | | | | | | |
Net asset value, beginning of period | | $ | 30.86 | | | $ | 37.73 | | | $ | 38.15 | | | $ | 33.05 | | | $ | 27.13 | |
Income (loss) from investment operations: | |
Net investment income (loss)a | | | .30 | | | | .06 | | | | .03 | | | | .04 | | | | (.07 | ) |
Net gain (loss) on investments (realized and unrealized) | | | 3.95 | | | | (2.24 | ) | | | 2.04 | | | | 8.59 | | | | 6.54 | |
Total from investment operations | | | 4.25 | | | | (2.18 | ) | | | 2.07 | | | | 8.63 | | | | 6.47 | |
Less distributions from: | |
Net realized gains | | | (4.84 | ) | | | (4.69 | ) | | | (2.49 | ) | | | (3.53 | ) | | | (.55 | ) |
Total distributions | | | (4.84 | ) | | | (4.69 | ) | | | (2.49 | ) | | | (3.53 | ) | | | (.55 | ) |
Net asset value, end of period | | $ | 30.27 | | | $ | 30.86 | | | $ | 37.73 | | | $ | 38.15 | | | $ | 33.05 | |
| | |
Total Returnb | | | 15.51 | % | | | (6.83 | %) | | | 5.52 | % | | | 28.93 | % | | | 24.13 | % |
Ratios/Supplemental Data | |
Net assets, end of period (in thousands) | | $ | 407,883 | | | $ | 476,792 | | | $ | 1,017,208 | | | $ | 1,038,762 | | | $ | 903,221 | |
Ratios to average net assets: | |
Net investment income (loss) | | | 1.04 | % | | | 0.18 | % | | | 0.08 | % | | | 0.11 | % | | | (0.22 | %) |
Total expensesd | | | 1.49 | % | | | 1.42 | % | | | 1.39 | % | | | 1.39 | % | | | 1.46 | % |
Portfolio turnover rate | | | 52 | % | | | 84 | % | | | 35 | % | | | 23 | % | | | 19 | % |
20 | THE GUGGENHEIM FUNDS ANNUAL REPORT | SEE NOTES TO FINANCIAL STATEMENTS. |
FINANCIAL HIGHLIGHTS (continued) |
MID CAP VALUE FUND | |
This table is presented to show selected data for a share outstanding throughout each period and to assist shareholders in evaluating a Fund’s performance for the periods presented.
C-Class | | Year Ended
Sept. 30,
2016 | | | Year Ended
Sept. 30,
2015 | | | Year Ended
Sept. 30,
2014 | | | Year Ended
Sept. 30,
2013 | | | Year Ended
Sept. 30,
2012 | |
Per Share Data | | | | | | | | | | | | | | | |
Net asset value, beginning of period | | $ | 24.54 | | | $ | 31.14 | | | $ | 32.13 | | | $ | 28.57 | | | $ | 23.68 | |
Income (loss) from investment operations: | |
Net investment income (loss)a | | | .06 | | | | (.15 | ) | | | (.21 | ) | | | (.18 | ) | | | (.25 | ) |
Net gain (loss) on investments (realized and unrealized) | | | 3.02 | | | | (1.76 | ) | | | 1.71 | | | | 7.27 | | | | 5.69 | |
Total from investment operations | | | 3.08 | | | | (1.91 | ) | | | 1.50 | | | | 7.09 | | | | 5.44 | |
Less distributions from: | |
Net realized gains | | | (4.84 | ) | | | (4.69 | ) | | | (2.49 | ) | | | (3.53 | ) | | | (.55 | ) |
Total distributions | | | (4.84 | ) | | | (4.69 | ) | | | (2.49 | ) | | | (3.53 | ) | | | (.55 | ) |
Net asset value, end of period | | $ | 22.78 | | | $ | 24.54 | | | $ | 31.14 | | | $ | 32.13 | | | $ | 28.57 | |
| | |
Total Returnb | | | 14.64 | % | | | (7.49 | %) | | | 4.74 | % | | | 27.98 | % | | | 23.28 | % |
Ratios/Supplemental Data | |
Net assets, end of period (in thousands) | | $ | 98,176 | | | $ | 126,047 | | | $ | 192,942 | | | $ | 219,695 | | | $ | 191,249 | |
Ratios to average net assets: | |
Net investment income (loss) | | | 0.27 | % | | | (0.53 | %) | | | (0.65 | %) | | | (0.62 | %) | | | (0.92 | %) |
Total expensesd | | | 2.27 | % | | | 2.12 | % | | | 2.12 | % | | | 2.12 | % | | | 2.17 | % |
Portfolio turnover rate | | | 52 | % | | | 84 | % | | | 35 | % | | | 23 | % | | | 19 | % |
SEE NOTES TO FINANCIAL STATEMENTS. | THE GUGGENHEIM FUNDS ANNUAL REPORT | 21 |
FINANCIAL HIGHLIGHTS (concluded) |
MID CAP VALUE FUND |
This table is presented to show selected data for a share outstanding throughout each period and to assist shareholders in evaluating a Fund’s performance for the periods presented.
P-Class | | Year Ended
Sept. 30,
2016 | | | Period Ended
Sept. 30,
2015c | |
Per Share Data | | | | | | |
Net asset value, beginning of period | | $ | 30.77 | | | $ | 33.91 | |
Income (loss) from investment operations: | |
Net investment income (loss)a | | | .14 | | | | .10 | |
Net gain (loss) on investments (realized and unrealized) | | | 4.11 | | | | (3.24 | ) |
Total from investment operations | | | 4.25 | | | | (3.14 | ) |
Less distributions from: | |
Net realized gains | | | (4.84 | ) | | | — | |
Total distributions | | | (4.84 | ) | | | — | |
Net asset value, end of period | | $ | 30.18 | | | $ | 30.77 | |
| | |
Total Returnb | | | 15.61 | % | | | (9.26 | %) |
Ratios/Supplemental Data | |
Net assets, end of period (in thousands) | | $ | 3,423 | | | $ | 57 | |
Ratios to average net assets: | |
Net investment income (loss) | | | 0.48 | % | | | 0.71 | % |
Total expensesd | | | 1.32 | % | | | 1.32 | % |
Portfolio turnover rate | | | 52 | % | | | 84 | % |
a | Net investment income (loss) per share was computed using average shares outstanding throughout the period. |
b | Total return does not reflect the impact of any applicable sales charges and has not been annualized. |
c | Since commencement of operations: May 1, 2015. Percentage amounts for the period, except total return and portfolio turnover rate, have been annualized. |
d | Does not include expenses of the underlying funds in which the Fund invests. |
22 | THE GUGGENHEIM FUNDS ANNUAL REPORT | SEE NOTES TO FINANCIAL STATEMENTS. |
NOTES TO FINANCIAL STATEMENTS |
1. Organization and Significant Accounting Policies
Organization
Guggenheim Funds Trust (the “Trust”), a Delaware statutory trust, is registered with the SEC under the Investment Company Act of 1940 (“1940 Act”), as an open-ended investment company of the series type. Each series, in effect, is representing a separate Fund. The Trust is authorized to issue an unlimited number of shares. The Trust accounts for the assets of each Fund separately.
The Trust offers a combination of four separate classes of shares, A-Class shares, C-Class shares, P-Class shares and Institutional Class shares. Sales of shares of each Class are made without a front-end sales charge at the net asset value per share (“NAV”), with the exception of A-Class shares. A-Class shares are sold at the NAV, plus the applicable front-end sales charge. The sales charge varies depending on the amount purchased but will not exceed 4.75%. A-Class share purchases of $1 million or more are exempt from the front-end sales charge but have a 1% contingent deferred sales charge (“CDSC”), if shares are redeemed within 12 months of purchase. B-Class shares previously offered have been converted to A-Class shares effective July 31, 2014 for the Alpha Opportunity Fund, and effective August 8, 2015 for the other funds in the Trust. C-Class shares have a 1% CDSC if shares are redeemed within 12 months of purchase. Institutional Class shares are offered primarily for direct investment by institutions such as pension and profit sharing plans, endowments, foundations and corporations. Institutional Class shares require a minimum initial investment of $2 million and a minimum account balance of $1 million. At September 30, 2016, the Trust consisted of nineteen funds (the “Funds”).
This report covers the Mid Cap Value Fund (the “Fund”), a diversified investment company. Only A-Class, C-Class and P-Class shares had been issued by the Fund.
Guggenheim Investments (“GI”) provides advisory services, and Rydex Fund Services, LLC (“RFS”) provides transfer agent, administrative and accounting services to the Trust. Guggenheim Funds Distributors, LLC (“GFD”) acts as principal underwriter for the Trust. GI and GFD are affiliated entities; RFS ceased to be an affiliate of GI as of October 4, 2016, when it was acquired by MUFG Investor Services. In connection with its acquisition, RFS changed its name to MUFG Investor Services (US), LLC (“MUIS”). This change has no impact on the financial statements of the Fund.
Significant Accounting Policies
The Fund operates as an investment company and, accordingly, follows the investment company accounting and reporting guidance of the Financial Accounting Standards Board (“FASB”) Accounting Standards Codification Topic 946 Financial Services – Investment Companies.
The following significant accounting policies are in conformity with U.S. generally accepted accounting principles (“U.S. GAAP”) and are consistently followed by the Trust. This requires management to make estimates and assumptions that affect the reported amount of assets and
| | THE GUGGENHEIM FUNDS ANNUAL REPORT | 23 |
NOTES TO FINANCIAL STATEMENTS (continued) |
liabilities, contingent assets and liabilities at the date of the financial statements, and the reported amounts of revenues and expenses during the reporting period. Actual results could differ from these estimates. All time references are based on Eastern Time.
The NAV of each Class of the Fund is calculated by dividing the market value of the Fund’s securities and other assets, less all liabilities, attributable to the Class by the number of outstanding shares of the Fund.
A. The Board of Trustees of the Fund (the “Board”) has adopted policies and procedures for the valuation of the Fund’s investments (the “Valuation Procedures”). Pursuant to the Valuation Procedures, the Board has delegated to a valuation committee, consisting of representatives from Guggenheim’s investment management, fund administration, legal and compliance departments (the “Valuation Committee”), the day-to-day responsibility for implementing the Valuation Procedures, including, under most circumstances, the responsibility for determining the fair value of the Fund’s securities and/or other assets.
Valuations of the Fund’s securities are supplied primarily by pricing services appointed pursuant to the processes set forth in the Valuation Procedures. The Valuation Committee convenes monthly, or more frequently as needed, to review the valuation of all assets which have been fair valued for reasonableness. The Fund’s officers, through the Valuation Committee and consistent with the monitoring and review responsibilities set forth in the Valuation Procedures, regularly review procedures used and valuations provided by the pricing services.
If the pricing service cannot or does not provide a valuation for a particular investment or such valuation is deemed unreliable, such investment is fair valued by the Valuation Committee.
Equity securities listed on an exchange (New York Stock Exchange (“NYSE”) or American Stock Exchange) are valued at the last quoted sales price as of the close of business on the NYSE, usually 4:00 p.m. on the valuation date. Equity securities listed on the NASDAQ market system are valued at the NASDAQ Official Closing Price on the valuation date, which may not necessarily represent the last sale price. If there has been no sale on such exchange or NASDAQ on a given day, the security is valued at the closing bid price on that day.
Open-end investment companies (“Mutual Funds”) are valued at their NAV as of the close of business, on the valuation date.
Investments for which market quotations are not readily available are fair-valued as determined in good faith by GI under the direction of the Board of Trustees using methods established or ratified by the Board of Trustees. These methods include but are not limited to: market prices; sale prices; broker quotes; and models which derive prices based on inputs such as prices of securities with comparable maturities and characteristics, or based on inputs such as anticipated cash flows or collateral, spread over Treasuries, and other information analysis.
24 | THE GUGGENHEIM FUNDS ANNUAL REPORT | |
NOTES TO FINANCIAL STATEMENTS (continued) |
B. Security transactions are recorded on the trade date for financial reporting purposes. Realized gains and losses from securities transactions are recorded using the identified cost basis. Proceeds from lawsuits related to investment holdings are recorded as realized gains in the Fund. Dividend income is recorded on the ex-dividend date, net of applicable taxes withheld by foreign countries. Taxable non-cash dividends are recorded as dividend income. Interest income, including amortization of premiums and accretion of discounts, is accrued on a daily basis. Interest income also includes paydown gains and losses on mortgage-backed and asset-backed securities and senior and subordinated loans. Amendment fees are earned as compensation for evaluating and accepting changes to the original loan agreement and are recognized when received. Dividend income from REITs is recorded based on the income included in the distributions received from the REIT investments using published REIT classifications, including some management estimates when actual amounts are not available. Distributions received in excess of this estimated amount are recorded as a reduction of the cost of investments or reclassified to capital gains. The actual amounts of income, return of capital, and capital gains are only determined by each REIT after its fiscal year-end, and may differ from the estimated amounts.
C. Distributions of net investment income and net realized gains, if any, are declared and paid at least annually. Dividends are reinvested in additional shares unless shareholders request payment in cash. Distributions are recorded on the ex-dividend date and are determined in accordance with income tax regulations which may differ from U.S. GAAP.
D. Interest and dividend income, most expenses, all realized gains and losses, and all unrealized gains and losses are allocated to the classes based upon the value of the outstanding shares in each Class. Certain costs, such as distribution and service fees are charged directly to specific classes. In addition, certain expenses have been allocated to the individual Funds in the Trust on a pro rata basis upon the respective aggregate net assets of each Fund included in the Trust.
E. Under the fee arrangement with the custodian, the Fund may earn credits based on overnight custody cash balances. These credits are utilized to reduce related custodial expenses. The custodian fees disclosed in the Statement of Operations are before the reduction in expense from the related earnings credits, if any. For the year ended September 30, 2016, there were no earnings credits received.
F. The Fund may leave cash overnight in its cash account with the custodian. Periodically, the Fund may have cash due to the custodian bank as an overdraft balance. A fee is incurred on this overdraft, calculated by multiplying the overdraft by a rate based on the federal funds rate, which was 0.29% at September 30, 2016.
G. Under the Fund’s organizational documents, its Trustees and Officers are indemnified against certain liabilities arising out of the performance of their duties to the Trust. In addition, throughout the normal course of business, the Fund enters into contracts that contain a variety of representations and warranties which provide general indemnifications. The Fund’s maximum
| | THE GUGGENHEIM FUNDS ANNUAL REPORT | 25 |
NOTES TO FINANCIAL STATEMENTS (continued) |
exposure under these arrangements is unknown, as this would involve future claims that may be made against the Fund and/or its affiliates that have not yet occurred. However, based on experience, the Fund expects the risk of loss to be remote.
2. Federal Income Tax Information
The Fund intends to comply with the provisions of Subchapter M of the Internal Revenue Code applicable to regulated investment companies and will distribute substantially all taxable net investment income and capital gains sufficient to relieve the Fund from all, or substantially all, federal income, excise and state income taxes. Therefore, no provision for federal or state income tax is required.
Tax positions taken or expected to be taken in the course of preparing the Fund’s tax returns are evaluated to determine whether the tax positions are “more-likely-than-not” of being sustained by the applicable tax authority. Tax positions not deemed to meet the more-likely-than-not threshold would be recorded as a tax benefit or expense in the current year. Management has analyzed the Fund’s tax positions taken, or to be taken, on Federal income tax returns for all open tax years, and has concluded that no provision for income tax is required in the Fund’s financial statements. The Fund’s federal tax returns are subject to examination by the Internal Revenue Service for a period of three years after they are filed.
The tax character of distributions paid during the year ended September 30, 2016 was as follows:
Fund | | Ordinary
Income | | | Long-Term Capital Gain | | | Total
Distributions | |
Mid Cap Value Fund | | $ | — | | | $ | 94,749,801 | | | $ | 94,749,801 | |
The tax character of distributions paid during the year ended September 30, 2015 was as follows:
Fund | | Ordinary
Income | | | Long-Term Capital Gain | | | Total
Distributions | |
Mid Cap Value Fund | | $ | 2,885,724 | | | $ | 151,029,876 | | | $ | 153,915,600 | |
Note: For federal income tax purposes, short-term capital gain distributions are treated as ordinary income distributions.
Tax components of accumulated earnings/(deficit) as of September 30, 2016, were as follows:
Fund | | Undistributed Ordinary Income | | | Undistributed Long-Term Capital Gain | | | Net Unrealized Appreciation/ (Depreciation) | | | Accumulated Capital and Other Losses | |
Mid Cap Value Fund | | $ | 5,780,421 | | | $ | 8,320,873 | | | $ | 61,337,807 | | | $ | — | |
26 | THE GUGGENHEIM FUNDS ANNUAL REPORT | |
NOTES TO FINANCIAL STATEMENTS (continued) |
For Federal income tax purposes, capital loss carryforwards represent realized losses of the Funds that may be carried forward and applied against future capital gains. Under the RIC Modernization Act of 2010, the Fund is permitted to carry forward capital losses incurred in taxable years beginning after December 22, 2010 for an unlimited period and such capital loss carryforwards will retain their character as either short-term or long-term capital losses. As of September 30, 2016, the Fund had no capital loss carryforwards.
As of September 30, 2016 the following reclassifications were made to the capital accounts of the Fund, to reflect permanent book/tax differences and income and gains available for distributions under income tax regulations, which are due to equalization accounting, and adjustments to dividends received from real estate investment trusts. Net investment income, net realized gains and net assets were not affected by these changes.
On the Statements of Assets and Liabilities the following adjustments were made for permanent book/tax differences:
Fund | | Paid In
Capital | | | Undistributed
Net Investment Income | | | Accumulated
Net Realized
Loss | |
Mid Cap Value Fund | | $ | 6,817,829 | | | $ | 1,055,734 | | | $ | (7,873,563 | ) |
At September 30, 2016, the cost of securities for Federal income tax purposes, the aggregate gross unrealized gain for all securities for which there was an excess of value over tax cost and the aggregate gross unrealized loss for all securities for which there was an excess of tax cost over value, were as follows:
Fund | | Tax
Cost | | | Tax
Unrealized
Gain | | | Tax
Unrealized
Loss | | | Net
Unrealized
Gain | |
Mid Cap Value Fund | | | 456,944,349 | | | | 82,291,408 | | | | (20,953,601 | ) | | $ | 61,337,807 | |
3. Fees and Other Transactions with Affiliates
Under the terms of an investment advisory contract, the Fund pays GI investment advisory fees calculated at 1.00% of the average daily net assets of $200 million or less and 0.75% of the average daily net assets of the Fund in excess of $200 millon.
RFS was paid the following for providing transfer agent services to the Fund. Transfer agent fees are assessed to the applicable classes of the Fund.
Annual charge per account | $5.00 – $8.00 |
Transaction fee | $0.60 – $1.10 |
Minimum annual charge per Fund† | $25,000 |
Certain out-of-pocket charges | Varies |
† | Not subject to the Fund during the first twelve months of operations. |
| | THE GUGGENHEIM FUNDS ANNUAL REPORT | 27 |
NOTES TO FINANCIAL STATEMENTS (continued) |
RFS also acted as the administrative agent for the Fund, and as such performed administrative functions and the bookkeeping, accounting and pricing functions for the Fund. For these services, RFS received 0.095% of the average daily net assets of the Fund. The minimum annual charge for fund accounting administrative fees was $25,000.
GI engaged external service providers to perform other necessary services for the Trust, such as audit and accounting related services, legal services, custody, printing and mailing, etc., on a pass-through basis. Such expenses are allocated to various Funds within the complex based on relative net assets.
The Fund has adopted Distribution Plans related to the offering of A-Class, C-Class and P-Class shares pursuant to Rule 12b-1 under the 1940 Act. The plans provide for payments at an annual rate of 0.25% of the average daily net assets of the Fund’s A-Class and P-Class shares, and 1.00% of the average daily net assets of the Fund’s C-Class shares.
For the year ended September 30, 2016, GFD retained sales charges of $566,973 relating to sales of A-Class shares of the Trust.
At September 30, 2016, GI and its affiliates owned twenty percent of the outstanding of the Fund.
Certain trustees and officers of the Trust are also officers of GI and GFD.
4. Fair Value Measurement
In accordance with U.S. GAAP, fair value is defined as the price that the Fund would receive to sell an investment or pay to transfer a liability in an orderly transaction with an independent buyer in the principal market, or in the absence of a principal market, the most advantageous market for the investment or liability. U.S. GAAP establishes a three-tier fair value hierarchy based on the types of inputs used to value assets and liabilities and requires corresponding disclosure. The hierarchy and the corresponding inputs are summarized below:
Level 1 — | quoted prices in active markets for identical assets or liabilities. |
Level 2 — | significant other observable inputs (for example quoted prices for securities that are similar based on characteristics such as interest rates, prepayment speeds, credit risk, etc.). |
Level 3 — | significant unobservable inputs based on the best information available under the circumstances, to the extent observable inputs are not available, which may include assumptions. |
The types of inputs available depend on a variety of factors, such as the type of security and the characteristics of the markets in which it trades, if any. Fair valuation determinations that rely on fewer or no observable inputs require greater judgment. Accordingly, fair value determinations for Level 3 securities require the greatest amount of judgment.
28 | THE GUGGENHEIM FUNDS ANNUAL REPORT | |
NOTES TO FINANCIAL STATEMENTS (continued) |
The inputs or methodologies used for valuing securities are not necessarily an indication of the risk associated with investing in those securities. The suitability of the techniques and sources employed to determine fair valuation are regularly monitored and subject to change.
5. Securities Transactions
For the year ended September 30, 2016, the cost of purchases and proceeds from sales of investment securities, excluding government securities, short-term investments and derivatives, were as follows:
Fund | | Purchases | | | Sales | |
Mid Cap Value Fund | | $ | 279,598,041 | | | $ | 418,413,045 | |
The Fund is permitted to purchase or sell securities from or to certain affiliated funds under specified conditions outlined in procedures adopted by the Board of the Trust. The procedures have been designed to ensure that any purchase or sale of securities by a Fund from or to another fund or portfolio that is or could be considered an affiliate by virtue of having a common investment adviser (or affiliated investment advisers), common Trustees and/or common officers complies with Rule 17a-7 of the 1940 Act. Further, as defined under these procedures, each transaction is effected at the current market price to save costs, where permissible. For the year ended September 30, 2016, the Fund did not engage in purchases and sales of securities, pursuant to Rule 17a-7 of the 1940 Act.
6. Line of Credit
The Trust, with the exception of Capital Stewardship Fund, and certain affiliated funds, secured a 364-day committed, $800,000,000 line of credit from Citibank, N.A., which was in place through October 6, 2016, at which time the line of credit was renewed. A Fund may draw (borrow) from the line of credit as a temporary measure for emergency purposes, to facilitate redemption requests, or for other short-term liquidity purposes consistent with the Fund’s investment objective and program. For example, it may be advantageous for the Fund to borrow money rather than sell existing portfolio positions to meet redemption requests. Fees related to borrowings, if any, vary under this arrangement between the greater of Citibank’s “base rate”, LIBOR plus 1%, or the federal funds rate 0.29% at September 30, 2016, plus 1/2 of 1%. The funds paid upfront costs of $663,359 to renew the line of credit.
The commitment fee that may be paid by the Funds is at an annualized rate of 0.15% of the average daily amount of their unused commitment amount. The Funds did not have any borrowings under this agreement as of and for the period ended September 30, 2016.
On October 6, 2016, the Trust, with the exception of Capital Stewardship Fund, and certain affiliated funds, renewed the line of credit from Citibank, N.A., with an increased commitment amount to $1,000,000,000. Fees related to borrowings, if any, vary under this arrangement between the greater of Citibank’s “base rate”, LIBOR plus 1%, or the federal funds rate 0.29% at September
| | THE GUGGENHEIM FUNDS ANNUAL REPORT | 29 |
NOTES TO FINANCIAL STATEMENTS (concluded) |
30, 2016, plus 1/2 of 1%. The funds will pay upfront costs of $2,032,388 to renew the line of credit. The commitment fee that may be paid by the Funds is at an annualized rate of 0.15% of the average daily amount of their unused commitment amount.
The allocated interest expense amount for each Fund is referenced in the Statement of Operations under “Line of credit fees” and the effect on the expense ratio is included in the Financial Highlights.
7. Other Liabilities
The Fund wrote put option contracts through Lehman Brothers Inc., (“LBI”) that were exercised prior to the option contracts’ expiration and prior to the bankruptcy filing by LBI, during September, 2008. However, these transactions have not settled and the securities have not been delivered to the Fund as of September 30, 2016.
Although the ultimate resolution of these transactions is uncertain, the Fund has recorded a liability equal to the difference between the strike price on the put options and the market price of the underlying security on the exercise date. The amount of the liability recorded in miscellaneous payables by the Fund as of September 30, 2016, was $473,594.
8. Subsequent Event
At a meeting that occurred on November 16, 2016, the Board approved the following changes:
Effective on or about February 1, 2017, the breakpoint schedule for Mid Cap Value Fund’s Advisory Fee for will be eliminated. Currently, the Fund’s starting Advisory Fee is 1.00% with a 0.25% breakpoint on average daily net assets in excess of $200 million. The Fund’s Advisory Fee subsequent to February 1, 2017 will be 0.75% on the average daily net assets of the Fund. The reduced Advisory Fee will not result in any decrease in the nature, quality and extent of services provided to the Fund under the advisory agreement.
For more information, please refer to the Funds’ prospectus, which can be obtained at guggenheiminvestments.com or by calling 800.820.0888.
30 | THE GUGGENHEIM FUNDS ANNUAL REPORT | |
REPORT OF INDEPENDENT REGISTERED PUBLIC ACCOUNTING FIRM |
The Board of Trustees and Shareholders
of Guggenheim Funds Trust
We have audited the accompanying statement of assets and liabilities, including the schedule of investments, of Guggenheim Mid Cap Value Fund (one of the series constituting the Guggenheim Funds Trust) (the “Fund”) as of September 30, 2016, and the related statement of operations for the year then ended, the statements of changes in net assets for each of the two years in the period then ended, and the financial highlights for each of the years or periods indicated therein. These financial statements and financial highlights are the responsibility of the Fund’s management. Our responsibility is to express an opinion on these financial statements and financial highlights based on our audits.
We conducted our audits in accordance with the standards of the Public Company Accounting Oversight Board (United States). Those standards require that we plan and perform the audit to obtain reasonable assurance about whether the financial statements and financial highlights are free of material misstatement. We were not engaged to perform an audit of the Fund’s internal control over financial reporting. Our audits included consideration of internal control over financial reporting as a basis for designing audit procedures that are appropriate in the circumstances, but not for the purpose of expressing an opinion on the effectiveness of the Fund’s internal control over financial reporting. Accordingly, we express no such opinion. An audit also includes examining, on a test basis, evidence supporting the amounts and disclosures in the financial statements and financial highlights, assessing the accounting principles used and significant estimates made by management, and evaluating the overall financial statement presentation. Our procedures included confirmation of securities owned as of September 30, 2016, by correspondence with the custodian. We believe that our audits provide a reasonable basis for our opinion.
In our opinion, the financial statements and financial highlights referred to above present fairly, in all material respects, the financial position of the Guggenheim Mid Cap Value Fund (one of the series constituting Guggenheim Funds Trust) at September 30, 2016, the results of its operations for the year then ended, the changes in its net assets for each of the two years in the period then ended, and its financial highlights for each of the years or periods indicated therein, in conformity with U.S. generally accepted accounting principles.

McLean, Virginia
November 29, 2016
| | THE GUGGENHEIM FUNDS ANNUAL REPORT | 31 |
OTHER INFORMATION (Unaudited) |
Tax Information
In January 2017, shareholders will be advised on IRS Form 1099 DIV or substitute 1099 DIV as to the federal tax status of the distributions received by shareholders in the calendar year 2016.
With respect to the taxable year ended September 30, 2016, the Fund hereby designates as capital gain dividends the amounts listed below, or, if subsequently determined to be different, the net capital gain of such year:
Fund | | LTCG
Dividend Income | | | From Proceeds of Shareholder Redemptions | |
Mid Cap Value Fund | | $ | 94,749,801 | | | $ | 6,982,072 | |
Proxy Voting Information
A description of the policies and procedures that the Trust uses to determine how to vote proxies relating to securities held in the Funds’ portfolios is available, without charge and upon request, by calling 800.820.0888. This information is also available from the EDGAR database on the SEC’s website at https://www.sec.gov.
Information regarding how the Funds voted proxies relating to portfolio securities during the most recent 12-month period ended June 30 is available without charge, upon request, by calling 800.820.0888. This information is also available from the EDGAR database on the SEC’s website at https://www.sec.gov.
Sector Classification
Information in the “Schedule of Investments” is categorized by sectors using sector-level Classifications defined by the Bloomberg Industry Classification System, a widely recognized industry classification system provider. Each Fund’s registration statement has investment policies relating to concentration in specific sectors/industries. For purposes of these investment policies, the Funds usually classify sectors/industries based on industry-level Classifications used by widely recognized industry classification system providers such as Bloomberg Industry Classification System, Global Industry Classification Standards and Barclays Global Classification Scheme.
Quarterly Portfolio Schedules Information
The Trust files its complete schedule of portfolio holdings with the SEC for the first and third quarters of each fiscal year on Form N-Q; which are available on the SEC’s website at https://www.sec.gov. The Funds’ Forms N-Q may be reviewed and copied at the SEC’s Public Reference Room in Washington, DC, and that information on the operation of the Public Reference Room may be obtained by calling 800-SEC-0330. Copies of the portfolio holdings are also available to shareholders, without charge and upon request, by calling 800.820.0888.
32 | THE GUGGENHEIM FUNDS ANNUAL REPORT | |
OTHER INFORMATION (Unaudited)(continued) |
Report of the Guggenheim Funds Trust Contracts Review Committee
Guggenheim Funds Trust (the “Trust”) was organized as a Delaware statutory trust on November 8, 2013, and is registered as an open-end management investment company under the Investment Company Act of 1940, as amended (the “1940 Act”). The Trust includes the following series:
● Guggenheim Alpha Opportunity Fund (“Alpha Opportunity Fund”) ● Guggenheim Diversified Income Fund (“Diversified Income Fund”) ● Guggenheim High Yield Fund (“High Yield Fund”) ● Guggenheim Large Cap Value Fund (“Large Cap Value Fund”) ● Guggenheim Macro Opportunities Fund (“Macro Opportunities Fund”) ● Guggenheim Mid Cap Value Fund (“Mid Cap Value Fund”) ● Guggenheim Municipal Income Fund (“Municipal Income Fund”) ● Guggenheim Small Cap Value Fund (“Small Cap Value Fund”) ● Guggenheim StylePlus—Mid Growth Fund (“StylePlus—Mid Growth Fund”) ● Guggenheim World Equity Income Fund (“World Equity Income Fund”) | ● Guggenheim Capital Stewardship Fund (“Capital Stewardship Fund”) ● Guggenheim Floating Rate Strategies Fund (“Floating Rate Strategies Fund”) ● Guggenheim Investment Grade Bond Fund (“Investment Grade Bond Fund”) ● Guggenheim Limited Duration Fund (“Limited Duration Fund”) ● Guggenheim Market Neutral Real Estate Fund (“Market Neutral Real Estate Fund”) ● Guggenheim Mid Cap Value Institutional Fund (“Mid Cap Value Institutional Fund”) ● Guggenheim Risk Managed Real Estate Fund (“Risk Managed Real Estate Fund”) ● Guggenheim StylePlus—Large Core Fund (“StylePlus—Large Core Fund”) ● Guggenheim Total Return Bond Fund (“Total Return Bond Fund”) |
Security Investors, LLC (“Security Investors”), an indirect subsidiary of Guggenheim Partners, LLC, a global, diversified financial services firm (“Guggenheim Partners”), serves as investment adviser to each of: (i) Alpha Opportunity Fund; (ii) High Yield Fund; (iii) Investment Grade Bond Fund; (iv) Large Cap Value Fund; (v) Mid Cap Value Fund; (vi) Mid Cap Value Institutional Fund; (vii) Municipal Income Fund; (viii) Small Cap Value Fund; (ix) StylePlus—Large Core Fund; (x) StylePlus—Mid Growth Fund; and (xi) World Equity Income Fund (collectively, the “SI-Advised Funds”). (Guggenheim Partners, Security Investors, Guggenheim Partners Investment Management, LLC (“GPIM”) and their affiliates may be referred to herein collectively as “Guggenheim.” “Guggenheim Investments” refers to the global asset management and investment advisory division of Guggenheim Partners and includes GPIM, Security Investors and Guggenheim Funds Investment Advisors, LLC and other affiliated investment management businesses.) Under the terms of investment management agreements between Security Investors and the Trust, with respect to the SI-Advised Funds, Security Investors also is responsible for
| | THE GUGGENHEIM FUNDS ANNUAL REPORT | 33 |
OTHER INFORMATION (Unaudited)(continued) |
overseeing the activities of GPIM, an indirect subsidiary of Guggenheim Partners, with respect to its service as investment sub-adviser to Municipal Income Fund, pursuant to an investment sub-advisory agreement between Security Investors and GPIM (the “GPIM Sub-Advisory Agreement”).
GPIM serves as investment adviser with respect to each of: (i) Capital Stewardship Fund; (ii) Diversified Income Fund; (iii) Floating Rate Strategies Fund; (iv) Limited Duration Fund; (v) Macro Opportunities Fund; (vi) Market Neutral Real Estate Fund; (vii) Risk Managed Real Estate Fund; and (viii) Total Return Bond Fund (collectively, the “GPIM-Advised Funds” and together with the SI-Advised Funds, the “Funds” and individually, a “Fund”). Under the terms of investment management agreements between GPIM and the Trust, with respect to the GPIM-Advised Funds,1 GPIM also is responsible for overseeing the activities of Concinnity Advisors, LP (“Concinnity”) with respect to Concinnity’s service as investment sub-adviser to the Capital Stewardship Fund, pursuant to an investment sub-advisory agreement between GPIM and Concinnity (the “Concinnity Sub-Advisory Agreement”). Under the supervision of the Board of Trustees of the Trust (the “Board,” with the members of the Board referred to individually as the “Trustees”), the Advisers regularly provide (or, as applicable, oversee the provision of) investment research, advice and supervision, a continuous investment program, and direct the purchase and sale of securities and other investments for each Fund’s portfolio.
Following an initial two-year term, each of the Advisory Agreements continues in effect from year to year provided that such continuance is specifically approved at least annually by (i) the Board or a majority of the outstanding voting securities (as defined in the 1940 Act) of each Fund, and, in either event, (ii) the vote of a majority of the Trustees who are not “interested person[s],” as defined by the 1940 Act, of the Trust (the “Independent Trustees”) casting votes in person at a meeting called for such purpose. At meetings held in person on April 27, 2016 (the “April Meeting”) and on May 17, 2016 (the “May Meeting”), the members of the Contracts Review Committee of the Board (the “Committee”), consisting solely of the Independent Trustees, met separately from Guggenheim to consider the proposed renewal of the Advisory Agreements and the GPIM Sub-Advisory Agreement in connection with the Committee’s annual contract review schedule.2
1 | The investment management agreements pertaining to the SI-Advised Funds and the investment management agreements pertaining to the GPIM-Advised Funds are referred to herein together as the “Advisory Agreements” and, together with the GPIM Sub--Advisory Agreement, as the “Agreements.” In addition, unless the context indicates otherwise, GPIM, with respect to its service as investment adviser to the GPIM-Advised Funds, and Security Investors as to the SI-Advised Funds, are each referred to herein as the “Adviser” and together, the “Advisers.” |
2 | Since Diversified Income Fund is subject to an investment management agreement approved by the Board for an initial term of two years at an in-person meeting of the Board held on August 20, 2015 and the Fund launched in 2016, it was not included in the contract renewal process conducted at the meetings in April and May 2016. Similarly, Market Neutral Real Estate Fund is subject to an investment management agreement approved by the Board for an initial term of two years at an in-person Board meeting held on November 10, 2015, and the Fund launched in 2016. Consequently, Market Neutral Real Estate Fund also was not included in the scope of the 2016 contract renewal process. In addition, because shares of the Capital Stewardship Fund are only offered for subscription and are held by a limited number of institutional/bank investors, and the Fund issues a shareholder report separate from the other series of the Trust, the factors considered by the Committee in evaluating the proposed renewal of an investment management agreement pertaining to the Capital Stewardship Fund, and the Concinnity Sub-Advisory Agreement, are addressed in a separate report of the Committee. Accordingly, references hereafter to the “Funds” should be understood as referring to all series of the Trust, excluding: (i) Capital Stewardship Fund; (ii) Diversified Income Fund; and (iii) Market Neutral Real Estate Fund. |
34 | THE GUGGENHEIM FUNDS ANNUAL REPORT | |
OTHER INFORMATION (Unaudited)(continued) |
As part of its review process, the Committee was represented by independent legal counsel to the Independent Trustees (“Independent Legal Counsel”). Independent Legal Counsel reviewed and discussed with the Committee various key aspects of the Trustees’ legal responsibilities relating to the proposed renewal of the Agreements and other principal contracts. The Committee took into account various materials received from Guggenheim and Independent Legal Counsel. Recognizing that the evaluation process with respect to the services provided by each of the Advisers is an ongoing one, the Committee also considered the variety of written materials, reports and oral presentations the Board received throughout the year regarding performance and operating results of the Funds.
In connection with the contract review process, FUSE Research Network LLC (“FUSE”), an independent, third-party research provider, was engaged to prepare advisory contract renewal reports designed specifically to help boards of directors/trustees fulfill their advisory contract renewal responsibilities. The objective of the reports is to present the subject funds’ relative position regarding fees, expenses and total return performance, with peer group and universe comparisons. The Committee assessed the data provided in the FUSE reports as well as commentary and supporting data presented by Guggenheim, including, among other things, a summary of notable distinctions between certain Funds and the applicable peer group identified in the FUSE reports, as well as a discussion of those instances in which FUSE adjusted a peer group after considering a request by management to re-evaluate the peer group constituent funds.
In addition, Guggenheim provided materials and data in response to formal requests for information sent by Independent Legal Counsel on behalf of the Independent Trustees. Guggenheim also made a presentation at the April Meeting which, among other things, addressed areas identified for discussion by the Independent Trustees and Independent Legal Counsel. Throughout the process, the Committee asked questions of management and requested certain additional information, which Guggenheim provided following the April Meeting (collectively with the foregoing reports and materials, the “Contract Review Materials”).
The Committee considered the Contract Review Materials in the context of its accumulated experience governing the Trust and weighed the factors and standards discussed with Independent Legal Counsel. Following an analysis and discussion of the factors identified below and in the exercise of its business judgment, the Committee concluded that it was in the best interest of each Fund to recommend that the Board approve the renewal of each Advisory Agreement and the GPIM Sub-Advisory Agreement for an additional annual term.
Advisory Agreements
Nature, Extent and Quality of Services Provided by each Adviser: With respect to the nature, extent and quality of services currently provided by each Adviser, the Committee considered the information provided by Guggenheim concerning the education, experience, professional affiliations, areas of responsibility and duties of key personnel performing services for the Funds, including those personnel providing compliance oversight, as well as the supervisors and reporting lines for such personnel. In this connection, the Committee considered
| | THE GUGGENHEIM FUNDS ANNUAL REPORT | 35 |
OTHER INFORMATION (Unaudited)(continued) |
Guggenheim’s resources and related efforts to retain, attract and motivate capable personnel to serve the Funds and noted Guggenheim’s report on recent additions, departures and transitions in personnel who work on matters relating to the Funds or are significant to the operations of each Adviser. The Committee also considered the Advisers’ attention to relevant developments in the mutual fund industry and its observance of compliance and regulatory requirements, and noted that on a regular basis the Board receives and reviews information from the Trust’s Chief Compliance Officer regarding compliance policies and procedures established pursuant to Rule 38a-1 under the 1940 Act, as well as from Guggenheim’s Chief Risk Officer. The Committee also noted updates by Guggenheim to certain compliance programs, including with respect to Code of Ethics monitoring, and the implementation of additional forensic testing. The Committee took into consideration the settlement of a regulatory matter concerning GPIM and remedial steps taken in response by Guggenheim to enhance its organizational structure for compliance. In this connection, the Committee considered information provided by Guggenheim regarding the findings of an independent compliance consultant retained to review GPIM’s compliance program and the consultant’s conclusion that the program is reasonably designed to prevent and detect violations of the Investment Advisers Act of 1940, as amended, and the rules promulgated thereunder. Moreover, in connection with the Committee’s evaluation of the overall package of services provided by each Adviser, the Committee considered each Adviser’s administrative capabilities, including its role in monitoring and coordinating compliance responsibilities with the fund administrator, transfer agent, distributor, custodian and other service providers to the Funds. In addition, because Municipal Income Fund is sub-advised, the Committee took into account information provided by Guggenheim describing the Adviser’s processes and activities for providing oversight of sub-advisers, including information regarding the Adviser’s Sub-Advisory Oversight Committee.
With respect to Guggenheim’s resources and the ability of each Adviser to carry out its responsibilities under the applicable Advisory Agreement, the Chief Financial Officer of Guggenheim Investments reviewed with the Committee certain unaudited financial information concerning the holding company for Guggenheim Investments, Guggenheim Partners Investment Management Holdings, LLC (“GPIMH”). (Thereafter, the Committee received the audited consolidated financial statements of GPIMH and the audited financial statements of GPIM as supplemental information.)
The Committee also considered the acceptability of the terms of each Advisory Agreement, including the scope of services required to be performed by each Adviser.
Based on the foregoing, and based on other information received (both oral and written) at the April Meeting and the May Meeting, as well as other considerations, including the Committee’s knowledge of how each Adviser performs its duties through Board meetings, discussions and reports during the year, the Committee concluded that each Adviser and its personnel were qualified to serve the Funds in such capacity and may reasonably be expected to continue to provide a high quality of services under each Advisory Agreement with respect to the Funds.
36 | THE GUGGENHEIM FUNDS ANNUAL REPORT | |
OTHER INFORMATION (Unaudited)(continued) |
Investment Performance: The Committee received, for each Fund, investment returns for the ten-year, five-year, three-year, one-year and three-month periods ended December 31, 2015, as applicable. In addition, the Committee received a comparison of each Fund’s performance to the performance of a benchmark, a universe of funds and a narrower peer group of similar funds with comparable asset levels as identified by FUSE, in each case for the same periods, as applicable. The Committee also received from FUSE representatives and considered a description of the methodology employed by FUSE for identifying each Fund’s peer group and universe for performance and expense comparisons.
In seeking to evaluate Fund performance over a full market cycle, the Committee generally focused its attention first on five-year and three-year performance rankings as compared to the relevant universe of funds. The Committee also considered more recent performance periods, including the one-year period and, as deemed appropriate, the three-month period, for certain Funds such as for those Funds that were recently launched or had undergone recent changes in investment strategies, as well as circumstances in which enhancements were made to the portfolio management processes or techniques employed for a Fund. In this connection, the Committee made the following observations:
Alpha Opportunity Fund: The Fund’s Class A shares outperformed the performance universe median for the five-year and three-year periods, ranking in the 6th and 9th percentiles, respectively. The Committee considered the limitations on portfolio management as a result of the 2008 Lehman bankruptcy, and subsequent changes to the Fund’s investment strategies, noting that the Fund re-opened to subscriptions with a new U.S. long/short equity investment strategy on January 28, 2015. In light of the foregoing, the Committee also considered more recent performance periods, including the one-year and three-month periods ended December 31, 2015, and observed that the Fund’s Class A shares ranked in the 72nd and 92nd percentiles, respectively of its performance universe. Given the limited period of time that the Adviser has managed the Fund pursuant to its new investment program, the Committee also took into account updated performance data provided by the Adviser in connection with the May Meeting and noted that the Fund’s net performance for the one-year and three-month periods ended March 31, 2016 ranked in the 6th and 1st percentiles, respectively of the Morningstar Long/Short Equity peer group.
Floating Rate Strategies Fund: The Committee noted the Fund’s inception date of November 30, 2011, and observed that the Fund’s Class A shares ranked in the 1st and 5th percentiles of its performance universe for the three-year and one-year periods ended December 31, 2015, respectively, outperforming its performance universe median for each of these periods.
High Yield Fund: The returns of the Fund’s Class A shares ranked in the 46th and 10th percentiles of its performance universe for the five-year and three-year periods ended December 31, 2015, respectively, and outperformed the performance universe median for each of these periods.
Investment Grade Bond Fund: The returns of the Fund’s Class A shares ranked in the 1st percentile of its performance universe for both the five-year and three-year periods ended December 31, 2015, outperforming its performance universe median for both of these periods.
| | THE GUGGENHEIM FUNDS ANNUAL REPORT | 37 |
OTHER INFORMATION (Unaudited)(continued) |
Limited Duration Fund: The Committee noted the Fund’s inception date of December 16, 2013, and observed that the returns of the Fund’s Class A shares ranked in the 1st and 10th percentiles of the performance universe for the one-year and three-month periods ended December 31, 2015, respectively, outperforming the median returns.
Macro Opportunities Fund: The Committee noted the Fund’s inception date of November 30, 2011, and observed that the returns of the Fund’s Class A shares ranked in the 6th and 57th percentiles of the performance universe for the three-year and one-year periods ended December 31, 2015, respectively, and outperformed the performance universe median for the three-year period.
Municipal Income Fund: The Committee considered that Security Investors does not directly manage the investment portfolio but has delegated such duties to GPIM. Based on the information provided and the review of the Fund’s investment performance, the Committee concluded that Security Investors had appropriately reviewed and monitored GPIM’s investment performance as Sub-Adviser to the Fund.
Risk Managed Real Estate Fund: The Committee noted the Fund’s inception date of February 12, 2014, and observed the returns of the Fund’s Class A shares ranked in the 31st and 76th percentile of its performance universe for the one-year and three-month periods ended December 31, 2015, respectively.
StylePlus—Large Core Fund: The returns of the Fund’s Class A shares ranked in the 39th percentile of its performance universe for the three-year period ended December 31, 2015. The Committee noted that the Fund implemented a strategy change and a new portfolio management team in May 2013. In light of the foregoing, the Committee also considered more recent performance periods in addition to the three-year performance, including the one-year and three-month periods ended December 31, 2015, and observed that the returns of the Fund’s Class A shares exceeded the median of its performance universe for both periods, ranking in the 25th and 22nd percentiles for the one-year and three-month periods, respectively.
StylePlus—Mid Growth Fund: The returns of the Fund’s Class A shares ranked in the 45th percentile of its performance universe for the three-year period ended December 31, 2015. The Committee noted that the Fund implemented a strategy change and a new portfolio management team in May 2013. In light of the foregoing, the Committee considered more recent performance periods in addition to the three-year performance, including the one-year and three-month periods ended December 31, 2015, and observed that the returns of the Fund’s Class A shares exceeded the median of its performance universe for both periods, ranking in the 42nd and 45th percentiles for the one-year and three-month periods, respectively.
Total Return Bond Fund: The Committee noted the Fund’s inception date of November 30, 2011, and observed that the returns of the Fund’s Class A shares ranked in the 1st and 12th percentiles of its performance universe for the three-year and one-year periods ended December 31, 2015, respectively, and outperformed the performance universe median for each of these periods.
38 | THE GUGGENHEIM FUNDS ANNUAL REPORT | |
OTHER INFORMATION (Unaudited)(continued) |
World Equity Income Fund: The returns of the Fund’s Class A shares ranked in the 66th percentile of its performance universe for the three-year period ended December 31, 2015. The Committee noted that the Fund implemented a strategy change and a new portfolio management team in August 2013. In light of the foregoing, the Committee considered more recent performance periods in addition to the three-year performance, including the one-year and three-month periods ended December 31, 2015, and observed that the returns of the Fund’s Class A shares exceeded the median of its performance universe for both periods, ranking in the 43rd and 39th percentiles for the one-year and three-month periods, respectively.
Value Funds: Large Cap Value Fund, Mid Cap Value Fund, Mid Cap Value Institutional Fund and Small Cap Value Fund
Large Cap Value Fund: The returns of the Class A shares underperformed the performance universe median for the five-year, three-year, one-year and three-month periods ended December 31, 2015, and ranked in the 83rd, 72nd, 72nd and 67th percentiles, respectively.
Mid Cap Value Fund: The returns of the Class A shares underperformed the performance universe median for the five-year, three-year, one-year and three-month periods ended December 31, 2015, and ranked in the 83rd, 79th, 75th and 81st percentiles, respectively.
Mid Cap Value Institutional Fund: The Fund’s returns underperformed the performance universe median for the five-year, three-year, one-year and three-month periods ended December 31, 2015, and ranked in the 82nd, 75th, 70th and 67th percentiles, respectively.
Small Cap Value Fund: The Fund underperformed its performance universe median for the five-year, three-year and one-year periods ended December 31, 2015, ranking in the 80th percentile for the five-year and three-year periods and in the 67th percentile for the one-year period. The Fund outperformed its performance universe median for three-month period ended December 31, 2015, and ranked in the 29th percentile.
In response to the Committee’s request, representatives from the Adviser provided information regarding, and discussed factors impacting, each Value Fund’s performance, including market trends and stock selection. The Adviser’s representatives also discussed the portfolio management team’s philosophy and processes and explained their expectations and strategies for the future. The Committee noted measures taken by the Adviser to remedy relative longer-term underperformance with respect to each of the Value Funds, including strategy enhancements such as implementation of a refined stock selection process and additional risk controls to enforce the strategy’s sell discipline. The Committee noted that the Adviser believes the enhancements to the portfolio management techniques employed for each Value Fund, used in conjunction with existing proprietary quantitative models, will help improve the Fund‘s performance results. In light of the foregoing, the Committee requested and the Adviser provided supplemental performance data to enable the Committee to evaluate the impact of the strategy enhancements. In this connection, the Committee considered that the data provided by the Adviser indicated that each Value Fund’s performance was improving, with performance for the first quarter of 2016
| | THE GUGGENHEIM FUNDS ANNUAL REPORT | 39 |
OTHER INFORMATION (Unaudited)(continued) |
ranking better than the trailing one-year return. The Committee also considered the Adviser’s statement that it believes the improving trend in performance relative to peers reflects the enhancements implemented in the investment process. The Committee also noted Guggenheim’s commitment to monitor each Value Fund’s performance and update the Independent Trustees on a quarterly basis as to the impact of the process enhancements implemented to-date and advise on other steps that might be taken to further address each Fund’s performance, if necessary.
After reviewing the foregoing and related factors, the Committee concluded that: (i) each Fund’s performance was acceptable; or (ii) it was satisfied with Guggenheim’s responses and efforts relating to investment performance.
Comparative Fees, Costs of Services Provided and the Profits Realized by each Adviser from Its Relationship with the Funds: The Committee compared each Fund’s contractual advisory fee and total net expense ratio to the applicable peer group. The Committee also reviewed the median advisory fees and expense ratios, including expense ratio components (e.g., transfer agency fees, administration fees, other operating expenses, distribution fees and fee waivers/reimbursements) of the peer group of funds. In response to a supplemental request, the Committee also received and reviewed aggregated advisory and administrative fees compared to the peer group average and median.
As part of its evaluation of each Fund’s advisory fee, the Committee considered how such fees compared to the advisory fee charged by the applicable Adviser to one or more other funds, separate accounts and/or other types of client portfolios and investment vehicles that it manages pursuant to a similar investment objective and strategies, to the extent applicable, noting that, in certain instances, Guggenheim charges a lower advisory fee to such other clients. In this connection, the Committee considered, among other things, Guggenheim’s representations about the significant differences between managing mutual funds as compared to other types of accounts, including the additional resources required to effectively manage mutual fund assets and the greater regulatory costs associated with the management of such assets. The Committee also considered Guggenheim’s explanation that lower fees are charged in certain instances due to various other factors, including the scope of contract, type of investors, applicable legal, governance and capital structures, tax status and historical pricing reasons. With respect to the difference in fees charged to a comparable client that is a mutual fund, as to which Guggenheim serves as sub-adviser, the Committee took into account the following: Guggenheim advises that it has less legal and regulatory exposure as a sub-adviser to an unaffiliated fund and does not take on the same business risk because Guggenheim is not the sponsor of that fund. The Committee concluded that the information it received demonstrated that the aggregate services provided to the Funds were sufficiently different from those provided to other clients with similar investment strategies and/or the risks borne by Guggenheim were sufficiently greater than those associated with managing other clients with similar investment strategies to support the difference in fees.
In further considering the comparative fee and expense data presented in the Contract Review Materials and addressed by Guggenheim, the Committee made the following observations:
40 | THE GUGGENHEIM FUNDS ANNUAL REPORT | |
OTHER INFORMATION (Unaudited)(continued) |
Alpha Opportunity Fund: The average contractual advisory fee percentile rank across all share classes of the Fund and the asset weighted total net expense ratio are in the second quartile (27th and 46th percentiles, respectively) of its peer group. The Committee also considered that the Adviser had entered into an expense limitation agreement with respect to the Fund.
Floating Rate Strategies Fund: The average contractual advisory fee percentile rank across all share classes of the Fund is in the fourth quartile (83rd percentile) of its peer group and the asset weighted total net expense ratio is in the second quartile (45th percentile) of its peer group. The Committee also considered that the Adviser had entered into an expense limitation agreement with respect to the Fund.
High Yield Fund: The average contractual advisory fee percentile rank across all share classes of the Fund is in the second quartile (40th percentile) of its peer group and the asset weighted total net expense ratio is in the fourth quartile (77th percentile) of its peer group. The Committee also considered that the Adviser had entered into an expense limitation agreement with respect to the Fund.
Investment Grade Bond Fund: The average contractual advisory fee percentile rank across all share classes of the Fund is in the third quartile (54th percentile) of its peer group and the asset weighted total net expense ratio is in the fourth quartile (83rd percentile) of its peer group. The Committee also considered that the Adviser had entered into an expense limitation agreement with respect to the Fund.
Large Cap Value Fund: The average contractual advisory fee percentile rank across all share classes of the Fund is in the first quartile (22nd percentile) of its peer group and the asset weighted total net expense ratio is in the second quartile (35th percentile) of its peer group. The Committee also considered that the Adviser had entered into an expense limitation agreement with respect to the Fund.
Limited Duration Fund: The average contractual advisory fee percentile rank across all share classes of the Fund is in the third quartile (66th percentile) of its peer group, as is the Fund’s asset weighted total net expense ratio (63rd percentile). The Committee also considered that the Adviser had entered into an expense limitation agreement with respect to the Fund.
Macro Opportunities Fund: The average contractual advisory fee percentile rank across all share classes of the Fund is in the fourth quartile (98th percentile) of its peer group, as is the Fund’s the asset weighted total net expense ratio (95th percentile). The Committee also considered that the Adviser had entered into an expense limitation agreement with respect to the Fund. In addition, the Committee noted that the Fund is categorized as a non-traditional bond fund which seeks to add value by investing in many non-traditional securities outside of fixed income, including equities, currencies, commodities and derivatives. In this connection, the Committee considered the Adviser’s statement that it supports the Fund with significant resources and a unique approach to drive performance for investors.
| | THE GUGGENHEIM FUNDS ANNUAL REPORT | 41 |
OTHER INFORMATION (Unaudited)(continued) |
Mid Cap Value Fund: The average contractual advisory fee percentile rank across all share classes of the Fund is in the second quartile (37th percentile) of its peer group and the asset weighted total net expense ratio is in the fourth quartile (94th percentile) of its peer group.
Mid Cap Value Institutional Fund: The contractual advisory fee of the Fund is in the first quartile (6th percentile) of its peer group and the total net expense ratio is in the third quartile (63rd percentile) of its peer group.
Municipal Income Fund: The average contractual advisory fee percentile rank across all share classes of the Fund is in the second quartile (39th percentile) and the asset weighted total net expense ratio is in the 25th percentile of its peer group. The Committee also considered that the Adviser had entered into an expense limitation agreement with respect to the Fund.
Risk Managed Real Estate Fund: The average contractual advisory fee percentile rank across all share classes of the Fund and the asset weighted total net expense ratio are in the first quartile (1st percentile as to each) of its peer group.
StylePlus—Large Core Fund: The average contractual advisory fee percentile rank across all share classes of the Fund is in the third quartile (71st percentile) and the asset weighted total net expense ratio is in the fourth quartile (86th percentile) of its peer group.
StylePlus—Mid Growth Fund: The average contractual advisory fee percentile rank across all share classes of the Fund is in the second quartile (29th percentile) of its peer group and the asset weighted total net expense ratio is in the fourth quartile (92nd percentile) of its peer group.
Small Cap Value Fund: The average contractual advisory fee percentile rank across all share classes of the Fund is in the fourth quartile (75th percentile) of its peer group and the asset weighted total net expense ratio is in the first quartile (11th percentile) of its peer group. The Committee also considered that the Adviser had entered into an expense limitation agreement with respect to the Fund.
Total Return Bond Fund: The average contractual advisory fee percentile rank across all share classes of the Fund is in the fourth quartile (93rd percentile) of its peer group and the asset weighted total net expense ratio is in the third quartile (65th percentile) of its peer group. The Committee also considered that the Adviser had entered into an expense limitation agreement with respect to the Fund.
World Equity Income Fund: The average contractual advisory fee percentile rank across all share classes of the Fund is in the second quartile (31st percentile) of its peer group and the asset weighted total net expense ratio is in the fourth quartile (92nd percentile) of its peer group. The Committee also considered that the Adviser had entered into an expense limitation agreement with respect to the Fund.
42 | THE GUGGENHEIM FUNDS ANNUAL REPORT | |
OTHER INFORMATION (Unaudited)(continued) |
With respect to the costs of services provided and profits realized by Guggenheim Investments from its relationship with the Funds, the Committee reviewed a profitability analysis and data from management for each Fund setting forth the average assets under management for the twelve months ended December 31, 2015, ending assets under management as of December 31, 2015, gross revenues received by Guggenheim Investments, expenses allocated to the Fund, earnings and the operating margin/profitability rate, including variance information relative to the foregoing amounts as of December 31, 2014. In addition, the Chief Financial Officer of Guggenheim Investments reviewed with, and addressed questions from, the Committee concerning the expense allocation methodology employed in producing the profitability analysis.
In the course of its review of Guggenheim Investments’ profitability, the Committee took into account the methods used by Guggenheim Investments to determine expenses and profit and reviewed a report from an independent accounting firm evaluating Guggenheim Investments’ approach to allocating costs and determining the profitability of Guggenheim Investments with respect to individual funds and the entire fund complex. In evaluating the costs of services provided and the profitability to Guggenheim Investments, based upon the profitability rates presented by Guggenheim Investments and the conclusion of the independent accounting firm that the methodology used for calculating such rates was reasonable, the Committee concluded that the profits were not unreasonable.
The Committee considered other benefits available to each Adviser because of its relationship with the Funds and noted that Security Investors and GPIM may be deemed to benefit from arrangements whereby an affiliate, Rydex Fund Services, LLC, currently receives fees for (i) performing certain administrative functions and bookkeeping, accounting and pricing functions for the Funds pursuant to a Fund Accounting and Administration Agreement, and (ii) acting as transfer agent for the Funds and performing all shareholder servicing functions, including transferring record ownership, processing purchase and redemption transactions, answering inquiries, mailing shareholder communications, and acting as the dividend disbursing agent pursuant to a Transfer Agency Agreement. The Committee reviewed the compensation arrangements for the provision of the foregoing services, as well as Guggenheim’s profitability from providing such services. The Committee also noted Guggenheim’s statement that it may benefit from marketing synergies arising from offering a broad spectrum of products, including the Funds.
Economies of Scale: The Committee received and considered information regarding whether there have been economies of scale with respect to the management of the Funds as Fund assets grow, whether the Funds have appropriately benefited from any economies of scale, and whether there is potential for realization of any further economies of scale. The Committee considered whether economies of scale in the provision of services to the Funds were being passed along to the shareholders. The Committee noted the Adviser’s statement that Guggenheim continues to develop the infrastructure needed to support Fund asset growth and to achieve economies of scale across the firm’s various products and product lines. Thus, while Guggenheim may be benefiting from certain economies of scale and related cost efficiencies, it is concurrently
| | THE GUGGENHEIM FUNDS ANNUAL REPORT | 43 |
OTHER INFORMATION (Unaudited)(continued) |
realizing new costs and expenses associated with investment in infrastructure to support growth. The Committee took into account the additional information provided by Guggenheim at the Committee’s request regarding the investments made to support the growth of the organization, noting, among other things, enhancements to improve operational efficiency and further development of compliance-related functions, as well as Guggenheim’s view as to how such investments benefit the Funds.
As part of its assessment of economies of scale, the Committee also considered Guggenheim’s view that it seeks to share economies of scale through expense limitations and/or through advisory fees set at competitive rates pre-assuming future asset growth. Thus, the Committee considered the size of the Funds and the competitiveness of and/or other determinations made regarding the current advisory fee for each Fund, as well as whether a Fund is subject to an expense limitation.
As to the size of the Funds, the Committee took into account Guggenheim’s statement that generally the Funds’ assets are not sufficiently large to warrant breakpoints, with only three Funds—Floating Rate Strategies Fund, Macro Opportunities Fund, and Total Return Bond Fund—having assets in excess of (or approaching) $1 billion. With respect to the three Funds noted, the Committee considered the levels of profitability reported. The Committee also noted that each of the three Funds is subject to an expense limitation agreement, which results in a lower effective advisory fee.
The Committee determined that, taking into account all relevant factors, the advisory fee for each Fund was reasonable.
Sub-Advisory Agreement
Nature, Extent and Quality of Services Provided by the Sub-Adviser: With respect to the nature, extent and quality of services provided by GPIM (referred to in this discussion as the “Sub-Adviser”), the Committee considered the qualifications, experience and skills of the Sub-Adviser’s portfolio management and other key personnel and information from the Sub-Adviser describing the scope of its services to Municipal Income Fund. The Committee also considered the information provided by the Sub-Adviser concerning the Sub-Adviser’s business continuity and information security plans and controls, and compliance policies and procedures, among other things.
With respect to Guggenheim’s resources and the Sub-Adviser’s ability to carry out its responsibilities under the Sub-Advisory Agreement, as noted above, the Committee considered the financial condition of GPIMH. (Thereafter, the Committee received the audited financial statements of GPIM as supplemental information.)
The Committee also considered the acceptability of the terms of the Sub-Advisory Agreement. Based on the foregoing, and based on other information received (both oral and written) at the April Meeting and at the May Meeting, as well as other considerations, including the Committee’s
44 | THE GUGGENHEIM FUNDS ANNUAL REPORT | |
OTHER INFORMATION (Unaudited)(concluded) |
knowledge of how the Sub-Adviser performs its duties through Board meetings, discussions and reports throughout the year, the Committee concluded that the Sub-Adviser and its personnel were qualified to serve Municipal Income Fund in such capacity and may reasonably be expected to continue to provide a high quality of services under the Sub-Advisory Agreement.
Investment Performance: The Committee considered that the Fund’s Class A shares ranked in the third quartile (65th and 68th percentiles) of its performance universe for the five-year and three-year periods ended December 31, 2015, respectively. On January 13, 2012, the Fund acquired the assets and assumed the liabilities of TS&W/Claymore Tax-Advantaged Balanced Fund (the “Predecessor Fund”), a closed-end fund which used different investment strategies and had different investment advisers. Class A shares of the Fund have assumed the performance, financial and other historical information of the Predecessor Fund’s common shares and the performance of Class A shares of the Fund reflects the performance of the Predecessor Fund. In light of the foregoing, the Committee took into account more recent periods and noted that Fund’s Class A shares ranked in the fourth quartile for the one-year period ended December 31, 2015, and outperformed the performance universe median for the three-month period ended December 31, 2015, ranking in the 39th percentile. In considering the Fund’s performance for the one-year period, the Committee considered Guggenheim’s explanation that the Fund is managed very conservatively and the portfolio management team opted to maintain short duration by allocating to floating rate securities, which was a drag on performance for the period as the Federal Reserve increased interest rates fewer times than had been expected by the team. In light of all the facts and circumstances, the Committee concluded that the investment performance of the Fund and the Sub-Adviser was acceptable.
Comparative Fees, Costs of Services Provided and the Profits Realized by the Sub-Adviser from Its Relationship with the Fund: The Committee reviewed the level of sub-advisory fees payable to GPIM, noting that the fees are paid by Security Investors and do not impact the fees paid by the Fund.
Economies of Scale: The Committee recognized that, because the Sub-Adviser’s fees are paid by the Adviser and not the Fund, the analysis of economies of scale was more appropriate in the context of the Committee’s consideration of the applicable Advisory Agreement, which was separately considered. (See “Advisory Agreements – Economies of Scale” above.)
Overall Conclusions
Based on the foregoing, the Committee determined that the investment advisory fees are fair and reasonable in light of the extent and quality of the services provided and other benefits received and that the continuation of the Agreements is in the best interest of each Fund. In reaching this conclusion, no single factor was determinative or conclusive and each Committee member, in the exercise of his business judgment, may attribute different weights to different factors. At the May Meeting, the Committee, constituting all of the Independent Trustees, recommended the renewal of each Advisory Agreement and the Sub-Advisory Agreement for an additional annual term.
| | THE GUGGENHEIM FUNDS ANNUAL REPORT | 45 |
INFORMATION ON BOARD OF TRUSTEES AND OFFICERS (Unaudited) |
Name, Address* and Year of Birth | Position(s) Held with the Trust | Term of Office and Length of Time Served** | Principal Occupation(s) During Past Five Years | Number of Portfolios in Fund Complex Overseen | Other Directorships Held by Trustees |
INDEPENDENT TRUSTEES | | | |
Randall C. Barnes
(1951) | Trustee | Since 2014 | Current: Private Investor (2001-present).
Former: Senior Vice President and Treasurer, PepsiCo, Inc. (1993-1997); President, Pizza Hut International (1991-1993); Senior Vice President, Strategic Planning and New Business Development, PepsiCo, Inc. (1987-1990). | 101 | Current: Trustee, Purpose Investments Inc. (2014-Present). |
Donald A. Chubb, Jr.
(1946 ) | Trustee | Since 1994 | Current: Business broker and manager of commercial real estate, Griffith & Blair, Inc. (1997-present). | 97 | Current: Midland Care, Inc. (2011-present). |
Jerry B. Farley
(1946) | Trustee | Since 2005 | Current: President, Washburn University (1997-present). | 97 | Current: Westar Energy, Inc. (2004-present); CoreFirst Bank & Trust (2000-present). |
Roman Friedrich III
(1946) | Trustee | Since 2014 | Current: Founder and Managing Partner, Roman Friedrich & Company (1998-present).
Former: Senior Managing Director, MLV & Co. LLC (2010-2011). | 97 | Current: Zincore Metals, Inc. (2009-present).
Former: Axiom Gold and Silver Corp. (2011-2012). |
46 | THE GUGGENHEIM FUNDS ANNUAL REPORT | |
INFORMATION ON BOARD OF TRUSTEES AND OFFICERS (Unaudited)(continued) |
Name, Address* and Year of Birth | Position(s) Held with the Trust | Term of Office and Length of Time Served** | Principal Occupation(s) During Past Five Years | Number of Portfolios in Fund Complex Overseen | Other Directorships Held by Trustees |
INDEPENDENT TRUSTEES - continued | | |
Robert B. Karn III (1942)
| Trustee and Chairman of the Audit Committee | Since 2014 | Current: Consultant (1998-present).
Former: Arthur Andersen (1965-1997) and Managing Partner, Financial and Economic Consulting, St. Louis office (1987-1997). | 97 | Current: Peabody Energy Company (2003-present); GP Natural Resource Partners, LLC (2002- present). |
Ronald A. Nyberg
(1953) | Trustee and Chairman of the Nominating and Governance Committee | Since 2014 | Current: Partner, Momkus McCluskey Roberts, LLC (2016-present).
Former: Partner, Nyberg & Cassioppi, LLC (2000-2016); Executive Vice President, General Counsel, and Corporate Secretary, Van Kampen Investments (1982-1999). | 103 | Current: Edward-Elmhurst Healthcare System (2012-present). |
Maynard F. Oliverius
(1943) | Trustee | Since 1998 | Current: Retired.
Former: President and CEO, Stormont-Vail HealthCare (1996-2012). | 97 | Current: Fort Hays State University Foundation (1999-present); Stormont-Vail Foundation (2013-present); University of Minnesota Healthcare Association Foundation Committee (2009-present).
Former: Topeka Community Foundation (2009-2014) |
| | THE GUGGENHEIM FUNDS ANNUAL REPORT | 47 |
INFORMATION ON BOARD OF TRUSTEES AND OFFICERS (Unaudited)(continued) |
Name, Address* and Year of Birth | Position(s) Held with the Trust | Term of Office and Length of Time Served** | Principal Occupation(s) During Past Five Years | Number of Portfolios in Fund Complex Overseen | Other Directorships Held by Trustees |
INDEPENDENT TRUSTEES - concluded | | |
Ronald E. Toupin, Jr.
(1958) | Trustee and Chairman of the Board | Since 2014 | Current: Portfolio Consultant (2010-present).
Former: Vice President, Manager and Portfolio Manager, Nuveen Asset Management (1998-1999); Vice President, Nuveen Investment Advisory Corp. (1992-1999); Vice President and Manager, Nuveen Unit Investment Trusts (1991-1999); and Assistant Vice President and Portfolio Manager, Nuveen Unit Investment Trusts (1988-1999), each of John Nuveen & Co., Inc. (1982-1999). | 100 | Former: Bennett Group of Funds (2011-2013). |
48 | THE GUGGENHEIM FUNDS ANNUAL REPORT | |
INFORMATION ON BOARD OF TRUSTEES AND OFFICERS (Unaudited)(continued) |
Name, Address* and Year of Birth | Position(s) Held with the Trust | Term of Office and Length of Time Served** | Principal Occupation(s) During Past Five Years | Number of Portfolios in Fund Complex Overseen | Other Directorships Held by Trustees |
INTERESTED TRUSTEE | |
Donald C. Cacciapaglia***
(1951) | President, Chief Executive Officer and Trustee | Since 2012 | Current: President and CEO, certain other funds in the Fund Complex (2012-present); Vice Chairman, Guggenheim Investments (2010-present).
Former: Chairman and CEO, Channel Capital Group, Inc. (2002-2010). | 232 | Current: Clear Spring Life Insurance Company (2015-present); Guggenheim Partners Japan, Ltd. (2014-present); Guggenheim Partners Investment Management Holdings, LLC (2014-present); Delaware Life (2013-present); Guggenheim Life and Annuity Company (2011-present); Paragon Life Insurance Company of Indiana (2011-present). |
* | The business address of each Trustee is c/o Guggenheim Investments, 227 West Monroe Street, Chicago, Illinois 60606. |
** | Each Trustee serves an indefinite term, until his successor is elected and qualified. Time served includes time served in the respective position for the Predecessor Corporation. |
*** | This Trustee is deemed to be an "interested person" of the Funds under the 1940 Act by reason of his position with the Funds' Investment Manager and/or the parent of the Investment Manager. |
| | THE GUGGENHEIM FUNDS ANNUAL REPORT | 49 |
INFORMATION ON BOARD OF TRUSTEES AND OFFICERS (Unaudited)(continued) |
Name, Address* and Year of Birth | Position(s) Held with the Trust | Term of Office and Length of Time Served** | Principal Occupations
During Past Five Years |
OFFICERS | | | |
William H. Belden, III
(1965) | Vice President | Since 2014 | Current: Vice President, certain other funds in the Fund Complex (2006-present); Managing Director, Guggenheim Funds Investment Advisors, LLC (2005-present).
Former: Vice President of Management, Northern Trust Global Investments (1999-2005). |
Joanna M. Catalucci (1966) | AML Officer | Since 2016 | Current: Chief Compliance Officer, certain funds in the Fund Complex (2012-present); Senior Managing Director, Guggenheim Investments (2012-present); AML Officer, certain funds in the Fund Complex (2016-present). Former: Chief Compliance Officer and Secretary, certain other funds in the Fund Complex (2008-2012); Senior Vice President & Chief Compliance Officer, Security Investors, LLC and certain affiliates (2010-2012); Chief Compliance Officer and Senior Vice President, Rydex Advisors, LLC and certain affiliates (2010-2011). |
James M. Howley
(1972) | Assistant Treasurer | Since 2014 | Current: Director, Guggenheim Investments (2004-present) ; Assistant Treasurer, certain other funds in the Fund Complex (2006-present).
Former: Manager, Mutual Fund Administration of Van Kampen Investments, Inc. (1996-2004). |
Keith D. Kemp
(1960) | Assistant Treasurer | Since 2016 | Current: Managing Director of Transparent Value, LLC (2015-present); Managing Director of Guggenheim Investments (2015-present).
Former: Director, Transparent Value, LLC (2010-2015); Director, Guggenheim Investments (2010-2015); Chief Operating Officer, Macquarie Capital Investment Management (2007-2009). |
Amy J. Lee
(1961) | Vice President and Chief Legal Officer | Since 2007 (Vice President)
Since 2014 (Chief Legal Officer) | Current: Chief Legal Officer, certain other funds in the Fund Complex (2013-present); Senior Managing Director, Guggenheim Investments (2012-present).
Former: Vice President, Associate General Counsel and Assistant Secretary, Security Benefit Life Insurance Company and Security Benefit Corporation (2004-2012). |
50 | THE GUGGENHEIM FUNDS ANNUAL REPORT | |
INFORMATION ON BOARD OF TRUSTEES AND OFFICERS (Unaudited)(continued) |
Name, Address* and Year of Birth | Position(s) Held with the Trust | Term of Office and Length of Time Served** | Principal Occupations
During Past Five Years |
OFFICERS - continued | |
Mark E. Mathiasen
(1978) | Secretary | Since 2014 | Current: Secretary, certain other funds in the Fund Complex (2007-present); Managing Director, Guggenheim Investments (2007-present). |
Glenn McWhinnie
(1969) | Assistant Treasurer | Since 2016 | Current: Vice President, Guggenheim Investments (2009-present).
Former: Tax Compliance Manager, Ernst & Young LLP (1996-2009). |
Michael P. Megaris
(1984) | Assistant Secretary | Since 2014 | Current: Assistant Secretary, certain other funds in the Fund Complex (2014-present); Vice President, Guggenheim Investments (2012-present).
Former: J.D., University of Kansas School of Law (2009-2012). |
Elisabeth Miller
(1968) | Chief Compliance Officer | Since 2012 | Current: CCO, certain other funds in the Fund Complex (2012-present); CCO, Security Investors, LLC (2012-present); CCO, Guggenheim Funds Investment Advisors, LLC (2012-present); Managing Director, Guggenheim Investments (2012-present); Vice President, Guggenheim Funds Distributors, LLC (2014-present). Former: CCO, Guggenheim Distributors, LLC (2009-2014); Senior Manager, Security Investors, LLC (2004-2009); Senior Manager, Guggenheim Distributors, LLC (2004-2009). |
Adam J. Nelson
(1979) | Assistant Treasurer | Since 2015 | Current: Vice President, Guggenheim Investments (2015-present); Assistant Treasurer, certain other funds in the Fund Complex (2015-present).
Former: Assistant Vice President and Fund Administration Director, State Street Corporation (2013-2015); Fund Administration Assistant Director, State Street (2011-2013); Fund Administration Manager, State Street (2009-2011). |
| | THE GUGGENHEIM FUNDS ANNUAL REPORT | 51 |
INFORMATION ON BOARD OF TRUSTEES AND OFFICERS (Unaudited)(concluded) |
Name, Address* and Year of Birth | Position(s) Held with the Trust | Term of Office and Length of Time Served** | Principal Occupations
During Past Five Years |
OFFICERS - concluded | |
Kimberly J. Scott
(1974) | Assistant Treasurer | Since 2014 | Current: Vice President, Guggenheim Investments (2012-present) ; Assistant Treasurer, certain other funds in the Fund Complex (2012-present).
Former: Financial Reporting Manager, Invesco, Ltd. (2010-2011); Vice President/Assistant Treasurer, Mutual Fund Administration for Van Kampen Investments, Inc./Morgan Stanley Investment Management (2009-2010); Manager of Mutual Fund Administration, Van Kampen Investments, Inc./Morgan Stanley Investment Management (2005-2009). |
Bryan Stone
(1979) | Vice President | Since 2014 | Current: Vice President, certain other funds in the Fund Complex (2014-present); Director, Guggenheim Investments (2013-present).
Former: Senior Vice President, Neuberger Berman Group LLC (2009-2013); Vice President, Morgan Stanley (2002-2009). |
John L. Sullivan
(1955) | Chief Financial Officer and Treasurer | Since 2014 | Current: CFO, Chief Accounting Officer and Treasurer, certain other funds in the Fund Complex (2010-present); Senior Managing Director, Guggenheim Investments (2010-present).
Former: Managing Director and CCO, each of the funds in the Van Kampen Investments fund complex (2004-2010); Managing Director and Head of Fund Accounting and Administration, Morgan Stanley Investment Management (2002-2004); CFO and Treasurer, Van Kampen Funds (1996-2004). |
* | The business address of each officer is c/o Guggenheim Investments, 227 West Monroe Street, Chicago, Illinois 60606. |
** | Each officer serves an indefinite term, until his or her successor is duly elected and qualified. Time served includes time served in the respective position for the Predecessor Corporation. |
52 | THE GUGGENHEIM FUNDS ANNUAL REPORT | |
GUGGENHEIM INVESTMENTS PRIVACY POLICIES (Unaudited) |
Guggenheim Investments as used herein refers to Guggenheim Partners, LLC, Guggenheim Funds Investment Advisors, LLC, Guggenheim Partners Investment Management, LLC, Guggenheim Funds Distributors, LLC and Security Investors, LLC as well as the funds in the Guggenheim Funds complex (the “funds”).
Our Commitment to You
When you become a Guggenheim Investments investor, you entrust us with not only your hard-earned money but also with personal and financial information about you. We recognize that your relationship with us is based on trust and that you expect us to act responsibly and in your best interests. Because we have access to personal information about you, we hold ourselves to high standards in its safekeeping and use. This means, most importantly, that we do not sell client or account information to anyone—whether you are a current or former Guggenheim Investments client.
The Information We Collect About You and How We Collect It
In the course of doing business with shareholders and investors, we collect nonpublic personal information about you. You typically provide personal information when you complete a Guggenheim Investments account application or when you request a transaction that involves Rydex and Guggenheim Funds or one of the Guggenheim affiliated companies. “Nonpublic personal information” is personally identifiable information about you. For example it includes your name and address, Social Security or taxpayer identification number, assets, income, account balance, bank account information and investment activity (e.g. purchase and redemption history).
How We Share Your Personal Information
As a matter of policy, we do not disclose your nonpublic personal information to nonaffiliated third parties except as required or permitted by law. As emphasized above, we do not sell information about current or former clients or their accounts to third parties. Nor do we share such information, except when necessary to complete transactions at your request or to make you aware of related investment products and services that we offer. Additional details about how we handle your personal information are provided below.
To complete certain transactions or account changes that you direct, it may be necessary to provide your personal information to companies, individuals or groups that are not affiliated with Guggenheim Investments. For example if you ask to transfer assets from another financial institution to Guggenheim Investments, we will need to provide certain information about you to that company to complete the transaction. In connection with servicing your accounts or to alert you to other Guggenheim Investments investment products and services, we may share your information within the Guggenheim Investments family of affiliated companies. This would include, for example, sharing your information within Guggenheim Investments so we can make you aware of new funds or the services offered through another Guggenheim Investments
| | THE GUGGENHEIM FUNDS ANNUAL REPORT | 53 |
GUGGENHEIM INVESTMENTS PRIVACY POLICIES (Unaudited)(concluded) |
affiliated company. In certain instances, we may contract with nonaffiliated companies to perform services for us. Where necessary, we will disclose information we have about you to these third parties. In all such cases, we provide the third party with only the information necessary to carry out its assigned responsibilities and only for that purpose. And we require these third parties to treat your personal information with the same high degree of confidentiality that we do. In certain instances, we may share information with other financial institutions regarding individuals and entities in response to the U.S.A. Patriot Act. Finally we will share personal information about you if we are compelled by law to do so, if you direct us to do so with your consent, or in other circumstances as permitted by law.
How We Safeguard Your Personal Information
We maintain physical, electronic and procedural safeguards to protect your personal information. Within Guggenheim Investments, access to such information is limited to those who need it to perform their jobs such as servicing your account, resolving problems or informing you of new products and services.
54 | THE GUGGENHEIM FUNDS ANNUAL REPORT | |
This page intentionally left blank.
This page intentionally left blank.
This page intentionally left blank.
9.30.2016
Guggenheim Funds Annual Report
Fundamental Alpha |
Guggenheim Mid Cap Value Institutional Fund | | |
GuggenheimInvestments.com | SBMCVI-ANN-0916x0917 |
DEAR SHAREHOLDER | 2 |
ECONOMIC AND MARKET OVERVIEW | 3 |
ABOUT SHAREHOLDERS’ FUND EXPENSES | 5 |
MID CAP VALUE INSTITUTIONAL FUND | 8 |
NOTES TO FINANCIAL STATEMENTS | 20 |
REPORT OF INDEPENDENT REGISTERED PUBLIC ACCOUNTING FIRM | 28 |
OTHER INFORMATION | 29 |
INFORMATION ON BOARD OF TRUSTEES AND OFFICERS | 44 |
GUGGENHEIM INVESTMENTS PRIVACY POLICIES | 51 |
| | THE GUGGENHEIM FUNDS ANNUAL REPORT | 1 |
Dear Shareholder:
Security Investors, LLC, (the “Investment Adviser”) is pleased to present the shareholder report for Guggenheim Mid Cap Value Institutional Fund (the “Fund”) for the annual fiscal period ended September 30, 2016.
The Investment Adviser is part of Guggenheim Investments, which represents the investment management businesses of Guggenheim Partners, LLC (“Guggenheim”), a global, diversified financial services firm.
Guggenheim Funds Distributors, LLC, is the distributor of the Fund. Guggenheim Funds Distributors, LLC, is affiliated with Guggenheim and the Investment Advisers.
We encourage you to read the Economic and Market Overview section of the report, which follows this letter, and then the Managers’ Commentary for the Fund.
We are committed to providing innovative investment solutions and appreciate the trust you place in us.
Sincerely,
Donald C. Cacciapaglia
President and Chief Executive Officer
October 31, 2016
Read a prospectus and summary prospectus (if available) carefully before investing. It contains the investment objectives, risks, charges, expenses and other information, which should be considered carefully before investing. Obtain a prospectus and summary prospectus (if available) at guggenheiminvestments.com or call 800.820.0888.
Mid Cap Value Institutional Fund may not be suitable for all investors. ● An investment in the Fund will fluctuate and is subject to investment risks, which means investors could lose money. ● The intrinsic value of the underlying stocks may never be realized, or the stock may decline in value. ● Investments in small- to mid-sized company securities may present additional risks, such as less predictable earnings, higher volatility, and less liquidity than larger, more established companies.
2 | THE GUGGENHEIM FUNDS ANNUAL REPORT | |
ECONOMIC AND MARKET OVERVIEW (Unaudited) | September 30, 2016 |
Economic growth continues to rebound, even though the rise in U.S. Gross Domestic Product (“GDP”) disappointed in the first half of 2016. There was a large headwind from inventory drawdowns, which should soon reverse after five quarters of dragging on growth. Real GDP growth is expected to be around 2.5 percent in the second half of the year, driven by consumption, housing, and a fading trade drag, and supporting the view that U.S. economic growth remains resilient to global weakness.
The euro zone economy is slowly improving, but inflation will likely persist well below the European Central Bank’s (“ECB”) target in the coming quarters due to substantial slack. The ECB has indicated that more quantitative easing is possible, but will soon need to alter the quantitative easing program in order to keep up their purchase pace. Both China and Japan need weaker currencies. Chinese growth and capital flows have stabilized for now, but surging construction and a credit boom raise the prospect of future instability. Japan’s economic prospects are weak, and inflation remains far from the Bank of Japan’s (“BOJ”) target. The surging yen could drive further policy easing, including an increase in fiscal stimulus.
It appears the U.S. Federal Reserve (the “Fed”) will move forward with raising rates in December, absent any economic or geopolitical surprise or a meaningful tightening of financial conditions over the fourth quarter. But key events could influence risk asset performance for the balance of the year. A continued recovery in oil prices following the Organization of Petroleum Exporting Countries (“OPEC”) agreement to keep production between 32.5 to 33 million barrels per day would help sustain the rally (although we are skeptical that they will adhere to any quota based on historical production levels). Global oil inventories remain high, but supply and demand are moving toward balance. A rebound in GDP growth would also lift U.S. equity and corporate bond prices higher.
The macroeconomic picture remains the same; we are not on the verge of a recession. But despite our positive outlook on the U.S. economy, valuations across risk assets argue for caution. Ongoing accommodation from central bankers across the globe has alleviated much of the initial macroeconomic tail risk posed by Brexit but may not be enough to dampen the seasonal volatility typically observed in the fourth quarter. Ongoing troubles in the banking sector, such as the woes afflicting Deutsche Bank and Wells Fargo, coupled with uncertainty surrounding upcoming political events, which include the new Trump administration, the Italian constitutional referendum, and key European elections, may create volatility for risk assets for the balance of the year.
For the 12 months ended September 30, 2016, the Standard & Poor’s 500® (“S&P 500®”) Index* returned 15.43%. The MSCI Europe-Australasia-Far East (“EAFE”) Index* returned 6.52%. The return of the MSCI Emerging Markets Index* was 16.78%.
| | THE GUGGENHEIM FUNDS ANNUAL REPORT | 3 |
ECONOMIC AND MARKET OVERVIEW (Unaudited)(concluded) | September 30, 2016 |
In the bond market, the Bloomberg Barclays U.S. Aggregate Bond Index* posted a 5.19% return for the period, while the Bloomberg Barclays U.S. Corporate High Yield Index* returned 12.73%. The return of the Bank of America (“BofA”) Merrill Lynch 3-Month U.S. Treasury Bill Index* was 0.28% for the 12-month period.
The opinions and forecasts expressed may not actually come to pass. This information is subject to change at any time, based on market and other conditions, and should not be construed as a recommendation of any specific security or strategy.
*Index Definitions
The following indices are referenced throughout this report.
Indices are unmanaged and not available for direct investment. Index performance does not reflect transaction costs, fees, or expenses.
BofA Merrill Lynch 3-Month U.S. Treasury Bill Index is an unmanaged market Index of U.S. Treasury securities maturing in 90 days that assumes reinvestment of all income.
Bloomberg Barclays U.S. Aggregate Bond Index is a broad-based flagship benchmark that measures the investment grade, U.S. dollar-denominated, fixed-rate taxable bond market, including U.S. Treasuries, government-related and corporate securities, mortgage-backed securities or “MBS” (agency fixed-rate and hybrid adjustable-rate mortgage, or “ARM”, pass-throughs), asset-backed securities (“ABS”), and commercial mortgage-backed securities (“CMBS”) (agency and non-agency).
Bloomberg Barclays U.S. Corporate High Yield Index measures the U.S. dollar-denominated, high yield, fixed-rate corporate bond market. Securities are classified as high yield if the middle rating of Moody’s, Fitch, and S&P is Ba1/BB +/BB + or below.
MSCI EAFE Index is a capitalization-weighted measure of stock markets in Europe, Australasia, and the Far East.
MSCI Emerging Markets Index is a free float-adjusted market capitalization-weighted index that is designed to measure equity market performance in the global emerging markets.
Russell 2500® Value Index measures the performance of the small-to mid-cap value segment of the U.S. equity universe. It includes those Russell 2500 companies with lower price-to-book ratios and lower forecasted growth values.
S&P 500® Index is a broad-based index, the performance of which is based on the performance of 500 widely held common stocks chosen for market size, liquidity, and industry group representation.
4 | THE GUGGENHEIM FUNDS ANNUAL REPORT | |
ABOUT SHAREHOLDERS’ FUND EXPENSES (Unaudited) |
All mutual funds have operating expenses, and it is important for our shareholders to understand the impact of costs on their investments. Shareholders of a fund incur two types of costs: (i) transaction costs, including sales charges (loads) on purchase payments, reinvested dividends, other distributions, and exchange fees, and (ii) ongoing costs, including management fees, administrative services, and shareholder reports, among others. These ongoing costs, or operating expenses, are deducted from a fund’s gross income and reduce the investment return of the fund.
A fund’s expenses are expressed as a percentage of its average net assets, which is known as the expense ratio. The following examples are intended to help investors understand the ongoing costs (in dollars) of investing in a fund and to compare these costs with the ongoing costs of investing in other mutual funds.
The examples are based on an investment of $1,000 made at the beginning of the period and held for the entire six-month period beginning March 31, 2016 and ending September 30, 2016.
The following tables illustrate the Fund’s costs in two ways:
Table 1. Based on actual Fund return: This section helps investors estimate the actual expenses paid over the period. The “Ending Account Value” shown is derived from the Fund’s actual return, and the fifth column shows the dollar amount that would have been paid by an investor who started with $1,000 in the Fund. Investors may use the information here, together with the amount invested, to estimate the expenses paid over the period. Simply divide the Fund’s account value by $1,000 (for example, an $8,600 account value divided by $1,000 = 8.6), then multiply the result by the number provided under the heading “Expenses Paid During Period.”
Table 2. Based on hypothetical 5% return: This section is intended to help investors compare a Fund’s cost with those of other mutual funds. The table provides information about hypothetical account values and hypothetical expenses based on the Fund’s actual expense ratio and an assumed rate of return of 5% per year before expenses, which is not the Fund’s actual return. The hypothetical account values and expenses may not be used to estimate the actual ending account balance or expenses paid during the period. The example is useful in making comparisons because the U.S. Securities and Exchange Commission (the “SEC”) requires all mutual funds to calculate expenses based on the 5% return. Investors can assess a Fund’s costs by comparing this hypothetical example with the hypothetical examples that appear in shareholder reports of other funds.
The calculations illustrated above assume no shares were bought or sold during the period. Actual costs may have been higher or lower, depending on the amount of investment and the timing of any purchases or redemptions.
| | THE GUGGENHEIM FUNDS ANNUAL REPORT | 5 |
ABOUT SHAREHOLDERS’ FUND EXPENSES (Unaudited)(continued) |
Please note that the expenses shown in the table are meant to highlight your ongoing costs only and do not reflect any transactional costs, such as sales charges (loads) on purchase payments, and contingent deferred sales charges (“CDSC”) on redemptions, if any. Therefore, the second table is useful in comparing ongoing costs only, and will not help you determine the relative total costs of owning different funds. In addition, if these transactional costs were included, your costs would have been higher.
More information about the Fund’s expenses, including annual expense ratios for periods up to five years (subject to the Fund’s inception date), can be found in the Financial Highlights section of this report. For additional information on operating expenses and other shareholder costs, please refer to the Fund’s prospectus.
6 | THE GUGGENHEIM FUNDS ANNUAL REPORT | |
ABOUT SHAREHOLDERS’ FUND EXPENSES (Unaudited)(concluded) |
| | Expense
Ratio1 | Fund
Return | Beginning
Account Value
March 31,
2016 | Ending
Account Value
September 30,
2016 | Expenses
Paid During
Period2 |
Table 1. Based on actual Fund return3 |
Mid Cap Value Institutional Fund | 1.27% | 16.28% | $ 1,000.00 | $ 1,162.80 | $ 6.89 |
| |
Table 2. Based on hypothetical 5% return (before expenses) |
Mid Cap Value Institutional Fund | 1.27% | 5.00% | $ 1,000.00 | $ 1,018.70 | $ 6.43 |
1 | Annualized and excludes expenses of the underlying funds in which the Fund invests. |
2 | Expenses are equal to the Fund's annualized expense ratio, net of any applicable fee waivers, multiplied by the average account value over the period, multiplied by 183/365 (to reflect the one-half year period). |
3 | Actual cumulative return at net asset value for the period March 31, 2016 to September 30, 2016. |
| | THE GUGGENHEIM FUNDS ANNUAL REPORT | 7 |
MANAGERS’ COMMENTARY (Unaudited) | |
To Our Shareholders:
Guggenheim Mid Cap Value Institutional Fund (the “Fund”) is managed by a team of seasoned professionals led by James Schier, CFA, Managing Director and Senior Portfolio Manager; Scott Hammond, Managing Director and Portfolio Manager; Farhan Sharaff, Assistant Chief Investment Officer, Equities, and Portfolio Manager; and Gregg Strohkorb, CFA, Portfolio Manager. In the following paragraphs, the team discusses performance of the Fund for the fiscal year ended September 30, 2016.
For the year ended September 30, 2016, the Guggenheim Mid Cap Value Institutional Fund returned 16.28%1, compared with the 17.68% return of its benchmark, the Russell 2500 Value Index.
Strategy and Market Overview
Our investment approach focuses on understanding how companies make money and how easily companies can improve returns, maintain existing high levels of profitability, or benefit from change that occurs within the industries in which they operate. In today’s rapidly changing environment marked by very sharp and quick, but constrained volatility, our long-term orientation and discipline are a competitive advantage. This should become especially critical when the environment of indiscriminant valuation expansion subsides, and fundamentals once again become a more dominant factor in the market.
Performance Review
Most of the performance differential was due to stock selection. The largest negative impact was in the Materials sector, the best-performing sector in the Index, and in the Real Estate sector. The largest positive impact on return was in the Industrials sector, followed by Financials.
Among the top individual contributors on an absolute basis were Finisar, a provider of optical subsystems and components that advanced on strong sales among telecom clients, and Sonoco Products Co., a manufacturer of industrial and consumer packaging products. Another strong performer for the period was Industrials name DigitalGlobe, which benefitted from stronger-than-expected commercial as well as government business. Contributing to overall performance were the strategy’s asset-sensitive bank holdings, which performed particularly well late in the period in anticipation of a hike in short term interest rates.
The leading individual detractors from the Fund’s return on an absolute basis included Bunge Ltd., an agribusiness and food company not held in the Index, and Corrections Corporation of America, a Real Estate holding. Corrections Corporation was affected by increasing concern about the potential loss of federal funding, while Bunge faced price and margin volatility in its South
8 | THE GUGGENHEIM FUNDS ANNUAL REPORT | |
MANAGERS’ COMMENTARY (Unaudited)(concluded) | |
American agribusiness exposure due to weather effects and a dollar that was weak through much of the period. Another underperformer was Consumer Discretionary name Essendant, Inc., which reported poor earnings late in the period.
Portfolio Positioning
The largest relative sector exposures for the year were an underweight in Real Estate and an overweight in Health Care. Both stances detracted from return for the period. The other large underweight was in Financials, which contributed to return for the year.
The Fund has been underweight Financials for some time, as well as the REITs (Real Estate Investment Trust) industry, which was extracted from Financials to form a separate sector in September 2016 and continues to be fairly valued in our view. Toward the end of the period, the Fund trimmed its underweight in Financials by adding several banking names.
Relative underperformance in the overweighted Health Care sector was driven by fears of price controls, brought about by election year politics, severely pressuring biotechnology, device, and products stocks. Early in the period, leading hospital chains fell, citing poor admission trends and higher-than-expected labor costs, which served to punish all of the health-care-service names, especially those that are smaller or have more debt.
Portfolio and Market Outlook
During the quarter, investors began to gain confidence that commodity prices have seen a bottom, which suggested an end to the business pressure not only in energy but in several industrial and financial industries. In addition, the market appears to be getting comfortable with the notion that any interest rate increases will be gradual and enacted with extreme caution. Therefore, with the fear of a commodity-driven recession having ebbed, the fuel for a relief rally was present. With the economic environment proving to be steady but subdued, and a Fed that is acting with utmost caution, the markets appear fated to behave in a choppy manner while trading in a relatively narrow range.
Our portfolios tend to reflect a bias toward companies with balance sheet quality. We continue to find niche companies with what we believe to be attractive growth opportunities, and, as such, are constructive on the outlook.
Performance displayed represents past performance which is no guarantee of future results.
1 | Performance figures do not reflect taxes that a shareholder would pay on distributions or the redemption of shares. |
The opinions and forecast expressed may not actually come to pass. This information is subject to change at any time, based on market and other conditions, and should not be construed as a recommendation of any specific security or strategy.
| | THE GUGGENHEIM FUNDS ANNUAL REPORT | 9 |
PERFORMANCE REPORT AND FUND PROFILE (Unaudited) | September 30, 2016 |
MID CAP VALUE INSTITUTIONAL FUND
OBJECTIVE: Seeks long-term growth of capital.
Holdings Diversification (Market Exposure as % of Net Assets)

“Holdings Diversification (Market Exposure as % of Net Assets)” excludes any temporary cash investments.
Inception Date: July 11, 2008 |
Ten Largest Holdings (% of Total Net Assets) |
DigitalGlobe, Inc. | 2.3% |
Zions Bancorporation | 2.2% |
Alleghany Corp. | 1.9% |
Popular, Inc. | 1.8% |
Sonoco Products Co. | 1.7% |
WestRock Co. | 1.5% |
OGE Energy Corp. | 1.5% |
KeyCorp | 1.5% |
FLIR Systems, Inc. | 1.5% |
Wintrust Financial Corp. | 1.5% |
Top Ten Total | 17.4% |
| | |
“Ten Largest Holdings” excludes any temporary cash investments. |
10 | THE GUGGENHEIM FUNDS ANNUAL REPORT | |
PERFORMANCE REPORT AND FUND PROFILE (Unaudited)(concluded) | September 30, 2016 |
Cumulative Fund Performance*
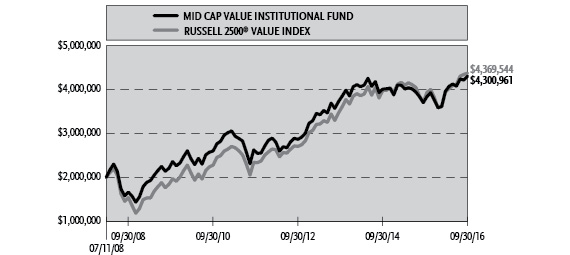
Average Annual Returns*
Periods Ended September 30, 2016
| | 1 Year | 5 Year | Since Inception
(07/11/08) |
Mid Cap Value Institutional Fund | 16.28% | 13.22% | 9.76% |
Russell 2500 Value Index | 17.68% | 16.29% | 9.97% |
* | The performance data above represents past performance that is not predictive of future results. The investment return and principal value of an investment in the Fund will fluctuate so that an investor’s shares, when redeemed, may be worth more or less than their original cost. Returns are historical and include changes in principal and reinvested dividends and capital gains and do not reflect the effect of taxes. The Russell 2500 Value Index is an unmanaged index and, unlike the Fund, has no management fees or operating expenses to reduce its reported return. |
| | THE GUGGENHEIM FUNDS ANNUAL REPORT | 11 |
SCHEDULE OF INVESTMENTS | September 30, 2016 |
MID CAP VALUE INSTITUTIONAL FUND | |
| | | Shares | | | Value | |
| | | | | | | |
COMMON STOCKS† - 100.2% | |
| | | | | | | |
Financial - 32.2% | |
Zions Bancorporation | | | 51,093 | | | $ | 1,584,905 | |
Alleghany Corp.* | | | 2,499 | | | | 1,312,025 | |
Popular, Inc. | | | 33,192 | | | | 1,268,599 | |
KeyCorp | | | 88,122 | | | | 1,072,445 | |
Wintrust Financial Corp. | | | 19,089 | | | | 1,060,775 | |
Sun Communities, Inc. | | | 11,807 | | | | 926,613 | |
Fulton Financial Corp. | | | 61,783 | | | | 897,089 | |
Assured Guaranty Ltd. | | | 32,003 | | | | 888,083 | |
Endurance Specialty Holdings Ltd. | | | 13,556 | | | | 887,240 | |
Trustmark Corp. | | | 31,895 | | | | 879,026 | |
Huntington Bancshares, Inc. | | | 84,416 | | | | 832,342 | |
EPR Properties | | | 10,308 | | | | 811,652 | |
E*TRADE Financial Corp.* | | | 27,276 | | | | 794,277 | |
CubeSmart | | | 27,891 | | | | 760,309 | |
Alexandria Real Estate Equities, Inc. | | | 6,599 | | | | 717,774 | |
Parkway Properties, Inc. | | | 39,049 | | | | 664,223 | |
EastGroup Properties, Inc. | | | 8,990 | | | | 661,304 | |
Hanover Insurance Group, Inc. | | | 8,223 | | | | 620,179 | |
Radian Group, Inc. | | | 43,853 | | | | 594,208 | |
Prosperity Bancshares, Inc. | | | 10,595 | | | | 581,560 | |
Equity Commonwealth* | | | 19,021 | | | | 574,815 | |
First Industrial Realty Trust, Inc. | | | 16,198 | | | | 457,108 | |
Lexington Realty Trust | | | 42,981 | | | | 442,704 | |
Unum Group | | | 11,624 | | | | 410,443 | |
DCT Industrial Trust, Inc. | | | 8,426 | | | | 409,082 | |
PacWest Bancorp | | | 8,946 | | | | 383,873 | |
Monogram Residential Trust, Inc. | | | 34,311 | | | | 365,069 | |
Camden Property Trust | | | 4,167 | | | | 348,945 | |
Genworth Financial, Inc. — Class A* | | | 48,854 | | | | 242,316 | |
Corrections Corporation of America | | | 15,784 | | | | 218,924 | |
Farmer Mac — Class C | | | 5,296 | | | | 209,192 | |
Apartment Investment & Management Co. — Class A | | | 4,498 | | | | 206,503 | |
Hancock Holding Co. | | | 5,804 | | | | 188,224 | |
IBERIABANK Corp. | | | 2,758 | | | | 185,117 | |
First Merchants Corp. | | | 6,679 | | | | 178,663 | |
Umpqua Holdings Corp. | | | 11,692 | | | | 175,965 | |
Total Financial | | | | | | | 22,811,571 | |
| | | | | | | | | |
Industrial - 16.1% | |
Sonoco Products Co. | | | 22,954 | | | | 1,212,659 | |
WestRock Co. | | | 22,506 | | | | 1,091,091 | |
FLIR Systems, Inc. | | | 34,101 | | | | 1,071,453 | |
Oshkosh Corp. | | | 16,152 | | | | 904,512 | |
Gentex Corp. | | | 49,936 | | | | 876,875 | |
Corning, Inc. | | | 36,304 | | | | 858,590 | |
Owens-Illinois, Inc.* | | | 39,345 | | | | 723,555 | |
Huntington Ingalls Industries, Inc. | | | 3,230 | | | | 495,547 | |
Werner Enterprises, Inc. | | | 19,947 | | | | 464,167 | |
Scorpio Tankers, Inc. | | | 92,620 | | | | 428,830 | |
Kirby Corp.* | | | 6,511 | | | | 404,724 | |
Harris Corp. | | | 4,128 | | | | 378,166 | |
Crane Co. | | | 5,873 | | | | 370,057 | |
Ryder System, Inc. | | | 5,562 | | | | 366,814 | |
Spirit AeroSystems Holdings, Inc. — Class A* | | | 8,092 | | | | 360,418 | |
Owens Corning | | | 6,578 | | | | 351,200 | |
Orbital ATK, Inc. | | | 4,586 | | | | 349,591 | |
ITT, Inc. | | | 9,490 | | | | 340,122 | |
Summit Materials, Inc. — Class A* | | | 17,284 | | | | 320,618 | |
Total Industrial | | | | | | | 11,368,989 | |
| | | | | | | | | |
Consumer, Non-cyclical - 14.4% | |
Bunge Ltd. | | | 16,992 | | | | 1,006,436 | |
Emergent BioSolutions, Inc.* | | | 29,131 | | | | 918,500 | |
Quest Diagnostics, Inc. | | | 9,487 | | | | 802,885 | |
ICF International, Inc.* | | | 17,640 | | | | 781,804 | |
Navigant Consulting, Inc.* | | | 37,808 | | | | 764,478 | |
Sanderson Farms, Inc. | | | 7,519 | | | | 724,305 | |
12 | THE GUGGENHEIM FUNDS ANNUAL REPORT | SEE NOTES TO FINANCIAL STATEMENTS. |
SCHEDULE OF INVESTMENTS (continued) | September 30, 2016 |
MID CAP VALUE INSTITUTIONAL FUND | |
| | | Shares | | | Value | |
| | | | | | | |
HealthSouth Corp. | | | 15,694 | | | $ | 636,706 | |
United Rentals, Inc.* | | | 7,128 | | | | 559,477 | |
Premier, Inc. — Class A* | | | 17,297 | | | | 559,385 | |
Surgical Care Affiliates, Inc.* | | | 11,141 | | | | 543,235 | |
MEDNAX, Inc.* | | | 8,008 | | | | 530,530 | |
Patterson Companies, Inc. | | | 10,732 | | | | 493,028 | |
FTI Consulting, Inc.* | | | 9,909 | | | | 441,545 | |
Ingredion, Inc. | | | 2,498 | | | | 332,384 | |
Molina Healthcare, Inc.* | | | 5,615 | | | | 327,467 | |
Universal Corp. | | | 4,581 | | | | 266,706 | |
John B Sanfilippo & Son, Inc. | | | 3,769 | | | | 193,462 | |
Darling Ingredients, Inc.* | | | 11,607 | | | | 156,811 | |
Community Health Systems, Inc.* | | | 10,875 | | | | 125,498 | |
Total Consumer, Non-cyclical | | | | 10,164,642 | |
| | | | | | | | | |
Utilities - 9.1% | |
OGE Energy Corp. | | | 33,927 | | | | 1,072,772 | |
Black Hills Corp. | | | 14,654 | | | | 897,118 | |
Ameren Corp. | | | 16,707 | | | | 821,650 | |
Portland General Electric Co. | | | 18,155 | | | | 773,221 | |
Avista Corp. | | | 17,377 | | | | 726,185 | |
Pinnacle West Capital Corp. | | | 8,688 | | | | 660,201 | |
UGI Corp. | | | 12,836 | | | | 580,701 | |
Calpine Corp.* | | | 38,447 | | | | 485,970 | |
ONE Gas, Inc. | | | 3,322 | | | | 205,432 | |
AES Corp. | | | 14,500 | | | | 186,325 | |
Total Utilities | | | | | | | 6,409,575 | |
| | | | | | | | | |
Consumer, Cyclical - 7.4% | |
DR Horton, Inc. | | | 27,915 | | | | 843,033 | |
J.C. Penney Company, Inc.* | | | 90,203 | | | | 831,672 | |
PVH Corp. | | | 7,122 | | | | 786,981 | |
UniFirst Corp. | | | 5,552 | | | | 732,087 | |
Essendant, Inc. | | | 26,744 | | | | 548,787 | |
Caleres, Inc. | | | 16,298 | | | | 412,176 | |
CalAtlantic Group, Inc. | | | 11,714 | | | | 391,716 | |
Goodyear Tire & Rubber Co. | | | 6,329 | | | | 204,427 | |
La-Z-Boy, Inc. | | | 7,558 | | | | 185,624 | |
WESCO International, Inc.* | | | 2,972 | | | | 182,748 | |
Vista Outdoor, Inc.* | | | 3,445 | | | | 137,318 | |
Total Consumer, Cyclical | | | | | | | 5,256,569 | |
| | | | | | | | | |
Energy - 7.3% | |
Marathon Oil Corp. | | | 60,212 | | | | 951,952 | |
Oasis Petroleum, Inc.* | | | 76,569 | | | | 878,246 | |
Laredo Petroleum, Inc.* | | | 63,856 | | | | 823,742 | |
Apache Corp. | | | 9,174 | | | | 585,943 | |
Chesapeake Energy Corp.* | | | 79,355 | | | | 497,556 | |
Rowan Companies plc — Class A | | | 27,695 | | | | 419,856 | |
Gulfport Energy Corp.* | | | 12,606 | | | | 356,120 | |
Whiting Petroleum Corp.* | | | 39,017 | | | | 341,009 | |
WPX Energy, Inc.* | | | 21,452 | | | | 282,952 | |
HydroGen Corp.*,†††, 1 | | | 1,265,700 | | | | 1 | |
Total Energy | | | | | | | 5,137,377 | |
| | | | | | | | | |
Technology - 6.6% | |
IXYS Corp. | | | 84,392 | | | | 1,016,924 | |
Micron Technology, Inc.* | | | 51,666 | | | | 918,621 | |
Maxwell Technologies, Inc.* | | | 167,031 | | | | 861,880 | |
CSRA, Inc. | | | 22,931 | | | | 616,844 | |
Lam Research Corp. | | | 6,182 | | | | 585,496 | |
MKS Instruments, Inc. | | | 9,379 | | | | 466,418 | |
ManTech International Corp. — Class A | | | 6,024 | | | | 227,045 | |
Total Technology | | | | | | | 4,693,228 | |
| | | | | | | | | |
Communications - 4.1% | |
DigitalGlobe, Inc.* | | | 58,191 | | | | 1,600,253 | |
Finisar Corp.* | | | 20,259 | | | | 603,718 | |
Scripps Networks Interactive, Inc. — Class A | | | 8,606 | | | | 546,395 | |
SEE NOTES TO FINANCIAL STATEMENTS. | THE GUGGENHEIM FUNDS ANNUAL REPORT | 13 |
SCHEDULE OF INVESTMENTS (continued) | September 30, 2016 |
MID CAP VALUE INSTITUTIONAL FUND | |
| | | Shares | | | Value | |
| | | | | | | |
Infinera Corp.* | | | 19,842 | | | $ | 179,173 | |
Total Communications | | | | | | | 2,929,539 | |
| | | | | | | | | |
Basic Materials - 3.1% | |
Reliance Steel & Aluminum Co. | | | 9,498 | | | | 684,141 | |
Freeport-McMoRan, Inc. | | | 51,418 | | | | 558,399 | |
Olin Corp. | | | 21,280 | | | | 436,667 | |
LyondellBasell Industries N.V. — Class A | | | 3,996 | | | | 322,317 | |
Landec Corp.* | | | 16,030 | | | | 214,962 | |
Total Basic Materials | | | | | | | 2,216,486 | |
| | | | | | | | | |
Total Common Stocks | | | | | | | | |
(Cost $62,911,497) | | | | | | | 70,987,976 | |
| | | | | | | | | |
CONVERTIBLE PREFERRED STOCKS††† - 0.0% | |
Thermoenergy Corp.*, 2, 4 | | | 793,750 | | | | 232 | |
Total Convertible Preferred Stocks | | | | | |
(Cost $757,980) | | | | | | | 232 | |
| | | | | | �� | | | |
SHORT-TERM INVESTMENTS† - 0.4% | |
Dreyfus Treasury
Securities Cash
Management
Fund - Institutional
Shares 0.16%3 | | | 255,325 | | | | 255,325 | |
Total Short-Term Investments | | | | | |
(Cost $255,325) | | | | | | | 255,325 | |
| | | | | | | | | |
Total Investments - 100.7% | | | | | |
(Cost $63,924,802) | | | | | | $ | 71,243,533 | |
Other Assets & Liabilities, net - (0.7)% | | | | (433,993 | ) |
Total Net Assets - 100.0% | | | | | | $ | 70,809,540 | |
* | Non-income producing security. |
† | Value determined based on Level 1 inputs — See Note 4. |
††† | Value determined based on Level 3 inputs — See Note 4. |
1 | Affiliated Issuer — See Note 6. |
2 | PIPE (Private Investment in Public Equity) — Stock issued by a company in the secondary market as a means of raising capital more quickly and less expensively than through registration of a secondary public offering. |
3 | Rate indicated is the 7 day yield as of September 30, 2016. |
4 | Illiquid Security. |
| | plc — Public Limited Company |
| | |
| | See Sector Classification in Other Information section. |
14 | THE GUGGENHEIM FUNDS ANNUAL REPORT | SEE NOTES TO FINANCIAL STATEMENTS. |
SCHEDULE OF INVESTMENTS (concluded) | September 30, 2016 |
MID CAP VALUE INSTITUTIONAL FUND | |
The following table summarizes the inputs used to value the Fund’s investments at September 30, 2016 (See Note 4 in the Notes to Financial Statements):
Investments in Securities (Assets) | | Level 1 | | | Level 2 | | | Level 3 | | | Total | |
Common Stocks | | $ | 70,987,975 | | | $ | — | | | $ | 1 | | | $ | 70,987,976 | |
Convertible Preferred Stocks | | | — | | | | — | | | | 232 | | | | 232 | |
Short-Term Investments | | | 255,325 | | | | — | | | | — | | | | 255,325 | |
Total | | $ | 71,243,300 | | | $ | — | | | $ | 233 | | | $ | 71,243,533 | |
Transfers between investment levels may occur as the markets fluctuate and/or the availability of data used in an investment’s valuation changes. Transfers between valuation levels, if any, are in comparison to the valuation levels at the end of the previous fiscal year, and are effective using the fair value as of the end of the previous fiscal period.
For the year ended September 30, 2016, there were no transfers between levels.
SEE NOTES TO FINANCIAL STATEMENTS. | THE GUGGENHEIM FUNDS ANNUAL REPORT | 15 |
STATEMENT OF ASSETS AND LIABILITIES |
MID CAP VALUE INSTITUTIONAL FUND |
September 30, 2016
Assets: | |
Investments in unaffiliated issuers, at value (cost $63,922,271) | | $ | 71,243,532 | |
Investments in affiliated issuers, at value (cost $2,531) | | | 1 | |
Total investments (cost $63,924,802) | | | 71,243,533 | |
Prepaid expenses | | | 20,345 | |
Receivables: | |
Securities sold | | | 317,265 | |
Fund shares sold | | | 137,107 | |
Dividends | | | 109,489 | |
Foreign taxes reclaim | | | 10,107 | |
Total assets | | | 71,837,846 | |
| | | | | |
Liabilities: | |
Payable for: | |
Securities purchased | | | 511,454 | |
Fund shares redeemed | | | 326,592 | |
Management fees | | | 47,376 | |
Trustees’ fees* | | | 18,886 | |
Fund accounting/administration fees | | | 6,001 | |
Transfer agent maintenance fees | | | 2,928 | |
Miscellaneous | | | 115,069 | |
Total liabilities | | | 1,028,306 | |
Net assets | | $ | 70,809,540 | |
| | | | | |
Net assets consist of: | |
Paid in capital | | $ | 58,645,045 | |
Undistributed net investment income | | | 2,688,391 | |
Accumulated net realized gain on investments | | | 2,157,373 | |
Net unrealized appreciation on investments | | | 7,318,731 | |
Net assets | | $ | 70,809,540 | |
Capital shares outstanding | | | 6,498,961 | |
Net asset value per share | | $ | 10.90 | |
* | Relates to Trustees not deemed “interested persons” within the meaning of Section 2(a)(19) of the 1940 Act. |
16 | THE GUGGENHEIM FUNDS ANNUAL REPORT | SEE NOTES TO FINANCIAL STATEMENTS. |
STATEMENT OF OPERATIONS |
MID CAP VALUE INSTITUTIONAL FUND |
Year Ended September 30, 2016
Investment Income: | |
Dividends from unaffiliated issuers (net of foreign withholding tax of $7,969) | | $ | 5,307,059 | |
Interest | | | 3,371 | |
Total investment income | | | 5,310,430 | |
| | | | | |
Expenses: | |
Management fees | | | 1,498,097 | |
Transfer agent/maintenance fees | | | 302,168 | |
Fund accounting/administration fees | | | 189,757 | |
Line of credit fees | | | 45,031 | |
Trustees’ fees* | | | 31,110 | |
Custodian fees | | | 15,225 | |
Tax expense | | | 10,956 | |
Miscellaneous | | | 175,736 | |
Total expenses | | | 2,268,080 | |
Net investment income | | | 3,042,350 | |
| | | | | |
Net Realized and Unrealized Gain (Loss): | |
Net realized gain (loss) on: | |
Investments in unaffiliated issuers | | $ | 17,153,748 | |
Net realized gain | | | 17,153,748 | |
Net change in unrealized appreciation (depreciation) on: | |
Investments in unaffiliated issuers | | | 8,094,425 | |
Net change in unrealized appreciation (depreciation) | | | 8,094,425 | |
Net realized and unrealized gain | | | 25,248,173 | |
Net increase in net assets resulting from operations | | $ | 28,290,523 | |
* | Relates to Trustees not deemed “interested persons” within the meaning of Section 2(a)(19) of the 1940 Act. |
SEE NOTES TO FINANCIAL STATEMENTS. | THE GUGGENHEIM FUNDS ANNUAL REPORT | 17 |
STATEMENTS OF CHANGES IN NET ASSETS |
MID CAP VALUE INSTITUTIONAL FUND | |
| | | Year Ended
September 30,
2016 | | | Year Ended
September 30,
2015 | |
Increase (Decrease) in Net Assets from Operations: | | | | | | |
Net investment income | | $ | 3,042,350 | | | $ | 2,586,231 | |
Net realized gain on investments | | | 17,153,748 | | | | 60,951,511 | |
Net change in unrealized appreciation (depreciation) on investments | | | 8,094,425 | | | | (81,449,262 | ) |
Net increase (decrease) in net assets resulting from operations | | | 28,290,523 | | | | (17,911,520 | ) |
| | | | | | | | | |
Distributions to shareholders from: | | | | | | | | |
Net investment income | | | (3,255,047 | ) | | | (2,549,762 | ) |
Net realized gains | | | (25,619,255 | ) | | | (71,890,688 | ) |
Total distributions to shareholders | | | (28,874,302 | ) | | | (74,440,450 | ) |
| | | | | | | | | |
Capital share transactions: | | | | | | | | |
Proceeds from sale of shares | | | 76,460,927 | | | | 180,989,626 | |
Distributions reinvested | | | 5,764,338 | | | | 40,920,075 | |
Cost of shares redeemed | | | (298,201,787 | ) | | | (440,288,527 | ) |
Net decrease from capital share transactions | | | (215,976,522 | ) | | | (218,378,826 | ) |
Net decrease in net assets | | | (216,560,301 | ) | | | (310,730,796 | ) |
| | | | | | | | | |
Net assets: | | | | | | | | |
Beginning of year | | | 287,369,841 | | | | 598,100,637 | |
End of year | | $ | 70,809,540 | | | $ | 287,369,841 | |
Undistributed net investment income at end of year | | $ | 2,688,391 | | | $ | 2,520,139 | |
| | | | | | | | | |
Capital share activity: | | | | | | | | |
Shares sold | | | 7,868,173 | | | | 15,865,670 | |
Shares issued from reinvestment of distributions | | | 592,429 | | | | 3,627,667 | |
Shares redeemed | | | (29,559,662 | ) | | | (38,179,646 | ) |
Net decrease in shares | | | (21,099,060 | ) | | | (18,686,309 | ) |
18 | THE GUGGENHEIM FUNDS ANNUAL REPORT | SEE NOTES TO FINANCIAL STATEMENTS. |
FINANCIAL HIGHLIGHTS |
MID CAP VALUE INSTITUTIONAL FUND | |
This table is presented to show selected data for a share outstanding throughout each period and to assist shareholders in evaluating a Fund’s performance for the periods presented.
Institutional Class | | Year Ended
Sept. 30,
2016 | | | Year Ended
Sept. 30,
2015 | | | Year Ended
Sept. 30,
2014 | | | Year Ended
Sept. 30,
2013 | | | Year Ended
Sept. 30,
2012 | |
Per Share Data | | | | | | | | | | | | | | | |
Net asset value, beginning of period | | $ | 10.41 | | | $ | 12.92 | | | $ | 13.09 | | | $ | 11.29 | | | $ | 9.97 | |
Income (loss) from investment operations: | |
Net investment income (loss)a | | | .15 | | | | .06 | | | | .06 | | | | .06 | | | | .03 | |
Net gain (loss) on investments (realized and unrealized) | | | 1.43 | | | | (.66 | ) | | | .65 | | | | 2.90 | | | | 2.30 | |
Total from investment operations | | | 1.58 | | | | (.60 | ) | | | .71 | | | | 2.96 | | | | 2.33 | |
Less distributions from: | |
Net investment income | | | (.12 | ) | | | (.07 | ) | | | (.07 | ) | | | (.04 | ) | | | (.04 | ) |
Net realized gains | | | (.97 | ) | | | (1.84 | ) | | | (.81 | ) | | | (1.12 | ) | | | (.97 | ) |
Total distributions | | | (1.09 | ) | | | (1.91 | ) | | | (.88 | ) | | | (1.16 | ) | | | (1.01 | ) |
Net asset value, end of period | | $ | 10.90 | | | $ | 10.41 | | | $ | 12.92 | | | $ | 13.09 | | | $ | 11.29 | |
| | |
Total Returnb | | | 16.28 | % | | | (5.85 | %) | | | 5.53 | % | | | 28.89 | % | | | 24.96 | % |
Ratios/Supplemental Data | |
Net assets, end of period (in thousands) | | $ | 70,810 | | | $ | 287,370 | | | $ | 598,101 | | | $ | 571,465 | | | $ | 490,741 | |
Ratios to average net assets: | |
Net investment income (loss) | | | 1.52 | % | | | 0.52 | % | | | 0.42 | % | | | 0.51 | % | | | 0.30 | % |
Total expensesc | | | 1.14 | % | | | 1.05 | % | | | 1.05 | % | | | 1.01 | % | | | 1.01 | % |
Net expenses | | | 1.14 | % | | | 1.05 | % | | | 1.05 | % | | | 1.01 | % | | | 0.98 | %d |
Portfolio turnover rate | | | 149 | % | | | 95 | % | | | 41 | % | | | 24 | % | | | 33 | % |
a | Net investment income (loss) per share was computed using average shares outstanding throughout the period. |
b | Total return does not reflect the impact of any applicable sales charges and has not been annualized. |
c | Does not include expenses of the underlying funds in which the Fund invests. |
d | Net expense information reflects the expense ratios after expense waivers and reimbursements, as applicable. |
SEE NOTES TO FINANCIAL STATEMENTS. | THE GUGGENHEIM FUNDS ANNUAL REPORT | 19 |
NOTES TO FINANCIAL STATEMENTS |
1. Organization and Significant Accounting Policies
Organization
Guggenheim Funds Trust (the “Trust”), a Delaware statutory trust, is registered with the SEC under the Investment Company Act of 1940 (“1940 Act”), as an open-ended investment company of the series type. Each series, in effect, is representing a separate Fund. The Trust is authorized to issue an unlimited number of shares. The Trust accounts for the assets of each Fund separately.
The Trust offers a combination of four separate classes of shares, A-Class shares, C-Class shares, P-Class shares and Institutional Class shares. Sales of shares of each Class are made without a front-end sales charge at the net asset value per share (“NAV”), with the exception of A-Class shares. A-Class shares are sold at the NAV, plus the applicable front-end sales charge. The sales charge varies depending on the amount purchased. A-Class share purchases of $1 million or more are exempt from the front-end sales charge but have a 1% contingent deferred sales charge (“CDSC”), if shares are redeemed within 12 months of purchase. C-Class shares have a 1% CDSC if shares are redeemed within 12 months of purchase. Institutional Class shares are offered primarily for direct investment by institutions such as pension and profit sharing plans, endowments, foundations and corporations. Institutional Class shares require a minimum initial investment of $2 million and a minimum account balance of $1 million. At September 30, 2016, the Trust consisted of nineteen funds (the “Funds”).
This report covers the Mid Cap Value Institutional Fund (the “Fund”), a diversified investment company.
Guggenheim Investments (“GI”) provides advisory services, and Rydex Fund Services, LLC (“RFS”) provides transfer agent, administrative and accounting services to the Trust. Guggenheim Funds Distributors, LLC (“GFD”) acts as principal underwriter for the Trust. GI and GFD are affiliated entities; RFS ceased to be an affiliate of GI as of October 4, 2016, when it was acquired by MUFG Investor Services. In connection with its acquisition, RFS changed its name to MUFG Investor Services (US), LLC (“MUIS”). This change has no impact on the financial statements of the Fund.
Significant Accounting Policies
The Fund operates as an investment company and, accordingly, follows the investment company accounting and reporting guidance of the Financial Accounting Standards Board (“FASB”) Accounting Standards Codification Topic 946 Financial Services – Investment Companies.
The following significant accounting policies are in conformity with U.S. generally accepted accounting principles (“U.S. GAAP”) and are consistently followed by the Trust. This requires management to make estimates and assumptions that affect the reported amount of assets and liabilities, contingent assets and liabilities at the date of the financial statements, and the reported amounts of revenues and expenses during the reporting period. Actual results could differ from these estimates. All time references are based on Eastern Time.
20 | THE GUGGENHEIM FUNDS ANNUAL REPORT | |
NOTES TO FINANCIAL STATEMENTS (continued) |
The NAV of the Fund is calculated by dividing the market value of the Fund’s securities and other assets, less all liabilities, by the number of outstanding shares of the Fund.
A. The Board of Trustees of the Fund (the “Board”) has adopted policies and procedures for the valuation of the Fund’s investments (the “Valuation Procedures”). Pursuant to the Valuation Procedures, the Board has delegated to a valuation committee, consisting of representatives from Guggenheim’s investment management, fund administration, legal and compliance departments (the “Valuation Committee”), the day-to-day responsibility for implementing the Valuation Procedures, including, under most circumstances, the responsibility for determining the fair value of the Fund’s securities and/or other assets.
Valuations of the Fund’s securities are supplied primarily by pricing services appointed pursuant to the processes set forth in the Valuation Procedures. The Valuation Committee convenes monthly, or more frequently as needed, to review the valuation of all assets which have been fair valued for reasonableness. The Fund’s officers, through the Valuation Committee and consistent with the monitoring and review responsibilities set forth in the Valuation Procedures, regularly review procedures used and valuations provided by the pricing services.
If the pricing service cannot or does not provide a valuation for a particular investment or such valuation is deemed unreliable, such investment is fair valued by the Valuation Committee.
Equity securities listed on an exchange (New York Stock Exchange (“NYSE”) or American Stock Exchange) are valued at the last quoted sales price as of the close of business on the NYSE, usually 4:00 p.m. on the valuation date. Equity securities listed on the NASDAQ market system are valued at the NASDAQ Official Closing Price on the valuation date, which may not necessarily represent the last sale price. If there has been no sale on such exchange or NASDAQ on a given day, the security is valued at the closing bid price on that day.
Open-end investment companies (“Mutual Funds”) are valued at their NAV as of the close of business, on the valuation date.
Investments for which market quotations are not readily available are fair valued as determined in good faith by GI under the direction of the Board using methods established or ratified by the Board. These methods include but are not limited to: market prices; sale prices; broker quotes; and models which derive prices based on inputs such as prices of securities with comparable maturities and characteristics, or based on inputs such as anticipated cash flows or collateral, spread over Treasuries, and other information analysis.
B. Security transactions are recorded on the trade date for financial reporting purposes. Realized gains and losses from securities transactions are recorded using the identified cost basis. Proceeds from lawsuits related to investment holdings are recorded as realized gains in the Fund. Dividend income is recorded on the ex-dividend date, net of applicable taxes withheld by foreign countries. Taxable non-cash dividends are recorded as dividend income. Interest income, including amortization of premiums and accretion of discounts, is accrued on a daily basis.
| | THE GUGGENHEIM FUNDS ANNUAL REPORT | 21 |
NOTES TO FINANCIAL STATEMENTS (continued) |
Interest income also includes paydown gains and losses or mortgage-backed and asset-backed securities and senior and subordinated loans. Amendment fees are earned on compensation for evaluating and accepting changes to the original loan agreement and are recognized when received. Dividend income from REITs is recorded based on the income included in the distributions received from the REIT investments using published REIT classifications, including some management estimates when actual amounts are not available. Distributions received in excess of this estimated amount are recorded as a reduction of the cost of investments or reclassified to capital gains. The actual amounts of income, return of capital, and capital gains are only determined by each REIT after its fiscal year-end, and may differ from the estimated amounts.
C. Distributions of net investment income and net realized gains, if any, are declared and paid at least annually. Dividends are reinvested in additional shares unless shareholders request payment in cash. Distributions are recorded on the ex-dividend date and are determined in accordance with income tax regulations which may differ from U.S. GAAP.
D. Certain expenses have been allocated to the individual Funds in the Trust on a pro rata basis upon the respective aggregate net assets of each Fund included in the Trust.
E. Under the fee arrangement with the custodian, the Fund may earn credits based on overnight custody cash balances. These credits are utilized to reduce related custodial expenses. The custodian fees disclosed in the Statement of Operations are before the reduction in expense from the related earnings credits, if any. For the year ended September 30, 2016, there were no earnings credits received.
F. The Fund may leave cash overnight in its cash account with the custodian. Periodically, the Fund may have cash due to the custodian bank as an overdraft balance. A fee is incurred on this overdraft, calculated by multiplying the overdraft by a rate based on the federal funds rate, which was 0.29% at September 30, 2016.
G. Under the Fund’s organizational documents, its Trustees and Officers are indemnified against certain liabilities arising out of the performance of their duties to the Trust. In addition, throughout the normal course of business, the Fund enters into contracts that contain a variety of representations and warranties which provide general indemnifications. The Fund’s maximum exposure under these arrangements is unknown, as this would involve future claims that may be made against the Fund and/or its affiliates that have not yet occurred. However, based on experience, the Fund expects the risk of loss to be remote.
2. Federal Income Tax Information
The Fund intends to comply with the provisions of Subchapter M of the Internal Revenue Code applicable to regulated investment companies and will distribute substantially all taxable net investment income and capital gains sufficient to relieve the Fund from all, or substantially all, federal income, excise and state income taxes. Therefore, no provision for federal or state income tax is required.
22 | THE GUGGENHEIM FUNDS ANNUAL REPORT | |
NOTES TO FINANCIAL STATEMENTS (continued) |
Tax positions taken or expected to be taken in the course of preparing the Fund’s tax returns are evaluated to determine whether the tax positions are “morelikely-than-not” of being sustained by the applicable tax authority. Tax positions not deemed to meet the more-likely-than-not threshold would be recorded as a tax benefit or expense in the current year. Management has analyzed the Fund’s tax positions taken, or to be taken, on Federal income tax returns for all open tax years, and has concluded that no provision for income tax is required in the Fund’s financial statements. The Fund’s federal tax returns are subject to examination by the Internal Revenue Service for a period of three years after they are filed.
The tax character of distributions paid during the year ended September 30, 2016 was as follows:
Fund | | Ordinary
Income | | | Long-Term
Capital Gains | | | Total
Distributions | |
Mid Cap Value Institutional Fund | | $ | 2,885,054 | | | $ | 25,989,248 | | | $ | 28,874,302 | |
The tax character of distributions paid during the year ended September 30, 2015 was as follows:
Fund | | Ordinary
Income | | | Long-Term
Capital Gains | | | Total
Distributions | |
Mid Cap Value Institutional Fund | | $ | 5,649,717 | | | $ | 68,790,733 | | | $ | 74,440,450 | |
Note: For federal income tax purposes, short-term capital gain distributions are treated as ordinary income distributions.
Tax components of accumulated earnings/(deficit) as of September 30, 2016, were as follows:
Fund | | Undistributed
Ordinary
Income | | | Undistributed
Long-Term
Capital Gains | | | Net Unrealized
Appreciation/
(Depreciation) | | | Accumulated
Capital and
Other Losses | |
Mid Cap Value Institutional Fund | | $ | 2,688,391 | | | $ | 3,279,743 | | | $ | 6,196,361 | | | $ | — | |
For Federal income tax purposes, capital loss carryforwards represent realized losses of the Funds that may be carried forward and applied against future capital gains. Under the RIC Modernization Act of 2010, the Fund is permitted to carry forward capital losses incurred in taxable years beginning after December 22, 2010 for an unlimited period and such capital loss carryforwards will retain their character as either short-term or long-term capital losses. As of September 30, 2016, the Fund had no capital loss carryforwards.
As of September 30, 2016 the following reclassifications were made to the capital accounts of the Fund, to reflect permanent book/tax differences and income and gains available for distributions under income tax regulations, which are due to equalization accounting, excise taxes paid, and dividend reclasses. Net investment income, net realized gains and net assets were not affected by these changes.
| | THE GUGGENHEIM FUNDS ANNUAL REPORT | 23 |
NOTES TO FINANCIAL STATEMENTS (continued) |
On the Statements of Assets and Liabilities the following adjustments were made for permanent book/tax differences:
Fund | | Paid In
Capital | | | Undistributed
Net Investment
Income | | | Accumulated
Net Realized
Loss | |
Mid Cap Value Institutional Fund | | $ | 12,533,530 | | | $ | 380,949 | | | $ | (12,914,479 | ) |
At September 30, 2016, the cost of securities for Federal income tax purposes, the aggregate gross unrealized gain for all securities for which there was an excess of value over tax cost and the aggregate gross unrealized loss for all securities for which there was an excess of tax cost over value, were as follows:
Fund | | Tax
Cost | | | Tax
Unrealized
Gain | | | Tax
Unrealized
Loss | | | Net
Unrealized
Gain | |
Mid Cap Value Institutional Fund | | $ | 65,047,172 | | | $ | 9,576,082 | | | $ | (3,379,721 | ) | | $ | 6,196,361 | |
3. Fees and Other Transactions with Affiliates
Under the terms of an investment advisory contract, the Fund pays GI investment advisory fees calculated at an annualized rate of 0.75% of the average daily net assets of the Fund.
RFS was paid the following for providing transfer agent services to the Fund. Transfer agent fees are assessed to the applicable class of the Fund.
Annual charge per account | $5.00 – $8.00 |
Transaction fee | $0.60 – $1.10 |
Minimum annual charge per Fund† | $25,000 |
Certain out-of-pocket charges | Varies |
| † | Not subject to the Fund during the fi rst twelve months of operations. |
RFS also acted as the administrative agent for the Fund. As such it performed administrative, bookkeeping, accounting and pricing functions for the Fund. For these services, RFS receive d 0.095% of the average daily net assets of the Fund. The minimum annual charge for fund accounting/administrative fees was $25,000.
GI engaged external service providers to perform other necessary services for the Trust, such as audit and accounting related services, legal services, custody, printing and mailing, etc., on a pass-through basis. Such expenses are allocated to various Funds within the complex based on relative net assets.
Certain trustees and officers of the Trust are also officers of GI and GFD.
24 | THE GUGGENHEIM FUNDS ANNUAL REPORT | |
NOTES TO FINANCIAL STATEMENTS (continued) |
4. Fair Value Measurement
In accordance with U.S. GAAP, fair value is defined as the price that the Fund would receive to sell an investment or pay to transfer a liability in an orderly transaction with an independent buyer in the principal market, or in the absence of a principal market, the most advantageous market for the investment or liability. U.S. GAAP establishes a three-tier fair value hierarchy based on the types of inputs used to value assets and liabilities and requires corresponding disclosure. The hierarchy and the corresponding inputs are summarized below:
Level 1 — | quoted prices in active markets for identical assets or liabilities. |
Level 2 — | significant other observable inputs (for example quoted prices for securities that are similar based on characteristics such as interest rates, prepayment speeds, credit risk, etc.). |
Level 3 — | significant unobservable inputs based on the best information available under the circumstances, to the extent observable inputs are not available, which may include assumptions. |
The types of inputs available depend on a variety of factors, such as the type of security and the characteristics of the markets in which it trades, if any. Fair valuation determinations that rely on fewer or no observable inputs require greater judgment. Accordingly, fair value determinations for Level 3 securities require the greatest amount of judgment.
The inputs or methodologies used for valuing securities are not necessarily an indication of the risk associated with investing in those securities. The suitability of the techniques and sources employed to determine fair valuation are regularly monitored and subject to change.
5. Securities Transactions
For the year ended September 30, 2016, the cost of purchases and proceeds from sales of investment securities, excluding government securities, short-term investments and derivatives, were as follows:
Fund | | Purchases | | | Sales | |
Mid Cap Value Institutional Fund | | $ | 298,068,565 | | | $ | 530,069,674 | |
The Fund is permitted to purchase or sell securities from or to certain affiliated funds under specified conditions outlined in procedures adopted by the Board of the Trust. The procedures have been designed to ensure that any purchase or sale of securities by a Fund from or to another fund or portfolio that is or could be considered an affiliate by virtue of having a common investment adviser (or affiliated investment advisers), common Trustees and/or common officers complies with Rule 17a-7 of the 1940 Act. Further, as defined under these procedures, each transaction is effected at the current market price to save costs, where permissible. For the year ended September 30, 2016, the Fund did not engage in purchases and sales of securities, pursuant to Rule 17a-7 of the 1940 Act.
| | THE GUGGENHEIM FUNDS ANNUAL REPORT | 25 |
NOTES TO FINANCIAL STATEMENTS (continued) |
6. Affiliated Transactions
Investments representing 5% or more of the outstanding voting shares of a portfolio company of a fund, or control of or by, or common control under GI, result in that portfolio company being considered an affiliated company of such fund, as defined in the 1940 Act.
Transactions during the year ended September 30, 2016, in which the portfolio company is an “affiliated person”, were as follows:
Affiliated issuers | | Value
09/30/15 | | | Additions | | | Reductions | | | Value
09/30/16 | | | Shares
09/30/16 | | | Investment
Income | |
HydroGen Corp. | | $ | 1 | | | $ | — | | | $ | — | | | $ | 1 | | | | 1,265,700 | | | $ | — | |
7. Line of Credit
The Trust, with the exception of Capital Stewardship Fund, and certain affiliated funds, secured a 364-day committed, $800,000,000 line of credit from Citibank, N.A., which was in place through October 6, 2016, at which time the line of credit was renewed. A Fund may draw (borrow) from the line of credit as a temporary measure for emergency purposes, to facilitate redemption requests, or for other short-term liquidity purposes consistent with the Fund’s investment objective and program. For example, it may be advantageous for the Fund to borrow money rather than sell existing portfolio positions to meet redemption requests. Fees related to borrowings, if any, vary under this arrangement between the greater of Citibank’s “base rate”, LIBOR plus 1%, or the federal funds rate 0.29% at September 30, 2016, plus 1/2 of 1%. The funds paid upfront costs of $663,359 to renew the line of credit.
The commitment fee that may be paid by the Funds is at an annualized rate of 0.15% of the average daily amount of their unused commitment amount. The Funds did not have any borrowings under this agreement as of and for the period ended September 30, 2016.
On October 6, 2016, the Trust, with the exception of Capital Stewardship Fund, and certain affiliated funds, renewed the line of credit from Citibank, N.A., with an increased commitment amount to $1,000,000,000. Fees related to borrowings, if any, vary under this arrangement between the greater of Citibank’s “base rate”, LIBOR plus 1%, or the federal funds rate 0.29% at September 30, 2016, plus 1/2 of 1%. The funds will pay upfront costs of $2,032,388 to renew the line of credit. The commitment fee that may be paid by the Funds is at an annualized rate of 0.15% of the average daily amount of their unused commitment amount.
The allocated interest expense amount for each Fund is referenced in the Statement of Operations under “Line of credit fees” and the effect on the expense ratio is included in the Financial Highlights.
26 | THE GUGGENHEIM FUNDS ANNUAL REPORT | |
NOTES TO FINANCIAL STATEMENTS (concluded) |
8. Other Liabilities
The Fund wrote put option contracts through Lehman Brothers Inc., (“LBI”) that were exercised prior to the option contracts’ expiration and prior to the bankruptcy filing by LBI, during September 2008. However, these transactions have not settled and the securities have not been delivered to the Fund as of September 30, 2016.
Although the ultimate resolution of these transactions is uncertain, the Fund has recorded a liability on its books equal to the difference between the strike price on the put options and the market price of the underlying security on the exercise date. The amount of the liability recorded in miscellaneous payables by the Fund as of September 30, 2016 was $15,940.
| | THE GUGGENHEIM FUNDS ANNUAL REPORT | 27 |
REPORT OF INDEPENDENT REGISTERED PUBLIC ACCOUNTING FIRM |
The Board of Trustees and Shareholders
of Guggenheim Funds Trust
We have audited the accompanying statement of assets and liabilities, including the schedule of investments, of Guggenheim Mid Cap Value Institutional Fund (one of the series constituting the Guggenheim Funds Trust) (the “Fund”) as of September 30, 2016, and the related statement of operations for the year then ended, the statements of changes in net assets for each of the two years in the period then ended, and the financial highlights for each of five years in the period then ended. These financial statements and financial highlights are the responsibility of the Fund’s management. Our responsibility is to express an opinion on these financial statements and financial highlights based on our audits.
We conducted our audits in accordance with the standards of the Public Company Accounting Oversight Board (United States). Those standards require that we plan and perform the audit to obtain reasonable assurance about whether the financial statements and financial highlights are free of material misstatement. We were not engaged to perform an audit of the Fund’s internal control over financial reporting. Our audits included consideration of internal control over financial reporting as a basis for designing audit procedures that are appropriate in the circumstances, but not for the purpose of expressing an opinion on the effectiveness of the Fund’s internal control over financial reporting. Accordingly, we express no such opinion. An audit also includes examining, on a test basis, evidence supporting the amounts and disclosures in the financial statements and financial highlights, assessing the accounting principles used and significant estimates made by management, and evaluating the overall financial statement presentation. Our procedures included confirmation of securities owned as of September 30, 2016, by correspondence with the custodian and transfer agent. We believe that our audits provide a reasonable basis for our opinion.
In our opinion, the financial statements and financial highlights referred to above present fairly, in all material respects, the financial position of the Guggenheim Mid Cap Value Institutional Fund (one of the series constituting the Guggenheim Funds Trust) at September 30, 2016, the results of its operations for the year then ended, the changes in its net assets for each of the two years in the period then ended, and its financial highlights for each of the five years in the period then ended, in conformity with U.S. generally accepted accounting principles.
McLean, Virginia
November 29, 2016
28 | THE GUGGENHEIM FUNDS ANNUAL REPORT | |
OTHER INFORMATION (Unaudited) |
Tax Information
In January 2017, shareholders will be advised on IRS Form 1099 DIV or substitute 1099 DIV as to the federal tax status of the distributions received by shareholders in the calendar year 2016.
The Fund’s investment income(dividend income plus short-term gains, if any) qualifies as follows:
Of the ordinary income distributions paid during the year, the following funds had the corresponding percentages qualify for the dividends received deduction for corporations:
Fund | | Dividend
Received Deduction | |
Mid Cap Value Institutional Fund | | | 100.00 | % |
The following amounts of taxable ordinary income dividends paid during the fiscal year qualified for the lower income tax rate available to individuals under the Jobs and Growth Tax Relief Reconciliation Act of 2003:
Fund | | Qualified
Dividend Income | |
Mid Cap Value Institutional Fund | | | 100.00 | % |
With respect to the taxable year ended September 30, 2016, the Fund hereby designates as capital gain dividends the amounts listed below, or, if subsequently determined to be different, the net capital gain of such year:
Fund | | LTCG
Dividend Income | | | From Proceeds of Shareholder Redemptions | |
Mid Cap Value Institutional Fund | | $ | 25,989,248 | | | $ | 12,544,486 | |
Proxy Voting Information
A description of the policies and procedures that the Trust uses to determine how to vote proxies relating to securities held in the Funds’ portfolios is available, without charge and upon request, by calling 800.820.0888. This information is also available from the EDGAR database on the SEC’s website at https://www.sec.gov.
Information regarding how the Funds voted proxies relating to portfolio securities during the most recent 12-month period ended June 30 is available without charge, upon request, by calling 800.820.0888. This information is also available from the EDGAR database on the SEC’s website at https://www.sec.gov.
| | THE GUGGENHEIM FUNDS ANNUAL REPORT | 29 |
OTHER INFORMATION (Unaudited)(continued) |
Sector Classification
Information in the “Schedule of Investments” is categorized by sectors using sector-level Classifications defined by the Bloomberg Industry Classification System, a widely recognized industry classification system provider. Each Fund’s registration statement has investment policies relating to concentration in specific sectors/industries. For purposes of these investment policies, the Funds usually classify sectors/industries based on industry-level Classifications used by widely recognized industry classification system providers such as Bloomberg Industry Classification System, Global Industry Classification Standards and Barclays Global Classification Scheme.
Quarterly Portfolio Schedules Information
The Trust files its complete schedule of portfolio holdings with the SEC for the first and third quarters of each fiscal year on Form N-Q; which are available on the SEC’s website at https://www.sec.gov. The Funds’ Forms N-Q may be reviewed and copied at the SEC’s Public Reference Room in Washington, DC, and that information on the operation of the Public Reference Room may be obtained by calling 800-SEC-0330. Copies of the portfolio holdings are also available to shareholders, without charge and upon request, by calling 800.820.0888.
Report of the Guggenheim Funds Trust Contracts Review Committee
Guggenheim Funds Trust (the “Trust”) was organized as a Delaware statutory trust on November 8, 2013, and is registered as an open-end management investment company under the Investment Company Act of 1940, as amended (the “1940 Act”). The Trust includes the following series:
● Guggenheim Alpha Opportunity Fund (“Alpha Opportunity Fund”) ● Guggenheim Diversified Income Fund (“Diversified Income Fund”) ● Guggenheim High Yield Fund (“High Yield Fund”) ● Guggenheim Large Cap Value Fund (“Large Cap Value Fund”) ● Guggenheim Macro Opportunities Fund (“Macro Opportunities Fund”) ● Guggenheim Mid Cap Value Fund (“Mid Cap Value Fund”) ● Guggenheim Municipal Income Fund (“Municipal Income Fund”) | ● Guggenheim Capital Stewardship Fund (“Capital Stewardship Fund”) ● Guggenheim Floating Rate Strategies Fund (“Floating Rate Strategies Fund”) ● Guggenheim Investment Grade Bond Fund (“Investment Grade Bond Fund”) ● Guggenheim Limited Duration Fund (“Limited Duration Fund”) ● Guggenheim Market Neutral Real Estate Fund (“Market Neutral Real Estate Fund”) ● Guggenheim Mid Cap Value Institutional Fund (“Mid Cap Value Institutional Fund”) |
30 | THE GUGGENHEIM FUNDS ANNUAL REPORT | |
OTHER INFORMATION (Unaudited)(continued) |
● Guggenheim Small Cap Value Fund (“Small Cap Value Fund”) ● Guggenheim StylePlus—Mid Growth Fund (“StylePlus—Mid Growth Fund”) ● Guggenheim World Equity Income Fund (“World Equity Income Fund”) | ● Guggenheim Risk Managed Real Estate Fund (“Risk Managed Real Estate Fund”) ● Guggenheim StylePlus—Large Core Fund (“StylePlus—Large Core Fund”) ● Guggenheim Total Return Bond Fund (“Total Return Bond Fund”) |
Security Investors, LLC (“Security Investors”), an indirect subsidiary of Guggenheim Partners, LLC, a global, diversified financial services firm (“Guggenheim Partners”), serves as investment adviser to each of: (i) Alpha Opportunity Fund; (ii) High Yield Fund; (iii) Investment Grade Bond Fund; (iv) Large Cap Value Fund; (v) Mid Cap Value Fund; (vi) Mid Cap Value Institutional Fund; (vii) Municipal Income Fund; (viii) Small Cap Value Fund; (ix) StylePlus—Large Core Fund; (x) StylePlus—Mid Growth Fund; and (xi) World Equity Income Fund (collectively, the “SI-Advised Funds”). (Guggenheim Partners, Security Investors, Guggenheim Partners Investment Management, LLC (“GPIM”) and their affiliates may be referred to herein collectively as “Guggenheim.” “Guggenheim Investments” refers to the global asset management and investment advisory division of Guggenheim Partners and includes GPIM, Security Investors and Guggenheim Funds Investment Advisors, LLC and other affiliated investment management businesses.) Under the terms of investment management agreements between Security Investors and the Trust, with respect to the SI-Advised Funds, Security Investors also is responsible for overseeing the activities of GPIM, an indirect subsidiary of Guggenheim Partners, with respect to its service as investment sub-adviser to Municipal Income Fund, pursuant to an investment sub-advisory agreement between Security Investors and GPIM (the “GPIM Sub-Advisory Agreement”).
GPIM serves as investment adviser with respect to each of: (i) Capital Stewardship Fund; (ii) Diversified Income Fund; (iii) Floating Rate Strategies Fund; (iv) Limited Duration Fund; (v) Macro Opportunities Fund; (vi) Market Neutral Real Estate Fund; (vii) Risk Managed Real Estate Fund; and (viii) Total Return Bond Fund (collectively, the “GPIM-Advised Funds” and together with the SI-Advised Funds, the “Funds” and individually, a “Fund”). Under the terms of investment management agreements between GPIM and the Trust, with respect to the GPIM-Advised Funds,1 GPIM also is responsible for overseeing the activities of Concinnity Advisors, LP (“Concinnity”) with respect to Concinnity’s service as investment sub-adviser to the Capital Stewardship Fund, pursuant to an investment sub-advisory agreement between GPIM and Concinnity (the “Concinnity Sub-Advisory Agreement”). Under the supervision of the Board of Trustees of the Trust (the “Board,” with the members of the Board referred to individually as the “Trustees”), the
1 | The investment management agreements pertaining to the SI-Advised Funds and the investment management agreements pertaining to the GPIM-Advised Funds are referred to herein together as the “Advisory Agreements” and, together with the GPIM Sub-Advisory Agreement, as the “Agreements.” In addition, unless the context indicates otherwise, GPIM, with respect to its service as investment adviser to the GPIM-Advised Funds, and Security Investors as to the SI-Advised Funds, are each referred to herein as the “Adviser” and together, the “Advisers.” |
| | THE GUGGENHEIM FUNDS ANNUAL REPORT | 31 |
OTHER INFORMATION (Unaudited)(continued) |
Advisers regularly provide (or, as applicable, oversee the provision of) investment research, advice and supervision, a continuous investment program, and direct the purchase and sale of securities and other investments for each Fund’s portfolio.
Following an initial two-year term, each of the Advisory Agreements continues in effect from year to year provided that such continuance is specifically approved at least annually by (i) the Board or a majority of the outstanding voting securities (as defined in the 1940 Act) of each Fund, and, in either event, (ii) the vote of a majority of the Trustees who are not “interested person[s],” as defined by the 1940 Act, of the Trust (the “Independent Trustees”) casting votes in person at a meeting called for such purpose. At meetings held in person on April 27, 2016 (the “April Meeting”) and on May 17, 2016 (the “May Meeting”), the members of the Contracts Review Committee of the Board (the “Committee”), consisting solely of the Independent Trustees, met separately from Guggenheim to consider the proposed renewal of the Advisory Agreements and the GPIM Sub-Advisory Agreement in connection with the Committee’s annual contract review schedule.2
As part of its review process, the Committee was represented by independent legal counsel to the Independent Trustees (“Independent Legal Counsel”). Independent Legal Counsel reviewed and discussed with the Committee various key aspects of the Trustees’ legal responsibilities relating to the proposed renewal of the Agreements and other principal contracts. The Committee took into account various materials received from Guggenheim and Independent Legal Counsel. Recognizing that the evaluation process with respect to the services provided by each of the Advisers is an ongoing one, the Committee also considered the variety of written materials, reports and oral presentations the Board received throughout the year regarding performance and operating results of the Funds.
In connection with the contract review process, FUSE Research Network LLC (“FUSE”), an independent, third-party research provider, was engaged to prepare advisory contract renewal reports designed specifically to help boards of directors/trustees fulfill their advisory contract renewal responsibilities. The objective of the reports is to present the subject funds’ relative position regarding fees, expenses and total return performance, with peer group and universe
2 | Since Diversified Income Fund is subject to an investment management agreement approved by the Board for an initial term of two years at an in-person meeting of the Board held on August 20, 2015 and the Fund launched in 2016, it was not included in the contract renewal process conducted at the meetings in April and May 2016. Similarly, Market Neutral Real Estate Fund is subject to an investment management agreement approved by the Board for an initial term of two years at an in-person Board meeting held on November 10, 2015, and the Fund launched in 2016. Consequently, Market Neutral Real Estate Fund also was not included in the scope of the 2016 contract renewal process. In addition, because shares of the Capital Stewardship Fund are only offered for subscription and are held by a limited number of institutional/bank investors, and the Fund issues a shareholder report separate from the other series of the Trust, the factors considered by the Committee in evaluating the proposed renewal of an investment management agreement pertaining to the Capital Stewardship Fund, and the Concinnity Sub-Advisory Agreement, are addressed in a separate report of the Committee. Accordingly, references hereafter to the “Funds” should be understood as referring to all series of the Trust, excluding: (i) Capital Stewardship Fund; (ii) Diversified Income Fund; and (iii) Market Neutral Real Estate Fund. |
32 | THE GUGGENHEIM FUNDS ANNUAL REPORT | |
OTHER INFORMATION (Unaudited)(continued) |
comparisons. The Committee assessed the data provided in the FUSE reports as well as commentary and supporting data presented by Guggenheim, including, among other things, a summary of notable distinctions between certain Funds and the applicable peer group identified in the FUSE reports, as well as a discussion of those instances in which FUSE adjusted a peer group after considering a request by management to re-evaluate the peer group constituent funds.
In addition, Guggenheim provided materials and data in response to formal requests for information sent by Independent Legal Counsel on behalf of the Independent Trustees. Guggenheim also made a presentation at the April Meeting which, among other things, addressed areas identified for discussion by the Independent Trustees and Independent Legal Counsel. Throughout the process, the Committee asked questions of management and requested certain additional information, which Guggenheim provided following the April Meeting (collectively with the foregoing reports and materials, the “Contract Review Materials”).
The Committee considered the Contract Review Materials in the context of its accumulated experience governing the Trust and weighed the factors and standards discussed with Independent Legal Counsel. Following an analysis and discussion of the factors identified below and in the exercise of its business judgment, the Committee concluded that it was in the best interest of each Fund to recommend that the Board approve the renewal of each Advisory Agreement and the GPIM Sub-Advisory Agreement for an additional annual term.
Advisory Agreements
Nature, Extent and Quality of Services Provided by each Adviser: With respect to the nature, extent and quality of services currently provided by each Adviser, the Committee considered the information provided by Guggenheim concerning the education, experience, professional affiliations, areas of responsibility and duties of key personnel performing services for the Funds, including those personnel providing compliance oversight, as well as the supervisors and reporting lines for such personnel. In this connection, the Committee considered Guggenheim’s resources and related efforts to retain, attract and motivate capable personnel to serve the Funds and noted Guggenheim’s report on recent additions, departures and transitions in personnel who work on matters relating to the Funds or are significant to the operations of each Adviser. The Committee also considered the Advisers’ attention to relevant developments in the mutual fund industry and its observance of compliance and regulatory requirements, and noted that on a regular basis the Board receives and reviews information from the Trust’s Chief Compliance Officer regarding compliance policies and procedures established pursuant to Rule 38a-1 under the 1940 Act, as well as from Guggenheim’s Chief Risk Officer. The Committee also noted updates by Guggenheim to certain compliance programs, including with respect to Code of Ethics monitoring, and the implementation of additional forensic testing. The Committee took into consideration the settlement of a regulatory matter concerning GPIM and remedial steps taken in response by Guggenheim to enhance its organizational structure for compliance. In this connection, the Committee considered information provided by Guggenheim regarding the findings of an independent compliance consultant retained to review GPIM’s compliance
| | THE GUGGENHEIM FUNDS ANNUAL REPORT | 33 |
OTHER INFORMATION (Unaudited)(continued) |
program and the consultant’s conclusion that the program is reasonably designed to prevent and detect violations of the Investment Advisers Act of 1940, as amended, and the rules promulgated thereunder. Moreover, in connection with the Committee’s evaluation of the overall package of services provided by each Adviser, the Committee considered each Adviser’s administrative capabilities, including its role in monitoring and coordinating compliance responsibilities with the fund administrator, transfer agent, distributor, custodian and other service providers to the Funds. In addition, because Municipal Income Fund is sub-advised, the Committee took into account information provided by Guggenheim describing the Adviser’s processes and activities for providing oversight of sub-advisers, including information regarding the Adviser’s Sub-Advisory Oversight Committee.
With respect to Guggenheim’s resources and the ability of each Adviser to carry out its responsibilities under the applicable Advisory Agreement, the Chief Financial Officer of Guggenheim Investments reviewed with the Committee certain unaudited financial information concerning the holding company for Guggenheim Investments, Guggenheim Partners Investment Management Holdings, LLC (“GPIMH”). (Thereafter, the Committee received the audited consolidated financial statements of GPIMH and the audited financial statements of GPIM as supplemental information.)
The Committee also considered the acceptability of the terms of each Advisory Agreement, including the scope of services required to be performed by each Adviser.
Based on the foregoing, and based on other information received (both oral and written) at the April Meeting and the May Meeting, as well as other considerations, including the Committee’s knowledge of how each Adviser performs its duties through Board meetings, discussions and reports during the year, the Committee concluded that each Adviser and its personnel were qualified to serve the Funds in such capacity and may reasonably be expected to continue to provide a high quality of services under each Advisory Agreement with respect to the Funds.
Investment Performance: The Committee received, for each Fund, investment returns for the ten-year, five-year, three-year, one-year and three-month periods ended December 31, 2015, as applicable. In addition, the Committee received a comparison of each Fund’s performance to the performance of a benchmark, a universe of funds and a narrower peer group of similar funds with comparable asset levels as identified by FUSE, in each case for the same periods, as applicable. The Committee also received from FUSE representatives and considered a description of the methodology employed by FUSE for identifying each Fund’s peer group and universe for performance and expense comparisons.
In seeking to evaluate Fund performance over a full market cycle, the Committee generally focused its attention first on five-year and three-year performance rankings as compared to the relevant universe of funds. The Committee also considered more recent performance periods, including the one-year period and, as deemed appropriate, the three-month period, for certain Funds such as for those Funds that were recently launched or had undergone recent changes in investment
34 | THE GUGGENHEIM FUNDS ANNUAL REPORT | |
OTHER INFORMATION (Unaudited)(continued) |
strategies, as well as circumstances in which enhancements were made to the portfolio management processes or techniques employed for a Fund. In this connection, the Committee made the following observations:
Alpha Opportunity Fund: The Fund’s Class A shares outperformed the performance universe median for the five-year and three-year periods, ranking in the 6th and 9th percentiles, respectively. The Committee considered the limitations on portfolio management as a result of the 2008 Lehman bankruptcy, and subsequent changes to the Fund’s investment strategies, noting that the Fund re-opened to subscriptions with a new U.S. long/short equity investment strategy on January 28, 2015. In light of the foregoing, the Committee also considered more recent performance periods, including the one-year and three-month periods ended December 31, 2015, and observed that the Fund’s Class A shares ranked in the 72nd and 92nd percentiles, respectively of its performance universe. Given the limited period of time that the Adviser has managed the Fund pursuant to its new investment program, the Committee also took into account updated performance data provided by the Adviser in connection with the May Meeting and noted that the Fund’s net performance for the one-year and three-month periods ended March 31, 2016 ranked in the 6th and 1st percentiles, respectively of the Morningstar Long/Short Equity peer group.
Floating Rate Strategies Fund: The Committee noted the Fund’s inception date of November 30, 2011, and observed that the Fund’s Class A shares ranked in the 1st and 5th percentiles of its performance universe for the three-year and one-year periods ended December 31, 2015, respectively, outperforming its performance universe median for each of these periods.
High Yield Fund: The returns of the Fund’s Class A shares ranked in the 46th and 10th percentiles of its performance universe for the five-year and three-year periods ended December 31, 2015, respectively, and outperformed the performance universe median for each of these periods.
Investment Grade Bond Fund: The returns of the Fund’s Class A shares ranked in the 1st percentile of its performance universe for both the five-year and three-year periods ended December 31, 2015, outperforming its performance universe median for both of these periods.
Limited Duration Fund: The Committee noted the Fund’s inception date of December 16, 2013, and observed that the returns of the Fund’s Class A shares ranked in the 1st and 10th percentiles of the performance universe for the one-year and three-month periods ended December 31, 2015, respectively, outperforming the median returns.
Macro Opportunities Fund: The Committee noted the Fund’s inception date of November 30, 2011, and observed that the returns of the Fund’s Class A shares ranked in the 6th and 57th percentiles of the performance universe for the three-year and one-year periods ended December 31, 2015, respectively, and outperformed the performance universe median for the three-year period.
| | THE GUGGENHEIM FUNDS ANNUAL REPORT | 35 |
OTHER INFORMATION (Unaudited)(continued) |
Municipal Income Fund: The Committee considered that Security Investors does not directly manage the investment portfolio but has delegated such duties to GPIM. Based on the information provided and the review of the Fund’s investment performance, the Committee concluded that Security Investors had appropriately reviewed and monitored GPIM’s investment performance as Sub-Adviser to the Fund.
Risk Managed Real Estate Fund: The Committee noted the Fund’s inception date of February 12, 2014, and observed the returns of the Fund’s Class A shares ranked in the 31st and 76th percentile of its performance universe for the one-year and three-month periods ended December 31, 2015, respectively.
StylePlus—Large Core Fund: The returns of the Fund’s Class A shares ranked in the 39th percentile of its performance universe for the three-year period ended December 31, 2015. The Committee noted that the Fund implemented a strategy change and a new portfolio management team in May 2013. In light of the foregoing, the Committee also considered more recent performance periods in addition to the three-year performance, including the one-year and three-month periods ended December 31, 2015, and observed that the returns of the Fund’s Class A shares exceeded the median of its performance universe for both periods, ranking in the 25th and 22nd percentiles for the one-year and three-month periods, respectively.
StylePlus—Mid Growth Fund: The returns of the Fund’s Class A shares ranked in the 45th percentile of its performance universe for the three-year period ended December 31, 2015. The Committee noted that the Fund implemented a strategy change and a new portfolio management team in May 2013. In light of the foregoing, the Committee considered more recent performance periods in addition to the three-year performance, including the one-year and three-month periods ended December 31, 2015, and observed that the returns of the Fund’s Class A shares exceeded the median of its performance universe for both periods, ranking in the 42nd and 45th percentiles for the one-year and three-month periods, respectively.
Total Return Bond Fund: The Committee noted the Fund’s inception date of November 30, 2011, and observed that the returns of the Fund’s Class A shares ranked in the 1st and 12th percentiles of its performance universe for the three-year and one-year periods ended December 31, 2015, respectively, and outperformed the performance universe median for each of these periods.
World Equity Income Fund: The returns of the Fund’s Class A shares ranked in the 66th percentile of its performance universe for the three-year period ended December 31, 2015. The Committee noted that the Fund implemented a strategy change and a new portfolio management team in August 2013. In light of the foregoing, the Committee considered more recent performance periods in addition to the three-year performance, including the one-year and three-month periods ended December 31, 2015, and observed that the returns of the Fund’s Class A shares exceeded the median of its performance universe for both periods, ranking in the 43rd and 39th percentiles for the one-year and three-month periods, respectively.
36 | THE GUGGENHEIM FUNDS ANNUAL REPORT | |
OTHER INFORMATION (Unaudited)(continued) |
Value Funds:Large Cap Value Fund, Mid Cap Value Fund, Mid Cap Value Institutional Fund and Small Cap Value Fund
Large Cap Value Fund: The returns of the Class A shares underperformed the performance universe median for the five-year, three-year, one-year and three-month periods ended December 31, 2015, and ranked in the 83rd, 72nd, 72nd and 67th percentiles, respectively.
Mid Cap Value Fund: The returns of the Class A shares underperformed the performance universe median for the five-year, three-year, one-year and three-month periods ended December 31, 2015, and ranked in the 83rd, 79th, 75th and 81st percentiles, respectively.
Mid Cap Value Institutional Fund: The Fund’s returns underperformed the performance universe median for the five-year, three-year, one-year and three-month periods ended December 31, 2015, and ranked in the 82nd, 75th, 70th and 67th percentiles, respectively.
Small Cap Value Fund: The Fund underperformed its performance universe median for the five-year, three-year and one-year periods ended December 31, 2015, ranking in the 80th percentile for the five-year and three-year periods and in the 67th percentile for the one-year period. The Fund outperformed its performance universe median for three-month period ended December 31, 2015, and ranked in the 29th percentile.
In response to the Committee’s request, representatives from the Adviser provided information regarding, and discussed factors impacting, each Value Fund’s performance, including market trends and stock selection. The Adviser’s representatives also discussed the portfolio management team’s philosophy and processes and explained their expectations and strategies for the future. The Committee noted measures taken by the Adviser to remedy relative longer-term underperformance with respect to each of the Value Funds, including strategy enhancements such as implementation of a refined stock selection process and additional risk controls to enforce the strategy’s sell discipline. The Committee noted that the Adviser believes the enhancements to the portfolio management techniques employed for each Value Fund, used in conjunction with existing proprietary quantitative models, will help improve the Fund‘s performance results. In light of the foregoing, the Committee requested and the Adviser provided supplemental performance data to enable the Committee to evaluate the impact of the strategy enhancements. In this connection, the Committee considered that the data provided by the Adviser indicated that each Value Fund’s performance was improving, with performance for the first quarter of 2016 ranking better than the trailing one-year return. The Committee also considered the Adviser’s statement that it believes the improving trend in performance relative to peers reflects the enhancements implemented in the investment process. The Committee also noted Guggenheim’s commitment to monitor each Value Fund’s performance and update the Independent Trustees on a quarterly basis as to the impact of the process enhancements implemented to-date and advise on other steps that might be taken to further address each Fund’s performance, if necessary.
| | THE GUGGENHEIM FUNDS ANNUAL REPORT | 37 |
OTHER INFORMATION (Unaudited)(continued) |
After reviewing the foregoing and related factors, the Committee concluded that: (i) each Fund’s performance was acceptable; or (ii) it was satisfied with Guggenheim’s responses and efforts relating to investment performance.
Comparative Fees, Costs of Services Provided and the Profits Realized by each Adviser from Its Relationship with the Funds: The Committee compared each Fund’s contractual advisory fee and total net expense ratio to the applicable peer group. The Committee also reviewed the median advisory fees and expense ratios, including expense ratio components (e.g., transfer agency fees, administration fees, other operating expenses, distribution fees and fee waivers/reimbursements) of the peer group of funds. In response to a supplemental request, the Committee also received and reviewed aggregated advisory and administrative fees compared to the peer group average and median.
As part of its evaluation of each Fund’s advisory fee, the Committee considered how such fees compared to the advisory fee charged by the applicable Adviser to one or more other funds, separate accounts and/or other types of client portfolios and investment vehicles that it manages pursuant to a similar investment objective and strategies, to the extent applicable, noting that, in certain instances, Guggenheim charges a lower advisory fee to such other clients. In this connection, the Committee considered, among other things, Guggenheim’s representations about the significant differences between managing mutual funds as compared to other types of accounts, including the additional resources required to effectively manage mutual fund assets and the greater regulatory costs associated with the management of such assets. The Committee also considered Guggenheim’s explanation that lower fees are charged in certain instances due to various other factors, including the scope of contract, type of investors, applicable legal, governance and capital structures, tax status and historical pricing reasons. With respect to the difference in fees charged to a comparable client that is a mutual fund, as to which Guggenheim serves as sub-adviser, the Committee took into account the following: Guggenheim advises that it has less legal and regulatory exposure as a sub-adviser to an unaffiliated fund and does not take on the same business risk because Guggenheim is not the sponsor of that fund. The Committee concluded that the information it received demonstrated that the aggregate services provided to the Funds were sufficiently different from those provided to other clients with similar investment strategies and/or the risks borne by Guggenheim were sufficiently greater than those associated with managing other clients with similar investment strategies to support the difference in fees.
In further considering the comparative fee and expense data presented in the Contract Review Materials and addressed by Guggenheim, the Committee made the following observations:
Alpha Opportunity Fund: The average contractual advisory fee percentile rank across all share classes of the Fund and the asset weighted total net expense ratio are in the second quartile (27th and 46th percentiles, respectively) of its peer group. The Committee also considered that the Adviser had entered into an expense limitation agreement with respect to the Fund.
38 | THE GUGGENHEIM FUNDS ANNUAL REPORT | |
OTHER INFORMATION (Unaudited)(continued) |
Floating Rate Strategies Fund: The average contractual advisory fee percentile rank across all share classes of the Fund is in the fourth quartile (83rd percentile) of its peer group and the asset weighted total net expense ratio is in the second quartile (45th percentile) of its peer group. The Committee also considered that the Adviser had entered into an expense limitation agreement with respect to the Fund.
High Yield Fund: The average contractual advisory fee percentile rank across all share classes of the Fund is in the second quartile (40th percentile) of its peer group and the asset weighted total net expense ratio is in the fourth quartile (77th percentile) of its peer group. The Committee also considered that the Adviser had entered into an expense limitation agreement with respect to the Fund.
Investment Grade Bond Fund: The average contractual advisory fee percentile rank across all share classes of the Fund is in the third quartile (54th percentile) of its peer group and the asset weighted total net expense ratio is in the fourth quartile (83rd percentile) of its peer group. The Committee also considered that the Adviser had entered into an expense limitation agreement with respect to the Fund.
Large Cap Value Fund: The average contractual advisory fee percentile rank across all share classes of the Fund is in the first quartile (22nd percentile) of its peer group and the asset weighted total net expense ratio is in the second quartile (35th percentile) of its peer group. The Committee also considered that the Adviser had entered into an expense limitation agreement with respect to the Fund.
Limited Duration Fund: The average contractual advisory fee percentile rank across all share classes of the Fund is in the third quartile (66th percentile) of its peer group, as is the Fund’s asset weighted total net expense ratio (63rd percentile). The Committee also considered that the Adviser had entered into an expense limitation agreement with respect to the Fund.
Macro Opportunities Fund: The average contractual advisory fee percentile rank across all share classes of the Fund is in the fourth quartile (98th percentile) of its peer group, as is the Fund’s the asset weighted total net expense ratio (95th percentile). The Committee also considered that the Adviser had entered into an expense limitation agreement with respect to the Fund. In addition, the Committee noted that the Fund is categorized as a non-traditional bond fund which seeks to add value by investing in many non-traditional securities outside of fixed income, including equities, currencies, commodities and derivatives. In this connection, the Committee considered the Adviser’s statement that it supports the Fund with significant resources and a unique approach to drive performance for investors.
Mid Cap Value Fund: The average contractual advisory fee percentile rank across all share classes of the Fund is in the second quartile (37th percentile) of its peer group and the asset weighted total net expense ratio is in the fourth quartile (94th percentile) of its peer group.
| | THE GUGGENHEIM FUNDS ANNUAL REPORT | 39 |
OTHER INFORMATION (Unaudited)(continued) |
Mid Cap Value Institutional Fund: The contractual advisory fee of the Fund is in the first quartile (6th percentile) of its peer group and the total net expense ratio is in the third quartile (63rd percentile) of its peer group.
Municipal Income Fund: The average contractual advisory fee percentile rank across all share classes of the Fund is in the second quartile (39th percentile) and the asset weighted total net expense ratio is in the 25th percentile of its peer group. The Committee also considered that the Adviser had entered into an expense limitation agreement with respect to the Fund.
Risk Managed Real Estate Fund: The average contractual advisory fee percentile rank across all share classes of the Fund and the asset weighted total net expense ratio are in the first quartile (1st percentile as to each) of its peer group.
StylePlus—Large Core Fund: The average contractual advisory fee percentile rank across all share classes of the Fund is in the third quartile (71st percentile) and the asset weighted total net expense ratio is in the fourth quartile (86th percentile) of its peer group.
StylePlus—Mid Growth Fund: The average contractual advisory fee percentile rank across all share classes of the Fund is in the second quartile (29th percentile) of its peer group and the asset weighted total net expense ratio is in the fourth quartile (92nd percentile) of its peer group.
Small Cap Value Fund: The average contractual advisory fee percentile rank across all share classes of the Fund is in the fourth quartile (75th percentile) of its peer group and the asset weighted total net expense ratio is in the first quartile (11th percentile) of its peer group. The Committee also considered that the Adviser had entered into an expense limitation agreement with respect to the Fund.
Total Return Bond Fund: The average contractual advisory fee percentile rank across all share classes of the Fund is in the fourth quartile (93rd percentile) of its peer group and the asset weighted total net expense ratio is in the third quartile (65th percentile) of its peer group. The Committee also considered that the Adviser had entered into an expense limitation agreement with respect to the Fund.
World Equity Income Fund: The average contractual advisory fee percentile rank across all share classes of the Fund is in the second quartile (31st percentile) of its peer group and the asset weighted total net expense ratio is in the fourth quartile (92nd percentile) of its peer group. The Committee also considered that the Adviser had entered into an expense limitation agreement with respect to the Fund.
With respect to the costs of services provided and profits realized by Guggenheim Investments from its relationship with the Funds, the Committee reviewed a profitability analysis and data from management for each Fund setting forth the average assets under management for the twelve months ended December 31, 2015, ending assets under management as of December 31, 2015, gross revenues received by Guggenheim Investments, expenses allocated to the Fund, earnings and the operating margin/profitability rate, including variance information relative
40 | THE GUGGENHEIM FUNDS ANNUAL REPORT | |
OTHER INFORMATION (Unaudited)(continued) |
to the foregoing amounts as of December 31, 2014. In addition, the Chief Financial Officer of Guggenheim Investments reviewed with, and addressed questions from, the Committee concerning the expense allocation methodology employed in producing the profitability analysis.
In the course of its review of Guggenheim Investments’ profitability, the Committee took into account the methods used by Guggenheim Investments to determine expenses and profit and reviewed a report from an independent accounting firm evaluating Guggenheim Investments’ approach to allocating costs and determining the profitability of Guggenheim Investments with respect to individual funds and the entire fund complex. In evaluating the costs of services provided and the profitability to Guggenheim Investments, based upon the profitability rates presented by Guggenheim Investments and the conclusion of the independent accounting firm that the methodology used for calculating such rates was reasonable, the Committee concluded that the profits were not unreasonable.
The Committee considered other benefits available to each Adviser because of its relationship with the Funds and noted that Security Investors and GPIM may be deemed to benefit from arrangements whereby an affiliate, Rydex Fund Services, LLC, currently receives fees for (i) performing certain administrative functions and bookkeeping, accounting and pricing functions for the Funds pursuant to a Fund Accounting and Administration Agreement, and (ii) acting as transfer agent for the Funds and performing all shareholder servicing functions, including transferring record ownership, processing purchase and redemption transactions, answering inquiries, mailing shareholder communications, and acting as the dividend disbursing agent pursuant to a Transfer Agency Agreement. The Committee reviewed the compensation arrangements for the provision of the foregoing services, as well as Guggenheim’s profitability from providing such services. The Committee also noted Guggenheim’s statement that it may benefit from marketing synergies arising from offering a broad spectrum of products, including the Funds.
Economies of Scale: The Committee received and considered information regarding whether there have been economies of scale with respect to the management of the Funds as Fund assets grow, whether the Funds have appropriately benefited from any economies of scale, and whether there is potential for realization of any further economies of scale. The Committee considered whether economies of scale in the provision of services to the Funds were being passed along to the shareholders. The Committee noted the Adviser’s statement that Guggenheim continues to develop the infrastructure needed to support Fund asset growth and to achieve economies of scale across the firm’s various products and product lines. Thus, while Guggenheim may be benefiting from certain economies of scale and related cost efficiencies, it is concurrently realizing new costs and expenses associated with investment in infrastructure to support growth. The Committee took into account the additional information provided by Guggenheim at the Committee’s request regarding the investments made to support the growth of the organization, noting, among other things, enhancements to improve operational efficiency and further development of compliance-related functions, as well as Guggenheim’s view as to how such investments benefit the Funds.
| | THE GUGGENHEIM FUNDS ANNUAL REPORT | 41 |
OTHER INFORMATION (Unaudited)(continued) |
As part of its assessment of economies of scale, the Committee also considered Guggenheim’s view that it seeks to share economies of scale through expense limitations and/or through advisory fees set at competitive rates pre-assuming future asset growth. Thus, the Committee considered the size of the Funds and the competitiveness of and/or other determinations made regarding the current advisory fee for each Fund, as well as whether a Fund is subject to an expense limitation.
As to the size of the Funds, the Committee took into account Guggenheim’s statement that generally the Funds’ assets are not sufficiently large to warrant breakpoints, with only three Funds—Floating Rate Strategies Fund, Macro Opportunities Fund, and Total Return Bond Fund—having assets in excess of (or approaching) $1 billion. With respect to the three Funds noted, the Committee considered the levels of profitability reported. The Committee also noted that each of the three Funds is subject to an expense limitation agreement, which results in a lower effective advisory fee.
The Committee determined that, taking into account all relevant factors, the advisory fee for each Fund was reasonable.
Sub-Advisory Agreement
Nature, Extent and Quality of Services Provided by the Sub-Adviser: With respect to the nature, extent and quality of services provided by GPIM (referred to in this discussion as the “Sub-Adviser”), the Committee considered the qualifications, experience and skills of the Sub-Adviser’s portfolio management and other key personnel and information from the Sub-Adviser describing the scope of its services to Municipal Income Fund. The Committee also considered the information provided by the Sub-Adviser concerning the Sub-Adviser’s business continuity and information security plans and controls, and compliance policies and procedures, among other things.
With respect to Guggenheim’s resources and the Sub-Adviser’s ability to carry out its responsibilities under the Sub-Advisory Agreement, as noted above, the Committee considered the financial condition of GPIMH. (Thereafter, the Committee received the audited financial statements of GPIM as supplemental information.)
The Committee also considered the acceptability of the terms of the Sub-Advisory Agreement. Based on the foregoing, and based on other information received (both oral and written) at the April Meeting and at the May Meeting, as well as other considerations, including the Committee’s knowledge of how the Sub-Adviser performs its duties through Board meetings, discussions and reports throughout the year, the Committee concluded that the Sub-Adviser and its personnel were qualified to serve Municipal Income Fund in such capacity and may reasonably be expected to continue to provide a high quality of services under the Sub-Advisory Agreement.
42 | THE GUGGENHEIM FUNDS ANNUAL REPORT | |
OTHER INFORMATION (Unaudited)(concluded) |
Investment Performance: The Committee considered that the Fund’s Class A shares ranked in the third quartile (65th and 68th percentiles) of its performance universe for the five-year and three-year periods ended December 31, 2015, respectively. On January 13, 2012, the Fund acquired the assets and assumed the liabilities of TS&W/Claymore Tax-Advantaged Balanced Fund (the “Predecessor Fund”), a closed-end fund which used different investment strategies and had different investment advisers. Class A shares of the Fund have assumed the performance, financial and other historical information of the Predecessor Fund’s common shares and the performance of Class A shares of the Fund reflects the performance of the Predecessor Fund. In light of the foregoing, the Committee took into account more recent periods and noted that Fund’s Class A shares ranked in the fourth quartile for the one-year period ended December 31, 2015, and outperformed the performance universe median for the three-month period ended December 31, 2015, ranking in the 39th percentile. In considering the Fund’s performance for the one-year period, the Committee considered Guggenheim’s explanation that the Fund is managed very conservatively and the portfolio management team opted to maintain short duration by allocating to floating rate securities, which was a drag on performance for the period as the Federal Reserve increased interest rates fewer times than had been expected by the team. In light of all the facts and circumstances, the Committee concluded that the investment performance of the Fund and the Sub-Adviser was acceptable.
Comparative Fees, Costs of Services Provided and the Profits Realized by the Sub-Adviser from Its Relationship with the Fund: The Committee reviewed the level of sub-advisory fees payable to GPIM, noting that the fees are paid by Security Investors and do not impact the fees paid by the Fund.
Economies of Scale: The Committee recognized that, because the Sub-Adviser’s fees are paid by the Adviser and not the Fund, the analysis of economies of scale was more appropriate in the context of the Committee’s consideration of the applicable Advisory Agreement, which was separately considered. (See “Advisory Agreements – Economies of Scale” above.)
Overall Conclusions
Based on the foregoing, the Committee determined that the investment advisory fees are fair and reasonable in light of the extent and quality of the services provided and other benefits received and that the continuation of the Agreements is in the best interest of each Fund. In reaching this conclusion, no single factor was determinative or conclusive and each Committee member, in the exercise of his business judgment, may attribute different weights to different factors. At the May Meeting, the Committee, constituting all of the Independent Trustees, recommended the renewal of each Advisory Agreement and the Sub-Advisory Agreement for an additional annual term.
| | THE GUGGENHEIM FUNDS ANNUAL REPORT | 43 |
INFORMATION ON BOARD OF TRUSTEES AND OFFICERS (Unaudited) |
Name, Address* and Year of Birth | Position(s) Held with the Trust | Term of Office and Length of Time Served** | Principal Occupation(s) During Past Five Years | Number of Portfolios in Fund Complex Overseen | Other Directorships Held by Trustees |
INDEPENDENT TRUSTEES | | | |
Randall C. Barnes (1951) | Trustee | Since 2014 | Current: Private Investor (2001-present). Former: Senior Vice President and Treasurer, PepsiCo, Inc. (1993-1997); President, Pizza Hut International (1991-1993); Senior Vice President, Strategic Planning and New Business Development, PepsiCo, Inc. (1987-1990). | 101 | Current: Trustee, Purpose Investments Inc. (2014-Present). |
Donald A.
Chubb, Jr. (1946) | Trustee | Since 1994 | Current: Business broker and manager of commercial real estate, Griffith & Blair, Inc. (1997-present). | 97 | Current: Midland Care, Inc. (2011-present). |
Jerry B. Farley (1946) | Trustee | Since 2005 | Current: President, Washburn University (1997-present). | 97 | Current: Westar Energy, Inc. (2004-present); CoreFirst Bank & Trust (2000-present). |
44 | THE GUGGENHEIM FUNDS ANNUAL REPORT | |
INFORMATION ON BOARD OF TRUSTEES AND OFFICERS (Unaudited)(continued) |
Name, Address* and Year of Birth | Position(s) Held with the Trust | Term of Office and Length of Time Served** | Principal Occupation(s) During Past Five Years | Number of Portfolios in Fund Complex Overseen | Other Directorships Held by Trustees |
INDEPENDENT TRUSTEES - continued | | |
Roman
Friedrich III (1946) | Trustee | Since 2014 | Current: Founder and Managing Partner, Roman Friedrich & Company (1998-present). Former: Senior Managing Director, MLV & Co. LLC (2010-2011). | 97 | Current: Zincore Metals, Inc. (2009-present). Former: Axiom Gold and Silver Corp. (2011-2012). |
Robert B. Karn III (1942) | Trustee and Chairman of the Audit Committee | Since 2014 | Current: Consultant (1998-present). Former: Arthur Andersen (1965-1997) and Managing Partner, Financial and Economic Consulting, St. Louis office (1987-1997). | 97 | Current: Peabody Energy Company (2003-present); GP Natural Resource Partners, LLC (2002-present). |
Ronald A. Nyberg (1953) | Trustee and Chairman of the Nominating and Governance Committee | Since 2014 | Current: Partner, Momkus McCluskey Roberts, LLC (2016-present). Former: Partner, Nyberg & Cassioppi, LLC (2000-2016); Executive Vice President, General Counsel, and Corporate Secretary, Van Kampen Investments (1982-1999). | 103 | Current: Edward-Elmhurst Healthcare System (2012-present). |
| | THE GUGGENHEIM FUNDS ANNUAL REPORT | 45 |
INFORMATION ON BOARD OF TRUSTEES AND OFFICERS (Unaudited)(continued) |
Name, Address* and Year of Birth | Position(s) Held with the Trust | Term of Office and Length of Time Served** | Principal Occupation(s) During Past Five Years | Number of Portfolios in Fund Complex Overseen | Other Directorships Held by Trustees |
INDEPENDENT TRUSTEES - concluded | | |
Maynard F. Oliverius (1943) | Trustee | Since 1998 | Current: Retired. Former: President and CEO, Stormont-Vail HealthCare (1996-2012). | 97 | Current: Fort Hays State University Foundation (1999-present); Stormont-Vail Foundation (2013-present); University of Minnesota Healthcare Association Foundation Committee (2009-present). Former: Topeka Community Foundation (2009-2014). |
Ronald E.
Toupin, Jr. (1958) | Trustee and Chairman of the Board | Since 2014 | Current: Portfolio Consultant (2010-present). Former: Vice President, Manager and Portfolio Manager, Nuveen Asset Management (1998-1999); Vice President, Nuveen Investment Advisory Corp. (1992-1999); Vice President and Manager, Nuveen Unit Investment Trusts (1991-1999); and Assistant Vice President and Portfolio Manager, Nuveen Unit Investment Trusts (1988-1999), each of John Nuveen & Co., Inc. (1982-1999). | 100 | Former: Bennett Group of Funds (2011-2013). |
46 | THE GUGGENHEIM FUNDS ANNUAL REPORT | |
INFORMATION ON BOARD OF TRUSTEES AND OFFICERS (Unaudited)(continued) |
Name, Address* and Year of Birth | Position(s) Held with the Trust | Term of Office and Length of Time Served** | Principal Occupation(s) During Past Five Years | Number of Portfolios in Fund Complex Overseen | Other Directorships Held by Trustees |
INTERESTED TRUSTEE | |
Donald C. Cacciapaglia*** (1951) | President, Chief Executive Officer and Trustee | Since 2012 | Current: President and CEO, certain other funds in the Fund Complex (2012-present); Vice Chairman, Guggenheim Investments (2010-present). Former: Chairman and CEO, Channel Capital Group, Inc. (2002-2010). | 232 | Current: Clear Spring Life Insurance Company (2015-present); Guggenheim Partners Japan, Ltd. (2014-present); Guggenheim Partners Investment Management Holdings, LLC (2014-present); Delaware Life (2013-present); Guggenheim Life and Annuity Company (2011-present); Paragon Life Insurance Company of Indiana (2011-present). |
* | The business address of each Trustee is c/o Guggenheim Investments, 227 West Monroe Street, Chicago, Illinois 60606. |
** | Each Trustee serves an indefinite term, until his successor is elected and qualified. Time served includes time served in the respective position for the Predecessor Corporation. |
*** | This Trustee is deemed to be an “interested person” of the Funds under the 1940 Act by reason of his position with the Funds’ Investment Manager and/or the parent of the Investment Manager. |
| | THE GUGGENHEIM FUNDS ANNUAL REPORT | 47 |
INFORMATION ON BOARD OF TRUSTEES AND OFFICERS (Unaudited)(continued) |
Name, Address* and Year of Birth | Position(s) Held with the Trust | Term of Office and Length of Time Served** | Principal Occupations
During Past Five Years |
OFFICERS | | | |
William H.
Belden, III (1965) | Vice President | Since 2014 | Current: Vice President, certain other funds in the Fund Complex (2006-present); Managing Director, Guggenheim Funds Investment Advisors, LLC (2005-present). Former: Vice President of Management, Northern Trust Global Investments (1999-2005). |
Joanna M.
Catalucci (1966) | AML Officer | Since 2016 | Current: Chief Compliance Officer, certain funds in the Fund Complex (2012-present); Senior Managing Director, Guggenheim Investments (2012-present); AML Officer, certain funds in the Fund Complex (2016-present). Former: Chief Compliance Officer and Secretary, certain other funds in the Fund Complex (2008-2012); Senior Vice President & Chief Compliance Officer, Security Investors, LLC and certain affiliates (2010-2012); Chief Compliance Officer and Senior Vice President, Rydex Advisors, LLC and certain affiliates (2010-2011). |
James M. Howley (1972) | Assistant Treasurer | Since 2014 | Current: Director, Guggenheim Investments (2004-present) ; Assistant Treasurer, certain other funds in the Fund Complex (2006-present). Former: Manager, Mutual Fund Administration of Van Kampen Investments, Inc. (1996-2004). |
Keith D. Kemp (1960) | Assistant Treasurer | Since 2016 | Current: Managing Director of Transparent Value, LLC (2015-present); Managing Director of Guggenheim Investments (2015-present). Former: Director, Transparent Value, LLC (2010-2015); Director, Guggenheim Investments (2010-2015); Chief Operating Officer, Macquarie Capital Investment Management (2007-2009). |
Amy J. Lee (1961) | Vice President and Chief Legal Officer | Since 2007 (Vice President) Since 2014 (Chief Legal Officer) | Current: Chief Legal Officer, certain other funds in the Fund Complex (2013-present); Senior Managing Director, Guggenheim Investments (2012-present). Former: Vice President, Associate General Counsel and Assistant Secretary, Security Benefit Life Insurance Company and Security Benefit Corporation (2004-2012). |
48 | THE GUGGENHEIM FUNDS ANNUAL REPORT | |
INFORMATION ON BOARD OF TRUSTEES AND OFFICERS (Unaudited)(continued) |
Name, Address* and Year of Birth | Position(s) Held with the Trust | Term of Office and Length of Time Served** | Principal Occupations
During Past Five Years |
OFFICERS - continued | |
Mark E. Mathiasen (1978) | Secretary | Since 2014 | Current: Secretary, certain other funds in the Fund Complex (2007-present); Managing Director, Guggenheim Investments (2007-present). |
Glenn McWhinnie (1969) | Assistant Treasurer | Since 2016 | Current: Vice President, Guggenheim Investments (2009-present). Former: Tax Compliance Manager, Ernst & Young LLP (1996-2009). |
Michael P. Megaris (1984) | Assistant Secretary | Since 2014 | Current: Assistant Secretary, certain other funds in the Fund Complex (2014-present); Vice President, Guggenheim Investments (2012-present). Former: J.D., University of Kansas School of Law (2009-2012). |
Elisabeth Miller (1968) | Chief Compliance Officer | Since 2012 | Current: CCO, certain other funds in the Fund Complex (2012-present); CCO, Security Investors, LLC (2012-present); CCO, Guggenheim Funds Investment Advisors, LLC (2012-present); Managing Director, Guggenheim Investments (2012-present); Vice President, Guggenheim Funds Distributors, LLC (2014-present). Former: CCO, Guggenheim Distributors, LLC (2009-2014); Senior Manager, Security Investors, LLC (2004-2009); Senior Manager, Guggenheim Distributors, LLC (2004-2009). |
Adam J. Nelson (1979) | Assistant Treasurer | Since 2015 | Current: Vice President, Guggenheim Investments (2015-present); Assistant Treasurer, certain other funds in the Fund Complex (2015-present). Former: Assistant Vice President and Fund Administration Director, State Street Corporation (2013-2015); Fund Administration Assistant Director, State Street (2011-2013); Fund Administration Manager, State Street (2009-2011). |
| | THE GUGGENHEIM FUNDS ANNUAL REPORT | 49 |
INFORMATION ON BOARD OF TRUSTEES AND OFFICERS (Unaudited)(concluded) |
Name, Address* and Year of Birth | Position(s) Held with the Trust | Term of Office and Length of Time Served** | Principal Occupations
During Past Five Years |
OFFICERS - concluded | |
Kimberly J. Scott (1974) | Assistant Treasurer | Since 2014 | Current: Vice President, Guggenheim Investments (2012-present) ; Assistant Treasurer, certain other funds in the Fund Complex (2012-present). Former: Financial Reporting Manager, Invesco, Ltd. (2010-2011); Vice President/Assistant Treasurer, Mutual Fund Administration for Van Kampen Investments, Inc./Morgan Stanley Investment Management (2009-2010); Manager of Mutual Fund Administration, Van Kampen Investments, Inc./Morgan Stanley Investment Management (2005-2009). |
Bryan Stone (1979) | Vice President | Since 2014 | Current: Vice President, certain other funds in the Fund Complex (2014-present); Director, Guggenheim Investments (2013-present). Former: Senior Vice President, Neuberger Berman Group LLC (2009-2013); Vice President, Morgan Stanley (2002-2009). |
John L. Sullivan (1955) | Chief Financial Officer and Treasurer | Since 2014 | Current: CFO, Chief Accounting Officer and Treasurer, certain other funds in the Fund Complex (2010-present); Senior Managing Director, Guggenheim Investments (2010-present). Former: Managing Director and CCO, each of the funds in the Van Kampen Investments fund complex (2004-2010); Managing Director and Head of Fund Accounting and Administration, Morgan Stanley Investment Management (2002-2004); CFO and Treasurer, Van Kampen Funds (1996-2004). |
* | The business address of each officer is c/o Guggenheim Investments, 227 West Monroe Street, Chicago, Illinois 60606. |
** | Each officer serves an indefinite term, until his or her successor is duly elected and qualified. Time served includes time served in the respective position for the Predecessor Corporation. |
50 | THE GUGGENHEIM FUNDS ANNUAL REPORT | |
GUGGENHEIM INVESTMENTS PRIVACY POLICIES |
Guggenheim Investments as used herein refers to Guggenheim Partners, LLC, Guggenheim Funds Investment Advisors, LLC, Guggenheim Partners Investment Management, LLC, Guggenheim Funds Distributors, LLC and Security Investors, LLC as well as the funds in the Guggenheim Funds complex (the “funds”).
Our Commitment to You
When you become a Guggenheim Investments investor, you entrust us with not only your hard-earned money but also with personal and financial information about you. We recognize that your relationship with us is based on trust and that you expect us to act responsibly and in your best interests. Because we have access to personal information about you, we hold ourselves to high standards in its safekeeping and use. This means, most importantly, that we do not sell client or account information to anyone—whether you are a current or former Guggenheim Investments client.
The Information We Collect About You and How We Collect It
In the course of doing business with shareholders and investors, we collect nonpublic personal information about you. You typically provide personal information when you complete a Guggenheim Investments account application or when you request a transaction that involves Rydex and Guggenheim Funds or one of the Guggenheim affiliated companies. “Nonpublic personal information” is personally identifiable information about you. For example it includes your name and address, Social Security or taxpayer identification number, assets, income, account balance, bank account information and investment activity (e.g. purchase and redemption history).
How We Share Your Personal Information
As a matter of policy, we do not disclose your nonpublic personal information to nonaffiliated third parties except as required or permitted by law. As emphasized above, we do not sell information about current or former clients or their accounts to third parties. Nor do we share such information, except when necessary to complete transactions at your request or to make you aware of related investment products and services that we offer. Additional details about how we handle your personal information are provided below.
To complete certain transactions or account changes that you direct, it may be necessary to provide your personal information to companies, individuals or groups that are not affiliated with Guggenheim Investments. For example if you ask to transfer assets from another financial institution to Guggenheim Investments, we will need to provide certain information about you to that company to complete the transaction. In connection with servicing your accounts or to alert you to other Guggenheim Investments investment products and services, we may share your information within the Guggenheim Investments family of affiliated companies. This would include, for example, sharing your information within Guggenheim Investments so we can make you aware of new funds or the services offered through another Guggenheim Investments
| | THE GUGGENHEIM FUNDS ANNUAL REPORT | 51 |
GUGGENHEIM INVESTMENTS PRIVACY POLICIES (Unaudited)(concluded) |
affiliated company. In certain instances, we may contract with nonaffiliated companies to perform services for us. Where necessary, we will disclose information we have about you to these third parties. In all such cases, we provide the third party with only the information necessary to carry out its assigned responsibilities and only for that purpose. And we require these third parties to treat your personal information with the same high degree of confidentiality that we do. In certain instances, we may share information with other financial institutions regarding individuals and entities in response to the U.S.A. Patriot Act. Finally we will share personal information about you if we are compelled by law to do so, if you direct us to do so with your consent, or in other circumstances as permitted by law.
How We Safeguard Your Personal Information
We maintain physical, electronic and procedural safeguards to protect your personal information. Within Guggenheim Investments, access to such information is limited to those who need it to perform their jobs such as servicing your account, resolving problems or informing you of new products and services.
52 | THE GUGGENHEIM FUNDS ANNUAL REPORT | |
This page intentionally left blank.
This page intentionally left blank.
This page intentionally left blank.
This page intentionally left blank.
This page intentionally left blank.
9.30.2016
Guggenheim Funds Annual Report
| |
Guggenheim Capital Stewardship Fund | | |
GuggenheimInvestments.com | CSF-ANN-0916x0917 |
DEAR SHAREHOLDER | 2 |
ECONOMIC AND MARKET OVERVIEW | 3 |
ABOUT SHAREHOLDERS’ FUND EXPENSES | 4 |
CAPITAL STEWARDSHIP FUND | 6 |
NOTES TO FINANCIAL STATEMENTS | 14 |
REPORT OF INDEPENDENT REGISTERED PUBLIC ACCOUNTING FIRM | 19 |
OTHER INFORMATION | 20 |
INFORMATION ON BOARD OF TRUSTEES AND OFFICERS | 26 |
GUGGENHEIM INVESTMENTS PRIVACY POLICIES | 30 |
| | THE GUGGENHEIM FUNDS ANNUAL REPORT | 1 |
Dear Shareholder:
Guggenheim Partners Investment Management, LLC (“GPIM” or the “Investment Adviser”) is pleased to present the annual shareholder report for the Guggenheim Capital Stewardship Fund (the “Fund”). The report covers the annual fiscal period ended September 30, 2016.
Concinnity Advisors, LP serves as the Fund’s sub-adviser (the “Sub-Adviser”).
The Investment Adviser is part of Guggenheim Investments, which represents the investment management businesses of Guggenheim Partners, LLC, (“Guggenheim”), a global, diversified financial services firm.
Guggenheim Funds Distributors, LLC is the distributor of the Funds. Guggenheim Funds Distributors, LLC is affiliated with Guggenheim and the Investment Adviser.
We encourage you to read the Economic and Market Overview section of the report, which follows this letter, and then the Managers’ Commentary on the Fund.
We are committed to providing innovative investment solutions and appreciate the trust you place in us.
Sincerely,
Donald C. Cacciapaglia
President and Chief Executive Officer
October 31, 2016
Read a prospectus and summary prospectus (if available) carefully before investing. It contains the investment objectives, risks, charges, expenses and other information, which should be considered carefully before investing. Obtain a prospectus and summary prospectus (if available) at guggenheiminvestments.com or call 800.820.0888.
There can be no assurance that any investment product will achieve its investment objective(s). There are risks associated with investing, including the entire loss of principal invested. Investing involves market risks. The investment return and principal value of any investment product will fluctuate with changes in market conditions. Please read the prospectus for more detailed information regarding these and other risks.
2 | THE GUGGENHEIM FUNDS ANNUAL REPORT | |
ECONOMIC AND MARKET OVERVIEW (Unaudited) | September 30, 2016 |
Economic growth continues to rebound, even though the rise in U.S. Gross Domestic Product (“GDP”) disappointed in the first half of 2016. There was a large headwind from inventory drawdowns, which should soon reverse after five quarters of dragging on growth. Real GDP growth is expected to be around 2.5 percent in the second half of the year, driven by consumption, housing, and a fading trade drag, and supporting the view that U.S. economic growth remains resilient to global weakness.
The euro zone economy is slowly improving, but inflation will likely persist well below the European Central Bank’s (“ECB”) target in the coming quarters due to substantial slack. The ECB has indicated that more quantitative easing is possible, but will soon need to alter the quantitative easing program in order to keep up their purchase pace. Both China and Japan need weaker currencies. Chinese growth and capital flows have stabilized for now, but surging construction and a credit boom raise the prospect of future instability. Japan’s economic prospects are weak, and inflation remains far from the Bank of Japan’s (“BOJ”) target. The surging yen could drive further policy easing, including an increase in fiscal stimulus.
It appears the U.S. Federal Reserve (the “Fed”) will move forward with raising rates in December, absent any economic or geopolitical surprise or a meaningful tightening of financial conditions over the fourth quarter. But key events could influence risk asset performance for the balance of the year: A continued recovery in oil prices following the Organization of Petroleum Exporting Countries (“OPEC”) agreement to keep production between 32.5 to 33 million barrels per day would help sustain the rally (although we are skeptical that they will adhere to any quota based on historical production levels). Global oil inventories remain high, but supply and demand are moving toward balance. A rebound in GDP growth would also lift U.S. equity and corporate bond prices higher.
The macroeconomic picture remains the same; we are not on the verge of a recession. But despite our positive outlook on the U.S. economy, valuations across risk assets argue for caution. Ongoing accommodation from central bankers across the globe has alleviated much of the initial macroeconomic tail risk posed by Brexit but may not be enough to dampen the seasonal volatility typically observed in the fourth quarter. Ongoing troubles in the banking sector, such as the woes afflicting Deutsche Bank and Wells Fargo, coupled with uncertainty surrounding upcoming political events, which include the new Trump administration, the Italian constitutional referendum, and key European elections, may create volatility for risk assets for the balance of the year.
For the 12 months ended September 30, 2016, the Standard & Poor’s 500® (“S&P 500®”) Index* returned 15.43%. The MSCI Europe-Australasia-Far East (“EAFE”) Index* returned 6.52%. The return of the MSCI Emerging Markets Index* was 16.78%.
In the bond market, the Bloomberg Barclays U.S. Aggregate Bond Index* posted a 5.19% return for the period, while the Bloomberg Barclays U.S. Corporate High Yield Index* returned 12.73%. The return of the Bank of America (“BofA”) Merrill Lynch 3-Month U.S. Treasury Bill Index* was 0.28% for the 12-month period.
The opinions and forecasts expressed may not actually come to pass. This information is subject to change at any time, based on market and other conditions, and should not be construed as a recommendation of any specific security or strategy.
*Index Definitions:
The following indices are referenced throughout this report.Indices are unmanaged and not available for direct investment. Index performance does not reflect transaction costs, fees, or expenses.
Bloomberg Barclays U.S. Aggregate Bond Index is a broad-based flagship benchmark that measures the investment grade, U.S. dollar-denominated, fixed-rate taxable bond market, including U.S. Treasuries, government-related and corporate securities, mortgage-backed securities or “MBS” (agency fixed-rate and hybrid adjustable-rate mortgage, or “ARM”, pass-throughs), asset-backed securities (“ABS”), and commercial mortgage-backed securities (“CMBS”) (agency and non-agency).
Bloomberg Barclays U.S. Corporate High Yield Index measures the U.S. dollar-denominated, high yield, fixed-rate corporate bond market. Securities are classified as high yield if the middle rating of Moody’s, Fitch, and S&P is Ba1/BB +/BB + or below.
BofA Merrill Lynch 3-Month U.S. Treasury Bill Index is an unmanaged market Index of U.S. Treasury securities maturing in 90 days that assumes reinvestment of all income.
MSCI EAFE Index is a capitalization-weighted measure of stock markets in Europe, Australasia, and the Far East.
MSCI Emerging Markets Index is a free float-adjusted market capitalization-weighted index that is designed to measure equity market performance in the global emerging markets.
S&P 500® Index is a broad-based index, the performance of which is based on the performance of 500 widely held common stocks chosen for market size, liquidity, and industry group representation.
| | THE GUGGENHEIM FUNDS ANNUAL REPORT | 3 |
ABOUT SHAREHOLDERS’ FUND EXPENSES (Unaudited) | |
All mutual funds have operating expenses, and it is important for our shareholders to understand the impact of costs on their investments. Shareholders of a fund incur two types of costs: (i) transaction costs, including sales charges (loads) on purchase payments, reinvested dividends, other distributions, and exchange fees, and (ii) ongoing costs, including management fees, administrative services, and shareholder reports, among others. These ongoing costs, or operating expenses, are deducted from a fund’s gross income and reduce the investment return of the fund.
A fund’s expenses are expressed as a percentage of its average net assets, which is known as the expense ratio. The following examples are intended to help investors understand the ongoing costs (in dollars) of investing in a fund and to compare these costs with the ongoing costs of investing in other mutual funds.
The examples are based on an investment of $1,000 made at the beginning of the period and held for the entire six-month period beginning March 31, 2016 and ending September 30, 2016.
The following tables illustrate the Fund’s costs in two ways:
Table 1. Based on actual Fund return: This section helps investors estimate the actual expenses paid over the period. The “Ending Account Value” shown is derived from the Fund’s actual return, and the fifth column shows the dollar amount that would have been paid by an investor who started with $1,000 in the Fund. Investors may use the information here, together with the amount invested, to estimate the expenses paid over the period. Simply divide the Fund’s account value by $1,000 (for example, an $8,600 account value divided by $1,000 = 8.6), then multiply the result by the number provided under the heading “Expenses Paid During Period.”
Table 2. Based on hypothetical 5% return: This section is intended to help investors compare a Fund’s cost with those of other mutual funds. The table provides information about hypothetical account values and hypothetical expenses based on the Fund’s actual expense ratio and an assumed rate of return of 5% per year before expenses, which is not the Fund’s actual return. The hypothetical account values and expenses may not be used to estimate the actual ending account balance or expenses paid during the period. The example is useful in making comparisons because the U.S. Securities and Exchange Commission (the “SEC”) requires all mutual funds to calculate expenses based on the 5% return. Investors can assess a Fund’s costs by comparing this hypothetical example with the hypothetical examples that appear in shareholder reports of other funds.
The calculations illustrated above assume no shares were bought or sold during the period. Actual costs may have been higher or lower, depending on the amount of investment and the timing of any purchases or redemptions.
Please note that the expenses shown in the table are meant to highlight your ongoing costs only and do not reflect any transactional costs, such as sales charges (loads) on purchase payments, and contingent deferred sales charges (“CDSC”) on redemptions, if any. Therefore, the second table is useful in comparing ongoing costs only, and will not help you determine the relative total costs of owning different funds. In addition, if these transactional costs were included, your costs would have been higher.
More information about the Fund’s expenses, including annual expense ratios for periods up to five years (subject to the Fund’s inception date), can be found in the Financial Highlights section of this report. For additional information on operating expenses and other shareholder costs, please refer to the Fund’s prospectus.
4 | THE GUGGENHEIM FUNDS ANNUAL REPORT | |
ABOUT SHAREHOLDERS’ FUND EXPENSES (Unaudited)(concluded) | |
| | Expense
Ratio1 | Fund
Return | Beginning
Account Value
March 31, 2016 | Ending
Account Value
September 30, 2016 | Expenses
Paid During
Period2 |
Table 1. Based on actual Fund return3 | | | | | |
Capital Stewardship Fund | | | | | |
Institutional Class | 1.05% | 4.08% | $ 1,000.00 | $ 1,040.80 | $ 5.37 |
| |
Table 2. Based on hypothetical 5% return (before expenses) | | | | |
Capital Stewardship Fund | | | | | |
Institutional Class | 1.05% | 5.00% | $ 1,000.00 | $ 1,019.80 | $ 5.32 |
1 | Annualized and excludes expenses of the underlying funds in which the Fund invests. |
2 | Expenses are equal to the Fund's annualized expense ratio, net of any applicable fee waivers, multiplied by the average account value over the period, multiplied by 183/365 (to reflect the one-half year period). |
3 | Actual cumulative return at net asset value for the period March 31, 2016 to September 30, 2016. |
| | THE GUGGENHEIM FUNDS ANNUAL REPORT | 5 |
MANAGER’S COMMENTARY (Unaudited) | September 30, 2016 |
To Our Shareholders
Guggenheim Capital Stewardship Fund (the “Fund”) is managed by a team of seasoned professionals led by B. Scott Minerd, Chairman of Investments and Global Chief Investment Officer and Portfolio Manager; Farhan Sharaff, Assistant Chief Investment Officer, Equities, and Portfolio Manager; Jayson Flowers, Senior Managing Director and Head of Equity and Derivative Strategies, and Portfolio Manager; Scott Hammond, Managing Director and Portfolio Manager; Qi Yan, Managing Director and Portfolio Manager; and Peter Derby, Portfolio Manager at Concinnity Partners, LP, an unaffiliated Sub-adviser (the “Sub-adviser”) to the Fund. The following paragraphs discuss the Fund for the fiscal year ended September 30, 2016.
For the year ended September 30, 2016, Guggenheim Capital Stewardship Fund Institutional Shares returned 15.30%, compared with the 15.43% return of its benchmark, the S&P 500 Index.
Strategy Overview
The Fund’s investment objective is to seek long-term capital appreciation. It pursues its investment objective by investing in equity securities that the Fund believes will provide attractive long-term returns relative to the S&P 500 Index. Guggenheim Partners Investment Management, LLC, the Fund’s adviser (the “Investment Adviser or Manager”), and Concinnity Advisors, LP, the Fund’s sub-adviser (the “Sub-Adviser”), believe that companies that successfully implement multi-stakeholder management systems are generally better positioned to create sustained long-term value for their shareholders than competing companies that do not implement such systems. The Investment Adviser and Sub-Adviser believe that companies implementing such systems do so by aligning the interests of all of a company’s core stakeholders, including investors, customers, employees, business partners, and communities in which a company does business.
To identify an initial universe of companies that it believes have exemplary multi-stakeholder management systems, the Sub-Adviser uses its proprietary research methodology system, which seeks to identify the components of those management systems, including, but not limited to: (1) customer loyalty; (2) employee engagement, as demonstrated by high levels of loyalty; (3) efficient use of “intangible” assets; and (4) high supplier loyalty, as demonstrated by the maturity of supply chain activities and (5) community engagement.
Performance Review
The Fund on a net basis underperformed its benchmark by 0.13% for the fiscal year ended on September 30, 2016.
Positive contributors to this result were (+0.24%) from active security selection and (+0.88%) from active sector allocation. Offsetting it were Fund-related expenses (-1.12%) including management fees and implementation shortfalls that were primarily driven by portfolio rebalances (-0.12%).
Security selection impacts were mainly driven by securities from the following sectors: Materials (+0.61%), Information Technology (+0.54%), Health Care (+0.51%), Industrials (-0.80%), Consumer Discretionary (-0.37%), and Consumer Staples (-0.20%).
The top individual contributors to return were Microsoft Corp., Chevron Corp., and AT&T, Inc. The top individual detractors were Gilead Sciences, Inc., Bristol-Myers Squibb, and Marathon Oil Corp.
Throughout the period, underweighting the Financials sector, while overweighting the Consumer Staples sector, positively impacted the Fund by (+0.53%) and (+0.49%) respectively. Offsetting this was underweights in Energy (-0.26%), Materials (-0.20%), Information Technology (-0.12%) and Real Estate (-0.13%), combined with an overweight in Telecommunications Services (-0.14%).
Performance displayed represents past performance which is no guarantee of future results.
The opinions and forecast expressed may not actually come to pass. This information is subject to change at any time, based on market and other conditions, and should not be construed as a recommendation of any specific security or strategy.
6 | THE GUGGENHEIM FUNDS ANNUAL REPORT | |
PERFORMANCE REPORT AND FUND PROFILE (Unaudited) | September 30, 2016 |
GUGGENHEIM CAPITAL STEWARDSHIP FUND
Holdings Diversification (Market Exposure as % of Net Assets)
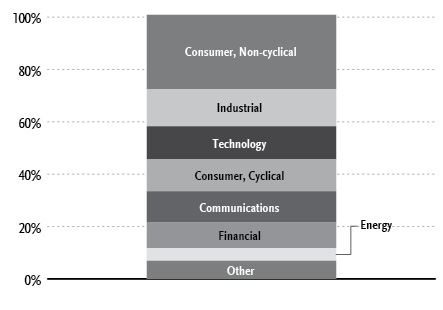
“Holdings Diversification (Market Exposure as % of Net Assets)” excludes any temporary cash investments.
Cumulative Fund Performance*
Inception Date: September 26, 2014 |
Ten Largest Holdings (% of Total Net Assets) |
AT&T, Inc. | 2.8% |
Alphabet, Inc. — Class A | 2.7% |
Apple, Inc. | 2.7% |
Johnson & Johnson | 2.7% |
Intel Corp. | 2.5% |
Verizon Communications, Inc. | 2.1% |
Waste Management, Inc. | 1.5% |
United Parcel Service, Inc. — Class B | 1.5% |
3M Co. | 1.4% |
Automatic Data Processing, Inc. | 1.3% |
Top Ten Total | 21.2% |
| | |
“Ten Largest Holdings” excludes any temporary cash investments. |
Average Annual Returns*
Periods Ended September 30, 2016
| | 1 Year | Since Inception
(09/26/14) |
Guggenheim Capital Stewardship Fund | 15.30% | 4.66% |
S&P 500 Index | 15.43% | 6.79% |
* | The performance data above represents past performance that is not predictive of future results. The investment return and principal value of an investment in the Fund will fluctuate so that an investor’s shares, when redeemed, may be worth more or less than their original cost. Returns are historical and include changes in principal and reinvested dividends and capital gains and do not reflect the effect of taxes. The S&P 500 Index is an unmanaged index and, unlike the Fund, has no management fees or operating expenses to reduce its reported return. |
| | THE GUGGENHEIM FUNDS ANNUAL REPORT | 7 |
SCHEDULE OF INVESTMENTS | September 30, 2016 |
CAPITAL STEWARDSHIP FUND | |
| | | Shares | | | Value | |
| | | | | | | |
COMMON STOCKS† - 100.3% | |
| | | | | | | |
Consumer, Non-cyclical - 28.3% | |
Johnson & Johnson | | | 47,063 | | | $ | 5,559,553 | |
Automatic Data Processing, Inc. | | | 30,872 | | | | 2,722,910 | |
Pfizer, Inc. | | | 79,051 | | | | 2,677,457 | |
Colgate-Palmolive Co. | | | 34,739 | | | | 2,575,549 | |
Eli Lilly & Co. | | | 30,554 | | | | 2,452,264 | |
PepsiCo, Inc. | | | 22,328 | | | | 2,428,617 | |
Gilead Sciences, Inc. | | | 27,323 | | | | 2,161,796 | |
Kimberly-Clark Corp. | | | 16,860 | | | | 2,126,721 | |
AbbVie, Inc. | | | 33,638 | | | | 2,121,549 | |
Merck & Company, Inc. | | | 32,299 | | | | 2,015,781 | |
Amgen, Inc. | | | 11,922 | | | | 1,988,709 | |
Procter & Gamble Co. | | | 21,960 | | | | 1,970,910 | |
Bristol-Myers Squibb Co. | | | 36,288 | | | | 1,956,649 | |
Danaher Corp. | | | 23,370 | | | | 1,831,974 | |
Cardinal Health, Inc. | | | 21,247 | | | | 1,650,892 | |
Kroger Co. | | | 55,593 | | | | 1,650,000 | |
ManpowerGroup, Inc. | | | 21,865 | | | | 1,579,965 | |
Biogen, Inc.* | | | 4,955 | | | | 1,551,064 | |
Medtronic plc | | | 17,441 | | | | 1,506,902 | |
Hershey Co. | | | 14,616 | | | | 1,397,290 | |
Allergan plc* | | | 5,839 | | | | 1,344,780 | |
DaVita, Inc.* | | | 19,799 | | | | 1,308,120 | |
Clorox Co. | | | 10,034 | | | | 1,256,056 | |
Celgene Corp.* | | | 11,831 | | | | 1,236,694 | |
Morningstar, Inc. | | | 15,537 | | | | 1,231,618 | |
RR Donnelley & Sons Co. | | | 73,532 | | | | 1,155,923 | |
JM Smucker Co. | | | 6,147 | | | | 833,164 | |
General Mills, Inc. | | | 12,913 | | | | 824,882 | |
Becton Dickinson and Co. | | | 3,890 | | | | 699,150 | |
Agios Pharmaceuticals, Inc.* | | | 12,602 | | | | 665,638 | |
Quest Diagnostics, Inc. | | | 7,371 | | | | 623,808 | |
Whole Foods Market, Inc. | | | 20,106 | | | | 570,005 | |
Kellogg Co. | | | 7,048 | | | | 546,009 | |
Coca-Cola Co. | | | 12,255 | | | | 518,632 | |
Campbell Soup Co. | | | 9,349 | | | | 511,390 | |
Dr Pepper Snapple Group, Inc. | | | 4,985 | | | | 455,180 | |
Thermo Fisher Scientific, Inc. | | | 2,542 | | | | 404,331 | |
Stryker Corp. | | | 3,345 | | | | 389,391 | |
CR Bard, Inc. | | | 1,438 | | | | 322,515 | |
Abbott Laboratories | | | 7,367 | | | | 311,550 | |
Anthem, Inc. | | | 1,800 | | | | 225,558 | |
Total Consumer, Non-cyclical | | | | | | | 59,360,946 | |
| | | | | | | | | |
Industrial - 14.2% | |
Waste Management, Inc. | | | 49,236 | | | | 3,139,287 | |
United Parcel Service, Inc. — Class B | | | 28,269 | | | | 3,091,498 | |
3M Co. | | | 16,749 | | | | 2,951,676 | |
Raytheon Co. | | | 16,257 | | | | 2,213,065 | |
FedEx Corp. | | | 10,699 | | | | 1,868,901 | |
Fluor Corp. | | | 31,396 | | | | 1,611,243 | |
Boeing Co. | | | 12,053 | | | | 1,587,862 | |
CSX Corp. | | | 45,849 | | | | 1,398,395 | |
Stericycle, Inc.* | | | 16,238 | | | | 1,301,313 | |
Rockwell Collins, Inc. | | | 14,414 | | | | 1,215,677 | |
Honeywell International, Inc. | | | 9,618 | | | | 1,121,363 | |
J.B. Hunt Transport Services, Inc. | | | 13,016 | | | | 1,056,118 | |
Sonoco Products Co. | | | 19,166 | | | | 1,012,540 | |
General Electric Co. | | | 32,850 | | | | 973,017 | |
Dover Corp. | | | 12,853 | | | | 946,495 | |
SunPower Corp. — Class A* | | | 104,762 | | | | 934,477 | |
Union Pacific Corp. | | | 7,659 | | | | 746,982 | |
Graco, Inc. | | | 8,145 | | | | 602,730 | |
Rockwell Automation, Inc. | | | 3,969 | | | | 485,567 | |
Caterpillar, Inc. | | | 3,763 | | | | 334,042 | |
Emerson Electric Co. | | | 6,121 | | | | 333,656 | |
Agilent Technologies, Inc. | | | 6,868 | | | | 323,414 | |
United Technologies Corp. | | | 3,050 | | | | 309,880 | |
Total Industrial | | | | | | | 29,559,198 | |
| | | | | | | | | |
Technology - 12.5% | |
Apple, Inc. | | | 49,374 | | | | 5,581,731 | |
Intel Corp. | | | 140,278 | | | | 5,295,495 | |
Microsoft Corp. | | | 45,676 | | | | 2,630,938 | |
Paychex, Inc. | | | 36,941 | | | | 2,137,776 | |
Intuit, Inc. | | | 14,532 | | | | 1,598,665 | |
Western Digital Corp. | | | 26,501 | | | | 1,549,514 | |
Teradata Corp.* | | | 35,708 | | | | 1,106,948 | |
Jack Henry & Associates, Inc. | | | 12,382 | | | | 1,059,280 | |
Cognizant Technology Solutions Corp. — Class A* | | | 19,053 | | | | 909,019 | |
Akamai Technologies, Inc.* | | | 15,418 | | | | 817,000 | |
Teradyne, Inc. | | | 37,073 | | | | 800,035 | |
Analog Devices, Inc. | | | 11,361 | | | | 732,216 | |
Oracle Corp. | | | 15,448 | | | | 606,797 | |
International Business Machines Corp. | | | 2,891 | | | | 459,235 | |
NetApp, Inc. | | | 10,653 | | | | 381,590 | |
salesforce.com, Inc.* | | | 4,876 | | | | 347,805 | |
Total Technology | | | | | | | 26,014,044 | |
| | | | | | | | | |
Consumer, Cyclical - 12.4% | |
McDonald’s Corp. | | | 21,349 | | | | 2,462,820 | |
Wal-Mart Stores, Inc. | | | 30,753 | | | | 2,217,906 | |
WW Grainger, Inc. | | | 9,262 | | | | 2,082,468 | |
CVS Health Corp. | | | 22,934 | | | | 2,040,897 | |
Ford Motor Co. | | | 145,944 | | | | 1,761,544 | |
Southwest Airlines Co. | | | 44,036 | | | | 1,712,561 | |
Alaska Air Group, Inc. | | | 21,397 | | | | 1,409,206 | |
Delta Air Lines, Inc. | | | 33,828 | | | | 1,331,470 | |
Home Depot, Inc. | | | 9,793 | | | | 1,260,163 | |
AutoZone, Inc.* | | | 1,480 | | | | 1,137,143 | |
Walgreens Boots Alliance, Inc. | | | 13,426 | | | | 1,082,404 | |
Lowe’s Companies, Inc. | | | 14,781 | | | | 1,067,336 | |
Choice Hotels International, Inc. | | | 21,760 | | | | 980,941 | |
Brinker International, Inc. | | | 19,340 | | | | 975,316 | |
Costco Wholesale Corp. | | | 6,006 | | | | 915,975 | |
Chipotle Mexican Grill, Inc. — Class A* | | | 2,149 | | | | 910,102 | |
BorgWarner, Inc. | | | 25,114 | | | | 883,511 | |
Michael Kors Holdings Ltd.* | | | 13,256 | | | | 620,248 | |
Best Buy Company, Inc. | | | 11,054 | | | | 422,042 | |
GameStop Corp. — Class A | | | 14,695 | | | | 405,435 | |
8 | THE GUGGENHEIM FUNDS ANNUAL REPORT | SEE NOTES TO FINANCIAL STATEMENTS. |
SCHEDULE OF INVESTMENTS (continued) | September 30, 2016 |
CAPITAL STEWARDSHIP FUND | |
| | | Shares | | | Value | |
| | | | | | | |
NIKE, Inc. — Class B | | | 4,669 | | | $ | 245,823 | |
Total Consumer, Cyclical | | | | | | | 25,925,311 | |
| | | | | | | | | |
Communications - 11.7% | |
AT&T, Inc. | | | 145,121 | | | | 5,893,363 | |
Alphabet, Inc. — Class A* | | | 6,961 | | | | 5,597,062 | |
Verizon Communications, Inc. | | | 84,064 | | | | 4,369,647 | |
Amazon.com, Inc.* | | | 2,321 | | | | 1,943,397 | |
Twitter, Inc.* | | | 76,662 | | | | 1,767,059 | |
Cisco Systems, Inc. | | | 44,826 | | | | 1,421,881 | |
Viacom, Inc. — Class B | | | 28,378 | | | | 1,081,202 | |
Telephone & Data Systems, Inc. | | | 27,536 | | | | 748,428 | |
News Corp. — Class A | | | 46,036 | | | | 643,583 | |
Walt Disney Co. | | | 5,800 | | | | 538,588 | |
Discovery Communications, Inc. — Class A* | | | 19,814 | | | | 533,393 | |
Total Communications | | | | | | | 24,537,603 | |
| | | | | | | | | |
Financial - 9.9% | |
AvalonBay Communities, Inc. | | | 11,998 | | | | 2,133,724 | |
T. Rowe Price Group, Inc. | | | 31,953 | | | | 2,124,875 | |
Berkshire Hathaway, Inc. — Class B* | | | 14,133 | | | | 2,041,795 | |
JPMorgan Chase & Co. | | | 28,105 | | | | 1,871,512 | |
Federal Realty Investment Trust | | | 12,102 | | | | 1,862,861 | |
Simon Property Group, Inc. | | | 8,164 | | | | 1,690,030 | |
M&T Bank Corp. | | | 11,151 | | | | 1,294,631 | |
KeyCorp | | | 101,957 | | | | 1,240,816 | |
Erie Indemnity Co. — Class A | | | 12,121 | | | | 1,237,190 | |
Aflac, Inc. | | | 15,959 | | | | 1,146,973 | |
Principal Financial Group, Inc. | | | 20,227 | | | | 1,041,893 | |
Wells Fargo & Co. | | | 21,557 | | | | 954,544 | |
Travelers Companies, Inc. | | | 6,300 | | | | 721,665 | |
American Financial Group, Inc. | | | 5,179 | | | | 388,425 | |
Goldman Sachs Group, Inc. | | | 2,160 | | | | 348,343 | |
Progressive Corp. | | | 9,866 | | | | 310,779 | |
U.S. Bancorp | | | 7,191 | | | | 308,422 | |
Total Financial | | | | | | | 20,718,478 | |
| | | | | | | | | |
Energy - 4.8% | |
Spectra Energy Corp. | | | 49,962 | | | | 2,135,876 | |
Chevron Corp. | | | 17,139 | | | | 1,763,946 | |
Phillips 66 | | | 13,992 | | | | 1,127,056 | |
ConocoPhillips | | | 24,971 | | | | 1,085,488 | |
Valero Energy Corp. | | | 20,102 | | | | 1,065,406 | |
Schlumberger Ltd. | | | 11,186 | | | | 879,667 | |
First Solar, Inc.* | | | 14,121 | | | | 557,638 | |
Marathon Oil Corp. | | | 22,167 | | | | 350,460 | |
Oceaneering International, Inc. | | | 12,127 | | | | 333,614 | |
Hess Corp. | | | 6,017 | | | | 322,632 | |
Occidental Petroleum Corp. | | | 4,181 | | | | 304,879 | |
Total Energy | | | | | | | 9,926,662 | |
| | | | | | | | | |
Basic Materials - 4.1% | |
Praxair, Inc. | | | 18,960 | | | | 2,290,937 | |
Sherwin-Williams Co. | | | 7,250 | | | | 2,005,785 | |
Air Products & Chemicals, Inc. | | | 10,227 | | | | 1,537,527 | |
Compass Minerals International, Inc. | | | 14,378 | | | | 1,059,659 | |
Westlake Chemical Corp. | | | 6,982 | | | | 373,537 | |
International Paper Co. | | | 7,436 | | | | 356,779 | |
Eastman Chemical Co. | | | 4,731 | | | | 320,194 | |
Dow Chemical Co. | | | 5,877 | | | | 304,605 | |
Mosaic Co. | | | 12,146 | | | | 297,091 | |
Total Basic Materials | | | | | | | 8,546,114 | |
| | | | | | | | | |
Utilities - 2.4% | |
Entergy Corp. | | | 19,835 | | | | 1,521,940 | |
Southern Co. | | | 21,974 | | | | 1,127,266 | |
Consolidated Edison, Inc. | | | 11,218 | | | | 844,715 | |
Exelon Corp. | | | 18,332 | | | | 610,272 | |
Xcel Energy, Inc. | | | 13,787 | | | | 567,197 | |
NextEra Energy, Inc. | | | 2,515 | | | | 307,635 | |
Total Utilities | | | | | | | 4,979,025 | |
| | | | | | | | | |
Total Common Stocks | | | | | | | | |
(Cost $204,246,704) | | | | | | | 209,567,381 | |
| | | | | | | | | |
EXCHANGE-TRADED FUNDS† - 0.5% | |
SPDR S&P 500 ETF Trust | | | 4,521 | | | | 977,892 | |
Total Exchange-Traded Funds | | | | | | | | |
(Cost $944,838) | | | | | | | 977,892 | |
| | | | | | | | | |
SHORT-TERM INVESTMENTS† - 0.3% | |
Dreyfus Treasury Prime Cash
Management Institutional
Shares 0.16%1 | | | 559,248 | | | | 559,248 | |
Total Short-Term Investments | | | | | | | | |
(Cost $559,248) | | | | | | | 559,248 | |
| | | | | | | | | |
Total Investments - 101.1% | | | | | | | | |
(Cost $205,750,790) | | | | | | $ | 211,104,521 | |
Other Assets & Liabilities, net - (1.1)% | | | | | | | (2,237,866 | ) |
Total Net Assets - 100.0% | | | | | | $ | 208,866,655 | |
* | Non-income producing security. |
† | Value determined based on Level 1 inputs — See Note 4. |
1 | Rate indicated is the 7 day yield as of September 30, 2016. |
| | plc — Public Limited Company |
| | |
| | See Sector Classification in Other Information section. |
SEE NOTES TO FINANCIAL STATEMENTS. | THE GUGGENHEIM FUNDS ANNUAL REPORT | 9 |
SCHEDULE OF INVESTMENTS (concluded) | September 30, 2016 |
CAPITAL STEWARDSHIP FUND | |
The following table summarizes the inputs used to value the Fund’s investments at September 30, 2016 (See Note 4 in the Notes to Financial Statements):
Investments in Securities (Assets) | | Level 1 | | | Level 2 | | | Level 3 | | | Total | |
Common Stocks | | $ | 209,567,381 | | | $ | — | | | $ | — | | | $ | 209,567,381 | |
Exchange-Traded Funds | | | 977,892 | | | | — | | | | — | | | | 977,892 | |
Short-Term Investments | | | 559,248 | | | | — | | | | — | | | | 559,248 | |
Total | | $ | 211,104,521 | | | $ | — | | | $ | — | | | $ | 211,104,521 | |
Transfers between investment levels may occur as the markets fluctuate and/or the availability of data used in an investment’s valuation changes. Transfers between valuation levels, if any, are in comparison to the valuation levels at the end of the previous fiscal year, and are effective using the fair value as of the end of the previous fiscal period.
For the year ended September 30, 2016, there were no transfers between levels.
10 | THE GUGGENHEIM FUNDS ANNUAL REPORT | SEE NOTES TO FINANCIAL STATEMENTS. |
STATEMENT OF ASSETS AND LIABILITIES |
September 30, 2016 |
Assets: | |
Investments, at value (cost $205,750,790) | | $ | 211,104,521 | |
Prepaid expenses | | | 3,490 | |
Receivables: | |
Dividends | | | 187,545 | |
Total assets | | | 211,295,556 | |
| | | | | |
Liabilities: | |
Payable for: | |
Fund shares redeemed | | | 2,192,983 | |
Management fees | | | 155,369 | |
Fund accounting/administration fees | | | 16,400 | |
Trustees’ fees* | | | 9,287 | |
Transfer agent/maintenance fees | | | 2,857 | |
Miscellaneous | | | 52,005 | |
Total liabilities | | | 2,428,901 | |
Net assets | | $ | 208,866,655 | |
| | | | | |
Net assets consist of: | |
Paid in capital | | $ | 197,332,121 | |
Undistributed net investment income | | | 2,150,633 | |
Accumulated net realized gain on investments | | | 4,030,170 | |
Net unrealized appreciation on investments | | | 5,353,731 | |
Net assets | | $ | 208,866,655 | |
Capital shares outstanding | | | 7,865,722 | |
Net asset value per share | | $ | 26.55 | |
STATEMENT OF OPERATIONS |
Year Ended September 30, 2016 |
Investment Income: | |
Dividends | | $ | 4,981,856 | |
Interest | | | 588 | |
Total investment income | | | 4,982,444 | |
| | | | | |
Expenses: | |
Management fees | | | 1,835,517 | |
Transfer agent/maintenance fees | | | 25,670 | |
Fund accounting/administration fees | | | 193,747 | |
Trustees’ fees* | | | 10,530 | |
Custodian fees | | | 10,318 | |
Miscellaneous | | | 96,170 | |
Total expenses | | | 2,171,952 | |
Net investment income | | | 2,810,492 | |
| | | | | |
Net Realized and Unrealized Gain (Loss): | |
Net realized gain (loss) on: | |
Investments | | | 7,701,198 | |
Net realized gain | | | 7,701,198 | |
Net change in unrealized appreciation (depreciation) on: | |
Investments | | | 18,164,398 | |
Net change in unrealized appreciation (depreciation) | | | 18,164,398 | |
Net realized and unrealized gain | | | 25,865,596 | |
Net increase in net assets resulting from operations | | $ | 28,676,088 | |
* | Relates to Trustees not deemed “interested persons” within the meaning of Section 2(a)(19) of the 1940 Act. |
SEE NOTES TO FINANCIAL STATEMENTS. | THE GUGGENHEIM FUNDS ANNUAL REPORT | 11 |
STATEMENTS OF CHANGES IN NET ASSETS |
| | | Year Ended
September 30,
2016 | | | Year Ended
September 30,
2015 | |
Increase (Decrease) in Net Assets from Operations: | | | | | | |
Net investment income | | $ | 2,810,492 | | | $ | 2,559,178 | |
Net realized gain on investments | | | 7,701,198 | | | | 506,679 | |
Net change in unrealized appreciation (depreciation) on investments | | | 18,164,398 | | | | (11,027,250 | ) |
Net increase (decrease) in net assets resulting from operations | | | 28,676,088 | | | | (7,961,393 | ) |
| | | | | | | | | |
Distributions to shareholders from: | | | | | | | | |
Net investment income | | | (2,583,368 | ) | | | (637,133 | ) |
Net realized gains | | | (3,078,358 | ) | | | — | |
Total distributions to shareholders | | | (5,661,726 | ) | | | (637,133 | ) |
| | | | | | | | | |
Capital share transactions: | | | | | | | | |
Proceeds from sale of shares | | | 40,409,661 | | | | 38,908,526 | |
Distributions reinvested | | | 5,389,571 | | | | 476,495 | |
Cost of shares redeemed | | | (49,615,134 | ) | | | (50,132,804 | ) |
Net decrease from capital share transactions | | | (3,815,902 | ) | | | (10,747,783 | ) |
Net increase (decrease) in net assets | | | 19,198,460 | | | | (19,346,309 | ) |
| | | | | | | | | |
Net assets: | | | | | | | | |
Beginning of year | | | 189,668,195 | | | | 209,014,504 | |
End of year | | $ | 208,866,655 | | | $ | 189,668,195 | |
Undistributed net investment income at end of year | | $ | 2,150,633 | | | $ | 1,923,509 | |
| | | | | | | | | |
Capital share activity: | | | | | | | | |
Shares sold | | | 1,615,108 | | | | 1,485,730 | |
Shares issued from reinvestment of distributions | | | 218,644 | | | | 18,671 | |
Shares redeemed | | | (1,974,077 | ) | | | (1,929,837 | ) |
Net decrease in shares | | | (140,325 | ) | | | (425,436 | ) |
12 | THE GUGGENHEIM FUNDS ANNUAL REPORT | SEE NOTES TO FINANCIAL STATEMENTS. |
This table is presented to show selected data for a share outstanding throughout each period and to assist shareholders in evaluating a Fund’s performance for the periods presented.
Institutional Class | | Year Ended
September 30,
2016 | | | Year Ended
September 30,
2015 | | | Period Ended
September 30,
2014a | |
Per Share Data | | | | | | | | | |
Net asset value, beginning of period | | $ | 23.69 | | | $ | 24.79 | | | $ | 25.00 | |
Income (loss) from investment operations: | |
Net investment income (loss)b | | | .35 | | | | .31 | | | | — | c |
Net gain (loss) on investments (realized and unrealized) | | | 3.22 | | | | (1.33 | ) | | | (.21 | ) |
Total from investment operations | | | 3.57 | | | | (1.02 | ) | | | (.21 | ) |
Less distributions from: | |
Net investment income | | | (.32 | ) | | | (.08 | ) | | | — | |
Net realized gains | | | (.39 | ) | | | — | | | | — | |
Total distributions | | | (.71 | ) | | | (.08 | ) | | | — | |
Net asset value, end of period | | $ | 26.55 | | | $ | 23.69 | | | $ | 24.79 | |
| | |
Total Returne | | | 15.30 | % | | | (4.15 | %) | | | (0.84 | %) |
Ratios/Supplemental Data | |
Net assets, end of period (in thousands) | | $ | 208,867 | | | $ | 189,668 | | | $ | 209,015 | |
Ratios to average net assets: | |
Net investment income (loss) | | | 1.38 | % | | | 1.22 | % | | | 0.13 | % |
Total expensesd | | | 1.07 | % | | | 1.15 | % | | | 1.24 | % |
Portfolio turnover rate | | | 209 | % | | | 221 | % | | | — | |
a | Since commencement of operations: September 26, 2014. Percentage amounts for the period, except total return and portfolio turnover rate, have been annualized. |
b | Net investment income (loss) per share was computed using average shares outstanding throughout the period. |
c | Net investment income is less than $0.01 per share. |
d | Does not include expenses of the underlying funds in which the Fund invests. |
e | Total return does not reflect the impact of any applicable sales charge and has not been annualized. |
SEE NOTES TO FINANCIAL STATEMENTS. | THE GUGGENHEIM FUNDS ANNUAL REPORT | 13 |
NOTES TO FINANCIAL STATEMENTS |
1. Organization and Significant Accounting Policies
Organization
Guggenheim Funds Trust (the “Trust”), a Delaware statutory trust, is registered with the SEC under the Investment Company Act of 1940 (“1940 Act”), as an open-ended investment company of the series type. Each series, in effect, is representing a separate Fund. The Trust is authorized to issue an unlimited number of shares. The Trust accounts for the assets of each Fund separately.
The Trust offers a combination of four separate classes of shares, A-Class shares, C-Class shares, P-Class shares and Institutional Class shares. Sales of shares of each Class are made without a front-end sales charge at the net asset value per share (“NAV”), with the exception of A-Class shares. A-Class shares are sold at the NAV, plus the applicable front-end sales charge. The sales charge varies depending on the amount purchased. A-Class share purchases of $1 million or more are exempt from the front-end sales charge but have a 1% contingent deferred sales charge (“CDSC”), if shares are redeemed within 12 months of purchase. C-Class shares have a 1% CDSC if shares are redeemed within 12 months of purchase. Institutional Class shares are offered primarily for direct investment by institutions such as pension and profit sharing plans, endowments, foundations and corporations. Institutional Class shares require a minimum initial investment of $2 million and a minimum account balance of $1 million. Institutional Class shares are offered without a front-end sales charge or a CDSC. At September 30, 2016, the Trust consisted of nineteen funds (the “Funds”).
This report covers the Guggenheim Capital Stewardship Fund (the “Fund”), a diversified investment company. As of September 30, 2016, only Institutional Class shares of the Fund were offered for subscription.
Guggenheim Investments (“GI”) provides advisory services, and Rydex Fund Services, LLC (“RFS”) provides transfer agent, administrative and accounting services to the Trust. Guggenheim Funds Distributors, LLC (“GFD”) acts as principal underwriter for the Trust. GI and GFD are affiliated entities; RFS ceased to be an affiliate of GI as of October 4, 2016, when it was acquired by MUFG Investor Services. In connection with its acquisition, RFS changed its name to MUFG Investor Services (US), LLC (“MUIS”). This change has no impact on the financial statements of the Fund.
Concinnity Advisors, LP (the “Sub-Adviser”) serves as the sub-adviser to the Fund and is responsible for the day-to-day management of the Fund’s portfolio.
Significant Accounting Policies
The Fund operates as an investment company and, accordingly, follows the investment company accounting and reporting guidance of the Financial Accounting Standards Board (“FASB”) Accounting Standards Codification Topic 946 Financial Services – Investment Companies.
The following significant accounting policies are in conformity with U.S. generally accepted accounting principles (“U.S. GAAP”) and are consistently followed by the Trust. This requires management to make estimates and assumptions that affect the reported amount of assets and liabilities, contingent assets and liabilities at the date of the financial statements, and the reported amounts of revenues and expenses during the reporting period. Actual results could differ from these estimates. All time references are based on Eastern Time.
The NAV of the Fund is calculated by dividing the market value of the Fund’s securities and other assets, less all liabilities.
A. The Board of Trustees of the Fund (the “Board”) has adopted policies and procedures for the valuation of the Fund’s investments (the “Valuation Procedures”). Pursuant to the Valuation Procedures, the Board has delegated to a valuation committee, consisting of representatives from Guggenheim’s investment management, fund administration, legal and compliance departments (the “Valuation Committee”), the day-to-day responsibility for implementing the Valuation Procedures, including, under most circumstances, the responsibility for determining the fair value of the Fund’s securities and/or other assets.
Valuations of the Fund’s securities are supplied primarily by pricing services appointed pursuant to the processes set forth in the Valuation Procedures. The Valuation Committee convenes monthly, or more frequently as needed, to review the valuation of all assets which have been fair valued for reasonableness. The Fund’s officers, through the Valuation Committee and consistent with the monitoring and review responsibilities set forth in the Valuation Procedures, regularly review procedures used and valuations provided by the pricing services.
If the pricing service cannot or does not provide a valuation for a particular investment or such valuation is deemed unreliable, such investment is fair valued by the Valuation Committee.
Equity securities listed on an exchange (New York Stock Exchange (“NYSE”) or American Stock Exchange) are valued at the last quoted sales price as of the close of business on the NYSE, usually 4:00 p.m. on the valuation date. Equity securities listed on the NASDAQ market system are valued at the NASDAQ Official Closing Price on the valuation date, which may not necessarily
14 | THE GUGGENHEIM FUNDS ANNUAL REPORT | |
NOTES TO FINANCIAL STATEMENTS (continued) |
represent the last sale price. If there has been no sale on such exchange or NASDAQ on a given day, the security is valued at the closing bid price on that day.
Open-end investment companies (“Mutual Funds”) are valued at their NAV as of the close of business, on the valuation date. Exchange-traded funds (“ETFs”) and closed-end investment companies (“CEFs”) are valued at the last quoted sales price.
Investments for which market quotations are not readily available are fair-valued as determined in good faith by GI under the direction of the Board using methods established or ratified by the Board. Valuations in accordance with these methods are intended to reflect each security’s (or asset’s) “fair value.” Each such determination is based on a consideration of all relevant factors, which are likely to vary from one pricing context to another. Examples of such factors may include, but are not limited to: market prices; sale prices; broker quotes; and models which derive prices based on inputs such as prices of securities with comparable maturities and characteristics, or based on inputs such as anticipated cash flows or collateral, spread over Treasuries, and other information analysis.
B. Security transactions are recorded on the trade date for financial reporting purposes. Realized gains and losses from securities transactions are recorded using the identified cost basis. Proceeds from lawsuits related to investment holdings are recorded as realized gains in the Fund. Dividend income is recorded on the ex-dividend date, net of applicable taxes withheld by foreign countries. Taxable non-cash dividends are recorded as dividend income. Interest income, including amortization of premiums and accretion of discounts, is accrued on a daily basis. Interest income also includes paydown gains and losses on mortgage-backed and asset-backed securities and senior and subordinated loans. Amendment fees are earned as compensation for evaluating and accepting changes to the original loan agreement and are recognized when received. Dividend income from REITs is recorded based on the income included in the distributions received from the REIT investments using published REIT classifications, including some management estimates when actual amounts are not available. Distributions received in excess of this estimated amount are recorded as a reduction of the cost of investments or reclassified to capital gains. The actual amounts of income, return of capital, and capital gains are only determined by each REIT after its fiscal year-end, and may differ from the estimated amounts.
C. Distributions of net investment income and net realized gains, if any, are declared and paid at least annually. Dividends are reinvested in additional shares unless shareholders request payment in cash. Distributions are recorded on the ex-dividend date and are determined in accordance with income tax regulations which may differ from U.S. GAAP.
D. Certain expenses have been allocated to the individual Funds in the Trust on a pro rata basis upon the respective aggregate net assets of each Fund included in the Trust.
E. Under the fee arrangement with the custodian, the Fund may earn credits based on overnight custody cash balances. These credits are utilized to reduce related custodial expenses. The custodian fees disclosed in the Statement of Operations are before the reduction in expense from the related earnings credits, if any. For the year ended September 30, 2016, there were no earnings credits received.
The Fund may leave cash overnight in its cash account with the custodian. Periodically, the Fund may have cash due to the custodian bank as an overdraft balance. A fee is incurred on this overdraft, calculated by multiplying the overdraft by a rate based on the federal funds rate, which was 0.29% at September 30, 2016.
F. Under the Fund’s organizational documents, its Trustees and Officers are indemnified against certain liabilities arising out of the performance of their duties to the Trust. In addition, throughout the normal course of business, the Fund enters into contracts that contain a variety of representations and warranties which provide general indemnifications. The Fund’s maximum exposure under these arrangements is unknown, as this would involve future claims that may be made against the Fund and/or its affiliates that have not yet occurred. However, based on experience, the Fund expects the risk of loss to be remote.
2. Fees and Other Transactions with Affiliates
Under the terms of an investment advisory contract, the Fund pays GI investment advisory fees calculated at an annualized rate of 0.90% of the average daily net assets of the Fund.
RFS was paid the following for providing transfer agent services to the Fund. Transfer agent fees were assessed to the applicable class of the Fund.
Annual charge per account | $5.00 – $8.00 |
Transaction fee | $0.60 – $1.10 |
Minimum annual charge per Fund† | $25,000 |
Certain out-of-pocket charges | Varies |
† | Not subject to the Fund during the first twelve months of operations. |
| | THE GUGGENHEIM FUNDS ANNUAL REPORT | 15 |
NOTES TO FINANCIAL STATEMENTS (continued) |
RFS also acted as the administrative agent for the Fund. As such it performed administrative, bookkeeping, accounting and pricing functions for the Fund. For these services, RFS received 0.095% of the average daily net assets of the Fund. The minimum annual charge for fund accounting/administrative fees is $25,000.
GI engages external service providers to perform other necessary services for the Trust, such as audit and accounting related services, legal services, custody, printing and mailing, etc., on a pass-through basis. Such expenses are allocated to various Funds within the complex based on relative net assets.
Certain trustees and officers of the Trust are also officers of GI and GFD.
3. Fair Value Measurement
In accordance with U.S. GAAP, fair value is defined as the price that the Fund would receive to sell an investment or pay to transfer a liability in an orderly transaction with an independent buyer in the principal market, or in the absence of a principal market, the most advantageous market for the investment or liability. U.S. GAAP establishes a three-tier fair value hierarchy based on the types of inputs used to value assets and liabilities and requires corresponding disclosure. The hierarchy and the corresponding inputs are summarized below:
Level 1 — | quoted prices in active markets for identical assets or liabilities. |
Level 2 — | significant other observable inputs (for example quoted prices for securities that are similar based on characteristics such as interest rates, prepayment speeds, credit risk, etc.). |
Level 3 — | significant unobservable inputs based on the best information available under the circumstances, to the extent observable inputs are not available, which may include assumptions. |
The types of inputs available depend on a variety of factors, such as the type of security and the characteristics of the markets in which it trades, if any. Fair valuation determinations that rely on fewer or no observable inputs require greater judgment. Accordingly, fair value determinations for Level 3 securities require the greatest amount of judgment.
The inputs or methodologies used for valuing securities are not necessarily an indication of the risk associated with investing in those securities. The suitability of the techniques and sources employed to determine fair valuation are regularly monitored and subject to change.
4. Federal Income Tax Information
The Fund intends to comply with the provisions of Subchapter M of the Internal Revenue Code applicable to regulated investment companies and will distribute substantially all taxable net investment income and capital gains sufficient to relieve the Fund from all, or substantially all, federal income, excise and state income taxes. Therefore, no provision for federal or state income tax is required.
Tax positions taken or expected to be taken in the course of preparing the Fund’s tax returns are evaluated to determine whether the tax positions are “more-likely-than-not” of being sustained by the applicable tax authority. Tax positions not deemed to meet the more-likely-than-not threshold would be recorded as a tax benefit or expense in the current year. Management has analyzed the Fund’s tax positions taken, or to be taken, on federal income tax returns for all open tax years, and has concluded that no provision for income tax is required in the Fund’s financial statements. The Fund’s federal tax returns are subject to examination by the Internal Revenue Service for a period of three years after they are filed.
At September 30, 2016, the cost of securities for federal income tax purposes, the aggregate gross unrealized gain for all securities for which there was an excess of value over tax cost, and the aggregate gross unrealized loss for all securities for which there was an excess of tax cost over value were as follows:
16 | THE GUGGENHEIM FUNDS ANNUAL REPORT | |
NOTES TO FINANCIAL STATEMENTS (continued) |
The tax character of distributions paid during the year ended September 30, 2016 was as follows:
Fund | | Ordinary
Income | | | Long-Term
Capital Gain | | | Total
Distributions | |
Capital Stewardship Fund | | $ | 5,403,315 | | | $ | 258,411 | | | $ | 5,661,726 | |
The tax character of distributions paid during the year ended September 30, 2015 was as follows:
Fund | | Ordinary
Income | | | Long-Term
Capital Gain | | | Total
Distributions | |
Capital Stewardship Fund | | $ | 637,133 | | | $ | — | | | $ | 637,133 | |
Tax components of accumulated earnings/(deficit) as of September 30, 2016, were as follows:
Fund | | Undistributed
Ordinary
Income | | | Undistributed
Long-Term
Capital Gain | | | Net Unrealized
Appreciation/
(Depreciation) | | | Accumulated
Capital and
Other Losses | |
Capital Stewardship Fund | | $ | 8,964,303 | | | $ | — | | | $ | 3,578,118 | | | $ | (1,007,887 | ) |
For Federal income tax purposes, capital loss carryforwards represent realized losses of the Funds that may be carried forward and applied against future capital gains. Under the RIC Modernization Act of 2010, the Fund is permitted to carry forward capital losses incurred in taxable years beginning after December 22, 2010 for an unlimited period and such capital loss carryforwards will retain their character as either short-term or long-term capital losses. As of September 30, 2016, the Fund had no capital loss carryforwards.
As of September 30, 2016 the following reclassifications were made to the capital accounts of the Fund, to reflect permanent book/tax differences and income and gains available for distributions under income tax regulations, which are due to equalization accounting for undistributed income and capital gains. Net investment income, net realized gains and net assets were not affected by these changes.
On the Statements of Assets and Liabilities the following adjustments were made for permanent book/tax differences:
Fund | | Paid In
Capital | | | Undistributed
Net Investment
Income | | | Accumulated
Net Realized
Loss | |
Capital Stewardship Fund | | $ | 600,489 | | | $ | — | | | $ | (600,489 | ) |
At September 30, 2016, the cost of securities for Federal income tax purposes, the aggregate gross unrealized gain for all securities for which there was an excess of value over tax cost and the aggregate gross unrealized loss for all securities for which there was an excess of tax cost over value, were as follows:
Fund | | Tax
Cost | | | Tax
Unrealized
Gain | | | Tax
Unrealized
Loss | | | Net
Unrealized
Gain | |
Capital Stewardship Fund | | $ | 207,526,403 | | | $ | 10,148,073 | | | $ | (6,569,955 | ) | | $ | 3,578,118 | |
| | THE GUGGENHEIM FUNDS ANNUAL REPORT | 17 |
NOTES TO FINANCIAL STATEMENTS (concluded) |
Pursuant to Federal income tax regulations applicable to investment companies, the Funds can elect to treat net capital losses and certain ordinary losses realized between November 1 and September 30 of each year as occurring on the first day of the following tax year. The Funds also can elect to treat certain ordinary losses realized between January 1 and September 30 of each year as occurring on the first day of the following tax year. The Funds have elected to defer the following late year losses:
Fund | | Ordinary | | | Capital | |
Capital Stewardship Fund | | $ | — | | | $ | 1,007,887 | |
5. Securities Transactions
For the year ended September 30, 2016, the cost of purchases and proceeds from sales of investment securities, excluding government securities, short-term investments and derivatives, were as follows:
Fund | | Purchases | | | Sales | |
Capital Stewardship Fund | | $ | 425,712,250 | | | $ | 430,503,164 | |
The Fund is permitted to purchase or sell securities from or to certain affiliated funds under specified conditions outlined in procedures adopted by the Board of the Trust. The procedures have been designed to ensure that any purchase or sale of securities by a Fund from or to another fund or portfolio that is or could be considered an affiliate by virtue of having a common investment adviser (or affiliated investment advisers), common Trustees and/or common officers complies with Rule 17a-7 of the 1940 Act. Further, as defined under these procedures, each transaction is effected at the current market price to save costs, where permissible. For the year ended September 30, 2016, the Fund did not engage in purchases and sales of securities, pursuant to Rule 17a-7 of the 1940 Act.
18 | THE GUGGENHEIM FUNDS ANNUAL REPORT | |
REPORT OF INDEPENDENT REGISTERED PUBLIC ACCOUNTING FIRM |
The Board of Trustees and Shareholders
of Guggenheim Funds Trust
We have audited the accompanying statement of assets and liabilities, including the schedule of investments, of Guggenheim Capital Stewardship Fund (one of the series constituting the Guggenheim Funds Trust) (the “Fund”) as of September 30, 2016, and the related statement of operations for the year then ended, the statements of changes in net assets for each of the two years in the period then ended, and the financial highlights for each of the years or periods indicated therein. These financial statements and financial highlights are the responsibility of the Fund’s management. Our responsibility is to express an opinion on these financial statements and financial highlights based on our audits.
We conducted our audits in accordance with the standards of the Public Company Accounting Oversight Board (United States). Those standards require that we plan and perform the audit to obtain reasonable assurance about whether the financial statements and financial highlights are free of material misstatement. We were not engaged to perform an audit of the Fund’s internal control over financial reporting. Our audits included consideration of internal control over financial reporting as a basis for designing audit procedures that are appropriate in the circumstances, but not for the purpose of expressing an opinion on the effectiveness of the Fund’s internal control over financial reporting. Accordingly, we express no such opinion. An audit also includes examining, on a test basis, evidence supporting the amounts and disclosures in the financial statements and financial highlights, assessing the accounting principles used and significant estimates made by management, and evaluating the overall financial statement presentation. Our procedures included confirmation of securities owned as of September 30, 2016, by correspondence with the custodian. We believe that our audits provide a reasonable basis for our opinion.
In our opinion, the financial statements and financial highlights referred to above present fairly, in all material respects, the financial position of the Guggenheim Capital Stewardship Fund (one of the series constituting the Guggenheim Funds Trust) at September 30, 2016, the results of its operations for the year then ended, the changes in its net assets for each of the two years in the period then ended, and its financial highlights for each of the years or periods indicated therein, in conformity with U.S. generally accepted accounting principles.
McLean, Virginia
November 29, 2016
| | THE GUGGENHEIM FUNDS ANNUAL REPORT | 19 |
OTHER INFORMATION (Unaudited) |
Tax Information
In January 2017, shareholders will be advised on IRS Form 1099 DIV or substitute 1099 DIV as to the federal tax status of the distributions received by shareholders in the calendar year 2016.
The Fund’s investment income(dividend income plus short-term gains, if any) qualifies as follows:
Of the ordinary income distributions paid during the year, the following funds had the corresponding percentages qualify for the dividends received deduction for corporations:
Fund | | Dividend
Received
Deduction | |
Guggenheim Capital Stewardship Fund | | | 72.10 | % |
Additionally, the following amounts of taxable ordinary income dividends paid during the fiscal year qualified for the lower income tax rate available to individuals under the Jobs and Growth Tax Relief Reconciliation Act of 2003:
Fund | | Qualified
Dividend
Income | |
Guggenheim Capital Stewardship Fund | | | 71.87 | % |
Additionally, of the taxable ordinary income distributions paid during the fiscal year ending September 30, 2016, the Fund had the corresponding percentages qualify as interest related dividends and qualified short-term capital gains as permitted by IRC Section 871(k)(1) and IRC Section 871(k)(2), respectively:
Fund | | Qualified
Interest | | | Qualified
Short-Term | |
Guggenheim Capital Stewardship Fund | | | 0.00 | % | | | 100.00 | % |
With respect to the taxable year ended September 30, 2016, the Funds hereby designate as capital gain dividends the amounts listed below, or, if subsequently determined to be different, the net capital gain of such year:
Fund | | LTCG
Dividend | | | From Proceeds of Shareholder Redemptions | |
Guggenheim Capital Stewardship Fund | | $ | 258,411 | | | $ | — | |
Proxy Voting Information
A description of the policies and procedures that the Trust uses to determine how to vote proxies relating to securities held in the Funds’ portfolios is available, without charge and upon request, by calling 800.820.0888. This information is also available from the EDGAR database on the SEC’s website at https://www.sec.gov.
Information regarding how the Funds voted proxies relating to portfolio securities during the most recent 12-month period ended June 30 is available without charge, upon request, by calling 800.820.0888. This information is also available from the EDGAR database on the SEC’s website at https://www.sec.gov.
20 | THE GUGGENHEIM FUNDS ANNUAL REPORT | |
OTHER INFORMATION (Unaudited)(continued) |
Sector Classification
Information in the “Schedule of Investments” is categorized by sectors using sector-level Classifications defined by the Bloomberg Industry Classification System, a widely recognized industry classification system provider. Each Fund’s registration statement has investment policies relating to concentration in specific sectors/industries. For purposes of these investment policies, the Funds usually classify sectors/industries based on industry-level Classifications used by widely recognized industry classification system providers such as Bloomberg Industry Classification System, Global Industry Classification Standards and Barclays Global Classification Scheme.
Quarterly Portfolio Schedules Information
The Trust files its complete schedule of portfolio holdings with the SEC for the first and third quarters of each fiscal year on Form N-Q; which are available on the SEC’s website at https://www.sec.gov. The Funds’ Forms N-Q may be reviewed and copied at the SEC’s Public Reference Room in Washington, DC, and that information on the operation of the Public Reference Room may be obtained by calling 800-SEC-0330. Copies of the portfolio holdings are also available to shareholders, without charge and upon request, by calling 800.820.0888.
Report of the Guggenheim Funds Trust Contracts Review Committee- Guggenheim Capital Stewardship Fund
Guggenheim Funds Trust (the “Trust”) was organized as a Delaware statutory trust on November 8, 2013, and is registered as an open-end management investment company under the Investment Company Act of 1940, as amended (the “1940 Act”). The Trust is authorized to issue an unlimited number of shares of beneficial interest in separate series, with each such series representing interests in a separate portfolio of securities and other assets (each, a “Guggenheim Fund” and collectively, the “Guggenheim Funds”). On August 20, 2014, Guggenheim Partners Investment Management, LLC (“GPIM” or the “Adviser”), an indirect subsidiary of Guggenheim Partners, LLC, a global diversified financial services firm (“Guggenheim Partners”), was approved to serve as the investment adviser to Guggenheim Capital Stewardship Fund (“Capital Stewardship Fund” or the “Fund”), a series of the Trust (i.e., a Guggenheim Fund), pursuant to an investment advisory agreement between the Trust and GPIM, with respect to Capital Stewardship Fund (the “Investment Advisory Agreement”). (Guggenheim Partners, GPIM and its affiliates may be referred to herein together as “Guggenheim.” “Guggenheim Investments” refers to the global asset management and investment advisory division of Guggenheim Partners and includes GPIM, Guggenheim Funds Investment Advisors, LLC, Security Investors, LLC and other affiliated investment management businesses.)
Under the supervision of the Board of Trustees of the Trust (the “Board,” with the members of the Board referred to individually as the “Trustees”), GPIM: (i) acts as investment adviser for and supervises and manages the investment and reinvestment of Capital Stewardship Fund’s assets and, in connection therewith, has complete discretion in purchasing and selling securities and other assets of the Fund and in voting, exercising consents and exercising all other rights related to such securities and other assets on the Fund’s behalf; (ii) supervises the investment program of the Fund and the composition of its portfolio; (iii) arranges for the purchase and sale of securities and other assets held in the Fund; (iv) provides a continuous investment program for the Fund, including investment research and management; and (v) provides certain administrative services. Under the terms of the Investment Advisory Agreement, GPIM may delegate some or all of its duties and obligations to one or more sub-advisers and, in this connection, is responsible for overseeing the activities of Concinnity Advisors, LP (“Concinnity” or the “Sub-Adviser”) with respect to Concinnity’s service as investment sub-adviser to the Fund, pursuant to an investment sub-advisory agreement between GPIM and Concinnity (the “Sub-Advisory Agreement” and together with the Investment Advisory Agreement, the “Advisory Agreements”).
Following an initial two-year term, each of the Advisory Agreements continues in effect from year to year provided that such continuance is specifically approved at least annually by (i) the Board or a majority of the outstanding voting securities (as defined in the 1940 Act) of the Fund, and, in either event, (ii) the vote of a majority of the Trustees who are not “interested person[s],” as defined by the 1940 Act, of the Trust (the “Independent Trustees”) casting votes in person at a meeting called for such purpose. At meetings held in person on April 27, 2016 (the “April Meeting”) and on May 17, 2016 (the “May Meeting”), the Contracts Review Committee of the Board (the “Committee”), consisting solely of the Independent Trustees, met separately from Guggenheim to consider the proposed renewal of the Advisory Agreements in connection with the Committee’s annual contract review schedule.
As part of its review process, the Committee was represented by independent legal counsel to the Independent Trustees (“Independent Legal Counsel”). Independent Legal Counsel reviewed and discussed with the Committee various key aspects of the Trustees’ legal responsibilities relating to the proposed renewal of the Advisory Agreements and other principal contracts. The Committee took into account various materials
| | THE GUGGENHEIM FUNDS ANNUAL REPORT | 21 |
OTHER INFORMATION (Unaudited)(continued) |
received from Guggenheim and Independent Legal Counsel. Recognizing that the evaluation process with respect to the services provided by each of GPIM and Concinnity is an ongoing one, the Committee also considered the variety of written materials, reports and oral presentations the Board received throughout the year regarding performance and operating results of the Fund.
In connection with the contract review process, FUSE Research Network LLC (“FUSE”), an independent, third-party research provider, was engaged to prepare advisory contract renewal reports designed specifically to help boards of directors/trustees fulfill their advisory contract renewal responsibilities. The objective of the reports is to present the subject funds’ relative position regarding fees, expenses and total return performance, with peer group and universe comparisons. The Committee assessed the data provided in the FUSE reports and noted that the peer group identified by FUSE included 14 other large blend funds.
In addition, Guggenheim provided materials and data in response to formal requests for information sent by Independent Legal Counsel on behalf of the Independent Trustees. Guggenheim also made a presentation at the April Meeting which, among other things, addressed areas identified for discussion by the Independent Trustees and Independent Legal Counsel. Throughout the process, the Committee asked questions of management and requested certain additional information, which Guggenheim provided following the April Meeting (collectively with the foregoing reports and materials, the “Contract Review Materials”).
The Committee also considered the circumstances unique to Capital Stewardship Fund, including its organizational history. In this connection, the assets of Guggenheim Concinnity Master Strategy Fund, SPC, a Cayman Islands exempted segregated portfolio company which relied on the exclusion from the definition of an “investment company” provided by Section 3(c)(7) of the 1940 Act (the “Predecessor Fund”) and for which GPIM served as investment adviser and Concinnity as the sub-adviser, was reorganized with and into Capital Stewardship Fund (the “Reorganization”). The Predecessor Fund was a master fund in a set of unregistered offshore and domestic master-feeder funds (collectively, the “Private Funds”), which had certain bank investors. The investors issued notes that provided coupon payments based on the after-tax return of the Private Funds and the notes, in turn, were held by a single holder affiliated with Guggenheim. The Reorganization enabled the bank investors and noteholder to continue to benefit from the strategies previously offered by the Private Funds by converting the Predecessor Fund into a registered investment company structure that pursues the same investment strategies, since Capital Stewardship Fund’s investment objective and strategies are, in all materials respects, the same as those of the Predecessor Fund. The Board had authorized the launch of Capital Stewardship Fund on the condition that it not be offered to other investors unless and until such time as the Board determines to permit additional sales.
The Committee considered the foregoing and the Contract Review Materials in the context of its accumulated experience governing the Trust and weighed the factors and standards discussed with Independent Legal Counsel. Following an analysis and discussion of the factors identified below and in the exercise of its business judgment, the Committee concluded that it was in the best interest of Capital Stewardship Fund to recommend that the Board approve the renewal of each Advisory Agreement for an annual term.
Investment Advisory Agreement
Nature, Extent and Quality of Services Provided by the Adviser: With respect to the nature, extent and quality of services currently provided by the Adviser, the Committee considered the information provided by Guggenheim concerning the education, experience, professional affiliations, areas of responsibility and duties of key personnel performing services for the Fund, including those personnel providing compliance oversight, as well as the supervisors and reporting lines for such personnel. In this connection, the Committee considered Guggenheim’s resources and related efforts to retain, attract and motivate capable personnel to serve the Fund and noted Guggenheim’s report on recent additions, departures and transitions in personnel who work on matters relating to the Fund or are significant to the operations of the Adviser. The Committee also considered Guggenheim’s attention to relevant developments in the mutual fund industry and its observance of compliance and regulatory requirements, and noted that on a regular basis the Board receives and reviews information from the Trust’s Chief Compliance Officer regarding compliance policies and procedures established pursuant to Rule 38a-1 under the 1940 Act, as well as from Guggenheim’s Chief Risk Officer. The Committee also noted updates by Guggenheim to certain compliance programs, including with respect to Code of Ethics monitoring, and the implementation of additional forensic testing. The Committee took into consideration the settlement of a regulatory matter concerning GPIM and remedial steps taken in response by Guggenheim to enhance its organizational structure for compliance. In this connection, the Committee considered information provided by Guggenheim regarding the findings of an independent compliance consultant retained to review GPIM’s compliance program and the consultant’s conclusion that the program is reasonably designed to prevent and detect violations of the Investment Advisers Act of 1940, as amended, and the rules promulgated thereunder. Moreover, in connection with
22 | THE GUGGENHEIM FUNDS ANNUAL REPORT | |
OTHER INFORMATION (Unaudited)(continued) |
the Committee’s evaluation of the overall package of services provided by the Adviser, the Committee considered the Adviser’s administrative capabilities, including its role in monitoring and coordinating compliance responsibilities with the fund administrator, transfer agent, distributor, custodian and other service providers to the Guggenheim Funds.
With respect to Guggenheim’s resources and the ability of the Adviser to carry out its responsibilities under the Investment Advisory Agreement, the Chief Financial Officer of Guggenheim Investments reviewed with the Committee certain unaudited financial information concerning the holding company for Guggenheim Investments, Guggenheim Partners Investment Management Holdings, LLC (“GPIMH”). (Thereafter, the Committee received the audited consolidated financial statements of GPIMH and the audited financial statements of GPIM as supplemental information.)
The Committee also considered the acceptability of the terms of the Investment Advisory Agreement, including the scope of services required to be performed by the Adviser.
Based on the foregoing, and based on other information received (both oral and written) at the April Meeting and the May Meeting, as well as other considerations, including the Committee’s knowledge of how the Adviser performs its duties through Board meetings, discussions and reports during the year, the Committee concluded that the Adviser and its personnel were qualified to serve Capital Stewardship Fund in such capacity and may reasonably be expected to continue to provide a high quality of services under the Investment Advisory Agreement with respect to the Fund.
Investment Performance: The Fund commenced investment operations on September 26, 2014. The Committee received investment returns for the one-year and three-month periods ended December 31, 2015 as compared to a universe of funds identified by FUSE. The Committee considered that Capital Stewardship Fund seeks long-term capital appreciation and to generate returns in excess of the S&P 500 Total Return Index by investing in companies that use a Multi-stakeholder Management System (“MsMs”) approach to achieve sustainable corporate performance. In this connection, the Committee took into account the role and responsibilities of each of the Adviser and Sub-Adviser in implementing the Fund’s investment strategy, including the manner in which the relationship between the advisory firms differs in certain respects from traditional fund management structures with an adviser and unaffiliated sub-adviser. In this regard, the Committee noted that in order to identify an initial universe of companies that it believes have exemplary multi-stakeholder management systems, the Sub-Adviser uses its proprietary research methodology system to identify a universe of companies and then ranks the companies using multi-factor modeling techniques. The Adviser then uses its proprietary quantitative models to optimize a portfolio and creates the list of securities for the portfolio. The Sub-Adviser then reviews the list of securities provided by the Adviser and identifies the securities to be purchased by the Adviser for the Fund. The Adviser retains the responsibility for executing the trades instructed by the Sub-Adviser based on the Fund’s investment policies and limitations. In view of the foregoing, the Committee took into account information provided by Guggenheim describing the Adviser’s processes and activities for providing oversight of sub-advisers, including information regarding the Adviser’s Sub-Advisory Oversight Committee. Based on the information provided and the review of the Fund’s investment performance, the Committee concluded that the Adviser had appropriately reviewed and monitored Concinnity’s investment performance as Sub-Adviser to the Fund.
Comparative Fees, Costs of Services Provided and the Profits Realized by GPIM from its Relationship with the Fund: The Committee compared the Fund’s contractual advisory fee and total net expense ratio to the applicable peer group identified by FUSE. The Committee also reviewed the median advisory fees and expense ratios, including expense ratio components (e.g., transfer agency fees, administration fees, other operating expenses, distribution fees and fee waivers/reimbursements) of the peer group of funds. In response to a supplemental request, the Committee also received and reviewed aggregated advisory and administrative fees compared to the peer group average and median.
The Committee observed that both the Fund’s contractual advisory fee and total net expense ratio is the highest of the peer group. The Committee considered, however, that the Fund was launched to accommodate certain bank clients that were invested in an unregistered private fund (previously defined as the Predecessor Fund) with a unique investment strategy. Shares of the Fund are not registered under the Securities Act of 1933, as amended, and thus, are available only to accredited investors in a single institutional share class. Accordingly, in evaluating the reasonableness of the advisory fee, the Committee considered the sophistication of the Fund’s bank client investors. The Committee also noted that, as considered in connection with the initial approval of the Advisory Agreements with respect to the Fund, the Fund has a lower contractual advisory fee and total expense ratio than the Predecessor Fund. In addition, the Committee noted that GPIM does not charge a lower advisory fee for other funds or separate accounts with investment strategies comparable to those of the Fund.
| | THE GUGGENHEIM FUNDS ANNUAL REPORT | 23 |
OTHER INFORMATION (Unaudited)(continued) |
With respect to the costs of services provided and profits realized by Guggenheim Investments from its relationship with the Fund, the Committee reviewed a profitability analysis and data from management setting forth the Fund’s average assets under management for the twelve months ended December 31, 2015, ending assets under management as of December 31, 2015, gross revenue received by Guggenheim Investments, expenses allocated to the Fund, earnings and the operating margin/profitability rate (with a negative rate reported with respect to the Fund), including variance information relative to the foregoing amounts as of December 31, 2014. In addition, the Chief Financial Officer of Guggenheim Investments reviewed with, and addressed questions from, the Committee concerning the expense allocation methodology employed in producing the profitability analysis.
In the course of its review of Guggenheim Investments’ profitability with respect to the Guggenheim Funds generally, the Committee took into account the methods used by Guggenheim Investments to determine expenses and profit and reviewed a report from an independent accounting firm evaluating Guggenheim Investments’ approach to allocating costs and determining the profitability of Guggenheim Investments with respect to individual funds and the entire fund complex. In evaluating the costs of services provided and the profitability to Guggenheim Investments, based upon the profitability rates presented by Guggenheim Investments and the conclusion of the independent accounting firm that the methodology used for calculating such rates was reasonable, the Committee concluded that the profits were not unreasonable.
The Committee considered other benefits available to the Adviser because of its relationship with the Guggenheim Funds, including Capital Stewardship Fund, and noted that GPIM may be deemed to benefit from arrangements whereby an affiliate, Rydex Fund Services, LLC, currently receives fees for (i) performing certain administrative functions and bookkeeping, accounting and pricing functions for the Guggenheim Funds pursuant to a Fund Accounting and Administration Agreement, and (ii) acting as transfer agent for the Guggenheim Funds and performing all shareholder servicing functions, including transferring record ownership, processing purchase and redemption transactions, answering inquiries, mailing shareholder communications, and acting as the dividend disbursing agent pursuant to a Transfer Agency Agreement. The Committee reviewed the compensation arrangements for the provision of the foregoing services, as well as Guggenheim’s profitability from providing such services. The Committee also noted Guggenheim’s statement that it may benefit from marketing synergies arising from offering a broad spectrum of products, including the Guggenheim Funds.
Economies of Scale: With respect to economies of scale, the Committee considered that the Fund is not available to retail investors. The Committee concluded that the advisory fee schedule reflected an appropriate level of sharing of any economies of scale.
The Committee determined that, taking into account all relevant factors, the Fund’s advisory fee was reasonable.
Sub-Advisory Agreement
Nature, Extent and Quality of Services Provided by the Sub-Adviser: With respect to the nature, extent and quality of services provided by the Sub-Adviser, the Committee considered the Fund’s investment objective and Concinnity’s investment strategy and method for implementing such investment strategy, including, but not limited to the investment decision processes employed for the Fund. In this connection, the Trustees also noted that the Sub-Adviser is experienced in identifying companies with elements of the MsMs management system. In addition, the Committee took into account the information provided by the Sub-Adviser regarding, among other things: its current advisory services and clients and the principal activities in which it is engaged; personnel changes and operational enhancements; the experience of key personnel responsible for providing services to the Fund and their qualifications to provide such services; the Sub-Adviser’s evaluation of its success in meeting the Fund’s investment objective; the Fund’s portfolio construction process and the sources of information generally relied upon by the Sub-Adviser in providing investment advisory, statistical and research services to the Fund; the Sub-Adviser’s process for risk management; the Sub-Adviser’s compliance program; and the business continuity plan and cybersecurity controls employed by the Sub-Adviser.
With respect to the Sub-Adviser’s resources and its ability to carry out its responsibilities under the Sub-Advisory Agreement, the Committee noted that the Sub-Adviser provided its tax return filing. The Committee also considered the Sub-Adviser’s statement that it is an ongoing viable business enterprise that currently has the resources necessary to provide the contracted for services to the Fund. In further assessing the Sub-Adviser’s resources, as well as the nature and quality of the services it provides, the Committee discussed the Sub-Adviser’s capabilities and resources with Guggenheim management and, in this connection, noted that the Guggenheim representatives expressed comfort with such capabilities and resources in consideration of Concinnity’s role in the Fund’s management.
The Committee also considered the acceptability of the terms of the Sub-Advisory Agreement, including the scope of services required to be performed by the Sub-Adviser.
24 | THE GUGGENHEIM FUNDS ANNUAL REPORT | |
OTHER INFORMATION (Unaudited)(concluded) |
Based on the foregoing, and based on other information received (both oral and written) at the April Meeting and the May Meeting, the Committee concluded that the Sub-Adviser and its personnel were qualified to serve the Fund in such capacity and may reasonably be expected to continue to provide a high quality of services under the Sub-Advisory Agreement.
Investment Performance: The Committee considered the Fund’s limited operating history and noted the Fund’s Class I shares ranked in the second quartile (47th percentile) and first quartile (15th percentile) for the one-year and three-month periods ended December 31, 2015, respectively. The Committee concluded that the investment performance of the Fund and the Sub-Adviser was acceptable.
Comparative Fees, Costs of Services Provided and the Profits Realized by the Sub-Adviser from its Relationship with the Fund: The Committee reviewed the level of sub-advisory fees payable to the Sub-Adviser, noting that the fees are paid by GPIM and are not additional fees borne by the Fund. The Committee also noted that the sub-advisory fees paid by GPIM to Concinnity are the product of arms-length negotiations between GPIM and Concinnity. The Committee considered the allocation of the advisory fee charged to the Fund between GPIM and Concinnity in light of the nature, extent and quality of the investment advisory services provided by GPIM and Concinnity.
With respect to the costs of services provided and profits realized by the Sub-Adviser from its relationship with the Fund, the Committee considered Concinnity’s size and partnership structure, the aggregate management fees paid to Concinnity and the methodology used to calculate its profitability. The Committee considered other benefits available to the Sub-Adviser because of its relationship with the Fund. In this regard, the Committee noted that, in response to the Independent Trustees’ written request to identify such benefits, Concinnity stated that it benefits from the compensation it receives, indicating that there were no other benefits to the Sub-Adviser.
Based on all of the information provided, the Committee determined that the Sub-Adviser’s profitability from its relationship with the Fund was not unreasonable.
Economies of Scale: The Committee recognized that, because the Sub-Adviser’s fees are paid by GPIM and not the Fund, the analysis of economies of scale was more appropriate in the context of the Committee’s consideration of the Investment Advisory Agreement, which was separately considered. (See “Investment Advisory Agreement- Economies of Scale” above.)
The Committee determined that, taking into account all relevant factors, the Fund’s sub-advisory fee was reasonable.
Overall Conclusions
Based on the foregoing, the Committee determined that the investment advisory fees are fair and reasonable in light of the extent and quality of the services provided and other benefits received and that the continuation of each Advisory Agreement is in the best interest of the Fund. In reaching this conclusion, no single factor was determinative or conclusive and each Committee member, in the exercise of his business judgment, may attribute different weights to different factors. At the May Meeting, the Committee, constituting all of the Independent Trustees, recommended the renewal of each Advisory Agreement for an annual term.
| | THE GUGGENHEIM FUNDS ANNUAL REPORT | 25 |
INFORMATION ON BOARD OF TRUSTEES AND OFFICERS (Unaudited) |
Name, Address*
and Year of Birth | Position(s)
Held with
the Trust | Term of Office
and Length of
Time Served** | Principal Occupation(s)
During Past Five Years | Number of
Portfolios
in Fund
Complex
Overseen | Other Directorships
Held by Trustees |
INDEPENDENT TRUSTEES | | | |
Randall C. Barnes
(1951) | Trustee | Since 2014 | Current: Private Investor (2001-present).
Former: Senior Vice President and Treasurer, PepsiCo, Inc. (1993-1997); President, Pizza Hut International (1991-1993); Senior Vice President, Strategic Planning and New Business Development, PepsiCo, Inc. (1987-1990). | 101 | Current: Trustee, Purpose Investments Inc. (2014-Present). |
Donald A. Chubb, Jr.
(1946) | Trustee | Since 1994 | Current: Business broker and manager of commercial real estate, Griffith & Blair, Inc. (1997-present). | 97 | Current: Midland Care, Inc. (2011-present). |
Jerry B. Farley
(1946) | Trustee | Since 2005 | Current: President, Washburn University (1997-present). | 97 | Current: Westar Energy, Inc. (2004-present); CoreFirst Bank & Trust (2000-present). |
Roman Friedrich III
(1946) | Trustee | Since 2014 | Current: Founder and Managing Partner, Roman Friedrich & Company (1998-present).
Former: Senior Managing Director, MLV & Co. LLC (2010-2011). | 97 | Current: Zincore Metals, Inc. (2009-present).
Former: Axiom Gold and Silver Corp. (2011-2012). |
Robert B. Karn III
(1942) | Trustee and Chairman of the Audit Committee | Since 2014 | Current: Consultant (1998-present). Former: Arthur Andersen (1965-1997) and Managing Partner, Financial and Economic Consulting, St. Louis office (1987-1997). | 97 | Current: Peabody Energy Company (2003-present); GP Natural Resource Partners, LLC (2002- present). |
Ronald A. Nyberg
(1953) | Trustee and Chairman of the Nominating and Governance Committee | Since 2014 | Current: Partner, Momkus McCluskey Roberts, LLC (2016-present).
Former: Partner, Nyberg & Cassioppi, LLC (2000-2016); Executive Vice President, General Counsel, and Corporate Secretary, Van Kampen Investments (1982-1999). | 103 | Current: Edward-Elmhurst Healthcare System (2012-present). |
26 | THE GUGGENHEIM FUNDS ANNUAL REPORT | |
INFORMATION ON BOARD OF TRUSTEES AND OFFICERS (Unaudited)(continued) |
Name, Address* and Year of Birth | Position(s)
Held with
the Trust | Term of Office and Length of Time Served** | Principal Occupation(s) During Past Five Years | Number of Portfolios in Fund Complex Overseen | Other
Directorships Held by Trustees |
INDEPENDENT TRUSTEES - continued | | |
Maynard F. Oliverius
(1943) | Trustee | Since 1998 | Current: Retired.
Former: President and CEO, Stormont-Vail HealthCare (1996-2012). | 97 | Current: Fort Hays State University Foundation (1999-present); Stormont-Vail Foundation (2013-present); University of Minnesota Healthcare Alumni Association Foundation (2009-present).
Former: Topeka Community Foundation (2009-2014). |
Ronald E. Toupin, Jr.
(1958) | Trustee and Chairman of the Board | Since 2014 | Current: Portfolio Consultant (2010-present).
Former: Vice President, Manager and Portfolio Manager, Nuveen Asset Management (1998-1999); Vice President, Nuveen Investment Advisory Corp. (1992-1999); Vice President and Manager, Nuveen Unit Investment Trusts (1991-1999); and Assistant Vice President and Portfolio Manager, Nuveen Unit Investment Trusts (1988-1999), each of John Nuveen & Co., Inc. (1982-1999). | 100 | Former: Bennett Group of Funds (2011-2013). |
INTERESTED TRUSTEE | |
Donald C. Cacciapaglia***
(1951) | President, Chief Executive Officer and Trustee | Since 2012 | Current: President and CEO, certain other funds in the Fund Complex (2012-present); Vice Chairman, Guggenheim Investments (2010-present).
Former: Chairman and CEO, Channel Capital Group, Inc. (2002-2010). | 232 | Current: Clear Spring Life Insurance Company (2015-present); Guggenheim Partners Japan, Ltd. (2014-present); Guggenheim Partners Investment Management Holdings, LLC (2014-present); Delaware Life (2013-present); Guggenheim Life and Annuity Company (2011-present); Paragon Life Insurance Company of Indiana (2011-present). |
* | The business address of each Trustee is c/o Guggenheim Investments, 227 West Monroe Street, Chicago, Illinois 60606. |
** | Each Trustee serves an indefinite term, until his successor is elected and qualified. Time served includes time served in the respective position for the Predecessor Corporation. |
*** | This Trustee is deemed to be an "interested person" of the Funds under the 1940 Act by reason of his position with the Funds' Investment Manager and/or the parent of the Investment Manager. |
| | THE GUGGENHEIM FUNDS ANNUAL REPORT | 27 |
INFORMATION ON BOARD OF TRUSTEES AND OFFICERS (Unaudited)(continued) |
Name, Address* and Year of Birth | Position(s)
held with
the Trust | Term of Office and Length of Time Served** | Principal Occupations
During Past Five Years |
OFFICERS | | | |
William H. Belden, III
(1965) | Vice President | Since 2014 | Current: Vice President, certain other funds in the Fund Complex (2006-present); Managing Director, Guggenheim Funds Investment Advisors, LLC (2005-present).
Former: Vice President of Management, Northern Trust Global Investments (1999-2005). |
James M. Howley
(1972) | Assistant Treasurer | Since 2014 | Current: Director, Guggenheim Investments (2004-present) ; Assistant Treasurer, certain other funds in the Fund Complex (2006-present).
Former: Manager, Mutual Fund Administration of Van Kampen Investments, Inc. (1996-2004). |
Joanna M. Catalucci (1966) | AML Officer | Since 2016 | Current: Chief Compliance Officer, certain funds in the Fund Complex (2012-present); Senior Managing Director, Guggenheim Investments (2012-present); AML Officer, certain funds in the Fund Complex (2016-present). Former: Chief Compliance Officer and Secretary, certain other funds in the Fund Complex (2008-2012); Senior Vice President & Chief Compliance Officer, Security Investors, LLC and certain affiliates (2010-2012); Chief Compliance Officer and Senior Vice President, Rydex Advisors, LLC and certain affiliates (2010-2011). |
Keith D. Kemp
(1960) | Assistant Treasurer | Since 2016 | Current: Managing Director of Transparent Value, LLC (2015-present); Managing Director of Guggenheim Investments (2015-present).
Former: Director, Transparent Value, LLC (2010-2015); Director, Guggenheim Investments (2010-2015); Chief Operating Officer, Macquarie Capital Investment Management (2007-2009). |
Amy J. Lee
(1961) | Vice President and Chief Legal Officer | Since 2007 (Vice President)
Since 2014 (Chief Legal Officer) | Current: Chief Legal Officer, certain other funds in the Fund Complex (2013-present); Senior Managing Director, Guggenheim Investments (2012-present).
Former: Vice President, Associate General Counsel and Assistant Secretary, Security Benefit Life Insurance Company and Security Benefit Corporation (2004-2012). |
Mark E. Mathiasen
(1978) | Secretary | Since 2014 | Current: Secretary, certain other funds in the Fund Complex (2007-present); Managing Director, Guggenheim Investments (2007-present). |
Glenn McWhinnie
(1969) | Assistant Treasurer | Since 2016 | Current: Vice President, Guggenheim Investments (2009-present).
Former: Tax Compliance Manager, Ernst & Young LLP (1996-2009). |
Michael P. Megaris
(1984) | Assistant Secretary | Since 2014 | Current: Assistant Secretary, certain other funds in the Fund Complex (2014-present); Vice President, Guggenheim Investments (2012-present).
Former: J.D., University of Kansas School of Law (2009-2012). |
28 | THE GUGGENHEIM FUNDS ANNUAL REPORT | |
INFORMATION ON BOARD OF TRUSTEES AND OFFICERS (Unaudited)(concluded) |
Name, Address* and Year of Birth | Position(s)
held with
the Trust | Term of Office and Length of Time Served** | Principal Occupations
During Past Five Years |
OFFICERS - continued | |
Elisabeth Miller
(1968) | Chief Compliance Officer | Since 2012 | Current: CCO, certain other funds in the Fund Complex (2012-present); CCO, Security Investors, LLC (2012-present); CCO, Guggenheim Funds Investment Advisors, LLC (2012-present); Managing Director, Guggenheim Investments (2012-present); Vice President, Guggenheim Funds Distributors, LLC (2014-present).
Former: CCO, Guggenheim Distributors, LLC (2009-2014); Senior Manager, Security Investors, LLC (2004-2009); Senior Manager, Guggenheim Distributors, LLC (2004-2009). |
Adam J. Nelson
(1979) | Assistant Treasurer | Since 2015 | Current: Vice President, Guggenheim Investments (2015-present); Assistant Treasurer, certain other funds in the Fund Complex (2015-present).
Former: Assistant Vice President and Fund Administration Director, State Street Corporation (2013-2015); Fund Administration Assistant Director, State Street (2011-2013); Fund Administration Manager, State Street (2009-2011). |
Kimberly J. Scott
(1974) | Assistant Treasurer | Since 2014 | Current: Vice President, Guggenheim Investments (2012-present) ; Assistant Treasurer, certain other funds in the Fund Complex (2012-present).
Former: Financial Reporting Manager, Invesco, Ltd. (2010-2011); Vice President/Assistant Treasurer, Mutual Fund Administration for Van Kampen Investments, Inc./Morgan Stanley Investment Management (2009-2010); Manager of Mutual Fund Administration, Van Kampen Investments, Inc./Morgan Stanley Investment Management (2005-2009). |
Bryan Stone
(1979) | Vice President | Since 2014 | Current: Vice President, certain other funds in the Fund Complex (2014-present); Director, Guggenheim Investments (2013-present).
Former: Senior Vice President, Neuberger Berman Group LLC (2009-2013); Vice President, Morgan Stanley (2002-2009). |
John L. Sullivan
(1955) | Chief Financial Officer and Treasurer | Since 2014 | Current: CFO, Chief Accounting Officer and Treasurer, certain other funds in the Fund Complex (2010-present); Senior Managing Director, Guggenheim Investments (2010-present).
Former: Managing Director and CCO, each of the funds in the Van Kampen Investments fund complex (2004-2010); Managing Director and Head of Fund Accounting and Administration, Morgan Stanley Investment Management (2002-2004); CFO and Treasurer, Van Kampen Funds (1996-2004). |
* | The business address of each officer is c/o Guggenheim Investments, 227 West Monroe Street, Chicago, Illinois 60606. |
** | Each officer serves an indefinite term, until his or her successor is duly elected and qualified. Time served includes time served in the respective position for the Predecessor Corporation. |
| | THE GUGGENHEIM FUNDS ANNUAL REPORT | 29 |
GUGGENHEIM INVESTMENTS PRIVACY POLICIES (Unaudited) |
Guggenheim Investments as used herein refers to Guggenheim Partners, LLC, Guggenheim Funds Investment Advisors, LLC, Guggenheim Partners Investment Management, LLC, Guggenheim Funds Distributors, LLC and Security Investors, LLC as well as the funds in the Guggenheim Funds complex (the “funds”).
Our Commitment to You
When you become a Guggenheim Investments investor, you entrust us with not only your hard-earned money but also with personal and financial information about you. We recognize that your relationship with us is based on trust and that you expect us to act responsibly and in your best interests. Because we have access to personal information about you, we hold ourselves to high standards in its safekeeping and use. This means, most importantly, that we do not sell client or account information to anyone—whether you are a current or former Guggenheim Investments client.
The Information We Collect About You and How We Collect It
In the course of doing business with shareholders and investors, we collect nonpublic personal information about you. You typically provide personal information when you complete a Guggenheim Investments account application or when you request a transaction that involves Rydex and Guggenheim Funds or one of the Guggenheim affiliated companies. “Nonpublic personal information” is personally identifiable information about you. For example it includes your name and address, Social Security or taxpayer identification number, assets, income, account balance, bank account information and investment activity (e.g. purchase and redemption history).
How We Share Your Personal Information
As a matter of policy, we do not disclose your nonpublic personal information to nonaffiliated third parties except as required or permitted by law. As emphasized above, we do not sell information about current or former clients or their accounts to third parties. Nor do we share such information, except when necessary to complete transactions at your request or to make you aware of related investment products and services that we offer. Additional details about how we handle your personal information are provided below.
To complete certain transactions or account changes that you direct, it may be necessary to provide your personal information to companies, individuals or groups that are not affiliated with Guggenheim Investments. For example if you ask to transfer assets from another financial institution to Guggenheim Investments, we will need to provide certain information about you to that company to complete the transaction. In connection with servicing your accounts or to alert you to other Guggenheim Investments investment products and services, we may share your information within the Guggenheim Investments family of affiliated companies. This would include, for example, sharing your information within Guggenheim Investments so we can make you aware of new funds or the services offered through another Guggenheim Investments affiliated company. In certain instances, we may contract with nonaffiliated companies to perform services for us. Where necessary, we will disclose information we have about you to these third parties. In all such cases, we provide the third party with only the information necessary to carry out its assigned responsibilities and only for that purpose. And we require these third parties to treat your personal information with the same high degree of confidentiality that we do. In certain instances, we may share information with other financial institutions regarding individuals and entities in response to the U.S.A. Patriot Act. Finally we will share personal information about you if we are compelled by law to do so, if you direct us to do so with your consent, or in other circumstances as permitted by law.
How We Safeguard Your Personal Information
We maintain physical, electronic and procedural safeguards to protect your personal information. Within Guggenheim Investments, access to such information is limited to those who need it to perform their jobs such as servicing your account, resolving problems or informing you of new products and services.
30 | THE GUGGENHEIM FUNDS ANNUAL REPORT | |
This page intentionally left blank.
This page intentionally left blank.
This page intentionally left blank.
9.30.2016
Guggenheim Funds Annual Report
| |
Guggenheim Macro Opportunities Fund | | |
GuggenheimInvestments.com | MO-ANN-0916x0917 |
DEAR SHAREHOLDER | 2 |
ECONOMIC AND MARKET OVERVIEW | 4 |
ABOUT SHAREHOLDERS’ FUND EXPENSES | 6 |
MACRO OPPORTUNITIES FUND | 9 |
NOTES TO CONSOLIDATED FINANCIAL STATEMENTS | 59 |
REPORT OF INDEPENDENT REGISTERED PUBLIC ACCOUNTING FIRM | 87 |
OTHER INFORMATION | 88 |
INFORMATION ON BOARD OF TRUSTEES AND OFFICERS | 103 |
GUGGENHEIM INVESTMENTS PRIVACY POLICIES | 110 |
| | THE GUGGENHEIM FUNDS ANNUAL REPORT | 1 |
Dear Shareholder:
Guggenheim Partners Investment Management, LLC (the “Investment Adviser”) is pleased to present the shareholder report for Guggenheim Macro Opportunities Fund (the “Fund”) for the annual fiscal period ended September 30, 2016.
The Investment Adviser is part of Guggenheim Investments, which represents the investment management businesses of Guggenheim Partners, LLC (“Guggenheim”), a global, diversified financial services firm.
Guggenheim Funds Distributors, LLC is the distributor of the Fund. Guggenheim Funds Distributors, LLC is affiliated with Guggenheim and the Investment Adviser.
We encourage you to read the Economic and Market Overview section of the report, which follows this letter, and then the Managers’ Commentary for the Fund.
We are committed to providing innovative investment solutions and appreciate the trust you place in us.
Sincerely,

Donald C. Cacciapaglia
President and Chief Executive Officer
October 31, 2016
Read a prospectus and summary prospectus (if available) carefully before investing. It contains the investment objectives, risks, charges, expenses and other information, which should be considered carefully before investing. Obtain a prospectus and summary prospectus (if available) at guggenheiminvestments.com or call 800.820.0888.
2 | THE GUGGENHEIM FUNDS ANNUAL REPORT | |
Macro Opportunities Fund may not be suitable for all investors. ● The Fund’s market value will change in response to interest rate changes and market conditions among other factors. In general, bond prices rise when interest rates fall and vice versa. ● The Fund’s exposure to high yield securities may subject the Fund to greater volatility. ● The intrinsic value of the underlying stocks in which the Fund invests may never be realized or the stock may decline in value. ● When market conditions are deemed appropriate, the Fund may use leverage to the full extent permitted by its investment policies and restrictions and applicable law. Leveraging will exaggerate the effect on net asset value of any increase or decrease in the market value of the Fund’s portfolio. ● The use of short selling involves increased risks and costs. You risk paying more for a security than you received from its sale. Theoretically, stocks sold short have the risk of unlimited losses. ● The Fund may invest in derivative instruments, which may be more volatile and less liquid, increasing the risk of loss when compared to traditional securities. Certain of the derivative instruments are also subject to the risks of counterparty default and adverse tax treatment. ● Instruments and strategies (such as borrowing transactions and reverse repurchase agreements) may provide leveraged exposure to a particular investment, which will magnify any gains or losses on those investments. ● Investments in reverse repurchase agreements expose the Fund to the many of the same risks as investments in derivatives. ● The Fund’s investments in other investment vehicles subject the Fund to those risks and expenses affecting the investment vehicle. ● The Fund’s investments in foreign securities carry additional risks when compared to U.S. securities, due to the impact of diplomatic, political or economic developments in the country in question (investments in emerging markets securities are generally subject to an even greater level of risks). ● Investments in syndicated bank loans generally offer a floating interest rate and involve special types of risks. ● A highly liquid secondary market may not exist for the commodity-linked structured notes the Fund invests in, and there can be no assurance that a highly liquid secondary market will develop. ● The Fund’s exposure to the commodity markets may subject the Fund to greater volatility as commodity-linked investments may be affected by changes in overall market movements, commodity index volatility, changes in interest rates or factors affecting a particular industry or commodity such as droughts, floods, weather, embargos, tariffs and international economic, political and regulatory developments. ● The Fund’s investments in municipal securities can be affected by events that affect the municipal bond market. ● The Fund’s investments in real estate securities subject the Fund to the same risks as direct investments in real estate, which is particularly sensitive to economic downturns. ● The Fund’s investments in restricted securities may involve financial and liquidity risk. ● You may have a gain or loss when you sell your shares. ● It is important to note that the Fund is not guaranteed by the U.S. government. ● This Fund is considered nondiversified and can invest a greater portion of its assets in securities of individual issuers than a diversified fund. As a result, changes in the market value of a single security could cause greater fluctuations in the value of fund shares than would occur in a more diversified fund. ● Please read the prospectus for more detailed information regarding these and other risks.
| | THE GUGGENHEIM FUNDS ANNUAL REPORT | 3 |
ECONOMIC AND MARKET OVERVIEW (Unaudited) | September 30, 2016 |
Economic growth continues to rebound, even though the rise in U.S. Gross Domestic Product (“GDP”) disappointed in the first half of 2016. There was a large headwind from inventory drawdowns, which should soon reverse after five quarters of dragging on growth. Real GDP growth is expected to be around 2.5 percent in the second half of the year, driven by consumption, housing, and a fading trade drag, and supporting the view that U.S. economic growth remains resilient to global weakness.
The euro zone economy is slowly improving, but inflation will likely persist well below the European Central Bank’s (“ECB”) target in the coming quarters due to substantial slack. The ECB has indicated that more quantitative easing is possible, but will soon need to alter the quantitative easing program in order to keep up their purchase pace. Both China and Japan need weaker currencies. Chinese growth and capital flows have stabilized for now, but surging construction and a credit boom raise the prospect of future instability. Japan’s economic prospects are weak, and inflation remains far from the Bank of Japan’s (“BOJ”) target. The surging yen could drive further policy easing, including an increase in fiscal stimulus.
It appears the U.S. Federal Reserve (the “Fed”) will move forward with raising rates in December, absent any economic or geopolitical surprise or a meaningful tightening of financial conditions over the fourth quarter. But key events could influence risk asset performance for the balance of the year: A continued recovery in oil prices following the Organization of Petroleum Exporting Countries (“OPEC”) agreement to keep production between 32.5 to 33 million barrels per day would help sustain the rally (although we are skeptical that they will adhere to any quota based on historical production levels). Global oil inventories remain high, but supply and demand are moving toward balance. A rebound in GDP growth would also lift U.S. equity and corporate bond prices higher.
The macroeconomic picture remains the same; we are not on the verge of a recession. But despite our positive outlook on the U.S. economy, valuations across risk assets argue for caution. Ongoing accommodation from central bankers across the globe has alleviated much of the initial macroeconomic tail risk posed by Brexit but may not be enough to dampen the seasonal volatility typically observed in the fourth quarter. Ongoing troubles in the banking sector, such as the woes afflicting Deutsche Bank and Wells Fargo, coupled with uncertainty surrounding upcoming political events, which include the new Trump administration, the Italian constitutional referendum, and key European elections, may create volatility for risk assets for the balance of the year.
For the 12 months ended September 30, 2016, the Standard & Poor’s 500® (“S&P 500®”) Index* returned 15.43%. The MSCI Europe-Australasia-Far East (“EAFE”) Index* returned 6.52%. The return of the MSCI Emerging Markets Index* was 16.78%.
In the bond market, the Bloomberg Barclays U.S. Aggregate Bond Index* posted a 5.19% return for the period, while the Bloomberg Barclays U.S. Corporate High Yield Index* returned 12.73%. The return of the Bank of America (“BofA”) Merrill Lynch 3-Month U.S. Treasury Bill Index* was 0.28% for the 12-month period.
4 | THE GUGGENHEIM FUNDS ANNUAL REPORT | |
ECONOMIC AND MARKET OVERVIEW (Unaudited)(concluded) | September 30, 2016 |
The opinions and forecasts expressed may not actually come to pass. This information is subject to change at any time, based on market and other conditions, and should not be construed as a recommendation of any specific security or strategy.
*Index Definitions
The following indices are referenced throughout this report. Indices are unmanaged and not available for direct investment. Index performance does not reflect transaction costs, fees, or expenses.
BofA Merrill Lynch 3-Month U.S. Treasury Bill Index is an unmanaged market Index of U.S. Treasury securities maturing in 90 days that assumes reinvestment of all income.
Bloomberg Barclays U.S. Aggregate Bond Index is a broad-based flagship benchmark that measures the investment grade, U.S. dollar-denominated, fixed-rate taxable bond market, including U.S. Treasuries, government-related and corporate securities, mortgage-backed securities or “MBS” (agency fixed-rate and hybrid adjustable-rate mortgage, or “ARM”, pass-throughs), asset-backed securities (“ABS”), and commercial mortgage-backed securities (“CMBS”) (agency and non-agency).
Bloomberg Barclays U.S. Corporate High Yield Index measures the U.S. dollar-denominated, high yield, fixed-rate corporate bond market. Securities are classified as high yield if the middle rating of Moody’s, Fitch, and S&P is Ba1/BB +/BB + or below.
BofA Merrill Lynch 3-Month U.S. Treasury Bill Index is an unmanaged market Index of U.S. Treasury securities maturing in 90 days that assumes reinvestment of all income.
MSCI EAFE Index is a capitalization-weighted measure of stock markets in Europe, Australasia, and the Far East.
MSCI Emerging Markets Index is a free float-adjusted market capitalization-weighted index that is designed to measure equity market performance in the global emerging markets.
S&P 500® Index is a broad-based index, the performance of which is based on the performance of 500 widely held common stocks chosen for market size, liquidity, and industry group representation.
| | THE GUGGENHEIM FUNDS ANNUAL REPORT | 5 |
ABOUT SHAREHOLDERS’ FUND EXPENSES |
All mutual funds have operating expenses, and it is important for our shareholders to understand the impact of costs on their investments. Shareholders of a fund incur two types of costs: (i) transaction costs, including sales charges (loads) on purchase payments, reinvested dividends, other distributions, and exchange fees, and (ii) ongoing costs, including management fees, administrative services, and shareholder reports, among others. These ongoing costs, or operating expenses, are deducted from a fund’s gross income and reduce the investment return of the fund.
A fund’s expenses are expressed as a percentage of its average net assets, which is known as the expense ratio. The following examples are intended to help investors understand the ongoing costs (in dollars) of investing in a fund and to compare these costs with the ongoing costs of investing in other mutual funds.
The examples are based on an investment of $1,000 made at the beginning of the period and held for the entire six-month period beginning March 31, 2016 and ending September 30, 2016.
The following tables illustrate the Fund’s costs in two ways:
Table 1. Based on actual Fund return: This section helps investors estimate the actual expenses paid over the period. The “Ending Account Value” shown is derived from the Fund’s actual return, and the fifth column shows the dollar amount that would have been paid by an investor who started with $1,000 in the Fund. Investors may use the information here, together with the amount invested, to estimate the expenses paid over the period. Simply divide the Fund’s account value by $1,000 (for example, an $8,600 account value divided by $1,000 = 8.6), then multiply the result by the number provided under the heading “Expenses Paid During Period.”
Table 2. Based on hypothetical 5% return: This section is intended to help investors compare a Fund’s cost with those of other mutual funds. The table provides information about hypothetical account values and hypothetical expenses based on the Fund’s actual expense ratio and an assumed rate of return of 5% per year before expenses, which is not the Fund’s actual return. The hypothetical account values and expenses may not be used to estimate the actual ending account balance or expenses paid during the period. The example is useful in making comparisons because the U.S. Securities and Exchange Commission (the “SEC”) requires all mutual funds to calculate expenses based on the 5% return. Investors can assess a Fund’s costs by comparing this hypothetical example with the hypothetical examples that appear in shareholder reports of other funds.
The calculations illustrated above assume no shares were bought or sold during the period. Actual costs may have been higher or lower, depending on the amount of investment and the timing of any purchases or redemptions.
6 | THE GUGGENHEIM FUNDS ANNUAL REPORT | |
ABOUT SHAREHOLDERS’ FUND EXPENSES (Unaudited)(continued) |
Please note that the expenses shown in the table are meant to highlight your ongoing costs only and do not reflect any transactional costs, such as sales charges (loads) on purchase payments, and contingent deferred sales charges (“CDSC”) on redemptions, if any. Therefore, the second table is useful in comparing ongoing costs only, and will not help you determine the relative total costs of owning different funds. In addition, if these transactional costs were included, your costs would have been higher.
More information about the Fund’s expenses, including annual expense ratios for periods up to five years (subject to the Fund’s inception date), can be found in the Financial Highlights section of this report. For additional information on operating expenses and other shareholder costs, please refer to the Fund’s prospectus.
| | THE GUGGENHEIM FUNDS ANNUAL REPORT | 7 |
ABOUT SHAREHOLDERS’ FUND EXPENSES (Unaudited)(concluded) |
| | Expense
Ratio1 | Fund
Return | Beginning
Account Value
March 31,
2016 | Ending
Account Value
September 30,
2016 | Expenses
Paid During
Period2 |
Table 1. Based on actual Fund return3 |
Macro Opportunities Fund |
A-Class | 1.38% | 7.40% | $ 1,000.00 | $ 1,074.00 | $ 7.17 |
C-Class | 2.12% | 6.99% | 1,000.00 | 1,069.90 | 11.00 |
P-Class | 1.23% | 7.52% | 1,000.00 | 1,075.20 | 6.40 |
Institutional Class | 0.97% | 7.61% | 1,000.00 | 1,076.10 | 5.05 |
|
Table 2. Based on hypothetical 5% return (before expenses) |
Macro Opportunities Fund |
A-Class | 1.38% | 5.00% | $ 1,000.00 | $ 1,018.15 | $ 6.98 |
C-Class | 2.12% | 5.00% | 1,000.00 | 1,014.44 | 10.71 |
P-Class | 1.23% | 5.00% | 1,000.00 | 1,018.90 | 6.23 |
Institutional Class | 0.97% | 5.00% | 1,000.00 | 1,020.21 | 4.91 |
1 | Annualized and excludes expenses of the underlying funds in which the Funds invest. |
2 | Expenses are equal to the Fund's annualized expense ratio, net of any applicable fee waivers, multiplied by the average account value over the period, multiplied by 183/365 (to reflect the one-half year period). |
3 | Actual cumulative return at net asset value for the period March 31, 2016 to September 30, 2016. |
8 | THE GUGGENHEIM FUNDS ANNUAL REPORT | |
MANAGERS’ COMMENTARY (Unaudited) | |
To Our Shareholders
Guggenheim Macro Opportunities Fund (the “Fund”) is managed by a team of seasoned professionals, including B. Scott Minerd, Chairman of Investments and Global Chief Investment Officer; Anne B. Walsh, Senior Managing Director and Assistant Chief Investment Officer; Kevin H. Gundersen, Senior Managing Director and Portfolio Manager; James W. Michal, Senior Managing Director and Portfolio Manager; Steven H. Brown, CFA, Managing Director and Portfolio Manager; and Adam Bloch, Director and Portfolio Manager. In the following paragraphs, the investment team discusses the market environment and the Fund’s performance for the fiscal year ended September 30, 2016.
For the one-year period ended September 30, 2016, Guggenheim Macro Opportunities Fund returned 5.57%1, compared with the 0.28% return of its benchmark, the Bank of America Merrill Lynch 3-Month U.S. Treasury Bill Index.
The Fund seeks to provide total return, comprised of current income and capital appreciation. Unconstrained to a benchmark, the Fund has the flexibility to invest across a broad array of fixed-income securities, as well as equities, commodities, and alternative investments.
At the start of the period, the U.S. Federal Reserve (the “Fed”) announced a 25-basis-point increase in the federal funds target rate from 0–25 basis points to a range of 25–50 basis points on December 16, 2015. A number of other key events fueled the risk-off sentiment in the fourth quarter of 2015 that continued into 2016, but three were particularly damaging to risk assets. The first was the release of the much stronger-than-expected U.S. employment report in early November 2015, which boosted the odds that the Fed would begin raising interest rates. The second event was the European Central Bank’s (“ECB”) announcement of new stimulus measures at its December 2015 meeting, which disappointed market expectations. The third event was the December 2015 announcement by the Organization of Petroleum Exporting Countries (“OPEC”) that its members would continue to pump approximately 31.5 million barrels of crude oil per day. Risk assets rallied, however, in the latter half of the first quarter of 2016, led by a dovish pivot in Fed communication and positive economic data which helped to combat recession fears. By conveying a more cautious policy outlook, the Fed helped spur a reversal of dollar strength, a rally in crude oil, and spread tightening across risk assets.
The rally in risk assets that began in February 2016 was briefly interrupted in June by the UK’s vote to leave the European Union. Despite the two-day selloff following the UK vote, high-yield bonds and bank loans held up. Current valuations in energy bonds indicate that leveraged credit has further room to rally as we pass the worst of the commodity related distress, but volatility is expected to remain elevated. A positive outlook for the U.S. economy, a cautious Fed, and stabilizing oil prices support our constructive view on corporate credit assets.
The Fund’s positive returns were largely attributable to the Fund’s carry as well as the tightening of credit spreads. Positive returns were driven largely by the allocation to ABS (asset-backed securities, including collateralized loan obligations, or CLOs), bank loans, mortgage-backed securities (including commercial mortgage-backed securities and non-Agency residential mortgage-backed securities, or non-Agency RMBS), high yield bonds, and preferred securities.
The Fund makes macro-themed investments to take positions based on its views of various markets and assets, typically over long investment horizons, which may involve derivatives. It also uses derivatives to manage duration and currency exposure.
The chief attributes of the Fund over the period were maintaining low effective duration of a little more than one year and significant holdings in structured credit, including ABS and CLOs, as well as bank loans and high yield corporate bonds. Most of the Fund’s structured credit holdings feature floating rate coupons, yields higher than traditional securitized assets like auto or credit-card receivables, and, often, investment-grade ratings. The Fund believes that ABS and CLOs offer some downside protection, and amortizing structures to keep credit exposure lower over time. Floating rate instruments accounted for about half the Fund’s holdings at the end of the period.
Over the period, the Fund increased its exposure to ABS, bank loans, and high yield bonds, while exposure to non-Agency RMBS declined.
| | THE GUGGENHEIM FUNDS ANNUAL REPORT | 9 |
MANAGERS’ COMMENTARY (Unaudited)(concluded) | |
The Fund invests excess cash into the Guggenheim Strategy Funds which, in turn, invest in a diversified portfolio of debt securities and financial instruments providing exposure to fixed income markets. The investment objective of the Guggenheim Strategy Funds is to seek a high level of income consistent with the preservation of capital. For the one -year period ended September 30, 2016, investment in the Guggenheim Strategy Funds has benefited Fund performance relative to investing in other short-term investments.
Performance displayed represents past performance which is no guarantee of future results.
1 | Performance figures are based on Class A shares and do not reflect deduction of the sales charges or taxes that a shareholder would pay on distributions or the redemption of shares. |
The opinions and forecast expressed may not actually come to pass. This information is subject to change at any time, based on market and other conditions, and should not be construed as a recommendation of any specific security or strategy.
10 | THE GUGGENHEIM FUNDS ANNUAL REPORT | |
PERFORMANCE REPORT AND FUND PROFILE (Unaudited) | September 30, 2016 |
MACRO OPPORTUNITIES FUND
OBJECTIVE: Seeks to provide total return, comprised of current income and capital appreciation.
Consolidated Holdings Diversification (Market Exposure as % of Net Assets)
“Consolidated Holdings Diversification (Market Exposure as % of Net Assets)” excludes any temporary cash investments or investments in Guggenheim Strategy Funds Trust mutual funds. Investments in those Funds do not provide “market exposure” to meet the Fund’s investment objective, but will significantly increase the portfolio’s exposure to certain other asset categories (and their associated risks), which may cause the Fund to deviate from its principal investment strategy, including: (i) high yield, high risk debt securities rated below the top four long-term rating categories by a nationally recognized statistical rating organization (also known as “junk bonds”); (ii) securities issued by the U.S. government or its agencies and instrumentalities; (iii) CLOs and similar investments; and (iv) other short-term fixed income securities.
| | THE GUGGENHEIM FUNDS ANNUAL REPORT | 11 |
PERFORMANCE REPORT AND FUND PROFILE (Unaudited)(continued) | September 30, 2016 |
Inception Dates: |
A-Class | November 30, 2011 |
C-Class | November 30, 2011 |
P-Class | May 1, 2015 |
Institutional Class | November 30, 2011 |
Ten Long Largest Holdings (% of Total Net Assets) |
Guggenheim Strategy Fund I | 2.4% |
Guggenheim Alpha Opportunity Fund - Institutional Class | 1.5% |
Guggenheim Limited Duration Fund - Institutional Class | 1.5% |
Motel 6 Trust | 1.0% |
Triaxx Prime CDO Ltd. | 0.9% |
GS Mortgage Securities Corporation Trust | 0.9% |
ECAF I Ltd. | 0.8% |
Banc of America Funding Ltd. | 0.8% |
Kenya Government International Bond | 0.8% |
Dominican Republic International Bond | 0.7% |
Top Ten Total | 11.3% |
“Ten Long Largest Holdings” excludes any temporary cash or derivative investments. |
Portfolio Composition by Quality Rating1 |
Rating | % of Total Investments |
Fixed Income Instruments | |
AAA | 1.2% |
AA | 2.4% |
A | 13.8% |
BBB | 22.2% |
BB | 13.3% |
B | 18.8% |
CCC | 6.1% |
CC | 0.3% |
NR2 | 9.5% |
Other Instruments | 12.4% |
Total Investments | 100.0% |
The chart above reflects percentages of the value of total investments. |
1 | Source: BlackRock Solutions. Credit quality ratings are measured on a scale that generally ranges from AAA (highest) to D (lowest). All securities except for those labeled “NR” have been rated by a Nationally Recognized Statistical Rating Organization (“NRSRO”). For purposes of this presentation, when ratings are available from more than one agency, the highest rating is used. Guggenheim Investments converts ratings to the equivalent S&P rating. Security ratings are determined at the time of purchase and may change thereafter. |
2 | NR securities do not necessarily indicate low credit quality. |
12 | THE GUGGENHEIM FUNDS ANNUAL REPORT | |
PERFORMANCE REPORT AND FUND PROFILE (Unaudited)(concluded) | September 30, 2016 |
Cumulative Fund Performance*

Average Annual Returns*
Periods Ended September 30, 2016
| | 1 Year | Since
Inception
(11/30/11) |
A-Class Shares | 5.57% | 6.01% |
A-Class Shares with sales charge† | 0.56% | 4.95% |
C-Class Shares | 4.79% | 5.24% |
C-Class Shares with CDSC‡ | 3.79% | 5.24% |
Institutional Class shares | 5.97% | 6.38% |
BofA Merrill Lynch 3-Month U.S. Treasury Bill Index | 0.28% | 0.11% |
| | 1 Year | Since
Inception
(05/01/15) |
P-Class Shares | 5.74% | 3.32% |
BofA Merrill Lynch 3-Month U.S. Treasury Bill Index | 0.28% | 0.11% |
* | The performance data above represents past performance that is not predictive of future results. The investment return and principal value of an investment in the Fund will fluctuate so that an investor’s shares, when redeemed, may be worth more or less than their original cost. Returns are historical and include changes in principal and reinvested dividends and capital gains and do not reflect the effect of taxes. The BofA Merrill Lynch 3-Month U.S. Treasury Bill Index is an unmanaged index and, unlike the Fund, has no management fees or operating expenses to reduce its reported return. The graph is based on A-Class shares only; performance for C-Class shares, P-Class shares and Institutional Class shares will vary due to differences in fee structures. |
† | Effective October 1, 2015, the maximum sales charge decreased from 4.75% to 4.00%. A 4.75% maximum sales charge is used in the calculation of the Average Annual Returns (based on subscriptions made prior to October 1, 2015), and a 4.00% maximum sales charge will be used to calculate performance for periods based on subscriptions made on or after October 1, 2015. |
‡ | Fund returns include a CDSC of 1% if redeemed within 12 months of purchase. |
| | THE GUGGENHEIM FUNDS ANNUAL REPORT | 13 |
CONSOLIDATED SCHEDULE OF INVESTMENTS | September 30, 2016 |
MACRO OPPORTUNITIES FUND | |
| | Shares | | | Value | |
| | | | | | | |
COMMON STOCKS† - 2.8% | |
| | | | | | | |
Consumer, Non-cyclical - 0.7% | |
Gilead Sciences, Inc.1 | | | 19,181 | | | $ | 1,517,600 | |
UnitedHealth Group, Inc.2 | | | 9,555 | | | | 1,337,699 | |
Kroger Co.1 | | | 42,883 | | | | 1,272,767 | |
WellCare Health Plans, Inc.*,1 | | | 10,288 | | | | 1,204,622 | |
HCA Holdings, Inc.*,1 | | | 14,595 | | | | 1,103,820 | |
Cardinal Health, Inc.1 | | | 12,227 | | | | 950,038 | |
Molina Healthcare, Inc.*,1 | | | 16,120 | | | | 940,118 | |
Express Scripts Holding Co.*,1 | | | 13,295 | | | | 937,696 | |
Biogen, Inc.*,1 | | | 2,995 | | | | 937,525 | |
AbbVie, Inc.1 | | | 14,738 | | | | 929,526 | |
Sanderson Farms, Inc.1 | | | 9,571 | | | | 921,974 | |
Laboratory Corporation of America Holdings*,1 | | | 6,601 | | | | 907,506 | |
Tyson Foods, Inc. — Class A1 | | | 11,359 | | | | 848,177 | |
McKesson Corp.1 | | | 5,061 | | | | 843,922 | |
Quest Diagnostics, Inc.1 | | | 9,359 | | | | 792,052 | |
United Therapeutics Corp.*,1 | | | 6,552 | | | | 773,660 | |
JM Smucker Co.1 | | | 5,676 | | | | 769,325 | |
Universal Health Services, Inc. — Class B1 | | | 6,219 | | | | 766,305 | |
Dr Pepper Snapple Group, Inc.1 | | | 8,044 | | | | 734,498 | |
Dean Foods Co.1 | | | 42,574 | | | | 698,214 | |
Ingredion, Inc.1 | | | 5,149 | | | | 685,126 | |
Darling Ingredients, Inc.*,1 | | | 48,752 | | | | 658,640 | |
Western Union Co.1 | | | 27,423 | | | | 570,947 | |
Charles River Laboratories International, Inc.*,1 | | | 6,417 | | | | 534,793 | |
Whole Foods Market, Inc. | | | 18,393 | | | | 521,442 | |
Kimberly-Clark Corp. | | | 3,887 | | | | 490,306 | |
Johnson & Johnson1 | | | 4,102 | | | | 484,569 | |
LifePoint Health, Inc.*,1 | | | 7,697 | | | | 455,893 | |
SpartanNash Co.1 | | | 15,621 | | | | 451,759 | |
Coty, Inc. — Class A* | | | 18,760 | | | | 440,860 | |
Hologic, Inc.*,1 | | | 11,315 | | | | 439,361 | |
ResMed, Inc.1 | | | 5,969 | | | | 386,732 | |
Deluxe Corp.1 | | | 5,704 | | | | 381,141 | |
VCA, Inc.*,1 | | | 5,123 | | | | 358,508 | |
Chemed Corp.1 | | | 2,501 | | | | 352,816 | |
Hill-Rom Holdings, Inc.1 | | | 5,511 | | | | 341,572 | |
Henry Schein, Inc.*,1 | | | 2,035 | | | | 331,664 | |
Air Methods Corp.*,1 | | | 9,941 | | | | 313,042 | |
Magellan Health, Inc.*,1 | | | 5,626 | | | | 302,285 | |
Sarepta Therapeutics, Inc.* | | | 2,680 | | | | 164,579 | |
Targus Group International Equity, Inc*,†††,3 | | | 13,186 | | | | 19,252 | |
Total Consumer, Non-cyclical | | | | 27,872,331 | |
| | | | | | | | | |
Financial - 0.5% | |
California Republic Bancorp* | | | 166,500 | | | | 6,187,141 | |
Travelers Companies, Inc.1 | | | 9,320 | | | | 1,067,606 | |
Aflac, Inc.1 | | | 12,185 | | | | 875,736 | |
Prudential Financial, Inc.1 | | | 10,417 | | | | 850,548 | |
Everest Re Group Ltd.1 | | | 3,935 | | | | 747,532 | |
State Street Corp.1 | | | 9,786 | | | | 681,399 | |
Principal Financial Group, Inc.1 | | | 12,838 | | | | 661,285 | |
Interactive Brokers Group, Inc. — Class A1 | | | 17,244 | | | | 608,196 | |
JPMorgan Chase & Co.1 | | | 7,985 | | | | 531,721 | |
Selective Insurance Group, Inc.1 | | | 12,294 | | | | 490,039 | |
Allstate Corp.1 | | | 6,732 | | | | 465,720 | |
American Financial Group, Inc.1 | | | 5,974 | | | | 448,050 | |
Aspen Insurance Holdings Ltd.1 | | | 9,339 | | | | 435,104 | |
Hanover Insurance Group, Inc.1 | | | 5,445 | | | | 410,662 | |
14 | THE GUGGENHEIM FUNDS ANNUAL REPORT | SEE NOTES TO FINANCIAL STATEMENTS. |
CONSOLIDATED SCHEDULE OF INVESTMENTS (continued) | September 30, 2016 |
MACRO OPPORTUNITIES FUND | |
| | Shares | | | Value | |
| | | | | | | |
MetLife, Inc.1 | | | 9,221 | | | $ | 409,689 | |
Signature Bank*,1 | | | 3,147 | | | | 372,762 | |
WR Berkley Corp.1 | | | 6,124 | | | | 353,722 | |
RenaissanceRe Holdings Ltd. | | | 2,709 | | | | 325,513 | |
Hartford Financial Services Group, Inc.1 | | | 7,573 | | | | 324,276 | |
Torchmark Corp. | | | 4,950 | | | | 316,256 | |
Home BancShares, Inc. | | | 2,703 | | | | 56,249 | |
Total Financial | | | | | | | 16,619,206 | |
| | | | | | | | | |
Technology - 0.4% | |
Xerox Corp.1 | | | 101,085 | | | | 1,023,991 | |
HP, Inc.1 | | | 55,508 | | | | 862,039 | |
SYNNEX Corp.1 | | | 7,410 | | | | 845,555 | |
Apple, Inc.1 | | | 7,234 | | | | 817,804 | |
CA, Inc.1 | | | 24,010 | | | | 794,251 | |
NetApp, Inc.1 | | | 21,014 | | | | 752,721 | |
International Business Machines Corp.1 | | | 4,508 | | | | 716,095 | |
Tessera Technologies, Inc.1 | | | 18,569 | | | | 713,792 | |
Convergys Corp.1 | | | 22,526 | | | | 685,241 | |
Oracle Corp.1 | | | 16,274 | | | | 639,243 | |
CACI International, Inc. — Class A*,1 | | | 4,813 | | | | 485,632 | |
IPG Photonics Corp.*,1 | | | 5,812 | | | | 478,618 | |
Allscripts Healthcare Solutions, Inc.*,1 | | | 34,818 | | | | 458,553 | |
NCR Corp.*,1 | | | 12,718 | | | | 409,393 | |
Teradata Corp.*,1 | | | 12,729 | | | | 394,599 | |
Mentor Graphics Corp.1 | | | 13,524 | | | | 357,575 | |
Sykes Enterprises, Inc.*,1 | | | 12,530 | | | | 352,469 | |
Seagate Technology plc | | | 8,827 | | | | 340,281 | |
Fiserv, Inc.*,1 | | | 3,206 | | | | 318,901 | |
Broadridge Financial Solutions, Inc.1 | | | 4,614 | | | | 312,783 | |
VeriFone Systems, Inc.*,1 | | | 19,618 | | | | 308,787 | |
DST Systems, Inc.1 | | | 2,591 | | | | 305,531 | |
Icad, Inc.*,1 | | | 54,863 | | | | 285,288 | |
Qlik Technologies, Inc. A*,††,3 | | | 177 | | | | 176,810 | |
Qlik Technologies, Inc.*,†††,3 | | | 11,400 | | | | 11,400 | |
Qlik Technologies, Inc. B*,††,3 | | | 43,738 | | | | 1,786 | |
Total Technology | | | | | | | 12,849,138 | |
| | | | | | | | | |
Industrial - 0.4% | |
Fluor Corp.1 | | | 22,967 | | | | 1,178,666 | |
Cummins, Inc.1 | | | 6,483 | | | | 830,796 | |
Huntington Ingalls Industries, Inc.1 | | | 5,004 | | | | 767,714 | |
Arrow Electronics, Inc.*,1 | | | 10,420 | | | | 666,568 | |
EMCOR Group, Inc.1 | | | 10,391 | | | | 619,511 | |
Boeing Co.1 | | | 4,653 | | | | 612,986 | |
ITT, Inc.1 | | | 16,287 | | | | 583,726 | |
Vishay Intertechnology, Inc.1 | | | 35,279 | | | | 497,082 | |
Crane Co.1 | | | 7,557 | | | | 476,167 | |
Sanmina Corp.*,1 | | | 15,635 | | | | 445,128 | |
Methode Electronics, Inc.1 | | | 12,694 | | | | 443,909 | |
Barnes Group, Inc.1 | | | 10,711 | | | | 434,331 | |
Saia, Inc.*,1 | | | 14,300 | | | | 428,429 | |
Keysight Technologies, Inc.*,1 | | | 13,259 | | | | 420,178 | |
Timken Co.1 | | | 11,424 | | | | 401,439 | |
Federal Signal Corp.1 | | | 28,802 | | | | 381,915 | |
Applied Industrial Technologies, Inc.1 | | | 7,954 | | | | 371,770 | |
ArcBest Corp.1 | | | 19,216 | | | | 365,489 | |
Mueller Industries, Inc.1 | | | 11,117 | | | | 360,413 | |
United Parcel Service, Inc. — Class B | | | 3,154 | | | | 344,921 | |
Tech Data Corp.* | | | 3,766 | | | | 319,018 | |
Rockwell Collins, Inc.1 | | | 3,779 | | | | 318,721 | |
Landstar System, Inc.1 | | | 4,618 | | | | 314,393 | |
Werner Enterprises, Inc.1 | | | 13,449 | | | | 312,958 | |
Avnet, Inc.1 | | | 7,489 | | | | 307,498 | |
Total Industrial | | | | | | | 12,203,726 | |
SEE NOTES TO FINANCIAL STATEMENTS. | THE GUGGENHEIM FUNDS ANNUAL REPORT | 15 |
CONSOLIDATED SCHEDULE OF INVESTMENTS (continued) | September 30, 2016 |
MACRO OPPORTUNITIES FUND | |
| | Shares | | | Value | |
| | | | | | | |
Communications - 0.3% | |
AT&T, Inc.1 | | | 34,502 | | | $ | 1,401,125 | |
Verizon Communications, Inc.1 | | | 24,917 | | | | 1,295,186 | |
Cisco Systems, Inc.1 | | | 36,837 | | | | 1,168,470 | |
InterDigital, Inc.1 | | | 12,188 | | | | 965,290 | |
Time Warner, Inc.1 | | | 11,604 | | | | 923,795 | |
Viacom, Inc. — Class B1 | | | 19,223 | | | | 732,396 | |
AMC Networks, Inc. — Class A*,1 | | | 11,875 | | | | 615,838 | |
Cengage Learning Acquisitions, Inc.*,†† | | | 21,660 | | | | 525,255 | |
Comcast Corp. — Class A1 | | | 7,761 | | | | 514,865 | |
ATN International, Inc.1 | | | 7,535 | | | | 490,076 | |
Total Communications | | | | | | | 8,632,296 | |
| | | | | | | | | |
Consumer, Cyclical - 0.2% | |
Wal-Mart Stores, Inc.1 | | | 22,031 | | | | 1,588,876 | |
CVS Health Corp.1 | | | 17,829 | | | | 1,586,603 | |
UniFirst Corp.1 | | | 8,393 | | | | 1,106,701 | |
Delta Air Lines, Inc.1 | | | 25,168 | | | | 990,613 | |
Southwest Airlines Co.1 | | | 14,341 | | | | 557,722 | |
Hawaiian Holdings, Inc.*,1 | | | 9,003 | | | | 437,546 | |
Dana, Inc.1 | | | 21,876 | | | | 341,047 | |
Thor Industries, Inc.1 | | | 3,996 | | | | 338,461 | |
Macy’s, Inc.1 | | | 8,947 | | | | 331,486 | |
Total Consumer, Cyclical | | | | | | | 7,279,055 | |
| | | | | | | | | |
Utilities - 0.2% | |
Consolidated Edison, Inc.1 | | | 13,599 | | | | 1,024,004 | |
Public Service Enterprise Group, Inc.1 | | | 19,781 | | | | 828,230 | |
Pinnacle West Capital Corp.1 | | | 9,548 | | | | 725,553 | |
Southwest Gas Corp.1 | | | 10,231 | | | | 714,737 | |
CenterPoint Energy, Inc.1 | | | 27,326 | | | | 634,783 | |
Edison International2 | | | 8,758 | | | | 632,766 | |
American Electric Power Company, Inc.1 | | | 9,500 | | | | 609,995 | |
AES Corp.1 | | | 37,232 | | | | 478,431 | |
Vectren Corp.1 | | | 8,690 | | | | 436,238 | |
DTE Energy Co.1 | | | 4,001 | | | | 374,774 | |
OGE Energy Corp.1 | | | 10,703 | | | | 338,429 | |
American Water Works Company, Inc.1 | | | 4,117 | | | | 308,116 | |
Total Utilities | | | | | | | 7,106,056 | |
| | | | | | | | | |
Energy - 0.1% | |
Titan Energy LLC* | | | 35,116 | | | | 1,035,922 | |
First Solar, Inc.*,1 | | | 10,005 | | | | 395,097 | |
Rowan Companies plc — Class A | | | 24,342 | | | | 369,025 | |
Total Energy | | | | | | | 1,800,044 | |
| | | | | | | | | |
Basic Materials - 0.0% | |
Mirabela Nickel Ltd.*,†††,3 | | | 7,057,522 | | | | 540 | |
| | | | | | | | | |
Total Common Stocks | | | | | | | | |
(Cost $90,547,364) | | | | | | | 94,362,392 | |
| | | | | | | | | |
PREFERRED STOCKS†† - 0.5% | |
Industrial - 0.4% | |
Seaspan Corp. 6.38% due 04/30/193 | | | 572,000 | | | | 14,528,800 | |
| | | | | | | | | |
Financial - 0.1% | |
Cent CLO 16, LP due 08/1/24*,5 | | | 7,000 | | | | 3,381,804 | |
BreitBurn Energy Partners 8.00% due 12/31/49*,†††,3 | | | 389,684 | | | | 60,731 | |
GSC Partners CDO Fund V Ltd. due 11/20/16*,†††,5,7 | | | 5,200 | | | | 1 | |
Total Financial | | | | | | | 3,442,536 | |
Total Preferred Stocks | | | | | | | | |
(Cost $21,452,435) | | | | | | | 17,971,336 | |
16 | THE GUGGENHEIM FUNDS ANNUAL REPORT | SEE NOTES TO FINANCIAL STATEMENTS. |
CONSOLIDATED SCHEDULE OF INVESTMENTS (continued) | September 30, 2016 |
MACRO OPPORTUNITIES FUND | |
| | Shares | | | Value | |
| | | | | | | |
WARRANTS†† - 0.0% | |
Comstock Resources, Inc. | | | | | | |
$0.01, 09/06/18 | | | 15,538 | | | $ | 2 | |
Total Warrants | | | | | | | | |
(Cost $—) | | | | | | | 2 | |
| | | | | | | | | |
MUTUAL FUNDS† - 6.6% | |
Guggenheim Strategy Fund I8 | | | 3,255,053 | | | | 81,343,779 | |
Guggenheim Alpha Opportunity Fund - Institutional Class8 | | | 1,881,326 | | | | 50,457,164 | |
Guggenheim Limited Duration Fund - Institutional Class8 | | | 1,951,150 | | | | 48,212,909 | |
Guggenheim Risk Managed Real Estate Fund - Institutional Class8 | | | 476,898 | | | | 13,911,113 | |
Guggenheim High Yield Fund - Insitutional Class8 | | | 1,467,807 | | | | 13,357,046 | |
Guggenheim Floating Rate Strategies Fund - Institutional Class8 | | | 477,649 | | | | 12,390,218 | |
Total Mutual Funds | | | | | | | | |
(Cost $215,711,306) | | | | | | | 219,672,229 | |
| | | | | | | | | |
SHORT-TERM INVESTMENTS† - 5.8% | |
Federated U.S. Treasury Cash Reserve Fund - Institutional Shares 0.17%9 | | | 187,748,900 | | | | 187,748,900 | |
Western Asset Institutional U.S. Treasury Reserves - Institutional Shares 0.18%9 | | | 6,528,508 | | | | 6,528,508 | |
Total Short-Term Investments | | | | | |
(Cost $194,277,408) | | | | | | | 194,277,408 | |
| | | Face
Amount17 | | | | |
| | | | | | | |
ASSET-BACKED SECURITIES†† - 33.4% | |
Collateralized Loan Obligations - 25.0% | |
CIFC Funding Ltd. | | | | | | |
2014-3X INC, due 07/22/265 | | $ | 15,400,000 | | | | 9,650,339 | |
2014-2A, 5.43% due 05/24/266,7 | | | 10,000,000 | | | | 8,409,790 | |
2015-2A, 4.49% due 12/05/246,7 | | | 6,250,000 | | | | 6,149,211 | |
2012-1X, 8.65% due 08/14/24 | | | 4,850,000 | | | | 4,049,524 | |
2013-2A, 4.28% due 04/21/256,7 | | | 4,250,000 | | | | 4,005,587 | |
2014-3A, 5.45% due 07/22/266,7 | | | 4,000,000 | | | | 3,432,199 | |
2014-1A, 3.89% due 08/14/246,7 | | | 3,250,000 | | | | 3,251,067 | |
2014-1A, 5.93% due 04/18/256,7 | | | 2,500,000 | | | | 1,783,351 | |
2014-1A, 3.48% due 04/18/256,7 | | | 1,750,000 | | | | 1,750,138 | |
2013-4A, 4.33% due 11/27/246,7 | | | 1,000,000 | | | | 967,937 | |
Treman Park CLO Ltd. | | | | | | | | |
2015-1A, due 04/20/275,7 | | | 28,400,000 | | | | 24,086,200 | |
RFTI Issuer Ltd. | | | | | | | | |
2015-FL1, 4.40% due 08/15/306,20 | | | 22,841,000 | | | | 22,782,922 | |
Voya CLO Ltd. | | | | | | | | |
2013-1X, due 04/15/245 | | | 20,000,000 | | | | 12,267,999 | |
2015-3A, 4.63% due 10/15/226,7 | | | 4,000,000 | | | | 3,974,307 | |
2014-3A, 6.11% due 07/25/266,7 | | | 2,850,000 | | | | 2,097,539 | |
2014-2A, 3.63% due 07/17/266,7 | | | 2,000,000 | | | | 1,999,908 | |
Shackleton CLO Ltd. | | | | | | | | |
2014-5A, 3.49% due 05/07/266,7 | | | 10,750,000 | | | | 10,603,341 | |
2013-4A, 3.67% due 01/13/256,7 | | | 7,250,000 | | | | 7,257,250 | |
2014-6A, 4.28% due 07/17/266,7 | | | 2,068,000 | | | | 1,918,070 | |
SEE NOTES TO FINANCIAL STATEMENTS. | THE GUGGENHEIM FUNDS ANNUAL REPORT | 17 |
CONSOLIDATED SCHEDULE OF INVESTMENTS (continued) | September 30, 2016 |
MACRO OPPORTUNITIES FUND | |
| | Face
Amount17 | | | Value | |
| | | | | | | |
KVK CLO Ltd. | | | | | | |
2014-2A, 3.68% due 07/15/266,7 | | $ | 8,250,000 | | | $ | 8,076,457 | |
2014-1A, 3.72% due 05/15/266,7 | | | 5,000,000 | | | | 4,836,525 | |
2013-1A, due 04/14/255,7 | | | 11,900,000 | | | | 4,335,004 | |
2014-3A, due 10/15/265,7 | | | 2,500,000 | | | | 904,768 | |
Avery | | | | | | | | |
2013-3X COM, due 01/18/255 | | | 19,800,000 | | | | 15,927,120 | |
Babson CLO Ltd. | | | | | | | | |
2012-2A, due 05/15/235,7 | | | 11,850,000 | | | | 5,560,988 | |
2014-IA, due 07/20/255,7 | | | 6,400,000 | | | | 3,892,612 | |
2013-IIA, 3.93% due 01/18/256,7 | | | 3,500,000 | | | | 3,352,448 | |
2014-3A, 5.78% due 01/15/266,7 | | | 2,500,000 | | | | 2,134,329 | |
Resource Capital Corp. | | | | | | | | |
2015-CRE4, 3.53% due 08/15/326,7 | | | 7,750,000 | | | | 7,285,000 | |
2015-CRE3, 4.53% due 03/15/326,7 | | | 7,000,000 | | | | 6,608,513 | |
2013-CRE1, 4.03% due 12/15/286,7 | | | 1,000,000 | | | | 999,250 | |
ALM VII Ltd. | | | | | | | | |
2012-7A, 5.19% due 10/19/246,7 | | | 6,500,000 | | | | 6,500,035 | |
2013-7RA, 4.16% due 04/24/246,7 | | | 4,750,000 | | | | 4,628,461 | |
2013-7R2A, 4.16% due 04/24/246,7 | | | 2,500,000 | | | | 2,432,246 | |
Golub Capital Partners CLO Ltd. | | | | | | | | |
2015-25A, 3.43% due 08/05/276,7 | | | 6,000,000 | | | | 5,897,810 | |
2014-21A, 4.01% due 10/25/266,7 | | | 4,300,000 | | | | 4,147,418 | |
2014-18A, 4.21% due 04/25/266,7 | | | 2,200,000 | | | | 2,178,206 | |
2014-18A, 4.71% due 04/25/266,7 | | | 1,200,000 | | | | 1,079,240 | |
Dryden XXIII Senior Loan Fund | | | | | | | | |
2014-23A, 3.63% due 07/17/236,7 | | | 6,000,000 | | | | 5,942,984 | |
2014-23A, 4.58% due 07/17/236,7 | | | 3,425,000 | | | | 3,410,852 | |
2014-23A, 7.68% due 07/17/236,7 | | | 3,750,000 | | | | 3,166,029 | |
OHA Credit Partners IX Ltd. | | | | | | | | |
2013-9A, due 10/20/255,7 | | | 14,000,000 | | | | 12,255,750 | |
Fortress Credit Opportunities VI CLO Ltd. | | | | | | | | |
2015-6A, 6.10% due 10/10/266,7 | | | 5,400,000 | | | | 5,092,972 | |
2015-6A, 3.55% due 10/10/266,7 | | | 4,000,000 | | | | 3,963,049 | |
2015-6A, 4.50% due 10/10/266,7 | | | 3,000,000 | | | | 2,948,774 | |
Neuberger Berman CLO Ltd. | | | | | | | | |
2014-12A, 3.81% due 07/25/236,7 | | | 5,300,000 | | | | 5,299,994 | |
2012-12X SUB, due 07/25/235 | | | 7,000,000 | | | | 3,378,401 | |
2012-12A, due 07/25/235,7 | | | 5,900,000 | | | | 2,847,510 | |
Carlyle Global Market Strategies CLO Ltd. | | | | | | | | |
2012-3A, due 10/04/245,7 | | | 6,400,000 | | | | 5,058,756 | |
2014-2A, 4.60% due 07/20/236,7 | | | 3,000,000 | | | | 2,988,278 | |
2013-3X SUB, due 07/15/255 | | | 4,000,000 | | | | 2,267,618 | |
2015-1A, 4.45% due 04/20/226,7 | | | 1,000,000 | | | | 1,000,049 | |
NewStar Clarendon Fund CLO LLC | | | | | | | | |
2015-1A, 3.41% due 01/25/276,7 | | | 7,000,000 | | | | 6,934,519 | |
2015-1A, 4.06% due 01/25/276,7 | | | 4,000,000 | | | | 3,875,085 | |
18 | THE GUGGENHEIM FUNDS ANNUAL REPORT | SEE NOTES TO FINANCIAL STATEMENTS. |
CONSOLIDATED SCHEDULE OF INVESTMENTS (continued) | September 30, 2016 |
MACRO OPPORTUNITIES FUND | |
| | | Face
Amount17 | | | Value | |
| | | | | | | |
Telos CLO Ltd. | | | | | | |
2014-6A, 3.68% due 01/17/276,7 | | $ | 5,000,000 | | | $ | 4,936,642 | |
2013-3A, 3.68% due 01/17/246,7 | | | 2,750,000 | | | | 2,749,826 | |
2013-3A, 4.93% due 01/17/246,7 | | | 2,550,000 | | | | 2,539,071 | |
Highbridge Loan Management Ltd. | | | | | | | | |
2014-1A, 4.11% due 09/20/226,7 | | | 6,500,000 | | | | 6,507,673 | |
2014-1A, 5.11% due 09/20/226,7 | | | 3,500,000 | | | | 3,501,895 | |
Brightwood Capital Fund | | | | | | | | |
6.68% due 04/29/23 | | | 10,000,000 | | | | 9,902,542 | |
Newstar Commercial Loan Funding LLC | | | | | | | | |
2015-1A, 4.55% due 01/20/276,7 | | | 5,000,000 | | | | 4,949,600 | |
2013-1A, 5.41% due 09/20/236,7 | | | 3,250,000 | | | | 3,027,217 | |
2014-1A, 5.45% due 04/20/256,7 | | | 1,250,000 | | | | 1,137,669 | |
2013-1A, 6.16% due 09/20/236,7 | | | 750,000 | | | | 681,569 | |
Great Lakes CLO Ltd. | | | | | | | | |
2015-1A, 4.43% due 07/15/266,7 | | | 4,250,000 | | | | 4,063,502 | |
2014-1A, 4.38% due 04/15/256,7 | | | 3,000,000 | | | | 2,913,398 | |
2014-1A, 4.88% due 04/15/256,7 | | | 1,500,000 | | | | 1,365,707 | |
2012-1A, due 01/15/235,20 | | | 3,250,000 | | | | 1,308,359 | |
Betony CLO Ltd. | | | | | | | | |
2015-1A, 6.03% due 04/15/276,7 | | | 11,000,000 | | | | 9,139,008 | |
Venture XIII CLO Ltd. | | | | | | | | |
2013-13A, due 06/10/255,7 | | | 11,040,000 | | | | 6,116,331 | |
2013-13A, 6.15% due 06/10/256,7 | | | 2,900,000 | | | | 2,595,967 | |
Longfellow Place CLO Ltd. | | | | | | | | |
2013-1A, 6.43% due 01/15/246,7 | | | 9,250,000 | | | | 8,542,222 | |
Dryden 41 Senior Loan Fund | | | | | | | | |
2015-41A, due 01/15/285,7 | | | 10,500,000 | | | | 8,484,885 | |
Dryden 37 Senior Loan Fund | | | | | | | | |
2015-37A, due 04/15/275,7 | | | 9,500,000 | | | | 8,477,098 | |
ACAS CLO Ltd. | | | | | | | | |
2013-1A, 6.80% due 04/20/256,7 | | | 4,000,000 | | | | 3,216,665 | |
2014-1A, 5.63% due 07/18/266,7 | | | 2,500,000 | | | | 2,149,892 | |
2014-2A, 6.43% due 01/15/276,7 | | | 2,300,000 | | | | 2,101,146 | |
2013-1A, 3.45% due 04/20/256,7 | | | 1,000,000 | | | | 999,375 | |
Steele Creek CLO Ltd. | | | | | | | | |
2015-1A, 7.31% due 02/21/276,7 | | | 7,550,000 | | | | 5,555,072 | |
2014-1A, 4.01% due 08/21/266,7 | | | 1,500,000 | | | | 1,500,007 | |
2015-1A, 4.81% due 02/21/276,7 | | | 1,350,000 | | | | 1,292,212 | |
Ares XXVI CLO Ltd. | | | | | | | | |
2013-1A, due 04/15/255,7 | | | 9,500,000 | | | | 4,598,068 | |
2013-1A, 3.43% due 04/15/256,7 | | | 2,000,000 | | | | 1,988,301 | |
2013-1A, 4.43% due 04/15/256,7 | | | 1,500,000 | | | | 1,438,268 | |
Atlas Senior Loan Fund V Ltd. | | | | | | | | |
2014-1A, 3.68% due 07/16/266,7 | | | 8,000,000 | | | | 8,000,166 | |
Galaxy XIX CLO Ltd. | | | | | | | | |
2015-19A, due 01/24/275,7 | | | 5,500,000 | | | | 4,817,619 | |
2015-19A, 4.11% due 01/24/276,7 | | | 3,000,000 | | | | 3,001,583 | |
TICP CLO III Ltd. | | | | | | | | |
2014-3A, 4.45% due 01/20/276,7 | | | 8,000,000 | | | | 7,633,744 | |
SEE NOTES TO FINANCIAL STATEMENTS. | THE GUGGENHEIM FUNDS ANNUAL REPORT | 19 |
CONSOLIDATED SCHEDULE OF INVESTMENTS (continued) | September 30, 2016 |
MACRO OPPORTUNITIES FUND | |
| | | Face
Amount17 | | | Value | |
| | | | | | | |
Shackleton I CLO Ltd. | | | | | | |
2012-1A, 5.57% due 08/14/236,7 | | $ | 7,500,000 | | | $ | 7,620,977 | |
Atlas Senior Loan Fund IV Ltd. | | | | | | | | |
2014-2A, 3.52% due 02/17/266,7 | | | 3,900,000 | | | | 3,842,756 | |
2014-2A, 4.27% due 02/17/266,7 | | | 3,990,000 | | | | 3,674,739 | |
Cent CLO | | | | | | | | |
2014-16A, 3.96% due 08/01/246,7 | | | 7,250,000 | | | | 7,250,496 | |
OCP CLO Ltd. | | | | | | | | |
2014-7A, 3.70% due 10/20/266,7 | | | 5,000,000 | | | | 4,950,000 | |
2014-6A, 3.78% due 07/17/266,7 | | | 2,000,000 | | | | 1,999,906 | |
ACIS CLO Ltd. | | | | | | | | |
2015-6A, 4.13% due 05/01/276,7 | | | 3,000,000 | | | | 2,955,318 | |
2013-1A, 5.18% due 04/18/246,7 | | | 2,100,000 | | | | 2,099,911 | |
2013-2A, 4.52% due 10/14/226,7 | | | 1,800,000 | | | | 1,756,672 | |
Fortress Credit Investments IV Ltd. | | | | | | | | |
2015-4A, 4.18% due 07/17/236,7 | | | 7,300,000 | | | | 6,783,393 | |
Venture XI CLO Ltd. | | | | | | | | |
2015-11A, 3.77% due 11/14/226,7 | | | 4,000,000 | | | | 4,000,041 | |
2015-11A, 4.77% due 11/14/226,7 | | | 2,500,000 | | | | 2,483,810 | |
Benefit Street Partners CLO Ltd. | | | | | | | | |
2015-IA, 3.78% due 10/15/256,7 | | | 6,500,000 | | | | 6,476,977 | |
Cerberus Onshore II CLO-2 LLC | | | | | | | | |
2014-1A, 4.78% due 10/15/236,7 | | | 3,500,000 | | | | 3,459,084 | |
2014-1A, 3.98% due 10/15/236,7 | | | 3,000,000 | | | | 2,991,450 | |
Catamaran CLO Ltd. | | | | | | | | |
2015-1A, 3.80% due 04/22/276,7 | | | 4,000,000 | | | | 3,953,647 | |
2012-1A, 7.11% due 12/20/236,7 | | | 3,250,000 | | | | 2,221,841 | |
Fortress Credit Opportunities V CLO Ltd. | | | | | | | | |
2014-5A, 5.16% due 10/15/266,7 | | | 3,500,000 | | | | 3,264,495 | |
2014-5A, 4.21% due 10/15/266,7 | | | 3,000,000 | | | | 2,883,611 | |
Northwoods Capital XIV Ltd. | | | | | | | | |
2014-14A, 4.17% due 11/12/256,7 | | | 6,000,000 | | | | 6,004,504 | |
ALM XIV Ltd. | | | | | | | | |
2014-14A, 3.69% due 07/28/266,7 | | | 3,100,000 | | | | 3,112,273 | |
2014-14A, 4.19% due 07/28/266,7 | | | 2,500,000 | | | | 2,437,891 | |
Fortress Credit BSL Ltd. | | | | | | | | |
2013-1A, 3.59% due 01/19/256,7 | | | 5,500,000 | | | | 5,467,161 | |
Madison Park Funding XIII Ltd. | | | | | | | | |
2014-13A, 6.54% due 01/19/256,7 | | | 6,750,000 | | | | 5,415,877 | |
AIMCO CLO Series | | | | | | | | |
2015-AA, due 01/15/285,7 | | | 5,400,000 | | | | 3,364,604 | |
2015-AA, 3.98% due 01/15/286,7 | | | 2,000,000 | | | | 2,020,061 | |
Fortress Credit Opportunities III CLO, LP | | | | | | | | |
2014-3A, 3.91% due 04/28/266,7 | | | 5,500,000 | | | | 5,176,013 | |
Hull Street CLO Ltd. | | | | | | | | |
2014-1A, 4.28% due 10/18/266,7 | | | 5,785,000 | | | | 5,109,270 | |
Atlas Senior Loan Fund II Ltd. | | | | | | | | |
2012-2A, due 01/30/245,7 | | | 9,600,000 | | | | 5,058,275 | |
20 | THE GUGGENHEIM FUNDS ANNUAL REPORT | SEE NOTES TO FINANCIAL STATEMENTS. |
CONSOLIDATED SCHEDULE OF INVESTMENTS (continued) | September 30, 2016 |
MACRO OPPORTUNITIES FUND | |
| | | Face
Amount17 | | | Value | |
| | | | | | | |
ALM VIII Ltd. | | | | | | |
2013-8A, 5.20% due 01/20/266,7 | | $ | 5,000,000 | | | $ | 5,000,024 | |
KKR Financial CLO Ltd. | | | | | | | | |
2015-12, 3.68% due 07/15/276,7 | | | 5,000,000 | | | | 4,995,824 | |
Marea CLO Ltd. | | | | | | | | |
2015-1A, 4.43% due 10/15/236,7 | | | 5,000,000 | | | | 4,942,683 | |
Golub Capital Partners CLO 18 Ltd. | | | | | | | | |
2014-18A, 3.21% due 04/25/266,7 | | | 5,000,000 | | | | 4,926,307 | |
Fortress Credit Funding V, LP | | | | | | | | |
2015-5A, 4.47% due 08/15/226,7 | | | 5,000,000 | | | | 4,912,762 | |
Dryden XXVIII Senior Loan Fund | | | | | | | | |
2013-28A, 4.72% due 08/15/256,7 | | | 6,000,000 | | | | 4,872,249 | |
Fifth Street SLF II Ltd. | | | | | | | | |
2015-2A, 3.56% due 09/29/276,7 | | | 5,000,000 | | | | 4,829,365 | |
Figueroa CLO Ltd. | | | | | | | | |
2013-2A, 4.61% due 12/18/256,7 | | | 5,000,000 | | | | 4,753,004 | |
NewStar Commercial Loan Trust | | | | | | | | |
2007-1A, 3.13% due 09/30/226,7 | | | 4,000,000 | | | | 3,676,735 | |
2007-1A, 2.13% due 09/30/226,7 | | | 1,000,000 | | | | 944,491 | |
Mountain Hawk II CLO Ltd. | | | | | | | | |
2013-2A, 3.30% due 07/22/246,7 | | | 2,500,000 | | | | 2,327,804 | |
2013-2A, 3.85% due 07/22/246,7 | | | 2,750,000 | | | | 2,241,350 | |
NewStar Arlington Senior Loan Program LLC | | | | | | | | |
2014-1A, 4.96% due 07/25/256,7 | | | 2,750,000 | | | | 2,535,612 | |
2014-1A, 4.01% due 07/25/256,7 | | | 2,000,000 | | | | 1,938,646 | |
Golub Capital Partners CLO 24M Ltd. | | | | | | | | |
2015-24A, 5.03% due 02/05/276,7 | | | 5,000,000 | | | | 4,316,678 | |
Halcyon Loan Advisors Funding Ltd. | | | | | | | | |
2012-2A, 3.71% due 12/20/246,7 | | | 3,250,000 | | | | 3,166,244 | |
2012-1A, 3.82% due 08/15/236,7 | | | 1,000,000 | | | | 1,000,010 | |
BlueMountain CLO Ltd. | | | | | | | | |
2012-2A, 4.91% due 11/20/246,7 | | | 4,100,000 | | | | 4,121,668 | |
ARES CLO Ltd. | | | | | | | | |
2016-3A, 4.45% due 01/17/246,7 | | | 4,100,000 | | | | 4,105,781 | |
WhiteHorse X Ltd. | | | | | | | | |
2015-10A, 5.98% due 04/17/276,7 | | | 4,980,000 | | | | 4,068,249 | |
Franklin CLO VI Ltd. | | | | | | | | |
2007-6A, 3.04% due 08/09/196,7 | | | 4,165,000 | | | | 4,052,256 | |
Symphony CLO V Ltd. | | | | | | | | |
2007-5A, 4.93% due 01/15/246,7 | | | 4,000,000 | | | | 4,002,571 | |
Oaktree EIF II Series Ltd. | | | | | | | | |
2014-A2, 4.02% due 11/15/256,7 | | | 4,000,000 | | | | 3,999,802 | |
JFIN CLO Ltd. | | | | | | | | |
2007-1A, 3.50% due 07/20/216,7 | | | 4,000,000 | | | | 3,994,113 | |
Adirondack Park CLO Ltd. | | | | | | | | |
2013-1A, 4.33% due 04/15/246,7 | | | 4,000,000 | | | | 3,930,380 | |
Avery Point IV CLO Ltd. | | | | | | | | |
2014-1A, 5.71% due 04/25/266,7 | | | 5,570,000 | | | | 3,902,027 | |
Gramercy Park CLO Ltd. | | | | | | | | |
2014-1A, 4.73% due 07/17/236,7 | | | 1,750,000 | | | | 1,753,064 | |
2012-1A, due 07/17/235,7 | | | 2,650,000 | | | | 1,445,053 | |
2012-1X, due 07/17/235 | | | 1,250,000 | | | | 681,629 | |
SEE NOTES TO FINANCIAL STATEMENTS. | THE GUGGENHEIM FUNDS ANNUAL REPORT | 21 |
CONSOLIDATED SCHEDULE OF INVESTMENTS (continued) | September 30, 2016 |
MACRO OPPORTUNITIES FUND | |
| | | Face
Amount17 | | | Value | |
| | | | | | | |
Airlie CLO Ltd. | | | | | | |
2006-2A, 2.15% due 12/20/206,7 | | $ | 4,000,000 | | | $ | 3,811,510 | |
Golub Capital Partners CLO 25M Ltd. | | | | | | | | |
2015-25A, 4.43% due 08/05/276,7 | | | 4,000,000 | | | | 3,811,420 | |
Marathon CLO VI Ltd. | | | | | | | | |
2014-6A, 3.67% due 05/13/256,7 | | | 3,780,000 | | | | 3,688,271 | |
Garrison Funding Ltd. | | | | | | | | |
2016-2A, 4.86% due 09/29/276,7 | | | 3,700,000 | | | | 3,659,300 | |
Grayson CLO Ltd. | | | | | | | | |
2006-1A, 1.17% due 11/01/216,7 | | | 3,700,000 | | | | 3,553,663 | |
TICP CLO I Ltd. | | | | | | | | |
2014-1A, 5.22% due 04/26/266,7 | | | 4,200,000 | | | | 3,519,796 | |
Fifth Street Senior Loan Fund I LLC | | | | | | | | |
2015-1A, 4.45% due 01/20/276,7 | | | 3,500,000 | | | | 3,416,771 | |
Mountain View CLO Ltd. | | | | | | | | |
2015-9A, 6.03% due 07/15/276,7 | | | 4,000,000 | | | | 3,400,754 | |
Primus CLO II Ltd. | | | | | | | | |
2007-2A, 1.63% due 07/15/216,7 | | | 3,500,000 | | | | 3,334,134 | |
Mountain Hawk I CLO Ltd. | | | | | | | | |
2013-1A, 3.42% due 01/20/246,7 | | | 3,400,000 | | | | 3,311,888 | |
Ivy Hill Middle Market Credit Fund IX Ltd. | | | | | | | | |
2014-9A, 3.98% due 10/18/256,7 | | | 3,500,000 | | | | 3,282,188 | |
Oaktree EIF II Series B1 Ltd. | | | | | | | | |
2015-B1A, 3.92% due 02/15/266,7 | | | 3,250,000 | | | | 3,250,830 | |
DIVCORE CLO Ltd. | | | | | | | | |
2013-1A, 4.42% due 11/15/326,7 | | | 3,250,000 | | | | 3,219,653 | |
NewMark Capital Funding CLO Ltd. | | | | | | | | |
2014-2A, 4.34% due 06/30/266,7 | | | 3,500,000 | | | | 3,186,138 | |
Keuka Park CLO Ltd. | | | | | | | | |
2013-1A, 5.65% due 10/21/246,7 | | | 2,250,000 | | | | 1,590,412 | |
2013-1A, due 10/21/245,7 | | | 3,000,000 | | | | 1,435,304 | |
Neuberger Berman CLO XVIII Ltd. | | | | | | | | |
2014-18A, 3.97% due 11/14/256,7 | | | 3,000,000 | | | | 3,000,024 | |
Marathon CLO V Ltd. | | | | | | | | |
2013-5A, due 02/21/255,7 | | | 5,500,000 | | | | 2,988,621 | |
Flatiron CLO Ltd. | | | | | | | | |
2013-1A, 4.28% due 01/17/266,7 | | | 3,200,000 | | | | 2,986,156 | |
Vibrant CLO II Ltd. | | | | | | | | |
2013-2A, 3.46% due 07/24/246,7 | | | 3,000,000 | | | | 2,978,255 | |
Vibrant CLO Ltd. | | | | | | | | |
2015-1A, 4.58% due 07/17/246,7 | | | 3,000,000 | | | | 2,975,047 | |
Marathon CLO VII Ltd. | | | | | | | | |
2014-7A, 4.24% due 10/28/256,7 | | | 3,000,000 | | | | 2,970,220 | |
Silvermore CLO Ltd. | | | | | | | | |
2014-1A, 3.82% due 05/15/266,7 | | | 3,000,000 | | | | 2,938,136 | |
Race Point V CLO Ltd. | | | | | | | | |
2014-5A, 4.60% due 12/15/226,7 | | | 2,900,000 | | | | 2,898,736 | |
Mountain Hawk III CLO Ltd. | | | | | | | | |
2014-3A, 3.48% due 04/18/256,7 | | | 3,000,000 | | | | 2,880,437 | |
AMMC CLO XI Ltd. | | | | | | | | |
2012-11A, due 10/30/235,7 | | | 5,650,000 | | | | 2,799,004 | |
Sound Point CLO I Ltd. | | | | | | | | |
2012-1A, 5.28% due 10/20/236,7 | | | 2,750,000 | | | | 2,750,207 | |
22 | THE GUGGENHEIM FUNDS ANNUAL REPORT | SEE NOTES TO FINANCIAL STATEMENTS. |
CONSOLIDATED SCHEDULE OF INVESTMENTS (continued) | September 30, 2016 |
MACRO OPPORTUNITIES FUND | |
| | | Face
Amount17 | | | Value | |
| | | | | | | |
Symphony CLO XII Ltd. | | | | | | |
2013-12A, 4.18% due 10/15/256,7 | | $ | 2,700,000 | | | $ | 2,620,951 | |
Symphony CLO IX, LP | | | | | | | | |
2012-9A, 4.93% due 04/16/226,7 | | | 2,600,000 | | | | 2,603,159 | |
West CLO Ltd. | | | | | | | | |
2013-1A, due 11/07/255,7 | | | 5,300,000 | | | | 1,648,679 | |
2013-1A, 3.69% due 11/07/256,7 | | | 1,000,000 | | | | 953,403 | |
Apidos CLO XX | | | | | | | | |
2015-20A, 3.88% due 01/16/276,7 | | | 2,500,000 | | | | 2,528,365 | |
LCM X, LP | | | | | | | | |
2014-10A, 4.43% due 04/15/226,7 | | | 2,500,000 | | | | 2,499,992 | |
Symphony CLO XI Ltd. | | | | | | | | |
2013-11A, 4.68% due 01/17/256,7 | | | 2,500,000 | | | | 2,499,827 | |
Galaxy XVIII CLO Ltd. | | | | | | | | |
2014-18A, 3.68% due 10/15/266,7 | | | 2,500,000 | | | | 2,486,243 | |
Westwood CDO II Ltd. | | | | | | | | |
2007-2A, 2.51% due 04/25/226,7 | | | 2,550,000 | | | | 2,422,368 | |
Gallatin CLO VII Ltd. | | | | | | | | |
2014-1A, 4.44% due 07/15/236,7 | | | 2,500,000 | | | | 2,379,164 | |
Venture XVI CLO Ltd. | | | | | | | | |
2014-16A, 3.43% due 04/15/266,7 | | | 2,250,000 | | | | 2,234,250 | |
Venture XII CLO Ltd. | | | | | | | | |
2013-12A, 4.48% due 02/28/246,7 | | | 2,250,000 | | | | 2,214,472 | |
Callidus Debt Partners CLO Fund VI Ltd. | | | | | | | | |
2007-6A, 3.71% due 10/23/216,7 | | | 2,100,000 | | | | 2,035,388 | |
OHA Credit Partners VII Ltd. | | | | | | | | |
2012-7A, 4.81% due 11/20/236,7 | | | 2,000,000 | | | | 1,999,857 | |
AMMC CLO XIV Ltd. | | | | | | | | |
2014-14A, 3.51% due 07/27/266,7 | | | 2,000,000 | | | | 1,990,961 | |
Blue Hill CLO Ltd. | | | | | | | | |
2013-1A, 3.68% due 01/15/266,7 | | | 2,000,000 | | | | 1,984,531 | |
Cerberus Onshore II CLO LLC | | | | | | | | |
2014-1A, 4.18% due 10/15/236,7 | | | 1,000,000 | | | | 995,409 | |
2014-1A, 4.68% due 10/15/236,7 | | | 1,000,000 | | | | 987,059 | |
Limerock CLO II Ltd. | | | | | | | | |
2014-2A, 3.53% due 04/18/266,7 | | | 2,000,000 | | | | 1,942,378 | |
Lime Street CLO Ltd. | | | | | | | | |
2007-1A, 3.36% due 06/20/216,7 | | | 2,000,000 | | | | 1,818,038 | |
Copper River CLO Ltd. | | | | | | | | |
2007-1A, due 01/20/215,6,20 | | | 8,150,000 | | | | 1,811,637 | |
Jamestown CLO VI Ltd. | | | | | | | | |
2015-6A, 4.06% due 02/20/276,7 | | | 2,000,000 | | | | 1,801,593 | |
NXT Capital CLO LLC | | | | | | | | |
2015-1A, 4.85% due 04/21/276,7 | | | 2,000,000 | | | | 1,784,981 | |
Octagon Investment Partners XIV Ltd. | | | | | | | | |
2012-1A, 7.18% due 01/15/246,7 | | | 2,550,000 | | | | 1,764,997 | |
OHA Credit Partners VI Ltd. | | | | | | | | |
2015-6A, 4.32% due 05/15/236,7 | | | 1,750,000 | | | | 1,753,928 | |
Canyon Capital CLO Ltd. | | | | | | | | |
2013-1A, 3.48% due 01/15/246,7 | | | 1,750,000 | | | | 1,750,894 | |
Symphony CLO XV Ltd. | | | | | | | | |
2014-15A, 3.88% due 10/17/266,7 | | | 1,750,000 | | | | 1,750,008 | |
Octagon Investment Partners XV Ltd. | | | | | | | | |
2013-1A, 3.54% due 01/19/256,7 | | | 1,750,000 | | | | 1,749,982 | |
SEE NOTES TO FINANCIAL STATEMENTS. | THE GUGGENHEIM FUNDS ANNUAL REPORT | 23 |
CONSOLIDATED SCHEDULE OF INVESTMENTS (continued) | September 30, 2016 |
MACRO OPPORTUNITIES FUND | |
| | | Face
Amount17 | | | Value | |
| | | | | | | |
Shackleton II CLO Ltd. | | | | | | |
2012-2A, 4.75% due 10/20/236,7 | | $ | 1,750,000 | | | $ | 1,744,405 | |
Octagon Loan Funding Ltd. | | | | | | | | |
2014-1A, due 11/18/265,7 | | | 3,000,000 | | | | 1,726,257 | |
Madison Park Funding XI Ltd. | | | | | | | | |
2013-11A, 4.21% due 10/23/256,7 | | | 1,750,000 | | | | 1,710,620 | |
Landmark VIII CLO Ltd. | | | | | | | | |
2006-8A, 2.14% due 10/19/206,7 | | | 1,650,000 | | | | 1,593,506 | |
MCF CLO IV LLC | | | | | | | | |
2014-1A, 6.58% due 10/15/256,7 | | | 1,750,000 | | | | 1,500,463 | |
OZLM Funding V Ltd. | | | | | | | | |
2013-5A, 3.68% due 01/17/266,7 | | | 1,500,000 | | | | 1,499,956 | |
Covenant Credit Partners CLO I Ltd. | | | | | | | | |
2014-1A, 3.62% due 07/20/266,7 | | | 1,500,000 | | | | 1,499,654 | |
Greywolf CLO III Ltd. | | | | | | | | |
2014-1A, 3.55% due 04/22/266,7 | | | 1,500,000 | | | | 1,495,942 | |
Symphony CLO X Ltd. | | | | | | | | |
2015-10A, 4.56% due 07/23/236,7 | | | 1,500,000 | | | | 1,491,246 | |
MCF CLO III LLC | | | | | | | | |
2014-3A, 3.42% due 01/20/246,7 | | | 1,750,000 | | | | 1,490,958 | |
Finn Square CLO Ltd. | | | | | | | | |
2012-1A, due 12/24/235,7 | | | 3,250,000 | | | | 1,477,148 | |
BNPP IP CLO Ltd. | | | | | | | | |
2014-2A, 6.01% due 10/30/256,7 | | | 1,750,000 | | | | 1,455,222 | |
MCF CLO I LLC | | | | | | | | |
2013-1A, 4.25% due 04/20/236,7 | | | 1,500,000 | | | | 1,442,702 | |
LCM XI, LP | | | | | | | | |
2012-11A, 5.84% due 04/19/226,7 | | | 1,500,000 | | | | 1,438,459 | |
Kingsland IV Ltd. | | | | | | | | |
2007-4A, 2.13% due 04/16/216,7 | | | 1,500,000 | | | | 1,407,299 | |
OHA Park Avenue CLO I Ltd. | | | | | | | | |
2007-1A, 4.11% due 03/14/226,7 | | | 1,413,497 | | | | 1,400,432 | |
Duane Street CLO IV Ltd. | | | | | | | | |
2007-4A, 3.07% due 11/14/216,7 | | | 1,400,000 | | | | 1,377,153 | |
TICP CLO II Ltd. | | | | | | | | |
2014-2A, 3.70% due 07/20/266,7 | | | 1,300,000 | | | | 1,284,601 | |
GoldenTree Loan Opportunities III Ltd. | | | | | | | | |
2007-3A, 3.96% due 05/01/226,7 | | | 1,250,000 | | | | 1,240,383 | |
COA Summit CLO Limited | | | | | | | | |
2014-1A, 4.55% due 04/20/236,7 | | | 1,250,000 | | | | 1,231,696 | |
ICE EM CLO | | | | | | | | |
2007-1A, 2.05% due 08/15/226,7 | | | 1,250,000 | | | | 1,218,238 | |
Eaton Vance CLO Ltd. | | | | | | | | |
2014-1A, 5.71% due 07/15/266,7 | | | 1,500,000 | | | | 1,211,297 | |
Venture XX CLO Ltd. | | | | | | | | |
2015-20A, 6.98% due 04/15/276,7 | | | 1,600,000 | | | | 1,163,855 | |
Ares XXV CLO Ltd. | | | | | | | | |
2013-3A, due 01/17/245,7 | | | 2,000,000 | | | | 1,094,808 | |
Rockwall CDO Ltd. | | | | | | | | |
2007-1A, 1.01% due 08/01/246,7 | | | 1,090,033 | | | | 1,081,224 | |
Palmer Square CLO Ltd. | | | | | | | | |
2014-1A, 3.23% due 10/17/226,7 | | | 1,000,000 | | | | 991,291 | |
OHA Loan Funding Ltd. | | | | | | | | |
2013-1A, 4.31% due 07/23/256,7 | | | 1,000,000 | | | | 985,056 | |
Halcyon Loan Investors CLO II, Inc. | | | | | | | | |
2007-2A, 2.11% due 04/24/216,7 | | | 1,000,000 | | | | 976,914 | |
24 | THE GUGGENHEIM FUNDS ANNUAL REPORT | SEE NOTES TO FINANCIAL STATEMENTS. |
CONSOLIDATED SCHEDULE OF INVESTMENTS (continued) | September 30, 2016 |
MACRO OPPORTUNITIES FUND | |
| | | Face
Amount17 | | | Value | |
| | | | | | | |
Cavalry CLO II | | | | | | |
2013-2A, 4.68% due 01/17/246,7 | | $ | 1,000,000 | | | $ | 970,087 | |
WhiteHorse VIII Ltd. | | | | | | | | |
2014-1A, 3.51% due 05/01/266,7 | | | 1,000,000 | | | | 952,432 | |
Eastland CLO Ltd. | | | | | | | | |
2007-1A, 1.16% due 05/01/226,7 | | | 1,000,000 | | | | 944,691 | |
Ares CLO Ltd. | | | | | | | | |
2013-1X, due 04/15/255 | | | 1,660,000 | | | | 803,452 | |
Venture XV CLO Ltd. | | | | | | | | |
2013-15A, 3.78% due 07/15/256,7 | | | 750,000 | | | | 750,060 | |
Venture CLO Ltd. | | | | | | | | |
2013-14A, 3.58% due 08/28/256,7 | | | 750,000 | | | | 741,387 | |
Westwood CDO I Ltd. | | | | | | | | |
2007-1A, 1.53% due 03/25/216,7 | | | 700,000 | | | | 662,421 | |
Gleneagles CLO Ltd. | | | | | | | | |
2005-1A, 1.66% due 11/01/176,7 | | | 595,886 | | | | 592,064 | |
Fortress Credit Opportunities | | | | | | | | |
2005-1A, 0.94% due 07/15/196,20 | | | 372,871 | | | | 357,569 | |
Marathon CLO II Ltd. | | | | | | | | |
2005-2A, due 12/20/19†††,5,6,7 | | | 2,250,000 | | | | 2 | |
Total Collateralized Loan Obligations | | | | 835,801,801 | |
| | | | | | | | | |
Transport-Aircraft - 4.7% | |
Apollo Aviation Securitization Equity Trust | | | | | | | | |
2014-1, 7.50% due 12/15/296 | | | 17,091,346 | | | | 16,963,161 | |
2014-1, 5.13% due 12/15/29 | | | 16,225,962 | | | | 15,795,974 | |
2016-1A, 6.50% due 03/17/367 | | | 5,700,000 | | | | 5,621,340 | |
ECAF I Ltd. | | | | | | | | |
2015-1A, 5.80% due 06/15/407 | | | 27,569,373 | | | | 27,017,985 | |
AIM Aviation Finance Ltd. | | | | | | | | |
2015-1A, 5.07% due 02/15/407 | | | 16,363,393 | | | | 15,751,075 | |
Castlelake Aircraft Securitization Trust | | | | | | | | |
2014-1, 7.50% due 02/15/297 | | | 8,609,882 | | | | 8,545,308 | |
2014-1, 5.25% due 02/15/297 | | | 4,721,495 | | | | 4,674,280 | |
Castle Aircraft SecuritizationTrust | | | | | | | | |
2015-1A, 5.75% due 12/15/407 | | | 11,517,499 | | | | 11,368,854 | |
Stripes | | | | | | | | |
2013-1 A1, 4.03% due 03/20/23†††,3 | | | 8,592,345 | | | | 8,363,425 | |
Atlas Ltd. | | | | | | | | |
2014-1 A, 4.88% due 12/15/39 | | | 6,494,550 | | | | 6,429,604 | |
AASET | | | | | | | | |
2014-1 C, 10.00% due 12/15/29 | | | 5,890,230 | | | | 5,881,395 | |
Turbine Engines Securitization Ltd. | | | | | | | | |
2013-1A, 5.13% due 12/13/4820 | | | 3,560,118 | | | | 3,526,290 | |
2013-1A, 6.38% due 12/13/4820 | | | 2,485,969 | | | | 2,286,400 | |
Rise Ltd. | | | | | | | | |
2014-1, 4.75% due 02/12/39 | | | 5,869,792 | | | | 5,799,354 | |
Emerald Aviation Finance Ltd. | | | | | | | | |
2013-1, 6.35% due 10/15/387 | | | 5,368,229 | | | | 5,376,281 | |
Eagle I Ltd. | | | | | | | | |
2014-1A, 5.29% due 12/15/397 | | | 4,675,781 | | | | 4,453,682 | |
Willis Engine Securitization Trust II | | | | | | | | |
2012-A, 5.50% due 09/15/377 | | | 4,377,678 | | | | 4,333,901 | |
SEE NOTES TO FINANCIAL STATEMENTS. | THE GUGGENHEIM FUNDS ANNUAL REPORT | 25 |
CONSOLIDATED SCHEDULE OF INVESTMENTS (continued) | September 30, 2016 |
MACRO OPPORTUNITIES FUND | |
| | | Face
Amount17 | | | Value | |
| | | | | | | |
AABS Ltd. | | | | | | |
2013-1, 4.88% due 01/15/38 | | $ | 2,220,033 | | | $ | 2,206,713 | |
Airplanes Pass Through Trust | | | | | | | | |
2001-1A, 1.07% due 03/15/196,20 | | | 3,791,006 | | | | 1,251,032 | |
Total Transport-Aircraft | | | | | | | 155,646,054 | |
| | | | | | | | | |
Collateralized Debt Obligations - 3.6% | |
Triaxx Prime CDO Ltd. | | | | | | | | |
2006-2A, 0.79% due 10/02/396,7 | | | 32,163,124 | | | | 30,632,049 | |
Putnam Structured Product Funding Ltd. | | | | | | | | |
2003-1A, 1.52% due 10/15/386,7 | | | 18,950,000 | | | | 16,328,854 | |
FDF I Ltd. | | | | | | | | |
2015-1A, 5.50% due 11/12/307 | | | 12,000,000 | | | | 12,191,733 | |
Gramercy Real Estate CDO Ltd. | | | | | | | | |
2007-1A, 1.10% due 08/15/566,7 | | | 12,785,451 | | | | 12,071,469 | |
SRERS Funding Ltd. | | | | | | | | |
2011-RS, 0.76% due 05/09/466,7 | | | 15,918,348 | | | | 11,498,909 | |
N-Star REL CDO VIII Ltd. | | | | | | | | |
2006-8A, 0.89% due 02/01/416,7 | | | 8,100,000 | | | | 7,862,582 | |
2006-8A, 0.82% due 02/01/416,7 | | | 97,190 | | | | 97,013 | |
Highland Park CDO I Ltd. | | | | | | | | |
2006-1A, 1.23% due 11/25/516,7 | | | 6,379,580 | | | | 5,859,096 | |
RAIT CRE CDO I Ltd. | | | | | | | | |
2006-1X A1B, 0.86% due 11/20/46 | | | 5,889,997 | | | | 5,693,802 | |
Static Repackaging Trust Ltd. | | | | | | | | |
2004-1A, 1.86% due 05/10/396,7 | | | 5,050,019 | | | | 4,879,877 | |
Wrightwood Capital Real Estate CDO Ltd. | | | | | | | | |
2005-1A, 1.24% due 11/21/406,7 | | | 5,000,000 | | | | 4,811,055 | |
FDF II Ltd. | | | | | | | | |
2016-2A, 6.29% due 05/12/317 | | | 4,750,000 | | | | 4,770,197 | |
Banco Bradesco SA | | | | | | | | |
2014-1, 5.44% due 03/12/26†††6,20 | | | 3,068,402 | | | | 3,076,969 | |
Pasadena CDO Ltd. | | | | | | | | |
2002-1A, 1.71% due 06/19/376,7 | | | 1,042,610 | | | | 1,019,122 | |
Helios Series I Multi Asset CBO Ltd. | | | | | | | | |
2001-1A, 1.79% due 12/13/366,7 | | | 105,313 | | | | 104,703 | |
Total Collateralized Debt Obligations | | | | 120,897,430 | |
| | | | | | | | | |
Financial - 0.1% | |
CCR Incorporated MT100 Payment Rights Master Trust | | | | | | | | |
2010-CX, 0.96% due 07/10/176 | | | 2,993,040 | | | | 2,974,208 | |
Garanti Diversified Payment Rights Finance Co. | | | | | | | | |
2007-A, 0.85% due 07/09/176 | | | 104,000 | | | | 103,271 | |
Total Financial | | | | | | | 3,077,479 | |
| | | | | | | | | |
Credit Card - 0.0% | |
Credit Card Pass-Through Trust | | | | | | | | |
2012-BIZ, due 12/15/497 | | | 225,519 | | | | 181,011 | |
Total Asset-Backed Securities | | | | | |
(Cost $1,120,282,675) | | | | | | | 1,115,603,775 | |
| | | | | | | | | |
26 | THE GUGGENHEIM FUNDS ANNUAL REPORT | SEE NOTES TO FINANCIAL STATEMENTS. |
CONSOLIDATED SCHEDULE OF INVESTMENTS (continued) | September 30, 2016 |
MACRO OPPORTUNITIES FUND | |
| | | Face
Amount17 | | | Value | |
| | | | | | | |
SENIOR FLOATING RATE INTERESTS†† - 18.3% | |
Technology - 4.5% | |
EIG Investors Corp. | | | | | | |
6.00% due 02/09/233 | | $ | 18,338,819 | | | $ | 17,055,101 | |
6.48% due 11/08/19 | | | 2,623,377 | | | | 2,541,397 | |
Solera LLC | | | | | | | | |
5.75% due 03/03/23 | | | 7,810,750 | | | | 7,887,217 | |
5.10% due 03/03/21†††,3 | | | 5,130,000 | | | | 4,491,803 | |
TIBCO Software, Inc. | | | | | | | | |
6.50% due 12/04/20 | | | 11,632,658 | | | | 11,451,885 | |
Epicor Software | | | | | | | | |
4.75% due 06/01/22 | | | 11,356,250 | | | | 11,178,865 | |
Deltek, Inc. | | | | | | | | |
5.00% due 06/25/22 | | | 8,261,586 | | | | 8,282,240 | |
Avaya, Inc. | | | | | | | | |
6.25% due 05/29/20 | | | 10,891,461 | | | | 8,023,413 | |
Project Alpha Intermediate Holding, Inc. | | | | | | | | |
9.25% due 08/22/22††† | | | 8,000,000 | | | | 7,847,671 | |
Advanced Computer Software | | | | | | | | |
10.50% due 01/31/233 | | | 4,750,000 | | | | 4,370,000 | |
6.50% due 03/18/22 | | | 3,447,500 | | | | 3,283,744 | |
Nimbus Acquisition Topco Ltd. | | | | | | | | |
7.25% due 07/15/21††† | | GBP 5,050,000 | | | | 6,459,521 | |
Harbortouch Payments LLC | | | | | | | | |
7.00% due 05/31/22 | | | 6,186,094 | | | | 6,247,955 | |
Landslide Holdings, Inc. | | | | | | | | |
5.50% due 09/27/22 | | | 4,850,000 | | | | 4,880,313 | |
Ceridian Corp. | | | | | | | | |
4.50% due 09/15/20 | | | 4,609,835 | | | | 4,500,352 | |
The Active Network, Inc. | | | | | | | | |
5.50% due 11/13/20 | | | 4,481,059 | | | | 4,447,451 | |
PowerSchool, Inc. | | | | | | | | |
5.88% due 07/30/21†††,3 | | | 3,465,000 | | | | 3,465,000 | |
6.38% due 07/30/21†††,3 | | | 800,000 | | | | 800,000 | |
Greenway Medical Technologies | | | | | | | | |
6.00% due 11/04/203 | | | 3,848,856 | | | | 3,743,012 | |
9.25% due 11/04/213 | | | 550,000 | | | | 507,375 | |
Diebold, Inc. | | | | | | | | |
5.25% due 11/06/23 | | | 3,600,000 | | | | 3,633,012 | |
Netsmart Technologies, Inc. | | | | | | | | |
5.75% due 04/19/23 | | | 3,466,313 | | | | 3,479,311 | |
Ipreo Holdings | | | | | | | | |
4.25% due 08/06/21 | | | 3,239,346 | | | | 3,079,420 | |
Micron Technology, Inc. | | | | | | | | |
6.53% due 04/26/22 | | | 3,042,375 | | | | 3,073,346 | |
Mirion Technologies | | | | | | | | |
5.75% due 03/31/22 | | | 2,216,250 | | | | 2,210,709 | |
CPI Acquisition, Inc. | | | | | | | | |
5.50% due 08/17/22 | | | 2,182,372 | | | | 2,128,730 | |
Severin Acquisition LLC | | | | | | | | |
6.00% due 07/30/21†††,3 | | | 2,041,573 | | | | 2,041,573 | |
Sparta Holding Corp. | | | | | | | | |
6.50% due 07/28/20†††,3 | | | 1,814,608 | | | | 1,803,043 | |
Compucom Systems, Inc. | | | | | | | | |
4.25% due 05/11/20 | | | 1,865,732 | | | | 1,321,554 | |
MRI Software LLC | | | | | | | | |
5.25% due 06/23/21 | | | 1,278,409 | | | | 1,268,821 | |
GlobalLogic Holdings, Inc. | | | | | | | | |
6.25% due 06/02/19 | | | 1,167,000 | | | | 1,164,083 | |
Aspect Software, Inc. | | | | | | | | |
10.50% due 05/25/20 | | | 1,065,624 | | | | 1,037,203 | |
Quorum Business Solutions | | | | | | | | |
5.75% due 08/06/213 | | | 658,275 | | | | 648,401 | |
Hyland Software, Inc. | | | | | | | | |
4.75% due 07/01/22 | | | 471,400 | | | | 474,148 | |
Eze Castle Software, Inc. | | | | | | | | |
7.25% due 04/05/21 | | | 400,000 | | | | 387,332 | |
Flexera Software LLC | | | | | | | | |
8.00% due 04/02/21 | | | 350,000 | | | | 343,438 | |
Total Technology | | | | | | | 149,558,439 | |
| | | | | | | | | |
Consumer, Cyclical - 4.1% | |
PETCO Animal Supplies, Inc. | | | | | | | | |
5.00% due 01/26/23 | | | 10,298,250 | | | | 10,399,790 | |
5.00% due 01/26/23 | | | 5,099,687 | | | | 5,149,868 | |
Belk, Inc. | | | | | | | | |
5.75% due 12/12/22 | | | 11,989,750 | | | | 10,846,406 | |
Mavis Tire | | | | | | | | |
6.25% due 11/02/20†††,3 | | | 9,282,500 | | | | 9,175,823 | |
SEE NOTES TO FINANCIAL STATEMENTS. | THE GUGGENHEIM FUNDS ANNUAL REPORT | 27 |
CONSOLIDATED SCHEDULE OF INVESTMENTS (continued) | September 30, 2016 |
MACRO OPPORTUNITIES FUND | |
| | | Face
Amount17 | | | Value | |
| | | | | | | |
Advantage Sales & Marketing LLC | | | | | | |
4.25% due 07/23/21 | | $ | 8,963,997 | | | $ | 8,846,390 | |
3.39% due 07/25/19†††,3 | | | 112,500 | | | | 104,329 | |
Gates Global, Inc. | | | | | | | | |
4.25% due 07/05/21 | | | 8,645,115 | | | | 8,507,571 | |
Sears Holdings Corp. | | | | | | | | |
5.50% due 06/30/18 | | | 7,552,608 | | | | 7,388,943 | |
Life Time Fitness | | | | | | | | |
4.25% due 06/10/22 | | | 6,826,631 | | | | 6,827,860 | |
Navistar, Inc. | | | | | | | | |
6.50% due 08/07/20 | | | 6,451,250 | | | | 6,463,378 | |
National Vision, Inc. | | | | | | | | |
4.00% due 03/12/21 | | | 4,691,638 | | | | 4,631,820 | |
6.75% due 03/11/22 | | | 650,000 | | | | 605,800 | |
Sky Bet | | | | | | | | |
6.25% due 02/25/22 | | GBP 3,700,000 | | | | 4,819,720 | |
Eyemart Express | | | | | | | | |
5.00% due 12/17/21 | | | 4,393,750 | | | | 4,404,734 | |
Amaya Holding B.V. | | | | | | | | |
5.00% due 08/01/21 | | | 4,352,960 | | | | 4,347,519 | |
Neiman Marcus Group, Inc. | | | | | | | | |
4.25% due 10/25/20 | | | 4,672,447 | | | | 4,292,811 | |
Fitness International LLC | | | | | | | | |
6.00% due 07/01/20 | | | 4,160,617 | | | | 4,154,376 | |
PF Chang’s | | | | | | | | |
4.53% due 07/02/19 | | | 3,386,792 | | | | 3,335,990 | |
Floor and Decor Outlets of America, Inc. | | | | | | | | |
6.75% due 09/30/23 | | | 3,250,000 | | | | 3,250,000 | |
BJ’s Wholesale Club, Inc. | | | | | | | | |
4.50% due 09/26/19 | | | 3,233,676 | | | | 3,239,400 | |
Men’s Wearhouse | | | | | | | | |
4.50% due 06/18/21 | | | 3,177,536 | | | | 3,143,790 | |
Equinox Fitness | | | | | | | | |
5.00% due 01/31/20 | | | 2,942,665 | | | | 2,959,820 | |
Acosta, Inc. | | | | | | | | |
4.25% due 09/26/21 | | | 2,484,956 | | | | 2,360,708 | |
Dealer Tire LLC | | | | | | | | |
5.50% due 12/22/21 | | | 1,965,000 | | | | 1,979,738 | |
Packers Holdings | | | | | | | | |
4.75% due 12/02/21 | | | 1,796,055 | | | | 1,800,545 | |
Capital Automotive LP | | | | | | | | |
6.00% due 04/30/20 | | | 1,770,000 | | | | 1,779,293 | |
Prime Security Services Borrower LLC | | | | | | | | |
4.75% due 05/02/22 | | | 1,645,875 | | | | 1,660,787 | |
Med Finance Merger Sub LLC | | | | | | | | |
7.25% due 08/16/21†††,3 | | | 1,584,634 | | | | 1,571,771 | |
1-800 Contacts | | | | | | | | |
5.25% due 01/22/23 | | | 1,467,625 | | | | 1,475,580 | |
BBB Industries, LLC | | | | | | | | |
6.00% due 11/03/21 | | | 1,455,725 | | | | 1,457,545 | |
NPC International, Inc. | | | | | | | | |
4.75% due 12/28/18 | | | 1,279,609 | | | | 1,279,609 | |
Jacobs Entertainment, Inc. | | | | | | | | |
5.25% due 10/29/18 | | | 1,158,174 | | | | 1,158,174 | |
Alexander Mann Solutions Ltd. | | | | | | | | |
5.75% due 12/20/19 | | | 1,050,043 | | | | 1,034,292 | |
Sterling Intermidiate Corp. | | | | | | | | |
5.75% due 06/20/22 | | | 518,384 | | | | 515,792 | |
Ascena Retail Group | | | | | | | | |
5.25% due 08/21/22 | | | 469,934 | | | | 452,635 | |
Container Store, Inc. | | | | | | | | |
4.25% due 04/05/19 | | | 323,675 | | | | 275,124 | |
Rite Aid Corp. | | | | | | | | |
5.75% due 08/21/20 | | | 100,000 | | | | 100,188 | |
Total Consumer, Cyclical | | | | | | | 135,797,919 | |
| | | | | | | | | |
Industrial - 2.7% | |
Travelport Holdings LLC | | | | | | | | |
5.00% due 09/02/21 | | | 20,542,119 | | | | 20,626,548 | |
DAE Aviation | | | | | | | | |
5.25% due 07/07/22 | | | 6,535,117 | | | | 6,569,818 | |
CareCore National LLC | | | | | | | | |
5.50% due 03/05/21 | | | 4,998,061 | | | | 4,898,100 | |
SI Organization | | | | | | | | |
5.75% due 11/22/19 | | | 3,701,126 | | | | 3,717,337 | |
GYP Holdings III Corp. | | | | | | | | |
4.50% due 04/01/21 | | | 3,455,684 | | | | 3,443,796 | |
Hardware Holdings LLC | | | | | | | | |
6.75% due 03/30/203 | | | 3,430,000 | | | | 3,344,250 | |
NVA Holdings, Inc. | | | | | | | | |
4.75% due 08/14/21 | | | 2,819,931 | | | | 2,816,406 | |
5.50% due 08/14/21 | | | 378,100 | | | | 378,573 | |
28 | THE GUGGENHEIM FUNDS ANNUAL REPORT | SEE NOTES TO FINANCIAL STATEMENTS. |
CONSOLIDATED SCHEDULE OF INVESTMENTS (continued) | September 30, 2016 |
MACRO OPPORTUNITIES FUND | |
| | | Face
Amount17 | | | Value | |
| | | | | | | |
SIRVA Worldwide, Inc. | | | | | | |
7.50% due 03/27/193 | | $ | 3,048,354 | | | $ | 3,017,871 | |
Advanced Integration Tech | | | | | | | | |
6.50% due 07/22/21 | | | 3,000,000 | | | | 3,007,500 | |
Flakt Woods | | | | | | | | |
2.88% due 03/20/17††† | | EUR 2,691,864 | | | | 2,993,480 | |
KC Merger Sub, Inc. | | | | | | | | |
6.00% due 08/12/22 | | | 2,774,982 | | | | 2,781,226 | |
Pro Mach Group, Inc. | | | | | | | | |
4.75% due 10/22/21 | | | 2,752,481 | | | | 2,746,288 | |
CHI Overhead Doors, Inc. | | | | | | | | |
4.50% due 07/29/22 | | | 2,527,982 | | | | 2,527,982 | |
Tronair Parent, Inc. | | | | | | | | |
5.50% due 09/08/23 | | | 2,500,000 | | | | 2,475,000 | |
V.Group Ltd. | | | | | | | | |
4.75% due 06/25/21 | | | 2,241,634 | | | | 2,238,832 | |
Exopack Holdings SA | | | | | | | | |
4.50% due 05/08/19 | | | 1,979,174 | | | | 1,975,473 | |
National Technical Systems | | | | | | | | |
7.25% due 06/12/21†††,3 | | | 1,879,730 | | | | 1,832,737 | |
Mast Global | | | | | | | | |
7.75% due 09/12/19†††,3 | | | 1,790,536 | | | | 1,781,645 | |
Thermasys Corp. | | | | | | | | |
5.25% due 05/03/193 | | | 2,214,188 | | | | 1,781,048 | |
Hillman Group, Inc. | | | | | | | | |
4.50% due 06/30/21 | | | 1,776,911 | | | | 1,780,607 | |
CPM Holdings, Inc. | | | | | | | | |
6.00% due 04/11/22 | | | 1,678,750 | | | | 1,685,750 | |
Survitec | | | | | | | | |
5.34% due 03/12/223 | | GBP 1,125,000 | | | | 1,417,080 | |
Douglas Dynamics, LLC | | | | | | | | |
5.25% due 12/31/21 | | | 1,408,915 | | | | 1,412,437 | |
Swissport Investments S.A. | | | | | | | | |
6.25% due 02/09/22 | | EUR 1,250,000 | | | | 1,412,286 | |
Capstone Logistics | | | | | | | | |
5.50% due 10/07/21 | | | 1,386,003 | | | | 1,354,818 | |
ProAmpac | | | | | | | | |
5.75% due 08/18/22 | | | 1,262,258 | | | | 1,268,569 | |
Constantinople Acquisition GmbH | | | | | | | | |
4.00% due 04/30/22 | | | 987,500 | | | | 989,149 | |
Atkore International, Inc. | | | | | | | | |
7.75% due 10/09/21 | | | 850,000 | | | | 850,357 | |
Bioplan USA, Inc. | | | | | | | | |
5.75% due 09/23/21 | | | 797,975 | | | | 742,116 | |
Hunter Fan Co. | | | | | | | | |
6.73% due 12/20/173 | | | 483,949 | | | | 476,690 | |
Tank Holdings Corp. | | | | | | | | |
5.25% due 03/16/22 | | | 464,130 | | | | 444,020 | |
Doncasters Group Ltd. | | | | | | | | |
9.50% due 10/09/20 | | | 456,207 | | | | 429,405 | |
CEVA Group Plc (United Kingdom) | | | | | | | | |
due 03/19/19†††,3,10 | | | 220,000 | | | | 197,889 | |
6.50% due 03/19/21 | | | 217,900 | | | | 174,228 | |
NANA Development Corp. | | | | | | | | |
8.00% due 03/15/183 | | | 390,000 | | | | 364,650 | |
Hunter Defense Technologies | | | | | | | | |
7.00% due 08/05/19†††,3 | | | 389,333 | | | | 292,000 | |
Power Borrower, LLC | | | | | | | | |
8.25% due 11/06/20 | | | 275,000 | | | | 273,625 | |
Wencor Group | | | | | | | | |
4.04% due 06/19/19††† | | | 100,000 | | | | 93,637 | |
Total Industrial | | | | | | | 90,613,223 | |
| | | | | | | | | |
Consumer, Non-cyclical - 2.7% | |
IHC Holding Corp. | | | | | | | | |
7.00% due 04/30/21†††,3 | | | 7,406,250 | | | | 7,321,420 | |
7.25% due 04/30/21†††,3 | | | 1,446,375 | | | | 1,425,892 | |
Affordable Care Holdings Corp. | | | | | | | | |
5.75% due 10/24/22 | | | 7,195,625 | | | | 7,195,624 | |
Lineage Logistics LLC | | | | | | | | |
4.50% due 04/07/21 | | | 6,382,781 | | | | 6,302,996 | |
American Seafoods | | | | | | | | |
6.02% due 08/19/213 | | | 5,780,556 | | | | 5,722,750 | |
One Call Medical, Inc. | | | | | | | | |
5.00% due 11/27/20 | | | 6,043,054 | | | | 5,642,702 | |
Springs Industries, Inc. | | | | | | | | |
7.50% due 06/01/21†††,3 | | | 5,100,000 | | | | 4,991,739 | |
At Home Holding III Corp. | | | | | | | | |
5.00% due 06/03/22 | | | 4,937,500 | | | | 4,912,813 | |
Grocery Outlet, Inc. | | | | | | | | |
5.00% due 10/21/21 | | | 4,383,581 | | | | 4,372,622 | |
ABB Concise Optical Group LLC | | | | | | | | |
6.00% due 06/15/23 | | | 4,000,000 | | | | 4,035,000 | |
SEE NOTES TO FINANCIAL STATEMENTS. | THE GUGGENHEIM FUNDS ANNUAL REPORT | 29 |
CONSOLIDATED SCHEDULE OF INVESTMENTS (continued) | September 30, 2016 |
MACRO OPPORTUNITIES FUND | |
| | | Face
Amount17 | | | Value | |
| | | | | | | |
Authentic Brands | | | | | | |
5.50% due 05/27/21 | | $ | 3,766,104 | | | $ | 3,756,689 | |
American Tire Distributors, Inc. | | | | | | | | |
5.25% due 09/01/21 | | | 3,467,945 | | | | 3,419,394 | |
Chobani LLC | | | | | | | | |
5.50% due 09/29/23 | | | 3,300,000 | | | | 3,283,500 | |
Packaging Coordinators Midco, Inc. | | | | | | | | |
5.00% due 07/03/23 | | | 3,192,000 | | | | 3,192,000 | |
SHO Holding I Corp. | | | | | | | | |
6.00% due 10/27/223 | | | 2,977,500 | | | | 2,962,613 | |
DJO Finance LLC | | | | | | | | |
4.25% due 06/08/20 | | | 2,831,977 | | | | 2,778,878 | |
Chef’s Warehouse Parent LLC | | | | | | | | |
6.75% due 06/22/223 | | | 2,613,407 | | | | 2,587,273 | |
Give and Go Prepared Foods Corp. | | | | | | | | |
6.50% due 07/29/23 | | | 2,500,000 | | | | 2,485,950 | |
Arctic Glacier Holdings, Inc. | | | | | | | | |
6.00% due 05/10/19 | | | 2,013,366 | | | | 1,988,198 | |
Reddy Ice Holdings, Inc. | | | | | | | | |
6.75% due 05/01/19 | | | 1,061,984 | | | | 1,003,575 | |
10.75% due 10/01/193 | | | 1,125,000 | | | | 873,754 | |
AMAG Pharmaceuticals | | | | | | | | |
4.75% due 08/17/21 | | | 1,669,114 | | | | 1,669,114 | |
Phillips-Medsize Corp. | | | | | | | | |
4.75% due 06/16/21 | | | 1,466,740 | | | | 1,464,452 | |
Nellson Nutraceutical (US) | | | | | | | | |
6.00% due 12/23/21 | | | 1,458,872 | | | | 1,457,049 | |
Winebow, Inc. | | | | | | | | |
4.75% due 07/01/21 | | | 977,500 | | | | 957,950 | |
NES Global Talent | | | | | | | | |
6.50% due 10/03/193 | | | 1,064,191 | | | | 947,130 | |
CTI Foods Holding Co. LLC | | | | | | | | |
8.25% due 06/28/21 | | | 1,035,000 | | | | 921,150 | |
Nellson Nutraceutical (CAD) | | | | | | | | |
6.00% due 12/23/21 | | | 906,130 | | | | 904,997 | |
Mediware Information Systems, Inc. | | | | | | | | |
5.75% due 09/28/23 | | | 800,000 | | | | 804,000 | |
Advancepierre Foods, Inc. | | | | | | | | |
4.50% due 06/02/23 | | | 600,035 | | | | 604,536 | |
Fender Musical Instruments Corp. | | | | | | | | |
5.75% due 04/03/19 | | | 447,750 | | | | 444,952 | |
Targus Group International, Inc. | | | | | | | | |
due 05/24/16†††,3,10 | | | 152,876 | | | | — | |
Total Consumer, Non-cyclical | | | | 90,430,712 | |
| | | | | | | | | |
Financial - 1.5% | |
Americold Realty Operating Partnership, LP | | | | | | | | |
5.75% due 12/01/22 | | | 7,504,941 | | | | 7,565,957 | |
LPL Financial Holdings, Inc. | | | | | | | | |
4.75% due 11/21/22 | | | 5,657,250 | | | | 5,687,913 | |
USI Holdings Corp. | | | | | | | | |
4.25% due 12/27/19 | | | 4,370,412 | | | | 4,373,691 | |
National Financial Partners Corp. | | | | | | | | |
4.50% due 07/01/20 | | | 4,176,106 | | | | 4,182,203 | |
Assured Partners, Inc. | | | | | | | | |
5.75% due 10/21/22 | | | 4,050,894 | | | | 4,067,340 | |
Alliant Holdings I L.P. | | | | | | | | |
4.75% due 08/12/22 | | | 3,504,384 | | | | 3,501,756 | |
Magic Newco, LLC | | | | | | | | |
5.00% due 12/12/18 | | | 3,337,152 | | | | 3,339,922 | |
Hyperion Insurance | | | | | | | | |
5.50% due 04/29/22 | | | 3,250,500 | | | | 3,174,308 | |
Sedgwick Claims Management Service, Inc. | | | | | | | | |
5.25% due 02/28/21 | | | 2,793,000 | | | | 2,810,456 | |
York Risk Services | | | | | | | | |
4.75% due 10/01/213 | | | 3,041,194 | | | | 2,778,891 | |
Integro Parent, Inc. | | | | | | | | |
6.75% due 10/31/22 | | | 2,233,766 | | | | 2,177,921 | |
Acrisure LLC | | | | | | | | |
6.50% due 05/19/22 | | | 2,077,748 | | | | 2,081,654 | |
30 | THE GUGGENHEIM FUNDS ANNUAL REPORT | SEE NOTES TO FINANCIAL STATEMENTS. |
CONSOLIDATED SCHEDULE OF INVESTMENTS (continued) | September 30, 2016 |
MACRO OPPORTUNITIES FUND | |
| | | Face
Amount17 | | | Value | |
| | | | | | | |
Ryan LLC | | | | | | |
6.75% due 08/07/20 | | $ | 1,640,625 | | | $ | 1,619,100 | |
American Stock Transfer & Trust | | | | | | | | |
5.75% due 06/26/20 | | | 1,561,899 | | | | 1,525,460 | |
Cunningham Lindsey U.S., Inc. | | | | | | | | |
5.00% due 12/10/19 | | | 660,031 | | | | 553,601 | |
9.25% due 06/10/20 | | | 116,932 | | | | 45,311 | |
Total Financial | | | | | | | 49,485,484 | |
| | | | | | | | | |
Utilities - 1.1% | |
Invenergy Thermal Operating I, LLC | | | | | | | | |
6.50% due 10/19/22 | | | 12,226,500 | | | | 11,676,307 | |
Linden Cogeneration Power | | | | | | | | |
5.25% due 06/28/23 | | | 6,112,154 | | | | 6,168,691 | |
Dynegy, Inc. | | | | | | | | |
5.00% due 06/27/23 | | | 5,900,000 | | | | 5,942,775 | |
MRP Generation Holding | | | | | | | | |
8.00% due 09/29/22 | | | 3,500,000 | | | | 3,290,000 | |
Panda Hummel | | | | | | | | |
7.00% due 10/27/22 | | | 3,000,000 | | | | 2,885,010 | |
Terraform AP Acquisition Holdings LLC | | | | | | | | |
7.00% due 06/26/22 | | | 2,769,305 | | | | 2,741,612 | |
Osmose Utility Services, Inc. | | | | | | | | |
4.75% due 08/22/22 | | | 1,633,500 | | | | 1,630,952 | |
Panda Power | | | | | | | | |
7.50% due 08/21/20 | | | 1,321,688 | | | | 1,296,906 | |
Exgen Texas Power LLC | | | | | | | | |
5.75% due 09/18/21 | | | 499,236 | | | | 406,254 | |
Total Utilities | | | | | | | 36,038,507 | |
| | | | | | | | | |
Communications - 1.0% | |
Cengage Learning Acquisitions, Inc. | | | | | | | | |
5.25% due 06/07/23 | | | 14,355,604 | | | | 14,337,659 | |
Mcgraw-Hill Global Education Holdings LLC | | | | | | | | |
5.00% due 05/04/22 | | | 4,189,500 | | | | 4,211,495 | |
Match Group, Inc. | | | | | | | | |
5.50% due 11/16/22 | | | 3,217,500 | | | | 3,233,588 | |
Anaren, Inc. | | | | | | | | |
5.50% due 02/18/213 | | | 1,876,736 | | | | 1,806,359 | |
9.25% due 08/18/213 | | | 1,500,000 | | | | 1,335,000 | |
Proquest LLC | | | | | | | | |
5.75% due 10/24/21 | | | 2,713,491 | | | | 2,713,491 | |
Numericable US LLC | | | | | | | | |
4.75% due 02/10/23 | | | 2,020,299 | | | | 2,033,552 | |
Mitel Networks Corp. | | | | | | | | |
5.50% due 04/29/22 | | | 1,212,217 | | | | 1,219,418 | |
Internet Brands | | | | | | | | |
4.75% due 07/08/21 | | | 1,163,748 | | | | 1,165,203 | |
MergerMarket Ltd. | | | | | | | | |
4.50% due 02/04/21 | | | 1,170,980 | | | | 1,153,415 | |
Bureau van Dijk Electronic Publishing BV | | | | | | | | |
4.88% due 09/20/213 | | GBP 787,910 | | | | 1,019,878 | |
Liberty Cablevision of Puerto Rico LLC | | | | | | | | |
4.50% due 01/07/22 | | | 600,000 | | | | 591,378 | |
Total Communications | | | | | | | 34,820,436 | |
| | | | | | | | | |
Basic Materials - 0.4% | |
PQ Corp. | | | | | | | | |
5.75% due 11/04/22 | | | 3,840,375 | | | | 3,866,796 | |
Azelis Finance S.A. | | | | | | | | |
6.50% due 12/16/22 | | | 2,282,750 | | | | 2,308,431 | |
Platform Specialty Products | | | | | | | | |
5.50% due 06/07/20 | | | 1,934,787 | | | | 2,008,810 | |
Zep, Inc. | | | | | | | | |
5.50% due 06/27/22 | | | 1,975,000 | | | | 1,977,469 | |
Chromaflo Technologies | | | | | | | | |
4.50% due 12/02/19 | | | 1,059,202 | | | | 1,057,878 | |
Hoffmaster Group, Inc. | | | | | | | | |
5.25% due 05/08/20 | | | 690,696 | | | | 690,696 | |
Noranda Aluminum Acquisition Corp. | | | | | | | | |
7.00% due 02/28/19 | | | 959,142 | | | | 105,506 | |
Total Basic Materials | | | | | | | 12,015,586 | |
| | | | | | | | | |
Energy - 0.3% | |
Veresen Midstream LP | | | | | | | | |
5.25% due 03/31/22 | | | 6,220,270 | | | | 6,163,230 | |
Cactus Wellhead | | | | | | | | |
7.00% due 07/31/20 | | | 2,810,178 | | | | 2,156,812 | |
SEE NOTES TO FINANCIAL STATEMENTS. | THE GUGGENHEIM FUNDS ANNUAL REPORT | 31 |
CONSOLIDATED SCHEDULE OF INVESTMENTS (continued) | September 30, 2016 |
MACRO OPPORTUNITIES FUND | |
| | | Face
Amount17 | | | Value | |
| | | | | | | |
PSS Companies | | | | | | |
5.50% due 01/28/203 | | $ | 854,837 | | | $ | 624,031 | |
Total Energy | | | | | | | 8,944,073 | |
| | | | | | | | | |
Electric - 0.0% | |
Panda Temple II Power | | | | | | | | |
7.25% due 04/03/19 | | | 992,500 | | | | 905,656 | |
Stonewall (Green Energy) | | | | | | | | |
6.50% due 11/12/21 | | | 500,000 | | | | 485,000 | |
Total Electric | | | | | | | 1,390,656 | |
Total Senior Floating Rate Interests | | | | | |
(Cost $614,957,759) | | | | | | | 609,095,035 | |
| | | | | | | | | |
CORPORATE BONDS†† - 13.7% | |
Financial - 4.3% | |
Citigroup, Inc. | | | | | | | | |
5.95% due 12/31/496,11 | | | 11,259,000 | | | | 11,470,119 | |
5.88% due 12/31/496,11 | | | 9,280,000 | | | | 9,373,728 | |
5.95% due 12/29/496,11 | | | 8,300,000 | | | | 8,598,219 | |
5.90% due 12/31/496,11 | | | 3,300,000 | | | | 3,415,500 | |
Bank of America Corp. | | | | | | | | |
6.10% due 03/12/496,11 | | | 17,000,000 | | | | 17,722,499 | |
6.30% due 12/31/496,11 | | | 6,100,000 | | | | 6,626,125 | |
Jefferies Finance LLC / JFIN Company-Issuer Corp. | | | | | | | | |
7.38% due 04/01/207 | | | 10,274,000 | | | | 10,017,149 | |
7.50% due 04/15/217 | | | 4,751,000 | | | | 4,620,348 | |
6.88% due 04/15/227 | | | 1,100,000 | | | | 1,023,000 | |
Atlas Mara Ltd. | | | | | | | | |
8.00% due 12/31/203 | | | 14,400,000 | | | | 12,096,000 | |
GEO Group, Inc. | | | | | | | | |
6.00% due 04/15/26 | | | 6,450,000 | | | | 5,482,500 | |
5.88% due 10/15/24 | | | 3,850,000 | | | | 3,311,000 | |
5.88% due 01/15/22 | | | 2,000,000 | | | | 1,800,000 | |
5.13% due 04/01/23 | | | 200,000 | | | | 170,000 | |
Kennedy-Wilson, Inc. | | | | | | | | |
5.88% due 04/01/24 | | | 9,550,000 | | | | 9,621,625 | |
Oxford Finance LLC / Oxford Finance Company-Issuer, Inc. | | | | | | | | |
7.25% due 01/15/187 | | | 7,926,000 | | | | 7,926,000 | |
Fifth Third Bancorp | | | | | | | | |
4.90% due 12/31/496,11 | | | 7,700,000 | | | | 7,461,300 | |
CIC Receivables Master Trust | | | | | | | | |
4.89% due 10/07/21††† | | | 6,240,706 | | | | 6,296,621 | |
Customers Bank | | | | | | | | |
6.13% due 06/26/296,20 | | | 4,500,000 | | | | 4,545,000 | |
Greystar Real Estate Partners LLC | | | | | | | | |
8.25% due 12/01/227 | | | 3,325,000 | | | | 3,524,500 | |
NFP Corp. | | | | | | | | |
9.00% due 07/15/217 | | | 3,061,000 | | | | 3,144,795 | |
Univest Corporation of Pennsylvania | | | | | | | | |
5.10% due 03/30/253,6 | | | 2,500,000 | | | | 2,500,000 | |
Jefferies LoanCore LLC / JLC Finance Corp. | | | | | | | | |
6.88% due 06/01/207 | | | 1,700,000 | | | | 1,547,000 | |
FBM Finance, Inc. | | | | | | | | |
8.25% due 08/15/217 | | | 1,200,000 | | | | 1,254,000 | |
NewStar Financial, Inc. | | | | | | | | |
7.25% due 05/01/20 | | | 1,225,000 | | | | 1,206,625 | |
Total Financial | | | | | | | 144,753,653 | |
| | | | | | | | | |
Energy - 2.3% | |
Sunoco Logistics Partners Operations, LP | | | | | | | | |
5.95% due 12/01/25 | | | 14,375,000 | | | | 16,659,733 | |
CONSOL Energy, Inc. | | | | | | | | |
8.00% due 04/01/23 | | | 10,300,000 | | | | 9,991,000 | |
Buckeye Partners, LP | | | | | | | | |
4.35% due 10/15/24 | | | 9,701,000 | | | | 9,845,254 | |
SandRidge Energy, Inc. | | | | | | | | |
8.75% due 06/01/207,12 | | | 23,454,000 | | | | 8,443,440 | |
Approach Resources, Inc. | | | | | | | | |
7.00% due 06/15/21 | | | 8,093,000 | | | | 6,474,400 | |
Comstock Resources, Inc. | | | | | | | | |
10.00% due 03/15/20 | | | 5,650,000 | | | | 5,226,250 | |
Gibson Energy, Inc. | | | | | | | | |
6.75% due 07/15/217 | | | 4,590,000 | | | | 4,693,274 | |
BreitBurn Energy Partners Limited Partnership / BreitBurn Finance Corp. | | | | | | | | |
9.25% due 05/18/20†††,3,12 | | | 5,037,000 | | | | 3,525,900 | |
Hess Corp. | | | | | | | | |
7.30% due 08/15/31 | | | 2,950,000 | | | | 3,498,417 | |
32 | THE GUGGENHEIM FUNDS ANNUAL REPORT | SEE NOTES TO FINANCIAL STATEMENTS. |
CONSOLIDATED SCHEDULE OF INVESTMENTS (continued) | September 30, 2016 |
MACRO OPPORTUNITIES FUND | |
| | | Face
Amount17 | | | Value | |
| | | | | | | |
Crestwood Midstream Partners, LP / Crestwood Midstream Finance Corp. | | | | | | |
6.13% due 03/01/22 | | $ | 2,600,000 | | | $ | 2,626,000 | |
Unit Corp. | | | | | | | | |
6.63% due 05/15/21 | | | 2,850,000 | | | | 2,404,688 | |
Crestwood Midstream Partners Limited Partnership / Crestwood Midstream Finance Corp. | | | | | | | | |
6.25% due 04/01/23 | | | 1,675,000 | | | | 1,695,938 | |
PDC Energy, Inc. | | | | | | | | |
6.13% due 09/15/24 | | | 650,000 | | | | 672,750 | |
7.75% due 10/15/22 | | | 450,000 | | | | 480,375 | |
Schahin II Finance Company SPV Ltd. | | | | | | | | |
5.88% due 09/25/2212,20 | | | 7,557,400 | | | | 906,888 | |
Antero Resources Corp. | | | | | | | | |
5.63% due 06/01/23 | | | 775,000 | | | | 789,531 | |
Total Energy | | | | | | | 77,933,838 | |
| | | | | | | | | |
Communications - 1.7% | |
DISH DBS Corp. | | | | | | | | |
5.88% due 11/15/24 | | | 18,200,000 | | | | 17,972,500 | |
7.75% due 07/01/26 | | | 2,900,000 | | | | 3,081,250 | |
SFR Group S.A. | | | | | | | | |
6.00% due 05/15/227 | | | 7,725,000 | | | | 7,879,500 | |
6.25% due 05/15/247 | | | 6,622,000 | | | | 6,578,639 | |
Avaya, Inc. | | | | | | | | |
7.00% due 04/01/197 | | | 9,505,000 | | | | 7,009,938 | |
MDC Partners, Inc. | | | | | | | | |
6.50% due 05/01/247 | | | 5,000,000 | | | | 4,625,000 | |
McGraw-Hill Global Education Holdings LLC / McGraw-Hill Global Education Finance | | | | | | | | |
7.88% due 05/15/247 | | | 2,400,000 | | | | 2,592,000 | |
Midcontinent Communications & Midcontinent Finance Corp. | | | | | | | | |
6.88% due 08/15/237 | | | 2,410,000 | | | | 2,566,650 | |
TIBCO Software, Inc. | | | | | | | | |
11.38% due 12/01/217 | | | 2,750,000 | | | | 2,447,500 | |
EIG Investors Corp. | | | | | | | | |
10.88% due 02/01/24†††,20 | | | 1,100,000 | | | | 913,822 | |
Total Communications | | | | | | | 55,666,799 | |
| | | | | | | | | |
Consumer, Non-cyclical - 1.4% | |
Vector Group Ltd. | | | | | | | | |
7.75% due 02/15/21 | | | 18,610,000 | | | | 19,627,967 | |
Bumble Bee Holdings, Inc. | | | | | | | | |
9.00% due 12/15/177 | | | 18,709,000 | | | | 18,802,545 | |
Central Garden & Pet Co. | | | | | | | | |
6.13% due 11/15/23 | | | 4,475,000 | | | | 4,788,250 | |
Opal Acquisition, Inc. | | | | | | | | |
8.88% due 12/15/217 | | | 2,060,000 | | | | 1,689,200 | |
KeHE Distributors LLC / KeHE Finance Corp. | | | | | | | | |
7.63% due 08/15/217 | | | 1,125,000 | | | | 1,116,563 | |
Bumble Bee Holdco SCA | | | | | | | | |
9.63% due 03/15/187 | | | 1,076,000 | | | | 1,067,930 | |
Total Consumer, Non-cyclical | | | | 47,092,455 | |
| | | | | | | | | |
Basic Materials - 1.2% | |
BHP Billiton Finance USA Ltd. | | | | | | | | |
6.75% due 10/19/756,7 | | | 14,500,000 | | | | 16,421,250 | |
Yamana Gold, Inc. | | | | | | | | |
4.95% due 07/15/24 | | | 12,400,000 | | | | 12,808,939 | |
Eldorado Gold Corp. | | | | | | | | |
6.13% due 12/15/207 | | | 7,570,000 | | | | 7,622,990 | |
Alcoa Nederland Holding BV | | | | | | | | |
6.75% due 09/30/247 | | | 1,800,000 | | | | 1,869,750 | |
7.00% due 09/30/267 | | | 550,000 | | | | 568,563 | |
Constellium N.V. | | | | | | | | |
7.88% due 04/01/217 | | | 1,250,000 | | | | 1,334,375 | |
Mirabela Nickel Ltd. | | | | | | | | |
2.38% due 06/24/19†††,3 | | | 1,885,418 | | | | 527,917 | |
1.00% due 09/10/44†††,3 | | | 37,690 | | | | — | |
Total Basic Materials | | | | | | | 41,153,784 | |
SEE NOTES TO FINANCIAL STATEMENTS. | THE GUGGENHEIM FUNDS ANNUAL REPORT | 33 |
CONSOLIDATED SCHEDULE OF INVESTMENTS (continued) | September 30, 2016 |
MACRO OPPORTUNITIES FUND | |
| | | Face
Amount17 | | | Value | |
| | | | | | | |
Technology - 0.9% | |
Micron Technology, Inc. | | | | | | |
5.25% due 08/01/23 | | $ | 11,200,000 | | | $ | 11,060,000 | |
7.50% due 09/15/237 | | | 2,250,000 | | | | 2,499,165 | |
NCR Corp. | | | | | | | | |
6.38% due 12/15/23 | | | 6,010,000 | | | | 6,355,575 | |
Infor US, Inc. | | | | | | | | |
6.50% due 05/15/22 | | | 5,720,000 | | | | 5,791,500 | |
Epicor Software | | | | | | | | |
9.25% due 06/21/23††† | | | 1,850,000 | | | | 1,807,450 | |
First Data Corp. | | | | | | | | |
7.00% due 12/01/237 | | | 1,100,000 | | | | 1,163,250 | |
Total Technology | | | | | | | 28,676,940 | |
| | | | | | | | | |
Industrial - 0.6% | |
StandardAero Aviation Holdings, Inc. | | | | | | | | |
10.00% due 07/15/237 | | | 5,800,000 | | | | 6,223,864 | |
Dynagas LNG Partners Limited Partnership / Dynagas Finance, Inc. | | | | | | | | |
6.25% due 10/30/193 | | | 5,950,000 | | | | 5,518,625 | |
Novelis Corp. | | | | | | | | |
6.25% due 08/15/247 | | | 2,750,000 | | | | 2,918,438 | |
5.88% due 09/30/267 | | | 1,600,000 | | | | 1,638,000 | |
Princess Juliana International Airport Operating Company N.V. | | | | | | | | |
5.50% due 12/20/27†††,7 | | | 1,764,867 | | | | 1,733,275 | |
LMI Aerospace, Inc. | | | | | | | | |
7.38% due 07/15/19 | | | 1,550,000 | | | | 1,557,750 | |
Infor US, Inc. | | | | | | | | |
5.75% due 05/15/22 | | EUR 1,120,000 | | | | 1,231,570 | |
CEVA Group plc | | | | | | | | |
7.00% due 03/01/217 | | | 263,000 | | | | 213,030 | |
Total Industrial | | | | | | | 21,034,552 | |
| | | | | | | | | |
Consumer, Cyclical - 0.6% | |
WMG Acquisition Corp. | | | | | | | | |
6.75% due 04/15/227 | | | 6,050,000 | | | | 6,397,875 | |
Ferrellgas Limited Partnership / Ferrellgas Finance Corp. | | | | | | | | |
6.75% due 06/15/23 | | | 5,500,000 | | | | 4,840,000 | |
Carrols Restaurant Group, Inc. | | | | | | | | |
8.00% due 05/01/22 | | | 2,500,000 | | | | 2,703,125 | |
Nathan’s Famous, Inc. | | | | | | | | |
10.00% due 03/15/207 | | | 2,450,000 | | | | 2,695,000 | |
Seminole Hard Rock Entertainment Inc. / Seminole Hard Rock International LLC | | | | | | | | |
5.88% due 05/15/217 | | | 1,800,000 | | | | 1,818,000 | |
Total Consumer, Cyclical | | | | | | | 18,454,000 | |
| | | | | | | | | |
Diversified - 0.5% | |
HRG Group, Inc. | | | | | | | | |
7.88% due 07/15/19 | | | 15,017,000 | | | | 15,824,164 | |
| | | | | | | | | |
Utilities - 0.2% | |
LBC Tank Terminals Holding Netherlands BV | | | | | | | | |
6.88% due 05/15/237 | | | 2,865,000 | | | | 2,850,675 | |
Terraform Global Operating LLC | | | | | | | | |
13.75% due 08/15/227,13 | | | 2,700,000 | | | | 2,781,000 | |
FPL Energy National Wind LLC | | | | | | | | |
5.61% due 03/10/2420 | | | 40,202 | | | | 39,197 | |
Total Utilities | | | | | | | 5,670,872 | |
Total Corporate Bonds | | | | | | | | |
(Cost $445,331,469) | | | | | | | 456,261,057 | |
| | | | | | | | | |
COLLATERALIZED MORTGAGE OBLIGATIONs†† - 10.0% | |
Residential Mortgage Backed Securities - 7.3% | |
Banc of America Funding Ltd. | | | | | | | | |
2013-R1, 0.71% due 11/03/416,7 | | | 28,124,214 | | | | 25,622,707 | |
NRPL Trust | | | | | | | | |
2015-1A, 3.88% due 11/01/547 | | | 19,217,434 | | | | 19,086,278 | |
2014-2A, 3.75% due 10/25/576,7 | | | 6,060,769 | | | | 6,036,523 | |
RALI Series Trust | | | | | | | | |
2006-QO10, 0.68% due 01/25/376 | | | 11,305,218 | | | | 9,533,528 | |
34 | THE GUGGENHEIM FUNDS ANNUAL REPORT | SEE NOTES TO FINANCIAL STATEMENTS. |
CONSOLIDATED SCHEDULE OF INVESTMENTS (continued) | September 30, 2016 |
MACRO OPPORTUNITIES FUND | |
| | | Face
Amount17 | | | Value | |
| | | | | | | |
2007-QO2, 0.68% due 02/25/476 | | $ | 12,963,357 | | | $ | 7,377,964 | |
2006-QO2, 0.80% due 02/25/466 | | | 13,941,822 | | | | 6,283,164 | |
2006-QO2, 0.75% due 02/25/466 | | | 4,025,814 | | | | 1,771,679 | |
American Home Mortgage Assets Trust | | | | | | | | |
2007-1, 1.21% due 02/25/476 | | | 34,400,717 | | | | 20,391,212 | |
Lehman XS Trust Series | | | | | | | | |
2006-16N, 0.72% due 11/25/466 | | | 11,754,787 | | | | 9,687,910 | |
2006-10N, 0.74% due 07/25/466 | | | 8,589,745 | | | | 6,839,790 | |
LSTAR Securities Investment Ltd. | | | | | | | | |
2016-3, 2.53% due 09/01/216,7 | | | 15,600,000 | | | | 15,399,889 | |
LSTAR Securities Investment Trust | | | | | | | | |
2015-1, 2.53% due 01/01/206,7 | | | 13,045,819 | | | | 13,026,250 | |
Oak Hill Advisors Residential Loan Trust | | | | | | | | |
2015-NPL2, 3.72% due 07/25/557 | | | 12,195,113 | | | | 12,090,590 | |
Nomura Resecuritization Trust | | | | | | | | |
2015-4R, 1.31% due 03/26/366,7 | | | 6,601,279 | | | | 6,259,332 | |
2012-1R, 0.96% due 08/27/476,7 | | | 5,881,917 | | | | 5,801,335 | |
AJAX Mortgage Loan Trust | | | | | | | | |
2015-A, 3.88% due 11/25/547 | | | 10,997,313 | | | | 10,964,782 | |
Merrill Lynch Alternative Note Asset Trust Series | | | | | | | | |
2007-OAR3, 0.72% due 07/25/376 | | | 12,396,309 | | | | 9,893,700 | |
GSAA Home Equity Trust | | | | | | | | |
2006-3, 0.83% due 03/25/366 | | | 5,582,277 | | | | 3,688,356 | |
2007-7, 0.80% due 07/25/376 | | | 3,741,963 | | | | 3,329,596 | |
2006-14, 0.78% due 09/25/366 | | | 4,497,821 | | | | 2,773,061 | |
GSAA Trust | | | | | | | | |
2006-9, 0.77% due 06/25/366 | | | 14,711,200 | | | | 8,054,551 | |
Luminent Mortgage Trust | | | | | | | | |
2006-2, 0.73% due 02/25/466 | | | 11,672,231 | | | | 7,996,913 | |
Washington Mutual Mortgage Pass-Through Certificates WMALT Series Trust | | | | | | | | |
2006-AR9, 1.35% due 11/25/466 | | | 9,721,404 | | | | 6,974,453 | |
HSI Asset Securitization Corporation Trust | | | | | | | | |
2005-OPT1, 0.95% due 11/25/356 | | | 7,320,000 | | | | 6,365,251 | |
American Home Mortgage Investment Trust | | | | | | | | |
2006-1, 0.92% due 03/25/466 | | | 5,905,653 | | | | 4,892,246 | |
GCAT LLC | | | | | | | | |
2015-1, 3.63% due 05/26/207,14 | | | 4,449,308 | | | | 4,456,148 | |
Alliance Bancorp Trust | | | | | | | | |
2007-OA1, 0.77% due 07/25/376 | | | 4,508,346 | | | | 3,287,219 | |
Wachovia Asset Securitization Issuance II LLC Trust | | | | | | | | |
2007-HE1, 0.67% due 07/25/376,7 | | | 2,445,948 | | | | 2,091,175 | |
Morgan Stanley Re-REMIC Trust | | | | | | | | |
2010-R5, 1.12% due 06/26/366,7 | | | 2,144,902 | | | | 1,553,718 | |
Asset Backed Securities Corporation Home Equity Loan Trust | | | | | | | | |
2006-HE5, 0.67% due 07/25/366 | | | 1,218,421 | | | | 1,075,311 | |
SEE NOTES TO FINANCIAL STATEMENTS. | THE GUGGENHEIM FUNDS ANNUAL REPORT | 35 |
CONSOLIDATED SCHEDULE OF INVESTMENTS (continued) | September 30, 2016 |
MACRO OPPORTUNITIES FUND | |
| | | Face
Amount17 | | | Value | |
| | | | | | | |
First Franklin Mortgage Loan Trust | | | | | | |
2006-FF1, 0.97% due 01/25/366 | | $ | 1,225,000 | | | $ | 985,601 | |
GreenPoint Mortgage Funding Trust | | | | | | | | |
2007-AR1, 0.61% due 02/25/476 | | | 227,802 | | | | 225,873 | |
Total Residential Mortgage Backed Securities | | | | 243,816,105 | |
| | | | | | | | | |
Commercial Mortgage Backed Securities - 2.5% | |
Motel 6 Trust | | | | | | | | |
2015-MTL6, 5.28% due 02/05/307 | | | 34,450,000 | | | | 34,531,003 | |
GS Mortgage Securities Corporation Trust | | | | | | | | |
2016-ICE2, 9.02% due 02/15/336,7 | | | 28,300,000 | | | | 28,244,546 | |
CDGJ Commercial Mortgage Trust | | | | | | | | |
2014-BXCH, 4.77% due 12/15/276,7 | | | 11,694,646 | | | | 11,585,151 | |
BXHTL Mortgage Trust | | | | | | | | |
2015-JWRZ, 4.21% due 05/15/296,7 | | | 5,000,000 | | | | 4,890,311 | |
GE Business Loan Trust | | | | | | | | |
2007-1A, 0.97% due 04/16/356,7 | | | 3,983,494 | | | | 3,497,189 | |
Total Commercial Mortgage Backed Securities | | | | 82,748,200 | |
| | | | | | | | | |
Military Housing - 0.2% | |
Capmark Military Housing Trust | | | | | | | | |
2007-AET2, 6.06% due 10/10/5220 | | | 5,850,300 | | | | 5,902,602 | |
Total Collateralized Mortgage Obligations | |
(Cost $335,314,513) | | | | | | | 332,466,907 | |
| | | | | | | | | |
FOREIGN GOVERNMENT BONDS†† - 1.5% | |
Kenya Government International Bond | | | | | | | | |
6.88% due 06/24/247 | | | 25,000,000 | | | | 24,500,000 | |
Dominican Republic International Bond | | | | | | | | |
6.85% due 01/27/457 | | | 21,700,000 | | | | 24,304,000 | |
Total Foreign Government Bonds | | | | | |
(Cost $48,143,574) | | | | | | | 48,804,000 | |
| | | | | | | | | |
FEDERAL AGENCY DISCOUNT NOTES†† - 1.0% | |
Federal Home Loan Bank15 | | | | | | | | |
0.22% due 10/25/16 | | | 32,000,000 | | | | 31,995,307 | |
Total Federal Agency Discount Notes | | | | | |
(Cost $31,995,307) | | | | | | | 31,995,307 | |
| | | | | | | | | |
SENIOR FIXED RATE INTERESTS†† - 0.1% | |
Communications - 0.1% | |
Lions Gate Entertainment Corp. | | | | | | | | |
5.00% due 03/17/22 | | | 2,110,000 | | | | 2,146,925 | |
| | | | | | | | | |
Financial - 0.0% | |
Magic Newco, LLC | | | | | | | | |
12.00% due 06/12/19 | | | 1,075,000 | | | | 1,128,750 | |
| | | | | | | | | |
Consumer, Non-cyclical - 0.0% | |
Targus Group International, Inc. | | | | | | | | |
2019-B., 7.5% due 12/31/19†††,3 | | | 42,952 | | | | 60,059 | |
2019-A-2, 7.5% due 12/31/19†††,3 | | | 14,317 | | | | 20,019 | |
Total Consumer, Non-cyclical | | | | 80,078 | |
Total Senior Fixed Rate Interests | | | | | |
(Cost $3,384,723) | | | | | | | 3,355,753 | |
| | | | | | | | | |
COMMERCIAL PAPER†† - 8.7% | |
Hasbro, Inc. | | | | | | | | |
0.60% due 10/07/167 | | | 49,300,000 | | | | 49,295,070 | |
BAT International Finance PLC | | | | | | | | |
0.78% due 10/12/16 | | | 45,000,000 | | | | 44,989,275 | |
36 | THE GUGGENHEIM FUNDS ANNUAL REPORT | SEE NOTES TO FINANCIAL STATEMENTS. |
CONSOLIDATED SCHEDULE OF INVESTMENTS (continued) | September 30, 2016 |
MACRO OPPORTUNITIES FUND | |
| | | Face
Amount17 | | | Value | |
| | | | | | | |
American Water Capital Corp. | | | | | | |
0.67% due 10/11/167 | | $ | 39,000,000 | | | $ | 38,992,742 | |
Nissan Motor Acceptance Corp. | | | | | | | | |
0.68% due 10/17/167 | | | 35,000,000 | | | | 34,989,422 | |
Omnicom Capital, Inc. | | | | | | | | |
0.73% due 10/25/16 | | | 28,000,000 | | | | 27,988,077 | |
Ryder System, Inc. | | | | | | | | |
0.73% due 10/24/16 | | | 26,830,000 | | | | 26,817,536 | |
Mondelez International, Inc. | | | | | | | | |
0.71% due 10/25/16 | | | 20,000,000 | | | | 19,990,533 | |
Wal-Mart Stores, Inc. | | | | | | | | |
0.31% due 10/11/16 | | | 17,000,000 | | | | 16,998,536 | |
General Mills, Inc. | | | | | | | | |
0.63% due 10/12/16 | | | 15,000,000 | | | | 14,997,113 | |
Campbell Soup Co. | | | | | | | | |
0.65% due 11/07/16 | | | 15,000,000 | | | | 14,989,979 | |
Total Commercial Paper | | | | | | | | |
(Cost $290,048,283) | | | | | | | 290,048,283 | |
| | | | | | | | | |
REPURCHASE AGREEMENTS††,16 - 0.0% | |
Barclays | | | | | | | | |
issued 03/24/16 at 0.00%
open maturity1 | | | 769,375 | | | | 769,375 | |
issued 12/17/15 at (0.15)%
open maturity1 | | | 489,375 | | | | 489,375 | |
Total Repurchase Agreements | | | | | |
(Cost $1,258,750) | | | | | | | 1,258,750 | |
| | | Contracts | | | | |
| | | | | | | |
OPTIONS PURCHASED† - 0.1% | |
Call options on: | | | | | | |
SPDR Gold Shares March 2017 Expiring with strike price of $135.00 | | | 9,069 | | | $ | 2,040,525 | |
Total Call options | | | | | | | 2,040,525 | |
Total Options Purchased | | | | | | | | |
(Cost $5,940,195) | | | | | | | 2,040,525 | |
| | | | | | | | | |
Total Investments - 102.5% | | | | | |
(Cost $3,418,645,761) | | | | | | $ | 3,417,212,759 | |
| | | Shares | | | | |
| | | | | | | |
COMMON STOCKS SOLD SHORT† - (1.2)% | |
Utilities - (0.0)% | |
South Jersey Industries, Inc. | | | 16,317 | | | | (482,167 | ) |
| | | | | | | | | |
Communications - (0.0)% | |
Amazon.com, Inc.* | | | 713 | | | | (597,002 | ) |
TripAdvisor, Inc.* | | | 12,182 | | | | (769,659 | ) |
Total Communications | | | | | | | (1,366,661 | ) |
| | | | | | | | | |
Consumer, Non-cyclical - (0.0)% | |
Cantel Medical Corp. | | | 4,794 | | | | (373,836 | ) |
Monro Muffler Brake, Inc. | | | 6,621 | | | | (405,007 | ) |
Vertex Pharmaceuticals, Inc.* | | | 10,071 | | | | (878,292 | ) |
Total Consumer, Non-cyclical | | | | (1,657,135 | ) |
| | | | | | | | | |
Industrial - (0.1)% | |
Aerovironment, Inc.* | | | 16,120 | | | | (393,489 | ) |
EnPro Industries, Inc. | | | 8,575 | | | | (487,232 | ) |
Itron, Inc.* | | | 9,006 | | | | (502,175 | ) |
Martin Marietta Materials, Inc. | | | 2,907 | | | | (520,673 | ) |
Vulcan Materials Co. | | | 6,485 | | | | (737,539 | ) |
Louisiana-Pacific Corp.* | | | 50,766 | | | | (955,924 | ) |
Total Industrial | | | | | | | (3,597,032 | ) |
| | | | | | | | | |
SEE NOTES TO FINANCIAL STATEMENTS. | THE GUGGENHEIM FUNDS ANNUAL REPORT | 37 |
CONSOLIDATED SCHEDULE OF INVESTMENTS (continued) | September 30, 2016 |
MACRO OPPORTUNITIES FUND | |
| | | Shares | | | Value | |
| | | | | | | |
Basic Materials - (0.1)% | |
NewMarket Corp. | | | 908 | | | $ | (389,823 | ) |
Sensient Technologies Corp. | | | 6,870 | | | | (520,746 | ) |
FMC Corp. | | | 10,999 | | | | (531,692 | ) |
Ashland Global Holdings, Inc. | | | 5,249 | | | | (608,622 | ) |
Balchem Corp. | | | 9,827 | | | | (761,886 | ) |
Royal Gold, Inc. | | | 16,600 | | | | (1,285,338 | ) |
Total Basic Materials | | | | | | | (4,098,107 | ) |
| | |
Technology - (0.2)% | |
Ultimate Software Group, Inc.* | | | 1,958 | | | | (400,196 | ) |
CommVault Systems, Inc.* | | | 8,804 | | | | (467,757 | ) |
Intuit, Inc. | | | 4,497 | | | | (494,715 | ) |
Semtech Corp.* | | | 18,829 | | | | (522,128 | ) |
Silicon Laboratories, Inc.* | | | 8,915 | | | | (524,202 | ) |
Medidata Solutions, Inc.* | | | 11,942 | | | | (665,886 | ) |
Cypress Semiconductor Corp. | | | 88,146 | | | | (1,071,855 | ) |
Autodesk, Inc.* | | | 19,616 | | | | (1,418,825 | ) |
Total Technology | | | | | | | (5,565,564 | ) |
| | | | | | | | | |
Consumer, Cyclical - (0.2)% | |
Crocs, Inc.* | | | 37,705 | | | | (312,952 | ) |
Pool Corp. | | | 3,393 | | | | (320,706 | ) |
LKQ Corp.* | | | 9,461 | | | | (335,487 | ) |
Popeyes Louisiana Kitchen, Inc.* | | | 6,425 | | | | (341,425 | ) |
Mobile Mini, Inc. | | | 11,551 | | | | (348,840 | ) |
Motorcar Parts of America, Inc.* | | | 12,475 | | | | (359,031 | ) |
Core-Mark Holding Company, Inc. | | | 11,490 | | | | (411,342 | ) |
Kate Spade & Co.* | | | 26,171 | | | | (448,309 | ) |
Papa John’s International, Inc. | | | 6,205 | | | | (489,264 | ) |
Hanesbrands, Inc. | | | 21,544 | | | | (543,986 | ) |
Under Armour, Inc. — Class A* | | | 15,339 | | | | (593,313 | ) |
CarMax, Inc.* | | | 15,839 | | | | (845,011 | ) |
Wynn Resorts Ltd. | | | 10,815 | | | | (1,053,597 | ) |
Total Consumer, Cyclical | | | | | | | (6,403,263 | ) |
| | | | | | | | | |
Financial - (0.5)% | |
Life Storage, Inc. | | | 3,471 | | | | (308,711 | ) |
Taubman Centers, Inc. | | | 4,546 | | | | (338,268 | ) |
Bank of the Ozarks, Inc. | | | 8,879 | | | | (340,953 | ) |
Safety Insurance Group, Inc. | | | 5,073 | | | | (341,007 | ) |
Extra Space Storage, Inc. | | | 4,475 | | | | (355,360 | ) |
American Assets Trust, Inc. | | | 8,451 | | | | (366,604 | ) |
Glacier Bancorp, Inc. | | | 13,916 | | | | (396,884 | ) |
American Tower Corp. — Class A | | | 3,548 | | | | (402,095 | ) |
Liberty Property Trust | | | 10,054 | | | | (405,679 | ) |
Community Bank System, Inc. | | | 8,463 | | | | (407,155 | ) |
SL Green Realty Corp. | | | 3,914 | | | | (423,103 | ) |
Essex Property Trust, Inc. | | | 1,907 | | | | (424,689 | ) |
Webster Financial Corp. | | | 11,461 | | | | (435,633 | ) |
Kite Realty Group Trust | | | 17,172 | | | | (476,008 | ) |
Morgan Stanley | | | 14,879 | | | | (477,021 | ) |
Camden Property Trust | | | 5,780 | | | | (484,017 | ) |
Welltower, Inc. | | | 6,741 | | | | (504,025 | ) |
Douglas Emmett, Inc. | | | 13,996 | | | | (512,673 | ) |
EastGroup Properties, Inc. | | | 7,042 | | | | (518,010 | ) |
Federal Realty Investment Trust | | | 3,420 | | | | (526,441 | ) |
Simon Property Group, Inc. | | | 2,613 | | | | (540,917 | ) |
Equity One, Inc. | | | 17,871 | | | | (547,031 | ) |
People’s United Financial, Inc. | | | 35,553 | | | | (562,448 | ) |
Duke Realty Corp. | | | 20,848 | | | | (569,776 | ) |
Realty Income Corp. | | | 8,703 | | | | (582,492 | ) |
Boston Properties, Inc. | | | 4,456 | | | | (607,309 | ) |
HCP, Inc. | | | 16,067 | | | | (609,742 | ) |
Mercury General Corp. | | | 11,256 | | | | (617,392 | ) |
AvalonBay Communities, Inc. | | | 3,479 | | | | (618,705 | ) |
Associated Banc-Corp. | | | 34,047 | | | | (666,981 | ) |
38 | THE GUGGENHEIM FUNDS ANNUAL REPORT | SEE NOTES TO FINANCIAL STATEMENTS. |
CONSOLIDATED SCHEDULE OF INVESTMENTS (continued) | September 30, 2016 |
MACRO OPPORTUNITIES FUND | |
| | | Shares | | | Value | |
| | | | | | | |
Vornado Realty Trust | | | 6,847 | | | $ | (692,985 | ) |
Valley National Bancorp | | | 71,972 | | | | (700,287 | ) |
Crown Castle International Corp. | | | 7,702 | | | | (725,605 | ) |
Total Financial | | | | | | | (16,486,006 | ) |
| | | | | | | | | |
Total Common Stocks Sold Short | | | | | |
(Proceeds $35,848,542) | | | | | | | (39,655,935 | ) |
| | | Face
Amount | | | | |
| | | | | | | |
CORPORATE BONDS SOLD SHORT†† - (0.0)% | |
Envision Healthcare Corp. | | | | | | |
5.13% due 07/01/227 | | $ | 1,250,000 | | | | (1,243,750 | ) |
Total Corporate Bonds Sold Short | | | | | |
(Cost $1,241,725) | | | | | | | (1,243,750 | ) |
Total Securities Sold Short - (1.2)% | | | | | |
(proceeds $37,090,267) | | | | | | | (40,899,685 | ) |
| | | Contracts | | | | |
| | | | | | | |
OPTIONS WRITTEN† - 0.0% | |
Call options on: | | | | | | |
SPDR Gold Shares Expiring March 2017 with strike price of $150.00 | | | 9,069 | | | | (594,020 | ) |
Total Options Written | | | | | | | | |
(Premiums received $2,711,631) | | | | | | | (594,020 | ) |
Other Assets & Liabilities, net - (1.3)% | | | | (43,297,814 | ) |
Total Net Assets - 100.0% | | | | | | $ | 3,332,421,240 | |
| | | Units | | | Unrealized
Gain (Loss) | |
| | | | | | | |
OTC EQUITY SWAP AGREEMENTs†† | |
Morgan Stanley
June 2017 Macro
Opportunities Long
Custom Basket Swap
1.03%18,
Terminating 11/30/17
(Notional Value $63,513,017) | | | | | $ | 1,656,222 | |
| | |
OTC total return SWAP AGREEMENTS†† | |
Bank of America
December 2016 U.S.
Treasury Note 2.25%
due 11/15/25
Swap 0.20%21,
Terminating 12/07/16
(Notional Value $261,567,739) | | | 264,137,000 | | | $ | (1,107,810 | ) |
| | | | | | | | | |
OTC total return SWAP AGREEMENTs SOLD SHORT†† | |
Barclays
December 2016
German Bund
Swap 1.25%,4
Terminating 12/08/16
(Notional Value $244,151,115) | | | 214,754,000 | | | $ | (315,383 | ) |
| | | | | | | | | |
OTC equity SWAP AGREEMENTs SOLD SHORT†† | |
Morgan Stanley
June 2017 Macro
Opportunities Short
Custom Basket Swap
0.05%19
Terminating 11/30/17
(Notional Value $72,357,497) | | | | | | $ | (3,271,965 | ) |
SEE NOTES TO FINANCIAL STATEMENTS. | THE GUGGENHEIM FUNDS ANNUAL REPORT | 39 |
CONSOLIDATED SCHEDULE OF INVESTMENTS (continued) | September 30, 2016 |
MACRO OPPORTUNITIES FUND | |
| | | Shares | | | Unrealized
Gain | |
| | | | | | | |
Custom Basket of Long Securities18 | |
Energizer Holdings, Inc. | | | 15,180 | | | $ | 217,486 | |
WestRock Co. | | | 18,768 | | | | 175,963 | |
Intel Corp. | | | 25,875 | | | | 139,521 | |
Trinity Industries, Inc. | | | 18,475 | | | | 118,263 | |
QUALCOMM, Inc. | | | 5,048 | | | | 114,423 | |
United Continental Holdings, Inc.* | | | 21,119 | | | | 113,090 | |
Mallinckrodt plc* | | | 7,527 | | | | 110,764 | |
eBay, Inc.* | | | 11,308 | | | | 103,893 | |
Science Applications International Corp. | | | 7,074 | | | | 94,784 | |
Merck & Company, Inc. | | | 9,060 | | | | 88,933 | |
Teradyne, Inc. | | | 34,277 | | | | 88,441 | |
Lincoln National Corp. | | | 10,880 | | | | 88,089 | |
Waters Corp.* | | | 2,234 | | | | 85,854 | |
Cambrex Corp.* | | | 9,428 | | | | 83,260 | |
Ciena Corp.* | | | 14,568 | | | | 78,756 | |
Amgen, Inc. | | | 5,108 | | | | 78,442 | |
Scripps Networks Interactive, Inc. — Class A | | | 19,436 | | | | 76,177 | |
Scotts Miracle-Gro Co. — Class A | | | 4,821 | | | | 70,146 | |
Post Holdings, Inc.* | | | 5,763 | | | | 69,415 | |
Oasis Petroleum, Inc.* | | | 28,394 | | | | 61,467 | |
United Natural Foods, Inc.* | | | 23,803 | | | | 60,785 | |
International Paper Co. | | | 12,151 | | | | 59,113 | |
Harris Corp. | | | 3,544 | | | | 56,530 | |
Bank of America Corp. | | | 21,416 | | | | 44,546 | |
Microsoft Corp. | | | 5,561 | | | | 42,290 | |
Discovery Communications, Inc. — Class A* | | | 31,835 | | | | 41,307 | |
United Rentals, Inc.* | | | 7,791 | | | | 40,451 | |
UGI Corp. | | | 23,708 | | | | 37,503 | |
Foot Locker, Inc. | | | 7,859 | | | | 35,691 | |
Emergent BioSolutions, Inc.* | | | 13,236 | | | | 35,028 | |
F5 Networks, Inc.* | | | 4,229 | | | | 34,905 | |
Brinker International, Inc. | | | 6,086 | | | | 30,742 | |
FedEx Corp. | | | 2,232 | | | | 30,020 | |
Citigroup, Inc. | | | 7,146 | | | | 29,919 | |
AECOM* | | | 19,571 | | | | 28,096 | |
Polaris Industries, Inc. | | | 5,636 | | | | 27,413 | |
Intuitive Surgical, Inc.* | | | 469 | | | | 23,101 | |
Carlisle Companies, Inc. | | | 4,734 | | | | 22,489 | |
SUPERVALU, Inc.* | | | 70,941 | | | | 21,201 | |
Becton Dickinson and Co. | | | 2,326 | | | | 20,970 | |
Baxter International, Inc. | | | 6,596 | | | | 20,854 | |
Brocade Communications Systems, Inc. | | | 72,236 | | | | 20,093 | |
Universal Corp. | | | 7,450 | | | | 20,078 | |
Rockwell Automation, Inc. | | | 2,768 | | | | 19,836 | |
Agilent Technologies, Inc. | | | 9,902 | | | | 19,492 | |
Accenture plc — Class A | | | 3,417 | | | | 16,416 | |
Brunswick Corp. | | | 6,844 | | | | 14,871 | |
PepsiCo, Inc. | | | 3,251 | | | | 11,359 | |
Steel Dynamics, Inc. | | | 13,250 | | | | 11,157 | |
Jacobs Engineering Group, Inc.* | | | 8,088 | | | | 10,471 | |
Juniper Networks, Inc. | | | 43,061 | | | | 8,027 | |
American Airlines Group, Inc. | | | 9,567 | | | | 7,640 | |
Fidelity National Information Services, Inc. | | | 5,196 | | | | 6,888 | |
AmerisourceBergen Corp. — Class A | | | 11,105 | | | | 5,874 | |
Alliance Data Systems Corp.* | | | 1,512 | | | | 4,910 | |
Snap-on, Inc. | | | 2,033 | | | | 4,874 | |
Avery Dennison Corp. | | | 4,755 | | | | 4,752 | |
Big Lots, Inc. | | | 7,237 | | | | 4,589 | |
Altria Group, Inc. | | | 7,505 | | | | 3,293 | |
Casey’s General Stores, Inc. | | | 4,810 | | | | 3,283 | |
Nucor Corp. | | | 11,898 | | | | 2,008 | |
Telephone & Data Systems, Inc. | | | 17,663 | | | | 1,835 | |
Sysco Corp. | | | 6,423 | | | | 182 | |
Hain Celestial Group, Inc.* | | | 9,144 | | | | 113 | |
40 | THE GUGGENHEIM FUNDS ANNUAL REPORT | SEE NOTES TO FINANCIAL STATEMENTS. |
CONSOLIDATED SCHEDULE OF INVESTMENTS (continued) | September 30, 2016 |
MACRO OPPORTUNITIES FUND | |
| | | Shares | | | Unrealized
Gain (Loss) | |
| | | | | | | |
Synchrony Financial | | | 25,723 | | | $ | (283 | ) |
Staples, Inc. | | | 37,123 | | | | (947 | ) |
Ameren Corp. | | | 20,881 | | | | (1,034 | ) |
Best Buy Company, Inc. | | | 12,470 | | | | (1,071 | ) |
General Motors Co. | | | 12,714 | | | | (1,737 | ) |
Skechers U.S.A., Inc. — Class A* | | | 13,722 | | | | (3,173 | ) |
Archer-Daniels-Midland Co. | | | 18,013 | | | | (3,518 | ) |
Bed Bath & Beyond, Inc. | | | 10,860 | | | | (3,907 | ) |
Discover Financial Services | | | 8,950 | | | | (4,046 | ) |
Xcel Energy, Inc. | | | 9,452 | | | | (4,108 | ) |
Target Corp. | | | 6,931 | | | | (4,586 | ) |
RR Donnelley & Sons Co. | | | 23,993 | | | | (6,027 | ) |
Hawaiian Electric Industries, Inc. | | | 13,352 | | | | (7,141 | ) |
FirstEnergy Corp. | | | 25,753 | | | | (7,144 | ) |
PG&E Corp. | | | 5,624 | | | | (7,670 | ) |
Automatic Data Processing, Inc. | | | 3,528 | | | | (8,316 | ) |
Robert Half International, Inc. | | | 10,711 | | | | (8,523 | ) |
Equity Residential | | | 4,846 | | | | (9,503 | ) |
Old Republic International Corp. | | | 24,587 | | | | (10,308 | ) |
Pitney Bowes, Inc. | | | 20,970 | | | | (10,915 | ) |
Alaska Air Group, Inc. | | | 15,656 | | | | (11,034 | ) |
HollyFrontier Corp. | | | 10,217 | | | | (14,265 | ) |
Mosaic Co. | | | 15,618 | | | | (16,561 | ) |
Southwest Airlines Co. | | | 21,955 | | | | (20,582 | ) |
Lockheed Martin Corp. | | | 1,321 | | | | (21,030 | ) |
Duke Energy Corp. | | | 8,461 | | | | (22,204 | ) |
MEDNAX, Inc.* | | | 10,919 | | | | (24,640 | ) |
Progressive Corp. | | | 21,607 | | | | (24,755 | ) |
Wells Fargo & Co. | | | 17,564 | | | | (26,937 | ) |
The Gap, Inc. | | | 25,640 | | | | (30,189 | ) |
DaVita, Inc.* | | | 11,686 | | | | (31,202 | ) |
Pfizer, Inc. | | | 27,073 | | | | (38,589 | ) |
CNO Financial Group, Inc. | | | 20,568 | | | | (38,792 | ) |
ManpowerGroup, Inc. | | | 12,402 | | | | (45,748 | ) |
JetBlue Airways Corp.* | | | 46,881 | | | | (46,489 | ) |
Eastman Chemical Co. | | | 9,204 | | | | (47,479 | ) |
Campbell Soup Co. | | | 5,773 | | | | (48,109 | ) |
Danaher Corp. | | | 18,476 | | | | (48,311 | ) |
VeriSign, Inc.* | | | 8,094 | | | | (51,505 | ) |
Total System Services, Inc. | | | 14,140 | | | | (59,549 | ) |
Level 3 Communications, Inc.* | | | 23,415 | | | | (63,972 | ) |
Flowers Foods, Inc. | | | 43,819 | | | | (64,049 | ) |
Cal-Maine Foods, Inc. | | | 15,607 | | | | (65,970 | ) |
CenturyLink, Inc. | | | 47,435 | | | | (73,237 | ) |
Frontier Communications Corp. | | | 160,125 | | | | (78,336 | ) |
Ford Motor Co. | | | 78,508 | | | | (85,425 | ) |
Michael Kors Holdings Ltd.* | | | 23,597 | | | | (96,444 | ) |
Cognizant Technology Solutions Corp. — Class A* | | | 13,933 | | | | (100,007 | ) |
Total Custom Basket of Long Securities | | | | | | $ | 1,602,795 | |
| | | | | | | | | |
Custom Basket of Short Securities19 | |
Alexion Pharmaceuticals, Inc.* | | | (5,980 | ) | | | 65,467 | |
VF Corp. | | | (10,026 | ) | | | 64,650 | |
Cree, Inc.* | | | (13,298 | ) | | | 53,001 | |
New York Community Bancorp, Inc. | | | (87,665 | ) | | | 50,990 | |
Orbital ATK, Inc. | | | (4,436 | ) | | | 46,330 | |
New Jersey Resources Corp. | | | (9,113 | ) | | | 40,024 | |
NIKE, Inc. — Class B | | | (15,522 | ) | | | 39,661 | |
Mattel, Inc. | | | (18,332 | ) | | | 37,529 | |
Macerich Co. | | | (4,448 | ) | | | 34,343 | |
Fortune Brands Home & Security, Inc. | | | (5,411 | ) | | | 32,109 | |
General Electric Co. | | | (37,171 | ) | | | 29,770 | |
FactSet Research Systems, Inc. | | | (2,328 | ) | | | 24,953 | |
Dollar Tree, Inc.* | | | (5,553 | ) | | | 21,741 | |
UDR, Inc. | | | (16,359 | ) | | | 18,890 | |
AutoNation, Inc.* | | | (7,666 | ) | | | 18,658 | |
SEE NOTES TO FINANCIAL STATEMENTS. | THE GUGGENHEIM FUNDS ANNUAL REPORT | 41 |
CONSOLIDATED SCHEDULE OF INVESTMENTS (continued) | September 30, 2016 |
MACRO OPPORTUNITIES FUND | |
| | | Shares | | | Unrealized
Gain (Loss) | |
| | | | | | | |
salesforce.com, Inc.* | | | (5,131 | ) | | $ | 15,804 | |
Tempur Sealy International, Inc.* | | | (6,094 | ) | | | 14,845 | |
Healthcare Realty Trust, Inc. | | | (10,344 | ) | | | 13,405 | |
Kilroy Realty Corp. | | | (4,668 | ) | | | 12,204 | |
Jones Lang LaSalle, Inc. | | | (2,704 | ) | | | 11,231 | |
NiSource, Inc. | | | (23,020 | ) | | | 10,775 | |
Mohawk Industries, Inc.* | | | (1,540 | ) | | | 10,012 | |
Manhattan Associates, Inc.* | | | (5,396 | ) | | | 9,769 | |
Highwoods Properties, Inc. | | | (6,060 | ) | | | 9,409 | |
Equinix, Inc. | | | (1,432 | ) | | | 6,570 | |
Eversource Energy | | | (5,617 | ) | | | 5,894 | |
Legg Mason, Inc. | | | (13,924 | ) | | | 5,379 | |
MDC Holdings, Inc. | | | (17,026 | ) | | | 4,275 | |
Paychex, Inc. | | | (5,433 | ) | | | 4,083 | |
Prologis, Inc. | | | (10,715 | ) | | | 4,006 | |
Northern Trust Corp. | | | (4,647 | ) | | | 3,228 | |
PNC Financial Services Group, Inc. | | | (5,158 | ) | | | 2,857 | |
Regeneron Pharmaceuticals, Inc.* | | | (783 | ) | | | 2,650 | |
Tractor Supply Co. | | | (4,697 | ) | | | 2,617 | |
3M Co. | | | (1,797 | ) | | | 2,127 | |
Panera Bread Co. — Class A* | | | (1,655 | ) | | | 2,054 | |
Moody’s Corp. | | | (2,920 | ) | | | 1,315 | |
Monster Beverage Corp.* | | | (2,173 | ) | | | 618 | |
McDonald’s Corp. | | | (3,903 | ) | | | 414 | |
Financial Engines, Inc. | | | (10,766 | ) | | | 108 | |
Kennametal, Inc. | | | (16,323 | ) | | | (496 | ) |
Intercontinental Exchange, Inc. | | | (1,978 | ) | | | (683 | ) |
Advance Auto Parts, Inc. | | | (2,149 | ) | | | (1,659 | ) |
Lennox International, Inc. | | | (2,281 | ) | | | (2,098 | ) |
Bottomline Technologies de, Inc.* | | | (13,719 | ) | | | (2,305 | ) |
Tiffany & Co. | | | (8,359 | ) | | | (2,371 | ) |
Eli Lilly & Co. | | | (7,922 | ) | | | (2,639 | ) |
Alphabet, Inc. — Class C* | | | (414 | ) | | | (3,488 | ) |
Priceline Group, Inc.* | | | (218 | ) | | | (3,499 | ) |
Wendy’s Co. | | | (43,821 | ) | | | (3,532 | ) |
Ecolab, Inc. | | | (4,612 | ) | | | (4,201 | ) |
Fulton Financial Corp. | | | (30,571 | ) | | | (4,989 | ) |
AMETEK, Inc. | | | (6,772 | ) | | | (5,288 | ) |
Bob Evans Farms, Inc. | | | (11,256 | ) | | | (5,306 | ) |
Starbucks Corp. | | | (6,008 | ) | | | (5,934 | ) |
Illinois Tool Works, Inc. | | | (4,198 | ) | | | (5,964 | ) |
IDEXX Laboratories, Inc.* | | | (2,887 | ) | | | (6,158 | ) |
O’Reilly Automotive, Inc.* | | | (1,159 | ) | | | (6,187 | ) |
Sterling Bancorp | | | (18,543 | ) | | | (6,434 | ) |
Air Products & Chemicals, Inc. | | | (2,166 | ) | | | (6,663 | ) |
Arthur J Gallagher & Co. | | | (6,662 | ) | | | (7,333 | ) |
Sempra Energy | | | (5,181 | ) | | | (7,355 | ) |
Edgewell Personal Care Co.* | | | (4,082 | ) | | | (7,439 | ) |
Hasbro, Inc. | | | (4,097 | ) | | | (7,534 | ) |
Facebook, Inc. — Class A* | | | (5,685 | ) | | | (7,855 | ) |
Stericycle, Inc.* | | | (4,089 | ) | | | (8,730 | ) |
Expeditors International of Washington, Inc. | | | (6,355 | ) | | | (8,879 | ) |
Ross Stores, Inc. | | | (5,117 | ) | | | (8,983 | ) |
Electronic Arts, Inc.* | | | (4,264 | ) | | | (10,383 | ) |
Zoetis, Inc. | | | (7,694 | ) | | | (11,066 | ) |
Roper Technologies, Inc. | | | (2,108 | ) | | | (11,265 | ) |
CF Industries Holdings, Inc. | | | (22,133 | ) | | | (11,299 | ) |
General Dynamics Corp. | | | (3,098 | ) | | | (11,349 | ) |
Expedia, Inc. | | | (4,245 | ) | | | (11,799 | ) |
International Flavors & Fragrances, Inc. | | | (2,321 | ) | | | (12,791 | ) |
J.C. Penney Company, Inc.* | | | (36,363 | ) | | | (12,890 | ) |
Mastercard, Inc. — Class A | | | (6,740 | ) | | | (13,024 | ) |
42 | THE GUGGENHEIM FUNDS ANNUAL REPORT | SEE NOTES TO FINANCIAL STATEMENTS. |
CONSOLIDATED SCHEDULE OF INVESTMENTS (continued) | September 30, 2016 |
MACRO OPPORTUNITIES FUND | |
| | | Shares | | | Unrealized
Loss | |
| | | | | | | |
Group 1 Automotive, Inc. | | | (5,201 | ) | | $ | (13,891 | ) |
Masco Corp. | | | (11,479 | ) | | | (14,466 | ) |
Donaldson Company, Inc. | | | (9,265 | ) | | | (15,231 | ) |
Acuity Brands, Inc. | | | (1,186 | ) | | | (15,291 | ) |
Genesee & Wyoming, Inc. — Class A* | | | (4,829 | ) | | | (15,875 | ) |
Alexandria Real Estate Equities, Inc. | | | (8,145 | ) | | | (16,357 | ) |
Pioneer Natural Resources Co. | | | (1,784 | ) | | | (19,627 | ) |
Weyerhaeuser Co. | | | (10,995 | ) | | | (20,020 | ) |
SVB Financial Group* | | | (3,072 | ) | | | (20,178 | ) |
CME Group, Inc. — Class A | | | (6,881 | ) | | | (20,472 | ) |
DCT Industrial Trust, Inc. | | | (7,090 | ) | | | (20,537 | ) |
Microsemi Corp.* | | | (8,996 | ) | | | (20,790 | ) |
BlackRock, Inc. — Class A | | | (1,393 | ) | | | (22,069 | ) |
Kansas City Southern | | | (5,542 | ) | | | (22,121 | ) |
Devon Energy Corp. | | | (8,736 | ) | | | (22,624 | ) |
Xylem, Inc. | | | (11,742 | ) | | | (23,444 | ) |
Dominion Resources, Inc. | | | (8,130 | ) | | | (24,346 | ) |
Weingarten Realty Investors | | | (8,223 | ) | | | (24,351 | ) |
Netflix, Inc.* | | | (5,983 | ) | | | (24,675 | ) |
Equifax, Inc. | | | (2,346 | ) | | | (25,170 | ) |
B/E Aerospace, Inc. | | | (8,680 | ) | | | (25,974 | ) |
Pentair plc | | | (5,316 | ) | | | (25,991 | ) |
Invesco Ltd. | | | (22,521 | ) | | | (26,440 | ) |
Toll Brothers, Inc.* | | | (26,729 | ) | | | (27,134 | ) |
Edwards Lifesciences Corp.* | | | (5,270 | ) | | | (27,392 | ) |
NVIDIA Corp. | | | (6,226 | ) | | | (27,734 | ) |
Wabtec Corp. | | | (4,234 | ) | | | (28,660 | ) |
MSCI, Inc. — Class A | | | (4,690 | ) | | | (28,888 | ) |
Esterline Technologies Corp.* | | | (5,807 | ) | | | (30,044 | ) |
Anadarko Petroleum Corp. | | | (5,490 | ) | | | (30,568 | ) |
Take-Two Interactive Software, Inc.* | | | (14,236 | ) | | | (31,760 | ) |
Trimble, Inc.* | | | (12,508 | ) | | | (32,880 | ) |
Alliant Energy Corp. | | | (8,135 | ) | | | (33,312 | ) |
Marriott Vacations Worldwide Corp. | | | (10,336 | ) | | | (34,028 | ) |
Red Hat, Inc.* | | | (7,111 | ) | | | (34,477 | ) |
Royal Caribbean Cruises Ltd. | | | (9,761 | ) | | | (37,501 | ) |
Electronics for Imaging, Inc.* | | | (8,059 | ) | | | (37,930 | ) |
Education Realty Trust, Inc. | | | (9,295 | ) | | | (40,592 | ) |
Four Corners Property Trust, Inc. | | | (18,017 | ) | | | (41,305 | ) |
TransDigm Group, Inc.* | | | (1,919 | ) | | | (45,192 | ) |
Freeport-McMoRan, Inc. | | | (126,497 | ) | | | (45,943 | ) |
Domino’s Pizza, Inc. | | | (2,652 | ) | | | (48,728 | ) |
Garmin Ltd. | | | (6,639 | ) | | | (50,321 | ) |
Five Below, Inc.* | | | (12,877 | ) | | | (52,966 | ) |
Chipotle Mexican Grill, Inc. — Class A* | | | (2,640 | ) | | | (53,385 | ) |
Jack in the Box, Inc. | | | (4,872 | ) | | | (53,455 | ) |
Adobe Systems, Inc.* | | | (6,870 | ) | | | (55,609 | ) |
American International Group, Inc. | | | (14,048 | ) | | | (61,893 | ) |
Navient Corp. | | | (25,172 | ) | | | (62,380 | ) |
Ulta Salon Cosmetics & Fragrance, Inc.* | | | (2,061 | ) | | | (62,397 | ) |
Fortinet, Inc.* | | | (19,810 | ) | | | (65,440 | ) |
Lexington Realty Trust | | | (37,418 | ) | | | (65,696 | ) |
Tyler Technologies, Inc.* | | | (2,292 | ) | | | (67,142 | ) |
Caterpillar, Inc. | | | (9,923 | ) | | | (68,564 | ) |
Yum! Brands, Inc. | | | (7,297 | ) | | | (69,099 | ) |
Ventas, Inc. | | | (5,694 | ) | | | (71,826 | ) |
Lithia Motors, Inc. — Class A | | | (5,899 | ) | | | (72,911 | ) |
Sotheby’s | | | (12,406 | ) | | | (76,752 | ) |
Nektar Therapeutics* | | | (31,558 | ) | | | (77,999 | ) |
Cooper Companies, Inc. | | | (2,177 | ) | | | (97,022 | ) |
Corning, Inc. | | | (42,300 | ) | | | (102,247 | ) |
Leucadia National Corp. | | | (36,714 | ) | | | (104,893 | ) |
Copart, Inc.* | | | (9,686 | ) | | | (105,282 | ) |
Deere & Co. | | | (18,562 | ) | | | (109,169 | ) |
SEE NOTES TO FINANCIAL STATEMENTS. | THE GUGGENHEIM FUNDS ANNUAL REPORT | 43 |
CONSOLIDATED SCHEDULE OF INVESTMENTS (continued) | September 30, 2016 |
MACRO OPPORTUNITIES FUND | |
| | | Shares | | | Unrealized
Loss | |
| | | | | | | |
Dunkin’ Brands Group, Inc. | | | (11,615 | ) | | $ | (110,047 | ) |
Zebra Technologies Corp. — Class A* | | | (5,869 | ) | | | (114,921 | ) |
MDU Resources Group, Inc. | | | (17,556 | ) | | | (121,994 | ) |
PTC, Inc.* | | | (15,665 | ) | | | (125,517 | ) |
S&P Global, Inc. | | | (4,028 | ) | | | (131,220 | ) |
Cintas Corp. | | | (8,573 | ) | | | (143,921 | ) |
Stillwater Mining Co.* | | | (54,402 | ) | | | (174,639 | ) |
Total Custom Basket of Short Securities | | | | | | $ | (3,188,818 | ) |
CENTRALLY CLEARED INTEREST RATE SWAP AGREEMENTS†† | |
Counterparty | Floating
Rate | Floating Rate Index | | Fixed
Rate | | Maturity
Date | | Notional
Amount | | | Market
Value | | | Unrealized
Appreciation/
Depreciation | |
Merrill Lynch | Receive | 1-Year USD-Federal Funds | | | 0.60 | % | 01/31/18 | | $ | (1,669,250,000 | ) | | $ | 386,198 | | | $ | 386,198 | |
Merrill Lynch | Receive | 1-Year USD-Federal Funds | | | 0.61 | % | 01/31/18 | | | (1,669,250,000 | ) | | | 186,572 | | | | 186,572 | |
Merrill Lynch | Receive | 3-Month USD-LIBOR | | | 1.59 | % | 07/02/18 | | | (34,550,000 | ) | | | (355,313 | ) | | | (355,313 | ) |
Merrill Lynch | Receive | 3-Month USD-LIBOR | | | 2.73 | % | 07/02/23 | | | (23,800,000 | ) | | | (2,221,986 | ) | | | (2,221,986 | ) |
| | | | | | | | | | | | | | | | | | $ | (2,004,529 | ) |
OTC FORWARD FOREIGN CURRENCY EXCHANGE CONTRACTS†† | |
Counterparty | | Contracts
to Buy (Sell) | | Currency | Settlement
Date | | Settlement
Value | | | Value at
September 30,
2016 | | | Net
Unrealized
Appreciation/
Depreciation | |
Bank of America | | | (10,673,000 | ) | GBP | 10/13/16 | | $ | 14,155,579 | | | $ | 13,838,799 | | | $ | 316,779 | |
Morgan Stanley | | | 1,100,000 | | EUR | 10/13/16 | | | (1,231,163 | ) | | | 1,236,247 | | | | 5,084 | |
Deutsche Bank | | | (416,000 | ) | EUR | 10/13/16 | | | 468,161 | | | | 467,526 | | | | 635 | |
Morgan Stanley | | | (616,000 | ) | EUR | 10/13/16 | | | 690,555 | | | | 692,298 | | | | (1,743 | ) |
Bank of America | | | (5,561,000 | ) | EUR | 10/13/16 | | | 6,243,679 | | | | 6,249,790 | | | | (6,111 | ) |
| | | | | | | | | | | | | | | | | $ | 314,644 | |
44 | THE GUGGENHEIM FUNDS ANNUAL REPORT | SEE NOTES TO FINANCIAL STATEMENTS. |
CONSOLIDATED SCHEDULE OF INVESTMENTS (continued) | September 30, 2016 |
MACRO OPPORTUNITIES FUND | |
* | Non-income producing security. |
† | Value determined based on Level 1 inputs, unless otherwise noted — See Note 4. |
†† | Value determined based on Level 2 inputs, unless otherwise noted — See Note 4. |
††† | Value determined based on Level 3 inputs — See Note 4. |
1 | All or a portion of this security is pledged as short security collateral at September 30, 2016. |
2 | All or a portion of this security is pledged as equity swap collateral at September 30, 2016. |
3 | Illiquid security. |
4 | Total Return is based on German Bund +/- financing at a fixed rate. Rate indicated is rate effective at September 30, 2016. |
5 | Security has no stated coupon. However, it is expected to receive residual cash flow payments on defined deal dates. |
6 | Variable rate security. Rate indicated is rate effective at September 30, 2016. |
7 | Security is a 144A or Section 4(a)(2) security. These securities have been determined to be liquid under guidelines established by the Board of Trustees. The total market value of 144A or Section 4(a)(2) liquid securities is $1,504,168,949 (cost $1,486,803,520), or 45.1% of total net assets. |
8 | Affiliated issuer — See Note 8. |
9 | Rate indicated is the 7 day yield as of September 30, 2016. |
10 | Security with no rate was unsettled at September 30, 2016. |
11 | Perpetual maturity. |
12 | Security is in default of interest and/or principal obligations. |
13 | Security or a portion thereof is held as collateral for reverse repurchase agreements — See Note 12. |
14 | Security is a step up/step down bond. The coupon increases or decreases at regular intervals until the bond reaches full maturity. |
15 | The issuer operates under a Congressional charter; its securities are neither issued nor guaranteed by the U.S. Government. |
16 | Repurchase Agreements — See Note 11. |
17 | The face amount is denominated in U.S. dollars unless otherwise indicated. |
18 | Total Return is based on the return of long basket of securities +/- financing at a variable rate. Rate indicated is rate effective at September 30, 2016. |
19 | Total Return is based on the return of short basket of securities +/- financing at a variable rate. Rate indicated is rate effective at September 30, 2016. |
20 | Security is a 144A or Section 4(a)(2) security. These securities are considered to be illiquid and restricted under guidelines established by the Board of Trustees. The total market value of 144A or Section 4(a)(2) illiquid and restricted securities is $48,708,687 (cost $64,006,554), or 1.45% of total net assets — See Note 13. |
21 | Total return is based on U.S Treasury Note +/- financing at a fixed rate. Rate indicated is rate effective at September 30, 2016. |
| | plc — Public Limited Company |
| | REIT — Real Estate Investment Trust |
| | |
| | See Sector Classification in Other Information section. |
SEE NOTES TO FINANCIAL STATEMENTS. | THE GUGGENHEIM FUNDS ANNUAL REPORT | 45 |
CONSOLIDATED SCHEDULE OF INVESTMENTS (continued) | September 30, 2016 |
MACRO OPPORTUNITIES FUND | |
The following table summarizes the inputs used to value the Fund’s investments at September 30, 2016 (See Note 4 in the Notes to Financial Statements):
Investments in Securities (Assets) | | Level 1 | | | Level 2 | | | Level 2 -
Other* | | | Level 3 | | | Total | |
Asset Backed Securities | | $ | — | | | $ | 1,104,163,379 | | | $ | — | | | $ | 11,440,396 | | | $ | 1,115,603,775 | |
Collateralized Mortgage Obligations | | | — | | | | 332,466,907 | | | | — | | | | — | | | | 332,466,907 | |
Commercial Paper | | | — | | | | 290,048,283 | | | | — | | | | — | | | | 290,048,283 | |
Common Stocks | | | 93,627,349 | | | | 703,851 | | | | — | | | | 31,192 | | | | 94,362,392 | |
Corporate Bonds | | | — | | | | 441,456,072 | | | | — | | | | 14,804,985 | | | | 456,261,057 | |
Equity Swap Agreements | | | — | | | | — | | | | 1,656,222 | | | | — | | | | 1,656,222 | |
Federal Agency Discount Notes | | | — | | | | 31,995,307 | | | | — | | | | — | | | | 31,995,307 | |
Forward Foreign Currency Exchange Contracts | | | — | | | | — | | | | 322,498 | | | | — | | | | 322,498 | |
Foreign Government Bonds | | | — | | | | 48,804,000 | | | | — | | | | — | | | | 48,804,000 | |
Interest Rate Swap Agreements | | | — | | | | — | | | | 572,770 | | | | — | | | | 572,770 | |
Mutual Funds | | | 219,672,229 | | | | — | | | | — | | | | — | | | | 219,672,229 | |
Options Purchased | | | 2,040,525 | | | | — | | | | — | | | | — | | | | 2,040,525 | |
Preferred Stocks | | | — | | | | 17,910,604 | | | | — | | | | 60,732 | | | | 17,971,336 | |
Repurchase Agreements | | | — | | | | 1,258,750 | | | | — | | | | — | | | | 1,258,750 | |
Senior Fixed Rate Interests | | | — | | | | 3,275,675 | | | | — | | | | 80,078 | | | | 3,355,753 | |
Senior Floating Rate Interests | | | — | | | | 550,404,062 | | | | — | | | | 58,690,973 | | | | 609,095,035 | |
Short Term Investments | | | 194,277,408 | | | | — | | | | — | | | | — | | | | 194,277,408 | |
Warrants | | | — | | | | 2 | | | | — | | | | — | | | | 2 | |
Total | | $ | 509,617,511 | | | $ | 2,822,486,892 | | | $ | 2,551,490 | | | $ | 85,108,356 | | | $ | 3,419,764,249 | |
46 | THE GUGGENHEIM FUNDS ANNUAL REPORT | SEE NOTES TO FINANCIAL STATEMENTS. |
CONSOLIDATED SCHEDULE OF INVESTMENTS (continued) | September 30, 2016 |
MACRO OPPORTUNITIES FUND | |
Investments in Securities (Liabilities) | | Level 1 | | | Level 2 | | | Level 2 -
Other* | | | Level 3 | | | Total | |
Common Stocks | | $ | 39,655,935 | | | $ | — | | | $ | — | | | $ | — | | | $ | 39,655,935 | |
Corporate Bonds | | | — | | | | 1,243,750 | | | | — | | | | — | | | | 1,243,750 | |
Equity Swap Agreements | | | — | | | | — | | | | 3,271,965 | | | | — | | | | 3,271,965 | |
Forward Foreign Currency Exchange Contracts | | | — | | | | — | | | | 7,854 | | | | — | | | | 7,854 | |
Interest Rate Swap Agreements | | | — | | | | — | | | | 2,577,299 | | | | — | | | | 2,577,299 | |
Options Written | | | 594,020 | | | | — | | | | — | | | | — | | | | 594,020 | |
Total Return Swap Agreements | | | — | | | | — | | | | 1,423,193 | | | | — | | | | 1,423,193 | |
Total | | $ | 40,249,955 | | | $ | 1,243,750 | | | $ | 7,280,311 | | | $ | — | | | $ | 48,774,016 | |
* | Other financial instruments include forward foreign currency contracts or swaps, which are reported as unrealized gain/loss at year end. |
Transfers between investment levels may occur as the markets fluctuate and/or the availability of data used in an investment’s valuation changes. Transfers between valuation levels, if any, are in comparison to the valuation levels at the end of the previous fiscal year, and are effective using the fair value as of the end of the previous fiscal period.
As of September 30, 2016, the Fund had transfers in/out of Level 3 due to changes in securities valuation method. See the Summary of Fair Value Level 3 Activity for changes to and from Level 2 and Level 3. There were no other securities that transferred between levels.
SEE NOTES TO FINANCIAL STATEMENTS. | THE GUGGENHEIM FUNDS ANNUAL REPORT | 47 |
CONSOLIDATED SCHEDULE OF INVESTMENTS (continued) | September 30, 2016 |
MACRO OPPORTUNITIES FUND | |
Category | | Ending Balance
at 09/30/16 | | Valuation Technique | Unobservable
Inputs | | Input
Range | |
Asset Backed Securities | | $ | 11,440,396 | | Option Adjusted Spread off the prior month end broker mark over the 3 month LIBOR | Indicative Quote | | | — | |
Common Stocks | | | 19,252 | | Enterprise Value | Valuation Multiple | | | 5.5 | x |
Common Stocks | | | 11,400 | | Model Price | Purchase Price | | | — | |
Common Stocks | | | 540 | | Model Price | Liquidation value | | | — | |
Corporate Bonds | | | 12,469,618 | | Option Adjusted Spread off the prior month end broker mark over the 3 month LIBOR | Indicative Quote | | | — | |
Corporate Bonds | | | 1,807,450 | | Model Price | Market Comparable Yields | | | 8.9 | % |
Corporate Bonds | | | 527,917 | | Model Price | Liquidation value | | | — | |
Preferred Stocks | | | 60,732 | | Model Price | Market Comparable Yields | | | 8.25 | % |
Senior Fixed Rate Interests | | | 80,078 | | Enterprise Value | Valuation Multiple | | | 5.5 | x |
Senior Floating Rate Interests | | | 38,518,871 | | Model Price | Purchase Price | | | — | |
Senior Floating Rate Interests | | | 16,886,622 | | Model Price | Market Comparable Yields | | | 4.9% - 5.9 | % |
Senior Floating Rate Interests | | | 3,285,480 | | Option Adjusted Spread off the prior month end broker mark over the 3 month LIBOR | Indicative Quote | | | — | |
Total | | $ | 85,108,356 | | | | | | | |
48 | THE GUGGENHEIM FUNDS ANNUAL REPORT | SEE NOTES TO FINANCIAL STATEMENTS. |
CONSOLIDATED SCHEDULE OF INVESTMENTS (concluded) | September 30, 2016 |
MACRO OPPORTUNITIES FUND | |
Summary of Fair Value Level 3 Activity
Following is a reconciliation of Level 3 assets and liabilities for which significant unobservable inputs were used to determine fair value for the year ended September 30, 2016:
LEVEL 3 – Fair value measurement using significant unobservable inputs
| | Senior Floating/ Fixed Rate Interests | | | Asset Backed Securities | | | Corporate Bonds | | | Options Purchased | | | Common/ Preferred Stocks | | | Total | |
MACRO OPPORTUNITIES | | | | | | | | | | | | | | | | | | |
Assets: | | | | | | | | | | | | | | | | | | |
Beginning Balance | | $ | 47,150,842 | | | $ | 20,001,559 | | | $ | 16,169,805 | | | $ | 4,932,931 | | | $ | 1,955,376 | | | $ | 90,210,513 | |
Purchases | | | 25,070,797 | | | | 284 | | | | 936,778 | | | | — | | | | 44,446 | | | | 26,052,305 | |
Sales, maturities and paydowns | | | (9,649,445 | ) | | | (1,349,904 | ) | | | (2,934,877 | ) | | | — | | | | — | | | | (13,934,226 | ) |
Total realized gains or losses included in earnings | | | 13,002 | | | | (1,245,083 | ) | | | (673,873 | ) | | | (6,500,660 | ) | | | (971,251 | ) | | | (9,377,865 | ) |
Total change in unrealized gains or losses included in earnings | | | (731,305 | ) | | | 995,701 | | | | (558,871 | ) | | | 1,567,729 | | | | (936,649 | ) | | | 336,605 | |
Transfers into Level 3 | | | 295,536 | | | | 80,286 | | | | 1,866,023 | | | | — | | | | — | | | | 2,241,845 | |
Transfers out of Level 3 | | | (3,378,375 | ) | | | (7,042,446 | ) | | | — | | | | — | | | | — | | | | (10,420,821 | ) |
Ending Balance | | $ | 58,771,052 | | | $ | 11,440,397 | | | $ | 14,804,985 | | | $ | — | | | $ | 91,922 | | | $ | 85,108,356 | |
Net Change in unrealized appreciation (depreciation) for investments in securities still held at September 30, 2016 | | $ | (1,185,264 | ) | | $ | (265,073 | ) | | $ | (1,230,973 | ) | | $ | — | | | $ | (1,907,689 | ) | | $ | (4,588,999 | ) |
SEE NOTES TO FINANCIAL STATEMENTS. | THE GUGGENHEIM FUNDS ANNUAL REPORT | 49 |
CONSOLIDATED STATEMENT OF ASSETS AND LIABILITIES |
MACRO OPPORTUNITIES FUND |
September 30, 2016
Assets: | |
Investments in unaffiliated issuers, at value (cost $3,201,675,705) | | $ | 3,196,281,780 | |
Investments in affiliated issuers, at value (cost $215,711,306) | | | 219,672,229 | |
Repurchase agreements, at value (cost $1,258,750) | | | 1,258,750 | |
Total investments (cost $3,418,645,761) | | | 3,417,212,759 | |
Foreign currency, at value (cost $800) | | | 800 | |
Segregated cash with broker | | | 13,971,824 | |
Cash | | | 3,687,720 | |
Unrealized appreciation on swap agreements | | | 2,228,992 | |
Unrealized appreciation on forward foreign currency exchange contracts | | | 322,498 | |
Prepaid expenses | | | 135,248 | |
Receivables: | |
Swap settlement | | | 70,300 | |
Securities sold | | | 4,321,791 | |
Fund shares sold | | | 15,033,794 | |
Dividends | | | 402,392 | |
Foreign taxes reclaim | | | 31,412 | |
Interest | | | 18,730,562 | |
Total assets | | | 3,476,150,092 | |
| | | | | |
Liabilities: | |
Securities sold short, at value (proceeds $37,090,267) | | | 40,899,685 | |
Segregated cash due to broker | | | 14,609,379 | |
Unrealized depreciation on swap agreements | | | 7,272,457 | |
Unrealized depreciation on forward foreign currency exchange contracts | | | 7,854 | |
Reverse Repurchase Agreements | | | 2,031,750 | |
Unfunded loan commitments, at value (Note 10) (proceeds $3,248,776) | | | 2,015,400 | |
Options written, at value (premiums received $2,711,631) | | | 594,020 | |
Payable for: | |
Securities purchased | | | 61,320,650 | |
Fund shares redeemed | | | 9,901,097 | |
Management fees | | | 2,064,011 | |
Dividends distributed | | | 953,058 | |
Transfer agent/maintenance fees | | | 769,440 | |
Distribution and service fees | | | 437,863 | |
Fund accounting/administration fees | | | 256,040 | |
Trustees’ fees* | | | 106,764 | |
Miscellaneous | | | 489,384 | |
Total liabilities | | | 143,728,852 | |
Net assets | | $ | 3,332,421,240 | |
| | | | | |
Net assets consist of: | |
Paid in capital | | $ | 3,486,472,972 | |
Accumulated net investment loss | | | (26,384,548 | ) |
Accumulated net realized loss on investments | | | (121,048,972 | ) |
Net unrealized depreciation on investments | | | (6,618,212 | ) |
Net assets | | $ | 3,332,421,240 | |
| | | | | |
A-Class: | |
Net assets | | $ | 727,601,673 | |
Capital shares outstanding | | | 27,973,642 | |
Net asset value per share | | $ | 26.01 | |
Maximum offering price per share (Net asset value divided by 95.25%) | | $ | 27.31 | |
| | | | | |
C-Class: | |
Net assets | | $ | 337,075,182 | |
Capital shares outstanding | | | 12,967,928 | |
Net asset value per share | | $ | 25.99 | |
| | | | | |
P-Class: | |
Net assets | | $ | 63,664,940 | |
Capital shares outstanding | | | 2,447,142 | |
Net asset value per share | | $ | 26.02 | |
| | | | | |
Institutional Class: | |
Net assets | | $ | 2,204,079,445 | |
Capital shares outstanding | | | 84,637,313 | |
Net asset value per share | | $ | 26.04 | |
* | Relates to Trustees not deemed “interested persons” within the meaning of Section 2(a)(19) of the 1940 Act. |
50 | THE GUGGENHEIM FUNDS ANNUAL REPORT | SEE NOTES TO FINANCIAL STATEMENTS. |
CONSOLIDATED STATEMENT OF OPERATIONS |
MACRO OPPORTUNITIES FUND |
Year Ended September 30, 2016
Investment Income: | |
Interest | | $ | 188,913,088 | |
Dividends from securities of affiliated issuers | | | 7,590,881 | |
Dividends from securities of unaffiliated issuers | | | 3,149,697 | |
Other income | | | 107,111 | |
Total investment income | | | 199,760,777 | |
| | | | | |
Expenses: | |
Management fees | | | 29,470,048 | |
Transfer agent/maintenance fees | |
A-Class | | | 1,331,566 | |
C-Class | | | 472,228 | |
P-Class | | | 12,071 | |
Institutional Class | | | 1,648,258 | |
Distribution and service fees: | |
A-Class | | | 1,899,572 | |
C-Class | | | 3,497,811 | |
P-Class | | | 152,140 | |
Fund accounting/administration fees | | | 3,141,319 | |
Interest expense | | | 3,418,749 | |
Short sales dividend expense | | | 1,569,250 | |
Line of credit fees | | | 504,896 | |
Prime broker interest expense | | | 422,000 | |
Trustees’ fees* | | | 241,393 | |
Custodian fees | | | 134,951 | |
Tax expense | | | 8 | |
Miscellaneous | | | 1,344,585 | |
Total expenses | | | 49,260,845 | |
Less: | |
Expenses waived by Advisor | | | (5,123,781 | ) |
Expenses waived by Transfer Agent: | | | | |
A-Class | | | (208,420 | ) |
Institutional Class | | | (1,307,644 | ) |
Expenses waived by Distributor: | | | | |
A-Class | | | (10,431 | ) |
Total waived expenses | | | (6,650,276 | ) |
Net expenses | | | 42,610,569 | |
Net investment income | | | 157,150,208 | |
| | | | | |
Net Realized and Unrealized Gain (Loss): | |
Net realized gain (loss) on: | |
Investments in unaffiliated issuers | | | (10,544,274 | ) |
Investments in affiliated issuers | | | (6,415,707 | ) |
Swap agreements | | | (47,504,289 | ) |
Foreign currency | | | 256,144 | |
Forward currency exchange contracts | | | 3,262,640 | |
Securities sold short | | | 710,915 | |
Options purchased | | | (10,327,649 | ) |
Options written | | | 3,528,165 | |
Realized gain distributions received from investment company shares | | | 1,538,939 | |
Net realized loss | | | (65,495,116 | ) |
Net change in unrealized appreciation (depreciation) on: | |
Investments in unaffiliated issuers | | | 71,962,824 | |
Investments in affiliated issuers | | | 5,074,390 | |
Securities sold short | | | (7,734,002 | ) |
Swap agreements | | | 6,776,826 | |
Options purchased | | | (3,037,859 | ) |
Options written | | | 2,522,956 | |
Foreign currency | | | (91,427 | ) |
Forward foreign currency exchange contracts | | | 341,114 | |
Net change in unrealized appreciation (depreciation) | | | 75,814,822 | |
Net realized and unrealized gain | | | 10,319,706 | |
Net increase in net assets resulting from operations | | $ | 167,469,914 | |
* | Relates to Trustees not deemed “interested persons” within the meaning of Section 2(a)(19) of the 1940 Act. |
SEE NOTES TO FINANCIAL STATEMENTS. | THE GUGGENHEIM FUNDS ANNUAL REPORT | 51 |
CONSOLIDATED STATEMENTS OF CHANGES IN NET ASSETS |
MACRO OPPORTUNITIES FUND | |
| | | Year Ended
September 30,
2016 | | | Year Ended
September 30,
2015 | |
Increase (Decrease) in Net Assets from Operations: | | | | | | |
Net investment income | | $ | 157,150,208 | | | $ | 106,179,902 | |
Net realized loss on investments | | | (65,495,116 | ) | | | (9,260,115 | ) |
Net change in unrealized appreciation (depreciation) on investments | | | 75,814,822 | | | | (75,857,361 | ) |
Net increase in net assets resulting from operations | | | 167,469,914 | | | | 21,062,426 | |
| | | | | | | | | |
Distributions to shareholders from: | | | | | | | | |
Net investment income | | | | | | | | |
A-Class | | | (43,084,447 | ) | | | (32,220,860 | ) |
C-Class | | | (17,221,539 | ) | | | (11,680,427 | ) |
P-Class | | | (3,524,032 | ) | | | (440,186 | )* |
Institutional Class | | | (129,098,070 | ) | | | (82,260,910 | ) |
Total distributions to shareholders | | | (192,928,088 | ) | | | (126,602,383 | ) |
| | | | | | | | | |
Capital share transactions: | | | | | | | | |
Proceeds from sale of shares | | | | | | | | |
A-Class | | | 282,051,379 | | | | 850,080,101 | |
C-Class | | | 78,368,484 | | | | 190,338,315 | |
P-Class | | | 52,735,159 | | | | 65,730,196 | * |
Institutional Class | | | 1,037,025,887 | | | | 2,043,569,550 | |
Distributions reinvested | | | | | | | | |
A-Class | | | 34,200,550 | | | | 24,525,980 | |
C-Class | | | 14,434,110 | | | | 9,454,336 | |
P-Class | | | 3,524,032 | | | | 440,175 | * |
Institutional Class | | | 111,104,610 | | | | 70,225,372 | |
Cost of shares redeemed | | | | | | | | |
A-Class | | | (427,797,431 | ) | | | (361,979,619 | ) |
C-Class | | | (127,965,462 | ) | | | (62,646,748 | ) |
P-Class | | | (56,282,422 | ) | | | (1,207,063 | )* |
Institutional Class | | | (1,323,116,513 | ) | | | (563,882,643 | ) |
Net increase (decrease) from capital share transactions | | | (321,717,617 | ) | | | 2,264,647,952 | |
Net increase (decrease) in net assets | | | (347,175,791 | ) | | | 2,159,107,995 | |
| | | | | | | | | |
Net assets: | | | | | | | | |
Beginning of year | | | 3,679,597,031 | | | | 1,520,489,036 | |
End of year | | $ | 3,332,421,240 | | | $ | 3,679,597,031 | |
Accumulated net investment loss at end of year | | $ | (26,384,548 | ) | | $ | (11,576,626 | ) |
52 | THE GUGGENHEIM FUNDS ANNUAL REPORT | SEE NOTES TO FINANCIAL STATEMENTS. |
CONSOLIDATED STATEMENTS OF CHANGES IN NET ASSETS (concluded) |
MACRO OPPORTUNITIES FUND | |
| | | Year Ended
September 30,
2016 | | | Year Ended
September 30,
2015 | |
Capital share activity: | | | | | | |
Shares sold | | | | | | |
A-Class | | | 11,100,448 | | | | 31,696,780 | |
C-Class | | | 3,085,029 | | | | 7,105,425 | |
P-Class | | | 2,066,333 | | | | 2,477,290 | * |
Institutional Class | | | 40,790,744 | | | | 76,252,160 | |
Shares issued from reinvestment of distributions | | | | | | | | |
A-Class | | | 1,349,655 | | | | 919,487 | |
C-Class | | | 570,223 | | | | 353,874 | |
P-Class | | | 139,423 | | | | 16,755 | * |
Institutional Class | | | 4,378,100 | | | | 2,628,280 | |
Shares redeemed | | | | | | | | |
A-Class | | | (16,874,688 | ) | | | (13,561,866 | ) |
C-Class | | | (5,070,813 | ) | | | (2,346,202 | ) |
P-Class | | | (2,206,800 | ) | | | (45,859 | )* |
Institutional Class | | | (52,364,340 | ) | | | (21,112,108 | ) |
Net increase (decrease) in shares | | | (13,036,686 | ) | | | 84,384,016 | |
* | Since commencement of operations May 1, 2015. |
SEE NOTES TO FINANCIAL STATEMENTS. | THE GUGGENHEIM FUNDS ANNUAL REPORT | 53 |
FINANCIAL HIGHLIGHTS |
MACRO OPPORTUNITIES FUND | |
This table is presented to show selected data for a share outstanding throughout each period and to assist shareholders in evaluating a Fund’s performance for the periods presented.
A-Class | | Year Ended
Sept. 30,
2016g | | | Year Ended
Sept. 30,
2015g | | | Year Ended
Sept. 30,
2014 | | | Year Ended
Sept. 30,
2013 | | | Period Ended
Sept. 30,
2012a | |
Per Share Data | | | | | | | | | | | | | | | |
Net asset value, beginning of period | | $ | 26.07 | | | $ | 26.81 | | | $ | 26.31 | | | $ | 26.53 | | | $ | 25.00 | |
Income (loss) from investment operations: | |
Net investment income (loss)b | | | 1.16 | | | | .98 | | | | 1.10 | | | | 1.37 | | | | .99 | |
Net gain (loss) on investments (realized and unrealized) | | | .21 | | | | (.55 | ) | | | .69 | | | | (.04 | ) | | | 1.52 | |
Total from investment operations | | | 1.37 | | | | .43 | | | | 1.79 | | | | 1.33 | | | | 2.51 | |
Less distributions from: | |
Net investment income | | | (1.43 | ) | | | (1.17 | ) | | | (1.27 | ) | | | (1.43 | ) | | | (.98 | ) |
Net realized gains | | | — | | | | — | | | | — | | | | (.12 | ) | | | — | |
Return of capital | | | — | | | | — | | | | (.02 | ) | | | — | | | | — | |
Total distributions | | | (1.43 | ) | | | (1.17 | ) | | | (1.29 | ) | | | (1.55 | ) | | | (.98 | ) |
Net asset value, end of period | | $ | 26.01 | | | $ | 26.07 | | | $ | 26.81 | | | $ | 26.31 | | | $ | 26.53 | |
| | |
Total Returnh | | | 5.57 | % | | | 1.59 | % | | | 6.88 | % | | | 5.01 | % | | | 10.19 | % |
Ratios/Supplemental Data | |
Net assets, end of period (in thousands) | | $ | 727,602 | | | $ | 844,523 | | | $ | 357,765 | | | $ | 334,751 | | | $ | 83,081 | |
Ratios to average net assets: | |
Net investment income (loss) | | | 4.59 | % | | | 3.67 | % | | | 4.08 | % | | | 5.11 | % | | | 4.61 | % |
Total expensesc | | | 1.65 | % | | | 1.52 | % | | | 1.51 | % | | | 1.56 | % | | | 1.61 | % |
Net expensesd,f | | | 1.46 | % | | | 1.38 | % | | | 1.36 | % | | | 1.41 | % | | | 1.37 | % |
Portfolio turnover rate | | | 61 | % | | | 40 | % | | | 54 | % | | | 84 | % | | | 46 | % |
54 | THE GUGGENHEIM FUNDS ANNUAL REPORT | SEE NOTES TO FINANCIAL STATEMENTS. |
FINANCIAL HIGHLIGHTS (continued) |
MACRO OPPORTUNITIES FUND | |
This table is presented to show selected data for a share outstanding throughout each period and to assist shareholders in evaluating a Fund’s performance for the periods presented.
C-Class | | Year Ended
Sept. 30,
2016g | | | Year Ended
Sept. 30,
2015g | | | Year Ended
Sept. 30,
2014 | | | Year Ended
Sept. 30,
2013 | | | Period Ended
Sept. 30,
2012a | |
Per Share Data | | | | | | | | | | | | | | | |
Net asset value, beginning of period | | $ | 26.05 | | | $ | 26.79 | | | $ | 26.29 | | | $ | 26.51 | | | $ | 25.00 | |
Income (loss) from investment operations: | |
Net investment income (loss)b | | | .98 | | | | .78 | | | | .90 | | | | 1.17 | | | | .82 | |
Net gain (loss) on investments (realized and unrealized) | | | .20 | | | | (.55 | ) | | | .69 | | | | (.03 | ) | | | 1.53 | |
Total from investment operations | | | 1.18 | | | | .23 | | | | 1.59 | | | | 1.14 | | | | 2.35 | |
Less distributions from: | |
Net investment income | | | (1.24 | ) | | | (.97 | ) | | | (1.07 | ) | | | (1.24 | ) | | | (.84 | ) |
Net realized gains | | | — | | | | — | | | | — | | | | (.12 | ) | | | — | |
Return of capital | | | — | | | | — | | | | (.02 | ) | | | — | | | | — | |
Total distributions | | | (1.24 | ) | | | (.97 | ) | | | (1.09 | ) | | | (1.36 | ) | | | (.84 | ) |
Net asset value, end of period | | $ | 25.99 | | | $ | 26.05 | | | $ | 26.79 | | | $ | 26.29 | | | $ | 26.51 | |
| | |
Total Returnh | | | 4.79 | % | | | 0.84 | % | | | 6.10 | % | | | 4.26 | % | | | 9.54 | % |
Ratios/Supplemental Data | |
Net assets, end of period (in thousands) | | $ | 337,075 | | | $ | 374,633 | | | $ | 248,359 | | | $ | 163,129 | | | $ | 32,711 | |
Ratios to average net assets: | |
Net investment income (loss) | | | 3.87 | % | | | 2.90 | % | | | 3.34 | % | | | 4.36 | % | | | 3.83 | % |
Total expensesc | | | 2.36 | % | | | 2.24 | % | | | 2.22 | % | | | 2.29 | % | | | 2.31 | % |
Net expensesd,f | | | 2.20 | % | | | 2.13 | % | | | 2.10 | % | | | 2.15 | % | | | 2.11 | % |
Portfolio turnover rate | | | 61 | % | | | 40 | % | | | 54 | % | | | 84 | % | | | 46 | % |
SEE NOTES TO FINANCIAL STATEMENTS. | THE GUGGENHEIM FUNDS ANNUAL REPORT | 55 |
FINANCIAL HIGHLIGHTS (continued) |
MACRO OPPORTUNITIES FUND |
This table is presented to show selected data for a share outstanding throughout each period and to assist shareholders in evaluating a Fund’s performance for the periods presented.
P-Class | | Year Ended
Sept. 30,
2016g | | | Period Ended
Sept. 30,
2015e | |
Per Share Data | | | | | | |
Net asset value, beginning of period | | $ | 26.07 | | | $ | 26.78 | |
Income (loss) from investment operations: | |
Net investment income (loss)b | | | 1.20 | | | | .37 | |
Net gain (loss) on investments (realized and unrealized) | | | .21 | | | | (.62 | ) |
Total from investment operations | | | 1.41 | | | | (.25 | ) |
Less distributions from: | |
Net investment income | | | (1.46 | ) | | | (.46 | ) |
Total distributions | | | (1.46 | ) | | | (.46 | ) |
Net asset value, end of period | | $ | 26.02 | | | $ | 26.07 | |
| | |
Total Returnh | | | 5.74 | % | | | (0.95 | %) |
Ratios/Supplemental Data | |
Net assets, end of period (in thousands) | | $ | 63,665 | | | $ | 63,819 | |
Ratios to average net assets: | |
Net investment income (loss) | | | 4.73 | % | | | 3.36 | % |
Total expensesc | | | 1.49 | % | | | 1.43 | % |
Net expensesd,f | | | 1.33 | % | | | 1.30 | % |
Portfolio turnover rate | | | 61 | % | | | 40 | % |
56 | THE GUGGENHEIM FUNDS ANNUAL REPORT | SEE NOTES TO FINANCIAL STATEMENTS. |
FINANCIAL HIGHLIGHTS (continued) |
MACRO OPPORTUNITIES FUND |
This table is presented to show selected data for a share outstanding throughout each period and to assist shareholders in evaluating a Fund’s performance for the periods presented.
Institutional Class | | Year Ended
Sept. 30,
2016g | | | Year Ended
Sept. 30,
2015g | | | Year Ended
Sept. 30,
2014 | | | Year Ended
Sept. 30,
2013 | | | Period Ended
Sept. 30,
2012a | |
Per Share Data | | | | | | | | | | | | | | | |
Net asset value, beginning of period | | $ | 26.10 | | | $ | 26.84 | | | $ | 26.34 | | | $ | 26.56 | | | $ | 25.00 | |
Income (loss) from investment operations: | |
Net investment income (loss)b | | | 1.26 | | | | 1.06 | | | | 1.18 | | | | 1.46 | | | | 1.12 | |
Net gain (loss) on investments (realized and unrealized) | | | .21 | | | | (.54 | ) | | | .70 | | | | (.04 | ) | | | 1.47 | |
Total from investment operations | | | 1.47 | | | | .52 | | | | 1.88 | | | | 1.42 | | | | 2.59 | |
Less distributions from: | |
Net investment income | | | (1.53 | ) | | | (1.26 | ) | | | (1.36 | ) | | | (1.52 | ) | | | (1.03 | ) |
Net realized gains | | | — | | | | — | | | | — | | | | (.12 | ) | | | — | |
Return of capital | | | — | | | | — | | | | (.02 | ) | | | — | | | | — | |
Total distributions | | | (1.53 | ) | | | (1.26 | ) | | | (1.38 | ) | | | (1.64 | ) | | | (1.03 | ) |
Net asset value, end of period | | $ | 26.04 | | | $ | 26.10 | | | $ | 26.84 | | | $ | 26.34 | | | $ | 26.56 | |
| | |
Total Return h | | | 5.97 | % | | | 1.92 | % | | | 7.23 | % | | | 5.35 | % | | | 10.55 | % |
Ratios/Supplemental Data | |
Net assets, end of period (in thousands) | | $ | 2,204,079 | | | $ | 2,396,622 | | | $ | 914,366 | | | $ | 416,727 | | | $ | 106,716 | |
Ratios to average net assets: | |
Net investment income (loss) | | | 4.96 | % | | | 3.97 | % | | | 4.37 | % | | | 5.43 | % | | | 5.22 | % |
Total expensesc | | | 1.29 | % | | | 1.20 | % | | | 1.18 | % | | | 1.23 | % | | | 1.31 | % |
Net expensesd,f | | | 1.08 | % | | | 1.05 | % | | | 1.02 | % | | | 1.09 | % | | | 1.06 | % |
Portfolio turnover rate | | | 61 | % | | | 40 | % | | | 54 | % | | | 84 | % | | | 46 | % |
SEE NOTES TO FINANCIAL STATEMENTS. | THE GUGGENHEIM FUNDS ANNUAL REPORT | 57 |
FINANCIAL HIGHLIGHTS (concluded) |
MACRO OPPORTUNITIES FUND |
a | Since commencement of operations: November 30, 2011. Percentage amounts for the period, except total return and portfolio turnover rate, have been annualized. |
b | Net investment income (loss) per share was computed using average shares outstanding throughout the period. |
c | Does not include expenses of the underlying funds in which the Fund invests. |
d | Net expense information reflects the expense ratios after expense waivers. |
e | Since commencement of operations: May 1, 2015. Percentage amounts for the period, except total return and portfolio turnover rate, have been annualized. |
f | Net expenses may include expenses that are excluded from the expense limitation agreement and affiliated fee waivers. Excluding these expenses, the operating expense ratios for the periods would be: |
| | 09/30/16 | 09/30/15 | 09/30/14 | 09/30/13 | 09/30/12 |
A-Class | 1.28% | 1.30% | 1.27% | 1.29% | 1.29% |
C-Class | 2.02% | 2.05% | 2.01% | 2.01% | 2.02% |
P-Class | 1.15% | 1.21% | N/A | N/A | N/A |
Institutional Class | 0.90% | 0.97% | 0.94% | 0.96% | 0.96% |
g | Consolidated. |
h | Total return does not reflect the impact of any applicable sales charges and has not been annualized. |
58 | THE GUGGENHEIM FUNDS ANNUAL REPORT | SEE NOTES TO FINANCIAL STATEMENTS. |
NOTES TO CONSOLIDATED FINANCIAL STATEMENTS |
1. Organization, Consolidation of Subsidiary Significant Accounting Policies
Organization
Guggenheim Funds Trust (the “Trust”), a Delaware statutory trust, is registered with the SEC under the Investment Company Act of 1940 (“1940 Act”), as an open-ended investment company of the series type. Each series, in effect, is representing a separate Fund. The Trust is authorized to issue an unlimited number of shares. The Trust accounts for the assets of each Fund separately.
The Trust offers a combination of four separate classes of shares, A-Class shares, C-Class shares, P-Class shares and Institutional Class shares. Sales of shares of each Class are made without a front-end sales charge at the net asset value per share (“NAV”), with the exception of A-Class shares. A-Class shares are sold at the NAV, plus the applicable front-end sales charge. The sales charge varies depending on the amount purchased, but will not exceed 4.00%. A-Class share purchases of $1 million or more are exempt from the front-end sales charge but have a 1% contingent deferred sales charge (“CDSC”), if shares are redeemed within 12 months of purchase. C-Class shares have a 1% CDSC if shares are redeemed within 12 months of purchase. Institutional Class shares are offered primarily for direct investment by institutions such as pension and profit sharing plans, endowments, foundations and corporations. Institutional Class shares require a minimum initial investment of $2 million and a minimum account balance of $1 million. At September 30, 2016, the Trust consisted of nineteen funds (the “Funds”).
This report covers the Macro Opportunities Fund (the “Fund”), a non-diversified investment company.
Guggenheim Investments (“GI”) provides advisory services, and Rydex Fund Services, LLC (“RFS”) provides transfer agent, administrative and accounting services to the Trust. Guggenheim Funds Distributors, LLC (“GFD”) acts as principal underwriter for the Trust. GI and GFD are affiliated entities; RFS ceased to be an affiliate of GI as of October 4, 2016, when it was acquired by MUFG Investor Services. In connection with its acquisition, RFS changed its name to MUFG Investor Services (US), LLC (“MUIS”). This change has no impact on the financial statements of the Fund.
Consolidation of Subsidiary
The consolidated financial statements of the Fund includes the accounts of a wholly-owned and controlled Cayman Islands subsidiary (the “Subsidiary”). Significant inter-company accounts and transactions have been eliminated in consolidation for the Fund.
The Fund may invest up to 25% of its total assets in its Subsidiary which acts as an investment vehicle in order to effect certain investments consistent with the Fund’s investment objective and policies.
| | THE GUGGENHEIM FUNDS ANNUAL REPORT | 59 |
NOTES TO CONSOLIDATED FINANCIAL STATEMENTS (continued) |
A summary of the Fund’s investment in its Subsidiary is as follows:
Fund | Commencement
Date of
Subsidiary | | Subsidiary
Net Assets at
September 30,
2016 | | | % of Net Assets
of the Fund at
September 30,
2016 | |
Macro Opportunities Fund | 01/08/15 | | $ | 6,222,623 | | | | 0.19 | % |
Significant Accounting Policies
The Fund operates as an investment company and, accordingly, follows the investment company accounting and reporting guidance of the Financial Accounting Standards Board (“FASB”) Accounting Standards Codification Topic 946 Financial Services – Investment Companies.
The following significant accounting policies are in conformity with U.S. generally accepted accounting principles (“U.S. GAAP”) and are consistently followed by the Trust. This requires management to make estimates and assumptions that affect the reported amount of assets and liabilities, contingent assets and liabilities at the date of the financial statements, and the reported amounts of revenues and expenses during the reporting period. Actual results could differ from these estimates. All time references are based on Eastern Time.
The NAV of each Class of the Fund is calculated by dividing the market value of the Fund’s securities and other assets, less all liabilities, attributable to the Class by the number of outstanding shares of the Class.
A. The Board of Trustees of the Fund (the “Board”) has adopted policies and procedures for the valuation of the Fund’s investments (the “Valuation Procedures”). Pursuant to the Valuation Procedures, the Board has delegated to a valuation committee, consisting of representatives from Guggenheim’s investment management, fund administration, legal and compliance departments (the “Valuation Committee”), the day-to-day responsibility for implementing the Valuation Procedures, including, under most circumstances, the responsibility for determining the fair value of the Fund’s securities and/or other assets.
Valuations of the Fund’s securities are supplied primarily by pricing services appointed pursuant to the processes set forth in the Valuation Procedures. The Valuation Committee convenes monthly, or more frequently as needed, to review the valuation of all assets which have been fair valued for reasonableness. The Fund’s officers, through the Valuation Committee and consistent with the monitoring and review responsibilities set forth in the Valuation Procedures, regularly review procedures used and valuations provided by the pricing services.
If the pricing service cannot or does not provide a valuation for a particular investment or such valuation is deemed unreliable, such investment is fair valued by the Valuation Committee.
60 | THE GUGGENHEIM FUNDS ANNUAL REPORT | |
NOTES TO CONSOLIDATED FINANCIAL STATEMENTS (continued) |
Equity securities listed on an exchange (New York Stock Exchange (“NYSE”) or American Stock Exchange) are valued at the last quoted sales price as of the close of business on the NYSE, usually 4:00 p.m. on the valuation date. Equity securities listed on the NASDAQ market system are valued at the NASDAQ Official Closing Price on the valuation date, which may not necessarily represent the last sale price. If there has been no sale on such exchange or NASDAQ on a given day, the security is valued at the closing bid price on that day.
Generally, trading in foreign securities markets is substantially completed each day at various times prior to the close of the NYSE. The values of foreign securities are determined as of the close of such foreign markets or the close of the NYSE, if earlier. All investments quoted in foreign currencies are valued in U.S. dollars on the basis of the foreign currency exchange rates prevailing at the close of business. Investments in foreign securities may involve risks not present in domestic investments. The Valuation Committee will determine the current value of such foreign securities by taking into consideration certain factors which may include those discussed above, as well as the following factors, among others: the value of the securities traded on other foreign markets, ADR trading, closed-end fund trading, foreign currency exchange activity, and the trading prices of financial products that are tied to foreign securities. In addition, the Board has authorized the Valuation Committee and GI to use prices and other information supplied by a third party pricing vendor in valuing foreign securities.
Open-end investment companies (“mutual funds”) are valued at their NAV as of the close of business, on the valuation date. Exchange-traded funds (“ETFs”) and closed-end investment companies (“CEFs”) are valued at the last quoted sales price.
Debt securities with a maturity of greater than 60 days at acquisition are valued at prices that reflect broker-dealer supplied valuations or are obtained from independent pricing services, which may consider the trade activity, treasury spreads, yields or price of bonds of comparable quality, coupon, maturity, and type, as well as prices quoted by dealers who make markets in such securities. Short-term debt securities with a maturity of 60 days or less at acquisition are valued at amortized cost, provided such amount approximates market value.
Repurchase agreements are valued at amortized cost, provided such amounts approximate market value.
Typically, loans are valued using information provided by an independent third party pricing service which uses broker quotes in a non-active market.
Listed options are valued at the Official Settlement Price listed by the exchange, usually as of 4:00 p.m. Long options are valued using the bid price and short options are valued using the ask price. In the event that a settlement price is not available, fair valuation is enacted. Over-the-counter (“OTC”) options are valued using the average bid price (for long options) or average ask price (for short options) obtained from one or more security dealers.
| | THE GUGGENHEIM FUNDS ANNUAL REPORT | 61 |
NOTES TO CONSOLIDATED FINANCIAL STATEMENTS (continued) |
The value of OTC swap agreements entered into by a Fund are accounted for using the unrealized gains or losses on the agreements that are determined by marking the agreements to the last quoted value of the index that the swaps pertain to at the close of the NYSE. The swaps’ values are then adjusted to include dividends accrued, financing charges and/or interest associated with the swap agreements.
The value of interest rate swap agreements entered into by a Fund is accounted for using the unrealized gain or loss on the agreements that is determined using the spread priced off the previous day’s Chicago Mercantile Exchange (“CME”) price.
The value of equity swaps with custom portfolio baskets shall be computed by using the last exchange sale price for each underlying equity security within the swap agreement. A custom portfolio equity swap will be adjusted to include dividends accrued, financing charges and/or interest, as applicable, under the swap agreement.
Investments for which market quotations are not readily available are fair- valued as determined in good faith by GI under the direction of the Board using methods established or ratified by the Board. Valuations in accordance with these methods are intended to reflect each security’s (or asset’s) “fair value.” Each such determination is based on a consideration of all relevant factors, which are likely to vary from one pricing context to another. Examples of such factors may include, but are not limited to: market prices; sale prices; broker quotes; and models which derive prices based on inputs such as prices of securities with comparable maturities and characteristics, or based on inputs such as anticipated cash flows or collateral, spread over Treasuries, and other information analysis.
In connection with futures contracts and other derivative investments, such factors may include obtaining information as to how (a) these contracts and other derivative investments trade in the futures or other derivative markets, respectively, and (b) the securities underlying these contracts and other derivative investments trade in the cash market.
B. Senior loans in which the Fund invests generally pay interest rates which are periodically adjusted by reference to a base short-term floating rate, plus a premium. These base lending rates are generally (i) the lending rate offered by one or more major European banks, such as the one-month or three-month London Inter-Bank Offered Rate (LIBOR), (ii) the prime rate offered by one or more major United States banks, or (iii) the bank’s certificate of deposit rate. Senior floating rate interests often require prepayments from excess cash flows or permit the borrower to repay at its election. The rate at which the borrower repays cannot be predicted with accuracy. As a result, the actual remaining maturity may be substantially less than the stated maturities shown. The interest rate indicated is the rate in effect at September 30, 2016.
C. The Fund may purchase and sell interests in securities on a when-issued and delayed delivery basis, with payment and delivery scheduled for a future date. No income accrues to the Fund on such interests or securities in connection with such transactions prior to the date the Fund actually takes delivery of such interests or securities. These transactions are subject to market
62 | THE GUGGENHEIM FUNDS ANNUAL REPORT | |
NOTES TO CONSOLIDATED FINANCIAL STATEMENTS (continued) |
fluctuations and are subject to the risk that the value at delivery may be more or less than the trade date purchase price. Although the Fund will generally purchase these securities with the intention of acquiring such securities, they may sell such securities before the settlement date.
D. When the Fund engages in a short sale of a security, an amount equal to the proceeds is reflected as an asset and an equivalent liability. The amount of the liability is subsequently marked-to-market to reflect the market value of the short sale. The Fund maintains a segregated account of cash and/or securities as collateral for short sales.
Fees, if any, paid to brokers to borrow securities in connection with short sales are recorded as interest expense. In addition, the Fund must pay out the dividend rate of the equity or coupon rate of the obligation to the lender and record this as an expense. Short dividend or interest expense is a cost associated with the investment objective of short sales transactions, rather than an operational cost associated with the day-to-day management of any mutual fund. The Fund may also receive rebate income from the broker resulting from the investment of the proceeds from securities sold short.
E. Upon the purchase of an option, the premium paid is recorded as an investment, the value of which is marked-to-market daily. If a purchased option expires, the Fund realizes a loss in the amount of the cost of the option. When the Fund enters into a closing sale transaction, it realizes a gain or loss depending on whether the proceeds from the closing sale transaction are greater or less than the cost of the option. If the Fund exercises a put option, it realizes a gain or loss from the sale of the underlying security and the proceeds from such sale will be decreased by the premium originally paid. When the Fund exercises a call option, the cost of the security purchased by the Fund upon exercise increases by the premium originally paid.
When the Fund writes (sells) an option, an amount equal to the premium received is entered in that Fund’s accounting records as an asset and equivalent liability. The amount of the liability is subsequently marked-to-market to reflect the current value of the option written. When a written option expires, or if the Fund enters into a closing purchase transaction, it realizes a gain (or loss if the cost of a closing purchase transaction exceeds the premium received when the option was sold).
F. Swap agreements are marked-to-market daily and the change, if any, is recorded as unrealized gain or loss. Payments received or made as a result of an agreement or termination of an agreement are recognized as realized gains or losses.
G. Forward foreign currency exchange contracts are valued daily based on the applicable exchange rate of the underlying currency. The change in value of the contract is recorded as unrealized appreciation or depreciation until the contract is closed. When the contract is closed, the Fund records a realized gain or loss equal to the difference between the value at the time the contract was opened and the value at the time it was closed.
| | THE GUGGENHEIM FUNDS ANNUAL REPORT | 63 |
NOTES TO CONSOLIDATED FINANCIAL STATEMENTS (continued) |
H. Security transactions are recorded on the trade date for financial reporting purposes. Realized gains and losses from securities transactions are recorded using the identified cost basis. Proceeds from lawsuits related to investment holdings are recorded as realized gains in the Fund. Dividend income is recorded on the ex-dividend date, net of applicable taxes withheld by foreign countries. Taxable non-cash dividends are recorded as dividend income. Interest income, including amortization of premiums and accretion of discounts, is accrued on a daily basis. Interest income also includes paydown gains and losses on mortgage-backed and asset-backed securities and senior and subordinated loans. Amendment fees are earned as compensation for evaluating and accepting changes to the original loan agreement and are recognized when received. Dividend income from REITs is recorded based on the income included in the distributions received from the REIT investments using published REIT classifications, including some management estimates when actual amounts are not available. Distributions received in excess of this estimated amount are recorded as a reduction of the cost of investments or reclassified to capital gains. The actual amounts of income, return of capital, and capital gains are only determined by each REIT after its fiscal year-end, and may differ from the estimated amounts.
I. The Fund declares dividends from investment income daily. The Fund pays its shareholders from its net investment income monthly and distributes any net capital gains that it has realized, at least annually. Distributions to shareholders are recorded on the ex-dividend date. Dividends are reinvested in additional shares unless shareholders request payment in cash. The character of distributions made during the year from net investment income or net realized gains may differ from their ultimate characterization for federal income tax purposes.
J. Interest and dividend income, most expenses, all realized gains and losses, and all unrealized gains and losses are allocated to the classes based upon the value of the outstanding shares in each Class. Certain costs, such as distribution and service fees are charged directly to specific classes. In addition, certain expenses have been allocated to the individual Funds in the Trust on a pro rata basis upon the respective aggregate net assets of each Fund included in the Trust.
K. Under the fee arrangement with the custodian, the Fund may earn credits based on overnight custody cash balances. These credits are utilized to reduce related custodial expenses. The custodian fees disclosed in the Statement of Operations are before the reduction in expense from the related earnings credits, if any. For the year ended September 30, 2016, there were no earnings credits received.
L. The Fund may leave cash overnight in its cash account with the custodian. Periodically, the Fund may have cash due to the custodian bank as an overdraft balance. A fee is incurred on this overdraft, calculated by multiplying the overdraft by a rate based on the federal funds rate which was 0.29% at September 30, 2016.
M. Under the Fund’s organizational documents, its Trustees and Officers are indemnified against certain liabilities arising out of the performance of their duties to the Trust. In addition, throughout the normal course of business, the Fund enters into contracts that contain a variety of representations and warranties which provide general indemnifications. The Fund’s maximum
64 | THE GUGGENHEIM FUNDS ANNUAL REPORT | |
NOTES TO CONSOLIDATED FINANCIAL STATEMENTS (continued) |
exposure under these arrangements is unknown, as this would involve future claims that may be made against the Fund and/or its affiliates that have not yet occurred. However, based on experience, the Fund expects the risk of loss to be remote.
N. The accounting records of the Fund are maintained in U.S. dollars. All assets and liabilities initially expressed in foreign currencies are converted into U.S. dollars at prevailing exchange rates. Purchases and sales of investment securities, dividend and interest income, and certain expenses are translated at the rates of exchange prevailing on the respective dates of such transactions. Changes in the relationship of these foreign currencies to the U.S. dollar can significantly affect the value of the investments and earnings of the Funds. Foreign investments may also subject the Funds to foreign government exchange restrictions, expropriation, taxation or other political, social or economic developments, all of which could affect the market and/or credit risk of the investments.
The Funds do not isolate that portion of the results of operations resulting from changes in the foreign exchange rates on investments from the fluctuations arising from changes in the market prices of securities held. Such fluctuations are included with the net realized and unrealized gain or loss on investments.
Reported net realized foreign exchange gains and losses arise from sales of foreign currencies and currency gains or losses realized between the trade and settlement dates on investment transactions. Net unrealized exchange gains and losses arise from changes in the fair values of assets and liabilities other than investments in securities at the fiscal period end, resulting from changes in exchange rates.
2. Financial Instruments and Derivatives
As part of its investment strategy, the Fund utilizes short sales and a variety of derivative instruments. These investments involve, to varying degrees, elements of market risk and risks in excess of the amounts recognized in the Statement of Assets and Liabilities. Valuation and accounting treatment of these instruments can be found under Significant Accounting Policies in Note 1 of these Notes to Financial Statements.
Short Sales
A short sale is a transaction in which a Fund sells a security it does not own. If the security sold short decreases in price between the time the Fund sells the security and closes its short position, the Fund will realize a gain on the transaction. Conversely, if the security increases in price during the period, the Fund will realize a loss on the transaction. The risk of such price increases is the principal risk of engaging in short sales.
| | THE GUGGENHEIM FUNDS ANNUAL REPORT | 65 |
NOTES TO CONSOLIDATED FINANCIAL STATEMENTS (continued) |
Derivatives
Derivatives are instruments whose values depend on, or are derived from, in whole or in part, the value of one or more other assets, such as securities, currencies, commodities or indices. Derivative instruments may be used to increase investment flexibility (including to maintain cash reserves while maintaining exposure to certain other assets), for risk management (hedging) purposes, to facilitate trading, to reduce transaction costs and to pursue higher investment returns. Derivative instruments may also be used to mitigate certain investment risks, such as foreign currency exchange rate risk, interest rate risk and credit risk. U.S. GAAP requires disclosures to enable investors to better understand how and why a Fund uses derivative instruments, how these derivative instruments are accounted for and their effects on the Fund’s financial position and results of operations.
The Fund may utilize derivatives for the following purposes:
Duration - the use of an instrument to manage the interest rate risk of a portfolio.
Hedge - an investment made in order to reduce the risk of adverse price movements in a security, by taking an offsetting position to protect against broad market moves.
Index Exposure - the use of an instrument to obtain exposure to a listed or other type of index.
Speculation - the use of an instrument to express macro-economic and other investment views.
Options Purchased and Written
A call option on a security gives the purchaser of the option the right to buy, and the writer of a call option the obligation to sell, the underlying security. The purchaser of a put option has the right to sell, and the writer of the put option the obligation to buy, the underlying security at any time during the option period. The risk associated with purchasing options is limited to the premium originally paid.
The following table represents the Fund’s use, and volume of call/put options purchased on a quarterly basis:
Fund | Use | | Average Number
of Contracts | |
Macro Opportunities Fund | Duration, Hedge, Index Exposure, Speculation | | | 10,298 | |
Fund | Use | | Average Notional* | |
Macro Opportunities Fund | Duration, Hedge, Index Exposure, Speculation | | $ | 389,990,500 | |
* | Average Notional relates to currency options. |
66 | THE GUGGENHEIM FUNDS ANNUAL REPORT | |
NOTES TO CONSOLIDATED FINANCIAL STATEMENTS (continued) |
The risk in writing a call option is that a Fund may incur a loss if the market price of the underlying security increases and the option is exercised. The risk in writing a put option is that a Fund may incur a loss if the market price of the underlying security decreases and the option is exercised. In addition, there may be an imperfect correlation between the movement in prices of options and the underlying securities where a Fund may not be able to enter into a closing transaction because of an illiquid secondary market; or, for OTC options, a Fund may be at risk because of the counterparty’s inability to perform.
The following tables represent the Fund’s use and activity of options written for the year ended September 30, 2016:
Written Call Options
| | | Macro Opportunities Fund | |
| | | Number of
Contracts | | | Premium
Amount | |
Balance at September 30, 2015 | | | 25,858 | | | $ | 2,787,228 | |
Options Written | | | 19,414 | | | | 4,749,596 | |
Options terminated in closing purchase transactions | | | (20,690 | ) | | | (4,406,970 | ) |
Options expired | | | (15,513 | ) | | | (418,223 | ) |
Options exercised | | | — | | | | — | |
Balance at September 30, 2016 | | | 9,069 | | | $ | 2,711,631 | |
Written Put Options
| | | Macro Opportunities Fund | |
| | | Number of
Contracts | | | Premium
Amount | |
Balance at September 30, 2015 | | | 594 | | | $ | 1,899,577 | |
Options Written | | | 544 | | | | 2,023,075 | |
Options terminated in closing purchase transactions | | | (594 | ) | | | (1,899,577 | ) |
Options expired | | | (544 | ) | | | (2,023,075 | ) |
Options exercised | | | — | | | | — | |
Balance at September 30, 2016 | | | — | | | $ | — | |
Swaps
A swap is an agreement that obligates two parties to exchange a series of cash flows at specified intervals based upon or calculated by reference to changes in specified prices or rates for a specified amount of an underlying asset. A Fund utilizing OTC swaps bears the risk of loss of the amount expected to be received under a swap agreement in the event of the default or bankruptcy of a swap agreement counterparty or if the underlying asset declines in value. Certain standardized swaps are subject to mandatory central clearing. Central clearing generally reduces counterparty credit risk and increases liquidity, but central clearing does not make swap transactions risk-free. For Funds utilizing interest rate swaps, the exchange bears the risk of loss.
| | THE GUGGENHEIM FUNDS ANNUAL REPORT | 67 |
NOTES TO CONSOLIDATED FINANCIAL STATEMENTS (continued) |
Additionally, there is no guarantee that a Fund or an underlying fund could eliminate its exposure under an outstanding swap agreement by entering into an offsetting swap agreement with the same or another party.
Total return swaps involve commitments where single or multiple cash flows are exchanged based on the price of an underlying reference asset (such as index or basket) or a fixed or variable interest rate. Index swaps will usually be computed based on the current index value as of the close of regular trading on the NYSE or other exchange, with the swap value being adjusted to include dividends accrued, financing charges and/or interest associated with the swap agreement. A fund utilizing a total return index swap bears the risk of loss of the amount expected to be received under a swap agreement in the event of the default or bankruptcy of a swap agreement counterparty or if the underlying index declines in value.
The following table represents the Fund’s use and volume of total return swaps on a quarterly basis:
| | | | Average Notional | |
Fund | Use | | Long | | | Short | |
Macro Opportunities Fund | Index exposure, Speculation | | $ | 289,147,174 | | | $ | 380,963,733 | |
Interest rate swaps involve the exchange by the Fund with another party for its respective commitment to pay or receive interest on a notional amount of principal. Interest rate swaps are generally valued using the closing price from the prior day, subject to an adjustment for the current day’s spreads. Interest rate swaps are generally subject to mandatory central clearing, but central clearing does not make interest rate swap transactions risk free.
The following table represents the Fund’s use and volume of interest rate swaps on a quarterly basis:
| | | | Average Notional | |
Fund | Use | | Long | | | Short | |
Macro Opportunities Fund | Duration, Hedge, Speculation | | $ | 12,532,500 | | | $ | 905,125,076 | |
Currency swaps enable the Fund to gain exposure to currencies in a market without actually possessing a given currency, or to hedge a position. Currency swaps involve the exchange of the principal and interest in one currency for the principal and interest in another currency. As in other types of OTC swaps, the Fund may be at risk due to the counterparty’s inability to perform.
The following table represents the Fund’s use, and volume of currency swaps on a quarterly basis:
| | | | Average Notional | |
Fund | Use | | Long | | | Short | |
Macro Opportunities Fund | Speculation | | $ | 18,237,596 | | | $ | — | |
68 | THE GUGGENHEIM FUNDS ANNUAL REPORT | |
NOTES TO CONSOLIDATED FINANCIAL STATEMENTS (continued) |
Forward Foreign Currency Exchange Contracts
A forward foreign currency exchange contract is an agreement between two parties to exchange two designated currencies at a specific time in the future. Certain types of contracts may be cash settled, in an amount equal to the change in exchange rates during the term of the contract. The contracts can be used to hedge or manage exposure to foreign currency risks with portfolio investments or to gain exposure to foreign currencies.
The market value of a forward foreign currency exchange contract changes with fluctuations in foreign currency exchange rates. Furthermore, the Fund may be exposed to risk if the counterparties cannot meet the contract terms or if the currency value changes unfavorably as compared to the U.S. dollar.
The following table represents the Fund’s use, and volume of forward foreign currency exchange contracts on a quarterly basis:
| | | | Average Settlement | |
Fund | Use | | Purchased | | | Sold | |
Macro Opportunities Fund | Hedge | | $ | 39,587,887 | | | $ | 1,300,826 | |
Derivative Investment Holdings Categorized by Risk Exposure
The following is a summary of the location of derivative investments on the Fund’s Statement of Assets and Liabilities as of September 30, 2016:
Derivative Investment Type | Asset Derivatives | Liability Derivatives |
Equity/Interest Rate contracts | Unrealized appreciation on swap agreements | Unrealized depreciation on swap agreements |
Currency contracts | Unrealized appreciation on forward foreign currency exchange contracts | Unrealized depreciation on forward foreign currency exchange contracts |
Commodity contracts | Investments in unaffiliated issues, at value | Options written, at value |
The following table sets forth the fair value of the Fund’s derivative investments categorized by primary risk exposure at September 30, 2016:
Asset Derivative Investments Value | |
Fund | | Swaps
Equity
Contracts | | | Swaps
Interest Rate
Contracts | | | Swaps
Total Return
Contracts | | | Options
Purchased
Commodities
Contracts | | | Forward
Foreign
Currency
Exchange
Contracts | | | Total
Value at
September 30,
2016 | |
Macro Opportunities Fund | | $ | 1,656,222 | | | $ | 572,770 | | | $ | — | | | $ | 2,040,525 | | | $ | 322,498 | | | $ | 4,592,015 | |
| | THE GUGGENHEIM FUNDS ANNUAL REPORT | 69 |
NOTES TO CONSOLIDATED FINANCIAL STATEMENTS (continued) |
Liability Derivative Investments Value | |
Fund | | Swaps
Equity
Contracts | | | Swaps
Interest Rate
Contracts | | | Swaps
Total Return
Contracts | | | Options
Written
Commodities
Contracts | | | Forward
Foreign
Currency
Exchange
Contracts | | | Total
Value at
September 30,
2016 | |
Macro Opportunities Fund | | $ | 3,271,965 | | | $ | 2,577,299 | | | $ | 1,423,193 | | | $ | 594,020 | | | $ | 7,854 | | | $ | 7,874,331 | |
The following is a summary of the location of derivative investments on the Fund’s Statement of Operations for the year ended September 30, 2016:
Derivative Investment Type | Location of Gain (Loss) on Derivatives |
Currency contracts | Net realized gain(loss) on forward foreign currency exchange contracts |
| Net change in unrealized appreciation (depreciation) on forward foreign currency exchange contracts |
Equity/Interest Rate/Commodity contracts | Net realized gain (loss) on options purchased |
| Net change in unrealized appreciation (depreciation) on options purchased |
| | Net realized gain (loss) on options written |
| | Net change in unrealized appreciation (depreciation) on options written |
| | Net realized gain (loss) on swap agrrements |
| | Net change in unrealized appreciation (depreciation) on swap agreements |
The following is a summary of the Fund’s realized gain (loss) and change in unrealized appreciation (depreciation) on derivative investments recognized on the Statement of Operations categorized by primary risk exposure for the year ended September 30, 2016:
Realized Gain (Loss) on Derivative Investments Recognized on the Statement of Operations | |
Swaps
Equity
Contracts | | | Swaps
Currency
Contracts | | | Swaps
Interest
Rate
Contracts | | | Swaps
Total
Return Contracts | | | Options
Written
Equity
Contracts | | | Options
Written
Interest Rate
Contracts | | | Options
Written
Commodities
Contracts | |
$ | (35,478,403 | ) | | $ | 1,998,847 | | | $ | 1,875,848 | | | $ | (15,900,581 | ) | | $ | 3,761,678 | | | $ | 418,222 | | | $ | (651,735 | ) |
70 | THE GUGGENHEIM FUNDS ANNUAL REPORT | |
NOTES TO CONSOLIDATED FINANCIAL STATEMENTS (continued) |
Realized Gain (Loss) on Derivative Investments Recognized on the Statement of Operations | |
Options
Purchased
Equity
Contracts | | | Options
Purchased
Interest Rate
Contracts | | | Options
Purchased
Commodities
Contracts | | | Options
Purchased
Foreign Currency
Contracts | | | Forward
Foreign
Currency
Exchange
Contracts | | | Total
Value at
September
30, 2016 | |
$ | (5,063,869 | ) | | $ | (1,531,613 | ) | | $ | 4,944,910 | | | $ | (8,677,077 | ) | | | 3,262,640 | | | $ | (51,041,133 | ) |
Change in Unrealized Appreciation (Depreciation) on Derivative Investments Recognized on the Statement of Operations | |
Swaps
Equity
Contracts | | | Swaps
Currency
Contracts | | | Swaps
Interest
Rate
Contracts | | | Swaps
Total
Return
Contracts | | | Options
Written
Equity
Contracts | | | Options
Written
Interest Rate
Contracts | | | Options
Written
Commodities
Contracts | |
$ | 10,948,622 | | | $ | (149,721 | ) | | $ | (3,724,806 | ) | | $ | (297,269 | ) | | $ | 482,363 | | | $ | 202,298 | | | $ | 1,838,295 | |
Change in Unrealized Appreciation (Depreciation) on Derivative Investments Recognized on the Statement of Operations | |
Options
Purchased
Equity
Contracts | | | Options
Purchased
Interest Rate
Contracts | | | Options
Purchased
Commodities
Contracts | | | Options
Purchased
Foreign Currency
Contracts | | | Forward
Foreign
Currency
Exchange
Contracts | | | Total
Value at
September
30, 2016 | |
$ | (955,152 | ) | | $ | (1,147,341 | ) | | $ | (2,503,095 | ) | | $ | 1,567,729 | | | $ | 341,114 | | | $ | 6,603,037 | |
In conjunction with the use short sales and of derivative instruments, the Fund is required to maintain collateral in various forms. The Fund uses, where appropriate, depending on the financial instrument utilized and the broker involved, margin deposits at the broker, cash and/or securities segregated at the custodian bank, discount notes or the repurchase agreements allocated to the Fund.
The Trust has established counterparty credit guidelines and enters into transactions only with financial institutions of investment grade or better. The Trust monitors the counterparty credit risk.
3. Fees and Other Transactions with Affiliates
Under the terms of an investment advisory contract, the Fund pays GI investment advisory fees calculated at an annualized rate of 0.89% of the average daily net assets of the Fund.
| | THE GUGGENHEIM FUNDS ANNUAL REPORT | 71 |
NOTES TO CONSOLIDATED FINANCIAL STATEMENTS (continued) |
GI has contractually agreed to waive the management fee it receives from the Subsidiary in an amount equal to the management fee paid to GI by the Subsidiary. This undertaking will continue in effect for so long as the Fund invests in the Subsidiary, and may not be terminated by GI unless GI obtains the prior approval of the Fund’s Board of Trustees for such termination. For the year September 30, 2016, the Fund waived $40,139 related to advisory fees in the Subsidiary.
RFS was paid the following for providing transfer agent services to the Fund. Transfer agent fees were assessed to the applicable class of the Fund.
Annual charge per account | $5.00 – $8.00 |
Transaction fee | $0.60 – $1.10 |
Minimum annual charge per Fund† | $25,000 |
Certain out-of-pocket charges | Varies |
† | Not subject to the Fund during the first twelve months of operations. |
RFS also acted as the administrative agent for the Fund. As such it performed administrative, bookkeeping, accounting and pricing functions for the Fund. For these services, RFS received 0.095% of the average daily net assets of the Fund. The minimum annual charge for fund accounting/administrative fees is $25,000.
GI engages external service providers to perform other necessary services for the Trust, such as audit and accounting related services, legal services, custody, printing and mailing, etc., on a pass-through basis. Such expenses are allocated to various Funds within the complex based on relative net assets.
The Fund has adopted Distribution Plans related to the offering of A-Class, C-Class and P-Class shares pursuant to Rule 12b-1 under the 1940 Act. The plans provide for payments at an annual rate of 0.25% of the average daily net assets of the Fund’s A-Class and P-Class shares, and 1.00% of the average daily net assets of the Fund’s C-Class shares.
The investment advisory contracts for the following Fund provides that the total expenses be limited to a percentage of average net assets for each class of shares, exclusive of brokerage costs, dividends on securities sold short, expenses of other investment companies in which a Fund invests, interest, taxes, litigation, indemnification and extraordinary expenses. The limits are listed below:
| | Limit | Effective
Date | Contract
End Date |
Macro Opportunities Fund - A-Class | 1.36% | 11/30/12 | 02/01/17 |
Macro Opportunities Fund - C-Class | 2.11% | 11/30/12 | 02/01/17 |
Macro Opportunities Fund - P-Class | 1.36% | 05/01/15 | 02/01/17 |
Macro Opportunities Fund - Institutional Class | 0.95% | 11/30/12 | 02/01/17 |
72 | THE GUGGENHEIM FUNDS ANNUAL REPORT | |
NOTES TO CONSOLIDATED FINANCIAL STATEMENTS (continued) |
GI is entitled to reimbursement by the Funds for fees waived or expenses reimbursed during any of the previous 36 months, beginning on the date of the expense limitation agreement, if on any day the estimated operating expenses are less than the indicated percentages. At September 30, 2016, the amount of fees waived or expenses reimbursed that are subject to recoupment are presented in the following table:
Fund | | Expires
2017 | | | Expires
2018 | | | Expires
2019 | | | Total | |
Macro Opportunities Fund | | | | | | | | | | | | |
A-Class | | $ | 502,195 | | | $ | 863,800 | | | $ | 990,093 | | | $ | 2,356,088 | |
C-Class | | | 225,006 | | | | 287,650 | | | | 353,801 | | | | 855,536 | |
P-Class | | | — | | | | 10,952 | | | | 61,438 | | | | 62,617 | |
Institutional Class | | | 840,366 | | | | 2,185,566 | | | | 3,487,376 | | | | 6,513,308 | |
For the year ended September 30, 2016, no amounts were recouped by GI.
If a Fund invests in an affiliated fund, the investing Fund’s adviser has agreed to waive fees at the investing fund level. Fee waivers will be calculated at the investing Fund level without regard to any expense cap, if any, in effect for the investing Fund. Fees waived under this arrangement are not subject to reimbursement to GI. For the year September 30, 2016, the Fund waived $1,717,429 related to investments in affiliated funds.
For the year ended September 30, 2016, GFD retained sales charges of $566,973 relating to sales of A-Class shares of the Trust.
Certain trustees and officers of the Trust are also officers of GI and GFD.
4. Fair Value Measurement
In accordance with U.S. GAAP, fair value is defined as the price that the Fund would receive to sell an investment or pay to transfer a liability in an orderly transaction with an independent buyer in the principal market, or in the absence of a principal market, the most advantageous market for the investment or liability. U.S. GAAP establishes a three-tier fair value hierarchy based on the types of inputs used to value assets and liabilities and requires corresponding disclosure. The hierarchy and the corresponding inputs are summarized below:
Level 1 — | quoted prices in active markets for identical assets or liabilities. |
Level 2 — | significant other observable inputs (for example quoted prices for securities that are similar based on characteristics such as interest rates, prepayment speeds, credit risk, etc.). |
Level 3 — | significant unobservable inputs based on the best information available under the circumstances, to the extent observable inputs are not available, which may include assumptions. |
| | THE GUGGENHEIM FUNDS ANNUAL REPORT | 73 |
NOTES TO CONSOLIDATED FINANCIAL STATEMENTS (continued) |
The types of inputs available depend on a variety of factors, such as the type of security and the characteristics of the markets in which it trades, if any. Fair valuation determinations that rely on fewer or no observable inputs require greater judgment. Accordingly, fair value determinations for Level 3 securities require the greatest amount of judgment.
Independent pricing services are used to value a majority of the Fund’s investments. When values are not available from a pricing service, they may be computed by the Fund’s investment adviser or an affiliate. In any event, values may be determined using a variety of sources and techniques, including: market prices; broker quotes; and models which derive prices based on inputs such as prices of securities with comparable maturities and characteristics or based on inputs such as anticipated cash flows or collateral, spread over Treasuries, and other information and analysis. A significant portion of the Fund’s assets and liabilities are categorized as Level 2 or Level 3, as indicated in this report.
Indicative quotes from broker-dealers, adjusted for fluctuations in criteria such as credit spreads and interest rates, may be also used to value the Fund’s assets and liabilities, i.e. prices provided by a broker-dealer or other market participant who has not committed to trade at that price. Although indicative quotes are typically received from established market participants, the Fund may not have the transparency to view the underlying inputs which support the market quotations. Significant changes in an indicative quote would generally result in significant changes in the fair value of the security.
Certain fixed income securities are valued by obtaining a monthly indicative quote from a broker-dealer, adjusted for fluctuations in criteria such as credit spreads and interest rates.
The inputs or methodologies used for valuing securities are not necessarily an indication of the risk associated with investing in those securities. The suitability of the techniques and sources employed to determine fair valuation are regularly monitored and subject to change.
5. Offsetting
In the normal course of business, the Fund enters into transactions subject to enforceable master netting arrangements or other similar arrangements. Generally, the right to offset in those agreements allows the Fund to counteract the exposure to a specific counterparty with collateral received from or delivered to that counterparty based on the terms of the arrangements. These arrangements provide for the right to liquidate upon the occurrence of an event of default, credit event upon merger or additional termination event.
In order to better define their contractual rights and to secure rights that will help the Fund mitigate its counterparty risk, the Fund may enter into an International Swaps and Derivatives Association, Inc. Master Agreement (“ISDA Master Agreement”) or similar agreement with its derivative contract counterparties. An ISDA Master Agreement is a bilateral agreement between a Fund and a counterparty that governs OTC derivatives, including foreign exchange contracts, and typically contains, among other things, collateral posting terms and netting provisions in
74 | THE GUGGENHEIM FUNDS ANNUAL REPORT | |
NOTES TO CONSOLIDATED FINANCIAL STATEMENTS (continued) |
the event of a default and/or termination event. The provisions of the ISDA Master Agreement typically permit a single net payment in the event of a default (close-out netting) or similar event, including the bankruptcy or insolvency of the counterparty.
For derivatives traded under an ISDA Master Agreement, the collateral requirements are typically calculated by netting the mark-to-market amount for each transaction under such agreement and comparing that amount to the value of any collateral currently pledged by the Fund and the counterparty. For financial reporting purposes, cash collateral that has been pledged to cover obligations of the Fund and cash collateral received from the counterparty, if any,arereported separately on the Statement of Assets and Liabilities as segregated cash with broker/receivable for variation margin, or payable for swap settlement/variation margin. Generally, the amount of collateral due from or to a counterparty must exceed a minimum transfer amount threshold (e.g., $300,000) before a transfer is required to be made. To the extent amounts due to the Fund from its counterparties are not fully collateralized, contractually or otherwise, the Fund bears the risk of loss from counterparty nonperformance. The Fund attempts to mitigate counterparty risk by only entering into agreements with counterparties that they believe to be of good standing and by monitoring the financial stability of those counterparties.
For financial reporting purposes, the Fund does not offset derivative assets and derivative liabilities that are subject to netting arrangements in the Statement of Assets and Liabilities.
The following tables present derivative financial instruments and secured financing transactions that are subject to enforceable netting arrangements and offset in the Statement of Assets and Liabilities in conformity with U.S. GAAP:
| | | | | | | | | | | | | Gross Amounts Not Offset
in the Statement of
Assets and Liabilities | | | | |
Fund | Instrument | | Gross Amounts of Recognized Assets1 | | | Gross Amounts Offset in the Statement of Assets and Liabilities | | | Net Amount of Assets Presented
on the Statement of Assets and Liabilities | | | Financial
Instruments | | | Cash
Collateral
Received | | | Net
Amount | |
Macro Opportunities Fund | Swap agreements | | $ | 1,656,222 | | | $ | — | | | $ | 1,656,222 | | | $ | 1,656,222 | | | $ | — | | | $ | — | |
Foreign forward currency exchange contracts | | | 322,498 | | | | — | | | | 322,498 | | | | 321,863 | | | | — | | | | 635 | |
Option contracts | | | 2,040,525 | | | | — | | | | 2,040,525 | | | | 1,391,162 | | | | 450,000 | | | | 199,363 | |
| | THE GUGGENHEIM FUNDS ANNUAL REPORT | 75 |
NOTES TO CONSOLIDATED FINANCIAL STATEMENTS (continued) |
| | | | | | | | | | | | | Gross Amounts Not Offset in the Statement of Assets and Liabilities | | | | |
Fund | Instrument | | Gross Amounts of Recognized Liabilities1 | | | Gross Amounts Offset in the Statement of Assets and Liabilities | | | Net Amount of Liabilities Presented on the Statement of Assets and Liabilities | | | Financial
Instruments | | | Cash
Collateral
Pledged | | | Net
Amount | |
Macro Opportunities Fund | Swap agreements | | $ | 4,695,158 | | | $ | — | | | $ | 4,695,158 | | | $ | 2,767,373 | | | $ | 315,383 | | | $ | 1,612,402 | |
Foreign forward currency exchange contracts | | | 7,854 | | | | — | | | | 7,854 | | | | 7,854 | | | | — | | | | — | |
Option contracts | | | 594,020 | | | | — | | | | 594,020 | | | | 594,020 | | | | — | | | | — | |
1 | Centrally cleared swaps are excluded from these reported amounts. |
6. Federal Income Tax Information
The Fund intends to comply with the provisions of Subchapter M of the Internal Revenue Code applicable to regulated investment companies and will distribute substantially all taxable net investment income and capital gains sufficient to relieve the Fund from all, or substantially all, federal income, excise and state income taxes. Therefore, no provision for federal or state income tax is required.
Tax positions taken or expected to be taken in the course of preparing the Fund’s tax returns are evaluated to determine whether the tax positions are “more-likely-than-not” of being sustained by the applicable tax authority. Tax positions not deemed to meet the more-likely-than-not threshold would be recorded as a tax benefit or expense in the current year. Management has analyzed the Fund’s tax positions taken, or to be taken, on federal income tax returns for all open tax years, and has concluded that no provision for income tax is required in the Fund’s financial statements. The Fund’s federal tax returns are subject to examination by the Internal Revenue Service for a period of three years after they are filed.
The tax character of distributions paid during the year ended September 30, 2016 was as follows:
Fund | | Ordinary
Income | | | Long-Term Capital Gain | | | Return of
Capital | | | Total
Distributions | |
Macro Opportunities Fund | | $ | 192,928,088 | | | $ | — | | | $ | — | | | $ | 192,928,088 | |
76 | THE GUGGENHEIM FUNDS ANNUAL REPORT | |
NOTES TO CONSOLIDATED FINANCIAL STATEMENTS (continued) |
The tax character of distributions paid during the year ended September 30, 2015 was as follows:
Fund | | Ordinary
Income | | | Long-Term Capital Gain | | | Return of
Capital | | | Total
Distributions | |
Macro Opportunities Fund | | $ | 126,602,383 | | | $ | — | | | $ | — | | | $ | 126,602,383 | |
Tax components of accumulated earnings/(deficit) as of September 30, 2016, were as follows:
Fund | | Undistributed Ordinary
Income | | | Undistributed Long-Term Capital Gain | | | Net Unrealized Appreciation/ (Depreciation) | | | Accumulated Capital Losses | | | Other
Temporary Differences | |
Macro Opportunities Fund | | $ | — | | | $ | — | | | $ | (56,948,655 | ) | | $ | (91,754,023 | ) | | $ | (5,349,054 | ) |
Note: Capital Loss Carryforward amounts may be limited due to Federal income tax regulations.
For Federal income tax purposes, capital loss carryforwards represent realized losses of the Fund(s) that may be carried forward and applied against future capital gains. Under the RIC Modernization Act of 2010, the Funds are permitted to carry forward capital losses incurred in taxable years beginning after December 22, 2010 for an unlimited period and such capital loss carryforwards will retain their character as either short-term or long-term capital losses. As of September 30, 2016, capital loss carryforwards for the Fund were as follows:
Fund | | Unlimited Short-Term | | | Unlimited
Long-Term | | | Total Capital
Loss Carryforward | |
Macro Opportunities Fund | | $ | (33,155,492 | ) | | $ | (42,536,655 | ) | | $ | (75,692,147 | ) |
As of September 30, 2016 the following reclassifications were made to the capital accounts of the Fund, to reflect permanent book/tax differences and income and gains available for distributions under income tax regulations, which are due to foreign currency reclasses, paydown reclasses, swap reclasses, recharacterization of income from investments, certain CLO investments, short dividend expenses, and transactions with the fund’s wholly owned foreign subsidiary. Net investment income, net realized gains and net assets were not affected by these changes.
On the Statements of Assets and Liabilities the following adjustments were made for permanent book/tax differences:
Fund | | Paid In
Capital | | | Undistributed
Net Investment Income | | | Accumulated
Net Realized
Loss | |
Macro Opportunities Fund | | $ | (16,356 | ) | | $ | 20,969,958 | | | $ | (20,953,602 | ) |
| | THE GUGGENHEIM FUNDS ANNUAL REPORT | 77 |
NOTES TO CONSOLIDATED FINANCIAL STATEMENTS (continued) |
At September 30, 2016, the cost of securities for Federal income tax purposes, the aggregate gross unrealized gain for all securities for which there was an excess of value over tax cost and the aggregate gross unrealized loss for all securities for which there was an excess of tax cost over value, were as follows:
Fund | | Tax
Cost | | | Tax
Unrealized
Gain | | | Tax
Unrealized
Loss | | | Net
Unrealized
Loss | |
Macro Opportunities Fund | | $ | 3,472,428,616 | | | $ | 95,394,820 | | | $ | (146,428,579 | ) | | $ | (51,033,759 | ) |
Pursuant to Federal income tax regulations applicable to investment companies, the Funds can elect to treat net capital losses and certain ordinary losses realized between November 1 and September 30 of each year as occurring on the first day of the following tax year. The Funds also can elect to treat certain ordinary losses realized between January 1 and September 30 of each year as occurring on the first day of the following tax year. The Funds have elected to defer the following late year losses:
Fund | | Ordinary | | | Capital | |
Macro Opportunities Fund | | $ | 16,061,876 | | | $ | — | |
7. Securities Transactions
For the year ended September 30, 2016, the cost of purchases and proceeds from sales of investment securities, excluding government securities, short-term investments and derivatives, were as follows:
Fund | | Purchases | | | Sales | |
Macro Opportunities Fund | | $ | 2,067,512,770 | | | $ | 2,895,072,541 | |
For the year ended September 30, 2016, the cost of purchases and proceeds from the sales of government securities were as follows:
Fund | | Purchases | | | Sales | |
Macro Opportunities Fund | | $ | 6,062,244 | | | $ | 6,015,525 | |
78 | THE GUGGENHEIM FUNDS ANNUAL REPORT | |
NOTES TO CONSOLIDATED FINANCIAL STATEMENTS (continued) |
The Fund is permitted to purchase or sell securities from or to certain affiliated funds under specified conditions outlined in procedures adopted by the Board of the Trust. The procedures have been designed to ensure that any purchase or sale of securities by a Fund from or to another fund or portfolio that is or could be considered an affiliate by virtue of having a common investment adviser (or affiliated investment advisers), common Trustees and/or common officers complies with Rule 17a-7 of the 1940 Act. Further, as defined under these procedures, each transaction is effected at the current market price to save costs, where permissible. For the year ended September 30, 2016, the Fund engaged in purchases and sales of securities, pursuant to Rule 17a-7 of the 1940 Act, as follows:
Fund | | Purchases | | | Sales | | | Realized Gain | |
Macro Opportunities Fund | | $ | 8,307,653 | | | $ | 59,502,378 | | | $ | 9,474,888 | |
8. Affiliated Transactions
Investments representing 5% or more of the outstanding voting shares of a portfolio company of a fund, or control of or by, or common control under GI, result in that portfolio company being considered an affiliated company of such fund, as defined in the 1940 Act.
The Fund may invest in the Guggenheim Strategy Funds Trust consisting of Guggenheim Strategy Fund I, Guggenheim Strategy Fund II, Guggenheim Strategy Fund III, and Guggenheim Variable Insurance Strategy Fund III (collectively, the “Cash Management Funds”), open-end management investment companies managed by GI. The Cash Management Funds, which launched on March 11, 2014, are offered as cash management options only to mutual funds, trusts, and other accounts managed by GI and/or its affiliates, and are not available to the public. The Cash Management Funds pay no investment management fees. The Cash Management Funds’ annual report on Form N-CSR dated September 30, 2015, is available publicly or upon request. This information is available from the EDGAR database on the SEC’s website at http://www.sec.gov/Archives/edgar/data/1601445/000089180415000857/gug63224-ncsr.htm.
| | THE GUGGENHEIM FUNDS ANNUAL REPORT | 79 |
NOTES TO CONSOLIDATED FINANCIAL STATEMENTS (continued) |
Transactions during the year ended September 30, 2016, in which the portfolio company is an “affiliated person,” were as follows:
Affiliated issuers by Fund | | Value
09/30/15 | | | Additions | | | Reductions | | | Value
09/30/16 | |
Macro Opportunities Fund | |
Floating Rate Strategies Fund - Institutional Class | | $ | — | | | $ | 168,796,122 | | | $ | (153,200,000 | ) | | $ | 12,390,218 | |
Guggenheim Alpha Opportunity Fund - Institutional Class | | | 48,406,518 | | | | — | | | | — | | | | 50,457,164 | |
Guggenheim BulletShares 2018 High Yield Corporate Bond ETF | | | — | | | | 30,005,464 | | | | (29,830,281 | ) | | | — | |
Guggenheim BulletShares 2019 High Yield Corporate Bond ETF | | | — | | | | 24,996,630 | | | | (24,841,275 | ) | | | — | |
Guggenheim High Yield Fund - Insitutional Class | | | — | | | | 21,084,493 | | | | (8,000,000 | ) | | | 13,357,046 | |
Guggenheim Limited Duration Fund - Institutional Class | | | 59,605,430 | | | | 48,264,134 | | | | (59,508,757 | ) | | | 48,212,909 | |
Guggenheim Risk Managed Real Estate Fund - Institutional Class | | | 12,075,709 | | | | 1,988,984 | | | | — | | | | 13,911,113 | |
Guggenheim Strategic Opportunities Fund | | | 5,644,376 | | | | — | | | | (5,309,754 | ) | | | — | |
Guggenheim Strategy Fund I | | | 177,382,768 | | | | 80,882,004 | | | | (177,497,628 | ) | | | 81,343,779 | |
Guggenheim Strategy Fund II | | | 40,043,095 | | | | 122,139 | | | | (40,096,624 | ) | | | — | |
| | | $ | 343,157,896 | | | $ | 376,139,970 | | | $ | (498,284,319 | ) | | $ | 219,672,229 | |
80 | THE GUGGENHEIM FUNDS ANNUAL REPORT | |
NOTES TO CONSOLIDATED FINANCIAL STATEMENTS (continued) |
Affiliated issuers by Fund | | Shares
09/30/16 | | | Investment
Income | | | Realized
Gain (Loss) | | | Capital Gain Distributions | |
Macro Opportunities Fund | | | | | | | | | | | | |
Floating Rate Strategies Fund - Institutional Class | | | 477,649 | | | $ | 2,793,920 | | | $ | (3,404,061 | ) | | $ | — | |
Guggenheim Alpha Opportunity Fund - Institutional Class | | | 1,881,326 | | | | — | | | | — | | | | — | |
Guggenheim BulletShares 2018 High Yield Corporate Bond ETF | | | — | | | | 702,964 | | | | (175,183 | ) | | | — | |
Guggenheim BulletShares 2019 High Yield Corporate Bond ETF | | | — | | | | 584,614 | | | | (155,355 | ) | | | — | |
Guggenheim High Yield Fund - Insitutional Class | | | 1,467,807 | | | | 1,079,974 | | | | (233,682 | ) | | | — | |
Guggenheim Limited Duration Fund - Institutional Class | | | 1,951,150 | | | | 757,597 | | | | (1,297,584 | ) | | | — | |
Guggenheim Risk Managed Real Estate Fund - Institutional Class | | | 476,898 | | | | 450,045 | | | | — | | | | 1,538,939 | |
Guggenheim Strategic Opportunities Fund | | | — | | | | 344,913 | | | | (763,274 | ) | | | — | |
Guggenheim Strategy Fund I | | | 3,255,053 | | | | 876,854 | | | | (221,472 | ) | | | — | |
Guggenheim Strategy Fund II | | | — | | | | — | | | | (165,096 | ) | | | — | |
| | | | | | | $ | 7,590,881 | | | $ | (6,415,707 | ) | | $ | 1,538,939 | |
9. Loan Commitments
Pursuant to the terms of certain loan agreements, the Fund held unfunded loan commitments as of September 30, 2016. The Fund is obligated to fund these loan commitments at the borrower’s discretion.
| | THE GUGGENHEIM FUNDS ANNUAL REPORT | 81 |
NOTES TO CONSOLIDATED FINANCIAL STATEMENTS (continued) |
The unfunded loan commitments as of September 30, 2016 were as follows:
Borrower | Maturity
Date | | Face
Amount | | | Value | |
Macro Opportunities Fund | | | | | | | |
Acosta, Inc. | 09/26/19 | | $ | 6,000,000 | | | $ | 477,007 | |
Advantage Sales & Marketing LLC | 07/25/19 | | | 1,387,500 | | | | 100,601 | |
American Stock Transfer & Trust | 06/26/18 | | | 400,000 | | | | 18,393 | |
BBB Industries, LLC | 11/04/19 | | | 1,750,000 | | | | 150,105 | |
CEVA Group Plc (United Kingdom) | 03/19/19 | | | 780,000 | | | | 78,392 | |
Epicor Software | 06/01/20 | | | 2,000,000 | | | | 182,456 | |
Eyemart Express | 12/18/19 | | | 500,000 | | | | 38,992 | |
Hillman Group, Inc. | 06/30/19 | | | 1,000,000 | | | | 59,956 | |
Hoffmaster Group, Inc. | 05/09/19 | | | 500,000 | | | | 30,342 | |
IntraWest Holdings S.à r.l. | 12/10/18 | | | 750,000 | | | | 13,124 | |
Learning Care Group (US), Inc. | 05/05/19 | | | 500,000 | | | | 40,096 | |
MRI Software LLC | 06/23/21 | | | 109,091 | | | | — | |
National Financial Partners Corp. | 07/01/18 | | | 1,000,000 | | | | 49,210 | |
National Technical Systems | 06/12/21 | | | 594,118 | | | | 27,333 | |
Phillips-Medsize Corp. | 06/14/19 | | | 1,100,000 | | | | 69,289 | |
Pro Mach Group, Inc. | 10/22/19 | | | 900,000 | | | | 66,320 | |
Signode Industrial Group US, Inc. | 05/01/19 | | | 3,400,000 | | | | 218,853 | |
Solera LLC | 03/03/21 | | | 2,970,000 | | | | 369,481 | |
Wencor Group | 06/19/19 | | | 400,000 | | | | 25,450 | |
| | | | $ | 26,040,709 | | | $ | 2,015,400 | |
10. Line of Credit
The Trust, with the exception of Capital Stewardship Fund, and certain affiliated funds, secured a 364-day committed, $800,000,000 line of credit from Citibank, N.A., which was in place through October 6, 2016, at which time the line of credit was renewed. A Fund may draw (borrow) from the line of credit as a temporary measure for emergency purposes, to facilitate redemption requests, or for other short-term liquidity purposes consistent with the Fund’s investment objective and program. For example, it may be advantageous for the Fund to borrow money rather than sell existing portfolio positions to meet redemption requests. Fees related to borrowings, if any, vary under this arrangement between the greater of Citibank’s “base rate”, LIBOR plus 1%, or the federal funds rate 0.29% at September 30, 2016, plus 1/2 of 1%. The funds paid upfront costs of $663,359 to renew the line of credit.
The commitment fee that may be paid by the Funds is at an annualized rate of 0.15% of the average daily amount of their unused commitment amount. The Funds did not have any borrowings under this agreement as of and for the period ended September 30, 2016.
On October 6, 2016, the Trust, with the exception of Capital Stewardship Fund, and certain affiliated funds, renewed the line of credit from Citibank, N.A., with an increased commitment amount to $1,000,000,000. Fees related to borrowings, if any, vary under this arrangement between
82 | THE GUGGENHEIM FUNDS ANNUAL REPORT | |
NOTES TO CONSOLIDATED FINANCIAL STATEMENTS (continued) |
the greater of Citibank’s “base rate”, LIBOR plus 1%, or the federal funds rate 0.29% at September 30, 2016, plus 1/2 of 1%. The funds will pay upfront costs of $2,032,388 to renew the line of credit. The commitment fee that may be paid by the Funds is at an annualized rate of 0.15% of the average daily amount of their unused commitment amount.
The allocated interest expense amount for each Fund is referenced in the Statement of Operations under “Line of credit fees” and the effect on the expense ratio is included in the Financial Highlights.
11. Repurchase Agreements
In connection with transactions in repurchase agreements, it is the Fund’s policy that its custodian takes possession of the underlying collateral. For the following repurchase agreements, the collateral is in the possession of the Fund’s custodian and is evaluated to ensure that its market value exceeds, at a minimum, 102% of the original face amount of the repurchase agreements.
The following repurchase agreements were used as a means of borrowing securities to sell short.
Counterparty and Terms of Agreement | | | Face Value | | | Repurchase Price | | Collateral | | | Par Value | | | Fair Value |
| Barclays | | | | | | | | Envision Healthcare Corp. | | | | | | |
| 0.00% - (0.15%) | | | | | | | | 5.13% | | | | | | |
| Open Maturity | | | $1,258,750 | | | $1,258,005 | | 07/01/22 | | | $1,250,000 | | | $1,259,592 |
In the event of counterparty default, the Fund has the right to collect the collateral to off set losses incurred. There is potential loss to the Fund in the event the Fund is delayed or prevented from exercising its right to dispose of the collateral securities, including the risk of a possible decline in the value of the underlying securities during the period while the Fund seeks to assert its rights. The Fund’s investment adviser, acting under the supervision of the Board of Trustees, reviews the value of the collateral and the creditworthiness of those banks and dealers with which the Fund enters into repurchase agreements to evaluate potential risks.
12. Reverse Repurchase Agreements
The Fund may enter into reverse repurchase agreements. Under a reverse repurchase agreement, a Fund sells securities and agrees to repurchase them at a particular price at a future date. In the event the buyer of securities under a reverse repurchase agreement files for bankruptcy or becomes insolvent, such buyer or its trustee or receiver may receive an extension of time to determine whether to enforce the Fund’s obligation to repurchase the securities, and the Fund’s use of the proceeds of the reverse repurchase agreement may effectively be restricted pending such decision.
| | THE GUGGENHEIM FUNDS ANNUAL REPORT | 83 |
NOTES TO CONSOLIDATED FINANCIAL STATEMENTS (continued) |
For the year ended September 30, 2016, the Fund entered into reverse repurchase agreements as follows:
Fund | | Number
of Days
Outstanding | | | Balance at
September 30,
2016 | | | Average
Balance Outstanding | | | Average Interest Rate | |
Macro Opportunities Fund | | | 366 | | | $ | 2,031,750 | | | $ | 266,146,923 | | | | 1.40 | % |
The following table presents reverse repurchase agreements that are subject to netting arrangements and offset in the Statement of Assets of Liabilities in conformity with U.S. GAAP:
| | | | | | | | | | | | | Gross Amounts Not Offset in the Statement of Assets and Liabilities | | | | |
Fund | Instrument | | Gross Amounts of Recognized Liabilities | | | Gross Amounts Offset in the Statement of Assets and Liabilities | | | Net Amount of Liabilities Presented on the Statement of Assets and Liabilities | | | Financial
Instruments | | | Cash
Collateral
Pledged | | | Net
Amount | |
Macro Opportunities Fund | Reverse repurchase agreements | | $ | 2,031,750 | | | $ | — | | | $ | 2,031,750 | | | $ | 2,031,750 | | | $ | — | | | $ | — | |
The following is a summary of the remaining contractual maturities of the reverse repurchase agreements outstanding as of year-end, aggregated by asset class of the related collateral pledged by the Fund:
| | | Overnight and
Continuous | | | Total | |
Macro Opportunities Fund | | | | | | |
Corporate Bonds | | $ | 2,031,750 | | | $ | 2,031,750 | |
Gross amount of recognized liabilities for reverse repurchase agreements | | $ | 2,031,750 | | | $ | 2,031,750 | |
84 | THE GUGGENHEIM FUNDS ANNUAL REPORT | |
NOTES TO CONSOLIDATED FINANCIAL STATEMENTS (continued) |
13. Restricted Securities
The securities below are considered illiquid and restricted under guidelines established by the Board of Trustees:
Fund | Restricted
Securities | Acquisition
Date | | | | Cost | | | | Value |
Macro Opportunities Fund | Airplanes Pass Through Trust | | | | | | | | | |
| | 2001-1A, 1.07% due 03/15/19 | 01/18/12 | | | $ | 3,057,624 | | | $ | 1,251,032 |
| | Banco Bradesco SA | | | | | | | | | |
| | 2014-1, 5.44% due 03/12/26 | 11/19/14 | | | | 3,068,402 | | | | 3,076,969 |
| | Capmark Military Housing Trust | | | | | | | | | |
| | 2007-AET2, 6.06% due 10/10/52 | 04/23/15 | | | | 5,860,811 | | | | 5,902,602 |
| | Copper River CLO Ltd. | | | | | | | | | |
| | 2007-1A, due 01/20/21 | 05/09/14 | | | | 9,535,500 | | | | 1,811,637 |
| | Customers Bank | | | | | | | | | |
| | 6.13% due 06/26/29 | 06/24/14 | | | | 4,500,000 | | | | 4,545,000 |
| | EIG Investors Corp. | | | | | | | | | |
| | 10.88% due 02/01/24 | 08/31/16 | | | | 913,974 | | | | 913,822 |
| | FPL Energy National Wind LLC | | | | | | | | | |
| | 5.61% due 03/10/24 | 08/31/12 | | | | 38,659 | | | | 39,197 |
| | Fortress Credit Opportunities | | | | | | | | | |
| | 2005-1A, 0.94% due 07/15/19 | 02/16/12 | | | | 353,680 | | | | 357,569 |
| | Great Lakes CLO Ltd. | | | | | | | | | |
| | 2012-1A, due 01/15/23 | 12/06/12 | | | | 3,103,750 | | | | 1,308,359 |
| | RFTI Issuer Ltd. | | | | | | | | | |
| | 2015-FL1, 4.40% due 08/15/30 | 10/14/15 | | | | 22,766,183 | | | | 22,782,922 |
| | Schahin II Finance Company SPV Ltd. | | | | | | | | | |
| | 5.88% due 09/25/22 | 03/21/12 | | | | 4,838,890 | | | | 906,888 |
| | Turbine Engines Securitization Ltd. | | | | | | | | | |
| | 2013-1A, 6.38% due 12/13/48 | 11/27/13 | | | | 2,443,012 | | | | 2,286,400 |
| | Turbine Engines Securitization Ltd. | | | | | | | | | |
| | 2013-1A, 5.13% due 12/13/48 | 11/27/13 | | | | 3,526,069 | | | | 3,526,290 |
| | | | | | $ | 64,006,554 | | | $ | 48,708,687 |
| | THE GUGGENHEIM FUNDS ANNUAL REPORT | 85 |
NOTES TO CONSOLIDATED FINANCIAL STATEMENTS (concluded) |
14. P-Class Shares
Effective May 1, 2015, the Funds started to offer P-Class shares.
P-Class shares of the Funds are offered primarily through broker/dealers and other financial intermediaries with which Guggenheim Funds Distributors, LLC has an agreement for the use of P-Class shares of the Funds in investment products, programs or accounts. P-Class shares do not have a minimum initial investment amount, subsequent investment amount or a minimum account balance.
15. Subsequent Event
At a meeting that occurred on November 16, 2016, the Board approved the following changes:
Approval to add an advisory fee breakpoint (“breakpoint”) to the fixed income mutual funds. Effective on or about February 1, 2017, a breakpoint of 5 basis points (0.05%) on average daily net assets above $5 billion will apply to each of the following Funds’ advisory fees:
Floating Rate Strategies Fund
Investment Grade Bond Fund
Macro Opportunities Fund
Total Return Bond Fund
The introduction of advisory fee breakpoints will not result in any decrease in the nature, quality and extent of services provided to the Funds under the advisory agreements.
86 | THE GUGGENHEIM FUNDS ANNUAL REPORT | |
REPORT OF INDEPENDENT REGISTERED PUBLIC ACCOUNTING FIRM |
The Board of Trustees and Shareholders
of Guggenheim Funds Trust
We have audited the accompanying consolidated statement of assets and liabilities, including the consolidated schedule of investments, of Guggenheim Macro Opportunities Fund (one of the series constituting the Guggenheim Funds Trust) (the “Fund”) as of September 30, 2016, and the related consolidated statement of operations for the year then ended, the consolidated statements of changes in net assets for each of the two years in the period then ended, and the financial highlights for each of the years or periods indicated therein (consolidated for the year ended September 30, 2016 and for the year or period ended September 30, 2015). These financial statements and financial highlights are the responsibility of the Fund’s management. Our responsibility is to express an opinion on these financial statements and financial highlights based on our audits.
We conducted our audits in accordance with the standards of the Public Company Accounting Oversight Board (United States). Those standards require that we plan and perform the audit to obtain reasonable assurance about whether the financial statements and financial highlights are free of material misstatement. We were not engaged to perform an audit of the Fund’s internal control over financial reporting. Our audits included consideration of internal control over financial reporting as a basis for designing audit procedures that are appropriate in the circumstances, but not for the purpose of expressing an opinion on the effectiveness of the Fund’s internal control over financial reporting. Accordingly, we express no such opinion. An audit also includes examining, on a test basis, evidence supporting the amounts and disclosures in the financial statements and financial highlights, assessing the accounting principles used and significant estimates made by management, and evaluating the overall financial statement presentation. Our procedures included confirmation of securities owned as of September 30, 2016, by correspondence with the custodians, transfer agent, brokers, and paying agents or by other appropriate auditing procedures where replies from brokers, or paying agents were not received. We believe that our audits provide a reasonable basis for our opinion.
In our opinion, the financial statements and financial highlights referred to above present fairly, in all material respects, the financial position of the Guggenheim Macro Opportunities Fund (one of the series constituting the Guggenheim Funds Trust) at September 30, 2016, the consolidated results of its operations for the year then ended, the consolidated changes in its net assets for each of the two years in the period then ended, and its financial highlights for each of the years or periods indicated therein (consolidated for the year ended September 30, 2016 and for the year or period ended September 30, 2015), in conformity with U.S. generally accepted accounting principles.
McLean, Virginia
November 29, 2016
| | THE GUGGENHEIM FUNDS ANNUAL REPORT | 87 |
OTHER INFORMATION (Unaudited) |
Tax Information
In January 2017, shareholders will be advised on IRS Form 1099 DIV or substitute 1099 DIV as to the federal tax status of the distributions received by shareholders in the calendar year 2016.
The Fund’s investment income(dividend income plus short-term gains, if any) qualifies as follows:
Of the ordinary income distributions paid during the year, the following funds had the corresponding percentages qualify for the dividends received deduction for corporations:
Fund | Dividend
Received Deduction |
Guggenheim Macro Opportunities Fund | 2.26% |
The following amounts of taxable ordinary income dividends paid during the fiscal year qualified for the lower income tax rate available to individuals under the Jobs and Growth Tax Relief Reconciliation Act of 2003:
Fund | Qualified
Dividend Income |
Guggenheim Macro Opportunities Fund | 2.34% |
Additionally, of the taxable ordinary income distributions paid during the fiscal year ending September 30, 2016, the Fund had the corresponding percentages qualify as interest related dividends and qualified short-term capital gains as permitted by IRC Section 871(k)(1) and IRC Section 871(k)(2), respectively:
Fund | Qualified
Interest | Qualified
Short-Term
Capital Gain |
Guggenheim Macro Opportunities Fund | 58.55% | 0.00% |
Proxy Voting Information
A description of the policies and procedures that the Trust uses to determine how to vote proxies relating to securities held in the Funds’ portfolios is available, without charge and upon request, by calling 800.820.0888. This information is also available from the EDGAR database on the SEC’s website at https://www.sec.gov.
Information regarding how the Funds voted proxies relating to portfolio securities during the most recent 12-month period ended June 30 is available without charge, upon request, by calling 800.820.0888. This information is also available from the EDGAR database on the SEC’s website at https://www.sec.gov.
88 | THE GUGGENHEIM FUNDS ANNUAL REPORT | |
OTHER INFORMATION (Unaudited)(continued) |
Sector Classification
Information in the “Schedule of Investments” is categorized by sectors using sector-level Classifications defined by the Bloomberg Industry Classification System, a widely recognized industry classification system provider. Each Fund’s registration statement has investment policies relating to concentration in specific sectors/industries. For purposes of these investment policies, the Funds usually classify sectors/industries based on industry-level Classifications used by widely recognized industry classification system providers such as Bloomberg Industry Classification System, Global Industry Classification Standards and Barclays Global Classification Scheme.
Quarterly Portfolio Schedules Information
The Trust files its complete schedule of portfolio holdings with the SEC for the first and third quarters of each fiscal year on Form N-Q; which are available on the SEC’s website at https://www.sec.gov. The Funds’ Forms N-Q may be reviewed and copied at the SEC’s Public Reference Room in Washington, DC, and that information on the operation of the Public Reference Room may be obtained by calling 800-SEC-0330. Copies of the portfolio holdings are also available to shareholders, without charge and upon request, by calling 800.820.0888.
Report of the Guggenheim Funds Trust Contracts Review Committee
Guggenheim Funds Trust (the “Trust”) was organized as a Delaware statutory trust on November 8, 2013, and is registered as an open-end management investment company under the Investment Company Act of 1940, as amended (the “1940 Act”). The Trust includes the following series:
● Guggenheim Alpha Opportunity Fund (“Alpha Opportunity Fund”) ● Guggenheim Diversified Income Fund (“Diversified Income Fund”) ● Guggenheim High Yield Fund (“High Yield Fund”) ● Guggenheim Large Cap Value Fund (“Large Cap Value Fund”) ● Guggenheim Macro Opportunities Fund (“Macro Opportunities Fund”) ● Guggenheim Mid Cap Value Fund (“Mid Cap Value Fund”) ● Guggenheim Municipal Income Fund (“Municipal Income Fund”) | ● Guggenheim Capital Stewardship Fund (“Capital Stewardship Fund”) ● Guggenheim Floating Rate Strategies Fund (“Floating Rate Strategies Fund”) ● Guggenheim Investment Grade Bond Fund (“Investment Grade Bond Fund”) ● Guggenheim Limited Duration Fund (“Limited Duration Fund”) ● Guggenheim Market Neutral Real Estate Fund (“Market Neutral Real Estate Fund”) ● Guggenheim Mid Cap Value Institutional Fund (“Mid Cap Value Institutional Fund”) |
| | THE GUGGENHEIM FUNDS ANNUAL REPORT | 89 |
OTHER INFORMATION (Unaudited)(continued) |
● Guggenheim Small Cap Value Fund (“Small Cap Value Fund”) ● Guggenheim StylePlus—Mid Growth Fund (“StylePlus—Mid Growth Fund”) ● Guggenheim World Equity Income Fund (“World Equity Income Fund”) | ● Guggenheim Risk Managed Real Estate Fund (“Risk Managed Real Estate Fund”) ● Guggenheim StylePlus—Large Core Fund (“StylePlus—Large Core Fund”) ● Guggenheim Total Return Bond Fund (“Total Return Bond Fund”) |
Security Investors, LLC (“Security Investors”), an indirect subsidiary of Guggenheim Partners, LLC, a global, diversified financial services firm (“Guggenheim Partners”), serves as investment adviser to each of: (i) Alpha Opportunity Fund; (ii) High Yield Fund; (iii) Investment Grade Bond Fund; (iv) Large Cap Value Fund; (v) Mid Cap Value Fund; (vi) Mid Cap Value Institutional Fund; (vii) Municipal Income Fund; (viii) Small Cap Value Fund; (ix) StylePlus—Large Core Fund; (x) StylePlus—Mid Growth Fund; and (xi) World Equity Income Fund (collectively, the “SI-Advised Funds”). (Guggenheim Partners, Security Investors, Guggenheim Partners Investment Management, LLC (“GPIM”) and their affiliates may be referred to herein collectively as “Guggenheim.” “Guggenheim Investments” refers to the global asset management and investment advisory division of Guggenheim Partners and includes GPIM, Security Investors and Guggenheim Funds Investment Advisors, LLC and other affiliated investment management businesses.) Under the terms of investment management agreements between Security Investors and the Trust, with respect to the SI-Advised Funds, Security Investors also is responsible for overseeing the activities of GPIM, an indirect subsidiary of Guggenheim Partners, with respect to its service as investment sub-adviser to Municipal Income Fund, pursuant to an investment sub-advisory agreement between Security Investors and GPIM (the “GPIM Sub-Advisory Agreement”).
GPIM serves as investment adviser with respect to each of: (i) Capital Stewardship Fund; (ii) Diversified Income Fund; (iii) Floating Rate Strategies Fund; (iv) Limited Duration Fund; (v) Macro Opportunities Fund; (vi) Market Neutral Real Estate Fund; (vii) Risk Managed Real Estate Fund; and (viii) Total Return Bond Fund (collectively, the “GPIM-Advised Funds” and together with the SI-Advised Funds, the “Funds” and individually, a “Fund”). Under the terms of investment management agreements between GPIM and the Trust, with respect to the GPIM-Advised Funds,1 GPIM also is responsible for overseeing the activities of Concinnity Advisors, LP (“Concinnity”) with respect to Concinnity’s service as investment sub-adviser to the Capital Stewardship Fund, pursuant to an investment sub-advisory agreement between GPIM and Concinnity (the “Concinnity Sub-Advisory Agreement”). Under the supervision of the Board of Trustees of the Trust (the “Board,” with the members of the Board referred to individually as the “Trustees”), the
1 | The investment management agreements pertaining to the SI-Advised Funds and the investment management agreements pertaining to the GPIM-Advised Funds are referred to herein together as the “Advisory Agreements” and, together with the GPIM Sub-Advisory Agreement, as the “Agreements.” In addition, unless the context indicates otherwise, GPIM, with respect to its service as investment adviser to the GPIM-Advised Funds, and Security Investors as to the SI-Advised Funds, are each referred to herein as the “Adviser” and together, the “Advisers.” |
90 | THE GUGGENHEIM FUNDS ANNUAL REPORT | |
OTHER INFORMATION (Unaudited)(continued) |
Advisers regularly provide (or, as applicable, oversee the provision of) investment research, advice and supervision, a continuous investment program, and direct the purchase and sale of securities and other investments for each Fund’s portfolio.
Following an initial two-year term, each of the Advisory Agreements continues in effect from year to year provided that such continuance is specifically approved at least annually by (i) the Board or a majority of the outstanding voting securities (as defined in the 1940 Act) of each Fund, and, in either event, (ii) the vote of a majority of the Trustees who are not “interested person[s],” as defined by the 1940 Act, of the Trust (the “Independent Trustees”) casting votes in person at a meeting called for such purpose. At meetings held in person on April 27, 2016 (the “April Meeting”) and on May 17, 2016 (the “May Meeting”), the members of the Contracts Review Committee of the Board (the “Committee”), consisting solely of the Independent Trustees, met separately from Guggenheim to consider the proposed renewal of the Advisory Agreements and the GPIM Sub-Advisory Agreement in connection with the Committee’s annual contract review schedule.2
As part of its review process, the Committee was represented by independent legal counsel to the Independent Trustees (“Independent Legal Counsel”). Independent Legal Counsel reviewed and discussed with the Committee various key aspects of the Trustees’ legal responsibilities relating to the proposed renewal of the Agreements and other principal contracts. The Committee took into account various materials received from Guggenheim and Independent Legal Counsel. Recognizing that the evaluation process with respect to the services provided by each of the Advisers is an ongoing one, the Committee also considered the variety of written materials, reports and oral presentations the Board received throughout the year regarding performance and operating results of the Funds.
In connection with the contract review process, FUSE Research Network LLC (“FUSE”), an independent, third-party research provider, was engaged to prepare advisory contract renewal reports designed specifically to help boards of directors/trustees fulfill their advisory contract renewal responsibilities. The objective of the reports is to present the subject funds’ relative position regarding fees, expenses and total return performance, with peer group and universe comparisons. The Committee assessed the data provided in the FUSE reports as well as
2 | Since Diversified Income Fund is subject to an investment management agreement approved by the Board for an initial term of two years at an in-person meeting of the Board held on August 20, 2015 and the Fund launched in 2016, it was not included in the contract renewal process conducted at the meetings in April and May 2016. Similarly, Market Neutral Real Estate Fund is subject to an investment management agreement approved by the Board for an initial term of two years at an in-person Board meeting held on November 10, 2015, and the Fund launched in 2016. Consequently, Market Neutral Real Estate Fund also was not included in the scope of the 2016 contract renewal process. In addition, because shares of the Capital Stewardship Fund are only offered for subscription and are held by a limited number of institutional/bank investors, and the Fund issues a shareholder report separate from the other series of the Trust, the factors considered by the Committee in evaluating the proposed renewal of an investment management agreement pertaining to the Capital Stewardship Fund, and the Concinnity Sub-Advisory Agreement, are addressed in a separate report of the Committee. Accordingly, references hereafter to the “Funds” should be understood as referring to all series of the Trust, excluding: (i) Capital Stewardship Fund; (ii) Diversified Income Fund; and (iii) Market Neutral Real Estate Fund. |
| | THE GUGGENHEIM FUNDS ANNUAL REPORT | 91 |
OTHER INFORMATION (Unaudited)(continued) |
commentary and supporting data presented by Guggenheim, including, among other things, a summary of notable distinctions between certain Funds and the applicable peer group identified in the FUSE reports, as well as a discussion of those instances in which FUSE adjusted a peer group after considering a request by management to re-evaluate the peer group constituent funds.
In addition, Guggenheim provided materials and data in response to formal requests for information sent by Independent Legal Counsel on behalf of the Independent Trustees. Guggenheim also made a presentation at the April Meeting which, among other things, addressed areas identified for discussion by the Independent Trustees and Independent Legal Counsel. Throughout the process, the Committee asked questions of management and requested certain additional information, which Guggenheim provided following the April Meeting (collectively with the foregoing reports and materials, the “Contract Review Materials”).
The Committee considered the Contract Review Materials in the context of its accumulated experience governing the Trust and weighed the factors and standards discussed with Independent Legal Counsel. Following an analysis and discussion of the factors identified below and in the exercise of its business judgment, the Committee concluded that it was in the best interest of each Fund to recommend that the Board approve the renewal of each Advisory Agreement and the GPIM Sub-Advisory Agreement for an additional annual term.
Advisory Agreements
Nature, Extent and Quality of Services Provided by each Adviser: With respect to the nature, extent and quality of services currently provided by each Adviser, the Committee considered the information provided by Guggenheim concerning the education, experience, professional affiliations, areas of responsibility and duties of key personnel performing services for the Funds, including those personnel providing compliance oversight, as well as the supervisors and reporting lines for such personnel. In this connection, the Committee considered Guggenheim’s resources and related efforts to retain, attract and motivate capable personnel to serve the Funds and noted Guggenheim’s report on recent additions, departures and transitions in personnel who work on matters relating to the Funds or are significant to the operations of each Adviser. The Committee also considered the Advisers’ attention to relevant developments in the mutual fund industry and its observance of compliance and regulatory requirements, and noted that on a regular basis the Board receives and reviews information from the Trust’s Chief Compliance Officer regarding compliance policies and procedures established pursuant to Rule 38a-1 under the 1940 Act, as well as from Guggenheim’s Chief Risk Officer. The Committee also noted updates by Guggenheim to certain compliance programs, including with respect to Code of Ethics monitoring, and the implementation of additional forensic testing. The Committee took into consideration the settlement of a regulatory matter concerning GPIM and remedial steps taken in response by Guggenheim to enhance its organizational structure for compliance. In this connection, the Committee considered information provided by Guggenheim regarding the findings of an independent compliance consultant retained to review GPIM’s compliance program and the consultant’s conclusion that the program is reasonably designed to prevent and
92 | THE GUGGENHEIM FUNDS ANNUAL REPORT | |
OTHER INFORMATION (Unaudited)(continued) |
detect violations of the Investment Advisers Act of 1940, as amended, and the rules promulgated thereunder. Moreover, in connection with the Committee’s evaluation of the overall package of services provided by each Adviser, the Committee considered each Adviser’s administrative capabilities, including its role in monitoring and coordinating compliance responsibilities with the fund administrator, transfer agent, distributor, custodian and other service providers to the Funds. In addition, because Municipal Income Fund is sub-advised, the Committee took into account information provided by Guggenheim describing the Adviser’s processes and activities for providing oversight of sub-advisers, including information regarding the Adviser’s Sub-Advisory Oversight Committee.
With respect to Guggenheim’s resources and the ability of each Adviser to carry out its responsibilities under the applicable Advisory Agreement, the Chief Financial Officer of Guggenheim Investments reviewed with the Committee certain unaudited financial information concerning the holding company for Guggenheim Investments, Guggenheim Partners Investment Management Holdings, LLC (“GPIMH”). (Thereafter, the Committee received the audited consolidated financial statements of GPIMH and the audited financial statements of GPIM as supplemental information.)
The Committee also considered the acceptability of the terms of each Advisory Agreement, including the scope of services required to be performed by each Adviser.
Based on the foregoing, and based on other information received (both oral and written) at the April Meeting and the May Meeting, as well as other considerations, including the Committee’s knowledge of how each Adviser performs its duties through Board meetings, discussions and reports during the year, the Committee concluded that each Adviser and its personnel were qualified to serve the Funds in such capacity and may reasonably be expected to continue to provide a high quality of services under each Advisory Agreement with respect to the Funds.
Investment Performance: The Committee received, for each Fund, investment returns for the ten-year, five-year, three-year, one-year and three-month periods ended December 31, 2015, as applicable. In addition, the Committee received a comparison of each Fund’s performance to the performance of a benchmark, a universe of funds and a narrower peer group of similar funds with comparable asset levels as identified by FUSE, in each case for the same periods, as applicable. The Committee also received from FUSE representatives and considered a description of the methodology employed by FUSE for identifying each Fund’s peer group and universe for performance and expense comparisons.
In seeking to evaluate Fund performance over a full market cycle, the Committee generally focused its attention first on five-year and three-year performance rankings as compared to the relevant universe of funds. The Committee also considered more recent performance periods, including the one-year period and, as deemed appropriate, the three-month period, for certain Funds such as for those Funds that were recently launched or had undergone recent changes in investment
| | THE GUGGENHEIM FUNDS ANNUAL REPORT | 93 |
OTHER INFORMATION (Unaudited)(continued) |
strategies, as well as circumstances in which enhancements were made to the portfolio management processes or techniques employed for a Fund. In this connection, the Committee made the following observations:
Alpha Opportunity Fund: The Fund’s Class A shares outperformed the performance universe median for the five-year and three-year periods, ranking in the 6th and 9th percentiles, respectively. The Committee considered the limitations on portfolio management as a result of the 2008 Lehman bankruptcy, and subsequent changes to the Fund’s investment strategies, noting that the Fund re-opened to subscriptions with a new U.S. long/short equity investment strategy on January 28, 2015. In light of the foregoing, the Committee also considered more recent performance periods, including the one-year and three-month periods ended December 31, 2015, and observed that the Fund’s Class A shares ranked in the 72nd and 92nd percentiles, respectively of its performance universe. Given the limited period of time that the Adviser has managed the Fund pursuant to its new investment program, the Committee also took into account updated performance data provided by the Adviser in connection with the May Meeting and noted that the Fund’s net performance for the one-year and three-month periods ended March 31, 2016 ranked in the 6th and 1st percentiles, respectively of the Morningstar Long/Short Equity peer group.
Floating Rate Strategies Fund: The Committee noted the Fund’s inception date of November 30, 2011, and observed that the Fund’s Class A shares ranked in the 1st and 5th percentiles of its performance universe for the three-year and one-year periods ended December 31, 2015, respectively, outperforming its performance universe median for each of these periods.
High Yield Fund: The returns of the Fund’s Class A shares ranked in the 46th and 10th percentiles of its performance universe for the five-year and three-year periods ended December 31, 2015, respectively, and outperformed the performance universe median for each of these periods.
Investment Grade Bond Fund: The returns of the Fund’s Class A shares ranked in the 1st percentile of its performance universe for both the five-year and three-year periods ended December 31, 2015, outperforming its performance universe median for both of these periods.
Limited Duration Fund: The Committee noted the Fund’s inception date of December 16, 2013, and observed that the returns of the Fund’s Class A shares ranked in the 1st and 10th percentiles of the performance universe for the one-year and three-month periods ended December 31, 2015, respectively, outperforming the median returns.
Macro Opportunities Fund: The Committee noted the Fund’s inception date of November 30, 2011, and observed that the returns of the Fund’s Class A shares ranked in the 6th and 57th percentiles of the performance universe for the three-year and one-year periods ended December 31, 2015, respectively, and outperformed the performance universe median for the three-year period.
94 | THE GUGGENHEIM FUNDS ANNUAL REPORT | |
OTHER INFORMATION (Unaudited)(continued) |
Municipal Income Fund: The Committee considered that Security Investors does not directly manage the investment portfolio but has delegated such duties to GPIM. Based on the information provided and the review of the Fund’s investment performance, the Committee concluded that Security Investors had appropriately reviewed and monitored GPIM’s investment performance as Sub-Adviser to the Fund.
Risk Managed Real Estate Fund: The Committee noted the Fund’s inception date of February 12, 2014, and observed the returns of the Fund’s Class A shares ranked in the 31st and 76th percentile of its performance universe for the one-year and three-month periods ended December 31, 2015, respectively.
StylePlus—Large Core Fund: The returns of the Fund’s Class A shares ranked in the 39th percentile of its performance universe for the three-year period ended December 31, 2015. The Committee noted that the Fund implemented a strategy change and a new portfolio management team in May 2013. In light of the foregoing, the Committee also considered more recent performance periods in addition to the three-year performance, including the one-year and three-month periods ended December 31, 2015, and observed that the returns of the Fund’s Class A shares exceeded the median of its performance universe for both periods, ranking in the 25th and 22nd percentiles for the one-year and three-month periods, respectively.
StylePlus—Mid Growth Fund: The returns of the Fund’s Class A shares ranked in the 45th percentile of its performance universe for the three-year period ended December 31, 2015. The Committee noted that the Fund implemented a strategy change and a new portfolio management team in May 2013. In light of the foregoing, the Committee considered more recent performance periods in addition to the three-year performance, including the one-year and three-month periods ended December 31, 2015, and observed that the returns of the Fund’s Class A shares exceeded the median of its performance universe for both periods, ranking in the 42nd and 45th percentiles for the one-year and three-month periods, respectively.
Total Return Bond Fund: The Committee noted the Fund’s inception date of November 30, 2011, and observed that the returns of the Fund’s Class A shares ranked in the 1st and 12th percentiles of its performance universe for the three-year and one-year periods ended December 31, 2015, respectively, and outperformed the performance universe median for each of these periods.
World Equity Income Fund: The returns of the Fund’s Class A shares ranked in the 66th percentile of its performance universe for the three-year period ended December 31, 2015. The Committee noted that the Fund implemented a strategy change and a new portfolio management team in August 2013. In light of the foregoing, the Committee considered more recent performance periods in addition to the three-year performance, including the one-year and three-month periods ended December 31, 2015, and observed that the returns of the Fund’s Class A shares exceeded the median of its performance universe for both periods, ranking in the 43rd and 39th percentiles for the one-year and three-month periods, respectively.
| | THE GUGGENHEIM FUNDS ANNUAL REPORT | 95 |
OTHER INFORMATION (Unaudited)(continued) |
Value Funds: Large Cap Value Fund, Mid Cap Value Fund, Mid Cap Value Institutional Fund and Small Cap Value Fund
Large Cap Value Fund: The returns of the Class A shares underperformed the performance universe median for the five-year, three-year, one-year and three-month periods ended December 31, 2015, and ranked in the 83rd, 72nd, 72nd and 67th percentiles, respectively.
Mid Cap Value Fund: The returns of the Class A shares underperformed the performance universe median for the five-year, three-year, one-year and three-month periods ended December 31, 2015, and ranked in the 83rd, 79th, 75th and 81st percentiles, respectively.
Mid Cap Value Institutional Fund: The Fund’s returns underperformed the performance universe median for the five-year, three-year, one-year and three-month periods ended December 31, 2015, and ranked in the 82nd, 75th, 70th and 67th percentiles, respectively.
Small Cap Value Fund: The Fund underperformed its performance universe median for the five-year, three-year and one-year periods ended December 31, 2015, ranking in the 80th percentile for the five-year and three-year periods and in the 67th percentile for the one-year period. The Fund outperformed its performance universe median for three-month period ended December 31, 2015, and ranked in the 29th percentile.
In response to the Committee’s request, representatives from the Adviser provided information regarding, and discussed factors impacting, each Value Fund’s performance, including market trends and stock selection. The Adviser’s representatives also discussed the portfolio management team’s philosophy and processes and explained their expectations and strategies for the future. The Committee noted measures taken by the Adviser to remedy relative longer-term underperformance with respect to each of the Value Funds, including strategy enhancements such as implementation of a refined stock selection process and additional risk controls to enforce the strategy’s sell discipline. The Committee noted that the Adviser believes the enhancements to the portfolio management techniques employed for each Value Fund, used in conjunction with existing proprietary quantitative models, will help improve the Fund‘s performance results. In light of the foregoing, the Committee requested and the Adviser provided supplemental performance data to enable the Committee to evaluate the impact of the strategy enhancements. In this connection, the Committee considered that the data provided by the Adviser indicated that each Value Fund’s performance was improving, with performance for the first quarter of 2016 ranking better than the trailing one-year return. The Committee also considered the Adviser’s statement that it believes the improving trend in performance relative to peers reflects the enhancements implemented in the investment process. The Committee also noted Guggenheim’s commitment to monitor each Value Fund’s performance and update the Independent Trustees on a quarterly basis as to the impact of the process enhancements implemented to-date and advise on other steps that might be taken to further address each Fund’s performance, if necessary.
96 | THE GUGGENHEIM FUNDS ANNUAL REPORT | |
OTHER INFORMATION (Unaudited)(continued) |
After reviewing the foregoing and related factors, the Committee concluded that: (i) each Fund’s performance was acceptable; or (ii) it was satisfied with Guggenheim’s responses and efforts relating to investment performance.
Comparative Fees, Costs of Services Provided and the Profits Realized by each Adviser from Its Relationship with the Funds: The Committee compared each Fund’s contractual advisory fee and total net expense ratio to the applicable peer group. The Committee also reviewed the median advisory fees and expense ratios, including expense ratio components (e.g., transfer agency fees, administration fees, other operating expenses, distribution fees and fee waivers/reimbursements) of the peer group of funds. In response to a supplemental request, the Committee also received and reviewed aggregated advisory and administrative fees compared to the peer group average and median.
As part of its evaluation of each Fund’s advisory fee, the Committee considered how such fees compared to the advisory fee charged by the applicable Adviser to one or more other funds, separate accounts and/or other types of client portfolios and investment vehicles that it manages pursuant to a similar investment objective and strategies, to the extent applicable, noting that, in certain instances, Guggenheim charges a lower advisory fee to such other clients. In this connection, the Committee considered, among other things, Guggenheim’s representations about the significant differences between managing mutual funds as compared to other types of accounts, including the additional resources required to effectively manage mutual fund assets and the greater regulatory costs associated with the management of such assets. The Committee also considered Guggenheim’s explanation that lower fees are charged in certain instances due to various other factors, including the scope of contract, type of investors, applicable legal, governance and capital structures, tax status and historical pricing reasons. With respect to the difference in fees charged to a comparable client that is a mutual fund, as to which Guggenheim serves as sub-adviser, the Committee took into account the following: Guggenheim advises that it has less legal and regulatory exposure as a sub-adviser to an unaffiliated fund and does not take on the same business risk because Guggenheim is not the sponsor of that fund. The Committee concluded that the information it received demonstrated that the aggregate services provided to the Funds were sufficiently different from those provided to other clients with similar investment strategies and/or the risks borne by Guggenheim were sufficiently greater than those associated with managing other clients with similar investment strategies to support the difference in fees.
In further considering the comparative fee and expense data presented in the Contract Review Materials and addressed by Guggenheim, the Committee made the following observations:
Alpha Opportunity Fund: The average contractual advisory fee percentile rank across all share classes of the Fund and the asset weighted total net expense ratio are in the second quartile (27th and 46th percentiles, respectively) of its peer group. The Committee also considered that the Adviser had entered into an expense limitation agreement with respect to the Fund.
| | THE GUGGENHEIM FUNDS ANNUAL REPORT | 97 |
OTHER INFORMATION (Unaudited)(continued) |
Floating Rate Strategies Fund: The average contractual advisory fee percentile rank across all share classes of the Fund is in the fourth quartile (83rd percentile) of its peer group and the asset weighted total net expense ratio is in the second quartile (45th percentile) of its peer group. The Committee also considered that the Adviser had entered into an expense limitation agreement with respect to the Fund.
High Yield Fund: The average contractual advisory fee percentile rank across all share classes of the Fund is in the second quartile (40th percentile) of its peer group and the asset weighted total net expense ratio is in the fourth quartile (77th percentile) of its peer group. The Committee also considered that the Adviser had entered into an expense limitation agreement with respect to the Fund.
Investment Grade Bond Fund: The average contractual advisory fee percentile rank across all share classes of the Fund is in the third quartile (54th percentile) of its peer group and the asset weighted total net expense ratio is in the fourth quartile (83rd percentile) of its peer group. The Committee also considered that the Adviser had entered into an expense limitation agreement with respect to the Fund.
Large Cap Value Fund: The average contractual advisory fee percentile rank across all share classes of the Fund is in the first quartile (22nd percentile) of its peer group and the asset weighted total net expense ratio is in the second quartile (35th percentile) of its peer group. The Committee also considered that the Adviser had entered into an expense limitation agreement with respect to the Fund.
Limited Duration Fund: The average contractual advisory fee percentile rank across all share classes of the Fund is in the third quartile (66th percentile) of its peer group, as is the Fund’s asset weighted total net expense ratio (63rd percentile). The Committee also considered that the Adviser had entered into an expense limitation agreement with respect to the Fund.
Macro Opportunities Fund: The average contractual advisory fee percentile rank across all share classes of the Fund is in the fourth quartile (98th percentile) of its peer group, as is the Fund’s the asset weighted total net expense ratio (95th percentile). The Committee also considered that the Adviser had entered into an expense limitation agreement with respect to the Fund. In addition, the Committee noted that the Fund is categorized as a non-traditional bond fund which seeks to add value by investing in many non-traditional securities outside of fixed income, including equities, currencies, commodities and derivatives. In this connection, the Committee considered the Adviser’s statement that it supports the Fund with significant resources and a unique approach to drive performance for investors.
Mid Cap Value Fund: The average contractual advisory fee percentile rank across all share classes of the Fund is in the second quartile (37th percentile) of its peer group and the asset weighted total net expense ratio is in the fourth quartile (94th percentile) of its peer group.
98 | THE GUGGENHEIM FUNDS ANNUAL REPORT | |
OTHER INFORMATION (Unaudited)(continued) |
Mid Cap Value Institutional Fund: The contractual advisory fee of the Fund is in the first quartile (6th percentile) of its peer group and the total net expense ratio is in the third quartile (63rd percentile) of its peer group.
Municipal Income Fund: The average contractual advisory fee percentile rank across all share classes of the Fund is in the second quartile (39th percentile) and the asset weighted total net expense ratio is in the 25th percentile of its peer group. The Committee also considered that the Adviser had entered into an expense limitation agreement with respect to the Fund.
Risk Managed Real Estate Fund: The average contractual advisory fee percentile rank across all share classes of the Fund and the asset weighted total net expense ratio are in the first quartile (1st percentile as to each) of its peer group.
StylePlus—Large Core Fund: The average contractual advisory fee percentile rank across all share classes of the Fund is in the third quartile (71st percentile) and the asset weighted total net expense ratio is in the fourth quartile (86th percentile) of its peer group.
StylePlus—Mid Growth Fund: The average contractual advisory fee percentile rank across all share classes of the Fund is in the second quartile (29th percentile) of its peer group and the asset weighted total net expense ratio is in the fourth quartile (92nd percentile) of its peer group.
Small Cap Value Fund: The average contractual advisory fee percentile rank across all share classes of the Fund is in the fourth quartile (75th percentile) of its peer group and the asset weighted total net expense ratio is in the first quartile (11th percentile) of its peer group. The Committee also considered that the Adviser had entered into an expense limitation agreement with respect to the Fund.
Total Return Bond Fund: The average contractual advisory fee percentile rank across all share classes of the Fund is in the fourth quartile (93rd percentile) of its peer group and the asset weighted total net expense ratio is in the third quartile (65th percentile) of its peer group. The Committee also considered that the Adviser had entered into an expense limitation agreement with respect to the Fund.
World Equity Income Fund: The average contractual advisory fee percentile rank across all share classes of the Fund is in the second quartile (31st percentile) of its peer group and the asset weighted total net expense ratio is in the fourth quartile (92nd percentile) of its peer group. The Committee also considered that the Adviser had entered into an expense limitation agreement with respect to the Fund.
With respect to the costs of services provided and profits realized by Guggenheim Investments from its relationship with the Funds, the Committee reviewed a profitability analysis and data from management for each Fund setting forth the average assets under management for the twelve months ended December 31, 2015, ending assets under management as of December 31, 2015, gross revenues received by Guggenheim Investments, expenses allocated to the Fund, earnings and the operating margin/profitability rate, including variance information relative
| | THE GUGGENHEIM FUNDS ANNUAL REPORT | 99 |
OTHER INFORMATION (Unaudited)(continued) |
to the foregoing amounts as of December 31, 2014. In addition, the Chief Financial Officer of Guggenheim Investments reviewed with, and addressed questions from, the Committee concerning the expense allocation methodology employed in producing the profitability analysis.
In the course of its review of Guggenheim Investments’ profitability, the Committee took into account the methods used by Guggenheim Investments to determine expenses and profit and reviewed a report from an independent accounting firm evaluating Guggenheim Investments’ approach to allocating costs and determining the profitability of Guggenheim Investments with respect to individual funds and the entire fund complex. In evaluating the costs of services provided and the profitability to Guggenheim Investments, based upon the profitability rates presented by Guggenheim Investments and the conclusion of the independent accounting firm that the methodology used for calculating such rates was reasonable, the Committee concluded that the profits were not unreasonable.
The Committee considered other benefits available to each Adviser because of its relationship with the Funds and noted that Security Investors and GPIM may be deemed to benefit from arrangements whereby an affiliate, Rydex Fund Services, LLC, currently receives fees for (i) performing certain administrative functions and bookkeeping, accounting and pricing functions for the Funds pursuant to a Fund Accounting and Administration Agreement, and (ii) acting as transfer agent for the Funds and performing all shareholder servicing functions, including transferring record ownership, processing purchase and redemption transactions, answering inquiries, mailing shareholder communications, and acting as the dividend disbursing agent pursuant to a Transfer Agency Agreement. The Committee reviewed the compensation arrangements for the provision of the foregoing services, as well as Guggenheim’s profitability from providing such services. The Committee also noted Guggenheim’s statement that it may benefit from marketing synergies arising from offering a broad spectrum of products, including the Funds.
Economies of Scale: The Committee received and considered information regarding whether there have been economies of scale with respect to the management of the Funds as Fund assets grow, whether the Funds have appropriately benefited from any economies of scale, and whether there is potential for realization of any further economies of scale. The Committee considered whether economies of scale in the provision of services to the Funds were being passed along to the shareholders. The Committee noted the Adviser’s statement that Guggenheim continues to develop the infrastructure needed to support Fund asset growth and to achieve economies of scale across the firm’s various products and product lines. Thus, while Guggenheim may be benefiting from certain economies of scale and related cost efficiencies, it is concurrently realizing new costs and expenses associated with investment in infrastructure to support growth. The Committee took into account the additional information provided by Guggenheim at the Committee’s request regarding the investments made to support the growth of the organization, noting, among other things, enhancements to improve operational efficiency and further development of compliance-related functions, as well as Guggenheim’s view as to how such investments benefit the Funds.
100 | THE GUGGENHEIM FUNDS ANNUAL REPORT | |
OTHER INFORMATION (Unaudited)(continued) |
As part of its assessment of economies of scale, the Committee also considered Guggenheim’s view that it seeks to share economies of scale through expense limitations and/or through advisory fees set at competitive rates pre-assuming future asset growth. Thus, the Committee considered the size of the Funds and the competitiveness of and/or other determinations made regarding the current advisory fee for each Fund, as well as whether a Fund is subject to an expense limitation.
As to the size of the Funds, the Committee took into account Guggenheim’s statement that generally the Funds’ assets are not sufficiently large to warrant breakpoints, with only three Funds—Floating Rate Strategies Fund, Macro Opportunities Fund, and Total Return Bond Fund—having assets in excess of (or approaching) $1 billion. With respect to the three Funds noted, the Committee considered the levels of profitability reported. The Committee also noted that each of the three Funds is subject to an expense limitation agreement, which results in a lower effective advisory fee.
The Committee determined that, taking into account all relevant factors, the advisory fee for each Fund was reasonable.
Sub-Advisory Agreement
Nature, Extent and Quality of Services Provided by the Sub-Adviser: With respect to the nature, extent and quality of services provided by GPIM (referred to in this discussion as the “Sub-Adviser”), the Committee considered the qualifications, experience and skills of the Sub- Adviser’s portfolio management and other key personnel and information from the Sub-Adviser describing the scope of its services to Municipal Income Fund. The Committee also considered the information provided by the Sub-Adviser concerning the Sub-Adviser’s business continuity and information security plans and controls, and compliance policies and procedures, among other things.
With respect to Guggenheim’s resources and the Sub-Adviser’s ability to carry out its responsibilities under the Sub-Advisory Agreement, as noted above, the Committee considered the financial condition of GPIMH. (Thereafter, the Committee received the audited financial statements of GPIM as supplemental information.)
The Committee also considered the acceptability of the terms of the Sub-Advisory Agreement. Based on the foregoing, and based on other information received (both oral and written) at the April Meeting and at the May Meeting, as well as other considerations, including the Committee’s knowledge of how the Sub-Adviser performs its duties through Board meetings, discussions and reports throughout the year, the Committee concluded that the Sub-Adviser and its personnel were qualified to serve Municipal Income Fund in such capacity and may reasonably be expected to continue to provide a high quality of services under the Sub-Advisory Agreement.
| | THE GUGGENHEIM FUNDS ANNUAL REPORT | 101 |
OTHER INFORMATION (Unaudited)(concluded) |
Investment Performance: The Committee considered that the Fund’s Class A shares ranked in the third quartile (65th and 68th percentiles) of its performance universe for the five-year and three-year periods ended December 31, 2015, respectively. On January 13, 2012, the Fund acquired the assets and assumed the liabilities of TS&W/Claymore Tax-Advantaged Balanced Fund (the “Predecessor Fund”), a closed-end fund which used different investment strategies and had different investment advisers. Class A shares of the Fund have assumed the performance, financial and other historical information of the Predecessor Fund’s common shares and the performance of Class A shares of the Fund reflects the performance of the Predecessor Fund. In light of the foregoing, the Committee took into account more recent periods and noted that Fund’s Class A shares ranked in the fourth quartile for the one-year period ended December 31, 2015, and outperformed the performance universe median for the three-month period ended December 31, 2015, ranking in the 39th percentile. In considering the Fund’s performance for the one-year period, the Committee considered Guggenheim’s explanation that the Fund is managed very conservatively and the portfolio management team opted to maintain short duration by allocating to floating rate securities, which was a drag on performance for the period as the Federal Reserve increased interest rates fewer times than had been expected by the team. In light of all the facts and circumstances, the Committee concluded that the investment performance of the Fund and the Sub-Adviser was acceptable.
Comparative Fees, Costs of Services Provided and the Profits Realized by the Sub- Adviser from Its Relationship with the Fund: The Committee reviewed the level of sub-advisory fees payable to GPIM, noting that the fees are paid by Security Investors and do not impact the fees paid by the Fund.
Economies of Scale: The Committee recognized that, because the Sub-Adviser’s fees are paid by the Adviser and not the Fund, the analysis of economies of scale was more appropriate in the context of the Committee’s consideration of the applicable Advisory Agreement, which was separately considered. (See “Advisory Agreements – Economies of Scale” above.)
Overall Conclusions
Based on the foregoing, the Committee determined that the investment advisory fees are fair and reasonable in light of the extent and quality of the services provided and other benefits received and that the continuation of the Agreements is in the best interest of each Fund. In reaching this conclusion, no single factor was determinative or conclusive and each Committee member, in the exercise of his business judgment, may attribute different weights to different factors. At the May Meeting, the Committee, constituting all of the Independent Trustees, recommended the renewal of each Advisory Agreement and the Sub-Advisory Agreement for an additional annual term.
102 | THE GUGGENHEIM FUNDS ANNUAL REPORT | |
INFORMATION ON BOARD OF TRUSTEES AND OFFICERS (Unaudited) |
Name, Address* and Year of Birth | Position(s) Held with the Trust | Term of Office and Length of Time Served** | Principal Occupation(s) During Past Five Years | Number of Portfolios in Fund Complex Overseen | Other Directorships Held by Trustees |
INDEPENDENT TRUSTEES | | | | |
Randall C. Barnes
(1951) | Trustee | Since 2014 | Current: Private Investor (2001-present).
Former: Senior Vice President and Treasurer, PepsiCo, Inc. (1993-1997); President, Pizza Hut International (1991-1993); Senior Vice President, Strategic Planning and New Business Development, PepsiCo, Inc. (1987-1990). | 101 | Current: Trustee, Purpose Investments Inc. (2014-Present). |
Donald A. Chubb, Jr.
(1946 ) | Trustee | Since 1994 | Current: Business broker and manager of commercial real estate, Griffith & Blair, Inc. (1997-present). | 97 | Current: Midland Care, Inc. (2011-present). |
Jerry B. Farley
(1946) | Trustee | Since 2005 | Current: President, Washburn University (1997-present). | 97 | Current: Westar Energy, Inc. (2004-present); CoreFirst Bank & Trust (2000-present). |
Roman Friedrich III
(1946) | Trustee and Chairman of the Contracts Review Committee | Since 2014 | Current: Founder and Managing Partner, Roman Friedrich & Company (1998-present).
Former: Senior Managing Director, MLV & Co. LLC (2010-2011). | 97 | Current: Zincore Metals, Inc. (2009-present).
Former: Axiom Gold and Silver Corp. (2011-2012). |
| | THE GUGGENHEIM FUNDS ANNUAL REPORT | 103 |
INFORMATION ON BOARD OF TRUSTEES AND OFFICERS (Unaudited)(continued) |
Name, Address* and Year of Birth | Position(s) Held with the Trust | Term of Office and Length of Time Served** | Principal Occupation(s) During Past Five Years | Number of Portfolios in Fund Complex Overseen | Other Directorships Held by Trustees |
INDEPENDENT TRUSTEES - continued |
Robert B. Karn III
(1942) | Trustee and Chairman of the Audit Committee | Since 2014 | Current: Consultant (1998-present).
Former: Arthur Andersen (1965-1997) and Managing Partner, Financial and Economic Consulting, St. Louis office (1987-1997). | 97 | Current: Peabody Energy Company (2003-present); GP Natural Resource Partners, LLC (2002- present). |
Ronald A. Nyberg
(1953) | Trustee and Chairman of the Nominating and Governance Committee | Since 2014 | Current: Partner, Momkus McCluskey Roberts, LLC (2016-present).
Former: Partner, Nyberg & Cassioppi, LLC (2000-2016); Executive Vice President, General Counsel, and Corporate Secretary, Van Kampen Investments (1982-1999). | 103 | Current: Edward-Elmhurst Healthcare System (2012-present). |
Maynard F. Oliverius
(1943) | Trustee | Since 1998 | Current: Retired.
Former: President and CEO, Stormont-Vail HealthCare (1996-2012). | 97 | Current: Fort Hays State University Foundation (1999-present); Stormont-Vail Foundation (2013-present); University of Minnesota HealthCare Alumni Association Foundation (2009-present). Former: Topeka Community Foundation (2009-2014). |
104 | THE GUGGENHEIM FUNDS ANNUAL REPORT | |
INFORMATION ON BOARD OF TRUSTEES AND OFFICERS (Unaudited)(continued) |
Name, Address* and Year of Birth | Position(s) Held with the Trust | Term of Office and Length of Time Served** | Principal Occupation(s) During Past Five Years | Number of Portfolios in Fund Complex Overseen | Other Directorships Held by Trustees |
INDEPENDENT TRUSTEES - concluded |
Ronald E. Toupin, Jr.
(1958) | Trustee and Chairman of the Board | Since 2014 | Current: Portfolio Consultant (2010-present).
Former: Vice President, Manager and Portfolio Manager, Nuveen Asset Management (1998-1999); Vice President, Nuveen Investment Advisory Corp. (1992-1999); Vice President and Manager, Nuveen Unit Investment Trusts (1991-1999); and Assistant Vice President and Portfolio Manager, Nuveen Unit Investment Trusts (1988-1999), each of John Nuveen & Co., Inc. (1982-1999). | 100 | Former: Bennett Group of Funds (2011-2013). |
| | THE GUGGENHEIM FUNDS ANNUAL REPORT | 105 |
INFORMATION ON BOARD OF TRUSTEES AND OFFICERS (Unaudited)(continued) |
Name, Address* and Year of Birth | Position(s) Held with the Trust | Term of Office and Length of Time Served** | Principal Occupation(s) During Past Five Years | Number of Portfolios in Fund Complex Overseen | Other Directorships Held by Trustees |
INTERESTED TRUSTEE |
Donald C. Cacciapaglia***
(1951) | President, Chief Executive Officer and Trustee | Since 2012 | Current: President and CEO, certain other funds in the Fund Complex (2012-present); Vice Chairman, Guggenheim Investments (2010-present).
Former: Chairman and CEO, Channel Capital Group, Inc. (2002-2010). | 232 | Current: Clear Spring Life Insurance Company (2015-present); Guggenheim Partners Japan, Ltd. (2014-present); Guggenheim Partners Investment Management Holdings, LLC (2014-present); Delaware Life (2013-present); Guggenheim Life and Annuity Company (2011-present); Paragon Life Insurance Company of Indiana (2011-present). |
* | The business address of each Trustee is c/o Guggenheim Investments, 805 King Farm Boulevard, Suite 600, Rockville, Maryland 20850 |
** | Each Trustee serves an indefinite term, until his successor is elected and qualified. Time served includes time served in the respective position for the Predecessor Corporation. |
*** | This Trustee is deemed to be an "interested person" of the Funds under the 1940 Act by reason of his position with the Funds' Investment Manager and/or the parent of the Investment Manager. |
106 | THE GUGGENHEIM FUNDS ANNUAL REPORT | |
INFORMATION ON BOARD OF TRUSTEES AND OFFICERS (Unaudited)(continued) |
Name, Address* and Year of Birth | Position(s) held with the Trust | Term of Office and Length of Time Served** | Principal Occupations During Past Five Years |
OFFICERS | | | |
William H. Belden, III
(1965) | Vice President | Since 2014 | Current: Vice President, certain other funds in the Fund Complex (2006-present); Managing Director, Guggenheim Funds Investment Advisors, LLC (2005-present).
Former: Vice President of Management, Northern Trust Global Investments (1999-2005). |
Joanna M. Catalucci (1966) | AML Officer | Since 2016 | Current: Chief Compliance Officer, certain funds in the Fund Complex (2012-present); Senior Managing Director, Guggenheim Investments (2012-present); AML Officer, certain funds in the Fund Complex (2016-present). Former: Chief Compliance Officer and Secretary, certain other funds in the Fund Complex (2008-2012); Senior Vice President & Chief Compliance Officer, Security Investors, LLC and certain affiliates (2010-2012); Chief Compliance Officer and Senior Vice President, Rydex Advisors, LLC and certain affiliates (2010-2011). |
James M. Howley
(1972) | Assistant Treasurer | Since 2014 | Current: Director, Guggenheim Investments (2004-present) ; Assistant Treasurer, certain other funds in the Fund Complex (2006-present).
Former: Manager, Mutual Fund Administration of Van Kampen Investments, Inc. (1996-2004). |
Keith D. Kemp
(1960) | Assistant Treasurer | Since 2016 | Current: Managing Director of Transparent Value, LLC (2015-present); Managing Director of Guggenheim Investments (2015-present).
Former: Director, Transparent Value, LLC (2010-2015); Director, Guggenheim Investments (2010-2015); Chief Operating Officer, Macquarie Capital Investment Management (2007-2009). |
Amy J. Lee
(1961) | Vice President and Chief Legal Officer | Since 2007 (Vice President) Since 2014 (Chief Legal Officer) | Current: Chief Legal Officer, certain other funds in the Fund Complex (2013-present); Senior Managing Director, Guggenheim Investments (2012-present).
Former: Vice President, Associate General Counsel and Assistant Secretary, Security Benefit Life Insurance Company and Security Benefit Corporation (2004-2012). |
| | THE GUGGENHEIM FUNDS ANNUAL REPORT | 107 |
INFORMATION ON BOARD OF TRUSTEES AND OFFICERS (Unaudited)(continued) |
Name, Address* and Year of Birth | Position(s) held with the Trust | Term of Office and Length of Time Served** | Principal Occupations
During Past Five Years |
OFFICERS - continued | |
Mark E. Mathiasen
(1978) | Secretary | Since 2014 | Current: Secretary, certain other funds in the Fund Complex (2007-present); Managing Director, Guggenheim Investments (2007-present). |
Glenn McWhinnie
(1969) | Assistant Treasurer | Since 2016 | Current: Vice President, Guggenheim Investments (2009-present).
Former: Tax Compliance Manager, Ernst & Young LLP (1996-2009). |
Michael P. Megaris
(1984) | Assistant Secretary | Since 2014 | Current: Assistant Secretary, certain other funds in the Fund Complex (2014-present); Vice President, Guggenheim Investments (2012-present).
Former: J.D., University of Kansas School of Law (2009-2012). |
Elisabeth Miller
(1968) | Chief Compliance Officer | Since 2012 | Current: CCO, certain other funds in the Fund Complex (2012-present); CCO, Security Investors, LLC (2012-present); CCO, Guggenheim Funds Investment Advisors, LLC (2012-present); Managing Director, Guggenheim Investments (2012-present); Vice President, Guggenheim Funds Distributors, LLC (2014-present).
Former: CCO, Guggenheim Distributors, LLC (2009-2014); Senior Manager, Security Investors, LLC (2004-2009); Senior Manager, Guggenheim Distributors, LLC (2004-2009). |
Adam J. Nelson
(1979) | Assistant Treasurer | Since 2015 | Current: Vice President, Guggenheim Investments (2015-present); Assistant Treasurer, certain other funds in the Fund Complex (2015-present).
Former: Assistant Vice President and Fund Administration Director, State Street Corporation (2013-2015); Fund Administration Assistant Director, State Street (2011-2013); Fund Administration Manager, State Street (2009-2011). |
108 | THE GUGGENHEIM FUNDS ANNUAL REPORT | |
INFORMATION ON BOARD OF TRUSTEES AND OFFICERS (Unaudited)(concluded) |
Name, Address* and Year of Birth | Position(s) held with the Trust | Term of Office and Length of Time Served** | Principal Occupations
During Past Five Years |
OFFICERS - concluded | |
Kimberly J. Scott
(1974) | Assistant Treasurer | Since 2014 | Current: Vice President, Guggenheim Investments (2012-present) ; Assistant Treasurer, certain other funds in the Fund Complex (2012-present).
Former: Financial Reporting Manager, Invesco, Ltd. (2010-2011); Vice President/Assistant Treasurer, Mutual Fund Administration for Van Kampen Investments, Inc./Morgan Stanley Investment Management (2009-2010); Manager of Mutual Fund Administration, Van Kampen Investments, Inc./Morgan Stanley Investment Management (2005-2009). |
Bryan Stone
(1979) | Vice President | Since 2014 | Current: Vice President, certain other funds in the Fund Complex (2014-present); Director, Guggenheim Investments (2013-present).
Former: Senior Vice President, Neuberger Berman Group LLC (2009-2013); Vice President, Morgan Stanley (2002-2009). |
John L. Sullivan
(1955) | Chief Financial Officer and Treasurer | Since 2014 | Current: CFO, Chief Accounting Officer and Treasurer, certain other funds in the Fund Complex (2010-present); Senior Managing Director, Guggenheim Investments (2010-present).
Former: Managing Director and CCO, each of the funds in the Van Kampen Investments fund complex (2004-2010); Managing Director and Head of Fund Accounting and Administration, Morgan Stanley Investment Management (2002-2004); CFO and Treasurer, Van Kampen Funds (1996-2004). |
* | The business address of each officer is c/o Guggenheim Investments, 227 West Monroe Street, Chicago, Illinois 60606. |
** | Each officer serves an indefinite term, until his or her successor is duly elected and qualified. Time served includes time served in the respective position for the Predecessor Corporation. |
| | THE GUGGENHEIM FUNDS ANNUAL REPORT | 109 |
GUGGENHEIM INVESTMENTS PRIVACY POLICIES (Unaudited) |
Guggenheim Investments as used herein refers to Guggenheim Partners, LLC, Guggenheim Funds Investment Advisors, LLC, Guggenheim Partners Investment Management, LLC, Guggenheim Funds Distributors, LLC and Security Investors, LLC as well as the funds in the Guggenheim Funds complex (the “funds”).
Our Commitment to You
When you become a Guggenheim Investments investor, you entrust us with not only your hard-earned money but also with personal and financial information about you. We recognize that your relationship with us is based on trust and that you expect us to act responsibly and in your best interests. Because we have access to personal information about you, we hold ourselves to high standards in its safekeeping and use. This means, most importantly, that we do not sell client or account information to anyone—whether you are a current or former Guggenheim Investments client.
The Information We Collect About You and How We Collect It
In the course of doing business with shareholders and investors, we collect nonpublic personal information about you. You typically provide personal information when you complete a Guggenheim Investments account application or when you request a transaction that involves Rydex and Guggenheim Funds or one of the Guggenheim affiliated companies. “Nonpublic personal information” is personally identifiable information about you. For example it includes your name and address, Social Security or taxpayer identification number, assets, income, account balance, bank account information and investment activity (e.g. purchase and redemption history).
How We Share Your Personal Information
As a matter of policy, we do not disclose your nonpublic personal information to nonaffiliated third parties except as required or permitted by law. As emphasized above, we do not sell information about current or former clients or their accounts to third parties. Nor do we share such information, except when necessary to complete transactions at your request or to make you aware of related investment products and services that we offer. Additional details about how we handle your personal information are provided below.
To complete certain transactions or account changes that you direct, it may be necessary to provide your personal information to companies, individuals or groups that are not affiliated with Guggenheim Investments. For example if you ask to transfer assets from another financial institution to Guggenheim Investments, we will need to provide certain information about you to that company to complete the transaction. In connection with servicing your accounts or to alert you to other Guggenheim Investments investment products and services, we may share your information within the Guggenheim Investments family of affiliated companies. This would include, for example, sharing your information within Guggenheim Investments so we can make you aware of new funds or the services offered through another Guggenheim Investments
110 | THE GUGGENHEIM FUNDS ANNUAL REPORT | |
GUGGENHEIM INVESTMENTS PRIVACY POLICIES (Unaudited)(continued) |
affiliated company. In certain instances, we may contract with nonaffiliated companies to perform services for us. Where necessary, we will disclose information we have about you to these third parties. In all such cases, we provide the third party with only the information necessary to carry out its assigned responsibilities and only for that purpose. And we require these third parties to treat your personal information with the same high degree of confidentiality that we do. In certain instances, we may share information with other financial institutions regarding individuals and entities in response to the U.S.A. Patriot Act. Finally we will share personal information about you if we are compelled by law to do so, if you direct us to do so with your consent, or in other circumstances as permitted by law.
How We Safeguard Your Personal Information
We maintain physical, electronic and procedural safeguards to protect your personal information. Within Guggenheim Investments, access to such information is limited to those who need it to perform their jobs such as servicing your account, resolving problems or informing you of new products and services.
| | THE GUGGENHEIM FUNDS ANNUAL REPORT | 111 |
This page intentionally left blank.
This page intentionally left blank.
9.30.2016
Guggenheim Funds Annual Report
| |
Guggenheim Floating Rate Strategies Fund | | |
GuggenheimInvestments.com | FR-ANN-0916x0917 |
DEAR SHAREHOLDER | 2 |
ECONOMIC AND MARKET OVERVIEW | 4 |
ABOUT SHAREHOLDERS’ FUND EXPENSES | 6 |
FLOATING RATE STRATEGIES FUND | 9 |
NOTES TO FINANCIAL STATEMENTS | 39 |
REPORT OF INDEPENDENT REGISTERED PUBLIC ACCOUNTING FIRM | 56 |
OTHER INFORMATION | 57 |
INFORMATION ON BOARD OF TRUSTEES AND OFFICERS | 72 |
GUGGENHEIM INVESTMENTS PRIVACY POLICIES | 79 |
| | THE GUGGENHEIM FUNDS ANNUAL REPORT | 1 |
Dear Shareholder:
Guggenheim Partners Investment Management, LLC (the “Investment Adviser”), is pleased to present the shareholder report for Guggenheim Floating Rate Strategies Fund (the “Fund”) for the annual fiscal period ended September 30, 2016.
The Investment Adviser is part of Guggenheim Investments, which represents the investment management businesses of Guggenheim Partners, LLC (“Guggenheim”), a global, diversified financial services firm.
Guggenheim Funds Distributors, LLC is the distributor of the Funds. Guggenheim Funds Distributors, LLC is affiliated with Guggenheim and the Investment Adviser.
We encourage you to read the Economic and Market Overview section of the report, which follows this letter, and then the Managers’ Commentary for the Fund.
We are committed to providing innovative investment solutions and appreciate the trust you place in us.
Sincerely,
Donald C. Cacciapaglia
President and Chief Executive Officer
October 31, 2016
Read a prospectus and summary prospectus (if available) carefully before investing. It contains the investment objectives, risks, charges, expenses and other information, which should be considered carefully before investing. Obtain a prospectus and summary prospectus (if available) at guggenheiminvestments.com or call 800.820.0888.
2 | THE GUGGENHEIM FUNDS ANNUAL REPORT | |
Floating Rate Strategies Fund may not be suitable for all investors. ● Investments in floating rate senior secured syndicated bank loans and other floating rate securities involve special types of risks, including credit rate risk, interest rate risk, liquidity risk and prepayment risk. ● The Fund’s market value will change in response to interest rate changes and market conditions among other factors. In general, bond prices rise when interest rates fall and vice versa. ● The Fund’s exposure to high yield securities may subject the Fund to greater volatility. ● When market conditions are deemed appropriate, the Fund may use leverage to the full extent permitted by its investment policies and restrictions and applicable law. Leveraging will exaggerate the effect on net asset value of any increase or decrease in the market value of the Fund’s portfolio. ● The Fund may invest in derivative instruments, which may be more volatile and less liquid, increasing the risk of loss when compared to traditional securities. Certain of the derivative instruments are also subject to the risks of counterparty default and adverse tax treatment. ● Instruments and strategies (such as borrowing transactions and reverse repurchase agreements) may provide leveraged exposure to a particular investment, which will magnify any gains or losses on those investments. ● Investments in reverse repurchase agreements and synthetic instruments (such as synthetic collateralized debt obligations) expose the Fund to the many of the same risks as investments in derivatives. ● The Fund’s investments in other investment vehicles subject the Fund to those risks and expenses affecting the investment vehicle. ● The Fund’s investments in foreign securities carry additional risks when compared to U.S. securities, due to the impact of diplomatic, political or economic developments in the country in question (investments in emerging markets securities are generally subject to an even greater level of risks). ● The Fund’s investments in real estate securities subject the Fund to the same risks as direct investments in real estate, which is particularly sensitive to economic downturns. ● The Fund’s investments in restricted securities may involve financial and liquidity risk. ● The Fund is subject to active trading risks that may increase volatility and impact its ability to achieve its investment objective. ● You may have a gain or loss when you sell your shares. ● It is important to note that the Fund is not guaranteed by the U.S. government. ● Please read the prospectus for more detailed information regarding these and other risks.
| | THE GUGGENHEIM FUNDS ANNUAL REPORT | 3 |
ECONOMIC AND MARKET OVERVIEW (Unaudited) | September 30, 2016 |
Economic growth continues to rebound, even though the rise in U.S. Gross Domestic Product (“GDP”) disappointed in the first half of 2016. There was a large headwind from inventory drawdowns, which should soon reverse after five quarters of dragging on growth. Real GDP growth is expected to be around 2.5 percent in the second half of the year, driven by consumption, housing, and a fading trade drag, and supporting the view that U.S. economic growth remains resilient to global weakness.
The euro zone economy is slowly improving, but inflation will likely persist well below the European Central Bank’s (“ECB”) target in the coming quarters due to substantial slack. The ECB has indicated that more quantitative easing is possible, but will soon need to alter the quantitative easing program in order to keep up their purchase pace. Both China and Japan need weaker currencies. Chinese growth and capital flows have stabilized for now, but surging construction and a credit boom raise the prospect of future instability. Japan’s economic prospects are weak, and inflation remains far from the Bank of Japan’s (“BOJ”) target. The surging yen could drive further policy easing, including an increase in fiscal stimulus.
It appears the U.S. Federal Reserve (the “Fed”) will move forward with raising rates in December, absent any economic or geopolitical surprise or a meaningful tightening of financial conditions over the fourth quarter. But key events could influence risk asset performance for the balance of the year: A continued recovery in oil prices following the Organization of Petroleum Exporting Countries (“OPEC”) agreement to keep production between 32.5 to 33 million barrels per day would help sustain the rally (although we are skeptical that they will adhere to any quota based on historical production levels). Global oil inventories remain high, but supply and demand are moving toward balance. A rebound in GDP growth would also lift U.S. equity and corporate bond prices higher.
The macroeconomic picture remains the same; we are not on the verge of a recession. But despite our positive outlook on the U.S. economy, valuations across risk assets argue for caution. Ongoing accommodation from central bankers across the globe has alleviated much of the initial macroeconomic tail risk posed by Brexit but may not be enough to dampen the seasonal volatility typically observed in the fourth quarter. Ongoing troubles in the banking sector, such as the woes afflicting Deutsche Bank and Wells Fargo, coupled with uncertainty surrounding upcoming political events, which include the new Trump administration, the Italian constitutional referendum, and key European elections, may create volatility for risk assets for the balance of the year.
For the 12 months ended September 30, 2016, the Standard & Poor’s 500® (“S&P 500”) Index* returned 15.43%. The MSCI Europe-Australasia-Far East (“EAFE”) Index* returned 6.52%. The return of the MSCI Emerging Markets Index* was 16.78%.
4 | THE GUGGENHEIM FUNDS ANNUAL REPORT | |
ECONOMIC AND MARKET OVERVIEW (Unaudited)(concluded) | September 30, 2016 |
In the bond market, the Bloomberg Barclays U.S. Aggregate Bond Index* posted a 5.19% return for the period, while the Bloomberg Barclays U.S. Corporate High Yield Index* returned 12.73%. The return of the Bank of America (“BofA”) Merrill Lynch 3-Month U.S. Treasury Bill Index* was 0.28% for the 12-month period.
The opinions and forecasts expressed may not actually come to pass. This information is subject to change at any time, based on market and other conditions, and should not be construed as a recommendation of any specific security or strategy.
*Index Definitions:
The following indices are referenced throughout this report. Indices are unmanaged and not available for direct investment. Index performance does not reflect transaction costs, fees, or expenses.
BofA Merrill Lynch 3-Month U.S. Treasury Bill Index is an unmanaged market Index of U.S. Treasury securities maturing in 90 days that assumes reinvestment of all income.
Bloomberg Barclays U.S. Aggregate Bond Index is a broad-based flagship benchmark that measures the investment grade, U.S. dollar-denominated, fixed-rate taxable bond market, including U.S. Treasuries, government-related and corporate securities, mortgage-backed securities or “MBS” (agency fixed-rate and hybrid adjustable-rate mortgage, or “ARM”, pass-throughs), asset-backed securities (“ABS”), and commercial mortgage-backed securities (“CMBS”) (agency and non-agency).
Bloomberg Barclays U.S. Corporate High Yield Index measures the U.S. dollar denominated, high yield, fixed-rate corporate bond market. Securities are classified as high yield if the middle rating of Moody’s, Fitch, and S&P is Ba1/BB +/BB + or below.
Credit Suisse Leveraged Loan Index tracks the investable market of the U.S. dollar denominated leveraged loan market. It consists of issues rated “5B” or lower, meaning that the highest rated issues included in this index are Moody’s/S&P ratings of Baa1/BB+ or Ba1/BBB+. All loans are funded term loans with a tenor of at least one year and are made by issuers domiciled in developed countries.
MSCI EAFE Index is a capitalization-weighted measure of stock markets in Europe, Australasia, and the Far East.
MSCI Emerging Markets Index is a free float-adjusted market capitalization-weighted index that is designed to measure equity market performance in the global emerging markets.
S&P 500® is a broad-based index, the performance of which is based on the performance of 500 widely held common stocks chosen for market size, liquidity, and industry group representation.
| | THE GUGGENHEIM FUNDS ANNUAL REPORT | 5 |
ABOUT SHAREHOLDERS’ FUND EXPENSES (Unaudited) |
All mutual funds have operating expenses, and it is important for our shareholders to understand the impact of costs on their investments. Shareholders of a fund incur two types of costs: (i) transaction costs, including sales charges (loads) on purchase payments, reinvested dividends, other distributions, and exchange fees, and (ii) ongoing costs, including management fees, administrative services, and shareholder reports, among others. These ongoing costs, or operating expenses, are deducted from a fund’s gross income and reduce the investment return of the fund.
A fund’s expenses are expressed as a percentage of its average net assets, which is known as the expense ratio. The following examples are intended to help investors understand the ongoing costs (in dollars) of investing in a fund and to compare these costs with the ongoing costs of investing in other mutual funds.
The examples are based on an investment of $1,000 made at the beginning of the period and held for the entire six-month period beginning March 31, 2016 and ending September 30, 2016.
The following tables illustrate the Fund’s costs in two ways:
Table 1. Based on actual Fund return: This section helps investors estimate the actual expenses paid over the period. The “Ending Account Value” shown is derived from the Fund’s actual return, and the fifth column shows the dollar amount that would have been paid by an investor who started with $1,000 in the Fund. Investors may use the information here, together with the amount invested, to estimate the expenses paid over the period. Simply divide the Fund’s account value by $1,000 (for example, an $8,600 account value divided by $1,000 = 8.6), then multiply the result by the number provided under the heading “Expenses Paid During Period.”
Table 2. Based on hypothetical 5% return: This section is intended to help investors compare a Fund’s cost with those of other mutual funds. The table provides information about hypothetical account values and hypothetical expenses based on the Fund’s actual expense ratio and an assumed rate of return of 5% per year before expenses, which is not the Fund’s actual return. The hypothetical account values and expenses may not be used to estimate the actual ending account balance or expenses paid during the period. The example is useful in making comparisons because the U.S. Securities and Exchange Commission (the “SEC”) requires all mutual funds to calculate expenses based on the 5% return. Investors can assess a Fund’s costs by comparing this hypothetical example with the hypothetical examples that appear in shareholder reports of other funds.
The calculations illustrated above assume no shares were bought or sold during the period. Actual costs may have been higher or lower, depending on the amount of investment and the timing of any purchases or redemptions.
6 | THE GUGGENHEIM FUNDS ANNUAL REPORT | |
ABOUT SHAREHOLDERS’ FUND EXPENSES (Unaudited)(continued) |
Please note that the expenses shown in the table are meant to highlight your ongoing costs only and do not reflect any transactional costs, such as sales charges (loads) on purchase payments, and contingent deferred sales charges (“CDSC”) on redemptions, if any. Therefore, the second table is useful in comparing ongoing costs only, and will not help you determine the relative total costs of owning different funds. In addition, if these transactional costs were included, your costs would have been higher.
More information about the Fund’s expenses, including annual expense ratios for periods up to five years (subject to the Fund’s inception date), can be found in the Financial Highlights section of this report. For additional information on operating expenses and other shareholder costs, please refer to the Fund’s prospectus.
| | THE GUGGENHEIM FUNDS ANNUAL REPORT | 7 |
ABOUT SHAREHOLDERS’ FUND EXPENSES (Unaudited)(concluded) |
| | Expense
Ratio1 | Fund
Return | Beginning
Account Value
March 31,
2016 | Ending
Account Value
September 30,
2016 | Expenses
Paid During
Period2 |
Table 1. Based on actual Fund return3 |
Floating Rate Strategies Fund |
A-Class | 1.03% | 4.60% | $ 1,000.00 | $ 1,046.00 | $ 5.28 |
C-Class | 1.78% | 4.24% | 1,000.00 | 1,042.40 | 9.11 |
P-Class | 1.03% | 4.59% | 1,000.00 | 1,045.90 | 5.28 |
Institutional Class | 0.79% | 4.72% | 1,000.00 | 1,047.20 | 4.05 |
| |
Table 2. Based on hypothetical 5% return (before expenses) |
Floating Rate Strategies Fund |
A-Class | 1.03% | 5.00% | $ 1,000.00 | $ 1,019.90 | $ 5.22 |
C-Class | 1.78% | 5.00% | 1,000.00 | 1,016.14 | 9.00 |
P-Class | 1.03% | 5.00% | 1,000.00 | 1,019.90 | 5.22 |
Institutional Class | 0.79% | 5.00% | 1,000.00 | 1,021.11 | 4.00 |
1 | Annualized and excludes expenses of the underlying funds in which the Fund invests. |
2 | Expenses are equal to the Fund's annualized expense ratio, net of any applicable fee waivers, multiplied by the average account value over the period, multiplied by 183/365 (to reflect the one-half year period). |
3 | Actual cumulative return at net asset value for the period March 31, 2016 to September 30, 2016. |
8 | THE GUGGENHEIM FUNDS ANNUAL REPORT | |
MANAGERS’ COMMENTARY (Unaudited) | |
To Our Shareholders
Guggenheim Floating Rate Strategies Fund (the “Fund”) is managed by a team of seasoned professionals, including B. Scott Minerd, Chairman of Investments and Global Chief Investment Officer; Anne B. Walsh, Senior Managing Director and Assistant Chief Investment Officer; Kevin H. Gundersen, Senior Managing Director and Portfolio Manager; James W. Michal, Senior Managing Director and Portfolio Manager; and Thomas J. Hauser, Managing Director and Portfolio Manager. In the following paragraphs, the investment team discusses the market environment and the Fund’s performance for the fiscal year ended September 30, 2016.
For the one-year period ended September 30, 2016, Guggenheim Floating Rate Strategies Fund returned 4.47%1, compared with the 5.35% return of its benchmark, the Credit Suisse Leveraged Loan Index.
The Fund seeks to provide a high level of current income while maximizing total return. The Fund pursues its objective by investing primarily in bank loans and other floating-rate securities. It offers opportunities for investors seeking an alternative to traditional fixed income securities that may help hedge interest rate and inflation exposure. The Fund’s allocations to bank loans, high yield bonds, and structured credit help to decrease volatility and diversify sources of return, and contributed to return for the period.
Fund performance for the period was primarily a result of credit selection among loans, as Guggenheim’s bottom-up, fundamental approach results in the construction of portfolios with strong downside protection that tend to outperform when the broader market underperforms. The loan sector’s continued underweight to Energy and Staples exposure relative to the broader market was also a positive for much of the period. However, underweights to Consumer Cyclical and Basic Industry detracted from return. The Fund focuses on staying up in quality, as times of uncertainty have been accompanied by higher volatility in lower-quality assets. This positioning worked against the Fund at times during the period, amid a volatile interest rate environment or when lower quality loans outperformed.
Although high-yield corporate bonds have delivered more than twice the total return versus bank loans, year to date through September, the loan market has delivered a stronger risk-adjusted return than most of the fixed-income market as a result of limited volatility. This includes high-yield corporates, investment-grade corporates, Agency mortgage-backed securities, non-Agency CMBS, and even Treasuries. High origination volume has been met by stronger demand from both loan mutual funds and robust activity in the collateralized loan obligation market, thereby strengthening the technical backdrop for loans.
We maintain our preference for senior positions in the capital structure, specifically first-lien debt. Weaker covenants and less subordinated debt (which acts to cushion losses) in post-crisis deals became more prevalent during the ultra-easy money post-crisis days. This will likely prove negative for recoveries when the credit cycle matures.
| | THE GUGGENHEIM FUNDS ANNUAL REPORT | 9 |
MANAGERS’ COMMENTARY (Unaudited)(concluded) | |
We continue to avoid highly levered industries and companies with heavy capital expenditure needs that can impair cash flow generation. Companies with strong cash flows, recurring revenue streams, and high-quality margins should remain the focus in the later stages of the cycle. With only 5 percent exposure to Energy and 2 percent exposure to Metals and Mining, leveraged loans are relatively insulated to fundamental deterioration stemming from commodity markets.
The twelve-month trailing issuer-weighted default rate for loans moved little during the period, ending at 1.9 percent, well below the historical average. Excluding commodity-related issuers, the default rate remains near the post-crisis low at just 0.9 percent.
The Fund invests excess cash into the Guggenheim Strategy Funds which, in turn, invest in a diversified portfolio of debt securities and financial instruments providing exposure to fixed income markets. The investment objective of the Guggenheim Strategy Funds is to seek a high level of income consistent with the preservation of capital. For the one -year period ended September 30, 2016, investment in the Guggenheim Strategy Funds has benefited Fund performance relative to investing in other short-term investments.
Performance displayed represents past performance which is no guarantee of future results.
1 | Performance figures are based on Class A shares and do not reflect taxes that a shareholder would pay on distributions or the redemption of shares. |
The opinions and forecast expressed may not actually come to pass. This information is subject to change at any time, based on market and other conditions, and should not be construed as a recommendation of any specific security or strategy.
10 | THE GUGGENHEIM FUNDS ANNUAL REPORT | |
PERFORMANCE REPORT AND FUND PROFILE (Unaudited) | September 30, 2016 |
FLOATING RATE STRATEGIES FUND
OBJECTIVE: Seeks to provide a high level of current income while maximizing total return.
Holdings Diversification (Market Exposure as % of Net Assets)
“Holdings Diversification (Market Exposure as % of Net Assets)” excludes any temporary cash investments or investments in Guggenheim Strategy Funds Trust mutual funds. Investments in those Funds do not provide “market exposure” to meet the Fund’s investment objective, but will significantly increase the portfolio’s exposure to certain other asset categories (and their associated risks), which may cause the Fund to deviate from its principal investment strategy, including: (i) high yield, high risk debt securities rated below the top four long-term rating categories by a nationally recognized statistical rating organization (also known as “junk bonds”); (ii) securities issued by the U.S. government or its agencies and instrumentalities; (iii) CLOs and similar investments; and (iv) other short-term fixed income securities.
Inception Dates: |
A-Class | November 30, 2011 |
C-Class | November 30, 2011 |
P-Class | May 1, 2015 |
Institutional Class | November 30, 2011 |
Ten Largest Holdings (% of Total Net Assets) |
Chobani LLC | 1.0% |
Cengage Learning Acquisitions, Inc. | 1.0% |
Gold Merger Company, Inc. | 1.0% |
Landslide Holdings, Inc. | 1.0% |
Petsmart, Inc. | 0.9% |
PQ Corp. | 0.9% |
DJO Finance LLC | 0.9% |
Albertson’s LLC | 0.9% |
Quikrete Holdings, Inc. | 0.9% |
Travelport Holdings LLC | 0.9% |
Top Ten Total | 9.4% |
| | |
“Ten Largest Holdings” excludes any temporary cash or derivative investments. |
| | THE GUGGENHEIM FUNDS ANNUAL REPORT | 11 |
PERFORMANCE REPORT AND FUND PROFILE (Unaudited)(continued) | September 30, 2016 |
Cumulative Fund Performance*
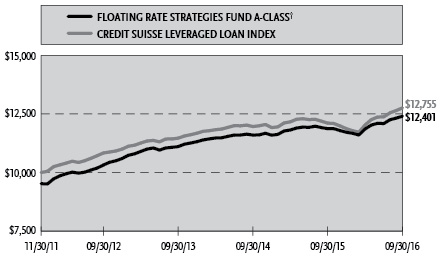
Average Annual Returns*
Periods Ended September 30, 2016
| | 1 Year | Since Inception
(11/30/11) |
A-Class Shares | 4.47% | 5.61% |
A-Class Shares with sales charge† | -0.49% | 4.55% |
C-Class Shares | 3.68% | 4.83% |
C-Class Shares with CDSC‡ | 2.68% | 4.83% |
Institutional Class Shares | 4.71% | 5.86% |
Credit Suisse Leveraged Loan Index | 5.35% | 5.16% |
| | | |
| | | Since Inception
(05/01/15) |
P-Class Shares | 4.46% | 2.95% |
Credit Suisse Leveraged Loan Index | 5.35% | 2.75% |
* | The performance data above represents past performance that is not predictive of future results. The investment return and principal value of an investment in the Fund will fluctuate so that an investor’s shares, when redeemed, may be worth more or less than their original cost. Returns are historical and include changes in principal and reinvested dividends and capital gains and do not reflect the effect of taxes. The Credit Suisse Leveraged Loan Index is an unmanaged index and, unlike the Fund, has no management fees or operating expenses to reduce its reported return. The graph is based on A-Class shares only; performance for C-Class shares, P-Class shares and Institutional Class shares will vary due to differences in fee structures. |
† | Effective October 1, 2015, the maximum sales charge decreased from 4.75% to 3.00%. A 4.75% maximum sales charge is used in the calculation of the Average Annual Returns (based on subscriptions made prior to October 1, 2015), and a 3.00% maximum sales charge will be used to calculate performance for periods based on subscriptions made on or after October 1, 2015. |
‡ | Fund returns include a CDSC of 1% if redeemed within 12 months of purchase. |
12 | THE GUGGENHEIM FUNDS ANNUAL REPORT | |
PERFORMANCE REPORT AND FUND PROFILE (Unaudited)(concluded) | September 30, 2016 |
Portfolio Composition by Quality Rating1
Rating | % of Total Investments |
Fixed Income Instruments |
AAA | 2.7% |
AA | 0.9% |
A | 3.0% |
BBB | 11.7% |
BB | 29.3% |
B | 40.8% |
CCC | 3.0% |
CC | 0.1% |
NR2 | 3.9% |
Other Instruments | 4.6% |
Total Investments | 100.0% |
The chart above reflects percentages of the value of total investments.
1 | Source: BlackRock Solutions. Credit quality ratings are measured on a scale that generally ranges from AAA (highest) to D (lowest). All securities except for those labeled “NR” have been rated by Moody’s, Standard & Poor’s (“S&P”), or Fitch, which are all a Nationally Recognized Statistical Rating Organization (“NRSRO”). For purposes of this presentation, when ratings are available from more than one agency, the highest rating is used. Guggenheim Investments has converted Moody’s and Fitch ratings to the equivalent S&P rating. Security ratings are determined at the time of purchase and may change thereafter. |
2 | NR securities do not necessarily indicate low credit quality. |
| | THE GUGGENHEIM FUNDS ANNUAL REPORT | 13 |
SCHEDULE OF INVESTMENTS | September 30, 2016 |
FLOATING RATE STRATEGIES FUND | |
| | | Shares | | | Value | |
| | | | | | | |
COMMON STOCKS† - 0.0% | |
| | |
Energy - 0.0% | |
Titan Energy LLC* | | | 10,110 | | | $ | 298,245 | |
| | | | | | | | | |
Consumer, Non-cyclical - 0.0% | |
Targus Group International Equity, Inc*,†††,1 | | | 13,186 | | | | 19,252 | |
| | | | | | | | | |
Basic Materials - 0.0% | |
Mirabela Nickel Ltd.*,†††,1 | | | 4,755,634 | | | | 364 | |
Total Common Stocks | | | | | | | | |
(Cost $2,130,407) | | | | | | | 317,861 | |
| | | | | | | | | |
MUTUAL FUNDS†,2 - 1.1% | |
Guggenheim Strategy Fund I | | | 735,751 | | | | 18,386,427 | |
Guggenheim Strategy Fund II | | | 287,125 | | | | 7,160,896 | |
Total Mutual Funds | | | | | | | | |
(Cost $25,449,203) | | | | | | | 25,547,323 | |
| | | | | | | | | |
SHORT TERM INVESTMENTS† - 3.8% | |
Federated U.S. Treasury Cash Reserve Fund Institutional Shares 0.17%3 | | | 92,892,365 | | | | 92,892,365 | |
Total Short Term Investments | | | | | |
(Cost $92,892,365) | | | | | | | 92,892,365 | |
| | | Face
Amount10 | | | | |
| | | | | | | |
SENIOR FLOATING RATE INTERESTS†† - 73.1% | |
Technology - 13.6% | |
Landslide Holdings, Inc. | | | | | | |
5.50% due 09/27/22 | | $ | 23,000,000 | | | | 23,143,749 | |
Verisure Cayman 2 | | | | | | | | |
4.50% due 10/21/22 | | EUR | 17,000,000 | | | | 19,325,863 | |
EIG Investors Corp. | | | | | | | | |
6.00% due 02/09/231 | | | 14,710,653 | | | | 13,680,908 | |
6.48% due 11/08/19 | | | 5,149,792 | | | | 4,988,861 | |
Epicor Software | | | | | | | | |
4.75% due 06/01/22 | | | 18,565,000 | | | | 18,275,015 | |
Avago Technologies Cayman Finance Ltd. | | | | | | | | |
3.52% due 02/01/23 | | | 17,934,052 | | | | 18,138,321 | |
Diebold, Inc. | | | | | | | | |
5.25% due 11/06/23 | | | 17,025,000 | | | | 17,181,119 | |
First Data Corp. | | | | | | | | |
4.53% due 03/24/21 | | | 15,942,259 | | | | 16,052,898 | |
4.28% due 07/08/22 | | | 400,000 | | | | 402,100 | |
TIBCO Software, Inc. | | | | | | | | |
6.50% due 12/04/20 | | | 16,653,906 | | | | 16,395,104 | |
Solera LLC | | | | | | | | |
5.75% due 03/03/23 | | | 15,969,750 | | | | 16,126,094 | |
Deltek, Inc. | | | | | | | | |
5.00% due 06/25/22 | | | 15,438,596 | | | | 15,477,193 | |
The Active Network, Inc. | | | | | | | | |
5.50% due 11/13/20 | | | 11,956,264 | | | | 11,866,592 | |
Infor (US), Inc. | | | | | | | | |
3.75% due 06/03/20 | | | 11,490,764 | | | | 11,416,074 | |
Coherent Holding GmbH | | | | | | | | |
4.25% due 08/01/23 | | EUR | 9,300,000 | | | | 10,571,235 | |
Informatica Corp. | | | | | | | | |
4.50% due 08/05/22 | | | 10,494,000 | | | | 10,205,415 | |
Banca Civica (UK) - Chambertin | | | | | | | | |
4.63% due 08/04/21†††,1 | | GBP | 3,800,000 | | | | 4,741,410 | |
4.88% due 05/29/20†††,1 | | GBP | 3,800,000 | | | | 4,741,410 | |
GlobalLogic Holdings, Inc. | | | | | | | | |
6.25% due 06/02/19 | | | 9,481,875 | | | | 9,458,170 | |
Greenway Medical Technologies | | | | | | | | |
6.00% due 11/04/201 | | | 9,725,000 | | | | 9,457,563 | |
Micro Focus International plc | | | | | | | | |
4.50% due 11/19/21 | | | 8,935,129 | | | | 8,963,096 | |
Ip reo Holdings | | | | | | | | |
4.25% due 08/06/21 | | | 8,818,505 | | | | 8,383,135 | |
Advanced Computer Software | | | | | | | | |
6.50% due 03/18/22 | | | 6,402,500 | | | | 6,098,381 | |
10.50% due 01/31/231 | | | 2,200,000 | | | | 2,024,000 | |
14 | THE GUGGENHEIM FUNDS ANNUAL REPORT | SEE NOTES TO FINANCIAL STATEMENTS. |
SCHEDULE OF INVESTMENTS (continued) | September 30, 2016 |
FLOATING RATE STRATEGIES FUND | |
| | | Face
Amount10 | | | Value | |
| | | | | | | |
Avaya, Inc. | | | | | | |
6.25% due 05/29/20 | | $ | 10,468,867 | | | $ | 7,712,101 | |
Aspect Software, Inc. | | | | | | | | |
10.50% due 05/25/20 | | | 6,934,369 | | | | 6,749,430 | |
Micron Technology, Inc. | | | | | | | | |
6.53% due 04/26/22 | | | 5,803,763 | | | | 5,862,845 | |
Ceridian Corp. | | | | | | | | |
4.50% due 09/15/20 | | | 5,945,424 | | | | 5,804,221 | |
Linxens | | | | | | | | |
5.00% due 10/14/22 | | | 4,872,827 | | | | 4,891,100 | |
Go Daddy Operating Company, LLC | | | | | | | | |
4.25% due 05/13/21 | | | 3,806,952 | | | | 3,826,520 | |
Solarwinds Holdings, Inc. | | | | | | | | |
5.50% due 02/03/23 | | | 2,992,500 | | | | 3,019,433 | |
Compucom Systems, Inc. | | | | | | | | |
4.25% due 05/11/20 | | | 4,196,260 | | | | 2,972,337 | |
Sabre, Inc. | | | | | | | | |
4.00% due 02/19/19 | | | 2,393,031 | | | | 2,401,502 | |
Infor, Inc. | | | | | | | | |
3.75% due 06/03/20 | | | 1,880,866 | | | | 1,866,290 | |
Wall Street Systems Delaware, Inc. | | | | | | | | |
4.75% due 08/26/23 | | | 1,860,246 | | | | 1,861,027 | |
Eze Castle Software, Inc. | | | | | | | | |
7.25% due 04/05/21 | | | 1,441,176 | | | | 1,395,534 | |
Sparta Holding Corp. | | | | | | | | |
6.50% due 07/28/20†††,1 | | | 1,384,832 | | | | 1,376,006 | |
Applied Systems, Inc. | | | | | | | | |
4.00% due 01/25/21 | | | 1,208,930 | | | | 1,210,441 | |
Total Technology | | | | | | | 328,062,493 | |
| | | | | | | | | |
Consumer, Cyclical - 13.5% | |
Petsmart, Inc. | | | | | | | | |
4.25% due 03/11/22 | | | 22,019,184 | | | | 22,044,505 | |
PETCO Animal Supplies, Inc. | | | | | | | | |
5.00% due 01/26/23 | | | 16,268,250 | | | | 16,428,655 | |
5.00% due 01/26/23 | | | 5,422,750 | | | | 5,476,110 | |
Life Time Fitness | | | | | | | | |
4.25% due 06/10/22 | | | 19,672,782 | | | | 19,676,322 | |
Smart & Final Stores LLC | | | | | | | | |
4.30% due 11/15/22 | | | 17,748,040 | | | | 17,742,539 | |
Acosta, Inc. | | | | | | | | |
4.25% due 09/26/21 | | | 18,018,516 | | | | 17,117,590 | |
Sears Holdings Corp. | | | | | | | | |
5.50% due 06/30/18 | | | 16,484,314 | | | | 16,127,099 | |
BJ’s Wholesale Club, Inc. | | | | | | | | |
4.50% due 09/26/19 | | | 16,077,317 | | | | 16,105,774 | |
Party City Holdings, Inc. | | | | | | | | |
4.47% due 08/19/22 | | | 16,037,107 | | | | 16,082,973 | |
Navistar, Inc. | | | | | | | | |
6.50% due 08/07/20 | | | 15,334,125 | | | | 15,362,953 | |
Gates Global, Inc. | | | | | | | | |
4.25% due 07/05/21 | | | 14,949,082 | | | | 14,711,242 | |
Advantage Sales & Marketing LLC | | | | | | | | |
4.25% due 07/23/21 | | | 13,426,208 | | | | 13,250,056 | |
3.39% due 07/25/19†††,1 | | | 600,000 | | | | 556,422 | |
Equinox Fitness | | | | | | | | |
5.00% due 01/31/20 | | | 11,993,588 | | | | 12,063,511 | |
Belk, Inc. | | | | | | | | |
5.75% due 12/12/22 | | | 13,283,250 | | | | 12,016,559 | |
Fitness International LLC | | | | | | | | |
6.00% due 07/01/20 | | | 11,674,078 | | | | 11,656,567 | |
Leslie’s Poolmart, Inc. | | | | | | | | |
5.25% due 08/16/23 | | | 11,300,000 | | | | 11,365,879 | |
La Quinta Intermediate Holdings | | | | | | | | |
3.75% due 04/14/21 | | | 10,718,797 | | | | 10,698,753 | |
Burlington Coat Factory Warehouse Corp. | | | | | | | | |
3.50% due 08/13/21 | | | 10,100,000 | | | | 10,167,367 | |
Deuce Acquisition | | | | | | | | |
6.50% due 12/08/221 | | GBP | 7,100,000 | | | | 8,783,385 | |
PTL Acqusition, Inc. | | | | | | | | |
4.00% due 05/12/23 | | | 8,300,000 | | | | 8,370,052 | |
National Vision, Inc. | | | | | | | | |
4.00% due 03/12/21 | | | 8,008,158 | | | | 7,906,054 | |
Neiman Marcus Group, Inc. | | | | | | | | |
4.25% due 10/25/20 | | | 7,807,008 | | | | 7,172,688 | |
Eyemart Express | | | | | | | | |
5.00% due 12/17/21 | | | 6,904,509 | | | | 6,921,770 | |
YUM! Brands, Inc. | | | | | | | | |
3.28% due 06/16/23 | | | 5,187,000 | | | | 5,219,419 | |
Men’s Wearhouse | | | | | | | | |
4.50% due 06/18/21 | | | 4,390,267 | | | | 4,343,643 | |
SEE NOTES TO FINANCIAL STATEMENTS. | THE GUGGENHEIM FUNDS ANNUAL REPORT | 15 |
SCHEDULE OF INVESTMENTS (continued) | September 30, 2016 |
FLOATING RATE STRATEGIES FUND | |
| | | Face
Amount10 | | | Value | |
| | | | | | | |
Sterling Intermidiate Corp. | | | | | | |
5.75% due 06/20/22 | | $ | 4,270,499 | | | $ | 4,249,146 | |
Bass Pro Group LLC | | | | | | | | |
4.00% due 06/05/20 | | | 3,304,718 | | | | 3,294,408 | |
Ascena Retail Group | | | | | | | | |
5.25% due 08/21/22 | | | 3,187,291 | | | | 3,069,967 | |
Hilton Worldwide Finance LLC | | | | | | | | |
2.50% due 10/25/23 | | | 2,915,514 | | | | 2,931,462 | |
Capital Automotive LP | | | | | | | | |
6.00% due 04/30/20 | | | 2,830,000 | | | | 2,844,858 | |
NPC International, Inc. | | | | | | | | |
4.75% due 12/28/18 | | | 906,153 | | | | 906,153 | |
Container Store, Inc. | | | | | | | | |
4.25% due 04/05/19 | | | 870,630 | | | | 740,035 | |
Kate Spade & Co. | | | | | | | | |
4.00% due 04/09/21 | | | 578,269 | | | | 578,026 | |
Rite Aid Corp. | | | | | | | | |
5.75% due 08/21/20 | | | 500,000 | | | | 500,940 | |
Jacobs Entertainment, Inc. | | | | | | | | |
5.25% due 10/29/18 | | | 463,269 | | | | 463,269 | |
Total Consumer, Cyclical | | | | | | | 326,946,151 | |
| | | | | | | | | |
Consumer, Non-cyclical - 13.5% | |
Chobani LLC | | | | | | | | |
5.50% due 09/29/23 | | | 24,000,000 | | | | 23,880,000 | |
Gold Merger Company, Inc. | | | | | | | | |
4.75% due 07/27/23 | | | 23,175,000 | | | | 23,334,443 | |
DJO Finance LLC | | | | | | | | |
4.25% due 06/08/20 | | | 22,284,394 | | | | 21,866,562 | |
Albertson’s LLC | | | | | | | | |
4.50% due 08/25/21 | | | 21,094,585 | | | | 21,247,942 | |
MPH Acquisition Holdings LLC | | | | | | | | |
5.00% due 06/07/23 | | | 19,518,156 | | | | 19,752,959 | |
CHG Healthcare Services, Inc. | | | | | | | | |
4.75% due 06/07/23 | | | 18,929,023 | | | | 19,100,519 | |
Press Ganey Holdings, Inc. | | | | | | | | |
4.25% due 09/29/23 | | | 17,000,000 | | | | 17,000,000 | |
Advancepierre Foods, Inc. | | | | | | | | |
4.50% due 06/02/23 | | | 16,851,896 | | | | 16,978,285 | |
US Foods, Inc. | | | | | | | | |
4.00% due 06/27/23 | | | 16,408,875 | | | | 16,528,496 | |
American Tire Distributors, Inc. | | | | | | | | |
5.25% due 09/01/21 | | | 16,487,266 | | | | 16,256,444 | |
Authentic Brands | | | | | | | | |
5.50% due 05/27/21 | | | 13,931,351 | | | | 13,896,522 | |
At Home Holding III Corp. | | | | | | | | |
5.00% due 06/03/22 | | | 12,343,750 | | | | 12,282,031 | |
Hostess Brands | | | | | | | | |
4.50% due 08/03/22 | | | 11,385,000 | | | | 11,456,156 | |
Endo Luxembourg Finance Co. | | | | | | | | |
3.75% due 09/25/22 | | | 11,314,500 | | | | 11,283,046 | |
Lineage Logistics LLC | | | | | | | | |
4.50% due 04/07/21 | | | 10,796,584 | | | | 10,661,627 | |
Pinnacle Foods Corp. | | | | | | | | |
3.25% due 04/29/20 | | | 4,911,392 | | | | 4,929,810 | |
3.25% due 04/29/20 | | | 4,010,953 | | | | 4,028,280 | |
CTI Foods Holding Co. LLC | | | | | | | | |
8.25% due 06/28/21 | | | 7,420,000 | | | | 6,603,800 | |
4.50% due 06/29/20 | | | 1,262,453 | | | | 1,219,846 | |
Reddy Ice Holdings, Inc. | | | | | | | | |
6.75% due 05/01/19 | | | 4,730,919 | | | | 4,470,718 | |
10.75% due 10/01/191 | | | 2,000,000 | | | | 1,553,340 | |
Valeant Pharmaceuticals International, Inc. | | | | | | | | |
5.25% due 08/05/20 | | | 3,879,214 | | | | 3,885,265 | |
5.50% due 04/01/22 | | | 1,997,048 | | | | 2,002,241 | |
Sterigenics Norion Holdings | | | | | | | | |
4.25% due 05/16/22 | | | 4,950,000 | | | | 4,962,375 | |
Pharmaceutical Product Development | | | | | | | | |
4.25% due 08/18/22 | | | 4,751,157 | | | | 4,765,600 | |
Dole Food Company, Inc. | | | | | | | | |
4.57% due 11/01/18 | | | 4,724,789 | | | | 4,733,246 | |
Arctic Glacier Holdings, Inc. | | | | | | | | |
6.00% due 05/10/19 | | | 4,576,503 | | | | 4,519,296 | |
16 | THE GUGGENHEIM FUNDS ANNUAL REPORT | SEE NOTES TO FINANCIAL STATEMENTS. |
SCHEDULE OF INVESTMENTS (continued) | September 30, 2016 |
FLOATING RATE STRATEGIES FUND | |
| | | Face
Amount10 | | | Value | |
| | | | | | | |
Grocery Outlet, Inc. | | | | | | |
5.00% due 10/21/21 | | $ | 3,950,161 | | | $ | 3,940,285 | |
Nellson Nutraceutical (US) | | | | | | | | |
6.00% due 12/23/21 | | | 3,063,632 | | | | 3,059,803 | |
Serta Simmons Holdings LLC | | | | | | | | |
4.25% due 10/01/19 | | | 2,602,371 | | | | 2,608,877 | |
Genoa Healthcare | | | | | | | | |
4.50% due 05/02/22 | | | 2,567,500 | | | | 2,567,500 | |
R&R Ice Cream PLC | | | | | | | | |
6.25% due 09/28/23 | | EUR | 2,000,000 | | | | 2,257,793 | |
Nellson Nutraceutical (US) | | | | | | | | |
6.00% due 12/23/21 | | | 1,902,873 | | | | 1,900,495 | |
NES Global Talent | | | | | | | | |
6.50% due 10/03/191 | | | 1,637,217 | | | | 1,457,123 | |
Acadia Healthcare Company, Inc. | | | | | | | | |
3.75% due 02/16/23 | | | 1,343,250 | | | | 1,351,645 | |
Catalent Pharma Solutions, Inc. | | | | | | | | |
4.25% due 05/20/21 | | | 1,191,149 | | | | 1,198,225 | |
Aramark Corp. | | | | | | | | |
3.34% due 02/24/21 | | | 1,189,500 | | | | 1,196,197 | |
Fender Musical Instruments Corp. | | | | | | | | |
5.75% due 04/03/19 | | | 747,647 | | | | 742,975 | |
Targus Group International, Inc. | | | | | | | | |
due 05/24/16†††,1,4 | | | 152,876 | | | | — | |
Total Consumer, Non-cyclical | | | | 325,479,767 | |
| | | | | | | | | |
Industrial - 12.2% | |
Quikrete Holdings, Inc. | | | | | | | | |
4.00% due 09/28/20 | | | 21,030,000 | | | | 21,161,437 | |
Travelport Holdings LLC | | | | | | | | |
5.00% due 09/02/21 | | | 20,487,766 | | | | 20,571,970 | |
Transdigm, Inc. | | | | | | | | |
3.75% due 05/14/22 | | | 12,908,686 | | | | 12,915,915 | |
3.83% due 06/04/21 | | | 6,657,934 | | | | 6,652,408 | |
American Builders & Contractors Supply Co., Inc. | | | | | | | | |
3.50% due 09/23/23 | | | 14,831,908 | | | | 14,872,696 | |
3.50% due 04/16/20 | | | 3,101,804 | | | | 3,108,411 | |
Brickman Group Holdings, Inc. | | | | | | | | |
4.00% due 12/18/20 | | | 16,281,708 | | | | 16,241,003 | |
Amber Bidco Ltd. | | | | | | | | |
4.66% due 06/30/21†††,1 | | | 10,480,000 | | | | 10,336,855 | |
4.50% due 06/30/21†††,1 | | GBP | 3,500,000 | | | | 4,475,261 | |
Engility Corp. | | | | | | | | |
5.75% due 08/14/23 | | | 14,659,687 | | | | 14,792,504 | |
Flakt Woods | | | | | | | | |
2.88% due 03/20/17††† | | EUR | 12,307,222 | | | | 13,686,211 | |
Camp International Holding Co. | | | | | | | | |
4.75% due 08/18/23 | | | 13,400,000 | | | | 13,373,200 | |
TMF Group Holding BV | | | | | | | | |
4.00% due 09/29/23 | | EUR | 10,750,000 | | | | 12,232,721 | |
USIC Holding, Inc. | | | | | | | | |
4.00% due 07/10/20 | | | 11,949,909 | | | | 11,875,222 | |
DAE Aviation | | | | | | | | |
5.25% due 07/07/22 | | | 10,428,830 | | | | 10,484,207 | |
Reynolds Group Holdings | | | | | | | | |
4.25% due 02/05/23 | | | 10,273,272 | | | | 10,302,139 | |
CareCore National LLC | | | | | | | | |
5.50% due 03/05/21 | | | 9,762,700 | | | | 9,567,446 | |
Rexnord LLC/RBS Global, Inc. | | | | | | | | |
4.00% due 08/21/20 | | | 7,759,769 | | | | 7,766,598 | |
Hardware Holdings LLC | | | | | | | | |
6.75% due 03/30/201 | | | 6,125,000 | | | | 5,971,875 | |
CPM Holdings, Inc. | | | | | | | | |
6.00% due 04/11/22 | | | 5,727,500 | | | | 5,751,384 | |
Crosby Worldwide | | | | | | | | |
4.00% due 11/23/20 | | | 6,539,077 | | | | 5,460,129 | |
Power Borrower, LLC | | | | | | | | |
4.25% due 05/06/20 | | | 3,614,510 | | | | 3,600,956 | |
8.25% due 11/06/20 | | | 1,670,000 | | | | 1,661,650 | |
Thermasys Corp. | | | | | | | | |
5.25% due 05/03/191 | | | 6,270,469 | | | | 5,043,840 | |
SIRVA Worldwide, Inc. | | | | | | | | |
7.50% due 03/27/191 | | | 4,690,160 | | | | 4,643,259 | |
CHI Overhead Doors, Inc. | | | | | | | | |
4.50% due 07/29/22 | | | 4,554,000 | | | | 4,554,000 | |
SEE NOTES TO FINANCIAL STATEMENTS. | THE GUGGENHEIM FUNDS ANNUAL REPORT | 17 |
SCHEDULE OF INVESTMENTS (continued) | September 30, 2016 |
FLOATING RATE STRATEGIES FUND | |
| | | Face
Amount10 | | | Value | |
| | | | | | | |
NVA Holdings, Inc. | | | | | | |
4.75% due 08/14/21 | | $ | 3,963,659 | | | $ | 3,958,704 | |
5.50% due 08/14/21 | | | 527,350 | | | | 528,009 | |
Hillman Group, Inc. | | | | | | | | |
4.50% due 06/30/21 | | | 3,458,062 | | | | 3,465,254 | |
Connolly Corp. | | | | | | | | |
3.61% due 09/28/23 | | | 3,049,723 | | | | 3,047,192 | |
SIG Onex Wizard Acquisition | | | | | | | | |
4.00% due 03/11/22 | | | 2,914,660 | | | | 2,917,487 | |
Mast Global | | | | | | | | |
7.75% due 09/12/19†††,1 | | | 2,896,456 | | | | 2,882,073 | |
Learning Care Group (US), Inc. | | | | | | | | |
5.00% due 05/05/21 | | | 2,632,852 | | | | 2,626,270 | |
GYP Holdings III Corp. | | | | | | | | |
4.50% due 04/01/21 | | | 2,577,408 | | | | 2,568,542 | |
SI Organization | | | | | | | | |
5.75% due 11/22/19 | | | 2,417,686 | | | | 2,428,276 | |
Doncasters Group Ltd. | | | | | | | | |
9.50% due 10/09/20 | | | 2,348,621 | | | | 2,210,639 | |
Berlin Packaging LLC | | | | | | | | |
4.50% due 10/01/21 | | | 1,883,596 | | | | 1,889,981 | |
Berry Plastics Corp. | | | | | | | | |
3.50% due 02/07/20 | | | 1,066,834 | | | | 1,067,506 | |
3.50% due 01/06/21 | | | 815,500 | | | | 815,704 | |
Constantinople Acquisition GmbH | | | | | | | | |
4.00% due 04/30/22 | | | 1,826,875 | | | | 1,829,926 | |
Mitchell International, Inc. | | | | | | | | |
4.50% due 10/13/20 | | | 1,832,212 | | | | 1,829,537 | |
Tank Holdings Corp. | | | | | | | | |
5.25% due 03/16/22 | | | 1,856,522 | | | | 1,776,079 | |
ProAmpac | | | | | | | | |
5.75% due 08/18/22 | | | 1,579,534 | | | | 1,587,432 | |
NANA Development Corp. | | | | | | | | |
8.00% due 03/15/181 | | | 1,530,000 | | | | 1,430,550 | |
Dematic S.A. | | | | | | | | |
4.25% due 12/28/19 | | | 1,327,554 | | | | 1,326,226 | |
Ceva Group Plc (United Kingdom) | | | | | | | | |
6.50% due 03/19/21 | | | 407,923 | | | | 326,167 | |
Pro Mach Group, Inc. | | | | | | | | |
4.75% due 10/22/21 | | | 615,602 | | | | 614,216 | |
Wencor Group | | | | | | | | |
4.04% due 06/19/19††† | | | 482,308 | | | | 451,621 | |
Atkore International, Inc. | | | | | | | | |
7.75% due 10/09/21 | | | 400,000 | | | | 400,168 | |
Omnitracs, Inc. | | | | | | | | |
8.75% due 05/25/21 | | | 350,000 | | | | 329,875 | |
Hunter Fan Co. | | | | | | | | |
6.73% due 12/20/171 | | | 186,134 | | | | 183,342 | |
Total Industrial | | | | | | | 293,594,073 | |
| | | | | | | | | |
Communications - 8.4% | |
Cengage Learning Acquisitions, Inc. | | | | | | | | |
5.25% due 06/07/23 | | | 23,389,420 | | | | 23,360,184 | |
Numericable US LLC | | | | | | | | |
4.75% due 02/10/23 | | | 17,561,750 | | | | 17,676,955 | |
4.56% due 07/31/22 | | | 3,275,250 | | | | 3,296,736 | |
Univision Communications, Inc. | | | | | | | | |
4.00% due 02/28/20 | | | 18,384,445 | | | | 18,416,066 | |
4.00% due 03/01/20 | | | 1,271,731 | | | | 1,273,587 | |
Cartrawler | | | | | | | | |
3.75% due 04/29/211 | | EUR | 16,231,796 | | | | 18,050,523 | |
Neptune Finco Corp. | | | | | | | | |
5.00% due 10/09/22 | | | 17,955,000 | | | | 17,973,673 | |
Mcgraw-Hill Global Education Holdings LLC | | | | | | | | |
5.00% due 05/04/22 | | | 15,186,938 | | | | 15,266,669 | |
Ziggo Secured Finance BV | | | | | | | | |
3.75% due 08/31/24 | | EUR | 12,300,000 | | | | 13,837,621 | |
Warner Music Group | | | | | | | | |
3.75% due 07/01/20 | | | 13,591,259 | | | | 13,574,270 | |
T-Mobile US, Inc. | | | | | | | | |
3.50% due 11/09/22 | | | 11,910,000 | | | | 12,000,992 | |
Light Tower Fiber LLC | | | | | | | | |
4.09% due 04/13/20 | | | 11,657,484 | | | | 11,653,870 | |
Houghton Mifflin Co. | | | | | | | | |
4.00% due 05/31/21 | | | 10,766,244 | | | | 10,645,124 | |
Virgin Media Bristol LLC | | | | | | | | |
3.65% due 06/30/23 | | | 5,857,895 | | | | 5,881,209 | |
CBS Outdoor Americas Capital LLC | | | | | | | | |
3.00% due 02/01/21 | | | 3,967,500 | | | | 3,979,403 | |
18 | THE GUGGENHEIM FUNDS ANNUAL REPORT | SEE NOTES TO FINANCIAL STATEMENTS. |
SCHEDULE OF INVESTMENTS (continued) | September 30, 2016 |
FLOATING RATE STRATEGIES FUND | |
| | | Face
Amount10 | | | Value | |
| | | | | | | |
Internet Brands | | | | | | |
4.75% due 07/08/21 | | $ | 3,027,083 | | | $ | 3,030,867 | |
Match Group, Inc. | | | | | | | | |
5.50% due 11/16/22 | | | 2,754,375 | | | | 2,768,147 | |
EMI Music Publishing | | | | | | | | |
4.00% due 08/19/22 | | | 2,465,189 | | | | 2,471,746 | |
Telenet Financing USD LLC | | | | | | | | |
4.36% due 06/30/24 | | | 2,150,000 | | | | 2,166,125 | |
Anaren, Inc. | | | | | | | | |
5.50% due 02/18/211 | | | 1,501,389 | | | | 1,445,087 | |
9.25% due 08/18/211 | | | 275,000 | | | | 244,750 | |
Scout24 AG | | | | | | | | |
3.50% due 02/12/21 | | EUR | 1,456,527 | | | | 1,642,730 | |
Charter Communications Operating, LLC | | | | | | | | |
3.00% due 01/03/21 | | | 1,575,573 | | | | 1,579,764 | |
Level 3 Communications, Inc. | | | | | | | | |
4.00% due 08/01/19 | | | 750,000 | | | | 752,813 | |
Total Communications | | | | | | | 202,988,911 | |
| | | | | | | | | |
Financial - 6.9% | |
Americold Realty Operating Partnership, LP | | | | | | | | |
5.75% due 12/01/22 | | | 18,054,750 | | | | 18,201,534 | |
Alliant Holdings I L.P. | | | | | | | | |
4.75% due 08/12/22 | | | 16,392,500 | | | | 16,380,206 | |
Transunion Holding Co. | | | | | | | | |
3.59% due 04/09/21 | | | 16,219,618 | | | | 16,260,167 | |
National Financial Partners Corp. | | | | | | | | |
4.50% due 07/01/20 | | | 14,115,999 | | | | 14,136,609 | |
Assured Partners, Inc. | | | | | | | | |
5.75% due 10/21/22 | | | 12,897,314 | | | | 12,949,677 | |
HUB International Ltd. | | | | | | | | |
4.00% due 10/02/20 | | | 12,444,553 | | | | 12,444,553 | |
Hyperion Insurance | | | | | | | | |
5.50% due 04/29/22 | | | 12,683,866 | | | | 12,386,557 | |
York Risk Services | | | | | | | | |
4.75% due 10/01/211 | | | 11,435,421 | | | | 10,449,116 | |
WEX, Inc. | | | | | | | | |
4.25% due 07/01/23 | | | 10,074,750 | | | | 10,183,860 | |
Magic Newco, LLC | | | | | | | | |
5.00% due 12/12/18 | | | 7,367,106 | | | | 7,373,220 | |
Acrisure LLC | | | | | | | | |
6.50% due 05/19/22 | | | 6,759,886 | | | | 6,772,594 | |
American Stock Transfer & Trust | | | | | | | | |
5.75% due 06/26/20 | | | 5,679,634 | | | | 5,547,128 | |
WTG Holdings | | | | | | | | |
4.75% due 01/15/21 | | | 4,114,753 | | | | 4,114,753 | |
Cotiviti Corp. | | | | | | | | |
3.61% due 09/28/23 | | | 3,850,000 | | | | 3,857,238 | |
LPL Financial Holdings, Inc. | | | | | | | | |
4.75% due 11/21/22 | | | 3,796,313 | | | | 3,816,889 | |
Jefferies Finance LLC | | | | | | | | |
4.50% due 05/14/20 | | | 3,801,875 | | | | 3,744,847 | |
Dollar Tree, Inc. | | | | | | | | |
3.06% due 07/06/22 | | | 2,571,815 | | | | 2,587,888 | |
Fly Leasing Ltd. | | | | | | | | |
3.54% due 08/09/19 | | | 1,688,395 | | | | 1,690,506 | |
Cunningham Lindsey U.S., Inc. | | | | | | | | |
5.00% due 12/10/19 | | | 1,557,915 | | | | 1,306,701 | |
9.25% due 06/10/20 | | | 194,886 | | | | 75,518 | |
USI Holdings Corp. | | | | | | | | |
4.25% due 12/27/19 | | | 1,367,837 | | | | 1,368,863 | |
AMWINS Group LLC | | | | | | | | |
4.75% due 09/06/19 | | | 963,237 | | | | 968,352 | |
Total Financial | | | | | | | 166,616,776 | |
| | | | | | | | | |
Basic Materials - 2.0% | |
PQ Corp. | | | | | | | | |
5.75% due 11/04/22 | | | 21,869,190 | | | | 22,019,650 | |
Nexeo Solutions LLC | | | | | | | | |
5.25% due 06/09/23 | | | 10,504,185 | | | | 10,550,193 | |
Chromaflo Technologies | | | | | | | | |
4.50% due 12/02/19 | | | 9,133,839 | | | | 9,122,422 | |
Platform Specialty Products | | | | | | | | |
5.50% due 06/07/20 | | | 3,228,184 | | | | 3,240,290 | |
Zep, Inc. | | | | | | | | |
5.50% due 06/27/22 | | | 2,241,401 | | | | 2,244,203 | |
Minerals Technologies, Inc. | | | | | | | | |
3.75% due 05/10/21 | | | 978,452 | | | | 983,344 | |
SEE NOTES TO FINANCIAL STATEMENTS. | THE GUGGENHEIM FUNDS ANNUAL REPORT | 19 |
SCHEDULE OF INVESTMENTS (continued) | September 30, 2016 |
FLOATING RATE STRATEGIES FUND | |
| | | Face
Amount10 | | | Value | |
| | | | | | | |
Hoffmaster Group, Inc. | | | | | | |
5.25% due 05/08/20 | | $ | 933,291 | | | $ | 933,291 | |
Total Basic Materials | | | | | | | 49,093,393 | |
| | | | | | | | | |
Utilities - 1.8% | |
TPF II Power LLC | | | | | | | | |
5.00% due 10/02/21 | | | 15,479,772 | | | | 15,622,960 | |
Linden Cogeneration Power | | | | | | | | |
5.25% due 06/28/23 | | | 15,172,015 | | | | 15,312,356 | |
Dynegy, Inc. | | | | | | | | |
5.00% due 06/27/23 | | | 11,000,000 | | | | 11,079,750 | |
EWT Holdings III Corp. | | | | | | | | |
5.50% due 01/15/21 | | | 1,641,750 | | | | 1,645,854 | |
Total Utilities | | | | | | | 43,660,920 | |
| | | | | | | | | |
Energy - 0.8% | |
Veresen Midstream LP | | | | | | | | |
5.25% due 03/31/22 | | | 15,626,852 | | | | 15,483,554 | |
PSS Companies | | | | | | | | |
5.50% due 01/28/201 | | | 5,609,564 | | | | 4,094,981 | |
Total Energy | | | | | | | 19,578,535 | |
| | | | | | | | | |
Electric - 0.4% | |
Stonewall (Green Energy) | | | | | | | | |
6.50% due 11/12/21 | | | 5,950,000 | | | | 5,771,500 | |
Panda Temple II Power | | | | | | | | |
7.25% due 04/03/19 | | | 4,466,250 | | | | 4,075,453 | |
Total Electric | | | | | | | 9,846,953 | |
Total Senior Floating Rate Interests | | | | | |
(Cost $1,784,789,157) | | | | | | | 1,765,867,972 | |
| | | | | | | | | |
CORPORATE BONDS†† - 7.0% | |
Energy - 1.4% | |
Sabine Pass Liquefaction LLC | | | | | | | | |
5.63% due 02/01/21 | | | 5,500,000 | | | | 5,809,375 | |
5.63% due 04/15/23 | | | 4,200,000 | | | | 4,483,500 | |
Crestwood Midstream Partners Limited Partnership / Crestwood Midstream Finance Corp. | | | | | | | | |
6.00% due 12/15/20 | | | 6,300,000 | | | | 6,347,250 | |
CONSOL Energy, Inc. | | | | | | | | |
5.88% due 04/15/22 | | | 6,750,000 | | | | 6,210,000 | |
Unit Corp. | | | | | | | | |
6.63% due 05/15/21 | | | 4,000,000 | | | | 3,375,000 | |
Gibson Energy, Inc. | | | | | | | | |
6.75% due 07/15/215 | | | 2,905,000 | | | | 2,970,363 | |
FTS International, Inc. | | | | | | | | |
8.35% due 06/15/205,6 | | | 2,950,000 | | | | 2,505,730 | |
Legacy Reserves Limited Partnership / Legacy Reserves Finance Corp. | | | | | | | | |
8.00% due 12/01/20 | | | 2,750,000 | | | | 1,485,000 | |
PDC Energy, Inc. | | | | | | | | |
7.75% due 10/15/22 | | | 800,000 | | | | 854,000 | |
BreitBurn Energy Partners Limited Partnership / BreitBurn Finance Corp. | | | | | | | | |
7.88% due 04/15/227 | | | 850,000 | | | | 433,500 | |
Total Energy | | | | | | | 34,473,718 | |
| | | | | | | | | |
Industrial - 1.2% | |
Ardagh Packaging Finance plc / Ardagh Holdings USA, Inc. | | | | | | | | |
4.07% due 05/15/215,6 | | | 13,500,000 | | | | 13,702,500 | |
Reynolds Group Issuer Incorporated / Reynolds Group Issuer LLC / Reynolds Group Issuer Lu | | | | | | | | |
4.13% due 07/15/215,6 | | | 7,500,000 | | | | 7,612,500 | |
Novelis Corp. | | | | | | | | |
6.25% due 08/15/245 | | | 3,000,000 | | | | 3,183,750 | |
Anixter, Inc. | | | | | | | | |
5.50% due 03/01/23 | | | 3,000,000 | | | | 3,142,500 | |
CEVA Group plc | | | | | | | | |
7.00% due 03/01/215 | | | 663,000 | | | | 537,030 | |
Total Industrial | | | | | | | 28,178,280 | |
20 | THE GUGGENHEIM FUNDS ANNUAL REPORT | SEE NOTES TO FINANCIAL STATEMENTS. |
SCHEDULE OF INVESTMENTS (continued) | September 30, 2016 |
FLOATING RATE STRATEGIES FUND | |
| | | Face
Amount10 | | | Value | |
| | | | | | | |
Consumer, Non-cyclical - 1.1% | |
Tenet Healthcare Corp. | | | | | | |
4.35% due 06/15/206 | | $ | 17,000,000 | | | $ | 17,086,700 | |
Vector Group Ltd. | | | | | | | | |
7.75% due 02/15/21 | | | 6,890,000 | | | | 7,266,883 | |
Bumble Bee Holdings, Inc. | | | | | | | | |
9.00% due 12/15/175 | | | 1,754,000 | | | | 1,762,770 | |
Opal Acquisition, Inc. | | | | | | | | |
8.88% due 12/15/215 | | | 855,000 | | | | 701,100 | |
Total Consumer, Non-cyclical | | | | 26,817,453 | |
| | | | | | | | | |
Communications - 1.1% | |
Interoute Finco plc | | | | | | | | |
6.25% due 10/15/20 | | EUR | 7,250,000 | | | | 8,239,469 | |
Ziggo Secured Finance BV | | | | | | | | |
5.50% due 01/15/275 | | | 5,000,000 | | | | 4,993,750 | |
Midcontinent Communications & Midcontinent Finance Corp. | | | | | | | | |
6.88% due 08/15/235 | | | 4,000,000 | | | | 4,260,000 | |
Level 3 Financing, Inc. | | | | | | | | |
4.41% due 01/15/186 | | | 4,210,000 | | | | 4,225,788 | |
Sprint Communications, Inc. | | | | | | | | |
9.00% due 11/15/185 | | | 1,000,000 | | | | 1,103,750 | |
DISH DBS Corp. | | | | | | | | |
7.75% due 07/01/265 | | | 900,000 | | | | 956,250 | |
MDC Partners, Inc. | | | | | | | | |
6.50% due 05/01/245 | | | 950,000 | | | | 878,750 | |
TIBCO Software, Inc. | | | | | | | | |
11.38% due 12/01/215 | | | 550,000 | | | | 489,500 | |
Avaya, Inc. | | | | | | | | |
7.00% due 04/01/195 | | | 610,000 | | | | 449,875 | |
UPCB Finance VI Ltd. | | | | | | | | |
6.88% due 01/15/225 | | | 424,000 | | | | 444,140 | |
Total Communications | | | | | | | 26,041,272 | |
| | | | | | | | | |
Financial - 0.9% | |
Kennedy-Wilson, Inc. | | | | | | | | |
5.88% due 04/01/24 | | | 11,305,000 | | | | 11,389,787 | |
Icahn Enterprises, LP / Icahn Enterprises Finance Corp. | | | | | | | | |
5.88% due 02/01/22 | | | 5,000,000 | | | | 4,800,000 | |
Icahn Enterprises Limited Partnership / Icahn Enterprises Finance Corp. | | | | | | | | |
6.00% due 08/01/20 | | | 1,700,000 | | | | 1,708,500 | |
Jefferies Finance LLC / JFIN Company-Issuer Corp. | | | | | | | | |
7.38% due 04/01/205 | | | 1,050,000 | | | | 1,023,750 | |
NFP Corp. | | | | | | | | |
9.00% due 07/15/215 | | | 850,000 | | | | 873,269 | |
Oxford Finance LLC / Oxford Finance Company-Issuer, Inc. | | | | | | | | |
7.25% due 01/15/185 | | | 650,000 | | | | 650,000 | |
CyrusOne, LP / CyrusOne Finance Corp. | | | | | | | | |
6.38% due 11/15/22 | | | 600,000 | | | | 635,437 | |
Fidelity & Guaranty Life Holdings, Inc. | | | | | | | | |
6.38% due 04/01/215 | | | 450,000 | | | | 450,000 | |
Total Financial | | | | | | | 21,530,743 | |
| | | | | | | | | |
Technology - 0.5% | |
First Data Corp. | | | | | | | | |
5.00% due 01/15/245 | | | 6,250,000 | | | | 6,343,750 | |
5.75% due 01/15/245 | | | 5,200,000 | | | | 5,343,000 | |
NCR Corp. | | | | | | | | |
6.38% due 12/15/23 | | | 800,000 | | | | 846,000 | |
Micron Technology, Inc. | | | | | | | | |
5.25% due 08/01/235 | | | 450,000 | | | | 444,375 | |
Total Technology | | | | | | | 12,977,125 | |
| | | | | | | | | |
Utilities - 0.5% | |
AES Corp. | | | | | | | | |
3.84% due 06/01/196 | | | 2,608,000 | | | | 2,614,520 | |
6.00% due 05/15/26 | | | 2,000,000 | | | | 2,115,000 | |
5.50% due 04/15/25 | | | 1,150,000 | | | | 1,184,500 | |
Terraform Global Operating LLC | | | | | | | | |
13.75% due 08/15/225 | | | 4,600,000 | | | | 4,738,000 | |
SEE NOTES TO FINANCIAL STATEMENTS. | THE GUGGENHEIM FUNDS ANNUAL REPORT | 21 |
SCHEDULE OF INVESTMENTS (continued) | September 30, 2016 |
FLOATING RATE STRATEGIES FUND | |
| | | Face
Amount10 | | | Value | |
| | | | | | | |
LBC Tank Terminals Holding Netherlands BV | | | | | | |
6.88% due 05/15/235 | | $ | 630,000 | | | $ | 626,850 | |
Total Utilities | | | | | | | 11,278,870 | |
| | | | | | | | | |
Consumer, Cyclical - 0.3% | |
Ferrellgas Limited Partnership / Ferrellgas Finance Corp. | | | | | | | | |
6.50% due 05/01/21 | | | 4,615,000 | | | | 4,222,725 | |
WMG Acquisition Corp. | | | | | | | | |
6.75% due 04/15/225 | | | 2,280,000 | | | | 2,411,100 | |
Men’s Wearhouse, Inc. | | | | | | | | |
7.00% due 07/01/22 | | | 295,000 | | | | 274,350 | |
Total Consumer, Cyclical | | | | | | | 6,908,175 | |
| | | | | | | | | |
Basic Materials - 0.0% | |
Mirabela Nickel Ltd. | | | | | | | | |
2.38% due 06/24/19†††,1 | | | 1,279,819 | | | | 358,349 | |
1.00% due 09/10/44†††,1 | | | 25,570 | | | | — | |
Eldorado Gold Corp. | | | | | | | | |
6.13% due 12/15/205 | | | 265,000 | | | | 266,855 | |
Total Basic Materials | | | | | | | 625,204 | |
| | | | | | | | | |
Diversified - 0.0% | |
HRG Group, Inc. | | | | | | | | |
7.88% due 07/15/19 | | | 490,000 | | | | 516,338 | |
Total Corporate Bonds | | | | | | | | |
(Cost $171,811,861) | | | | | | | 169,347,178 | |
| | | | | | | | | |
ASSET-BACKED SECURITIES†† - 5.3% | |
Collateralized Loan Obligations - 3.0% | |
OHA Credit Partners IX Ltd. | | | | | | | | |
2013-9A, due 10/20/255,8 | | | 6,000,000 | | | | 5,252,464 | |
TICP CLO II Ltd. | | | | | | | | |
2014-2A, 5.45% due 07/20/265,6 | | | 6,560,000 | | | | 5,231,669 | |
PFP Ltd. | | | | | | |
2015-2, 3.43% due 07/14/345,6 | | | 5,000,000 | | | | 5,000,832 | |
ACIS CLO Ltd. | | | | | | | | |
2013-2A, 4.52% due 10/14/225,6 | | | 1,800,000 | | | | 1,756,672 | |
2013-1A, 5.18% due 04/18/245,6 | | | 1,000,000 | | | | 999,957 | |
2015-6A, 4.13% due 05/01/275,6 | | | 1,000,000 | | | | 985,106 | |
Golub Capital Partners CLO Ltd. | | | | | | | | |
2015-24A, 4.53% due 02/05/275,6 | | | 3,750,000 | | | | 3,731,537 | |
Avery | | | | | | | | |
2013-3X COM, due 01/18/258 | | | 4,300,020 | | | | 3,458,936 | |
Fortress Credit Opportunities VI CLO Ltd. | | | | | | | | |
2015-6A, 4.50% due 10/10/265,6 | | | 3,500,000 | | | | 3,440,237 | |
Fortress Credit Funding V, LP | | | | | | | | |
2015-5A, 4.47% due 08/15/225,6 | | | 3,500,000 | | | | 3,438,934 | |
Newstar Commercial Loan Funding LLC | | | | | | | | |
2013-1A, 5.41% due 09/20/235,6 | | | 2,750,000 | | | | 2,561,491 | |
2014-1A, 5.45% due 04/20/255,6 | | | 250,000 | | | | 227,534 | |
2013-1A, 6.16% due 09/20/235,6 | | | 250,000 | | | | 227,190 | |
OHA Credit Partners VIII Ltd. | | | | | | | | |
2013-8A, 5.10% due 04/20/255,6 | | | 3,225,000 | | | | 2,771,954 | |
Treman Park CLO Ltd. | | | | | | | | |
2015-1A, due 04/20/275,8 | | | 3,000,000 | | | | 2,685,162 | |
Halcyon Loan Advisors Funding Ltd. | | | | | | | | |
2012-1A, 3.82% due 08/15/235,6 | | | 2,600,000 | | | | 2,600,026 | |
22 | THE GUGGENHEIM FUNDS ANNUAL REPORT | SEE NOTES TO FINANCIAL STATEMENTS. |
SCHEDULE OF INVESTMENTS (continued) | September 30, 2016 |
FLOATING RATE STRATEGIES FUND | |
| | | Face
Amount | | | Value | |
| | | | | | | |
ALM XIV Ltd. | | | | | | |
2014-14A, 4.19% due 07/28/265,6 | | $ | 2,650,000 | | | $ | 2,584,164 | |
Fortress Credit Opportunities V CLO Ltd. | | | | | | | | |
2014-5A, 5.16% due 10/15/265,6 | | | 2,500,000 | | | | 2,331,782 | |
Shackleton I CLO Ltd. | | | | | | | | |
2012-1A, 4.12% due 08/14/235,6 | | | 2,000,000 | | | | 2,026,981 | |
Duane Street CLO IV Ltd. | | | | | | | | |
2007-4A, 3.07% due 11/14/215,6 | | | 2,000,000 | | | | 1,967,362 | |
Galaxy XVI CLO Ltd. | | | | | | | | |
2013-16A, 4.17% due 11/16/255,6 | | | 2,000,000 | | | | 1,857,102 | |
CIFC Funding Ltd. | | | | | | | | |
2014-1A, 5.18% due 04/18/255,6 | | | 2,000,000 | | | | 1,652,645 | |
DIVCORE CLO Ltd. | | | | | | | | |
2013-1A, 4.42% due 11/15/325,6 | | | 1,600,000 | | | | 1,585,060 | |
Dryden XXVIII Senior Loan Fund | | | | | | | | |
2013-28A, 3.52% due 08/15/255,6 | | | 1,500,000 | | | | 1,500,057 | |
MCF CLO I LLC | | | | | | | | |
2013-1A, 4.25% due 04/20/235,6 | | | 1,500,000 | | | | 1,442,702 | |
Cent CLO 22 Ltd. | | | | | | | | |
2014-22A, 6.09% due 11/07/265,6 | | | 1,500,000 | | | | 1,282,504 | |
Grayson CLO Ltd. | | | | | | | | |
2006-1A, 1.17% due 11/01/215,6 | | | 1,200,000 | | | | 1,152,539 | |
Cerberus Onshore II CLO LLC | | | | | | | | |
2014-1A, 4.68% due 10/15/235,6 | | | 600,000 | | | | 592,235 | |
2014-1A, 4.18% due 10/15/235,6 | | | 500,000 | | | | 497,705 | |
Telos CLO Ltd. | | | | | | | | |
2013-3A, 4.93% due 01/17/245,6 | | | 1,050,000 | | | | 1,045,500 | |
Gramercy Park CLO Ltd. | | | | | | | | |
2014-1A, 4.73% due 07/17/235,6 | | | 1,000,000 | | | | 1,001,751 | |
Venture XI CLO Ltd. | | | | | | | | |
2015-11A, 3.77% due 11/14/225,6 | | | 1,000,000 | | | | 1,000,010 | |
COA Summit CLO Limited | | | | | | | | |
2014-1A, 4.55% due 04/20/235,6 | | | 1,000,000 | | | | 985,357 | |
NewStar Commercial Loan Trust | | | | | | | | |
2007-1A, 2.13% due 09/30/225,6 | | | 500,000 | | | | 472,246 | |
2007-1A, 3.13% due 09/30/225,6 | | | 500,000 | | | | 459,592 | |
Shackleton II CLO Ltd. | | | | | | | | |
2012-2A, 4.75% due 10/20/235,6 | | | 750,000 | | | | 747,602 | |
Westchester CLO Ltd. | | | | | | | | |
2007-1A, 1.10% due 08/01/225,6 | | | 750,000 | | | | 734,582 | |
Ares XXVI CLO Ltd. | | | | | | | | |
2013-1A, due 04/15/255,8 | | | 1,250,000 | | | | 605,009 | |
NewStar Arlington Senior Loan Program LLC | | | | | | | | |
2014-1A, 4.01% due 07/25/255,6 | | | 600,000 | | | | 581,594 | |
Westwood CDO I Ltd. | | | | | | | | |
2007-1A, 1.53% due 03/25/215,6 | | | 500,000 | | | | 473,158 | |
Kingsland IV Ltd. | | | | | | | | |
2007-4A, 2.13% due 04/16/215,6 | | | 500,000 | | | | 469,100 | |
MCF CLO III LLC | | | | | | | | |
2014-3A, 3.42% due 01/20/245,6 | | | 500,000 | | | | 425,988 | |
Eastland CLO Ltd. | | | | | | | | |
2007-1A, 1.16% due 05/01/225,6 | | | 350,000 | | | | 330,642 | |
SEE NOTES TO FINANCIAL STATEMENTS. | THE GUGGENHEIM FUNDS ANNUAL REPORT | 23 |
SCHEDULE OF INVESTMENTS (continued) | September 30, 2016 |
FLOATING RATE STRATEGIES FUND | |
| | | Face
Amount | | | Value | |
| | | | | | | |
Great Lakes CLO Ltd. | | | | | | |
2014-1A, 4.88% due 04/15/255,6 | | $ | 250,000 | | | $ | 227,618 | |
Total Collateralized Loan Obligations | | | | 74,402,288 | |
| | | | | | | | | |
Credit Card - 1.0% | |
Capital One Multi-Asset Execution Trust | | | | | | | | |
2007-A5, 0.56% due 07/15/206 | | | 10,000,000 | | | | 9,991,048 | |
2015-A6, 0.89% due 06/15/206 | | | 9,000,000 | | | | 9,019,571 | |
Chase Issuance Trust | | | | | | | | |
2007-A12, 0.57% due 08/15/196 | | | 4,000,000 | | | | 3,998,586 | |
Credit Card Pass-Through Trust | | | | | | | | |
2012-BIZ, 0.00% due 12/15/495 | | | 101,483 | | | | 81,455 | |
Total Credit Card | | | | | | | 23,090,660 | |
| | | | | | | | | |
Collateralized Debt Obligations - 0.8% | |
Gramercy Real Estate CDO Ltd. | | | | | | | | |
2007-1A, 1.10% due 08/15/565,6 | | | 9,295,545 | | | | 8,776,450 | |
N-Star REL CDO VIII Ltd. | | | | | | | | |
2006-8A, 0.89% due 02/01/415,6 | | | 3,250,000 | | | | 3,154,740 | |
2006-8A, 0.82% due 02/01/415,6 | | | 63,731 | | | | 63,615 | |
Triaxx Prime CDO Ltd. | | | | | | | | |
2006-2A, 0.79% due 10/02/395,6 | | | 3,278,825 | | | | 3,122,742 | |
RAIT CRE CDO I Ltd. | | | | | | | | |
2006-1X A1B, 0.86% due 11/20/46 | | | 2,944,998 | | | | 2,846,901 | |
SRERS Funding Ltd. | | | | | | | | |
2011-RS, 0.76% due 05/09/465,6 | | | 399,568 | | | | 389,566 | |
Total Collateralized Debt Obligations | | | | 18,354,014 | |
| | | | | | | | | |
Automotive - 0.3% | |
AmeriCredit Automobile Receivables Trust | | | | | | | | |
2016-2, 1.22% due 10/08/196 | | | 7,000,000 | | | | 7,014,840 | |
| | | | | | | | | |
Transport-Aircraft - 0.2% | |
Castlelake Aircraft Securitization Trust | | | | | | | | |
2014-1, 5.25% due 02/15/295 | | | 2,181,423 | | | | 2,159,608 | |
2014-1, 7.50% due 02/15/295 | | | 1,596,347 | | | | 1,584,375 | |
Airplanes Pass Through Trust | | | | | | | | |
2001-1A, 1.07% due 03/15/196,11 | | | 1,620,327 | | | | 534,708 | |
Total Transport-Aircraft | | | | | | | 4,278,691 | |
Total Asset-Backed Securities | | | | | |
(Cost $125,670,569) | | | | | | | 127,140,493 | |
| | | | | | | | | |
COLLATERALIZED MORTGAGE OBLIGATION†† - 4.6% | |
Residential Mortgage-Backed Securities - 4.2% | |
LSTAR Securities Investment Trust | | | | | | | | |
2015-4, 2.52% due 04/01/205,6 | | | 12,168,490 | | | | 12,016,385 | |
2015-1, 2.53% due 01/01/205,6 | | | 6,862,865 | | | | 6,852,571 | |
2015-5, 2.53% due 04/01/205,6 | | | 5,577,635 | | | | 5,493,971 | |
2015-10, 2.52% due 11/01/205,6 | | | 2,896,498 | | | | 2,845,810 | |
RALI Series Trust | | | | | | | | |
2006-QO2, 0.75% due 02/25/466 | | | 9,167,139 | | | | 4,034,273 | |
2007-QO4, 0.72% due 05/25/476 | | | 3,763,544 | | | | 3,133,252 | |
2006-QO10, 0.68% due 01/25/376 | | | 3,675,181 | | | | 3,099,228 | |
Lehman XS Trust Series | | | | | | | | |
2007-15N, 0.77% due 08/25/376 | | | 6,188,827 | | | | 5,289,068 | |
2006-16N, 0.72% due 11/25/466 | | | 3,294,539 | | | | 2,715,251 | |
24 | THE GUGGENHEIM FUNDS ANNUAL REPORT | SEE NOTES TO FINANCIAL STATEMENTS. |
SCHEDULE OF INVESTMENTS (continued) | September 30, 2016 |
FLOATING RATE STRATEGIES FUND | |
| | | Face
Amount | | | Value | |
| | | | | | | |
GSAA Home Equity Trust | | | | | | |
2006-14, 0.70% due 09/25/366 | | $ | 12,202,446 | | | $ | 6,367,627 | |
2007-7, 0.80% due 07/25/376 | | | 991,248 | | | | 882,012 | |
Banc of America Funding Ltd. | | | | | | | | |
2013-R1, 0.71% due 11/03/415,6 | | | 6,374,822 | | | | 5,807,813 | |
American Home Mortgage Investment Trust | | | | | | | | |
2006-1, 0.92% due 03/25/466 | | | 6,422,626 | | | | 5,320,507 | |
IndyMac INDX Mortgage Loan Trust | | | | | | | | |
2006-AR4, 0.74% due 05/25/466 | | | 5,971,716 | | | | 4,907,824 | |
WaMu Mortgage Pass-Through Certificates Series Trust | | | | | | | | |
2007-OA6, 1.30% due 07/25/476 | | | 5,657,888 | | | | 4,741,149 | |
Structured Asset Securities Corporation Mortgage Loan Trust | | | | | | | | |
2006-OPT1, 0.79% due 04/25/366 | | | 3,769,259 | | | | 3,673,622 | |
2007-BC1, 0.66% due 02/25/376 | | | 860,953 | | | | 745,738 | |
Nomura Resecuritization Trust | | | | | | | | |
2015-4R, 1.31% due 03/26/365,6 | | | 2,564,056 | | | | 2,431,238 | |
2012-1R, 0.96% due 08/27/475,6 | | | 1,457,350 | | | | 1,437,384 | |
AJAX Mortgage Loan Trust | | | | | | | | |
2015-A, 3.88% due 11/25/545 | | | 3,504,759 | | | | 3,494,392 | |
American Home Mortgage Assets Trust | | | | | | | | |
2006-4, 0.73% due 10/25/466 | | | 5,026,101 | | | | 3,335,832 | |
Washington Mutual Mortgage Pass-Through Certificates WMALT Series Trust | | | | | | | | |
2006-AR9, 1.35% due 11/25/466 | | | 3,993,825 | | | | 2,865,301 | |
Wachovia Asset Securitization Issuance II LLC Trust | | | | | | | | |
2007-HE1, 0.67% due 07/25/375,6 | | | 3,173,541 | | | | 2,713,233 | |
GreenPoint Mortgage Funding Trust | | | | | | | | |
2005-HE4, 1.00% due 07/25/306 | | | 2,759,946 | | | | 2,695,837 | |
Merrill Lynch Alternative Note Asset Trust Series | | | | | | | | |
2007-OAR3, 0.72% due 07/25/376 | | | 2,752,901 | | | | 2,197,136 | |
Morgan Stanley Re-REMIC Trust | | | | | | | | |
2010-R5, 1.12% due 06/26/365,6 | | | 1,109,432 | | | | 803,647 | |
Alliance Bancorp Trust | | | | | | | | |
2007-OA1, 0.77% due 07/25/376 | | | 819,699 | | | | 597,676 | |
New Century Home Equity Loan Trust | | | | | | | | |
2004-4, 1.32% due 02/25/356 | | | 378,922 | | | | 314,143 | |
Total Residential Mortgage-Backed Securities | | | | 100,811,920 | |
| | | | | | | | | |
Commercial Mortgage-Backed Securities - 0.4% | |
GS Mortgage Securities Corporation Trust | | | | | | | | |
2016-ICE2, 9.02% due 02/15/335,6 | | | 10,000,000 | | | | 9,980,405 | |
Total Collateralized Mortgage Obligation | | | | | |
(Cost $110,557,339) | | | | | | | 110,792,325 | |
SEE NOTES TO FINANCIAL STATEMENTS. | THE GUGGENHEIM FUNDS ANNUAL REPORT | 25 |
SCHEDULE OF INVESTMENTS (continued) | September 30, 2016 |
FLOATING RATE STRATEGIES FUND | |
| | | Face
Amount | | | Value | |
| | | | | | | |
FEDERAL AGENCY DISCOUNT NOTES†† - 1.5% | |
Federal Home Loan Bank9 | | | | | | |
0.24% due 10/04/16 | | $ | 30,000,000 | | | $ | 29,999,400 | |
0.22% due 10/25/16 | | | 7,000,000 | | | | 6,998,973 | |
Total Federal Home Loan Bank | | | | 36,998,373 | |
Total Federal Agency Discount Notes | | | | | |
(Cost $36,998,373) | | | | | | | 36,998,373 | |
| | | | | | | | | |
SENIOR FIXED RATE INTERESTS†† - 0.5% | |
Communications - 0.3% | |
Lions Gate Entertainment Corp. | | | | | | | | |
5.00% due 03/17/22 | | | 7,780,000 | | | | 7,916,150 | |
| | | | | | | | | |
Consumer, Cyclical - 0.2% | |
Men’s Wearhouse, Inc. | | | | | | | | |
5.00% due 06/18/21 | | | 4,700,000 | | | | 4,582,500 | |
| | | | | | | | | |
Financial - 0.0% | |
Magic Newco, LLC | | | | | | | | |
12.00% due 06/12/19 | | | 500,000 | | | | 525,000 | |
| | | | | | | | | |
Consumer, Non-cyclical - 0.0% | |
Targus Group International, Inc. | | | | | | | | |
7.50% due 12/31/19†††,1 | | | 57,268 | | | | 80,078 | |
Total Senior Fixed Rate Interests | | | | | |
(Cost $13,048,535) | | | | | | | 13,103,728 | |
| | | | | | | | | |
COMMERCIAL PAPER†† - 9.3% | |
Nissan Motor Acceptance Corp. | | | | | | | | |
0.66% due 10/17/165 | | | 35,900,000 | | | | 35,889,381 | |
BAT International Finance PLC | | | | | | | | |
0.78% due 10/12/16 | | | 35,000,000 | | | | 34,991,658 | |
Omnicom Capital, Inc. | | | | | | | | |
0.62% due 10/25/16 | | | 22,000,000 | | | | 21,990,632 | |
Bemis, Inc. | | | | | | | | |
0.55% due 10/07/16 | | | 20,000,000 | | | | 19,998,167 | |
American Water Capital Corp. | | | | | | | | |
0.67% due 10/11/165 | | | 20,000,000 | | | | 19,996,278 | |
Ryder System, Inc. | | | | | | | | |
0.73% due 10/17/16 | | | 20,000,000 | | | | 19,993,511 | |
General Mills, Inc. | | | | | | | | |
0.62% due 10/13/16 | | | 17,770,000 | | | | 17,766,328 | |
Wal-Mart Stores, Inc. | | | | | | | | |
0.31% due 10/11/16 | | | 15,000,000 | | | | 14,998,708 | |
VF Corp.0.72% due 10/25/16 | | | 15,000,000 | | | | 14,992,800 | |
Campbell Soup Co. | | | | | | | | |
0.65% due 11/07/16 | | | 15,000,000 | | | | 14,989,979 | |
Kellogg Co. | | | | | | | | |
0.52% due 10/05/165 | | | 11,800,000 | | | | 11,799,318 | |
Total Commercial Paper (Cost $227,406,760) | | | | | | | 227,406,760 | |
Total Investments - 106.2% | | | | | |
(Cost $2,590,754,569) | | | | | | $ | 2,569,414,378 | |
Other Assets & Liabilities, net - (6.2)% | | | | (150,600,860 | ) |
Total Net Assets - 100.0% | | | $ | 2,418,813,518 | |
26 | THE GUGGENHEIM FUNDS ANNUAL REPORT | SEE NOTES TO FINANCIAL STATEMENTS. |
SCHEDULE OF INVESTMENTS (continued) | September 30, 2016 |
FLOATING RATE STRATEGIES FUND | |
FORWARD FOREIGN CURRENCY EXCHANGE CONTRACTS†† | |
Counterparty | | Contracts
to Buy
(Sell) | | Currency | Settlement
Date | | Settlement
Value | | | Value at
September 30,
2016 | | | Net
Unrealized
Appreciation/
(Depreciation) | |
Morgan Stanley | | | (17,897,000 | ) | GBP | 10/13/16 | | $ | 23,743,549 | | | $ | 23,205,565 | | | $ | 537,984 | |
Morgan Stanley | | | 3,170,000 | | EUR | 10/13/16 | | | (3,556,763 | ) | | | (3,562,639 | ) | | | 5,876 | |
J.P. Morgan | | | (70,232,000 | ) | EUR | 10/13/16 | | | 78,871,519 | | | | 78,930,997 | | | | (59,478 | ) |
| | | | | | | | | | | | | | | | | $ | 484,382 | |
* | Non-income producing security. |
† | Value determined based on Level 1 inputs, unless otherwise noted — See Note 4. |
†† | Value determined based on Level 2 inputs, unless otherwise noted — See Note 4. |
††† | Value determined based on Level 3 inputs — See Note 4. |
1 | Illiquid security. |
2 | Affiliated issuer — See Note 7. |
3 | Rate indicated is the 7 day yield as of September 30, 2016. |
4 | Security with no rate was unsettled at September 30, 2016. |
5 | Security is a 144A or Section 4(a)(2) security. These securities have been determined to be liquid under guidelines established by the Board of Trustees. The total market value of 144A or Section 4(a)(2) liquid securities is $281,560,436 (cost $280,647,647), or 11.6% of total net assets. |
6 | Variable rate security. Rate indicated is rate effective at September 30, 2016. |
7 | Security is in default of interest and/or principal obligations. |
8 | Security has no stated coupon. However, it is expected to receive residual cash flow payments on defined deal dates. |
9 | The issuer operates under a Congressional charter; its securities are neither issued nor guaranteed by the U.S. Government. |
10 | The face amount is denominated in U.S. dollars unless otherwise indicated. |
11 | Security is a 144A or Section 4(a)(2) security. These securities are considered illiquid and restricted under guidelines established by the Board of Trustees. The total market value of 144A or Section 4(a)(2) illiquid and restricted securities is $534,708 (cost $1,307,090), or less than 0.1% of total net assets — See Note 11. |
| | plc — Public Limited Company |
| | REIT — Real Estate Investment Trust |
| | |
| | See Sector Classification in Other Information section. |
SEE NOTES TO FINANCIAL STATEMENTS. | THE GUGGENHEIM FUNDS ANNUAL REPORT | 27 |
SCHEDULE OF INVESTMENTS (continued) | September 30, 2016 |
FLOATING RATE STRATEGIES FUND | |
The following table summarizes the inputs used to value the Fund’s investments at September 30, 2016 (See Note 4 in the Notes to Financial Statements):
Investments in Securities (Assets) | | Level 1 | | | Level 1 - Other* | | | Level 2 | | | Level 2 - Other* | | | Level 3 | | | Total | |
Asset-Backed Securities | | $ | — | | | $ | — | | | $ | 127,140,493 | | | $ | — | | | $ | — | | | $ | 127,140,493 | |
Collateralized Mortgage Obligations | | | — | | | | — | | | | 110,792,325 | | | | — | | | | — | | | | 110,792,325 | |
Commercial Paper | | | —— | | | | — | | | | 227,406,760 | | | | — | | | | — | | | | 227,406,760 | |
Common Stocks | | | 298,245 | | | | — | | | | — | | | | — | | | | 19,616 | | | | 317,861 | |
Corporate Bonds | | | — | | | | — | | | | 168,988,829 | | | | — | | | | 358,349 | | | | 169,347,178 | |
Forward Foreign Currency Exchange Contracts | | | — | | | | — | | | | — | | | | 543,860 | | | | — | | | | 543,860 | |
Federal Agency Discount Notes | | | — | | | | — | | | | 36,998,373 | | | | — | | | | — | | | | 36,998,373 | |
Mutual Funds | | | 25,547,323 | | | | — | | | | — | | | | — | | | | — | | | | 25,547,323 | |
Senior Fixed Rate Interests | | | — | | | | — | | | | 13,023,650 | | | | — | | | | 80,078 | | | | 13,103,728 | |
Senior Floating Rate Interests | | | — | | | | — | | | | 1,722,620,703 | | | | — | | | | 43,247,269 | | | | 1,765,867,972 | |
Short Term Investments | | | 92,892,365 | | | | — | | | | — | | | | — | | | | — | | | | 92,892,365 | |
Total | | $ | 118,737,933 | | | $ | — | | | $ | 2,406,971,133 | | | $ | 543,860 | | | $ | 43,705,312 | | | $ | 2,569,958,238 | |
Investments in Securities (Liabilities) | | Level 1 | | | Level 1 - Other* | | | Level 2 | | | Level 2 - Other* | | | Level 3 | | | Total | |
Forward Foreign Currency Exchange Contracts | | $ | — | | | $ | — | | | $ | — | | | $ | 59,478 | | | $ | — | | | $ | 59,478 | |
* | Other financial instruments include forward foreign currency contracts, which are reported as unrealized gain/loss at period end. |
28 | THE GUGGENHEIM FUNDS ANNUAL REPORT | SEE NOTES TO FINANCIAL STATEMENTS. |
SCHEDULE OF INVESTMENTS (continued) | September 30, 2016 |
FLOATING RATE STRATEGIES FUND | |
The following is a summary of significant unobservable inputs used in the fair valuation of assets and liabilities categorized within Level 3 of the fair value hierarchy:
Category | | Ending
Balance at 09/30/16 | | Valuation
Technique | Unobservable
Inputs | | Input
Range | |
Common Stocks | | $ | 19,252 | | Enterprise Value | Valuation Multiple | | | 5.5 | x |
Common Stocks | | | 364 | | Model Price | Liquidation value | | | — | |
Corporate Bonds | | | 358,349 | | Model Price | Liquidation value | | | — | |
Senior Fixed Rate Interests | | | 80,078 | | Enterprise Value | Valuation Multiple | | | 5.5 | x |
Senior Floating Rate Interests | | | 20,078,238 | | Model Price | Purchase Price | | | — | |
Senior Floating Rate Interests | | | 13,686,211 | | Option Adjusted Spread off the prior month end broker mark over the 3 month LIBOR | Indicative Quote | | | — | |
Senior Floating Rate Interests | | | 9,482,820 | | Enterprise Value | Valuation Multiple | | | 12.0 | x |
Total | | $ | 43,705,312 | | | | | | | |
Any remaining Level 3 securities held by the Fund and excluded from the table above, were not considered material to the Fund.
Transfers between investment levels may occur as the markets fluctuate and/or the availability of data used in an investment’s valuation changes. Transfers between valuation levels, if any, are in comparison to the valuation levels at the end of the previous fiscal year, and are effective using the fair value as of the end of the previous fiscal period.
As of September 30, 2016, the Fund had securities with a total value of $1,021,643 transfer into Level 3 from Level 2 and securities with a total value of $6,032,813 transfer out of Level 3 into Level 2 due to changes in the securities valuation method. There were no other securities that transferred between levels.
SEE NOTES TO FINANCIAL STATEMENTS. | THE GUGGENHEIM FUNDS ANNUAL REPORT | 29 |
SCHEDULE OF INVESTMENTS (concluded) | September 30, 2016 |
FLOATING RATE STRATEGIES FUND | |
Summary of Fair Value Level 3 Activity
Following is a reconciliation of Level 3 assets for which significant unobservable inputs were used to determine fair value for the year ended September 30, 2016:
LEVEL 3 - Fair value measurement using significant unobservable inputs
| | | Senior Floating Rate Interests | | | Common
Stocks | | | Corporate
Bonds | | | Senior Fixed Rate Interests | | | Total | |
FLOATING RATE STRATEGIES | | | | | | | | | | | | | | | |
Assets: | | | | | | | | | | | | | | | |
Beginning Balance | | $ | 52,904,389 | | | $ | 334 | | | $ | 1,543,530 | | | $ | 67,103 | | | $ | 54,515,356 | |
Purchases | | | 11,785,057 | | | | 17,820 | | | | (16,140 | ) | | | 68,845 | | | | 11,855,582 | |
Sales, maturities and paydowns | | | (14,314,694 | ) | | | — | | | | (1,026,000 | ) | | | (78,773 | ) | | | (15,419,467 | ) |
Total realized gains or losses included in earnings | | | (9,102 | ) | | | — | | | | (636,812 | ) | | | (62,389 | ) | | | (708,303 | ) |
Total change in unrealized gains or losses included in earnings | | | (2,107,211 | ) | | | 1,462 | | | | 493,771 | | | | 85,292 | | | | (1,526,686 | ) |
Transfers into Level 3 | | | 1,021,643 | | | | — | | | | — | | | | — | | | | 1,021,643 | |
Transfers out of Level 3 | | | (6,032,813 | ) | | | — | | | | — | | | | — | | | | (6,032,813 | ) |
Ending Balance | | $ | 43,247,269 | | | $ | 19,616 | | | $ | 358,349 | | | $ | 80,078 | | | $ | 43,705,312 | |
Net Change in unrealized appreciation (depreciation) for investments in securities still held at September 30, 2016 | | $ | (2,345,329 | ) | | $ | 1,432 | | | $ | (88,995 | ) | | $ | 11,234 | | | $ | (2,421,658 | ) |
30 | THE GUGGENHEIM FUNDS ANNUAL REPORT | SEE NOTES TO FINANCIAL STATEMENTS. |
STATEMENT OF ASSETS AND LIABILITIES |
FLOATING RATE STRATEGIES FUND |
September 30, 2016
Assets: | |
Investments in unaffiliated issuers, at value (cost $2,565,305,366) | | $ | 2,543,867,055 | |
Investments in affiliated issuers, at value (cost $25,449,203) | | | 25,547,323 | |
Total investments (cost $2,590,754,569) | | | 2,569,414,378 | |
Foreign currency, at value (cost $126,715) | | | 126,715 | |
Cash | | | 15,631,249 | |
Unrealized appreciation on forward foreign currency exchange contracts | | | 543,860 | |
Prepaid expenses | | | 103,030 | |
Receivables: | |
Securities sold | | | 295,541 | |
Fund shares sold | | | 10,771,000 | |
Dividends | | | 36,336 | |
Foreign taxes reclaim | | | 74,230 | |
Interest | | | 9,558,964 | |
Total assets | | | 2,606,555,303 | |
| | | | | |
Liabilities: | |
Unfunded loan commitments, at value (Note 8) (proceeds $4,310,505) | | | 2,199,518 | |
Segregated cash due to broker | | | 330,000 | |
Unrealized depreciation on forward foreign currency exchange contracts | | | 59,478 | |
Payable for: | |
Securities purchased | | | 176,673,438 | |
Fund shares redeemed | | | 5,237,972 | |
Distribution to shareholders | | | 1,134,403 | |
Management fees | | | 1,063,699 | |
Distribution and service fees | | | 277,529 | |
Transfer agent/maintenance fees | | | 266,469 | |
Fund accounting/administration fees | | | 183,694 | |
Trustees’ fees* | | | 42,682 | |
Miscellaneous | | | 272,903 | |
Total liabilities | | | 187,741,785 | |
Net assets | | $ | 2,418,813,518 | |
| | | | | |
Net assets consist of: | |
Paid in capital | | $ | 2,454,147,805 | |
Accumulated net investment loss | | | (743,658 | ) |
Accumulated net realized loss on investments | | | (15,769,303 | ) |
Net unrealized depreciation on investments | | | (18,821,326 | ) |
Net assets | | $ | 2,418,813,518 | |
| | | | | |
A-Class: | |
Net assets | | $ | 452,610,588 | |
Capital shares outstanding | | | 17,460,675 | |
Net asset value per share | | $ | 25.92 | |
Maximum offering price per share (Net asset value divided by 97.00%) | | $ | 26.72 | |
| | | | | |
C-Class: | |
Net assets | | $ | 197,296,434 | |
Capital shares outstanding | | | 7,614,141 | |
Net asset value per share | | $ | 25.91 | |
| | | | | |
P-Class: | |
Net assets | | $ | 124,974,094 | |
Capital shares outstanding | | | 4,818,820 | |
Net asset value per share | | $ | 25.93 | |
| | | | | |
Institutional Class: | |
Net assets | | $ | 1,643,932,402 | |
Capital shares outstanding | | | 63,364,523 | |
Net asset value per share | | $ | 25.94 | |
* | Relates to Trustees not deemed “interested persons” within the meaning of Section 2(a)(19) of the 1940 Act. |
SEE NOTES TO FINANCIAL STATEMENTS. | THE GUGGENHEIM FUNDS ANNUAL REPORT | 31 |
STATEMENT OF OPERATIONS |
FLOATING RATE STRATEGIES FUND |
Year Ended September 30, 2016
Investment Income: | |
Interest | | $ | 101,831,359 | |
Dividends from securities of affiliated issuers | | | 422,256 | |
Dividends from securities of unaffiliated issuers | | | 7,638 | |
Total investment income | | | 102,261,253 | |
| | | | | |
Expenses: | |
Management fees | | | 13,555,253 | |
Transfer agent/maintenance fees | |
A-Class | | | 607,122 | |
C-Class | | | 212,686 | |
P-Class | | | 3,098 | |
Institutional Class | | | 828,315 | |
Distribution and service fees: | |
A-Class | | | 1,044,782 | |
C-Class | | | 1,756,716 | |
P-Class | | | 201,466 | |
Fund accounting/administration fees | | | 1,981,126 | |
Line of credit fees | | | 255,091 | |
Trustees’ fees* | | | 120,085 | |
Custodian fees | | | 78,512 | |
Tax expense | | | 95 | |
Miscellaneous | | | 822,601 | |
Total expenses | | | 21,466,948 | |
Less: | |
Expenses waived by Adviser | | | (395,679 | ) |
Expenses waived by Transfer Agent | | | | |
A-Class | | | (576,417 | ) |
C-Class | | | (202,887 | ) |
P-Class | | | (376 | ) |
Institutional Class | | | (750,018 | ) |
Expenses waived by Distributor | | | | |
A-Class | | | (58,669 | ) |
C-Class | | | (19,485 | ) |
P-Class | | | (7,070 | ) |
Total waived expenses | | | (2,010,601 | ) |
Net expenses | | | 19,456,347 | |
Net investment income | | | 82,804,906 | |
| | | | | |
Net Realized and Unrealized Gain (Loss): | |
Net realized gain (loss) on: | |
Investments in unaffiliated issuers | | | (18,168,440 | ) |
Investments in affiliated issuers | | | (25,744 | ) |
Foreign currency | | | 1,448,865 | |
Forward foreign currency exchange contracts | | | 1,605,665 | |
Net realized loss | | | (15,139,654 | ) |
Net change in unrealized appreciation (depreciation) on: | |
Investments in unaffiliated issuers | | | 27,567,300 | |
Investments in affiliated issuers | | | 126,255 | |
Foreign currency | | | (103,714 | ) |
Forward foreign currency exchange contracts | | | 890,866 | |
Net change in unrealized appreciation (depreciation) | | | 28,480,707 | |
Net realized and unrealized gain | | | 13,341,053 | |
Net increase in net assets resulting from operations | | $ | 96,145,959 | |
* | Relates to Trustees not deemed “interested persons” within the meaning of Section 2(a)(19) of the 1940 Act. |
32 | THE GUGGENHEIM FUNDS ANNUAL REPORT | SEE NOTES TO FINANCIAL STATEMENTS. |
STATEMENTS OF CHANGES IN NET ASSETS |
FLOATING RATE STRATEGIES FUND | |
| | | Year Ended
September 30,
2016 | | | Year Ended
September 30,
2015 | |
Increase (Decrease) in Net Assets from Operations: | | | | | | |
Net investment income | | $ | 82,804,906 | | | $ | 57,257,242 | |
Net realized gain (loss) on investments | | | (15,139,654 | ) | | | 12,472,163 | |
Net change in unrealized appreciation (depreciation) on investments | | | 28,480,707 | | | | (41,312,890 | ) |
Net increase in net assets resulting from operations | | | 96,145,959 | | | | 28,416,515 | |
| | | | | | | | | |
Distributions to shareholders from: | | | | | | | | |
Net investment income | | | | | | | | |
A-Class | | | (17,533,970 | ) | | | (14,747,792 | ) |
C-Class | | | (6,005,382 | ) | | | (4,776,563 | ) |
P-Class | | | (3,269,505 | ) | | | (100,000 | )* |
Institutional Class | | | (62,586,943 | ) | | | (43,675,370 | ) |
Net realized gains | | | | | | | | |
A-Class | | | — | | | | (968,588 | ) |
C-Class | | | — | | | | (397,766 | ) |
Institutional Class | | | — | | | | (2,326,328 | ) |
Total distributions to shareholders | | | (89,395,800 | ) | | | (66,992,407 | ) |
| | | | | | | | | |
Capital share transactions: | | | | | | | | |
Proceeds from sale of shares | | | | | | | | |
A-Class | | | 328,587,677 | | | | 269,729,701 | |
C-Class | | | 93,383,014 | | | | 61,495,860 | |
P-Class | | | 130,565,954 | | | | 21,013,826 | * |
Institutional Class | | | 1,293,714,252 | | | | 920,575,822 | |
Distributions reinvested | | | | | | | | |
A-Class | | | 15,307,772 | | | | 12,878,840 | |
C-Class | | | 4,886,193 | | | | 4,256,809 | |
P-Class | | | 3,269,505 | | | | 99,953 | * |
Institutional Class | | | 50,783,545 | | | | 37,311,662 | |
Cost of shares redeemed | | | | | | | | |
A-Class | | | (292,937,913 | ) | | | (238,118,241 | ) |
C-Class | | | (47,794,125 | ) | | | (48,812,351 | ) |
P-Class | | | (30,899,865 | ) | | | (368,247 | )* |
Institutional Class | | | (934,769,638 | ) | | | (454,573,514 | ) |
Net increase from capital share transactions | | | 614,096,371 | | | | 585,490,120 | |
Net increase in net assets | | | 620,846,530 | | | | 546,914,228 | |
| | | | | | | | | |
Net assets: | | | | | | | | |
Beginning of year | | | 1,797,966,988 | | | | 1,251,052,760 | |
End of year | | $ | 2,418,813,518 | | | $ | 1,797,966,988 | |
Accumulated net investment loss at end of year | | $ | (743,658 | ) | | $ | (5,002,242 | ) |
SEE NOTES TO FINANCIAL STATEMENTS. | THE GUGGENHEIM FUNDS ANNUAL REPORT | 33 |
STATEMENTS OF CHANGES IN NET ASSETS (concluded) |
FLOATING RATE STRATEGIES FUND | |
| | | Year Ended
September 30,
2016 | | | Year Ended
September 30,
2015 | |
Capital share activity: | | | | | | |
Shares sold | | | | | | |
A-Class | | | 12,898,402 | | | | 10,278,287 | |
C-Class | | | 3,665,393 | | | | 2,343,633 | |
P-Class | | | 5,115,313 | | | | 803,544 | * |
Institutional Class | | | 50,648,724 | | | | 35,050,422 | |
Shares issued from reinvestment of distributions | | | | | | | | |
A-Class | | | 600,582 | | | | 491,118 | |
C-Class | | | 191,843 | | | | 162,389 | |
P-Class | | | 128,540 | | | | 3,839 | * |
Institutional Class | | | 1,990,689 | | | | 1,421,995 | |
Shares redeemed | | | | | | | | |
A-Class | | | (11,505,029 | ) | | | (9,071,267 | ) |
C-Class | | | (1,879,755 | ) | | | (1,862,040 | ) |
P-Class | | | (1,218,323 | ) | | | (14,093 | )* |
Institutional Class | | | (36,817,913 | ) | | | (17,315,843 | ) |
Net increase in shares | | | 23,818,466 | | | | 22,291,984 | |
* | Since commencement of operations: May 1, 2015 |
34 | THE GUGGENHEIM FUNDS ANNUAL REPORT | SEE NOTES TO FINANCIAL STATEMENTS. |
FINANCIAL HIGHLIGHTS |
FLOATING RATE STRATEGIES FUND | |
This table is presented to show selected data for a share outstanding throughout each period and to assist shareholders in evaluating a Fund’s performance for the periods presented.
A-Class | | Year Ended
Sept. 30,
2016 | | | Year Ended
Sept. 30,
2015 | | | Year Ended
Sept. 30,
2014 | | | Year Ended
Sept. 30,
2013 | | | Period Ended
Sept. 30,
2012a | |
Per Share Data | | | | | | | | | | | | | | | |
Net asset value, beginning of period | | $ | 25.88 | | | $ | 26.52 | | | $ | 26.62 | | | $ | 26.10 | | | $ | 25.00 | |
Income (loss) from investment operations: | |
Net investment income (loss)b | | | .99 | | | | 1.04 | | | | 1.10 | | | | 1.30 | | | | 1.09 | |
Net gain (loss) on investments (realized and unrealized) | | | .12 | | | | (.42 | ) | | | .05 | | | | .65 | | | | .97 | |
Total from investment operations | | | 1.11 | | | | .62 | | | | 1.15 | | | | 1.95 | | | | 2.06 | |
Less distributions from: | |
Net investment income | | | (1.07 | ) | | | (1.18 | ) | | | (1.20 | ) | | | (1.37 | ) | | | (.96 | ) |
Net realized gains | | | — | | | | (.08 | ) | | | (.05 | ) | | | (.06 | ) | | | — | |
Total distributions | | | (1.07 | ) | | | (1.26 | ) | | | (1.25 | ) | | | (1.43 | ) | | | (.96 | ) |
Net asset value, end of period | | $ | 25.92 | | | $ | 25.88 | | | $ | 26.52 | | | $ | 26.62 | | | $ | 26.10 | |
| | |
Total Returne | | | 4.47 | % | | | 2.36 | % | | | 4.42 | % | | | 7.61 | % | | | 8.37 | % |
Ratios/Supplemental Data | |
Net assets, end of period (in thousands) | | $ | 452,611 | | | $ | 400,270 | | | $ | 365,207 | | | $ | 378,324 | | | $ | 44,175 | |
Ratios to average net assets: | |
Net investment income (loss) | | | 3.88 | % | | | 3.97 | % | | | 4.10 | % | | | 4.90 | % | | | 5.13 | % |
Total expensesc | | | 1.20 | % | | | 1.19 | % | | | 1.18 | % | | | 1.19 | % | | | 1.39 | % |
Net expensesd,g | | | 1.03 | % | | | 1.03 | % | | | 1.04 | % | | | 1.05 | % | | | 1.06 | % |
Portfolio turnover rate | | | 35 | % | | | 44 | % | | | 58 | % | | | 50 | % | | | 61 | % |
SEE NOTES TO FINANCIAL STATEMENTS. | THE GUGGENHEIM FUNDS ANNUAL REPORT | 35 |
FINANCIAL HIGHLIGHTS (continued) |
FLOATING RATE STRATEGIES FUND | |
This table is presented to show selected data for a share outstanding throughout each period and to assist shareholders in evaluating a Fund’s performance for the periods presented.
C-Class | | Year Ended
Sept. 30,
2016 | | | Year Ended
Sept. 30,
2015 | | | Year Ended
Sept. 30,
2014 | | | Year Ended
Sept. 30,
2013 | | | Period Ended
Sept. 30,
2012a | |
Per Share Data | | | | | | | | | | | | | | | |
Net asset value, beginning of period | | $ | 25.87 | | | $ | 26.51 | | | $ | 26.60 | | | $ | 26.09 | | | $ | 25.00 | |
Income (loss) from investment operations: | |
Net investment income (loss)b | | | .80 | | | | .85 | | | | .90 | | | | 1.11 | | | | .93 | |
Net gain (loss) on investments (realized and unrealized) | | | .12 | | | | (.43 | ) | | | .06 | | | | .63 | | | | .98 | |
Total from investment operations | | | .92 | | | | .42 | | | | .96 | | | | 1.74 | | | | 1.91 | |
Less distributions from: | |
Net investment income | | | (.88 | ) | | | (.98 | ) | | | (1.00 | ) | | | (1.17 | ) | | | (.82 | ) |
Net realized gains | | | — | | | | (.08 | ) | | | (.05 | ) | | | (.06 | ) | | | — | |
Total distributions | | | (.88 | ) | | | (1.06 | ) | | | (1.05 | ) | | | (1.23 | ) | | | (.82 | ) |
Net asset value, end of period | | $ | 25.91 | | | $ | 25.87 | | | $ | 26.51 | | | $ | 26.60 | | | $ | 26.09 | |
| | |
Total Returne | | | 3.68 | % | | | 1.63 | % | | | 3.64 | % | | | 6.77 | % | | | 7.72 | % |
Ratios/Supplemental Data | |
Net assets, end of period (in thousands) | | $ | 197,296 | | | $ | 145,808 | | | $ | 132,370 | | | $ | 120,606 | | | $ | 24,358 | |
Ratios to average net assets: | |
Net investment income (loss) | | | 3.13 | % | | | 3.23 | % | | | 3.35 | % | | | 4.19 | % | | | 4.36 | % |
Total expensesc | | | 1.93 | % | | | 1.91 | % | | | 1.89 | % | | | 1.93 | % | | | 2.06 | % |
Net expensesd,g | | | 1.78 | % | | | 1.78 | % | | | 1.79 | % | | | 1.81 | % | | | 1.80 | % |
Portfolio turnover rate | | | 35 | % | | | 44 | % | | | 58 | % | | | 50 | % | | | 61 | % |
36 | THE GUGGENHEIM FUNDS ANNUAL REPORT | SEE NOTES TO FINANCIAL STATEMENTS. |
FINANCIAL HIGHLIGHTS (continued) |
FLOATING RATE STRATEGIES FUND |
This table is presented to show selected data for a share outstanding throughout each period and to assist shareholders in evaluating a Fund’s performance for the periods presented.
P-Class | | Year Ended
Sept. 30,
2016 | | | Period Ended
Sept. 30,
2015f | |
Per Share Data | | | | | | |
Net asset value, beginning of period | | $ | 25.89 | | | $ | 26.37 | |
Income (loss) from investment operations: | |
Net investment income (loss)b | | | .99 | | | | .40 | |
Net gain (loss) on investments (realized and unrealized) | | | .12 | | | | (.46 | ) |
Total from investment operations | | | 1.11 | | | | (.06 | ) |
Less distributions from: | |
Net investment income | | | (1.07 | ) | | | (.42 | ) |
Total distributions | | | (1.07 | ) | | | (.42 | ) |
Net asset value, end of period | | $ | 25.93 | | | $ | 25.89 | |
| | |
Total Returne | | | 4.46 | % | | | (0.24 | %) |
Ratios/Supplemental Data | |
Net assets, end of period (in thousands) | | $ | 124,974 | | | $ | 20,536 | |
Ratios to average net assets: | |
Net investment income (loss) | | | 3.86 | % | | | 3.68 | % |
Total expensesc | | | 1.06 | % | | | 1.04 | % |
Net expensesd,g | | | 1.03 | % | | | 1.02 | % |
Portfolio turnover rate | | | 35 | % | | | 44 | % |
SEE NOTES TO FINANCIAL STATEMENTS. | THE GUGGENHEIM FUNDS ANNUAL REPORT | 37 |
FINANCIAL HIGHLIGHTS (concluded) |
FLOATING RATE STRATEGIES FUND |
This table is presented to show selected data for a share outstanding throughout each period and to assist shareholders in evaluating a Fund’s performance for the periods presented.
Institutional Class | | Year Ended
Sept. 30,
2016 | | | Year Ended
Sept. 30,
2015 | | | Year Ended
Sept. 30,
2014 | | | Year Ended
Sept. 30,
2013 | | | Period Ended
Sept. 30,
2012a | |
Per Share Data | | | | | | | | | | | | | | | |
Net asset value, beginning of period | | $ | 25.90 | | | $ | 26.54 | | | $ | 26.64 | | | $ | 26.12 | | | $ | 25.00 | |
Income (loss) from investment operations: | |
Net investment income (loss)b | | | 1.05 | | | | 1.10 | | | | 1.16 | | | | 1.36 | | | | 1.10 | |
Net gain (loss) on investments (realized and unrealized) | | | .12 | | | | (.42 | ) | | | .06 | | | | .65 | | | | 1.02 | |
Total from investment operations | | | 1.17 | | | | .68 | | | | 1.22 | | | | 2.01 | | | | 2.12 | |
Less distributions from: | |
Net investment income | | | (1.13 | ) | | | (1.24 | ) | | | (1.27 | ) | | | (1.43 | ) | | | (1.00 | ) |
Net realized gains | | | — | | | | (.08 | ) | | | (.05 | ) | | | (.06 | ) | | | — | |
Total distributions | | | (1.13 | ) | | | (1.32 | ) | | | (1.32 | ) | | | (1.49 | ) | | | (1.00 | ) |
Net asset value, end of period | | $ | 25.94 | | | $ | 25.90 | | | $ | 26.54 | | | $ | 26.64 | | | $ | 26.12 | |
| | |
Total Returne | | | 4.71 | % | | | 2.59 | % | | | 4.67 | % | | | 7.86 | % | | | 8.59 | % |
Ratios/Supplemental Data | |
Net assets, end of period (in thousands) | | $ | 1,643,932 | | | $ | 1,231,352 | | | $ | 753,476 | | | $ | 457,813 | | | $ | 72,197 | |
Ratios to average net assets: | |
Net investment income (loss) | | | 4.11 | % | | | 4.18 | % | | | 4.32 | % | | | 5.12 | % | | | 5.16 | % |
Total expensesc | | | 0.87 | % | | | 0.85 | % | | | 0.87 | % | | | 0.86 | % | | | 0.99 | % |
Net expensesd,g | | | 0.79 | % | | | 0.79 | % | | | 0.80 | % | | | 0.81 | % | | | 0.80 | % |
Portfolio turnover rate | | | 35 | % | | | 44 | % | | | 58 | % | | | 50 | % | | | 61 | % |
a | Since commencement of operations: November 30, 2011. Percentage amounts for the period, except total return and portfolio turnover rate, have been annualized. |
b | Net investment income (loss) per share was computed using average shares outstanding throughout the period. |
c | Does not include expenses of the underlying funds in which the Fund invests. |
d | Net expense information reflects the expense ratios after expense waivers. |
e | Total return does not reflect the impact of any applicable sales charges and has not been annualized. |
f | Since commencement of operations: May 1, 2015. Percentage amounts for the period, except total return and portfolio turnover rate, have been annualized. |
g | Net expenses may include expenses that are excluded from the expense limitation agreement. Excluding these expenses the operating expense ratios for the periods would be: |
| | | 09/30/16 | 09/30/15 | 09/30/14 | 09/30/13 | 09/30/12 |
| | A-Class | 1.02% | 1.02% | 1.02% | 1.03% | 1.01% |
| | C-Class | 1.77% | 1.77% | 1.77% | 1.78% | 1.76% |
| | P-Class | 1.02% | 1.01% | N/A | N/A | N/A |
| | Institutional Class | 0.78% | 0.78% | 0.78% | 0.79% | 0.77% |
38 | THE GUGGENHEIM FUNDS ANNUAL REPORT | SEE NOTES TO FINANCIAL STATEMENTS. |
NOTES TO FINANCIAL STATEMENTS |
1. Organization and Significant Accounting Policies
Organization
Guggenheim Funds Trust (the “Trust”), a Delaware statutory trust, is registered with the SEC under the Investment Company Act of 1940 (“1940 Act”), as an open-ended investment company of the series type. Each series, in effect, is representing a separate Fund. The Trust is authorized to issue an unlimited number of shares. The Trust accounts for the assets of each Fund separately.
The Trust offers a combination of four separate classes of shares, A-Class shares, C-Class shares, P-Class shares and Institutional Class shares. Sales of shares of each Class are made without a front-end sales charge at the net asset value per share (“NAV”), with the exception of A-Class shares. A-Class shares are sold at the NAV, plus the applicable front-end sales charge. The sales charge varies depending on the amount purchased, but will not exceed 3.00%. A-Class share purchases of $1 million or more are exempt from the front-end sales charge but have a 1% contingent deferred sales charge (“CDSC”), if shares are redeemed within 12 months of purchase. C-Class shares have a 1% CDSC if shares are redeemed within 12 months of purchase. Institutional Class shares are offered primarily for direct investment by institutions such as pension and profit sharing plans, endowments, foundations and corporations. Institutional Class shares require a minimum initial investment of $2 million and a minimum account balance of $1 million. At September 30, 2016, the Trust consisted of nineteen funds (the “Funds”).
This report covers the Floating Rate Strategies Fund (the “Fund”), a diversified investment company.
Guggenheim Investments (“GI”) provides advisory services, and Rydex Fund Services, LLC (“RFS”) provides transfer agent, administrative and accounting services to the Trust. Guggenheim Funds Distributors, LLC (“GFD”) acts as principal underwriter for the Trust. GI and GFD are affiliated entities; RFS ceased to be an affiliate of GI as of October 4, 2016, when it was acquired by MUFG Investor Services. In connection with its acquisition, RFS changed its name to MUFG Investor Services (US), LLC (“MUIS”). This change has no impact on the financial statements of the Fund.
Significant Accounting Policies
The Fund operates as an investment company and, accordingly, follows the investment company accounting and reporting guidance of the Financial Accounting Standards Board (“FASB”) Accounting Standards Codification Topic 946 Financial Services – Investment Companies.
The following significant accounting policies are in conformity with U.S. generally accepted accounting principles (“U.S. GAAP”) and are consistently followed by the Trust. This requires management to make estimates and assumptions that affect the reported amount of assets and liabilities, contingent assets and liabilities at the date of the financial statements, and the reported amounts of revenues and expenses during the reporting period. Actual results could differ from these estimates. All time references are based on Eastern Time.
| | THE GUGGENHEIM FUNDS ANNUAL REPORT | 39 |
NOTES TO FINANCIAL STATEMENTS (continued) |
The NAV of each Class of the Fund is calculated by dividing the market value of the Fund’s securities and other assets, less all liabilities, attributable to the Class by the number of outstanding shares of the Class.
A. The Board of Trustees of the Fund (the “Board”) has adopted policies and procedures for the valuation of the Fund’s investments (the “Valuation Procedures”). Pursuant to the Valuation Procedures, the Board has delegated to a valuation committee, consisting of representatives from Guggenheim’s investment management, fund administration, legal and compliance departments (the “Valuation Committee”), the day-to-day responsibility for implementing the Valuation Procedures, including, under most circumstances, the responsibility for determining the fair value of the Fund’s securities and/or other assets.
Valuations of the Fund’s securities are supplied primarily by pricing services appointed pursuant to the processes set forth in the Valuation Procedures. The Valuation Committee convenes monthly, or more frequently as needed, to review the valuation of all assets which have been fair valued for reasonableness. The Fund’s officers, through the Valuation Committee and consistent with the monitoring and review responsibilities set forth in the Valuation Procedures, regularly review procedures used and valuations provided by the pricing services.
If the pricing service cannot or does not provide a valuation for a particular investment or such valuation is deemed unreliable, such investment is fair valued by the Valuation Committee.
Equity securities listed on an exchange (New York Stock Exchange (“NYSE”) or American Stock Exchange) are valued at the last quoted sales price as of the close of business on the NYSE, usually 4:00 p.m. on the valuation date. Equity securities listed on the NASDAQ market system are valued at the NASDAQ Official Closing Price on the valuation date, which may not necessarily represent the last sale price. If there has been no sale on such exchange or NASDAQ on a given day, the security is valued at the closing bid price on that day.
Generally, trading in foreign securities markets is substantially completed each day at various times prior to the close of the NYSE. The values of foreign securities are determined as of the close of such foreign markets or the close of the NYSE, if earlier. All investments quoted in foreign currencies are valued in U.S. dollars on the basis of the foreign currency exchange rates prevailing at the close of business. Investments in foreign securities may involve risks not present in domestic investments. The Valuation Committee will determine the current value of such foreign securities by taking into consideration certain factors which may include those discussed above, as well as the following factors, among others: the value of the securities traded on other foreign markets, ADR trading, closed-end fund trading, foreign currency exchange activity, and the trading prices of financial products that are tied to foreign securities. In addition, the Board has authorized the Valuation Committee and GI to use prices and other information supplied by a third party pricing vendor in valuing foreign securities.
40 | THE GUGGENHEIM FUNDS ANNUAL REPORT | |
NOTES TO FINANCIAL STATEMENTS (continued) |
Open-end investment companies (“mutual funds”) are valued at their NAV as of the close of business, on the valuation date. Exchange-traded funds (“ETFs”) and closed-end investment companies (“CEFs”) are valued at the last quoted sales price.
Debt securities with a maturity of greater than 60 days at acquisition are valued at prices that reflect broker-dealer supplied valuations or are obtained from independent pricing services, which may consider the trade activity, treasury spreads, yields or price of bonds of comparable quality, coupon, maturity, and type, as well as prices quoted by dealers who make markets in such securities. Short-term debt securities with a maturity of 60 days or less at acquisition are valued at amortized cost, provided such amount approximates market value.
Typically, loans are valued using information provided by an independent third party pricing service which uses broker quotes in a non-active market.
Investments for which market quotations are not readily available are fair valued as determined in good faith by GI under the direction of the Board using methods established or ratified by the Board. Valuations in accordance with these methods are intended to reflect each security’s (or asset’s) “fair value.” Each such determination is based on a consideration of all relevant factors, which are likely to vary from one pricing context to another. Examples of such factors may include, but are not limited to: market prices; sale prices; broker quotes; and models which derive prices based on inputs such as prices of securities with comparable maturities and characteristics, or based on inputs such as anticipated cash flows or collateral, spread over Treasuries, and other information analysis.
B. Senior loans in which the Fund invests generally pay interest rates which are periodically adjusted by reference to a base short-term floating rate, plus a premium. These base lending rates are generally (i) the lending rate offered by one or more major European banks, such as the one-month or three-month London Inter-Bank Offered Rate (LIBOR), (ii) the prime rate offered by one or more major United States banks, or (iii) the bank’s certificate of deposit rate. Senior floating rate interests often require prepayments from excess cash flows or permit the borrower to repay at its election. The rate at which the borrower repays cannot be predicted with accuracy. As a result, the actual remaining maturity may be substantially less than the stated maturities shown. The interest rate indicated is the rate in effect at September 30, 2016.
C. The Fund may purchase and sell interests in securities on a when-issued and delayed delivery basis, with payment and delivery scheduled for a future date. No income accrues to the Fund on such interests or securities in connection with such transactions prior to the date the Fund actually take delivery of such interests or securities. These transactions are subject to market fluctuations and are subject to the risk that the value at delivery may be more or less than the trade date purchase price. Although the Fund will generally purchase these securities with the intention of acquiring such securities, they may sell such securities before the settlement date.
| | THE GUGGENHEIM FUNDS ANNUAL REPORT | 41 |
NOTES TO FINANCIAL STATEMENTS (continued) |
D. Forward foreign currency exchange contracts are valued daily based on the applicable exchange rate of the underlying currency. The change in value of the contract is recorded as unrealized appreciation or depreciation until the contract is closed. When the contract is closed, the Fund records a realized gain or loss equal to the difference between the value at the time the contract was opened and the value at the time it was closed.
E. Security transactions are recorded on the trade date for financial reporting purposes. Realized gains and losses from securities transactions are recorded using the identified cost basis. Proceeds from lawsuits related to investment holdings are recorded as realized gains in the Fund. Dividend income is recorded on the ex-dividend date, net of applicable taxes withheld by foreign countries. Taxable non-cash dividends are recorded as dividend income. Interest income, including amortization of premiums and accretion of discounts, is accrued on a daily basis. Interest income also includes paydown gains and losses on mortgage-backed and asset-backed securities and senior and subordinated loans. Amendment fees are earned as compensation for evaluating and accepting changes to the original loan agreement and are recognized when received. Dividend income from REITs is recorded based on the income included in the distributions received from the REIT investments using published REIT classifications, including some management estimates when actual amounts are not available. Distributions received in excess of this estimated amount are recorded as a reduction of the cost of investments or reclassified to capital gains. The actual amounts of income, return of capital, and capital gains are only determined by each REIT after its fiscal year-end, and may differ from the estimated amounts.
F. The Fund declares dividends from investment income daily. The Fund pays its shareholders from its net investment income monthly and distributes any net capital gains that it has realized, at least annually. Distributions to shareholders are recorded on the ex-dividend date. Dividends are reinvested in additional shares unless shareholders request payment in cash. The character of distributions made during the year from net investment income or net realized gains may differ from their ultimate characterization for federal income tax purposes.
G. Interest and dividend income, most expenses, all realized gains and losses, and all unrealized gains and losses are allocated to the classes based upon the value of the outstanding shares in each Class. Certain costs, such as distribution and service fees are charged directly to specific classes. In addition, certain expenses have been allocated to the individual Funds in the Trust on a pro rata basis upon the respective aggregate net assets of each Fund included in the Trust.
H. Under the fee arrangement with the custodian, the Fund may earn credits based on overnight custody cash balances. These credits are utilized to reduce related custodial expenses. The custodian fees disclosed in the Statement of Operations are before the reduction in expense from the related earnings credits, if any. For the year ended September 30, 2016, there were no earnings credits received.
42 | THE GUGGENHEIM FUNDS ANNUAL REPORT | |
NOTES TO FINANCIAL STATEMENTS (continued) |
I. The Fund may leave cash overnight in its cash account with the custodian. Periodically, the Fund may have cash due to the custodian bank as an overdraft balance. A fee is incurred on this overdraft, calculated by multiplying the overdraft by a rate based on the federal funds rate, which was 0.29% at September 30, 2016.
J. The accounting records of the Fund are maintained in U.S. dollars. All assets and liabilities initially expressed in foreign currencies are converted into U.S. dollars at prevailing exchange rates. Purchases and sales of investment securities, dividend and interest income, and certain expenses are translated at the rates of exchange prevailing on the respective dates of such transactions. Changes in the relationship of these foreign currencies to the U.S. dollar can significantly affect the value of the investments and earnings of the Funds. Foreign investments may also subject the Fund to foreign government exchange restrictions, expropriation, taxation or other political, social or economic developments, all ofwhich could affect the market and/or credit risk of the investments.
The Fund does not isolate that portion of the results of operations resulting from changes in the foreign exchange rates on investments from the fluctuations arising from changes in the market prices of securities held. Such fluctuations are included with the net realized and unrealized gain or loss on investments.
Reported net realized foreign exchange gains and losses arise from sales of foreign currencies and currency gains or losses realized between the trade and settlement dates on investment transactions. Net unrealized exchange gains and losses arise from changes in the fair values of assets and liabilities other than investments in securities at the fiscal period end, resulting from changes in exchange rates.
K. Under the Fund’s organizational documents, its Trustees and Officers are indemnified against certain liabilities arising out of the performance of their duties to the Trust. In addition, throughout the normal course of business, the Fund enters into contracts that contain a variety of representations and warranties which provide general indemnifications. The Fund’s maximum exposure under these arrangements is unknown, as this would involve future claims that may be made against the Fund and/or its affiliates that have not yet occurred. However, based on experience, the Fund expects the risk of loss to be remote.
2. Financial Instruments and Derivatives
As part of its investment strategy, the Fund utilizes a variety of derivative instruments. These investments involve, to varying degrees, elements of market risk and risks in excess of the amounts recognized in the Statement of Assets and Liabilities. Valuation and accounting treatment of these instruments can be found under Significant Accounting Policies in Note 1 of these Notes to Financial Statements.
| | THE GUGGENHEIM FUNDS ANNUAL REPORT | 43 |
NOTES TO FINANCIAL STATEMENTS (continued) |
Derivatives
Derivatives are instruments whose values depend on, or are derived from, in whole or in part, the value of one or more other assets, such as securities, currencies, commodities or indices. Derivative instruments may be used to increase investment flexibility (including to maintain cash reserves while maintaining exposure to certain other assets), for risk management (hedging) purposes, to facilitate trading, to reduce transaction costs and to pursue higher investment returns. Derivative instruments may also be used to mitigate certain investment risks, such as foreign currency exchange rate risk, interest rate risk and credit risk. U.S. GAAP requires disclosures to enable investors to better understand how and why a Fund uses derivative instruments, how these derivative instruments are accounted for and their effects on the Fund’s financial position and results of operations.
The Fund may utilize derivatives for the following purposes:
Hedge: an investment made in order to reduce the risk of adverse price movements in a security, by taking an offsetting position to protect against broad market moves.
Forward Foreign Currency Exchange Contracts
A forward foreign currency exchange contract is an agreement between two parties to exchange two designated currencies at a specific time in the future. Certain types of contracts may be cash settled, in an amount equal to the change in exchange rates during the term of the contract. The contracts can be used to hedge or manage exposure to foreign currency risks with portfolio investments or to gain exposure to foreign currencies.
The market value of a forward foreign currency exchange contract changes with fluctuations in foreign currency exchange rates. Furthermore, the Fund may be exposed to risk if the counterparties cannot meet the contract terms or if the currency value changes unfavorably as compared to the U.S. dollar.
The following table represents the Fund’s use and volume of forward currency exchange contracts on a quarterly basis:
| | | | Average Settlement | |
Fund | Use | | Purchased | | | Sold | |
Floating Rate Strategies Fund | Hedge | | $ | 103,230,752 | | | $ | 2,060,024 | |
44 | THE GUGGENHEIM FUNDS ANNUAL REPORT | |
NOTES TO FINANCIAL STATEMENTS (continued) |
Derivative Investment Holdings Categorized by Risk Exposure
The following is a summary of the location of derivative investments on the Fund’s Statement of Assets and Liabilities as of September 30, 2016:
Derivative Investment Type | Asset Derivatives | Liability Derivatives |
Currency contracts | Unrealized appreciation on forward foreign currency exchange contracts | Unrealized depreciation on forward foreign currency exchange contracts |
The following table sets forth the fair value of the Fund’s derivative investments categorized by primary risk exposure at September 30, 2016:
Asset Derivative Investments Value | |
Fund | | Forward
Foreign Currency
Exchange Contracts | |
Floating Rate Strategies Fund | | $ | 543,860 | |
Liability Derivative Investments Value | |
Fund | | Forward
Foreign Currency
Exchange Contracts | |
Floating Rate Strategies Fund | | $ | 59,478 | |
The following is a summary of the location of derivative investments on the Fund’s Statement of Operations for the year ended September 30, 2016:
Derivative Investment Type | Location of Gain (Loss) on Derivatives |
Currency contracts | Net realized gain (loss) on forward foreign currency exchange contracts |
| Net change in unrealized appreciation (depreciation) on forward foreign currency exchange contracts |
The following is a summary of the Fund’s realized gain (loss) and change in unrealized appreciation (depreciation) on derivative investments recognized on the Statement of Operations categorized by primary risk exposure for the year ended September 30, 2016:
Realized Gain (Loss) on Derivative Investment Recognized on the Statement of Operations | |
Fund | | Forward
Foreign Currency
Exchange Contracts | |
Floating Rate Strategies Fund | | $ | 1,605,665 | |
| | THE GUGGENHEIM FUNDS ANNUAL REPORT | 45 |
NOTES TO FINANCIAL STATEMENTS (continued) |
Change in Unrealized Appreciation (Depreciation) on Derivative
Investments Recognized on the Statement of Operations | |
Fund | | Forward
Foreign Currency
Exchange Contracts | |
Floating Rate Strategies Fund | | $ | 890,866 | |
In conjunction with the use of derivative instruments, the Fund is required to maintain collateral in various forms. The Fund uses, where appropriate, depending on the financial instrument utilized and the broker involved, margin deposits at the broker, cash and/or securities segregated at the custodian bank, discount notes or the repurchase agreements allocated to the Fund.
The Trust has established counterparty credit guidelines and enters into transactions only with financial institutions of investment grade or better. The Trust monitors the counterparty credit risk.
3. Fees and Other Transactions with Affiliates
Under the terms of an investment advisory contract, the Fund pays GI investment advisory fees calculated at an annualized rate of 0.65% of the average daily net assets of the Fund.
RFS was paid the following for providing transfer agent services to the Fund. Transfer agent fees were assessed to the applicable class of the Fund.
Annual charge per account | $5.00 – $8.00 |
Transaction fee | $0.60 – $1.10 |
Minimum annual charge per Fund† | $25,000 |
Certain out-of-pocket charges | Varies |
† | Not subject to the Fund during the first twelve months of operations. |
RFS also acted as the administrative agent for the Fund. As such it performed administrative, bookkeeping, accounting and pricing functions for the Fund. For these services, RFS received 0.095% of the average daily net assets of the Fund. The minimum annual charge for fund accounting/administrative fees is $25,000.
GI engages external service providers to perform other necessary services for the Trust, such as audit and accounting related services, legal services, custody, printing and mailing, etc., on a pass-through basis. Such expenses are allocated to various Funds within the complex based on relative net assets.
The Fund has adopted Distribution Plans related to the offering of A-Class, C-Class and P-Class shares pursuant to Rule 12b-1 under the 1940 Act. The plans provide for payments at an annual rate of 0.25% of the average daily net assets of the Fund’s A-Class and P-Class shares, and 1.00% of the average daily net assets of the Fund’s C-Class shares.
46 | THE GUGGENHEIM FUNDS ANNUAL REPORT | |
NOTES TO FINANCIAL STATEMENTS (continued) |
The investment advisory contracts for the following Fund provides that the total expenses be limited to a percentage of average net assets for each class of shares, exclusive of brokerage costs, dividends on securities sold short, expenses of other investment companies in which a Fund invests, interest, taxes, litigation, indemnification and extraordinary expenses. The limits are listed below:
| | Limit | Effective
Date | Contract
End Date |
Floating Rate Strategies Fund - A-Class | 1.02% | 11/30/12 | 02/01/17 |
Floating Rate Strategies Fund - C-Class | 1.77% | 11/30/12 | 02/01/17 |
Floating Rate Strategies Fund - P-Class* | 1.02% | 05/01/15 | 02/01/17 |
Floating Rate Strategies Fund - Institutional Class | 0.78% | 11/30/12 | 02/01/17 |
* | Since the commencement of operations: May 1, 2015 |
GI is entitled to reimbursement by the Fund for fees waived or expenses reimbursed during any of the previous 36 months, beginning on the date of the expense limitation agreement, if on any day the estimated operating expenses are less than the indicated percentages. At September 30, 2016, the amount of fees waived or expenses reimbursed that are subject to recoupment are presented in the following table:
Fund | | Expires
2017 | | | Expires
2018 | | | Expires
2019 | | | Fund
Total | |
Floating Rate Strategies Fund | | | | | | | | | | | | |
A-Class | | $ | 611,271 | | | $ | 521,200 | | | $ | 715,008 | | | $ | 1,847,479 | |
C-Class | | | 138,934 | | | | 164,290 | | | | 254,684 | | | | 557,908 | |
P-Class | | | — | | | | 609 | | | | 19,459 | | | | 20,068 | |
Institutional Class | | | 455,839 | | | | 538,037 | | | | 1,021,450 | | | | 2,015,326 | |
For the year ended September 30, 2016, no amounts were recouped by GI.
For the year ended September 30, 2016, GFD retained sales charges of $566,973 relating to sales of A-Class shares of the Trust.
Certain trustees and officers of the Trust are also officers of GI and GFD.
| | THE GUGGENHEIM FUNDS ANNUAL REPORT | 47 |
NOTES TO FINANCIAL STATEMENTS (continued) |
4. Fair Value Measurement
In accordance with U.S. GAAP, fair value is defined as the price that the Fund would receive to sell an investment or pay to transfer a liability in an orderly transaction with an independent buyer in the principal market, or in the absence of a principal market, the most advantageous market for the investment or liability. U.S. GAAP establishes a three-tier fair value hierarchy based on the types of inputs used to value assets and liabilities and requires corresponding disclosure. The hierarchy and the corresponding inputs are summarized below:
Level 1 — | quoted prices in active markets for identical assets or liabilities. |
Level 2 — | significant other observable inputs (for example quoted prices for securities that are similar based on characteristics such as interest rates, prepayment speeds, credit risk, etc.). |
Level 3 — | significant unobservable inputs based on the best information available under the circumstances, to the extent observable inputs are not available, which may include assumptions. |
The types of inputs available depend on a variety of factors, such as the type of security and the characteristics of the markets in which it trades, if any. Fair valuation determinations that rely on fewer or no observable inputs require greater judgment. Accordingly, fair value determinations for Level 3 securities require the greatest amount of judgment.
Independent pricing services are used to value a majority of the Fund’s investments. When values are not available from a pricing service, they may be computed by the Fund’s investment adviser or an affiliate. In any event, values may be determined using a variety of sources and techniques, including: market prices; broker quotes; and models which derive prices based on inputs such as prices of securities with comparable maturities and characteristics or based on inputs such as anticipated cash flows or collateral, spread over Treasuries, and other information and analysis. A significant portion of the Fund’s assets and liabilities are categorized as Level 2 or Level 3, as indicated in this report.
Indicative quotes from broker-dealers, adjusted for fluctuations in criteria such as credit spreads and interest rates, may be also used to value the Fund’s assets and liabilities, i.e. prices provided by a broker-dealer or other market participant who has not committed to trade at that price. Although indicative quotes are typically received from established market participants, the Fund may not have the transparency to view the underlying inputs which support the market quotations. Significant changes in an indicative quote would generally result in significant changes in the fair value of the security.
Certain fixed income securities are valued by obtaining a monthly indicative quote from a broker-dealer, adjusted for fluctuations in criteria such as credit spreads and interest rates.
48 | THE GUGGENHEIM FUNDS ANNUAL REPORT | |
NOTES TO FINANCIAL STATEMENTS (continued) |
The inputs or methodologies used for valuing securities are not necessarily an indication of the risk associated with investing in those securities. The suitability of the techniques and sources employed to determine fair valuation are regularly monitored and subject to change.
5. Federal Income Tax Information
The Fund intends to comply with the provisions of Subchapter M of the Internal Revenue Code applicable to regulated investment companies and will distribute substantially all taxable net investment income and capital gains sufficient to relieve the Fund from all, or substantially all, federal income, excise and state income taxes. Therefore, no provision for federal or state income tax is required.
Tax positions taken or expected to be taken in the course of preparing the Fund’s tax returns are evaluated to determine whether the tax positions are “more-likely-than-not” of being sustained by the applicable tax authority. Tax positions not deemed to meet the more-likely-than-not threshold would be recorded as a tax benefit or expense in the current year. Management has analyzed the Fund’s tax positions taken, or to be taken, on federal income tax returns for all open tax years, and has concluded that no provision for income tax is required in the Fund’s financial statements. The Fund’s federal tax returns are subject to examination by the Internal Revenue Service for a period of three years after they are filed.
The tax character of distributions paid during the year ended September 30, 2016 was as follows:
Fund | | Ordinary
Income | | | Long-Term
Capital Gain | | | Total
Distributions | |
Floating Rate Strategies Fund | | $ | 89,395,800 | | | $ | — | | | $ | 89,395,800 | |
The tax character of distributions paid during the year ended September 30, 2015 was as follows:
Fund | | Ordinary
Income | | | Long-Term
Capital Gain | | | Total
Distributions | |
Floating Rate Strategies Fund | | $ | 66,140,027 | | | $ | 852,380 | | | $ | 66,992,407 | |
Note: For federal income tax purposes, short-term capital gain distributions are treated as ordinary income distributions.
Tax components of accumulated earnings/(deficit) as of September 30, 2016, were as follows:
Fund | | Undistributed Ordinary Income | | | Undistributed Long-Term Capital Gain | | | Net Unrealized Appreciation/(Depreciation) | | | Accumulated Capital Loss | | | Other Temporary Differences | |
Floating Rate Strategies Fund | | $ | 6,933,127 | | | $ | — | | | $ | (21,071,148 | ) | | $ | (14,003,863 | ) | | $ | (7,192,403 | ) |
| | THE GUGGENHEIM FUNDS ANNUAL REPORT | 49 |
NOTES TO FINANCIAL STATEMENTS (continued) |
For Federal income tax purposes, capital loss carryforwards represent realized losses of the Fund that may be carried forward and applied against future capital gains. Under the RIC Modernization Act of 2010, the Fund is permitted to carry forward capital losses incurred in taxable years beginning after December 22, 2010 for an unlimited period and such capital loss carryforwards will retain their character as either short-term or long-term capital losses. As of September 30, 2016, capital loss carryforwards for the Fund was as follows:
Fund | | Unlimited
Short-Term | | | Unlimited
Long-Term | | | Total
Capital Loss
Carryforward | |
Floating Rate Strategies Fund | | $ | — | | | $ | (14,003,863 | ) | | $ | (14,003,863 | ) |
As of September 30, 2016, the following reclassifications were made to the capital accounts of the Fund, to reflect permanent book/tax differences and income and gains available for distributions under income tax regulations, which are due to foreign currency reclasses, paydown reclasses, and CLO investments. Net investment income, net realized gains and net assets were not affected by these changes.
On the Statements of Assets and Liabilities, the following adjustments were made for permanent book/tax differences:
Fund | | Paid In
Capital | | | Undistributed
Net Investment
Income | | | Accumulated
Net Realized
Loss | |
Floating Rate Strategies Fund | | $ | 2 | | | $ | 844,994 | | | $ | (844,996 | ) |
At September 30, 2016, the cost of securities for Federal income tax purposes, the aggregate gross unrealized gain for all securities for which there was an excess of value over tax cost and the aggregate gross unrealized loss for all securities for which there was an excess of tax cost over value, were as follows:
Fund | | Tax
Cost | | | Tax
Unrealized
Gain | | | Tax
Unrealized
Loss | | | Net
Unrealized
Loss | |
Floating Rate Strategies Fund | | $ | 2,592,520,009 | | | $ | 22,137,227 | | | $ | (45,242,858 | ) | | $ | (23,105,631 | ) |
6. Securities Transactions
For the year ended September 30, 2016, the cost of purchases and proceeds from sales of investment securities, excluding government securities, short-term investments and derivatives, were as follows:
Fund | | Purchases | | | Sales | |
Floating Rate Strategies Fund | | $ | 1,213,436,137 | | | $ | 662,109,225 | |
50 | THE GUGGENHEIM FUNDS ANNUAL REPORT | |
NOTES TO FINANCIAL STATEMENTS (continued) |
The Fund is permitted to purchase or sell securities from or to certain affiliated funds under specified conditions outlined in procedures adopted by the Board of the Trust. The procedures have been designed to ensure that any purchase or sale of securities by a Fund from or to another fund or portfolio that is or could be considered an affiliate by virtue of having a common investment adviser (or affiliated investment advisers), common Trustees and/or common officers complies with Rule 17a-7 of the 1940 Act. Further, as defined under these procedures, each transaction is effected at the current market price to save costs, where permissible. For the year ended September 30, 2016, the Fund engaged in purchases and sales of securities, pursuant to Rule 17a-7 of the 1940 Act, as follows:
Fund | | Purchases | | | Sales | | | Realized
Gain | |
Floating Rate Strategies Fund | | $ | 1,083,750 | | | $ | — | | | $ | — | |
7. Affiliated Transactions
Investments representing 5% or more of the outstanding voting shares of a portfolio company of a fund, or control of or by, or common control under GI, result in that portfolio company being considered an affiliated company of such fund, as defined in the 1940 Act.
The Fund may invest in the Guggenheim Strategy Funds Trust consisting of Guggenheim Strategy Fund I, Guggenheim Strategy Fund II, Guggenheim Strategy Fund III, and Guggenheim Variable Insurance Strategy Fund III (collectively, the “Cash Management Funds”), open-end management investment companies managed by GI. The Cash Management Funds, which launched on March 11, 2014, are offered as cash management options only to mutual funds, trusts, and other accounts managed by GI and/or its affiliates, and are not available to the public. The Cash Management Funds pay no investment management fees. The Cash Management Funds’ annual report on Form N-CSR dated September 30, 2015, is available publicly or upon request. This information is available from the EDGAR database on the SEC’s website at http://www.sec.gov/Archives/edgar/data/1601445/000089180415000857/gug63224-ncsr.htm.
Transactions during the year ended September 30, 2016, in which the portfolio company is an “affiliated person,” were as follows:
Affiliated issuers by Fund | | Value
09/30/15 | | | Additions | | | Reductions | | | Value
09/30/16 | | | Shares
09/30/16 | | | Investment
Income | | | Realized
Loss | |
Floating Rate Strategies Fund | | | | | | | | | | |
Guggenheim Strategy Fund I | | $ | 35,022,618 | | | $ | 292,607 | | | $ | (17,000,000 | ) | | $ | 18,386,427 | | | | 735,751 | | | $ | 291,445 | | | $ | (23,326 | ) |
Guggenheim Strategy Fund II | | | — | | | | 10,131,587 | | | | (3,000,000 | ) | | | 7,160,896 | | | | 287,125 | | | | 130,811 | | | | (2,418 | ) |
| | | $ | 35,022,618 | | | $ | 10,424,194 | | | $ | (20,000,000 | ) | | $ | 25,547,323 | | | | | | | $ | 422,256 | | | $ | (25,744 | ) |
| | THE GUGGENHEIM FUNDS ANNUAL REPORT | 51 |
NOTES TO FINANCIAL STATEMENTS (continued) |
8. Loan Commitments
Pursuant to the terms of certain loan agreements, the Fund held unfunded loan commitments as of September 30, 2016. The Fund is obligated to fund these loan commitments at the borrower’s discretion.
The unfunded loan commitments as of September 30, 2016 were as follows:
Borrower | Maturity Date | | Face Amount | | | Value | |
Floating Rate Strategies Fund | | | | | | | |
Acrisure LLC | 05/19/22 | | $ | 3,423,051 | | | $ | 49,609 | |
Advantage Sales & Marketing LLC | 07/25/19 | | | 7,400,000 | | | | 536,540 | |
American Stock Transfer & Trust | 06/26/18 | | | 800,000 | | | | 36,786 | |
CEVA Group Plc (United Kingdom) | 03/19/19 | | | 3,000,000 | | | | 301,508 | |
Hoffmaster Group, Inc. | 05/09/19 | | | 1,750,000 | | | | 106,199 | |
IntraWest Holdings S.à r.l. | 12/10/18 | | | 6,900,000 | | | | 120,740 | |
Kronos, Inc. | 10/30/17 | | | 500,000 | | | | 16,060 | |
National Financial Partners Corp. | 07/01/18 | | | 3,000,000 | | | | 147,630 | |
Signode Industrial Group US, Inc. | 05/01/19 | | | 11,400,000 | | | | 733,801 | |
Wencor Group | 06/19/19 | | | 2,367,692 | | | | 150,645 | |
| | | | $ | 40,540,743 | | | $ | 2,199,518 | |
9. Line of Credit
The Trust, with the exception of Capital Stewardship Fund, and certain affiliated funds, secured a 364-day committed, $800,000,000 line of credit from Citibank, N.A., which was in place through October 6, 2016, at which time the line of credit was renewed. A Fund may draw (borrow) from the line of credit as a temporary measure for emergency purposes, to facilitate redemption requests, or for other short-term liquidity purposes consistent with the Fund’s investment objective and program. For example, it may be advantageous for the Fund to borrow money rather than sell existing portfolio positions to meet redemption requests. Fees related to borrowings, if any, vary under this arrangement between the greater of Citibank’s “base rate”, LIBOR plus 1%, or the federal funds rate 0.29% at September 30, 2016, plus 1/2 of 1%. The funds paid upfront costs of $663,359 to renew the line of credit.
The commitment fee that may be paid by the Funds is at an annualized rate of 0.15% of the average daily amount of their unused commitment amount. The Funds did not have any borrowings under this agreement as of and for the year ended September 30, 2016.
On October 6, 2016, the Trust, with the exception of Capital Stewardship Fund, and certain affiliated funds, renewed the line of credit from Citibank, N.A., with an increased commitment amount to $1,000,000,000. Fees related to borrowings, if any, vary under this arrangement between the greater of Citibank’s “base rate”, LIBOR plus 1%, or the federal funds rate 0.29% at September 30, 2016, plus 1/2 of 1%. The funds will pay upfront costs of $2,032,388 to renew the line of credit. The commitment fee that may be paid by the Funds is at an annualized rate of 0.15% of the average daily amount of their unused commitment amount.
52 | THE GUGGENHEIM FUNDS ANNUAL REPORT | |
NOTES TO FINANCIAL STATEMENTS (continued) |
The allocated interest expense amount for each Fund is referenced in the Statement of Operations under “Line of credit fees” and the effect on the expense ratio is included in the Financial Highlights.
10. Reverse Repurchase Agreements
The Fund may enter into reverse repurchase agreements. Under a reverse repurchase agreement, a Fund sells securities and agrees to repurchase them at a particular price at a future date. In the event the buyer of securities under a reverse repurchase agreement files for bankruptcy or becomes insolvent, such buyer or its trustee or receiver may receive an extension of time to determine whether to enforce the Fund’s obligation to repurchase the securities, and the Fund’s use of the proceeds of the reverse repurchase agreement may effectively be restricted pending such decision.
For the year ended September 30, 2016, the Fund entered into reverse repurchase agreements as follows:
Fund | | Number
of Days
Outstanding | | | Balance at
September 30,
2016 | | | Average
Balance
Outstanding | | | Average
Interest
Rate | |
Floating Rate Strategies Fund | | | 116 | | | $ | — | | | $ | 398,091 | | | | 1.70 | % |
There were no outstanding reverse repurchase agreements at September 30, 2016.
11. Restricted Securities
The securities below are considered illiquid and restricted under guidelines established by the Board:
Fund | Restricted Securities | Acquisition
Date | | Amortized
Cost | | | Value | |
Floating Rate Strategies Fund | Airplanes Pass Through Trust 2001-1A, 1.07% due 03/15/19 | 12/27/11 | | $ | 1,307,090 | | | $ | 534,708 | |
12. Offsetting
In the normal course of business, the Fund enters into transactions subject to enforceable master netting arrangements or other similar arrangements. Generally, the right to offset in those agreements allows the Fund to counteract the exposure to a specific counterparty with collateral received or delivered to that counterparty based on the terms of the arrangements. These arrangements provide for the right to liquidate upon the occurrence of an event of default, credit event upon merger or additional termination event.
In order to better define their contractual rights and to secure rights that will help the Fund mitigate its counterparty risk, the Fund may enter into an International Swaps and Derivatives Association, Inc. Master Agreement (“ISDA Master Agreement”) or similar agreement with its
| | THE GUGGENHEIM FUNDS ANNUAL REPORT | 53 |
NOTES TO FINANCIAL STATEMENTS (continued) |
derivative contract counterparties. An ISDA Master Agreement is a bilateral agreement between a Fund and a counterparty that governs OTC derivatives, including foreign exchange contracts, and typically contains, among other things, collateral posting terms and netting provisions in the event of a default and/or termination event. The provisions of the ISDA Master Agreement typically permit a single net payment in the event of a default (close-out netting) or similar event, including the bankruptcy or insolvency of the counterparty.
For derivatives traded under an ISDA Master Agreement, the collateral requirements are typically calculated by netting the mark to market amount for each transaction under such agreement and comparing that amount to the value of any collateral currently pledged by the Fund and the counterparty. For financial reporting purposes, cash collateral that has been pledged to cover obligations of the Fund and cash collateral received from the counterparty, if any, is reported separately on the Statement of Assets and Liabilities as segregated cash with broker/receivable for variation margin, or payable for swap settlement/ variation margin. Generally, the amount of collateral due from or to a counterparty must exceed a minimum transfer amount threshold (e.g., $300,000) before a transfer is required to be made. To the extent amounts due to the Fund from its counterparties are not fully collateralized, contractually or otherwise, the Fund bears the risk of loss from counterparty nonperformance. The Fund attempts to mitigate counterparty risk by only entering into agreements with counterparties that they believe to be of good standing and by monitoring the financial stability of those counterparties.
For financial reporting purposes, the Fund does not offset derivative assets and derivative liabilities that are subject to netting arrangements in the Statement of Assets and Liabilities.
The following tables present derivative financial instruments and secured financing transactions that are subject to enforceable netting arrangements and offset in the Statement of Assets and Liabilities in conformity with U.S. GAAP.
| | | | | | | | | | | | | Gross Amounts Not Offset in the Statement of Assets and Liabilities | | | | |
Fund | Instrument | | Gross Amounts of Recognized Assets | | | Gross Amounts Offset in the Statement of Assets and Liabilities | | | Net Amount of Assets Presented on the Statement of Assets and Liabilities | | | Financial Instruments | | | Cash Collateral Received | | | Net Amount | |
Floating Rate Strategies Fund | Forward foreign currency exchange contracts | | $ | 543,860 | | | $ | — | | | $ | 543,860 | | | $ | 59,478 | | | $ | — | | | $ | 484,382 | |
54 | THE GUGGENHEIM FUNDS ANNUAL REPORT | |
NOTES TO FINANCIAL STATEMENTS (concluded) |
| | | | | | | | | | | | | Gross Amounts Not Offset in the Statement of Assets and Liabilities | | | | |
Fund | Instrument | | Gross Amounts of Recognized Liabilities | | | Gross Amounts Offset in the Statement of Assets and Liabilities | | | Net Amount of Liabilities Presented on the Statement of Assets and Liabilities | | | Financial Instruments | | | Cash Collateral Received | | | Net Amount | |
Floating Rate Strategies Fund | Forward foreign currency exchange contracts | | $ | 59,478 | | | $ | — | | | $ | 59,478 | | | $ | 59,478 | | | $ | — | | | $ | — | |
13. Subsequent Event
At a meeting that occurred on November 16, 2016, the Board approved the following changes:
Approval to add an advisory fee breakpoint (“breakpoint”) to the fixed income mutual funds. Effective on or about February 1, 2017, a breakpoint of 5 basis points (0.05%) on average daily net assets above $5 billion will apply to each of the following Funds’ advisory fees:
Floating Rate Strategies Fund
Investment Grade Bond Fund
Macro Opportunities Fund
Total Return Bond Fund
The introduction of advisory fee breakpoints will not result in any decrease in the nature, quality and extent of services provided to the Funds under the advisory agreements.
| | THE GUGGENHEIM FUNDS ANNUAL REPORT | 55 |
REPORT OF INDEPENDENT REGISTERED PUBLIC ACCOUNTING FIRM |
The Board of Trustees and Shareholders
of Guggenheim Funds Trust
We have audited the accompanying statement of assets and liabilities, including the schedule of investments, of Guggenheim Floating Rate Strategies Fund (one of the series constituting the Guggenheim Funds Trust) (the “Fund”) as of September 30, 2016, and the related statement of operations for the year then ended, the statements of changes in net assets for each of the two years in the period then ended, and the financial highlights for each of the years or periods indicated therein. These financial statements and financial highlights are the responsibility of the Fund’s management. Our responsibility is to express an opinion on these financial statements and financial highlights based on our audits.
We conducted our audits in accordance with the standards of the Public Company Accounting Oversight Board (United States). Those standards require that we plan and perform the audit to obtain reasonable assurance about whether the financial statements and financial highlights are free of material misstatement. We were not engaged to perform an audit of the Fund’s internal control over financial reporting. Our audits included consideration of internal control over financial reporting as a basis for designing audit procedures that are appropriate in the circumstances, but not for the purpose of expressing an opinion on the effectiveness of the Fund’s internal control over financial reporting. Accordingly, we express no such opinion. An audit also includes examining, on a test basis, evidence supporting the amounts and disclosures in the financial statements and financial highlights, assessing the accounting principles used and significant estimates made by management, and evaluating the overall financial statement presentation. Our procedures included confirmation of securities owned as of September 30, 2016, by correspondence with the custodian, transfer agent, brokers, and paying agents or by other appropriate auditing procedures where replies from paying agents were not received. We believe that our audits provide a reasonable basis for our opinion.
In our opinion, the financial statements and financial highlights referred to above present fairly, in all material respects, the financial position of the Guggenheim Floating Rate Strategies Fund (one of the series constituting the Guggenheim Funds Trust) at September 30, 2016, the results of its operations for the year then ended, the changes in its net assets for each of the two years in the period then ended, and its financial highlights for each of the years or periods indicated therein, in conformity with U.S. generally accepted accounting principles.
McLean, Virginia
November 29, 2016
56 | THE GUGGENHEIM FUNDS ANNUAL REPORT | |
OTHER INFORMATION (Unaudited) |
Tax Information
In January 2017, shareholders will be advised on IRS Form 1099 DIV or substitute 1099 DIV as to the federal tax status of the distributions received by shareholders in the calendar year 2016.
Additionally, of the taxable ordinary income distributions paid during the fiscal year ending September 30, 2016, the Fund had the corresponding percentages qualify as interest related dividends and qualified short-term capital gains as permitted by IRC Section 871(k)(1) and IRC Section 871(k)(2), respectively:
Fund | Qualified
Interest | Qualified
Short-Term
Capital Gain |
Floating Rate Strategies Fund | 77.35% | 0.00% |
Proxy Voting Information
A description of the policies and procedures that the Trust uses to determine how to vote proxies relating to securities held in the Funds’ portfolios is available, without charge and upon request, by calling 800.820.0888. This information is also available from the EDGAR database on the SEC’s website at https://www.sec.gov.
Information regarding how the Funds voted proxies relating to portfolio securities during the most recent 12-month period ended June 30 is available without charge, upon request, by calling 800.820.0888. This information is also available from the EDGAR database on the SEC’s website at https://www.sec.gov.
Sector Classification
Information in the “Schedule of Investments” is categorized by sectors using sector-level Classifications defined by the Bloomberg Industry Classification System, a widely recognized industry classification system provider. Each Fund’s registration statement has investment policies relating to concentration in specific sectors/industries. For purposes of these investment policies, the Funds usually classify sectors/industries based on industry-level Classifications used by widely recognized industry classification system providers such as Bloomberg Industry Classification System, Global Industry Classification Standards and Barclays Global Classification Scheme.
Quarterly Portfolio Schedules Information
The Trust files its complete schedule of portfolio holdings with the SEC for the first and third quarters of each fiscal year on Form N-Q; which are available on the SEC’s website at https://www.sec.gov. The Funds’ Forms N-Q may be reviewed and copied at the SEC’s Public Reference Room in Washington, DC, and that information on the operation of the Public Reference Room may be obtained by calling 800-SEC-0330. Copies of the portfolio holdings are also available to shareholders, without charge and upon request, by calling 800.820.0888.
| | THE GUGGENHEIM FUNDS ANNUAL REPORT | 57 |
OTHER INFORMATION (Unaudited)(continued) |
Report of the Guggenheim Funds Trust Contracts Review Committee
Guggenheim Funds Trust (the “Trust”) was organized as a Delaware statutory trust on November 8, 2013, and is registered as an open-end management investment company under the Investment Company Act of 1940, as amended (the “1940 Act”). The Trust includes the following series:
● Guggenheim Alpha Opportunity Fund (“Alpha Opportunity Fund”) ● Guggenheim Diversified Income Fund (“Diversified Income Fund”) ● Guggenheim High Yield Fund (“High Yield Fund”) ● Guggenheim Large Cap Value Fund (“Large Cap Value Fund”) ● Guggenheim Macro Opportunities Fund (“Macro Opportunities Fund”) ● Guggenheim Mid Cap Value Fund (“Mid Cap Value Fund”) ● Guggenheim Municipal Income Fund (“Municipal Income Fund”) ● Guggenheim Small Cap Value Fund (“Small Cap Value Fund”) ● Guggenheim StylePlus—Mid Growth Fund (“StylePlus—Mid Growth Fund”) ● Guggenheim World Equity Income Fund (“World Equity Income Fund”) | ● Guggenheim Capital Stewardship Fund (“Capital Stewardship Fund”) ● Guggenheim Floating Rate Strategies Fund (“Floating Rate Strategies Fund”) ● Guggenheim Investment Grade Bond Fund (“Investment Grade Bond Fund”) ● Guggenheim Limited Duration Fund (“Limited Duration Fund”) ● Guggenheim Market Neutral Real Estate Fund (“Market Neutral Real Estate Fund”) ● Guggenheim Mid Cap Value Institutional Fund (“Mid Cap Value Institutional Fund”) ● Guggenheim Risk Managed Real Estate Fund (“Risk Managed Real Estate Fund”) ● Guggenheim StylePlus—Large Core Fund (“StylePlus—Large Core Fund”) ● Guggenheim Total Return Bond Fund (“Total Return Bond Fund”) |
Security Investors, LLC (“Security Investors”), an indirect subsidiary of Guggenheim Partners, LLC, a global, diversified financial services firm (“Guggenheim Partners”), serves as investment adviser to each of: (i) Alpha Opportunity Fund; (ii) High Yield Fund; (iii) Investment Grade Bond Fund; (iv) Large Cap Value Fund; (v) Mid Cap Value Fund; (vi) Mid Cap Value Institutional Fund; (vii) Municipal Income Fund; (viii) Small Cap Value Fund; (ix) StylePlus—Large Core Fund; (x) StylePlus—Mid Growth Fund; and (xi) World Equity Income Fund (collectively, the “SI-Advised Funds”). (Guggenheim Partners, Security Investors, Guggenheim Partners Investment Management, LLC (“GPIM”) and their affiliates may be referred to herein collectively as “Guggenheim.” “Guggenheim Investments” refers to the global asset management and investment advisory division of Guggenheim Partners and includes GPIM, Security Investors
58 | THE GUGGENHEIM FUNDS ANNUAL REPORT | |
OTHER INFORMATION (Unaudited)(continued) |
and Guggenheim Funds Investment Advisors, LLC and other affiliated investment management businesses.) Under the terms of investment management agreements between Security Investors and the Trust, with respect to the SI-Advised Funds, Security Investors also is responsible for overseeing the activities of GPIM, an indirect subsidiary of Guggenheim Partners, with respect to its service as investment sub-adviser to Municipal Income Fund, pursuant to an investment sub-advisory agreement between Security Investors and GPIM (the “GPIM Sub-Advisory Agreement”).
GPIM serves as investment adviser with respect to each of: (i) Capital Stewardship Fund; (ii) Diversified Income Fund; (iii) Floating Rate Strategies Fund; (iv) Limited Duration Fund; (v) Macro Opportunities Fund; (vi) Market Neutral Real Estate Fund; (vii) Risk Managed Real Estate Fund; and (viii) Total Return Bond Fund (collectively, the “GPIM-Advised Funds” and together with the SI-Advised Funds, the “Funds” and individually, a “Fund”). Under the terms of investment management agreements between GPIM and the Trust, with respect to the GPIM-Advised Funds,1 GPIM also is responsible for overseeing the activities of Concinnity Advisors, LP (“Concinnity”) with respect to Concinnity’s service as investment sub-adviser to the Capital Stewardship Fund, pursuant to an investment sub-advisory agreement between GPIM and Concinnity (the “Concinnity Sub-Advisory Agreement”). Under the supervision of the Board of Trustees of the Trust (the “Board,” with the members of the Board referred to individually as the “Trustees”), the Advisers regularly provide (or, as applicable, oversee the provision of) investment research, advice and supervision, a continuous investment program, and direct the purchase and sale of securities and other investments for each Fund’s portfolio.
Following an initial two-year term, each of the Advisory Agreements continues in effect from year to year provided that such continuance is specifically approved at least annually by (i) the Board or a majority of the outstanding voting securities (as defined in the 1940 Act) of each Fund, and, in either event, (ii) the vote of a majority of the Trustees who are not “interested person[s],” as defined by the 1940 Act, of the Trust (the “Independent Trustees”) casting votes in person at a meeting called for such purpose. At meetings held in person on April 27, 2016 (the “April Meeting”) and on May 17, 2016 (the “May Meeting”), the members of the Contracts Review Committee of the Board (the “Committee”), consisting solely of the Independent Trustees, met
1 | The investment management agreements pertaining to the SI-Advised Funds and the investment management agreements pertaining to the GPIM-Advised Funds are referred to herein together as the “Advisory Agreements” and, together with the GPIM Sub-Advisory Agreement, as the “Agreements.” In addition, unless the context indicates otherwise, GPIM, with respect to its service as investment adviser to the GPIM-Advised Funds, and Security Investors as to the SI-Advised Funds, are each referred to herein as the “Adviser” and together, the “Advisers.” |
| | THE GUGGENHEIM FUNDS ANNUAL REPORT | 59 |
OTHER INFORMATION (Unaudited)(continued) |
separately from Guggenheim to consider the proposed renewal of the Advisory Agreements and the GPIM Sub-Advisory Agreement in connection with the Committee’s annual contract review schedule.2
As part of its review process, the Committee was represented by independent legal counsel to the Independent Trustees (“Independent Legal Counsel”). Independent Legal Counsel reviewed and discussed with the Committee various key aspects of the Trustees’ legal responsibilities relating to the proposed renewal of the Agreements and other principal contracts. The Committee took into account various materials received from Guggenheim and Independent Legal Counsel. Recognizing that the evaluation process with respect to the services provided by each of the Advisers is an ongoing one, the Committee also considered the variety of written materials, reports and oral presentations the Board received throughout the year regarding performance and operating results of the Funds.
In connection with the contract review process, FUSE Research Network LLC (“FUSE”), an independent, third-party research provider, was engaged to prepare advisory contract renewal reports designed specifically to help boards of directors/trustees fulfill their advisory contract renewal responsibilities. The objective of the reports is to present the subject funds’ relative position regarding fees, expenses and total return performance, with peer group and universe comparisons. The Committee assessed the data provided in the FUSE reports as well as commentary and supporting data presented by Guggenheim, including, among other things, a summary of notable distinctions between certain Funds and the applicable peer group identified in the FUSE reports, as well as a discussion of those instances in which FUSE adjusted a peer group after considering a request by management to re-evaluate the peer group constituent funds.
In addition, Guggenheim provided materials and data in response to formal requests for information sent by Independent Legal Counsel on behalf of the Independent Trustees. Guggenheim also made a presentation at the April Meeting which, among other things, addressed areas identified for discussion by the Independent Trustees and Independent Legal Counsel.
2 | Since Diversified Income Fund is subject to an investment management agreement approved by the Board for an initial term of two years at an in-person meeting of the Board held on August 20, 2015 and the Fund launched in 2016, it was not included in the contract renewal process conducted at the meetings in April and May 2016. Similarly, Market Neutral Real Estate Fund is subject to an investment management agreement approved by the Board for an initial term of two years at an in-person Board meeting held on November 10, 2015, and the Fund launched in 2016. Consequently, Market Neutral Real Estate Fund also was not included in the scope of the 2016 contract renewal process. In addition, because shares of the Capital Stewardship Fund are only offered for subscription and are held by a limited number of institutional/bank investors, and the Fund issues a shareholder report separate from the other series of the Trust, the factors considered by the Committee in evaluating the proposed renewal of an investment management agreement pertaining to the Capital Stewardship Fund, and the Concinnity Sub-Advisory Agreement, are addressed in a separate report of the Committee. Accordingly, references hereafter to the “Funds” should be understood as referring to all series of the Trust, excluding: (i) Capital Stewardship Fund; (ii) Diversified Income Fund; and (iii) Market Neutral Real Estate Fund. |
60 | THE GUGGENHEIM FUNDS ANNUAL REPORT | |
OTHER INFORMATION (Unaudited)(continued) |
Throughout the process, the Committee asked questions of management and requested certain additional information, which Guggenheim provided following the April Meeting (collectively with the foregoing reports and materials, the “Contract Review Materials”).
The Committee considered the Contract Review Materials in the context of its accumulated experience governing the Trust and weighed the factors and standards discussed with Independent Legal Counsel. Following an analysis and discussion of the factors identified below and in the exercise of its business judgment, the Committee concluded that it was in the best interest of each Fund to recommend that the Board approve the renewal of each Advisory Agreement and the GPIM Sub-Advisory Agreement for an additional annual term.
Advisory Agreements
Nature, Extent and Quality of Services Provided by each Adviser: With respect to the nature, extent and quality of services currently provided by each Adviser, the Committee considered the information provided by Guggenheim concerning the education, experience, professional affiliations, areas of responsibility and duties of key personnel performing services for the Funds, including those personnel providing compliance oversight, as well as the supervisors and reporting lines for such personnel. In this connection, the Committee considered Guggenheim’s resources and related efforts to retain, attract and motivate capable personnel to serve the Funds and noted Guggenheim’s report on recent additions, departures and transitions in personnel who work on matters relating to the Funds or are significant to the operations of each Adviser. The Committee also considered the Advisers’ attention to relevant developments in the mutual fund industry and its observance of compliance and regulatory requirements, and noted that on a regular basis the Board receives and reviews information from the Trust’s Chief Compliance Officer regarding compliance policies and procedures established pursuant to Rule 38a-1 under the 1940 Act, as well as from Guggenheim’s Chief Risk Officer. The Committee also noted updates by Guggenheim to certain compliance programs, including with respect to Code of Ethics monitoring, and the implementation of additional forensic testing. The Committee took into consideration the settlement of a regulatory matter concerning GPIM and remedial steps taken in response by Guggenheim to enhance its organizational structure for compliance. In this connection, the Committee considered information provided by Guggenheim regarding the findings of an independent compliance consultant retained to review GPIM’s compliance program and the consultant’s conclusion that the program is reasonably designed to prevent and detect violations of the Investment Advisers Act of 1940, as amended, and the rules promulgated thereunder. Moreover, in connection with the Committee’s evaluation of the overall package of services provided by each Adviser, the Committee considered each Adviser’s administrative capabilities, including its role in monitoring and coordinating compliance responsibilities with the fund administrator, transfer agent, distributor, custodian and other service providers to the Funds. In addition, because Municipal Income Fund is sub-advised, the Committee took into account information provided by Guggenheim describing the Adviser’s processes and activities for providing oversight of sub-advisers, including information regarding the Adviser’s Sub-Advisory Oversight Committee.
| | THE GUGGENHEIM FUNDS ANNUAL REPORT | 61 |
OTHER INFORMATION (Unaudited)(continued) |
With respect to Guggenheim’s resources and the ability of each Adviser to carry out its responsibilities under the applicable Advisory Agreement, the Chief Financial Officer of Guggenheim Investments reviewed with the Committee certain unaudited financial information concerning the holding company for Guggenheim Investments, Guggenheim Partners Investment Management Holdings, LLC (“GPIMH”). (Thereafter, the Committee received the audited consolidated financial statements of GPIMH and the audited financial statements of GPIM as supplemental information.)
The Committee also considered the acceptability of the terms of each Advisory Agreement, including the scope of services required to be performed by each Adviser.
Based on the foregoing, and based on other information received (both oral and written) at the April Meeting and the May Meeting, as well as other considerations, including the Committee’s knowledge of how each Adviser performs its duties through Board meetings, discussions and reports during the year, the Committee concluded that each Adviser and its personnel were qualified to serve the Funds in such capacity and may reasonably be expected to continue to provide a high quality of services under each Advisory Agreement with respect to the Funds.
Investment Performance: The Committee received, for each Fund, investment returns for the ten-year, five-year, three-year, one-year and three-month periods ended December 31, 2015, as applicable. In addition, the Committee received a comparison of each Fund’s performance to the performance of a benchmark, a universe of funds and a narrower peer group of similar funds with comparable asset levels as identified by FUSE, in each case for the same periods, as applicable. The Committee also received from FUSE representatives and considered a description of the methodology employed by FUSE for identifying each Fund’s peer group and universe for performance and expense comparisons.
In seeking to evaluate Fund performance over a full market cycle, the Committee generally focused its attention first on five-year and three-year performance rankings as compared to the relevant universe of funds. The Committee also considered more recent performance periods, including the one-year period and, as deemed appropriate, the three-month period, for certain Funds such as for those Funds that were recently launched or had undergone recent changes in investment strategies, as well as circumstances in which enhancements were made to the portfolio management processes or techniques employed for a Fund. In this connection, the Committee made the following observations:
Alpha Opportunity Fund: The Fund’s Class A shares outperformed the performance universe median for the five-year and three-year periods, ranking in the 6th and 9th percentiles, respectively. The Committee considered the limitations on portfolio management as a result of the 2008 Lehman bankruptcy, and subsequent changes to the Fund’s investment strategies, noting that the Fund re-opened to subscriptions with a new U.S. long/short equity investment strategy on January 28, 2015. In light of the foregoing, the Committee also considered more recent performance periods, including the one-year and three-month periods ended December 31, 2015, and observed that the Fund’s Class A shares ranked in the 72nd and 92nd percentiles, respectively
62 | THE GUGGENHEIM FUNDS ANNUAL REPORT | |
OTHER INFORMATION (Unaudited)(continued) |
of its performance universe. Given the limited period of time that the Adviser has managed the Fund pursuant to its new investment program, the Committee also took into account updated performance data provided by the Adviser in connection with the May Meeting and noted that the Fund’s net performance for the one-year and three-month periods ended March 31, 2016 ranked in the 6th and 1st percentiles, respectively of the Morningstar Long/Short Equity peer group.
Floating Rate Strategies Fund: The Committee noted the Fund’s inception date of November 30, 2011, and observed that the Fund’s Class A shares ranked in the 1st and 5th percentiles of its performance universe for the three-year and one-year periods ended December 31, 2015, respectively, outperforming its performance universe median for each of these periods.
High Yield Fund: The returns of the Fund’s Class A shares ranked in the 46th and 10th percentiles of its performance universe for the five-year and three-year periods ended December 31, 2015, respectively, and outperformed the performance universe median for each of these periods.
Investment Grade Bond Fund: The returns of the Fund’s Class A shares ranked in the 1st percentile of its performance universe for both the five-year and three-year periods ended December 31, 2015, outperforming its performance universe median for both of these periods.
Limited Duration Fund: The Committee noted the Fund’s inception date of December 16, 2013, and observed that the returns of the Fund’s Class A shares ranked in the 1st and 10th percentiles of the performance universe for the one-year and three-month periods ended December 31, 2015, respectively, outperforming the median returns.
Macro Opportunities Fund: The Committee noted the Fund’s inception date of November 30, 2011, and observed that the returns of the Fund’s Class A shares ranked in the 6th and 57th percentiles of the performance universe for the three-year and one-year periods ended December 31, 2015, respectively, and outperformed the performance universe median for the three-year period.
Municipal Income Fund: The Committee considered that Security Investors does not directly manage the investment portfolio but has delegated such duties to GPIM. Based on the information provided and the review of the Fund’s investment performance, the Committee concluded that Security Investors had appropriately reviewed and monitored GPIM’s investment performance as Sub-Adviser to the Fund.
Risk Managed Real Estate Fund: The Committee noted the Fund’s inception date of February 12, 2014, and observed the returns of the Fund’s Class A shares ranked in the 31st and 76th percentile of its performance universe for the one-year and three-month periods ended December 31, 2015, respectively.
StylePlus—Large Core Fund: The returns of the Fund’s Class A shares ranked in the 39th percentile of its performance universe for the three-year period ended December 31, 2015. The Committee noted that the Fund implemented a strategy change and a new portfolio management team in May 2013. In light of the foregoing, the Committee also considered more recent
| | THE GUGGENHEIM FUNDS ANNUAL REPORT | 63 |
OTHER INFORMATION (Unaudited)(continued) |
performance periods in addition to the three-year performance, including the one-year and three-month periods ended December 31, 2015, and observed that the returns of the Fund’s Class A shares exceeded the median of its performance universe for both periods, ranking in the 25th and 22nd percentiles for the one-year and three-month periods, respectively.
StylePlus—Mid Growth Fund: The returns of the Fund’s Class A shares ranked in the 45th percentile of its performance universe for the three-year period ended December 31, 2015. The Committee noted that the Fund implemented a strategy change and a new portfolio management team in May 2013. In light of the foregoing, the Committee considered more recent performance periods in addition to the three-year performance, including the one-year and three-month periods ended December 31, 2015, and observed that the returns of the Fund’s Class A shares exceeded the median of its performance universe for both periods, ranking in the 42nd and 45th percentiles for the one-year and three-month periods, respectively.
Total Return Bond Fund: The Committee noted the Fund’s inception date of November 30, 2011, and observed that the returns of the Fund’s Class A shares ranked in the 1st and 12th percentiles of its performance universe for the three-year and one-year periods ended December 31, 2015, respectively, and outperformed the performance universe median for each of these periods.
World Equity Income Fund: The returns of the Fund’s Class A shares ranked in the 66th percentile of its performance universe for the three-year period ended December 31, 2015. The Committee noted that the Fund implemented a strategy change and a new portfolio management team in August 2013. In light of the foregoing, the Committee considered more recent performance periods in addition to the three-year performance, including the one-year and three-month periods ended December 31, 2015, and observed that the returns of the Fund’s Class A shares exceeded the median of its performance universe for both periods, ranking in the 43rd and 39th percentiles for the one-year and three-month periods, respectively.
Value Funds: Large Cap Value Fund, Mid Cap Value Fund, Mid Cap Value Institutional Fund and Small Cap Value Fund
Large Cap Value Fund: The returns of the Class A shares underperformed the performance universe median for the five-year, three-year, one-year and three-month periods ended December 31, 2015, and ranked in the 83rd, 72nd, 72nd and 67th percentiles, respectively.
Mid Cap Value Fund: The returns of the Class A shares underperformed the performance universe median for the five-year, three-year, one-year and three-month periods ended December 31, 2015, and ranked in the 83rd, 79th, 75th and 81st percentiles, respectively.
Mid Cap Value Institutional Fund: The Fund’s returns underperformed the performance universe median for the five-year, three-year, one-year and three-month periods ended December 31, 2015, and ranked in the 82nd, 75th, 70th and 67th percentiles, respectively.
64 | THE GUGGENHEIM FUNDS ANNUAL REPORT | |
OTHER INFORMATION (Unaudited)(continued) |
Small Cap Value Fund: The Fund underperformed its performance universe median for the five-year, three-year and one-year periods ended December 31, 2015, ranking in the 80th percentile for the five-year and three-year periods and in the 67th percentile for the one-year period. The Fund outperformed its performance universe median for three-month period ended December 31, 2015, and ranked in the 29th percentile.
In response to the Committee’s request, representatives from the Adviser provided information regarding, and discussed factors impacting, each Value Fund’s performance, including market trends and stock selection. The Adviser’s representatives also discussed the portfolio management team’s philosophy and processes and explained their expectations and strategies for the future. The Committee noted measures taken by the Adviser to remedy relative longer-term underperformance with respect to each of the Value Funds, including strategy enhancements such as implementation of a refined stock selection process and additional risk controls to enforce the strategy’s sell discipline. The Committee noted that the Adviser believes the enhancements to the portfolio management techniques employed for each Value Fund, used in conjunction with existing proprietary quantitative models, will help improve the Fund‘s performance results. In light of the foregoing, the Committee requested and the Adviser provided supplemental performance data to enable the Committee to evaluate the impact of the strategy enhancements. In this connection, the Committee considered that the data provided by the Adviser indicated that each Value Fund’s performance was improving, with performance for the first quarter of 2016 ranking better than the trailing one-year return. The Committee also considered the Adviser’s statement that it believes the improving trend in performance relative to peers reflects the enhancements implemented in the investment process. The Committee also noted Guggenheim’s commitment to monitor each Value Fund’s performance and update the Independent Trustees on a quarterly basis as to the impact of the process enhancements implemented to-date and advise on other steps that might be taken to further address each Fund’s performance, if necessary.
After reviewing the foregoing and related factors, the Committee concluded that: (i) each Fund’s performance was acceptable; or (ii) it was satisfied with Guggenheim’s responses and efforts relating to investment performance.
Comparative Fees, Costs of Services Provided and the Profits Realized by each Adviser from Its Relationship with the Funds: The Committee compared each Fund’s contractual advisory fee and total net expense ratio to the applicable peer group. The Committee also reviewed the median advisory fees and expense ratios, including expense ratio components (e.g., transfer agency fees, administration fees, other operating expenses, distribution fees and fee waivers/reimbursements) of the peer group of funds. In response to a supplemental request, the Committee also received and reviewed aggregated advisory and administrative fees compared to the peer group average and median.
As part of its evaluation of each Fund’s advisory fee, the Committee considered how such fees compared to the advisory fee charged by the applicable Adviser to one or more other funds, separate accounts and/or other types of client portfolios and investment vehicles that it manages
| | THE GUGGENHEIM FUNDS ANNUAL REPORT | 65 |
OTHER INFORMATION (Unaudited)(continued) |
pursuant to a similar investment objective and strategies, to the extent applicable, noting that, in certain instances, Guggenheim charges a lower advisory fee to such other clients. In this connection, the Committee considered, among other things, Guggenheim’s representations about the significant differences between managing mutual funds as compared to other types of accounts, including the additional resources required to effectively manage mutual fund assets and the greater regulatory costs associated with the management of such assets. The Committee also considered Guggenheim’s explanation that lower fees are charged in certain instances due to various other factors, including the scope of contract, type of investors, applicable legal, governance and capital structures, tax status and historical pricing reasons. With respect to the difference in fees charged to a comparable client that is a mutual fund, as to which Guggenheim serves as sub-adviser, the Committee took into account the following: Guggenheim advises that it has less legal and regulatory exposure as a sub-adviser to an unaffiliated fund and does not take on the same business risk because Guggenheim is not the sponsor of that fund. The Committee concluded that the information it received demonstrated that the aggregate services provided to the Funds were sufficiently different from those provided to other clients with similar investment strategies and/or the risks borne by Guggenheim were sufficiently greater than those associated with managing other clients with similar investment strategies to support the difference in fees.
In further considering the comparative fee and expense data presented in the Contract Review Materials and addressed by Guggenheim, the Committee made the following observations:
Alpha Opportunity Fund: The average contractual advisory fee percentile rank across all share classes of the Fund and the asset weighted total net expense ratio are in the second quartile (27th and 46th percentiles, respectively) of its peer group. The Committee also considered that the Adviser had entered into an expense limitation agreement with respect to the Fund.
Floating Rate Strategies Fund: The average contractual advisory fee percentile rank across all share classes of the Fund is in the fourth quartile (83rd percentile) of its peer group and the asset weighted total net expense ratio is in the second quartile (45th percentile) of its peer group. The Committee also considered that the Adviser had entered into an expense limitation agreement with respect to the Fund.
High Yield Fund: The average contractual advisory fee percentile rank across all share classes of the Fund is in the second quartile (40th percentile) of its peer group and the asset weighted total net expense ratio is in the fourth quartile (77th percentile) of its peer group. The Committee also considered that the Adviser had entered into an expense limitation agreement with respect to the Fund.
Investment Grade Bond Fund: The average contractual advisory fee percentile rank across all share classes of the Fund is in the third quartile (54th percentile) of its peer group and the asset weighted total net expense ratio is in the fourth quartile (83rd percentile) of its peer group. The Committee also considered that the Adviser had entered into an expense limitation agreement with respect to the Fund.
66 | THE GUGGENHEIM FUNDS ANNUAL REPORT | |
OTHER INFORMATION (Unaudited)(continued) |
Large Cap Value Fund: The average contractual advisory fee percentile rank across all share classes of the Fund is in the first quartile (22nd percentile) of its peer group and the asset weighted total net expense ratio is in the second quartile (35th percentile) of its peer group. The Committee also considered that the Adviser had entered into an expense limitation agreement with respect to the Fund.
Limited Duration Fund: The average contractual advisory fee percentile rank across all share classes of the Fund is in the third quartile (66th percentile) of its peer group, as is the Fund’s asset weighted total net expense ratio (63rd percentile). The Committee also considered that the Adviser had entered into an expense limitation agreement with respect to the Fund.
Macro Opportunities Fund: The average contractual advisory fee percentile rank across all share classes of the Fund is in the fourth quartile (98th percentile) of its peer group, as is the Fund’s the asset weighted total net expense ratio (95th percentile). The Committee also considered that the Adviser had entered into an expense limitation agreement with respect to the Fund. In addition, the Committee noted that the Fund is categorized as a non-traditional bond fund which seeks to add value by investing in many non-traditional securities outside of fixed income, including equities, currencies, commodities and derivatives. In this connection, the Committee considered the Adviser’s statement that it supports the Fund with significant resources and a unique approach to drive performance for investors.
Mid Cap Value Fund: The average contractual advisory fee percentile rank across all share classes of the Fund is in the second quartile (37th percentile) of its peer group and the asset weighted total net expense ratio is in the fourth quartile (94th percentile) of its peer group.
Mid Cap Value Institutional Fund: The contractual advisory fee of the Fund is in the first quartile (6th percentile) of its peer group and the total net expense ratio is in the third quartile (63rd percentile) of its peer group.
Municipal Income Fund: The average contractual advisory fee percentile rank across all share classes of the Fund is in the second quartile (39th percentile) and the asset weighted total net expense ratio is in the 25th percentile of its peer group. The Committee also considered that the Adviser had entered into an expense limitation agreement with respect to the Fund.
Risk Managed Real Estate Fund: The average contractual advisory fee percentile rank across all share classes of the Fund and the asset weighted total net expense ratio are in the first quartile (1st percentile as to each) of its peer group.
StylePlus—Large Core Fund: The average contractual advisory fee percentile rank across all share classes of the Fund is in the third quartile (71st percentile) and the asset weighted total net expense ratio is in the fourth quartile (86th percentile) of its peer group.
StylePlus—Mid Growth Fund: The average contractual advisory fee percentile rank across all share classes of the Fund is in the second quartile (29th percentile) of its peer group and the asset weighted total net expense ratio is in the fourth quartile (92nd percentile) of its peer group.
| | THE GUGGENHEIM FUNDS ANNUAL REPORT | 67 |
OTHER INFORMATION (Unaudited)(continued) |
Small Cap Value Fund: The average contractual advisory fee percentile rank across all share classes of the Fund is in the fourth quartile (75th percentile) of its peer group and the asset weighted total net expense ratio is in the first quartile (11th percentile) of its peer group. The Committee also considered that the Adviser had entered into an expense limitation agreement with respect to the Fund.
Total Return Bond Fund: The average contractual advisory fee percentile rank across all share classes of the Fund is in the fourth quartile (93rd percentile) of its peer group and the asset weighted total net expense ratio is in the third quartile (65th percentile) of its peer group. The Committee also considered that the Adviser had entered into an expense limitation agreement with respect to the Fund.
World Equity Income Fund: The average contractual advisory fee percentile rank across all share classes of the Fund is in the second quartile (31st percentile) of its peer group and the asset weighted total net expense ratio is in the fourth quartile (92nd percentile) of its peer group. The Committee also considered that the Adviser had entered into an expense limitation agreement with respect to the Fund.
With respect to the costs of services provided and profits realized by Guggenheim Investments from its relationship with the Funds, the Committee reviewed a profitability analysis and data from management for each Fund setting forth the average assets under management for the twelve months ended December 31, 2015, ending assets under management as of December 31, 2015, gross revenues received by Guggenheim Investments, expenses allocated to the Fund, earnings and the operating margin/profitability rate, including variance information relative to the foregoing amounts as of December 31, 2014. In addition, the Chief Financial Officer of Guggenheim Investments reviewed with, and addressed questions from, the Committee concerning the expense allocation methodology employed in producing the profitability analysis.
In the course of its review of Guggenheim Investments’ profitability, the Committee took into account the methods used by Guggenheim Investments to determine expenses and profit and reviewed a report from an independent accounting firm evaluating Guggenheim Investments’ approach to allocating costs and determining the profitability of Guggenheim Investments with respect to individual funds and the entire fund complex. In evaluating the costs of services provided and the profitability to Guggenheim Investments, based upon the profitability rates presented by Guggenheim Investments and the conclusion of the independent accounting firm that the methodology used for calculating such rates was reasonable, the Committee concluded that the profits were not unreasonable.
The Committee considered other benefits available to each Adviser because of its relationship with the Funds and noted that Security Investors and GPIM may be deemed to benefit from arrangements whereby an affiliate, Rydex Fund Services, LLC, currently receives fees for (i) performing certain administrative functions and bookkeeping, accounting and pricing functions for the Funds pursuant to a Fund Accounting and Administration Agreement, and (ii) acting as transfer agent for the Funds and performing all shareholder servicing functions, including
68 | THE GUGGENHEIM FUNDS ANNUAL REPORT | |
OTHER INFORMATION (Unaudited)(continued) |
transferring record ownership, processing purchase and redemption transactions, answering inquiries, mailing shareholder communications, and acting as the dividend disbursing agent pursuant to a Transfer Agency Agreement. The Committee reviewed the compensation arrangements for the provision of the foregoing services, as well as Guggenheim’s profitability from providing such services. The Committee also noted Guggenheim’s statement that it may benefit from marketing synergies arising from offering a broad spectrum of products, including the Funds.
Economies of Scale: The Committee received and considered information regarding whether there have been economies of scale with respect to the management of the Funds as Fund assets grow, whether the Funds have appropriately benefited from any economies of scale, and whether there is potential for realization of any further economies of scale. The Committee considered whether economies of scale in the provision of services to the Funds were being passed along to the shareholders. The Committee noted the Adviser’s statement that Guggenheim continues to develop the infrastructure needed to support Fund asset growth and to achieve economies of scale across the firm’s various products and product lines. Thus, while Guggenheim may be benefiting from certain economies of scale and related cost efficiencies, it is concurrently realizing new costs and expenses associated with investment in infrastructure to support growth. The Committee took into account the additional information provided by Guggenheim at the Committee’s request regarding the investments made to support the growth of the organization, noting, among other things, enhancements to improve operational efficiency and further development of compliance-related functions, as well as Guggenheim’s view as to how such investments benefit the Funds.
As part of its assessment of economies of scale, the Committee also considered Guggenheim’s view that it seeks to share economies of scale through expense limitations and/or through advisory fees set at competitive rates pre-assuming future asset growth. Thus, the Committee considered the size of the Funds and the competitiveness of and/or other determinations made regarding the current advisory fee for each Fund, as well as whether a Fund is subject to an expense limitation.
As to the size of the Funds, the Committee took into account Guggenheim’s statement that generally the Funds’ assets are not sufficiently large to warrant breakpoints, with only three Funds—Floating Rate Strategies Fund, Macro Opportunities Fund, and Total Return Bond Fund—having assets in excess of (or approaching) $1 billion. With respect to the three Funds noted, the Committee considered the levels of profitability reported. The Committee also noted that each of the three Funds is subject to an expense limitation agreement, which results in a lower effective advisory fee.
The Committee determined that, taking into account all relevant factors, the advisory fee for each Fund was reasonable.
| | THE GUGGENHEIM FUNDS ANNUAL REPORT | 69 |
OTHER INFORMATION (Unaudited)(continued) |
Sub-Advisory Agreement
Nature, Extent and Quality of Services Provided by the Sub-Adviser: With respect to the nature, extent and quality of services provided by GPIM (referred to in this discussion as the “Sub-Adviser”), the Committee considered the qualifications, experience and skills of the Sub-Adviser’s portfolio management and other key personnel and information from the Sub-Adviser describing the scope of its services to Municipal Income Fund. The Committee also considered the information provided by the Sub-Adviser concerning the Sub-Adviser’s business continuity and information security plans and controls, and compliance policies and procedures, among other things.
With respect to Guggenheim’s resources and the Sub-Adviser’s ability to carry out its responsibilities under the Sub-Advisory Agreement, as noted above, the Committee considered the financial condition of GPIMH. (Thereafter, the Committee received the audited financial statements of GPIM as supplemental information.)
The Committee also considered the acceptability of the terms of the Sub-Advisory Agreement. Based on the foregoing, and based on other information received (both oral and written) at the April Meeting and at the May Meeting, as well as other considerations, including the Committee’s knowledge of how the Sub-Adviser performs its duties through Board meetings, discussions and reports throughout the year, the Committee concluded that the Sub-Adviser and its personnel were qualified to serve Municipal Income Fund in such capacity and may reasonably be expected to continue to provide a high quality of services under the Sub-Advisory Agreement.
Investment Performance: The Committee considered that the Fund’s Class A shares ranked in the third quartile (65th and 68th percentiles) of its performance universe for the five-year and three-year periods ended December 31, 2015, respectively. On January 13, 2012, the Fund acquired the assets and assumed the liabilities of TS&W/Claymore Tax-Advantaged Balanced Fund (the “Predecessor Fund”), a closed-end fund which used different investment strategies and had different investment advisers. Class A shares of the Fund have assumed the performance, financial and other historical information of the Predecessor Fund’s common shares and the performance of Class A shares of the Fund reflects the performance of the Predecessor Fund. In light of the foregoing, the Committee took into account more recent periods and noted that Fund’s Class A shares ranked in the fourth quartile for the one-year period ended December 31, 2015, and outperformed the performance universe median for the three-month period ended December 31, 2015, ranking in the 39th percentile. In considering the Fund’s performance for the one-year period, the Committee considered Guggenheim’s explanation that the Fund is managed very conservatively and the portfolio management team opted to maintain short duration by allocating to floating rate securities, which was a drag on performance for the period as the Federal Reserve increased interest rates fewer times than had been expected by the team. In light of all the facts and circumstances, the Committee concluded that the investment performance of the Fund and the Sub-Adviser was acceptable.
70 | THE GUGGENHEIM FUNDS ANNUAL REPORT | |
OTHER INFORMATION (Unaudited)(concluded) |
Comparative Fees, Costs of Services Provided and the Profits Realized by the Sub-Adviser from Its Relationship with the Fund: The Committee reviewed the level of sub-advisory fees payable to GPIM, noting that the fees are paid by Security Investors and do not impact the fees paid by the Fund.
Economies of Scale: The Committee recognized that, because the Sub-Adviser’s fees are paid by the Adviser and not the Fund, the analysis of economies of scale was more appropriate in the context of the Committee’s consideration of the applicable Advisory Agreement, which was separately considered. (See “Advisory Agreements – Economies of Scale” above.)
Overall Conclusions
Based on the foregoing, the Committee determined that the investment advisory fees are fair and reasonable in light of the extent and quality of the services provided and other benefits received and that the continuation of the Agreements is in the best interest of each Fund. In reaching this conclusion, no single factor was determinative or conclusive and each Committee member, in the exercise of his business judgment, may attribute different weights to different factors. At the May Meeting, the Committee, constituting all of the Independent Trustees, recommended the renewal of each Advisory Agreement and the Sub-Advisory Agreement for an additional annual term.
| | THE GUGGENHEIM FUNDS ANNUAL REPORT | 71 |
INFORMATION ON BOARD OF TRUSTEES AND OFFICERS (Unaudited) |
Name, Address* and Year of Birth | Position(s) Held with the Trust | Term of Office and Length of Time Served** | Principal Occupation(s) During Past Five Years | Number of Portfolios in Fund Complex Overseen | Other Directorships Held by Trustees |
INDEPENDENT TRUSTEES | | | |
Randall C. Barnes
(1951) | Trustee | Since 2014 | Current: Private Investor (2001-present).
Former: Senior Vice President and Treasurer, PepsiCo, Inc. (1993-1997); President, Pizza Hut International (1991-1993); Senior Vice President, Strategic Planning and New Business Development, PepsiCo, Inc. (1987-1990). | 101 | Current: Trustee, Purpose Investments Inc. (2014-Present). |
Donald A.
Chubb, Jr.
(1946 ) | Trustee | Since 1994 | Current: Business broker and manager of commercial real estate, Griffith & Blair, Inc. (1997-present). | 97 | Current: Midland Care, Inc. (2011-present). |
Jerry B. Farley
(1946) | Trustee | Since 2005 | Current: President, Washburn University (1997-present). | 97 | Current: Westar Energy, Inc. (2004-present); CoreFirst Bank & Trust (2000-present). |
Roman
Friedrich III
(1946) | Trustee and Chairman of the Contracts Review Committee | Since 2014 | Current: Founder and Managing Partner, Roman Friedrich & Company (1998-present).
Former: Senior Managing Director, MLV & Co. LLC (2010-2011). | 97 | Current: Zincore Metals, Inc. (2009-present).
Former: Axiom Gold and Silver Corp. (2011-2012). |
72 | THE GUGGENHEIM FUNDS ANNUAL REPORT | |
INFORMATION ON BOARD OF TRUSTEES AND OFFICERS (Unaudited)(continued) |
Name, Address* and Year of Birth | Position(s) Held with the Trust | Term of Office and Length of Time Served** | Principal Occupation(s) During Past Five Years | Number of Portfolios in Fund Complex Overseen | Other Directorships Held by Trustees |
INDEPENDENT TRUSTEES - continued | | |
Robert B. Karn III
(1942) | Trustee and Chairman of the Audit Committee | Since 2014 | Current: Consultant (1998-present).
Former: Arthur Andersen (1965-1997) and Managing Partner, Financial and Economic Consulting, St. Louis office (1987-1997). | 97 | Current: Peabody Energy Company (2003-present); GP Natural Resource Partners, LLC (2002- present). |
Ronald A. Nyberg
(1953) | Trustee and Chairman of the Nominating and Governance Committee | Since 2014 | Current: Partner, Momkus McCluskey Roberts LLC (2016-present).
Former: Partner, Nyberg & Cassioppi, LLC (2000-2016); Executive Vice President, General Counsel, and Corporate Secretary, Van Kampen Investments (1982-1999). | 103 | Current: Edward-Elmhurst Healthcare System (2012-present). |
Maynard F. Oliverius
(1943) | Trustee | Since 1998 | Current: Retired.
Former: President and CEO, Stormont-Vail HealthCare (1996-2012). | 97 | Current: Fort Hays State University Foundation (1999-present); Stormont-Vail Foundation (2013-present); University of Minnesota MHA Alumni Philanthropy Committee (2009-present). Former: Topeka Community Foundation (2009-2014). |
| | THE GUGGENHEIM FUNDS ANNUAL REPORT | 73 |
INFORMATION ON BOARD OF TRUSTEES AND OFFICERS (Unaudited)(continued) |
Name, Address* and Year of Birth | Position(s) Held with the Trust | Term of Office and Length of Time Served** | Principal Occupation(s) During Past Five Years | Number of Portfolios in Fund Complex Overseen | Other Directorships Held by Trustees |
INDEPENDENT TRUSTEES - concluded | | |
Ronald E.
Toupin, Jr.
(1958) | Trustee and Chairman of the Board | Since 2014 | Current: Portfolio Consultant (2010-present).
Former: Vice President, Manager and Portfolio Manager, Nuveen Asset Management (1998-1999); Vice President, Nuveen Investment Advisory Corp. (1992-1999); Vice President and Manager, Nuveen Unit Investment Trusts (1991-1999); and Assistant Vice President and Portfolio Manager, Nuveen Unit Investment Trusts (1988-1999), each of John Nuveen & Co., Inc. (1982-1999). | 100 | Former: Bennett Group of Funds (2011-2013). |
74 | THE GUGGENHEIM FUNDS ANNUAL REPORT | |
INFORMATION ON BOARD OF TRUSTEES AND OFFICERS (Unaudited)(continued) |
Name, Address* and Year of Birth | Position(s) Held with the Trust | Term of Office and Length of Time Served** | Principal Occupation(s) During Past Five Years | Number of Portfolios in Fund Complex Overseen | Other Directorships Held by Trustees |
INTERESTED TRUSTEE | |
Donald C. Cacciapaglia***
(1951) | President, Chief Executive Officer and Trustee | Since 2012 | Current: President and CEO, certain other funds in the Fund Complex (2012-present); Vice Chairman, Guggenheim Investments (2010-present).
Former: Chairman and CEO, Channel Capital Group, Inc. (2002-2010). | 232 | Current: Clear Spring Life Insurance Company (2015-present); Guggenheim Partners Japan, Ltd. (2014-present); Guggenheim Partners Investment Management Holdings, LLC (2014-present); Delaware Life (2013-present); Guggenheim Life and Annuity Company (2011-present); Paragon Life Insurance Company of Indiana (2011-present). |
* | The business address of each Trustee is c/o Guggenheim Investments, 227 West Monroe Street, Chicago, Illinois 60606. |
** | Each Trustee serves an indefinite term, until his successor is elected and qualified. Time served includes time served in the respective position for the Predecessor Corporation. |
*** | This Trustee is deemed to be an "interested person" of the Funds under the 1940 Act by reason of his position with the Funds' Investment Manager and/or the parent of the Investment Manager. |
| | THE GUGGENHEIM FUNDS ANNUAL REPORT | 75 |
INFORMATION ON BOARD OF TRUSTEES AND OFFICERS (Unaudited)(continued) |
Name, Address* and Year of Birth | Position(s) held with the Trust | Term of Office and Length of Time Served** | Principal Occupations
During Past Five Years |
OFFICERS | | | |
William H.
Belden, III
(1965) | Vice President | Since 2014 | Current: Vice President, certain other funds in the Fund Complex (2006-present); Managing Director, Guggenheim Funds Investment Advisors, LLC (2005-present).
Former: Vice President of Management, Northern Trust Global Investments (1999-2005). |
Joanna M. Catalucci
(1966) | AML Officer | Since 2016 | Current: Chief Compliance Officer, certain funds in the Fund Complex (2012-present); Senior Managing Director, Guggenheim Investments (2012-present); AML Officer, certain funds in the Fund Complex (2016-present).
Former: Chief Compliance Officer and Secretary, certain other funds in the Fund Complex (2008-2012); Senior Vice President & Chief Compliance Officer, Security Investors, LLC and certain affiliates (2010-2012); Chief Compliance Officer and Senior Vice President, Rydex Advisors, LLC and certain affiliates (2010-2011). |
James Howley
(1972) | Assistant Treasurer | Since 2014 | Current: Director, Guggenheim Investments (2004-present); Assistant Treasurer, certain other funds in the Fund Complex (2006-present).
Former: Manager, Mutual Fund Administration of Van Kampen Investments, Inc. (1996-2004). |
Keith D. Kemp
(1960) | Assistant Treasurer | Since 2016 | Current: Managing Director of Transparent Value, LLC (2015-present); Managing Director of Guggenheim Investments (2015-present).
Former: Director, Transparent Value, LLC (2010-2015); Director, Guggenheim Investments (2010-2015); Chief Operating Officer, Macquarie Capital Investment Management (2007-2009). |
Amy J. Lee
(1961) | Vice President and Chief Legal Officer | Since 2007
(Vice President)
Since 2014 (Chief Legal Officer) | Current: Chief Legal Officer, certain other funds in the Fund Complex (2013-present); Senior Managing Director, Guggenheim Investments (2012-present).
Former: Vice President, Associate General Counsel and Assistant Secretary, Security Benefit Life Insurance Company and Security Benefit Corporation (2004-2012). |
76 | THE GUGGENHEIM FUNDS ANNUAL REPORT | |
INFORMATION ON BOARD OF TRUSTEES AND OFFICERS (Unaudited)(continued) |
Name, Address* and Year of Birth | Position(s) held with the Trust | Term of Office and Length of Time Served** | Principal Occupations
During Past Five Years |
OFFICERS - continued | |
Mark E. Mathiasen
(1978) | Secretary | Since 2014 | Current: Secretary, certain other funds in the Fund Complex (2007-present); Managing Director, Guggenheim Investments (2007-present). |
Glenn McWhinnie
(1969) | Assistant Treasurer | Since 2016 | Current: Vice President, Guggenheim Investments (2009-present).
Former: Tax Compliance Manager, Ernst & Young LLP (1996-2009). |
Michael P. Megaris
(1984) | Assistant Secretary | Since 2014 | Current: Assistant Secretary, certain other funds in the Fund Complex (2014-present); Vice President, Guggenheim Investments (2012-present).
Former: J.D., University of Kansas School of Law (2009-2012). |
Elisabeth Miller
(1968) | Chief Compliance Officer | Since 2012 | Current: CCO, certain other funds in the Fund Complex (2012-present); CCO, Security Investors, LLC (2012-present); CCO, Guggenheim Funds Investment Advisors, LLC (2012-present); Managing Director, Guggenheim Investments (2012-present); Vice President, Guggenheim Funds Distributors, LLC (2014-present).
Former: CCO, Guggenheim Distributors, LLC (2009-2014); Senior Manager, Security Investors, LLC (2004-2009); Senior Manager, Guggenheim Distributors, LLC (2004-2009). |
Adam J. Nelson
(1979) | Assistant Treasurer | Since 2015 | Current: Vice President, Guggenheim Investments (2015-present); Assistant Treasurer, certain other funds in the Fund Complex (2015-present).
Former: Assistant Vice President and Fund Administration Director, State Street Corporation (2013-2015); Fund Administration Assistant Director, State Street (2011-2013); Fund Administration Manager, State Street (2009-2011). |
| | THE GUGGENHEIM FUNDS ANNUAL REPORT | 77 |
INFORMATION ON BOARD OF TRUSTEES AND OFFICERS (Unaudited)(concluded) |
Name, Address* and Year of Birth | Position(s) held with the Trust | Term of Office and Length of Time Served** | Principal Occupations
During Past Five Years |
OFFICERS - concluded | |
Kimberly Scott
(1974) | Assistant Treasurer | Since 2014 | Current: Vice President, Guggenheim Investments (2012-present); Assistant Treasurer, certain other funds in the Fund Complex (2012-present).
Former: Financial Reporting Manager, Invesco, Ltd. (2010-2011); Vice President/Assistant Treasurer, Mutual Fund Administration for Van Kampen Investments, Inc./Morgan Stanley Investment Management (2009-2010); Manager of Mutual Fund Administration, Van Kampen Investments, Inc./Morgan Stanley Investment Management (2005-2009). |
Bryan Stone
(1979) | Vice President | Since 2014 | Current: Vice President, certain other funds in the Fund Complex (2014-present); Director, Guggenheim Investments (2013-present).
Former: Senior Vice President, Neuberger Berman Group LLC (2009-2013); Vice President, Morgan Stanley (2002-2009). |
John L. Sullivan
(1955) | Chief Financial Officer and Treasurer | Since 2014 | Current: CFO, Chief Accounting Officer and Treasurer, certain other funds in the Fund Complex (2010-present); Senior Managing Director, Guggenheim Investments (2010-present).
Former: Managing Director and CCO, each of the funds in the Van Kampen Investments fund complex (2004-2010); Managing Director and Head of Fund Accounting and Administration, Morgan Stanley Investment Management (2002-2004); CFO and Treasurer, Van Kampen Funds (1996-2004). |
* | The business address of each officer is c/o Guggenheim Investments, 227 West Monroe Street, Chicago, Illinois 60606. |
** | Each officer serves an indefinite term, until his or her successor is duly elected and qualified. Time served includes time served in the respective position for the Predecessor Corporation. |
78 | THE GUGGENHEIM FUNDS ANNUAL REPORT | |
GUGGENHEIM INVESTMENTS PRIVACY POLICIES (Unaudited) |
Guggenheim Investments as used herein refers to Guggenheim Partners, LLC, Guggenheim Funds Investment Advisors, LLC, Guggenheim Partners Investment Management, LLC, Guggenheim Funds Distributors, LLC and Security Investors, LLC as well as the funds in the Guggenheim Funds complex (the “funds”).
Our Commitment to You
When you become a Guggenheim Investments investor, you entrust us with not only your hard-earned money but also with personal and financial information about you. We recognize that your relationship with us is based on trust and that you expect us to act responsibly and in your best interests. Because we have access to personal information about you, we hold ourselves to high standards in its safekeeping and use. This means, most importantly, that we do not sell client or account information to anyone—whether you are a current or former Guggenheim Investments client.
The Information We Collect About You and How We Collect It
In the course of doing business with shareholders and investors, we collect nonpublic personal information about you. You typically provide personal information when you complete a Guggenheim Investments account application or when you request a transaction that involves Rydex and Guggenheim Funds or one of the Guggenheim affiliated companies. “Nonpublic personal information” is personally identifiable information about you. For example it includes your name and address, Social Security or taxpayer identification number, assets, income, account balance, bank account information and investment activity (e.g. purchase and redemption history).
How We Share Your Personal Information
As a matter of policy, we do not disclose your nonpublic personal information to nonaffiliated third parties except as required or permitted by law. As emphasized above, we do not sell information about current or former clients or their accounts to third parties. Nor do we share such information, except when necessary to complete transactions at your request or to make you aware of related investment products and services that we offer. Additional details about how we handle your personal information are provided below.
To complete certain transactions or account changes that you direct, it may be necessary to provide your personal information to companies, individuals or groups that are not affiliated with Guggenheim Investments. For example if you ask to transfer assets from another financial institution to Guggenheim Investments, we will need to provide certain information about you to that company to complete the transaction. In connection with servicing your accounts or to alert you to other Guggenheim Investments investment products and services, we may share your information within the Guggenheim Investments family of affiliated companies. This would include, for example, sharing your information within Guggenheim Investments so we can make you aware of new funds or the services offered through another Guggenheim Investments
| | THE GUGGENHEIM FUNDS ANNUAL REPORT | 79 |
GUGGENHEIM INVESTMENTS PRIVACY POLICIES (Unaudited)(concluded) |
affiliated company. In certain instances, we may contract with nonaffiliated companies to perform services for us. Where necessary, we will disclose information we have about you to these third parties. In all such cases, we provide the third party with only the information necessary to carry out its assigned responsibilities and only for that purpose. And we require these third parties to treat your personal information with the same high degree of confidentiality that we do. In certain instances, we may share information with other financial institutions regarding individuals and entities in response to the U.S.A. Patriot Act. Finally we will share personal information about you if we are compelled by law to do so, if you direct us to do so with your consent, or in other circumstances as permitted by law.
How We Safeguard Your Personal Information
We maintain physical, electronic and procedural safeguards to protect your personal information. Within Guggenheim Investments, access to such information is limited to those who need it to perform their jobs such as servicing your account, resolving problems or informing you of new products and services.
80 | THE GUGGENHEIM FUNDS ANNUAL REPORT | |
This page intentionally left blank.
This page intentionally left blank.
This page intentionally left blank.
This page intentionally left blank.
This page intentionally left blank.
This page intentionally left blank.
This page intentionally left blank.
This page intentionally left blank.
This page intentionally left blank.
9.30.2016
Guggenheim Funds Annual Report
| |
Guggenheim Total Return Bond Fund | | |
GuggenheimInvestments.com | TRB-ANN-0916x0917 |
DEAR SHAREHOLDER | 2 |
ECONOMIC AND MARKET OVERVIEW | 4 |
ABOUT SHAREHOLDERS’ FUND EXPENSES | 6 |
TOTAL RETURN BOND FUND | 9 |
NOTES TO FINANCIAL STATEMENTS | 49 |
REPORT OF INDEPENDENT REGISTERED PUBLIC ACCOUNTING FIRM | 70 |
OTHER INFORMATION | 71 |
INFORMATION ON BOARD OF TRUSTEES AND OFFICERS | 86 |
GUGGENHEIM INVESTMENTS PRIVACY POLICIES | 93 |
| | THE GUGGENHEIM FUNDS ANNUAL REPORT | 1 |
Dear Shareholder:
Guggenheim Partners Investment Management, LLC (the “Investment Adviser”) is pleased to present the shareholder report for Guggenheim Total Return Bond Fund (the “Fund”) for the annual fiscal period ended September 30, 2016.
The Investment Adviser is part of Guggenheim Investments, which represents the investment management businesses of Guggenheim Partners, LLC (“Guggenheim”), a global, diversified financial services firm.
Guggenheim Funds Distributors, LLC is the distributor of the Fund. Guggenheim Funds Distributors, LLC is affiliated with Guggenheim and the Investment Adviser.
We encourage you to read the Economic and Market Overview section of the report, which follows this letter, and then the Managers’ Commentary for the Fund.
We are committed to providing innovative investment solutions and appreciate the trust you place in us.
Sincerely,
Donald C. Cacciapaglia
President and Chief Executive Officer
October 31, 2016
Read a prospectus and summary prospectus (if available) carefully before investing. It contains the investment objectives, risks, charges, expenses and other information, which should be considered carefully before investing. Obtain a prospectus and summary prospectus (if available) at guggenheiminvestments.com or call 800.820.0888.
2 | THE GUGGENHEIM FUNDS ANNUAL REPORT | |
Total Return Bond Fund may not be suitable for all investors. ● The Fund’s market value will change in response to interest rate changes and market conditions among other factors. In general, bond prices rise when interest rates fall and vice versa. ● The Fund’s exposure to high yield securities may subject the Fund to greater volatility. ● When market conditions are deemed appropriate, the Fund will leverage to the full extent permitted by its investment policies and restrictions and applicable law. Leveraging will exaggerate the effect on net asset value of any increase or decrease in the market value of the Fund’s portfolio. ● The Fund may invest in derivative instruments, which may be more volatile and less liquid, increasing the risk of loss when compared to traditional securities. Many of the derivative instruments are also subject to the risks of counterparty default and adverse tax treatment. ● Instruments and strategies (such as borrowing transactions and reverse repurchase agreements) may provide leveraged exposure to a particular investment, which will magnify any gains or losses on those investments. ● Investments in reverse repurchase agreements expose the Fund to many of the same risks as investments in derivatives. ● The Fund’s investments in other investment vehicles subject the Fund to those risks and expenses affecting the investment vehicle. ● The Fund’s investments in foreign securities carry additional risks when compared to U.S. securities, due to the impact of diplomatic, political, or economic developments in the country in question (investments in emerging markets securities are generally subject to an even greater level of risks). ● Investments in syndicated bank loans generally offer a floating interest rate and involve special types of risks. ● The Fund’s investments in municipal securities can be affected by events that affect the municipal bond market. ● The Fund’s investments in real estate securities subject the Fund to the same risks as direct investments in real estate, which is particularly sensitive to economic downturns. ● The Fund’s investments in restricted securities may involve financial and liquidity risk. ● You may have a gain or loss when you sell your shares. ● It is important to note that the Fund is not guaranteed by the U.S. government. ● Please read the prospectus for more detailed information regarding these and other risks.
| | THE GUGGENHEIM FUNDS ANNUAL REPORT | 3 |
ECONOMIC AND MARKET OVERVIEW (Unaudited) | September 30, 2016 |
Economic growth continues to rebound, even though the rise in U.S. Gross Domestic Product (“GDP”) disappointed in the first half of 2016. There was a large headwind from inventory drawdowns, which should soon reverse after five quarters of dragging on growth. Real GDP growth is expected to be around 2.5 percent in the second half of the year, driven by consumption, housing, and a fading trade drag, and supporting the view that U.S. economic growth remains resilient to global weakness.
The euro zone economy is slowly improving, but inflation will likely persist well below the European Central Bank’s (“ECB”) target in the coming quarters due to substantial slack. The ECB has indicated that more quantitative easing is possible, but will soon need to alter the quantitative easing program in order to keep up their purchase pace. Both China and Japan need weaker currencies. Chinese growth and capital flows have stabilized for now, but surging construction and a credit boom raise the prospect of future instability. Japan’s economic prospects are weak, and inflation remains far from the Bank of Japan’s (“BOJ”) target. The surging yen could drive further policy easing, including an increase in fiscal stimulus.
It appears the U.S. Federal Reserve (the “Fed”) will move forward with raising rates in December, absent any economic or geopolitical surprise or a meaningful tightening of financial conditions over the fourth quarter. But key events could influence risk asset performance for the balance of the year: A continued recovery in oil prices following the Organization of Petroleum Exporting Countries (“OPEC”) agreement to keep production between 32.5 to 33 million barrels per day would help sustain the rally (although we are skeptical that they will adhere to any quota based on historical production levels). Global oil inventories remain high, but supply and demand are moving toward balance. A rebound in GDP growth would also lift U.S. equity and corporate bond prices higher.
The macroeconomic picture remains the same; we are not on the verge of a recession. But despite our positive outlook on the U.S. economy, valuations across risk assets argue for caution. Ongoing accommodation from central bankers across the globe has alleviated much of the initial macroeconomic tail risk posed by Brexit but may not be enough to dampen the seasonal volatility typically observed in the fourth quarter. Ongoing troubles in the banking sector, such as the woes afflicting Deutsche Bank and Wells Fargo, coupled with uncertainty surrounding upcoming political events, which include the new Trump administration, the Italian constitutional referendum, and key European elections, may create volatility for risk assets for the balance of the year.
For the 12 months ended September 30, 2016, the Standard & Poor’s 500® (“S&P 500”) Index* returned 15.43%. The MSCI Europe-Australasia-Far East (“EAFE”) Index* returned 6.52%. The return of the MSCI Emerging Markets Index* was 16.78%.
4 | THE GUGGENHEIM FUNDS ANNUAL REPORT | |
ECONOMIC AND MARKET OVERVIEW (Unaudited)(concluded) | September 30, 2016 |
In the bond market, the Bloomberg Barclays U.S. Aggregate Bond Index* posted a 5.19% return for the period, while the Bloomberg Barclays U.S. Corporate High Yield Index* returned 12.73%. The return of the Bank of America (“BofA”) Merrill Lynch 3-Month U.S. Treasury Bill Index* was 0.28% for the 12-month period.
The opinions and forecasts expressed may not actually come to pass. This information is subject to change at any time, based on market and other conditions, and should not be construed as a recommendation of any specific security or strategy.
*Index Definitions
The following indices are referenced throughout this report. Indices are unmanaged and not available for direct investment. Index performance does not reflect transaction costs, fees, or expenses.
BofA Merrill Lynch 3-Month U.S. Treasury Bill Index is an unmanaged market Index of U.S. Treasury securities maturing in 90 days that assumes reinvestment of all income.
Bloomberg Barclays U.S. Aggregate Bond Index is a broad-based flagship benchmark that measures the investment grade, U.S. dollar denominated, fixed-rate taxable bond market, including U.S. Treasuries, government-related and corporate securities, mortgage-backed securities or “MBS” (agency fixed-rate and hybrid adjustable-rate mortgage, or “ARM”, pass-throughs), asset-backed securities (“ABS”), and commercial mortgage-backed securities (“CMBS”) (agency and non-agency).
Bloomberg Barclays U.S. Corporate High Yield Index measures the U.S. dollar denominated, high yield, fixed-rate corporate bond market. Securities are classified as high yield if the middle rating of Moody’s, Fitch, and S&P is Ba1/BB +/BB + or below.
MSCI EAFE Index is a capitalization-weighted measure of stock markets in Europe, Australasia, and the Far East.
MSCI Emerging Markets Index is a free float-adjusted market capitalization-weighted index that is designed to measure equity market performance in the global emerging markets.
S&P 500® Index is a broad-based index, the performance of which is based on the performance of 500 widely held common stocks chosen for market size, liquidity, and industry group representation.
| | THE GUGGENHEIM FUNDS ANNUAL REPORT | 5 |
ABOUT SHAREHOLDERS’ FUND EXPENSES |
All mutual funds have operating expenses, and it is important for our shareholders to understand the impact of costs on their investments. Shareholders of a fund incur two types of costs: (i) transaction costs, including sales charges (loads) on purchase payments, reinvested dividends, other distributions, and exchange fees, and (ii) ongoing costs, including management fees, administrative services, and shareholder reports, among others. These ongoing costs, or operating expenses, are deducted from a fund’s gross income and reduce the investment return of the fund.
A fund’s expenses are expressed as a percentage of its average net assets, which is known as the expense ratio. The following examples are intended to help investors understand the ongoing costs (in dollars) of investing in a fund and to compare these costs with the ongoing costs of investing in other mutual funds.
The examples are based on an investment of $1,000 made at the beginning of the period and held for the entire six-month period beginning March 31, 2016 and ending September 30, 2016.
The following tables illustrate the Fund’s costs in two ways:
Table 1. Based on actual Fund return: This section helps investors estimate the actual expenses paid over the period. The “Ending Account Value” shown is derived from the Fund’s actual return, and the fifth column shows the dollar amount that would have been paid by an investor who started with $1,000 in the Fund. Investors may use the information here, together with the amount invested, to estimate the expenses paid over the period. Simply divide the Fund’s account value by $1,000 (for example, an $8,600 account value divided by $1,000 = 8.6), then multiply the result by the number provided under the heading “Expenses Paid During Period.”
Table 2. Based on hypothetical 5% return: This section is intended to help investors compare a Fund’s cost with those of other mutual funds. The table provides information about hypothetical account values and hypothetical expenses based on the Fund’s actual expense ratio and an assumed rate of return of 5% per year before expenses, which is not the Fund’s actual return. The hypothetical account values and expenses may not be used to estimate the actual ending account balance or expenses paid during the period. The example is useful in making comparisons because the U.S. Securities and Exchange Commission (the “SEC”) requires all mutual funds to calculate expenses based on the 5% return. Investors can assess a Fund’s costs by comparing this hypothetical example with the hypothetical examples that appear in shareholder reports of other funds.
The calculations illustrated above assume no shares were bought or sold during the period. Actual costs may have been higher or lower, depending on the amount of investment and the timing of any purchases or redemptions.
6 | THE GUGGENHEIM FUNDS ANNUAL REPORT | |
ABOUT SHAREHOLDERS’ FUND EXPENSES (Unaudited)(continued) |
Please note that the expenses shown in the table are meant to highlight your ongoing costs only and do not reflect any transactional costs, such as sales charges (loads) on purchase payments, and contingent deferred sales charges (“CDSC”) on redemptions, if any. Therefore, the second table is useful in comparing ongoing costs only, and will not help you determine the relative total costs of owning different funds. In addition, if these transactional costs were included, your costs would have been higher.
More information about the Fund’s expenses, including annual expense ratios for periods up to five years (subject to the Fund’s inception date), can be found in the Financial Highlights section of this report. For additional information on operating expenses and other shareholder costs, please refer to the Fund’s prospectus.
| | THE GUGGENHEIM FUNDS ANNUAL REPORT | 7 |
ABOUT SHAREHOLDERS’ FUND EXPENSES (Unaudited)(concluded) |
| | Expense
Ratio1 | Fund
Return | Beginning
Account Value
March 31,
2016 | Ending
Account Value
September 30,
2016 | Expenses
Paid During
Period2 |
Table 1. Based on actual Fund return3 |
Total Return Bond Fund |
A-Class | 0.96% | 5.86% | $ 1,000.00 | $ 1,058.60 | $ 4.95 |
C-Class | 1.68% | 5.46% | 1,000.00 | 1,054.60 | 8.65 |
P-Class | 0.81% | 5.92% | 1,000.00 | 1,059.20 | 4.18 |
Institutional Class | 0.56% | 6.06% | 1,000.00 | 1,060.60 | 2.89 |
| |
Table 2. Based on hypothetical 5% return (before expenses) |
Total Return Bond Fund |
A-Class | 0.96% | 5.00% | $ 1,000.00 | $ 1,020.26 | $ 4.86 |
C-Class | 1.68% | 5.00% | 1,000.00 | 1,016.65 | 8.49 |
P-Class | 0.81% | 5.00% | 1,000.00 | 1,021.01 | 4.10 |
Institutional Class | 0.56% | 5.00% | 1,000.00 | 1,022.26 | 2.84 |
1 | Annualized and excludes expenses of the underlying funds in which the Fund invests. |
2 | Expenses are equal to the Fund's annualized expense ratio, net of any applicable fee waivers, multiplied by the average account value over the period, multiplied by 183/365 (to reflect the one-half year period). |
3 | Actual cumulative return at net asset value for the period March 31, 2016 to September 30, 2016. |
8 | THE GUGGENHEIM FUNDS ANNUAL REPORT | |
MANAGERS’ COMMENTARY (Unaudited) | |
To Our Shareholders
Guggenheim Total Return Bond Fund (the “Fund”) is managed by a team of seasoned professionals, including B. Scott Minerd, Chairman of Investments and Global Chief Investment Officer; Anne B. Walsh, Senior Managing Director and Assistant Chief Investment Officer; Jeffrey B. Abrams, Senior Managing Director and Portfolio Manager; James W. Michal, Senior Managing Director and Portfolio Manager; Steven H. Brown, CFA, Managing Director and Portfolio Manager; and Adam Bloch, Director and Portfolio Manager. In the following paragraphs, the investment team discusses the market environment and the Fund’s performance for the fiscal year ended September 30, 2016.
For the one-year period ended September 30, 2016, Guggenheim Total Return Bond Fund returned 6.88%1, compared with the 5.19% return of its benchmark, the Bloomberg Barclays U.S. Aggregate Bond Index.
The Fund seeks to provide total return, comprised of current income and capital appreciation. The Fund pursues its investment objective by investing primarily in high-quality, investment-grade fixed-income securities across multiple sectors. The Fund employs a tactical sector allocation strategy, offering the opportunity to capitalize on total return potential created by changing market conditions.
At the start of the period, the U.S. Federal Reserve (the “Fed”) announced a 25-basis-point increase in the federal funds target rate from 0–25 basis points to a range of 25–50 basis points on December 16, 2015. A number of other key events fueled the risk-off sentiment in the fourth quarter of 2015 that continued into 2016, but three were particularly damaging to risk assets. The first was the release of the much stronger-than-expected U.S. employment report in early November 2015, which boosted the odds that the Fed would begin raising interest rates. The second event was the European Central Bank’s (“ECB”) announcement of new stimulus measures at its December 2015 meeting, which disappointed market expectations. The third event was the December 2015 announcement by the Organization of Petroleum Exporting Countries (“OPEC”) that its members would continue to pump approximately 31.5 million barrels of crude oil per day. Risk assets rallied, however, in the latter half of the first quarter of 2016, led by a dovish pivot in Fed communication and positive economic data which helped to combat recession fears. By conveying a more cautious policy outlook, the Fed helped spur a reversal of dollar strength, a rally in crude oil, and spread tightening across risk assets.
The rally in risk assets that began in February 2016 was briefly interrupted in June by the UK’s vote to leave the European Union. Despite the two-day sell-off following the UK vote, high-yield bonds and bank loans held up. Current valuations in energy bonds indicate that leveraged credit has further room to rally as we pass the worst of the commodity related distress, but volatility is expected to remain elevated. A positive outlook for the U.S. economy, a cautious Fed, and stabilizing oil prices support our constructive view on corporate credit assets.
| | THE GUGGENHEIM FUNDS ANNUAL REPORT | 9 |
MANAGERS’ COMMENTARY (Unaudited)(concluded) | |
The Fund’s positive returns were attributable to duration, the Fund’s carry, and the tightening of credit spreads. Positive returns were driven by good credit selection in ABS (asset-backed securities, including collateralized loan obligations, or CLOs), mortgage-backed securities (including commercial mortgage-backed securities and non-Agency residential mortgage-backed securities, or non-Agency RMBS), high yield bonds, bank loans, and preferred securities.
Derivatives slightly detracted from performance for the year and were used to manage duration and hedge currency risk.
The Fund held a majority of the portfolio in structured credit, including ABS and CLOs. Most of the Fund’s structured credit holdings feature floating rate coupons, yields higher than traditional securitized assets like auto or credit-card receivables, and often, investment-grade ratings. The Fund believes that ABS and CLOs offer some downside protection, and amortizing structures to keep credit exposure lower over time. Floating rate instruments accounted for about half the Fund’s holdings at the end of the period.
Over the period, the Fund increased its exposure to bank loans and high yield corporate bonds, while exposure to municipal bonds and preferred securities declined. The increase in below-investment-grade assets sought to take advantage of dislocations in the credit markets during the period.
The Fund benefited from its barbell approach to managing duration as the interest rate curve flattened during the period. The Fund maintains higher duration than the benchmark at the long end of the curve mainly through long-maturity zero-coupon Treasury and Agency bonds. On the other end of the curve, short-term and floating rate assets are held, enabling the Fund to keep its effective duration at around 4.5 years for most of the period, compared with an average of 5.5 years for the Bloomberg Barclays U.S. Aggregate Bond Index. The Fund will continue to focus on allocating to structured credit that should shield investors from rate volatility without having to sacrifice yield.
The Fund invests excess cash into the Guggenheim Strategy Funds which, in turn, invest in a diversified portfolio of debt securities and financial instruments providing exposure to fixed income markets. The investment objective of the Guggenheim Strategy Funds is to seek a high level of income consistent with the preservation of capital. For the one-year period ended September 30, 2016, investment in the Guggenheim Strategy Funds has benefited Fund performance relative to investing in other short-term investments.
Performance displayed represents past performance which is no guarantee of future results.
1 | Performance figures are based on Class A shares and do not reflect deduction of the sales charges or taxes that a shareholder would pay on distributions or the redemption of shares. |
The opinions and forecast expressed may not actually come to pass. This information is subject to change at any time, based on market and other conditions, and should not be construed as a recommendation of any specific security or strategy.
10 | THE GUGGENHEIM FUNDS ANNUAL REPORT | |
PERFORMANCE REPORT AND FUND PROFILE (Unaudited) | September 30, 2016 |
TOTAL RETURN BOND FUND
OBJECTIVE: Seeks to provide total return, comprised of current income and capital appreciation.
Holdings Diversification (Market Exposure as % of Net Assets)
“Holdings Diversification (Market Exposure as % of Net Assets)” excludes any temporary cash investments or investments in Guggenheim Strategy Funds Trust mutual funds. Investments in those Funds do not provide “market exposure” to meet the Fund’s investment objective, but will significantly increase the portfolio’s exposure to certain other asset categories (and their associated risks), which may cause the Fund to deviate from its principal investment strategy, including: (i) high yield, high risk debt securities rated below the top four long-term rating categories by a nationally recognized statistical rating organization (also known as “junk bonds”); (ii) securities issued by the U.S. government or its agencies and instrumentalities; (iii) CLOs and similar investments; and (iv) other short-term fixed income securities.
| | THE GUGGENHEIM FUNDS ANNUAL REPORT | 11 |
PERFORMANCE REPORT AND FUND PROFILE (Unaudited)(continued) | September 30, 2016 |
Inception Dates: |
A-Class | November 30, 2011 |
C-Class | November 30, 2011 |
P-Class | May 1, 2015 |
Institutional Class | November 30, 2011 |
Portfolio Composition by Quality Rating1 |
Rating | % of Total Investments |
Fixed Income Instruments | |
AAA | 23.5% |
AA | 10.7% |
A | 16.1% |
BBB | 11.3% |
BB | 6.8% |
B | 6.4% |
CCC | 5.7% |
CC | 1.3% |
D | 0.1% |
NR2 | 12.7% |
Total | 94.6% |
Other Instruments | 5.4% |
Total Investments | 100.0% |
| | |
The chart above reflects percentages of the value of total investments. |
Ten Largest Holdings (% of Total Net Assets) |
U.S. Treasury Bonds | 4.6% |
U.S. Treasury Notes | 2.7% |
LSTAR Securities Investment Trust | 1.1% |
Fannie Mae | 1.0% |
VOLT L LLC | 1.0% |
Bayview Opportunity Master Fund IIIa Trust | 1.0% |
Freddie Mac | 0.8% |
Countrywide Asset-Backed Certificates | 0.8% |
State of California General Obligation Unlimited | 0.8% |
Putnam Structured Product Funding Ltd. | 0.8% |
Top Ten Total | 14.6% |
| | |
“Ten Largest Holdings” excludes any temporary cash or derivative investments. |
1 | Source: BlackRock Solutions. Credit quality ratings are measured on a scale that generally ranges from AAA (highest) to D (lowest). All securities except for those labeled “NR” have been rated by a Nationally Recognized Statistical Rating Organization (“NRSRO”). For purposes of this presentation, when ratings are available from more than one agency, the highest rating is used. Guggenheim Investments converts ratings to the equivalent S&P rating. |
2 | NR securities do not necessarily indicate low credit quality. |
12 | THE GUGGENHEIM FUNDS ANNUAL REPORT | |
PERFORMANCE REPORT AND FUND PROFILE (Unaudited)(concluded) | September 30, 2016 |
Cumulative Fund Performance*

Average Annual Returns*
Periods Ended September 30, 2016
| | 1 Year | Since Inception
(11/30/11) |
A-Class Shares | 6.88% | 6.40% |
A-Class Shares with sales charge† | 1.81% | 5.33% |
C-Class Shares | 6.08% | 5.62% |
C-Class Shares with CDSC‡ | 5.08% | 5.62% |
Institutional Class Shares | 7.26% | 6.77% |
Barclays U.S. Aggregate Bond Index | 5.19% | 3.18% |
| | | |
| | 1 Year | Since Inception
(05/01/15) |
P-Class Shares | 6.97% | 4.72% |
Barclays U.S. Aggregate Bond Index | 5.19% | 3.79% |
* | The performance data above represents past performance that is not predictive of future results. The investment return and principal value of an investment in the Fund will fluctuate so that an investor’s shares, when redeemed, may be worth more or less than their original cost. Returns are historical and include changes in principal and reinvested dividends and capital gains and do not reflect the effect of taxes. The Barclays U.S. Aggregate Bond Index is an unmanaged index and, unlike the Fund, has no management fees or operating expenses to reduce its reported return. The graph is based on A-Class shares only; performance for C-Class shares, P-Class shares and Institutional Class shares will vary due to differences in fee structures. |
† | Effective October 1, 2015, the maximum sales charge decreased from 4.75% to 4.00%. A 4.75% maximum sales charge is used in the calculation of the Average Annual Returns (based on subscriptions made prior to October 1, 2015), and a 4.00% maximum sales charge will be used to calculate performance for periods based on subscriptions made on or after October 1, 2015. |
‡ | Fund returns include a CDSC of 1% if redeemed within 12 months of purchase. |
| | THE GUGGENHEIM FUNDS ANNUAL REPORT | 13 |
SCHEDULE OF INVESTMENTS | September 30, 2016 |
TOTAL RETURN BOND FUND | |
| | | Shares | | | Value | |
| | | | | | | |
COMMON STOCKS† - 0.0% | |
| | | | | | | |
Energy - 0.0% | |
Titan Energy LLC* | | | 6,740 | | | $ | 198,830 | |
| | | | | | | | | |
Total Common Stocks | | | | | | | | |
(Cost $200,000) | | | | | | | 198,830 | |
| | | | | | | | | |
PREFERRED STOCKS†† - 0.0% | |
Industrial - 0.0% | |
Seaspan Corp. 6.38% due 04/30/191 | | | 44,000 | | | | 1,117,600 | |
| | | | | | | | | |
Financial - 0.0% | |
GSC Partners CDO Fund V Ltd. due 11/20/16*,†††,2,3,4 | | | 1,325 | | | | — | |
Total Preferred Stocks | | | | | | | | |
(Cost $1,205,780) | | | | | | | 1,117,600 | |
| | | | | | | | | |
MUTUAL FUNDS† - 1.6% | |
Floating Rate Strategies Fund - Institutional Class5 | | | 773,117 | | | | 20,054,667 | |
Guggenheim Limited Duration Fund - Institutional Class5 | | | 625,391 | | | | 15,453,399 | |
Guggenheim Strategy Fund I5 | | | 482,232 | | | | 12,050,977 | |
Guggenheim Strategy Fund II5 | | | 430,390 | | | | 10,733,931 | |
Guggenheim Strategy Fund III5 | | | 253,888 | | | | 6,342,121 | |
Total Mutual Funds | | | | | | | | |
(Cost $64,130,852) | | | | | | | 64,635,095 | |
| | | | | | | | | |
CLOSED-END FUNDS† - 0.2% | |
Guggenheim Strategic Opportunities Fund5 | | | 481,691 | | | | 9,205,115 | |
Total Closed-End Funds | | | | | | | | |
(Cost $8,478,228) | | | | | | | 9,205,115 | |
| | | | | | | | | |
SHORT TERM INVESTMENTS† - 3.1% | |
Federated U.S. Treasury Cash Reserve Fund Institutional Shares 0.17%6 | | | 124,358,399 | | | | 124,358,399 | |
Total Short Term Investments | | | | | |
(Cost $124,358,399) | | | | | | | 124,358,399 | |
| | | Face
Amount15 | | | | |
| | | | | | | |
ASSET-BACKED SECURITIES†† - 31.0% | |
Collateralized Loan Obligations - 21.9% | |
CIFC Funding Ltd. | | | | | | |
2015-2A, 2.74% due 12/05/242,3 | | $ | 18,500,000 | | | | 18,465,865 | |
2015-3A, 2.79% due 10/19/272,3 | | | 9,750,000 | | | | 9,739,382 | |
2014-3X INC, due 07/22/264 | | | 9,500,000 | | | | 5,953,131 | |
2013-3A, 3.36% due 10/24/252,3 | | | 3,500,000 | | | | 3,440,233 | |
2007-1A, 2.31% due 05/10/212,3 | | | 3,250,000 | | | | 3,164,738 | |
2015-1A, 2.90% due 01/22/272,3 | | | 3,000,000 | | | | 3,000,206 | |
2013-4A, 4.08% due 11/27/242,3 | | | 2,250,000 | | | | 2,250,493 | |
2015-2A, 2.78% due 04/15/272,3 | | | 2,000,000 | | | | 1,988,690 | |
2014-1A, 3.89% due 08/14/242,3 | | | 1,250,000 | | | | 1,250,410 | |
2014-1A, 3.48% due 04/18/252,3 | | | 500,000 | | | | 500,039 | |
OCP CLO Ltd. | | | | | | | | |
2016-11A, 3.03% due 04/26/282,3 | | | 18,500,000 | | | | 18,440,965 | |
2016-11A, 4.08% due 04/26/282,3 | | | 7,000,000 | | | | 6,998,745 | |
2014-6A, 5.63% due 07/17/262,3 | | | 6,200,000 | | | | 5,353,367 | |
2015-8A, 6.18% due 04/17/272,3 | | | 5,000,000 | | | | 4,225,000 | |
14 | THE GUGGENHEIM FUNDS ANNUAL REPORT | SEE NOTES TO FINANCIAL STATEMENTS. |
SCHEDULE OF INVESTMENTS (continued) | September 30, 2016 |
TOTAL RETURN BOND FUND | |
| | | Face
Amount15 | | | Value | |
| | | | | | | |
2014-6A, 3.78% due 07/17/262,3 | | $ | 4,000,000 | | | $ | 3,999,812 | |
2014-7A, 2.80% due 10/20/262,3 | | | 3,500,000 | | | | 3,499,767 | |
2013-4A, 3.46% due 10/24/252,3 | | | 2,250,000 | | | | 2,217,203 | |
2014-6A, 2.73% due 07/17/262,3 | | | 1,500,000 | | | | 1,496,308 | |
Golub Capital Partners CLO Ltd. | | | | | | | | |
2015-25A, 2.58% due 08/05/272,3 | | | 16,500,000 | | | | 16,066,846 | |
2015-24A, 3.48% due 02/05/272,3 | | | 5,000,000 | | | | 4,953,629 | |
2013-17A, 3.11% due 10/25/252,3 | | | 3,250,000 | | | | 3,198,582 | |
2014-21A, 3.16% due 10/25/262,3 | | | 2,700,000 | | | | 2,651,279 | |
2014-10A, 3.65% due 10/20/212,3 | | | 1,000,000 | | | | 999,598 | |
2014-18A, 4.21% due 04/25/262,3 | | | 500,000 | | | | 495,047 | |
2013-17A, 4.54% due 10/25/252,3 | | | 400,000 | | | | 397,684 | |
LMREC, Inc. | | | | | | | | |
2015-CRE1, 2.29% due 02/22/322,3 | | | 20,000,000 | | | | 19,682,695 | |
2015-CRE1, 4.04% due 02/22/322,3 | | | 2,000,000 | | | | 1,912,237 | |
Great Lakes CLO Ltd. | | | | | | | | |
2015-1A, 2.63% due 07/15/262,3 | | | 10,000,000 | | | | 9,924,576 | |
2012-1A, 3.43% due 01/15/232,3 | | | 4,000,000 | | | | 3,988,696 | |
2015-1A, 3.38% due 07/15/262,3 | | | 4,000,000 | | | | 3,932,803 | |
2012-1A, 4.78% due 01/15/232,3 | | | 1,250,000 | | | | 1,231,102 | |
2012-1A, due 01/15/234,16 | | | 1,000,000 | | | | 402,572 | |
2014-1A, 4.38% due 04/15/252,3 | | | 250,000 | | | | 242,783 | |
Fortress Credit BSL II Ltd. | | | | | | | | |
2013-2A, 2.19% due 10/19/252,3,7 | | | 15,500,000 | | | | 15,534,847 | |
2013-2A, 2.94% due 10/19/252,3 | | | 4,000,000 | | | | 4,023,714 | |
Brightwood Capital Fund III Holdings | | | | | | | | |
3.32% due 04/29/23 | | | 17,500,000 | | | | 17,375,494 | |
Regatta IV Funding Ltd. | | | | | | | | |
2014-1A, 3.66% due 07/25/262,3 | | | 13,500,000 | | | | 13,499,139 | |
2014-1A, 5.66% due 07/25/262,3 | | | 4,621,000 | | | | 3,774,667 | |
Shackleton CLO Ltd. | | | | | | | | |
2015-8A, 3.65% due 10/20/272,3 | | | 7,600,000 | | | | 7,567,259 | |
2013-4A, 2.67% due 01/13/252,3 | | | 5,000,000 | | | | 4,988,773 | |
2014-6A, 3.78% due 07/17/262,3 | | | 2,950,000 | | | | 2,929,790 | |
2013-3A, 6.18% due 04/15/252,3 | | | 2,250,000 | | | | 1,701,740 | |
Black Diamond CLO Ltd. | | | | | | | | |
2013-1A, 2.16% due 02/01/232,3 | | | 14,000,464 | | | | 13,891,857 | |
2014-1A, 3.53% due 02/06/262,3 | | | 2,000,000 | | | | 1,964,876 | |
2013-1A, 4.01% due 02/01/232,3 | | | 650,000 | | | | 654,113 | |
PFP Ltd. | | | | | | | | |
2015-2, 2.53% due 07/14/342,3 | | | 16,500,000 | | | | 16,448,035 | |
Garrison Funding Ltd. | | | | | | | | |
2016-2A, 3.06% due 09/29/272,3 | | | 7,000,000 | | | | 7,000,000 | |
2015-1A, 3.33% due 05/25/272,3 | | | 6,250,000 | | | | 6,263,705 | |
2016-2A, 4.01% due 09/29/272,3 | | | 2,250,000 | | | | 2,243,925 | |
WhiteHorse VIII Ltd. | | | | | | | | |
2014-1A, 2.81% due 05/01/262,3 | | | 15,750,000 | | | | 15,457,167 | |
RFTI Issuer Ltd. | | | | | | | | |
2015-FL1, 2.27% due 08/15/303,16 | | | 10,000,000 | | | | 9,980,131 | |
2015-FL1, 4.40% due 08/15/303,16 | | | 5,000,000 | | | | 4,987,286 | |
SEE NOTES TO FINANCIAL STATEMENTS. | THE GUGGENHEIM FUNDS ANNUAL REPORT | 15 |
SCHEDULE OF INVESTMENTS (continued) | September 30, 2016 |
TOTAL RETURN BOND FUND | |
| | | Face
Amount15 | | | Value | |
| | | | | | | |
Fortress Credit Investments IV Ltd. | | | | | | |
2015-4A, 2.58% due 07/17/232,3 | | $ | 14,000,000 | | | $ | 13,919,173 | |
2015-4A, 3.58% due 07/17/232,3 | | | 1,000,000 | | | | 958,374 | |
Marea CLO Ltd. | | | | | | | | |
2015-1A, 2.48% due 10/15/232,3,7 | | | 14,393,000 | | | | 14,328,751 | |
Oaktree EIF II Series Ltd. | | | | | | | | |
2014-A2, 3.12% due 11/15/252,3 | | | 8,000,000 | | | | 8,000,142 | |
2014-A2, 4.02% due 11/15/252,3 | | | 5,300,000 | | | | 5,299,738 | |
0.97% due 10/23/21 | | | 11,424,767 | | | | 11,294,962 | |
due 10/25/21 | | | 1,750,000 | | | | 1,750,000 | |
Treman Park CLO Ltd. | | | | | | | | |
2015-1A, due 04/20/273,4 | | | 13,600,000 | | | | 11,601,307 | |
Atrium XI | | | | | | | | |
2014-11A, 3.91% due 10/23/252,3 | | | 11,500,000 | | | | 11,500,894 | |
Venture XI CLO Ltd. | | | | | | | | |
2015-11A, 2.77% due 11/14/222,3 | | | 11,500,000 | | | | 11,478,855 | |
Carlyle Global Market Strategies CLO Ltd. | | | | | | | | |
2012-3A, due 10/04/243,4 | | | 8,920,000 | | | | 7,050,642 | |
2014-1A, 3.68% due 04/17/252,3 | | | 2,500,000 | | | | 2,500,433 | |
2014-2A, 4.60% due 07/20/232,3 | | | 750,000 | | | | 747,070 | |
Babson CLO Ltd. | | | | | | | | |
2014-3A, 3.68% due 01/15/262,3 | | | 7,000,000 | | | | 7,000,059 | |
2012-2A, due 05/15/233,4 | | | 4,750,000 | | | | 2,229,088 | |
2014-IA, due 07/20/253,4 | | | 1,300,000 | | | | 790,687 | |
ACIS CLO Ltd. | | | | | | | | |
2015-6A, 3.24% due 05/01/272,3 | | | 7,500,000 | | | | 7,470,373 | |
2013-1A, 3.63% due 04/18/242,3 | | | 1,650,000 | | | | 1,609,367 | |
2013-2A, 3.88% due 10/14/222,3 | | | 375,000 | | | | 374,292 | |
TICP CLO III Ltd. | | | | | | | | |
2014-3A, 3.05% due 01/20/272,3 | | | 7,000,000 | | | | 7,000,558 | |
2014-3A, 3.95% due 01/20/272,3 | | | 2,250,000 | | | | 2,250,497 | |
West CLO Ltd. | | | | | | | | |
2012-1A, 3.16% due 10/30/232,3 | | | 9,200,000 | | | | 9,214,881 | |
Resource Capital Corporation | | | | | | | | |
2015-CRE3, 2.93% due 03/15/322,3 | | | 4,500,000 | | | | 4,331,866 | |
2015-CRE3, 3.68% due 03/15/322,3 | | | 3,000,000 | | | | 2,858,608 | |
2014-CRE2, 3.03% due 04/15/322,3 | | | 2,000,000 | | | | 1,886,057 | |
Dryden 37 Senior Loan Fund | | | | | | | | |
2015-37A, due 04/15/273,4 | | | 10,000,000 | | | | 8,923,261 | |
Venture XVII CLO Ltd. | | | | | | | | |
2014-17A, 3.53% due 07/15/262,3 | | | 8,750,000 | | | | 8,613,290 | |
Neuberger Berman CLO XVII Ltd. | | | | | | | | |
2014-17A, 3.53% due 08/04/252,3 | | | 8,500,000 | | | | 8,386,304 | |
Voya CLO Ltd. | | | | | | | | |
2013-1X, due 04/15/244 | | | 9,500,000 | | | | 5,827,300 | |
2015-3A, 3.63% due 10/15/222,3 | | | 2,250,000 | | | | 2,249,896 | |
KKR CLO Ltd. | | | | | | | | |
2015-12, 2.98% due 07/15/272,3 | | | 8,000,000 | | | | 8,002,640 | |
Fifth Street SLF II Ltd. | | | | | | | | |
2015-2A, 2.67% due 09/29/272,3 | | | 8,000,000 | | | | 7,845,834 | |
Newstar Commercial Loan Funding LLC | | | | | | | | |
2016-1A, 4.58% due 02/25/282,3 | | | 5,750,000 | | | | 5,723,212 | |
2015-1A, 3.50% due 01/20/272,3 | | | 1,000,000 | | | | 967,476 | |
2013-1A, 5.41% due 09/20/232,3 | | | 700,000 | | | | 652,016 | |
16 | THE GUGGENHEIM FUNDS ANNUAL REPORT | SEE NOTES TO FINANCIAL STATEMENTS. |
SCHEDULE OF INVESTMENTS (continued) | September 30, 2016 |
TOTAL RETURN BOND FUND | |
| | | Face
Amount15 | | | Value | |
| | | | | | | |
2014-1A, 4.30% due 04/20/252,3 | | $ | 500,000 | | | $ | 491,196 | |
Covenant Credit Partners CLO I Ltd. | | | | | | | | |
2014-1A, 3.62% due 07/20/262,3 | | | 7,300,000 | | | | 7,298,318 | |
Ares XXVI CLO Ltd. | | | | | | | | |
2013-1A, 3.43% due 04/15/252,3 | | | 5,000,000 | | | | 4,970,752 | |
2013-1A, due 04/15/253,4 | | | 4,300,000 | | | | 2,081,231 | |
Vibrant CLO Limited | | | | | | | | |
2015-1A, 3.48% due 07/17/242,3 | | | 7,000,000 | | | | 7,000,035 | |
Vibrant Clo IV Ltd. | | | | | | | | |
2016-4A, 3.08% due 07/20/282,3 | | | 7,000,000 | | | | 6,996,444 | |
TICC CLO LLC | | | | | | | | |
2012-1A, 4.33% due 08/25/232,3 | | | 6,250,000 | | | | 6,306,972 | |
2012-1A, 5.58% due 08/25/232,3 | | | 350,000 | | | | 350,202 | |
Marathon CLO VII Ltd. | | | | | | | | |
2014-7A, 4.24% due 10/28/252,3 | | | 4,000,000 | | | | 3,960,294 | |
2014-7A, 3.39% due 10/28/252,3 | | | 2,500,000 | | | | 2,499,879 | |
Cereberus ICQ Levered LLC | | | | | | | | |
2015-1A, 2.73% due 11/06/252,3 | | | 4,000,000 | | | | 3,963,234 | |
2015-1A, 3.73% due 11/06/252,3 | | | 2,250,000 | | | | 2,249,857 | |
Fifth Street Senior Loan Fund I LLC | | | | | | | | |
2015-1A, 2.70% due 01/20/272,3 | | | 5,000,000 | | | | 4,939,837 | |
2015-1A, 3.70% due 01/20/272,3 | | | 1,250,000 | | | | 1,255,771 | |
Northwoods Capital XIV Ltd. | | | | | | | | |
2014-14A, 3.28% due 11/12/252,3 | | | 6,000,000 | | | | 6,056,601 | |
Avery | | | | | | | | |
2013-3X COM, due 01/18/254 | | | 7,500,060 | | | | 6,033,048 | |
Steele Creek CLO Ltd. | | | | | | | | |
2014-1A, 3.06% due 08/21/262,3 | | | 5,800,000 | | | | 5,771,000 | |
2014-1A, 4.01% due 08/21/262,3 | | | 250,000 | | | | 250,001 | |
Fortress Credit Opportunities III CLO, LP | | | | | | | | |
2014-3A, 2.56% due 04/28/262,3 | | | 5,000,000 | | | | 4,988,998 | |
2014-3A, 3.16% due 04/28/262,3 | | | 650,000 | | | | 645,093 | |
2014-3A, 3.91% due 04/28/262,3 | | | 400,000 | | | | 376,437 | |
Fortress Credit Funding V, LP | | | | | | | | |
2015-5A, 3.47% due 08/15/222,3 | | | 6,000,000 | | | | 5,971,996 | |
Babson CLO Limited | | | | | | | | |
2014-IA, 3.40% due 07/20/252,3 | | | 5,950,000 | | | | 5,886,190 | |
TICP CLO II Ltd. | | | | | | | | |
2014-2A, 3.70% due 07/20/262,3 | | | 3,000,000 | | | | 2,964,463 | |
2014-2A, 4.00% due 07/20/262,3 | | | 2,850,000 | | | | 2,651,345 | |
ARES CLO Ltd. | | | | | | | | |
2016-3A, 4.45% due 01/17/242,3 | | | 5,550,000 | | | | 5,557,825 | |
Muir Woods CLO Ltd. | | | | | | | | |
2012-1A, 3.46% due 09/14/232,3 | | | 5,500,000 | | | | 5,502,986 | |
TICP CLO I Ltd. | | | | | | | | |
2014-1A, 3.72% due 04/26/262,3 | | | 5,500,000 | | | | 5,499,536 | |
Catamaran CLO Ltd. | | | | | | | | |
2012-1A, 6.11% due 12/20/232,3 | | | 3,000,000 | | | | 2,655,370 | |
2014-2A, 6.33% due 10/18/262,3 | | | 2,500,000 | | | | 1,718,739 | |
2015-1A, 3.80% due 04/22/272,3 | | | 1,000,000 | | | | 988,412 | |
SEE NOTES TO FINANCIAL STATEMENTS. | THE GUGGENHEIM FUNDS ANNUAL REPORT | 17 |
SCHEDULE OF INVESTMENTS (continued) | September 30, 2016 |
TOTAL RETURN BOND FUND | |
| | | Face
Amount15 | | | Value | |
| | | | | | | |
OHA Credit Partners IX Ltd. | | | | | | |
2013-9A, due 10/20/253,4 | | $ | 6,000,000 | | | $ | 5,252,465 | |
AIMCO CLO Series | | | | | | | | |
2015-AA, 2.98% due 01/15/282,3 | | | 5,000,000 | | | | 5,029,796 | |
Fortress Credit Opportunities VI CLO Ltd. | | | | | | | | |
2015-6A, 3.55% due 10/10/262,3 | | | 5,000,000 | | | | 4,953,811 | |
Cerberus Onshore II CLO LLC | | | | | | | | |
2014-1A, 2.68% due 10/15/232,3 | | | 2,645,816 | | | | 2,644,177 | |
2014-1A, 2.98% due 10/15/232,3 | | | 2,250,000 | | | | 2,251,151 | |
Mountain Hawk II CLO Ltd. | | | | | | | | |
2013-2A, 2.40% due 07/22/242,3 | | | 5,000,000 | | | | 4,848,544 | |
Telos CLO Ltd. | | | | | | | | |
2013-3A, 3.68% due 01/17/242,3 | | | 2,000,000 | | | | 1,999,874 | |
2014-6A, 2.78% due 01/17/272,3 | | | 1,500,000 | | | | 1,499,912 | |
2007-2A, 2.88% due 04/15/222,3 | | | 1,100,000 | | | | 1,061,644 | |
Marathon CLO V Ltd. | | | | | | | | |
2013-5A, 3.16% due 02/21/252,3 | | | 4,500,000 | | | | 4,490,124 | |
Halcyon Loan Advisors Funding Ltd. | | | | | | | | |
2012-2A, 3.71% due 12/20/242,3 | | | 4,000,000 | | | | 3,896,915 | |
2012-2A, 5.36% due 12/20/242,3 | | | 600,000 | | | | 565,650 | |
Canyon Capital CLO Ltd. | | | | | | | | |
2013-1A, 2.63% due 01/15/242,3 | | | 4,000,000 | | | | 4,005,311 | |
ACAS CLO Ltd. | | | | | | | | |
2014-1A, 3.18% due 09/20/232,3 | | | 4,000,000 | | | | 3,999,987 | |
LCM XI, LP | | | | | | | | |
2012-11A, 3.64% due 04/19/222,3 | | | 4,000,000 | | | | 3,999,829 | |
Cavalry CLO II | | | | | | | | |
2013-2A, 2.03% due 01/17/242,3 | | | 4,000,000 | | | | 3,991,000 | |
Regatta III Funding Ltd. | | | | | | | | |
2014-1A, 3.53% due 04/15/262,3 | | | 4,000,000 | | | | 3,967,413 | |
MT Wilson CLO II Ltd. | | | | | | | | |
2007-2A, 3.41% due 07/11/202,3 | | | 4,000,000 | | | | 3,891,003 | |
Kingsland V Ltd. | | | | | | | | |
2007-5A, 1.47% due 07/14/212,3 | | | 4,000,000 | | | | 3,857,740 | |
Anchorage Capital CLO 4 Ltd. | | | | | | | | |
2014-4A, 2.90% due 07/28/262,3 | | | 3,600,000 | | | | 3,629,509 | |
Dryden XXV Senior Loan Fund | | | | | | | | |
2012-25A, 3.68% due 01/15/252,3 | | | 3,600,000 | | | | 3,591,892 | |
Cent CLO | | | | | | | | |
2014-16A, 3.01% due 08/01/242,3 | | | 1,750,000 | | | | 1,750,201 | |
2014-16A, 3.96% due 08/01/242,3 | | | 1,750,000 | | | | 1,750,120 | |
Madison Park Funding VIII Ltd. | | | | | | | | |
2014-8A, 3.50% due 04/22/222,3 | | | 2,000,000 | | | | 2,000,147 | |
2014-8A, 2.90% due 04/22/222,3 | | | 1,500,000 | | | | 1,499,997 | |
Greywolf CLO III Ltd. | | | | | | | | |
2014-1A, 3.55% due 04/22/262,3 | | | 2,000,000 | | | | 1,994,589 | |
2014-1A, 2.75% due 04/22/262,3 | | | 1,500,000 | | | | 1,503,421 | |
ACRE Commercial Mortgage Trust | | | | | | | | |
2014-FL2, 3.03% due 08/15/312,3 | | | 3,500,000 | | | | 3,476,687 | |
18 | THE GUGGENHEIM FUNDS ANNUAL REPORT | SEE NOTES TO FINANCIAL STATEMENTS. |
SCHEDULE OF INVESTMENTS (continued) | September 30, 2016 |
TOTAL RETURN BOND FUND | |
| | | Face
Amount15 | | | Value | |
| | | | | | | |
CFIP CLO Ltd. | | | | | | |
2014-1A, 2.14% due 04/13/252,3 | | $ | 3,400,000 | | | $ | 3,383,624 | |
Oaktree EIF I Series A1 Ltd. | | | | | | | | |
2016-A, 4.34% due 01/20/272,3 | | | 3,250,000 | | | | 3,257,067 | |
NewMark Capital Funding CLO Ltd. | | | | | | | | |
2014-2A, 3.11% due 06/30/262,3 | | | 3,250,000 | | | | 3,251,427 | |
Dryden XXIII Senior Loan Fund | | | | | | | | |
2014-23A, 4.58% due 07/17/232,3 | | | 2,000,000 | | | | 1,991,738 | |
2014-23A, 3.63% due 07/17/232,3 | | | 1,250,000 | | | | 1,238,122 | |
Recette CLO LLC | | | | | | | | |
2015-1A, 3.50% due 10/20/272,3 | | | 3,250,000 | | | | 3,223,287 | |
THL Credit Wind River CLO Ltd. | | | | | | | | |
2014-2A, 5.93% due 07/15/262,3 | | | 3,600,000 | | | | 3,199,354 | |
Fortress Credit Opportunities V CLO Ltd. | | | | | | | | |
2014-5A, 4.21% due 10/15/262,3 | | | 1,750,000 | | | | 1,682,106 | |
2014-5A, 3.31% due 10/15/262,3 | | | 1,500,000 | | | | 1,488,837 | |
KVK CLO Ltd. | | | | | | | | |
2013-2A, 2.68% due 01/15/262,3 | | | 1,750,000 | | | | 1,708,251 | |
2013-1A, due 04/14/253,4 | | | 3,800,000 | | | | 1,384,287 | |
Madison Park Funding Ltd. | | | | | | | | |
2007-6A, 3.97% due 07/26/212,3 | | | 3,000,000 | | | | 3,012,956 | |
Venture X CLO Ltd. | | | | | | | | |
2012-10A, 3.95% due 07/20/222,3 | | | 3,000,000 | | | | 3,000,157 | |
Atlas Senior Loan Fund VI Ltd. | | | | | | | | |
2014-6A, 3.68% due 10/15/262,3 | | | 3,000,000 | | | | 2,999,810 | |
Octagon Investment Partners XIX Ltd. | | | | | | | | |
2014-1A, 3.53% due 04/15/262,3 | | | 3,000,000 | | | | 2,989,905 | |
Benefit Street Partners CLO Ltd. | | | | | | | | |
2015-IA, 3.78% due 10/15/252,3 | | | 3,000,000 | | | | 2,989,374 | |
Ivy Hill Middle Market Credit Fund VII Ltd. | | | | | | | | |
2013-7A, 3.00% due 10/20/252,3 | | | 2,000,000 | | | | 1,946,044 | |
2013-7A, 4.15% due 10/20/252,3 | | | 1,000,000 | | | | 951,417 | |
Crown Point CLO III Ltd. | | | | | | | | |
2015-3A, 3.73% due 12/31/272,3 | | | 3,000,000 | | | | 2,879,188 | |
Flatiron CLO Ltd. | | | | | | | | |
2013-1A, 3.43% due 01/17/262,3 | | | 1,450,000 | | | | 1,446,827 | |
2013-1A, 6.03% due 01/17/262,3 | | | 2,000,000 | | | | 1,336,687 | |
Rockwall CDO Ltd. | | | | | | | | |
2007-1A, 1.31% due 08/01/242,3 | | | 2,100,000 | | | | 2,049,046 | |
2007-1A, 1.01% due 08/01/242,3 | | | 731,717 | | | | 725,804 | |
OHA Credit Partners VI Ltd. | | | | | | | | |
2015-6A, 3.32% due 05/15/232,3 | | | 2,500,000 | | | | 2,500,467 | |
Marathon CLO IV Ltd. | | | | | | | | |
2012-4A, 3.81% due 05/20/232,3 | | | 2,500,000 | | | | 2,500,345 | |
Galaxy XVIII CLO Ltd. | | | | | | | | |
2014-18A, 3.68% due 10/15/262,3 | | | 2,500,000 | | | | 2,486,243 | |
Venture XVI CLO Ltd. | | | | | | | | |
2014-16A, 3.43% due 04/15/262,3 | | | 2,500,000 | | | | 2,482,500 | |
SEE NOTES TO FINANCIAL STATEMENTS. | THE GUGGENHEIM FUNDS ANNUAL REPORT | 19 |
SCHEDULE OF INVESTMENTS (continued) | September 30, 2016 |
TOTAL RETURN BOND FUND | |
| | | Face
Amount15 | | | Value | |
| | | | | | | |
Eaton Vance CLO Ltd. | | | | | | |
2013-1A, 2.62% due 11/13/242,3 | | $ | 2,500,000 | | | $ | 2,481,250 | |
Symphony CLO X Ltd. | | | | | | | | |
2015-10A, 3.56% due 07/23/232,3 | | | 2,350,000 | | | | 2,350,002 | |
Oaktree EIF II Series B1 Ltd. | | | | | | | | |
2015-B1A, 3.12% due 02/15/262,3 | | | 2,205,000 | | | | 2,206,929 | |
Neuberger Berman CLO Ltd. | | | | | | | | |
2012-12X SUB, due 07/25/234 | | | 3,000,000 | | | | 1,447,886 | |
2012-12A, due 07/25/233,4 | | | 1,500,000 | | | | 723,943 | |
Venture XIII CLO Ltd. | | | | | | | | |
2013-13A, due 06/10/253,4 | | | 3,700,000 | | | | 2,049,857 | |
NewStar Arlington Senior Loan Program LLC | | | | | | | | |
2014-1A, 3.31% due 07/25/252,3 | | | 1,000,000 | | | | 953,136 | |
2014-1A, 4.76% due 07/25/253 | | | 700,000 | | | | 697,151 | |
2014-1A, 4.01% due 07/25/252,3 | | | 400,000 | | | | 387,729 | |
Anchorage Capital CLO Ltd. | | | | | | | | |
2012-1A, 3.47% due 01/13/252,3 | | | 2,000,000 | | | | 2,001,067 | |
KKR CLO Trust | | | | | | | | |
2012-1A, 3.05% due 12/15/242,3 | | | 2,000,000 | | | | 2,000,619 | |
Mountain Hawk I CLO Ltd. | | | | | | | | |
2013-1A, 2.88% due 01/20/242,3 | | | 2,000,000 | | | | 2,000,043 | |
Octagon Investment Partners XVI Ltd. | | | | | | | | |
2013-1A, 3.43% due 07/17/252,3 | | | 2,000,000 | | | | 1,989,374 | |
ALM VII R Ltd. | | | | | | | | |
2013-7RA, 3.31% due 04/24/242,3 | | | 2,000,000 | | | | 1,986,134 | |
Sound Point CLO IV Ltd. | | | | | | | | |
2013-3A, 3.05% due 01/21/262,3 | | | 2,000,000 | | | | 1,985,288 | |
Duane Street CLO IV Ltd. | | | | | | | | |
2007-4A, 3.07% due 11/14/212,3 | | | 2,000,000 | | | | 1,967,362 | |
NewStar Clarendon Fund CLO LLC | | | | | | | | |
2015-1A, 4.06% due 01/25/272,3 | | | 2,000,000 | | | | 1,937,543 | |
Madison Park Funding V Ltd. | | | | | | | | |
2007-5A, 2.28% due 02/26/212,3 | | | 2,000,000 | | | | 1,921,512 | |
Ivy Hill Middle Market Credit Fund IX Ltd. | | | | | | | | |
2014-9A, 3.13% due 10/18/252,3 | | | 1,000,000 | | | | 974,929 | |
2014-9A, 3.98% due 10/18/252,3 | | | 1,000,000 | | | | 937,768 | |
Resource Capital Corp. | | | | | | | | |
2015-CRE3, 4.53% due 03/15/322,3 | | | 2,000,000 | | | | 1,888,146 | |
Galaxy XIX CLO Ltd. | | | | | | | | |
2015-19A, due 01/24/273,4 | | | 2,000,000 | | | | 1,751,861 | |
Newstar Trust | | | | | | | | |
2012-2A, 4.95% due 01/20/232,3 | | | 1,000,000 | | | | 999,919 | |
2012-2A, 3.95% due 01/20/232,3 | | | 750,000 | | | | 749,418 | |
Westchester CLO Ltd. | | | | | | | | |
2007-1A, 1.20% due 08/01/222,3 | | | 1,850,000 | | | | 1,747,750 | |
Race Point V CLO Ltd. | | | | | | | | |
2014-5A, 3.70% due 12/15/222,3 | | | 1,100,000 | | | | 1,099,528 | |
2014-5A, 4.60% due 12/15/222,3 | | | 500,000 | | | | 499,782 | |
Gramercy Park CLO Ltd. | | | | | | | | |
2014-1A, 3.63% due 07/17/232,3 | | | 1,600,000 | | | | 1,595,724 | |
AMMC CLO XIII Ltd. | | | | | | | | |
2013-13A, 6.46% due 01/26/262,3 | | | 2,000,000 | | | | 1,540,759 | |
20 | THE GUGGENHEIM FUNDS ANNUAL REPORT | SEE NOTES TO FINANCIAL STATEMENTS. |
SCHEDULE OF INVESTMENTS (continued) | September 30, 2016 |
TOTAL RETURN BOND FUND | |
| | | Face
Amount15 | | | Value | |
| | | | | | | |
Adirondack Park CLO Ltd. | | | | | | |
2013-1A, 3.68% due 04/15/242,3 | | $ | 1,500,000 | | | $ | 1,501,194 | |
ACA CLO Ltd. | | | | | | | | |
2007-1A, 1.63% due 06/15/222,3 | | | 1,575,000 | | | | 1,496,155 | |
ING Investment Management CLO Ltd. | | | | | | | | |
2007-4A, 2.91% due 06/14/222,3 | | | 1,500,000 | | | | 1,473,854 | |
MCF CLO I LLC | | | | | | | | |
2013-1A, 4.25% due 04/20/232,3 | | | 1,500,000 | | | | 1,442,702 | |
COA Summit CLO Limited | | | | | | | | |
2014-1A, 3.50% due 04/20/232,3 | | | 1,250,000 | | | | 1,249,557 | |
Venture CLO Ltd. | | | | | | | | |
2013-14A, 3.58% due 08/28/252,3 | | | 1,250,000 | | | | 1,235,644 | |
ALM XIV Ltd. | | | | | | | | |
2014-14A, 3.69% due 07/28/262,3 | | | 750,000 | | | | 752,969 | |
2014-14A, 4.19% due 07/28/262,3 | | | 300,000 | | | | 292,547 | |
Oaktree CLO Ltd. | | | | | | | | |
2014-2A, 5.95% due 10/20/262,3 | | | 1,250,000 | | | | 1,033,310 | |
Ares XXIII CLO Ltd. | | | | | | | | |
2014-1A, 3.89% due 04/19/232,3 | | | 1,000,000 | | | | 1,018,340 | |
Gallatin CLO VII Ltd. | | | | | | | | |
2014-1A, 3.58% due 07/15/232,3 | | | 1,000,000 | | | | 1,000,077 | |
Neuberger Berman CLO XVIII Ltd. | | | | | | | | |
2014-18A, 3.97% due 11/14/252,3 | | | 1,000,000 | | | | 1,000,008 | |
Symphony CLO XV Ltd. | | | | | | | | |
2014-15A, 3.88% due 10/17/262,3 | | | 1,000,000 | | | | 1,000,004 | |
San Gabriel CLO Ltd. | | | | | | | | |
2007-1A, 3.10% due 09/10/212,3 | | | 1,000,000 | | | | 989,778 | |
WhiteHorse IV Ltd. | | | | | | | | |
2007-4A, 2.13% due 01/17/202,3 | | | 1,000,000 | | | | 972,654 | |
Flagship CLO VI | | | | | | | | |
2007-1A, 3.25% due 06/10/212,3 | | | 1,000,000 | | | | 971,404 | |
Limerock CLO II Ltd. | | | | | | | | |
2014-2A, 3.53% due 04/18/262,3 | | | 1,000,000 | | | | 971,189 | |
Highbridge Loan Management Ltd. | | | | | | | | |
2013-2A, 4.40% due 10/20/242,3 | | | 1,000,000 | | | | 968,567 | |
NXT Capital CLO LLC | | | | | | | | |
2015-1A, 4.35% due 04/21/272,3 | | | 1,000,000 | | | | 963,675 | |
Lime Street CLO Ltd. | | | | | | | | |
2007-1A, 3.36% due 06/20/212,3 | | | 1,000,000 | | | | 909,019 | |
Global Leveraged Capital Credit Opportunity Fund | | | | | | | | |
2006-1A, 1.70% due 12/20/182,3 | | | 759,780 | | | | 756,033 | |
Venture XII CLO Ltd. | | | | | | | | |
2013-12A, 3.68% due 02/28/242,3 | | | 750,000 | | | | 749,975 | |
Saranac CLO III Ltd. | | | | | | | | |
2014-3A, 6.02% due 06/22/252,3 | | | 1,000,000 | | | | 738,479 | |
Grayson CLO Ltd. | | | | | | | | |
2006-1A, 1.17% due 11/01/212,3 | | | 750,000 | | | | 720,337 | |
Atlas Senior Loan Fund II Ltd. | | | | | | | | |
2012-2A, due 01/30/243,4 | | | 1,200,000 | | | | 632,284 | |
KKR Financial CLO Ltd. | | | | | | | | |
2012-1A, 4.15% due 12/15/242,3 | | | 500,000 | | | | 500,297 | |
OZLM Funding V Ltd. | | | | | | | | |
2013-5A, 3.68% due 01/17/262,3 | | | 500,000 | | | | 499,985 | |
GoldenTree Credit Opportunities Financing Ltd. | | | | | | | | |
2012-1A, 4.85% due 06/15/282,3 | | | 500,000 | | | | 499,973 | |
SEE NOTES TO FINANCIAL STATEMENTS. | THE GUGGENHEIM FUNDS ANNUAL REPORT | 21 |
SCHEDULE OF INVESTMENTS (continued) | September 30, 2016 |
TOTAL RETURN BOND FUND | |
| | | Face
Amount15 | | | Value | |
| | | | | | | |
AMMC CLO XIV Ltd. | | | | | | |
2014-14A, 3.51% due 07/27/262,3 | | $ | 500,000 | | | $ | 497,740 | |
DIVCORE CLO Ltd. | | | | | | | | |
2013-1A, 4.42% due 11/15/322,3 | | | 500,000 | | | | 495,331 | |
Keuka Park CLO Ltd. | | | | | | | | |
2013-1A, due 10/21/243,4 | | | 1,000,000 | | | | 478,435 | |
Westwood CDO I Ltd. | | | | | | | | |
2007-1A, 1.53% due 03/25/212,3 | | | 500,000 | | | | 473,158 | |
NewStar Commercial Loan Trust | | | | | | | | |
2007-1A, 2.13% due 09/30/222,3 | | | 500,000 | | | | 472,246 | |
Finn Square CLO Ltd. | | | | | | | | |
2012-1A, due 12/24/233,4 | | | 1,000,000 | | | | 454,507 | |
MCF CLO IV LLC | | | | | | | | |
2014-1A, 6.58% due 10/15/252,3 | | | 500,000 | | | | 428,704 | |
Ares XXV CLO Ltd. | | | | | | | | |
2013-3A, due 01/17/243,4 | | | 750,000 | | | | 410,553 | |
Copper River CLO Ltd. | | | | | | | | |
2007-1A, due 01/20/212,4,16 | | | 1,500,000 | | | | 333,430 | |
Eastland CLO Ltd. | | | | | | | | |
2007-1A, 1.16% due 05/01/222,3 | | | 250,000 | | | | 236,173 | |
ICE EM CLO | | | | | | | | |
2007-1A, 1.80% due 08/15/222,3 | | | 35,240 | | | | 35,024 | |
Marathon CLO II Ltd. | | | | | | | | |
2005-2A, due 12/20/19†††,2,3,4 | | | 250,000 | | | | — | |
Total Collateralized Loan Obligations | | | | 863,906,465 | |
| | | | | | | | | |
Transport-Aircraft - 3.5% | |
AIM Aviation Finance Ltd. | | | | | | | | |
2015-1A, 4.21% due 02/15/403 | | | 29,267,857 | | | | 29,445,075 | |
2015-1A, 5.07% due 02/15/403 | | | 2,438,988 | | | | 2,347,721 | |
Apollo Aviation Securitization Equity Trust | | | | | | | | |
2016-1A, 4.88% due 03/17/363 | | | 21,137,500 | | | | 20,873,281 | |
2014-1, 5.13% due 12/15/29 | | | 8,437,500 | | | | 8,213,906 | |
2014-1, 7.50% due 12/15/292 | | | 2,596,154 | | | | 2,576,683 | |
Castlelake Aircraft Securitization Trust | | | | | | | | |
2015-1A, 4.70% due 12/15/403 | | | 20,122,867 | | | | 19,921,638 | |
2014-1, 5.25% due 02/15/293 | | | 1,662,765 | | | | 1,646,137 | |
2014-1, 7.50% due 02/15/293 | | | 821,053 | | | | 814,896 | |
ECAF I Ltd. | | | | | | | | |
2015-1A, 4.95% due 06/15/403 | | | 16,106,543 | | | | 15,974,808 | |
2015-1A, 3.47% due 06/15/403 | | | 1,662,651 | | | | 1,655,962 | |
Harbour Aircraft Investments Ltd. | | | | | | | | |
2016-1A, 4.70% due 07/15/41 | | | 8,121,550 | | | | 8,148,051 | |
Diamond Head Aviation Ltd. | | | | | | | | |
2015-1, 3.81% due 07/14/283 | | | 5,108,566 | | | | 5,115,079 | |
Rise Ltd. | | | | | | | | |
2014-1, 4.75% due 02/12/39 | | | 4,653,906 | | | | 4,598,059 | |
Atlas Ltd. | | | | | | | | |
2014-1 A, 4.88% due 12/15/39 | | | 3,583,200 | | | | 3,547,368 | |
Eagle I Ltd. | | | | | | | | |
2014-1A, 4.31% due 12/15/393 | | | 2,646,250 | | | | 2,578,771 | |
AASET | | | | | | | | |
2014-1 C, 10.00% due 12/15/29 | | | 2,356,092 | | | | 2,352,558 | |
22 | THE GUGGENHEIM FUNDS ANNUAL REPORT | SEE NOTES TO FINANCIAL STATEMENTS. |
SCHEDULE OF INVESTMENTS (continued) | September 30, 2016 |
TOTAL RETURN BOND FUND | |
| | | Face
Amount15 | | | Value | |
| | | | | | | |
Emerald Aviation Finance Ltd. | | | | | | |
2013-1, 4.65% due 10/15/383 | | $ | 1,610,469 | | | $ | 1,657,839 | |
2013-1, 6.35% due 10/15/383 | | | 345,100 | | | | 345,618 | |
Stripes | | | | | | | | |
2013-1 A1, 4.03% due 03/20/23†††,1 | | | 1,764,499 | | | | 1,717,489 | |
Turbine Engines Securitization Ltd. | | | | | | | | |
2013-1A, 5.13% due 12/13/4816 | | | 1,271,534 | | | | 1,259,451 | |
Willis Engine Securitization Trust II | | | | | | | | |
2012-A, 5.50% due 09/15/373 | | | 1,094,419 | | | | 1,083,475 | |
AABS Ltd. | | | | | | | | |
2013-1, 4.88% due 01/15/38 | | | 281,017 | | | | 279,331 | |
Airplanes Pass Through Trust | | | | | | | | |
2001-1A, 1.07% due 03/15/192,16 | | | 740,322 | | | | 244,306 | |
Total Transport-Aircraft | | | | | | | 136,397,502 | |
| | | | | | | | | |
Collateralized Debt Obligations - 3.3% | |
Putnam Structured Product Funding Ltd. | | | | | | | | |
2003-1A, 1.52% due 10/15/382,3 | | | 35,300,000 | | | | 30,417,338 | |
FDF II Ltd. | | | | | | | | |
2016-2A, 4.29% due 05/12/313 | | | 20,500,000 | | | | 20,878,468 | |
2016-2A, 5.29% due 05/12/313 | | | 5,000,000 | | | | 5,118,098 | |
Triaxx Prime CDO Ltd. | | | | | | | | |
2006-2A, 0.79% due 10/02/392,3 | | | 22,523,916 | | | | 21,451,700 | |
FDF I Ltd. | | | | | | | | |
2015-1A, 4.40% due 11/12/303 | | | 13,000,000 | | | | 13,659,859 | |
SRERS Funding Ltd. | | | | | | | | |
2011-RS, 0.76% due 05/09/462,3 | | | 13,813,760 | | | | 9,439,313 | |
Gramercy Real Estate CDO Ltd. | | | | | | | | |
2006-1A, 1.08% due 07/25/412,3 | | | 7,023,679 | | | | 6,936,831 | |
2007-1A, 1.10% due 08/15/562,3 | | | 1,435,102 | | | | 1,354,961 | |
Anchorage Credit Funding 3 Ltd. | | | | | | | | |
2016-3A, 3.85% due 10/28/33†††,3 | | | 7,500,000 | | | | 7,605,668 | |
Highland Park CDO I Ltd. | | | | | | | | |
2006-1A, 1.23% due 11/25/512,3 | | | 5,799,618 | | | | 5,326,451 | |
N-Star REL CDO VIII Ltd. | | | | | | | | |
2006-8A, 0.89% due 02/01/412,3 | | | 3,650,000 | | | | 3,543,015 | |
Anchorage Credit Funding 1 Ltd. | | | | | | | | |
2015-1A, 4.30% due 07/28/303 | | | 3,000,000 | | | | 3,094,681 | |
RAIT CRE CDO I Ltd. | | | | | | | | |
2006-1X A1B, 0.86% due 11/20/46 | | | 1,472,499 | | | | 1,423,450 | |
Wrightwood Capital Real Estate CDO Ltd. | | | | | | | | |
2005-1A, 1.24% due 11/21/402,3 | | | 1,250,000 | | | | 1,202,764 | |
N-Star Real Estate CDO IX Ltd. | | | | | | | | |
0.84% due 02/01/411 | | | 101,970 | | | | 101,786 | |
Total Collateralized Debt Obligations | | | | 131,554,383 | |
| | | | | | | | | |
Whole Business - 1.2% | |
Taco Bell Funding LLC | | | | | | | | |
2016-1A, 4.97% due 05/25/463 | | | 27,600,000 | | | | 28,583,499 | |
2016-1A, 4.38% due 05/25/463 | | | 3,400,000 | | | | 3,523,219 | |
Wendys Funding LLC | | | | | | | | |
2015-1A, 4.50% due 06/15/453 | | | 7,870,500 | | | | 7,858,820 | |
Drug Royalty III Limited Partnership 1 | | | | | | | | |
2016-1A, 3.98% due 04/15/273 | | | 4,376,386 | | | | 4,358,148 | |
SEE NOTES TO FINANCIAL STATEMENTS. | THE GUGGENHEIM FUNDS ANNUAL REPORT | 23 |
SCHEDULE OF INVESTMENTS (continued) | September 30, 2016 |
TOTAL RETURN BOND FUND | |
| | | Face
Amount15 | | | Value | |
| | | | | | | |
Sonic Capital LLC | | | | | | |
2016-1A, 4.47% due 05/20/463 | | $ | 2,491,667 | | | $ | 2,554,788 | |
Total Whole Business | | | | | | | 46,878,474 | |
| | | | | | | | | |
Net Lease - 0.6% | |
Store Master Funding I LLC | | | | | | | | |
2015-1A, 4.17% due 04/20/453 | | | 5,807,570 | | | | 5,881,526 | |
2015-1A, 3.75% due 04/20/453 | | | 1,489,375 | | | | 1,504,502 | |
Spirit Master Funding LLC | | | | | | | | |
2014-2A, 5.76% due 03/20/423 | | | 4,976,276 | | | | 5,193,988 | |
2014-4A, 4.63% due 01/20/453 | | | 2,000,000 | | | | 1,948,916 | |
Capital Automotive REIT | | | | | | | | |
2014-1A, 3.66% due 10/15/443 | | | 3,750,000 | | | | 3,752,738 | |
STORE Master Funding LLC | | | | | | | | |
2012-1A, 5.77% due 08/20/423 | | | 1,786,035 | | | | 1,808,792 | |
2013-1A, 4.16% due 03/20/433 | | | 1,743,875 | | | | 1,727,436 | |
Total Net Lease | | | | | | | 21,817,898 | |
| | | | | | | | | |
Financial - 0.2% | |
Industrial DPR Funding Ltd. | | | | | | | | |
2016-1A, 5.24% due 04/15/26†††,3 | | | 4,000,000 | | | | 4,043,904 | |
Hana Small Business Lending Loan Trust | | | | | | | | |
2014-2014, 3.42% due 01/25/402,3 | | | 1,354,488 | | | | 1,339,588 | |
CCR Incorporated MT100 Payment Rights Master Trust | | | | | | | | |
2012-CA, 4.75% due 07/10/223 | | | 791,667 | | | | 816,302 | |
2010-CX, 0.96% due 07/10/172 | | | 498,840 | | | | 495,701 | |
Garanti Diversified Payment Rights Finance Co. | | | | | | | | |
2007-A, 0.85% due 07/09/172 | | | 416,000 | | | | 413,083 | |
Total Financial | | | | | | | 7,108,578 | |
| | | | | | | | | |
Industrial - 0.2% | |
Agnico-Eagle Mines Ltd | | | | | | | | |
4.84% due 06/30/26†††,1 | | | 6,000,000 | | | | 6,115,242 | |
| | | | | | | | | |
Insurance - 0.1% | |
Chesterfield Financial Holdings LLC | | | | | | | | |
2014-1A, 4.50% due 12/15/343 | | | 5,206,250 | | | | 5,208,051 | |
| | | | | | | | | |
Transport-Container - 0.0% | |
CLI Funding V LLC | | | | | | | | |
2013-2A, 3.22% due 06/18/283 | | | 1,514,810 | | | | 1,475,445 | |
Total Asset-Backed Securities | |
(Cost $1,209,203,065) | | | | | | | 1,220,462,038 | |
| | | | | | | | | |
COLLATERALIZED MORTGAGE OBLIGATIONs†† - 29.3% | |
Residential Mortgage-Backed Securities - 20.8% | |
LSTAR Securities Investment Trust | | | | | | | | |
2015-1, 2.53% due 01/01/202,3 | | | 45,256,667 | | | | 45,188,781 | |
2015-4, 2.52% due 04/01/202,3 | | | 28,215,921 | | | | 27,863,222 | |
2016-2, 2.53% due 03/01/212,3 | | | 26,114,597 | | | | 25,513,961 | |
2015-3, 2.53% due 03/01/202,3 | | | 19,850,173 | | | | 19,589,342 | |
2015-2, 2.52% due 01/01/202,3 | | | 19,391,035 | | | | 19,122,202 | |
2015-5, 2.53% due 04/01/202,3 | | | 13,363,674 | | | | 13,163,219 | |
2015-10, 2.52% due 11/01/202,3 | | | 6,372,296 | | | | 6,260,781 | |
2015-6, 2.53% due 05/01/202,3 | | | 4,374,590 | | | | 4,292,567 | |
24 | THE GUGGENHEIM FUNDS ANNUAL REPORT | SEE NOTES TO FINANCIAL STATEMENTS. |
SCHEDULE OF INVESTMENTS (continued) | September 30, 2016 |
TOTAL RETURN BOND FUND | |
| | | Face
Amount15 | | | Value | |
| | | | | | | |
RALI Series Trust | | | | | | |
2006-QO10, 0.68% due 01/25/372 | | $ | 17,891,449 | | | $ | 15,087,603 | |
2006-QO2, 0.75% due 02/25/462 | | | 23,237,545 | | | | 10,226,374 | |
2007-QO2, 0.68% due 02/25/472 | | | 14,645,874 | | | | 8,335,551 | |
2007-QO4, 0.72% due 05/25/472 | | | 6,975,101 | | | | 5,806,961 | |
2005-QO1, 0.83% due 08/25/352 | | | 7,080,599 | | | | 5,554,752 | |
2005-QO1, 2.01% due 08/25/352 | | | 4,681,789 | | | | 3,974,790 | |
2006-QS8, 0.98% due 08/25/362 | | | 6,052,811 | | | | 3,918,636 | |
2006-QO2, 0.80% due 02/25/462 | | | 6,149,164 | | | | 2,771,245 | |
2007-QO3, 0.69% due 03/25/472 | | | 2,907,905 | | | | 2,317,428 | |
VOLT L LLC | | | | | | | | |
2016-NP10, 3.50% due 09/25/463,8 | | | 38,900,000 | | | | 38,900,000 | |
Bayview Opportunity Master Fund IIIa Trust | | | | | | | | |
2016-RN3, 3.60% due 09/28/313,8 | | | 38,400,000 | | | | 38,389,045 | |
Countrywide Asset-Backed Certificates | | | | | | | | |
2006-6, 0.70% due 09/25/362 | | | 35,350,916 | | | | 32,837,151 | |
American Home Mortgage Investment Trust | | | | | | | | |
2007-1, 2.08% due 05/25/479 | | | 102,411,942 | | | | 18,793,257 | |
2006-1, 0.80% due 03/25/462 | | | 8,758,126 | | | | 7,188,934 | |
2006-1, 0.92% due 03/25/462 | | | 3,928,993 | | | | 3,254,780 | |
VOLT XLI LLC | | | | | | | | |
2016-NPL1, 4.25% due 02/26/463,8 | | | 28,895,010 | | | | 29,157,013 | |
LSTAR Securities Investment Ltd. | | | | | | | | |
2016-3, 2.53% due 09/01/212,3 | | | 21,800,000 | | | | 21,520,358 | |
American Home Mortgage Assets Trust | | | | | | | | |
2006-4, 0.71% due 10/25/462 | | | 15,475,640 | | | | 10,239,654 | |
2007-1, 1.21% due 02/25/472 | | | 12,788,658 | | | | 7,580,546 | |
2006-5, 1.43% due 11/25/462 | | | 5,318,167 | | | | 2,793,815 | |
Washington Mutual Mortgage Pass-Through Certificates WMALT Series Trust | | | | | | | | |
2006-AR9, 1.34% due 11/25/462 | | | 22,470,470 | | | | 16,255,345 | |
2006-7, 4.46% due 09/25/36 | | | 3,231,942 | | | | 1,842,072 | |
2006-AR9, 1.35% due 11/25/462 | | | 1,345,207 | | | | 965,096 | |
2006-8, 4.57% due 10/25/36 | | | 563,480 | | | | 355,638 | |
WaMu Mortgage Pass-Through Certificates Series Trust | | | | | | | | |
2007-OA6, 1.30% due 07/25/472 | | | 11,298,371 | | | | 9,467,714 | |
2007-OA3, 1.28% due 04/25/472 | | | 7,461,127 | | | | 5,570,942 | |
2006-AR13, 1.39% due 10/25/462 | | | 2,644,491 | | | | 2,186,318 | |
2006-AR11, 1.43% due 09/25/462 | | | 2,118,265 | | | | 1,542,268 | |
CSMC Series | | | | | | | | |
2015-12R, 1.02% due 11/30/372,3 | | | 19,970,000 | | | | 18,766,706 | |
Nomura Resecuritization Trust | | | | | | | | |
2016-1R, 3.52% due 01/28/38†††,2,3 | | | 12,732,175 | | | | 12,716,041 | |
2015-4R, 1.31% due 03/26/362,3 | | | 2,564,056 | | | | 2,431,238 | |
2015-4R, 1.09% due 12/26/362,3 | | | 1,970,981 | | | | 1,832,923 | |
2012-1R, 0.96% due 08/27/472,3 | | | 210,068 | | | | 207,191 | |
SEE NOTES TO FINANCIAL STATEMENTS. | THE GUGGENHEIM FUNDS ANNUAL REPORT | 25 |
SCHEDULE OF INVESTMENTS (continued) | September 30, 2016 |
TOTAL RETURN BOND FUND | |
| | | Face
Amount15 | | | Value | |
| | | | | | | |
Lehman XS Trust Series | | | | | | |
2007-2N, 0.71% due 02/25/372 | | $ | 12,258,057 | | | $ | 8,464,643 | |
2007-15N, 0.77% due 08/25/372 | | | 6,560,157 | | | | 5,606,412 | |
2005-7N, 0.80% due 12/25/352 | | | 3,345,236 | | | | 2,979,207 | |
VOLT XLVIII LLC | | | | | | | | |
2016-NPL8, 3.50% due 07/25/463 | | | 15,465,034 | | | | 15,475,213 | |
Wachovia Asset Securitization Issuance II LLC Trust | | | | | | | | |
2007-HE1, 0.67% due 07/25/372,3 | | | 9,768,516 | | | | 8,351,638 | |
2007-HE2A, 0.66% due 07/25/372,3 | | | 8,006,813 | | | | 6,978,802 | |
VOLT XXXIX LLC | | | | | | | | |
2015-NP13, 4.13% due 10/25/453,8 | | | 14,888,026 | | | | 15,006,585 | |
GSMSC Resecuritization Trust | | | | | | | | |
2015-5R, 0.66% due 02/26/372,3 | | | 16,543,495 | | | | 14,690,083 | |
Impac Secured Assets CMN Owner Trust | | | | | | | | |
2005-2, 0.78% due 03/25/362 | | | 18,879,415 | | | | 14,596,512 | |
VOLT XL LLC | | | | | | | | |
2015-NP14, 4.38% due 11/27/453,8 | | | 13,054,520 | | | | 13,179,000 | |
VOLT XXXVI LLC | | | | | | | | |
2015-NP10, 3.63% due 07/25/453,8 | | | 13,151,824 | | | | 13,172,694 | |
Banc of America Funding Ltd. | | | | | | | | |
2013-R1, 0.71% due 11/03/412,3 | | | 13,499,623 | | | | 12,298,899 | |
NRPL Trust | | | | | | | | |
2015-1A, 3.88% due 11/01/543 | | | 8,393,942 | | | | 8,336,655 | |
2014-2A, 3.75% due 10/25/572,3 | | | 3,507,271 | | | | 3,493,240 | |
VOLT XXXIII LLC | | | | | | | | |
2015-NPL5, 3.50% due 03/25/553 | | | 11,307,169 | | | | 11,313,332 | |
Banc of America Funding Trust | | | | | | | | |
2014-R7, 0.66% due 09/26/362,3 | | | 7,196,976 | | | | 6,836,407 | |
2015-R4, 0.70% due 01/27/352,3 | | | 4,414,272 | | | | 4,115,861 | |
First Franklin Mortgage Loan Trust | | | | | | | | |
2004-FF10, 1.80% due 07/25/342 | | | 11,162,322 | | | | 10,795,693 | |
HarborView Mortgage Loan Trust | | | | | | | | |
2006-14, 0.68% due 01/25/472 | | | 10,923,306 | | | | 9,014,244 | |
Vericrest Opportunity Loan Trust | | | | | | | | |
2015-NPL3, 3.38% due 10/25/583 | | | 8,823,420 | | | | 8,805,866 | |
VOLT XXVII LLC | | | | | | | | |
2014-NPL7, 3.38% due 08/27/573 | | | 8,616,893 | | | | 8,610,933 | |
Deutsche Alt-A Securities Mortgage Loan Trust Series | | | | | | | | |
2007-OA2, 1.28% due 04/25/472 | | | 5,491,445 | | | | 4,666,800 | |
2006-OA1, 0.73% due 02/25/472 | | | 4,699,504 | | | | 3,829,748 | |
CIT Mortgage Loan Trust | | | | | | | | |
2007-1, 1.98% due 10/25/372,3 | | | 8,097,867 | | | | 7,933,077 | |
Structured Asset Investment Loan Trust | | | | | | | | |
2005-11, 0.89% due 01/25/362 | | | 8,487,128 | | | | 7,641,339 | |
Morgan Stanley Resecuritization Trust | | | | | | | | |
2014-R9, 0.66% due 11/26/462,3 | | | 7,722,488 | | | | 7,179,598 | |
26 | THE GUGGENHEIM FUNDS ANNUAL REPORT | SEE NOTES TO FINANCIAL STATEMENTS. |
SCHEDULE OF INVESTMENTS (continued) | September 30, 2016 |
TOTAL RETURN BOND FUND | |
| | | Face
Amount15 | | | Value | |
| | | | | | | |
Morgan Stanley ABS Capital I Inc. Trust | | | | | | |
2006-NC1, 0.91% due 12/25/352 | | $ | 7,800,000 | | | $ | 6,992,534 | |
IndyMac INDX Mortgage Loan Trust | | | | | | | | |
2005-AR18, 1.31% due 10/25/362 | | | 9,948,690 | | | | 6,867,676 | |
Oak Hill Advisors Residential Loan Trust | | | | | | | | |
2015-NPL2, 3.72% due 07/25/553 | | | 5,941,209 | | | | 5,890,287 | |
BCAP LLC | | | | | | | | |
2014-RR2, 0.81% due 03/26/362,3 | | | 4,093,997 | | | | 3,905,990 | |
2014-RR3, 0.66% due 10/26/362,3 | | | 1,971,674 | | | | 1,925,931 | |
Soundview Home Loan Trust | | | | | | | | |
2007-1, 0.70% due 03/25/372 | | | 5,998,488 | | | | 5,729,558 | |
VOLT XXXIV LLC | | | | | | | | |
2015-NPL7, 3.25% due 02/25/553,8 | | | 5,679,787 | | | | 5,662,552 | |
VOLT XLII LLC | | | | | | | | |
2016-NPL2, 4.25% due 03/26/463 | | | 5,416,181 | | | | 5,483,101 | |
Park Place Securities Inc. Asset-Backed Pass-Through Certificates Series | | | | | | | | |
2005-WCW2, 1.06% due 07/25/352 | | | 5,000,000 | | | | 4,600,074 | |
Alternative Loan Trust | | | | | | | | |
2007-OA7, 0.71% due 05/25/472 | | | 5,291,137 | | | | 4,509,276 | |
AJAX Mortgage Loan Trust | | | | | | | | |
2015-A, 3.88% due 11/25/543 | | | 4,229,736 | | | | 4,217,224 | |
GSAA Home Equity Trust | | | | | | | | |
2006-14, 0.70% due 09/25/362 | | | 6,380,556 | | | | 3,329,578 | |
2007-7, 0.80% due 07/25/372 | | | 495,624 | | | | 441,006 | |
Luminent Mortgage Trust | | | | | | | | |
2006-2, 0.73% due 02/25/462 | | | 5,467,323 | | | | 3,745,788 | |
Nationstar HECM Loan Trust | | | | | | | | |
2016-1A, 2.98% due 02/25/263 | | | 3,255,761 | | | | 3,253,385 | |
First NLC Trust | | | | | | | | |
2005-1, 0.98% due 05/25/352 | | | 3,606,171 | | | | 3,095,860 | |
GSAA Trust | | | | | | | | |
2005-10, 1.50% due 06/25/352 | | | 3,312,000 | | | | 3,057,836 | |
GreenPoint Mortgage Funding Trust | | | | | | | | |
2005-HE4, 1.00% due 07/25/302 | | | 2,817,413 | | | | 2,751,969 | |
2007-AR1, 0.61% due 02/25/472 | | | 20,360 | | | | 20,187 | |
RFMSI Series Trust | | | | | | | | |
2006-S11, 6.00% due 11/25/36 | | | 2,560,910 | | | | 2,265,327 | |
GCAT LLC | | | | | | | | |
2015-1, 3.63% due 05/26/203,8 | | | 2,093,792 | | | | 2,097,011 | |
Irwin Home Equity Loan Trust | | | | | | | | |
2007-1, 5.85% due 08/25/373 | | | 1,318,942 | | | | 1,291,119 | |
Structured Asset Securities Corporation Mortgage Loan Trust | | | | | | | | |
2006-BC6, 0.70% due 01/25/372 | | | 1,151,610 | | | | 1,055,691 | |
UCFC Manufactured Housing Contract | | | | | | | | |
1997-2, 7.38% due 10/15/28 | | | 965,938 | | | | 994,182 | |
Alliance Bancorp Trust | | | | | | | | |
2007-OA1, 0.77% due 07/25/372 | | | 1,229,549 | | | | 896,514 | |
GSAMP Trust | | | | | | | | |
2005-HE6, 0.97% due 11/25/352 | | | 800,000 | | | | 785,825 | |
SEE NOTES TO FINANCIAL STATEMENTS. | THE GUGGENHEIM FUNDS ANNUAL REPORT | 27 |
SCHEDULE OF INVESTMENTS (continued) | September 30, 2016 |
TOTAL RETURN BOND FUND | |
| | | Face
Amount15 | | | Value | |
| | | | | | | |
Morgan Stanley Re-REMIC Trust | | | | | | |
2010-R5, 1.12% due 06/26/362,3 | | $ | 493,081 | | | $ | 357,177 | |
Total Residential Mortgage-Backed Securities | | | | 822,376,599 | |
| | | | | | | | | |
Commercial Mortgage-Backed Securities - 6.5% | |
Citigroup Commercial Mortgage Trust | | | | | | | | |
2016-GC36, 4.92% due 02/10/492 | | | 23,800,000 | | | | 25,473,008 | |
2016-P5, 4.47% due 10/10/492 | | | 5,950,000 | | | | 5,961,481 | |
2016-P4, 2.18% due 07/10/492 | | | 32,972,506 | | | | 4,754,385 | |
2016-C2, 1.95% due 08/10/492 | | | 34,584,260 | | | | 4,610,282 | |
2016-GC37, 1.97% due 04/10/492 | | | 19,341,269 | | | | 2,497,022 | |
2015-GC35, 1.06% due 11/10/482 | | | 34,349,894 | | | | 1,948,972 | |
2015-GC29, 1.31% due 04/10/482 | | | 24,858,958 | | | | 1,704,544 | |
2013-GC15, 4.37% due 09/10/462 | | | 380,000 | | | | 430,958 | |
Wells Fargo Commercial Mortgage Trust | | | | | | | | |
2016-C32, 1.52% due 01/15/592 | | | 125,742,703 | | | | 11,471,757 | |
2016-C35, 2.17% due 07/15/482 | | | 27,709,256 | | | | 3,934,099 | |
2016-NXS5, 1.74% due 01/15/592 | | | 30,851,556 | | | | 3,036,568 | |
2015-NXS4, 1.10% due 12/15/482 | | | 39,806,151 | | | | 2,570,944 | |
2015-P2, 1.17% due 12/15/482 | | | 34,878,226 | | | | 2,346,712 | |
2015-C30, 1.17% due 09/15/582 | | | 33,659,442 | | | | 2,231,470 | |
2016-C32, 4.88% due 01/15/592 | | | 1,400,000 | | | | 1,508,476 | |
2015-NXS1, 1.33% due 05/15/482 | | | 11,868,589 | | | | 817,511 | |
2015-NXS4, 4.22% due 12/15/482 | | | 64,000 | | | | 69,951 | |
COMM Mortgage Trust | | | | | | | | |
2015-CR26, 1.21% due 10/10/482 | | | 93,266,997 | | | | 6,341,512 | |
2013-CR13, 4.91% due 12/10/232 | | | 4,650,000 | | | | 5,037,344 | |
2015-CR26, 4.64% due 10/10/482 | | | 3,400,000 | | | | 3,417,131 | |
2015-CR24, 4.52% due 08/10/482 | | | 2,967,000 | | | | 3,071,543 | |
2015-CR23, 1.15% due 05/10/482 | | | 49,504,281 | | | | 2,837,110 | |
2013-CR13, 1.12% due 12/10/232 | | | 52,349,896 | | | | 2,253,328 | |
2015-CR27, 1.32% due 10/10/482 | | | 31,793,831 | | | | 2,245,814 | |
2015-CR27, 4.62% due 10/10/482 | | | 1,500,000 | | | | 1,539,198 | |
2015-CR23, 3.80% due 05/10/48 | | | 700,000 | | | | 750,955 | |
Hilton USA Trust | | | | | | | | |
2013-HLT, 5.61% due 11/05/302,3 | | | 11,700,000 | | | | 11,718,060 | |
2013-HLF, 4.27% due 11/05/302,3 | | | 7,208,379 | | | | 7,211,888 | |
2013-HLF, 3.27% due 11/05/302,3 | | | 6,256,329 | | | | 6,256,323 | |
GS Mortgage Securities Corporation Trust | | | | | | | | |
2016-ICE2, 4.77% due 02/15/332,3 | | | 18,000,000 | | | | 18,126,041 | |
JPMDB Commercial Mortgage Securities Trust | | | | | | | | |
2016-C2, 3.56% due 06/15/492 | | | 14,300,000 | | | | 13,696,367 | |
2016-C2, 1.87% due 06/15/492 | | | 33,098,101 | | | | 3,584,270 | |
JP Morgan Chase Commercial Mortgage Securities Trust | | | | | | | | |
2016-JP3, 1.53% due 08/15/492 | | | 75,000,000 | | | | 8,134,125 | |
28 | THE GUGGENHEIM FUNDS ANNUAL REPORT | SEE NOTES TO FINANCIAL STATEMENTS. |
SCHEDULE OF INVESTMENTS (continued) | September 30, 2016 |
TOTAL RETURN BOND FUND | |
| | | Face
Amount15 | | | Value | |
| | | | | | | |
2015-CSMO, 3.82% due 01/15/322,3 | | $ | 4,900,000 | | | $ | 4,886,864 | |
2015-JP1, 4.90% due 01/15/492 | | | 2,800,000 | | | | 2,981,840 | |
Motel 6 Trust | | | | | | | | |
2015-MTL6, 5.28% due 02/05/303 | | | 15,000,000 | | | | 15,035,270 | |
Morgan Stanley Capital I Trust | | | | | | | | |
2015-XLF1, 2.73% due 08/13/192,3 | | | 7,600,000 | | | | 7,567,271 | |
2016-UBS9, 4.70% due 03/15/492 | | | 275,000 | | | | 287,372 | |
JPMBB Commercial Mortgage Securities Trust | | | | | | | | |
2015-C31, 4.77% due 08/15/482 | | | 3,253,000 | | | | 3,057,299 | |
2013-C17, 5.05% due 01/15/472 | | | 2,500,000 | | | | 2,701,059 | |
2013-C12, 0.90% due 07/15/452 | | | 52,768,146 | | | | 1,468,933 | |
CSAIL Commercial Mortgage Trust | | | | | | | | |
2015-C1, 1.11% due 04/15/502 | | | 58,402,269 | | | | 3,394,340 | |
2016-C6, 4.91% due 01/15/492 | | | 3,000,000 | | | | 3,247,919 | |
FREMF Mortgage Trust | | | | | | | | |
2013-K29, 0.13% due 05/25/463 | | | 829,570,834 | | | | 5,268,687 | |
J.P. Morgan Chase Commercial Mortgage Securities Trust | | | | | | | | |
2016-WSP, 2.68% due 08/15/332,3 | | | 5,000,000 | | | | 5,011,837 | |
CDGJ Commercial Mortgage Trust | | | | | | | | |
2014-BXCH, 3.02% due 12/15/272,3 | | | 3,000,000 | | | | 2,959,944 | |
2014-BXCH, 4.77% due 12/15/272,3 | | | 1,871,143 | | | | 1,853,624 | |
DBJPM Mortgage Trust | | | | | | | | |
2016-C1, 3.51% due 05/10/492 | | | 4,450,000 | | | | 4,294,358 | |
CD Mortgage Trust | | | | | | | | |
2016-CD1, 1.58% due 08/10/492 | | | 36,080,897 | | | | 3,800,289 | |
CFCRE Commercial Mortgage Trust | | | | | | | | |
2016-C3, 1.25% due 01/10/482 | | | 40,794,290 | | | | 3,181,669 | |
Morgan Stanley Bank of America Merrill Lynch Trust | | | | | | | | |
2015-C27, 1.20% due 12/15/472 | | | 41,758,118 | | | | 2,802,099 | |
BXHTL Mortgage Trust | | | | | | | | |
2015-JWRZ, 3.38% due 05/15/292,3 | | | 2,500,000 | | | | 2,462,387 | |
Hyatt Hotel Portfolio Trust | | | | | | | | |
2015-HYT, 3.57% due 11/15/292,3 | | | 2,000,000 | | | | 1,989,927 | |
CSMC Trust | | | | | | | | |
2015-SAND, 3.37% due 08/15/302,3 | | | 1,700,000 | | | | 1,666,565 | |
BAMLL Commercial Mortgage Securities Trust | | | | | | | | |
2014-ICTS, 3.47% due 06/15/282,3 | | | 1,500,000 | | | | 1,476,543 | |
BLCP Hotel Trust | | | | | | | | |
2014-CLRN, 3.02% due 08/15/292,3 | | | 1,500,000 | | | | 1,475,526 | |
GS Mortgage Securities Trust | | | | | | | | |
2015-GC28, 1.30% due 02/10/482 | | | 21,716,041 | | | | 1,372,621 | |
WFRBS Commercial Mortgage Trust | | | | | | | | |
2013-C12, 1.53% due 03/15/482,3 | | | 14,028,214 | | | | 828,634 | |
LSTAR Commercial Mortgage Trust | | | | | | | | |
2014-2, 5.00% due 01/20/412,3 | | | 500,000 | | | | 511,014 | |
GS Mortgage Securities Corporation II | | | | | | | | |
SEE NOTES TO FINANCIAL STATEMENTS. | THE GUGGENHEIM FUNDS ANNUAL REPORT | 29 |
SCHEDULE OF INVESTMENTS (continued) | September 30, 2016 |
TOTAL RETURN BOND FUND | |
| | | Face
Amount15 | | | Value | |
| | | | | | | |
2013-GC10, 2.94% due 02/10/46 | | $ | 225,000 | | | $ | 235,489 | |
Total Commercial Mortgage-Backed Securities | | | | 257,408,529 | |
| | | | | | | | | |
Government Agency - 1.1% | |
Fannie Mae | | | | | | | | |
#BA1742, 3.50% due 12/01/45 | | | 9,572,522 | | | | 10,098,615 | |
#AS6528, 4.00% due 01/01/46 | | | 4,561,780 | | | | 4,896,095 | |
#AL6307, 4.50% due 02/01/45 | | | 2,681,243 | | | | 2,933,245 | |
#AS7580, 3.00% due 07/01/46 | | | 2,370,759 | | | | 2,464,212 | |
#AX3215, 4.50% due 09/01/44 | | | 1,813,798 | | | | 1,983,880 | |
#AS2288, 5.00% due 04/01/44 | | | 1,541,328 | | | | 1,710,515 | |
#AL4290, 4.50% due 10/01/43 | | | 1,186,072 | | | | 1,297,406 | |
#AL6671, 5.00% due 12/01/44 | | | 1,041,223 | | | | 1,155,514 | |
#MA1525, 3.50% due 08/01/43 | | | 929,866 | | | | 981,820 | |
Freddie Mac | | | | | | | | |
#G08694, 4.00% due 02/01/46 | | | 4,337,326 | | | | 4,654,329 | |
#G60038, 3.50% due 01/01/44 | | | 3,657,676 | | | | 3,865,881 | |
#G08677, 4.00% due 11/01/45 | | | 3,362,790 | | | | 3,606,710 | |
#G08715, 3.00% due 08/01/46 | | | 2,382,243 | | | | 2,476,531 | |
Freddie Mac Multifamily Structured Pass Through Certificates | | | | | | | | |
2015-K043, 0.68% due 12/25/242 | | | 44,814,511 | | | | 1,740,802 | |
2014-K715, 2.86% due 01/25/21 | | | 450,000 | | | | 474,637 | |
Total Government Agency | | | | | | | 44,340,192 | |
| | | | | | | | | |
Military Housing - 0.9% | |
Capmark Military Housing Trust | | | | | | | | |
2008-AMCW, 6.90% due 07/10/55†††,16 | | | 8,454,270 | | | | 10,925,993 | |
2007-AETC, 5.75% due 02/10/5216 | | | 8,319,544 | | | | 8,641,964 | |
2007-ROBS, 6.06% due 10/10/5216 | | | 4,824,040 | | | | 4,772,616 | |
2007-AET2, 6.06% due 10/10/5216 | | | 2,193,863 | | | | 2,213,476 | |
GMAC Commercial Mortgage Asset Corp. | | | | | | | | |
2005-DRUM, 5.47% due 05/10/5016 | | | 4,731,250 | | | | 5,153,120 | |
2005-BLIS, 5.25% due 07/10/50†††,16 | | | 2,500,000 | | | | 2,634,707 | |
2003-PRES, 6.24% due 10/10/4116 | | | 939,853 | | | | 1,075,396 | |
Total Military Housing | | | | | | | 35,417,272 | |
Total Collateralized Mortgage Obligations | |
(Cost $1,146,856,812) | | | | | | | 1,159,542,592 | |
| | | | | | | | | |
CORPORATE BONDS†† - 13.7% | |
Financial - 4.9% | |
Citigroup, Inc. | | | | | | | | |
6.25% 2,10 | | | 10,800,000 | | | | 11,623,499 | |
5.95% 2,10 | | | 10,990,000 | | | | 11,202,726 | |
5.88% 2,10 | | | 5,685,000 | | | | 5,742,419 | |
5.95% 2,10 | | | 5,000,000 | | | | 5,179,650 | |
WP Carey, Inc. | | | | | | | | |
4.25% due 10/01/26 | | | 22,150,000 | | | | 22,457,531 | |
Hospitality Properties Trust | | | | | | | | |
5.25% due 02/15/26 | | | 16,200,000 | | | | 17,130,560 | |
Bank of America Corp. | | | | | | | | |
6.10% 2,10 | | | 10,500,000 | | | | 10,946,250 | |
6.30% 2,10 | | | 5,450,000 | | | | 5,920,063 | |
Teachers Insurance & Annuity Association of America | | | | | | | | |
4.90% due 09/15/443 | | | 11,050,000 | | | | 12,428,078 | |
4.38% due 09/15/542,3 | | | 3,000,000 | | | | 3,037,500 | |
Kennedy-Wilson, Inc. | | | | | | | | |
5.88% due 04/01/24 | | | 11,575,000 | | | | 11,661,813 | |
30 | THE GUGGENHEIM FUNDS ANNUAL REPORT | SEE NOTES TO FINANCIAL STATEMENTS. |
SCHEDULE OF INVESTMENTS (continued) | September 30, 2016 |
TOTAL RETURN BOND FUND | |
| | | Face
Amount15 | | | Value | |
| | | | | | | |
GMH Military Housing-Navy Northeast LLC | | | | | | |
6.30% due 10/15/49†††,1 | | $ | 8,725,000 | | | $ | 9,428,885 | |
GEO Group, Inc. | | | | | | | | |
5.88% due 10/15/24 | | | 6,085,000 | | | | 5,233,100 | |
6.00% due 04/15/26 | | | 2,791,000 | | | | 2,372,350 | |
Citizens Financial Group, Inc. | | | | | | | | |
5.50%2,10 | | | 4,500,000 | | | | 4,410,000 | |
2.38% due 07/28/21 | | | 1,700,000 | | | | 1,705,953 | |
Atlas Mara Ltd. | | | | | | | | |
8.00% due 12/31/201 | | | 6,600,000 | | | | 5,544,000 | |
Fort Benning Family Communities LLC | | | | | | | | |
0.87% due 01/15/36†††,2,16 | | | 6,000,000 | | | | 4,696,903 | |
Fifth Third Bancorp | | | | | | | | |
4.90% 2,10 | | | 3,800,000 | | | | 3,682,200 | |
EPR Properties | | | | | | | | |
4.50% due 04/01/25 | | | 1,690,000 | | | | 1,712,492 | |
5.75% due 08/15/22 | | | 1,400,000 | | | | 1,553,038 | |
Mid-Atlantic Military Family Communities LLC | | | | | | | | |
5.30% due 08/01/5016 | | | 3,323,086 | | | | 3,133,105 | |
Customers Bank | | | | | | | | |
6.13% due 06/26/292,16 | | | 2,000,000 | | | | 2,020,000 | |
American Tower Corp. | | | | | | | | |
4.70% due 03/15/22 | | | 1,320,000 | | | | 1,467,179 | |
3.50% due 01/31/23 | | | 420,000 | | | | 438,088 | |
AmTrust Financial Services, Inc. | | | | | | | | |
6.13% due 08/15/231 | | | 1,671,000 | | | | 1,759,458 | |
Columbia Property Trust Operating Partnership, LP | | | | | | | | |
3.65% due 08/15/26 | | | 1,700,000 | | | | 1,710,015 | |
Prudential Financial, Inc. | | | | | | | | |
6.63% due 12/01/37 | | | 1,300,000 | | | | 1,673,481 | |
Atlantic Marine Corporations Communities LLC | | | | | | | | |
5.43% due 12/01/5016 | | | 1,051,828 | | | | 1,110,678 | |
5.38% due 02/15/481 | | | 553,257 | | | | 549,794 | |
International Lease Finance Corp. | | | | | | | | |
8.63% due 01/15/22 | | | 1,300,000 | | | | 1,599,000 | |
Jefferies Group LLC | | | | | | | | |
5.13% due 01/20/23 | | | 1,500,000 | | | | 1,598,088 | |
HCP, Inc. | | | | | | | | |
4.00% due 12/01/22 | | | 1,500,000 | | | | 1,585,168 | |
Credit Suisse Group Funding Guernsey Ltd. | | | | | | | | |
4.55% due 04/17/26 | | | 1,500,000 | | | | 1,574,976 | |
Discover Bank/Greenwood DE | | | | | | | | |
4.20% due 08/08/23 | | | 1,400,000 | | | | 1,506,698 | |
Lincoln National Corp. | | | | | | | | |
8.75% due 07/01/19 | | | 1,000,000 | | | | 1,177,066 | |
7.00% due 06/15/40 | | | 210,000 | | | | 270,327 | |
Pacific Northwest Communities LLC | | | | | | | | |
5.91% due 06/15/5016 | | | 1,000,000 | | | | 1,171,630 | |
Fort Knox Military Housing Privatization Project | | | | | | | | |
0.86% due 02/15/52†††,2,16 | | | 1,768,987 | | | | 1,099,437 | |
Cadence Bank North America | | | | | | | | |
6.25% due 06/28/292,16 | | | 1,200,000 | | | | 1,020,000 | |
Oxford Finance LLC / Oxford Finance Company-Issuer, Inc. | | | | | | | | |
7.25% due 01/15/183 | | | 1,000,000 | | | | 1,000,000 | |
Univest Corporation of Pennsylvania | | | | | | | | |
5.10% due 03/30/251,2 | | | 1,000,000 | | | | 1,000,000 | |
HSBC Holdings plc | | | | | | | | |
4.30% due 03/08/26 | | | 910,000 | | | | 975,209 | |
Wilton Re Finance LLC | | | | | | | | |
5.88% due 03/30/332,3 | | | 925,000 | | | | 950,438 | |
CC Holdings GS V LLC / Crown Castle GS III Corp. | | | | | | | | |
3.85% due 04/15/23 | | | 800,000 | | | | 855,671 | |
Nasdaq, Inc. | | | | | | | | |
5.55% due 01/15/20 | | | 720,000 | | | | 794,992 | |
SEE NOTES TO FINANCIAL STATEMENTS. | THE GUGGENHEIM FUNDS ANNUAL REPORT | 31 |
SCHEDULE OF INVESTMENTS (continued) | September 30, 2016 |
TOTAL RETURN BOND FUND | |
| | | Face
Amount15 | | | Value | |
| | | | | | | |
ACC Group Housing LLC | | | | | | |
6.35% due 07/15/5416 | | $ | 625,000 | | | $ | 759,017 | |
CIC Receivables Master Trust | | | | | | | | |
4.89% due 10/07/21††† | | | 480,054 | | | | 484,355 | |
Assurant, Inc. | | | | | | | | |
6.75% due 02/15/34 | | | 281,000 | | | | 353,910 | |
Welltower, Inc. | | | | | | | | |
4.00% due 06/01/25 | | | 220,000 | | | | 233,283 | |
Total Financial | | | | | | | 191,540,073 | |
| | | | | | | | | |
Energy - 2.8% | |
Sunoco Logistics Partners Operations, LP | | | | | | | | |
5.95% due 12/01/25 | | | 14,650,000 | | | | 16,978,441 | |
3.90% due 07/15/26 | | | 7,200,000 | | | | 7,341,934 | |
4.25% due 04/01/24 | | | 4,200,000 | | | | 4,362,725 | |
ConocoPhillips | | | | | | | | |
6.50% due 02/01/39 | | | 12,250,000 | | | | 15,812,631 | |
5.90% due 10/15/32 | | | 7,875,000 | | | | 9,354,776 | |
Halliburton Co. | | | | | | | | |
4.85% due 11/15/35 | | | 12,900,000 | | | | 13,826,723 | |
3.80% due 11/15/25 | | | 1,600,000 | | | | 1,654,178 | |
Husky Energy, Inc. | | | | | | | | |
4.00% due 04/15/24 | | | 9,652,000 | | | | 10,073,783 | |
7.25% due 12/15/19 | | | 600,000 | | | | 693,522 | |
Gulfstream Natural Gas System LLC | | | | | | | | |
4.60% due 09/15/253 | | | 8,440,000 | | | | 8,849,457 | |
Equities Corp. | | | | | | | | |
4.88% due 11/15/21 | | | 6,905,000 | | | | 7,560,692 | |
Hess Corp. | | | | | | | | |
4.30% due 04/01/27 | | | 3,650,000 | | | | 3,678,419 | |
7.88% due 10/01/29 | | | 897,000 | | | | 1,092,016 | |
7.13% due 03/15/33 | | | 720,000 | | | | 813,176 | |
7.30% due 08/15/31 | | | 470,000 | | | | 557,375 | |
Enterprise Products Operating LLC | | | | | | | | |
3.90% due 02/15/24 | | | 890,000 | | | | 930,884 | |
3.95% due 02/15/27 | | | 670,000 | | | | 702,070 | |
Anadarko Petroleum Corp. | | | | | | | | |
8.70% due 03/15/19 | | | 1,310,000 | | | | 1,491,542 | |
Baker Hughes, Inc. | | | | | | | | |
3.20% due 08/15/21 | | | 1,000,000 | | | | 1,042,833 | |
Magellan Midstream Partners, LP | | | | | | | | |
4.25% due 02/01/21 | | | 740,000 | | | | 796,597 | |
Tosco Corp. | | | | | | | | |
8.13% due 02/15/30 | | | 560,000 | | | | 765,725 | |
Unit Corp. | | | | | | | | |
6.63% due 05/15/21 | | | 700,000 | | | | 590,625 | |
QEP Resources, Inc. | | | | | | | | |
6.88% due 03/01/21 | | | 200,000 | | | | 208,500 | |
Schahin II Finance Company SPV Ltd. | | | | | | | | |
5.88% due 09/25/2211,16 | | | 781,800 | | | | 93,816 | |
Total Energy | | | | | | | 109,272,440 | |
| | | | | | | | | |
Basic Materials - 1.7% | |
Newcrest Finance Pty Ltd. | | | | | | | | |
4.45% due 11/15/213 | | | 17,535,000 | | | | 18,544,437 | |
4.20% due 10/01/223 | | | 10,875,000 | | | | 11,329,727 | |
Yamana Gold, Inc. | | | | | | | | |
4.95% due 07/15/24 | | | 21,020,000 | | | | 21,713,220 | |
BHP Billiton Finance USA Ltd. | | | | | | | | |
6.75% due 10/19/752,3 | | | 13,000,000 | | | | 14,722,500 | |
Eldorado Gold Corp. | | | | | | | | |
6.13% due 12/15/203 | | | 1,050,000 | | | | 1,057,350 | |
Southern Copper Corp. | | | | | | | | |
5.25% due 11/08/42 | | | 430,000 | | | | 406,465 | |
7.50% due 07/27/35 | | | 260,000 | | | | 306,109 | |
PQ Corp. | | | | | | | | |
6.75% due 11/15/223 | | | 350,000 | | | | 371,000 | |
Total Basic Materials | | | | | | | 68,450,808 | |
| | | | | | | | | |
Communications - 1.4% | |
DISH DBS Corp. | | | | | | | | |
5.88% due 11/15/24 | | | 8,350,000 | | | | 8,245,625 | |
7.75% due 07/01/26 | | | 7,425,000 | | | | 7,889,063 | |
5.88% due 07/15/22 | | | 2,820,000 | | | | 2,898,199 | |
Sprint Communications, Inc. | | | | | | | | |
7.00% due 03/01/203 | | | 10,300,000 | | | | 11,046,750 | |
9.00% due 11/15/183 | | | 3,975,000 | | | | 4,387,406 | |
CSC Holdings LLC | | | | | | | | |
6.63% due 10/15/253 | | | 7,897,000 | | | | 8,568,244 | |
6.75% due 11/15/21 | | | 1,700,000 | | | | 1,797,750 | |
32 | THE GUGGENHEIM FUNDS ANNUAL REPORT | SEE NOTES TO FINANCIAL STATEMENTS. |
SCHEDULE OF INVESTMENTS (continued) | September 30, 2016 |
TOTAL RETURN BOND FUND | |
| | | Face
Amount15 | | | Value | |
| | | | | | | |
SFR Group S.A. | | | | | | |
6.25% due 05/15/243 | | $ | 2,950,000 | | | $ | 2,930,683 | |
6.00% due 05/15/223 | | | 600,000 | | | | 612,000 | |
Virgin Media Finance plc | | | | | | | | |
6.38% due 04/15/233 | | | 1,620,000 | | | | 1,701,000 | |
Match Group, Inc. | | | | | | | | |
6.38% due 06/01/24 | | | 1,355,000 | | | | 1,473,563 | |
Qwest Corp. | | | | | | | | |
6.75% due 12/01/21 | | | 1,270,000 | | | | 1,414,463 | |
Avaya, Inc. | | | | | | | | |
7.00% due 04/01/193,7 | | | 1,700,000 | | | | 1,253,750 | |
AT&T, Inc. | | | | | | | | |
4.50% due 03/09/48 | | | 910,000 | | | | 914,765 | |
Koninklijke KPN N.V. | | | | | | | | |
8.38% due 10/01/30 | | | 600,000 | | | | 838,889 | |
Time Warner, Inc. | | | | | | | | |
6.50% due 11/15/36 | | | 500,000 | | | | 646,242 | |
Vodafone Group plc | | | | | | | | |
7.88% due 02/15/30 | | | 430,000 | | | | 596,605 | |
Total Communications | | | | | | | 57,214,997 | |
| | | | | | | | | |
Consumer, Non-cyclical - 1.2% | |
Tenet Healthcare Corp. | | | | | | | | |
4.35% due 06/15/202 | | | 14,610,000 | | | | 14,684,511 | |
Vector Group Ltd. | | | | | | | | |
7.75% due 02/15/21 | | | 12,637,000 | | | | 13,328,244 | |
Bumble Bee Holdings, Inc. | | | | | | | | |
9.00% due 12/15/173 | | | 10,801,000 | | | | 10,855,005 | |
United Communities LLC | | | | | | | | |
5.61% due 09/15/5116 | | | 4,650,044 | | | | 5,067,943 | |
Central Garden & Pet Co. | | | | | | | | |
6.13% due 11/15/23 | | | 2,525,000 | | | | 2,701,750 | |
Becton Dickinson and Co. | | | | | | | | |
6.00% due 05/15/39 | | | 564,000 | | | | 717,470 | |
Kraft Heinz Foods Co. | | | | | | | | |
6.88% due 01/26/39 | | | 320,000 | | | | 444,173 | |
Opal Acquisition, Inc. | | | | | | | | |
8.88% due 12/15/213 | | | 500,000 | | | | 410,000 | |
Acadia Healthcare Company, Inc. | | | | | | | | |
5.63% due 02/15/23 | | | 300,000 | | | | 304,500 | |
Total Consumer, Non-cyclical | | | | 48,513,596 | |
| | | | | | | | | |
Industrial - 0.5% | |
Molex Electronic Technologies LLC | | | | | | | | |
3.90% due 04/15/253 | | | 6,034,000 | | | | 6,159,725 | |
Reynolds Group Issuer Inc. / Reynolds Group Issuer LLC / Reynolds Group Issuer | | | | | | | | |
6.88% due 02/15/21 | | | 3,100,000 | | | | 3,216,250 | |
Princess Juliana International Airport Operating Company N.V. | | | | | | | | |
5.50% due 12/20/27†††,3 | | | 2,667,822 | | | | 2,620,068 | |
Reynolds Group Issuer Incorporated / Reynolds Group Issuer LLC / Reynolds Group Issuer Lu | | | | | | | | |
4.13% due 07/15/212,3 | | | 1,875,000 | | | | 1,903,125 | |
L-3 Communications Corp. | | | | | | | | |
4.75% due 07/15/20 | | | 950,000 | | | | 1,037,384 | |
5.20% due 10/15/19 | | | 760,000 | | | | 832,192 | |
Dynagas LNG Partners Limited Partnership / Dynagas Finance, Inc. | | | | | | | | |
6.25% due 10/30/191 | | | 1,700,000 | | | | 1,576,750 | |
Eaton Corp. | | | | | | | | |
4.00% due 11/02/32 | | | 1,300,000 | | | | 1,392,375 | |
Amsted Industries, Inc. | | | | | | | | |
5.38% due 09/15/243 | | | 700,000 | | | | 696,500 | |
CEVA Group plc | | | | | | | | |
7.00% due 03/01/213 | | | 100,000 | | | | 81,000 | |
Total Industrial | | | | | | | 19,515,369 | |
| | | | | | | | | |
Consumer, Cyclical - 0.4% | |
Wynn Las Vegas LLC / Wynn Las Vegas Capital Corp. | | | | | | | | |
5.50% due 03/01/253 | | | 6,600,000 | | | | 6,682,499 | |
HP Communities LLC | | | | | | | | |
5.78% due 03/15/463 | | | 2,150,000 | | | | 2,493,506 | |
5.62% due 09/15/3216 | | | 1,000,000 | | | | 1,160,110 | |
Hasbro, Inc. | | | | | | | | |
6.35% due 03/15/40 | | | 1,500,000 | | | | 1,828,388 | |
SEE NOTES TO FINANCIAL STATEMENTS. | THE GUGGENHEIM FUNDS ANNUAL REPORT | 33 |
SCHEDULE OF INVESTMENTS (continued) | September 30, 2016 |
TOTAL RETURN BOND FUND | |
| | | Face
Amount15 | | | Value | |
| | | | | | | |
Northern Group Housing LLC | | | | | | |
6.80% due 08/15/5316 | | $ | 1,200,000 | | | $ | 1,580,292 | |
Tupperware Brands Corp. | | | | | | | | |
4.75% due 06/01/21 | | | 750,000 | | | | 820,514 | |
National CineMedia LLC | | | | | | | | |
5.75% due 08/15/26 | | | 750,000 | | | | 778,125 | |
Total Consumer, Cyclical | | | | | | | 15,343,434 | |
| | | | | | | | | |
Technology - 0.4% | |
Micron Technology, Inc. | | | | | | | | |
5.25% due 08/01/23 | | | 6,675,000 | | | | 6,591,562 | |
First Data Corp. | | | | | | | | |
5.75% due 01/15/243 | | | 5,500,000 | | | | 5,651,250 | |
Open Text Corp. | | | | | | | | |
5.63% due 01/15/233 | | | 975,000 | | | | 994,500 | |
CA, Inc. | | | | | | | | |
5.38% due 12/01/19 | | | 760,000 | | | | 839,301 | |
NCR Corp. | | | | | | | | |
6.38% due 12/15/23 | | | 625,000 | | | | 660,938 | |
Fidelity National Information Services, Inc. | | | | | | | | |
3.50% due 04/15/23 | | | 380,000 | | | | 398,731 | |
Total Technology | | | | | | | 15,136,282 | |
| | | | | | | | | |
Diversified - 0.2% | |
HRG Group, Inc. | | | | | | | | |
7.88% due 07/15/19 | | | 6,395,000 | | | | 6,738,731 | |
Leucadia National Corp. | | | | | | | | |
5.50% due 10/18/23 | | | 1,500,000 | | | | 1,570,223 | |
Total Diversified | | | | | | | 8,308,954 | |
| | | | | | | | | |
Utilities - 0.2% | |
AES Corp. | | | | | | | | |
3.84% due 06/01/192 | | | 3,098,000 | | | | 3,105,745 | |
6.00% due 05/15/26 | | | 700,000 | | | | 740,250 | |
LBC Tank Terminals Holding Netherlands BV | | | | | | | | |
6.88% due 05/15/233 | | | 850,000 | | | | 845,750 | |
Progress Energy, Inc. | | | | | | | | |
6.00% due 12/01/39 | | | 650,000 | | | | 830,392 | |
Exelon Generation Company LLC | | | | | | | | |
6.25% due 10/01/39 | | | 670,000 | | | | 745,563 | |
Total Utilities | | | | | | | 6,267,700 | |
Total Corporate Bonds | | | | | | | | |
(Cost $519,159,509) | | | | | | | 539,563,653 | |
| | | | | | | | | |
U.S. GOVERNMENT SECURITIES†† - 8.6% | |
U.S. Treasury Bonds | | | | | | | | |
due 11/15/4412 | | | 359,827,000 | | | | 182,249,136 | |
8.75% due 05/15/20 | | | 9,030,000 | | | | 11,511,489 | |
4.38% due 05/15/40 | | | 7,320,000 | | | | 10,228,273 | |
8.75% due 08/15/20 | | | 6,500,000 | | | | 8,405,566 | |
8.00% due 11/15/21 | | | 6,000,000 | | | | 8,027,112 | |
8.13% due 08/15/19 | | | 3,000,000 | | | | 3,612,306 | |
2.75% due 11/15/42 | | | 2,580,000 | | | | 2,808,573 | |
4.75% due 02/15/41 | | | 1,750,000 | | | | 2,581,866 | |
6.13% due 11/15/27 | | | 1,310,000 | | | | 1,901,546 | |
7.88% due 02/15/21 | | | 500,000 | | | | 644,278 | |
Total U.S. Treasury Bonds | | | | | | | 231,970,145 | |
U.S. Treasury Notes | | | | | | | | |
1.50% due 08/15/267 | | | 106,958,000 | | | | 105,917,619 | |
2.88% due 03/31/18 | | | 1,000,000 | | | | 1,031,562 | |
3.13% due 05/15/19 | | | 500,000 | | | | 529,395 | |
Total U.S. Treasury Notes | | | | | | | 107,478,576 | |
Total U.S. Government Securities | | | | | |
(Cost $333,708,919) | | | | | | | 339,448,721 | |
| | | | | | | | | |
FEDERAL AGENCY SECURITIES†† - 5.8% | |
Fannie Mae13 | | | | | | | | |
1.88% due 09/24/26 | | | 40,100,000 | | | | 39,898,898 | |
2.13% due 04/24/26 | | | 19,685,000 | | | | 20,032,421 | |
due 01/15/3012 | | | 4,000,000 | | | | 2,812,828 | |
0.88% due 02/08/18 | | | 1,500,000 | | | | 1,502,007 | |
due 01/15/3512 | | | 2,250,000 | | | | 1,300,912 | |
due 02/06/3312 | | | 1,456,000 | | | | 902,605 | |
due 01/15/3312 | | | 1,450,000 | | | | 901,124 | |
due 07/15/3212 | | | 1,333,000 | | | | 843,041 | |
Total Fannie Mae | | | | | | | 68,193,836 | |
Fannie Mae Principal | | | | | | | | |
due 05/15/2912 | | | 33,900,000 | | | | 24,335,251 | |
due 01/15/3012 | | | 34,000,000 | | | | 24,205,552 | |
due 05/15/3012 | | | 23,250,000 | | | | 16,401,782 | |
34 | THE GUGGENHEIM FUNDS ANNUAL REPORT | SEE NOTES TO FINANCIAL STATEMENTS. |
SCHEDULE OF INVESTMENTS (continued) | September 30, 2016 |
TOTAL RETURN BOND FUND | |
| | | Face
Amount15 | | | Value | |
| | | | | | | |
due 11/15/3012 | | $ | 2,800,000 | | | $ | 1,942,996 | |
Total Fannie Mae Principal | | | | | | | 66,885,581 | |
Freddie Mac13 | | | | | | | | |
due 12/14/2912 | | | 45,850,000 | | | | 32,849,369 | |
1.25% due 10/02/19 | | | 2,500,000 | | | | 2,517,650 | |
2.38% due 01/13/22 | | | 2,000,000 | | | | 2,106,076 | |
Total Freddie Mac | | | | | | | 37,473,095 | |
Freddie Mac Strips | | | | | | | | |
due 07/15/3212 | | | 28,600,000 | | | | 18,541,323 | |
due 03/15/3112 | | | 21,115,000 | | | | 14,458,919 | |
Total Freddie Mac Strips | | | | | | | 33,000,242 | |
Tennessee Valley Authority | | | | | | | | |
5.38% due 04/01/56 | | | 8,360,000 | | | | 11,829,166 | |
4.25% due 09/15/65 | | | 9,900,000 | | | | 11,777,684 | |
Total Tennessee Valley Authority | | | | 23,606,850 | |
Total Federal Agency Securities | | | | | |
(Cost $218,667,611) | | | | | | | 229,159,604 | |
| | | | | | | | | |
SENIOR FLOATING RATE INTERESTS†† - 4.5% | |
Consumer, Non-cyclical - 1.1% | |
Albertson’s LLC | | | | | | | | |
4.50% due 08/25/21 | | | 8,512,169 | | | | 8,574,052 | |
4.75% due 12/21/22 | | | 2,462,952 | | | | 2,486,055 | |
Advancepierre Foods, Inc. | | | | | | | | |
4.50% due 06/02/23 | | | 6,738,462 | | | | 6,789,000 | |
Pharmaceutical Product Development | | | | | | | | |
4.25% due 08/18/22 | | | 6,337,034 | | | | 6,356,299 | |
MPH Acquisition Holdings LLC | | | | | | | | |
5.00% due 06/07/23 | | | 4,042,363 | | | | 4,090,993 | |
Gold Merger Company, Inc. | | | | | | | | |
4.75% due 07/27/23 | | | 3,825,000 | | | | 3,851,316 | |
Packaging Coordinators Midco, Inc. | | | | | | | | |
5.00% due 07/03/23 | | | 3,192,000 | | | | 3,192,000 | |
Press Ganey Holdings, Inc. | | | | | | | | |
4.25% due 09/29/23 | | | 3,000,000 | | | | 3,000,000 | |
Grocery Outlet, Inc. | | | | | | | | |
5.00% due 10/21/21 | | | 1,750,155 | | | | 1,745,780 | |
One Call Medical, Inc. | | | | | | | | |
5.00% due 11/27/20 | | | 1,659,659 | | | | 1,549,706 | |
CHG Healthcare Services, Inc. | | | | | | | | |
4.75% due 06/07/23 | | | 1,492,500 | | | | 1,506,022 | |
DJO Finance LLC | | | | | | | | |
4.25% due 06/08/20 | | | 875,000 | | | | 858,594 | |
Arctic Glacier Holdings, Inc. | | | | | | | | |
6.00% due 05/10/19 | | | 119,021 | | | | 117,533 | |
Total Consumer, Non-cyclical | | | | 44,117,350 | |
| | | | | | | | | |
Industrial - 0.9% | |
Travelport Holdings LLC | | | | | | | | |
5.00% due 09/02/21 | | | 19,892,694 | | | | 19,974,454 | |
Camp International Holding Co. | | | | | | | | |
4.75% due 08/18/23 | | | 4,100,000 | | | | 4,091,800 | |
Engility Corp. | | | | | | | | |
5.75% due 08/14/23 | | | 3,192,714 | | | | 3,221,640 | |
TMF Group Holding BV | | | | | | | | |
4.00% due 09/29/23 | | EUR | 1,750,000 | | | | 1,991,373 | |
CareCore National LLC | | | | | | | | |
5.50% due 03/05/21 | | | 1,395,893 | | | | 1,367,975 | |
Reynolds Group Holdings | | | | | | | | |
4.25% due 02/05/23 | | | 1,200,000 | | | | 1,203,372 | |
Hillman Group, Inc. | | | | | | | | |
4.50% due 06/30/21 | | | 994,911 | | | | 996,980 | |
Hardware Holdings LLC | | | | | | | | |
6.75% due 03/30/201 | | | 833,000 | | | | 812,175 | |
Wencor Group | | | | | | | | |
4.50% due 06/18/21 | | | 294,168 | | | | 271,370 | |
Thermasys Corp. | | | | | | | | |
5.25% due 05/03/191 | | | 91,875 | | | | 73,902 | |
Total Industrial | | | | | | | 34,005,041 | |
| | | | | | | | | |
Technology - 0.9% | |
EIG Investors Corp. | | | | | | | | |
6.00% due 02/09/231 | | | 8,167,085 | | | | 7,595,390 | |
6.48% due 11/08/19 | | | 708,507 | | | | 686,366 | |
Solera LLC | | | | | | | | |
5.75% due 03/03/23 | | | 5,970,000 | | | | 6,028,447 | |
Epicor Software | | | | | | | | |
4.75% due 06/01/22 | | | 5,154,227 | | | | 5,073,718 | |
5.00% due 06/01/22 | | | 950,000 | | | | 939,313 | |
Avaya, Inc. | | | | | | | | |
6.25% due 05/29/20 | | | 5,639,690 | | | | 4,154,591 | |
SEE NOTES TO FINANCIAL STATEMENTS. | THE GUGGENHEIM FUNDS ANNUAL REPORT | 35 |
SCHEDULE OF INVESTMENTS (continued) | September 30, 2016 |
TOTAL RETURN BOND FUND | |
| | | Face
Amount15 | | | Value | |
| | | | | | | |
Macom Technology Solutions Holdings, Inc. | | | | | | |
4.50% due 05/07/21 | | $ | 1,994,898 | | | $ | 2,011,116 | |
TIBCO Software, Inc. | | | | | | | | |
6.50% due 12/04/20 | | | 1,970,000 | | | | 1,939,386 | |
Advanced Computer Software | | | | | | | | |
10.50% due 01/31/231 | | | 2,000,000 | | | | 1,840,000 | |
Deltek, Inc. | | | | | | | | |
5.00% due 06/25/22 | | | 1,613,879 | | | | 1,617,914 | |
Micro Focus International plc | | | | | | | | |
4.50% due 11/19/21 | | | 850,402 | | | | 853,063 | |
Linxens | | | | | | | | |
5.00% due 10/14/22 | | | 497,494 | | | | 499,359 | |
Ceridian Corp. | | | | | | | | |
4.50% due 09/15/20 | | | 425,000 | | | | 414,906 | |
Compucom Systems, Inc. | | | | | | | | |
4.25% due 05/11/20 | | | 290,010 | | | | 205,423 | |
Aspect Software, Inc. | | | | | | | | |
10.50% due 05/25/20 | | | 15,106 | | | | 14,703 | |
Total Technology | | | | | | | 33,873,695 | |
| | | | | | | | | |
Communications - 0.7% | |
Cengage Learning Acquisitions, Inc. | | | | | | | | |
5.25% due 06/07/23 | | | 17,517,573 | | | | 17,495,676 | |
Numericable US LLC | | | | | | | | |
4.75% due 02/10/23 | | | 4,278,500 | | | | 4,306,567 | |
Internet Brands | | | | | | | | |
4.75% due 07/08/21 | | | 2,544,783 | | | | 2,547,964 | |
Numericable SFR SA | | | | | | | | |
5.00% due 01/15/24 | | | 1,446,375 | | | | 1,459,392 | |
Proquest LLC | | | | | | | | |
5.75% due 10/24/21 | | | 1,356,745 | | | | 1,356,745 | |
Houghton Mifflin Co. | | | | | | | | |
4.00% due 05/31/21 | | | 746,222 | | | | 737,827 | |
Mitel Networks Corp. | | | | | | | | |
5.50% due 04/29/22 | | | 525,000 | | | | 528,119 | |
Total Communications | | | | | | | 28,432,290 | |
| | | | | | | | | |
Consumer, Cyclical - 0.6% | |
Leslie’s Poolmart, Inc. | | | | | | | | |
5.25% due 08/16/23 | | | 4,400,000 | | | | 4,425,651 | |
Petsmart, Inc. | | | | | | | | |
4.25% due 03/11/22 | | | 3,581,864 | | | | 3,585,983 | |
Trader Corp. | | | | | | | | |
5.00% due 08/09/23 | | | 3,400,000 | | | | 3,414,892 | |
Equinox Fitness | | | | | | | | |
5.00% due 01/31/20 | | | 2,364,769 | | | | 2,378,556 | |
Life Time Fitness | | | | | | | | |
4.25% due 06/10/22 | | | 1,712,560 | | | | 1,712,868 | |
1-800 Contacts | | | | | | | | |
5.25% due 01/22/23 | | | 1,592,000 | | | | 1,600,629 | |
Eyemart Express | | | | | | | | |
5.00% due 12/17/21 | | | 1,387,500 | | | | 1,390,969 | |
PTL Acqusition, Inc. | | | | | | | | |
4.00% due 05/12/23 | | | 1,250,000 | | | | 1,260,550 | |
BBB Industries, LLC | | | | | | | | |
6.00% due 11/03/21 | | | 985,000 | | | | 986,231 | |
Prime Security Services Borrower LLC | | | | | | | | |
4.75% due 05/02/22 | | | 723,188 | | | | 729,740 | |
Neiman Marcus Group, Inc. | | | | | | | | |
4.25% due 10/25/20 | | | 585,000 | | | | 537,469 | |
Sears Holdings Corp. | | | | | | | | |
5.50% due 06/30/18 | | | 490,419 | | | | 479,792 | |
Container Store, Inc. | | | | | | | | |
4.25% due 04/05/19 | | | 255,522 | | | | 217,194 | |
Ascena Retail Group | | | | | | | | |
5.25% due 08/21/22 | | | 187,876 | | | | 180,960 | |
Capital Automotive LP | | | | | | | | |
6.00% due 04/30/20 | | | 140,000 | | | | 140,735 | |
Total Consumer, Cyclical | | | | | | | 23,042,219 | |
| | | | | | | | | |
Financial - 0.1% | |
Hyperion Insurance | | | | | | | | |
5.50% due 04/29/22 | | | 2,601,793 | | | | 2,540,806 | |
Acrisure LLC | | | | | | | | |
6.50% due 05/19/22 | | | 1,325,468 | | | | 1,327,960 | |
National Financial Partners Corp. | | | | | | | | |
4.50% due 07/01/20 | | | 1,199,177 | | | | 1,200,928 | |
USI Holdings Corp. | | | | | | | | |
4.25% due 12/27/19 | | | 493,639 | | | | 494,009 | |
American Stock Transfer & Trust | | | | | | | | |
5.75% due 06/26/20 | | | 236,651 | | | | 231,130 | |
Total Financial | | | | | | | 5,794,833 | |
| | | | | | | | | |
36 | THE GUGGENHEIM FUNDS ANNUAL REPORT | SEE NOTES TO FINANCIAL STATEMENTS. |
SCHEDULE OF INVESTMENTS (continued) | September 30, 2016 |
TOTAL RETURN BOND FUND | |
| | | Face
Amount15 | | | Value | |
| | | | | | | |
Basic Materials - 0.1% | |
Ennis-Flint | | | | | | |
5.00% due 06/13/23 | | $ | 4,000,000 | | | $ | 4,030,000 | |
Nexeo Solutions LLC | | | | | | | | |
5.25% due 06/09/23 | | | 1,695,750 | | | | 1,703,177 | |
Total Basic Materials | | | | | | | 5,733,177 | |
| | | | | | | | | |
Utilities - 0.1% | |
Invenergy Thermal Operating I, LLC | | | | | | | | |
6.50% due 10/19/22 | | | 2,673,000 | | | | 2,552,715 | |
Total Senior Floating Rate Interests | | | | | |
(Cost $177,648,959) | | | | | | | 177,551,320 | |
| | | | | | | | | |
MUNICIPAL BONDS†† - 1.1% | |
California - 0.7% | |
State of California General Obligation Unlimited | | | | | | | | |
7.60% due 11/01/40 | | | 19,280,000 | | | | 31,255,386 | |
| | | | | | | | | |
Illinois - 0.2% | |
State of Illinois General Obligation Unlimited | | | | | | | | |
5.65% due 12/01/38 | | | 5,350,000 | | | | 5,555,226 | |
6.90% due 03/01/35 | | | 1,600,000 | | | | 1,811,248 | |
Total Illinois | | | | | | | 7,366,474 | |
| | | | | | | | | |
Michigan - 0.2% | |
Detroit City School District General Obligation Unlimited | | | | | | | | |
7.75% due 05/01/39 | | | 4,900,000 | | | | 6,400,625 | |
Total Municipal Bonds | | | | | | | | |
(Cost $43,145,093) | | | | | | | 45,022,485 | |
| | | | | | | | | |
FOREIGN GOVERNMENT BONDS†† - 0.9% | |
Kenya Government International Bond | | | | | | | | |
6.88% due 06/24/243 | | | 15,750,000 | | | | 15,435,000 | |
Dominican Republic International Bond | | | | | | | | |
6.85% due 01/27/453 | | | 9,700,000 | | | | 10,864,000 | |
Corporation Financiera de Desarrollo S.A. | | | | | | | | |
5.25% due 07/15/292,3 | | | 7,950,000 | | | | 8,566,125 | |
Bahamas Government International Bond | | | | | | | | |
6.95% due 11/20/293 | | | 110,000 | | | | 125,950 | |
Total Foreign Government Bonds | | | | | |
(Cost $34,040,846) | | | | | | | 34,991,075 | |
| | | | | | | | | |
COMMERCIAL PAPER†† - 1.6% | |
Nissan Motor Acceptance Corp. | | | | | | | | |
0.66% due 10/21/163 | | | 36,000,000 | | | | 35,986,800 | |
VF Corp. | | | | | | | | |
0.60% due 10/13/16 | | | 20,000,000 | | | | 19,996,000 | |
American Water Capital Corp. | | | | | | | | |
0.62% due 10/03/16 | | | 1,500,000 | | | | 1,499,944 | |
Apple, Inc. | | | | | | | | |
0.44% due 10/21/16 | | | 1,500,000 | | | | 1,499,633 | |
Nissan Motor Acceptance Corp | | | | | | | | |
0.79% due 11/21/16 | | | 1,500,000 | | | | 1,498,120 | |
Wal-Mart Stores, Inc. | | | | | | | | |
0.40% due 10/18/16 | | | 1,100,000 | | | | 1,099,792 | |
American Honda Finance Corp. | | | | | | | | |
0.50% due 11/08/16 | | | 1,000,000 | | | | 999,510 | |
Microsoft Corp. | | | | | | | | |
0.50% due 11/08/16 | | | 1,000,000 | | | | 999,510 | |
Coca-Cola Co/The | | | | | | | | |
0.50% due 11/14/16 | | | 1,000,000 | | | | 999,463 | |
Total Commercial Paper | | | | | | | | |
(Cost $64,578,800) | | | | | | | 64,578,772 | |
| | | | | | | | | |
REPURCHASE AGREEMENTS††,14 - 0.4% | |
Jefferies & Company, Inc.
issued 09/02/16 at 3.00%
due 10/04/16 | | | 12,842,000 | | | | 12,842,000 | |
SEE NOTES TO FINANCIAL STATEMENTS. | THE GUGGENHEIM FUNDS ANNUAL REPORT | 37 |
SCHEDULE OF INVESTMENTS (continued) | September 30, 2016 |
TOTAL RETURN BOND FUND | |
| | | Face
Amount15 | | | Value | |
| | | | | | | |
Mizuho Securities Company Ltd.
issued 09/21/16 at 1.51%
due 12/20/16 | | $ | 3,659,000 | | | $ | 3,659,000 | |
Total Repurchase Agreements | | | | | |
(Cost $16,501,000) | | | | | | | 16,501,000 | |
| | | | | | | | | |
Total Investments - 101.9% | | | | | | | | |
(Cost $3,961,883,873) | | | | | | $ | 4,026,336,299 | |
Other Assets & Liabilities, net - (1.9)% | | | | (75,011,942 | ) |
Total Net Assets - 100.0% | | | | | | $ | 3,951,324,357 | |
* | Non-income producing security. |
† | Value determined based on Level 1 inputs — See Note 4. |
†† | Value determined based on Level 2 inputs, unless otherwise noted — See Note 4. |
††† | Value determined based on Level 3 inputs — See Note 4. |
1 | Illiquid security. |
2 | Variable rate security. Rate indicated is rate effective at September 30, 2016. |
3 | Security is a 144A or Section 4(a)(2) security. These securities have been determined to be liquid under guidelines established by the Board of Trustees. The total market value of 144A or Section 4(a)(2) liquid securities is $1,965,582,604 (cost $1,944,136,422), or 49.7% of total net assets. |
4 | Security has no stated coupon. However, it is expected to receive residual cash flow payments on defined deal dates. |
5 | Affiliated issuer — See Note 8. |
6 | Rate indicated is the 7 day yield as of September 30, 2016. |
7 | Securities or a portion thereof are held as collateral for reverse repurchase agreements at September 30, 2016 — See Note 12. |
8 | Security is a step up/step down bond. The coupon increases or decreases at regular intervals until the bond reaches full maturity. |
9 | Security is an interest-only strip. Rate indicated is effective yield at September 30, 2016. |
10 | Perpetual maturity. |
11 | Security is in default of interest and/or principal obligations. |
12 | Zero coupon rate security. |
13 | On September 7, 2008, the issuer was placed in conservatorship by the Federal Housing Finance Agency (FHFA). As conservator, the FHFA has full powers to control the assets and operations of the firm. |
14 | Repurchase Agreements — See Note 5. |
15 | The face amount is denominated in U.S. dollars, unless otherwise noted. |
16 | Security is 144A or Section 4(a)(2) security. These securities are considered illiquid and restricted under guidelines established by the Board of Trustees. The total market value of 144A or Section 4(a)(2) illiquid and restricted securities is $75,537,381 (cost $76,808,694) or 1.9% of total net assets — See Note 12. |
| | plc — Public Limited Company |
| | REIT — Real Estate Investment Trust |
| | |
| | See Sector Classification in Other Information section. |
38 | THE GUGGENHEIM FUNDS ANNUAL REPORT | SEE NOTES TO FINANCIAL STATEMENTS. |
SCHEDULE OF INVESTMENTS (continued) | September 30, 2016 |
TOTAL RETURN BOND FUND | |
The following table summarizes the inputs used to value the Fund’s investments at September 30, 2016 (See Note 4 in the Notes to Financial Statements):
Investments in Securities (Assets) | | Level 1 | | | Level 2 | | | Level 3 | | | Total | |
Asset-Backed Securities | | $ | — | | | $ | 1,200,979,735 | | | $ | 19,482,303 | | | $ | 1,220,462,038 | |
Closed-End Funds | | | 9,205,115 | | | | — | | | | — | | | | 9,205,115 | |
Collateralized Mortgage Obligations | | | — | | | | 1,133,265,851 | | | | 26,276,741 | | | | 1,159,542,592 | |
Commercial Paper | | | — | | | | 64,578,772 | | | | — | | | | 64,578,772 | |
Common Stocks | | | 198,830 | | | | — | | | | — | | | | 198,830 | |
Corporate Bonds | | | — | | | | 521,234,005 | | | | 18,329,648 | | | | 539,563,653 | |
Federal Agency Securities | | | — | | | | 229,159,604 | | | | — | | | | 229,159,604 | |
Foreign Government Bonds | | | — | | | | 34,991,075 | | | | — | | | | 34,991,075 | |
Municipal Bonds | | | — | | | | 45,022,485 | | | | — | | | | 45,022,485 | |
Mutual Funds | | | 64,635,095 | | | | — | | | | — | | | | 64,635,095 | |
Preferred Stocks | | | — | | | | 1,117,600 | | | | — | | | | 1,117,600 | |
Repurchase Agreements | | | — | | | | 16,501,000 | | | | — | | | | 16,501,000 | |
Senior Floating Rate Interests | | | — | | | | 177,551,320 | | | | — | | | | 177,551,320 | |
Short Term Investments | | | 124,358,399 | | | | — | | | | — | | | | 124,358,399 | |
U.S. Government Securities | | | — | | | | 339,448,721 | | | | — | | | | 339,448,721 | |
Total | | $ | 198,397,439 | | | $ | 3,763,850,168 | | | $ | 64,088,692 | | | $ | 4,026,336,299 | |
The following is a summary of significant unobservable inputs used in the fair valuation of assets and liabilities categorized within Level 3 of the fair value hierarchy:
Category and Subcategory | | Ending Balance at 09/30/16 | | Valuation
Technique | Unobservable Inputs | | Input
Range | |
Asset-Backed Securities | | $ | 19,482,303 | | Option Adjusted Spread off the prior month end broker mark over the 3 month LIBOR | Indicative Quote | | | — | |
Collateralized Mortgage Obligations | | | 26,276,741 | | Option Adjusted Spread off the prior month end broker mark over the 3 month LIBOR | Indicative Quote | | | — | |
Corporate Bonds | | | 18,329,648 | | Option Adjusted Spread off the prior month end broker mark over the 3 month LIBOR | Indicative Quote | | | — | |
Total | | $ | 64,088,692 | | | | | | | |
Transfers between investment levels may occur as the markets fluctuate and/or the availability of data used in an investment’s valuation changes. Transfers between valuation levels, if any, are in comparison to the valuation levels at the end of the previous fiscal year, and are effective using the fair value as of the end of the previous fiscal period.
As of September 30, 2016, the Fund had securities with a total value of $2,829,654 transfer into Level 3 from Level 2 and securities with a total value of $14,694,302 transfer out of Level 3 into Level 2 due to changes in securities valuation method. There were no other securities that transferred between Levels.
SEE NOTES TO FINANCIAL STATEMENTS. | THE GUGGENHEIM FUNDS ANNUAL REPORT | 39 |
SCHEDULE OF INVESTMENTS (concluded) | September 30, 2016 |
TOTAL RETURN BOND FUND | |
Summary of Fair Value Level 3 Activity
Following is a reconciliation of Level 3 assets for which significant unobservable inputs were used to determine fair value for the year ended September 30, 2016:
LEVEL 3 - Fair value measurement using significant unobservable inputs
| | | Senior Floating Rate Interests | | | Collateralized Mortgage Obligations | | | Asset-Backed Securities | | | Corporate Bonds | | | Preferred Stocks | | | Total | |
TOTAL RETURN BOND | | | | | | | | | | | | | | | | | | |
Assets: | | | | | | | | | | | | | | | | | | |
Beginning Balance | | $ | 820,463 | | | $ | 9,315,497 | | | $ | 9,114,981 | | | $ | 16,625,222 | | | $ | 45 | | | $ | 35,876,208 | |
Purchases | | | — | | | | 28,395,495 | | | | 17,458,340 | | | | — | | | | — | | | | 45,853,835 | |
Sales, maturities and paydowns | | | (8,500 | ) | | | (2,655,626 | ) | | | (3,684,429 | ) | | | (683,596 | ) | | | — | | | | (7,032,151 | ) |
Total realized gains or losses included in earnings | | | — | | | | (263,287 | ) | | | 3,779 | | | | (51,194 | ) | | | (208,125 | ) | | | (518,827 | ) |
Total change in unrealized gains or losses included in earnings | | | 8,500 | | | | 800,158 | | | | 466,198 | | | | 291,339 | | | | 208,080 | | | | 1,774,275 | |
Transfers in Level 3 | | | — | | | | — | | | | 8,921 | | | | 2,820,733 | | | | — | | | | 2,829,654 | |
Transfers out of Level 3 | | | (820,463 | ) | | | (9,315,496 | ) | | | (3,885,487 | ) | | | (672,856 | ) | | | — | | | | (14,694,302 | ) |
Ending Balance | | $ | — | | | $ | 26,276,741 | | | $ | 19,482,303 | | | $ | 18,329,648 | | | $ | — | | | $ | 64,088,692 | |
Net Change in unrealized appreciation (depreciation) for investments in securities still held at September 30, 2016 | | $ | — | | | $ | 381,512 | | | $ | 224,781 | | | $ | 114,141 | | | $ | — | | | $ | 720,434 | |
40 | THE GUGGENHEIM FUNDS ANNUAL REPORT | SEE NOTES TO FINANCIAL STATEMENTS. |
STATEMENT OF ASSETS AND LIABILITIES |
TOTAL RETURN BOND FUND |
September 30, 2016
Assets: | |
Investments in unaffiliated issuers, at value (cost $3,872,773,793) | | $ | 3,935,995,089 | |
Investments in affiliated issuers, at value (cost $72,609,080) | | | 73,840,210 | |
Repurchase agreements, at value (cost $16,501,000) | | | 16,501,000 | |
Total investments (cost $3,961,883,873) | | | 4,026,336,299 | |
Cash | | | 12,413,613 | |
Prepaid expenses | | | 199,558 | |
Receivables: | |
Securities sold | | | 18,854,279 | |
Fund shares sold | | | 20,851,100 | |
Dividends | | | 108,089 | |
Interest | | | 19,790,965 | |
Total assets | | | 4,098,553,903 | |
| | | | | |
Liabilities: | |
Reverse Repurchase Agreements | | | 75,113,227 | |
Unfunded loan commitments, at value (Note 9) (proceeds $296,068) | | | 184,630 | |
Payable for: | |
Securities purchased | | | 62,828,313 | |
Fund shares redeemed | | | 5,586,716 | |
Distribution to shareholders | | | 1,092,693 | |
Management fees | | | 921,062 | |
Transfer agent/maintenance fees | | | 388,356 | |
Distribution and service fees | | | 314,182 | |
Fund accounting/administration fees | | | 299,827 | |
Interest from reverse repurchase agreements | | | 180,239 | |
Trustees’ fees* | | | 16,560 | |
Miscellaneous | | | 303,741 | |
Total liabilities | | | 147,229,546 | |
Net assets | | $ | 3,951,324,357 | |
| | | | | |
Net assets consist of: | |
Paid in capital | | $ | 3,879,832,571 | |
Undistributed net investment income | | | 2,451,545 | |
Accumulated net realized gain on investments | | | 4,478,803 | |
Net unrealized appreciation on investments | | | 64,561,438 | |
Net assets | | $ | 3,951,324,357 | |
| | | | | |
A-Class: | |
Net assets | | $ | 548,222,753 | |
Capital shares outstanding | | | 20,135,531 | |
Net asset value per share | | $ | 27.23 | |
Maximum offering price per share (Net asset value divided by 96.00%) | | $ | 28.36 | |
| | | | | |
C-Class: | |
Net assets | | $ | 216,254,710 | |
Capital shares outstanding | | | 7,941,854 | |
Net asset value per share | | $ | 27.23 | |
| | | | | |
P-Class: | |
Net assets | | $ | 161,928,485 | |
Capital shares outstanding | | | 5,946,871 | |
Net asset value per share | | $ | 27.23 | |
| | | | | |
Institutional Class: | |
Net assets | | $ | 3,024,918,409 | |
Capital shares outstanding | | | 110,968,135 | |
Net asset value per share | | $ | 27.26 | |
* | Relates to Trustees not deemed “interested persons” within the meaning of Section 2(a)(19) of the 1940 Act. |
SEE NOTES TO FINANCIAL STATEMENTS. | THE GUGGENHEIM FUNDS ANNUAL REPORT | 41 |
STATEMENT OF OPERATIONS |
TOTAL RETURN BOND FUND |
Year Ended September 30, 2016
Investment Income: | |
Interest | | $ | 123,244,272 | |
Dividends from securities of affiliated issuers | | | 2,177,635 | |
Dividends from securities of unaffiliated issuers | | | 120,964 | |
Other income | | | 714,214 | |
Total investment income | | | 126,257,085 | |
| | | | | |
Expenses: | |
Management fees | | | 13,935,860 | |
Transfer agent/maintenance fees | |
A-Class | | | 856,670 | |
C-Class | | | 159,938 | |
P-Class | | | 5,538 | |
Institutional Class | | | 1,464,665 | |
Distribution and service fees: | |
A-Class | | | 1,237,573 | |
C-Class | | | 1,470,574 | |
P-Class | | | 171,709 | |
Fund accounting/administration fees | | | 2,647,167 | |
Short interest expense | | | 2,315,262 | |
Line of credit fees | | | 252,405 | |
Trustees’ fees* | | | 104,815 | |
Custodian fees | | | 67,806 | |
Prime broker interest expense | | | 1,153 | |
Miscellaneous | | | 821,021 | |
Total expenses | | | 25,512,156 | |
Less: | |
Expenses waived by Advisor | | | (4,014,962 | ) |
Expenses waived by Transfer Agent | | | | |
A-Class | | | (185,755 | ) |
C-Class | | | — | |
P-Class | | | — | |
Institutional Class | | | (1,316,484 | ) |
Expenses waived by Distributor | | | | |
A-Class | | | (8,545 | ) |
P-Class | | | — | |
Total waived expenses | | | (5,525,746 | ) |
Net expenses | | | 19,986,410 | |
Net investment income | | | 106,270,675 | |
| | | | | |
Net Realized and Unrealized Gain (Loss): | |
Net realized gain (loss) on: | |
Investments in unaffiliated issuers | | | 27,231,139 | |
Investments in affiliated issuers | | | (1,563,315 | ) |
Swap agreements | | | 78,755 | |
Foreign currency | | | 20,643 | |
Forward currency exchange contracts | | | (61,000 | ) |
Options purchased | | | (724,488 | ) |
Options written | | | 197,829 | |
Net realized gain | | | 25,179,563 | |
Net change in unrealized appreciation (depreciation) on: | |
Investments in unaffiliated issuers | | | 82,031,406 | |
Investments in affiliated issuers | | | 1,498,599 | |
Swap agreements | | | (233,580 | ) |
Options purchased | | | (542,718 | ) |
Options written | | | 95,691 | |
Forward foreign currency exchange contracts | | | 8,192 | |
Foreign currency | | | (2,426 | ) |
Net change in unrealized appreciation (depreciation) | | | 82,855,164 | |
Net realized and unrealized gain | | | 108,034,727 | |
Net increase in net assets resulting from operations | | $ | 214,305,402 | |
* | Relates to Trustees not deemed “interested persons” within the meaning of Section 2(a)(19) of the 1940 Act. |
42 | THE GUGGENHEIM FUNDS ANNUAL REPORT | SEE NOTES TO FINANCIAL STATEMENTS. |
STATEMENTS OF CHANGES IN NET ASSETS |
TOTAL RETURN BOND FUND | |
| | | Year Ended
September 30,
2016 | | | Year Ended
September 30,
2015 | |
Increase (Decrease) in Net Assets from Operations: | | | | | | |
Net investment income | | $ | 106,270,675 | | | $ | 45,275,578 | |
Net realized gain (loss) on investments | | | 25,179,563 | | | | (1,184,115 | ) |
Net change in unrealized appreciation (depreciation) on investments | | | 82,855,164 | | | | (23,680,352 | ) |
Net increase in net assets resulting from operations | | | 214,305,402 | | | | 20,411,111 | |
| | | | | | | | | |
Distributions to shareholders from: | | | | | | | | |
Net investment income | | | | | | | | |
A-Class | | | (19,285,718 | ) | | | (12,143,821 | ) |
C-Class | | | (4,414,562 | ) | | | (1,931,992 | ) |
P-Class | | | (2,468,760 | ) | | | (50,783 | )* |
Institutional Class | | | (85,820,390 | ) | | | (37,951,737 | ) |
Net realized gains | | | | | | | | |
A-Class | | | — | | | | (151,030 | ) |
C-Class | | | — | | | | (42,876 | ) |
Institutional Class | | | — | | | | (494,795 | ) |
Total distributions to shareholders | | | (111,989,430 | ) | | | (52,767,034 | ) |
| | | | | | | | | |
Capital share transactions: | | | | | | | | |
Proceeds from sale of shares | | | | | | | | |
A-Class | | | 409,315,803 | | | | 458,924,613 | |
C-Class | | | 142,276,966 | | | | 71,678,491 | |
P-Class | | | 169,273,892 | | | | 12,910,094 | * |
Institutional Class | | | 2,285,297,704 | | | | 1,454,555,055 | |
Distributions reinvested | | | | | | | | |
A-Class | | | 16,940,775 | | | | 11,204,598 | |
C-Class | | | 3,370,562 | | | | 1,494,334 | |
P-Class | | | 2,496,360 | | | | 50,783 | * |
Institutional Class | | | 68,800,673 | | | | 30,228,500 | |
Cost of shares redeemed | | | | | | | | |
A-Class | | | (328,114,466 | ) | | | (117,493,593 | ) |
C-Class | | | (24,573,068 | ) | | | (7,519,876 | ) |
P-Class | | | (26,108,049 | ) | | | (407,473 | )* |
Institutional Class | | | (816,727,764 | ) | | | (323,091,282 | ) |
Net increase from capital share transactions | | | 1,902,249,388 | | | | 1,592,534,244 | |
Net increase in net assets | | | 2,004,565,360 | | | | 1,560,178,321 | |
| | | | | | | | | |
Net assets: | | | | | | | | |
Beginning of year | | | 1,946,758,997 | | | | 386,580,676 | |
End of year | | $ | 3,951,324,357 | | | $ | 1,946,758,997 | |
Undistributed net investment income/Accumulated net investment loss at end of year | | $ | 2,451,545 | | | $ | (5,568,813 | ) |
SEE NOTES TO FINANCIAL STATEMENTS. | THE GUGGENHEIM FUNDS ANNUAL REPORT | 43 |
STATEMENTS OF CHANGES IN NET ASSETS (concluded) |
TOTAL RETURN BOND FUND | |
| | | Year Ended
September 30,
2016 | | | Year Ended
September 30,
2015 | |
Capital share activity: | | | | | | |
Shares sold | | | | | | |
A-Class | | | 15,477,259 | | | | 17,036,418 | |
C-Class | | | 5,370,784 | | | | 2,663,981 | |
P-Class | | | 6,363,397 | | | | 485,553 | * |
Institutional Class | | | 86,143,028 | | | | 53,995,281 | |
Shares issued from reinvestment of distributions | | | | | | | | |
A-Class | | | 639,848 | | | | 417,283 | |
C-Class | | | 126,992 | | | | 55,663 | |
P-Class | | | 93,411 | | | | 1,915 | * |
Institutional Class | | | 2,587,333 | | | | 1,125,242 | |
Shares redeemed | | | | | | | | |
A-Class | | | (12,426,783 | ) | | | (4,379,242 | ) |
C-Class | | | (926,958 | ) | | | (280,709 | ) |
P-Class | | | (982,068 | ) | | | (15,337 | )* |
Institutional Class | | | (30,884,118 | ) | | | (12,035,818 | ) |
Net increase in shares | | | 71,582,125 | | | | 59,070,230 | |
* | Since the commencement of operations: May 1, 2015. |
44 | THE GUGGENHEIM FUNDS ANNUAL REPORT | SEE NOTES TO FINANCIAL STATEMENTS. |
FINANCIAL HIGHLIGHTS |
TOTAL RETURN BOND FUND | |
This table is presented to show selected data for a share outstanding throughout each period and to assist shareholders in evaluating a Fund’s performance for the periods presented.
A-Class | | Year Ended
Sept. 30,
2016 | | | Year Ended
Sept. 30,
2015 | | | Year Ended
Sept. 30,
2014 | | | Year Ended
Sept. 30,
2013 | | | Period Ended
Sept. 30,
2012a | |
Per Share Data | | | | | | | | | | | | | | | |
Net asset value, beginning of period | | $ | 26.50 | | | $ | 26.94 | | | $ | 26.16 | | | $ | 26.51 | | | $ | 25.00 | |
Income (loss) from investment operations: | |
Net investment income (loss)b | | | .96 | | | | .94 | | | | 1.01 | | | | 1.20 | | | | 1.08 | |
Net gain (loss) on investments (realized and unrealized) | | | .81 | | | | (.25 | ) | | | 1.13 | | | | (.28 | ) | | | 1.35 | |
Total from investment operations | | | 1.77 | | | | .69 | | | | 2.14 | | | | .92 | | | | 2.43 | |
Less distributions from: | |
Net investment income | | | (1.04 | ) | | | (1.09 | ) | | | (1.36 | ) | | | (1.23 | ) | | | (.92 | ) |
Net realized gains | | | — | | | | (.04 | ) | | | — | | | | (.04 | ) | | | — | |
Total distributions | | | (1.04 | ) | | | (1.13 | ) | | | (1.36 | ) | | | (1.27 | ) | | | (.92 | ) |
Net asset value, end of period | | $ | 27.23 | | | $ | 26.50 | | | $ | 26.94 | | | $ | 26.16 | | | $ | 26.51 | |
| | |
Total Return | | | 6.88 | % | | | 2.56 | % | | | 8.34 | % | | | 3.53 | % | | | 9.78 | % |
Ratios/Supplemental Data | |
Net assets, end of period (in thousands) | | $ | 548,223 | | | $ | 435,760 | | | $ | 90,805 | | | $ | 74,328 | | | $ | 30,689 | |
Ratios to average net assets: | |
Net investment income (loss) | | | 3.63 | % | | | 3.50 | % | | | 3.80 | % | | | 4.47 | % | | | 5.10 | % |
Total expensesc | | | 1.15 | % | | | 1.10 | % | | | 1.19 | % | | | 1.27 | % | | | 1.51 | % |
Net expensesd,f | | | 0.97 | % | | | 0.91 | % | | | 0.94 | % | | | 0.98 | % | | | 0.85 | % |
Portfolio turnover rate | | | 86 | % | | | 74 | % | | | 52 | % | | | 94 | % | | | 69 | % |
SEE NOTES TO FINANCIAL STATEMENTS. | THE GUGGENHEIM FUNDS ANNUAL REPORT | 45 |
FINANCIAL HIGHLIGHTS (continued) |
TOTAL RETURN BOND FUND | |
This table is presented to show selected data for a share outstanding throughout each period and to assist shareholders in evaluating a Fund’s performance for the periods presented.
C-Class | | Year Ended
Sept. 30,
2016 | | | Year Ended
Sept. 30,
2015 | | | Year Ended
Sept. 30,
2014 | | | Year Ended
Sept. 30,
2013 | | | Period Ended
Sept. 30,
2012a | |
Per Share Data | | | | | | | | | | | | | | | |
Net asset value, beginning of period | | $ | 26.50 | | | $ | 26.94 | | | $ | 26.16 | | | $ | 26.50 | | | $ | 25.00 | |
Income (loss) from investment operations: | |
Net investment income (loss)b | | | .75 | | | | .74 | | | | .82 | | | | .99 | | | | .94 | |
Net gain (loss) on investments (realized and unrealized) | | | .82 | | | | (.25 | ) | | | 1.12 | | | | (.27 | ) | | | 1.32 | |
Total from investment operations | | | 1.57 | | | | .49 | | | | 1.94 | | | | .72 | | | | 2.26 | |
Less distributions from: | |
Net investment income | | | (.84 | ) | | | (.89 | ) | | | (1.16 | ) | | | (1.02 | ) | | | (.76 | ) |
Net realized gains | | | — | | | | (.04 | ) | | | — | | | | (.04 | ) | | | — | |
Total distributions | | | (.84 | ) | | | (.93 | ) | | | (1.16 | ) | | | (1.06 | ) | | | (.76 | ) |
Net asset value, end of period | | $ | 27.23 | | | $ | 26.50 | | | $ | 26.94 | | | $ | 26.16 | | | $ | 26.50 | |
| | |
Total Return | | | 6.08 | % | | | 1.82 | % | | | 7.58 | % | | | 2.77 | % | | | 9.09 | % |
Ratios/Supplemental Data | |
Net assets, end of period (in thousands) | | $ | 216,255 | | | $ | 89,320 | | | $ | 25,107 | | | $ | 15,654 | | | $ | 6,607 | |
Ratios to average net assets: | |
Net investment income (loss) | | | 2.82 | % | | | 2.75 | % | | | 3.10 | % | | | 3.70 | % | | | 4.38 | % |
Total expensesc | | | 1.83 | % | | | 1.80 | % | | | 1.90 | % | | | 2.07 | % | | | 2.26 | % |
Net expensesd,f | | | 1.69 | % | | | 1.63 | % | | | 1.66 | % | | | 1.77 | % | | | 1.63 | % |
Portfolio turnover rate | | | 86 | % | | | 74 | % | | | 52 | % | | | 94 | % | | | 69 | % |
46 | THE GUGGENHEIM FUNDS ANNUAL REPORT | SEE NOTES TO FINANCIAL STATEMENTS. |
FINANCIAL HIGHLIGHTS (continued) |
TOTAL RETURN BOND FUND |
This table is presented to show selected data for a share outstanding throughout each period and to assist shareholders in evaluating a Fund’s performance for the periods presented.
P-Class | | Year Ended
Sept. 30,
2016 | | | Period Ended
Sept. 30,
2015e | |
Per Share Data | | | | | | |
Net asset value, beginning of period | | $ | 26.49 | | | $ | 26.98 | |
Income (loss) from investment operations: | |
Net investment income (loss)b | | | .96 | | | | .36 | |
Net gain (loss) on investments (realized and unrealized) | | | .84 | | | | (.43 | ) |
Total from investment operations | | | 1.80 | | | | (.07 | ) |
Less distributions from: | |
Net investment income | | | (1.06 | ) | | | (.42 | ) |
Total distributions | | | (1.06 | ) | | | (.42 | ) |
Net asset value, end of period | | $ | 27.23 | | | $ | 26.49 | |
| | |
Total Return | | | 6.97 | % | | | (0.21 | %) |
Ratios/Supplemental Data | |
Net assets, end of period (in thousands) | | $ | 161,928 | | | $ | 12,509 | |
Ratios to average net assets: | |
Net investment income (loss) | | | 3.58 | % | | | 3.20 | % |
Total expensesc | | | 0.96 | % | | | 1.02 | % |
Net expensesd,f | | | 0.82 | % | | | 0.84 | % |
Portfolio turnover rate | | | 86 | % | | | 74 | % |
SEE NOTES TO FINANCIAL STATEMENTS. | THE GUGGENHEIM FUNDS ANNUAL REPORT | 47 |
FINANCIAL HIGHLIGHTS (concluded) |
TOTAL RETURN BOND FUND |
This table is presented to show selected data for a share outstanding throughout each period and to assist shareholders in evaluating a Fund’s performance for the periods presented.
Institutional Class | | Year Ended
Sept. 30,
2016 | | | Year Ended
Sept. 30,
2015 | | | Year Ended
Sept. 30,
2014 | | | Year Ended
Sept. 30,
2013 | | | Period Ended
Sept. 30,
2012a | |
Per Share Data | | | | | | | | | | | | | | | |
Net asset value, beginning of period | | $ | 26.53 | | | $ | 26.97 | | | $ | 26.19 | | | $ | 26.54 | | | $ | 25.00 | |
Income (loss) from investment operations: | |
Net investment income (loss)b | | | 1.05 | | | | 1.03 | | | | 1.09 | | | | 1.28 | | | | 1.06 | |
Net gain (loss) on investments (realized and unrealized) | | | .82 | | | | (.25 | ) | | | 1.14 | | | | (.27 | ) | | | 1.44 | |
Total from investment operations | | | 1.87 | | | | .78 | | | | 2.23 | | | | 1.01 | | | | 2.50 | |
Less distributions from: | |
Net investment income | | | (1.14 | ) | | | (1.18 | ) | | | (1.45 | ) | | | (1.32 | ) | | | (.96 | ) |
Net realized gains | | | — | | | | (.04 | ) | | | — | | | | (.04 | ) | | | — | |
Total distributions | | | (1.14 | ) | | | (1.22 | ) | | | (1.45 | ) | | | (1.36 | ) | | | (.96 | ) |
Net asset value, end of period | | $ | 27.26 | | | $ | 26.53 | | | $ | 26.97 | | | $ | 26.19 | | | $ | 26.54 | |
| | |
Total Return | | | 7.26 | % | | | 2.91 | % | | | 8.74 | % | | | 3.88 | % | | | 10.09 | % |
Ratios/Supplemental Data | |
Net assets, end of period (in thousands) | | $ | 3,024,918 | | | $ | 1,409,171 | | | $ | 270,668 | | | $ | 78,318 | | | $ | 44,566 | |
Ratios to average net assets: | |
Net investment income (loss) | | | 3.94 | % | | | 3.83 | % | | | 4.09 | % | | | 4.78 | % | | | 4.91 | % |
Total expensesc | | | 0.79 | % | | | 0.76 | % | | | 0.81 | % | | | 0.89 | % | | | 0.99 | % |
Net expensesd,f | | | 0.59 | % | | | 0.57 | % | | | 0.57 | % | | | 0.64 | % | | | 0.52 | % |
Portfolio turnover rate | | | 86 | % | | | 74 | % | | | 52 | % | | | 94 | % | | | 69 | % |
a | Since commencement of operations: November 30, 2011. Percentage amounts for the period, except total return and portfolio turnover rate, have been annualized. |
b | Net investment income (loss) per share was computed using average shares outstanding throughout the period. |
c | Does not include expenses of the underlying funds in which the Fund invests. |
d | Net expense information reflects the expense ratios after expense waivers. |
e | Since commencement of operations: May 1, 2015. Percentage amounts for the period, except total return and portfolio turnover rate, have been annualized. |
f | Net expenses may include expenses that are excluded from the expense limitation agreement. Excluding these expenses, the operating expense ratio for the year would be: |
| | | 09/30/16 | 09/30/15 | 09/30/14 | 09/30/13 | 09/30/12 |
| | A-Class | 0.87% | 0.84% | 0.86% | 0.86% | 0.82% |
| | C-Class | 1.60% | 1.56% | 1.58% | 1.64% | 1.59% |
| | P-Class | 0.75% | 0.75% | N/A | N/A | N/A |
| | Institutional Class | 0.49% | 0.50% | 0.50% | 0.52% | 0.50% |
48 | THE GUGGENHEIM FUNDS ANNUAL REPORT | SEE NOTES TO FINANCIAL STATEMENTS. |
NOTES TO FINANCIAL STATEMENTS |
1. Organization and Significant Accounting Policies
Organization
Guggenheim Funds Trust (the “Trust”), a Delaware statutory trust, is registered with the SEC under the Investment Company Act of 1940 (“1940 Act”), as an open-ended investment company of the series type. Each series, in effect, is representing a separate Fund. The Trust is authorized to issue an unlimited number of shares. The Trust accounts for the assets of each Fund separately.
The Trust offers a combination of four separate classes of shares, A-Class shares, C-Class shares, P-Class shares and Institutional Class shares. Sales of shares of each Class are made without a front-end sales charge at the net asset value per share (“NAV”), with the exception of A-Class shares. A-Class shares are sold at the NAV, plus the applicable front-end sales charge. The sales charge varies depending on the amount purchased, but will not exceed 4.00%. A-Class share purchases of $1 million or more are exempt from the front-end sales charge but have a 1% contingent deferred sales charge (“CDSC”), if shares are redeemed within 12 months of purchase. C-Class shares have a 1% CDSC if shares are redeemed within 12 months of purchase. Institutional Class shares are offered primarily for direct investment by institutions such as pension and profit sharing plans, endowments, foundations and corporations. Institutional Class shares require a minimum initial investment of $2 million and a minimum account balance of $1 million. At September 30, 2016, the Trust consisted of nineteen funds (the “Funds”).
This report covers the Total Return Bond Fund (the “Fund”), a diversified investment company.
Guggenheim Investments (“GI”) provides advisory services, and Rydex Fund Services, LLC (“RFS”) provides transfer agent, administrative and accounting services to the Trust. Guggenheim Funds Distributors, LLC (“GFD”) acts as principal underwriter for the Trust. GI and GFD are affiliated entities; RFS ceased to be an affiliate of GI as of October 4, 2016, when it was acquired by MUFG Investor Services. In connection with its acquisition, RFS changed its name to MUFG Investor Services (US), LLC (“MUIS”). This change has no impact on the financial statements of the Fund.
Significant Accounting Policies
The Fund operates as an investment company and, accordingly, follows the investment company accounting and reporting guidance of the Financial Accounting Standards Board (“FASB”) Accounting Standards Codification Topic 946 Financial Services – Investment Companies.
The following significant accounting policies are in conformity with U.S. generally accepted accounting principles (“U.S. GAAP”) and are consistently followed by the Trust. This requires management to make estimates and assumptions that affect the reported amount of assets and liabilities, contingent assets and liabilities at the date of the financial statements, and the reported amounts of revenues and expenses during the reporting period. Actual results could differ from these estimates. All time references are based on Eastern Time.
| | THE GUGGENHEIM FUNDS ANNUAL REPORT | 49 |
NOTES TO FINANCIAL STATEMENTS (continued) |
The NAV of each Class of the Fund is calculated by dividing the market value of the Fund’s securities and other assets, less all liabilities attributable to the Class, by the number of outstanding shares of the Class.
A. The Board of Trustees of the Fund (the “Board”) has adopted policies and procedures for the valuation of the Fund’s investments (the “Valuation Procedures”). Pursuant to the Valuation Procedures, the Board has delegated to a valuation committee, consisting of representatives from Guggenheim’s investment management, fund administration, legal and compliance departments (the “Valuation Committee”), the day-to-day responsibility for implementing the Valuation Procedures, including, under most circumstances, the responsibility for determining the fair value of the Fund’s securities and/or other assets.
Valuations of the Fund’s securities are supplied primarily by pricing services appointed pursuant to the processes set forth in the Valuation Procedures. The Valuation Committee convenes monthly, or more frequently as needed, to review the valuation of all assets which have been fair valued for reasonableness. The Fund’s officers, through the Valuation Committee and consistent with the monitoring and review responsibilities set forth in the Valuation Procedures, regularly review procedures used and valuations provided by the pricing services.
If the pricing service cannot or does not provide a valuation for a particular investment or such valuation is deemed unreliable, such investment is fair valued by the Valuation Committee.
Equity securities listed on an exchange (New York Stock Exchange (“NYSE”) or American Stock Exchange) are valued at the last quoted sales price as of the close of business on the NYSE, usually 4:00 p.m. on the valuation date. Equity securities listed on the NASDAQ market system are valued at the NASDAQ Official Closing Price on the valuation date, which may not necessarily represent the last sale price. If there has been no sale on such exchange or NASDAQ on a given day, the security is valued at the closing bid price on that day.
Generally, trading in foreign securities markets is substantially completed each day at various times prior to the close of the NYSE. The values of foreign securities are determined as of the close of such foreign markets or the close of the NYSE, if earlier. All investments quoted in foreign currencies are valued in U.S. dollars on the basis of the foreign currency exchange rates prevailing at the close of business. Investments in foreign securities may involve risks not present in domestic investments. The Valuation Committee will determine the current value of such foreign securities by taking into consideration certain factors which may include those discussed above, as well as the following factors, among others: the value of the securities traded on other foreign markets, ADR trading, closed-end fund trading, foreign currency exchange activity, and the trading prices of financial products that are tied to foreign securities. In addition, the Board has authorized the Valuation Committee and GI to use prices and other information supplied by a third party pricing vendor in valuing foreign securities.
50 | THE GUGGENHEIM FUNDS ANNUAL REPORT | |
NOTES TO FINANCIAL STATEMENTS (continued) |
Open-end investment companies (“mutual funds”) are valued at their NAV as of the close of business, on the valuation date. Exchange-traded funds (“ETFs”) and closed-end investment companies (“CEFs”) are valued at the last quoted sales price.
U.S. Government securities are valued by either independent pricing services, the last traded fill price, or at the reported bid price at the close of business.
Debt securities with a maturity of greater than 60 days at acquisition are valued at prices that reflect broker-dealer supplied valuations or are obtained from independent pricing services, which may consider the trade activity, treasury spreads, yields or price of bonds of comparable quality, coupon, maturity, and type, as well as prices quoted by dealers who make markets in such securities. Short-term debt securities with a maturity of 60 days or less at acquisition are valued at amortized cost, provided such amount approximates market value.
Repurchase agreements are valued at amortized cost, provided such amounts approximate market value.
Typically, loans are valued using information provided by an independent third party pricing service which uses broker quotes in a non-active market.
Listed options are valued at the Official Settlement Price listed by the exchange, usually as of 4:00 p.m. Long options are valued using the bid price and short options are valued using the ask price. In the event that a settlement price is not available, fair valuation is enacted. Over-the-counter options are valued using the average bid price (for long options), or average ask price (for short options) obtained from one or more security dealers.
The value of interest rate swap agreements entered into by a Fund are accounted for using the unrealized gain or loss on the agreements that is determined using the spread priced off the previous day’s Chicago Mercantile Exchange (“CME”) price.
Forward foreign currency exchange contracts are valued daily based on the applicable exchange rate of the underlying currency. The change in value of the contract is recorded as unrealized appreciation or depreciation until the forward foreign currency contract is closed. When the forward foreign currency contract is closed, the Fund records a realized gain or loss equal to the difference between the value at the time the contract was opened and the value at the time it was closed.
Investments for which market quotations are not readily available are fair-valued as determined in good faith by GI under the direction of the Board using methods established or ratified by the Board. Valuations in accordance with these methods are intended to reflect each security’s (or asset’s) “fair value.” Each such determination is based on a consideration of all relevant factors, which are likely to vary from one pricing context to another. Examples of such factors may include, but are not limited to: market prices; sale prices; broker quotes; and models which derive prices
| | THE GUGGENHEIM FUNDS ANNUAL REPORT | 51 |
NOTES TO FINANCIAL STATEMENTS (continued) |
based on inputs such as prices of securities with comparable maturities and characteristics, or based on inputs such as anticipated cash flows or collateral, spread over Treasuries, and other information analysis.
In connection with futures contracts and other derivative investments, such factors may include obtaining information as to how (a) these contracts and other derivative investments trade in the futures or other derivative markets, respectively, and (b) the securities underlying these contracts and other derivative investments trade in the cash market.
B. Senior loans in which the Fund invests generally pay interest rates which are periodically adjusted by reference to a base short-term floating rate, plus a premium. These base lending rates are generally (i) the lending rate offered by one or more major European banks, such as the one-month or three-month London Inter-Bank Offered Rate (LIBOR), (ii) the prime rate offered by one or more major United States banks, or (iii) the bank’s certificate of deposit rate. Senior floating rate interests often require prepayments from excess cash flows or permit the borrower to repay at its election. The rate at which the borrower repays cannot be predicted with accuracy. As a result, the actual remaining maturity may be substantially less than the stated maturities shown. The interest rate indicated is the rate in effect at September 30, 2016.
C. The Fund may purchase and sell interests in securities on a when-issued and delayed delivery basis, with payment and delivery scheduled for a future date. No income accrues to the Fund on such interests or securities in connection with such transactions prior to the date the Fund actually takes delivery of such interests or securities. These transactions are subject to market fluctuations and are subject to the risk that the value at delivery may be more or less than the trade date purchase price. Although the Fund will generally purchase these securities with the intention of acquiring such securities, they may sell such securities before the settlement date.
D. Upon the purchase of an option, the premium paid is recorded as an investment, the value of which is marked-to-market daily. If a purchased option expires, the Fund realizes a loss in the amount of the cost of the option. When the Fund enters into a closing sale transaction, it realizes a gain or loss depending on whether the proceeds from the closing sale transaction are greater or less than the cost of the option. If the Fund exercises a put option, it realizes a gain or loss from the sale of the underlying security and the proceeds from such sale will be decreased by the premium originally paid. When the Fund exercises a call option, the cost of the security purchased by the Fund upon exercise increases by the premium originally paid.
When the Fund writes (sells) an option, an amount equal to the premium received is entered in that Fund’s accounting records as an asset and equivalent liability. The amount of the liability is subsequently marked-to-market to reflect the current value of the option written. When a written option expires, or if the Fund enters into a closing purchase transaction, it realizes a gain (or loss if the cost of a closing purchase transaction exceeds the premium received when the option was sold).
52 | THE GUGGENHEIM FUNDS ANNUAL REPORT | |
NOTES TO FINANCIAL STATEMENTS (continued) |
E. Swap agreements are marked-to-marked daily and the change, if any, is recorded as unrealized gain or loss. Payments received or made as a result of an agreement or termination of the agreement are recognized as realized gains or losses.
F. The accounting records of the Fund are maintained in U.S. dollars. All assets and liabilities initially expressed in foreign currencies are converted into U.S. dollars at prevailing exchange rates. Purchases and sales of investment securities, dividend and interest income, and certain expenses are translated at the rates of exchange prevailing on the respective dates of such transactions. Changes in the relationship of these foreign currencies to the U.S. dollar can significantly affect the value of the investments and earnings of the Fund. Foreign investments may also subject the Fund to foreign government exchange restrictions, expropriation, taxation, or other political, social or economic developments, all of which could affect the market and/or credit risk of the investments.
The Fund does not isolate that portion of the results of operations resulting from changes in the foreign exchange rates on investments from the fluctuations arising from changes in the market prices of securities held. Such fluctuations are included with the net realized and unrealized gain or loss on investments.
Reported net realized foreign exchange gains and losses arise from sales of foreign currencies and currency gains or losses realized between the trade and settlement dates on investment transactions. Net unrealized exchange gains and losses arise from changes in the fair values of assets and liabilities other than investments in securities at the fiscal period end, resulting from changes in exchange rates.
G. Security transactions are recorded on the trade date for financial reporting purposes. Realized gains and losses from securities transactions are recorded using the identified cost basis. Proceeds from lawsuits related to investment holdings are recorded as realized gains in the Fund. Dividend income is recorded on the ex-dividend date, net of applicable taxes withheld by foreign countries. Taxable non-cash dividends are recorded as dividend income. Interest income, including amortization of premiums and accretion of discounts, is accrued on a daily basis. Interest income also includes paydown gains and losses on mortgage-backed and asset-backed securities and senior and subordinated loans. Amendment fees are earned as compensation for evaluating and accepting changes to the original loan agreement and are recognized when received. Dividend income from REITs is recorded based on the income included in the distributions received from the REIT investments using published REIT classifications, including some management estimates when actual amounts are not available. Distributions received in excess of this estimated amount are recorded as a reduction of the cost of investments or reclassified to capital gains. The actual amounts of income, return of capital, and capital gains are only determined by each REIT after its fiscal year-end, and may differ from the estimated amounts.
H. The Fund declares dividends from investment income daily. The Fund pays its shareholders from its net investment income monthly and distributes any net capital gains that it has realized, at least annually. Distributions to shareholders are recorded on the ex-dividend date. Dividends
| | THE GUGGENHEIM FUNDS ANNUAL REPORT | 53 |
NOTES TO FINANCIAL STATEMENTS (continued) |
are reinvested in additional shares unless shareholders request payment in cash. The character of distributions made during the year from net investment income or net realized gains may differ from their ultimate characterization for federal income tax purposes.
I. Interest and dividend income, most expenses, all realized gains and losses, and all unrealized gains and losses are allocated to the classes based upon the value of the outstanding shares in each Class. Certain costs, such as distribution and service fees are charged directly to specific classes. In addition, certain expenses have been allocated to the individual Funds in the Trust on a pro rata basis upon the respective aggregate net assets of each Fund included in the Trust.
J. Under the fee arrangement with the custodian, the Fund may earn credits based on overnight custody cash balances. These credits are utilized to reduce related custodial expenses. The custodian fees disclosed in the Statement of Operations are before the reduction in expense from the related earnings credits, if any. For the year ended September 30, 2016, there were no earnings credits received.
K. The Fund may leave cash overnight in its cash account with the custodian. Periodically, the Fund may have cash due to the custodian bank as an overdraft balance. A fee is incurred on this overdraft, calculated by multiplying the overdraft by a rate based on the federal funds rate, which was 0.29% at September 30, 2016.
L. Under the Fund’s organizational documents, its Trustees and Officers are indemnified against certain liabilities arising out of the performance of their duties to the Trust. In addition, throughout the normal course of business, the Fund enters into contracts that contain a variety of representations and warranties which provide general indemnifications. The Fund’s maximum exposure under these arrangements is unknown, as this would involve future claims that may be made against the Fund and/or its affiliates that have not yet occurred. However, based on experience, the Fund expects the risk of loss to be remote.
2. Financial Instruments and Derivatives
As part of its investment strategy, the Fund utilizes a variety of derivative instruments. These investments involve, to varying degrees, elements of market risk and risks in excess of the amounts recognized in the Statement of Assets and Liabilities. Valuation and accounting treatment of these instruments can be found under Significant Accounting Policies in Note 1 of these Notes to Financial Statements.
Derivatives
Derivatives are instruments whose values depend on, or are derived from, in whole or in part, the value of one or more other assets, such as securities, currencies, commodities or indices. Derivative instruments may be used to increase investment flexibility (including to maintain cash reserves while maintaining exposure to certain other assets), for risk management (hedging) purposes, to facilitate trading, to reduce transaction costs and to pursue higher investment returns. Derivative instruments may also be used to mitigate certain investment risks, such
54 | THE GUGGENHEIM FUNDS ANNUAL REPORT | |
NOTES TO FINANCIAL STATEMENTS (continued) |
as foreign currency exchange rate risk, interest rate risk and credit risk. U.S. GAAP requires disclosures to enable investors to better understand how and why a Fund uses derivative instruments, how these derivative instruments are accounted for and their effects on the Fund’s financial position and results of operations.
The Funds may utilize derivatives for the following purposes:
Duration: the use of an instrument to manage the interest rate risk of a portfolio.
Hedge: an investment made in order to reduce the risk of adverse price movements in a security, by taking an offsetting position to protect against broad market moves.
Options Purchased and Written
A call option on a security gives the purchaser of the option the right to buy, and the writer of a call option the obligation to sell, the underlying security. The purchaser of a put option has the right to sell, and the writer of the put option the obligation to buy the underlying security at any time during the option period. The risk associated with purchasing options is limited to the premium originally paid.
The risk in writing a call option is that a Fund may incur a loss if the market price of the underlying security increases and the option is exercised. The risk in writing a put option is that a Fund may incur a loss if the market price of the underlying security decreases and the option is exercised. In addition, there may be an imperfect correlation between the movement in prices of options and the underlying securities where a Fund may not be able to enter into a closing transaction because of an illiquid secondary market; or, for OTC options, a Fund may be at risk because of the counterparty’s inability to perform.
The Fund used written options for Duration and Hedge. The following table represents the Fund’s use and activity of options written for the year ended September 30, 2016:
Call Options Written
Written Call Options | | | |
| | | Total Return Bond Fund | |
| | | Number of
Contracts | | | Premium
Amount | |
Balance at September 30, 2015 | | | 7,338 | | | $ | 197,829 | |
Options Written | | | — | | | | — | |
Options terminated in closing purchase transactions | | | — | | | | — | |
Options expired | | | (7,338 | ) | | | (197,829 | ) |
Options exercised | | | — | | | | — | |
Balance at September 30, 2016 | | | — | | | $ | — | |
| | THE GUGGENHEIM FUNDS ANNUAL REPORT | 55 |
NOTES TO FINANCIAL STATEMENTS (continued) |
Swaps
A swap is an agreement that obligates two parties to exchange a series of cash flows at specified intervals based upon or calculated by reference to changes in specified prices or rates for a specified amount of an underlying asset. A Fund utilizing OTC swaps bears the risk of loss of the amount expected to be received under a swap agreement in the event of the default or bankruptcy of a swap agreement counterparty or if the underlying asset declines in value. Certain standardized swaps are subject to mandatory central clearing. Central clearing generally reduces counterparty credit risk and increases liquidity, but central clearing does not make swap transactions risk-free. Additionally, there is no guarantee that a Fund or an underlying fund could eliminate its exposure under an outstanding swap agreement by entering into an offsetting swap agreement with the same or another party.
Total return swaps involve commitments where single or multiple cash flows are exchanged based on the price of an underlying reference asset (such as index or basket) or a fixed or variable interest rate. Index swaps will usually be computed based on the current index value as of the close of regular trading on the NYSE or other exchange, with the swap value being adjusted to include dividends accrued, financing charges and/or interest associated with the swap agreement. Custom basket swaps are computed in a similar manner, but the composition of the custom basket swap is not tied directly to a publicly available index. As such, the constituents of the basket are available on the respective Fund’s Schedule of Investments. A Fund utilizing a total return index swap bears the risk of loss of the amount expected to be received under a swap agreement in the event of the default or bankruptcy of a swap agreement counterparty or if the underlying index declines in value.
Interest rate swaps involve the exchange by the Fund with another party for its respective commitment to pay or receive interest on a notional amount of principal. Interest rate swaps are generally valued using the closing price from the prior day, subject to an adjustment for the current day’s spreads. Interest rate swaps are generally subject to mandatory central clearing, but central clearing does not make interest rate swap transactions risk free.
Forward Foreign Currency Exchange Contracts
A forward foreign currency exchange contract is an agreement between two parties to exchange two designated currencies at a specific time in the future. Certain types of forward foreign currency exchange contracts may be cash settled, in an amount equal to the change in exchange rates during the term of the contract. The contracts can be used to hedge or manage exposure to foreign currency risks with portfolio investments or to gain exposure to foreign currencies.
The market value of a forward foreign currency exchange contract changes with fluctuations in foreign currency exchange rates. Furthermore, the Fund may be exposed to risk if the counterparties cannot meet the contract terms or if the currency value changes unfavorably as compared to the U.S. dollar.
56 | THE GUGGENHEIM FUNDS ANNUAL REPORT | |
NOTES TO FINANCIAL STATEMENTS (continued) |
The following table represents the Fund’s use, and volume of forward currency exchange contracts on a quarterly basis:
| | | | Average Settlement | |
Fund | Use | | Long | | | Short | |
Total Return Bond Fund | Hedge | | $ | 856 | | | $ | 384,418 | |
Derivative Investment Holdings Categorized by Risk Exposure
The following is a summary of the location of derivative investments on the Fund’s Statement of Operations for the year ended September 30, 2016:
Derivative Investment Type | Location of Gain (Loss) on Derivatives |
Currency contracts | Net realized gain (loss) on forward foreign currency exchange contracts |
| Net change in unrealized appreciation (depreciation) on forward foreign currency exchange contracts |
Equity/Interest rate contracts | Net realized gain (loss) on options purchased |
| | Net change in unrealized appreciation (depreciation) on options purchased |
| | Net realized gain (loss) on options written |
| | Net change in unrealized appreciation (depreciation) on options written |
| | Net realized gain (loss) on swap agreements |
| | Net change in unrealized appreciation (depreciation) on swap agreements |
The following is a summary of the Fund’s realized gain (loss) and change in unrealized appreciation (depreciation) on derivative investments recognized on the Statement of Operations categorized by primary risk exposure for the year ended September 30, 2016:
Realized Gain (Loss) on Derivative Investments Recognized on the Statement of Operations | |
Fund | | Swaps
Equity
Contracts | | | Swaps
Interest
Rate
Contracts | | | Options
Written
Equity Contracts | | | Options Purchased Equity Contracts | | | Forward
Currency
Exchange
Contracts | | | Total | |
Total Return Bond Fund | | $ | 11,969 | | | $ | 66,786 | | | $ | 197,829 | | | $ | (724,488 | ) | | $ | (61,000 | ) | | $ | (508,904 | ) |
| | THE GUGGENHEIM FUNDS ANNUAL REPORT | 57 |
NOTES TO FINANCIAL STATEMENTS (continued) |
Change in Unrealized Appreciation (Depreciation) on Derivative Investments Recognized on the Statement of Operations | |
Fund | | Swaps
Equity
Contracts | | | Swaps
Interest
Rate
Contracts | | | Options
Written
Equity Contracts | | | Options Purchased Equity Contracts | | | Forward
Currency
Exchange
Contracts | | | Total | |
Total Return Bond Fund | | $ | — | | | $ | (233,580 | ) | | $ | 95,691 | | | $ | (542,718 | ) | | $ | 8,192 | | | $ | (672,415 | ) |
In conjunction with the use of derivative instruments, the Fund is required to maintain collateral in various forms. The Fund uses, where appropriate, depending on the financial instrument utilized and the broker involved, margin deposits at the broker, cash and/or securities segregated at the custodian bank, discount notes or the repurchase agreements allocated to the Fund.
The Trust has established counterparty credit guidelines and enters into transactions only with financial institutions of investment grade or better. The Trust monitors the counterparty credit risk.
3. Fees and Other Transactions with Affiliates
Under the terms of an investment advisory contract, the Fund pays GI investment advisory fees calculated at an annualized rate of 0.50% of the average daily net assets of the Fund.
RFS was paid the following for providing transfer agent services to the Fund. Transfer agent fees were assessed to the applicable class of the Fund.
Annual charge per account | $5.00 – $8.00 |
Transaction fee | $0.60 – $1.10 |
Minimum annual charge per Fund† | $25,000 |
Certain out-of-pocket charges | Varies |
† | Not subject to the Fund during the first twelve months of operations. |
RFS also acted as the administrative agent for the Fund. As such it performed administrative, bookkeeping, accounting and pricing functions for the Fund. For these services, RFS received 0.095% of the average daily net assets of the Fund. The minimum annual charge for fund accounting/administrative fees is $25,000.
GI engages external service providers to perform other necessary services for the Trust, such as audit and accounting related services, legal services, custody, printing and mailing, etc., on a pass-through basis. Such expenses are allocated to various Funds within the complex based on relative net assets.
The Fund has adopted Distribution Plans related to the offering of A-Class, C-Class and P-Class shares pursuant to Rule 12b-1 under the 1940 Act. The plans provide for payments at an annual rate of 0.25% of the average daily net assets of the Fund’s A-Class and P-Class shares, and 1.00% of the average daily net assets of the Fund’s C-Class shares.
58 | THE GUGGENHEIM FUNDS ANNUAL REPORT | |
NOTES TO FINANCIAL STATEMENTS (continued) |
The investment advisory contracts for the following Fund provides that the total expenses be limited to a percentage of average net assets for each class of shares, exclusive of brokerage costs, dividends on securities sold short, expenses of other investment companies in which a Fund invests, interest, taxes, litigation, indemnification and extraordinary expenses. The limits are listed below:
| | Limit | Effective
Date | Contract
End Date |
Total Return Bond Fund - A-Class | 0.90% | 11/30/12 | 02/01/17 |
Total Return Bond Fund - C-Class | 1.65% | 11/30/12 | 02/01/17 |
Total Return Bond Fund - P-Class* | 0.90% | 05/01/15 | 02/01/17 |
Total Return Bond Fund - Institutional Class | 0.50% | 11/30/12 | 02/01/17 |
* | Since the commencement of operations: May 1, 2015 |
GI is entitled to reimbursement by the Funds for fees waived or expenses reimbursed during any of the previous 36 months, beginning on the date of the expense limitation agreement, if on any day the estimated operating expenses are less than the indicated percentages. At September 30, 2016, the amount of fees waived or expenses reimbursed that are subject to recoupment are presented in the following table:
Fund | | Expires
2017 | | | Expires
2018 | | | Expires
2019 | | | Fund
Total | |
Total Return Bond Fund | | | | | | | | | | | | |
A-Class | | $ | 201,298 | | | $ | 576,490 | | | $ | 886,912 | | | $ | 1,664,700 | |
C-Class | | | 40,016 | | | | 99,359 | | | | 201,092 | | | | 340,467 | |
P-Class | | | — | | | | 2,335 | | | | 91,216 | | | | 93,551 | |
Institutional Class | | | 309,618 | | | | 1,646,773 | | | | 4,174,107 | | | | 6,130,498 | |
For the year ended September 30, 2016, no amounts were recouped by GI.
If a Fund invests in an affiliated fund, the investing Fund’s adviser has agreed to waive fees at the investing fund level. Fee waivers will be calculated at the investing Fund level without regard to any expense cap, if any, in effect for the investing Fund. Fees waived under this arrangement are not subject to reimbursement to GI. For the year September 30, 2016, the Fund waived $172,420 related to investments in affiliated funds.
For the year ended September 30, 2016, GFD retained sales charges of $566,973 relating to sales of A-Class shares of the Trust.
Certain trustees and officers of the Trust are also officers of GI and GFD.
| | THE GUGGENHEIM FUNDS ANNUAL REPORT | 59 |
NOTES TO FINANCIAL STATEMENTS (continued) |
4. Fair Value Measurement
In accordance with U.S. GAAP, fair value is defined as the price that the Fund would receive to sell an investment or pay to transfer a liability in an orderly transaction with an independent buyer in the principal market, or in the absence of a principal market, the most advantageous market for the investment or liability. U.S. GAAP establishes a three-tier fair value hierarchy based on the types of inputs used to value assets and liabilities and requires corresponding disclosure. The hierarchy and the corresponding inputs are summarized below:
Level 1 — | quoted prices in active markets for identical assets or liabilities. |
Level 2 — | significant other observable inputs (for example quoted prices for securities that are similar based on characteristics such as interest rates, prepayment speeds, credit risk, etc.). |
Level 3 — | significant unobservable inputs based on the best information available under the circumstances, to the extent observable inputs are not available, which may include assumptions. |
The types of inputs available depend on a variety of factors, such as the type of security and the characteristics of the markets in which it trades, if any. Fair valuation determinations that rely on fewer or no observable inputs require greater judgment. Accordingly, fair value determinations for Level 3 securities require the greatest amount of judgment.
Independent pricing services are used to value a majority of the Fund’s investments. When values are not available from a pricing service, they may be computed by the Fund’s investment adviser or an affiliate. In any event, values may be determined using a variety of sources and techniques, including: market prices; broker quotes; and models which derive prices based on inputs such as prices of securities with comparable maturities and characteristics or based on inputs such as anticipated cash flows or collateral, spread over Treasuries, and other information and analysis. A significant portion of the Fund’s assets and liabilities are categorized as Level 2 or Level 3, as indicated in this report.
Indicative quotes from broker-dealers, adjusted for fluctuations in criteria such as credit spreads and interest rates, may be also used to value the Fund’s assets and liabilities, i.e. prices provided by a broker-dealer or other market participant who has not committed to trade at that price. Although indicative quotes are typically received from established market participants, the Fund may not have the transparency to view the underlying inputs which support the market quotations. Significant changes in an indicative quote would generally result in significant changes in the fair value of the security.
Certain fixed income securities are valued by obtaining a monthly indicative quote from a broker-dealer, adjusted for fluctuations in criteria such as credit spreads and interest rates.
60 | THE GUGGENHEIM FUNDS ANNUAL REPORT | |
NOTES TO FINANCIAL STATEMENTS (continued) |
The inputs or methodologies used for valuing securities are not necessarily an indication of the risk associated with investing in those securities. The suitability of the techniques and sources employed to determine fair valuation are regularly monitored and subject to change.
5. Reverse Repurchase Agreements
The Fund may enter into reverse repurchase agreements. Under a reverse repurchase agreement, a Fund sells securities and agrees to repurchase them at a particular price at a future date. In the event the buyer of securities under a reverse repurchase agreement files for bankruptcy or becomes insolvent, such buyer or its trustee or receiver may receive an extension of time to determine whether to enforce the Fund’s obligation to repurchase the securities, and the Fund’s use of the proceeds of the reverse repurchase agreement may effectively be restricted pending such decision.
For the year ended September 30, 2016, the Fund entered into reverse repurchase agreements:
Fund | | Number
of Days Outstanding | | | Balance at September 30,
2016 | | | Average
Balance
Outstanding | | | Average
Interest
Rate | |
Total Return Bond Fund | | | 366 | | | $ | 75,113,227 | | | $ | 250,810,803 | | | | 0.92 | % |
The following table presents reverse repurchase agreements that are subject to netting arrangements and offset in the Statement of Assets of Liabilities in conformity with U.S. GAAP:
| | | | | | | | | | | | | Gross Amount Not
Offset in the Statement of Assets and Liabilities | | | | |
Fund | Instrument | | Gross Amount of Recognized Liabilities | | | Gross
Amount Offset in the Statement of Assets and Liabilities | | | Net Amount of Liabilities Presented on the Statement of Assets and Liabilities | | | Financial Instruments | | | Cash Collateral Pledged | | | Net Amount | |
Total Return Bond Fund | Reverse repurchase agreements | | $ | 75,113,227 | | | $ | — | | | $ | 75,113,227 | | | $ | 75,113,227 | | | $ | — | | | $ | — | |
| | THE GUGGENHEIM FUNDS ANNUAL REPORT | 61 |
NOTES TO FINANCIAL STATEMENTS (continued) |
The following is a summary of the remaining contractual maturities of the reverse repurchase agreements outstanding as of September 30, 2016, aggregated by asset class of the related collateral pledged by the Fund:
Fund | | Up to
30 days | | | 31-90
days | | | Overnight and Continuous | | | Total | |
Total Return Bond Fund | | | | | | | | | | | | |
U.S. Treasury Note | | $ | 49,463,605 | | | $ | — | | | $ | — | | | $ | 49,463,605 | |
Asset-Backed Securities | | | — | | | | 24,994,977 | | | | — | | | | 24,994,977 | |
Corporate Bonds | | | — | | | | — | | | | 930,750 | | | | 930,750 | |
Gross amount of recognized liabilities for reverse repurchase agreements | | $ | 49,463,605 | | | $ | 24,994,977 | | | $ | 930,750 | | | $ | 75,389,332 | |
6. Federal Income Tax Information
The Fund intends to comply with the provisions of Subchapter M of the Internal Revenue Code applicable to regulated investment companies and will distribute substantially all taxable net investment income and capital gains sufficient to relieve the Fund from all, or substantially all, federal income, excise and state income taxes. Therefore, no provision for federal or state income tax is required.
Tax positions taken or expected to be taken in the course of preparing the Fund’s tax returns are evaluated to determine whether the tax positions are “more-likely-than-not” of being sustained by the applicable tax authority. Tax positions not deemed to meet the more-likely-than-not threshold would be recorded as a tax benefit or expense in the current year. Management has analyzed the Fund’s tax positions taken, or to be taken, on federal income tax returns for all open tax years, and has concluded that no provision for income tax is required in the Fund’s financial statements. The Fund’s federal tax returns are subject to examination by the Internal Revenue Service for a period of three years after they are filed.
The tax character of distributions paid during the year ended September 30, 2016 was as follows:
Fund | | Ordinary
Income | | | Long-Term
Capital Gain | | | Total
Distributions | |
Total Return Bond Fund | | $ | 111,989,430 | | | $ | — | | | $ | 111,989,430 | |
The tax character of distributions paid during the year ended September 30, 2015 was as follows:
Fund | | Ordinary
Income | | | Long-Term
Capital Gain | | | Total
Distributions | |
Total Return Bond Fund | | $ | 52,078,333 | | | $ | 688,701 | | | $ | 52,767,034 | |
Note: For federal income tax purposes, short-term capital gain distributions are treated as ordinary income distributions.
62 | THE GUGGENHEIM FUNDS ANNUAL REPORT | |
NOTES TO FINANCIAL STATEMENTS (continued) |
Tax components of accumulated earnings/(deficit) as of September 30, 2016, were as follows:
Fund | | Undistributed Ordinary Income | | | Undistributed Long-Term Capital Gain | | | Net Unrealized
Appreciation/
(Depreciation) | | | Accumulated Capital and Other Losses | | | Other Temporary Differences | |
Total Return Bond Fund | | $ | 31,556,686 | | | $ | — | | | $ | 49,327,373 | | | $ | — | | | $ | (9,392,273 | ) |
For Federal income tax purposes, capital loss carryforwards represent realized losses of the Fund that may be carried forward and applied against future capital gains. Under the RIC Modernization Act of 2010, the Fund is permitted to carry forward capital losses incurred in taxable years beginning after December 22, 2010 for an unlimited period and such capital loss carryforwards will retain their character as either short-term or long-term capital losses. As of September 30, 2016, the Fund had no capital loss carryforwards.
As of September 30, 2016, the following reclassifications were made to the capital accounts of the Fund, to reflect permanent book/tax differences and income and gains available for distributions under income tax regulations, which are due to foreign currency reclasses, bond bifurication, paydown reclasses, equalization accounting, swap reclasses, CLO investments, recharacterization of income from investments and return of capital investments. Net investment income, net realized gains and net assets were not affected by these changes.
On the Statement of Assets and Liabilities, the following adjustments were made for permanent book/tax differences:
Fund | | Paid In
Capital | | | Undistributed
Net Investment
Income | | | Accumulated
Net Realized
Loss | |
Total Return Bond Fund | | $ | 632,939 | | | $ | 15,112,588 | | | $ | (15,745,527 | ) |
At September 30, 2016, the cost of securities for Federal income tax purposes, the aggregate gross unrealized gain for all securities for which there was an excess of value over tax cost and the aggregate gross unrealized loss for all securities for which there was an excess of tax cost over value, were as follows:
Fund | | Tax
Cost | | | Tax
Unrealized
Gain | | | Tax
Unrealized
Loss | | | Net
Unrealized
Gain | |
Total Return Bond Fund | | $ | 3,977,117,938 | | | $ | 97,225,809 | | | $ | (48,007,448 | ) | | $ | 49,218,361 | |
| | THE GUGGENHEIM FUNDS ANNUAL REPORT | 63 |
NOTES TO FINANCIAL STATEMENTS (continued) |
7. Securities Transactions
For the year ended September 30, 2016, the cost of purchases and proceeds from sales of investment securities, excluding government securities, short-term investments and derivatives, were as follows:
Fund | | Purchases | | | Sales | |
Total Return Bond Fund | | $ | 3,264,957,380 | | | $ | 1,630,393,221 | |
For the year ended September 30, 2016, the cost of purchases and proceeds from sales of government securities were as follows:
Fund | | Purchases | | | Sales | |
Total Return Bond Fund | | $ | 824,544,356 | | | $ | 824,557,275 | |
The Fund is permitted to purchase or sell securities from or to certain affiliated funds under specified conditions outlined in procedures adopted by the Board of the Trust. The procedures have been designed to ensure that any purchase or sale of securities by a Fund from or to another fund or portfolio that is or could be considered an affiliate by virtue of having a common investment adviser (or affiliated investment advisers), common Trustees and/or common officers complies with Rule 17a-7 of the 1940 Act. Further, as defined under these procedures, each transaction is effected at the current market price to save costs, where permissible. For the year ended September 30, 2016, the Fund engaged in purchases and sales of securities, pursuant to Rule 17a-7 of the 1940 Act, as follows:
Fund | | Purchases | | | Sales | | | Realized
Gain | |
Total Return Bond Fund | | $ | 39,851,307 | | | $ | 1,124,016 | | | $ | 40,750 | |
8. Affiliated Transactions
Investments representing 5% or more of the outstanding voting shares of a portfolio company of a fund, or control of or by, or common control under GI, result in that portfolio company being considered an affiliated company of such fund, as defined in the 1940 Act.
The Fund may invest in the Guggenheim Strategy Funds Trust consisting of Guggenheim Strategy Fund I, Guggenheim Strategy Fund II, Guggenheim Strategy Fund III, and Guggenheim Variable Insurance Strategy Fund III (collectively, the “Cash Management Funds”), open-end management investment companies managed by GI. The Cash Management Funds, which launched on March 11, 2014, are offered as cash management options only to mutual funds, trusts, and other accounts managed by GI and/or its affiliates, and are not available to the public. The Cash Management Funds pay no investment management fees. The Cash Management
64 | THE GUGGENHEIM FUNDS ANNUAL REPORT | |
NOTES TO FINANCIAL STATEMENTS (continued) |
Funds’ annual report on Form N-CSR dated September 30, 2015, is available publicly or upon request. This information is available from the EDGAR database on the SEC’s website at http://www.sec.gov/Archives/edgar/data/1601445/000089180415000857/gug63224-ncsr.htm.
Transactions during the year ended September 30, 2016, in which the portfolio company is an “affiliated person,” were as follows:
Affiliated issuers by Fund | | Value
09/30/15 | | | Additions | | | Reductions | | | Value
09/30/16 | | | Shares
09/30/16 | | | Investment
Income | | | Realized
Loss | |
Total Return Bond Fund | | | | | | | | | | |
Floating Rate Strategies Fund - Institutional Class | | $ | — | | | $ | 84,654,555 | | | $ | (63,318,973 | ) | | $ | 20,054,667 | | | | 773,117 | | | $ | 651,037 | | | $ | (1,311,803 | ) |
Guggenheim Limited Duration Fund - Institutional Class | | | — | | | | 15,211,441 | | | | — | | | | 15,453,399 | | | | 625,391 | | | | 209,346 | | | | — | |
Guggenheim Strategic Opportunities Fund | | | 2,968,259 | | | | 5,309,754 | | | | — | | | | 9,205,115 | | | | 481,691 | | | | 707,678 | | | | — | |
Guggenheim Strategy Fund I | | | 95,705,888 | | | | 39,179,963 | | | | (122,800,000 | ) | | | 12,050,977 | | | | 482,232 | | | | 429,204 | | | | (172,986 | ) |
Guggenheim Strategy Fund II | | | — | | | | 10,621,380 | | | | — | | | | 10,733,931 | | | | 430,390 | | | | 120,216 | | | | — | |
Guggenheim Strategy Fund III | | | — | | | | 6,294,133 | | | | — | | | | 6,342,121 | | | | 253,888 | | | | 43,304 | | | | — | |
High Yield Fund - Institutional Class | | | — | | | | 3,516,850 | | | | (3,438,323 | ) | | | — | | | | — | | | | 16,850 | | | | (78,526 | ) |
| | | | 98,674,147 | | | | 164,788,076 | | | | (189,557,296 | ) | | | 73,840,210 | | | | | | | | 2,177,635 | | | | (1,563,315 | ) |
9. Loan Commitments
Pursuant to the terms of certain loan agreements, the Fund held unfunded loan commitments as of September 30, 2016. The Fund is obligated to fund these loan commitments at the borrower’s discretion.
The unfunded loan commitments as of September 30, 2016 were as follows:
Borrower | Maturity
Date | | Face
Amount | | | Value | |
Total Return Bond Fund | | | | | | | |
Acosta, Inc. | 09/26/19 | | $ | 2,200,000 | | | $ | 174,903 | |
Acrisure LLC | 05/19/22 | | | 671,186 | | | | 9,727 | |
| | | | $ | 2,871,186 | | | $ | 184,630 | |
| | THE GUGGENHEIM FUNDS ANNUAL REPORT | 65 |
NOTES TO FINANCIAL STATEMENTS (continued) |
10. Line of Credit
The Trust, with the exception of Capital Stewardship Fund, and certain affiliated funds, secured a 364-day committed, $800,000,000 line of credit from Citibank, N.A., which was in place through October 6, 2016, at which time the line of credit was renewed. A Fund may draw (borrow) from the line of credit as a temporary measure for emergency purposes, to facilitate redemption requests, or for other short-term liquidity purposes consistent with the Fund’s investment objective and program. For example, it may be advantageous for the Fund to borrow money rather than sell existing portfolio positions to meet redemption requests. Fees related to borrowings, if any, vary under this arrangement between the greater of Citibank’s “base rate”, LIBOR plus 1%, or the federal funds rate, 0.29% at September 30, 2016, plus 1/2 of 1%. The funds paid upfront costs of $663,359 to renew the line of credit.
The commitment fee that may be paid by the Funds is at an annualized rate of 0.15% of the average daily amount of their unused commitment amount. The Funds did not have any borrowings under this agreement as of and for the year ended September 30, 2016.
On October 6, 2016, the Trust, with the exception of Capital Stewardship Fund, and certain affiliated funds, renewed the line of credit from Citibank, N.A., with an increased commitment amount to $1,000,000,000. Fees related to borrowings, if any, vary under this arrangement between the greater of Citibank’s “base rate”, LIBOR plus 1%, or the federal funds rate, 0.29% at September 30, 2016, plus 1/2 of 1%. The funds will pay upfront costs of $2,032,388 to renew the line of credit. The commitment fee that may be paid by the Funds is at an annualized rate of 0.15% of the average daily amount of their unused commitment amount.
The allocated interest expense amount for each Fund is referenced in the Statement of Operations under “Line of credit fees” and the effect on the expense ratio is included in the Financial Highlights.
66 | THE GUGGENHEIM FUNDS ANNUAL REPORT | |
NOTES TO FINANCIAL STATEMENTS (continued) |
11. Repurchase Agreements
In connection with transactions in repurchase agreements, it is the Fund’s policy that its custodian takes possession of the underlying collateral. The collateral is in the possession of the Fund’s custodian and is evaluated to ensure that its market value exceeds, at a minimum, 102% of the original face amount of the repurchase agreements.
Fund | Counterparty and
Terms of Agreement | | | Face
Value | | | Repurchase
Price | | Collateral | | | Par
Value | | | Fair
Value |
Total Return Bond Fund | Jefferies & Company, Inc. | | | | | | | | | | | | | | |
| | 3.00% | | | | | | | | | | | | | | |
| | Due 10/04/16 | | $ | 12,842,000 | | $ | 12,876,245 | | Buckeye Tobacco Settlement Financing Authority | | | | | | |
| | | | | | | | | | 0.00% | | | | | | |
| | | | | | | | | | 06/01/47 | | $ | 214,029,000 | | $ | 15,196,059 |
| | | | | | | | | | | | | | | | |
| | Mizuho Securities Co. | | | | | | | | | | | | | | |
| | 1.51% | | | | | | | | | | | | | | |
| | Due 12/20/16 | | | 3,659,000 | | | 3,672,861 | | Option One Mortgage Loan Trust | | | | | | |
| | | | | | | | | | 5.61% | | | | | | |
| | | | | | | | | | 01/25/37 | | | 8,381,000 | | | 8,290,312 |
12. Restricted Securities
The securities below are considered illiquid and restricted under guidelines established by the Board:
Fund | Restricted
Securities | Acquisition
Date | | Amortized
Cost | | | Value | |
Total Return Bond Fund | Capmark Military Housing Trust 2008-AMCW | | | | | | | |
| | 6.90% due 07/10/55 | 05/20/16 | | $ | 10,819,814 | | | $ | 10,925,993 | |
| | RFTI Issuer, Ltd 2015-FL1 | | | | | | | | | |
| | 2.27% due 08/15/30 | 10/14/15 | | | 9,961,073 | | | | 9,980,131 | |
| | Capmark Military Housing Trust 2007-AETC | | | | | | | | | |
| | 5.75% due 02/10/52 | 09/18/14 | | | 8,335,383 | | | | 8,641,964 | |
| | GMAC Commercial Mortgage Asset Corp. 2005-DRUM | | | | | | | | | |
| | 5.47% due 05/10/50 | 05/20/16 | | | 5,061,328 | | | | 5,153,120 | |
| | United Communities LLC | | | | | | | | | |
| | 5.61% due 09/15/51 | 05/25/16 | | | 4,938,765 | | | | 5,067,943 | |
| | THE GUGGENHEIM FUNDS ANNUAL REPORT | 67 |
NOTES TO FINANCIAL STATEMENTS (continued) |
Fund | Restricted
Securities | Acquisition
Date | | Amortized
Cost | | | Value | |
| | Capmark Military Housing Trust 2007-ROBS | | | | | | | |
| | 6.06% due 10/10/52 | 04/23/15 | | $ | 4,739,355 | | | $ | 4,772,616 | |
| | RFTI Issuer, Ltd 2015-FL1 | | | | | | | | | |
| | 4.40% due 08/15/30 | 10/14/15 | | | 4,983,622 | | | | 4,987,286 | |
| | Fort Benning Family Communities LLC | | | | | | | | | |
| | 0.87% due 01/15/36 | 03/27/15 | | | 4,738,446 | | | | 4,696,903 | |
| | Mid-Atlantic Military Family Communities LLC | | | | | | | | | |
| | 5.30% due 08/01/50 | 11/19/15 | | | 3,057,493 | | | | 3,133,105 | |
| | GMAC Commercial Mortgage Asset Corp. 2005-BLIS | | | | | | | | | |
| | 5.25% due 07/10/50 | 05/20/16 | | | 2,595,215 | | | | 2,634,707 | |
| | Capmark Military Housing Trust 2007-AET2 | | | | | | | | | |
| | 6.06% due 10/10/52 | 10/16/15 | | | 2,165,952 | | | | 2,213,476 | |
| | Customers Bank | | | | | | | | | |
| | 6.13% due 06/26/29 | 06/24/14 | | | 2,000,000 | | | | 2,020,000 | |
| | Northern Group Housing LLC | | | | | | | | | |
| | 6.80% due 08/15/53 | 07/25/13 | | | 1,200,000 | | | | 1,580,292 | |
| | Turbine Engines Securitization Ltd. 2013 1-A | | | | | | | | | |
| | 5.13% due 12/13/48 | 11/27/13 | | | 1,259,373 | | | | 1,259,451 | |
| | Pacific Northwest Communities LLC | | | | | | | | | |
| | 5.91% due 06/15/50 | 05/22/14 | | | 1,000,000 | | | | 1,171,630 | |
| | HP Communities LLC | | | | | | | | | |
| | 5.62% due 09/15/32 | 06/09/14 | | | 1,011,240 | | | | 1,160,110 | |
| | Atlantic Marine Corporations Communities LLC | | | | | | | | | |
| | 5.43% due 12/01/50 | 07/25/14 | | | 1,011,986 | | | | 1,110,678 | |
| | Fort Knox Military Housing Privatization Project | | | | | | | | | |
| | 0.86% due 02/15/52 | 04/09/15 | | | 1,113,070 | | | | 1,099,437 | |
| | GMAC Commercial Mortgage Asset Corp. 2003-PRES | | | | | | | | | |
| | 6.24% due 10/10/41 | 04/03/14 | | | 896,844 | | | | 1,075,396 | |
| | Cadence Bank North America | | | | | | | | | |
| | 6.25% due 06/28/29 | 06/06/14 | | | 1,200,000 | | | | 1,020,000 | |
| | ACC Group Housing LLC | | | | | | | | | |
| | 6.35% due 07/15/54 | 06/03/14 | | | 625,000 | | | | 759,017 | |
| | Great Lakes CLO Ltd. | | | | | | | | | |
| | due 01/15/23 | 12/06/12 | | | 955,000 | | | | 402,572 | |
| | Copper River CLO Ltd 2007-1A | | | | | | | | | |
| | due 01/20/21 | 05/09/14 | | | 1,755,000 | | | | 333,430 | |
| | Airplanes Pass Through Trust 2001-1A | | | | | | | | | |
| | 1.07% due 03/15/19 | 11/30/11 | | | 607,228 | | | | 244,306 | |
| | Schahin II Finance Company SPV Ltd | | | | | | | | | |
| | due 09/25/22 | 03/21/12 | | | 777,505 | | | | 93,816 | |
68 | THE GUGGENHEIM FUNDS ANNUAL REPORT | |
NOTES TO FINANCIAL STATEMENTS (concluded) |
13. Subsequent Event
At a meeting that occurred on November 16, 2016, the Board approved the following changes:
Approval to add an advisory fee breakpoint (“breakpoint”) to the fixed income mutual funds. Effective on or about February 1, 2017, a breakpoint of 5 basis points (0.05%) on average daily net assets above $5 billion will apply to each of the following Funds’ advisory fees:
Floating Rate Strategies Fund
Investment Grade Bond Fund
Macro Opportunities Fund
Total Return Bond Fund
The introduction of advisory fee breakpoints will not result in any decrease in the nature, quality and extent of services provided to the Funds under the advisory agreements.
| | THE GUGGENHEIM FUNDS ANNUAL REPORT | 69 |
REPORT OF INDEPENDENT REGISTERED PUBLIC ACCOUNTING FIRM |
The Board of Trustees and Shareholders
of Guggenheim Funds Trust
We have audited the accompanying statement of assets and liabilities, including the schedule of investments, of Guggenheim Total Return Bond Fund (one of the series constituting the Guggenheim Funds Trust) (the “Fund”) as of September 30, 2016, and the related statements of operations for the year then ended, the statements of changes in net assets for each of the two years in the period then ended, and the financial highlights for each of the years or periods indicated therein. These financial statements and financial highlights are the responsibility of the Fund’s management. Our responsibility is to express an opinion on these financial statements and financial highlights based on our audits.
We conducted our audits in accordance with the standards of the Public Company Accounting Oversight Board (United States). Those standards require that we plan and perform the audit to obtain reasonable assurance about whether the financial statements and financial highlights are free of material misstatement. We were not engaged to perform an audit of the Fund’s internal control over financial reporting. Our audits included consideration of internal control over financial reporting as a basis for designing audit procedures that are appropriate in the circumstances, but not for the purpose of expressing an opinion on the effectiveness of the Fund’s internal control over financial reporting. Accordingly, we express no such opinion. An audit also includes examining, on a test basis, evidence supporting the amounts and disclosures in the financial statements and financial highlights, assessing the accounting principles used and significant estimates made by management, and evaluating the overall financial statement presentation. Our procedures included confirmation of securities owned as of September 30, 2016, by correspondence with the custodians, transfer agent, brokers, and paying agents or by other appropriate auditing procedures where replies from brokers or paying agents were not received. We believe that our audits provide a reasonable basis for our opinion.
In our opinion, the financial statements and financial highlights referred to above present fairly, in all material respects, the financial position of the Guggenheim Total Return Bond Fund (one of the series constituting the Guggenheim Funds Trust) at September 30, 2016, the results of its operations for the year then ended, the changes in its net assets for each of the two years in the period then ended, and its financial highlights for each of the years or periods indicated therein, in conformity with U.S. generally accepted accounting principles.
McLean, Virginia
November 29, 2016
70 | THE GUGGENHEIM FUNDS ANNUAL REPORT | |
OTHER INFORMATION (Unaudited) |
Tax Information
In January 2017, shareholders will be advised on IRS Form 1099 DIV or substitute 1099 DIV as to the federal tax status of the distributions received by shareholders in the calendar year 2016.
The Fund’s investment income (dividend income plus short-term gains, if any) qualifies as follows:
Of the ordinary income distributions paid during the fiscal year, the following fund had the corresponding percentages qualify for the dividends received deduction for corporations:
Fund | | Dividend
Received Deduction | |
Total Return Bond Fund | | | 0.56 | % |
The following amounts of taxable ordinary income dividends paid during the fiscal year qualified for the lower income tax rate available to individuals under the Jobs and Growth Tax Relief Reconciliation Act of 2003:
Fund | | Qualified
Dividend Income | |
Total Return Bond Fund | | | 0.58 | % |
Additionally, of the taxable ordinary income distributions paid during the fiscal year ending September 30, 2016, the Fund had the corresponding percentages qualify as interest related dividends and qualified short-term capital gains as permitted by IRC Section 871(k)(1) and IRC Section 871(k)(2), respectively:
Fund | | Qualified
Interest | | | Qualified
Short-Term
Capital Gain | |
Total Return Bond Fund | | | 59.39 | % | | | 0.00 | % |
With respect to the taxable year ended September 30, 2016, the Fund hereby designates as capital gain dividends the amounts listed below, or, if subsequently determined to be different, the net capital gain of such year:
Fund | | LTCG
dividend income | | | From Proceeds of Shareholder Redemptions | |
Total Return Bond Fund | | $ | — | | | $ | 110,198 | |
| | THE GUGGENHEIM FUNDS ANNUAL REPORT | 71 |
OTHER INFORMATION (Unaudited)(continued) |
Proxy Voting Information
A description of the policies and procedures that the Trust uses to determine how to vote proxies relating to securities held in the Funds’ portfolios is available, without charge and upon request, by calling 800.820.0888. This information is also available from the EDGAR database on the SEC’s website at https://www.sec.gov.
Information regarding how the Funds voted proxies relating to portfolio securities during the most recent 12-month period ended June 30 is available without charge, upon request, by calling 800.820.0888. This information is also available from the EDGAR database on the SEC’s website at https://www.sec.gov.
Sector Classification
Information in the “Schedule of Investments” is categorized by sectors using sector-level Classifications defined by the Bloomberg Industry Classification System, a widely recognized industry classification system provider. Each Fund’s registration statement has investment policies relating to concentration in specific sectors/industries. For purposes of these investment policies, the Funds usually classify sectors/industries based on industry-level Classifications used by widely recognized industry classification system providers such as Bloomberg Industry Classification System, Global Industry Classification Standards and Barclays Global Classification Scheme.
Quarterly Portfolio Schedules Information
The Trust files its complete schedule of portfolio holdings with the SEC for the first and third quarters of each fiscal year on Form N-Q; which are available on the SEC’s website at https://www.sec.gov. The Funds’ Forms N-Q may be reviewed and copied at the SEC’s Public Reference Room in Washington, DC, and that information on the operation of the Public Reference Room may be obtained by calling 800-SEC-0330. Copies of the portfolio holdings are also available to shareholders, without charge and upon request, by calling 800.820.0888.
Report of the Guggenheim Funds Trust Contracts Review Committee
Guggenheim Funds Trust (the “Trust”) was organized as a Delaware statutory trust on November 8, 2013, and is registered as an open-end management investment company under the Investment Company Act of 1940, as amended (the “1940 Act”). The Trust includes the following series:
● Guggenheim Alpha Opportunity Fund (“Alpha Opportunity Fund”) ● Guggenheim Diversified Income Fund (“Diversified Income Fund”) ● Guggenheim High Yield Fund (“High Yield Fund”) | ● Guggenheim Capital Stewardship Fund (“Capital Stewardship Fund”) ● Guggenheim Floating Rate Strategies Fund (“Floating Rate Strategies Fund”) ● Guggenheim Investment Grade Bond Fund (“Investment Grade Bond Fund”) |
72 | THE GUGGENHEIM FUNDS ANNUAL REPORT | |
OTHER INFORMATION (Unaudited)(continued) |
● Guggenheim Large Cap Value Fund (“Large Cap Value Fund”) ● Guggenheim Macro Opportunities Fund (“Macro Opportunities Fund”) ● Guggenheim Mid Cap Value Fund (“Mid Cap Value Fund”) ● Guggenheim Municipal Income Fund (“Municipal Income Fund”) ● Guggenheim Small Cap Value Fund (“Small Cap Value Fund”) ● Guggenheim StylePlus—Mid Growth Fund (“StylePlus—Mid Growth Fund”) ● Guggenheim World Equity Income Fund (“World Equity Income Fund”) | ● Guggenheim Limited Duration Fund (“Limited Duration Fund”) ● Guggenheim Market Neutral Real Estate Fund (“Market Neutral Real Estate Fund”) ● Guggenheim Mid Cap Value Institutional Fund (“Mid Cap Value Institutional Fund”) ● Guggenheim Risk Managed Real Estate Fund (“Risk Managed Real Estate Fund”) ● Guggenheim StylePlus—Large Core Fund (“StylePlus—Large Core Fund”) ● Guggenheim Total Return Bond Fund (“Total Return Bond Fund”) |
Security Investors, LLC (“Security Investors”), an indirect subsidiary of Guggenheim Partners, LLC, a global, diversified financial services firm (“Guggenheim Partners”), serves as investment adviser to each of: (i) Alpha Opportunity Fund; (ii) High Yield Fund; (iii) Investment Grade Bond Fund; (iv) Large Cap Value Fund; (v) Mid Cap Value Fund; (vi) Mid Cap Value Institutional Fund; (vii) Municipal Income Fund; (viii) Small Cap Value Fund; (ix) StylePlus—Large Core Fund; (x) StylePlus—Mid Growth Fund; and (xi) World Equity Income Fund (collectively, the “SI-Advised Funds”). (Guggenheim Partners, Security Investors, Guggenheim Partners Investment Management, LLC (“GPIM”) and their affiliates may be referred to herein collectively as “Guggenheim.” “Guggenheim Investments” refers to the global asset management and investment advisory division of Guggenheim Partners and includes GPIM, Security Investors and Guggenheim Funds Investment Advisors, LLC and other affiliated investment management businesses.) Under the terms of investment management agreements between Security Investors and the Trust, with respect to the SI-Advised Funds, Security Investors also is responsible for overseeing the activities of GPIM, an indirect subsidiary of Guggenheim Partners, with respect to its service as investment sub-adviser to Municipal Income Fund, pursuant to an investment sub-advisory agreement between Security Investors and GPIM (the “GPIM Sub-Advisory Agreement”).
GPIM serves as investment adviser with respect to each of: (i) Capital Stewardship Fund; (ii) Diversified Income Fund; (iii) Floating Rate Strategies Fund; (iv) Limited Duration Fund; (v) Macro Opportunities Fund; (vi) Market Neutral Real Estate Fund; (vii) Risk Managed Real Estate Fund; and (viii) Total Return Bond Fund (collectively, the “GPIM-Advised Funds” and together with the SI-Advised Funds, the “Funds” and individually, a “Fund”). Under the terms of investment
| | THE GUGGENHEIM FUNDS ANNUAL REPORT | 73 |
OTHER INFORMATION (Unaudited)(continued) |
management agreements between GPIM and the Trust, with respect to the GPIM-Advised Funds,1 GPIM also is responsible for overseeing the activities of Concinnity Advisors, LP (“Concinnity”) with respect to Concinnity’s service as investment sub-adviser to the Capital Stewardship Fund, pursuant to an investment sub-advisory agreement between GPIM and Concinnity (the “Concinnity Sub-Advisory Agreement”). Under the supervision of the Board of Trustees of the Trust (the “Board,” with the members of the Board referred to individually as the “Trustees”), the Advisers regularly provide (or, as applicable, oversee the provision of) investment research, advice and supervision, a continuous investment program, and direct the purchase and sale of securities and other investments for each Fund’s portfolio.
Following an initial two-year term, each of the Advisory Agreements continues in effect from year to year provided that such continuance is specifically approved at least annually by (i) the Board or a majority of the outstanding voting securities (as defined in the 1940 Act) of each Fund, and, in either event, (ii) the vote of a majority of the Trustees who are not “interested person[s],” as defined by the 1940 Act, of the Trust (the “Independent Trustees”) casting votes in person at a meeting called for such purpose. At meetings held in person on April 27, 2016 (the “April Meeting”) and on May 17, 2016 (the “May Meeting”), the members of the Contracts Review Committee of the Board (the “Committee”), consisting solely of the Independent Trustees, met separately from Guggenheim to consider the proposed renewal of the Advisory Agreements and the GPIM Sub-Advisory Agreement in connection with the Committee’s annual contract review schedule.2
As part of its review process, the Committee was represented by independent legal counsel to the Independent Trustees (“Independent Legal Counsel”). Independent Legal Counsel reviewed and discussed with the Committee various key aspects of the Trustees’ legal responsibilities relating to the proposed renewal of the Agreements and other principal contracts. The Committee took
1 | The investment management agreements pertaining to the SI-Advised Funds and the investment management agreements pertaining to the GPIM-Advised Funds are referred to herein together as the “Advisory Agreements” and, together with the GPIM Sub-Advisory Agreement, as the “Agreements.” In addition, unless the context indicates otherwise, GPIM, with respect to its service as investment adviser to the GPIM-Advised Funds, and Security Investors as to the SI-Advised Funds, are each referred to herein as the “Adviser” and together, the “Advisers.” |
2 | Since Diversified Income Fund is subject to an investment management agreement approved by the Board for an initial term of two years at an in-person meeting of the Board held on August 20, 2015 and the Fund launched in 2016, it was not included in the contract renewal process conducted at the meetings in April and May 2016. Similarly, Market Neutral Real Estate Fund is subject to an investment management agreement approved by the Board for an initial term of two years at an in-person Board meeting held on November 10, 2015, and the Fund launched in 2016. Consequently, Market Neutral Real Estate Fund also was not included in the scope of the 2016 contract renewal process. In addition, because shares of the Capital Stewardship Fund are only offered for subscription and are held by a limited number of institutional/bank investors, and the Fund issues a shareholder report separate from the other series of the Trust, the factors considered by the Committee in evaluating the proposed renewal of an investment management agreement pertaining to the Capital Stewardship Fund, and the Concinnity Sub-Advisory Agreement, are addressed in a separate report of the Committee. Accordingly, references hereafter to the “Funds” should be understood as referring to all series of the Trust, excluding: (i) Capital Stewardship Fund; (ii) Diversified Income Fund; and (iii) Market Neutral Real Estate Fund. |
74 | THE GUGGENHEIM FUNDS ANNUAL REPORT | |
OTHER INFORMATION (Unaudited)(continued) |
into account various materials received from Guggenheim and Independent Legal Counsel. Recognizing that the evaluation process with respect to the services provided by each of the Advisers is an ongoing one, the Committee also considered the variety of written materials, reports and oral presentations the Board received throughout the year regarding performance and operating results of the Funds.
In connection with the contract review process, FUSE Research Network LLC (“FUSE”), an independent, third-party research provider, was engaged to prepare advisory contract renewal reports designed specifically to help boards of directors/trustees fulfill their advisory contract renewal responsibilities. The objective of the reports is to present the subject funds’ relative position regarding fees, expenses and total return performance, with peer group and universe comparisons. The Committee assessed the data provided in the FUSE reports as well as commentary and supporting data presented by Guggenheim, including, among other things, a summary of notable distinctions between certain Funds and the applicable peer group identified in the FUSE reports, as well as a discussion of those instances in which FUSE adjusted a peer group after considering a request by management to re-evaluate the peer group constituent funds.
In addition, Guggenheim provided materials and data in response to formal requests for information sent by Independent Legal Counsel on behalf of the Independent Trustees. Guggenheim also made a presentation at the April Meeting which, among other things, addressed areas identified for discussion by the Independent Trustees and Independent Legal Counsel. Throughout the process, the Committee asked questions of management and requested certain additional information, which Guggenheim provided following the April Meeting (collectively with the foregoing reports and materials, the “Contract Review Materials”).
The Committee considered the Contract Review Materials in the context of its accumulated experience governing the Trust and weighed the factors and standards discussed with Independent Legal Counsel. Following an analysis and discussion of the factors identified below and in the exercise of its business judgment, the Committee concluded that it was in the best interest of each Fund to recommend that the Board approve the renewal of each Advisory Agreement and the GPIM Sub-Advisory Agreement for an additional annual term.
Advisory Agreements
Nature, Extent and Quality of Services Provided by each Adviser: With respect to the nature, extent and quality of services currently provided by each Adviser, the Committee considered the information provided by Guggenheim concerning the education, experience, professional affiliations, areas of responsibility and duties of key personnel performing services for the Funds, including those personnel providing compliance oversight, as well as the supervisors and reporting lines for such personnel. In this connection, the Committee considered Guggenheim’s resources and related efforts to retain, attract and motivate capable personnel to serve the Funds and noted Guggenheim’s report on recent additions, departures and transitions in personnel who work on matters relating to the Funds or are significant to the operations of each Adviser. The Committee also considered the Advisers’ attention to relevant developments
| | THE GUGGENHEIM FUNDS ANNUAL REPORT | 75 |
OTHER INFORMATION (Unaudited)(continued) |
in the mutual fund industry and its observance of compliance and regulatory requirements, and noted that on a regular basis the Board receives and reviews information from the Trust’s Chief Compliance Officer regarding compliance policies and procedures established pursuant to Rule 38a-1 under the 1940 Act, as well as from Guggenheim’s Chief Risk Officer. The Committee also noted updates by Guggenheim to certain compliance programs, including with respect to Code of Ethics monitoring, and the implementation of additional forensic testing. The Committee took into consideration the settlement of a regulatory matter concerning GPIM and remedial steps taken in response by Guggenheim to enhance its organizational structure for compliance. In this connection, the Committee considered information provided by Guggenheim regarding the findings of an independent compliance consultant retained to review GPIM’s compliance program and the consultant’s conclusion that the program is reasonably designed to prevent and detect violations of the Investment Advisers Act of 1940, as amended, and the rules promulgated thereunder. Moreover, in connection with the Committee’s evaluation of the overall package of services provided by each Adviser, the Committee considered each Adviser’s administrative capabilities, including its role in monitoring and coordinating compliance responsibilities with the fund administrator, transfer agent, distributor, custodian and other service providers to the Funds. In addition, because Municipal Income Fund is sub-advised, the Committee took into account information provided by Guggenheim describing the Adviser’s processes and activities for providing oversight of sub-advisers, including information regarding the Adviser’s Sub-Advisory Oversight Committee.
With respect to Guggenheim’s resources and the ability of each Adviser to carry out its responsibilities under the applicable Advisory Agreement, the Chief Financial Officer of Guggenheim Investments reviewed with the Committee certain unaudited financial information concerning the holding company for Guggenheim Investments, Guggenheim Partners Investment Management Holdings, LLC (“GPIMH”). (Thereafter, the Committee received the audited consolidated financial statements of GPIMH and the audited financial statements of GPIM as supplemental information.)
The Committee also considered the acceptability of the terms of each Advisory Agreement, including the scope of services required to be performed by each Adviser.
Based on the foregoing, and based on other information received (both oral and written) at the April Meeting and the May Meeting, as well as other considerations, including the Committee’s knowledge of how each Adviser performs its duties through Board meetings, discussions and reports during the year, the Committee concluded that each Adviser and its personnel were qualified to serve the Funds in such capacity and may reasonably be expected to continue to provide a high quality of services under each Advisory Agreement with respect to the Funds.
Investment Performance: The Committee received, for each Fund, investment returns for the ten-year, five-year, three-year, one-year and three-month periods ended December 31, 2015, as applicable. In addition, the Committee received a comparison of each Fund’s performance to the performance of a benchmark, a universe of funds and a narrower peer group of similar
76 | THE GUGGENHEIM FUNDS ANNUAL REPORT | |
OTHER INFORMATION (Unaudited)(continued) |
funds with comparable asset levels as identified by FUSE, in each case for the same periods, as applicable. The Committee also received from FUSE representatives and considered a description of the methodology employed by FUSE for identifying each Fund’s peer group and universe for performance and expense comparisons.
In seeking to evaluate Fund performance over a full market cycle, the Committee generally focused its attention first on five-year and three-year performance rankings as compared to the relevant universe of funds. The Committee also considered more recent performance periods, including the one-year period and, as deemed appropriate, the three-month period, for certain Funds such as for those Funds that were recently launched or had undergone recent changes in investment strategies, as well as circumstances in which enhancements were made to the portfolio management processes or techniques employed for a Fund. In this connection, the Committee made the following observations:
Alpha Opportunity Fund: The Fund’s Class A shares outperformed the performance universe median for the five-year and three-year periods, ranking in the 6th and 9th percentiles, respectively. The Committee considered the limitations on portfolio management as a result of the 2008 Lehman bankruptcy, and subsequent changes to the Fund’s investment strategies, noting that the Fund re-opened to subscriptions with a new U.S. long/short equity investment strategy on January 28, 2015. In light of the foregoing, the Committee also considered more recent performance periods, including the one-year and three-month periods ended December 31, 2015, and observed that the Fund’s Class A shares ranked in the 72nd and 92nd percentiles, respectively of its performance universe. Given the limited period of time that the Adviser has managed the Fund pursuant to its new investment program, the Committee also took into account updated performance data provided by the Adviser in connection with the May Meeting and noted that the Fund’s net performance for the one-year and three-month periods ended March 31, 2016 ranked in the 6th and 1st percentiles, respectively of the Morningstar Long/Short Equity peer group.
Floating Rate Strategies Fund: The Committee noted the Fund’s inception date of November 30, 2011, and observed that the Fund’s Class A shares ranked in the 1st and 5th percentiles of its performance universe for the three-year and one-year periods ended December 31, 2015, respectively, outperforming its performance universe median for each of these periods.
High Yield Fund: The returns of the Fund’s Class A shares ranked in the 46th and 10th percentiles of its performance universe for the five-year and three-year periods ended December 31, 2015, respectively, and outperformed the performance universe median for each of these periods.
Investment Grade Bond Fund:The returns of the Fund’s Class A shares ranked in the 1st percentile of its performance universe for both the five-year and three-year periods ended December 31, 2015, outperforming its performance universe median for both of these periods.
| | THE GUGGENHEIM FUNDS ANNUAL REPORT | 77 |
OTHER INFORMATION (Unaudited)(continued) |
Limited Duration Fund: The Committee noted the Fund’s inception date of December 16, 2013, and observed that the returns of the Fund’s Class A shares ranked in the 1st and 10th percentiles of the performance universe for the one-year and three-month periods ended December 31, 2015, respectively, outperforming the median returns.
Macro Opportunities Fund:The Committee noted the Fund’s inception date of November 30, 2011, and observed that the returns of the Fund’s Class A shares ranked in the 6th and 57th percentiles of the performance universe for the three-year and one-year periods ended December 31, 2015, respectively, and outperformed the performance universe median for the three-year period.
Municipal Income Fund: The Committee considered that Security Investors does not directly manage the investment portfolio but has delegated such duties to GPIM. Based on the information provided and the review of the Fund’s investment performance, the Committee concluded that Security Investors had appropriately reviewed and monitored GPIM’s investment performance as Sub-Adviser to the Fund.
Risk Managed Real Estate Fund:The Committee noted the Fund’s inception date of February 12, 2014, and observed the returns of the Fund’s Class A shares ranked in the 31st and 76th percentile of its performance universe for the one-year and three-month periods ended December 31, 2015, respectively.
StylePlus—Large Core Fund: The returns of the Fund’s Class A shares ranked in the 39th percentile of its performance universe for the three-year period ended December 31, 2015. The Committee noted that the Fund implemented a strategy change and a new portfolio management team in May 2013. In light of the foregoing, the Committee also considered more recent performance periods in addition to the three-year performance, including the one-year and three-month periods ended December 31, 2015, and observed that the returns of the Fund’s Class A shares exceeded the median of its performance universe for both periods, ranking in the 25th and 22nd percentiles for the one-year and three-month periods, respectively.
StylePlus—Mid Growth Fund: The returns of the Fund’s Class A shares ranked in the 45th percentile of its performance universe for the three-year period ended December 31, 2015. The Committee noted that the Fund implemented a strategy change and a new portfolio management team in May 2013. In light of the foregoing, the Committee considered more recent performance periods in addition to the three-year performance, including the one-year and three-month periods ended December 31, 2015, and observed that the returns of the Fund’s Class A shares exceeded the median of its performance universe for both periods, ranking in the 42nd and 45th percentiles for the one-year and three-month periods, respectively.
Total Return Bond Fund: The Committee noted the Fund’s inception date of November 30, 2011, and observed that the returns of the Fund’s Class A shares ranked in the 1st and 12th percentiles of its performance universe for the three-year and one-year periods ended December 31, 2015, respectively, and outperformed the performance universe median for each of these periods.
78 | THE GUGGENHEIM FUNDS ANNUAL REPORT | |
OTHER INFORMATION (Unaudited)(continued) |
World Equity Income Fund: The returns of the Fund’s Class A shares ranked in the 66th percentile of its performance universe for the three-year period ended December 31, 2015. The Committee noted that the Fund implemented a strategy change and a new portfolio management team in August 2013. In light of the foregoing, the Committee considered more recent performance periods in addition to the three-year performance, including the one-year and three-month periods ended December 31, 2015, and observed that the returns of the Fund’s Class A shares exceeded the median of its performance universe for both periods, ranking in the 43rd and 39th percentiles for the one-year and three-month periods, respectively.
Value Funds: Large Cap Value Fund, Mid Cap Value Fund, Mid Cap Value Institutional Fund and Small Cap Value Fund
Large Cap Value Fund: The returns of the Class A shares underperformed the performance universe median for the five-year, three-year, one-year and three-month periods ended December 31, 2015, and ranked in the 83rd, 72nd, 72nd and 67th percentiles, respectively.
Mid Cap Value Fund: The returns of the Class A shares underperformed the performance universe median for the five-year, three-year, one-year and three-month periods ended December 31, 2015, and ranked in the 83rd, 79th, 75th and 81st percentiles, respectively.
Mid Cap Value Institutional Fund: The Fund’s returns underperformed the performance universe median for the five-year, three-year, one-year and three-month periods ended December 31, 2015, and ranked in the 82nd, 75th, 70th and 67th percentiles, respectively.
Small Cap Value Fund: The Fund underperformed its performance universe median for the five-year, three-year and one-year periods ended December 31, 2015, ranking in the 80th percentile for the five-year and three-year periods and in the 67th percentile for the one-year period. The Fund outperformed its performance universe median for three-month period ended December 31, 2015, and ranked in the 29th percentile.
In response to the Committee’s request, representatives from the Adviser provided information regarding, and discussed factors impacting, each Value Fund’s performance, including market trends and stock selection. The Adviser’s representatives also discussed the portfolio management team’s philosophy and processes and explained their expectations and strategies for the future. The Committee noted measures taken by the Adviser to remedy relative longer-term underperformance with respect to each of the Value Funds, including strategy enhancements such as implementation of a refined stock selection process and additional risk controls to enforce the strategy’s sell discipline. The Committee noted that the Adviser believes the enhancements to the portfolio management techniques employed for each Value Fund, used in conjunction with existing proprietary quantitative models, will help improve the Fund‘s performance results. In light of the foregoing, the Committee requested and the Adviser provided supplemental performance data to enable the Committee to evaluate the impact of the strategy enhancements. In this connection, the Committee considered that the data provided by the Adviser indicated that each Value Fund’s performance was improving, with performance for the first quarter of 2016
| | THE GUGGENHEIM FUNDS ANNUAL REPORT | 79 |
OTHER INFORMATION (Unaudited)(continued) |
ranking better than the trailing one-year return. The Committee also considered the Adviser’s statement that it believes the improving trend in performance relative to peers reflects the enhancements implemented in the investment process. The Committee also noted Guggenheim’s commitment to monitor each Value Fund’s performance and update the Independent Trustees on a quarterly basis as to the impact of the process enhancements implemented to-date and advise on other steps that might be taken to further address each Fund’s performance, if necessary.
After reviewing the foregoing and related factors, the Committee concluded that: (i) each Fund’s performance was acceptable; or (ii) it was satisfied with Guggenheim’s responses and efforts relating to investment performance.
Comparative Fees, Costs of Services Provided and the Profits Realized by each Adviser from Its Relationship with the Funds: The Committee compared each Fund’s contractual advisory fee and total net expense ratio to the applicable peer group. The Committee also reviewed the median advisory fees and expense ratios, including expense ratio components (e.g., transfer agency fees, administration fees, other operating expenses, distribution fees and fee waivers/reimbursements) of the peer group of funds. In response to a supplemental request, the Committee also received and reviewed aggregated advisory and administrative fees compared to the peer group average and median.
As part of its evaluation of each Fund’s advisory fee, the Committee considered how such fees compared to the advisory fee charged by the applicable Adviser to one or more other funds, separate accounts and/or other types of client portfolios and investment vehicles that it manages pursuant to a similar investment objective and strategies, to the extent applicable, noting that, in certain instances, Guggenheim charges a lower advisory fee to such other clients. In this connection, the Committee considered, among other things, Guggenheim’s representations about the significant differences between managing mutual funds as compared to other types of accounts, including the additional resources required to effectively manage mutual fund assets and the greater regulatory costs associated with the management of such assets. The Committee also considered Guggenheim’s explanation that lower fees are charged in certain instances due to various other factors, including the scope of contract, type of investors, applicable legal, governance and capital structures, tax status and historical pricing reasons. With respect to the difference in fees charged to a comparable client that is a mutual fund, as to which Guggenheim serves as sub-adviser, the Committee took into account the following: Guggenheim advises that it has less legal and regulatory exposure as a sub-adviser to an unaffiliated fund and does not take on the same business risk because Guggenheim is not the sponsor of that fund. The Committee concluded that the information it received demonstrated that the aggregate services provided to the Funds were sufficiently different from those provided to other clients with similar investment strategies and/or the risks borne by Guggenheim were sufficiently greater than those associated with managing other clients with similar investment strategies to support the difference in fees.
In further considering the comparative fee and expense data presented in the Contract Review Materials and addressed by Guggenheim, the Committee made the following observations:
80 | THE GUGGENHEIM FUNDS ANNUAL REPORT | |
OTHER INFORMATION (Unaudited)(continued) |
Alpha Opportunity Fund: The average contractual advisory fee percentile rank across all share classes of the Fund and the asset weighted total net expense ratio are in the second quartile (27th and 46th percentiles, respectively) of its peer group. The Committee also considered that the Adviser had entered into an expense limitation agreement with respect to the Fund.
Floating Rate Strategies Fund: The average contractual advisory fee percentile rank across all share classes of the Fund is in the fourth quartile (83rd percentile) of its peer group and the asset weighted total net expense ratio is in the second quartile (45th percentile) of its peer group. The Committee also considered that the Adviser had entered into an expense limitation agreement with respect to the Fund.
High Yield Fund: The average contractual advisory fee percentile rank across all share classes of the Fund is in the second quartile (40th percentile) of its peer group and the asset weighted total net expense ratio is in the fourth quartile (77th percentile) of its peer group. The Committee also considered that the Adviser had entered into an expense limitation agreement with respect to the Fund.
Investment Grade Bond Fund: The average contractual advisory fee percentile rank across all share classes of the Fund is in the third quartile (54th percentile) of its peer group and the asset weighted total net expense ratio is in the fourth quartile (83rd percentile) of its peer group. The Committee also considered that the Adviser had entered into an expense limitation agreement with respect to the Fund.
Large Cap Value Fund: The average contractual advisory fee percentile rank across all share classes of the Fund is in the first quartile (22nd percentile) of its peer group and the asset weighted total net expense ratio is in the second quartile (35th percentile) of its peer group. The Committee also considered that the Adviser had entered into an expense limitation agreement with respect to the Fund.
Limited Duration Fund: The average contractual advisory fee percentile rank across all share classes of the Fund is in the third quartile (66th percentile) of its peer group, as is the Fund’s asset weighted total net expense ratio (63rd percentile). The Committee also considered that the Adviser had entered into an expense limitation agreement with respect to the Fund.
Macro Opportunities Fund: The average contractual advisory fee percentile rank across all share classes of the Fund is in the fourth quartile (98th percentile) of its peer group, as is the Fund’s the asset weighted total net expense ratio (95th percentile). The Committee also considered that the Adviser had entered into an expense limitation agreement with respect to the Fund. In addition, the Committee noted that the Fund is categorized as a non-traditional bond fund which seeks to add value by investing in many non-traditional securities outside of fixed income, including equities, currencies, commodities and derivatives. In this connection, the Committee considered the Adviser’s statement that it supports the Fund with significant resources and a unique approach to drive performance for investors.
| | THE GUGGENHEIM FUNDS ANNUAL REPORT | 81 |
OTHER INFORMATION (Unaudited)(continued) |
Mid Cap Value Fund: The average contractual advisory fee percentile rank across all share classes of the Fund is in the second quartile (37th percentile) of its peer group and the asset weighted total net expense ratio is in the fourth quartile (94th percentile) of its peer group.
Mid Cap Value Institutional Fund: The contractual advisory fee of the Fund is in the first quartile (6th percentile) of its peer group and the total net expense ratio is in the third quartile (63rd percentile) of its peer group.
Municipal Income Fund: The average contractual advisory fee percentile rank across all share classes of the Fund is in the second quartile (39th percentile) and the asset weighted total net expense ratio is in the 25th percentile of its peer group. The Committee also considered that the Adviser had entered into an expense limitation agreement with respect to the Fund.
Risk Managed Real Estate Fund: The average contractual advisory fee percentile rank across all share classes of the Fund and the asset weighted total net expense ratio are in the first quartile (1st percentile as to each) of its peer group.
StylePlus—Large Core Fund: The average contractual advisory fee percentile rank across all share classes of the Fund is in the third quartile (71st percentile) and the asset weighted total net expense ratio is in the fourth quartile (86th percentile) of its peer group.
StylePlus—Mid Growth Fund: The average contractual advisory fee percentile rank across all share classes of the Fund is in the second quartile (29th percentile) of its peer group and the asset weighted total net expense ratio is in the fourth quartile (92nd percentile) of its peer group.
Small Cap Value Fund: The average contractual advisory fee percentile rank across all share classes of the Fund is in the fourth quartile (75th percentile) of its peer group and the asset weighted total net expense ratio is in the first quartile (11th percentile) of its peer group. The Committee also considered that the Adviser had entered into an expense limitation agreement with respect to the Fund.
Total Return Bond Fund: The average contractual advisory fee percentile rank across all share classes of the Fund is in the fourth quartile (93rd percentile) of its peer group and the asset weighted total net expense ratio is in the third quartile (65th percentile) of its peer group. The Committee also considered that the Adviser had entered into an expense limitation agreement with respect to the Fund.
World Equity Income Fund: The average contractual advisory fee percentile rank across all share classes of the Fund is in the second quartile (31st percentile) of its peer group and the asset weighted total net expense ratio is in the fourth quartile (92nd percentile) of its peer group. The Committee also considered that the Adviser had entered into an expense limitation agreement with respect to the Fund.
82 | THE GUGGENHEIM FUNDS ANNUAL REPORT | |
OTHER INFORMATION (Unaudited)(continued) |
With respect to the costs of services provided and profits realized by Guggenheim Investments from its relationship with the Funds, the Committee reviewed a profitability analysis and data from management for each Fund setting forth the average assets under management for the twelve months ended December 31, 2015, ending assets under management as of December 31, 2015, gross revenues received by Guggenheim Investments, expenses allocated to the Fund, earnings and the operating margin/profitability rate, including variance information relative to the foregoing amounts as of December 31, 2014. In addition, the Chief Financial Officer of Guggenheim Investments reviewed with, and addressed questions from, the Committee concerning the expense allocation methodology employed in producing the profitability analysis.
In the course of its review of Guggenheim Investments’ profitability, the Committee took into account the methods used by Guggenheim Investments to determine expenses and profit and reviewed a report from an independent accounting firm evaluating Guggenheim Investments’ approach to allocating costs and determining the profitability of Guggenheim Investments with respect to individual funds and the entire fund complex. In evaluating the costs of services provided and the profitability to Guggenheim Investments, based upon the profitability rates presented by Guggenheim Investments and the conclusion of the independent accounting firm that the methodology used for calculating such rates was reasonable, the Committee concluded that the profits were not unreasonable.
The Committee considered other benefits available to each Adviser because of its relationship with the Funds and noted that Security Investors and GPIM may be deemed to benefit from arrangements whereby an affiliate, Rydex Fund Services, LLC, currently receives fees for (i) performing certain administrative functions and bookkeeping, accounting and pricing functions for the Funds pursuant to a Fund Accounting and Administration Agreement, and (ii) acting as transfer agent for the Funds and performing all shareholder servicing functions, including transferring record ownership, processing purchase and redemption transactions, answering inquiries, mailing shareholder communications, and acting as the dividend disbursing agent pursuant to a Transfer Agency Agreement. The Committee reviewed the compensation arrangements for the provision of the foregoing services, as well as Guggenheim’s profitability from providing such services. The Committee also noted Guggenheim’s statement that it may benefit from marketing synergies arising from offering a broad spectrum of products, including the Funds.
Economies of Scale: The Committee received and considered information regarding whether there have been economies of scale with respect to the management of the Funds as Fund assets grow, whether the Funds have appropriately benefited from any economies of scale, and whether there is potential for realization of any further economies of scale. The Committee considered whether economies of scale in the provision of services to the Funds were being passed along to the shareholders. The Committee noted the Adviser’s statement that Guggenheim continues to develop the infrastructure needed to support Fund asset growth and to achieve economies of scale across the firm’s various products and product lines. Thus, while Guggenheim may be benefiting from certain economies of scale and related cost efficiencies, it is concurrently
| | THE GUGGENHEIM FUNDS ANNUAL REPORT | 83 |
OTHER INFORMATION (Unaudited)(continued) |
realizing new costs and expenses associated with investment in infrastructure to support growth. The Committee took into account the additional information provided by Guggenheim at the Committee’s request regarding the investments made to support the growth of the organization, noting, among other things, enhancements to improve operational efficiency and further development of compliance-related functions, as well as Guggenheim’s view as to how such investments benefit the Funds.
As part of its assessment of economies of scale, the Committee also considered Guggenheim’s view that it seeks to share economies of scale through expense limitations and/or through advisory fees set at competitive rates pre-assuming future asset growth. Thus, the Committee considered the size of the Funds and the competitiveness of and/or other determinations made regarding the current advisory fee for each Fund, as well as whether a Fund is subject to an expense limitation.
As to the size of the Funds, the Committee took into account Guggenheim’s statement that generally the Funds’ assets are not sufficiently large to warrant breakpoints, with only three Funds—Floating Rate Strategies Fund, Macro Opportunities Fund, and Total Return Bond Fund—having assets in excess of (or approaching) $1 billion. With respect to the three Funds noted, the Committee considered the levels of profitability reported. The Committee also noted that each of the three Funds is subject to an expense limitation agreement, which results in a lower effective advisory fee.
The Committee determined that, taking into account all relevant factors, the advisory fee for each Fund was reasonable.
Sub-Advisory Agreement
Nature, Extent and Quality of Services Provided by the Sub-Adviser: With respect to the nature, extent and quality of services provided by GPIM (referred to in this discussion as the “Sub-Adviser”), the Committee considered the qualifications, experience and skills of the Sub-Adviser’s portfolio management and other key personnel and information from the Sub-Adviser describing the scope of its services to Municipal Income Fund. The Committee also considered the information provided by the Sub-Adviser concerning the Sub-Adviser’s business continuity and information security plans and controls, and compliance policies and procedures, among other things.
With respect to Guggenheim’s resources and the Sub-Adviser’s ability to carry out its responsibilities under the Sub-Advisory Agreement, as noted above, the Committee considered the financial condition of GPIMH. (Thereafter, the Committee received the audited financial statements of GPIM as supplemental information.)
The Committee also considered the acceptability of the terms of the Sub-Advisory Agreement. Based on the foregoing, and based on other information received (both oral and written) at the April Meeting and at the May Meeting, as well as other considerations, including the Committee’s
84 | THE GUGGENHEIM FUNDS ANNUAL REPORT | |
OTHER INFORMATION (Unaudited)(concluded) |
knowledge of how the Sub-Adviser performs its duties through Board meetings, discussions and reports throughout the year, the Committee concluded that the Sub-Adviser and its personnel were qualified to serve Municipal Income Fund in such capacity and may reasonably be expected to continue to provide a high quality of services under the Sub-Advisory Agreement.
Investment Performance: The Committee considered that the Fund’s Class A shares ranked in the third quartile (65th and 68th percentiles) of its performance universe for the five-year and three-year periods ended December 31, 2015, respectively. On January 13, 2012, the Fund acquired the assets and assumed the liabilities of TS&W/Claymore Tax-Advantaged Balanced Fund (the “Predecessor Fund”), a closed-end fund which used different investment strategies and had different investment advisers. Class A shares of the Fund have assumed the performance, financial and other historical information of the Predecessor Fund’s common shares and the performance of Class A shares of the Fund reflects the performance of the Predecessor Fund. In light of the foregoing, the Committee took into account more recent periods and noted that Fund’s Class A shares ranked in the fourth quartile for the one-year period ended December 31, 2015, and outperformed the performance universe median for the three-month period ended December 31, 2015, ranking in the 39th percentile. In considering the Fund’s performance for the one-year period, the Committee considered Guggenheim’s explanation that the Fund is managed very conservatively and the portfolio management team opted to maintain short duration by allocating to floating rate securities, which was a drag on performance for the period as the Federal Reserve increased interest rates fewer times than had been expected by the team. In light of all the facts and circumstances, the Committee concluded that the investment performance of the Fund and the Sub-Adviser was acceptable.
Comparative Fees, Costs of Services Provided and the Profits Realized by the Sub-Adviser from Its Relationship with the Fund: The Committee reviewed the level of sub-advisory fees payable to GPIM, noting that the fees are paid by Security Investors and do not impact the fees paid by the Fund.
Economies of Scale: The Committee recognized that, because the Sub-Adviser’s fees are paid by the Adviser and not the Fund, the analysis of economies of scale was more appropriate in the context of the Committee’s consideration of the applicable Advisory Agreement, which was separately considered. (See “Advisory Agreements – Economies of Scale” above.)
Overall Conclusions
Based on the foregoing, the Committee determined that the investment advisory fees are fair and reasonable in light of the extent and quality of the services provided and other benefits received and that the continuation of the Agreements is in the best interest of each Fund. In reaching this conclusion, no single factor was determinative or conclusive and each Committee member, in the exercise of his business judgment, may attribute different weights to different factors. At the May Meeting, the Committee, constituting all of the Independent Trustees, recommended the renewal of each Advisory Agreement and the Sub-Advisory Agreement for an additional annual term.
| | THE GUGGENHEIM FUNDS ANNUAL REPORT | 85 |
INFORMATION ON BOARD OF TRUSTEES AND OFFICERS (Unaudited) |
A Board of Trustees oversees the Trust, as well as other trusts of GI, in which its members have no stated term of service, and continue to serve after election until resignation. The Statement of Additional Information includes further information about Fund Trustees and Officers, and can be obtained without charge by calling 800.820.0888.
Name, Address* and Year of Birth | Position(s) Held with the Trust | Term of Office and Length of Time Served** | Principal Occupation(s) During Past Five Years | Number of Portfolios in Fund Complex Overseen | Other Directorships Held by Trustees |
INDEPENDENT TRUSTEES | | | |
Randall C. Barnes
(1951) | Trustee | Since 2014 | Current: Private Investor (2001-present). Former: Senior Vice President and Treasurer, PepsiCo, Inc. (1993-1997); President, Pizza Hut International (1991-1993); Senior Vice President, Strategic Planning and New Business Development, PepsiCo, Inc. (1987-1990). | 101 | Current: Trustee, Purpose Investments Inc. (2014-Present). |
Donald A. Chubb, Jr.
(1946 ) | Trustee | Since 1994 | Current: Business broker and manager of commercial real estate, Griffith & Blair, Inc. (1997-present). | 97 | Current: Midland Care, Inc. (2011-present). |
Jerry B. Farley
(1946) | Trustee | Since 2005 | Current: President, Washburn University (1997-present). | 97 | Current: Westar Energy, Inc. (2004-present); CoreFirst Bank & Trust (2000-present). |
Roman
Friedrich III
(1946) | Trustee and Chairman of the Contracts Review Committee | Since 2014 | Current: Founder and Managing Partner, Roman Friedrich & Company (1998-present). Former: Senior Managing Director, MLV & Co. LLC (2010-2011). | 97 | Current: Zincore Metals, Inc. (2009-present). Former: Axiom Gold and Silver Corp. (2011-2012). |
86 | THE GUGGENHEIM FUNDS ANNUAL REPORT | |
INFORMATION ON BOARD OF TRUSTEES AND OFFICERS (Unaudited)(continued) |
Name, Address* and Year of Birth | Position(s) Held with the Trust | Term of Office and Length of Time Served** | Principal Occupation(s) During Past Five Years | Number of Portfolios in Fund Complex Overseen | Other Directorships Held by Trustees |
INDEPENDENT TRUSTEES - continued | | |
Robert B. Karn III
(1942) | Trustee and Chairman of the Audit Committee | Since 2014 | Current: Consultant (1998-present). Former: Arthur Andersen (1965-1997) and Managing Partner, Financial and Economic Consulting, St. Louis office (1987-1997). | 97 | Current: Peabody Energy Company (2003-present); GP Natural Resource Partners, LLC (2002- present). |
Ronald A. Nyberg
(1953) | Trustee and Chairman of the Nominating and Governance Committee | Since 2014 | Current: Partner, Momkus McCluskey Roberts LLC (2016-present). Former: Partner, Nyberg & Cassioppi, LLC (2000-2016); Executive Vice President, General Counsel, and Corporate Secretary, Van Kampen Investments (1982-1999). | 103 | Current: Edward-Elmhurst Healthcare System (2012-present). |
Maynard F. Oliverius
(1943) | Trustee | Since 1998 | Current: Retired. Former: President and CEO, Stormont-Vail HealthCare (1996-2012). | 97 | Current: Fort Hays State University Foundation (1999-present); Stormont-Vail Foundation (2013-present); University of Minnesota MHA Alumni Philanthropy Committee (2009-present). Former: Topeka Community Foundation (2009-2014). |
| | THE GUGGENHEIM FUNDS ANNUAL REPORT | 87 |
INFORMATION ON BOARD OF TRUSTEES AND OFFICERS (Unaudited)(continued) |
Name, Address* and Year of Birth | Position(s) Held with the Trust | Term of Office and Length of Time Served** | Principal Occupation(s) During Past Five Years | Number of Portfolios in Fund Complex Overseen | Other Directorships Held by Trustees |
INDEPENDENT TRUSTEES - concluded | | |
Ronald E. Toupin, Jr.
(1958) | Trustee and Chairman of the Board | Since 2014 | Current: Portfolio Consultant (2010-present). Former: Vice President, Manager and Portfolio Manager, Nuveen Asset Management (1998-1999); Vice President, Nuveen Investment Advisory Corp. (1992-1999); Vice President and Manager, Nuveen Unit Investment Trusts (1991-1999); and Assistant Vice President and Portfolio Manager, Nuveen Unit Investment Trusts (1988-1999), each of John Nuveen & Co., Inc. (1982-1999). | 100 | Former: Bennett Group of Funds (2011-2013). |
88 | THE GUGGENHEIM FUNDS ANNUAL REPORT | |
INFORMATION ON BOARD OF TRUSTEES AND OFFICERS (Unaudited)(continued) |
Name, Address* and Year of Birth | Position(s) Held with the Trust | Term of Office and Length of Time Served** | Principal Occupation(s) During Past Five Years | Number of Portfolios in Fund Complex Overseen | Other Directorships Held by Trustees |
INTERESTED TRUSTEE | |
Donald C. Cacciapaglia***
(1951) | President, Chief Executive Officer and Trustee | Since 2012 | Current: President and CEO, certain other funds in the Fund Complex (2012-present); Vice Chairman, Guggenheim Investments (2010-present). Former: Chairman and CEO, Channel Capital Group, Inc. (2002-2010). | 232 | Current: Clear Spring Life Insurance Company (2015-present); Guggenheim Partners Japan, Ltd. (2014-present); Guggenheim Partners Investment Management Holdings, LLC (2014-present); Delaware Life (2013-present); Guggenheim Life and Annuity Company (2011-present); Paragon Life Insurance Company of Indiana (2011-present). |
* | The business address of each Trustee is c/o Guggenheim Investments, 227 West Monroe Street, Chicago, Illinois 60606. |
** | Each Trustee serves an indefinite term, until his successor is elected and qualified. Time served includes time served in the respective position for the Predecessor Corporation. |
*** | This Trustee is deemed to be an “interested person” of the Funds under the 1940 Act by reason of his position with the Funds’ Investment Manager and/or the parent of the Investment Manager. |
| | THE GUGGENHEIM FUNDS ANNUAL REPORT | 89 |
INFORMATION ON BOARD OF TRUSTEES AND OFFICERS (Unaudited)(continued) |
Name, Address* and Year of Birth | Position(s) Held with the Trust | Term of Office and Length of Time Served** | Principal Occupations
During Past Five Years |
OFFICERS | | | |
William H. Belden, III
(1965) | Vice President | Since 2014 | Current: Vice President, certain other funds in the Fund Complex (2006-present); Managing Director, Guggenheim Funds Investment Advisors, LLC (2005-present). Former: Vice President of Management, Northern Trust Global Investments (1999-2005). |
Joanna M. Catalucci (1966) | AML Officer | Since 2016 | Current: Chief Compliance Officer, certain funds in the Fund Complex (2012-present); Senior Managing Director, Guggenheim Investments (2012-present); AML Officer, certain funds in the Fund Complex (2016-present). Former: Chief Compliance Officer and Secretary, certain other funds in the Fund Complex (2008-2012); Senior Vice President & Chief Compliance Officer, Security Investors, LLC and certain affiliates (2010-2012); Chief Compliance Officer and Senior Vice President, Rydex Advisors, LLC and certain affiliates (2010-2011). |
James Howley
(1972) | Assistant Treasurer | Since 2014 | Current: Director, Guggenheim Investments (2004-present); Assistant Treasurer, certain other funds in the Fund Complex (2006-present). Former: Manager, Mutual Fund Administration of Van Kampen Investments, Inc. (1996-2004). |
Keith D. Kemp
(1960) | Assistant Treasurer | Since 2016 | Current: Managing Director of Transparent Value, LLC (2015-present); Managing Director of Guggenheim Investments (2015-present). Former: Director, Transparent Value, LLC (2010-2015); Director, Guggenheim Investments (2010-2015); Chief Operating Officer, Macquarie Capital Investment Management (2007-2009). |
Amy J. Lee
(1961) | Vice President and Chief Legal Officer | Since 2007 (Vice President) Since 2014 (Chief Legal Officer) | Current: Chief Legal Officer, certain other funds in the Fund Complex (2013-present); Senior Managing Director, Guggenheim Investments (2012-present). Former: Vice President, Associate General Counsel and Assistant Secretary, Security Benefit Life Insurance Company and Security Benefit Corporation (2004-2012). |
90 | THE GUGGENHEIM FUNDS ANNUAL REPORT | |
INFORMATION ON BOARD OF TRUSTEES AND OFFICERS (Unaudited)(continued) |
Name, Address* and Year of Birth | Position(s) Held with the Trust | Term of Office and Length of Time Served** | Principal Occupations
During Past Five Years |
OFFICERS - continued | |
Mark E. Mathiasen
(1978) | Secretary | Since 2014 | Current: Secretary, certain other funds in the Fund Complex (2007-present); Managing Director, Guggenheim Investments (2007-present). |
Glenn McWhinnie
(1969) | Assistant Treasurer | Since 2016 | Current: Vice President, Guggenheim Investments (2009-present). Former: Tax Compliance Manager, Ernst & Young LLP (1996-2009). |
Michael P. Megaris
(1984) | Assistant Secretary | Since 2014 | Current: Assistant Secretary, certain other funds in the Fund Complex (2014-present); Vice President, Guggenheim Investments (2012-present). Former: J.D., University of Kansas School of Law (2009-2012). |
Elisabeth Miller
(1968) | Chief Compliance Officer | Since 2012 | Current: CCO, certain other funds in the Fund Complex (2012-present); CCO, Security Investors, LLC (2012-present); CCO, Guggenheim Funds Investment Advisors, LLC (2012-present); Managing Director, Guggenheim Investments (2012-present); Vice President, Guggenheim Funds Distributors, LLC (2014-present). Former: CCO, Guggenheim Distributors, LLC (2009-2014); Senior Manager, Security Investors, LLC (2004-2009); Senior Manager, Guggenheim Distributors, LLC (2004-2009). |
Adam J. Nelson
(1979) | Assistant Treasurer | Since 2015 | Current: Vice President, Guggenheim Investments (2015-present); Assistant Treasurer, certain other funds in the Fund Complex (2015-present). Former: Assistant Vice President and Fund Administration Director, State Street Corporation (2013-2015); Fund Administration Assistant Director, State Street (2011-2013); Fund Administration Manager, State Street (2009-2011). |
| | THE GUGGENHEIM FUNDS ANNUAL REPORT | 91 |
INFORMATION ON BOARD OF TRUSTEES AND OFFICERS (Unaudited)(concluded) |
Name, Address* and Year of Birth | Position(s) Held with the Trust | Term of Office and Length of Time Served** | Principal Occupations
During Past Five Years |
OFFICERS - concluded | |
Kimberly Scott
(1974) | Assistant Treasurer | Since 2014 | Current: Vice President, Guggenheim Investments (2012-present); Assistant Treasurer, certain other funds in the Fund Complex (2012-present). Former: Financial Reporting Manager, Invesco, Ltd. (2010-2011); Vice President/Assistant Treasurer, Mutual Fund Administration for Van Kampen Investments, Inc./Morgan Stanley Investment Management (2009-2010); Manager of Mutual Fund Administration, Van Kampen Investments, Inc./Morgan Stanley Investment Management (2005-2009). |
Bryan Stone
(1979) | Vice President | Since 2014 | Current: Vice President, certain other funds in the Fund Complex (2014-present); Director, Guggenheim Investments (2013-present). Former: Senior Vice President, Neuberger Berman Group LLC (2009-2013); Vice President, Morgan Stanley (2002-2009). |
John L. Sullivan
(1955) | Chief Financial Officer and Treasurer | Since 2014 | Current: CFO, Chief Accounting Officer and Treasurer, certain other funds in the Fund Complex (2010-present); Senior Managing Director, Guggenheim Investments (2010-present). Former: Managing Director and CCO, each of the funds in the Van Kampen Investments fund complex (2004-2010); Managing Director and Head of Fund Accounting and Administration, Morgan Stanley Investment Management (2002-2004); CFO and Treasurer, Van Kampen Funds (1996-2004). |
* | The business address of each officer is c/o Guggenheim Investments, 227 West Monroe Street, Chicago, Illinois 60606. |
** | Each officer serves an indefinite term, until his or her successor is duly elected and qualified. Time served includes time served in the respective position for the Predecessor Corporation. |
92 | THE GUGGENHEIM FUNDS ANNUAL REPORT | |
GUGGENHEIM INVESTMENTS PRIVACY POLICIES (Unaudited) |
Guggenheim Investments as used herein refers to Guggenheim Partners, LLC, Guggenheim Funds Investment Advisors, LLC, Guggenheim Partners Investment Management, LLC, Guggenheim Funds Distributors, LLC and Security Investors, LLC as well as the funds in the Guggenheim Funds complex (the “funds”).
Our Commitment to You
When you become a Guggenheim Investments investor, you entrust us with not only your hard-earned money but also with personal and financial information about you. We recognize that your relationship with us is based on trust and that you expect us to act responsibly and in your best interests. Because we have access to personal information about you, we hold ourselves to high standards in its safekeeping and use. This means, most importantly, that we do not sell client or account information to anyone—whether you are a current or former Guggenheim Investments client.
The Information We Collect About You and How We Collect It
In the course of doing business with shareholders and investors, we collect nonpublic personal information about you. You typically provide personal information when you complete a Guggenheim Investments account application or when you request a transaction that involves Rydex and Guggenheim Funds or one of the Guggenheim affiliated companies. “Nonpublic personal information” is personally identifiable information about you. For example it includes your name and address, Social Security or taxpayer identification number, assets, income, account balance, bank account information and investment activity (e.g. purchase and redemption history).
How We Share Your Personal Information
As a matter of policy, we do not disclose your nonpublic personal information to nonaffiliated third parties except as required or permitted by law. As emphasized above, we do not sell information about current or former clients or their accounts to third parties. Nor do we share such information, except when necessary to complete transactions at your request or to make you aware of related investment products and services that we offer. Additional details about how we handle your personal information are provided below.
To complete certain transactions or account changes that you direct, it may be necessary to provide your personal information to companies, individuals or groups that are not affiliated with Guggenheim Investments. For example if you ask to transfer assets from another financial institution to Guggenheim Investments, we will need to provide certain information about you to that company to complete the transaction. In connection with servicing your accounts or to alert you to other Guggenheim Investments investment products and services, we may share your information within the Guggenheim Investments family of affiliated companies. This would include, for example, sharing your information within Guggenheim Investments so we can make you aware of new funds or the services offered through another Guggenheim Investments
| | THE GUGGENHEIM FUNDS ANNUAL REPORT | 93 |
GUGGENHEIM INVESTMENTS PRIVACY POLICIES (Unaudited)(concluded) |
affiliated company. In certain instances, we may contract with nonaffiliated companies to perform services for us. Where necessary, we will disclose information we have about you to these third parties. In all such cases, we provide the third party with only the information necessary to carry out its assigned responsibilities and only for that purpose. And we require these third parties to treat your personal information with the same high degree of confidentiality that we do. In certain instances, we may share information with other financial institutions regarding individuals and entities in response to the U.S.A. Patriot Act. Finally we will share personal information about you if we are compelled by law to do so, if you direct us to do so with your consent, or in other circumstances as permitted by law.
How We Safeguard Your Personal Information
We maintain physical, electronic and procedural safeguards to protect your personal information. Within Guggenheim Investments, access to such information is limited to those who need it to perform their jobs such as servicing your account, resolving problems or informing you of new products and services.
94 | THE GUGGENHEIM FUNDS ANNUAL REPORT | |
This page intentionally left blank.
This page intentionally left blank.
This page intentionally left blank.
The registrant’s Board of Trustees has adopted a code of ethics that applies to the registrant’s principal executive officer and principal financial officer. No substantive amendments were approved or waivers were granted to the Code during the period covered by this report. The Code is filed as an exhibit to this Form N-CSR.
| Item 3. | Audit Committee Financial Expert. |
The registrant's Board of Trustees has determined that Robert B. Karn III, an "independent" Trustee serving on the registrant's audit committee, is an "audit committee financial expert," as defined in Item 3 of Form N-CSR. Under applicable securities laws, a person who is determined to be an audit committee financial expert will not be deemed an "expert" for any purpose, including without limitation for the purposes of Section 11 of the Securities Act of 1933, as a result of being designated or identified as an audit committee financial expert. The designation or identification of a person as an audit committee financial expert does not impose on such person any duties, obligations, or liabilities that are greater than the duties, obligations, and liabilities imposed on such person as a member of the audit committee and Board of Trustees in the absence of such designation or identification.
| Item 4. | Principal Accountant Fees and Services. |
| (a) | Audit Fees. The aggregate fees billed for each of the last two fiscal years (the “Reporting Periods”) for professional services rendered by the registrant’s principal accountant (the “Auditor”) for the audit of the registrant’s annual financial statements, or services that are normally provided by the Auditor in connection with the statutory and regulatory filings or engagements for the Reporting Periods, were $499,699 in 2015 and $535,234 in 2016. |
| (b) | Audit-Related Fees. The aggregate fees billed in the Reporting Periods for assurance and related services by the Auditor that are reasonably related to the performance of the audit of the registrant’s financial statements and are not reported under paragraph (a) of this Item 4 were $38,585 in 2015 and $0 in 2016. These audit-related were as follows: issuance of report concerning transfer agent's system of internal accounting control pursuant to Rule 17Ad-13 of the Securities Exchange Act. |
| (c) | Tax Fees. The aggregate fees billed to the registrant in the Reporting Periods for professional services rendered by the Auditor for tax compliance, tax advice and tax planning (“Tax Services”) were $141,043 in 2015 and $196,514 in 2016. These services consisted of (i) preparation of U.S. federal, state and excise tax returns; (ii) U.S. federal and state tax planning, advice and assistance regarding statutory, regulatory or administrative developments, (iii) tax advice regarding tax qualification matters and/or treatment of various financial instruments held or proposed to be acquired and (iv) review of U.S. federal excise distribution calculations. |
The aggregate fees billed in the Reporting Periods for Tax Services by the Auditor to Service Affiliates which required pre-approval by the Audit Committee were $0 in 2015 and $0 in 2016.
| (d) | All Other Fees. The aggregate fees billed to the registrant in the Reporting Periods for products and services provided by the Auditor, other than the services reported in paragraphs (a) through (c) of this Item, were $0 in 2015 and $0 in 2016. |
The aggregate fees billed in the Reporting Periods for Non‑Audit Services by the Auditor to Service Affiliates, other than the services reported in paragraphs (b) through (d) of this Item, which required pre‑approval by the Audit Committee were $0 in 2015 and $0 in 2016.
| (e) | Audit Committee Pre‑Approval Policies and Procedures. |
(1) The registrant’s audit committee reviews, and in its sole discretion, pre-approves, pursuant to written pre-approval procedures (A) all engagements for audit and non-audit services to be provided by the principal accountant to the registrant and (B) all engagements for non-audit services to be provided by the principal accountant (1) to the registrant’s investment adviser (not including a sub-adviser whose role is primarily portfolio management and is subcontracted or overseen by another investment adviser) and
(2) to any entity controlling, controlled by or under common control with the registrant’s investment adviser that provides ongoing services to the registrant; but in the case of the services described in subsection (B)(1) or (2), only if the engagement relates directly to the operations and financial reporting of the registrant; provided that such pre-approval need not be obtained in circumstances in which the preapproval requirement is waived under rules promulgated by the Securities and Exchange Commission or New York Stock Exchange listing standards. Sections V.B.2 and V.B.3 of the registrant’s audit committee’s Audit Committee Charter contain the Audit Committee’s Pre-Approval Policies and Procedures and such sections are included below.
V.B.2.Pre-approve any engagement of the independent auditors to provide any non-prohibited services to the Fund, including the fees and other compensation to be paid to the independent auditors (unless an exception is available under Rule 2-01 of Regulation S-X).
(a) The categories of services to be reviewed and considered for pre-approval include the following (collectively, “Identified Services”):
Audit Services
• Annual financial statement audits
• Seed audits (related to new product filings, as required)
• SEC and regulatory filings and consents
Audit-Related Services
• Accounting consultations
• Fund merger/reorganization support services
• Other accounting related matters
• Agreed upon procedures reports
• Attestation reports
• Other internal control reports
Tax Services
• Recurring tax services:
o Preparation of Federal and state income tax returns, including extensions
o Preparation of calculations of taxable income, including fiscal year tax designations
o Preparation of annual Federal excise tax returns (if applicable)
o Preparation of calendar year excise distribution calculations
o Calculation of tax equalization on an as-needed basis
o Preparation of the estimated excise distribution calculations on an as-needed basis
o Preparation of quarterly Federal, state and local and franchise tax estimated tax payments on an as-needed basis
o Preparation of state apportionment calculations to properly allocate Fund taxable income among the states for state tax filing
purposes
o Provision of tax compliance services in India for Funds with direct investments in India
o Assistance with management’s identification of passive foreign investment companies (PFICs) for tax purposes
• Permissible non-recurring tax services upon request:
o Assistance with determining ownership changes which impact a Fund’s utilization of loss carryforwards
o Assistance with calendar year shareholder reporting designations on Form 1099
o Assistance with corporate actions and tax treatment of complex securities and structured products
o Assistance with IRS ruling requests and calculation of deficiency dividends
o Conduct training sessions for the Adviser’s internal tax resources
o Assistance with Federal, state, local and international tax planning and advice regarding the tax consequences of proposed or actual transactions
o Tax services related to amendments to Federal, state and local returns and sales and use tax compliance
o RIC qualification reviews
o Tax distribution analysis and planning
o Tax authority examination services
o Tax appeals support services
o Tax accounting methods studies
o Fund merger, reorganization and liquidation support services
o Tax compliance, planning and advice services and related projects
(b) The Committee has pre-approved Identified Services for which the estimated fees are less than $25,000.
(c) For Identified Services with estimated fees of $25,000 or more, but less than $50,000, the Chair or any member of the Committee designated by the Chair is hereby authorized to pre-approve such services on behalf of the Committee.
(d) For Identified Services with estimated fees of $50,000 or more, such services require pre-approval by the Committee.
(e) All requests for Identified Services to be provided by the independent auditor that were pre-approved by the Committee shall be submitted to the Chief Accounting Officer (“CAO”) of the Trust by the independent auditor using the pre-approval request form attached as Appendix C to the Audit Committee Charter. The Trust’s CAO will determine whether such services are included within the list of services that have received the general preapproval of the Committee.
(f) The independent auditors or the CAO of the Trust (or an officer of the Trust who reports to the CAO) shall report to the Committee at each of its regular quarterly meetings all audit, audit-related and permissible non-audit services initiated since the last such report (unless the services were contained in the initial audit plan, as previously presented to, and approved by, the Committee). The report shall include a general description of the services and projected fees, and the means by which such services were approved by the Committee (including the particular category of Identified Services under which pre-approval was obtained).
V.B.3. Pre-approve any engagement of the independent auditors, including the fees and other compensation to be paid to the independent auditors, to provide any non-audit services to the Adviser (or any “control affiliate” of the Adviser providing ongoing services to the Trust), if the engagement relates directly to the operations and financial reporting of the Trust (unless an exception is available under Rule 2-01 of Regulation S-X).
(a) The Chair or any member of the Committee designated by the Chair may grant the pre-approval for non-audit services to the Adviser (or any “control affiliate” of the Adviser providing ongoing services to the Trust) relating directly to the operations and financial reporting of the Trust for which the estimated fees are less than $25,000. All such delegated pre-approvals shall be presented to the Committee no later than the next Committee meeting.
(b) For non-audit services to the Adviser (or any “control affiliate” of the Adviser providing ongoing services to the Trust) relating directly to the operations and financial reporting of the Trust for which the estimated fees are $25,000 or more, such services require pre-approval by the Committee.
(2) None of the services described in each of Items 4(b) through (d) were approved by the Audit Committee pursuant to paragraph (c)(7)(i)(C) of Rule 2-01 of Regulation S-X.
| (g) | Non‑Audit Fees. The aggregate non-audit fees were for audit-related and tax services rendered to the registrant, and rendered to Service Affiliates, for the Reporting Periods were $179,628 in 2015 and $196,514 in 2016. |
| (h) | Auditor Independence. The registrant’s Audit Committee was provided with information relating to the provision of non‑audit services by Ernst & Young, LLP to the registrant’s investment adviser (not including any sub-adviser whose role is primarily portfolio management and is subcontracted with or overseen by another investment adviser), and any entity controlling, controlled by, or under common control with the investment adviser that provides ongoing services to the registrant that were not pre‑approved by the Audit Committee so that a determination could be made whether the provision of such services is compatible with maintaining Ernst & Young, LLP’s independence. |
| Item 5. | Audit Committee of Listed Registrants. |
Not applicable.
The Schedule of Investments is included under Item 1 of this form.
| Item 7. | Disclosure of Proxy Voting Policies and Procedures for Closed-End Management Investment Companies. |
Not applicable.
| Item 8. | Portfolio Mangers of Closed-end Management Investment Companies |
Not applicable
| Item 9. | Purchases of Equity Securities by Closed-End Management Investment Company and Affiliated Purchasers. |
Not applicable.
| Item 10. | Submission of Matters to a Vote of Security Holders. |
The registrant does not currently have in place procedures by which shareholders may recommend nominees to the registrant’s board.
There have been no changes to the procedures by which shareholders may recommend nominees to the registrant’s board.
| Item 11. | Controls and Procedures. |
| (a) | The registrant’s President (principal executive officer) and Treasurer (principal financial officer) have evaluated the registrant’s disclosure controls and procedures within 90 days of this filing and have concluded that the registrant’s disclosure controls and procedures were effective as of that date in ensuring that information required to be disclosed by the registrant in this Form N-CSR was recorded, processed, summarized, and reported timely. |
| (b) | The registrant’s principal executive officer and principal financial officer are aware of no change in the registrant’s internal control over financial reporting that occurred during the registrant’s second fiscal quarter covered by this report that has materially affected, or is reasonably likely to materially affect, the registrant’s internal control over financial reporting. |
| (a)(1) | The registrant’s code of ethics pursuant to Item 2 of Form N-CSR is attached. |
| (a)(2) | Separate certifications by the President (principal executive officer) and Treasurer (principal financial officer) of the registrant as required by Rule 30a‑2(a) under the Act (17 CFR 270.30a-2(a)) are attached. |
| (b) | A certification by the registrant’s President (principal executive officer) and Treasurer (principal financial officer) as required by Rule 30a-2(b) under the Act (17 CFR 270.30a-2(b)) is attached. |

