UNITED STATES
SECURITIES AND EXCHANGE COMMISSION
Washington, D.C. 20549
FORM N-CSR
CERTIFIED SHAREHOLDER REPORT OF REGISTERED MANAGEMENT INVESTMENT COMPANIES
Investment Company Act file number 811- 01136
| Guggenheim Funds Trust |
| (Exact name of registrant as specified in charter) |
702 King Farm Boulevard, Suite 200
Rockville, Maryland 20850 |
| (Address of principal executive offices) (Zip code) |
Amy J. Lee
Guggenheim Funds Trust
702 King Farm Boulevard, Suite 200
Rockville, Maryland 20850 |
| (Name and address of agent for service) |
Registrant's telephone number, including area code: 1-301-296-5100
Date of fiscal year end:September 30
Date of reporting period:September 30, 2019
Form N-CSR is to be used by management investment companies to file reports with the Commission not later than 10 days after the transmission to stockholders of any report that is required to be transmitted to stockholders under Rule 30e-1 under the Investment Company Act of 1940 (17 CFR 270.30e-1). The Commission may use the information provided on Form N-CSR in its regulatory, disclosure review, inspection, and policymaking roles.
A registrant is required to disclose the information specified by Form N-CSR, and the Commission will make this information public. A registrant is not required to respond to the collection of information contained in Form N-CSR unless the Form displays a currently valid Office of Management and Budget (“OMB”) control number. Please direct comments concerning the accuracy of the information collection burden estimate and any suggestions for reducing the burden to Secretary, Securities and Exchange Commission, 450 Fifth Street, NW, Washington, DC 20549-0609. The OMB has reviewed this collection of information under the clearance requirements of 44 U.S.C. §3507.
| Item 1. | Reports to Stockholders. |
The registrant’s annual report transmitted to shareholders pursuant to Rule 30e-1 under the Investment Company Act of 1940, as amended (the “Investment Company Act”), is as follows:
9.30.2019
Guggenheim Funds Annual Report
Guggenheim Funds Trust-Equity |
Guggenheim Alpha Opportunity Fund | | |
Guggenheim Large Cap Value Fund | | |
Guggenheim Market Neutral Real Estate Fund | | |
Guggenheim Risk Managed Real Estate Fund | | |
Guggenheim Small Cap Value Fund | | |
Guggenheim StylePlus—Large Core Fund | | |
Guggenheim StylePlus—Mid Growth Fund | | |
Guggenheim World Equity Income Fund | | |
Beginning on January 1, 2021, paper copies of the Funds’ annual and semi-annual shareholder reports may no longer be sent by mail, unless you specifically request paper copies of the reports from a fund or from your financial intermediary. Instead, the reports will be made available on a website, and you will be notified by mail each time a report is posted and provided with a website link to access the report.
If you already elected to receive shareholder reports electronically, you will not be affected by this change and you need not take any action. At any time, you may elect to receive reports and other communications from a fund electronically by calling 800.820.0888, going to GuggenheimInvestments.com/myaccount, or by contacting your financial intermediary.
You may elect to receive all future shareholder reports in paper free of charge. If you hold shares of a fund directly, you can inform the Fund that you wish to receive paper copies of reports by calling 800.820.0888. If you hold shares of a fund through a financial intermediary, please contact the financial intermediary to make this election. Your election to receive reports in paper will apply to all Guggenheim Funds in which you are invested and may apply to all funds held with your financial intermediary.
GuggenheimInvestments.com | SBE-ANN-0919x0920 |

| | |
DEAR SHAREHOLDER | 2 |
ECONOMIC AND MARKET OVERVIEW | 4 |
ABOUT SHAREHOLDERS’ FUND EXPENSES | 6 |
ALPHA OPPORTUNITY FUND | 9 |
LARGE CAP VALUE FUND | 30 |
MARKET NEUTRAL REAL ESTATE FUND | 41 |
RISK MANAGED REAL ESTATE FUND | 53 |
SMALL CAP VALUE FUND | 69 |
STYLEPLUS—LARGE CORE FUND | 81 |
STYLEPLUS—MID GROWTH FUND | 93 |
WORLD EQUITY INCOME FUND | 106 |
NOTES TO FINANCIAL STATEMENTS | 119 |
REPORT OF INDEPENDENT REGISTERED PUBLIC ACCOUNTING FIRM | 134 |
OTHER INFORMATION | 136 |
INFORMATION ON BOARD OF TRUSTEES AND OFFICERS | 145 |
GUGGENHEIM INVESTMENTS PRIVACY NOTICE | 150 |
| | THE GUGGENHEIM FUNDS ANNUAL REPORT | 1 |
Dear Shareholder:
Security Investors, LLC and Guggenheim Partners Investment Management, LLC (together, “Investment Advisers”), are pleased to present the shareholder report for eight equity funds (the “Fund” or “Funds”). The report covers the annual fiscal period ended September 30, 2019.
The Investment Advisers are part of Guggenheim Investments, which represents the investment management businesses of Guggenheim Partners, LLC, (“Guggenheim”) a global, diversified financial services firm.
Guggenheim Funds Distributors, LLC is the distributor of the Funds. Guggenheim Funds Distributors, LLC is affiliated with Guggenheim and the Investment Advisers.
We encourage you to read the Economic and Market Overview section of the report, which follows this letter, and then the Managers’ Commentary for each Fund.
We are committed to providing innovative investment solutions and appreciate the trust you place in us.
Sincerely,
Security Investors, LLC
Guggenheim Partners Investment Management, LLC
October 31, 2019
Read a prospectus and summary prospectus (if available) carefully before investing. It contains the investment objectives, risks, charges, expenses and other information, which should be considered carefully before investing. Obtain a prospectus and summary prospectus (if available) at guggenheiminvestments.com or call 800.820.0888.
This material is not intended as a recommendation or as investment advice of any kind, including in connection with rollovers, transfers, and distributions. Such material is not provided in a fiduciary capacity, may not be relied upon for or in connection with the making of investment decisions, and does not constitute a solicitation of an offer to buy or sell securities. All content has been provided for informational or educational purposes only and is not intended to be and should not be construed as legal or tax advice and/or a legal opinion. Always consult a financial, tax and/ or legal professional regarding your specific situation.
Alpha Opportunity Fund is subject to a number of risks and is not suitable for all investors. ● Investments in securities and derivatives, in general, are subject to market risks that may cause their prices to fluctuate over time. An investment in the Fund may lose money. There can be no guarantee the Fund will achieve it investment objective. ●The Fund’s use of derivatives such as futures, options and swap agreements may expose the Fund to additional risks that it would not be subject to if it invested directly in the securities underlying those derivatives. ● Certain of the derivative instruments, such as swaps and structured notes, are also subject to the risks of counterparty default and adverse tax treatment. ●The more the Fund invests in leveraged instruments, the more the leverage will magnify any gains or losses on those investments. ● The Fund’s use of short selling involves increased risk and costs, including paying more for a security than it received from its sale and the risk of unlimited losses. ●In certain circumstances the Fund may be subject to liquidity risk and it may be difficult for the Fund to purchase and sell particular investments within a reasonable time at a fair price. ●In certain circumstances, it may be difficult for the Fund to purchase and sell particular investments within a reasonable time at a fair price. ●The Fund’s fixed income investments will change in value in response to interest rate changes and other factors. ● See the prospectus for more information on these and additional risks.
Large Cap Value Fund may not be suitable for all investors. ● An investment in the Fund will fluctuate and is subject to investment risks, which means an investor could lose money. ● The intrinsic value of the underlying stocks may never be realized, or the stock may decline in value. The Fund is subject to risk that large-capitalization stocks may underperform other segments of the equity market or the equity markets as a whole.
Market Neutral Real Estate Fund may not be suitable for all investors. ● Investing involves risk, including the possible loss of principal. ● There are no assurances that any fund will achieve its objective and/or strategy. ● The Fund’s investments in real estate securities subject the Fund to the same risks as direct investments in real estate, which is particularly sensitive to economic downturns. ● The Fund’s use of derivatives such as futures, options, and swap agreements may expose the Fund to additional risks that it would not be subject to if it invested directly in the securities underlying those derivatives. ● When market conditions are deemed appropriate, the Fund will leverage to the full extent permitted by its investment policies and restrictions and applicable law. Leveraging will exaggerate the effect on net asset value of any increase or decrease in the market value of the Fund’s portfolio. ● The more the Fund invests in leveraged instruments, the more the leverage will magnify any gains or losses on those investments. ● The Fund’s use of short selling involves increased risk and costs. The Fund risks paying more for a security than it received from its sale. ● The Fund’s investments in other investment vehicles subject the Fund to those risks and expenses affecting the investment vehicle. ● The Fund’s investments in foreign securities carry additional risks when compared to U.S. securities, due to the impact of diplomatic, political, or economic developments in the country in question (investments in emerging markets securities are generally subject to an even greater level of risk). ● The Fund may invest in derivative instruments, which may be more volatile and less liquid, increasing the risk of loss when compared to traditional securities. Certain of the derivative instruments are also subject to the risks of counterparty default and adverse tax treatment. ● Investing in sector funds is more volatile than investing in broadly diversified funds, as there is a greater risk due to the concentration of the funds’ holdings in issuers of the same or similar offerings. ● This Fund is considered non-diversified and can invest a greater portion of its assets in securities of individual issuers than a diversified fund. As a result, changes in the market value of a single security could cause greater fluctuations in the value of fund shares than would occur
2 | THE GUGGENHEIM FUNDS ANNUAL REPORT | |
in a more diversified fund. ● Short selling involves increased risks and costs. You risk paying more for a security than you received from its sale. This strategy may not be suitable for all investors. ● The Fund is subject to active trading risks that may increase volatility and impact its ability to achieve its investment objective. ● You may have a gain or loss when you sell your shares. ● It is important to note that the Fund is not guaranteed by the U.S. government. ● Please read the prospectus for more detailed information regarding these and other risks.
Risk Managed Real Estate Fund may not be suitable for all investors. ● Investments in securities in general are subject to market risks that may cause their prices to fluctuate over time ● Investing involves risk, including the possible loss of principal. ● There are no assurances that any fund will achieve its objective and/or strategy. ● The Fund’s investments in real estate securities subject the Fund to the same risks as direct investments in real estate, which is particularly sensitive to economic downturns. ● The Fund’s use of derivatives such as futures, options and swap agreements may expose the Fund to additional risks that it would not be subject to if it invested directly in the securities underlying those derivatives. ● When market conditions are deemed appropriate, the Fund will leverage to the full extent permitted by its investment policies and restrictions and applicable law. Leveraging will exaggerate the effect on net asset value of any increase or decrease in the market value of the Fund’s portfolio. ● The more the Fund invests in leveraged instruments, the more the leverage will magnify any gains or losses on those investments. ● The Fund’s use of short selling involves increased risk and costs. The Fund risks paying more for a security than it received from its sale. ● The Fund’s investments in other investment vehicles subject the Fund to those risks and expenses affecting the investment vehicle. ● The Fund’s investments in foreign securities carry additional risks when compared to U.S. securities, due to the impact of diplomatic, political or economic developments in the country in question (investments in emerging markets securities are generally subject to an even greater level of risk). ● The Fund may invest in derivative instruments, which may be more volatile and less liquid, increasing the risk of loss when compared to traditional securities. Certain of the derivative instruments are also subject to the risks of counterparty default and adverse tax treatment. ● Investing in sector funds is more volatile than investing in broadly diversified funds, as there is a greater risk due to the concentration of the funds’ holdings in issuers of the same or similar offerings. ● This Fund is considered non-diversified and can invest a greater portion of its assets in securities of individual issuers than a diversified fund. As a result, changes in the market value of a single security could cause greater fluctuations in the value of fund shares than would occur in a more diversified fund. ● Short selling involves increased risks and costs. You risk paying more for a security than you received from its sale. This strategy may not be suitable for all investors. ● The Fund is subject to active trading risks that may increase volatility and impact its ability to achieve its investment objective. ● You may have a gain or loss when you sell you shares. ● It is important to note that the Fund is not guaranteed by the U.S. government. ● Please read the prospectus for more detailed information regarding these and other risks.
Small Cap Value Fund may not be suitable for all investors. ● An investment in the Fund will fluctuate and is subject to investment risks, which means investors could lose money. ● The intrinsic value of the underlying stocks may never be realized, or the stock may decline in value. ● Investing in securities of small-capitalization companies may involve a greater risk of loss and more abrupt fluctuations in market price than investments in larger-capitalization companies.
StylePlus—Large Core Fund may not be suitable for all investors. ● Investments in large capitalization stocks may underperform other segments of the equity market or the equity market as a whole. ● Growth stocks may be more volatile than other stocks because they are more sensitive to investor perceptions regarding the growth potential of the issuing companies. Value stocks are subject to the risk that the intrinsic value of the stock may never be realized by the market or that the price goes down.● The Fund may invest in derivative instruments, which may be more volatile and less liquid, increasing the risk of loss when compared to traditional securities. Certain of the derivative instruments are also subject to the risks of counterparty default and adverse tax treatment. ● The Fund’s use of leverage, through borrowings or instruments such as derivatives, may cause the Fund to be more volatile than if it had not been leveraged. ● The Fund’s investments in other investment vehicles subject the Fund to those risks and expenses affecting the investment vehicle. ● The Fund may invest in foreign securities which carry additional risks when compared to U.S. securities, due to the impact of diplomatic, political or economic developments in the country in question (investments in emerging markets securities are generally subject to an even greater level of risk). ● The Fund may invest in fixed income securities whose market value will change in response to interest rate changes and market conditions among other factors. In general, bond prices rise when interest rates fall and vice versa. ● The Fund’s exposure to high yield securities may subject the Fund to greater volatility. ● The Fund may invest in bank loans and asset-backed securities, including mortgage backed, which involve special types of risks. ● The Fund may invest in restricted securities which may involve financial and liquidity risk. ● You may have a gain or loss when you sell your shares. ● It is important to note that the Fund is not guaranteed by the U.S. government. ● Please read the prospectus for more detailed information regarding these and other risks.
StylePlus—Mid Growth Fund may not be suitable for all investors. ● Investments in mid-sized company securities may present additional risks such as less predictable earnings, higher volatility and less liquidity than larger, more established companies. ● Growth stocks may be more volatile than other stocks because they are more sensitive to investor perceptions regarding the growth potential of the issuing companies. ● The Fund may invest in derivative instruments, which may be more volatile and less liquid, increasing the risk of loss when compared to traditional securities. Certain of the derivative instruments are also subject to the risks of counterparty default and adverse tax treatment. ● The Fund’s use of leverage, through borrowings or instruments such as derivatives, may cause the Fund to be more volatile than if it had not been leveraged. ● The Fund’s investments in other investment vehicles subject the Fund to those risks and expenses affecting the investment vehicle. ● The Fund may invest in foreign securities which carry additional risks when compared to U.S. securities, due to the impact of diplomatic, political or economic developments in the country in question (investments in emerging markets securities are generally subject to an even greater level of risk). ● The Fund may invest in fixed income securities whose market value will change in response to interest rate changes and market conditions, among other factors. In general, bond prices rise when interest rates fall and vice versa. ● The Fund’s exposure to high yield securities may subject the Fund to greater volatility. ● The Fund may invest in bank loans and asset-backed securities, including mortgage backed, which involve special types of risks. ● The Fund may invest in restricted securities which may involve financial and liquidity risk. ● You may have a gain or loss when you sell your shares. ● It is important to note that the Fund is not guaranteed by the U.S. government. ● Please read the prospectus for more detailed information regarding these and other risks.
World Equity Income Fund may not be suitable for all investors. ●Investments in securities in general are subject to market risks that may cause their prices to fluctuate over time. ●The Fund’s investments in foreign securities carry additional risks when compared to U.S. securities, due to the impact of diplomatic, political or economic developments in the country in question (investments in emerging markets are generally subject to an even greater level of risk). Additionally, the Fund’s exposure to foreign currencies subjects the Fund to the risk that those currencies will decline in value relative to the U.S. Dollar. ● The Fund’s investments in derivatives may pose risks in addition to those associated with investing directly in securities or other investments, including illiquidity of the derivatives, imperfect correlations with underlying investments or the Fund’s other portfolio holdings, lack of availability and counterparty risk. ●The Fund’s use of leverage, through instruments such as derivatives, may cause the Fund to be more volatile than if it had not been leveraged. ●The Fund’s investments in other investment vehicles subject the Fund to those risks and expenses affecting the investment vehicle. ●The Fund may have significant exposure to securities in a particular capitalization range e.g., large-, mid- or small-cap securities. As a result, the Fund may be subject to the risk that the pre-denominate capitalization range may underperform other segments of the equity market or the equity market as a whole. ● Please read the prospectus for more detailed information regarding these and other risks.
| | THE GUGGENHEIM FUNDS ANNUAL REPORT | 3 |
ECONOMIC AND MARKET OVERVIEW (Unaudited) | September 30, 2019 |
Economic data has been mixed over the past few months. On the positive side, we saw a pickup in the housing market as measured by housing starts and home sales, which could be a delayed response to lower mortgage rates. Industrial production had the strongest month-over-month gain in a year, partially boosted by an increase in oil production in Hurricane Barry’s wake. The unemployment rate fell to a 50-year low of 3.5% in September 2019, despite a continued moderation in payroll gains.
On the negative side, the Institute for Supply Management (“ISM”) Manufacturing Index plunged to the weakest reading since June 2009. The ISM Non-Manufacturing Index also came in well below expectations, the lowest since August 2016. Within both the manufacturing and non-manufacturing ISM indexes, analysts look at the employment component of the survey for an early read on other labor market indicators. Here we find more cause for concern: The non-manufacturing survey’s employment component is now barely above 50 while the manufacturing employment sub-index stands at 46.3, well into contraction territory. Combined, the outlook for output and hiring has dimmed, signaling trouble ahead for consumers.
Retail sales have been steady, but Commerce Department data showed that total consumer spending on goods and services increased only 0.1% month-over-month in August 2019, the smallest gain in six months. It is hard to identify the primary reason why consumers may already be turning more conservative on spending. Income growth looks steady, the equity market is higher year-to-date, and rates are lower, all of which should be boosting consumer confidence. Sentiment surveys, however, show that fewer consumers believe now is a good time to buy homes, vehicles, and household durables, and headline consumer confidence measures have ticked down. We believe trade policy and political concerns are weighing on sentiment, and these headwinds are set to ramp up further. Additional U.S. tariffs on China are due to take effect on December 15, 2019, and the U.S. House of Representatives is pressing forward with its impeachment inquiry into President Trump.
Guggenheim’s dashboard of U.S. recession indicators continues to point to a recession beginning as early as the first half of 2020, and we think the economic data is corroborating this view. Two of the more notable indicators pointing to high recession risk are the three-month/10-year U.S. Treasury yield curve, which has been inverted for 16 consecutive weeks through period end, and the Leading Economic Indicators Index which has slowed from a year-over-year growth rate of 6.6% in September 2018 to 1.1% as of August 2019. The indicators Guggenheim tracks as part of our recession probability model indicate a nearly 50% chance that a recession will come before mid-2020, and a 70% chance that it will arrive by mid-2021.
Over the period, the U.S. Treasury curve continued its overall flattening trend, as the difference between the two-year U.S. Treasury and 10-year U.S. Treasury narrowed to 5 basis points. Equity markets remained volatile, buoyed by a 25 basis point cut in July and September 2019 by the U.S. Federal Reserve (the “Fed”) and relatively strong U.S. economic data, but weighed down by trade war uncertainty and fears of a global slowdown.
With downside risks growing, markets have become more sensitive to the Fed’s communications about the future stance of monetary policy. Despite the two rate cuts, Fed policymakers are deeply divided. It is still unclear whether the Fed will deliver the aggressive and preemptive policy action that would prolong the current expansion.
For the 12-month period ended September 30, 2019, the Standard & Poor’s 500® (“S&P 500”) Index* returned 4.25%. The MSCI Europe-Australasia-Far East (“EAFE”) Index* returned -0.82%. The return of the MSCI Emerging Markets Index* was -1.63%.
In the bond market, the Bloomberg Barclays U.S. Aggregate Bond Index* posted a 10.30% return for the period, while the Bloomberg Barclays U.S. Corporate High Yield Index* returned 6.36%. The return of the ICE Bank of America (“BofA”) Merrill Lynch 3-Month U.S. Treasury Bill Index* was 2.39% for the 12-month period.
The opinions and forecasts expressed may not actually come to pass. This information is subject to change at any time, based on market and other conditions, and should not be construed as a recommendation of any specific security or strategy.
4 | THE GUGGENHEIM FUNDS ANNUAL REPORT | |
ECONOMIC AND MARKET OVERVIEW (Unaudited)(concluded) | September 30, 2019 |
*Index Definitions
Indices are unmanaged and not available for direct investment. Index performance does not reflect transaction costs, fees, or expenses.
Bloomberg Barclays U.S. Aggregate Bond Index is a broad-based flagship benchmark that measures the investment grade, U.S. dollar-denominated, fixed-rate taxable bond market, including U.S. Treasuries, government-related and corporate securities, mortgage-backed securities or “MBS” (agency fixed-rate and hybrid adjustable-rate mortgage, or “ARM”, pass-throughs), asset-backed securities (“ABS”), and commercial mortgage-backed securities (“CMBS”) (agency and non-agency).
Bloomberg Barclays U.S. Corporate High Yield Index measures the U.S. dollar-denominated, high yield, fixed-rate corporate bond market. Securities are classified as high yield if the middle rating of Moody’s, Fitch, and S&P is Ba1/BB +/BB + or below.
FTSE NAREIT Equity REITs Total Return Index (“FNRE”) is one of the FTSE NAREIT US Real Estate Index Series that contains all Equity REITs not designated as Timber REITs or Infrastructure REITs. FTSE NAREIT US Real Estate Index Series is designed to present investors with a comprehensive family of REIT performance indexes that spans the commercial real estate space across the US economy. The index series provides investors with exposure to all investment and property sectors. In addition, the more narrowly focused property sector and sub-sector indexes provide the facility to concentrate commercial real estate exposure in more selected markets. The National Association of Real Estate Investment Trusts (NAREIT) is the trade association for REITs and publicly traded real estate companies with an interest in the US property and investment markets.
ICE BofA Merrill Lynch 3-Month U.S. Treasury Bill Index is an unmanaged market Index of U.S. Treasury securities maturing in 90 days that assumes reinvestment of all income.
MSCI EAFE Index is a capitalization-weighted measure of stock markets in Europe, Australasia, and the Far East.
MSCI Emerging Markets Index is a free float-adjusted market capitalization-weighted index that is designed to measure equity market performance in the global emerging markets.
MSCI World Index (Net) is calculated with net dividends reinvested. It is a free float-adjusted market capitalization weighted index that is designed to measure the equity market performance of developed markets.
Morningstar Long/Short Equity Category Average is the average return of funds Morningstar places in a given category based on their portfolio statistics and compositions over the past three years. Long-short portfolios hold sizeable stakes in both long and short positions in equities, exchange traded funds, and related derivatives. Some funds that fall into this category will shift their exposure to long and short positions depending on their macro outlook or the opportunities they uncover through bottom-up research. At least 75% of the assets are in equity securities or derivatives, and funds in the category will typically have beta values to relevant benchmarks of between 0.3 and 0.8 over a three-year period.
Russell 1000® Value Index is a measure of the performance for the large-cap value segment of the U.S. equity universe. It includes those Russell 1000 companies with lower price-to-book ratios and lower expected growth values.
Russell 2000® Value Index measures the performance of the small-cap value segment of the U.S. equity universe. It includes those Russell 2000 companies with lower price-to-book ratios and lower forecasted growth values.
Russell 3000® Index measures the performance of the largest 3,000 U.S. companies, representing approximately 98% of the investable U.S. equity market.
Russell Midcap Growth® Index measures the performance of the mid-cap growth segment of the U.S. equity universe. It includes those Russell Midcap Index companies with higher price-to-book ratios and higher forecasted growth values.
S&P 500® is a broad-based index, the performance of which is based on the performance of 500 widely held common stocks chosen for market size, liquidity, and industry group representation.
| | THE GUGGENHEIM FUNDS ANNUAL REPORT | 5 |
ABOUT SHAREHOLDERS’ FUND EXPENSES (Unaudited) | |
All mutual funds have operating expenses, and it is important for our shareholders to understand the impact of costs on their investments. Shareholders of a fund incur two types of costs: (i) transaction costs, including sales charges (loads) on purchase payments, reinvested dividends, other distributions, and exchange fees, and (ii) ongoing costs, including management fees, administrative services, and shareholder reports, among others. These ongoing costs, or operating expenses, are deducted from a fund’s gross income and reduce the investment return of the fund.
A fund’s expenses are expressed as a percentage of its average net assets, which is known as the expense ratio. The following examples are intended to help investors understand the ongoing costs (in dollars) of investing in a fund and to compare these costs with the ongoing costs of investing in other mutual funds.
The examples are based on an investment of $1,000 made at the beginning of the period and held for the entire six-month period beginning March 31, 2019 and ending September 30, 2019.
The following tables illustrate the Funds’ costs in two ways:
Table 1. Based on actual Fund return: This section helps investors estimate the actual expenses paid over the period. The “Ending Account Value” shown is derived from the Fund’s actual return, and the fifth column shows the dollar amount that would have been paid by an investor who started with $1,000 in the Fund. Investors may use the information here, together with the amount invested, to estimate the expenses paid over the period. Simply divide the Fund’s account value by $1,000 (for example, an $8,600 account value divided by $1,000 = 8.6), then multiply the result by the number provided under the heading “Expenses Paid During Period.”
Table 2. Based on hypothetical 5% return: This section is intended to help investors compare a fund’s cost with those of other mutual funds. The table provides information about hypothetical account values and hypothetical expenses based on the Fund’s actual expense ratio and an assumed rate of return of 5% per year before expenses, which is not the Fund’s actual return. The hypothetical account values and expenses may not be used to estimate the actual ending account balance or expenses paid during the period. The example is useful in making comparisons because the U.S. Securities and Exchange Commission (the “SEC”) requires all mutual funds to calculate expenses based on the 5% return. Investors can assess a fund’s costs by comparing this hypothetical example with the hypothetical examples that appear in shareholder reports of other funds.
The calculations illustrated above assume no shares were bought or sold during the period. Actual costs may have been higher or lower, depending on the amount of investment and the timing of any purchases or redemptions.
Please note that the expenses shown in the table are meant to highlight your ongoing costs only and do not reflect any transactional costs, such as sales charges (loads) on purchase payments, and contingent deferred sales charges (“CDSC”) on redemptions, if any. Therefore, the second table is useful in comparing ongoing costs only, and will not help you determine the relative total costs of owning different funds. In addition, if these transactional costs were included, your costs would have been higher.
More information about the Funds’ expenses, including annual expense ratios for periods up to five years (subject to the Fund’s inception date), can be found in the Financial Highlights section of this report. For additional information on operating expenses and other shareholder costs, please refer to the appropriate Fund prospectus.
6 | THE GUGGENHEIM FUNDS ANNUAL REPORT | |
ABOUT SHAREHOLDERS’ FUND EXPENSES (Unaudited)(continued) | |
| Expense
Ratio1 | Fund
Return | Beginning
Account Value
March 31, 2019 | Ending
Account Value
September 30, 2019 | Expenses
Paid During
Period2 |
Table 1. Based on actual Fund return3 | | | | | |
Alpha Opportunity Fund | | | | | |
A-Class | 1.66% | (3.70%) | $ 1,000.00 | $ 963.00 | $ 8.17 |
C-Class | 2.51% | (4.05%) | 1,000.00 | 959.50 | 12.33 |
P-Class | 1.70% | (3.68%) | 1,000.00 | 963.20 | 8.37 |
Institutional Class | 1.32% | (3.50%) | 1,000.00 | 965.00 | 6.50 |
Large Cap Value Fund | | | | | |
A-Class | 1.15% | 0.18% | 1,000.00 | 1,001.80 | 5.77 |
C-Class | 1.90% | (0.18%) | 1,000.00 | 998.20 | 9.52 |
P-Class | 1.15% | 0.18% | 1,000.00 | 1,001.80 | 5.77 |
Institutional Class | 0.90% | 0.30% | 1,000.00 | 1,003.00 | 4.52 |
Market Neutral Real Estate Fund | | | | | |
A-Class | 1.65% | 3.89% | 1,000.00 | 1,038.90 | 8.43 |
C-Class | 2.40% | 3.49% | 1,000.00 | 1,034.90 | 12.24 |
P-Class | 1.65% | 3.90% | 1,000.00 | 1,039.00 | 8.43 |
Institutional Class | 1.40% | 4.01% | 1,000.00 | 1,040.10 | 7.16 |
Risk Managed Real Estate Fund | | | | | |
A-Class | 2.35% | 10.29% | 1,000.00 | 1,102.90 | 12.39 |
C-Class | 3.00% | 9.85% | 1,000.00 | 1,098.50 | 15.78 |
P-Class | 2.08% | 10.30% | 1,000.00 | 1,103.00 | 10.97 |
Institutional Class | 2.01% | 10.46% | 1,000.00 | 1,104.60 | 10.60 |
Small Cap Value Fund | | | | | |
A-Class | 1.30% | 3.13% | 1,000.00 | 1,031.30 | 6.62 |
C-Class | 2.05% | 2.71% | 1,000.00 | 1,027.10 | 10.42 |
P-Class | 1.30% | 3.01% | 1,000.00 | 1,030.10 | 6.62 |
Institutional Class | 1.05% | 3.20% | 1,000.00 | 1,032.00 | 5.35 |
StylePlus—Large Core Fund | | | | | |
A-Class | 1.27% | 5.08% | 1,000.00 | 1,050.80 | 6.53 |
C-Class | 2.12% | 4.64% | 1,000.00 | 1,046.40 | 10.88 |
P-Class | 1.36% | 5.04% | 1,000.00 | 1,050.40 | 6.99 |
Institutional Class | 1.05% | 5.18% | 1,000.00 | 1,051.80 | 5.40 |
StylePlus—Mid Growth Fund | | | | | |
A-Class | 1.47% | 3.63% | 1,000.00 | 1,036.30 | 7.50 |
C-Class | 2.21% | 3.18% | 1,000.00 | 1,031.80 | 11.26 |
P-Class | 1.54% | 3.57% | 1,000.00 | 1,035.70 | 7.86 |
Institutional Class | 1.34% | 3.66% | 1,000.00 | 1,036.60 | 6.84 |
World Equity Income Fund | | | | | |
A-Class | 1.22% | 3.81% | 1,000.00 | 1,038.10 | 6.23 |
C-Class | 1.97% | 3.39% | 1,000.00 | 1,033.90 | 10.04 |
P-Class | 1.22% | 3.75% | 1,000.00 | 1,037.50 | 6.23 |
Institutional Class | 0.97% | 3.96% | 1,000.00 | 1,039.60 | 4.96 |
| | THE GUGGENHEIM FUNDS ANNUAL REPORT | 7 |
ABOUT SHAREHOLDERS’ FUND EXPENSES (Unaudited)(concluded) | |
| Expense
Ratio1 | Fund
Return | Beginning
Account Value
March 31, 2019 | Ending
Account Value
September 30, 2019 | Expenses
Paid During
Period2 |
Table 2. Based on hypothetical 5% return (before expenses) | | | | |
Alpha Opportunity Fund | | | | | |
A-Class | 1.66% | 5.00% | $ 1,000.00 | $ 1,016.75 | $ 8.39 |
C-Class | 2.51% | 5.00% | 1,000.00 | 1,012.48 | 12.66 |
P-Class | 1.70% | 5.00% | 1,000.00 | 1,016.55 | 8.59 |
Institutional Class | 1.32% | 5.00% | 1,000.00 | 1,018.45 | 6.68 |
Large Cap Value Fund | | | | | |
A-Class | 1.15% | 5.00% | 1,000.00 | 1,019.30 | 5.82 |
C-Class | 1.90% | 5.00% | 1,000.00 | 1,015.54 | 9.60 |
P-Class | 1.15% | 5.00% | 1,000.00 | 1,019.30 | 5.82 |
Institutional Class | 0.90% | 5.00% | 1,000.00 | 1,020.56 | 4.56 |
Market Neutral Real Estate Fund | | | | | |
A-Class | 1.65% | 5.00% | 1,000.00 | 1,016.80 | 8.34 |
C-Class | 2.40% | 5.00% | 1,000.00 | 1,013.04 | 12.11 |
P-Class | 1.65% | 5.00% | 1,000.00 | 1,016.80 | 8.34 |
Institutional Class | 1.40% | 5.00% | 1,000.00 | 1,018.05 | 7.08 |
Risk Managed Real Estate Fund | | | | | |
A-Class | 2.35% | 5.00% | 1,000.00 | 1,013.29 | 11.86 |
C-Class | 3.00% | 5.00% | 1,000.00 | 1,010.03 | 15.12 |
P-Class | 2.08% | 5.00% | 1,000.00 | 1,014.64 | 10.50 |
Institutional Class | 2.01% | 5.00% | 1,000.00 | 1,014.99 | 10.15 |
Small Cap Value Fund | | | | | |
A-Class | 1.30% | 5.00% | 1,000.00 | 1,018.55 | 6.58 |
C-Class | 2.05% | 5.00% | 1,000.00 | 1,014.79 | 10.35 |
P-Class | 1.30% | 5.00% | 1,000.00 | 1,018.55 | 6.58 |
Institutional Class | 1.05% | 5.00% | 1,000.00 | 1,019.80 | 5.32 |
StylePlus—Large Core Fund | | | | | |
A-Class | 1.27% | 5.00% | 1,000.00 | 1,018.70 | 6.43 |
C-Class | 2.12% | 5.00% | 1,000.00 | 1,014.44 | 10.71 |
P-Class | 1.36% | 5.00% | 1,000.00 | 1,018.25 | 6.88 |
Institutional Class | 1.05% | 5.00% | 1,000.00 | 1,019.80 | 5.32 |
StylePlus—Mid Growth Fund | | | | | |
A-Class | 1.47% | 5.00% | 1,000.00 | 1,017.70 | 7.44 |
C-Class | 2.21% | 5.00% | 1,000.00 | 1,013.99 | 11.16 |
P-Class | 1.54% | 5.00% | 1,000.00 | 1,017.35 | 7.79 |
Institutional Class | 1.34% | 5.00% | 1,000.00 | 1,018.35 | 6.78 |
World Equity Income Fund | | | | | |
A-Class | 1.22% | 5.00% | 1,000.00 | 1,018.95 | 6.17 |
C-Class | 1.97% | 5.00% | 1,000.00 | 1,015.19 | 9.95 |
P-Class | 1.22% | 5.00% | 1,000.00 | 1,018.95 | 6.17 |
Institutional Class | 0.97% | 5.00% | 1,000.00 | 1,020.21 | 4.91 |
1 | This ratio represents annualized net expenses, which may include short dividend and interest expense. Excluding these expenses, the operating expense ratio for the Risk Managed Real Estate Fund would be 1.28%, 2.05%, 1.30% and 0.96% for the A-Class, C-Class, P-Class and Institutional Class, respectively. Excludes expenses of the underlying funds in which the Funds invest, if any. |
2 | Expenses are equal to the Fund’s annualized expense ratio, net of any applicable fee waivers, multiplied by the average account value over the period, multiplied by 183/365 (to reflect the one-half year period). |
3 | Actual cumulative return at net asset value for the period March 31, 2019 to September 30, 2019. |
8 | THE GUGGENHEIM FUNDS ANNUAL REPORT | |
MANAGERS’ COMMENTARY (Unaudited) | September 30, 2019 |
Dear Shareholder:
Guggenheim Alpha Opportunity Fund (the “Fund”) is managed by a team of seasoned professionals, including Farhan Sharaff, Senior Managing Director and Assistant Chief Investment Officer, Equities, and Portfolio Manager; Jayson Flowers, Senior Managing Director and Portfolio Manager; Samir Sanghani, CFA, Managing Director and Portfolio Manager; and Burak Hurmeydan, Ph.D., Director and Portfolio Manager. In the paragraphs below, the team discusses the performance of the Fund for the 12-month period ended September 30, 2019.
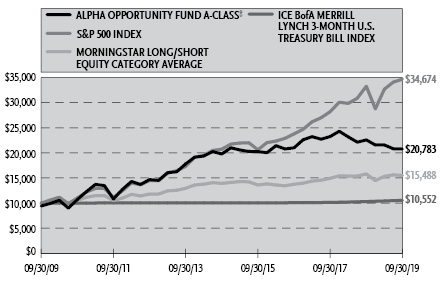
For the one year period ended September 30, 2019, Guggenheim Alpha Opportunity Fund returned -7.97%1, compared with the 2.39% return of its benchmark, the ICE BofA Merrill Lynch 3-Month U.S. Treasury Bill Index. The Fund’s secondary benchmark is the Morningstar Long/Short Equity Category Average. Its return for the 12 months was -1.99%.
Investment Approach
The Fund is managed as an opportunistic long/short strategy, which employs forward-looking, fundamental analysis to measure the market’s expected return for each stock in the universe. Quantitative techniques are then applied to evaluate market- and company-specific risk factors embedded in each stock and to assess which specific risk factors (such as size, growth, or sectors) are being overvalued or undervalued by the market. Finally, a portfolio is constructed within guidelines that is long the stocks that give the portfolio both the broad risk characteristics and company-specific risks that are perceived to be undervalued and is short stocks for which those characteristics are perceived to be overpriced.
The Fund will ordinarily hold simultaneous long and short positions in equity securities or securities markets that provide exposure up to a level equal to 150% of the Fund’s net assets for both the long and short positions. The Fund intends to maintain a low overall net exposure (the difference between the notional value of long positions and the notional value of short positions), typically varying between 50% net long and 30% net short in order to maintain low correlation to traditional equity markets and lower-than-market volatility, and seek to provide consistent absolute return. The overall net exposure will change as market opportunities change, and may, based on the Fund’s view of current market conditions, be outside this range.
Derivatives in the Fund are used to take short positions as well as long exposure above 100% of NAV (that is, to take leverage).
Performance Review
The period began with a major market pullback and spike in volatility, before rebounding strongly in the first months of 2019. The economy had begun to slow, and the trade war continued to escalate, leading the U.S. Federal Reserve (the “Fed”) to change its tone from hawkish to dovish, signaling that rate cuts were now on the horizon. The Fed course reversal became a large driver of the risk-market, as the fears of steady rate rises causing a recession quickly dissipated. Equity markets took a short-term hit in May when trade threats against China and Mexico escalated. But like most other dips over the last few years, it was short and quickly reversed, as the administration lowered its trade rhetoric. As global growth expectations decreased while the risk of trade wars and disorderly BREXIT increased, investors continued moving towards safer assets such as long-term U.S. Treasurys and high-quality stocks. In August, the yield curve between the 2-year and 10-year U.S. Treasury rates briefly inverted, a historical indicator that has presaged past recessions. The Fed fully abandoned last year’s hawkish stance and cut short term rates two times during the period while calling it a “midcycle adjustment to policy.”
At period end, the Fund held about 115% of assets in long securities, and 91% short, for a net-dollar exposure of 24%. This level of net exposure is lower than the prior few years, primarily because of the Guggenheim macro view that economic data are pointing toward a high probability of recession. While the positive net market exposure resulted in some positive market attribution, the Fund is decidedly less exposed to the broad market returns than in prior years (and likewise less exposed to the market than most long/short equity managers). Indeed, much of the Fund’s returns for the period are mostly explained by sector and style positioning.
The realized net beta (sensitivity of daily Fund returns to the S&P 500 index) averaged around 0.28 during the year. The long positions (on a standalone unlevered basis) averaged a return of -1.0%, compared to the Russell 3000 index return of 2.9%. Short positions returned 6.7% on a stand-alone basis. Thus, our negative returns results from poor alpha on both longs and shorts.
The Fund’s sector positioning was a slight detractor for the year, contributing -0.35% to attribution. The largest sector detractor was the net short position in Real Estate, which performed quite strongly on beta-adjusted terms despite looking quite expensive vis-à-vis other defensive sectors. Mostly offsetting that drag were overweights in Consumer Staples and Utilities, which also outperformed the market on a beta-adjusted basis.
| | THE GUGGENHEIM FUNDS ANNUAL REPORT | 9 |
MANAGERS’ COMMENTARY (Unaudited)(concluded) | September 30, 2019 |
The Fund’s fundamental style tilts were the primary negative contributor to the period’s returns, resulting in about -5.80% of the contribution. The Fund’s tilts towards cheaper names underperformed, while tilts towards higher free cash flow and higher profitability helped offset that drag a little.
A performance factor for the period was the unprecedented persistence of value names underperforming expensive stocks. The magnitude of cumulative Value style underperformance is reaching historic levels last seen in the 1999 Tech bubble.
The Fund’s strategy is to determine attractiveness of broad groups of stocks relative to their fundamentals. The Value factor has seen its risk premium (or embedded valuation) improve as the returns have struggled–implying that the valuation of the stocks (both cheaper and expensive) have spread much further than fundamentals of the companies. To what extent this ‘behavioral’ cycle will continue is a key question–and one that is very difficult to answer. In every market environment there are elements of the macro-economic cycle that are somewhat predictable, and elements that are new and completely unpredictable (global quantitative easing, negative long rates, and trade wars being the most unique factors this time around). These unique elements can drive market sentiment in ways that are hard to predict.
Focusing on corporate fundamentals tends to produce slightly more predictability. Companies must invest in operations & research to produce sales and earnings–and there are some bounds on how much and how little the companies can earn on that capital before competition comes in to erode them. Given some bounded limits on corporate earnings power, we find that the valuations awarded the most expensive tiers of the equity market have far surpassed the likely long-term earnings power.
We find some comfort during a poor performance period in knowing that, in past periods of Value drawdown, the forward performance of the factor has been tremendous due to the rewinding of all the excess valuations.
The Fund has not wavered in its valuation-disciplined approach to finding long and short equity opportunities. We continue to utilize ways for our dynamic factor approach to help mitigate these types of intermittent factor waves but have not been able to completely offset them in the current cycle. The Fund is primarily set up to take advantage of valuation disparities caused by behavioral cycles–by taking opposing long and short style and sector exposures where extremes exist–and trying to deliver positive returns that are not correlated with overall market direction. We see today large disparities that have historically provided strong fuel for opportunistic returns in the past and plan to stick with the discipline to reap those rewards going forward.
In early September, we saw a huge reversal of the above trend over the course of a few days. The weekly move in ‘momentum’ and ‘value’ factors were of magnitudes not seen in a decade. A key question is whether this heightened volatility is a precursor to further value/momentum reversal, or just a short-term trading fluke. The equity style reversal in September may have simply been a knee jerk reaction to the quick pop in interest rates at that time (the compression in yields has highly correlated with the bias towards expensive stocks). History also shows that strong momentum creates crowding in narrow market leaders, and that crowding can turn into a rush to exit as soon as the leading names become more volatile.
Positioning
At period end, the Fund’s net dollar exposure was 24%, the lower end of where we have been historically. The Fund maintains its large style bias towards cheaper valuation names, while maintaining moderate free cash flow bias and profitability bias–both of which are styles that have historically helped protect against macro risk in the event of recession. Guggenheim’s macro research team is still wary of recession in the next year or so and vulnerability in overall markets–and the Fund has likewise taken a cautious positioning with quality style characteristics and lower overall market exposure.
From an industry perspective, the Fund now holds a net short in the Technology sector after prior years of being positioned net long. The flip in exposure occurred during this year in response to relative attractiveness of the names vis-à-vis other sector opportunities. The net short in Financials has begun to shrink after remaining quite negative for a few years. The largest sector net long exposures are in Healthcare, Consumer Staples, and Transportation. The largest net short exposures exist in Real Estate, Materials, and IT sectors.
Performance displayed represents past performance which is no guarantee of future results.
1 | Performance figures are based on Class A shares and do not reflect deduction of the sales charges or taxes that a shareholder would pay on distributions or the redemption of shares. |
The opinions and forecast expressed may not actually come to pass. This information is subject to change at any time, based on market and other conditions, and should not be construed as a recommendation of any specific security or strategy.
10 | THE GUGGENHEIM FUNDS ANNUAL REPORT | |
PERFORMANCE REPORT AND FUND PROFILE (Unaudited) | September 30, 2019 |
ALPHA OPPORTUNITY FUND
OBJECTIVE: Seeks long-term growth of capital.
Holdings Diversification (Market Exposure as % of Net Assets)
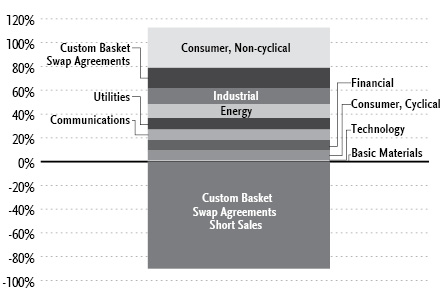
“Holdings Diversification (Market Exposure as % of Net Assets)” excludes any temporary cash investments.
Inception Dates: |
A-Class | July 7, 2003 |
C-Class | July 7, 2003 |
P-Class | May 1, 2015 |
Institutional Class | November 7, 2008 |
Ten Largest Holdings (% of Total Net Assets) |
ONEOK, Inc. | 1.4% |
Equity Commonwealth | 1.3% |
Archer-Daniels-Midland Co. | 1.3% |
Apartment Investment & Management Co. — Class A | 1.3% |
Chevron Corp. | 1.2% |
Exxon Mobil Corp. | 1.2% |
Amgen, Inc. | 1.2% |
Kinder Morgan, Inc. | 1.2% |
Medical Properties Trust, Inc. | 1.2% |
Verizon Communications, Inc. | 1.2% |
Top Ten Total | 12.5% |
| | |
“Ten Largest Holdings” excludes any temporary cash or derivative investments. |
| | THE GUGGENHEIM FUNDS ANNUAL REPORT | 11 |
PERFORMANCE REPORT AND FUND PROFILE (Unaudited)(concluded) | September 30, 2019 |
Cumulative Fund Performance*
Average Annual Returns*
Periods Ended September 30, 2019
| 1 Year | 5 Year | 10 Year |
A-Class Shares | (7.97%) | 0.99% | 8.23% |
A-Class Shares with sales charge‡ | (12.32%) | 0.01% | 7.59% |
C-Class Shares | (8.73%) | 0.23% | 7.41% |
C-Class Shares with CDSC§ | (9.64%) | 0.23% | 7.41% |
Institutional Class Shares | (7.57%) | 1.45% | 8.66% |
Morningstar Long/Short Equity Category Average | (1.99%) | 2.15% | 4.47% |
S&P 500 Index | 4.25% | 10.84% | 13.24% |
S&P 500 Index-Blended** | 2.39% | 5.80% | 10.63% |
ICE BofA Merrill Lynch 3-Month U.S. Treasury Bill Index | 2.39% | 0.98% | 0.54% |
| | 1 Year | Since
Inception
(05/01/15) |
P-Class Shares | | (7.99%) | (0.21%) |
Morningstar Long/Short Equity Category Average | | (1.99%) | 1.69% |
S&P 500 Index | | 4.25% | 10.39% |
S&P 500 Index-Blended** | | 2.39% | 4.73% |
ICE BofA Merrill Lynch 3-Month U.S. Treasury Bill Index | | 2.39% | 1.11% |
* | The performance data above represents past performance that is not predictive of future results. The investment return and principal value of an investment in the Fund will fluctuate so that an investor’s shares, when redeemed, may be worth more or less than their original cost. Returns are historical and include changes in principal and reinvested dividends and capital gains and do not reflect the effect of taxes. The ICE BofA Merrill Lynch 3-Month U.S. Treasury Bill Index, S&P 500 Index, and the Morningstar Long/Short Equity Category Average are unmanaged indices and, unlike the Fund, have no management fees or operating expenses to reduce their reported returns. The graph is based on A-Class shares only; performance for C-Class, P-Class and Institutional Class will vary due to differences in fee structures. |
** | Effective March 13, 2017, the Fund changed its principal investment strategy. As a result of the investment strategy change, the Fund’s new benchmark is the ICE BofA Merrill Lynch 3-Month Treasury Bill Index. The Fund’s performance was previously compared to the S&P 500 Index. The S&P 500 Index-Blended uses performance data for the S&P 500 Index from 03/31/09 to 03/12/17, and the ICE BofA Merrill Lynch 3-Month U.S. Treasury Bill index from 03/13/17 to 09/30/19. |
‡ | Effective February 22, 2011, the maximum sales charge decreased from 5.75% to 4.75%. A 5.75% maximum sales charge is used in the calculation of the Average Annual Returns based on subscriptions made prior to February 22, 2011, and a 4.75% maximum sales charge will be used to calculate performance for periods based on subscriptions made on or after February 22, 2011. |
§ | Fund returns include a CDSC of 1% if redeemed within 12 months of purchase. |
12 | THE GUGGENHEIM FUNDS ANNUAL REPORT | |
SCHEDULE OF INVESTMENTS | September 30, 2019 |
ALPHA OPPORTUNITY FUND | |
| | Shares | | | Value | |
COMMON STOCKS† - 95.9% |
| | | | | | | | | |
Consumer, Non-cyclical - 33.9% |
Archer-Daniels-Midland Co.1 | | | 28,659 | | | $ | 1,177,025 | |
Amgen, Inc.1 | | | 5,555 | | | | 1,074,948 | |
McKesson Corp. | | | 7,691 | | | | 1,051,052 | |
Ingredion, Inc.1 | | | 12,160 | | | | 993,958 | |
Merck & Company, Inc.1 | | | 11,599 | | | | 976,404 | |
Gilead Sciences, Inc.1 | | | 14,841 | | | | 940,623 | |
Molson Coors Brewing Co. — Class B1 | | | 15,705 | | | | 903,038 | |
Zimmer Biomet Holdings, Inc.1 | | | 6,320 | | | | 867,547 | |
CVS Health Corp. | | | 13,581 | | | | 856,554 | |
Pilgrim’s Pride Corp.* | | | 25,127 | | | | 805,195 | |
Pfizer, Inc.1 | | | 22,000 | | | | 790,460 | |
PepsiCo, Inc. | | | 5,652 | | | | 774,889 | |
Cal-Maine Foods, Inc. | | | 18,605 | | | | 743,363 | |
Kimberly-Clark Corp. | | | 5,223 | | | | 741,927 | |
Becton Dickinson and Co. | | | 2,742 | | | | 693,616 | |
Tyson Foods, Inc. — Class A | | | 7,635 | | | | 657,679 | |
Sysco Corp. | | | 7,592 | | | | 602,805 | |
Hill-Rom Holdings, Inc. | | | 5,699 | | | | 599,706 | |
Baxter International, Inc. | | | 6,822 | | | | 596,720 | |
AMERCO | | | 1,529 | | | | 596,371 | |
Colgate-Palmolive Co. | | | 8,107 | | | | 595,945 | |
H&R Block, Inc. | | | 24,559 | | | | 580,083 | |
Hologic, Inc.* | | | 11,290 | | | | 570,032 | |
Philip Morris International, Inc. | | | 7,458 | | | | 566,286 | |
Kroger Co.1 | | | 21,696 | | | | 559,323 | |
Darling Ingredients, Inc.* | | | 29,076 | | | | 556,224 | |
Eli Lilly & Co. | | | 4,691 | | | | 524,595 | |
Thermo Fisher Scientific, Inc. | | | 1,780 | | | | 518,461 | |
General Mills, Inc. | | | 9,396 | | | | 517,907 | |
Post Holdings, Inc.* | | | 4,871 | | | | 515,547 | |
Medtronic plc1 | | | 4,656 | | | | 505,735 | |
Hormel Foods Corp. | | | 10,264 | | | | 448,845 | |
Johnson & Johnson | | | 3,253 | | | | 420,873 | |
Biogen, Inc.* | | | 1,735 | | | | 403,943 | |
JM Smucker Co. | | | 3,663 | | | | 403,003 | |
Cardinal Health, Inc.1 | | | 8,490 | | | | 400,643 | |
Jazz Pharmaceuticals plc* | | | 3,089 | | | | 395,824 | |
Bio-Rad Laboratories, Inc. — Class A*,1 | | | 1,107 | | | | 368,343 | |
Integer Holdings Corp.* | | | 4,859 | | | | 367,146 | |
AmerisourceBergen Corp. — Class A | | | 4,422 | | | | 364,063 | |
ManpowerGroup, Inc. | | | 4,270 | | | | 359,705 | |
Lamb Weston Holdings, Inc. | | | 4,856 | | | | 353,128 | |
STERIS plc | | | 2,411 | | | | 348,365 | |
US Foods Holding Corp.* | | | 8,078 | | | | 332,006 | |
Campbell Soup Co. | | | 7,045 | | | | 330,551 | |
Herbalife Nutrition Ltd.* | | | 8,717 | | | | 330,026 | |
Kellogg Co. | | | 5,077 | | | | 326,705 | |
Regeneron Pharmaceuticals, Inc.* | | | 1,098 | | | | 304,585 | |
TrueBlue, Inc.* | | | 13,668 | | | | 288,395 | |
Central Garden & Pet Co. — Class A* | | | 10,001 | | | | 277,278 | |
Alexion Pharmaceuticals, Inc.* | | | 2,679 | | | | 262,381 | |
Innoviva, Inc.* | | | 23,237 | | | | 244,918 | |
Kraft Heinz Co.1 | | | 8,096 | | | | 226,162 | |
B&G Foods, Inc. | | | 11,949 | | | | 225,955 | |
Total Consumer, Non-cyclical | | | | | | | 30,236,861 | |
| | | | | | | | | |
Industrial - 13.5% |
United Parcel Service, Inc. — Class B | | | 7,989 | | �� | | 957,242 | |
FedEx Corp.1 | | | 5,819 | | | | 847,072 | |
Landstar System, Inc. | | | 6,374 | | | | 717,585 | |
Cummins, Inc. | | | 3,888 | | | | 632,461 | |
CSX Corp.1 | | | 8,749 | | | | 606,043 | |
Werner Enterprises, Inc. | | | 16,015 | | | | 565,330 | |
Knight-Swift Transportation Holdings, Inc. | | | 15,111 | | | | 548,529 | |
Schneider National, Inc. — Class B | | | 25,176 | | | | 546,823 | |
Norfolk Southern Corp. | | | 2,694 | | | | 484,004 | |
Saia, Inc.* | | | 5,055 | | | | 473,654 | |
Heartland Express, Inc. | | | 21,532 | | | | 463,153 | |
Old Dominion Freight Line, Inc. | | | 2,609 | | | | 443,452 | |
Forward Air Corp. | | | 6,489 | | | | 413,479 | |
Echo Global Logistics, Inc.* | | | 17,847 | | | | 404,235 | |
Kennametal, Inc. | | | 12,669 | | | | 389,445 | |
Waters Corp.* | | | 1,715 | | | | 382,839 | |
J.B. Hunt Transport Services, Inc.1 | | | 3,399 | | | | 376,099 | |
Agilent Technologies, Inc. | | | 4,847 | | | | 371,426 | |
Marten Transport Ltd. | | | 17,680 | | | | 367,390 | |
Kansas City Southern1 | | | 2,702 | | | | 359,393 | |
Union Pacific Corp. | | | 1,908 | | | | 309,058 | |
Parker-Hannifin Corp. | | | 1,388 | | | | 250,687 | |
Vishay Intertechnology, Inc. | | | 14,558 | | | | 246,467 | |
Avnet, Inc. | | | 5,330 | | | | 237,105 | |
Textron, Inc. | | | 4,712 | | | | 230,699 | |
Oshkosh Corp. | | | 2,843 | | | | 215,499 | |
Caterpillar, Inc. | | | 1,706 | | | | 215,485 | |
Total Industrial | | | | | | | 12,054,654 | |
| | | | | | | | | |
Energy - 11.9% |
ONEOK, Inc.1 | | | 16,404 | | | | 1,208,811 | |
Chevron Corp.1 | | | 9,231 | | | | 1,094,797 | |
Exxon Mobil Corp.1 | | | 15,379 | | | | 1,085,911 | |
Kinder Morgan, Inc. | | | 52,149 | | | | 1,074,791 | |
Phillips 661 | | | 9,034 | | | | 925,082 | |
HollyFrontier Corp.1 | | | 16,671 | | | | 894,232 | |
Valero Energy Corp.1 | | | 10,262 | | | | 874,733 | |
Marathon Petroleum Corp. | | | 12,871 | | | | 781,913 | |
Williams Companies, Inc. | | | 29,486 | | | | 709,433 | |
Delek US Holdings, Inc. | | | 18,784 | | | | 681,859 | |
Targa Resources Corp. | | | 9,780 | | | | 392,862 | |
Renewable Energy Group, Inc.* | | | 21,820 | | | | 327,409 | |
Cheniere Energy, Inc.* | | | 4,161 | | | | 262,393 | |
PBF Energy, Inc. — Class A | | | 7,835 | | | | 213,034 | |
Unit Corp.* | | | 35,705 | | | | 120,683 | |
Total Energy | | | | | | | 10,647,943 | |
| | | | | | | | | |
Utilities - 9.5% |
Pinnacle West Capital Corp. | | | 10,483 | | | | 1,017,585 | |
Portland General Electric Co. | | | 17,668 | | | | 995,945 | |
Ameren Corp.1 | | | 12,155 | | | | 973,008 | |
FirstEnergy Corp.1 | | | 19,640 | | | | 947,237 | |
PPL Corp. | | | 28,335 | | | | 892,269 | |
SEE NOTES TO FINANCIAL STATEMENTS. | THE GUGGENHEIM FUNDS ANNUAL REPORT | 13 |
SCHEDULE OF INVESTMENTS (continued) | September 30, 2019 |
ALPHA OPPORTUNITY FUND | |
| | Shares | | | Value | |
National Fuel Gas Co.1 | | | 18,010 | | | $ | 845,029 | |
Exelon Corp. | | | 13,043 | | | | 630,107 | |
Avista Corp. | | | 10,542 | | | | 510,655 | |
AES Corp.1 | | | 28,462 | | | | 465,069 | |
OGE Energy Corp. | | | 9,765 | | | | 443,136 | |
Southern Co. | | | 6,431 | | | | 397,243 | |
Public Service Enterprise Group, Inc. | | | 5,898 | | | | 366,148 | |
Total Utilities | | | | | | | 8,483,431 | |
| | | | | | | | | |
Communications - 8.9% |
Verizon Communications, Inc. | | | 17,435 | | | | 1,052,377 | |
Omnicom Group, Inc.1 | | | 11,764 | | | | 921,121 | |
AT&T, Inc.1 | | | 21,990 | | | | 832,101 | |
AMC Networks, Inc. — Class A*,1 | | | 13,606 | | | | 668,871 | |
Shenandoah Telecommunications Co. | | | 19,062 | | | | 605,600 | |
Discovery, Inc. — Class A* | | | 21,928 | | | | 583,943 | |
Scholastic Corp. | | | 14,872 | | | | 561,567 | |
John Wiley & Sons, Inc. — Class A | | | 12,025 | | | | 528,378 | |
Cogent Communications Holdings, Inc. | | | 9,076 | | | | 500,087 | |
ATN International, Inc. | | | 5,884 | | | | 343,449 | |
News Corp. — Class A | | | 22,489 | | | | 313,047 | |
Meredith Corp. | | | 8,071 | | | | 295,883 | |
TEGNA, Inc. | | | 16,996 | | | | 263,948 | |
Alphabet, Inc. — Class C* | | | 200 | | | | 243,800 | |
Facebook, Inc. — Class A* | | | 1,146 | | | | 204,080 | |
Total Communications | | | | | | | 7,918,252 | |
| | | | | | | | | |
Financial - 8.8% |
Equity Commonwealth REIT1 | | | 34,668 | | | | 1,187,379 | |
Apartment Investment & Management Co. — Class A REIT1 | | | 22,555 | | | | 1,176,018 | |
Medical Properties Trust, Inc. REIT | | | 54,023 | | | | 1,056,690 | |
HCP, Inc. REIT | | | 25,275 | | | | 900,548 | |
Hartford Financial Services Group, Inc.1 | | | 8,209 | | | | 497,547 | |
Deluxe Corp. | | | 9,378 | | | | 461,023 | |
Host Hotels & Resorts, Inc. REIT | | | 23,883 | | | | 412,937 | |
Northern Trust Corp. | | | 3,920 | | | | 365,814 | |
Summit Hotel Properties, Inc. REIT | | | 31,187 | | | | 361,769 | |
JPMorgan Chase & Co. | | | 2,342 | | | | 275,630 | |
Principal Financial Group, Inc. | | | 4,498 | | | | 257,016 | |
State Street Corp. | | | 4,089 | | | | 242,028 | |
Bank of New York Mellon Corp. | | | 5,131 | | | | 231,973 | |
Citigroup, Inc. | | | 3,206 | | | | 221,470 | |
Comerica, Inc. | | | 3,320 | | | | 219,087 | |
Total Financial | | | | | | | 7,866,929 | |
| | | | | | | | | |
Consumer, Cyclical - 8.1% |
Delta Air Lines, Inc.1 | | | 13,988 | | | | 805,709 | |
Southwest Airlines Co. | | | 13,576 | | | | 733,240 | |
Allison Transmission Holdings, Inc. | | | 15,334 | | | | 721,465 | |
United Airlines Holdings, Inc.*,1 | | | 7,527 | | | | 665,462 | |
JetBlue Airways Corp.* | | | 38,368 | | | | 642,664 | |
World Fuel Services Corp. | | | 14,816 | | | | 591,751 | |
Toll Brothers, Inc. | | | 10,986 | | | | 450,975 | |
Alaska Air Group, Inc. | | | 6,784 | | | | 440,349 | |
BorgWarner, Inc. | | | 11,632 | | | | 426,662 | |
Brinker International, Inc. | | | 8,573 | | | | 365,810 | |
General Motors Co. | | | 8,658 | | | | 324,502 | |
Lear Corp. | | | 2,746 | | | | 323,753 | |
Walgreens Boots Alliance, Inc. | | | 5,599 | | | | 309,681 | |
PACCAR, Inc. | | | 3,332 | | | | 233,273 | |
Lions Gate Entertainment Corp. — Class A* | | | 19,914 | | | | 184,204 | |
Total Consumer, Cyclical | | | | | | | 7,219,500 | |
| | | | | | | | | |
Technology - 0.8% |
Skyworks Solutions, Inc. | | | 3,672 | | | | 291,006 | |
Diodes, Inc.* | | | 6,190 | | | | 248,528 | |
Oracle Corp.1 | | | 3,960 | | | | 217,919 | |
Total Technology | | | | | | | 757,453 | |
| | | | | | | | | |
Basic Materials - 0.5% |
Westlake Chemical Corp. | | | 3,378 | | | | 221,327 | |
Domtar Corp. | | | 5,576 | | | | 199,676 | |
Total Basic Materials | | | | | | | 421,003 | |
| | | | | | | | | |
Total Common Stocks | | | | | | | | |
(Cost $83,769,680) | | | | | | | 85,606,026 | |
| | | | | | | | | |
MONEY MARKET FUND† - 6.6% |
Goldman Sachs Financial Square Treasury Instruments Fund — Institutional Shares 1.79%2 | | | 5,866,464 | | | | 5,866,464 | |
Total Money Market Fund | | | | | | | | |
(Cost $5,866,464) | | | | | | | 5,866,464 | |
| | | | | | | | | |
Total Investments - 102.5% | | | | | | | | |
(Cost $89,636,144) | | | | | | $ | 91,472,490 | |
Other Assets & Liabilities, net - (2.5)% | | | | | | | (2,222,028 | ) |
Total Net Assets - 100.0% | | | | | | $ | 89,250,462 | |
14 | THE GUGGENHEIM FUNDS ANNUAL REPORT | SEE NOTES TO FINANCIAL STATEMENTS. |
SCHEDULE OF INVESTMENTS (continued) | September 30, 2019 |
ALPHA OPPORTUNITY FUND | |
Custom Basket Swap Agreements | | | | |
Counterparty | Reference Obligation | Financing Rate
Pay (Receive) | | Payment
Frequency | | | Maturity
Date | | | Notional
Amount | | | Value and
Unrealized
Appreciation
(Depreciation) | |
OTC Custom Basket Swap Agreements†† | | | | | | | | |
Goldman Sachs International | GS Equity Custom Basket | 2.28% (Federal Funds Rate + 0.45%) | At Maturity | | | 05/06/24 | | | $ | 7,581,749 | | | $ | 208,633 | |
Morgan Stanley Capital Services LLC | MS Equity Custom Basket | 2.25% (Federal Funds Rate + 0.40%) | At Maturity | | | 02/01/24 | | | | 7,581,719 | | | | 187,779 | |
| | | | | | | | | | | | | $ | 15,163,468 | | | $ | 396,412 | |
| | | | | | | | | | | | | | | | | | | |
OTC Custom Basket Swap Agreements Sold Short†† | | | | | | | | | | | | | | | | |
Morgan Stanley Capital Services LLC | MS Equity Custom Basket | (1.55)% (Federal Funds Rate - 0.30%) | At Maturity | | | 02/01/24 | | | $ | 40,857,931 | | | $ | (1,869,155 | ) |
Goldman Sachs International | GS Equity Custom Basket | (1.63)% (Federal Funds Rate - 0.20%) | At Maturity | | | 05/06/24 | | | | 39,316,842 | | | | (794,924 | ) |
| | | | | | | | | | | | | $ | 80,174,773 | | | $ | (2,664,079 | ) |
| | Shares | | | Percentage
Notional
Amount | | | Value and
Unrealized
Appreciation
(Depreciation) | |
MS EQUITY LONG CUSTOM BASKET | | | | | | | | |
Communications | | | | | | | | | | | | |
TEGNA, Inc. | | | 1,700 | | | | 0.36 | % | | $ | 6,814 | |
Omnicom Group, Inc. | | | 957 | | | | 1.00 | % | | | 5,205 | |
Verizon Communications, Inc. | | | 1,419 | | | | 1.14 | % | | | 4,450 | |
News Corp. — Class A | | | 1,830 | | | | 0.34 | % | | | 2,945 | |
ATN International, Inc. | | | 479 | | | | 0.37 | % | | | 1,695 | |
Alphabet, Inc. — Class C | | | 16 | | | | 0.26 | % | | | 1,374 | |
Facebook, Inc. — Class A | | | 93 | | | | 0.22 | % | | | 1,136 | |
John Wiley & Sons, Inc. — Class A | | | 978 | | | | 0.57 | % | | | (512 | ) |
Scholastic Corp. | | | 1,210 | | | | 0.60 | % | | | (571 | ) |
Discovery, Inc. — Class A | | | 1,784 | | | | 0.63 | % | | | (2,179 | ) |
Cogent Communications Holdings, Inc. | | | 997 | | | | 0.72 | % | | | (3,225 | ) |
AMC Networks, Inc. — Class A | | | 1,107 | | | | 0.72 | % | | | (7,810 | ) |
Meredith Corp. | | | 657 | | | | 0.32 | % | | | (13,532 | ) |
Shenandoah Telecommunications Co. | | | 1,551 | | | | 0.65 | % | | | (22,195 | ) |
Total Communications | | | | | | | | | | | (26,405 | ) |
| | | | | | | | | | | | | |
Consumer, Cyclical | | | | | | | | | | | | |
World Fuel Services Corp. | | | 1,548 | | | | 0.82 | % | | | 16,659 | |
Delta Air Lines, Inc. | | | 1,138 | | | | 0.86 | % | | | 8,734 | |
United Airlines Holdings, Inc. | | | 612 | | | | 0.71 | % | | | 6,047 | |
Alaska Air Group, Inc. | | | 552 | | | | 0.47 | % | | | 5,476 | |
Toll Brothers, Inc. | | | 894 | | | | 0.48 | % | | | 4,744 | |
Southwest Airlines Co. | | | 1,105 | | | | 0.79 | % | | | 4,619 | |
Allison Transmission Holdings, Inc. | | | 1,248 | | | | 0.77 | % | | | 2,747 | |
JetBlue Airways Corp. | | | 3,123 | | | | 0.69 | % | | | 2,134 | |
Brinker International, Inc. | | | 697 | | | | 0.39 | % | | | 1,614 | |
PACCAR, Inc. | | | 271 | | | | 0.25 | % | | | 1,270 | |
General Motors Co. | | | 704 | | | | 0.35 | % | | | (1,727 | ) |
Walgreens Boots Alliance, Inc. | | | 455 | | | | 0.33 | % | | | (3,132 | ) |
Lear Corp. | | | 223 | | | | 0.35 | % | | | (3,329 | ) |
BorgWarner, Inc. | | | 946 | | | | 0.46 | % | | | (3,643 | ) |
Lions Gate Entertainment Corp. — Class A | | | 8,752 | | | | 1.07 | % | | | (8,178 | ) |
Total Consumer, Cyclical | | | | | | | | | | | 34,035 | |
| | | | | | | | | | | | | |
Consumer, Non-cyclical | | | | | | | | | | | | |
Pilgrim’s Pride Corp. | | | 2,045 | | | | 0.86 | % | | | 22,473 | |
Tyson Foods, Inc. — Class A | | | 862 | | | | 0.98 | % | | | 21,295 | |
Kimberly-Clark Corp. | | | 425 | | | | 0.80 | % | | | 12,586 | |
McKesson Corp. | | | 1,308 | | | | 2.36 | % | | | 12,321 | |
CVS Health Corp. | | | 1,105 | | | | 0.92 | % | | | 11,049 | |
Zimmer Biomet Holdings, Inc. | | | 514 | | | | 0.93 | % | | | 9,667 | |
Sysco Corp. | | | 618 | | | | 0.65 | % | | | 8,504 | |
Molson Coors Brewing Co. — Class B | | | 3,732 | | | | 2.83 | % | | | 8,117 | |
Medtronic plc | | | 378 | | | | 0.54 | % | | | 6,940 | |
Merck & Company, Inc. | | | 944 | | | | 1.05 | % | | | 6,539 | |
Hologic, Inc. | | | 919 | | | | 0.61 | % | | | 5,181 | |
Colgate-Palmolive Co. | | | 659 | | | | 0.64 | % | | | 4,815 | |
Baxter International, Inc. | | | 555 | | | | 0.64 | % | | | 4,754 | |
US Foods Holding Corp. | | | 657 | | | | 0.36 | % | | | 4,406 | |
Hill-Rom Holdings, Inc. | | | 463 | | | | 0.64 | % | | | 4,096 | |
Cardinal Health, Inc. | | | 1,657 | | | | 1.03 | % | | | 3,741 | |
General Mills, Inc. | | | 764 | | | | 0.56 | % | | | 3,622 | |
Central Garden & Pet Co. — Class A | | | 814 | | | | 0.30 | % | | | 3,464 | |
SEE NOTES TO FINANCIAL STATEMENTS. | THE GUGGENHEIM FUNDS ANNUAL REPORT | 15 |
SCHEDULE OF INVESTMENTS (continued) | September 30, 2019 |
ALPHA OPPORTUNITY FUND | |
| | Shares | | | Percentage
Notional
Amount | | | Value and
Unrealized
Appreciation
(Depreciation) | |
AMERCO | | | 124 | | | | 0.64 | % | | $ | 3,390 | |
Kellogg Co. | | | 413 | | | | 0.35 | % | | | 3,352 | |
PepsiCo, Inc. | | | 460 | | | | 0.83 | % | | | 3,314 | |
Campbell Soup Co. | | | 573 | | | | 0.35 | % | | | 3,281 | |
Amgen, Inc. | | | 452 | | | | 1.15 | % | | | 2,966 | |
Kroger Co. | | | 1,765 | | | | 0.60 | % | | | 2,570 | |
Becton Dickinson and Co. | | | 223 | | | | 0.74 | % | | | 2,424 | |
Eli Lilly & Co. | | | 381 | | | | 0.56 | % | | | 2,001 | |
Hormel Foods Corp. | | | 835 | | | | 0.48 | % | | | 1,959 | |
Lamb Weston Holdings, Inc. | | | 395 | | | | 0.38 | % | | | 1,768 | |
Biogen, Inc. | | | 141 | | | | 0.43 | % | | | 1,567 | |
ManpowerGroup, Inc. | | | 347 | | | | 0.39 | % | | | 763 | |
Philip Morris International, Inc. | | | 607 | | | | 0.61 | % | | | 99 | |
Jazz Pharmaceuticals plc | | | 251 | | | | 0.42 | % | | | (207 | ) |
Thermo Fisher Scientific, Inc. | | | 144 | | | | 0.55 | % | | | (227 | ) |
JM Smucker Co. | | | 298 | | | | 0.43 | % | | | (250 | ) |
STERIS plc | | | 196 | | | | 0.37 | % | | | (547 | ) |
Gilead Sciences, Inc. | | | 1,208 | | | | 1.01 | % | | | (680 | ) |
AmerisourceBergen Corp. — Class A | | | 1,383 | | | | 1.50 | % | | | (1,035 | ) |
Post Holdings, Inc. | | | 396 | | | | 0.55 | % | | | (1,299 | ) |
Regeneron Pharmaceuticals, Inc. | | | 89 | | | | 0.33 | % | | | (1,619 | ) |
TrueBlue, Inc. | | | 1,112 | | | | 0.31 | % | | | (1,916 | ) |
Johnson & Johnson | | | 264 | | | | 0.45 | % | | | (2,188 | ) |
Kraft Heinz Co. | | | 659 | | | | 0.24 | % | | | (3,052 | ) |
B&G Foods, Inc. | | | 972 | | | | 0.24 | % | | | (3,178 | ) |
Integer Holdings Corp. | | | 395 | | | | 0.39 | % | | | (3,284 | ) |
Archer-Daniels-Midland Co. | | | 2,332 | | | | 1.26 | % | | | (3,311 | ) |
Darling Ingredients, Inc. | | | 2,366 | | | | 0.60 | % | | | (4,016 | ) |
Innoviva, Inc. | | | 1,891 | | | | 0.26 | % | | | (5,957 | ) |
Cal-Maine Foods, Inc. | | | 1,514 | | | | 0.80 | % | | | (6,157 | ) |
Alexion Pharmaceuticals, Inc. | | | 218 | | | | 0.28 | % | | | (6,160 | ) |
H&R Block, Inc. | | | 1,999 | | | | 0.62 | % | | | (8,788 | ) |
Pfizer, Inc. | | | 1,790 | | | | 0.85 | % | | | (10,901 | ) |
Ingredion, Inc. | | | 989 | | | | 1.07 | % | | | (11,057 | ) |
Herbalife Nutrition Ltd. | | | 1,266 | | | | 0.63 | % | | | (17,468 | ) |
Total Consumer, Non-cyclical | | | | | | | | | | | 89,727 | |
| | | | | | | | | | | | | |
Financial | | | | | | | | | | | | |
HCP, Inc. | | | 2,057 | | | | 0.97 | % | | | 7,580 | |
Medical Properties Trust, Inc. | | | 4,397 | | | | 1.13 | % | | | 7,251 | |
Deluxe Corp. | | | 763 | | | | 0.49 | % | | | 6,497 | |
Hartford Financial Services Group, Inc. | | | 668 | | | | 0.53 | % | | | 6,043 | |
Equity Commonwealth | | | 2,821 | | | | 1.27 | % | | | 5,478 | |
JPMorgan Chase & Co. | | | 190 | | | | 0.29 | % | | | 3,441 | |
Apartment Investment & Management Co. — Class A | | | 1,835 | | | | 1.26 | % | | | 3,289 | |
Northern Trust Corp. | | | 319 | | | | 0.39 | % | | | 1,277 | |
Summit Hotel Properties, Inc. | | | 2,538 | | | | 0.39 | % | | | 612 | |
State Street Corp. | | | 332 | | | | 0.26 | % | | | 112 | |
Bank of New York Mellon Corp. | | | 417 | | | | 0.25 | % | | | 35 | |
Citigroup, Inc. | | | 261 | | | | 0.24 | % | | | (458 | ) |
Principal Financial Group, Inc. | | | 366 | | | | 0.28 | % | | | (707 | ) |
Comerica, Inc. | | | 270 | | | | 0.23 | % | | | (1,113 | ) |
Host Hotels & Resorts, Inc. | | | 1,943 | | | | 0.44 | % | | | (1,543 | ) |
Total Financial | | | | | | | | | | | 37,794 | |
| | | | | | | | | | | | | |
Industrial | | | | | | | | | | | | |
Saia, Inc. | | | 656 | | | | 0.81 | % | | | 21,672 | |
United Parcel Service, Inc. — Class B | | | 650 | | | | 1.03 | % | | | 7,134 | |
Knight-Swift Transportation Holdings, Inc. | | | 1,230 | | | | 0.59 | % | | | 6,052 | |
Kansas City Southern | | | 332 | | | | 0.58 | % | | | 5,885 | |
J.B. Hunt Transport Services, Inc. | | | 464 | | | | 0.68 | % | | | 5,731 | |
Marten Transport Ltd. | | | 1,439 | | | | 0.39 | % | | | 5,690 | |
Old Dominion Freight Line, Inc. | | | 212 | | | | 0.48 | % | | | 5,668 | |
Heartland Express, Inc. | | | 2,406 | | | | 0.68 | % | | | 5,628 | |
Cummins, Inc. | | | 316 | | | | 0.68 | % | | | 4,476 | |
Landstar System, Inc. | | | 518 | | | | 0.77 | % | | | 4,202 | |
Agilent Technologies, Inc. | | | 394 | | | | 0.40 | % | | | 3,469 | |
Schneider National, Inc. — Class B | | | 2,704 | | | | 0.77 | % | | | 2,854 | |
Werner Enterprises, Inc. | | | 1,303 | | | | 0.61 | % | | | 2,740 | |
Echo Global Logistics, Inc. | | | 1,452 | | | | 0.43 | % | | | 2,448 | |
Parker-Hannifin Corp. | | | 113 | | | | 0.27 | % | | | 1,797 | |
Avnet, Inc. | | | 433 | | | | 0.25 | % | | | 821 | |
Oshkosh Corp. | | | 231 | | | | 0.23 | % | | | 707 | |
Forward Air Corp. | | | 528 | | | | 0.44 | % | | | 418 | |
Caterpillar, Inc. | | | 138 | | | | 0.23 | % | | | 229 | |
Textron, Inc. | | | 383 | | | | 0.25 | % | | | (473 | ) |
Norfolk Southern Corp. | | | 219 | | | | 0.52 | % | | | (604 | ) |
CSX Corp. | | | 923 | | | | 0.84 | % | | | (1,368 | ) |
Vishay Intertechnology, Inc. | | | 1,184 | | | | 0.26 | % | | | (1,693 | ) |
Union Pacific Corp. | | | 155 | | | | 0.33 | % | | | (1,747 | ) |
Waters Corp. | | | 139 | | | | 0.41 | % | | | (3,634 | ) |
Kennametal, Inc. | | | 1,031 | | | | 0.42 | % | | | (4,591 | ) |
FedEx Corp. | | | 473 | | | | 0.91 | % | | | (14,436 | ) |
Total Industrial | | | | | | | | | | | 59,075 | |
| | | | | | | | | | | | | |
16 | THE GUGGENHEIM FUNDS ANNUAL REPORT | SEE NOTES TO FINANCIAL STATEMENTS. |
SCHEDULE OF INVESTMENTS (continued) | September 30, 2019 |
ALPHA OPPORTUNITY FUND | |
| | Shares | | | Percentage
Notional
Amount | | | Value and
Unrealized
Appreciation
(Depreciation) | |
Energy | | | | | | | | | | | | |
Kinder Morgan, Inc. | | | 4,244 | | | | 1.15 | % | | $ | 9,491 | |
ONEOK, Inc. | | | 1,335 | | | | 1.30 | % | | | 8,046 | |
Marathon Petroleum Corp. | | | 1,047 | | | | 0.84 | % | | | 7,053 | |
Delek US Holdings, Inc. | | | 1,528 | | | | 0.73 | % | | | 5,283 | |
HollyFrontier Corp. | | | 1,356 | | | | 0.96 | % | | | 3,958 | |
Phillips 66 | | | 735 | | | | 0.99 | % | | | 3,771 | |
Valero Energy Corp. | | | 835 | | | | 0.94 | % | | | 446 | |
Targa Resources Corp. | | | 796 | | | | 0.42 | % | | | (1,163 | ) |
Chevron Corp. | | | 751 | | | | 1.17 | % | | | (3,147 | ) |
Williams Companies, Inc. | | | 2,400 | | | | 0.76 | % | | | (7,576 | ) |
Exxon Mobil Corp. | | | 1,251 | | | | 1.17 | % | | | (10,226 | ) |
PBF Energy, Inc. — Class A | | | 1,720 | | | | 0.62 | % | | | (12,860 | ) |
Renewable Energy Group, Inc. | | | 1,776 | | | | 0.35 | % | | | (13,581 | ) |
Unit Corp. | | | 15,274 | | | | 0.68 | % | | | (24,494 | ) |
Total Energy | | | | | | | | | | | (34,999 | ) |
| | | | | | | | | | | | | |
Technology | | | | | | | | | | | | |
Diodes, Inc. | | | 503 | | | | 0.27 | % | | | 3,164 | |
Skyworks Solutions, Inc. | | | 333 | | | | 0.35 | % | | | 1,181 | |
Oracle Corp. | | | 322 | | | | 0.23 | % | | | 715 | |
Total Technology | | | | | | | | | | | 5,060 | |
| | | | | | | | | | | | | |
Utilities | | | | | | | | | | | | |
FirstEnergy Corp. | | | 1,598 | | | | 1.02 | % | | | 15,506 | |
Portland General Electric Co. | | | 1,438 | | | | 1.07 | % | | | 12,181 | |
Pinnacle West Capital Corp. | | | 853 | | | | 1.09 | % | | | 8,262 | |
Ameren Corp. | | | 989 | | | | 1.04 | % | | | 5,826 | |
Southern Co. | | | 523 | | | | 0.43 | % | | | 3,959 | |
Avista Corp. | | | 858 | | | | 0.55 | % | | | 2,338 | |
OGE Energy Corp. | | | 794 | | | | 0.48 | % | | | 1,960 | |
Public Service Enterprise Group, Inc. | | | 480 | | | | 0.39 | % | | | 1,188 | |
PPL Corp. | | | 2,306 | | | | 0.96 | % | | | 758 | |
AES Corp. | | | 2,316 | | | | 0.50 | % | | | (1,538 | ) |
Exelon Corp. | | | 1,061 | | | | 0.68 | % | | | (2,355 | ) |
National Fuel Gas Co. | | | 1,465 | | | | 0.91 | % | | | (19,392 | ) |
Total Utilities | | | | | | | | | | | 28,693 | |
| | | | | | | | | | | | | |
Basic Materials | | | | | | | | | | | | |
Westlake Chemical Corp. | | | 274 | | | | 0.24 | % | | | (356 | ) |
Domtar Corp. | | | 2,058 | | | | 0.97 | % | | | (4,845 | ) |
Total Basic Materials | | | | | | | | | | | (5,201 | ) |
Total MS Equity Long Custom Basket | | | | | | $ | 187,779 | |
| | | | | | | | | |
MS EQUITY SHORT CUSTOM BASKET | | | | | | | | |
Financial | | | | | | | | | | | | |
CNO Financial Group, Inc. | | | 9,237 | | | | (0.37 | )% | | $ | 18,854 | |
Hudson Pacific Properties, Inc. | | | 17,873 | | | | (1.47 | )% | | | 18,221 | |
People’s United Financial, Inc. | | | 14,317 | | | | (0.56 | )% | | | 14,476 | |
CVB Financial Corp. | | | 9,589 | | | | (0.50 | )% | | | 12,496 | |
Signature Bank | | | 1,238 | | | | (0.37 | )% | | | 10,733 | |
Ares Management Corp. — Class A | | | 6,793 | | | | (0.45 | )% | | | 8,768 | |
WesBanco, Inc. | | | 3,649 | | | | (0.33 | )% | | | 8,590 | |
First Republic Bank | | | 3,164 | | | | (0.75 | )% | | | 8,517 | |
Glacier Bancorp, Inc. | | | 5,020 | | | | (0.50 | )% | | | 4,826 | |
Mastercard, Inc. — Class A | | | 474 | | | | (0.32 | )% | | | 4,704 | |
BankUnited, Inc. | | | 4,429 | | | | (0.36 | )% | | | 3,137 | |
BOK Financial Corp. | | | 4,393 | | | | (0.85 | )% | | | 1,373 | |
Federal Realty Investment Trust | | | 1,395 | | | | (0.46 | )% | | | (1,943 | ) |
American Campus Communities, Inc. | | | 3,131 | | | | (0.37 | )% | | | (2,004 | ) |
CME Group, Inc. — Class A | | | 702 | | | | (0.36 | )% | | | (4,496 | ) |
Columbia Financial, Inc. | | | 9,172 | | | | (0.35 | )% | | | (6,103 | ) |
Healthcare Realty Trust, Inc. | | | 4,541 | | | | (0.37 | )% | | | (6,708 | ) |
Douglas Emmett, Inc. | | | 4,550 | | | | (0.48 | )% | | | (9,282 | ) |
Pebblebrook Hotel Trust | | | 9,624 | | | | (0.66 | )% | | | (11,144 | ) |
New York Community Bancorp, Inc. | | | 16,282 | | | | (0.50 | )% | | | (11,979 | ) |
Digital Realty Trust, Inc. | | | 1,169 | | | | (0.37 | )% | | | (14,403 | ) |
Liberty Property Trust | | | 8,703 | | | | (1.09 | )% | | | (14,727 | ) |
Capitol Federal Financial, Inc. | | | 31,880 | | | | (1.08 | )% | | | (14,984 | ) |
Intercontinental Exchange, Inc. | | | 1,465 | | | | (0.33 | )% | | | (16,214 | ) |
Valley National Bancorp | | | 27,327 | | | | (0.73 | )% | | | (16,297 | ) |
Old National Bancorp | | | 21,827 | | | | (0.92 | )% | | | (18,265 | ) |
CubeSmart | | | 6,599 | | | | (0.56 | )% | | | (18,361 | ) |
Assurant, Inc. | | | 1,278 | | | | (0.39 | )% | | | (18,414 | ) |
Alexandria Real Estate Equities, Inc. | | | 1,743 | | | | (0.66 | )% | | | (19,332 | ) |
Essex Property Trust, Inc. | | | 553 | | | | (0.44 | )% | | | (19,421 | ) |
WP Carey, Inc. | | | 2,794 | | | | (0.61 | )% | | | (22,422 | ) |
First Financial Bankshares, Inc. | | | 10,547 | | | | (0.86 | )% | | | (23,252 | ) |
UDR, Inc. | | | 7,849 | | | | (0.93 | )% | | | (24,724 | ) |
Realty Income Corp. | | | 7,825 | | | | (1.47 | )% | | | (25,275 | ) |
Extra Space Storage, Inc. | | | 1,845 | | | | (0.53 | )% | | | (27,677 | ) |
American Tower Corp. — Class A | | | 1,371 | | | | (0.74 | )% | | | (28,564 | ) |
STORE Capital Corp. | | | 8,682 | | | | (0.79 | )% | | | (28,853 | ) |
Equity Residential | | | 3,448 | | | | (0.73 | )% | | | (32,404 | ) |
American Homes 4 Rent — Class A | | | 10,463 | | | | (0.66 | )% | | | (34,681 | ) |
Axis Capital Holdings Ltd. | | | 3,738 | | | | (0.61 | )% | | | (35,820 | ) |
Camden Property Trust | | | 3,400 | | | | (0.92 | )% | | | (38,655 | ) |
First Industrial Realty Trust, Inc. | | | 6,851 | | | | (0.66 | )% | | | (40,792 | ) |
Washington Federal, Inc. | | | 5,338 | | | | (0.48 | )% | | | (41,103 | ) |
Agree Realty Corp. | | | 7,234 | | | | (1.30 | )% | | | (50,726 | ) |
SEE NOTES TO FINANCIAL STATEMENTS. | THE GUGGENHEIM FUNDS ANNUAL REPORT | 17 |
SCHEDULE OF INVESTMENTS (continued) | September 30, 2019 |
ALPHA OPPORTUNITY FUND | |
| | Shares | | | Percentage
Notional
Amount | | | Value and
Unrealized
Appreciation
(Depreciation) | |
Crown Castle International Corp. | | | 4,161 | | | | (1.42 | )% | | $ | (52,844 | ) |
EastGroup Properties, Inc. | | | 4,078 | | | | (1.25 | )% | | | (55,626 | ) |
Invitation Homes, Inc. | | | 10,225 | | | | (0.74 | )% | | | (55,742 | ) |
Welltower, Inc. | | | 6,197 | | | | (1.37 | )% | | | (57,997 | ) |
Everest Re Group Ltd. | | | 1,317 | | | | (0.86 | )% | | | (65,894 | ) |
Equity LifeStyle Properties, Inc. | | | 2,605 | | | | (0.85 | )% | | | (72,726 | ) |
SBA Communications Corp. | | | 2,310 | | | | (1.36 | )% | | | (80,722 | ) |
Equinix, Inc. | | | 701 | | | | (0.99 | )% | | | (89,273 | ) |
RLI Corp. | | | 5,153 | | | | (1.17 | )% | | | (98,772 | ) |
Terreno Realty Corp. | | | 10,111 | | | | (1.26 | )% | | | (108,894 | ) |
Americold Realty Trust | | | 14,119 | | | | (1.28 | )% | | | (109,095 | ) |
Rexford Industrial Realty, Inc. | | | 14,780 | | | | (1.59 | )% | | | (133,446 | ) |
Sun Communities, Inc. | | | 4,662 | | | | (1.69 | )% | | | (141,119 | ) |
Total Financial | | | | | | | | | | | (1,686,480 | ) |
| | | | | | | | | | | | | |
Industrial | | | | | | | | | | | | |
Fortive Corp. | | | 7,125 | | | | (1.20 | )% | | | 93,528 | |
Roper Technologies, Inc. | | | 1,182 | | | | (1.03 | )% | | | 20,369 | |
Alarm.com Holdings, Inc. | | | 852 | | | | (0.10 | )% | | | 12,311 | |
HEICO Corp. | | | 485 | | | | (0.15 | )% | | | 5,650 | |
Universal Display Corp. | | | 216 | | | | (0.09 | )% | | | 2,039 | |
Casella Waste Systems, Inc. — Class A | | | 2,912 | | | | (0.31 | )% | | | 608 | |
Exponent, Inc. | | | 3,144 | | | | (0.54 | )% | | | (1,654 | ) |
Boeing Co. | | | 371 | | | | (0.35 | )% | | | (2,893 | ) |
AMETEK, Inc. | | | 4,989 | | | | (1.12 | )% | | | (14,554 | ) |
AptarGroup, Inc. | | | 2,406 | | | | (0.70 | )% | | | (31,110 | ) |
Woodward, Inc. | | | 2,568 | | | | (0.68 | )% | | | (33,906 | ) |
Vulcan Materials Co. | | | 1,805 | | | | (0.67 | )% | | | (57,330 | ) |
Ball Corp. | | | 5,260 | | | | (0.94 | )% | | | (69,588 | ) |
Martin Marietta Materials, Inc. | | | 1,285 | | | | (0.86 | )% | | | (89,332 | ) |
TransDigm Group, Inc. | | | 1,352 | | | | (1.72 | )% | | | (96,011 | ) |
Total Industrial | | | | | | | | | | | (261,873 | ) |
| | | | | | | | | | | | | |
Utilities | | | | | | | | | | | | |
California Water Service Group | | | 2,389 | | | | (0.31 | )% | | | (11 | ) |
South Jersey Industries, Inc. | | | 12,485 | | | | (1.01 | )% | | | (9,114 | ) |
WEC Energy Group, Inc. | | | 2,217 | | | | (0.52 | )% | | | (13,068 | ) |
Atmos Energy Corp. | | | 1,235 | | | | (0.34 | )% | | | (13,523 | ) |
American States Water Co. | | | 2,398 | | | | (0.53 | )% | | | (15,261 | ) |
American Water Works Company, Inc. | | | 2,331 | | | | (0.71 | )% | | | (20,335 | ) |
NextEra Energy, Inc. | | | 1,428 | | | | (0.81 | )% | | | (54,696 | ) |
Dominion Energy, Inc. | | | 14,738 | | | | (2.92 | )% | | | (62,868 | ) |
Total Utilities | | | | | | | | | | | (188,876 | ) |
| | | | | | | | | | | | | |
Technology | | | | | | | | | | | | |
PTC, Inc. | | | 4,933 | | | | (0.82 | )% | | | 104,215 | |
Autodesk, Inc. | | | 2,310 | | | | (0.84 | )% | | | 58,406 | |
Workday, Inc. — Class A | | | 1,313 | | | | (0.55 | )% | | | 54,907 | |
ServiceNow, Inc. | | | 991 | | | | (0.62 | )% | | | 33,230 | |
EPAM Systems, Inc. | | | 1,170 | | | | (0.52 | )% | | | 14,791 | |
Appian Corp. | | | 1,630 | | | | (0.19 | )% | | | 12,752 | |
Fair Isaac Corp. | | | 838 | | | | (0.62 | )% | | | 12,526 | |
Everbridge, Inc. | | | 456 | | | | (0.07 | )% | | | 11,554 | |
MongoDB, Inc. | | | 274 | | | | (0.08 | )% | | | 10,166 | |
Twilio, Inc. — Class A | | | 306 | | | | (0.08 | )% | | | 8,287 | |
salesforce.com, Inc. | | | 607 | | | | (0.22 | )% | | | 6,127 | |
Qualys, Inc. | | | 506 | | | | (0.09 | )% | | | 5,975 | |
MSCI, Inc. — Class A | | | 273 | | | | (0.15 | )% | | | 5,918 | |
PROS Holdings, Inc. | | | 667 | | | | (0.10 | )% | | | 4,796 | |
HubSpot, Inc. | | | 246 | | | | (0.09 | )% | | | 4,646 | |
Blackline, Inc. | | | 910 | | | | (0.11 | )% | | | 4,639 | |
Coupa Software, Inc. | | | 604 | | | | (0.19 | )% | | | 3,865 | |
Adobe, Inc. | | | 216 | | | | (0.15 | )% | | | 2,981 | |
Intuit, Inc. | | | 158 | | | | (0.10 | )% | | | 2,253 | |
Appfolio, Inc. — Class A | | | 415 | | | | (0.10 | )% | | | 2,122 | |
Paycom Software, Inc. | | | 185 | | | | (0.09 | )% | | | 1,726 | |
Alteryx, Inc. — Class A | | | 469 | | | | (0.12 | )% | | | 1,706 | |
Accenture plc — Class A | | | 464 | | | | (0.22 | )% | | | 1,139 | |
Veeva Systems, Inc. — Class A | | | 258 | | | | (0.10 | )% | | | 1,052 | |
Atlassian Corporation plc — Class A | | | 328 | | | | (0.10 | )% | | | 19 | |
Aspen Technology, Inc. | | | 331 | | | | (0.10 | )% | | | (986 | ) |
ANSYS, Inc. | | | 215 | | | | (0.12 | )% | | | (2,073 | ) |
Synopsys, Inc. | | | 2,372 | | | | (0.80 | )% | | | (3,583 | ) |
Elastic N.V. | | | 457 | | | | (0.09 | )% | | | (3,592 | ) |
Advanced Micro Devices, Inc. | | | 2,028 | | | | (0.14 | )% | | | (3,625 | ) |
Five9, Inc. | | | 922 | | | | (0.12 | )% | | | (5,134 | ) |
DocuSign, Inc. | | | 841 | | | | (0.13 | )% | | | (6,205 | ) |
Tyler Technologies, Inc. | | | 351 | | | | (0.23 | )% | | | (10,208 | ) |
Monolithic Power Systems, Inc. | | | 459 | | | | (0.17 | )% | | | (10,379 | ) |
Pegasystems, Inc. | | | 5,830 | | | | (0.97 | )% | | | (22,081 | ) |
Guidewire Software, Inc. | | | 4,493 | | | | (1.16 | )% | | | (46,731 | ) |
Total Technology | | | | | | | | | | | 255,201 | |
| | | | | | | | | | | | | |
Consumer, Non-cyclical | | | | | | | | | | | | |
Guardant Health, Inc. | | | 1,415 | | | | (0.22 | )% | | | 30,488 | |
Rollins, Inc. | | | 5,731 | | | | (0.48 | )% | | | 19,757 | |
Chegg, Inc. | | | 1,019 | | | | (0.07 | )% | | | 6,982 | |
PayPal Holdings, Inc. | | | 559 | | | | (0.14 | )% | | | 5,318 | |
Avalara, Inc. | | | 954 | | | | (0.16 | )% | | | 3,290 | |
IDEXX Laboratories, Inc. | | | 154 | | | | (0.10 | )% | | | 2,678 | |
Intuitive Surgical, Inc. | | | 84 | | | | (0.11 | )% | | | (684 | ) |
Verisk Analytics, Inc. — Class A | | | 1,146 | | | | (0.44 | )% | | | (1,958 | ) |
Paylocity Holding Corp. | | | 423 | | | | (0.10 | )% | | | (2,398 | ) |
S&P Global, Inc. | | | 671 | | | | (0.40 | )% | | | (3,200 | ) |
CoStar Group, Inc. | | | 181 | | | | (0.26 | )% | | | (6,339 | ) |
Avery Dennison Corp. | | | 1,672 | | | | (0.46 | )% | | | (6,647 | ) |
18 | THE GUGGENHEIM FUNDS ANNUAL REPORT | SEE NOTES TO FINANCIAL STATEMENTS. |
SCHEDULE OF INVESTMENTS (continued) | September 30, 2019 |
ALPHA OPPORTUNITY FUND | |
| | Shares | | | Percentage
Notional
Amount | | | Value and
Unrealized
Appreciation
(Depreciation) | |
Cintas Corp. | | | 257 | | | | (0.17 | )% | | $ | (10,727 | ) |
Bright Horizons Family Solutions, Inc. | | | 1,584 | | | | (0.59 | )% | | | (18,968 | ) |
MarketAxess Holdings, Inc. | | | 553 | | | | (0.44 | )% | | | (41,899 | ) |
IHS Markit Ltd. | | | 9,336 | | | | (1.53 | )% | | | (74,238 | ) |
TransUnion | | | 6,714 | | | | (1.33 | )% | | | (100,341 | ) |
Total Consumer, Non-cyclical | | | | | | | | | | | (198,886 | ) |
| | | | | | | | | | | | | |
Consumer, Cyclical | | | | | | | | | | | | |
Wingstop, Inc. | | | 3,000 | | | | (0.64 | )% | | | 19,660 | |
Planet Fitness, Inc. — Class A | | | 585 | | | | (0.08 | )% | | | 10,215 | |
Copart, Inc. | | | 1,443 | | | | (0.28 | )% | | | (1,132 | ) |
Toro Co. | | | 3,816 | | | | (0.68 | )% | | | (3,313 | ) |
Wyndham Hotels & Resorts, Inc. | | | 3,392 | | | | (0.43 | )% | | | (3,822 | ) |
McDonald’s Corp. | | | 866 | | | | (0.46 | )% | | | (10,797 | ) |
NIKE, Inc. — Class B | | | 1,021 | | | | (0.23 | )% | | | (11,076 | ) |
Fastenal Co. | | | 9,493 | | | | (0.76 | )% | | | (18,451 | ) |
Pool Corp. | | | 710 | | | | (0.35 | )% | | | (29,011 | ) |
Scotts Miracle-Gro Co. — Class A | | | 2,865 | | | | (0.71 | )% | | | (69,567 | ) |
Total Consumer, Cyclical | | | | | | | | | | | (117,294 | ) |
| | | | | | | | | | | | | |
Basic Materials | | | | | | | | | | | | |
Allegheny Technologies, Inc. | | | 14,270 | | | | (0.71 | )% | | | 66,855 | |
WR Grace & Co. | | | 6,218 | | | | (1.02 | )% | | | 58,760 | |
Southern Copper Corp. | | | 6,626 | | | | (0.55 | )% | | | 31,341 | |
International Flavors & Fragrances, Inc. | | | 1,797 | | | | (0.54 | )% | | | 25,923 | |
Kaiser Aluminum Corp. | | | 1,862 | | | | (0.45 | )% | | | 8,793 | |
Sensient Technologies Corp. | | | 2,274 | | | | (0.38 | )% | | | (8,504 | ) |
Linde plc | | | 2,091 | | | | (0.99 | )% | | | (11,047 | ) |
PPG Industries, Inc. | | | 1,144 | | | | (0.33 | )% | | | (11,628 | ) |
Compass Minerals International, Inc. | | | 4,478 | | | | (0.62 | )% | | | (14,673 | ) |
NewMarket Corp. | | | 418 | | | | (0.48 | )% | | | (16,795 | ) |
Air Products & Chemicals, Inc. | | | 739 | | | | (0.40 | )% | | | (25,281 | ) |
Balchem Corp. | | | 3,511 | | | | (0.85 | )% | | | (25,630 | ) |
Materion Corp. | | | 5,474 | | | | (0.82 | )% | | | (27,042 | ) |
RPM International, Inc. | | | 5,178 | | | | (0.87 | )% | | | (43,656 | ) |
Sherwin-Williams Co. | | | 860 | | | | (1.16 | )% | | | (94,607 | ) |
Total Basic Materials | | | | | | | | | | | (87,191 | ) |
| | | | | | | | | | | | | |
Communications | | | | | | | | | | | | |
FireEye, Inc. | | | 16,147 | | | | (0.53 | )% | | | 59,138 | |
Palo Alto Networks, Inc. | | | 1,489 | | | | (0.74 | )% | | | 55,681 | |
Okta, Inc. | | | 525 | | | | (0.13 | )% | | | 12,804 | |
Trade Desk, Inc. — Class A | | | 185 | | | | (0.08 | )% | | | 7,197 | |
Zendesk, Inc. | | | 485 | | | | (0.09 | )% | | | 6,779 | |
Amazon.com, Inc. | | | 98 | | | | (0.42 | )% | | | 4,814 | |
MercadoLibre, Inc. | | | 69 | | | | (0.09 | )% | | | 4,297 | |
VeriSign, Inc. | | | 208 | | | | (0.10 | )% | | | 4,033 | |
Charter Communications, Inc. — Class A | | | 431 | | | | (0.43 | )% | | | 1,954 | |
Q2 Holdings, Inc. | | | 552 | | | | (0.11 | )% | | | (2,285 | ) |
Proofpoint, Inc. | | | 2,104 | | | | (0.66 | )% | | | (25,772 | ) |
Total Communications | | | | | | | | | | | 128,640 | |
| | | | | | | | | | | | | |
Energy | | | | | | | | | | | | |
Core Laboratories N.V. | | | 4,939 | | | | (0.56 | )% | | | 104,164 | |
National Oilwell Varco, Inc. | | | 12,755 | | | | (0.66 | )% | | | 74,436 | |
Diamondback Energy, Inc. | | | 3,808 | | | | (0.84 | )% | | | 70,361 | |
Schlumberger Ltd. | | | 8,816 | | | | (0.74 | )% | | | 38,643 | |
Total Energy | | | | | | | | | | | 287,604 | |
Total MS Equity Short Custom Basket | | | | | | $ | (1,869,155 | ) |
| | | | | | | | | |
GS EQUITY LONG CUSTOM BASKET | | | | | | | | |
Consumer, Cyclical | | | | | | | | | | | | |
World Fuel Services Corp. | | | 1,549 | | | | 0.83 | % | | $ | 10,486 | |
Toll Brothers, Inc. | | | 894 | | | | 0.49 | % | | | 4,034 | |
Allison Transmission Holdings, Inc. | | | 1,248 | | | | 0.78 | % | | | 3,869 | |
Southwest Airlines Co. | | | 1,105 | | | | 0.79 | % | | | 3,790 | |
United Airlines Holdings, Inc. | | | 612 | | | | 0.71 | % | | | 3,452 | |
Delta Air Lines, Inc. | | | 1,138 | | | | 0.86 | % | | | 3,095 | |
Alaska Air Group, Inc. | | | 552 | | | | 0.47 | % | | | 2,291 | |
Brinker International, Inc. | | | 697 | | | | 0.39 | % | | | 1,922 | |
Walgreens Boots Alliance, Inc. | | | 455 | | | | 0.33 | % | | | 1,102 | |
PACCAR, Inc. | | | 271 | | | | 0.25 | % | | | 60 | |
General Motors Co. | | | 704 | | | | 0.35 | % | | | (1,544 | ) |
BorgWarner, Inc. | | | 946 | | | | 0.46 | % | | | (3,698 | ) |
Lear Corp. | | | 223 | | | | 0.35 | % | | | (4,177 | ) |
Lions Gate Entertainment Corp. — Class A | | | 8,752 | | | | 1.07 | % | | | (4,310 | ) |
JetBlue Airways Corp. | | | 3,123 | | | | 0.69 | % | | | (7,308 | ) |
Total Consumer, Cyclical | | | | | | | | | | | 13,064 | |
| | | | | | | | | | | | | |
Consumer, Non-cyclical | | | | | | | | | | | | |
Molson Coors Brewing Co. — Class B | | | 3,731 | | | | 2.83 | % | | | 14,088 | |
Pilgrim’s Pride Corp. | | | 2,045 | | | | 0.86 | % | | | 10,256 | |
CVS Health Corp. | | | 1,105 | | | | 0.92 | % | | | 10,056 | |
Zimmer Biomet Holdings, Inc. | | | 514 | | | | 0.93 | % | | | 8,630 | |
Amgen, Inc. | | | 452 | | | | 1.15 | % | | | 8,538 | |
Cardinal Health, Inc. | | | 1,658 | | | | 1.03 | % | | | 6,166 | |
Baxter International, Inc. | | | 555 | | | | 0.64 | % | | | 5,450 | |
Medtronic plc | | | 378 | | | | 0.54 | % | | | 4,181 | |
Sysco Corp. | | | 618 | | | | 0.65 | % | | | 4,104 | |
Becton Dickinson and Co. | | | 223 | | | | 0.74 | % | | | 3,555 | |
SEE NOTES TO FINANCIAL STATEMENTS. | THE GUGGENHEIM FUNDS ANNUAL REPORT | 19 |
SCHEDULE OF INVESTMENTS (continued) | September 30, 2019 |
ALPHA OPPORTUNITY FUND | |
| | Shares | | | Percentage
Notional
Amount | | | Value and
Unrealized
Appreciation
(Depreciation) | |
Tyson Foods, Inc. — Class A | | | 862 | | | | 0.98 | % | | $ | 3,301 | |
Kimberly-Clark Corp. | | | 425 | | | | 0.80 | % | | | 3,162 | |
Kellogg Co. | | | 413 | | | | 0.35 | % | | | 3,102 | |
Campbell Soup Co. | | | 573 | | | | 0.35 | % | | | 3,040 | |
McKesson Corp. | | | 1,308 | | | | 2.36 | % | | | 2,844 | |
US Foods Holding Corp. | | | 657 | | | | 0.36 | % | | | 2,838 | |
Hologic, Inc. | | | 919 | | | | 0.61 | % | | | 2,509 | |
General Mills, Inc. | | | 764 | | | | 0.56 | % | | | 2,101 | |
Archer-Daniels-Midland Co. | | | 2,332 | | | | 1.26 | % | | | 2,099 | |
Central Garden & Pet Co. — Class A | | | 814 | | | | 0.30 | % | | | 2,072 | |
Kroger Co. | | | 1,765 | | | | 0.60 | % | | | 1,977 | |
Hormel Foods Corp. | | | 835 | | | | 0.48 | % | | | 1,873 | |
PepsiCo, Inc. | | | 460 | | | | 0.83 | % | | | 1,794 | |
Eli Lilly & Co. | | | 381 | | | | 0.56 | % | | | 1,616 | |
Lamb Weston Holdings, Inc. | | | 395 | | | | 0.38 | % | | | 1,609 | |
Ingredion, Inc. | | | 989 | | | | 1.07 | % | | | 1,493 | |
Merck & Company, Inc. | | | 944 | | | | 1.05 | % | | | 1,133 | |
Hill-Rom Holdings, Inc. | | | 463 | | | | 0.64 | % | | | 699 | |
Biogen, Inc. | | | 141 | | | | 0.43 | % | | | 527 | |
Colgate-Palmolive Co. | | | 659 | | | | 0.64 | % | | | 119 | |
Post Holdings, Inc. | | | 396 | | | | 0.55 | % | | | 79 | |
Jazz Pharmaceuticals plc | | | 251 | | | | 0.42 | % | | | (103 | ) |
AMERCO | | | 124 | | | | 0.64 | % | | | (156 | ) |
Thermo Fisher Scientific, Inc. | | | 144 | | | | 0.55 | % | | | (186 | ) |
TrueBlue, Inc. | | | 1,112 | | | | 0.31 | % | | | (367 | ) |
STERIS plc | | | 196 | | | | 0.37 | % | | | (595 | ) |
Darling Ingredients, Inc. | | | 2,366 | | | | 0.60 | % | | | (733 | ) |
Integer Holdings Corp. | | | 395 | | | | 0.39 | % | | | (830 | ) |
Philip Morris International, Inc. | | | 607 | | | | 0.61 | % | | | (1,341 | ) |
Kraft Heinz Co. | | | 659 | | | | 0.24 | % | | | (1,519 | ) |
Cal-Maine Foods, Inc. | | | 1,514 | | | | 0.80 | % | | | (1,840 | ) |
Regeneron Pharmaceuticals, Inc. | | | 89 | | | | 0.33 | % | | | (1,878 | ) |
AmerisourceBergen Corp. — Class A | | | 1,383 | | | | 1.50 | % | | | (2,041 | ) |
Johnson & Johnson | | | 264 | | | | 0.45 | % | | | (2,746 | ) |
ManpowerGroup, Inc. | | | 347 | | | | 0.39 | % | | | (2,877 | ) |
Gilead Sciences, Inc. | | | 1,208 | | | | 1.01 | % | | | (3,286 | ) |
JM Smucker Co. | | | 298 | | | | 0.43 | % | | | (3,901 | ) |
B&G Foods, Inc. | | | 972 | | | | 0.24 | % | | | (3,946 | ) |
Alexion Pharmaceuticals, Inc. | | | 218 | | | | 0.28 | % | | | (4,186 | ) |
Innoviva, Inc. | | | 1,891 | | | | 0.26 | % | | | (6,392 | ) |
Herbalife Nutrition Ltd. | | | 1,266 | | | | 0.63 | % | | | (7,089 | ) |
H&R Block, Inc. | | | 1,999 | | | | 0.62 | % | | | (9,616 | ) |
Pfizer, Inc. | | | 1,790 | | | | 0.85 | % | | | (12,065 | ) |
Total Consumer, Non-cyclical | | | | | | | | | | | 47,318 | |
| | | | | | | | | | | | | |
Financial | | | | | | | | | | | | |
HCP, Inc. | | | 2,057 | | | | 0.97 | % | | | 8,434 | |
Medical Properties Trust, Inc. | | | 4,397 | | | | 1.13 | % | | | 6,771 | |
Deluxe Corp. | | | 763 | | | | 0.49 | % | | | 6,234 | |
Hartford Financial Services Group, Inc. | | | 668 | | | | 0.53 | % | | | 3,323 | |
Equity Commonwealth | | | 2,821 | | | | 1.27 | % | | | 1,862 | |
Apartment Investment & Management Co. — Class A | | | 1,835 | | | | 1.26 | % | | | 1,853 | |
Northern Trust Corp. | | | 319 | | | | 0.39 | % | | | 1,447 | |
JPMorgan Chase & Co. | | | 190 | | | | 0.29 | % | | | 1,332 | |
State Street Corp. | | | 332 | | | | 0.26 | % | | | (24 | ) |
Bank of New York Mellon Corp. | | | 417 | | | | 0.25 | % | | | (121 | ) |
Summit Hotel Properties, Inc. | | | 2,538 | | | | 0.39 | % | | | (319 | ) |
Citigroup, Inc. | | | 261 | | | | 0.24 | % | | | (606 | ) |
Principal Financial Group, Inc. | | | 366 | | | | 0.28 | % | | | (1,047 | ) |
Comerica, Inc. | | | 270 | | | | 0.23 | % | | | (1,063 | ) |
Host Hotels & Resorts, Inc. | | | 1,943 | | | | 0.44 | % | | | (2,125 | ) |
Total Financial | | | | | | | | | | | 25,951 | |
| | | | | | | | | | | | | |
Communications | | | | | | | | | | | | |
Scholastic Corp. | | | 1,210 | | | | 0.60 | % | | | 5,723 | |
Verizon Communications, Inc. | | | 1,419 | | | | 1.13 | % | | | 5,009 | |
News Corp. — Class A | | | 1,830 | | | | 0.34 | % | | | 3,880 | |
Alphabet, Inc. — Class C | | | 16 | | | | 0.26 | % | | | 2,244 | |
TEGNA, Inc. | | | 1,700 | | | | 0.35 | % | | | 1,037 | |
Facebook, Inc. — Class A | | | 93 | | | | 0.22 | % | | | (2 | ) |
Omnicom Group, Inc. | | | 957 | | | | 0.99 | % | | | (871 | ) |
John Wiley & Sons, Inc. — Class A | | | 978 | | | | 0.57 | % | | | (1,320 | ) |
ATN International, Inc. | | | 479 | | | | 0.37 | % | | | (1,892 | ) |
Discovery, Inc. — Class A | | | 1,784 | | | | 0.63 | % | | | (4,175 | ) |
Cogent Communications Holdings, Inc. | | | 997 | | | | 0.72 | % | | | (5,145 | ) |
AMC Networks, Inc. — Class A | | | 1,107 | | | | 0.72 | % | | | (6,011 | ) |
Meredith Corp. | | | 657 | | | | 0.32 | % | | | (9,428 | ) |
Shenandoah Telecommunications Co. | | | 1,551 | | | | 0.65 | % | | | (9,740 | ) |
Total Communications | | | | | | | | | | | (20,691 | ) |
| | | | | | | | | | | | | |
Industrial | | | | | | | | | | | | |
Saia, Inc. | | | 656 | | | | 0.81 | % | | | 22,350 | |
United Parcel Service, Inc. — Class B | | | 650 | | | | 1.03 | % | | | 12,877 | |
J.B. Hunt Transport Services, Inc. | | | 464 | | | | 0.68 | % | | | 10,551 | |
20 | THE GUGGENHEIM FUNDS ANNUAL REPORT | SEE NOTES TO FINANCIAL STATEMENTS. |
SCHEDULE OF INVESTMENTS (continued) | September 30, 2019 |
ALPHA OPPORTUNITY FUND | |
| | Shares | | | Percentage
Notional
Amount | | | Value and
Unrealized
Appreciation
(Depreciation) | |
Schneider National, Inc. — Class B | | | 2,704 | | | | 0.77 | % | | $ | 10,167 | |
Werner Enterprises, Inc. | | | 1,303 | | | | 0.61 | % | | | 7,583 | |
Heartland Express, Inc. | | | 2,406 | | | | 0.68 | % | | | 6,689 | |
Knight-Swift Transportation Holdings, Inc. | | | 1,230 | | | | 0.59 | % | | | 6,445 | |
Old Dominion Freight Line, Inc. | | | 212 | | | | 0.48 | % | | | 6,197 | |
Landstar System, Inc. | | | 518 | | | | 0.77 | % | | | 5,662 | |
Kansas City Southern | | | 332 | | | | 0.58 | % | | | 4,526 | |
Marten Transport Ltd. | | | 1,439 | | | | 0.39 | % | | | 4,159 | |
Echo Global Logistics, Inc. | | | 1,452 | | | | 0.43 | % | | | 3,252 | |
Forward Air Corp. | | | 528 | | | | 0.44 | % | | | 2,746 | |
Agilent Technologies, Inc. | | | 394 | | | | 0.40 | % | | | 2,577 | |
Waters Corp. | | | 139 | | | | 0.41 | % | | | 2,132 | |
Parker-Hannifin Corp. | | | 113 | | | | 0.27 | % | | | 1,529 | |
Vishay Intertechnology, Inc. | | | 1,184 | | | | 0.26 | % | | | 1,279 | |
Textron, Inc. | | | 383 | | | | 0.25 | % | | | 115 | |
Avnet, Inc. | | | 433 | | | | 0.25 | % | | | (37 | ) |
Caterpillar, Inc. | | | 138 | | | | 0.23 | % | | | (134 | ) |
Cummins, Inc. | | | 316 | | | | 0.68 | % | | | (487 | ) |
Oshkosh Corp. | | | 231 | | | | 0.23 | % | | | (552 | ) |
Union Pacific Corp. | | | 155 | | | | 0.33 | % | | | (2,058 | ) |
Kennametal, Inc. | | | 1,031 | | | | 0.42 | % | | | (2,536 | ) |
Norfolk Southern Corp. | | | 219 | | | | 0.52 | % | | | (4,229 | ) |
FedEx Corp. | | | 473 | | | | 0.91 | % | | | (6,561 | ) |
CSX Corp. | | | 923 | | | | 0.84 | % | | | (8,491 | ) |
Total Industrial | | | | | | | | | | | 85,751 | |
| | | | | | | | | | | | | |
Energy | | | | | | | | | | | | |
HollyFrontier Corp. | | | 1,356 | | | | 0.96 | % | | | 17,791 | |
Marathon Petroleum Corp. | | | 1,047 | | | | 0.84 | % | | | 13,590 | |
Phillips 66 | | | 735 | | | | 0.99 | % | | | 13,002 | |
ONEOK, Inc. | | | 1,335 | | | | 1.30 | % | | | 10,640 | |
Valero Energy Corp. | | | 835 | | | | 0.94 | % | | | 7,415 | |
Renewable Energy Group, Inc. | | | 1,776 | | | | 0.35 | % | | | 1,803 | |
PBF Energy, Inc. — Class A | | | 1,720 | | | | 0.62 | % | | | 1,703 | |
Targa Resources Corp. | | | 796 | | | | 0.42 | % | | | 1,345 | |
Delek US Holdings, Inc. | | | 1,528 | | | | 0.73 | % | | | 1,070 | |
Kinder Morgan, Inc. | | | 4,244 | | | | 1.15 | % | | | (721 | ) |
Chevron Corp. | | | 751 | | | | 1.17 | % | | | (1,930 | ) |
Exxon Mobil Corp. | | | 1,251 | | | | 1.17 | % | | | (5,292 | ) |
Williams Companies, Inc. | | | 2,400 | | | | 0.76 | % | | | (8,568 | ) |
Unit Corp. | | | 15,274 | | | | 0.68 | % | | | (16,336 | ) |
Total Energy | | | | | | | | | | | 35,512 | |
| | | | | | | | | | | | | |
Utilities | | | | | | | | | | | | |
FirstEnergy Corp. | | | 1,598 | | | | 1.02 | % | | | 8,757 | |
Ameren Corp. | | | 989 | | | | 1.04 | % | | | 5,064 | |
Southern Co. | | | 523 | | | | 0.43 | % | | | 3,689 | |
Portland General Electric Co. | | | 1,438 | | | | 1.07 | % | | | 3,236 | |
PPL Corp. | | | 2,306 | | | | 0.96 | % | | | 2,029 | |
OGE Energy Corp. | | | 794 | | | | 0.48 | % | | | 1,969 | |
Avista Corp. | | | 858 | | | | 0.55 | % | | | 1,772 | �� |
Public Service Enterprise Group, Inc. | | | 480 | | | | 0.39 | % | | | 754 | |
Pinnacle West Capital Corp. | | | 853 | | | | 1.09 | % | | | 580 | |
AES Corp. | | | 2,316 | | | | 0.50 | % | | | (93 | ) |
Exelon Corp. | | | 1,061 | | | | 0.68 | % | | | (955 | ) |
National Fuel Gas Co. | | | 1,465 | | | | 0.91 | % | | | (8,834 | ) |
Total Utilities | | | | | | | | | | | 17,968 | |
| | | | | | | | | | | | | |
Basic Materials | | | | | | | | | | | | |
Westlake Chemical Corp. | | | 274 | | | | 0.24 | % | | | 817 | |
Domtar Corp. | | | 2,058 | | | | 0.97 | % | | | (2,176 | ) |
Total Basic Materials | | | | | | | | | | | (1,359 | ) |
| | | | | | | | | | | | | |
Technology | | | | | | | | | | | | |
Diodes, Inc. | | | 503 | | | | 0.27 | % | | | 3,144 | |
Skyworks Solutions, Inc. | | | 333 | | | | 0.35 | % | | | 1,624 | |
Oracle Corp. | | | 322 | | | | 0.23 | % | | | 351 | |
Total Technology | | | | | | | | | | | 5,119 | |
Total GS Equity Long Custom Basket | | | | | | $ | 208,633 | |
| | | | | | | | | |
GS EQUITY SHORT CUSTOM BASKET | | | | | | | | |
Technology | | | | | | | | | | | | |
PTC, Inc. | | | 4,933 | | | | (0.85 | )% | | $ | 99,489 | |
Workday, Inc. — Class A | | | 1,313 | | | | (0.56 | )% | | | 61,736 | |
ServiceNow, Inc. | | | 991 | | | | (0.63 | )% | | | 39,119 | |
Autodesk, Inc. | | | 2,310 | | | | (0.86 | )% | | | 37,226 | |
Fair Isaac Corp. | | | 838 | | | | (0.64 | )% | | | 19,131 | |
Everbridge, Inc. | | | 456 | | | | (0.06 | )% | | | 16,919 | |
Pegasystems, Inc. | | | 5,830 | | | | (1.00 | )% | | | 15,216 | |
EPAM Systems, Inc. | | | 1,170 | | | | (0.54 | )% | | | 14,197 | |
MongoDB, Inc. | | | 274 | | | | (0.08 | )% | | | 12,104 | |
Coupa Software, Inc. | | | 604 | | | | (0.20 | )% | | | 11,483 | |
Twilio, Inc. — Class A | | | 306 | | | | (0.09 | )% | | | 11,335 | |
Appian Corp. | | | 1,630 | | | | (0.20 | )% | | | 10,308 | |
Elastic N.V. | | | 457 | | | | (0.10 | )% | | | 7,845 | |
HubSpot, Inc. | | | 246 | | | | (0.09 | )% | | | 7,485 | |
Alteryx, Inc. — Class A | | | 469 | | | | (0.13 | )% | | | 7,079 | |
Advanced Micro Devices, Inc. | | | 2,028 | | | | (0.15 | )% | | | 6,936 | |
Paycom Software, Inc. | | | 185 | | | | (0.10 | )% | | | 5,020 | |
Veeva Systems, Inc. — Class A | | | 258 | | | | (0.10 | )% | | | 4,814 | |
Qualys, Inc. | | | 506 | | | | (0.10 | )% | | | 4,486 | |
Aspen Technology, Inc. | | | 331 | | | | (0.10 | )% | | | 3,854 | |
Atlassian Corporation plc — Class A | | | 328 | | | | (0.10 | )% | | | 3,441 | |
MSCI, Inc. — Class A | | | 273 | | | | (0.15 | )% | | | 3,373 | |
Appfolio, Inc. — Class A | | | 415 | | | | (0.10 | )% | | | 1,917 | |
PROS Holdings, Inc. | | | 667 | | | | (0.10 | )% | | | 1,724 | |
Accenture plc — Class A | | | 464 | | | | (0.23 | )% | | | 1,386 | |
salesforce.com, Inc. | | | 607 | | | | (0.23 | )% | | | 858 | |
SEE NOTES TO FINANCIAL STATEMENTS. | THE GUGGENHEIM FUNDS ANNUAL REPORT | 21 |
SCHEDULE OF INVESTMENTS (continued) | September 30, 2019 |
ALPHA OPPORTUNITY FUND | |
| | Shares | | | Percentage
Notional
Amount | | | Value and
Unrealized
Appreciation
(Depreciation) | |
Blackline, Inc. | | | 910 | | | | (0.11 | )% | | $ | 836 | |
Adobe, Inc. | | | 216 | | | | (0.15 | )% | | | (56 | ) |
Intuit, Inc. | | | 158 | | | | (0.11 | )% | | | (1,275 | ) |
Synopsys, Inc. | | | 2,372 | | | | (0.83 | )% | | | (2,629 | ) |
Five9, Inc. | | | 922 | | | | (0.13 | )% | | | (4,256 | ) |
ANSYS, Inc. | | | 215 | | | | (0.12 | )% | | | (4,935 | ) |
Tyler Technologies, Inc. | | | 351 | | | | (0.23 | )% | | | (9,916 | ) |
DocuSign, Inc. | | | 841 | | | | (0.13 | )% | | | (10,234 | ) |
Monolithic Power Systems, Inc. | | | 459 | | | | (0.18 | )% | | | (11,227 | ) |
Guidewire Software, Inc. | | | 4,493 | | | | (1.20 | )% | | | (35,420 | ) |
Total Technology | | | | | | | | | | | 329,369 | |
| | | | | | | | | | | | | |
Financial | | | | | | | | | | | | |
Hudson Pacific Properties, Inc. | | | 17,873 | | | | (1.52 | )% | | | 14,973 | |
Ares Management Corp. — Class A | | | 6,793 | | | | (0.46 | )% | | | 9,726 | |
People’s United Financial, Inc. | | | 14,317 | | | | (0.57 | )% | | | 8,375 | |
CVB Financial Corp. | | | 9,590 | | | | (0.51 | )% | | | 4,795 | |
CNO Financial Group, Inc. | | | 9,237 | | | | (0.37 | )% | | | 3,048 | |
First Republic Bank | | | 3,164 | | | | (0.78 | )% | | | 2,504 | |
Signature Bank | | | 1,238 | | | | (0.38 | )% | | | 1,362 | |
Capitol Federal Financial, Inc. | | | 31,880 | | | | (1.12 | )% | | | — | |
Visa, Inc. — Class A | | | 494 | | | | (0.22 | )% | | | (469 | ) |
BankUnited, Inc. | | | 4,429 | | | | (0.38 | )% | | | (531 | ) |
Glacier Bancorp, Inc. | | | 5,020 | | | | (0.52 | )% | | | (1,459 | ) |
Mastercard, Inc. — Class A | | | 474 | | | | (0.33 | )% | | | (1,747 | ) |
American Campus Communities, Inc. | | | 3,131 | | | | (0.38 | )% | | | (3,538 | ) |
Alexandria Real Estate Equities, Inc. | | | 1,743 | | | | (0.68 | )% | | | (5,246 | ) |
Healthcare Realty Trust, Inc. | | | 4,541 | | | | (0.39 | )% | | | (5,358 | ) |
CubeSmart | | | 6,599 | | | | (0.59 | )% | | | (5,477 | ) |
WesBanco, Inc. | | | 3,649 | | | | (0.35 | )% | | | (6,349 | ) |
Columbia Financial, Inc. | | | 9,172 | | | | (0.37 | )% | | | (7,888 | ) |
Federal Realty Investment Trust | | | 1,395 | | | | (0.48 | )% | | | (8,284 | ) |
Pebblebrook Hotel Trust | | | 9,624 | | | | (0.68 | )% | | | (8,485 | ) |
Douglas Emmett, Inc. | | | 4,550 | | | | (0.50 | )% | | | (8,873 | ) |
CME Group, Inc. — Class A | | | 702 | | | | (0.38 | )% | | | (9,649 | ) |
Intercontinental Exchange, Inc. | | | 1,465 | | | | (0.34 | )% | | | (10,738 | ) |
Liberty Property Trust | | | 10,487 | | | | (1.37 | )% | | | (11,102 | ) |
BOK Financial Corp. | | | 4,393 | | | | (0.88 | )% | | | (11,146 | ) |
Valley National Bancorp | | | 27,327 | | | | (0.76 | )% | | | (12,024 | ) |
American Homes 4 Rent — Class A | | | 10,463 | | | | (0.69 | )% | | | (12,242 | ) |
WP Carey, Inc. | | | 2,794 | | | | (0.64 | )% | | | (12,880 | ) |
Digital Realty Trust, Inc. | | | 1,169 | | | | (0.39 | )% | | | (13,311 | ) |
Crown Castle International Corp. | | | 4,161 | | | | (1.47 | )% | | | (13,420 | ) |
Old National Bancorp | | | 21,833 | | | | (0.96 | )% | | | (13,427 | ) |
Extra Space Storage, Inc. | | | 1,845 | | | | (0.55 | )% | | | (14,225 | ) |
Essex Property Trust, Inc. | | | 553 | | | | (0.46 | )% | | | (15,279 | ) |
American Tower Corp. — Class A | | | 1,371 | | | | (0.77 | )% | | | (16,671 | ) |
Assurant, Inc. | | | 1,278 | | | | (0.41 | )% | | | (17,942 | ) |
UDR, Inc. | | | 7,849 | | | | (0.97 | )% | | | (19,445 | ) |
Camden Property Trust | | | 3,400 | | | | (0.96 | )% | | | (19,448 | ) |
First Industrial Realty Trust, Inc. | | | 6,851 | | | | (0.69 | )% | | | (21,375 | ) |
Washington Federal, Inc. | | | 5,338 | | | | (0.50 | )% | | | (21,619 | ) |
Everest Re Group Ltd. | | | 1,317 | | | | (0.89 | )% | | | (22,442 | ) |
Axis Capital Holdings Ltd. | | | 3,738 | | | | (0.63 | )% | | | (24,697 | ) |
STORE Capital Corp. | | | 8,682 | | | | (0.83 | )% | | | (26,306 | ) |
RLI Corp. | | | 5,153 | | | | (1.22 | )% | | | (26,551 | ) |
Invitation Homes, Inc. | | | 10,225 | | | | (0.77 | )% | | | (27,289 | ) |
Equity LifeStyle Properties, Inc. | | | 2,605 | | | | (0.89 | )% | | | (28,994 | ) |
Equity Residential | | | 3,448 | | | | (0.76 | )% | | | (29,790 | ) |
Realty Income Corp. | | | 7,825 | | | | (1.53 | )% | | | (34,821 | ) |
New York Community Bancorp, Inc. | | | 16,282 | | | | (0.52 | )% | | | (35,332 | ) |
First Financial Bankshares, Inc. | | | 10,547 | | | | (0.89 | )% | | | (40,079 | ) |
Terreno Realty Corp. | | | 10,111 | | | | (1.31 | )% | | | (40,646 | ) |
SBA Communications Corp. | | | 2,310 | | | | (1.42 | )% | | | (41,303 | ) |
EastGroup Properties, Inc. | | | 4,078 | | | | (1.30 | )% | | | (42,982 | ) |
Agree Realty Corp. | | | 7,234 | | | | (1.35 | )% | | | (48,540 | ) |
Welltower, Inc. | | | 6,197 | | | | (1.43 | )% | | | (49,432 | ) |
Equinix, Inc. | | | 701 | | | | (1.03 | )% | | | (50,865 | ) |
Rexford Industrial Realty, Inc. | | | 14,780 | | | | (1.65 | )% | | | (66,953 | ) |
Sun Communities, Inc. | | | 4,662 | | | | (1.76 | )% | | | (92,401 | ) |
Total Financial | | | | | | | | | | | (1,014,287 | ) |
| | | | | | | | | | | | | |
Utilities | | | | | | | | | | | | |
California Water Service Group | | | 2,389 | | | | (0.32 | )% | | | 265 | |
WEC Energy Group, Inc. | | | 2,217 | | | | (0.54 | )% | | | (12,752 | ) |
South Jersey Industries, Inc. | | | 12,485 | | | | (1.05 | )% | | | (13,234 | ) |
Atmos Energy Corp. | | | 1,235 | | | | (0.36 | )% | | | (13,918 | ) |
American States Water Co. | | | 2,398 | | | | (0.55 | )% | | | (14,686 | ) |
American Water Works Company, Inc. | | | 2,331 | | | | (0.74 | )% | | | (15,835 | ) |
NextEra Energy, Inc. | | | 1,428 | | | | (0.85 | )% | | | (44,297 | ) |
Total Utilities | | | | | | | | | | | (114,457 | ) |
| | | | | | | | | | | | | |
Consumer, Non-cyclical | | | | | | | | | | | | |
Guardant Health, Inc. | | | 1,415 | | | | (0.23 | )% | | | 20,650 | |
Rollins, Inc. | | | 5,731 | | | | (0.50 | )% | | | 19,887 | |
Chegg, Inc. | | | 1,019 | | | | (0.08 | )% | | | 14,126 | |
22 | THE GUGGENHEIM FUNDS ANNUAL REPORT | SEE NOTES TO FINANCIAL STATEMENTS. |
SCHEDULE OF INVESTMENTS (continued) | September 30, 2019 |
ALPHA OPPORTUNITY FUND | |
| | Shares | | | Percentage
Notional
Amount | | | Value and
Unrealized
Appreciation
(Depreciation) | |
Avalara, Inc. | | | 954 | | | | (0.16 | )% | | $ | 11,318 | |
PayPal Holdings, Inc. | | | 559 | | | | (0.15 | )% | | | 6,155 | |
MarketAxess Holdings, Inc. | | | 553 | | | | (0.46 | )% | | | 4,689 | |
Paylocity Holding Corp. | | | 423 | | | | (0.10 | )% | | | 3,503 | |
IDEXX Laboratories, Inc. | | | 154 | | | | (0.11 | )% | | | 2,184 | |
Verisk Analytics, Inc. — Class A | | | 1,146 | | | | (0.46 | )% | | | (1,818 | ) |
Intuitive Surgical, Inc. | | | 84 | | | | (0.12 | )% | | | (2,064 | ) |
Avery Dennison Corp. | | | 1,672 | | | | (0.48 | )% | | | (2,131 | ) |
S&P Global, Inc. | | | 671 | | | | (0.42 | )% | | | (2,749 | ) |
CoStar Group, Inc. | | | 181 | | | | (0.27 | )% | | | (5,753 | ) |
Bright Horizons Family Solutions, Inc. | | | 1,584 | | | | (0.61 | )% | | | (6,740 | ) |
Cintas Corp. | | | 257 | | | | (0.18 | )% | | | (9,206 | ) |
IHS Markit Ltd. | | | 9,336 | | | | (1.59 | )% | | | (67,593 | ) |
TransUnion | | | 6,714 | | | | (1.39 | )% | | | (74,123 | ) |
Total Consumer, Non-cyclical | | | | | | | | | | | (89,665 | ) |
| | | | | | | | | | | | | |
Consumer, Cyclical | | | | | | | | | | | | |
Wingstop, Inc. | | | 3,000 | | | | (0.67 | )% | | | 20,240 | |
Wyndham Hotels & Resorts, Inc. | | | 3,392 | | | | (0.45 | )% | | | 14,891 | |
Planet Fitness, Inc. — Class A | | | 585 | | | | (0.09 | )% | | | 7,448 | |
Copart, Inc. | | | 1,443 | | | | (0.29 | )% | | | (1,151 | ) |
Toro Co. | | | 3,816 | | | | (0.71 | )% | | | (2,863 | ) |
McDonald’s Corp. | | | 866 | | | | (0.47 | )% | | | (8,277 | ) |
NIKE, Inc. — Class B | | | 1,021 | | | | (0.24 | )% | | | (10,884 | ) |
Pool Corp. | | | 710 | | | | (0.36 | )% | | | (11,268 | ) |
Fastenal Co. | | | 9,493 | | | | (0.79 | )% | | | (19,573 | ) |
Scotts Miracle-Gro Co. — Class A | | | 2,865 | | | | (0.74 | )% | | | (25,241 | ) |
Total Consumer, Cyclical | | | | | | | | | | | (36,678 | ) |
| | | | | | | | | | | | | |
Communications | | | | | | | | | | | | |
FireEye, Inc. | | | 16,147 | | | | (0.55 | )% | | | 23,638 | |
Okta, Inc. | | | 525 | | | | (0.13 | )% | | | 17,899 | |
Amazon.com, Inc. | | | 98 | | | | (0.43 | )% | | | 11,475 | |
Trade Desk, Inc. — Class A | | | 185 | | | | (0.09 | )% | | | 9,373 | |
Zendesk, Inc. | | | 485 | | | | (0.09 | )% | | | 9,005 | |
MercadoLibre, Inc. | | | 69 | | | | (0.10 | )% | | | 5,974 | |
VeriSign, Inc. | | | 208 | | | | (0.10 | )% | | | 5,622 | |
Charter Communications, Inc. — Class A | | | 431 | | | | (0.45 | )% | | | 2,274 | |
Q2 Holdings, Inc. | | | 552 | | | | (0.11 | )% | | | 747 | |
Palo Alto Networks, Inc. | | | 1,489 | | | | (0.77 | )% | | | (4,527 | ) |
Proofpoint, Inc. | | | 2,104 | | | | (0.69 | )% | | | (41,644 | ) |
Total Communications | | | | | | | | | | | 39,836 | |
| | | | | | | | | | | | | |
Basic Materials | | | | | | | | | | | | |
Allegheny Technologies, Inc. | | | 14,270 | | | | (0.73 | )% | | | 54,700 | |
International Flavors & Fragrances, Inc. | | | 1,797 | | | | (0.56 | )% | | | 52,940 | |
WR Grace & Co. | | | 6,218 | | | | (1.06 | )% | | | 48,376 | |
Materion Corp. | | | 5,474 | | | | (0.85 | )% | | | 20,853 | |
Southern Copper Corp. | | | 6,626 | | | | (0.58 | )% | | | 20,408 | |
Linde plc | | | 2,091 | | | | (1.03 | )% | | | 18,782 | |
Sensient Technologies Corp. | | | 2,274 | | | | (0.40 | )% | | | 11,102 | |
Compass Minerals International, Inc. | | | 4,478 | | | | (0.64 | )% | | | 672 | |
PPG Industries, Inc. | | | 1,144 | | | | (0.34 | )% | | | (1,899 | ) |
Air Products & Chemicals, Inc. | | | 739 | | | | (0.42 | )% | | | (2,077 | ) |
Balchem Corp. | | | 3,511 | | | | (0.89 | )% | | | (8,918 | ) |
Kaiser Aluminum Corp. | | | 1,862 | | | | (0.47 | )% | | | (12,610 | ) |
NewMarket Corp. | | | 418 | | | | (0.50 | )% | | | (28,023 | ) |
RPM International, Inc. | | | 5,178 | | | | (0.91 | )% | | | (41,249 | ) |
Sherwin-Williams Co. | | | 860 | | | | (1.20 | )% | | | (73,254 | ) |
Total Basic Materials | | | | | | | | | | | 59,803 | |
| | | | | | | | | | | | | |
Industrial | | | | | | | | | | | | |
Fortive Corp. | | | 7,125 | | | | (1.24 | )% | | | 76,419 | |
Roper Technologies, Inc. | | | 1,182 | | | | (1.07 | )% | | | 22,804 | |
Woodward, Inc. | | | 2,568 | | | | (0.70 | )% | | | 15,996 | |
AptarGroup, Inc. | | | 2,406 | | | | (0.72 | )% | | | 9,937 | |
Universal Display Corp. | | | 216 | | | | (0.09 | )% | | | 8,586 | |
HEICO Corp. | | | 485 | | | | (0.15 | )% | | | 6,726 | |
Alarm.com Holdings, Inc. | | | 852 | | | | (0.10 | )% | | | 6,134 | |
Casella Waste Systems, Inc. — Class A | | | 2,912 | | | | (0.32 | )% | | | 786 | |
Exponent, Inc. | | | 3,144 | | | | (0.56 | )% | | | (1,244 | ) |
Boeing Co. | | | 371 | | | | (0.36 | )% | | | (1,300 | ) |
AMETEK, Inc. | | | 4,989 | | | | (1.17 | )% | | | (12,898 | ) |
Vulcan Materials Co. | | | 1,805 | | | | (0.69 | )% | | | (27,417 | ) |
Ball Corp. | | | 5,260 | | | | (0.97 | )% | | | (31,102 | ) |
Martin Marietta Materials, Inc. | | | 1,285 | | | | (0.90 | )% | | | (56,035 | ) |
TransDigm Group, Inc. | | | 1,352 | | | | (1.79 | )% | | | (72,359 | ) |
Total Industrial | | | | | | | | | | | (54,967 | ) |
| | | | | | | | | | | | | |
Energy | | | | | | | | | | | | |
Diamondback Energy, Inc. | | | 3,808 | | | | (0.87 | )% | | | 42,932 | |
Schlumberger Ltd. | | | 8,816 | | | | (0.77 | )% | | | 22,216 | |
Core Laboratories N.V. | | | 4,939 | | | | (0.59 | )% | | | 19,805 | |
National Oilwell Varco, Inc. | | | 12,755 | | | | (0.69 | )% | | | 1,169 | |
Total Energy | | | | | | | | | | | 86,122 | |
Total GS Equity Short Custom Basket | | | | | | $ | (794,924 | ) |
SEE NOTES TO FINANCIAL STATEMENTS. | THE GUGGENHEIM FUNDS ANNUAL REPORT | 23 |
SCHEDULE OF INVESTMENTS (concluded) | September 30, 2019 |
ALPHA OPPORTUNITY FUND | |
* | Non-income producing security. |
† | Value determined based on Level 1 inputs — See Note 4. |
†† | Value determined based on Level 2 inputs — See Note 4. |
1 | All or a portion of this security is pledged as custom basket swap collateral at September 30, 2019. |
2 | Rate indicated is the 7-day yield as of September 30, 2019. |
| | GS — Goldman Sachs International |
| | MS — Morgan Stanley Capital Services LLC |
| | plc — Public Limited Company |
| | REIT — Real Estate Investment Trust |
| | |
| | See Sector Classification in Other Information section. |
The following table summarizes the inputs used to value the Fund’s investments at September 30, 2019 (See Note 4 in the Notes to Financial Statements):
Investments in Securities (Assets) | | Level 1
Quoted
Prices | | | Level 2
Significant
Observable
Inputs | | | Level 3
Significant
Unobservable
Inputs | | | Total | |
Common Stocks | | $ | 85,606,026 | | | $ | — | | | $ | — | | | $ | 85,606,026 | |
Money Market Fund | | | 5,866,464 | | | | — | | | | — | | | | 5,866,464 | |
Custom Basket Swap Agreements** | | | — | | | | 396,412 | | | | — | | | | 396,412 | |
Total Assets | | $ | 91,472,490 | | | $ | 396,412 | | | $ | — | | | $ | 91,868,902 | |
Investments in Securities (Liabilities) | | Level 1
Quoted
Prices | | | Level 2
Significant
Observable
Inputs | | | Level 3
Significant
Unobservable
Inputs | | | Total | |
Custom Basket Swap Agreements** | | $ | — | | | $ | 2,664,079 | | | $ | — | | | $ | 2,664,079 | |
** | This derivative is reported as unrealized appreciation/depreciation at period end. |
24 | THE GUGGENHEIM FUNDS ANNUAL REPORT | SEE NOTES TO FINANCIAL STATEMENTS. |
STATEMENT OF ASSETS AND LIABILITIES |
September 30, 2019 | |
Assets: |
Investments, at value (cost $89,636,144) | | $ | 91,472,490 | |
Cash | | | 295 | |
Unrealized appreciation on OTC swap agreements | | | 396,412 | |
Prepaid expenses | | | 37,975 | |
Receivables: |
Dividends | | | 130,701 | |
Swap settlement | | | 47,797 | |
Interest | | | 6,992 | |
Fund shares sold | | | 1,189 | |
Total assets | | | 92,093,851 | |
| | | | | |
Liabilities: |
Unrealized depreciation on OTC swap agreements | | | 2,664,079 | |
Payable for: |
Management fees | | | 61,275 | |
Transfer agent/maintenance fees | | | 12,807 | |
Fund shares redeemed | | | 10,921 | |
Fund accounting/administration fees | | | 5,466 | |
Distribution and service fees | | | 2,323 | |
Trustees’ fees* | | | 1,283 | |
Due to Investment Adviser | | | 2 | |
Miscellaneous | | | 85,233 | |
Total liabilities | | | 2,843,389 | |
Net assets | | $ | 89,250,462 | |
| | | | | |
Net assets consist of: |
Paid in capital | | $ | 113,718,464 | |
Total distributable earnings (loss) | | | (24,468,002 | ) |
Net assets | | $ | 89,250,462 | |
| | | | | |
A-Class: |
Net assets | | $ | 7,325,521 | |
Capital shares outstanding | | | 420,450 | |
Net asset value per share | | $ | 17.42 | |
Maximum offering price per share (Net asset value divided by 95.25%) | | $ | 18.29 | |
| | | | | |
C-Class: |
Net assets | | $ | 702,330 | |
Capital shares outstanding | | | 46,333 | |
Net asset value per share | | $ | 15.16 | |
| | | | | |
P-Class: |
Net assets | | $ | 1,905,094 | |
Capital shares outstanding | | | 108,505 | |
Net asset value per share | | $ | 17.56 | |
| | | | | |
Institutional Class: |
Net assets | | $ | 79,317,517 | |
Capital shares outstanding | | | 3,126,877 | |
Net asset value per share | | $ | 25.37 | |
STATEMENT OF OPERATIONS |
Year Ended September 30, 2019 | |
Investment Income: |
Dividends (net of foreign withholding tax of $26) | | $ | 2,572,357 | |
Interest | | | 103,009 | |
Total investment income | | | 2,675,366 | |
| | | | | |
Expenses: |
Management fees | | | 1,063,268 | |
Distribution and service fees: |
A-Class | | | 22,191 | |
C-Class | | | 8,432 | |
P-Class | | | 7,493 | |
Transfer agent/maintenance fees: |
A-Class | | | 9,560 | |
C-Class | | | 2,586 | |
P-Class | | | 5,848 | |
Institutional Class | | | 29,546 | |
Fund accounting/administration fees | | | 94,514 | |
Custodian fees | | | 28,761 | |
Trustees’ fees* | | | 20,239 | |
Line of credit fees | | | 3,131 | |
Miscellaneous | | | 193,460 | |
Recoupment of previously waived fees: |
A-Class | | | 7,802 | |
C-Class | | | 322 | |
P-Class | | | 967 | |
Institutional Class | | | 1,370 | |
Total expenses | | | 1,499,490 | |
Less: |
Expenses reimbursed by Adviser: |
A-Class | | | (539 | ) |
C-Class | | | (581 | ) |
P-Class | | | (193 | ) |
Institutional Class | | | (91 | ) |
Expenses waived by Adviser | | | (1,497 | ) |
Earnings credits applied | | | (363 | ) |
Total waived/reimbursed expenses | | | (3,264 | ) |
Net expenses | | | 1,496,226 | |
Net investment income | | | 1,179,140 | |
| | | | | |
Net Realized and Unrealized Gain (Loss): |
Net realized gain (loss) on: |
Investments | | | (13,737,097 | ) |
Swap agreements | | | (3,722,081 | ) |
Net realized loss | | | (17,459,178 | ) |
Net change in unrealized appreciation (depreciation) on: |
Investments | | | (2,975,412 | ) |
Swap agreements | | | 7,578,832 | |
Net change in unrealized appreciation (depreciation) | | | 4,603,420 | |
Net realized and unrealized loss | | | (12,855,758 | ) |
Net decrease in net assets resulting from operations | | $ | (11,676,618 | ) |
* | Relates to Trustees not deemed “interested persons” within the meaning of Section 2(a)(19) of the 1940 Act. |
SEE NOTES TO FINANCIAL STATEMENTS. | THE GUGGENHEIM FUNDS ANNUAL REPORT | 25 |
STATEMENTS OF CHANGES IN NET ASSETS |
| | Year Ended
September 30,
2019 | | | Year Ended
September 30,
2018 | |
Increase (Decrease) in Net Assets from Operations: | | | | | | | | |
Net investment income | | $ | 1,179,140 | | | $ | 1,893,779 | |
Net realized loss on investments | | | (17,459,178 | ) | | | (6,985,537 | ) |
Net change in unrealized appreciation (depreciation) on investments | | | 4,603,420 | | | | (844,817 | ) |
Net decrease in net assets resulting from operations | | | (11,676,618 | ) | | | (5,936,575 | ) |
| | | | | | | | | |
Distributions to shareholders: | | | | | | | | |
A-Class | | | (116,145 | ) | | | (950,491 | ) |
C-Class | | | — | | | | (199,304 | ) |
P-Class | | | (27,471 | ) | | | (527,188 | ) |
Institutional Class | | | (1,999,721 | ) | | | (9,428,285 | ) |
Total distributions to shareholders | | | (2,143,337 | ) | | | (11,105,268 | ) |
| | | | | | | | | |
Capital share transactions: | | | | | | | | |
Proceeds from sale of shares | | | | | | | | |
A-Class | | | 431,143 | | | | 2,076,718 | |
C-Class | | | 21,885 | | | | 333,769 | |
P-Class | | | 128,195 | | | | 7,281,013 | |
Institutional Class | | | 3,348,033 | | | | 5,609,253 | |
Distributions reinvested | | | | | | | | |
A-Class | | | 110,113 | | | | 925,939 | |
C-Class | | | — | | | | 194,318 | |
P-Class | | | 27,471 | | | | 527,188 | |
Institutional Class | | | 1,978,134 | | | | 9,428,285 | |
Cost of shares redeemed | | | | | | | | |
A-Class | | | (3,558,021 | ) | | | (5,488,322 | ) |
C-Class | | | (272,683 | ) | | | (1,716,741 | ) |
P-Class | | | (2,462,538 | ) | | | (9,878,570 | ) |
Institutional Class | | | (94,580,128 | ) | | | (15,771,018 | ) |
Net decrease from capital share transactions | | | (94,828,396 | ) | | | (6,478,168 | ) |
Net decrease in net assets | | | (108,648,351 | ) | | | (23,520,011 | ) |
| | | | | | | | | |
Net assets: | | | | | | | | |
Beginning of year | | | 197,898,813 | | | | 221,418,824 | |
End of year | | $ | 89,250,462 | | | $ | 197,898,813 | |
| | | | | | | | | |
Capital share activity: | | | | | | | | |
Shares sold | | | | | | | | |
A-Class | | | 23,614 | | | | 103,554 | |
C-Class | | | 1,365 | | | | 18,316 | |
P-Class | | | 6,923 | | | | 343,013 | |
Institutional Class | | | 130,493 | | | | 190,568 | |
Shares issued from reinvestment of distributions | | | | | | | | |
A-Class | | | 6,100 | | | | 44,581 | |
C-Class | | | — | | | | 10,724 | |
P-Class | | | 1,511 | | | | 25,285 | |
Institutional Class | | | 75,530 | | | | 313,962 | |
Shares redeemed | | | | | | | | |
A-Class | | | (196,272 | ) | | | (272,432 | ) |
C-Class | | | (17,408 | ) | | | (101,381 | ) |
P-Class | | | (135,289 | ) | | | (497,211 | ) |
Institutional Class | | | (3,599,302 | ) | | | (553,273 | ) |
Net decrease in shares | | | (3,702,735 | ) | | | (374,294 | ) |
26 | THE GUGGENHEIM FUNDS ANNUAL REPORT | SEE NOTES TO FINANCIAL STATEMENTS. |
This table is presented to show selected data for a share outstanding throughout each period and to assist shareholders in evaluating a Fund’s performance for the periods presented.
A-Class | | Year Ended
September 30,
2019 | | | Year Ended
September 30,
2018 | | | Year Ended
September 30,
2017 | | | Year Ended
September 30,
2016 | | | Year Ended
September 30,
2015 | |
Per Share Data | | | | | | | | | | | | | | | | | | | | |
Net asset value, beginning of period | | $ | 19.15 | | | $ | 21.10 | | | $ | 19.08 | | | $ | 18.39 | | | $ | 18.01 | |
Income (loss) from investment operations: |
Net investment income (loss)a | | | .12 | | | | .10 | | | | .31 | | | | (.19 | ) | | | (.35 | ) |
Net gain (loss) on investments (realized and unrealized) | | | (1.64 | ) | | | (.60 | ) | | | 1.72 | | | | .88 | | | | .73 | |
Total from investment operations | | | (1.52 | ) | | | (.50 | ) | | | 2.03 | | | | .69 | | | | .38 | |
Less distributions from: |
Net investment income | | | (.21 | ) | | | — | | | | — | | | | — | | | | (— | )b |
Net realized gains | | | — | | | | (1.45 | ) | | | (.01 | ) | | | — | | | | — | |
Total distributions | | | (.21 | ) | | | (1.45 | ) | | | (.01 | ) | | | — | | | | (— | )b |
Net asset value, end of period | | $ | 17.42 | | | $ | 19.15 | | | $ | 21.10 | | | $ | 19.08 | | | $ | 18.39 | |
|
Total Returnc | | | (7.97 | %) | | | (2.90 | %) | | | 10.70 | % | | | 3.70 | % | | | 2.13 | % |
Ratios/Supplemental Data |
Net assets, end of period (in thousands) | | $ | 7,326 | | | $ | 11,243 | | | $ | 15,011 | | | $ | 16,041 | | | $ | 11,485 | |
Ratios to average net assets: |
Net investment income (loss) | | | 0.64 | % | | | 0.51 | % | | | 1.49 | % | | | (1.02 | %) | | | (1.88 | %) |
Total expensesg | | | 1.65 | % | | | 1.54 | % | | | 2.21 | % | | | 2.69 | % | | | 3.92 | % |
Net expensesd,e,h | | | 1.64 | % | | | 1.54 | % | | | 2.17 | % | | | 2.69 | % | | | 2.94 | % |
Portfolio turnover rate | | | 126 | % | | | 255 | % | | | 92 | % | | | 235 | % | | | 124 | % |
C-Class | | Year Ended
September 30,
2019 | | | Year Ended
September 30,
2018 | | | Year Ended
September 30,
2017 | | | Year Ended
September 30,
2016 | | | Year Ended
September 30,
2015 | |
Per Share Data | | | | | | | | | | | | | | | | | | | | |
Net asset value, beginning of period | | $ | 16.61 | | | $ | 18.62 | | | $ | 16.96 | | | $ | 16.47 | | | $ | 16.25 | |
Income (loss) from investment operations: |
Net investment income (loss)a | | | (.03 | ) | | | (.05 | ) | | | .09 | | | | (.29 | ) | | | (.44 | ) |
Net gain (loss) on investments (realized and unrealized) | | | (1.42 | ) | | | (.51 | ) | | | 1.58 | | | | .78 | | | | .66 | |
Total from investment operations | | | (1.45 | ) | | | (.56 | ) | | | 1.67 | | | | .49 | | | | .22 | |
Less distributions from: |
Net investment income | | | — | | | | — | | | | — | | | | — | | | | (— | )b |
Net realized gains | | | — | | | | (1.45 | ) | | | (.01 | ) | | | — | | | | — | |
Total distributions | | | — | | | | (1.45 | ) | | | (.01 | ) | | | — | | | | (— | )b |
Net asset value, end of period | | $ | 15.16 | | | $ | 16.61 | | | $ | 18.62 | | | $ | 16.96 | | | $ | 16.47 | |
|
Total Returnc | | | (8.73 | %) | | | (3.65 | %) | | | 9.91 | % | | | 2.91 | % | | | 1.38 | % |
Ratios/Supplemental Data |
Net assets, end of period (in thousands) | | $ | 702 | | | $ | 1,036 | | | $ | 2,508 | | | $ | 1,550 | | | $ | 1,203 | |
Ratios to average net assets: |
Net investment income (loss) | | | (0.20 | %) | | | (0.31 | %) | | | 0.47 | % | | | (1.72 | %) | | | (2.64 | %) |
Total expensesg | | | 2.55 | % | | | 2.34 | % | | | 2.94 | % | | | 3.91 | % | | | 4.81 | % |
Net expensesd,e,h | | | 2.48 | % | | | 2.31 | % | | | 2.88 | % | | | 3.46 | % | | | 3.68 | % |
Portfolio turnover rate | | | 126 | % | | | 255 | % | | | 92 | % | | | 235 | % | | | 124 | % |
SEE NOTES TO FINANCIAL STATEMENTS. | THE GUGGENHEIM FUNDS ANNUAL REPORT | 27 |
FINANCIAL HIGHLIGHTS (continued) |
This table is presented to show selected data for a share outstanding throughout each period and to assist shareholders in evaluating a Fund’s performance for the periods presented.
P-Class | | Year Ended
September 30,
2019 | | | Year Ended
September 30,
2018 | | | Year Ended
September 30,
2017 | | | Year Ended
September 30,
2016 | | | Period Ended
September 30,
2015f | |
Per Share Data | | | | | | | | | | | | | | | | | | | | |
Net asset value, beginning of period | | $ | 19.23 | | | $ | 21.19 | | | $ | 19.11 | | | $ | 18.39 | | | $ | 19.11 | |
Income (loss) from investment operations: |
Net investment income (loss)a | | | .11 | | | | .10 | | | | (.06 | ) | | | (.12 | ) | | | (.13 | ) |
Net gain (loss) on investments (realized and unrealized) | | | (1.64 | ) | | | (.61 | ) | | | 2.15 | | | | .84 | | | | (.59 | ) |
Total from investment operations | | | (1.53 | ) | | | (.51 | ) | | | 2.09 | | | | .72 | | | | (.72 | ) |
Less distributions from: |
Net investment income | | | (.14 | ) | | | — | | | | — | | | | — | | | | — | |
Net realized gains | | | — | | | | (1.45 | ) | | | (.01 | ) | | | — | | | | — | |
Total distributions | | | (.14 | ) | | | (1.45 | ) | | | (.01 | ) | | | — | | | | — | |
Net asset value, end of period | | $ | 17.56 | | | $ | 19.23 | | | $ | 21.19 | | | $ | 19.11 | | | $ | 18.39 | |
|
Total Return | | | (7.99 | %) | | | (2.93 | %) | | | 11.00 | % | | | 3.86 | % | | | (3.77 | %) |
Ratios/Supplemental Data |
Net assets, end of period (in thousands) | | $ | 1,905 | | | $ | 4,525 | | | $ | 7,720 | | | $ | 4,453 | | | $ | 134 | |
Ratios to average net assets: |
Net investment income (loss) | | | 0.59 | % | | | 0.47 | % | | | (0.31 | %) | | | (0.65 | %) | | | (1.77 | %) |
Total expensesg | | | 1.67 | % | | | 1.58 | % | | | 1.75 | % | | | 2.44 | % | | | 3.31 | % |
Net expensesd,e,h | | | 1.66 | % | | | 1.57 | % | | | 1.72 | % | | | 2.44 | % | | | 2.87 | % |
Portfolio turnover rate | | | 126 | % | | | 255 | % | | | 92 | % | | | 235 | % | | | 124 | % |
28 | THE GUGGENHEIM FUNDS ANNUAL REPORT | SEE NOTES TO FINANCIAL STATEMENTS. |
FINANCIAL HIGHLIGHTS (concluded) |
This table is presented to show selected data for a share outstanding throughout each period and to assist shareholders in evaluating a Fund’s performance for the periods presented.
Institutional Class | | Year Ended
September 30,
2019 | | | Year Ended
September 30,
2018 | | | Year Ended
September 30,
2017 | | | Year Ended
September 30,
2016 | | | Year Ended
September 30,
2015 | |
Per Share Data | | | | | | | | | | | | | | | | | | | | |
Net asset value, beginning of period | | $ | 27.77 | | | $ | 29.86 | | | $ | 26.82 | | | $ | 25.73 | | | $ | 25.13 | |
Income (loss) from investment operations: |
Net investment income (loss)a | | | .28 | | | | .27 | | | | .12 | | | | (.13 | ) | | | (.40 | ) |
Net gain (loss) on investments (realized and unrealized) | | | (2.37 | ) | | | (.91 | ) | | | 2.93 | | | | 1.22 | | | | 1.00 | |
Total from investment operations | | | (2.09 | ) | | | (.64 | ) | | | 3.05 | | | | 1.09 | | | | .60 | |
Less distributions from: |
Net investment income | | | (.31 | ) | | | — | | | | — | | | | — | | | | (— | )b |
Net realized gains | | | — | | | | (1.45 | ) | | | (.01 | ) | | | — | | | | — | |
Total distributions | | | (.31 | ) | | | (1.45 | ) | | | (.01 | ) | | | — | | | | (— | )b |
Net asset value, end of period | | $ | 25.37 | | | $ | 27.77 | | | $ | 29.86 | | | $ | 26.82 | | | $ | 25.73 | |
|
Total Return | | | (7.57 | %) | | | (2.50 | %) | | | 11.42 | % | | | 4.20 | % | | | 2.41 | % |
Ratios/Supplemental Data |
Net assets, end of period (in thousands) | | $ | 79,318 | | | $ | 181,095 | | | $ | 196,180 | | | $ | 56,550 | | | $ | 50,304 | |
Ratios to average net assets: |
Net investment income (loss) | | | 1.05 | % | | | 0.94 | % | | | 0.40 | % | | | (0.49 | %) | | | (1.55 | %) |
Total expensesg | | | 1.22 | % | | | 1.12 | % | | | 1.38 | % | | | 2.23 | % | | | 2.80 | % |
Net expensesd,e,h | | | 1.21 | % | | | 1.12 | % | | | 1.37 | % | | | 2.23 | % | | | 2.80 | % |
Portfolio turnover rate | | | 126 | % | | | 255 | % | | | 92 | % | | | 235 | % | | | 124 | % |
a | Net investment income (loss) per share was computed using average shares outstanding throughout the period. |
b | Distributions from net investment income are less than $0.01 per share. |
c | Total return does not reflect the impact of any applicable sales charges. |
d | Net expense information reflects the expense ratios after expense waivers and reimbursements, as applicable. |
e | The portion of the ratios of net expenses to average net assets attributable to recoupments of prior fee reductions or expense reimbursements for the years presented was as follows: |
| | | 09/30/19 | 09/30/18 | 09/30/17 |
| | A-Class | 0.09% | 0.02% | 0.32% |
| | C-Class | 0.04% | 0.07% | 0.64% |
| | P-Class | 0.03% | 0.04% | — |
| | Institutional Class | 0.00%* | — | 0.01% |
f | Since commencement of operations: May 1, 2015. Percentage amounts for the period, except total return and portfolio turnover rate, have been annualized. |
g | Does not include expenses of the underlying funds in which the Fund invests. |
h | Net expenses may include expenses that are excluded from the expense limitation agreement. Excluding these expenses, the net expense ratios for the periods presented would be: |
| | | 09/30/19 | 09/30/18 | 09/30/17 | 09/30/16 | 09/30/15 |
| | A-Class | 1.64% | 1.52% | 2.00% | 2.11% | 2.11% |
| | C-Class | 2.48% | 2.30% | 2.71% | 2.86% | 2.86% |
| | P-Class | 1.66% | 1.56% | 1.68% | 1.87% | 2.10% |
| | Institutional Class | 1.21% | 1.11% | 1.28% | 1.63% | 1.86% |
SEE NOTES TO FINANCIAL STATEMENTS. | THE GUGGENHEIM FUNDS ANNUAL REPORT | 29 |
MANAGERS’ COMMENTARY (Unaudited) | September 30, 2019 |
To Our Shareholders:
Guggenheim Large Cap Value Fund is managed by a team of seasoned professionals led by David Toussaint, CFA, CPA, Managing Director and Portfolio Manager; James Schier, CFA, Senior Managing Director and Portfolio Manager; Farhan Sharaff, Senior Managing Director, Assistant Chief Investment Officer, Equities, and Portfolio Manager; Gregg Strohkorb, CFA, Director and Portfolio Manager; and Burak Hurmeydan, Ph.D., Director and Portfolio Manager. In the following paragraphs, the team discusses performance of the Fund for the fiscal year ended September 30, 2019.
For the fiscal year ended September 30, 2019, Guggenheim Large Cap Value Fund returned -3.59%1, compared with its benchmark, the Russell 1000® Value Index, which returned 4.00%.
Strategy and Market Overview
Our investment approach focuses on understanding how companies make money and how easily companies can improve returns, maintain existing high levels of profitability, or benefit from change that occurs within the industries in which they operate. In today’s rapidly changing environment marked by very sharp and quick, but constrained volatility, our long-term orientation and discipline are a competitive advantage. This should become especially critical when the environment of indiscriminant valuation expansion subsides, and fundamentals once again become a more dominant factor in the market.
Performance Review
The Fund underperformed the index significantly over a volatile one-year period, mostly due to the Fund’s deeper value bias relative to the benchmark. The growth investing style has strongly outperformed value for the last several years, but in the last months of the period value began to gain ground.
Stock selection was also a factor behind the Fund’s showing relative to the benchmark, with sector allocation providing additional headwind to results.
Highlighting the positive side was selection in Communications Services and in Consumer Staples and an overweight in Utilities. Most beneficial in Communications Services was not owning some media companies and CenturyLink, Inc, but this was offset by an underweight in strong performer AT&T, Inc. Similarly, in Consumer Staples, the Fund benefited from Tyson Foods, Inc., and Philip Morris International, Inc., and by not owning Kraft Heinz Co. The Utilities holdings benefited from an overweight in SCANA Corp., which was taken over by Dominion Energy during the period, and by not owning troubled California utility PG&E Corp.
On the negative side performance was driven by selection in Health Care, Materials, and Consumer Discretionary. Relative performance in Health Care was driven by poor performance among the Fund’s pharmaceutical, insurance, and biotech holdings. In Consumer Discretionary, big retail holding Macy’s, Inc., detracted, as did PVH Corp., and in Materials, poor performance in Nucor Corp. and Alcoa Corp. could not be overcome by strong performance from an overweight position in Reliance Steel & Aluminum Co.
Negative influences included unfavorable stock selection in the Energy sector. Oil prices softened over the period as economic uncertainty surrounding the trade dispute was especially magnified in smaller exploration and production companies. Fund holdings in Range Resources Corp. and Whiting Petroleum Corp. declined significantly in response. Overweights in large integrated oil company Chevron Corp. and transporter Kinder Morgan, Inc. were a sector bright spot.
Portfolio Positioning
While this strategy is balanced relative to the benchmark, it does possess defensive characteristics in virtue of overweights in Utilities and Health Care.
At the end of the period, the Fund’s largest overweights relative to the benchmark were in Financials and Materials. The Fund’s largest underweights were in Communication Services and Consumer Discretionary.
30 | THE GUGGENHEIM FUNDS ANNUAL REPORT | |
MANAGERS’ COMMENTARY (Unaudited)(concluded) | September 30, 2019 |
Portfolio and Market Outlook
The market volatility late in the year created sudden changes to the market. The perception of a friendlier environment from the Fed and continued hope that trade issues can be relatively quickly and favorably resolved has created an environment where the market is beginning to treat earnings disappointments and reduced outlooks in a less harsh manner since these are being viewed as more temporary issues. The total return potential for stocks now seems more favorable than it was just a few months ago, and the market appears to have begun the early phase of a calculated rebound that may have some duration in time and level.
The Fund has a value bias compared with the benchmark and is positioned favorably as the value investing style continues to improve. We continue to find niche companies with what we believe to be attractive growth opportunities, and, as such, are constructive on the outlook.
Performance displayed represents past performance which is no guarantee of future results.
1 | Performance figures are based on Class A shares and do not reflect deduction of the sales charges or taxes that a shareholder would pay on distributions or the redemption of shares. |
The opinions and forecast expressed may not actually come to pass. This information is subject to change at any time, based on market and other conditions, and should not be construed as a recommendation of any specific security or strategy.
| | THE GUGGENHEIM FUNDS ANNUAL REPORT | 31 |
PERFORMANCE REPORT AND FUND PROFILE (Unaudited) | September 30, 2019 |
LARGE CAP VALUE FUND
OBJECTIVE: Seeks long-term growth of capital.
Holdings Diversification (Market Exposure as % of Net Assets)
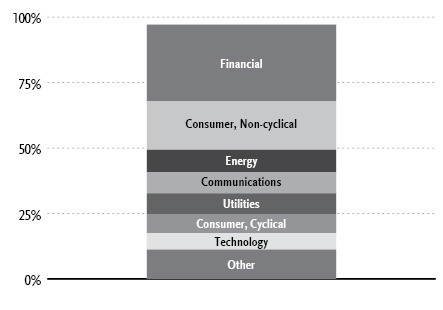
“Holdings Diversification (Market Exposure as % of Net Assets)” excludes any temporary cash investments.
Inception Dates: |
A-Class | August 7, 1944 |
C-Class | January 29, 1999 |
P-Class | May 1, 2015 |
Institutional Class | June 7, 2013 |
Ten Largest Holdings (% of Total Net Assets) |
Bank of America Corp. | 3.5% |
Chevron Corp. | 3.3% |
Citigroup, Inc. | 2.7% |
Intel Corp. | 2.7% |
iShares Russell 1000 Value ETF | 2.5% |
Verizon Communications, Inc. | 2.3% |
JPMorgan Chase & Co. | 2.3% |
Pfizer, Inc. | 2.3% |
Berkshire Hathaway, Inc. — Class B | 2.0% |
Wells Fargo & Co. | 1.9% |
Top Ten Total | 25.5% |
| | |
“Ten Largest Holdings” excludes any temporary cash investments. |
32 | THE GUGGENHEIM FUNDS ANNUAL REPORT | |
PERFORMANCE REPORT AND FUND PROFILE (Unaudited)(concluded) | September 30, 2019 |
Cumulative Fund Performance*
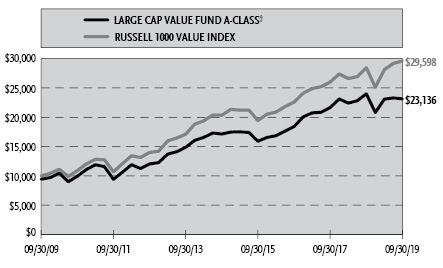
Average Annual Returns*
Periods Ended September 30, 2019
| 1 Year | 5 Year | 10 Year |
A-Class Shares | (3.59%) | 6.19% | 9.40% |
A-Class Shares with sales charge‡ | (8.17%) | 5.16% | 8.75% |
C-Class Shares | (4.28%) | 5.39% | 8.58% |
C-Class Shares with CDSC§ | (5.19%) | 5.39% | 8.58% |
Russell 1000 Value Index | 4.00% | 7.79% | 11.46% |
| 1 Year | 5 Year | Since
Inception
(06/07/13) |
Institutional Class Shares | (3.33%) | 6.44% | 8.17% |
Russell 1000 Value Index | 4.00% | 7.79% | 9.44% |
| | 1 Year | Since
Inception
(05/01/15) |
P-Class Shares | | (3.58%) | 6.20% |
Russell 1000 Value Index | | 4.00% | 7.41% |
* | The performance data above represents past performance that is not predictive of future results. The investment return and principal value of an investment in the Fund will fluctuate so that an investor’s shares, when redeemed, may be worth more or less than their original cost. Returns are historical and include changes in principal and reinvested dividends and capital gains and do not reflect the effect of taxes. The Russell 1000 Value Index is an unmanaged index and, unlike the Fund, has no management fees or operating expenses to reduce its reported return. The graph is based on A-Class shares only; performance for C-Class, P-Class and Institutional Class will vary due to differences in fee structures. |
‡ | Effective February 22, 2011, the maximum sales charge decreased from 5.75% to 4.75%. A 5.75% maximum sales charge is used in the calculation of the Average Annual Returns based on subscriptions made prior to February 22, 2011, and a 4.75% maximum sales charge will be used to calculate performance for periods based on subscriptions made on or after February 22, 2011. |
§ | Fund returns include a CDSC of 1% if redeemed within 12 months of purchase. |
| | THE GUGGENHEIM FUNDS ANNUAL REPORT | 33 |
SCHEDULE OF INVESTMENTS | September 30, 2019 |
LARGE CAP VALUE FUND | |
| | Shares | | | Value | |
COMMON STOCKS† - 94.7% |
| | | | | | | | | |
Financial - 29.3% |
Bank of America Corp. | | | 67,490 | | | $ | 1,968,683 | |
Citigroup, Inc. | | | 22,081 | | | | 1,525,355 | |
JPMorgan Chase & Co. | | | 10,847 | | | | 1,276,583 | |
Berkshire Hathaway, Inc. — Class B* | | | 5,352 | | | | 1,113,323 | |
Wells Fargo & Co. | | | 21,023 | | | | 1,060,400 | |
SunTrust Banks, Inc. | | | 11,705 | | | | 805,304 | |
Allstate Corp. | | | 6,658 | | | | 723,591 | |
Equity Commonwealth REIT | | | 19,760 | | | | 676,780 | |
Zions Bancorp North America | | | 15,175 | | | | 675,591 | |
Prudential Financial, Inc. | | | 6,727 | | | | 605,094 | |
Voya Financial, Inc. | | | 10,619 | | | | 578,098 | |
Principal Financial Group, Inc. | | | 10,025 | | | | 572,829 | |
MetLife, Inc. | | | 11,959 | | | | 563,987 | |
Hartford Financial Services Group, Inc. | | | 9,082 | | | | 550,460 | |
Loews Corp. | | | 10,029 | | | | 516,293 | |
Morgan Stanley | | | 9,603 | | | | 409,760 | |
Medical Properties Trust, Inc. REIT | | | 18,212 | | | | 356,227 | |
Regions Financial Corp. | | | 19,250 | | | | 304,535 | |
KeyCorp | | | 17,002 | | | | 303,316 | |
Charles Schwab Corp. | | | 7,179 | | | | 300,298 | |
American International Group, Inc. | | | 4,983 | | | | 277,553 | |
Old Republic International Corp. | | | 11,695 | | | | 275,651 | |
Marsh & McLennan Companies, Inc. | | | 2,739 | | | | 274,037 | |
Park Hotels & Resorts, Inc. REIT | | | 8,582 | | | | 214,292 | |
Jones Lang LaSalle, Inc. | | | 1,350 | | | | 187,731 | |
CIT Group, Inc. | | | 4,021 | | | | 182,192 | |
Total Financial | | | | | | | 16,297,963 | |
| | | | | | | | | |
Consumer, Non-cyclical - 18.6% |
Pfizer, Inc. | | | 34,985 | | | | 1,257,011 | |
Tyson Foods, Inc. — Class A | | | 8,317 | | | | 716,426 | |
McKesson Corp. | | | 4,953 | | | | 676,877 | |
Johnson & Johnson | | | 5,163 | | | | 667,989 | |
HCA Healthcare, Inc. | | | 5,191 | | | | 625,100 | |
Archer-Daniels-Midland Co. | | | 14,526 | | | | 596,583 | |
Procter & Gamble Co. | | | 4,497 | | | | 559,337 | |
Zimmer Biomet Holdings, Inc. | | | 3,805 | | | | 522,312 | |
Quest Diagnostics, Inc. | | | 4,820 | | | | 515,885 | |
Alexion Pharmaceuticals, Inc.* | | | 5,203 | | | | 509,582 | |
Merck & Company, Inc. | | | 5,747 | | | | 483,782 | |
Humana, Inc. | | | 1,800 | | | | 460,206 | |
Encompass Health Corp. | | | 6,762 | | | | 427,899 | |
Medtronic plc | | | 3,728 | | | | 404,936 | |
Bunge Ltd. | | | 6,688 | | | | 378,674 | |
Amgen, Inc. | | | 1,916 | | | | 370,765 | |
Biogen, Inc.* | | | 1,377 | | | | 320,593 | |
United Therapeutics Corp.* | | | 3,933 | | | | 313,657 | |
Mylan N.V.* | | | 11,569 | | | | 228,835 | |
UnitedHealth Group, Inc. | | | 956 | | | | 207,758 | |
Ingredion, Inc. | | | 1,421 | | | | 116,153 | |
Total Consumer, Non-cyclical | | | | | | | 10,360,360 | |
| | | | | | | | | |
Energy - 8.6% |
Chevron Corp. | | | 15,590 | | | | 1,848,974 | |
ConocoPhillips | | | 14,810 | | | | 843,874 | |
Exxon Mobil Corp. | | | 10,984 | | | | 775,580 | |
Marathon Oil Corp. | | | 43,193 | | | | 529,978 | |
Cabot Oil & Gas Corp. — Class A | | | 15,866 | | | | 278,766 | |
Parsley Energy, Inc. — Class A | | | 15,065 | | | | 253,092 | |
Whiting Petroleum Corp.* | | | 15,179 | | | | 121,887 | |
Range Resources Corp. | | | 29,532 | | | | 112,812 | |
Antero Resources Corp.* | | | 14,782 | | | | 44,642 | |
Total Energy | | | | | | | 4,809,605 | |
| | | | | | | | | |
Communications - 8.0% |
Verizon Communications, Inc. | | | 21,659 | | | | 1,307,337 | |
Comcast Corp. — Class A | | | 21,839 | | | | 984,502 | |
Symantec Corp. | | | 32,420 | | | | 766,084 | |
Cisco Systems, Inc. | | | 12,528 | | | | 619,009 | |
Juniper Networks, Inc. | | | 11,549 | | | | 285,838 | |
F5 Networks, Inc.* | | | 1,914 | | | | 268,764 | |
AT&T, Inc. | | | 6,381 | | | | 241,457 | |
Total Communications | | | | | | | 4,472,991 | |
| | | | | | | | | |
Utilities - 8.0% |
Exelon Corp. | | | 21,163 | | | | 1,022,384 | |
Public Service Enterprise Group, Inc. | | | 14,367 | | | | 891,903 | |
Edison International | | | 7,742 | | | | 583,902 | |
Duke Energy Corp. | | | 5,815 | | | | 557,426 | |
NiSource, Inc. | | | 13,520 | | | | 404,518 | |
Pinnacle West Capital Corp. | | | 4,056 | | | | 393,716 | |
AES Corp. | | | 19,964 | | | | 326,212 | |
PPL Corp. | | | 8,969 | | | | 282,434 | |
Total Utilities | | | | | | | 4,462,495 | |
| | | | | | | | | |
Consumer, Cyclical - 7.2% |
Walmart, Inc. | | | 7,481 | | | | 887,845 | |
Southwest Airlines Co. | | | 12,524 | | | | 676,421 | |
DR Horton, Inc. | | | 8,326 | | | | 438,864 | |
Walgreens Boots Alliance, Inc. | | | 7,342 | | | | 406,086 | |
Lear Corp. | | | 3,402 | | | | 401,096 | |
PACCAR, Inc. | | | 5,614 | | | | 393,036 | |
PVH Corp. | | | 3,928 | | | | 346,567 | |
Carnival Corp. | | | 6,345 | | | | 277,340 | |
Macy’s, Inc. | | | 12,315 | | | | 191,375 | |
Total Consumer, Cyclical | | | | | | | 4,018,630 | |
| | | | | | | | | |
Technology - 6.3% |
Intel Corp. | | | 29,094 | | | | 1,499,214 | |
Micron Technology, Inc.* | | | 18,416 | | | | 789,126 | |
Apple, Inc. | | | 2,826 | | | | 632,939 | |
Skyworks Solutions, Inc. | | | 3,589 | | | | 284,428 | |
Amdocs Ltd. | | | 4,135 | | | | 273,365 | |
Total Technology | | | | | | | 3,479,072 | |
| | | | | | | | | |
Basic Materials - 4.9% |
Nucor Corp. | | | 11,063 | | | | 563,217 | |
Huntsman Corp. | | | 21,747 | | | | 505,835 | |
Olin Corp. | | | 24,034 | | | | 449,917 | |
34 | THE GUGGENHEIM FUNDS ANNUAL REPORT | SEE NOTES TO FINANCIAL STATEMENTS. |
SCHEDULE OF INVESTMENTS (concluded) | September 30, 2019 |
LARGE CAP VALUE FUND | |
| | Shares | | | Value | |
DuPont de Nemours, Inc. | | | 4,778 | | | $ | 340,719 | |
Reliance Steel & Aluminum Co. | | | 2,787 | | | | 277,753 | |
Alcoa Corp.* | | | 13,599 | | | | 272,932 | |
Freeport-McMoRan, Inc. | | | 21,118 | | | | 202,099 | |
Dow, Inc. | | | 2,706 | | | | 128,941 | |
Total Basic Materials | | | | | | | 2,741,413 | |
| | | | | | | | | |
Industrial - 3.8% |
Owens Corning | | | 7,278 | | | | 459,970 | |
Eaton Corporation plc | | | 5,260 | | | | 437,369 | |
FedEx Corp. | | | 2,821 | | | | 410,653 | |
Johnson Controls International plc | | | 6,461 | | | | 283,573 | |
Knight-Swift Transportation Holdings, Inc. | | | 7,738 | | | | 280,890 | |
General Electric Co. | | | 26,811 | | | | 239,690 | |
Valmont Industries, Inc. | | | 30 | | | | 4,153 | |
Total Industrial | | | | | | | 2,116,298 | |
| | | | | | | | | |
Total Common Stocks | | | | | | | | |
(Cost $47,169,686) | | | | | | | 52,758,827 | |
| | | | | | | | | |
EXCHANGE-TRADED FUNDS† - 2.5% |
iShares Russell 1000 Value ETF | | | 10,913 | | | | 1,399,701 | |
Total Exchange-Traded Funds | | | | | | | | |
(Cost $1,417,371) | | | | | | | 1,399,701 | |
| | | | | | | | | |
MONEY MARKET FUND† - 2.7% |
Dreyfus Treasury Securities Cash Management Fund — Institutional Shares 1.83%1 | | | 1,529,002 | | | | 1,529,002 | |
Total Money Market Fund | | | | | | | | |
(Cost $1,529,002) | | | | | | | 1,529,002 | |
| | | | | | | | | |
Total Investments - 99.9% | | | | | | | | |
(Cost $50,116,059) | | | | | | $ | 55,687,530 | |
Other Assets & Liabilities, net - 0.1% | | | | | | | 47,067 | |
Total Net Assets - 100.0% | | | | | | $ | 55,734,597 | |
* | Non-income producing security. |
† | Value determined based on Level 1 inputs — See Note 4. |
1 | Rate indicated is the 7-day yield as of September 30, 2019. |
| | plc — Public Limited Company |
| | REIT — Real Estate Investment Trust |
| | |
| | See Sector Classification in Other Information section. |
The following table summarizes the inputs used to value the Fund’s investments at September 30, 2019 (See Note 4 in the Notes to Financial Statements):
Investments in Securities (Assets) | | Level 1
Quoted
Prices | | | Level 2
Significant
Observable
Inputs | | | Level 3
Significant
Unobservable
Inputs | | | Total | |
Common Stocks | | $ | 52,758,827 | | | $ | — | | | $ | — | | | $ | 52,758,827 | |
Exchange-Traded Funds | | | 1,399,701 | | | | — | | | | — | | | | 1,399,701 | |
Money Market Fund | | | 1,529,002 | | | | — | | | | — | | | | 1,529,002 | |
Total Assets | | $ | 55,687,530 | | | $ | — | | | $ | — | | | $ | 55,687,530 | |
SEE NOTES TO FINANCIAL STATEMENTS. | THE GUGGENHEIM FUNDS ANNUAL REPORT | 35 |
STATEMENT OF ASSETS AND LIABILITIES |
September 30, 2019 | |
Assets: |
Investments, at value (cost $50,116,059) | | $ | 55,687,530 | |
Prepaid expenses | | | 37,359 | |
Receivables: |
Dividends | | | 50,338 | |
Fund shares sold | | | 45,654 | |
Interest | | | 3,029 | |
Total assets | | | 55,823,910 | |
| | | | | |
Liabilities: |
Payable for: |
Professional fees | | | 26,642 | |
Management fees | | | 14,034 | |
Distribution and service fees | | | 11,459 | |
Printing fees | | | 10,743 | |
Fund shares redeemed | | | 9,452 | |
Transfer agent/maintenance fees | | | 5,738 | |
Fund accounting/administration fees | | | 3,431 | |
Trustees’ fees* | | | 1,158 | |
Miscellaneous | | | 6,656 | |
Total liabilities | | | 89,313 | |
Net assets | | $ | 55,734,597 | |
| | | | | |
Net assets consist of: |
Paid in capital | | $ | 46,031,031 | |
Total distributable earnings (loss) | | | 9,703,566 | |
Net assets | | $ | 55,734,597 | |
| | | | | |
A-Class: |
Net assets | | $ | 53,247,989 | |
Capital shares outstanding | | | 1,222,336 | |
Net asset value per share | | $ | 43.56 | |
Maximum offering price per share (Net asset value divided by 95.25%) | | $ | 45.73 | |
| | | | | |
C-Class: |
Net assets | | $ | 1,533,195 | |
Capital shares outstanding | | | 38,552 | |
Net asset value per share | | $ | 39.77 | |
| | | | | |
P-Class: |
Net assets | | $ | 155,170 | |
Capital shares outstanding | | | 3,570 | |
Net asset value per share | | $ | 43.46 | |
| | | | | |
Institutional Class: |
Net assets | | $ | 798,243 | |
Capital shares outstanding | | | 18,530 | |
Net asset value per share | | $ | 43.08 | |
STATEMENT OF OPERATIONS |
Year Ended September 30, 2019 | |
Investment Income: |
Dividends | | $ | 1,522,319 | |
Interest | | | 33,565 | |
Total investment income | | | 1,555,884 | |
| | | | | |
Expenses: |
Management fees | | | 393,936 | |
Distribution and service fees: |
A-Class | | | 136,456 | |
C-Class | | | 20,925 | |
P-Class | | | 365 | |
Transfer agent/maintenance fees: |
A-Class | | | 35,583 | |
C-Class | | | 3,964 | |
P-Class | | | 517 | |
Institutional Class | | | 6,436 | |
Registration fees | | | 63,842 | |
Fund accounting/administration fees | | | 48,485 | |
Trustees’ fees* | | | 15,667 | |
Custodian fees | | | 5,508 | |
Line of credit fees | | | 1,391 | |
Miscellaneous | | | 72,966 | |
Recoupment of previously waived fees: |
A-Class | | | 339 | |
Total expenses | | | 806,380 | |
Less: |
Expenses reimbursed by Adviser: |
A-Class | | | (35,924 | ) |
C-Class | | | (3,972 | ) |
P-Class | | | (517 | ) |
Institutional Class | | | (6,450 | ) |
Expenses waived by Adviser | | | (54,900 | ) |
Earnings credits applied | | | (29 | ) |
Total waived/reimbursed expenses | | | (101,792 | ) |
Net expenses | | | 704,588 | |
Net investment income | | | 851,296 | |
| | | | | |
Net Realized and Unrealized Gain (Loss): |
Net realized gain (loss) on: |
Investments | | | 3,806,953 | |
Net realized gain | | | 3,806,953 | |
Net change in unrealized appreciation (depreciation) on: |
Investments | | | (6,975,646 | ) |
Net change in unrealized appreciation (depreciation) | | | (6,975,646 | ) |
Net realized and unrealized loss | | | (3,168,693 | ) |
Net decrease in net assets resulting from operations | | $ | (2,317,397 | ) |
* | Relates to Trustees not deemed “interested persons” within the meaning of Section 2(a)(19) of the 1940 Act. |
36 | THE GUGGENHEIM FUNDS ANNUAL REPORT | SEE NOTES TO FINANCIAL STATEMENTS. |
STATEMENTS OF CHANGES IN NET ASSETS |
| | Year Ended
September 30,
2019 | | | Year Ended
September 30,
2018 | |
Increase (Decrease) in Net Assets from Operations: | | | | | | | | |
Net investment income | | $ | 851,296 | | | $ | 664,410 | |
Net realized gain on investments | | | 3,806,953 | | | | 3,673,389 | |
Net change in unrealized appreciation (depreciation) on investments | | | (6,975,646 | ) | | | 2,449,400 | |
Net increase (decrease) in net assets resulting from operations | | | (2,317,397 | ) | | | 6,787,199 | |
| | | | | | | | | |
Distributions to shareholders: | | | | | | | | |
A-Class | | | (3,032,549 | ) | | | (4,834,379 | ) |
C-Class | | | (126,553 | ) | | | (270,772 | ) |
P-Class | | | (8,136 | ) | | | (13,541 | ) |
Institutional Class | | | (281,733 | ) | | | (138,868 | ) |
Total distributions to shareholders | | | (3,448,971 | ) | | | (5,257,560 | ) |
| | | | | | | | | |
Capital share transactions: | | | | | | | | |
Proceeds from sale of shares | | | | | | | | |
A-Class | | | 6,686,468 | | | | 6,355,403 | |
C-Class | | | 506,809 | | | | 245,690 | |
P-Class | | | 45,579 | | | | 72,298 | |
Institutional Class | | | 323,966 | | | | 6,251,039 | |
Distributions reinvested | | | | | | | | |
A-Class | | | 2,987,616 | | | | 4,749,467 | |
C-Class | | | 125,361 | | | | 268,713 | |
P-Class | | | 8,136 | | | | 13,541 | |
Institutional Class | | | 281,712 | | | | 138,868 | |
Cost of shares redeemed | | | | | | | | |
A-Class | | | (7,766,149 | ) | | | (16,074,401 | ) |
C-Class | | | (1,482,917 | ) | | | (1,394,173 | ) |
P-Class | | | (33,283 | ) | | | (99,917 | ) |
Institutional Class | | | (5,275,661 | ) | | | (2,419,628 | ) |
Net decrease from capital share transactions | | | (3,592,363 | ) | | | (1,893,100 | ) |
Net decrease in net assets | | | (9,358,731 | ) | | | (363,461 | ) |
| | | | | | | | | |
Net assets: | | | | | | | | |
Beginning of year | | | 65,093,328 | | | | 65,456,789 | |
End of year | | $ | 55,734,597 | | | $ | 65,093,328 | |
| | | | | | | | | |
Capital share activity: | | | | | | | | |
Shares sold | | | | | | | | |
A-Class | | | 150,959 | | | | 133,690 | |
C-Class | | | 13,082 | | | | 5,729 | |
P-Class | | | 1,073 | | | | 1,564 | |
Institutional Class | | | 7,458 | | | | 137,565 | |
Shares issued from reinvestment of distributions | | | | | | | | |
A-Class | | | 77,180 | | | | 102,359 | |
C-Class | | | 3,526 | | | | 6,287 | |
P-Class | | | 211 | | | | 292 | |
Institutional Class | | | 7,373 | | | | 3,028 | |
Shares redeemed | | | | | | | | |
A-Class | | | (178,286 | ) | | | (344,514 | ) |
C-Class | | | (37,828 | ) | | | (32,179 | ) |
P-Class | | | (783 | ) | | | (2,155 | ) |
Institutional Class | | | (121,202 | ) | | | (51,806 | ) |
Net decrease in shares | | | (77,237 | ) | | | (40,140 | ) |
SEE NOTES TO FINANCIAL STATEMENTS. | THE GUGGENHEIM FUNDS ANNUAL REPORT | 37 |
This table is presented to show selected data for a share outstanding throughout each period and to assist shareholders in evaluating a Fund’s performance for the periods presented.
A-Class | | Year Ended
September 30,
2019 | | | Year Ended
September 30,
2018 | | | Year Ended
September 30,
2017 | | | Year Ended
September 30,
2016 | | | Year Ended
September 30,
2015 | |
Per Share Data | | | | | | | | | | | | | | | | | | | | |
Net asset value, beginning of period | | $ | 48.08 | | | $ | 46.96 | | | $ | 41.78 | | | $ | 39.11 | | | $ | 43.80 | |
Income (loss) from investment operations: |
Net investment income (loss)a | | | .62 | | | | .48 | | | | .37 | | | | .58 | | | | .36 | |
Net gain (loss) on investments (realized and unrealized) | | | (2.66 | ) | | | 4.46 | | | | 6.80 | | | | 5.23 | | | | (3.36 | ) |
Total from investment operations | | | (2.04 | ) | | | 4.94 | | | | 7.17 | | | | 5.81 | | | | (3.00 | ) |
Less distributions from: |
Net investment income | | | (.36 | ) | | | (.51 | ) | | | (.58 | ) | | | (.37 | ) | | | (.35 | ) |
Net realized gains | | | (2.12 | ) | | | (3.31 | ) | | | (1.41 | ) | | | (2.77 | ) | | | (1.34 | ) |
Total distributions | | | (2.48 | ) | | | (3.82 | ) | | | (1.99 | ) | | | (3.14 | ) | | | (1.69 | ) |
Net asset value, end of period | | $ | 43.56 | | | $ | 48.08 | | | $ | 46.96 | | | $ | 41.78 | | | $ | 39.11 | |
|
Total Returnb | | | (3.59 | %) | | | 10.82 | % | | | 17.68 | % | | | 15.69 | % | | | (7.19 | %) |
Ratios/Supplemental Data |
Net assets, end of period (in thousands) | | $ | 53,248 | | | $ | 56,369 | | | $ | 60,157 | | | $ | 55,325 | | | $ | 45,318 | |
Ratios to average net assets: |
Net investment income (loss) | | | 1.42 | % | | | 1.03 | % | | | 0.83 | % | | | 1.48 | % | | | 0.85 | % |
Total expensesc | | | 1.31 | % | | | 1.31 | % | | | 1.30 | % | | | 1.34 | % | | | 1.35 | % |
Net expensesd,e,f | | | 1.15 | % | | | 1.15 | % | | | 1.17 | % | | | 1.17 | % | | | 1.16 | % |
Portfolio turnover rate | | | 37 | % | | | 24 | % | | | 40 | % | | | 56 | % | | | 60 | % |
C-Class | | Year Ended
September 30,
2019 | | | Year Ended
September 30,
2018 | | | Year Ended
September 30,
2017 | | | Year Ended
September 30,
2016 | | | Year Ended
September 30,
2015 | |
Per Share Data | | | | | | | | | | | | | | | | | | | | |
Net asset value, beginning of period | | $ | 44.03 | | | $ | 43.29 | | | $ | 38.68 | | | $ | 36.38 | | | $ | 40.91 | |
Income (loss) from investment operations: |
Net investment income (loss)a | | | .26 | | | | .12 | | | | .03 | | | | .27 | | | | .04 | |
Net gain (loss) on investments (realized and unrealized) | | | (2.40 | ) | | | 4.09 | | | | 6.28 | | | | 4.87 | | | | (3.13 | ) |
Total from investment operations | | | (2.14 | ) | | | 4.21 | | | | 6.31 | | | | 5.14 | | | | (3.09 | ) |
Less distributions from: |
Net investment income | | | — | | | | (.16 | ) | | | (.29 | ) | | | (.07 | ) | | | (.10 | ) |
Net realized gains | | | (2.12 | ) | | | (3.31 | ) | | | (1.41 | ) | | | (2.77 | ) | | | (1.34 | ) |
Total distributions | | | (2.12 | ) | | | (3.47 | ) | | | (1.70 | ) | | | (2.84 | ) | | | (1.44 | ) |
Net asset value, end of period | | $ | 39.77 | | | $ | 44.03 | | | $ | 43.29 | | | $ | 38.68 | | | $ | 36.38 | |
|
Total Returnb | | | (4.28 | %) | | | 9.97 | % | | | 16.74 | % | | | 14.87 | % | | | (7.89 | %) |
Ratios/Supplemental Data |
Net assets, end of period (in thousands) | | $ | 1,533 | | | $ | 2,632 | | | $ | 3,461 | | | $ | 3,075 | | | $ | 3,345 | |
Ratios to average net assets: |
Net investment income (loss) | | | 0.66 | % | | | 0.28 | % | | | 0.08 | % | | | 0.75 | % | | | 0.10 | % |
Total expensesc | | | 2.18 | % | | | 2.10 | % | | | 2.09 | % | | | 2.18 | % | | | 2.16 | % |
Net expensesd,e,f | | | 1.90 | % | | | 1.90 | % | | | 1.92 | % | | | 1.92 | % | | | 1.91 | % |
Portfolio turnover rate | | | 37 | % | | | 24 | % | | | 40 | % | | | 56 | % | | | 60 | % |
38 | THE GUGGENHEIM FUNDS ANNUAL REPORT | SEE NOTES TO FINANCIAL STATEMENTS. |
FINANCIAL HIGHLIGHTS (continued) |
This table is presented to show selected data for a share outstanding throughout each period and to assist shareholders in evaluating a Fund’s performance for the periods presented.
P-Class | | Year Ended
September 30,
2019 | | | Year Ended
September 30,
2018 | | | Year Ended
September 30,
2017 | | | Year Ended
September 30,
2016 | | | Period Ended
September 30,
2015g | |
Per Share Data | | | | | | | | | | | | | | | | | | | | |
Net asset value, beginning of period | | $ | 48.00 | | | $ | 46.91 | | | $ | 41.74 | | | $ | 39.13 | | | $ | 43.64 | |
Income (loss) from investment operations: |
Net investment income (loss)a | | | .61 | | | | .49 | | | | .37 | | | | 1.40 | | | | .22 | |
Net gain (loss) on investments (realized and unrealized) | | | (2.64 | ) | | | 4.44 | | | | 6.78 | | | | 4.44 | | | | (4.73 | ) |
Total from investment operations | | | (2.03 | ) | | | 4.93 | | | | 7.15 | | | | 5.84 | | | | (4.51 | ) |
Less distributions from: |
Net investment income | | | (.39 | ) | | | (.53 | ) | | | (.57 | ) | | | (.46 | ) | | | — | |
Net realized gains | | | (2.12 | ) | | | (3.31 | ) | | | (1.41 | ) | | | (2.77 | ) | | | — | |
Total distributions | | | (2.51 | ) | | | (3.84 | ) | | | (1.98 | ) | | | (3.23 | ) | | | — | |
Net asset value, end of period | | $ | 43.46 | | | $ | 48.00 | | | $ | 46.91 | | | $ | 41.74 | | | $ | 39.13 | |
|
Total Return | | | (3.58 | %) | | | 10.80 | % | | | 17.63 | % | | | 15.83 | % | | | (10.38 | %) |
Ratios/Supplemental Data |
Net assets, end of period (in thousands) | | $ | 155 | | | $ | 147 | | | $ | 158 | | | $ | 123 | | | $ | 9 | |
Ratios to average net assets: |
Net investment income (loss) | | | 1.41 | % | | | 1.03 | % | | | 0.83 | % | | | 3.61 | % | | | 1.21 | % |
Total expensesc | | | 1.60 | % | | | 1.59 | % | | | 1.69 | % | | | 1.41 | % | | | 3.29 | % |
Net expensesd,e,f | | | 1.15 | % | | | 1.15 | % | | | 1.17 | % | | | 1.17 | % | | | 1.16 | % |
Portfolio turnover rate | | | 37 | % | | | 24 | % | | | 40 | % | | | 56 | % | | | 60 | % |
SEE NOTES TO FINANCIAL STATEMENTS. | THE GUGGENHEIM FUNDS ANNUAL REPORT | 39 |
FINANCIAL HIGHLIGHTS (concluded) |
This table is presented to show selected data for a share outstanding throughout each period and to assist shareholders in evaluating a Fund’s performance for the periods presented.
Institutional Class | | Year Ended
September 30,
2019 | | | Year Ended
September 30,
2018 | | | Year Ended
September 30,
2017 | | | Year Ended
September 30,
2016 | | | Year Ended
September 30,
2015 | |
Per Share Data | | | | | | | | | | | | | | | | | | | | |
Net asset value, beginning of period | | $ | 47.60 | | | $ | 46.56 | | | $ | 41.84 | | | $ | 39.17 | | | $ | 43.87 | |
Income (loss) from investment operations: |
Net investment income (loss)a | | | .71 | | | | .64 | | | | .51 | | | | .83 | | | | .47 | |
Net gain (loss) on investments (realized and unrealized) | | | (2.63 | ) | | | 4.35 | | | | 6.72 | | | | 5.10 | | | | (3.37 | ) |
Total from investment operations | | | (1.92 | ) | | | 4.99 | | | | 7.23 | | | | 5.93 | | | | (2.90 | ) |
Less distributions from: |
Net investment income | | | (.48 | ) | | | (.64 | ) | | | (1.10 | ) | | | (.49 | ) | | | (.46 | ) |
Net realized gains | | | (2.12 | ) | | | (3.31 | ) | | | (1.41 | ) | | | (2.77 | ) | | | (1.34 | ) |
Total distributions | | | (2.60 | ) | | | (3.95 | ) | | | (2.51 | ) | | | (3.26 | ) | | | (1.80 | ) |
Net asset value, end of period | | $ | 43.08 | | | $ | 47.60 | | | $ | 46.56 | | | $ | 41.84 | | | $ | 39.17 | |
|
Total Return | | | (3.33 | %) | | | 11.04 | % | | | 17.96 | % | | | 15.98 | % | | | (6.97 | %) |
Ratios/Supplemental Data |
Net assets, end of period (in thousands) | | $ | 798 | | | $ | 5,946 | | | $ | 1,681 | | | $ | 40 | | | $ | 2,544 | |
Ratios to average net assets: |
Net investment income (loss) | | | 1.65 | % | | | 1.39 | % | | | 1.13 | % | | | 2.13 | % | | | 1.09 | % |
Total expensesc | | | 1.14 | % | | | 1.00 | % | | | 1.07 | % | | | 1.04 | % | | | 0.98 | % |
Net expensesd,e,f | | | 0.90 | % | | | 0.90 | % | | | 0.92 | % | | | 0.92 | % | | | 0.91 | % |
Portfolio turnover rate | | | 37 | % | | | 24 | % | | | 40 | % | | | 56 | % | | | 60 | % |
a | Net investment income (loss) per share was computed using average shares outstanding throughout the period. |
b | Total return does not reflect the impact of any applicable sales charges. |
c | Does not include expenses of the underlying funds in which the Fund invests. |
d | Net expense information reflects the expense ratios after expense waivers and reimbursements, as applicable. |
e | The portion of the ratios of net expenses to average net assets attributable to recoupments of prior fee reductions or expense reimbursements for the years presented was as follows: |
| | | 09/30/19 | 09/30/18 | 09/30/17 |
| | A-Class | 0.00%* | 0.00%* | 0.01% |
| | C-Class | — | 0.00%* | 0.01% |
| | P-Class | — | — | 0.00%* |
| | Institutional Class | — | — | 0.02% |
f | Net expenses may include expenses that are excluded from the expense limitation agreement. Excluding these expenses, the net expense ratios for the years presented would be: |
| | | 09/30/19 | 09/30/18 | 09/30/17 | 09/30/16 | 09/30/15 |
| | A-Class | 1.15% | 1.15% | 1.15% | 1.15% | 1.15% |
| | C-Class | 1.90% | 1.90% | 1.90% | 1.90% | 1.90% |
| | P-Class | 1.15% | 1.15% | 1.15% | 1.15% | 1.15% |
| | Institutional Class | 0.90% | 0.90% | 0.90% | 0.90% | 0.90% |
g | Since commencement of operations: May 1, 2015. Percentage amounts for the period, except total return and portfolio turnover rate, have been annualized. |
40 | THE GUGGENHEIM FUNDS ANNUAL REPORT | SEE NOTES TO FINANCIAL STATEMENTS. |
MANAGERS’ COMMENTARY (Unaudited) | September 30, 2019 |
To Our Shareholders:
Guggenheim Market Neutral Real Estate Fund (the “Fund”) is managed by a team of seasoned professionals, including Jayson Flowers, Senior Managing Director and Portfolio Manager; and Thomas Youn, CFA, Managing Director and Portfolio Manager. In the following paragraphs, the investment team discusses performance for the fiscal year ended September 30, 2019.
For the fiscal year ended September 30, 2019, Guggenheim Market Neutral Real Estate Fund returned 8.12%1, compared with the 2.39% return of its benchmark, the ICE BofA Merrill Lynch 3-Month U.S. Treasury Bill Index.
Investment Approach
The Fund seeks to generate high risk-adjusted absolute returns with minimal market exposure and minimal correlation with other major asset classes. The Fund primarily utilizes a pair-trading strategy to exploit relative value opportunities among publicly traded real estate equities. The portfolio will typically maintain long exposure of 90-100% of net assets and short exposure of 90-100% of net assets under normal conditions, with minimal net market exposure.
The strategy utilizes a relative value framework that is specialized for the real estate sector. Top-down views on the private commercial real estate (“CRE”) and public REIT markets are formulated to drive sector allocation decisions. Individual securities evaluated and selected on a bottom-up basis using fundamental analysis and due diligence.
Market Review
After being range-bound for several years, REITs enjoyed a strong rally during 2019 and broke out to new all-time highs. In addition, REITs performed exceptionally well on a relative basis. In early 2018, we formed the view that REITs were poised to outperform the broad market based on a multi-year period of underperformance compared to the S&P 500 and the potential reversal in earnings growth trends (REITs accelerating and S&P 500 decelerating). That view played out as expected with the FTSE NAREIT Equity REITs Index delivering a total return of 18.42% compared to a 4.25% return for the S&P 500 Index. In fact, the REIT sector was the second-best performing sector within the S&P 500. Several trends that supported the strong REIT returns include the Federal Reserve’s “dovish pivot” in early 2019, the collapse in investment grade bond yields due to tightening credit spreads and lower Treasury yields and the improving outlook for REIT fundamentals and earnings growth. Broadly speaking, the global economy slowed considerably over the course of the year and investors sought havens as recession risk concerns grew. REITs have historically acted as a defensive sector and were a clear beneficiary of this trend.
The best-performing REIT sectors during the fiscal year were manufactured housing (+46%), net lease (+35%) and healthcare (+33%). Manufactured housing continues to benefit from steady demand, with little new supply on the horizon. The sector continues to post some of the strongest organic cash flow growth rates within the REIT sector. The net lease and healthcare sectors benefitted particularly well from the sharp decline in interest rates and the macro flight to quality. Both are considered to be defensive sectors and both derive a significant portion of earnings growth from positive spread investing (acquiring properties at yield above a REIT’s average cost of capital). The worst-performing sectors were regional malls (-13%), hotels (-12%), and timber REITs (-9%). Regional malls continue to suffer from elevated retail store closures as the industry rationalizes its space needs and finds the appropriate balance between online vs. brick-and-mortar distribution channels. Hotels suffered directly from the slowing macroeconomic backdrop. Similarly, timber REITs suffered from the broader economic slowdown and depressed lumber prices.
In the private market, CRE fundamentals remain healthy with a balanced demand and supply picture. Market rent growth and occupancy gains have moderated from cyclical peak levels but continue to support respectable property level cash flow growth in the 3% range. To be sure, certain pockets of the CRE market face challenges such as the elevated pace of store closures affecting retail landlords and the impact of new construction deliveries impacting senior housing and self-storage landlords. On balance, however, CRE fundamentals have remained steady against a backdrop of slow global economic growth.
Capital market conditions remain particularly robust and have improved over the past year as interest rates and credit spreads fell substantially. Current conditions provide strong support for CRE and REIT valuations. Indeed, after a period of flat to rising CRE cap rates in certain cases, there is early indication of a renewed downward trend in market cap rates.
| | THE GUGGENHEIM FUNDS ANNUAL REPORT | 41 |
MANAGERS’ COMMENTARY (Unaudited)(concluded) | September 30, 2019 |
Performance Review
The Fund outperformed its benchmark for the fiscal year ended September 30, 2019. Since inception (February 26, 2016), the Fund has outperformed the benchmark index, with an average annual return of 3.90% compared with 1.34% for the benchmark.
The Fund generated broad-based positive attribution across most subsectors. Strong stock selection along with favorable sector allocation biases supported returns. The leading contributors were long positions in residential, wireless tower, and healthcare REITs. The Fund also posted a strong gain on a short position in the mall sector. Poor stock selection within the net lease and data center sectors were the primary negative performance contributors.
The Fund utilizes total return swaps for hedging purposes by gaining short exposure to individual equity REIT securities. Derivative exposure performed as expected.
Strategy
The Fund maintained approximately 93% long exposure and 92% short exposure resulting in minimal exposure to equity REITs or the broad market during the year. Current exposure levels are typical, as the Fund seeks to redeploy capital into newly identified relative value opportunities. This was up from the end of the last period, when the Fund was involved in profit-taking on certain paired trades and de-risking given market volatility. Portfolio construction remains defensively positioned against moderating CRE fundamentals. Key sector overweights at period end include residential, wireless tower, net lease and healthcare REITs. We believe these sectors present attractive growth prospects relative to current valuations and will prove defensive in the event of a downshift in economic growth. Key sector underweights are lodging, real estate services, and retail REITs.
Outlook
Reflecting upon our views heading into 2019, we were positioned defensively against the potential for slower economic growth,and the potential for a significant market correction. Quarterly GDP growth did in fact slow from a high of 3.2% in June 2018 to 2.0% in September 2019. As one would expect, the S&P 500 Index experienced a sharp 20% correction at the end of 2018 as growth decelerated. However, we did not anticipate the sustained rally in risk assets over the course of the year. Against the backdrop of deteriorating economic and earnings growth, the S&P 500 and FNRE Indices both reached new all-time-highs in late 2019. As we look forward to the coming year, it strikes us that the strong gains for the S&P 500 were primarily driven by hope and optimism rather than fundamentals. Objectively speaking, most, if not all the gains for the S&P 500 was driven by multiple expansion rather than earnings growth, which approached flat to negative by late 2019.
Our macro research team highlights the steady increase in recession risk heading into 2020. Absolute valuation levels remain stretched by historical standards. There also remains considerable macro risk on the horizon whether it be a Fed policy mistake, a lingering trade war with China, or a negative surprise stemming from the upcoming presidential election.
Against this backdrop, the Fund remains defensively positioned in terms of market exposure. Positioning within the underlying long-only and long/short sleeves remains defensive as well in terms of sector weightings and factor exposures, though the size of various exposure tilts have been reduced. While our defensive posture served us well over the past year, much of the “bad news” has been reported and is arguably incorporated into market expectations.
We believe REITs are particularly well positioned in the current environment of slowing growth, rising recession risk and historically low interest rates. REITs have historically acted as a haven within the broader market during downturns, while offering above average income and inflation protection. Further, our unique risk-managed framework and defensive positioning has the potential to provide additional protection should macroeconomic conditions continue to deteriorate over the coming year.
Performance displayed represents past performance which is no guarantee of future results.
1 | Performance figures are based on Class A shares and do not reflect deduction of the sales charges or taxes that a shareholder would pay on distributions or the redemption of shares. |
The opinions and forecast expressed may not actually come to pass. This information is subject to change at any time, based on market and other conditions, and should not be construed as a recommendation of any specific security or strategy.
42 | THE GUGGENHEIM FUNDS ANNUAL REPORT | |
PERFORMANCE REPORT AND FUND PROFILE (Unaudited) | September 30, 2019 |
MARKET NEUTRAL REAL ESTATE FUND
OBJECTIVE: Seeks to provide capital appreciation, while limiting exposure to general stock market risk.
Holdings Diversification (Market Exposure as % of Net Assets)
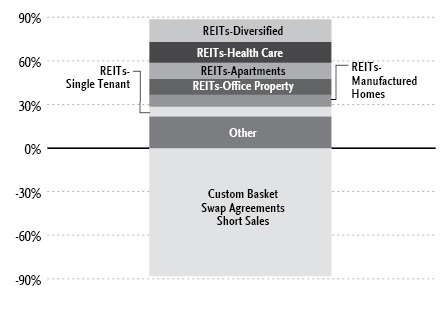
“Holdings Diversification (Market Exposure as % of Net Assets)” excludes any temporary cash investments.
Inception Dates: |
A-Class | February 26, 2016 |
C-Class | February 26, 2016 |
P-Class | February 26, 2016 |
Institutional Class | February 26, 2016 |
Ten Largest Holdings (% of Total Net Assets) |
InterXion Holding N.V. | 4.5% |
Invitation Homes, Inc. | 4.4% |
Safehold, Inc. | 4.2% |
Sun Communities, Inc. | 4.2% |
American Tower Corp. — Class A | 4.0% |
HCP, Inc. | 4.0% |
Omega Healthcare Investors, Inc. | 4.0% |
Ventas, Inc. | 4.0% |
Equinix, Inc. | 4.0% |
Equity LifeStyle Properties, Inc. | 3.9% |
Top Ten Total | 41.2% |
| | |
“Ten Largest Holdings” excludes any temporary cash or derivative investments. |
| | THE GUGGENHEIM FUNDS ANNUAL REPORT | 43 |
PERFORMANCE REPORT AND FUND PROFILE (Unaudited)(concluded) | September 30, 2019 |
Cumulative Fund Performance*
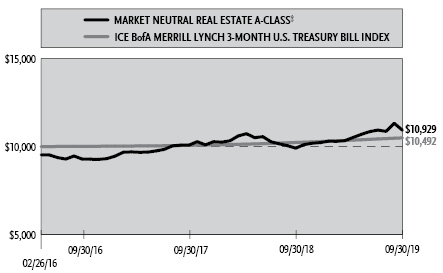
Average Annual Returns*
Periods Ended September 30, 2019
| 1 Year | Since
Inception
(02/26/16) |
A-Class Shares | 8.12% | 3.90% |
A-Class Shares with sales charge‡ | 3.00% | 2.50% |
C-Class Shares | 7.15% | 3.10% |
C-Class Shares with CDSC§ | 6.15% | 3.10% |
P-Class Shares | 7.80% | 3.79% |
Institutional Class Shares | 8.19% | 4.10% |
ICE BofA Merrill Lynch 3-Month U.S. Treasury Bill Index | 2.39% | 1.34% |
* | The performance data above represents past performance that is not predictive of future results. The investment return and principal value of an investment in the Fund will fluctuate so that an investor’s shares, when redeemed, may be worth more or less than their original cost. Returns are historical and include changes in principal and reinvested dividends and capital gains and do not reflect the effect of taxes. The ICE BofA Merrill Lynch 3-Month U.S. Treasury Bill Index is an unmanaged index and, unlike the Fund, has no management fees or operating expenses to reduce its reported return. The graph is based on A-Class shares only; performance for C-Class, P-Class, and Institutional Class will vary due to differences in fee structures. |
‡ | Fund returns are calculate using the maximum sales charge of 4.75%. |
§ | Fund returns include a CDSC of 1% if redeemed within 12 months of purchase. |
44 | THE GUGGENHEIM FUNDS ANNUAL REPORT | |
SCHEDULE OF INVESTMENTS | September 30, 2019 |
MARKET NEUTRAL REAL ESTATE FUND | |
| | Shares | | | Value | |
COMMON STOCKS† - 88.5% |
| | | | | | | | | |
REITs - 79.8% |
REITs-Diversified - 15.7% |
American Tower Corp. — Class A | | | 1,590 | | | $ | 351,597 | |
Equinix, Inc.1 | | | 597 | | | | 344,350 | |
Crown Castle International Corp.1 | | | 2,470 | | | | 343,355 | |
GEO Group, Inc. | | | 9,484 | | | | 164,453 | |
Four Corners Property Trust, Inc. | | | 3,043 | | | | 86,056 | |
iStar, Inc. | | | 6,159 | | | | 80,375 | |
Total REITs-Diversified | | | | | | | 1,370,186 | |
| | | | | | | | | |
REITs-Health Care - 14.2% |
HCP, Inc.1 | | | 9,854 | | | | 351,098 | |
Omega Healthcare Investors, Inc.1 | | | 8,284 | | | | 346,188 | |
Ventas, Inc.1 | | | 4,732 | | | | 345,578 | |
CareTrust REIT, Inc. | | | 8,209 | | | | 192,953 | |
Total REITs-Health Care | | | | | | | 1,235,817 | |
| | | | | | | | | |
REITs-Apartments - 11.2% |
Invitation Homes, Inc. | | | 13,013 | | | | 385,315 | |
Equity Residential1 | | | 3,771 | | | | 325,286 | |
American Homes 4 Rent — Class A | | | 10,379 | | | | 268,712 | |
Total REITs-Apartments | | | | | | | 979,313 | |
| | | | | | | | | |
REITs-Office Property - 10.9% |
Cousins Properties, Inc. | | | 6,834 | | | | 256,890 | |
Highwoods Properties, Inc. | | | 4,953 | | | | 222,588 | |
Equity Commonwealth | | | 5,063 | | | | 173,408 | |
Hudson Pacific Properties, Inc. | | | 4,626 | | | | 154,786 | |
JBG SMITH Properties1 | | | 3,305 | | | | 129,589 | |
Total REITs-Office Property | | | | | | | 937,261 | |
| | | | | | | | | |
REITs-Manufactured Homes - 8.1% |
Sun Communities, Inc.1 | | | 2,456 | | | | 364,593 | |
Equity LifeStyle Properties, Inc.1 | | | 2,571 | | | | 343,486 | |
Total REITs-Manufactured Homes | | | | | | | 708,079 | |
| | | | | | | | | |
REITs-Single Tenant - 6.8% |
Spirit Realty Capital, Inc. | | | 6,818 | | | | 326,309 | |
National Retail Properties, Inc. | | | 4,696 | | | | 264,854 | |
Total REITs-Single Tenant | | | | | | | 591,163 | |
| | | | | | | | | |
REITs-Warehouse/Industries - 6.0% |
Americold Realty Trust1 | | | 7,064 | | | | 261,862 | |
Terreno Realty Corp.1 | | | 2,581 | | | | 131,863 | |
Rexford Industrial Realty, Inc.1 | | | 2,981 | | | | 131,224 | |
Total REITs-Warehouse/Industries | | | | | | | 524,949 | |
| | | | | | | | | |
REITs-Storage - 2.6% |
Extra Space Storage, Inc. | | | 1,964 | | | | 229,434 | |
| | | | | | | | | |
REITs-Hotels - 2.3% |
Pebblebrook Hotel Trust | | | 7,315 | | | | 203,503 | |
| | | | | | | | | |
REITs-Shopping Centers - 2.0% |
Federal Realty Investment Trust | | | 1,262 | | | | 171,809 | |
Total REITs | | | | | | | 6,951,514 | |
| | | | | | | | | |
Software - 4.5% |
Computer Software - 4.5% |
InterXion Holding N.V.* | | | 4,802 | | | | 391,171 | |
| | | | | | | | | |
Real Estate - 4.2% |
Real Estate Management/Services - 4.2% |
Safehold, Inc. | | | 12,134 | | | | 370,087 | |
| | | | | | | | | |
Total Common Stocks | | | | | | | | |
(Cost $6,722,985) | | | | | | | 7,712,772 | |
| | | | | | | | | |
MONEY MARKET FUND† - 16.7% |
Goldman Sachs Financial Square Treasury Instruments Fund — Institutional Shares 1.79%2 | | | 1,454,656 | | | | 1,454,656 | |
Total Money Market Fund | | | | | | | | |
(Cost $1,454,656) | | | | | | | 1,454,656 | |
| | | | | | | | | |
Total Investments - 105.2% | | | | | | | | |
(Cost $8,177,641) | | | | | | $ | 9,167,428 | |
Other Assets & Liabilities, net - (5.2)% | | | | | | | (454,953 | ) |
Total Net Assets - 100.0% | | | | | | $ | 8,712,475 | |
Custom Basket Swap Agreements | | | | |
Counterparty | Reference Obligation | Financing Rate
Pay (Receive) | | Payment
Frequency | | | Maturity
Date | | | Notional
Amount | | | Value and
Unrealized
Depreciation | |
OTC Custom Basket Swap Agreements Sold Short†† | | | | | | | | |
Morgan Stanley Capital Services LLC | MS Equity Custom Basket | (1.44)% (Federal Funds Rate - 0.41%) | At Maturity | | | 07/22/24 | | | $ | 3,839,842 | | | $ | (167,386 | ) |
Goldman Sachs International | GS Equity Custom Basket | (1.50)% (Federal Funds Rate - 0.38%) | At Maturity | | | 05/06/24 | | | | 3,839,842 | | | | (102,747 | ) |
| | | | | | | | | | | | | $ | 7,679,684 | | | $ | (270,133 | ) |
SEE NOTES TO FINANCIAL STATEMENTS. | THE GUGGENHEIM FUNDS ANNUAL REPORT | 45 |
SCHEDULE OF INVESTMENTS (continued) | September 30, 2019 |
MARKET NEUTRAL REAL ESTATE FUND | |
| | Shares | | | Percentage
Notional
Amount | | | Value and
Unrealized
Appreciation
(Depreciation) | |
MS EQUITY SHORT CUSTOM BASKET | | | | | | | | |
Financial | | | | | | | | | | | | |
Hersha Hospitality Trust | | | 7,966 | | | | (3.09 | )% | | $ | 7,722 | |
Tanger Factory Outlet Centers, Inc. | | | 5,147 | | | | (2.07 | )% | | | 2,984 | |
Cushman & Wakefield plc | | | 4,637 | | | | (2.24 | )% | | | 742 | |
Public Storage | | | 355 | | | | (2.27 | )% | | | 424 | |
American Finance Trust, Inc. | | | 6,283 | | | | (2.28 | )% | | | (986 | ) |
CBRE Group, Inc. — Class A | | | 1,622 | | | | (2.24 | )% | | | (1,102 | ) |
Washington Real Estate Investment Trust | | | 3,806 | | | | (2.71 | )% | | | (1,104 | ) |
Vornado Realty Trust | | | 1,843 | | | | (3.06 | )% | | | (1,253 | ) |
SL Green Realty Corp. | | | 1,071 | | | | (2.28 | )% | | | (1,499 | ) |
Xenia Hotels & Resorts, Inc. | | | 6,604 | | | | (3.63 | )% | | | (2,443 | ) |
Marcus & Millichap, Inc. | | | 2,305 | | | | (2.13 | )% | | | (3,390 | ) |
Easterly Government Properties, Inc. | | | 4,231 | | | | (2.35 | )% | | | (4,126 | ) |
Service Properties Trust | | | 3,824 | | | | (2.57 | )% | | | (4,168 | ) |
Apollo Commercial Real Estate Finance, Inc. | | | 7,121 | | | | (3.56 | )% | | | (4,420 | ) |
Monmouth Real Estate Investment Corp. | | | 5,929 | | | | (2.23 | )% | | | (4,823 | ) |
Healthcare Realty Trust, Inc. | | | 3,557 | | | | (3.10 | )% | | | (5,722 | ) |
Brandywine Realty Trust | | | 8,285 | | | | (3.27 | )% | | | (6,877 | ) |
Physicians Realty Trust | | | 8,040 | | | | (3.72 | )% | | | (7,036 | ) |
Piedmont Office Realty Trust, Inc. — Class A | | | 7,645 | | | | (4.16 | )% | | | (7,186 | ) |
NexPoint Residential Trust, Inc. | | | 1,597 | | | | (1.94 | )% | | | (9,374 | ) |
Washington Prime Group, Inc. | | | 12,776 | | | | (1.38 | )% | | | (9,965 | ) |
Digital Realty Trust, Inc. | | | 1,042 | | | | (3.52 | )% | | | (10,254 | ) |
Kimco Realty Corp. | | | 4,381 | | | | (2.38 | )% | | | (11,916 | ) |
VEREIT, Inc. | | | 14,411 | | | | (3.67 | )% | | | (13,069 | ) |
Independence Realty Trust, Inc. | | | 5,260 | | | | (1.96 | )% | | | (13,097 | ) |
Total Financial | | | | | | | | | | | (111,938 | ) |
| | | | | | | | | | | | | |
Consumer, Cyclical | | | | | | | | | | | | |
Hyatt Hotels Corp. — Class A | | | 1,720 | | | | (3.30 | )% | | | 1,081 | |
Marriott International, Inc. — Class A | | | 892 | | | | (2.89 | )% | | | (2,065 | ) |
Total Consumer, Cyclical | | | | | | | | | | | (984 | ) |
| | | | | | | | | | | | | |
Exchange Traded Funds | | | | | | | | | | | | |
iShares U.S. Home Construction ETF | | | 1,014 | | | | (1.14 | )% | | | (4,137 | ) |
iShares U.S. Real Estate ETF | | | 3,429 | | | | (8.35 | )% | | | (19,820 | ) |
Vanguard Real Estate ETF | | | 6,800 | | | | (16.51 | )% | | $ | (30,507 | ) |
Total Exchange Traded Funds | | | | | | | | | | | (54,464 | ) |
Total MS Equity Short Custom Basket | | | | | | $ | (167,386 | ) |
| | | | | | | | | |
GS EQUITY SHORT CUSTOM BASKET | | | | | | | | |
Financial | | | | | | | | | | | | |
Hersha Hospitality Trust | | | 7,966 | | | | (3.09 | )% | | | 13,170 | |
SL Green Realty Corp. | | | 1,071 | | | | (2.28 | )% | | | 6,590 | |
Vornado Realty Trust | | | 1,843 | | | | (3.06 | )% | | | 5,591 | |
Tanger Factory Outlet Centers, Inc. | | | 5,147 | | | | (2.07 | )% | | | 3,971 | |
Brandywine Realty Trust | | | 8,285 | | | | (3.27 | )% | | | 1,606 | |
Physicians Realty Trust | | | 8,040 | | | | (3.72 | )% | | | 1,174 | |
Washington Prime Group, Inc. | | | 12,776 | | | | (1.38 | )% | | | 482 | |
Public Storage | | | 355 | | | | (2.27 | )% | | | 417 | |
Xenia Hotels & Resorts, Inc. | | | 6,604 | | | | (3.63 | )% | | | 249 | |
Washington Real Estate Investment Trust | | | 3,806 | | | | (2.71 | )% | | | 207 | |
American Finance Trust, Inc. | | | 6,283 | | | | (2.28 | )% | | | (887 | ) |
Piedmont Office Realty Trust, Inc. — Class A | | | 7,645 | | | | (4.16 | )% | | | (2,504 | ) |
Cushman & Wakefield plc | | | 4,637 | | | | (2.24 | )% | | | (2,824 | ) |
Marcus & Millichap, Inc. | | | 2,305 | | | | (2.13 | )% | | | (3,321 | ) |
Apollo Commercial Real Estate Finance, Inc. | | | 7,121 | | | | (3.56 | )% | | | (3,820 | ) |
Healthcare Realty Trust, Inc. | | | 3,557 | | | | (3.10 | )% | | | (3,947 | ) |
Easterly Government Properties, Inc. | | | 4,231 | | | | (2.35 | )% | | | (4,027 | ) |
CBRE Group, Inc. — Class A | | | 1,622 | | | | (2.24 | )% | | | (4,428 | ) |
Service Properties Trust | | | 3,824 | | | | (2.57 | )% | | | (4,512 | ) |
Monmouth Real Estate Investment Corp. | | | 5,929 | | | | (2.23 | )% | | | (4,676 | ) |
Digital Realty Trust, Inc. | | | 1,042 | | | | (3.52 | )% | | | (8,856 | ) |
VEREIT, Inc. | | | 14,411 | | | | (3.67 | )% | | | (9,990 | ) |
NexPoint Residential Trust, Inc. | | | 1,597 | | | | (1.94 | )% | | | (10,412 | ) |
Kimco Realty Corp. | | | 4,381 | | | | (2.38 | )% | | | (11,073 | ) |
Independence Realty Trust, Inc. | | | 5,260 | | | | (1.96 | )% | | | (14,675 | ) |
Total Financial | | | | | | | | | | | (56,495 | ) |
| | | | | | | | | | | | | |
Exchange Traded Funds | | | | | | | | | | | | |
iShares U.S. Home Construction ETF | | | 1,014 | | | | (1.14 | )% | | | (4,180 | ) |
iShares U.S. Real Estate ETF | | | 3,429 | | | | (8.35 | )% | | | (15,128 | ) |
Vanguard Real Estate ETF | | | 6,800 | | | | (16.51 | )% | | | (25,989 | ) |
Total Exchange Traded Funds | | | | | | | | | | | (45,297 | ) |
| | | | | | | | | | | | | |
46 | THE GUGGENHEIM FUNDS ANNUAL REPORT | SEE NOTES TO FINANCIAL STATEMENTS. |
SCHEDULE OF INVESTMENTS (concluded) | September 30, 2019 |
MARKET NEUTRAL REAL ESTATE FUND | |
| | Shares | | | Percentage
Notional
Amount | | | Value and
Unrealized
Appreciation
(Depreciation) | |
Consumer, Cyclical | | | | | | | | | | | | |
Hyatt Hotels Corp. — Class A | | | 1,720 | | | | (3.30 | )% | | $ | 1,091 | |
Marriott International, Inc. — Class A | | | 892 | | | | (2.89 | )% | | | (2,046 | ) |
Total Consumer, Cyclical | | | | | | | | | | | (955 | ) |
Total GS Equity Short Custom Basket | | | | | | $ | (102,747 | ) |
* | Non-income producing security. |
† | Value determined based on Level 1 inputs — See Note 4. |
†† | Value determined based on Level 2 inputs — See Note 4. |
1 | All or a portion of this security is pledged as custom basket swap collateral at September 30, 2019. |
2 | Rate indicated is the 7-day yield as of September 30, 2019. |
| | GS — Goldman Sachs International |
| | MS — Morgan Stanley Capital Services LLC |
| | REIT — Real Estate Investment Trust |
| | |
| | See Sector Classification in Other Information section. |
The following table summarizes the inputs used to value the Fund’s investments at September 30, 2019 (See Note 4 in the Notes to Financial Statements):
Investments in Securities (Assets) | | Level 1
Quoted
Prices | | | Level 2
Significant
Observable
Inputs | | | Level 3
Significant
Unobservable
Inputs | | | Total | |
Common Stocks | | $ | 7,712,772 | | | $ | — | | | $ | — | | | $ | 7,712,772 | |
Money Market Fund | | | 1,454,656 | | | | — | | | | — | | | | 1,454,656 | |
Total Assets | | $ | 9,167,428 | | | $ | — | | | $ | — | | | $ | 9,167,428 | |
Investments in Securities (Liabilities) | | Level 1
Quoted
Prices | | | Level 2
Significant
Observable
Inputs | | | Level 3
Significant
Unobservable
Inputs | | | Total | |
Custom Basket Swap Agreements** | | $ | — | | | $ | 270,133 | | | $ | — | | | $ | 270,133 | |
** | This derivative is reported as unrealized appreciation/depreciation at period end. |
SEE NOTES TO FINANCIAL STATEMENTS. | THE GUGGENHEIM FUNDS ANNUAL REPORT | 47 |
MARKET NEUTRAL REAL ESTATE FUND | |
STATEMENT OF ASSETS AND LIABILITIES |
September 30, 2019 | |
Assets: |
Investments, at value (cost $8,177,641) | | $ | 9,167,428 | |
Prepaid expenses | | | 31,637 | |
Receivables: |
Dividends | | | 23,870 | |
Investment Adviser | | | 13,393 | |
Interest | | | 1,382 | |
Total assets | | | 9,237,710 | |
| | | | | |
Liabilities: |
Unrealized depreciation on OTC swap agreements | | | 270,133 | |
Payable for: |
Swap settlement | | | 207,384 | |
Professional fees | | | 32,676 | |
Transfer agent/maintenance fees | | | 4,447 | |
Trustees’ fees* | | | 1,129 | |
Distribution and service fees | | | 697 | |
Miscellaneous | | | 8,769 | |
Total liabilities | | | 525,235 | |
Net assets | | $ | 8,712,475 | |
| | | | | |
Net assets consist of: |
Paid in capital | | $ | 7,854,240 | |
Total distributable earnings (loss) | | | 858,235 | |
Net assets | | $ | 8,712,475 | |
| | | | | |
A-Class: |
Net assets | | $ | 2,766,154 | |
Capital shares outstanding | | | 102,645 | |
Net asset value per share | | $ | 26.95 | |
Maximum offering price per share (Net asset value divided by 95.25%) | | $ | 28.29 | |
| | | | | |
C-Class: |
Net assets | | $ | 135,035 | |
Capital shares outstanding | | | 5,179 | |
Net asset value per share | | $ | 26.07 | |
| | | | | |
P-Class: |
Net assets | | $ | 331,973 | |
Capital shares outstanding | | | 12,721 | |
Net asset value per share | | $ | 26.10 | |
| | | | | |
Institutional Class: |
Net assets | | $ | 5,479,313 | |
Capital shares outstanding | | | 204,892 | |
Net asset value per share | | $ | 26.74 | |
STATEMENT OF OPERATIONS |
Year Ended September 30, 2019 | |
Investment Income: |
Dividends | | $ | 180,741 | |
Interest | | | 34,025 | |
Total investment income | | | 214,766 | |
| | | | | |
Expenses: |
Management fees | | | 91,833 | |
Distribution and service fees: |
A-Class | | | 6,548 | |
C-Class | | | 1,345 | |
P-Class | | | 714 | |
Transfer agent/maintenance fees: |
A-Class | | | 12,339 | |
C-Class | | | 526 | |
P-Class | | | 1,396 | |
Institutional Class | | | 14,906 | |
Registration fees | | | 60,940 | |
Professional fees | | | 50,526 | |
Fund accounting/administration fees | | | 24,999 | |
Trustees’ fees* | | | 15,469 | |
Custodian fees | | | 6,601 | |
Line of credit fees | | | 199 | |
Miscellaneous | | | 21,843 | |
Recoupment of previously waived fees: |
A-Class | | | 1 | |
C-Class | | | 25 | |
P-Class | | | 38 | |
Institutional Class | | | 1,486 | |
Total expenses | | | 311,734 | |
Less: |
Expenses reimbursed by Adviser: |
A-Class | | | (33,649 | ) |
C-Class | | | (1,593 | ) |
P-Class | | | (3,793 | ) |
Institutional Class | | | (57,675 | ) |
Expenses waived by Adviser | | | (90,173 | ) |
Earnings credits applied | | | (27 | ) |
Total waived/reimbursed expenses | | | (186,910 | ) |
Net expenses | | | 124,824 | |
Net investment income | | | 89,942 | |
| | | | | |
Net Realized and Unrealized Gain (Loss): |
Net realized gain (loss) on: |
Investments | | | 437,840 | |
Swap agreements | | | (350,683 | ) |
Net realized gain | | | 87,157 | |
Net change in unrealized appreciation (depreciation) on: |
Investments | | | 822,047 | |
Swap agreements | | | (354,351 | ) |
Net change in unrealized appreciation (depreciation) | | | 467,696 | |
Net realized and unrealized gain | | | 554,853 | |
Net increase in net assets resulting from operations | | $ | 644,795 | |
* | Relates to Trustees not deemed “interested persons” within the meaning of Section 2(a)(19) of the 1940 Act. |
48 | THE GUGGENHEIM FUNDS ANNUAL REPORT | SEE NOTES TO FINANCIAL STATEMENTS. |
MARKET NEUTRAL REAL ESTATE FUND | |
STATEMENTS OF CHANGES IN NET ASSETS |
| | Year Ended
September 30,
2019 | | | Year Ended
September 30,
2018 | |
Increase (Decrease) in Net Assets from Operations: | | | | | | | | |
Net investment income | | $ | 89,942 | | | $ | 86,678 | |
Net realized gain on investments | | | 87,157 | | | | 56,932 | |
Net change in unrealized appreciation (depreciation) on investments | | | 467,696 | | | | (120,277 | ) |
Net increase in net assets resulting from operations | | | 644,795 | | | | 23,333 | |
| | | | | | | | | |
Distributions to shareholders: | | | | | | | | |
A-Class | | | (23,934 | ) | | | (5,777 | ) |
C-Class | | | (1,887 | ) | | | (5,619 | ) |
P-Class | | | (8,952 | ) | | | (17,831 | ) |
Institutional Class | | | (123,892 | ) | | | (264,679 | ) |
Total distributions to shareholders | | | (158,665 | ) | | | (293,906 | ) |
| | | | | | | | | |
Capital share transactions: | | | | | | | | |
Proceeds from sale of shares | | | | | | | | |
A-Class | | | 444,400 | | | | 2,387,527 | |
C-Class | | | 7,500 | | | | 31,922 | |
P-Class | | | 93,822 | | | | 420,704 | |
Institutional Class | | | 7,504 | | | | 120,194 | |
Distributions reinvested | | | | | | | | |
A-Class | | | 23,478 | | | | 5,777 | |
C-Class | | | 1,887 | | | | 5,619 | |
P-Class | | | 8,952 | | | | 17,831 | |
Institutional Class | | | 123,892 | | | | 264,679 | |
Cost of shares redeemed | | | | | | | | |
A-Class | | | (359,944 | ) | | | (40,735 | ) |
C-Class | | | (16,459 | ) | | | (38,217 | ) |
P-Class | | | (268,362 | ) | | | (238,079 | ) |
Institutional Class | | | (27,812 | ) | | | (49,845 | ) |
Net increase from capital share transactions | | | 38,858 | | | | 2,887,377 | |
Net increase in net assets | | | 524,988 | | | | 2,616,804 | |
| | | | | | | | | |
Net assets: | | | | | | | | |
Beginning of year | | | 8,187,487 | | | | 5,570,683 | |
End of year | | $ | 8,712,475 | | | $ | 8,187,487 | |
| | | | | | | | | |
Capital share activity: | | | | | | | | |
Shares sold | | | | | | | | |
A-Class | | | 17,134 | | | | 95,960 | |
C-Class | | | 292 | | | | 1,230 | |
P-Class | | | 3,568 | | | | 15,930 | |
Institutional Class | | | 289 | | | | 4,477 | |
Shares issued from reinvestment of distributions | | | | | | | | |
A-Class | | | 922 | | | | 225 | |
C-Class | | | 76 | | | | 221 | |
P-Class | | | 363 | | | | 693 | |
Institutional Class | | | 4,912 | | | | 10,239 | |
Shares redeemed | | | | | | | | |
A-Class | | | (14,079 | ) | | | (1,629 | ) |
C-Class | | | (640 | ) | | | (1,459 | ) |
P-Class | | | (10,616 | ) | | | (9,466 | ) |
Institutional Class | | | (1,078 | ) | | | (1,947 | ) |
Net increase in shares | | | 1,143 | | | | 114,474 | |
SEE NOTES TO FINANCIAL STATEMENTS. | THE GUGGENHEIM FUNDS ANNUAL REPORT | 49 |
MARKET NEUTRAL REAL ESTATE FUND | |
This table is presented to show selected data for a share outstanding throughout each period and to assist shareholders in evaluating a Fund’s performance for the periods presented.
A-Class | | Year Ended
September 30,
2019 | | | Year Ended
September 30,
2018 | | | Year Ended
September 30,
2017 | | | Period Ended
September 30,
2016a | |
Per Share Data | | | | | | | | | | | | | | | | |
Net asset value, beginning of period | | $ | 25.16 | | | $ | 26.47 | | | $ | 24.45 | | | $ | 25.00 | |
Income (loss) from investment operations: |
Net investment income (loss)b | | | .25 | | | | .50 | | | | .08 | | | | .24 | |
Net gain (loss) on investments (realized and unrealized) | | | 1.78 | | | | (.41 | ) | | | 1.94 | | | | (.79 | ) |
Total from investment operations | | | 2.03 | | | | .09 | | | | 2.02 | | | | (.55 | ) |
Less distributions from: |
Net investment income | | | (.01 | ) | | | — | | | | — | | | | — | |
Net realized gains | | | (.23 | ) | | | (1.40 | ) | | | — | | | | — | |
Total distributions | | | (.24 | ) | | | (1.40 | ) | | | — | | | | — | |
Net asset value, end of period | | $ | 26.95 | | | $ | 25.16 | | | $ | 26.47 | | | $ | 24.45 | |
|
Total Returnc | | | 8.12 | % | | | 0.13 | % | | | 8.38 | % | | | (2.20 | %) |
Ratios/Supplemental Data |
Net assets, end of period (in thousands) | | $ | 2,766 | | | $ | 2,482 | | | $ | 109 | | | $ | 100 | |
Ratios to average net assets: |
Net investment income (loss) | | | 0.96 | % | | | 2.00 | % | | | 0.31 | % | | | 1.66 | % |
Total expenses | | | 3.99 | % | | | 5.01 | % | | | 4.88 | % | | | 3.74 | % |
Net expensesd,e,f | | | 1.62 | % | | | 1.65 | % | | | 1.65 | % | | | 1.64 | % |
Portfolio turnover rate | | | 180 | % | | | 216 | % | | | 145 | % | | | 135 | % |
C-Class | | Year Ended
September 30,
2019 | | | Year Ended
September 30,
2018 | | | Year Ended
September 30,
2017 | | | Period Ended
September 30,
2016a | |
Per Share Data | | | | | | | | | | | | | | | | |
Net asset value, beginning of period | | $ | 24.67 | | | $ | 26.16 | | | $ | 24.35 | | | $ | 25.00 | |
Income (loss) from investment operations: |
Net investment income (loss)b | | | .05 | | | | .12 | | | | (.11 | ) | | | .12 | |
Net gain (loss) on investments (realized and unrealized) | | | 1.70 | | | | (.21 | ) | | | 1.92 | | | | (.77 | ) |
Total from investment operations | | | 1.75 | | | | (.09 | ) | | | 1.81 | | | | (.65 | ) |
Less distributions from: |
Net investment income | | | (.12 | ) | | | — | | | | — | | | | — | |
Net realized gains | | | (.23 | ) | | | (1.40 | ) | | | — | | | | — | |
Total distributions | | | (.35 | ) | | | (1.40 | ) | | | — | | | | — | |
Net asset value, end of period | | $ | 26.07 | | | $ | 24.67 | | | $ | 26.16 | | | $ | 24.35 | |
|
Total Returnc | | | 7.15 | % | | | (0.59 | %) | | | 7.56 | % | | | (2.60 | %) |
Ratios/Supplemental Data |
Net assets, end of period (in thousands) | | $ | 135 | | | $ | 134 | | | $ | 143 | | | $ | 97 | |
Ratios to average net assets: |
Net investment income (loss) | | | 0.18 | % | | | 0.47 | % | | | (0.52 | %) | | | 0.93 | % |
Total expenses | | | 4.66 | % | | | 5.72 | % | | | 5.70 | % | | | 4.47 | % |
Net expensesd,e,f | | | 2.40 | % | | | 2.38 | % | | | 2.40 | % | | | 2.38 | % |
Portfolio turnover rate | | | 180 | % | | | 216 | % | | | 145 | % | | | 135 | % |
50 | THE GUGGENHEIM FUNDS ANNUAL REPORT | SEE NOTES TO FINANCIAL STATEMENTS. |
MARKET NEUTRAL REAL ESTATE FUND | |
FINANCIAL HIGHLIGHTS (continued) |
This table is presented to show selected data for a share outstanding throughout each period and to assist shareholders in evaluating a Fund’s performance for the periods presented.
P-Class | | Year Ended
September 30,
2019 | | | Year Ended
September 30,
2018 | | | Year Ended
September 30,
2017 | | | Period Ended
September 30,
2016a | |
Per Share Data | | | | | | | | | | | | | | | | |
Net asset value, beginning of period | | $ | 25.14 | | | $ | 26.48 | | | $ | 24.45 | | | $ | 25.00 | |
Income (loss) from investment operations: |
Net investment income (loss)b | | | .20 | | | | .33 | | | | .16 | | | | .26 | |
Net gain (loss) on investments (realized and unrealized) | | | 1.71 | | | | (.27 | ) | | | 1.87 | | | | (.81 | ) |
Total from investment operations | | | 1.91 | | | | .06 | | | | 2.03 | | | | (.55 | ) |
Less distributions from: |
Net investment income | | | (.72 | ) | | | — | | | | — | | | | — | |
Net realized gains | | | (.23 | ) | | | (1.40 | ) | | | — | | | | — | |
Total distributions | | | (.95 | ) | | | (1.40 | ) | | | — | | | | — | |
Net asset value, end of period | | $ | 26.10 | | | $ | 25.14 | | | $ | 26.48 | | | $ | 24.45 | |
|
Total Return | | | 7.80 | % | | | 0.09 | % | | | 8.34 | % | | | (2.20 | %) |
Ratios/Supplemental Data |
Net assets, end of period (in thousands) | | $ | 332 | | | $ | 488 | | | $ | 324 | | | $ | 124 | |
Ratios to average net assets: |
Net investment income (loss) | | | 0.77 | % | | | 1.26 | % | | | 0.52 | % | | | 1.64 | % |
Total expenses | | | 4.05 | % | | | 4.93 | % | | | 5.18 | % | | | 3.65 | % |
Net expensesd,e,f | | | 1.65 | % | | | 1.65 | % | | | 1.65 | % | | | 1.66 | % |
Portfolio turnover rate | | | 180 | % | | | 216 | % | | | 145 | % | | | 135 | % |
SEE NOTES TO FINANCIAL STATEMENTS. | THE GUGGENHEIM FUNDS ANNUAL REPORT | 51 |
MARKET NEUTRAL REAL ESTATE FUND | |
FINANCIAL HIGHLIGHTS (concluded) |
This table is presented to show selected data for a share outstanding throughout each period and to assist shareholders in evaluating a Fund’s performance for the periods presented.
Institutional Class | | Year Ended
September 30,
2019 | | | Year Ended
September 30,
2018 | | | Year Ended
September 30,
2017 | | | Period Ended
September 30,
2016a | |
Per Share Data | | | | | | | | | | | | | | | | |
Net asset value, beginning of period | | $ | 25.32 | | | $ | 26.57 | | | $ | 24.49 | | | $ | 25.00 | |
Income (loss) from investment operations: |
Net investment income (loss)b | | | .31 | | | | .36 | | | | .14 | | | | .28 | |
Net gain (loss) on investments (realized and unrealized) | | | 1.73 | | | | (.21 | ) | | | 1.94 | | | | (.79 | ) |
Total from investment operations | | | 2.04 | | | | .15 | | | | 2.08 | | | | (.51 | ) |
Less distributions from: |
Net investment income | | | (.39 | ) | | | — | | | | — | | | | — | |
Net realized gains | | | (.23 | ) | | | (1.40 | ) | | | — | | | | — | |
Total distributions | | | (.62 | ) | | | (1.40 | ) | | | — | | | | — | |
Net asset value, end of period | | $ | 26.74 | | | $ | 25.32 | | | $ | 26.57 | | | $ | 24.49 | |
|
Total Return | | | 8.19 | % | | | 0.36 | % | | | 8.62 | % | | | (2.04 | %) |
Ratios/Supplemental Data |
Net assets, end of period (in thousands) | | $ | 5,479 | | | $ | 5,083 | | | $ | 4,995 | | | $ | 4,604 | |
Ratios to average net assets: |
Net investment income (loss) | | | 1.18 | % | | | 1.39 | % | | | 0.55 | % | | | 1.92 | % |
Total expenses | | | 3.57 | % | | | 4.59 | % | | | 4.52 | % | | | 3.41 | % |
Net expensesd,e,f | | | 1.40 | % | | | 1.40 | % | | | 1.40 | % | | | 1.39 | % |
Portfolio turnover rate | | | 180 | % | | | 216 | % | | | 145 | % | | | 135 | % |
a | Since commencement of operations: February 26, 2016. Percentage amounts for the period, except total return and portfolio turnover rate, have been annualized. |
b | Net investment income (loss) per share was computed using average shares outstanding throughout the period. |
c | Total return does not reflect the impact of any applicable sales charges. |
d | Net expense information reflects the expense ratios after expense waivers and reimbursements, as applicable. |
e | The portion of the ratios of net expenses to average net assets attributable to recoupments of prior fee reductions or expense reimbursements for the years presented was as follows: |
| | | 09/30/19 | 09/30/18 | 09/30/17 |
| | A-Class | 0.00%* | — | 0.22% |
| | C-Class | 0.02% | — | 0.22% |
| | P-Class | 0.01% | — | 0.16% |
| | Institutional Class | 0.03% | — | 0.18% |
f | Net expenses may include expenses that are excluded from the expense limitation agreement. Excluding these expenses, the net expense ratios for the periods presented would be: |
| | | 09/30/19 | 09/30/18 | 09/30/17 | 09/30/16 |
| | A-Class | 1.62% | 1.65% | 1.63% | 1.63% |
| | C-Class | 2.40% | 2.37% | 2.37% | 2.37% |
| | P-Class | 1.65% | 1.65% | 1.63% | 1.65% |
| | Institutional Class | 1.40% | 1.40% | 1.38% | 1.38% |
52 | THE GUGGENHEIM FUNDS ANNUAL REPORT | SEE NOTES TO FINANCIAL STATEMENTS. |
MANAGERS’ COMMENTARY (Unaudited) | September 30, 2019 |
To Our Shareholders:
Guggenheim Risk Managed Real Estate Fund (the “Fund”) is managed by a team of seasoned professionals, including Jayson Flowers, Senior Managing Director and Portfolio Manager; and Thomas Youn, CFA, Managing Director and Portfolio Manager. In the following paragraphs, the investment team discusses performance for the fiscal year ended September 30, 2019.
For the fiscal year ended September 30, 2019, the Guggenheim Risk Managed Real Estate Fund returned 21.12%1, compared with the 18.42% return of its benchmark, the FTSE NAREIT Equity REITs Index (“REIT Index”).
Investment Approach
Our investment framework follows a differentiated approach to REIT investing that seeks to both outperform the REIT index and to actively mitigate volatility and drawdown risk. To accomplish this, the strategy combines a traditional long-only REIT strategy, a market-neutral long/short REIT strategy, and a framework for actively modulating the Fund’s overall market exposure. The Fund will typically maintain an average market exposure, or beta to the REIT Index, of approximately 0.90 by targeting an average long-only sleeve allocation of 90% and long/short sleeve allocation of 40%. The targeted sleeve weights are adjusted monthly to effectively modulate the Fund’s overall market exposure as warranted by market conditions.
The underlying long-only and long/short sleeves are managed independently within the Fund using a fundamental, relative value framework that is specialized for the real estate sector. Top-down views on private commercial real estate (“CRE”) and public REIT markets are formulated to drive sector allocation decisions. Individual securities are evaluated and selected on a bottom-up basis using fundamental analysis and due diligence.
Market Review
After being range-bound for several years, REITs enjoyed a strong rally during 2019 and broke out to new all-time highs. In addition, REITs performed exceptionally well on a relative basis. In early 2018, we formed the view that REITs were poised to outperform the broad market based on a multi-year period of underperformance compared to the S&P 500 and the potential reversal in earnings growth trends (REITs accelerating and S&P 500 decelerating). That view played out as expected with the REIT Index delivering a total return of 18.42% compared to a 4.25% return for the S&P 500 Index. In fact, the REIT sector was the second-best performing sector within the S&P 500. Several trends that supported the strong REIT returns include the Federal Reserve’s “dovish pivot” in early 2019, the collapse in investment grade bond yields due to tightening credit spreads and lower Treasury yields and the improving outlook for REIT fundamentals and earnings growth. Broadly speaking, the global economy slowed considerably over the course of the year and investors sought havens as recession risk concerns grew. REITs have historically acted as a defensive sector and were a clear beneficiary of this trend.
The best-performing REIT sectors during the fiscal year were manufactured housing (+46%), net lease (+35%) and healthcare (+33%). Manufactured housing continues to benefit from steady demand, with little new supply on the horizon. The sector continues to post some of the strongest organic cash flow growth rates within the REIT sector. The net lease and healthcare sectors benefitted particularly well from the sharp decline in interest rates and the macro flight to quality. Both are considered to be defensive sectors and both derive a significant portion of earnings growth from positive spread investing (acquiring properties at yield above a REIT’s average cost of capital). The worst-performing sectors were regional malls (-13%), hotels (-12%), and timber REITs (-9%). Regional malls continue to suffer from elevated retail store closures as the industry rationalizes its space needs and finds the appropriate balance between online vs. brick-and-mortar distribution channels. Hotels suffered directly from the slowing macroeconomic backdrop. Similarly, timber REITs suffered from the broader economic slowdown and depressed lumber prices.
In the private market, CRE fundamentals remain healthy with a balanced demand and supply picture. Market rent growth and occupancy gains have moderated from cyclical peak levels but continue to support respectable property level cash flow growth in the 3% range. To be sure, certain pockets of the CRE market face challenges such as the elevated pace of store closures affecting retail landlords and the impact of new construction deliveries impacting senior housing and self-storage landlords. On balance, however, CRE fundamentals have remained steady against a backdrop of slow global economic growth.
Capital market conditions remain particularly robust and have improved over the past year as interest rates and credit spreads fell substantially. Current conditions provide strong support for CRE and REIT valuations. Indeed, after a period of flat to rising CRE cap rates in certain cases, there is early indication of a renewed downward trend in market cap rates.
| | THE GUGGENHEIM FUNDS ANNUAL REPORT | 53 |
MANAGERS’ COMMENTARY (Unaudited)(concluded) | September 30, 2019 |
Performance Review
The Fund outperformed its benchmark by 2.70% for the fiscal year ended September 30, 2019. Inception-to-date, the Fund has outperformed the benchmark index by 1.66% annually, net of fees, with an annualized gain of 11.79% compared to 10.13% for the index. Consistent with the Fund’s objective, the Fund has also managed risk with a 13% reduction in annualized daily volatility during the fiscal year.
The Fund’s outperformance was primarily driven by strong alpha generation within the long-only and long/short sleeves, offset by the Fund’s below average market exposure. The Fund maintained an average long-only sleeve weight of 84% and a long/short sleeve weight of 44% during the fiscal year. The less-than-full market exposure level resulted in a -2.95% drag on relative performance given the benchmark’s 18.42% gain. The long-only sleeve outperformed the benchmark index by 4.63%, contributing 3.95% to relative performance. Finally, the long/short sleeve generated positive returns that contributed 3.24% to relative performance.
The Fund utilizes total return swaps to gain exposure to individual equity REIT securities and to obtain leverage. Of the 44% total average long/short allocation for the year, roughly 14% was made using cash positions and 30% was made using total return swaps. Derivative exposure performed as expected.
Strategy
The Fund finished the year with a market exposure level of 82% range, which is a slightly defensive level for the strategy. Portfolio construction at the underlying sleeve level for the long-only and long/short strategies remains defensively positioned against moderating macroeconomic trends though we have a more neutral view on REIT fundamentals. Key sector overweights at period-end include niche residential sectors (manufactured housing and single-family-rental), healthcare and net lease REITs. We believe these sectors present attractive growth prospects relative to current valuations and will prove defensive in the event of a continued downshift in economic growth. Key sector underweights are lodging, office, and regional malls REITs. The sector underweights largely reflect unattractive relative valuations for lodging and office REITs and elevated store closure risk for regional malls.
Outlook
Reflecting upon our views heading into 2019, we were positioned defensively against the potential for slower economic growth and the potential for a significant market correction. Quarterly GDP growth did in fact slow from a high of 3.2% in June 2018 to 2.0% in September 2019. As one would expect, the S&P 500 Index experienced a sharp 20% correction at the end of 2018 as growth decelerated. However, we did not anticipate the sustained rally in risk assets over the course of the year. Against the backdrop of deteriorating economic and earnings growth, the S&P 500 and FNRE Indices both reached new all-time-highs in late 2019. As we look forward to the coming year, it strikes us that the strong gains for the S&P 500 were primarily driven by hope and optimism rather than fundamentals. Objectively speaking, most, if not all the gains for the S&P 500 was driven by multiple expansion rather than earnings growth, which approached flat to negative by late 2019.
Our macro research team highlights the steady increase in recession risk heading into 2020. Absolute valuation levels remain stretched by historical standards. There also remains considerable macro risk on the horizon whether it be a Fed policy mistake, a lingering trade war with China, or a negative surprise stemming from the upcoming presidential election.
Against this backdrop, the Fund remains defensively positioned in terms of market exposure. Positioning within the underlying long-only and long/short sleeves remains defensive as well in terms of sector weightings and factor exposures, though the size of various exposure tilts have been reduced. While our defensive posture served us well over the past year, much of the “bad news” has been reported and is arguably incorporated into market expectations.
We believe REITs are particularly well positioned in the current environment of slowing growth, rising recession risk and historically low interest rates. REITs have historically acted as a haven within the broader market during downturns, while offering above average income and inflation protection. Further, our unique risk-managed framework and defensive positioning has the potential to provide additional protection should macroeconomic conditions continue to deteriorate over the coming year.
Performance displayed represents past performance which is no guarantee of future results.
1 | Performance figures are based on Class A shares and do not reflect deduction of the sales charges or taxes that a shareholder would pay on distributions or the redemption of shares. |
The opinions and forecast expressed may not actually come to pass. This information is subject to change at any time, based on market and other conditions, and should not be construed as a recommendation of any specific security or strategy.
54 | THE GUGGENHEIM FUNDS ANNUAL REPORT | |
PERFORMANCE REPORT AND FUND PROFILE (Unaudited) | September 30, 2019 |
RISK MANAGED REAL ESTATE FUND
OBJECTIVE: Seeks to provide total return, comprised of capital appreciation and current income.
Holdings Diversification (Market Exposure as % of Net Assets)
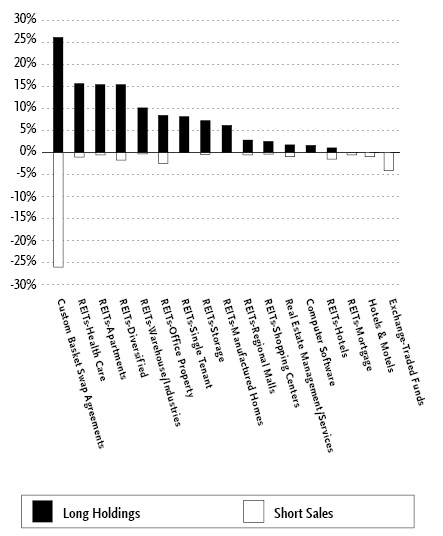
“Holdings Diversification (Market Exposure as % of Net Assets)” excludes any temporary cash investments.
Inception Dates: |
A-Class | March 28, 2014 |
C-Class | March 28, 2014 |
P-Class | May 1, 2015 |
Institutional Class | March 28, 2014 |
Ten Largest Holdings (% of Total Net Assets) |
Equinix, Inc. | 5.7% |
Prologis, Inc. | 4.5% |
Welltower, Inc. | 4.3% |
Ventas, Inc. | 4.2% |
Equity Residential | 3.9% |
Public Storage | 3.7% |
HCP, Inc. | 3.4% |
Sun Communities, Inc. | 3.3% |
Omega Healthcare Investors, Inc. | 2.9% |
Equity LifeStyle Properties, Inc. | 2.8% |
Top Ten Total | 38.7% |
| | |
“Ten Largest Holdings” excludes any temporary cash or derivative investments. |
| | THE GUGGENHEIM FUNDS ANNUAL REPORT | 55 |
PERFORMANCE REPORT AND FUND PROFILE (Unaudited)(concluded) | September 30, 2019 |
Cumulative Fund Performance*
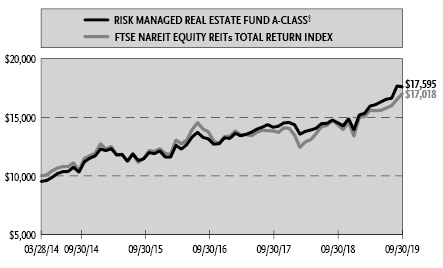
Average Annual Returns*
Periods Ended September 30, 2019
| 1 Year | 5 Year | Since
Inception
(03/28/14) |
A-Class Shares | 21.12% | 11.26% | 11.79% |
A-Class Shares with sales charge‡ | 15.38% | 10.18% | 10.80% |
C-Class Shares | 20.23% | 10.44% | 10.94% |
C-Class Shares with CDSC§ | 19.23% | 10.44% | 10.94% |
Institutional Class Shares | 21.46% | 11.60% | 12.11% |
FTSE NAREIT EQUITY REITs Total Return Index | 18.42% | 10.26% | 10.13% |
| | 1 Year | Since
Inception
(05/01/15) |
P-Class Shares | | 21.12% | 9.29% |
FTSE NAREIT EQUITY REITs Total Return Index | | 18.42% | 8.43% |
* | The performance data above represents past performance that is not predictive of future results. The investment return and principal value of an investment in the Fund will fluctuate so that an investor’s shares, when redeemed, may be worth more or less than their original cost. Returns are historical and include changes in principal and reinvested dividends and capital gains and do not reflect the effect of taxes. The FTSE NAREIT EQUITY REITs Total Return Index is an unmanaged index and, unlike the Fund, has no management fees or operating expenses to reduce its reported return. The graph is based on A-Class shares only; performance for C-Class, P-Class and Institutional Class will vary due to differences in fee structures. |
‡ | Fund returns are calculated using the maximum sales charge of 4.75%. |
§ | Fund returns include a CDSC of 1% if redeemed within 12 months of purchase. |
56 | THE GUGGENHEIM FUNDS ANNUAL REPORT | |
SCHEDULE OF INVESTMENTS | September 30, 2019 |
RISK MANAGED REAL ESTATE FUND | |
| | Shares | | | Value | |
COMMON STOCKS† - 95.9% |
| | | | | | | | | |
REITs - 92.6% |
REITs-Health Care - 15.6% |
Welltower, Inc. | | | 120,981 | | | $ | 10,966,928 | |
Ventas, Inc. | | | 144,905 | | | | 10,582,412 | |
HCP, Inc. | | | 241,769 | | | | 8,614,230 | |
Omega Healthcare Investors, Inc. | | | 174,307 | | | | 7,284,290 | |
CareTrust REIT, Inc. | | | 86,314 | | | | 2,028,811 | |
Total REITs-Health Care | | | | | | | 39,476,671 | |
| | | | | | | | | |
REITs-Apartments - 15.4% |
Equity Residential | | | 112,781 | | | | 9,728,489 | |
AvalonBay Communities, Inc.2 | | | 32,260 | | | | 6,946,546 | |
Invitation Homes, Inc.1 | | | 203,876 | | | | 6,036,768 | |
American Homes 4 Rent — Class A1 | | | 187,846 | | | | 4,863,333 | |
Essex Property Trust, Inc.1,2 | | | 14,466 | | | | 4,725,319 | |
UDR, Inc. | | | 39,191 | | | | 1,899,980 | |
Mid-America Apartment Communities, Inc. | | | 14,383 | | | | 1,869,934 | |
Apartment Investment & Management Co. — Class A1 | | | 34,453 | | | | 1,796,379 | |
Camden Property Trust | | | 8,873 | | | | 984,992 | |
Total REITs-Apartments | | | | | | | 38,851,740 | |
| | | | | | | | | |
REITs-Diversified - 15.4% |
Equinix, Inc.2 | | | 24,764 | | | | 14,283,875 | |
American Tower Corp. — Class A | | | 20,823 | | | | 4,604,590 | |
Crown Castle International Corp.1,2 | | | 29,837 | | | | 4,147,641 | |
WP Carey, Inc. | | | 34,771 | | | | 3,112,005 | |
Digital Realty Trust, Inc.1 | | | 22,271 | | | | 2,890,999 | |
Four Corners Property Trust, Inc. | | | 102,073 | | | | 2,886,624 | |
VICI Properties, Inc. | | | 94,014 | | | | 2,129,417 | |
CoreSite Realty Corp. | | | 11,566 | | | | 1,409,317 | |
iStar, Inc. | | | 101,615 | | | | 1,326,076 | |
EPR Properties | | | 14,885 | | | | 1,144,061 | |
GEO Group, Inc. | | | 50,008 | | | | 867,139 | |
Total REITs-Diversified | | | | | | | 38,801,744 | |
| | | | | | | | | |
REITs-Warehouse/Industries - 10.1% |
Prologis, Inc. | | | 133,422 | | | | 11,370,223 | |
Rexford Industrial Realty, Inc. | | | 97,450 | | | | 4,289,749 | |
Terreno Realty Corp.1 | | | 78,278 | | | | 3,999,223 | |
EastGroup Properties, Inc.1 | | | 24,610 | | | | 3,076,742 | |
Americold Realty Trust | | | 78,202 | | | | 2,898,948 | |
Total REITs-Warehouse/Industries | | | | | | | 25,634,885 | |
| | | | | | | | | |
REITs-Office Property - 8.4% |
Alexandria Real Estate Equities, Inc.1 | | | 29,581 | | | | 4,556,657 | |
Boston Properties, Inc.2 | | | 24,039 | | | | 3,116,897 | |
Highwoods Properties, Inc. | | | 67,235 | | | | 3,021,541 | |
Hudson Pacific Properties, Inc. | | | 83,013 | | | | 2,777,615 | |
JBG SMITH Properties1 | | | 68,887 | | | | 2,701,059 | |
Cousins Properties, Inc. | | | 55,803 | | | | 2,097,635 | |
Kilroy Realty Corp. | | | 14,424 | | | | 1,123,485 | |
Douglas Emmett, Inc. | | | 21,193 | | | | 907,696 | |
Equity Commonwealth | | | 26,122 | | | | 894,679 | |
Total REITs-Office Property | | | | | | | 21,197,264 | |
| | | | | | | | | |
REITs-Single Tenant - 8.1% |
Realty Income Corp. | | | 88,681 | | | | 6,800,059 | |
National Retail Properties, Inc. | | | 95,205 | | | | 5,369,562 | |
Spirit Realty Capital, Inc. | | | 94,886 | | | | 4,541,244 | |
STORE Capital Corp.1 | | | 98,771 | | | | 3,695,023 | |
Total REITs-Single Tenant | | | | | | | 20,405,888 | |
| | | | | | | | | |
REITs-Storage - 7.2% |
Public Storage | | | 38,309 | | | | 9,396,048 | |
Extra Space Storage, Inc.1 | | | 52,077 | | | | 6,083,635 | |
Iron Mountain, Inc.1 | | | 54,796 | | | | 1,774,842 | |
CubeSmart | | | 25,166 | | | | 878,293 | |
Total REITs-Storage | | | | | | | 18,132,818 | |
| | | | | | | | | |
REITs-Manufactured Homes - 6.1% |
Sun Communities, Inc. | | | 55,526 | | | | 8,242,835 | |
Equity LifeStyle Properties, Inc.1,2 | | | 53,612 | | | | 7,162,563 | |
Total REITs-Manufactured Homes | | | | | | | 15,405,398 | |
| | | | | | | | | |
REITs-Regional Malls - 2.8% |
Simon Property Group, Inc. | | | 45,593 | | | | 7,096,550 | |
| | | | | | | | | |
REITs-Shopping Centers - 2.5% |
Federal Realty Investment Trust1 | | | 25,900 | | | | 3,526,026 | |
Regency Centers Corp.1 | | | 41,195 | | | | 2,862,641 | |
Total REITs-Shopping Centers | | | | | | | 6,388,667 | |
| | | | | | | | | |
REITs-Hotels - 1.0% |
Pebblebrook Hotel Trust | | | 64,893 | | | | 1,805,323 | |
Sunstone Hotel Investors, Inc. | | | 46,649 | | | | 640,957 | |
Total REITs-Hotels | | | | | | | 2,446,280 | |
Total REITs | | | | | | | 233,837,905 | |
| | | | | | | | | |
Real Estate - 1.7% |
Real Estate Management/Services - 1.7% |
Safehold, Inc. | | | 143,065 | | | | 4,363,482 | |
| | | | | | | | | |
Software - 1.6% |
Computer Software - 1.6% |
InterXion Holding N.V.* | | | 51,023 | | | | 4,156,333 | |
| | | | | | | | | |
Total Common Stocks | | | | | | | | |
(Cost $204,875,344) | | | | | | | 242,357,720 | |
| | | | | | | | | |
MONEY MARKET FUND† - 5.7% |
Dreyfus Treasury Securities Cash Management Fund — Institutional Shares 1.83%3 | | | 14,368,540 | | | | 14,368,540 | |
Total Money Market Fund | | | | | | | | |
(Cost $14,368,540) | | | | | | | 14,368,540 | |
| | | | | | | | | |
Total Investments - 101.6% | | | | | | | | |
(Cost $219,243,884) | | | | | | $ | 256,726,260 | |
| | | | | | | | | |
SEE NOTES TO FINANCIAL STATEMENTS. | THE GUGGENHEIM FUNDS ANNUAL REPORT | 57 |
SCHEDULE OF INVESTMENTS (continued) | September 30, 2019 |
RISK MANAGED REAL ESTATE FUND | |
| | Shares | | | Value | |
COMMON STOCKS SOLD SHORT† - (11.7)% |
| | | | | | | | | |
Lodging - (1.0)% |
Hotels & Motels - (1.0)% |
Marriott International, Inc. — Class A | | | 9,469 | | | $ | (1,177,659 | ) |
Hyatt Hotels Corp. — Class A | | | 17,817 | | | | (1,312,578 | ) |
Total Hotels & Motels | | | | | | | (2,490,237 | ) |
Total Lodging | | | | | | | (2,490,237 | ) |
| | | | | | | | | |
Real Estate - (1.0)% |
Real Estate Management/Services - (1.0)% |
Marcus & Millichap, Inc.* | | | 24,138 | | | | (856,658 | ) |
Cushman & Wakefield plc* | | | 49,287 | | | | (913,288 | ) |
CBRE Group, Inc. — Class A* | | | 17,233 | | | | (913,521 | ) |
Total Real Estate Management/Services | | | | | | | (2,683,467 | ) |
Total Real Estate | | | | | | | (2,683,467 | ) |
| | | | | | | | | |
REITs - (9.7)% |
REITs-Warehouse/Industries - (0.3)% |
Monmouth Real Estate Investment Corp. | | | 61,163 | | | | (881,359 | ) |
| | | | | | | | | |
REITs-Storage - (0.4)% |
Public Storage | | | 3,662 | | | | (898,179 | ) |
| | | | | | | | | |
REITs-Shopping Centers - (0.4)% |
Kimco Realty Corp. | | | 45,489 | | | | (949,810 | ) |
| | | | | | | | | |
REITs-Regional Malls - (0.5)% |
Washington Prime Group, Inc. | | | 126,265 | | | | (522,737 | ) |
Tanger Factory Outlet Centers, Inc. | | | 54,220 | | | | (839,326 | ) |
Total REITs-Regional Malls | | | | | | | (1,362,063 | ) |
| | | | | | | | | |
REITs-Mortgage - (0.6)% |
Apollo Commercial Real Estate Finance, Inc. | | | 74,966 | | | | (1,437,098 | ) |
| | | | | | | | | |
REITs-Apartments - (0.6)% |
NexPoint Residential Trust, Inc. | | | 16,975 | | | | (793,751 | ) |
Independence Realty Trust, Inc. | | | 55,909 | | | | (800,058 | ) |
Total REITs-Apartments | | | | | | | (1,593,809 | ) |
| | | | | | | | | |
REITs-Health Care - (1.1)% |
Healthcare Realty Trust, Inc. | | | 36,928 | | | | (1,237,088 | ) |
Physicians Realty Trust | | | 84,096 | | | | (1,492,704 | ) |
Total REITs-Health Care | | | | | | | (2,729,792 | ) |
| | | | | | | | | |
REITs-Hotels - (1.5)% |
Service Properties Trust | | | 40,355 | | | | (1,040,755 | ) |
Hersha Hospitality Trust | | | 80,703 | | | | (1,200,861 | ) |
Xenia Hotels & Resorts, Inc. | | | 68,262 | | | | (1,441,693 | ) |
Total REITs-Hotels | | | | | | | (3,683,309 | ) |
| | | | | | | | | |
REITs-Diversified - (1.8)% |
American Finance Trust, Inc. | | | 66,772 | | | | (932,137 | ) |
Washington Real Estate Investment Trust | | | 38,779 | | | | (1,060,993 | ) |
Vornado Realty Trust | | | 19,109 | | | | (1,216,670 | ) |
Digital Realty Trust, Inc. | | | 11,070 | | | | (1,436,997 | ) |
Total REITs-Diversified | | | | | | | (4,646,797 | ) |
| | | | | | | | | |
REITs-Office Property - (2.5)% |
SL Green Realty Corp. | | | 11,291 | | | | (923,039 | ) |
Easterly Government Properties, Inc. | | | 43,961 | | | | (936,369 | ) |
Brandywine Realty Trust | | | 85,900 | | | | (1,301,385 | ) |
VEREIT, Inc. | | | 147,688 | | | | (1,444,389 | ) |
Piedmont Office Realty Trust, Inc. — Class A | | | 78,318 | | | | (1,635,280 | ) |
Total REITs-Office Property | | | | | | | (6,240,462 | ) |
Total REITs | | | | | | | (24,422,678 | ) |
| | | | | | | | | |
Total Common Stocks Sold Short | | | | | | | | |
(Proceeds $29,093,995) | | | | | | | (29,596,382 | ) |
| | | | | | | | | |
EXCHANGE-TRADED FUNDS SOLD SHORT† - (4.1)% |
iShares U.S. Home Construction ETF | | | 10,461 | | | | (453,066 | ) |
iShares U.S. Real Estate ETF | | | 35,935 | | | | (3,361,360 | ) |
Vanguard Real Estate ETF | | | 71,185 | | | | (6,638,001 | ) |
Total Exchange-Traded Funds Sold Short | | | | | | | | |
(Proceeds $10,052,154) | | | | | | | (10,452,427 | ) |
Total Securities Sold Short - (15.8)% | | | | | | | | |
(Proceeds $39,146,149) | | | | | | $ | (40,048,809 | ) |
Other Assets & Liabilities, net - 14.2% | | | | | | | 35,920,590 | |
Total Net Assets - 100.0% | | | | | | $ | 252,598,041 | |
58 | THE GUGGENHEIM FUNDS ANNUAL REPORT | SEE NOTES TO FINANCIAL STATEMENTS. |
SCHEDULE OF INVESTMENTS (continued) | September 30, 2019 |
RISK MANAGED REAL ESTATE FUND | |
Custom Basket Swap Agreements | | | | |
Counterparty | Reference Obligation | Financing Rate
Pay (Receive) | | Payment
Frequency | | | Maturity
Date | | | Notional
Amount | | | Value and
Unrealized
Appreciation
(Depreciation) | |
OTC Custom Basket Swap Agreements†† | | | | | | | | |
Morgan Stanley Capital Services LLC | MS Equity Custom Basket | 2.25% (Federal Funds Rate + 0.40%) | At Maturity | | | 06/12/24 | | | $ | 33,791,893 | | | $ | 2,092,990 | |
Goldman Sachs International | GS Equity Custom Basket | 2.28% (Federal Funds Rate + 0.45%) | At Maturity | | | 05/06/24 | | | | 32,181,729 | | | | 1,931,695 | |
| | | | | | | | | | | | | $ | 65,973,622 | | | $ | 4,024,685 | |
| | | | | | | | | | | | | | | | | | | |
OTC Custom Basket Swap Agreements Sold Short†† | | | | | | | | | | | | | | | | |
Goldman Sachs International | GS Equity Custom Basket | (1.50)% (Federal Funds Rate - 0.38%) | At Maturity | | | 05/06/24 | | | $ | 32,999,914 | | | $ | (836,105 | ) |
Morgan Stanley Capital Services LLC | MS Equity Custom Basket | (1.44)% (Federal Funds Rate - 0.41%) | At Maturity | | | 06/12/24 | | | | 32,999,914 | | | | (806,132 | ) |
| | | | | | | | | | | | | $ | 65,999,828 | | | $ | (1,642,237 | ) |
| | Shares | | | Percentage
Notional
Amount | | | Value and
Unrealized
Appreciation
(Depreciation) | |
MS EQUITY LONG CUSTOM BASKET | | | | | | | | |
Financial | | | | | | | | | | | | |
Sun Communities, Inc. | | | 10,354 | | | | 4.54 | % | | $ | 199,809 | |
Americold Realty Trust | | | 43,436 | | | | 4.76 | % | | | 191,552 | |
Equinix, Inc. | | | 2,610 | | | | 4.46 | % | | | 190,386 | |
Omega Healthcare Investors, Inc. | | | 36,208 | | | | 4.48 | % | | | 181,488 | |
HCP, Inc. | | | 43,068 | | | | 4.54 | % | | | 161,072 | |
Ventas, Inc. | | | 20,684 | | | | 4.47 | % | | | 147,349 | |
Invitation Homes, Inc. | | | 55,882 | | | | 4.90 | % | | | 137,949 | |
Equity Residential | | | 16,482 | | | | 4.21 | % | | | 135,761 | |
Equity LifeStyle Properties, Inc. | | | 10,975 | | | | 4.34 | % | | | 102,656 | |
American Tower Corp. — Class A | | | 6,927 | | | | 4.53 | % | | | 66,572 | |
Spirit Realty Capital, Inc. | | | 29,084 | | | | 4.12 | % | | | 60,002 | |
Extra Space Storage, Inc. | | | 8,441 | | | | 2.92 | % | | | 56,862 | |
American Homes 4 Rent — Class A | | | 44,536 | | | | 3.41 | % | | | 53,654 | |
Rexford Industrial Realty, Inc. | | | 13,029 | | | | 1.70 | % | | | 53,158 | |
CareTrust REIT, Inc. | | | 35,594 | | | | 2.48 | % | | | 52,409 | |
Crown Castle International Corp. | | | 10,784 | | | | 4.44 | % | | | 42,591 | |
Terreno Realty Corp. | | | 11,279 | | | | 1.71 | % | | | 41,958 | |
Cousins Properties, Inc. | | | 28,704 | | | | 3.19 | % | | | 41,914 | |
Highwoods Properties, Inc. | | | 20,972 | | | | 2.79 | % | | | 41,168 | |
Safehold, Inc. | | | 52,432 | | | | 4.73 | % | | | 22,964 | |
Federal Realty Investment Trust | | | 5,470 | | | | 2.20 | % | | | 18,419 | |
National Retail Properties, Inc. | | | 20,550 | | | | 3.43 | % | | | 11,631 | |
Four Corners Property Trust, Inc. | | | 13,316 | | | | 1.11 | % | | | 5,455 | |
GEO Group, Inc. | | | 41,156 | | | | 2.11 | % | | | (7,756 | ) |
JBG SMITH Properties | | | 14,463 | | | | 1.68 | % | | | (7,778 | ) |
iStar, Inc. | | | 26,178 | | | | 1.01 | % | | | (8,898 | ) |
Equity Commonwealth | | | 22,131 | | | | 2.24 | % | | | (9,567 | ) |
Hudson Pacific Properties, Inc. | | | 19,656 | | | | 1.95 | % | | | (12,429 | ) |
Pebblebrook Hotel Trust | | | 31,482 | | | | 2.59 | % | | | (22,663 | ) |
Total Financial | | | | | | | | | | | 1,947,688 | |
| | | | | | | | | | | | | |
Technology | | | | | | | | | | | | |
InterXion Holding N.V. | | | 20,565 | | | | 4.96 | % | | | 145,302 | |
Total MS Equity Long Custom Basket | | | | | | $ | 2,092,990 | |
| | | | | | | | | |
MS EQUITY SHORT CUSTOM BASKET | | | | | | | | |
Financial | | | | | | | | | | | | |
Hersha Hospitality Trust | | | 66,418 | | | | (2.99 | )% | | $ | 92,302 | |
SL Green Realty Corp. | | | 9,292 | | | | (2.30 | )% | | | 44,855 | |
Vornado Realty Trust | | | 15,727 | | | | (3.03 | )% | | | 38,648 | |
Tanger Factory Outlet Centers, Inc. | | | 44,622 | | | | (2.09 | )% | | | 32,820 | |
Physicians Realty Trust | | | 69,210 | | | | (3.72 | )% | | | 11,571 | |
Washington Prime Group, Inc. | | | 103,915 | | | | (1.30 | )% | | | 7,511 | |
Xenia Hotels & Resorts, Inc. | | | 56,179 | | | | (3.60 | )% | | | 6,852 | |
Public Storage | | | 3,102 | | | | (2.31 | )% | | | 3,708 | |
Washington Real Estate Investment Trust | | | 31,914 | | | | (2.65 | )% | | | 632 | |
Brandywine Realty Trust | | | 70,695 | | | | (3.25 | )% | | | 113 | |
American Finance Trust, Inc. | | | 54,978 | | | | (2.33 | )% | | | (8,632 | ) |
Cushman & Wakefield plc | | | 40,575 | | | | (2.28 | )% | | | (22,972 | ) |
Piedmont Office Realty Trust, Inc. — Class A | | | 64,455 | | | | (4.08 | )% | | | (24,544 | ) |
Marcus & Millichap, Inc. | | | 19,865 | | | | (2.14 | )% | | | (27,004 | ) |
Apollo Commercial Real Estate Finance, Inc. | | | 61,696 | | | | (3.58 | )% | | | (28,001 | ) |
SEE NOTES TO FINANCIAL STATEMENTS. | THE GUGGENHEIM FUNDS ANNUAL REPORT | 59 |
SCHEDULE OF INVESTMENTS (continued) | September 30, 2019 |
RISK MANAGED REAL ESTATE FUND | |
| | Shares | | | Percentage
Notional
Amount | | | Value and
Unrealized
Appreciation
(Depreciation) | |
Healthcare Realty Trust, Inc. | | | 30,503 | | | | (3.10 | )% | | $ | (29,560 | ) |
Easterly Government Properties, Inc. | | | 36,179 | | | | (2.34 | )% | | | (32,567 | ) |
CBRE Group, Inc. — Class A | | | 14,187 | | | | (2.28 | )% | | | (38,808 | ) |
Monmouth Real Estate Investment Corp. | | | 50,336 | | | | (2.19 | )% | | | (38,813 | ) |
Service Properties Trust | | | 33,212 | | | | (2.60 | )% | | | (40,684 | ) |
Digital Realty Trust, Inc. | | | 9,113 | | | | (3.58 | )% | | | (70,221 | ) |
VEREIT, Inc. | | | 121,752 | | | | (3.61 | )% | | | (73,043 | ) |
NexPoint Residential Trust, Inc. | | | 13,974 | | | | (1.98 | )% | | | (82,819 | ) |
Kimco Realty Corp. | | | 37,437 | | | | (2.37 | )% | | | (87,024 | ) |
Independence Realty Trust, Inc. | | | 46,026 | | | | (2.00 | )% | | | (112,309 | ) |
Total Financial | | | | | | | | | | | (477,989 | ) |
| | | | | | | | | | | | | |
Consumer, Cyclical | | | | | | | | | | | | |
Hyatt Hotels Corp. — Class A | | | 14,663 | | | | (3.27 | )% | | | 9,926 | |
Marriott International, Inc. — Class A | | | 7,796 | | | | (2.94 | )% | | | (18,052 | ) |
Total Consumer, Cyclical | | | | | | | | | | | (8,126 | ) |
| | | | | | | | | | | | | |
Exchange Traded Funds | | | | | | | | | | | | |
iShares U.S. Home Construction ETF | | | 8,863 | | | | (1.16 | )% | | | (30,837 | ) |
iShares U.S. Real Estate ETF | | | 29,574 | | | | (8.38 | )% | | | (110,958 | ) |
Vanguard Real Estate ETF | | | 58,584 | | | | (16.55 | )% | | | (178,222 | ) |
Total Exchange Traded Funds | | | | | | | | | | | (320,017 | ) |
Total MS Equity Short Custom Basket | | | | | | $ | (806,132 | ) |
| | | | | | | | | |
GS EQUITY LONG CUSTOM BASKET | | | | | | | | |
Financial | | | | | | | | | | | | |
Sun Communities, Inc. | | | 10,354 | | | | 4.78 | % | | $ | 202,628 | |
Equinix, Inc. | | | 2,610 | | | | 4.68 | % | | | 189,073 | |
Omega Healthcare Investors, Inc. | | | 36,208 | | | | 4.70 | % | | | 185,405 | |
HCP, Inc. | | | 43,068 | | | | 4.77 | % | | | 162,792 | |
Ventas, Inc. | | | 20,684 | | | | 4.69 | % | | | 152,040 | |
Invitation Homes, Inc. | | | 55,882 | | | | 5.14 | % | | | 138,731 | |
Equity Residential | | | 16,482 | | | | 4.42 | % | | | 133,819 | |
Equity LifeStyle Properties, Inc. | | | 10,975 | | | | 4.56 | % | | | 106,228 | |
American Tower Corp. — Class A | | | 6,927 | | | | 4.76 | % | | | 79,698 | |
Spirit Realty Capital, Inc. | | | 29,084 | | | | 4.33 | % | | | 60,520 | |
Rexford Industrial Realty, Inc. | | | 13,029 | | | | 1.78 | % | | | 59,021 | |
Extra Space Storage, Inc. | | | 8,441 | | | | 3.06 | % | | | 56,506 | |
CareTrust REIT, Inc. | | | 35,594 | | | | 2.60 | % | | | 54,287 | |
American Homes 4 Rent — Class A | | | 44,536 | | | | 3.58 | % | | | 52,848 | |
Cousins Properties, Inc. | | | 28,704 | | | | 3.35 | % | | | 48,791 | |
Terreno Realty Corp. | | | 11,279 | | | | 1.79 | % | | | 45,342 | |
Highwoods Properties, Inc. | | | 20,972 | | | | 2.93 | % | | | 40,395 | |
Crown Castle International Corp. | | | 10,784 | | | | 4.66 | % | | | 36,120 | |
Safehold, Inc. | | | 52,432 | | | | 4.97 | % | | | 18,863 | |
Federal Realty Investment Trust | | | 5,470 | | | | 2.31 | % | | | 18,723 | |
National Retail Properties, Inc. | | | 20,550 | | | | 3.60 | % | | | 11,118 | |
Four Corners Property Trust, Inc. | | | 13,316 | | | | 1.17 | % | | | 6,666 | |
JBG SMITH Properties | | | 14,463 | | | | 1.76 | % | | | (7,811 | ) |
GEO Group, Inc. | | | 41,156 | | | | 2.22 | % | | | (7,886 | ) |
iStar, Inc. | | | 26,178 | | | | 1.06 | % | | | (8,989 | ) |
Equity Commonwealth | | | 22,131 | | | | 2.36 | % | | | (9,388 | ) |
Hudson Pacific Properties, Inc. | | | 19,656 | | | | 2.04 | % | | | (16,080 | ) |
Pebblebrook Hotel Trust | | | 31,482 | | | | 2.72 | % | | | (25,526 | ) |
Total Financial | | | | | | | | | | | 1,783,934 | |
| | | | | | | | | | | | | |
Technology | | | | | | | | | | | | |
InterXion Holding N.V. | | | 20,565 | | | | 5.21 | % | | | 147,761 | |
Total GS Equity Long Custom Basket | | | | | | $ | 1,931,695 | |
| | | | | | | | | |
GS EQUITY SHORT CUSTOM BASKET | | | | | | | | |
Financial | | | | | | | | | | | | |
Hersha Hospitality Trust | | | 66,418 | | | | (2.99 | )% | | $ | 95,535 | |
SL Green Realty Corp. | | | 9,292 | | | | (2.30 | )% | | | 46,911 | |
Vornado Realty Trust | | | 15,727 | | | | (3.03 | )% | | | 38,515 | |
Tanger Factory Outlet Centers, Inc. | | | 44,622 | | | | (2.09 | )% | | | 35,528 | |
Brandywine Realty Trust | | | 70,695 | | | | (3.25 | )% | | | 5,956 | |
Washington Prime Group, Inc. | | | 103,915 | | | | (1.30 | )% | | | 4,156 | |
Public Storage | | | 3,102 | | | | (2.31 | )% | | | 3,643 | |
Xenia Hotels & Resorts, Inc. | | | 56,179 | | | | (3.60 | )% | | | 2,788 | |
Physicians Realty Trust | | | 69,210 | | | | (3.72 | )% | | | 2,169 | |
Washington Real Estate Investment Trust | | | 31,914 | | | | (2.65 | )% | | | 1,455 | |
American Finance Trust, Inc. | | | 54,978 | | | | (2.33 | )% | | | (7,763 | ) |
Cushman & Wakefield plc | | | 40,575 | | | | (2.28 | )% | | | (22,811 | ) |
Piedmont Office Realty Trust, Inc. — Class A | | | 64,455 | | | | (4.08 | )% | | | (23,884 | ) |
Marcus & Millichap, Inc. | | | 19,865 | | | | (2.14 | )% | | | (26,296 | ) |
Apollo Commercial Real Estate Finance, Inc. | | | 61,696 | | | | (3.58 | )% | | | (27,981 | ) |
Easterly Government Properties, Inc. | | | 36,179 | | | | (2.34 | )% | | | (31,700 | ) |
CBRE Group, Inc. — Class A | | | 14,187 | | | | (2.28 | )% | | | (32,105 | ) |
Healthcare Realty Trust, Inc. | | | 30,503 | | | | (3.10 | )% | | | (33,801 | ) |
60 | THE GUGGENHEIM FUNDS ANNUAL REPORT | SEE NOTES TO FINANCIAL STATEMENTS. |
SCHEDULE OF INVESTMENTS (continued) | September 30, 2019 |
RISK MANAGED REAL ESTATE FUND | |
| | Shares | | | Percentage
Notional
Amount | | | Value and
Unrealized
Appreciation
(Depreciation) | |
Service Properties Trust | | | 33,212 | | | | (2.60 | )% | | $ | (36,039 | ) |
Monmouth Real Estate Investment Corp. | | | 50,336 | | | | (2.20 | )% | | | (38,899 | ) |
Digital Realty Trust, Inc. | | | 9,113 | | | | (3.58 | )% | | | (69,510 | ) |
VEREIT, Inc. | | | 121,752 | | | | (3.61 | )% | | | (78,503 | ) |
NexPoint Residential Trust, Inc. | | | 13,974 | | | | (1.98 | )% | | | (81,151 | ) |
Kimco Realty Corp. | | | 37,437 | | | | (2.37 | )% | | | (88,293 | ) |
Independence Realty Trust, Inc. | | | 46,026 | | | | (2.00 | )% | | | (116,750 | ) |
Total Financial | | | | | | | | | | | (478,830 | ) |
| | | | | | | | | | | | | |
Consumer, Cyclical | | | | | | | | | | | | |
Hyatt Hotels Corp. — Class A | | | 14,663 | | | | (3.27 | )% | | | 9,981 | |
Marriott International, Inc. — Class A | | | 7,796 | | | | (2.94 | )% | | | (17,885 | ) |
Total Consumer, Cyclical | | | | | | | | | | | (7,904 | ) |
| | | | | | | | | | | | | |
Exchange Traded Funds | | | | | | | | | | | | |
iShares U.S. Home Construction ETF | | | 8,863 | | | | (1.16 | )% | | | (31,106 | ) |
iShares U.S. Real Estate ETF | | | 29,574 | | | | (8.38 | )% | | | (114,592 | ) |
Vanguard Real Estate ETF | | | 58,584 | | | | (16.54 | )% | | | (203,673 | ) |
Total Exchange Traded Funds | | | | | | | | | | | (349,371 | ) |
Total GS Equity Short Custom Basket | | | | | | $ | (836,105 | ) |
* | Non-income producing security. |
† | Value determined based on Level 1 inputs — See Note 4. |
†† | Value determined based on Level 2 inputs — See Note 4. |
1 | All or a portion of this security is pledged as custom basket swap collateral at September 30, 2019. |
2 | All or a portion of this security is pledged as short security collateral at September 30, 2019. |
3 | Rate indicated is the 7-day yield as of September 30, 2019. |
| | GS — Goldman Sachs International |
| | MS — Morgan Stanley Capital Services LLC |
| | plc — Public Limited Company |
| | REIT — Real Estate Investment Trust |
| | |
| | See Sector Classification in Other Information section. |
SEE NOTES TO FINANCIAL STATEMENTS. | THE GUGGENHEIM FUNDS ANNUAL REPORT | 61 |
SCHEDULE OF INVESTMENTS (concluded) | September 30, 2019 |
RISK MANAGED REAL ESTATE FUND | |
The following table summarizes the inputs used to value the Fund’s investments at September 30, 2019 (See Note 4 in the Notes to Financial Statements):
Investments in Securities (Assets) | | Level 1
Quoted
Prices | | | Level 2
Significant
Observable
Inputs | | | Level 3
Significant
Unobservable
Inputs | | | Total | |
Common Stocks | | $ | 242,357,720 | | | $ | — | | | $ | — | | | $ | 242,357,720 | |
Money Market Fund | | | 14,368,540 | | | | — | | | | — | | | | 14,368,540 | |
Custom Basket Swap Agreements** | | | — | | | | 4,024,685 | | | | — | | | | 4,024,685 | |
Total Assets | | $ | 256,726,260 | | | $ | 4,024,685 | | | $ | — | | | $ | 260,750,945 | |
Investments in Securities (Liabilities) | | Level 1
Quoted
Prices | | | Level 2
Significant
Observable
Inputs | | | Level 3
Significant
Unobservable
Inputs | | | Total | |
Common Stocks Sold Short | | $ | 29,596,382 | | | $ | — | | | $ | — | | | $ | 29,596,382 | |
Exchange-Traded Funds Sold Short | | | 10,452,427 | | | | — | | | | — | | | | 10,452,427 | |
Custom Basket Swap Agreements** | | | — | | | | 1,642,237 | | | | — | | | | 1,642,237 | |
Total Liabilities | | $ | 40,048,809 | | | $ | 1,642,237 | | | $ | — | | | $ | 41,691,046 | |
** | This derivative is reported as unrealized appreciation/depreciation at period end. |
62 | THE GUGGENHEIM FUNDS ANNUAL REPORT | SEE NOTES TO FINANCIAL STATEMENTS. |
RISK MANAGED REAL ESTATE FUND | |
STATEMENT OF ASSETS AND LIABILITIES |
September 30, 2019 |
Assets: |
Investments, at value (cost $219,243,884) | | $ | 256,726,260 | |
Cash | | | 34,069,867 | |
Unrealized appreciation on OTC swap agreements | | | 4,024,685 | |
Prepaid expenses | | | 44,675 | |
Receivables: |
Fund shares sold | | | 871,234 | |
Dividends | | | 694,283 | |
Interest | | | 21,418 | |
Total assets | | | 296,452,422 | |
| | | | | |
Liabilities: |
Securities sold short, at value (proceeds $39,146,149) | | | 40,048,809 | |
Segregated cash due to broker | | | 10,000 | |
Unrealized depreciation on OTC swap agreements | | | 1,642,237 | |
Payable for: |
Swap settlement | | | 1,099,859 | |
Fund shares redeemed | | | 376,774 | |
Securities purchased | | | 316,854 | |
Management fees | | | 141,723 | |
Distributions to shareholders | | | 111,420 | |
Fund accounting/administration fees | | | 15,155 | |
Distribution and service fees | | | 10,494 | |
Transfer agent/maintenance fees | | | 4,651 | |
Trustees’ fees* | | | 1,277 | |
Due to Investment Adviser | | | 636 | |
Miscellaneous | | | 74,492 | |
Total liabilities | | | 43,854,381 | |
Net assets | | $ | 252,598,041 | |
Net assets consist of: |
Paid in capital | | $ | 212,204,423 | |
Total distributable earnings (loss) | | | 40,393,618 | |
Net assets | | $ | 252,598,041 | |
| | | | | |
A-Class: |
Net assets | | $ | 16,681,958 | |
Capital shares outstanding | | | 489,036 | |
Net asset value per share | | $ | 34.11 | |
Maximum offering price per share (Net asset value divided by 95.25%) | | $ | 35.81 | |
| | | | | |
C-Class: |
Net assets | | $ | 1,721,465 | |
Capital shares outstanding | | | 50,811 | |
Net asset value per share | | $ | 33.88 | |
| | | | | |
P-Class: |
Net assets | | $ | 33,894,078 | |
Capital shares outstanding | | | 988,296 | |
Net asset value per share | | $ | 34.30 | |
| | | | | |
Institutional Class: |
Net assets | | $ | 200,300,540 | |
Capital shares outstanding | | | 5,803,317 | |
Net asset value per share | | $ | 34.51 | |
* | Relates to Trustees not deemed “interested persons” within the meaning of Section 2(a)(19) of the 1940 Act. |
SEE NOTES TO FINANCIAL STATEMENTS. | THE GUGGENHEIM FUNDS ANNUAL REPORT | 63 |
RISK MANAGED REAL ESTATE FUND | |
STATEMENT OF OPERATIONS |
Year Ended September 30, 2019 |
Investment Income: |
Dividends | | $ | 5,145,024 | |
Interest | | | 694,989 | |
Total investment income | | | 5,840,013 | |
| | | | | |
Expenses: |
Management fees | | | 1,452,969 | |
Distribution and service fees: |
A-Class | | | 35,602 | |
C-Class | | | 9,134 | |
P-Class | | | 21,037 | |
Transfer agent/maintenance fees: |
A-Class | | | 6,270 | |
C-Class | | | 1,437 | |
P-Class | | | 8,322 | |
Institutional Class | | | 59,542 | |
Fund accounting/administration fees | | | 154,985 | |
Short sales dividend expense | | | 1,044,835 | |
Prime broker interest expense | | | 126,147 | |
Trustees’ fees* | | | 21,720 | |
Custodian fees | | | 18,910 | |
Line of credit fees | | | 4,557 | |
Miscellaneous | | | 213,697 | |
Recoupment of previously waived fees: |
A-Class | | | 4,053 | |
C-Class | | | 52 | |
P-Class | | | 1,874 | |
Institutional Class | | | 14,665 | |
Total expenses | | | 3,199,808 | |
Less: |
Expenses reimbursed by Adviser: |
A-Class | | | (791 | ) |
C-Class | | | (689 | ) |
P-Class | | | (2,618 | ) |
Institutional Class | | | (3,047 | ) |
Expenses waived by Adviser | | | (10,503 | ) |
Total waived/reimbursed expenses | | | (17,648 | ) |
Net expenses | | | 3,182,160 | |
Net investment income | | | 2,657,853 | |
| | | | | |
Net Realized and Unrealized Gain (Loss): |
Net realized gain (loss) on: |
Investments | | $ | 4,980,379 | |
Investments sold short | | | (1,707,315 | ) |
Swap agreements | | | 3,143,110 | |
Net realized gain | | | 6,416,174 | |
Net change in unrealized appreciation (depreciation) on: |
Investments | | | 29,901,604 | |
Investments sold short | | | (857,464 | ) |
Swap agreements | | | 665,617 | |
Net change in unrealized appreciation (depreciation) | | | 29,709,757 | |
Net realized and unrealized gain | | | 36,125,931 | |
Net increase in net assets resulting from operations | | $ | 38,783,784 | |
* | Relates to Trustees not deemed “interested persons” within the meaning of Section 2(a)(19) of the 1940 Act. |
64 | THE GUGGENHEIM FUNDS ANNUAL REPORT | SEE NOTES TO FINANCIAL STATEMENTS. |
RISK MANAGED REAL ESTATE FUND | |
STATEMENTS OF CHANGES IN NET ASSETS |
| | Year Ended
September 30,
2019 | | | Year Ended
September 30,
2018 | |
Increase (Decrease) in Net Assets from Operations: | | | | | | | | |
Net investment income | | $ | 2,657,853 | | | $ | 2,409,131 | |
Net realized gain on investments | | | 6,416,174 | | | | 1,479,215 | |
Net change in unrealized appreciation (depreciation) on investments | | | 29,709,757 | | | | 1,249,273 | |
Net increase in net assets resulting from operations | | | 38,783,784 | | | | 5,137,619 | |
| | | | | | | | | |
Distributions to shareholders: | | | | | | | | |
A-Class | | | (375,063 | ) | | | (741,207 | ) |
C-Class | | | (14,377 | ) | | | (42,140 | ) |
P-Class | | | (241,067 | ) | | | (230,429 | ) |
Institutional Class | | | (4,902,443 | ) | | | (7,275,260 | ) |
Total distributions to shareholders | | | (5,532,950 | ) | | | (8,289,036 | ) |
| | | | | | | | | |
Capital share transactions: | | | | | | | | |
Proceeds from sale of shares | | | | | | | | |
A-Class | | | 3,123,032 | | | | 17,701,055 | |
C-Class | | | 1,198,445 | | | | 623,503 | |
P-Class | | | 39,953,878 | | | | 4,732,078 | |
Institutional Class | | | 34,036,778 | | | | 44,394,797 | |
Distributions reinvested | | | | | | | | |
A-Class | | | 371,479 | | | | 736,362 | |
C-Class | | | 14,097 | | | | 42,140 | |
P-Class | | | 241,067 | | | | 216,184 | |
Institutional Class | | | 4,045,330 | | | | 5,972,641 | |
Cost of shares redeemed | | | | | | | | |
A-Class | | | (2,964,330 | ) | | | (6,361,125 | ) |
C-Class | | | (485,605 | ) | | | (492,819 | ) |
P-Class | | | (12,160,967 | ) | | | (3,134,802 | ) |
Institutional Class | | | (21,126,545 | ) | | | (16,699,323 | ) |
Net increase from capital share transactions | | | 46,246,659 | | | | 47,730,691 | |
Net increase in net assets | | | 79,497,493 | | | | 44,579,274 | |
| | | | | | | | | |
Net assets: | | | | | | | | |
Beginning of year | | | 173,100,548 | | | | 128,521,274 | |
End of year | | $ | 252,598,041 | | | $ | 173,100,548 | |
| | | | | | | | | |
Capital share activity: | | | | | | | | |
Shares sold | | | | | | | | |
A-Class | | | 98,823 | | | | 595,944 | |
C-Class | | | 37,099 | | | | 21,422 | |
P-Class | | | 1,196,492 | | | | 160,270 | |
Institutional Class | | | 1,068,850 | | | | 1,537,226 | |
Shares issued from reinvestment of distributions | | | | | | | | |
A-Class | | | 12,517 | | | | 25,255 | |
C-Class | | | 477 | | | | 1,449 | |
P-Class | | | 7,585 | �� | | | 7,367 | |
Institutional Class | | | 133,928 | | | | 202,581 | |
Shares redeemed | | | | | | | | |
A-Class | | | (98,269 | ) | | | (219,176 | ) |
C-Class | | | (16,917 | ) | | | (17,261 | ) |
P-Class | | | (360,765 | ) | | | (108,542 | ) |
Institutional Class | | | (669,153 | ) | | | (565,538 | ) |
Net increase in shares | | | 1,410,667 | | | | 1,640,997 | |
SEE NOTES TO FINANCIAL STATEMENTS. | THE GUGGENHEIM FUNDS ANNUAL REPORT | 65 |
RISK MANAGED REAL ESTATE FUND | |
This table is presented to show selected data for a share outstanding throughout each period and to assist shareholders in evaluating a Fund’s performance for the periods presented.
A-Class | | Year Ended
September 30,
2019 | | | Year Ended
September 30,
2018 | | | Year Ended
September 30,
2017 | | | Year Ended
September 30,
2016 | | | Year Ended
September 30,
2015 | |
Per Share Data | | | | | | | | | | | | | | | | | | | | |
Net asset value, beginning of period | | $ | 28.93 | | | $ | 29.70 | | | $ | 28.87 | | | $ | 29.77 | | | $ | 26.99 | |
Income (loss) from investment operations: |
Net investment income (loss)a | | | .34 | | | | .41 | | | | .03 | | | | .19 | | | | (.21 | ) |
Net gain (loss) on investments (realized and unrealized) | | | 5.65 | | | | .38 | | | | 2.08 | | | | 3.84 | | | | 3.18 | |
Total from investment operations | | | 5.99 | | | | .79 | | | | 2.11 | | | | 4.03 | | | | 2.97 | |
Less distributions from: |
Net investment income | | | (.55 | ) | | | (.52 | ) | | | (.57 | ) | | | (1.12 | ) | | | (.05 | ) |
Net realized gains | | | (.26 | ) | | | (1.04 | ) | | | (.71 | ) | | | (3.81 | ) | | | (.14 | ) |
Total distributions | | | (.81 | ) | | | (1.56 | ) | | | (1.28 | ) | | | (4.93 | ) | | | (.19 | ) |
Net asset value, end of period | | $ | 34.11 | | | $ | 28.93 | | | $ | 29.70 | | | $ | 28.87 | | | $ | 29.77 | |
|
Total Returnb | | | 21.12 | % | | | 2.70 | % | | | 7.54 | % | | | 14.88 | % | | | 10.97 | % |
Ratios/Supplemental Data |
Net assets, end of period (in thousands) | | $ | 16,682 | | | $ | 13,772 | | | $ | 2,196 | | | $ | 743 | | | $ | 366 | |
Ratios to average net assets: |
Net investment income (loss) | | | 1.09 | % | | | 1.42 | % | | | 0.09 | % | | | 0.66 | % | | | (0.67 | %) |
Total expensesc | | | 1.89 | % | | | 1.78 | % | | | 1.45 | % | | | 1.93 | % | | | 3.41 | % |
Net expensesd,e,h | | | 1.88 | % | | | 1.76 | % | | | 1.33 | % | | | 1.78 | % | | | 3.04 | % |
Portfolio turnover rate | | | 122 | % | | | 107 | % | | | 85 | % | | | 133 | % | | | 214 | % |
C-Class | | Year Ended
September 30,
2019 | | | Year Ended
September 30,
2018 | | | Year Ended
September 30,
2017 | | | Year Ended
September 30,
2016 | | | Year Ended
September 30,
2015 | |
Per Share Data | | | | | | | | | | | | | | | | | | | | |
Net asset value, beginning of period | | $ | 28.75 | | | $ | 29.54 | | | $ | 28.77 | | | $ | 29.56 | | | $ | 26.95 | |
Income (loss) from investment operations: |
Net investment income (loss)a | | | .11 | | | | .15 | | | | (.19 | ) | | | .02 | | | | (.43 | ) |
Net gain (loss) on investments (realized and unrealized) | | | 5.60 | | | | .42 | | | | 2.06 | | | | 3.77 | | | | 3.18 | |
Total from investment operations | | | 5.71 | | | | .57 | | | | 1.87 | | | | 3.79 | | | | 2.75 | |
Less distributions from: |
Net investment income | | | (.32 | ) | | | (.32 | ) | | | (.39 | ) | | | (.77 | ) | | | — | |
Net realized gains | | | (.26 | ) | | | (1.04 | ) | | | (.71 | ) | | | (3.81 | ) | | | (.14 | ) |
Total distributions | | | (.58 | ) | | | (1.36 | ) | | | (1.10 | ) | | | (4.58 | ) | | | (.14 | ) |
Net asset value, end of period | | $ | 33.88 | | | $ | 28.75 | | | $ | 29.54 | | | $ | 28.77 | | | $ | 29.56 | |
|
Total Returnb | | | 20.23 | % | | | 1.93 | % | | | 6.71 | % | | | 14.00 | % | | | 10.20 | % |
Ratios/Supplemental Data |
Net assets, end of period (in thousands) | | $ | 1,721 | | | $ | 867 | | | $ | 725 | | | $ | 518 | | | $ | 95 | |
Ratios to average net assets: |
Net investment income (loss) | | | 0.35 | % | | | 0.53 | % | | | (0.66 | %) | | | 0.08 | % | | | (1.42 | %) |
Total expensesc | | | 2.73 | % | | | 2.71 | % | | | 2.27 | % | | | 3.32 | % | | | 5.76 | % |
Net expensesd,e,h | | | 2.65 | % | | | 2.53 | % | | | 2.08 | % | | | 2.53 | % | | | 3.76 | % |
Portfolio turnover rate | | | 122 | % | | | 107 | % | | | 85 | % | | | 133 | % | | | 214 | % |
66 | THE GUGGENHEIM FUNDS ANNUAL REPORT | SEE NOTES TO FINANCIAL STATEMENTS. |
RISK MANAGED REAL ESTATE FUND | |
FINANCIAL HIGHLIGHTS (continued) |
This table is presented to show selected data for a share outstanding throughout each period and to assist shareholders in evaluating a Fund’s performance for the periods presented.
P-Class | | Year Ended
September 30,
2019 | | | Year Ended
September 30,
2018 | | | Year Ended
September 30,
2017 | | | Year Ended
September 30,
2016 | | | Period Ended
September 30,
2015f | |
Per Share Data | | | | | | | | | | | | | | | | | | | | |
Net asset value, beginning of period | | $ | 29.09 | | | $ | 29.85 | | | $ | 29.01 | | | $ | 29.77 | | | $ | 30.89 | |
Income (loss) from investment operations: |
Net investment income (loss)a | | | .60 | | | | .37 | | | | .13 | | | | .16 | | | | .04 | |
Net gain (loss) on investments (realized and unrealized) | | | 5.42 | | | | .43 | | | | 1.98 | | | | 3.88 | | | | (1.16 | ) |
Total from investment operations | | | 6.02 | | | | .80 | | | | 2.11 | | | | 4.04 | | | | (1.12 | ) |
Less distributions from: |
Net investment income | | | (.55 | ) | | | (.52 | ) | | | (.56 | ) | | | (.99 | ) | | | — | |
Net realized gains | | | (.26 | ) | | | (1.04 | ) | | | (.71 | ) | | | (3.81 | ) | | | — | |
Total distributions | | | (.81 | ) | | | (1.56 | ) | | | (1.27 | ) | | | (4.80 | ) | | | — | |
Net asset value, end of period | | $ | 34.30 | | | $ | 29.09 | | | $ | 29.85 | | | $ | 29.01 | | | $ | 29.77 | |
|
Total Return | | | 21.12 | % | | | 2.68 | % | | | 7.53 | % | | | 14.87 | % | | | (3.63 | %) |
Ratios/Supplemental Data |
Net assets, end of period (in thousands) | | $ | 33,894 | | | $ | 4,217 | | | $ | 2,564 | | | $ | 82 | | | $ | 30 | |
Ratios to average net assets: |
Net investment income (loss) | | | 1.87 | % | | | 1.29 | % | | | 0.42 | % | | | 0.56 | % | | | 0.30 | % |
Total expensesc | | | 1.93 | % | | | 1.88 | % | | | 1.51 | % | | | 1.88 | % | | | 4.04 | %g |
Net expensesd,e,h | | | 1.89 | % | | | 1.78 | % | | | 1.30 | % | | | 1.78 | % | | | 2.94 | % |
Portfolio turnover rate | | | 122 | % | | | 107 | % | | | 85 | % | | | 133 | % | | | 214 | % |
SEE NOTES TO FINANCIAL STATEMENTS. | THE GUGGENHEIM FUNDS ANNUAL REPORT | 67 |
RISK MANAGED REAL ESTATE FUND | |
FINANCIAL HIGHLIGHTS (concluded) |
This table is presented to show selected data for a share outstanding throughout each period and to assist shareholders in evaluating a Fund’s performance for the periods presented.
Institutional Class | | Year Ended
September 30,
2019 | | | Year Ended
September 30,
2018 | | | Year Ended
September 30,
2017 | | | Year Ended
September 30,
2016 | | | Year Ended
September 30,
2015 | |
Per Share Data | | | | | | | | | | | | | | | | | | | | |
Net asset value, beginning of period | | $ | 29.27 | | | $ | 30.04 | | | $ | 29.18 | | | $ | 29.90 | | | $ | 27.00 | |
Income (loss) from investment operations: |
Net investment income (loss)a | | | .43 | | | | .46 | | | | .11 | | | | .26 | | | | (.11 | ) |
Net gain (loss) on investments (realized and unrealized) | | | 5.71 | | | | .43 | | | | 2.10 | | | | 3.89 | | | | 3.18 | |
Total from investment operations | | | 6.14 | | | | .89 | | | | 2.21 | | | | 4.15 | | | | 3.07 | |
Less distributions from: |
Net investment income | | | (.64 | ) | | | (.62 | ) | | | (.64 | ) | | | (1.06 | ) | | | (.03 | ) |
Net realized gains | | | (.26 | ) | | | (1.04 | ) | | | (.71 | ) | | | (3.81 | ) | | | (.14 | ) |
Total distributions | | | (.90 | ) | | | (1.66 | ) | | | (1.35 | ) | | | (4.87 | ) | | | (.17 | ) |
Net asset value, end of period | | $ | 34.51 | | | $ | 29.27 | | | $ | 30.04 | | | $ | 29.18 | | | $ | 29.90 | |
|
Total Return | | | 21.46 | % | | | 2.98 | % | | | 7.87 | % | | | 15.20 | % | | | 11.36 | % |
Ratios/Supplemental Data |
Net assets, end of period (in thousands) | | $ | 200,301 | | | $ | 154,245 | | | $ | 123,037 | | | $ | 111,823 | | | $ | 105,882 | |
Ratios to average net assets: |
Net investment income (loss) | | | 1.38 | % | | | 1.56 | % | | | 0.38 | % | | | 0.91 | % | | | (0.35 | %) |
Total expensesc | | | 1.61 | % | | | 1.51 | % | | | 1.02 | % | | | 1.50 | % | | | 2.70 | % |
Net expensesd,e,h | | | 1.60 | % | | | 1.50 | % | | | 1.01 | % | | | 1.50 | % | | | 2.70 | % |
Portfolio turnover rate | | | 122 | % | | | 107 | % | | | 85 | % | | | 133 | % | | | 214 | % |
a | Net investment income (loss) per share was computed using average shares outstanding throughout the period. |
b | Total return does not reflect the impact of any applicable sales charges. |
c | Does not include expenses of the underlying funds in which the Fund invests. |
d | Net expense information reflects the expense ratios after expense waivers and reimbursements, as applicable. |
e | The portion of the ratios of net expenses to average net assets attributable to recoupments of prior fee reductions or expense reimbursements for the years presented was as follows: |
| | | 09/30/19 | 09/30/18 | 09/30/17 |
| | A-Class | 0.03% | 0.03% | 0.02% |
| | C-Class | 0.01% | 0.01% | 0.00%* |
| | P-Class | 0.02% | 0.01% | 0.00%* |
| | Institutional Class | 0.01% | 0.02% | — |
f | Since commencement of operations: May 1, 2015. Percentage amounts for the period, except total return and portfolio turnover rate, have been annualized. |
g | Due to limited length of Fund operations, ratios for this period are not indicative of future performance. |
h | Net expenses may include expenses that are excluded from the expense limitation agreement. Excluding these expenses, the net expense ratios for the periods presented would be: |
| | | 09/30/19 | 09/30/18 | 09/30/17 | 09/30/16 | 09/30/15 |
| | A-Class | 1.27% | 1.29% | 1.30% | 1.29% | 1.30% |
| | C-Class | 2.05% | 2.05% | 2.04% | 2.03% | 2.05% |
| | P-Class | 1.30% | 1.30% | 1.29% | 1.28% | 1.30% |
| | Institutional Class | 1.00% | 1.03% | 0.97% | 1.00% | 0.99% |
68 | THE GUGGENHEIM FUNDS ANNUAL REPORT | SEE NOTES TO FINANCIAL STATEMENTS. |
MANAGERS’ COMMENTARY (Unaudited) | September 30, 2019 |
To Our Shareholders:
Guggenheim Small Cap Value Fund is managed by a team of seasoned professionals led by David Toussaint, CFA, CPA, Managing Director and Portfolio Manager; James Schier, CFA, Senior Managing Director and Portfolio Manager; Farhan Sharaff , Senior Managing Director, Assistant Chief Investment Officer, Equities, and Portfolio Manager; Gregg Strohkorb, CFA, Director and Portfolio Manager; and Burak Hurmeydan, Ph.D., Director and Portfolio Manager. In the following paragraphs, the team discusses performance of the Fund for the fiscal year ended September 30, 2019.
For the fiscal year ended September 30, 2019, Guggenheim Small Cap Value Fund returned -6.14%1, compared with its benchmark, the Russell 2000® Value Index, which returned -8.24%.
Strategy and Market Overview
Our investment approach focuses on understanding how companies make money and how easily companies can improve returns, maintain existing high levels of profitability, or benefit from change that occurs within the industries in which they operate. In today’s rapidly changing environment marked by very sharp and quick, but constrained volatility, our long-term orientation and discipline are a competitive advantage. This should become especially critical when the environment of indiscriminant valuation expansion subsides, and fundamentals once again become a more dominant factor in the market.
Performance Review
The Fund outperformed the index over a volatile one-year period.
For the 12-month period, stock selection was the major factor behind the Fund’s showing relative to the benchmark, with sector allocation providing only a slight tailwind to results.
Highlighting the positive side was selection in Information Technology. A top-performing holding was Cray (not held at period end), which was acquired by Hewlett Packard Enterprise in 2019. Other contributors included optical components company Infinera Corp., which benefited from favorable earnings, and MACOM Technology Solutions Holdings, Inc., which reacted positively to analyst upgrades.
Selection also helped in the Materials, Industrials, and Financials sectors. A Materials holding not in the benchmark, U.S. Concrete, Inc., was a large individual contributor to performance, benefiting from growth in government projects and a strong market for home building. Industrials had gains from Graphic Packaging Holding Co. and a lack of exposure to problematic engineering and construction companies. In Financials, an overweighting and positive performance in reinsurance drove results. Argo Group Holdings International Ltd. was a leading individual contributor.
Negative influences included unfavorable stock selection in the Energy sector. Oil prices softened over the period as economic uncertainty surrounding the trade dispute was especially magnified in smaller exploration and production companies. Range Resources Corp., Oasis Petroleum, Inc. and Whiting Petroleum Corp. each declined significantly in response. A sector bright spot for the Fund was Scorpio Tankers, Inc., the Fund’s best individual holding on a relative basis.
Performance of the Fund’s Real Estate sector also detracted. The Fund has an underweight relative to the benchmark in the sector, for which it was penalized, and the Fund’s hotel and real estate services REITs, although underweight compared with the benchmark, were a drag on performance.
Stock selection contributed in the Health Care sector, but had a big detractor, Evolent Health, Inc. The company’s largest customer, Passport, suffered rate cuts from Kentucky Medicaid that threatened Passport’s viability.
Portfolio Positioning
While this strategy is balanced relative to the benchmark, it does possess defensive characteristics in virtue of emphasizing relatively larger companies found in the benchmark as well as an overweight in Utilities.
| | THE GUGGENHEIM FUNDS ANNUAL REPORT | 69 |
MANAGERS’ COMMENTARY (Unaudited)(concluded) | September 30, 2019 |
At the end of the period, the Fund’s largest overweights relative to the benchmark were in Materials and Utilities. The Fund’s largest underweights were in Consumer Discretionary and Financials.
Portfolio and Market Outlook
The market volatility late in the year created sudden changes to the market. The perception of a friendlier environment from the Fed and continued hope that trade issues can be relatively quickly and favorably resolved has created an environment where the market is beginning to treat earnings disappointments and reduced outlooks in a less harsh manner since these are being viewed as more temporary issues. The total return potential for stocks now seems more favorable than it was just a few months ago, and the market appears to have begun the early phase of a calculated rebound that may have some duration in time and level.
Our portfolios tend to reflect a bias toward companies with balance sheet quality. We continue to find niche companies with what we believe to be attractive growth opportunities, and, as such, are constructive on the outlook.
Performance displayed represents past performance which is no guarantee of future results.
1 | Performance figures are based on Class A shares and do not reflect deduction of the sales charges or taxes that a shareholder would pay on distributions or the redemption of shares. |
The opinions and forecast expressed may not actually come to pass. This information is subject to change at any time, based on market and other conditions, and should not be construed as a recommendation of any specific security or strategy.
70 | THE GUGGENHEIM FUNDS ANNUAL REPORT | |
PERFORMANCE REPORT AND FUND PROFILE (Unaudited) | September 30, 2019 |
SMALL CAP VALUE FUND
OBJECTIVE: Seeks long-term capital appreciation.
Holdings Diversification (Market Exposure as % of Net Assets)
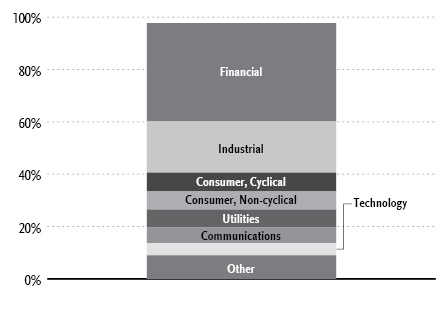
“Holdings Diversification (Market Exposure as % of Net Assets)” excludes any temporary cash investments.
Inception Dates: |
A-Class | July 11, 2008 |
C-Class | July 11, 2008 |
P-Class | May 1, 2015 |
Institutional Class | July 11, 2008 |
Ten Largest Holdings (% of Total Net Assets) |
Equity Commonwealth | 2.0% |
Portland General Electric Co. | 1.9% |
MDU Resources Group, Inc. | 1.8% |
Axis Capital Holdings Ltd. | 1.8% |
Radian Group, Inc. | 1.8% |
Physicians Realty Trust | 1.7% |
Scorpio Tankers, Inc. | 1.7% |
Viavi Solutions, Inc. | 1.6% |
Federal Agricultural Mortgage Corp. — Class C | 1.6% |
Infinera Corp. | 1.5% |
Top Ten Total | 17.4% |
| | |
“Ten Largest Holdings” excludes any temporary cash investments. |
| | THE GUGGENHEIM FUNDS ANNUAL REPORT | 71 |
PERFORMANCE REPORT AND FUND PROFILE (Unaudited)(concluded) | September 30, 2019 |
Cumulative Fund Performance*
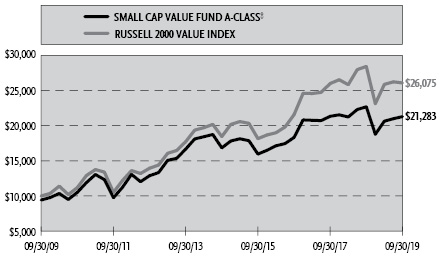
Average Annual Returns*
Periods Ended September 30, 2019
| 1 Year | 5 Year | 10 Year |
A-Class Shares | (6.14%) | 4.80% | 8.49% |
A-Class Shares with sales charge‡ | (10.62%) | 3.78% | 7.85% |
C-Class Shares | (6.89%) | 4.01% | 7.70% |
C-Class Shares with CDSC§ | (7.71%) | 4.01% | 7.70% |
Institutional Class Shares | (5.96%) | 5.06% | 8.74% |
Russell 2000 Value Index | (8.24%) | 7.17% | 10.06% |
| | 1 Year | Since
Inception
(05/01/15) |
P-Class Shares | | (6.18%) | 3.99% |
Russell 2000 Value Index | | (8.24%) | 5.95% |
* | The performance data above represents past performance that is not predictive of future results. The investment return and principal value of an investment in the Fund will fluctuate so that an investor’s shares, when redeemed, may be worth more or less than their original cost. Returns are historical and include changes in principal and reinvested dividends and capital gains and do not reflect the effect of taxes. The Russell 2000 Value Index is an unmanaged index and, unlike the Fund, has no management fees or operating expenses to reduce its reported return. The graph is based on A-Class Shares only; performance for C-Class, P-Class and Institutional Class will vary due to differences in fee structures. |
‡ | Effective February 22, 2011, the maximum sales charge decreased from 5.75% to 4.75%. A 5.75% maximum sales charge is used in the calculation of the Average Annual Returns based on subscriptions made prior to February 22, 2011, and a 4.75% maximum sales charge will be used to calculate performance for periods based on subscriptions made on or after February 22, 2011. |
§ | Fund returns include a CDSC of 1% if redeemed within 12 months of purchase. |
72 | THE GUGGENHEIM FUNDS ANNUAL REPORT | |
SCHEDULE OF INVESTMENTS | September 30, 2019 |
SMALL CAP VALUE FUND | |
| | Shares | | | Value | |
COMMON STOCKS† - 96.7% |
| | | | | | | | | |
Financial - 37.4% |
Equity Commonwealth REIT | | | 8,621 | | | $ | 295,269 | |
Axis Capital Holdings Ltd. | | | 3,874 | | | | 258,473 | |
Radian Group, Inc. | | | 11,142 | | | | 254,483 | |
Physicians Realty Trust REIT | | | 13,719 | | | | 243,512 | |
Federal Agricultural Mortgage Corp. — Class C | | | 2,765 | | | | 225,790 | |
Umpqua Holdings Corp. | | | 11,784 | | | | 193,965 | |
Lexington Realty Trust REIT | | | 18,262 | | | | 187,186 | |
First Horizon National Corp. | | | 11,364 | | | | 184,097 | |
Investors Bancorp, Inc. | | | 15,277 | | | | 173,546 | |
WSFS Financial Corp. | | | 3,888 | | | | 171,461 | |
Cathay General Bancorp | | | 4,709 | | | | 163,567 | |
Cousins Properties, Inc. REIT | | | 4,336 | | | | 162,990 | |
Simmons First National Corp. — Class A | | | 5,910 | | | | 147,159 | |
Preferred Bank/Los Angeles CA | | | 2,784 | | | | 145,826 | |
Hanmi Financial Corp. | | | 7,713 | | | | 144,850 | |
CNO Financial Group, Inc. | | | 9,059 | | | | 143,404 | |
Pinnacle Financial Partners, Inc. | | | 2,490 | | | | 141,308 | |
Hilltop Holdings, Inc. | | | 5,825 | | | | 139,159 | |
Berkshire Hills Bancorp, Inc. | | | 4,686 | | | | 137,253 | |
IBERIABANK Corp. | | | 1,661 | | | | 125,472 | |
Bancorp, Inc.* | | | 12,037 | | | | 119,166 | |
Redwood Trust, Inc. REIT | | | 7,090 | | | | 116,347 | |
Hancock Whitney Corp. | | | 2,853 | | | | 109,256 | |
Piedmont Office Realty Trust, Inc. — Class A REIT | | | 5,074 | | | | 105,945 | |
Howard Hughes Corp.* | | | 793 | | | | 102,773 | |
Flagstar Bancorp, Inc. | | | 2,748 | | | | 102,638 | |
Kennedy-Wilson Holdings, Inc. | | | 4,658 | | | | 102,103 | |
National Storage Affiliates Trust REIT | | | 2,942 | | | | 98,175 | |
Sunstone Hotel Investors, Inc. REIT | | | 6,999 | | | | 96,166 | |
PennyMac Mortgage Investment Trust REIT | | | 4,180 | | | | 92,922 | |
American National Insurance Co. | | | 692 | | | | 85,621 | |
Stifel Financial Corp. | | | 1,471 | | | | 84,406 | |
Prosperity Bancshares, Inc. | | | 1,188 | | | | 83,908 | |
BOK Financial Corp. | | | 1,015 | | | | 80,337 | |
Independent Bank Group, Inc. | | | 1,430 | | | | 75,232 | |
First Midwest Bancorp, Inc. | | | 3,851 | | | | 75,018 | |
MGIC Investment Corp. | | | 5,666 | | | | 71,278 | |
RMR Group, Inc. — Class A | | | 1,559 | | | | 70,903 | |
Unum Group | | | 2,276 | | | | 67,643 | |
Third Point Reinsurance Ltd.* | | | 6,030 | | | | 60,240 | |
Total Financial | | | | | | | 5,438,847 | |
| | | | | | | | | |
Industrial - 19.7% |
MDU Resources Group, Inc. | | | 9,507 | | | | 268,002 | |
Scorpio Tankers, Inc. | | | 8,142 | | | | 242,306 | |
US Concrete, Inc.* | | | 3,266 | | | | 180,544 | |
Graphic Packaging Holding Co. | | | 10,891 | | | | 160,642 | |
GATX Corp. | | | 2,020 | | | | 156,611 | |
Valmont Industries, Inc. | | | 1,074 | | | | 148,684 | |
Knight-Swift Transportation Holdings, Inc. | | | 4,027 | | | | 146,180 | |
Owens Corning | | | 1,846 | | | | 116,667 | |
KEMET Corp. | | | 6,164 | | | | 112,061 | |
PGT Innovations, Inc.* | | | 6,417 | | | | 110,822 | |
Plexus Corp.* | | | 1,768 | | | | 110,518 | |
Sanmina Corp.* | | | 3,296 | | | | 105,835 | |
Trinseo S.A. | | | 2,402 | | | | 103,166 | |
Gibraltar Industries, Inc.* | | | 2,207 | | | | 101,390 | |
Advanced Energy Industries, Inc.* | | | 1,695 | | | | 97,310 | |
Kirby Corp.* | | | 1,156 | | | | 94,977 | |
EnPro Industries, Inc. | | | 1,256 | | | | 86,224 | |
Park Aerospace Corp. | | | 4,814 | | | | 84,534 | |
Rexnord Corp.* | | | 3,055 | | | | 82,638 | |
Dycom Industries, Inc.* | | | 1,611 | | | | 82,242 | |
Crane Co. | | | 971 | | | | 78,292 | |
Vishay Intertechnology, Inc. | | | 3,910 | | | | 66,196 | |
Oshkosh Corp. | | | 871 | | | | 66,022 | |
Encore Wire Corp. | | | 1,082 | | | | 60,895 | |
Total Industrial | | | | | | | 2,862,758 | |
| | | | | | | | | |
Consumer, Cyclical - 7.2% |
Hawaiian Holdings, Inc. | | | 6,519 | | | | 171,189 | |
UniFirst Corp. | | | 849 | | | | 165,657 | |
MDC Holdings, Inc. | | | 3,024 | | | | 130,335 | |
Abercrombie & Fitch Co. — Class A | | | 6,735 | | | | 105,066 | |
International Speedway Corp. — Class A | | | 2,223 | | | | 100,057 | |
Asbury Automotive Group, Inc.* | | | 930 | | | | 95,167 | |
Wabash National Corp. | | | 5,595 | | | | 81,184 | |
MasterCraft Boat Holdings, Inc.* | | | 4,598 | | | | 68,625 | |
Methode Electronics, Inc. | | | 1,379 | | | | 46,389 | |
Tenneco, Inc. — Class A | | | 3,584 | | | | 44,872 | |
La-Z-Boy, Inc. | | | 1,238 | | | | 41,584 | |
Total Consumer, Cyclical | | | | | | | 1,050,125 | |
| | | | | | | | | |
Consumer, Non-cyclical - 7.1% |
Central Garden & Pet Co. — Class A* | | | 7,348 | | | | 203,723 | |
Encompass Health Corp. | | | 3,001 | | | | 189,903 | |
Navigant Consulting, Inc. | | | 5,680 | | | | 158,756 | |
Premier, Inc. — Class A* | | | 4,830 | | | | 139,684 | |
Eagle Pharmaceuticals, Inc.* | | | 2,080 | | | | 117,665 | |
Emergent BioSolutions, Inc.* | | | 1,592 | | | | 83,230 | |
Ingredion, Inc. | | | 915 | | | | 74,792 | |
AMAG Pharmaceuticals, Inc.* | | | 5,507 | | | | 63,606 | |
Total Consumer, Non-cyclical | | | | | | | 1,031,359 | |
| | | | | | | | | |
Utilities - 6.7% |
Portland General Electric Co. | | | 4,999 | | | | 281,794 | |
Black Hills Corp. | | | 2,869 | | | | 220,138 | |
Avista Corp. | | | 3,657 | | | | 177,145 | |
Southwest Gas Holdings, Inc. | | | 1,850 | | | | 168,424 | |
ALLETE, Inc. | | | 1,369 | | | | 119,664 | |
Total Utilities | | | | | | | 967,165 | |
| | | | | | | | | |
Communications - 6.1% |
Viavi Solutions, Inc.* | | | 16,227 | | | | 227,259 | |
Infinera Corp.* | | | 41,067 | | | | 223,815 | |
Ciena Corp.* | | | 2,633 | | | | 103,293 | |
Scholastic Corp. | | | 2,636 | | | | 99,535 | |
Gray Television, Inc.* | | | 5,796 | | | | 94,591 | |
InterDigital, Inc. | | | 1,235 | | | | 64,800 | |
SEE NOTES TO FINANCIAL STATEMENTS. | THE GUGGENHEIM FUNDS ANNUAL REPORT | 73 |
SCHEDULE OF INVESTMENTS (continued) | September 30, 2019 |
SMALL CAP VALUE FUND | |
| | Shares | | | Value | |
Entercom Communications Corp. — Class A | | | 12,252 | | | $ | 40,922 | |
Tribune Publishing Co. | | | 4,200 | | | | 36,036 | |
Total Communications | | | | | | | 890,251 | |
| | | | | | | | | |
Technology - 4.6% |
MACOM Technology Solutions Holdings, Inc.* | | | 10,351 | | | | 222,495 | |
CSG Systems International, Inc. | | | 2,479 | | | | 128,115 | |
Axcelis Technologies, Inc.* | | | 4,663 | | | | 79,691 | |
Lumentum Holdings, Inc.* | | | 1,333 | | | | 71,396 | |
Evolent Health, Inc. — Class A* | | | 9,097 | | | | 65,407 | |
Nanometrics, Inc.* | | | 1,980 | | | | 64,587 | |
TiVo Corp. | | | 5,675 | | | | 43,215 | |
Total Technology | | | | | | | 674,906 | |
| | | | | | | | | |
Basic Materials - 4.3% |
Ashland Global Holdings, Inc. | | | 2,288 | | | | 176,291 | |
Olin Corp. | | | 7,389 | | | | 138,322 | |
Huntsman Corp. | | | 4,128 | | | | 96,017 | |
Reliance Steel & Aluminum Co. | | | 836 | | | | 83,316 | |
Verso Corp. — Class A* | | | 4,291 | | | | 53,123 | |
Commercial Metals Co. | | | 2,302 | | | | 40,008 | |
Alcoa Corp.* | | | 1,676 | | | | 33,637 | |
Total Basic Materials | | | | | | | 620,714 | |
| | | | | | | | | |
Energy - 3.6% |
Parsley Energy, Inc. — Class A | | | 8,271 | | | | 138,953 | |
Delek US Holdings, Inc. | | | 2,236 | | | | 81,167 | |
Oasis Petroleum, Inc.* | | | 21,332 | | | | 73,809 | |
Whiting Petroleum Corp.* | | | 8,985 | | | | 72,149 | |
Range Resources Corp. | | | 15,879 | | | | 60,658 | |
Oil States International, Inc.* | | | 3,841 | | | | 51,085 | |
Gulfport Energy Corp.* | | | 10,025 | | | | 27,168 | |
Antero Resources Corp.* | | | 5,521 | | | | 16,673 | |
Total Energy | | | | | | | 521,662 | |
| | | | | | | | | |
Total Common Stocks | | | | | | | | |
(Cost $13,999,321) | | | | | | | 14,057,787 | |
| | | | | | | | | |
CONVERTIBLE PREFERRED STOCKS††† - 0.0% |
Industrial – 0.0% |
Thermoenergy Corp.*,1,2 | | | 6,250 | | | | — | |
Total Convertible Preferred Stocks | | | | | | | | |
(Cost $5,968) | | | | | | | — | |
| | | | | | | | | |
RIGHTS††† - 0.0% |
Basic Materials 0.0% |
Pan American Silver Corp.*,1 | | | 17,705 | | | | — | |
Total Rights | | | | | | | | |
(Cost $—) | | | | | | | — | |
| | | | | | | | | |
EXCHANGE-TRADED FUNDS† - 1.1% |
iShares Russell 2000 Value ETF | | | 1,248 | | | | 149,024 | |
Total Exchange-Traded Funds | | | | | | | | |
(Cost $149,589) | | | | | | | 149,024 | |
| | | | | | | | | |
MONEY MARKET FUND† - 0.7% |
Dreyfus Treasury Securities Cash Management — Institutional Shares 1.83%3 | | | 106,184 | | | | 106,184 | |
Total Money Market Fund | | | | | | | | |
(Cost $106,184) | | | | | | | 106,184 | |
| | | | | | | | | |
Total Investments - 98.5% | | | | | | | | |
(Cost $14,261,062) | | | | | | $ | 14,312,995 | |
Other Assets & Liabilities, net - 1.5% | | | | | | | 221,202 | |
Total Net Assets - 100.0% | | | | | | $ | 14,534,197 | |
* | Non-income producing security. |
† | Value determined based on Level 1 inputs — See Note 4. |
††† | Value determined based on Level 3 inputs — See Note 4. |
1 | Security was fair valued by the Valuation Committee at September 30, 2019. The total market value of fair valued securities amounts to $0, (cost $5,968) or 0.0% of total net assets. |
2 | PIPE (Private Investment in Public Equity) — Stock issued by a company in the secondary market as a means of raising capital more quickly and less expensively than through registration of a secondary public offering. |
3 | Rate indicated is the 7-day yield as of September 30, 2019. REIT — Real Estate Investment Trust |
| | |
| | See Sector Classification in Other Information section. |
74 | THE GUGGENHEIM FUNDS ANNUAL REPORT | SEE NOTES TO FINANCIAL STATEMENTS. |
SCHEDULE OF INVESTMENTS (concluded) | September 30, 2019 |
SMALL CAP VALUE FUND | |
The following table summarizes the inputs used to value the Fund’s investments at September 30, 2019 (See Note 4 in the Notes to Financial Statements):
Investments in Securities (Assets) | | Level 1
Quoted
Prices | | | Level 2
Significant
Observable
Inputs | | | Level 3
Significant
Unobservable
Inputs | | | Total | |
Common Stocks | | $ | 14,057,787 | | | $ | — | | | $ | — | | | $ | 14,057,787 | |
Convertible Preferred Stocks | | | — | | | | — | | | | — | * | | | — | |
Rights | | | — | | | | — | | | | — | * | | | — | |
Exchange-Traded Funds | | | 149,024 | | | | — | | | | — | | | | 149,024 | |
Money Market Fund | | | 106,184 | | | | — | | | | — | | | | 106,184 | |
Total Assets | | $ | 14,312,995 | | | $ | — | | | $ | — | | | $ | 14,312,995 | |
* | Security has a market value of $0. |
SEE NOTES TO FINANCIAL STATEMENTS. | THE GUGGENHEIM FUNDS ANNUAL REPORT | 75 |
STATEMENT OF ASSETS AND LIABILITIES |
September 30, 2019 | |
Assets: |
Investments, at value (cost $14,261,062) | | $ | 14,312,995 | |
Prepaid expenses | | | 40,344 | |
Receivables: |
Securities sold | | | 198,367 | |
Dividends | | | 16,789 | |
Fund shares sold | | | 5,287 | |
Investment adviser | | | 9,495 | |
Interest | | | 350 | |
Total assets | | | 14,583,627 | |
| | | | | |
Liabilities: |
Payable for: |
Professional fees | | | 25,674 | |
Transfer agent/maintenance fees | | | 4,897 | |
Fund shares redeemed | | | 4,817 | |
Printing fees | | | 4,270 | |
Distribution and service fees | | | 3,138 | |
Trustees’ fees* | | | 1,028 | |
Miscellaneous | | | 5,606 | |
Total liabilities | | | 49,430 | |
Net assets | | $ | 14,534,197 | |
| | | | | |
Net assets consist of: |
Paid in capital | | $ | 14,335,635 | |
Total distributable earnings (loss) | | | 198,562 | |
Net assets | | $ | 14,534,197 | |
| | | | | |
A-Class: |
Net assets | | $ | 9,751,401 | |
Capital shares outstanding | | | 758,536 | |
Net asset value per share | | $ | 12.86 | |
Maximum offering price per share (Net asset value divided by 95.25%) | | $ | 13.50 | |
| | | | | |
C-Class: |
Net assets | | $ | 1,593,290 | |
Capital shares outstanding | | | 135,613 | |
Net asset value per share | | $ | 11.75 | |
| | | | | |
P-Class: |
Net assets | | $ | 46,811 | |
Capital shares outstanding | | | 3,597 | |
Net asset value per share | | $ | 13.01 | |
| | | | | |
Institutional Class: |
Net assets | | $ | 3,142,695 | |
Capital shares outstanding | | | 270,901 | |
Net asset value per share | | $ | 11.60 | |
STATEMENT OF OPERATIONS |
Year Ended September 30, 2019 | |
Investment Income: |
Dividends (net of foreign withholding tax of $66) | | $ | 319,914 | |
Interest | | | 8,495 | |
Total investment income | | | 328,409 | |
| | | | | |
Expenses: |
Management fees | | | 120,003 | |
Distribution and service fees: | | | | |
A-Class | | | 26,155 | |
C-Class | | | 21,075 | |
P-Class | | | 85 | |
Transfer agent/maintenance fees: | | | | |
A-Class | | | 18,069 | |
C-Class | | | 5,835 | |
P-Class | | | 193 | |
Institutional Class | | | 8,241 | |
Registration fees | | | 60,624 | |
Professional fees | | | 38,016 | |
Fund accounting/administration fees | | | 24,999 | |
Trustees’ fees* | | | 17,235 | |
Custodian fees | | | 3,539 | |
Line of credit fees | | | 5 | |
Miscellaneous | | | 30,812 | |
Total expenses | | | 374,886 | |
Less: | | | | |
Expenses reimbursed by Adviser: | | | | |
A-Class | | | (40,951 | ) |
C-Class | | | (10,102 | ) |
P-Class | | | (281 | ) |
Institutional Class | | | (15,705 | ) |
Expenses waived by Adviser | | | (92,522 | ) |
Total waived/reimbursed expenses | | | (159,561 | ) |
Net expenses | | | 215,325 | |
Net investment income | | | 113,084 | |
| | | | | |
Net Realized and Unrealized Gain (Loss): |
Net realized gain (loss) on: |
Investments | | | 701,576 | |
Net realized gain | | | 701,576 | |
Net change in unrealized appreciation (depreciation) on: |
Investments | | | (2,007,250 | ) |
Net change in unrealized appreciation (depreciation) | | | (2,007,250 | ) |
Net realized and unrealized loss | | | (1,305,674 | ) |
Net decrease in net assets resulting from operations | | $ | (1,192,590 | ) |
* | Relates to Trustees not deemed “interested persons” within the meaning of Section 2(a)(19) of the 1940 Act. |
76 | THE GUGGENHEIM FUNDS ANNUAL REPORT | SEE NOTES TO FINANCIAL STATEMENTS. |
STATEMENTS OF CHANGES IN NET ASSETS |
| | Year Ended
September 30,
2019 | | | Year Ended
September 30,
2018 | |
Increase (Decrease) in Net Assets from Operations: | | | | | | | | |
Net investment income | | $ | 113,084 | | | $ | 36,203 | |
Net realized gain on investments | | | 701,576 | | | | 1,784,434 | |
Net change in unrealized appreciation (depreciation) on investments | | | (2,007,250 | ) | | | (703,509 | ) |
Net increase (decrease) in net assets resulting from operations | | | (1,192,590 | ) | | | 1,117,128 | |
| | | | | | | | | |
Distributions to shareholders: | | | | | | | | |
A-Class | | | (1,117,845 | ) | | | (844,451 | ) |
C-Class | | | (254,536 | ) | | | (259,676 | ) |
P-Class | | | (1,542 | ) | | | (861 | ) |
Institutional Class | | | (414,600 | ) | | | (403,734 | ) |
Total distributions to shareholders | | | (1,788,523 | ) | | | (1,508,722 | ) |
| | | | | | | | | |
Capital share transactions: | | | | | | | | |
Proceeds from sale of shares | | | | | | | | |
A-Class | | | 1,804,179 | | | | 2,936,068 | |
C-Class | | | 51,146 | | | | 226,040 | |
P-Class | | | 31,429 | | | | 714 | |
Institutional Class | | | 940,499 | | | | 1,692,756 | |
Distributions reinvested | | | | | | | | |
A-Class | | | 1,099,437 | | | | 831,363 | |
C-Class | | | 249,807 | | | | 254,977 | |
P-Class | | | 1,542 | | | | 861 | |
Institutional Class | | | 414,577 | | | | 397,704 | |
Cost of shares redeemed | | | | | | | | |
A-Class | | | (3,220,818 | ) | | | (3,632,141 | ) |
C-Class | | | (1,129,663 | ) | | | (1,803,026 | ) |
P-Class | | | (76 | ) | | | (26 | ) |
Institutional Class | | | (1,355,229 | ) | | | (2,912,537 | ) |
Net decrease from capital share transactions | | | (1,113,170 | ) | | | (2,007,247 | ) |
Net decrease in net assets | | | (4,094,283 | ) | | | (2,398,841 | ) |
| | | | | | | | | |
Net assets: | | | | | | | | |
Beginning of year | | | 18,628,480 | | | | 21,027,321 | |
End of year | | $ | 14,534,197 | | | $ | 18,628,480 | |
| | | | | | | | | |
Capital share activity: | | | | | | | | |
Shares sold | | | | | | | | |
A-Class | | | 143,478 | | | | 188,618 | |
C-Class | | | 4,333 | | | | 15,862 | |
P-Class | | | 2,490 | | | | 45 | |
Institutional Class | | | 80,364 | | | | 120,877 | |
Shares issued from reinvestment of distributions | | | | | | | | |
A-Class | | | 98,164 | | | | 55,684 | |
C-Class | | | 24,277 | | | | 18,477 | |
P-Class | | | 136 | | | | 57 | |
Institutional Class | | | 41,088 | | | | 29,157 | |
Shares redeemed | | | | | | | | |
A-Class | | | (249,860 | ) | | | (236,430 | ) |
C-Class | | | (94,752 | ) | | | (127,654 | ) |
P-Class | | | (6 | ) | | | (1 | ) |
Institutional Class | | | (117,331 | ) | | | (213,469 | ) |
Net decrease in shares | | | (67,619 | ) | | | (148,777 | ) |
SEE NOTES TO FINANCIAL STATEMENTS. | THE GUGGENHEIM FUNDS ANNUAL REPORT | 77 |
This table is presented to show selected data for a share outstanding throughout each period and to assist shareholders in evaluating a Fund’s performance for the periods presented.
A-Class | | Year Ended
September 30,
2019 | | | Year Ended
September 30,
2018 | | | Year Ended
September 30,
2017 | | | Year Ended
September 30,
2016 | | | Year Ended
September 30,
2015 | |
Per Share Data | | | | | | | | | | | | | | | | | | | | |
Net asset value, beginning of period | | $ | 15.56 | | | $ | 15.74 | | | $ | 13.61 | | | $ | 12.78 | | | $ | 16.82 | |
Income (loss) from investment operations: |
Net investment income (loss)a | | | .10 | | | | .04 | | | | .02 | | | | .01 | | | | .02 | |
Net gain (loss) on investments (realized and unrealized) | | | (1.28 | ) | | | .91 | | | | 2.20 | | | | 1.81 | | | | (.60 | ) |
Total from investment operations | | | (1.18 | ) | | | .95 | | | | 2.22 | | | | 1.82 | | | | (.58 | ) |
Less distributions from: |
Net investment income | | | (.19 | ) | | | (.15 | ) | | | (.09 | ) | | | — | | | | (.09 | ) |
Net realized gains | | | (1.33 | ) | | | (.98 | ) | | | — | | | | (.99 | ) | | | (3.37 | ) |
Total distributions | | | (1.52 | ) | | | (1.13 | ) | | | (.09 | ) | | | (.99 | ) | | | (3.46 | ) |
Net asset value, end of period | | $ | 12.86 | | | $ | 15.56 | | | $ | 15.74 | | | $ | 13.61 | | | $ | 12.78 | |
|
Total Returnb | | | (6.14 | %) | | | 6.32 | % | | | 16.41 | % | | | 14.81 | % | | | (5.23 | %) |
Ratios/Supplemental Data |
Net assets, end of period (in thousands) | | $ | 9,751 | | | $ | 11,931 | | | $ | 11,943 | | | $ | 13,283 | | | $ | 12,866 | |
Ratios to average net assets: |
Net investment income (loss) | | | 0.75 | % | | | 0.29 | % | | | 0.15 | % | | | 0.12 | % | | | 0.13 | % |
Total expensesc | | | 2.27 | % | | | 2.09 | % | | | 1.87 | % | | | 2.29 | % | | | 1.99 | % |
Net expensesd,e,f | | | 1.30 | % | | | 1.30 | % | | | 1.32 | % | | | 1.32 | % | | | 1.32 | % |
Portfolio turnover rate | | | 78 | % | | | 18 | % | | | 48 | % | | | 64 | % | | | 62 | % |
C-Class | | Year Ended
September 30,
2019 | | | Year Ended
September 30,
2018 | | | Year Ended
September 30,
2017 | | | Year Ended
September 30,
2016 | | | Year Ended
September 30,
2015 | |
Per Share Data | | | | | | | | | | | | | | | | | | | | |
Net asset value, beginning of period | | $ | 14.30 | | | $ | 14.51 | | | $ | 12.57 | | | $ | 11.95 | | | $ | 15.96 | |
Income (loss) from investment operations: |
Net investment income (loss)a | | | — | g | | | (.07 | ) | | | (.08 | ) | | | (.08 | ) | | | (.09 | ) |
Net gain (loss) on investments (realized and unrealized) | | | (1.18 | ) | | | .84 | | | | 2.02 | | | | 1.69 | | | | (.55 | ) |
Total from investment operations | | | (1.18 | ) | | | .77 | | | | 1.94 | | | | 1.61 | | | | (.64 | ) |
Less distributions from: |
Net investment income | | | (.04 | ) | | | — | | | | — | | | | — | | | | — | |
Net realized gains | | | (1.33 | ) | | | (.98 | ) | | | — | | | | (.99 | ) | | | (3.37 | ) |
Total distributions | | | (1.37 | ) | | | (.98 | ) | | | — | | | | (.99 | ) | | | (3.37 | ) |
Net asset value, end of period | | $ | 11.75 | | | $ | 14.30 | | | $ | 14.51 | | | $ | 12.57 | | | $ | 11.95 | |
|
Total Returnb | | | (6.89 | %) | | | 5.57 | % | | | 15.53 | % | | | 14.02 | % | | | (5.97 | %) |
Ratios/Supplemental Data |
Net assets, end of period (in thousands) | | $ | 1,593 | | | $ | 2,884 | | | $ | 4,281 | | | $ | 4,762 | | | $ | 5,173 | |
Ratios to average net assets: |
Net investment income (loss) | | | 0.01 | % | | | (0.50 | %) | | | (0.60 | %) | | | (0.64 | %) | | | (0.65 | %) |
Total expensesc | | | 3.09 | % | | | 2.94 | % | | | 2.71 | % | | | 3.04 | % | | | 2.72 | % |
Net expensesd,e,f | | | 2.05 | % | | | 2.05 | % | | | 2.07 | % | | | 2.07 | % | | | 2.08 | % |
Portfolio turnover rate | | | 78 | % | | | 18 | % | | | 48 | % | | | 64 | % | | | 62 | % |
78 | THE GUGGENHEIM FUNDS ANNUAL REPORT | SEE NOTES TO FINANCIAL STATEMENTS. |
FINANCIAL HIGHLIGHTS (continued) |
This table is presented to show selected data for a share outstanding throughout each period and to assist shareholders in evaluating a Fund’s performance for the periods presented.
P-Class | | Year Ended
September 30,
2019 | | | Year Ended
September 30,
2018 | | | Year Ended
September 30,
2017 | | | Year Ended
September 30,
2016 | | | Period Ended
September 30,
2015h | |
Per Share Data | | | | | | | | | | | | | | | | | | | | |
Net asset value, beginning of period | | $ | 15.73 | | | $ | 15.76 | | | $ | 13.60 | | | $ | 12.77 | | | $ | 14.33 | |
Income (loss) from investment operations: |
Net investment income (loss)a | | | .09 | | | | .05 | | | | .01 | | | | .02 | | | | .04 | |
Net gain (loss) on investments (realized and unrealized) | | | (1.29 | ) | | | .90 | | | | 2.22 | | | | 1.80 | | | | (1.60 | ) |
Total from investment operations | | | (1.20 | ) | | | .95 | | | | 2.23 | | | | 1.82 | | | | (1.56 | ) |
Less distributions from: |
Net investment income | | | (.19 | ) | | | — | | | | (.07 | ) | | | — | | | | — | |
Net realized gains | | | (1.33 | ) | | | (.98 | ) | | | — | | | | (.99 | ) | | | — | |
Total distributions | | | (1.52 | ) | | | (.98 | ) | | | (.07 | ) | | | (.99 | ) | | | — | |
Net asset value, end of period | | $ | 13.01 | | | $ | 15.73 | | | $ | 15.76 | | | $ | 13.60 | | | $ | 12.77 | |
|
Total Return | | | (6.18 | %) | | | 6.30 | % | | | 16.35 | % | | | 14.88 | % | | | (10.82 | %) |
Ratios/Supplemental Data |
Net assets, end of period (in thousands) | | $ | 47 | | | $ | 15 | | | $ | 14 | | | $ | 11 | | | $ | 9 | |
Ratios to average net assets: |
Net investment income (loss) | | | 0.72 | % | | | 0.30 | % | | | 0.09 | % | | | 0.13 | % | | | 0.60 | % |
Total expensesc | | | 2.73 | % | | | 2.79 | % | | | 3.60 | % | | | 2.50 | % | | | 4.04 | % |
Net expensesd,e,f | | | 1.28 | % | | | 1.30 | % | | | 1.32 | % | | | 1.32 | % | | | 1.31 | % |
Portfolio turnover rate | | | 78 | % | | | 18 | % | | | 48 | % | | | 64 | % | | | 62 | % |
SEE NOTES TO FINANCIAL STATEMENTS. | THE GUGGENHEIM FUNDS ANNUAL REPORT | 79 |
FINANCIAL HIGHLIGHTS (concluded) |
This table is presented to show selected data for a share outstanding throughout each period and to assist shareholders in evaluating a Fund’s performance for the periods presented.
Institutional Class | | Year Ended
September 30,
2019 | | | Year Ended
September 30,
2018 | | | Year Ended
September 30,
2017 | | | Year Ended
September 30,
2016 | | | Year Ended
September 30,
2015 | |
Per Share Data | | | | | | | | | | | | | | | | | | | | |
Net asset value, beginning of period | | $ | 14.24 | | | $ | 14.50 | | | $ | 12.54 | | | $ | 11.82 | | | $ | 17.04 | |
Income (loss) from investment operations: |
Net investment income (loss)a | | | .12 | | | | .07 | | | | .04 | | | | .04 | | | | .05 | |
Net gain (loss) on investments (realized and unrealized) | | | (1.20 | ) | | | .84 | | | | 2.04 | | | | 1.67 | | | | (.49 | ) |
Total from investment operations | | | (1.08 | ) | | | .91 | | | | 2.08 | | | | 1.71 | | | | (.44 | ) |
Less distributions from: |
Net investment income | | | (.23 | ) | | | (.19 | ) | | | (.12 | ) | | | — | | | | (1.41 | ) |
Net realized gains | | | (1.33 | ) | | | (.98 | ) | | | — | | | | (.99 | ) | | | (3.37 | ) |
Total distributions | | | (1.56 | ) | | | (1.17 | ) | | | (.12 | ) | | | (.99 | ) | | | (4.78 | ) |
Net asset value, end of period | | $ | 11.60 | | | $ | 14.24 | | | $ | 14.50 | | | $ | 12.54 | | | $ | 11.82 | |
|
Total Return | | | (5.96 | %) | | | 6.64 | % | | | 16.65 | % | | | 15.18 | % | | | (5.01 | %) |
Ratios/Supplemental Data |
Net assets, end of period (in thousands) | | $ | 3,143 | | | $ | 3,798 | | | $ | 4,790 | | | $ | 281 | | | $ | 459 | |
Ratios to average net assets: |
Net investment income (loss) | | | 0.99 | % | | | 0.50 | % | | | 0.30 | % | | | 0.30 | % | | | 0.33 | % |
Total expensesc | | | 2.09 | % | | | 1.91 | % | | | 1.56 | % | | | 2.09 | % | | | 1.70 | % |
Net expensesd,e,f | | | 1.05 | % | | | 1.05 | % | | | 1.07 | % | | | 1.07 | % | | | 1.07 | % |
Portfolio turnover rate | | | 78 | % | | | 18 | % | | | 48 | % | | | 64 | % | | | 62 | % |
a | Net investment income (loss) per share was computed using average shares outstanding throughout the period. |
b | Total return does not reflect the impact of any applicable sales charges. |
c | Does not include expenses of the underlying funds in which the Fund invests. |
d | Net expense information reflects the expense ratios after expense waivers and reimbursements, as applicable. |
e | The portion of the ratios of net expenses to average net assets attributable to recoupments of prior fee reductions or expense reimbursements for the years presented was as follows: |
| | | 09/30/19 | 09/30/18 | 09/30/17 |
| | A-Class | — | — | 0.00%* |
| | C-Class | — | — | 0.01% |
| | P-Class | — | — | 0.74% |
| | Institutional Class | — | — | 0.00%* |
f | Net expenses may include expenses that are excluded from the expense limitation agreement. Excluding these expenses, the net expense ratios for the years presented would be: |
| | | 09/30/19 | 09/30/18 | 09/30/17 | 09/30/16 | 09/30/15 |
| | A-Class | 1.30% | 1.30% | 1.30% | 1.30% | 1.30% |
| | C-Class | 2.05% | 2.05% | 2.05% | 2.05% | 2.05% |
| | P-Class | 1.28% | 1.30% | 1.30% | 1.30% | 1.30% |
| | Institutional Class | 1.05% | 1.05% | 1.05% | 1.05% | 1.05% |
g | Less than $0.01. |
h | Since commencement of operations: May 1, 2015. Percentage amounts for the period, except total return and portfolio turnover rate, have been annualized. |
80 | THE GUGGENHEIM FUNDS ANNUAL REPORT | SEE NOTES TO FINANCIAL STATEMENTS. |
MANAGERS’ COMMENTARY (Unaudited) | September 30, 2019 |
To Our Shareholders:
Guggenheim StylePlus—Large Core Fund (the “Fund”) is managed by a team of seasoned professionals, including Farhan Sharaff, Senior Managing Director and Assistant Chief Investment Officer, Equities; Jayson Flowers, Senior Managing Director and Portfolio Manager; Qi Yan, Managing Director and Portfolio Manager; and Adam Bloch, Managing Director and Portfolio Manager. In the following paragraphs, the investment team discusses performance of the Fund for the fiscal year ended September 30, 2019.
For the fiscal year ended September 30, 2019, Guggenheim StylePlus—Large Core Fund returned 1.50%1, compared with the 4.25% return of its benchmark, the S&P 500 Index.
Investment Approach
Through a combination of actively managed individual equity, passive equity, and actively managed fixed income, the Fund seeks to exceed the total return of the S&P 500 Index. The actively managed equity and fixed income components seek to provide multiple sources of outperformance and take advantage of Guggenheim’s competencies in both fixed income and systematic stock selection.
The active and passive decisions seek to add value by tactically allocating to actively managed equity through quantitative selection models when stock picking opportunities are high. During periods when Guggenheim views these opportunities to be less attractive, the Fund seeks to increase its passive exposure to equities and the allocation to fixed-income securities. The prospective return during such periods is the equity index plus an “alpha” component coming from the yield of the fixed-income overlay.
Performance Review
Over the period, from 15-25% of the total equity position was allocated to actively managed equity and 75-85% to passive equity. Remaining Fund assets were invested in the Guggenheim Strategy Funds, short-term fixed-income investment companies advised by Guggenheim Investments, and the Guggenheim Ultra Short Duration Fund whose objective is to seek a high level of income consistent with the preservation of capital.
The Fund underperformed the S&P 500 Index for the year ended September 30, 2019. The fixed income sleeve was the largest contributor, as positions in the Guggenheim Ultra Short Duration Fund and the Guggenheim Strategy Funds, which held asset-backed securities, investment-grade corporates, and non-agency residential mortgage-backed securities, constituted the majority of the Fund’s total return. The actively managed equity sleeve detracted from performance. The passive equity position, maintained through swap agreements and futures contracts, contributed to performance for the period.
When compared with the index, the total equity position (actively managed individual equity plus passive equity derivatives) was most overweight the Financials and Information Technology sectors and most underweight the Health Care and Utilities sectors.
Performance displayed represents past performance which is no guarantee of future results.
1 | Performance figures are based on Class A shares and do not reflect deduction of the sales charges or taxes that a shareholder would pay on distributions or the redemption of shares. |
The opinions and forecast expressed may not actually come to pass. This information is subject to change at any time, based on market and other conditions, and should not be construed as a recommendation of any specific security or strategy.
| | THE GUGGENHEIM FUNDS ANNUAL REPORT | 81 |
PERFORMANCE REPORT AND FUND PROFILE (Unaudited) | September 30, 2019 |
STYLEPLUS—LARGE CORE FUND
OBJECTIVE: Seeks long-term growth of capital.
Holdings Diversification (Market Exposure as % of Net Assets)
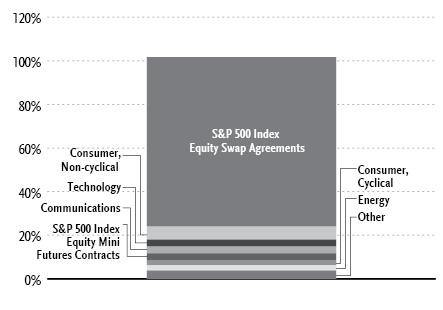
“Holdings Diversification (Market Exposure as % of Net Assets)” excludes any temporary cash investments, investments in Guggenheim Strategy Funds Trust mutual funds, or investments in Guggenheim Ultra Short Duration Fund.
Inception Dates: |
A-Class | September 10, 1962 |
C-Class | January 29, 1999 |
P-Class | May 1, 2015 |
Institutional Class | March 1, 2012 |
Ten Largest Holdings (% of Total Net Assets) |
Guggenheim Strategy Fund III | 33.8% |
Guggenheim Strategy Fund II | 30.2% |
Guggenheim Ultra Short Duration Fund — Institutional Class | 11.1% |
Apple, Inc. | 0.9% |
Microsoft Corp. | 0.7% |
Alphabet, Inc. — Class C | 0.6% |
Exxon Mobil Corp. | 0.5% |
Amazon.com, Inc. | 0.4% |
Chevron Corp. | 0.4% |
Verizon Communications, Inc. | 0.4% |
Top Ten Total | 79.0% |
| | |
“Ten Largest Holdings” excludes any temporary cash or derivative investments. |
82 | THE GUGGENHEIM FUNDS ANNUAL REPORT | |
PERFORMANCE REPORT AND FUND PROFILE (Unaudited)(concluded) | September 30, 2019 |
Cumulative Fund Performance*
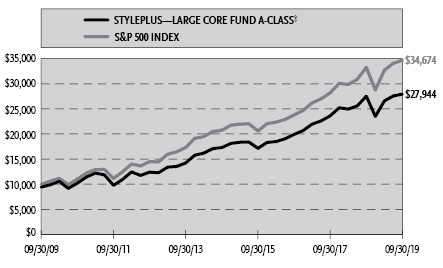
Average Annual Returns*
Periods Ended September 30, 2019
| 1 Year | 5 Year | 10 Year |
A-Class Shares | 1.50% | 10.08% | 11.49% |
A -Class Shares with sales charge‡ | (3.34%) | 9.01% | 10.82% |
C-Class Shares | 0.60% | 9.09% | 10.50% |
C-Class Shares with CDSC§ | (0.17%) | 9.09% | 10.50% |
S&P 500 Index | 4.25% | 10.84% | 13.24% |
| | 1 Year | Since
Inception
(05/01/15) |
P-Class Shares | | 1.47% | 9.29% |
S&P 500 Index | | 4.25% | 10.39% |
| 1 Year | 5 Year | Since
Inception
(03/01/12) |
Institutional Class Shares | 1.74% | 10.45% | 11.87% |
S&P 500 Index | 4.25% | 10.84% | 13.06% |
* | The performance data above represents past performance that is not predictive of future results. The investment return and principal value of an investment in the Fund will fluctuate so that an investor’s shares, when redeemed, may be worth more or less than their original cost. Returns are historical and include changes in principal and reinvested dividends and capital gains and do not reflect the effect of taxes. The S&P 500 Index is an unmanaged index and, unlike the Fund, has no management fees or operating expenses to reduce its reported return. The graph is based on A-Class shares only; performance for C-Class, P-Class and Institutional Class will vary due to differences in fee structures. |
‡ | Effective February 22, 2011, the maximum sales charge decreased from 5.75% to 4.75%. A 5.75% maximum sales charge is used in the calculation of the Average Annual Returns based on subscriptions made prior to February 22, 2011, and a 4.75% maximum sales charge will be used to calculate performance for periods based on subscriptions made on or after February 22, 2011. |
§ | Fund returns include a CDSC of 1% if redeemed within 12 months of purchase. |
| | THE GUGGENHEIM FUNDS ANNUAL REPORT | 83 |
SCHEDULE OF INVESTMENTS | September 30, 2019 |
STYLEPLUS—LARGE CORE FUND | |
| | Shares | | | Value | |
COMMON STOCKS† - 20.8% |
| | | | | | | | | |
Consumer, Non-cyclical - 5.9% |
Merck & Company, Inc. | | | 8,551 | | | $ | 719,823 | |
Johnson & Johnson | | | 5,452 | | | | 705,380 | |
Pfizer, Inc. | | | 17,538 | | | | 630,140 | |
Amgen, Inc. | | | 2,959 | | | | 572,596 | |
UnitedHealth Group, Inc. | | | 2,315 | | | | 503,096 | |
McKesson Corp. | | | 3,674 | | | | 502,089 | |
Archer-Daniels-Midland Co. | | | 11,706 | | | | 480,765 | |
PepsiCo, Inc. | | | 3,398 | | | | 465,866 | |
Gilead Sciences, Inc. | | | 7,312 | | | | 463,435 | |
Eli Lilly & Co. | | | 4,047 | | | | 452,576 | |
Tyson Foods, Inc. — Class A | | | 4,805 | | | | 413,903 | |
Kimberly-Clark Corp. | | | 2,837 | | | | 402,996 | |
Philip Morris International, Inc. | | | 5,238 | | | | 397,721 | |
Molson Coors Brewing Co. — Class B | | | 6,688 | | | | 384,560 | |
H&R Block, Inc. | | | 15,635 | | | | 369,299 | |
Humana, Inc. | | | 1,419 | | | | 362,796 | |
Biogen, Inc.* | | | 1,365 | | | | 317,799 | |
AmerisourceBergen Corp. — Class A | | | 3,839 | | | | 316,065 | |
Universal Health Services, Inc. — Class B | | | 2,052 | | | | 305,235 | |
Sysco Corp. | | | 3,787 | | | | 300,688 | |
CVS Health Corp. | | | 4,572 | | | | 288,356 | |
Regeneron Pharmaceuticals, Inc.* | | | 976 | | | | 270,742 | |
Zimmer Biomet Holdings, Inc. | | | 1,952 | | | | 267,951 | |
Kroger Co. | | | 9,293 | | | | 239,573 | |
Altria Group, Inc. | | | 5,613 | | | | 229,572 | |
HCA Healthcare, Inc. | | | 1,836 | | | | 221,091 | |
Colgate-Palmolive Co. | | | 2,695 | | | | 198,109 | |
AbbVie, Inc. | | | 2,585 | | | | 195,736 | |
Kraft Heinz Co. | | | 6,130 | | | | 171,242 | |
Alexion Pharmaceuticals, Inc.* | | | 1,656 | | | | 162,189 | |
Procter & Gamble Co. | | | 1,118 | | | | 139,057 | |
Medtronic plc | | | 1,274 | | | | 138,382 | |
General Mills, Inc. | | | 2,424 | | | | 133,611 | |
Constellation Brands, Inc. — Class A | | | 637 | | | | 132,037 | |
Anthem, Inc. | | | 424 | | | | 101,802 | |
Total Consumer, Non-cyclical | | | | | | | 11,956,278 | |
| | | | | | | | | |
Technology - 3.2% |
Apple, Inc. | | | 8,225 | | | | 1,842,153 | |
Microsoft Corp. | | | 10,575 | | | | 1,470,242 | |
Intel Corp. | | | 13,040 | | | | 671,951 | |
Lam Research Corp. | | | 1,417 | | | | 327,483 | |
Skyworks Solutions, Inc. | | | 4,036 | | | | 319,853 | |
Oracle Corp. | | | 5,621 | | | | 309,323 | |
HP, Inc. | | | 14,725 | | | | 278,597 | |
Seagate Technology plc | | | 4,788 | | | | 257,547 | |
International Business Machines Corp. | | | 1,468 | | | | 213,477 | |
NetApp, Inc. | | | 3,946 | | | | 207,204 | |
Activision Blizzard, Inc. | | | 3,842 | | | | 203,319 | |
Micron Technology, Inc.* | | | 4,122 | | | | 176,628 | |
QUALCOMM, Inc. | | | 2,026 | | | | 154,543 | |
Total Technology | | | | | | | 6,432,320 | |
| | | | | | | | | |
Communications - 3.1% |
Alphabet, Inc. — Class C* | | | 981 | | | | 1,195,839 | |
Amazon.com, Inc.* | | | 492 | | | | 854,068 | |
Verizon Communications, Inc. | | | 13,186 | | | | 795,907 | |
Facebook, Inc. — Class A* | | | 3,912 | | | | 696,649 | |
AT&T, Inc. | | | 17,776 | | | | 672,644 | |
Comcast Corp. — Class A | | | 12,290 | | | | 554,033 | |
Omnicom Group, Inc. | | | 5,686 | | | | 445,214 | |
Walt Disney Co. | | | 3,070 | | | | 400,083 | |
Discovery, Inc. — Class A* | | | 13,180 | | | | 350,983 | |
Corning, Inc. | | | 6,631 | | | | 189,116 | |
Cisco Systems, Inc. | | | 2,237 | | | | 110,530 | |
Netflix, Inc.* | | | 274 | | | | 73,328 | |
Total Communications | | | | | | | 6,338,394 | |
| | | | | | | | | |
Consumer, Cyclical - 2.4% |
Walgreens Boots Alliance, Inc. | | | 9,221 | | | | 510,013 | |
PACCAR, Inc. | | | 6,862 | | | | 480,409 | |
DR Horton, Inc. | | | 7,857 | | | | 414,142 | |
Southwest Airlines Co. | | | 7,016 | | | | 378,934 | |
Delta Air Lines, Inc. | | | 6,190 | | | | 356,544 | |
United Airlines Holdings, Inc.* | | | 3,766 | | | | 332,952 | |
PulteGroup, Inc. | | | 8,552 | | | | 312,576 | |
Lennar Corp. — Class A | | | 5,309 | | | | 296,508 | |
BorgWarner, Inc. | | | 8,027 | | | | 294,430 | |
General Motors Co. | | | 7,799 | | | | 292,306 | |
Carnival Corp. | | | 5,273 | | | | 230,483 | |
Best Buy Company, Inc. | | | 3,047 | | | | 210,213 | |
Aptiv plc | | | 2,046 | | | | 178,861 | |
Ralph Lauren Corp. — Class A | | | 1,846 | | | | 176,238 | |
Tapestry, Inc. | | | 6,686 | | | | 174,170 | |
Alaska Air Group, Inc. | | | 2,537 | | | | 164,677 | |
Total Consumer, Cyclical | | | | | | | 4,803,456 | |
| | | | | | | | | |
Energy - 2.4% |
Exxon Mobil Corp. | | | 13,165 | | | | 929,581 | |
Chevron Corp. | | | 6,744 | | | | 799,838 | |
ONEOK, Inc. | | | 6,949 | | | | 512,072 | |
ConocoPhillips | | | 8,386 | | | | 477,834 | |
Marathon Petroleum Corp. | | | 6,595 | | | | 400,646 | |
Phillips 66 | | | 3,674 | | | | 376,218 | |
Valero Energy Corp. | | | 4,344 | | | | 370,283 | |
Kinder Morgan, Inc. | | | 14,945 | | | | 308,016 | |
HollyFrontier Corp. | | | 4,739 | | | | 254,200 | |
Williams Companies, Inc. | | | 8,518 | | | | 204,943 | |
Marathon Oil Corp. | | | 12,874 | | | | 157,964 | |
Total Energy | | | | | | | 4,791,595 | |
| | | | | | | | | |
Industrial - 2.3% |
United Parcel Service, Inc. — Class B | | | 5,426 | | | | 650,143 | |
Union Pacific Corp. | | | 2,949 | | | | 477,679 | |
Cummins, Inc. | | | 2,820 | | | | 458,729 | |
CSX Corp. | | | 5,555 | | | | 384,795 | |
Parker-Hannifin Corp. | | | 2,062 | | | | 372,418 | |
Norfolk Southern Corp. | | | 1,986 | | | | 356,805 | |
Expeditors International of Washington, Inc. | | | 4,292 | | | | 318,853 | |
84 | THE GUGGENHEIM FUNDS ANNUAL REPORT | SEE NOTES TO FINANCIAL STATEMENTS. |
SCHEDULE OF INVESTMENTS (continued) | September 30, 2019 |
STYLEPLUS—LARGE CORE FUND | |
| | Shares | | | Value | |
J.B. Hunt Transport Services, Inc. | | | 2,312 | | | $ | 255,823 | |
Kansas City Southern | | | 1,654 | | | | 219,999 | |
Caterpillar, Inc. | | | 1,640 | | | | 207,148 | |
United Technologies Corp. | | | 1,420 | | | | 193,858 | |
Snap-on, Inc. | | | 1,141 | | | | 178,612 | |
Waters Corp.* | | | 785 | | | | 175,236 | |
CH Robinson Worldwide, Inc. | | | 1,808 | | | | 153,282 | |
FedEx Corp. | | | 1,041 | | | | 151,538 | |
General Electric Co. | | | 15,534 | | | | 138,874 | |
Total Industrial | | | | | | | 4,693,792 | |
| | | | | | | | | |
Financial - 1.5% |
Berkshire Hathaway, Inc. — Class B* | | | 2,181 | | | | 453,692 | |
JPMorgan Chase & Co. | | | 3,368 | | | | 396,380 | |
Travelers Companies, Inc. | | | 2,006 | | | | 298,272 | |
Bank of America Corp. | | | 10,225 | | | | 298,263 | |
Visa, Inc. — Class A | | | 1,505 | | | | 258,875 | |
Northern Trust Corp. | | | 2,276 | | | | 212,396 | |
Western Union Co. | | | 9,003 | | | | 208,599 | |
Citigroup, Inc. | | | 2,398 | | | | 165,654 | |
Synchrony Financial | | | 4,853 | | | | 165,439 | |
Hartford Financial Services Group, Inc. | | | 2,230 | | | | 135,160 | |
Bank of New York Mellon Corp. | | | 2,879 | | | | 130,160 | |
MetLife, Inc. | | | 2,583 | | | | 121,814 | |
Prudential Financial, Inc. | | | 1,273 | | | | 114,507 | |
Total Financial | | | | | | | 2,959,211 | |
| | | | | | | | | |
Total Common Stocks | | | | | | | | |
(Cost $40,433,318) | | | | | | | 41,975,046 | |
| | | | | | | | | |
MUTUAL FUNDS† - 75.1% |
Guggenheim Strategy Fund III1 | | | 2,744,942 | | | | 68,129,466 | |
Guggenheim Strategy Fund II1 | | | 2,447,873 | | | | 60,780,681 | |
Guggenheim Ultra Short Duration Fund — Institutional Class1,2 | | | 2,248,845 | | | | 22,398,499 | |
Total Mutual Funds | | | | | | | | |
(Cost $151,802,428) | | | | | | | 151,308,646 | |
| | | | | | | | | |
MONEY MARKET FUND† - 3.7% |
Dreyfus Treasury Securities Cash Management Fund — Institutional Shares 1.83%3 | | | 7,439,728 | | | | 7,439,728 | |
Total Money Market Fund | | | | | | | | |
(Cost $7,439,728) | | | | | | | 7,439,728 | |
| | | | | | | | | |
Total Investments - 99.6% | | | | | | | | |
(Cost $199,675,474) | | | | | | $ | 200,723,420 | |
Other Assets & Liabilities, net - 0.4% | | | | | | | 793,914 | |
Total Net Assets - 100.0% | | | | | | $ | 201,517,334 | |
Futures Contracts |
Description | | Number of
Contracts | | | Expiration
Date | | | Notional
Amount | | | Value and
Unrealized
Depreciation** | |
Equity Futures Contracts Purchased† |
S&P 500 Index Mini Futures Contracts | | | 42 | | | | Dec 2019 | | | $ | 6,253,275 | | | $ | (39,215 | ) |
Total Return Swap Agreements |
Counterparty | Index | Financing
Rate Pay | | Payment
Frequency | | | Maturity
Date | | | Units | | | Notional
Amount | | | Value and
Unrealized
Appreciation
(Depreciation) | |
OTC Equity Index Swap Agreements†† |
Citibank N.A., New York | S&P 500 Index Total Return | 2.28% (3 Month USD LIBOR + 0.19%) | | | At Maturity | | | | 10/30/20 | | | | 26,079 | | | $ | 156,698,019 | | | $ | — | |
* | Non-income producing security. |
** | Includes cumulative appreciation (depreciation). Variation margin is reported within the Statement of Assets and Liabilities. |
† | Value determined based on Level 1 inputs — See Note 4. |
†† | Value determined based on Level 2 inputs — See Note 4. |
1 | Affiliated issuer. |
2 | Effective November 30, 2018, Guggenheim Strategy Fund I was reorganized with and into the Guggenheim Ultra Short Duration Fund. |
3 | Rate indicated is the 7-day yield as of September 30, 2019. |
| | plc — Public Limited Company |
| | |
| | See Sector Classification in Other Information section. |
SEE NOTES TO FINANCIAL STATEMENTS. | THE GUGGENHEIM FUNDS ANNUAL REPORT | 85 |
SCHEDULE OF INVESTMENTS (concluded) | September 30, 2019 |
STYLEPLUS—LARGE CORE FUND | |
The following table summarizes the inputs used to value the Fund’s investments at September 30, 2019 (See Note 4 in the Notes to Financial Statements):
Investments in Securities (Assets) | | Level 1
Quoted
Prices | | | Level 2
Significant
Observable
Inputs | | | Level 3
Significant
Unobservable
Inputs | | | Total | |
Common Stocks | | $ | 41,975,046 | | | $ | — | | | $ | — | | | $ | 41,975,046 | |
Mutual Funds | | | 151,308,646 | | | | — | | | | — | | | | 151,308,646 | |
Money Market Fund | | | 7,439,728 | | | | — | | | | — | | | | 7,439,728 | |
Equity Index Swap Agreements** | | | — | | | | — | * | | | — | | | | — | |
Total Assets | | $ | 200,723,420 | | | $ | — | | | $ | — | | | $ | 200,723,420 | |
Investments in Securities (Liabilities) | | Level 1
Quoted
Prices | | | Level 2
Significant
Observable
Inputs | | | Level 3
Significant
Unobservable
Inputs | | | Total | |
Equity Futures Contracts** | | $ | 39,215 | | | $ | — | | | $ | — | | | $ | 39,215 | |
* | Includes security with unrealized appreciation/depreciation of less than $1. |
** | This derivative is reported as unrealized appreciation/depreciation at period end. |
Affiliated Transactions
Investments representing 5% or more of the outstanding voting shares of a company, or control of or by, or common control under Guggenheim Investments (“GI”), result in that company being considered an affiliated issuer, as defined in the 1940 Act.
The Fund may invest in certain of the underlying series of Guggenheim Strategy Funds Trust, including Guggenheim Strategy Fund II and Guggenheim Strategy Fund III, (collectively, the “Cash Management Funds”), each of which are open-end management investment companies managed by GI. The Cash Management Funds, which launched on March 11, 2014, are offered as cash management options only to mutual funds, trusts, and other accounts managed by GI and/or its affiliates, and are not available to the public. The Cash Management Funds pay no investment management fees. The Cash Management Funds’ annual report on Form N-CSR dated September 30, 2018, is available publicly or upon request. This information is available from the EDGAR database on the SEC’s website at https://www.sec.gov/Archives/edgar/data/1601445/000089180418000513/gug75569-ncsr.htm.
Transactions during the year ended September 30, 2019, in which the company is an affiliated issuer, were as follows:
Security Name | | Value
09/30/18 | | | Additions | | | Reductions | | | Realized
Gain (Loss) | | | Change in
Unrealized
Appreciation
(Depreciation) | | | Value
09/30/19 | | | Shares
09/30/19 | | | Investment
Income | | | Capital
Gain
Distributions | |
Mutual Funds | | | | | | | | | | | | | | | | | | | | | | | | | | | | | | | | | | | | |
Guggenheim Limited Duration Fund — R6-Class | | $ | 16,592,241 | | | $ | 114,943 | | | $ | (16,646,649 | ) | | $ | 271,859 | | | $ | (332,394 | ) | | $ | — | | | | — | | | $ | 114,627 | | | $ | 319 | |
Guggenheim Strategy Fund II | | | 66,163,141 | | | | 8,927,640 | | | | (13,968,304 | ) | | | (4,175 | ) | | | (337,621 | ) | | | 60,780,681 | | | | 2,447,873 | | | | 1,687,746 | | | | 30,930 | |
Guggenheim Strategy Fund III | | | 78,685,454 | | | | 3,058,978 | | | | (13,063,354 | ) | | | (77,617 | ) | | | (473,995 | ) | | | 68,129,466 | | | | 2,744,942 | | | | 2,056,222 | | | | 2,778 | |
Guggenheim Ultra Short Duration Fund — Institutional Class1 | | | 17,256,263 | | | | 37,093,372 | | | | (31,920,925 | ) | | | 5,177 | | | | (35,388 | ) | | | 22,398,499 | | | | 2,248,845 | | | | 548,420 | | | | 5,297 | |
| | | $ | 178,697,099 | | | $ | 49,194,933 | | | $ | (75,599,232 | ) | | $ | 195,244 | | | $ | (1,179,398 | ) | | $ | 151,308,646 | | | | | | | $ | 4,407,015 | | | $ | 39,324 | |
1 | Effective November 30, 2018, Guggenheim Strategy Fund I was reorganized with and into the Guggenheim Ultra Short Duration Fund. |
86 | THE GUGGENHEIM FUNDS ANNUAL REPORT | SEE NOTES TO FINANCIAL STATEMENTS. |
STYLEPLUS—LARGE CORE FUND | |
STATEMENT OF ASSETS AND LIABILITIES |
September 30, 2019 |
Assets: |
Investments in unaffiliated issuers, at value (cost $47,873,046) | | $ | 49,414,774 | |
Investments in affiliated issuers, at value (cost $151,802,428) | | | 151,308,646 | |
Cash | | | 3,301 | |
Segregated cash with broker | | | 163,800 | |
Prepaid expenses | | | 47,992 | |
Receivables: |
Swap settlement | | | 2,911,887 | |
Dividends | | | 323,706 | |
Fund shares sold | | | 22,258 | |
Interest | | | 14,112 | |
Total assets | | | 204,210,476 | |
| | | | | |
Liabilities: |
Segregated cash due to broker | | | 2,130,000 | |
Payable for: |
Securities purchased | | | 279,406 | |
Management fees | | | 112,312 | |
Distribution and service fees | | | 38,627 | |
Fund accounting/administration fees | | | 12,409 | |
Transfer agent/maintenance fees | | | 10,618 | |
Variation margin on futures contracts | | | 3,434 | |
Fund shares redeemed | | | 1,966 | |
Trustees’ fees* | | | 1,710 | |
Miscellaneous | | | 102,660 | |
Total liabilities | | | 2,693,142 | |
Net assets | | $ | 201,517,334 | |
| | | | | |
Net assets consist of: |
Paid in capital | | $ | 197,390,490 | |
Total distributable earnings (loss) | | | 4,126,844 | |
Net assets | | $ | 201,517,334 | |
| | | | | |
A-Class: |
Net assets | | $ | 196,562,594 | |
Capital shares outstanding | | | 9,599,809 | |
Net asset value per share | | $ | 20.48 | |
Maximum offering price per share (Net asset value divided by 95.25%) | | $ | 21.50 | |
| | | | | |
C-Class: |
Net assets | | $ | 972,511 | |
Capital shares outstanding | | | 68,396 | |
Net asset value per share | | $ | 14.22 | |
| | | | | |
P-Class: |
Net assets | | $ | 235,590 | |
Capital shares outstanding | | | 11,657 | |
Net asset value per share | | $ | 20.21 | |
| | | | | |
Institutional Class: |
Net assets | | $ | 3,746,639 | |
Capital shares outstanding | | | 184,443 | |
Net asset value per share | | $ | 20.31 | |
* | Relates to Trustees not deemed “interested persons” within the meaning of Section 2(a)(19) of the 1940 Act. |
SEE NOTES TO FINANCIAL STATEMENTS. | THE GUGGENHEIM FUNDS ANNUAL REPORT | 87 |
STYLEPLUS—LARGE CORE FUND | |
STATEMENT OF OPERATIONS |
Year Ended September 30, 2019 |
Investment Income: |
Dividends from securities of unaffiliated issuers | | $ | 981,120 | |
Dividends from securities of affiliated issuers | | | 4,407,015 | |
Interest | | | 151,120 | |
Total investment income | | | 5,539,255 | |
| | | | | |
Expenses: |
Management fees | | | 1,507,027 | |
Distribution and service fees: |
A-Class | | | 489,519 | |
C-Class | | | 10,115 | |
P-Class | | | 645 | |
Transfer agent/maintenance fees: |
A-Class | | | 161,019 | |
C-Class | | | 2,486 | |
P-Class | | | 335 | |
Institutional Class | | | 3,844 | |
Fund accounting/administration fees | | | 160,751 | |
Interest Expense | | | 35,099 | |
Trustees’ fees* | | | 21,273 | |
Custodian fees | | | 17,771 | |
Line of credit fees | | | 3,523 | |
Miscellaneous | | | 219,151 | |
Total expenses | | | 2,632,558 | |
Less: |
Expenses waived by Adviser | | | (64,734 | ) |
Net expenses | | | 2,567,824 | |
Net investment income | | | 2,971,431 | |
| | | | | |
Net Realized and Unrealized Gain (Loss): |
Net realized gain (loss) on: |
Investments in unaffiliated issuers | | $ | (250,917 | ) |
Investments in affiliated issuers | | | 195,244 | |
Distributions received from affiliated investment companies | | | 39,324 | |
Swap agreements | | | 2,027,836 | |
Futures contracts | | | (524,530 | ) |
Net realized gain | | | 1,486,957 | |
Net change in unrealized appreciation (depreciation) on: |
Investments in unaffiliated issuers | | | (1,251,202 | ) |
Investments in affiliated issuers | | | (1,179,398 | ) |
Swap agreements | | | (995,558 | ) |
Futures contracts | | | (48,219 | ) |
Net change in unrealized appreciation (depreciation) | | | (3,474,377 | ) |
Net realized and unrealized loss | | | (1,987,420 | ) |
Net increase in net assets resulting from operations | | $ | 984,011 | |
* | Relates to Trustees not deemed “interested persons” within the meaning of Section 2(a)(19) of the 1940 Act. |
88 | THE GUGGENHEIM FUNDS ANNUAL REPORT | SEE NOTES TO FINANCIAL STATEMENTS. |
STYLEPLUS—LARGE CORE FUND | |
STATEMENTS OF CHANGES IN NET ASSETS |
| | Year Ended
September 30,
2019 | | | Year Ended
September 30,
2018 | |
Increase (Decrease) in Net Assets from Operations: | | | | | | | | |
Net investment income | | $ | 2,971,431 | | | $ | 2,808,320 | |
Net realized gain on investments | | | 1,486,957 | | | | 34,055,009 | |
Net change in unrealized appreciation (depreciation) on investments | | | (3,474,377 | ) | | | (2,746,381 | ) |
Net increase in net assets resulting from operations | | | 984,011 | | | | 34,116,948 | |
| | | | | | | | | |
Distributions to shareholders: | | | | | | | | |
A-Class | | | (33,235,169 | ) | | | (34,164,488 | ) |
C-Class | | | (243,784 | ) | | | (475,223 | ) |
P-Class | | | (57,515 | ) | | | (87,267 | ) |
Institutional Class | | | (818,298 | ) | | | (998,960 | ) |
Total distributions to shareholders | | | (34,354,766 | ) | | | (35,725,938 | ) |
| | | | | | | | | |
Capital share transactions: | | | | | | | | |
Proceeds from sale of shares | | | | | | | | |
A-Class | | | 8,230,249 | | | | 6,578,624 | |
C-Class | | | 282,941 | | | | 457,398 | |
P-Class | | | 68,423 | | | | 123,734 | |
Institutional Class | | | 1,679,246 | | | | 4,334,054 | |
Distributions reinvested | | | | | | | | |
A-Class | | | 31,501,637 | | | | 31,962,892 | |
C-Class | | | 241,526 | | | | 467,557 | |
P-Class | | | 57,515 | | | | 87,266 | |
Institutional Class | | | 755,670 | | | | 922,633 | |
Cost of shares redeemed | | | | | | | | |
A-Class | | | (28,897,196 | ) | | | (25,292,149 | ) |
C-Class | | | (515,190 | ) | | | (1,900,350 | ) |
P-Class | | | (141,618 | ) | | | (372,908 | ) |
Institutional Class | | | (4,457,139 | ) | | | (4,225,529 | ) |
Net increase from capital share transactions | | | 8,806,064 | | | | 13,143,222 | |
Net increase (decrease) in net assets | | | (24,564,691 | ) | | | 11,534,232 | |
| | | | | | | | | |
Net assets: | | | | | | | | |
Beginning of year | | | 226,082,025 | | | | 214,547,793 | |
End of year | | $ | 201,517,334 | | | $ | 226,082,025 | |
| | | | | | | | | |
Capital share activity: | | | | | | | | |
Shares sold | | | | | | | | |
A-Class | | | 418,821 | | | | 272,567 | |
C-Class | | | 19,388 | | | | 25,701 | |
P-Class | | | 3,096 | | | | 5,149 | |
Institutional Class | | | 79,717 | | | | 187,375 | |
Shares issued from reinvestment of distributions | | | | | | | | |
A-Class | | | 1,858,504 | | | | 1,401,881 | |
C-Class | | | 20,382 | | | | 27,407 | |
P-Class | | | 3,435 | | | | 3,861 | |
Institutional Class | | | 45,011 | | | | 40,770 | |
Shares redeemed | | | | | | | | |
A-Class | | | (1,462,254 | ) | | | (1,055,618 | ) |
C-Class | | | (38,707 | ) | | | (106,147 | ) |
P-Class | | | (7,893 | ) | | | (16,275 | ) |
Institutional Class | | | (217,211 | ) | | | (175,281 | ) |
Net increase in shares | | | 722,289 | | | | 611,390 | |
SEE NOTES TO FINANCIAL STATEMENTS. | THE GUGGENHEIM FUNDS ANNUAL REPORT | 89 |
STYLEPLUS—LARGE CORE FUND | |
This table is presented to show selected data for a share outstanding throughout each period and to assist shareholders in evaluating a Fund’s performance for the periods presented.
A-Class | | Year Ended
September 30,
2019 | | | Year Ended
September 30,
2018 | | | Year Ended
September 30,
2017 | | | Year Ended
September 30,
2016 | | | Year Ended
September 30,
2015 | |
Per Share Data | | | | | | | | | | | | | | | | | | | | |
Net asset value, beginning of period | | $ | 24.78 | | | $ | 25.23 | | | $ | 21.86 | | | $ | 21.14 | | | $ | 24.53 | |
Income (loss) from investment operations: |
Net investment income (loss)a | | | .30 | | | | .30 | | | | .24 | | | | .16 | | | | .11 | |
Net gain (loss) on investments (realized and unrealized) | | | (.72 | ) | | | 3.52 | | | | 3.72 | | | | 3.04 | | | | (.12 | ) |
Total from investment operations | | | (.42 | ) | | | 3.82 | | | | 3.96 | | | | 3.20 | | | | (.01 | ) |
Less distributions from: |
Net investment income | | | (.30 | ) | | | (.24 | ) | | | (.16 | ) | | | (.13 | ) | | | (.22 | ) |
Net realized gains | | | (3.58 | ) | | | (4.03 | ) | | | (.43 | ) | | | (2.35 | ) | | | (3.16 | ) |
Total distributions | | | (3.88 | ) | | | (4.27 | ) | | | (.59 | ) | | | (2.48 | ) | | | (3.38 | ) |
Net asset value, end of period | | $ | 20.48 | | | $ | 24.78 | | | $ | 25.23 | | | $ | 21.86 | | | $ | 21.14 | |
|
Total Returnb | | | 1.50 | % | | | 16.60 | % | | | 18.58 | % | | | 16.13 | % | | | (0.84 | %) |
Ratios/Supplemental Data |
Net assets, end of period (in thousands) | | $ | 196,563 | | | $ | 217,697 | | | $ | 206,033 | | | $ | 188,979 | | | $ | 177,748 | |
Ratios to average net assets: |
Net investment income (loss) | | | 1.48 | % | | | 1.27 | % | | | 1.03 | % | | | 0.79 | % | | | 0.48 | % |
Total expensesc | | | 1.31 | % | | | 1.34 | % | | | 1.38 | % | | | 1.33 | % | | | 1.32 | % |
Net expensesd | | | 1.28 | % | | | 1.31 | % | | | 1.34 | % | | | 1.31 | % | | | 1.32 | % |
Portfolio turnover rate | | | 51 | % | | | 46 | % | | | 30 | % | | | 50 | % | | | 65 | % |
C-Class | | Year Ended
September 30,
2019 | | | Year Ended
September 30,
2018 | | | Year Ended
September 30,
2017 | | | Year Ended
September 30,
2016 | | | Year Ended
September 30,
2015 | |
Per Share Data | | | | | | | | | | | | | | | | | | | | |
Net asset value, beginning of period | | $ | 18.41 | | | $ | 19.74 | | | $ | 17.22 | | | $ | 17.17 | | | $ | 20.55 | |
Income (loss) from investment operations: |
Net investment income (loss)a | | | .08 | | | | .06 | | | | .03 | | | | (.02 | ) | | | (.08 | ) |
Net gain (loss) on investments (realized and unrealized) | | | (.69 | ) | | | 2.69 | | | | 2.92 | | | | 2.42 | | | | (.06 | ) |
Total from investment operations | | | (.61 | ) | | | 2.75 | | | | 2.95 | | | | 2.40 | | | | (.14 | ) |
Less distributions from: |
Net investment income | | | — | | | | (.05 | ) | | | — | | | | — | | | | (.08 | ) |
Net realized gains | | | (3.58 | ) | | | (4.03 | ) | | | (.43 | ) | | | (2.35 | ) | | | (3.16 | ) |
Total distributions | | | (3.58 | ) | | | (4.08 | ) | | | (.43 | ) | | | (2.35 | ) | | | (3.24 | ) |
Net asset value, end of period | | $ | 14.22 | | | $ | 18.41 | | | $ | 19.74 | | | $ | 17.22 | | | $ | 17.17 | |
|
Total Returnb | | | 0.60 | % | | | 15.56 | % | | | 17.59 | % | | | 15.00 | % | | | (1.72 | %) |
Ratios/Supplemental Data |
Net assets, end of period (in thousands) | | $ | 973 | | | $ | 1,239 | | | $ | 2,376 | | | $ | 2,650 | | | $ | 2,767 | |
Ratios to average net assets: |
Net investment income (loss) | | | 0.58 | % | | | 0.33 | % | | | 0.19 | % | | | (0.14 | %) | | | (0.44 | %) |
Total expensesc | | | 2.23 | % | | | 2.24 | % | | | 2.23 | % | | | 2.27 | % | | | 2.25 | % |
Net expensesd | | | 2.19 | % | | | 2.21 | % | | | 2.20 | % | | | 2.25 | % | | | 2.25 | % |
Portfolio turnover rate | | | 51 | % | | | 46 | % | | | 30 | % | | | 50 | % | | | 65 | % |
90 | THE GUGGENHEIM FUNDS ANNUAL REPORT | SEE NOTES TO FINANCIAL STATEMENTS. |
STYLEPLUS—LARGE CORE FUND | |
FINANCIAL HIGHLIGHTS (continued) |
This table is presented to show selected data for a share outstanding throughout each period and to assist shareholders in evaluating a Fund’s performance for the periods presented.
P-Class | | Year Ended
September 30,
2019 | | | Year Ended
September 30,
2018 | | | Year Ended
September 30,
2017 | | | Year Ended
September 30,
2016 | | | Period Ended
September 30,
2015e | |
Per Share Data | | | | | | | | | | | | | | | | | | | | |
Net asset value, beginning of period | | $ | 24.49 | | | $ | 25.03 | | | $ | 21.75 | | | $ | 21.11 | | | $ | 23.12 | |
Income (loss) from investment operations: |
Net investment income (loss)a | | | .29 | | | | .26 | | | | .22 | | | | .21 | | | | .03 | |
Net gain (loss) on investments (realized and unrealized) | | | (.73 | ) | | | 3.45 | | | | 3.68 | | | | 2.97 | | | | (2.04 | ) |
Total from investment operations | | | (.44 | ) | | | 3.71 | | | | 3.90 | | | | 3.18 | | | | (2.01 | ) |
Less distributions from: |
Net investment income | | | (.26 | ) | | | (.22 | ) | | | (.19 | ) | | | (.19 | ) | | | — | |
Net realized gains | | | (3.58 | ) | | | (4.03 | ) | | | (.43 | ) | | | (2.35 | ) | | | — | |
Total distributions | | | (3.84 | ) | | | (4.25 | ) | | | (.62 | ) | | | (2.54 | ) | | | — | |
Net asset value, end of period | | $ | 20.21 | | | $ | 24.49 | | | $ | 25.03 | | | $ | 21.75 | | | $ | 21.11 | |
|
Total Return | | | 1.47 | % | | | 16.23 | % | | | 18.43 | % | | | 16.08 | % | | | (8.69 | %) |
Ratios/Supplemental Data |
Net assets, end of period (in thousands) | | $ | 236 | | | $ | 319 | | | $ | 508 | | | $ | 405 | | | $ | 14 | |
Ratios to average net assets: |
Net investment income (loss) | | | 1.45 | % | | | 1.06 | % | | | 0.93 | % | | | 1.02 | % | | | 0.31 | % |
Total expensesc | | | 1.36 | % | | | 1.56 | % | | | 1.47 | % | | | 1.22 | % | | | 1.38 | % |
Net expensesd | | | 1.33 | % | | | 1.53 | % | | | 1.44 | % | | | 1.19 | % | | | 1.38 | % |
Portfolio turnover rate | | | 51 | % | | | 46 | % | | | 30 | % | | | 50 | % | | | 65 | % |
SEE NOTES TO FINANCIAL STATEMENTS. | THE GUGGENHEIM FUNDS ANNUAL REPORT | 91 |
STYLEPLUS—LARGE CORE FUND | |
FINANCIAL HIGHLIGHTS (concluded) |
This table is presented to show selected data for a share outstanding throughout each period and to assist shareholders in evaluating a Fund’s performance for the periods presented.
Institutional Class | | Year Ended
September 30,
2019 | | | Year Ended
September 30,
2018 | | | Year Ended
September 30,
2017 | | | Year Ended
September 30,
2016 | | | Year Ended
September 30,
2015 | |
Per Share Data | | | | | | | | | | | | | | | | | | | | |
Net asset value, beginning of period | | $ | 24.65 | | | $ | 25.13 | | | $ | 21.78 | | | $ | 21.00 | | | $ | 24.42 | |
Income (loss) from investment operations: |
Net investment income (loss)a | | | .35 | | | | .37 | | | | .32 | | | | .24 | | | | .12 | |
Net gain (loss) on investments (realized and unrealized) | | | (.75 | ) | | | 3.51 | | | | 3.69 | | | | 3.10 | | | | (.10 | ) |
Total from investment operations | | | (.40 | ) | | | 3.88 | | | | 4.01 | | | | 3.34 | | | | .02 | |
Less distributions from: |
Net investment income | | | (.36 | ) | | | (.33 | ) | | | (.23 | ) | | | (.21 | ) | | | (.28 | ) |
Net realized gains | | | (3.58 | ) | | | (4.03 | ) | | | (.43 | ) | | | (2.35 | ) | | | (3.16 | ) |
Total distributions | | | (3.94 | ) | | | (4.36 | ) | | | (.66 | ) | | | (2.56 | ) | | | (3.44 | ) |
Net asset value, end of period | | $ | 20.31 | | | $ | 24.65 | | | $ | 25.13 | | | $ | 21.78 | | | $ | 21.00 | |
|
Total Return | | | 1.74 | % | | | 16.96 | % | | | 18.96 | % | | | 17.00 | % | | | (0.75 | %) |
Ratios/Supplemental Data |
Net assets, end of period (in thousands) | | $ | 3,747 | | | $ | 6,826 | | | $ | 5,631 | | | $ | 4,247 | | | $ | 303 | |
Ratios to average net assets: |
Net investment income (loss) | | | 1.73 | % | | | 1.57 | % | | | 1.35 | % | | | 1.11 | % | | | 0.52 | % |
Total expensesc | | | 1.09 | % | | | 1.06 | % | | | 1.05 | % | | | 0.99 | % | | | 1.25 | % |
Net expensesd | | | 1.06 | % | | | 1.03 | % | | | 1.01 | % | | | 0.97 | % | | | 1.25 | % |
Portfolio turnover rate | | | 51 | % | | | 46 | % | | | 30 | % | | | 50 | % | | | 65 | % |
a | Net investment income (loss) per share was computed using average shares outstanding throughout the period. |
b | Total return does not reflect the impact of any applicable sales charges. |
c | Does not include expenses of the underlying funds in which the Fund invests. |
d | Net expense information reflects the expense ratios after expense waivers and reimbursements, as applicable. |
e | Since commencement of operations: May 1, 2015. Percentage amounts for the period, except total return and portfolio turnover rate, have been annualized. |
92 | THE GUGGENHEIM FUNDS ANNUAL REPORT | SEE NOTES TO FINANCIAL STATEMENTS. |
MANAGERS’ COMMENTARY (Unaudited) | September 30, 2019 |
To Our Shareholders:
Guggenheim StylePlus—Mid Growth Fund (the “Fund”) is managed by a team of seasoned professionals, including Farhan Sharaff, Senior Managing Director and Assistant Chief Investment Officer, Equities; Jayson Flowers, Senior Managing Director and Portfolio Manager; Qi Yan, Managing Director and Portfolio Manager; and Adam Bloch, Director and Portfolio Manager. In the following paragraphs, the investment team discusses performance for the fiscal year ended September 30, 2019.
For the fiscal year ended September 30, 2019, Guggenheim StylePlus—Mid Growth Fund returned 2.34%1, compared with the 5.20% return of its benchmark, the Russell Midcap® Growth Index.
Investment Approach
Through a combination of actively managed individual equity, passive equity, and actively managed fixed income, the Fund seeks to exceed the total return of the Russell Midcap Growth Index. The actively managed equity and fixed income components seek to provide multiple sources of outperformance and take advantage of Guggenheim’s competencies in both fixed income and systematic stock selection.
The active and passive decisions seek to add value by tactically allocating to actively managed equity through quantitative selection models when stock picking opportunities are high. During periods when Guggenheim views these opportunities to be less attractive, the Fund seeks to increase its passive exposure to equities and the allocation to fixed income securities. The prospective return during such periods is the equity index plus an “alpha” component coming from the yield of the fixed income overlay.
Performance Review
Over the period, from 15-25% of the total equity position was allocated to actively managed equity and 75-85% to passive equity. Remaining Fund assets were invested in the Guggenheim Strategy Funds, short-term fixed income investment companies advised by Guggenheim Investments, and the Guggenheim Ultra Short Duration Fund, whose objective is to seek a high level of income consistent with the preservation of capital.
The Fund underperformed the Russell Midcap Growth Index for the year ended September 30, 2019. The fixed income sleeve was the largest contributor, as positions in the Guggenheim Ultra Short Duration Fund and the Guggenheim Strategy Funds, which held asset-backed securities, investment-grade corporates, and non-agency residential mortgage-backed securities, constituted the majority of the Fund’s total return. The actively managed equity sleeve detracted from performance. The passive equity position, maintained through swap agreements and futures contracts, contributed to performance for the period.
When compared with the index, the total equity position (actively managed individual equity plus passive equity derivatives) was most overweight the Health Care and Energy sectors and most underweight the Information Technology and Financials sectors.
Performance displayed represents past performance which is no guarantee of future results.
1 | Performance figures are based on Class A shares and do not reflect deduction of the sales charges or taxes that a shareholder would pay on distributions or the redemption of shares. |
The opinions and forecast expressed may not actually come to pass. This information is subject to change at any time, based on market and other conditions, and should not be construed as a recommendation of any specific security or strategy.
| | THE GUGGENHEIM FUNDS ANNUAL REPORT | 93 |
PERFORMANCE REPORT AND FUND PROFILE (Unaudited) | September 30, 2019 |
STYLEPLUS—MID GROWTH FUND
OBJECTIVE: Seeks long-term growth of capital.
Holdings Diversification (Market Exposure as % of Net Assets)
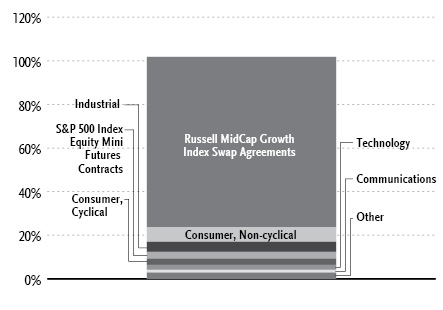
“Holdings Diversification (Market Exposure as % of Net Assets)” excludes any temporary cash investments, investments in Guggenheim Strategy Funds Trust mutual funds, or investments in Guggenheim Ultra Short Duration Fund.
Inception Dates: |
A-Class | September 17, 1969 |
C-Class | January 29, 1999 |
P-Class | May 1, 2015 |
Institutional Class | March 1, 2012 |
Ten Largest Holdings (% of Total Net Assets) |
Guggenheim Strategy Fund II | 34.5% |
Guggenheim Strategy Fund III | 32.5% |
Guggenheim Ultra Short Duration Fund — Institutional Class | 9.8% |
STERIS plc | 0.5% |
Post Holdings, Inc. | 0.4% |
Old Dominion Freight Line, Inc. | 0.4% |
Hill-Rom Holdings, Inc. | 0.4% |
Leidos Holdings, Inc. | 0.3% |
Zebra Technologies Corp. — Class A | 0.3% |
Bio-Rad Laboratories, Inc. — Class A | 0.3% |
Top Ten Total | 79.4% |
| | |
“Ten Largest Holdings” excludes any temporary cash or derivative investments. |
94 | THE GUGGENHEIM FUNDS ANNUAL REPORT | |
PERFORMANCE REPORT AND FUND PROFILE (Unaudited)(concluded) | September 30, 2019 |
Cumulative Fund Performance*

Average Annual Returns*
Periods Ended September 30, 2019
| 1 Year | 5 Year | 10 Year |
A-Class Shares | 2.34% | 9.95% | 11.95% |
A-Class Shares with sales charge‡ | (2.52%) | 8.88% | 11.29% |
C-Class Shares | 1.46% | 9.01% | 10.99% |
C-Class Shares with CDSC§ | 0.74% | 9.01% | 10.99% |
Russell Midcap Growth Index | 5.20% | 11.12% | 14.08% |
| 1 Year | 5 Year | Since
Inception
(03/01/12) |
Institutional Class Shares | 2.42% | 10.08% | 11.32% |
Russell Midcap Growth Index | 5.20% | 11.12% | 12.79% |
| | 1 Year | Since
Inception
(05/01/15) |
P-Class Shares | | 2.22% | 8.34% |
Russell Midcap Growth Index | | 5.20% | 9.84% |
* | The performance data above represents past performance that is not predictive of future results. The investment return and principal value of an investment in the Fund will fluctuate so that an investor’s shares, when redeemed, may be worth more or less than their original cost. Returns are historical and include changes in principal and reinvested dividends and capital gains and do not reflect the effect of taxes. The Russell Midcap Growth Index is an unmanaged index and, unlike the Fund, has no management fees or operating expenses to reduce its reported return. The graph is based on A-Class shares only; performance for C-Class, P-Class, and Institutional Class will vary due to differences in fee structures. |
‡ | Effective February 22, 2011, the maximum sales charge decreased from 5.75% to 4.75%. A 5.75% maximum sales charge is used in the calculation of the Average Annual Returns based on subscriptions made prior to February 22, 2011, and a 4.75% maximum sales charge will be used to calculate performance for periods based on subscriptions made on or after February 22, 2011. |
§ | Fund returns include a CDSC of 1% if redeemed within 12 months of purchase. |
| | THE GUGGENHEIM FUNDS ANNUAL REPORT | 95 |
SCHEDULE OF INVESTMENTS | September 30, 2019 |
STYLEPLUS—MID GROWTH FUND | |
| | Shares | | | Value | |
COMMON STOCKS† - 20.5% |
| | | | | | | | | |
Consumer, Non-cyclical - 6.7% |
STERIS plc | | | 2,859 | | | $ | 413,097 | |
Post Holdings, Inc.* | | | 2,917 | | | | 308,735 | |
Hill-Rom Holdings, Inc. | | | 2,865 | | | | 301,484 | |
Bio-Rad Laboratories, Inc. — Class A* | | | 765 | | | | 254,546 | |
Encompass Health Corp. | | | 3,717 | | | | 235,212 | |
Service Corporation International | | | 4,529 | | | | 216,531 | |
Molina Healthcare, Inc.* | | | 1,856 | | | | 203,640 | |
PRA Health Sciences, Inc.* | | | 2,038 | | | | 202,231 | |
Sabre Corp. | | | 8,629 | | | | 193,246 | |
Charles River Laboratories International, Inc.* | | | 1,335 | | | | 176,714 | |
Aaron’s, Inc. | | | 2,652 | | | | 170,418 | |
Humana, Inc. | | | 644 | | | | 164,652 | |
Zimmer Biomet Holdings, Inc. | | | 1,197 | | | | 164,312 | |
West Pharmaceutical Services, Inc. | | | 1,141 | | | | 161,817 | |
H&R Block, Inc. | | | 6,586 | | | | 155,561 | |
Universal Health Services, Inc. — Class B | | | 983 | | | | 146,221 | |
Integra LifeSciences Holdings Corp.* | | | 2,421 | | | | 145,430 | |
Catalent, Inc.* | | | 2,720 | | | | 129,635 | |
Globus Medical, Inc. — Class A* | | | 2,535 | | | | 129,589 | |
CoreLogic, Inc.* | | | 2,776 | | | | 128,446 | |
McKesson Corp. | | | 925 | | | | 126,410 | |
United Rentals, Inc.* | | | 928 | | | | 115,666 | |
Haemonetics Corp.* | | | 894 | | | | 112,769 | |
Sysco Corp. | | | 1,394 | | | | 110,684 | |
Adtalem Global Education, Inc.* | | | 2,834 | | | | 107,947 | |
Hologic, Inc.* | | | 2,092 | | | | 105,625 | |
Flowers Foods, Inc. | | | 4,558 | | | | 105,427 | |
WW International, Inc.* | | | 2,743 | | | | 103,740 | |
Lamb Weston Holdings, Inc. | | | 1,421 | | | | 103,335 | |
Syneos Health, Inc.* | | | 1,900 | | | | 101,099 | |
Exelixis, Inc.* | | | 5,315 | | | | 93,996 | |
Regeneron Pharmaceuticals, Inc.* | | | 304 | | | | 84,330 | |
LivaNova plc* | | | 1,132 | | | | 83,530 | |
Helen of Troy Ltd.* | | | 505 | | | | 79,618 | |
HealthEquity, Inc.* | | | 1,351 | | | | 77,203 | |
Alexion Pharmaceuticals, Inc.* | | | 725 | | | | 71,006 | |
ICU Medical, Inc.* | | | 426 | | | | 67,990 | |
WEX, Inc.* | | | 267 | | | | 53,953 | |
Total Consumer, Non-cyclical | | | | | | | 5,705,845 | |
| | | | | | | | | |
Industrial - 4.5% |
Old Dominion Freight Line, Inc. | | | 1,797 | | | | 305,436 | |
Lincoln Electric Holdings, Inc. | | | 2,885 | | | | 250,303 | |
Kennametal, Inc. | | | 7,161 | | | | 220,129 | |
Gentex Corp. | | | 7,760 | | | | 213,672 | |
Landstar System, Inc. | | | 1,831 | | | | 206,134 | |
Carlisle Companies, Inc. | | | 1,390 | | | | 202,301 | |
Regal Beloit Corp. | | | 2,772 | | | | 201,940 | |
Kirby Corp.* | | | 2,362 | | | | 194,062 | |
Kansas City Southern | | | 1,376 | | | | 183,022 | |
Littelfuse, Inc. | | | 1,029 | | | | 182,452 | |
Trimble, Inc.* | | | 4,572 | | | | 177,439 | |
XPO Logistics, Inc.* | | | 2,437 | | | | 174,416 | |
Expeditors International of Washington, Inc. | | | 1,870 | | | | 138,922 | |
FedEx Corp. | | | 888 | | | | 129,266 | |
EnerSys | | | 1,875 | | | | 123,638 | |
J.B. Hunt Transport Services, Inc. | | | 1,035 | | | | 114,523 | |
KBR, Inc. | | | 4,651 | | | | 114,136 | |
Masco Corp. | | | 2,662 | | | | 110,952 | |
GATX Corp. | | | 1,408 | | | | 109,162 | |
Lennox International, Inc. | | | 444 | | | | 107,879 | |
Louisiana-Pacific Corp. | | | 4,118 | | | | 101,220 | |
Agilent Technologies, Inc. | | | 1,235 | | | | 94,638 | |
Waters Corp.* | | | 371 | | | | 82,818 | |
IDEX Corp. | | | 488 | | | | 79,973 | |
Clean Harbors, Inc.* | | | 1,011 | | | | 78,049 | |
Total Industrial | | | | | | | 3,896,482 | |
| | | | | | | | | |
Consumer, Cyclical - 2.9% |
MSC Industrial Direct Company, Inc. — Class A | | | 3,138 | | | | 227,599 | |
Brinker International, Inc. | | | 4,818 | | | | 205,584 | |
NVR, Inc.* | | | 54 | | | | 200,737 | |
Cinemark Holdings, Inc. | | | 5,146 | | | | 198,841 | |
Domino’s Pizza, Inc. | | | 777 | | | | 190,046 | |
UniFirst Corp. | | | 886 | | | | 172,876 | |
Deckers Outdoor Corp.* | | | 918 | | | | 135,277 | |
Five Below, Inc.* | | | 1,071 | | | | 135,053 | |
Cracker Barrel Old Country Store, Inc. | | | 828 | | | | 134,674 | |
Live Nation Entertainment, Inc.* | | | 2,002 | | | | 132,813 | |
Williams-Sonoma, Inc. | | | 1,800 | | | | 122,364 | |
Wyndham Destinations, Inc. | | | 2,643 | | | | 121,631 | |
Sally Beauty Holdings, Inc.* | | | 7,683 | | | | 114,400 | |
Tapestry, Inc. | | | 3,604 | | | | 93,884 | |
Aptiv plc | | | 1,067 | | | | 93,277 | |
Tupperware Brands Corp. | | | 4,065 | | | | 64,512 | |
AutoZone, Inc.* | | | 56 | | | | 60,739 | |
Eldorado Resorts, Inc.* | | | 1,400 | | | | 55,818 | |
Total Consumer, Cyclical | | | | | | | 2,460,125 | |
| | | | | | | | | |
Technology - 2.3% |
Leidos Holdings, Inc. | | | 3,363 | | | | 288,814 | |
Zebra Technologies Corp. — Class A* | | | 1,309 | | | | 270,138 | |
Teradyne, Inc. | | | 4,053 | | | | 234,709 | |
MAXIMUS, Inc. | | | 2,995 | | | | 231,394 | |
j2 Global, Inc. | | | 1,770 | | | | 160,752 | |
Skyworks Solutions, Inc. | | | 1,969 | | | | 156,043 | |
CDK Global, Inc. | | | 2,766 | | | | 133,017 | |
Seagate Technology plc | | | 2,207 | | | | 118,714 | |
NetApp, Inc. | | | 1,821 | | | | 95,621 | |
Fair Isaac Corp.* | | | 312 | | | | 94,698 | |
KLA Corp. | | | 561 | | | | 89,452 | |
Tyler Technologies, Inc.* | | | 248 | | | | 65,100 | |
PTC, Inc.* | | | 628 | | | | 42,817 | |
Total Technology | | | | | | | 1,981,269 | |
| | | | | | | | | |
Communications - 1.3% |
John Wiley & Sons, Inc. — Class A | | | 4,647 | | | | 204,189 | |
AMC Networks, Inc. — Class A* | | | 3,545 | | | | 174,272 | |
96 | THE GUGGENHEIM FUNDS ANNUAL REPORT | SEE NOTES TO FINANCIAL STATEMENTS. |
SCHEDULE OF INVESTMENTS (continued) | September 30, 2019 |
STYLEPLUS—MID GROWTH FUND | |
| | Shares | | | Value | |
Cable One, Inc. | | | 122 | | | $ | 153,074 | |
Ciena Corp.* | | | 3,353 | | | | 131,538 | |
InterDigital, Inc. | | | 2,311 | | | | 121,258 | |
New York Times Co. — Class A | | | 3,548 | | | | 101,047 | |
eBay, Inc. | | | 1,876 | | | | 73,127 | |
FactSet Research Systems, Inc. | | | 293 | | | | 71,190 | |
Cars.com, Inc.* | | | 6,283 | | | | 56,421 | |
Total Communications | | | | | | | 1,086,116 | |
| | | | | | | | | |
Energy - 1.2% |
ONEOK, Inc. | | | 2,695 | | | | 198,595 | |
PBF Energy, Inc. — Class A | | | 5,552 | | | | 150,959 | |
Equitrans Midstream Corp. | | | 9,808 | | | | 142,706 | |
Apache Corp. | | | 5,551 | | | | 142,106 | |
HollyFrontier Corp. | | | 2,483 | | | | 133,188 | |
Marathon Oil Corp. | | | 10,551 | | | | 129,461 | |
Murphy Oil Corp. | | | 3,634 | | | | 80,348 | |
Southwestern Energy Co.* | | | 24,038 | | | | 46,393 | |
Total Energy | | | | | | | 1,023,756 | |
| | | | | | | | | |
Financial - 0.8% |
Medical Properties Trust, Inc. REIT | | | 10,671 | | | | 208,725 | |
Brixmor Property Group, Inc. REIT | | | 7,370 | | | | 149,537 | |
Western Union Co. | | | 6,344 | | | | 146,991 | |
Interactive Brokers Group, Inc. — Class A | | | 2,464 | | | | 132,514 | |
Commerce Bancshares, Inc. | | | 954 | | | | 57,860 | |
Total Financial | | | | | | | 695,627 | |
| | | | | | | | | |
Utilities - 0.7% |
National Fuel Gas Co. | | | 4,555 | | | | 213,720 | |
UGI Corp. | | | 3,759 | | | | 188,965 | |
Pinnacle West Capital Corp. | | | 1,025 | | | | 99,497 | |
Aqua America, Inc. | | | 2,042 | | | | 91,543 | |
Total Utilities | | | | | | | 593,725 | |
| | | | | | | | | |
Basic Materials - 0.1% |
Chemours Co. | | | 6,646 | | | | 99,291 | |
| | | | | | | | | |
Total Common Stocks | | | | | | | | |
(Cost $16,938,323) | | | | | | | 17,542,236 | |
| | | | | | | | | |
MUTUAL FUNDS† - 76.8% |
Guggenheim Strategy Fund II1 | | | 1,192,497 | | | | 29,609,705 | |
Guggenheim Strategy Fund III1 | | | 1,121,720 | | | | 27,841,081 | |
Guggenheim Ultra Short Duration Fund — Institutional Class1,2 | | | 844,513 | | | | 8,411,350 | |
Total Mutual Funds | | | | | | | | |
(Cost $66,066,901) | | | | | | | 65,862,136 | |
| | | | | | | | | |
MONEY MARKET FUND† - 2.5% |
Dreyfus Treasury Securities Cash Management Fund — Institutional Shares 1.83%3 | | | 2,168,538 | | | | 2,168,538 | |
Total Money Market Fund | | | | | | | | |
(Cost $2,168,538) | | | | | | | 2,168,538 | |
| | | | | | | | | |
Total Investments - 99.8% | | | | | | | | |
(Cost $85,173,762) | | | | | | $ | 85,572,910 | |
Other Assets & Liabilities, net - 0.2% | | | | | | | 201,012 | |
Total Net Assets - 100.0% | | | | | | $ | 85,773,922 | |
Futures Contracts |
Description | | Number of
Contracts | | | Expiration
Date | | | Notional
Amount | | | Value and
Unrealized
Depreciation** | |
Equity Futures Contracts Purchased† |
S&P 500 Index Mini Futures Contracts | | | 18 | | | | Dec 2019 | | | $ | 2,679,975 | | | $ | (15,067 | ) |
Total Return Swap Agreements |
Counterparty | Index | Financing
Rate Pay | | Payment
Frequency | | | Maturity
Date | | | Units | | | Notional
Amount | | | Value and
Unrealized
Appreciation
(Depreciation) | |
OTC Equity Index Swap Agreements†† |
Wells Fargo Bank, N.A. | Russell MidCap Growth Index Total Return | 2.19% (3 Month USD LIBOR + 0.10%) | | | At Maturity | | | | 12/30/19 | | | | 19,854 | | | $ | 67,099,988 | | | $ | — | |
SEE NOTES TO FINANCIAL STATEMENTS. | THE GUGGENHEIM FUNDS ANNUAL REPORT | 97 |
SCHEDULE OF INVESTMENTS (continued) | September 30, 2019 |
STYLEPLUS—MID GROWTH FUND | |
* | Non-income producing security. |
** | Includes cumulative appreciation (depreciation). Variation margin is reported within the Statement of Assets and Liabilities. |
† | Value determined based on Level 1 inputs — See Note 4. |
†† | Value determined based on Level 2 inputs — See Note 4. |
1 | Affiliated issuer. |
2 | Effective November 30, 2018, Guggenheim Strategy Fund I was reorganized with and into the Guggenheim Ultra Short Duration Fund. |
3 | Rate indicated is the 7-day yield as of September 30, 2019. |
| | plc — Public Limited Company |
| | REIT — Real Estate Investment Trust |
| | |
| | See Sector Classification in Other Information section. |
The following table summarizes the inputs used to value the Fund’s investments at September 30, 2019 (See Note 4 in the Notes to Financial Statements):
Investments in Securities (Assets) | | Level 1
Quoted
Prices | | | Level 2
Significant
Observable
Inputs | | | Level 3
Significant
Unobservable
Inputs | | | Total | |
Common Stocks | | $ | 17,542,236 | | | $ | — | | | $ | — | | | $ | 17,542,236 | |
Mutual Funds | | | 65,862,136 | | | | — | | | | — | | | | 65,862,136 | |
Money Market Fund | | | 2,168,538 | | | | — | | | | — | | | | 2,168,538 | |
Equity Index Swap Agreements** | | | — | | | | — | * | | | — | | | | — | |
Total Assets | | $ | 85,572,910 | | | $ | — | | | $ | — | | | $ | 85,572,910 | |
Investments in Securities (Liabilities) | | Level 1
Quoted
Prices | | | Level 2
Significant
Observable
Inputs | | | Level 3
Significant
Unobservable
Inputs | | | Total | |
Equity Futures Contracts** | | $ | 15,067 | | | $ | — | | | $ | — | | | $ | 15,067 | |
* | Includes security with unrealized appreciation/depreciation of less than $1. |
** | This derivative is reported as unrealized appreciation/depreciation at period end. |
98 | THE GUGGENHEIM FUNDS ANNUAL REPORT | SEE NOTES TO FINANCIAL STATEMENTS. |
SCHEDULE OF INVESTMENTS (concluded) | September 30, 2019 |
STYLEPLUS—MID GROWTH FUND | |
Affiliated Transactions
Investments representing 5% or more of the outstanding voting shares of a company, or control of or by, or common control under Guggenheim Investments (“GI”), result in that company being considered an affiliated issuer, as defined in the 1940 Act.
The Fund may invest in certain of the underlying series of Guggenheim Strategy Funds Trust, including Guggenheim Strategy Fund II and Guggenheim Strategy Fund III, (collectively, the “Cash Management Funds”), each of which are open-end management investment companies managed by GI. The Cash Management Funds, which launched on March 11, 2014, are offered as cash management options only to mutual funds, trusts, and other accounts managed by GI and/or its affiliates, and are not available to the public. The Cash Management Funds pay no investment management fees. The Cash Management Funds’ annual report on Form N-CSR dated September 30, 2018, is available publicly or upon request. This information is available from the EDGAR database on the SEC’s website at https://www.sec.gov/Archives/edgar/data/1601445/000089180418000513/gug75569-ncsr.htm.
Transactions during the year ended September 30, 2019, in which the company is an affiliated issuer, were as follows:
Security Name | | Value
09/30/18 | | | Additions | | | Reductions | | | Realized
Gain (Loss) | | | Change in
Unrealized
Appreciation
(Depreciation) | | | Value
09/30/19 | | | Shares
09/30/19 | | | Investment
Income | | | Capital
Gain
Distributions | |
Mutual Funds | | | | | | | | | | | | | | | | | | | | | | | | | | | | | | | | | | | | |
Guggenheim Limited Duration Fund — R6-Class | | $ | 6,598,929 | | | $ | 46,025 | | | $ | (6,620,712 | ) | | $ | 108,157 | | | $ | (132,399 | ) | | $ | — | | | | — | | | $ | 45,899 | | | $ | 127 | |
Guggenheim Strategy Fund II | | | 25,058,692 | | | | 9,461,295 | | | | (4,785,434 | ) | | | 109 | | | | (124,957 | ) | | | 29,609,705 | | | | 1,192,497 | | | | 759,209 | | | | 11,746 | |
Guggenheim Strategy Fund III | | | 30,040,343 | | | | 1,837,757 | | | | (3,819,309 | ) | | | (29,757 | ) | | | (187,953 | ) | | | 27,841,081 | | | | 1,121,720 | | | | 821,655 | | | | 1,125 | |
Guggenheim Ultra Short Duration Fund — Institutional Class1 | | | 8,642,455 | | | | 18,716,504 | | | | (18,932,052 | ) | | | (17,736 | ) | | | 2,179 | | | | 8,411,350 | | | | 844,513 | | | | 243,641 | | | | 2,525 | |
| | | $ | 70,340,419 | | | $ | 30,061,581 | | | $ | (34,157,507 | ) | | $ | 60,773 | | | $ | (443,130 | ) | | $ | 65,862,136 | | | | | | | $ | 1,870,404 | | | $ | 15,523 | |
1 | Effective November 30, 2018, Guggenheim Strategy Fund I was reorganized with and into the Guggenheim Ultra Short Duration Fund. |
SEE NOTES TO FINANCIAL STATEMENTS. | THE GUGGENHEIM FUNDS ANNUAL REPORT | 99 |
STYLEPLUS—MID GROWTH FUND | |
STATEMENT OF ASSETS AND LIABILITIES |
September 30, 2019 |
Assets: |
Investments in unaffiliated issuers, at value (cost $19,106,861) | | $ | 19,710,774 | |
Investments in affiliated issuers, at value (cost $66,066,901) | | | 65,862,136 | |
Cash | | | 8,350 | |
Segregated cash with broker | | | 63,000 | |
Prepaid expenses | | | 35,809 | |
Receivables: |
Swap settlement | | | 1,268,987 | |
Dividends | | | 138,755 | |
Interest | | | 5,501 | |
Fund shares sold | | | 2,113 | |
Total assets | | | 87,095,425 | |
| | | | | |
Liabilities: |
Segregated cash due to broker | | | 750,000 | |
Payable for: | | | | |
Securities purchased | | | 122,187 | |
Fund shares redeemed | | | 304,142 | |
Management fees | | | 48,555 | |
Distribution and service fees | | | 17,556 | |
Transfer agent/maintenance fees | | | 6,723 | |
Fund accounting/administration fees | | | 5,351 | |
Trustees’ fees* | | | 1,404 | |
Variation margin on futures contracts | | | 1,305 | |
Miscellaneous | | | 64,280 | |
Total liabilities | | | 1,321,503 | |
Net assets | | $ | 85,773,922 | |
| | | | | |
Net assets consist of: |
Paid in capital | | $ | 83,521,040 | |
Total distributable earnings (loss) | | | 2,252,882 | |
Net assets | | $ | 85,773,922 | |
| | | | | |
A-Class: |
Net assets | | $ | 83,026,836 | |
Capital shares outstanding | | | 2,094,774 | |
Net asset value per share | | $ | 39.64 | |
Maximum offering price per share (Net asset value divided by 95.25%) | | $ | 41.62 | |
| | | | | |
C-Class: |
Net assets | | $ | 1,682,919 | |
Capital shares outstanding | | | 65,573 | |
Net asset value per share | | $ | 25.66 | |
| | | | | |
P-Class: |
Net assets | | $ | 92,561 | |
Capital shares outstanding | | | 2,363 | |
Net asset value per share | | $ | 39.17 | |
| | | | | |
Institutional Class: |
Net assets | | $ | 971,606 | |
Capital shares outstanding | | | 24,511 | |
Net asset value per share | | $ | 39.64 | |
* | Relates to Trustees not deemed “interested persons” within the meaning of Section 2(a)(19) of the 1940 Act. |
100 | THE GUGGENHEIM FUNDS ANNUAL REPORT | SEE NOTES TO FINANCIAL STATEMENTS. |
STYLEPLUS—MID GROWTH FUND | |
STATEMENT OF OPERATIONS |
Year Ended September 30, 2019 |
Investment Income: |
Dividends from securities of unaffiliated issuers (net of foreign withholding tax of $20) | | $ | 228,724 | |
Dividends from securities of affiliated issuers | | | 1,870,404 | |
Interest | | | 60,642 | |
Total investment income | | | 2,159,770 | |
| | | | | |
Expenses: |
Management fees | | | 637,574 | |
Distribution and service fees: |
A-Class | | | 206,436 | |
C-Class | | | 16,741 | |
P-Class | | | 245 | |
Transfer agent/maintenance fees: |
A-Class | | | 88,757 | |
C-Class | | | 4,257 | |
P-Class | | | 232 | |
Institutional Class | | | 1,629 | |
Fund accounting/administration fees | | | 68,009 | |
Prime broker interest expense | | | 28,866 | |
Trustees’ fees* | | | 19,447 | |
Custodian fees | | | 7,860 | |
Line of credit fees | | | 1,234 | |
Miscellaneous | | | 158,245 | |
Total expenses | | | 1,239,532 | |
Less: |
Expenses waived by Adviser | | | (27,811 | ) |
Earnings credits applied | | | (521 | ) |
Total waived expenses | | | (28,332 | ) |
Net expenses | | | 1,211,200 | |
Net investment income | | | 948,570 | |
| | | | | |
Net Realized and Unrealized Gain (Loss): |
Net realized gain (loss) on: |
Investments in unaffiliated issuers | | $ | (114,693 | ) |
Investments in affiliated issuers | | | 60,773 | |
Distributions received from affiliated investment companies | | | 15,523 | |
Swap agreements | | | 1,464,999 | |
Futures contracts | | | (176,444 | ) |
Net realized gain | | | 1,250,158 | |
Net change in unrealized appreciation (depreciation) on: |
Investments in unaffiliated issuers | | | (122,625 | ) |
Investments in affiliated issuers | | | (443,130 | ) |
Swap agreements | | | 297,228 | |
Futures contracts | | | (14,760 | ) |
Net change in unrealized appreciation (depreciation) | | | (283,287 | ) |
Net realized and unrealized gain | | | 966,871 | |
Net increase in net assets resulting from operations | | $ | 1,915,441 | |
* | Relates to Trustees not deemed “interested persons” within the meaning of Section 2(a)(19) of the 1940 Act. |
SEE NOTES TO FINANCIAL STATEMENTS. | THE GUGGENHEIM FUNDS ANNUAL REPORT | 101 |
STYLEPLUS—MID GROWTH FUND | |
STATEMENTS OF CHANGES IN NET ASSETS |
| | Year Ended
September 30,
2019 | | | Year Ended
September 30,
2018 | |
Increase (Decrease) in Net Assets from Operations: | | | | | | | | |
Net investment income | | $ | 948,570 | | | $ | 728,677 | |
Net realized gain on investments | | | 1,250,158 | | | | 16,735,826 | |
Net change in unrealized appreciation (depreciation) on investments | | | (283,287 | ) | | | (2,764,532 | ) |
Net increase in net assets resulting from operations | | | 1,915,441 | | | | 14,699,971 | |
| | | | | | | | | |
Distributions to shareholders: | | | | | | | | |
A-Class | | | (15,751,937 | ) | | | (9,270,951 | ) |
C-Class | | | (404,113 | ) | | | (593,301 | ) |
P-Class | | | (21,229 | ) | | | (12,477 | ) |
Institutional Class | | | (165,670 | ) | | | (237,769 | ) |
Total distributions to shareholders | | | (16,342,949 | ) | | | (10,114,498 | ) |
| | | | | | | | | |
Capital share transactions: | | | | | | | | |
Proceeds from sale of shares | | | | | | | | |
A-Class | | | 7,824,230 | | | | 5,516,404 | |
C-Class | | | 481,877 | | | | 374,112 | |
P-Class | | | 13,250 | | | | 1,585,053 | |
Institutional Class | | | 740,878 | | | | 2,172,283 | |
Distributions reinvested | | | | | | | | |
A-Class | | | 15,152,789 | | | | 8,840,748 | |
C-Class | | | 399,145 | | | | 587,100 | |
P-Class | | | 21,229 | | | | 12,477 | |
Institutional Class | | | 158,129 | | | | 232,834 | |
Cost of shares redeemed | | | | | | | | |
A-Class | | | (13,619,860 | ) | | | (8,509,704 | ) |
C-Class | | | (670,235 | ) | | | (3,089,435 | ) |
P-Class | | | (44,190 | ) | | | (1,603,227 | ) |
Institutional Class | | | (613,555 | ) | | | (3,242,555 | ) |
Net increase from capital share transactions | | | 9,843,687 | | | | 2,876,090 | |
Net increase (decrease) in net assets | | | (4,583,821 | ) | | | 7,461,563 | |
| | | | | | | | | |
Net assets: | | | | | | | | |
Beginning of year | | | 90,357,743 | | | | 82,896,180 | |
End of year | | $ | 85,773,922 | | | $ | 90,357,743 | |
| | | | | | | | | |
Capital share activity: | | | | | | | | |
Shares sold | | | | | | | | |
A-Class | | | 204,461 | | | | 115,313 | |
C-Class | | | 20,362 | | | | 10,754 | |
P-Class | | | 343 | | | | 32,510 | |
Institutional Class | | | 18,602 | | | | 47,234 | |
Shares issued from reinvestment of distributions | | | | | | | | |
A-Class | | | 481,032 | | | | 197,822 | |
C-Class | | | 19,433 | | | | 18,125 | |
P-Class | | | 681 | | | | 282 | |
Institutional Class | | | 5,020 | | | | 5,208 | |
Shares redeemed | | | | | | | | |
A-Class | | | (351,396 | ) | | | (180,073 | ) |
C-Class | | | (25,905 | ) | | | (89,006 | ) |
P-Class | | | (1,197 | ) | | | (32,829 | ) |
Institutional Class | | | (16,682 | ) | | | (71,578 | ) |
Net increase in shares | | | 354,754 | | | | 53,762 | |
102 | THE GUGGENHEIM FUNDS ANNUAL REPORT | SEE NOTES TO FINANCIAL STATEMENTS. |
STYLEPLUS—MID GROWTH FUND | |
This table is presented to show selected data for a share outstanding throughout each period and to assist shareholders in evaluating a Fund’s performance for the periods presented.
A-Class | | Year Ended
September 30,
2019 | | | Year Ended
September 30,
2018 | | | Year Ended
September 30,
2017 | | | Year Ended
September 30,
2016 | | | Year Ended
September 30,
2015 | |
Per Share Data | | | | | | | | | | | | | | | | | | | | |
Net asset value, beginning of period | | $ | 49.70 | | | $ | 47.34 | | | $ | 40.52 | | | $ | 41.49 | | | $ | 45.82 | |
Income (loss) from investment operations: |
Net investment income (loss)a | | | .45 | | | | .41 | | | | .34 | | | | .19 | | | | .07 | |
Net gain (loss) on investments (realized and unrealized) | | | (1.58 | ) | | | 7.70 | | | | 6.72 | | | | 4.25 | | | | .63 | |
Total from investment operations | | | (1.13 | ) | | | 8.11 | | | | 7.06 | | | | 4.44 | | | | .70 | |
Less distributions from: |
Net investment income | | | (.41 | ) | | | (.24 | ) | | | (.24 | ) | | | (.05 | ) | | | — | |
Net realized gains | | | (8.52 | ) | | | (5.51 | ) | | | — | | | | (5.36 | ) | | | (5.03 | ) |
Total distributions | | | (8.93 | ) | | | (5.75 | ) | | | (.24 | ) | | | (5.41 | ) | | | (5.03 | ) |
Net asset value, end of period | | $ | 39.64 | | | $ | 49.70 | | | $ | 47.34 | | | $ | 40.52 | | | $ | 41.49 | |
|
Total Returnb | | | 2.34 | % | | | 18.51 | % | | | 17.54 | % | | | 11.55 | % | | | 1.04 | % |
Ratios/Supplemental Data |
Net assets, end of period (in thousands) | | $ | 83,027 | | | $ | 87,509 | | | $ | 77,049 | | | $ | 72,179 | | | $ | 73,178 | |
Ratios to average net assets: |
Net investment income (loss) | | | 1.13 | % | | | 0.87 | % | | | 0.78 | % | | | 0.48 | % | | | 0.16 | % |
Total expensesc | | | 1.44 | % | | | 1.55 | % | | | 1.45 | % | | | 1.45 | % | | | 1.47 | % |
Net expensesd | | | 1.41 | % | | | 1.52 | % | | | 1.42 | % | | | 1.43 | % | | | 1.47 | % |
Portfolio turnover rate | | | 73 | % | | | 52 | % | | | 43 | % | | | 61 | % | | | 75 | % |
C-Class | | Year Ended
September 30,
2019 | | | Year Ended
September 30,
2018 | | | Year Ended
September 30,
2017 | | | Year Ended
September 30,
2016 | | | Year Ended
September 30,
2015 | |
Per Share Data | | | | | | | | | | | | | | | | | | | | |
Net asset value, beginning of period | | $ | 35.78 | | | $ | 35.64 | | | $ | 30.58 | | | $ | 32.78 | | | $ | 37.48 | |
Income (loss) from investment operations: |
Net investment income (loss)a | | | .08 | | | | .02 | | | | (.03 | ) | | | (.12 | ) | | | (.25 | ) |
Net gain (loss) on investments (realized and unrealized) | | | (1.68 | ) | | | 5.63 | | | | 5.09 | | | | 3.28 | | | | .58 | |
Total from investment operations | | | (1.60 | ) | | | 5.65 | | | | 5.06 | | | | 3.16 | | | | .33 | |
Less distributions from: |
Net realized gains | | | (8.52 | ) | | | (5.51 | ) | | | — | | | | (5.36 | ) | | | (5.03 | ) |
Total distributions | | | (8.52 | ) | | | (5.51 | ) | | | — | | | | (5.36 | ) | | | (5.03 | ) |
Net asset value, end of period | | $ | 25.66 | | | $ | 35.78 | | | $ | 35.64 | | | $ | 30.58 | | | $ | 32.78 | |
|
Total Returnb | | | 1.46 | % | | | 17.51 | % | | | 16.55 | % | | | 10.55 | % | | | 0.20 | % |
Ratios/Supplemental Data |
Net assets, end of period (in thousands) | | $ | 1,683 | | | $ | 1,849 | | | $ | 3,984 | | | $ | 3,760 | | | $ | 4,762 | |
Ratios to average net assets: |
Net investment income (loss) | | | 0.30 | % | | | 0.05 | % | | | (0.08 | %) | | | (0.42 | %) | | | (0.68 | %) |
Total expensesc | | | 2.27 | % | | | 2.33 | % | | | 2.31 | % | | | 2.34 | % | | | 2.31 | % |
Net expensesd | | | 2.24 | % | | | 2.30 | % | | | 2.27 | % | | | 2.32 | % | | | 2.31 | % |
Portfolio turnover rate | | | 73 | % | | | 52 | % | | | 43 | % | | | 61 | % | | | 75 | % |
SEE NOTES TO FINANCIAL STATEMENTS. | THE GUGGENHEIM FUNDS ANNUAL REPORT | 103 |
STYLEPLUS—MID GROWTH FUND | |
FINANCIAL HIGHLIGHTS (continued) |
This table is presented to show selected data for a share outstanding throughout each period and to assist shareholders in evaluating a Fund’s performance for the periods presented.
P-Class | | Year Ended
September 30,
2019 | | | Year Ended
September 30,
2018 | | | Year Ended
September 30,
2017 | | | Year Ended
September 30,
2016 | | | Period Ended
September 30,
2015e | |
Per Share Data | | | | | | | | | | | | | | | | | | | | |
Net asset value, beginning of period | | $ | 49.12 | | | $ | 46.83 | | | $ | 40.27 | | | $ | 41.48 | | | $ | 45.96 | |
Income (loss) from investment operations: |
Net investment income (loss)a | | | .41 | | | | .32 | | | | .24 | | | | .26 | | | | — | f |
Net gain (loss) on investments (realized and unrealized) | | | (1.58 | ) | | | 7.61 | | | | 6.65 | | | | 4.09 | | | | (4.48 | ) |
Total from investment operations | | | (1.17 | ) | | | 7.93 | | | | 6.89 | | | | 4.35 | | | | (4.48 | ) |
Less distributions from: |
Net investment income | | | (.26 | ) | | | (.13 | ) | | | (.33 | ) | | | (.20 | ) | | | — | |
Net realized gains | | | (8.52 | ) | | | (5.51 | ) | | | — | | | | (5.36 | ) | | | — | |
Total distributions | | | (8.78 | ) | | | (5.64 | ) | | | (.33 | ) | | | (5.56 | ) | | | — | |
Net asset value, end of period | | $ | 39.17 | | | $ | 49.12 | | | $ | 46.83 | | | $ | 40.27 | | | $ | 41.48 | |
|
Total Return | | | 2.22 | % | | | 18.26 | % | | | 17.27 | % | | | 11.36 | % | | | (9.75 | %) |
Ratios/Supplemental Data |
Net assets, end of period (in thousands) | | $ | 93 | | | $ | 125 | | | $ | 121 | | | $ | 102 | | | $ | 11 | |
Ratios to average net assets: |
Net investment income (loss) | | | 1.04 | % | | | 0.67 | % | | | 0.55 | % | | | 0.69 | % | | | — | |
Total expensesc | | | 1.55 | % | | | 1.68 | % | | | 1.66 | % | | | 1.39 | % | | | 1.49 | % |
Net expensesd | | | 1.51 | % | | | 1.64 | % | | | 1.63 | % | | | 1.35 | % | | | 1.49 | % |
Portfolio turnover rate | | | 73 | % | | | 52 | % | | | 43 | % | | | 61 | % | | | 75 | % |
104 | THE GUGGENHEIM FUNDS ANNUAL REPORT | SEE NOTES TO FINANCIAL STATEMENTS. |
STYLEPLUS—MID GROWTH FUND | |
FINANCIAL HIGHLIGHTS (concluded) |
This table is presented to show selected data for a share outstanding throughout each period and to assist shareholders in evaluating a Fund’s performance for the periods presented.
Institutional Class | | Year Ended
September 30,
2019 | | | Year Ended
September 30,
2018 | | | Year Ended
September 30,
2017 | | | Year Ended
September 30,
2016 | | | Year Ended
September 30,
2015 | |
Per Share Data | | | | | | | | | | | | | | | | | | | | |
Net asset value, beginning of period | | $ | 49.80 | | | $ | 47.48 | | | $ | 40.59 | | | $ | 41.64 | | | $ | 45.96 | |
Income (loss) from investment operations: |
Net investment income (loss)a | | | .51 | | | | .53 | | | | .42 | | | | .19 | | | | .11 | |
Net gain (loss) on investments (realized and unrealized) | | | (1.63 | ) | | | 7.71 | | | | 6.78 | | | | 4.25 | | | | .60 | |
Total from investment operations | | | (1.12 | ) | | | 8.24 | | | | 7.20 | | | | 4.44 | | | | .71 | |
Less distributions from: |
Net investment income | | | (.52 | ) | | | (.41 | ) | | | (.31 | ) | | | (.13 | ) | | | — | |
Net realized gains | | | (8.52 | ) | | | (5.51 | ) | | | — | | | | (5.36 | ) | | | (5.03 | ) |
Total distributions | | | (9.04 | ) | | | (5.92 | ) | | | (.31 | ) | | | (5.49 | ) | | | (5.03 | ) |
Net asset value, end of period | | $ | 39.64 | | | $ | 49.80 | | | $ | 47.48 | | | $ | 40.59 | | | $ | 41.64 | |
|
Total Return | | | 2.42 | % | | | 18.77 | % | | | 17.88 | % | | | 11.50 | % | | | 1.08 | % |
Ratios/Supplemental Data |
Net assets, end of period (in thousands) | | $ | 972 | | | $ | 875 | | | $ | 1,743 | | | $ | 113 | | | $ | 54 | |
Ratios to average net assets: |
Net investment income (loss) | | | 1.28 | % | | | 1.11 | % | | | 0.95 | % | | | 0.48 | % | | | 0.23 | % |
Total expensesc | | | 1.31 | % | | | 1.26 | % | | | 1.26 | % | | | 1.46 | % | | | 1.41 | % |
Net expensesd | | | 1.28 | % | | | 1.23 | % | | | 1.22 | % | | | 1.44 | % | | | 1.41 | % |
Portfolio turnover rate | | | 73 | % | | | 52 | % | | | 43 | % | | | 61 | % | | | 75 | % |
a | Net investment income (loss) per share was computed using average shares outstanding throughout the period. |
b | Total return does not reflect the impact of any applicable sales charges. |
c | Does not include expenses of the underlying funds in which the Fund invests. |
d | Net expense information reflects the expense ratios after expense waivers. |
e | Since commencement of operations: May 1, 2015. Percentage amounts for the period, except total return and portfolio turnover rate, have been annualized. |
f | Net investment income is less than $0.01 per share. |
SEE NOTES TO FINANCIAL STATEMENTS. | THE GUGGENHEIM FUNDS ANNUAL REPORT | 105 |
MANAGERS’ COMMENTARY (Unaudited) | September 30, 2019 |
To Our Shareholders
Guggenheim World Equity Income Fund is managed by a team of seasoned professionals, including Farhan Sharaff, Senior Managing Director and Assistant Chief Investment Officer, Equities, and Portfolio Manager; Jayson Flowers, Senior Managing Director and Portfolio Manager; and Evan Einstein, Director and Portfolio Manager. In the following paragraphs, the investment team discusses performance for the fiscal year ended September 30, 2019.
For the one year period ended September 30, 2019, Guggenheim World Equity Income Fund returned 0.14%1, compared with the 1.83% return of its benchmark, the MSCI World Index.
Performance Review
The Guggenheim World Equity Income Fund delivered on its mandate to provide current equity income while providing a stable long-term total return. During the year, the Fund behaved well, as it balanced generating income while doing so with lower risk than the benchmark. The Fund tends to outperform in periods of decline or uncertainty.
Even though the Fund underperformed the MSCI World Index, it paid a distribution of 3.1% for the year, which reflected its successful navigation of the declining rate environment; being cognizant of companies with unsustainable dividends is one of the primary drivers for the Fund’s track record relative to peers.
The tactical currency hedge, which makes use of currency futures, detracted slightly from performance for the year as the Fund navigated very choppy currency rates, particularly in the euro, pound, and yen. Currencies were in flux with factors like Brexit, trade uncertainty, and concern over slower global growth.
The primary contributor to the Fund’s relative return came from good sector allocation, primarily overweights to Utilities, the Fund’s largest, and Real Estate, although the Fund was penalized by stock selection in Utilities. Duke Energy Corp. benefited from a flight to safety as the market declined in the fourth quarter of 2018. Real Estate is a prime sector to find stable-yielding names, and the sector benefited from Japan Retail Fund Investment Corp., a REIT which offers a 3.66% indicated yield and has a consistent history of dividend increases, as well as Essex Property Trust, Inc.. Allocation and stock selection in Communication Services also contributed to performance for the period, particularly from an underweight in Netflix, Inc., which was lower for the year.
Stock selection in Health Care, and selection and allocation in Consumer Staples, were the largest detractors from performance. Allergan plc and Idexx Laboratories, Inc. were significant individual health-related detractors, while tobacco names like Imperial Brands plc, Altria Group, Inc., and Philip Morris International, Inc. were some of the biggest contributors to the negative selection in Consumer Staples. The Fund shifted from an underweight to an overweight in Consumer Staples in the fourth quarter of 2018, in a search for safety during a turbulent period for equities, and the overweight has remained.
The portfolio’s largest underweight for the period on average was in Industrials, which was neutral in terms of allocation contribution, but stock selection detracted, as the Fund was underweight W.W. Grainger, Inc. and overweight 3M Co., which took a big hit in the summer.
From a country prospective, allocation detracted from performance, particularly an underweight to the U.S. That stance helped in the fourth quarter of 2018, but less so as the U.S. equity markets gained strength during 2019. The overweight was reduced as the period progressed. An overweight to the UK also detracted, given continuing Brexit uncertainty, as names like BP plc suffered. An overweight to Australia contributed, as the political climate there indicated lower risk for banks.
106 | THE GUGGENHEIM FUNDS ANNUAL REPORT | |
MANAGERS’ COMMENTARY (Unaudited)(concluded) | September 30, 2019 |
Portfolio Positioning
Global equities remain an important allocation in investors’ portfolios. Although the year was volatile, the index ended slightly higher. The turmoil gives cause for pause as the market searches for direction. All the uncertainty caused the VIX index to end higher as well. We continue to position ourselves more safely than the broader market as we anticipate volatility to continue. Accordingly, we have reduced our exposure to Information Technology, going from an overweight to underweight. Exposure to Materials was also brought up from underweight to in-line. Our Communication Services positions have increased as we look for reasonable positions with yield. We continue to seek out dividend yield, but avoid reaching for excessive or unsustainable yield.
Performance displayed represents past performance which is no guarantee of future results.
1 | Performance figures are based on Class A shares and do not reflect deduction of the sales charges or taxes that a shareholder would pay on distributions or the redemption of shares. |
The opinions and forecast expressed may not actually come to pass. This information is subject to change at any time, based on market and other conditions, and should not be construed as a recommendation of any specific security or strategy.
| | THE GUGGENHEIM FUNDS ANNUAL REPORT | 107 |
PERFORMANCE REPORT AND FUND PROFILE (Unaudited) | September 30, 2019 |
WORLD EQUITY INCOME FUND
OBJECTIVE: Seeks to provide total return, comprised of capital appreciation and income.
Holdings Diversification (Market Exposure as % of Net Assets)

“Holdings Diversification (Market Exposure as % of Net Assets)” excludes any temporary cash investments.
COUNTRY DIVERSIFICATION
Country | | % of Long Term
Investments | |
United States | | | 57.5 | % |
United Kingdom | | | 7.9 | % |
Japan | | | 6.0 | % |
Australia | | | 5.6 | % |
Canada | | | 4.6 | % |
France | | | 2.9 | % |
Singapore | | | 2.3 | % |
Other | | | 13.2 | % |
Total Long-Term Investments | | | 100.0 | % |
Inception Dates: |
A-Class | October 1, 1993 |
C-Class | January 29, 1999 |
P-Class | May 1, 2015 |
Institutional Class | May 2, 2011 |
Ten Largest Holdings (% of Total Net Assets) |
Microsoft Corp. | 2.6% |
Apple, Inc. | 1.7% |
Home Depot, Inc. | 1.5% |
AT&T, Inc. | 1.5% |
Johnson & Johnson | 1.5% |
Mastercard, Inc. — Class A | 1.4% |
Procter & Gamble Co. | 1.4% |
Verizon Communications, Inc. | 1.3% |
NextEra Energy, Inc. | 1.2% |
Pfizer, Inc. | 1.2% |
Top Ten Total | 15.3% |
| | |
“Ten Largest Holdings” excludes any temporary cash or derivative investments. |
108 | THE GUGGENHEIM FUNDS ANNUAL REPORT | |
PERFORMANCE REPORT AND FUND PROFILE (Unaudited)(concluded) | September 30, 2019 |
Cumulative Fund Performance*
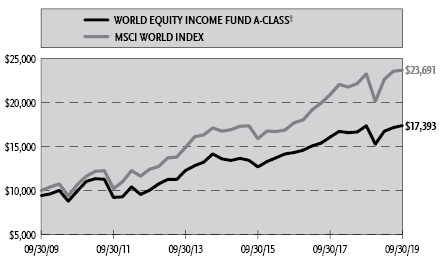
Average Annual Returns*
Periods Ended September 30, 2019
| 1 Year | 5 Year | 10 Year |
A-Class Shares | 0.14% | 5.05% | 6.32% |
A-Class Shares with sales charge‡ | (4.64%) | 4.04% | 5.69% |
C-Class Shares | (0.69%) | 4.26% | 5.52% |
C-Class Shares with CDSC§ | (1.66%) | 4.26% | 5.52% |
MSCI World Index | 1.83% | 7.18% | 9.01% |
| | 1 Year | Since
Inception
(05/01/15) |
P-Class Shares | | 0.06% | 5.40% |
MSCI World Index | | 1.83% | 6.68% |
| 1 Year | 5 Year | Since
Inception
(05/02/11) |
Institutional Class Shares | 0.40% | 5.33% | 4.95% |
MSCI World Index | 1.83% | 7.18% | 7.65% |
* | The performance data above represents past performance that is not predictive of future results. The investment return and principal value of an investment in the Fund will fluctuate so that an investor’s shares, when redeemed, may be worth more or less than their original cost. Returns are historical and include changes in principal and reinvested dividends and capital gains and do not reflect the effect of taxes. The MSCI World Index is an unmanaged index and, unlike the Fund, has no management fees or operating expenses to reduce its reported return. The graph is based on A-Class shares only; performance for C-Class, P-Class and Institutional Class will vary due to differences in fee structures. |
‡ | Effective February 22, 2011, the maximum sales charge decreased from 5.75% to 4.75%. A 5.75% maximum sales charge is used in the calculation of the Average Annual Returns based on subscriptions made prior to February 22, 2011, and a 4.75% maximum sales charge will be used to calculate performance for periods based on subscriptions made on or after February 22, 2011. |
§ | Fund returns include a CDSC of 1% if redeemed within 12 months of purchase. |
| | THE GUGGENHEIM FUNDS ANNUAL REPORT | 109 |
SCHEDULE OF INVESTMENTS | September 30, 2019 |
WORLD EQUITY INCOME FUND | |
| | Shares | | | Value | |
COMMON STOCKS† - 98.2% |
| | | | | | | | | |
Financial - 23.5% |
Mastercard, Inc. — Class A | | | 3,391 | | | $ | 920,894 | |
Commonwealth Bank of Australia | | | 13,585 | | | | 741,242 | |
Westpac Banking Corp. | | | 36,489 | | | | 730,076 | |
Intesa Sanpaolo SpA | | | 242,147 | | | | 574,347 | |
HSBC Holdings plc | | | 73,764 | | | | 566,439 | |
DBS Group Holdings Ltd. | | | 30,200 | | | | 546,401 | |
Visa, Inc. — Class A | | | 3,070 | | | | 528,070 | |
Public Storage REIT | | | 2,110 | | | | 517,520 | |
National Australia Bank Ltd. | | | 25,704 | | | | 515,329 | |
Simon Property Group, Inc. REIT | | | 3,110 | | | | 484,071 | |
Daiwa House REIT Investment Corp. REIT | | | 169 | | | | 475,211 | |
Marsh & McLennan Companies, Inc. | | | 4,738 | | | | 474,037 | |
SmartCentres Real Estate Investment Trust REIT | | | 18,483 | | | | 453,545 | |
Essex Property Trust, Inc. REIT | | | 1,362 | | | | 444,897 | |
Swedbank AB — Class A | | | 30,816 | | | | 443,708 | |
Canadian Imperial Bank of Commerce | | | 5,203 | | | | 429,416 | |
VEREIT, Inc. REIT | | | 42,985 | | | | 420,393 | |
RioCan Real Estate Investment Trust REIT | | | 20,856 | | | | 415,404 | |
United Overseas Bank Ltd. | | | 22,100 | | | | 410,405 | |
Sampo Oyj — Class A | | | 9,844 | | | | 391,528 | |
Aflac, Inc. | | | 7,109 | | | | 371,943 | |
Japan Retail Fund Investment Corp. REIT | | | 175 | | | | 370,033 | |
Great-West Lifeco, Inc. | | | 15,329 | | | | 368,164 | |
Ascendas Real Estate Investment Trust REIT | | | 150,800 | | | | 340,502 | |
Invesco Ltd. | | | 20,053 | | | | 339,698 | |
United Urban Investment Corp. REIT | | | 174 | | | | 333,155 | |
Direct Line Insurance Group plc | | | 80,792 | | | | 298,232 | |
ING Groep N.V. | | | 26,100 | | | | 273,293 | |
Covivio REIT | | | 2,500 | | | | 264,664 | |
Intercontinental Exchange, Inc. | | | 2,700 | | | | 249,129 | |
Royal Bank of Canada | | | 2,622 | | | | 212,757 | |
CME Group, Inc. — Class A | | | 1,000 | | | | 211,340 | |
Klepierre S.A. REIT | | | 6,000 | | | | 203,838 | |
American Express Co. | | | 1,700 | | | | 201,076 | |
Aon plc | | | 1,000 | | | | 193,570 | |
Zurich Insurance Group AG | | | 500 | | | | 191,410 | |
Scentre Group REIT | | | 70,200 | | | | 186,233 | |
NN Group N.V. | | | 5,000 | | | | 177,388 | |
Equity LifeStyle Properties, Inc. REIT | | | 1,300 | | | | 173,680 | |
JPMorgan Chase & Co. | | | 1,321 | | | | 155,468 | |
Australia & New Zealand Banking Group Ltd. | | | 8,026 | | | | 154,517 | |
Arthur J Gallagher & Co. | | | 1,500 | | | | 134,355 | |
Total Financial | | | | | | | 15,887,378 | |
| | | | | | | | | |
Consumer, Non-cyclical - 21.3% |
Johnson & Johnson | | | 7,673 | | | | 992,733 | |
Procter & Gamble Co. | | | 7,381 | | | | 918,049 | |
Pfizer, Inc. | | | 21,784 | | | | 782,699 | |
Roche Holding AG | | | 2,612 | | | | 760,282 | |
AbbVie, Inc. | | | 9,316 | | | | 705,407 | |
Medtronic plc | | | 6,432 | | | | 698,644 | |
Amgen, Inc. | | | 3,389 | | | | 655,806 | |
Kimberly-Clark Corp. | | | 4,461 | | | | 633,685 | |
Philip Morris International, Inc. | | | 8,166 | | | | 620,045 | |
Altria Group, Inc. | | | 15,100 | | | | 617,590 | |
S&P Global, Inc. | | | 2,354 | | | | 576,683 | |
PepsiCo, Inc. | | | 3,921 | | | | 537,569 | |
Colgate-Palmolive Co. | | | 7,105 | | | | 522,288 | |
Unilever plc | | | 8,000 | | | | 481,033 | |
Japan Tobacco, Inc. | | | 21,200 | | | | 463,956 | |
Zoetis, Inc. | | | 3,600 | | | | 448,524 | |
Imperial Brands plc | | | 18,384 | | | | 413,230 | |
Sanofi | | | 4,089 | | | | 379,209 | |
Kellogg Co. | | | 5,767 | | | | 371,106 | |
Unilever N.V. | | | 6,000 | | | | 360,772 | |
Woolworths Group Ltd. | | | 12,925 | | | | 325,263 | |
Mitsubishi Tanabe Pharma Corp. | | | 27,900 | | | | 305,808 | |
STERIS plc | | | 1,700 | | | | 245,633 | |
Novartis AG | | | 2,300 | | | | 199,469 | |
General Mills, Inc. | | | 3,380 | | | | 186,306 | |
CSL Ltd. | | | 1,100 | | | | 173,524 | |
Moody’s Corp. | | | 800 | | | | 163,864 | |
Sysco Corp. | | | 2,000 | | | | 158,800 | |
Atlantia SpA | | | 6,556 | | | | 158,610 | |
Cochlear Ltd. | | | 1,100 | | | | 154,560 | |
Sonic Healthcare Ltd. | | | 7,000 | | | | 132,543 | |
Takeda Pharmaceutical Company Ltd. | | | 3,800 | | | | 129,699 | |
Dairy Farm International Holdings Ltd. | | | 19,900 | | | | 125,370 | |
Total Consumer, Non-cyclical | | | | | | | 14,398,759 | |
| | | | | | | | | |
Technology - 12.7% |
Microsoft Corp. | | | 12,500 | | | | 1,737,875 | |
Apple, Inc. | | | 5,130 | | | | 1,148,966 | |
Texas Instruments, Inc. | | | 5,868 | | | | 758,381 | |
International Business Machines Corp. | | | 4,915 | | | | 714,739 | |
Broadcom, Inc. | | | 2,272 | | | | 627,231 | |
Fiserv, Inc.* | | | 5,847 | | | | 605,691 | |
Fidelity National Information Services, Inc. | | | 4,483 | | | | 595,163 | |
Canon, Inc. | | | 19,500 | | | | 519,912 | |
MSCI, Inc. — Class A | | | 2,200 | | | | 479,050 | |
Maxim Integrated Products, Inc. | | | 7,130 | | | | 412,898 | |
Konami Holdings Corp. | | | 8,200 | | | | 395,923 | |
Paychex, Inc. | | | 4,707 | | | | 389,598 | |
Intuit, Inc. | | | 815 | | | | 216,741 | |
Total Technology | | | | | | | 8,602,168 | |
| | | | | | | | | |
Communications - 12.7% |
AT&T, Inc. | | | 26,330 | | | | 996,327 | |
Verizon Communications, Inc. | | | 14,784 | | | | 892,362 | |
Amazon.com, Inc.* | | | 422 | | | | 732,554 | |
Alphabet, Inc. — Class C* | | | 593 | | | | 722,867 | |
NTT DOCOMO, Inc. | | | 22,300 | | | | 567,855 | |
CenturyLink, Inc. | | | 43,840 | | | | 547,123 | |
BCE, Inc. | | | 10,201 | | | | 493,548 | |
Elisa Oyj | | | 8,108 | | | | 418,130 | |
HKT Trust & HKT Ltd. | | | 245,663 | | | | 389,937 | |
TELUS Corp. | | | 10,604 | | | | 377,499 | |
Orange S.A. | | | 22,292 | | | | 349,862 | |
110 | THE GUGGENHEIM FUNDS ANNUAL REPORT | SEE NOTES TO FINANCIAL STATEMENTS. |
SCHEDULE OF INVESTMENTS (continued) | September 30, 2019 |
WORLD EQUITY INCOME FUND | |
| | Shares | | | Value | |
Nippon Telegraph & Telephone Corp. | | | 7,000 | | | $ | 333,839 | |
Proximus SADP | | | 10,031 | | | | 298,021 | |
Omnicom Group, Inc. | | | 3,798 | | | | 297,384 | |
Telia Company AB | | | 50,000 | | | | 223,905 | |
Facebook, Inc. — Class A* | | | 1,147 | | | | 204,258 | |
Informa plc | | | 18,000 | | | | 188,577 | |
CDW Corp. | | | 1,140 | | | | 140,493 | |
Motorola Solutions, Inc. | | | 800 | | | | 136,328 | |
Pearson plc | | | 15,000 | | | | 136,083 | |
Auto Trader Group plc | | | 20,000 | | | | 125,423 | |
Total Communications | | | | | | | 8,572,375 | |
| | | | | | | | | |
Industrial - 8.3% |
Lockheed Martin Corp. | | | 1,855 | | | | 723,561 | |
3M Co. | | | 3,700 | | | | 608,280 | |
Waste Management, Inc. | | | 4,958 | | | | 570,170 | |
United Parcel Service, Inc. — Class B | | | 4,159 | | | | 498,331 | |
Amcor plc | | | 48,724 | | | | 475,059 | |
Republic Services, Inc. — Class A | | | 5,446 | | | | 471,351 | |
Emerson Electric Co. | | | 6,401 | | | | 427,971 | |
Lennox International, Inc. | | | 1,580 | | | | 383,892 | |
Waste Connections, Inc. | | | 3,653 | | | | 336,076 | |
Honeywell International, Inc. | | | 1,936 | | | | 327,571 | |
Illinois Tool Works, Inc. | | | 1,724 | | | | 269,789 | |
Alstom S.A. | | | 5,000 | | | | 207,316 | |
Singapore Technologies Engineering Ltd. | | | 60,100 | | | | 167,021 | |
Geberit AG | | | 300 | | | | 143,287 | |
Total Industrial | | | | | | | 5,609,675 | |
| | | | | | | | | |
Utilities - 7.9% |
NextEra Energy, Inc. | | | 3,443 | | | | 802,185 | |
Duke Energy Corp. | | | 7,499 | | | | 718,854 | |
Dominion Energy, Inc. | | | 8,854 | | | | 717,528 | |
Power Assets Holdings Ltd. | | | 70,200 | | | | 471,596 | |
Snam SpA | | | 91,482 | | | | 462,198 | |
Endesa S.A. | | | 15,908 | | | | 418,686 | |
SSE plc | | | 25,228 | | | | 386,369 | |
Terna Rete Elettrica Nazionale SpA | | | 50,100 | | | | 321,947 | |
Fortum Oyj | | | 12,000 | | | | 283,777 | |
PPL Corp. | | | 8,275 | | | | 260,580 | |
Veolia Environnement S.A. | | | 8,000 | | | | 202,878 | |
OGE Energy Corp. | | | 3,656 | | | | 165,909 | |
AGL Energy Ltd. | | | 9,000 | | | | 116,403 | |
Total Utilities | | | | | | | 5,328,910 | |
| | | | | | | | | |
Consumer, Cyclical - 5.8% |
Home Depot, Inc. | | | 4,308 | | | | 999,542 | |
McDonald’s Corp. | | | 3,521 | | | | 755,994 | |
Persimmon plc | | | 18,395 | | | | 490,835 | |
Ford Motor Co. | | | 46,932 | | | | 429,897 | |
Harvey Norman Holdings Ltd. | | | 121,897 | | | | 372,751 | |
Las Vegas Sands Corp. | | | 5,250 | | | | 303,240 | |
Starbucks Corp. | | | 2,600 | | | | 229,892 | |
Crown Resorts Ltd. | | | 15,863 | | | | 129,033 | |
Singapore Airlines Ltd. | | | 17,800 | | | | 117,742 | |
Nissan Motor Company Ltd. | | | 16,900 | | | | 105,375 | |
Total Consumer, Cyclical | | | | | | | 3,934,301 | |
| | | | | | | | | |
Basic Materials - 3.7% |
Linde plc | | | 3,300 | | | | 639,276 | |
Rio Tinto plc | | | 11,907 | | | | 616,177 | |
Air Products & Chemicals, Inc. | | | 2,100 | | | | 465,906 | |
Croda International plc | | | 6,000 | | | | 358,561 | |
International Paper Co. | | | 5,663 | | | | 236,827 | |
Ecolab, Inc. | | | 1,000 | | | | 198,040 | |
Total Basic Materials | | | | | | | 2,514,787 | |
| | | | | | | | | |
Energy - 2.3% |
Royal Dutch Shell plc — Class A | | | 12,722 | | | | 372,939 | |
TOTAL S.A. | | | 6,021 | | | | 314,343 | |
Chevron Corp. | | | 2,300 | | | | 272,780 | |
ONEOK, Inc. | | | 3,600 | | | | 265,284 | |
Exxon Mobil Corp. | | | 2,200 | | | | 155,342 | |
Occidental Petroleum Corp. | | | 3,000 | | | | 133,410 | |
Total Energy | | | | | | | 1,514,098 | |
| | | | | | | | | |
Total Common Stocks | | | | | | | | |
(Cost $62,281,712) | | | | | | | 66,362,451 | |
| | | | | | | | | |
EXCHANGE-TRADED FUNDS† - 0.8% |
iShares MSCI EAFE ETF | | | 4,138 | | | | 269,839 | |
SPDR S&P 500 ETF Trust | | | 905 | | | | 268,577 | |
Total Exchange-Traded Funds | | | | | | | | |
(Cost $534,851) | | | | | | | 538,416 | |
| | | | | | | | | |
MONEY MARKET FUND† - 0.6% |
Goldman Sachs Financial Square Treasury Instruments Fund — Institutional Shares 1.79%1 | | | 407,459 | | | | 407,459 | |
Total Money Market Fund | | | | | | | | |
(Cost $407,459) | | | | | | | 407,459 | |
| | | | | | | | | |
Total Investments - 99.6% | | | | | | | | |
(Cost $63,224,022) | | | | | | $ | 67,308,326 | |
Other Assets & Liabilities, net - 0.4% | | | | | | | 282,971 | |
Total Net Assets - 100.0% | | | | | | $ | 67,591,297 | |
Futures Contracts |
Description | | Number of
Contracts | | | Expiration
Date | | | Notional
Amount | | | Value and
Unrealized
Appreciation** | |
Currency Futures Contracts Sold Short† |
Euro FX Futures Contracts | | | 22 | | | | Dec 2019 | | | $ | 3,014,138 | | | $ | 10,393 | |
SEE NOTES TO FINANCIAL STATEMENTS. | THE GUGGENHEIM FUNDS ANNUAL REPORT | 111 |
SCHEDULE OF INVESTMENTS (concluded) | September 30, 2019 |
WORLD EQUITY INCOME FUND | |
* | Non-income producing security. |
** | Includes cumulative appreciation (depreciation). Variation margin is reported within the Statement of Assets and Liabilities. |
† | Value determined based on Level 1 inputs — See Note 4. |
1 | Rate indicated is the 7-day yield as of September 30, 2019. |
| | plc — Public Limited Company |
| | REIT — Real Estate Investment Trust |
| | |
| | See Sector Classification in Other Information section. |
The following table summarizes the inputs used to value the Fund’s investments at September 30, 2019 (See Note 4 in the Notes to Financial Statements):
Investments in Securities (Assets) | | Level 1
Quoted
Prices | | | Level 2
Significant
Observable
Inputs | | | Level 3
Significant
Unobservable
Inputs | | | Total | |
Common Stocks | | $ | 66,362,451 | | | $ | — | | | $ | — | | | $ | 66,362,451 | |
Exchange-Traded Funds | | | 538,416 | | | | — | | | | — | | | | 538,416 | |
Money Market Fund | | | 407,459 | | | | — | | | | — | | | | 407,459 | |
Currency Futures Contracts** | | | 10,393 | | | | — | | | | — | | | | 10,393 | |
Total Assets | | $ | 67,318,719 | | | $ | — | | | $ | — | | | $ | 67,318,719 | |
** | This derivative is reported as unrealized appreciation/depreciation at period end. |
112 | THE GUGGENHEIM FUNDS ANNUAL REPORT | SEE NOTES TO FINANCIAL STATEMENTS. |
STATEMENT OF ASSETS AND LIABILITIES |
September 30, 2019 |
Assets: |
Investments, at value (cost $63,224,022) | | $ | 67,308,326 | |
Foreign currency, at value (cost $17,267) | | | 17,262 | |
Segregated Cash | | | 44,000 | |
Prepaid expenses | | | 35,133 | |
Receivables: |
Foreign tax reclaims | | | 182,570 | |
Dividends | | | 146,148 | |
Variation margin on futures contracts | | | 11,137 | |
Fund shares sold | | | 3,308 | |
Interest | | | 656 | |
Total assets | | | 67,748,540 | |
| | | | | |
Liabilities: |
Payable for: |
Professional fees | | | 33,812 | |
Printing fees | | | 29,524 | |
Management fees | | | 16,234 | |
Fund shares redeemed | | | 16,025 | |
Transfer agent/maintenance fees | | | 15,468 | |
Distribution and service fees | | | 14,255 | |
Custodian fees | | | 12,027 | |
Fund accounting/administration fees | | | 4,153 | |
Distributions to shareholders | | | 2,822 | |
Trustees’ fees* | | | 1,545 | |
Miscellaneous | | | 11,378 | |
Total liabilities | | | 157,243 | |
Net assets | | $ | 67,591,297 | |
| | | | | |
Net assets consist of: |
Paid in capital | | $ | 63,429,974 | |
Total distributable earnings (loss) | | | 4,161,323 | |
Net assets | | $ | 67,591,297 | |
| | | | | |
A-Class: |
Net assets | | $ | 60,638,534 | |
Capital shares outstanding | | | 3,974,523 | |
Net asset value per share | | $ | 15.26 | |
Maximum offering price per share (Net asset value divided by 95.25%) | | $ | 16.02 | |
| | | | | |
C-Class: |
Net assets | | $ | 3,365,970 | |
Capital shares outstanding | | | 257,734 | |
Net asset value per share | | $ | 13.06 | |
| | | | | |
P-Class: |
Net assets | | $ | 128,968 | |
Capital shares outstanding | | | 8,384 | |
Net asset value per share | | $ | 15.38 | |
| | | | | |
Institutional Class: |
Net assets | | $ | 3,457,825 | |
Capital shares outstanding | | | 228,079 | |
Net asset value per share | | $ | 15.16 | |
* | Relates to Trustees not deemed “interested persons” within the meaning of Section 2(a)(19) of the 1940 Act. |
SEE NOTES TO FINANCIAL STATEMENTS. | THE GUGGENHEIM FUNDS ANNUAL REPORT | 113 |
STATEMENT OF OPERATIONS |
Year Ended September 30, 2019 |
Investment Income: |
Dividends (net of foreign withholding tax of $224,666) | | $ | 2,821,468 | |
Interest | | | 11,341 | |
Total investment income | | | 2,832,809 | |
| | | | | |
Expenses: |
Management fees | | | 548,283 | |
Distribution and service fees: |
A-Class | | | 151,778 | |
C-Class | | | 36,108 | |
P-Class | | | 355 | |
Transfer agent/maintenance fees: |
A-Class | | | 35,515 | |
C-Class | | | 7,929 | |
P-Class | | | 200 | |
Institutional Class | | | 19,993 | |
Registration fees | | | 63,009 | |
Fund accounting/administration fees | | | 62,661 | |
Custodian fees | | | 23,202 | |
Trustees’ fees* | | | 19,552 | |
Line of credit fees | | | 1,819 | |
Miscellaneous | | | 105,702 | |
Recoupment of previously waived fees: |
A-Class | | | 422 | |
Total expenses | | | 1,076,528 | |
Less: |
Expenses reimbursed by Adviser: |
A-Class | | | (34,480 | ) |
C-Class | | | (7,843 | ) |
P-Class | | | (197 | ) |
Institutional Class | | | (19,586 | ) |
Expenses waived by Adviser | | | (66,398 | ) |
Earnings credits applied | | | (258 | ) |
Total waived/reimbursed expenses | | | (128,762 | ) |
Net expenses | | | 947,766 | |
Net investment income | | | 1,885,043 | |
| | | | | |
Net Realized and Unrealized Gain (Loss): |
Net realized gain (loss) on: |
Investments | | $ | 298,561 | |
Futures contracts | | | (103,726 | ) |
Foreign currency transactions | | | (3,745 | ) |
Net realized gain | | | 191,090 | |
Net change in unrealized appreciation (depreciation) on: |
Investments | | | (2,570,106 | ) |
Futures contracts | | | (14,632 | ) |
Foreign currency translations | | | (2,810 | ) |
Net change in unrealized appreciation (depreciation) | | | (2,587,548 | ) |
Net realized and unrealized loss | | | (2,396,458 | ) |
Net decrease in net assets resulting from operations | | $ | (511,415 | ) |
* | Relates to Trustees not deemed “interested persons” within the meaning of Section 2(a)(19) of the 1940 Act. |
114 | THE GUGGENHEIM FUNDS ANNUAL REPORT | SEE NOTES TO FINANCIAL STATEMENTS. |
STATEMENTS OF CHANGES IN NET ASSETS |
| | Year Ended
September 30,
2019 | | | Year Ended
September 30,
2018 | |
Increase (Decrease) in Net Assets from Operations: | | | | | | | | |
Net investment income | | $ | 1,885,043 | | | $ | 1,341,958 | |
Net realized gain on investments | | | 191,090 | | | | 6,312,313 | |
Net change in unrealized appreciation (depreciation) on investments | | | (2,587,548 | ) | | | (602,150 | ) |
Net increase (decrease) in net assets resulting from operations | | | (511,415 | ) | | | 7,052,121 | |
| | | | | | | | | |
Distributions to shareholders: | | | | | | | | |
A-Class | | | (2,009,452 | ) | | | (1,156,255 | ) |
C-Class | | | (99,688 | ) | | | (47,501 | ) |
P-Class | | | (4,761 | ) | | | (4,572 | ) |
Institutional Class | | | (531,121 | ) | | | (204,911 | ) |
Total distributions to shareholders | | | (2,645,022 | ) | | | (1,413,239 | ) |
| | | | | | | | | |
Capital share transactions: | | | | | | | | |
Proceeds from sale of shares | | | | | | | | |
A-Class | | | 3,128,968 | | | | 6,655,092 | |
C-Class | | | 91,755 | | | | 604,160 | |
P-Class | | | 21,480 | | | | 102,160 | |
Institutional Class | | | 1,671,048 | | | | 17,699,901 | |
Distributions reinvested | | | | | | | | |
A-Class | | | 1,991,397 | | | | 1,146,400 | |
C-Class | | | 95,462 | | | | 45,750 | |
P-Class | | | 4,761 | | | | 4,572 | |
Institutional Class | | | 530,037 | | | | 201,768 | |
Cost of shares redeemed | | | | | | | | |
A-Class | | | (9,831,792 | ) | | | (25,252,350 | ) |
C-Class | | | (863,102 | ) | | | (3,249,720 | ) |
P-Class | | | (82,954 | ) | | | (283,546 | ) |
Institutional Class | | | (17,688,013 | ) | | | (2,769,819 | ) |
Net decrease from capital share transactions | | | (20,930,953 | ) | | | (5,095,632 | ) |
Net increase (decrease) in net assets | | | (24,087,390 | ) | | | 543,250 | |
| | | | | | | | | |
Net assets: | | | | | | | | |
Beginning of year | | | 91,678,687 | | | | 91,135,437 | |
End of year | | $ | 67,591,297 | | | $ | 91,678,687 | |
| | | | | | | | | |
Capital share activity: | | | | | | | | |
Shares sold | | | | | | | | |
A-Class | | | 210,190 | | | | 431,369 | |
C-Class | | | 7,204 | | | | 45,705 | |
P-Class | | | 1,447 | | | | 6,473 | |
Institutional Class | | | 114,575 | | | | 1,160,747 | |
Shares issued from reinvestment of distributions | | | | | | | | |
A-Class | | | 138,399 | | | | 74,729 | |
C-Class | | | 7,831 | | | | 3,491 | |
P-Class | | | 329 | | | | 295 | |
Institutional Class | | | 37,301 | | | | 13,131 | |
Shares redeemed | | | | | | | | |
A-Class | | | (664,558 | ) | | | (1,645,397 | ) |
C-Class | | | (68,969 | ) | | | (244,443 | ) |
P-Class | | | (5,642 | ) | | | (18,035 | ) |
Institutional Class | | | (1,170,759 | ) | | | (180,147 | ) |
Net decrease in shares | | | (1,392,652 | ) | | | (352,082 | ) |
SEE NOTES TO FINANCIAL STATEMENTS. | THE GUGGENHEIM FUNDS ANNUAL REPORT | 115 |
This table is presented to show selected data for a share outstanding throughout each period and to assist shareholders in evaluating a Fund’s performance for the periods presented.
A-Class | | Year Ended
September 30,
2019 | | | Year Ended
September 30,
2018 | | | Year Ended
September 30,
2017 | | | Year Ended
September 30,
2016 | | | Year Ended
September 30,
2015 | |
Per Share Data | | | | | | | | | | | | | | | | | | | | |
Net asset value, beginning of period | | $ | 15.77 | | | $ | 14.84 | | | $ | 13.54 | | | $ | 12.28 | | | $ | 13.51 | |
Income (loss) from investment operations: |
Net investment income (loss)a | | | .35 | | | | .23 | | | | .31 | | | | .31 | | | | .29 | |
Net gain (loss) on investments (realized and unrealized) | | | (.36 | ) | | | .95 | | | | 1.34 | | | | 1.26 | | | | (1.18 | ) |
Total from investment operations | | | (.01 | ) | | | 1.18 | | | | 1.65 | | | | 1.57 | | | | (.89 | ) |
Less distributions from: |
Net investment income | | | (.37 | ) | | | (.25 | ) | | | (.35 | ) | | | (.31 | ) | | | (.34 | ) |
Net realized gains | | | (.13 | ) | | | — | | | | — | | | | — | | | | — | |
Total distributions | | | (.50 | ) | | | (.25 | ) | | | (.35 | ) | | | (.31 | ) | | | (.34 | ) |
Net asset value, end of period | | $ | 15.26 | | | $ | 15.77 | | | $ | 14.84 | | | $ | 13.54 | | | $ | 12.28 | |
|
Total Returnb | | | 0.14 | % | | | 8.01 | % | | | 12.31 | % | | | 12.85 | % | | | (6.70 | %) |
Ratios/Supplemental Data |
Net assets, end of period (in thousands) | �� | $ | 60,639 | | | $ | 67,679 | | | $ | 80,598 | | | $ | 80,575 | | | $ | 73,568 | |
Ratios to average net assets: |
Net investment income (loss) | | | 2.39 | % | | | 1.48 | % | | | 2.23 | % | | | 2.36 | % | | | 2.21 | % |
Total expensesc | | | 1.37 | % | | | 1.37 | % | | | 1.34 | % | | | 1.48 | % | | | 1.48 | % |
Net expensesd,e,f | | | 1.22 | % | | | 1.22 | % | | | 1.24 | % | | | 1.48 | % | | | 1.43 | % |
Portfolio turnover rate | | | 127 | % | | | 125 | % | | | 94 | % | | | 51 | % | | | 131 | % |
C-Class | | Year Ended
September 30,
2019 | | | Year Ended
September 30,
2018 | | | Year Ended
September 30,
2017 | | | Year Ended
September 30,
2016 | | | Year Ended
September 30,
2015 | |
Per Share Data | | | | | | | | | | | | | | | | | | | | |
Net asset value, beginning of period | | $ | 13.53 | | | $ | 12.72 | | | $ | 11.63 | | | $ | 10.55 | | | $ | 11.61 | |
Income (loss) from investment operations: |
Net investment income (loss)a | | | .21 | | | | .09 | | | | .19 | | | | .18 | | | | .17 | |
Net gain (loss) on investments (realized and unrealized) | | | (.33 | ) | | | .83 | | | | 1.13 | | | | 1.09 | | | | (1.02 | ) |
Total from investment operations | | | (.12 | ) | | | .92 | | | | 1.32 | | | | 1.27 | | | | (.85 | ) |
Less distributions from: |
Net investment income | | | (.22 | ) | | | (.11 | ) | | | (.23 | ) | | | (.19 | ) | | | (.21 | ) |
Net realized gains | | | (.13 | ) | | | — | | | | — | | | | — | | | | — | |
Total distributions | | | (.35 | ) | | | (.11 | ) | | | (.23 | ) | | | (.19 | ) | | | (.21 | ) |
Net asset value, end of period | | $ | 13.06 | | | $ | 13.53 | | | $ | 12.72 | | | $ | 11.63 | | | $ | 10.55 | |
|
Total Returnb | | | (0.69 | %) | | | 7.27 | % | | | 11.46 | % | | | 12.05 | % | | | (7.40 | %) |
Ratios/Supplemental Data |
Net assets, end of period (in thousands) | | $ | 3,366 | | | $ | 4,215 | | | $ | 6,449 | | | $ | 5,455 | | | $ | 5,936 | |
Ratios to average net assets: |
Net investment income (loss) | | | 1.64 | % | | | 0.71 | % | | | 1.53 | % | | | 1.59 | % | | | 1.50 | % |
Total expensesc | | | 2.28 | % | | | 2.18 | % | | | 2.19 | % | | | 2.35 | % | | | 2.28 | % |
Net expensesd,e,f | | | 1.97 | % | | | 1.97 | % | | | 1.99 | % | | | 2.23 | % | | | 2.23 | % |
Portfolio turnover rate | | | 127 | % | | | 125 | % | | | 94 | % | | | 51 | % | | | 131 | % |
116 | THE GUGGENHEIM FUNDS ANNUAL REPORT | SEE NOTES TO FINANCIAL STATEMENTS. |
FINANCIAL HIGHLIGHTS (continued) |
This table is presented to show selected data for a share outstanding throughout each period and to assist shareholders in evaluating a Fund’s performance for the periods presented.
P-Class | | Year Ended
September 30,
2019 | | | Year Ended
September 30,
2018 | | | Year Ended
September 30,
2017 | | | Year Ended
September 30,
2016 | | | Period Ended
September 30,
2015g | |
Per Share Data | | | | | | | | | | | | | | | | | | | | |
Net asset value, beginning of period | | $ | 15.92 | | | $ | 15.08 | | | $ | 13.73 | | | $ | 12.33 | | | $ | 13.62 | |
Income (loss) from investment operations: |
Net investment income (loss)a | | | .36 | | | | .24 | | | | .33 | | | | .33 | | | | .12 | |
Net gain (loss) on investments (realized and unrealized) | | | (.39 | ) | | | .95 | | | | 1.35 | | | | 1.35 | | | | (1.29 | ) |
Total from investment operations | | | (.03 | ) | | | 1.19 | | | | 1.68 | | | | 1.68 | | | | (1.17 | ) |
Less distributions from: |
Net investment income | | | (.38 | ) | | | (.35 | ) | | | (.33 | ) | | | (.28 | ) | | | (.12 | ) |
Net realized gains | | | (.13 | ) | | | — | | | | — | | | | — | | | | — | |
Total distributions | | | (.51 | ) | | | (.35 | ) | | | (.33 | ) | | | (.28 | ) | | | (.12 | ) |
Net asset value, end of period | | $ | 15.38 | | | $ | 15.92 | | | $ | 15.08 | | | $ | 13.73 | | | $ | 12.33 | |
|
Total Return | | | 0.06 | % | | | 7.99 | % | | | 12.32 | % | | | 13.73 | % | | | (8.64 | %) |
Ratios/Supplemental Data |
Net assets, end of period (in thousands) | | $ | 129 | | | $ | 195 | | | $ | 355 | | | $ | 133 | | | $ | 9 | |
Ratios to average net assets: |
Net investment income (loss) | | | 2.38 | % | | | 1.50 | % | | | 2.28 | % | | | 2.58 | % | | | 2.14 | % |
Total expensesc | | | 1.44 | % | | | 1.40 | % | | | 1.76 | % | | | 1.33 | % | | | 3.54 | % |
Net expensesd,e,f | | | 1.22 | % | | | 1.22 | % | | | 1.24 | % | | | 1.33 | % | | | 1.48 | % |
Portfolio turnover rate | | | 127 | % | | | 125 | % | | | 94 | % | | | 51 | % | | | 131 | % |
SEE NOTES TO FINANCIAL STATEMENTS. | THE GUGGENHEIM FUNDS ANNUAL REPORT | 117 |
FINANCIAL HIGHLIGHTS (concluded) |
This table is presented to show selected data for a share outstanding throughout each period and to assist shareholders in evaluating a Fund’s performance for the periods presented.
Institutional Class | | Year Ended
September 30,
2019 | | | Year Ended
September 30,
2018 | | | Year Ended
September 30,
2017 | | | Year Ended
September 30,
2016 | | | Year Ended
September 30,
2015 | |
Per Share Data | | | | | | | | | | | | | | | | | | | | |
Net asset value, beginning of period | | $ | 15.71 | | | $ | 14.74 | | | $ | 13.44 | | | $ | 12.23 | | | $ | 13.45 | |
Income (loss) from investment operations: |
Net investment income (loss)a | | | .39 | | | | .29 | | | | .35 | | | | .31 | | | | .36 | |
Net gain (loss) on investments (realized and unrealized) | | | (.37 | ) | | | .93 | | | | 1.33 | | | | 1.28 | | | | (1.21 | ) |
Total from investment operations | | | .02 | | | | 1.22 | | | | 1.68 | | | | 1.59 | | | | (.85 | ) |
Less distributions from: |
Net investment income | | | (.44 | ) | | | (.25 | ) | | | (.38 | ) | | | (.38 | ) | | | (.37 | ) |
Net realized gains | | | (.13 | ) | | | — | | | | — | | | | — | | | | — | |
Total distributions | | | (.57 | ) | | | (.25 | ) | | | (.38 | ) | | | (.38 | ) | | | (.37 | ) |
Net asset value, end of period | | $ | 15.16 | | | $ | 15.71 | | | $ | 14.74 | | | $ | 13.44 | | | $ | 12.23 | |
|
Total Return | | | 0.40 | % | | | 8.34 | % | | | 12.61 | % | | | 13.11 | % | | | (6.42 | %) |
Ratios/Supplemental Data |
Net assets, end of period (in thousands) | | $ | 3,458 | | | $ | 19,589 | | | $ | 3,734 | | | $ | 2,824 | | | $ | 4,541 | |
Ratios to average net assets: |
Net investment income (loss) | | | 2.67 | % | | | 1.85 | % | | | 2.50 | % | | | 2.42 | % | | | 2.70 | % |
Total expensesc | | | 1.17 | % | | | 1.02 | % | | | 1.09 | % | | | 1.30 | % | | | 1.23 | % |
Net expensesd,e,f | | | 0.97 | % | | | 0.97 | % | | | 0.98 | % | | | 1.22 | % | | | 1.23 | % |
Portfolio turnover rate | | | 127 | % | | | 125 | % | | | 94 | % | | | 51 | % | | | 131 | % |
a | Net investment income (loss) per share was computed using average shares outstanding throughout the period. |
b | Total return does not reflect the impact of any applicable sales charges. |
c | Does not include expenses of the underlying funds in which the Fund invests. |
d | Net expense information reflects the expense ratios after expense waivers and reimbursements, as applicable. |
e | The portion of the ratios of expenses before and after waivers/reimbursements to average net assets attributable to recoupments of prior fee reductions or expense reimbursements for the years presented was as follows: |
| | | 09/30/19 | 09/30/18 | 09/30/17 |
| | A-Class | 0.00%* | 0.00%* | 0.01% |
| | C-Class | — | 0.00%* | 0.01% |
| | P-Class | — | — | — |
| | Institutional Class | — | 0.02% | 0.03% |
f | Net expenses may include expenses that are excluded from the expense limitation agreement and recouped amounts. Excluding these expenses, the net expense ratios for the periods presented was as follows: |
| | | 09/30/19 | 09/30/18 | 09/30/17 | 09/30/16 | 09/30/15 |
| | A-Class | 1.22% | 1.22% | 1.22% | 1.46% | 1.46% |
| | C-Class | 1.97% | 1.97% | 1.97% | 2.21% | 2.21% |
| | P-Class | 1.22% | 1.22% | 1.22% | 1.32% | 1.46% |
| | Institutional Class | 0.97% | 0.97% | 0.96% | 1.21% | 1.21% |
g | Since commencement of operations: May 1, 2015. Percentage amounts for the period, except total return and portfolio turnover rate, have been annualized. |
118 | THE GUGGENHEIM FUNDS ANNUAL REPORT | SEE NOTES TO FINANCIAL STATEMENTS. |
NOTES TO FINANCIAL STATEMENTS |
Note 1 – Organization and Significant Accounting Policies
Organization
Guggenheim Funds Trust (the “Trust”), a Delaware statutory trust, is registered with the SEC under the Investment Company Act of 1940 (“1940 Act”), as an open-ended investment company of the series type. Each series, in effect, is representing a separate fund. The Trust is authorized to issue an unlimited number of no par value shares. The Trust accounts for the assets of each fund separately.
The Trust offers a combination of five separate classes of shares, A-Class shares, C-Class shares, P-Class shares, R6-Class shares and Institutional Class shares. Sales of shares of each Class are made without a front-end sales charge at the net asset value per share (“NAV”), with the exception of A-Class shares. A-Class shares are sold at the NAV, plus the applicable front-end sales charge. The sales charge varies depending on the amount purchased. A-Class share purchases of $1 million or more are exempt from the front-end sales charge but have a 1% contingent deferred sales charge (“CDSC”), if shares are redeemed within 12 months of purchase. C-Class shares have a 1% CDSC if shares are redeemed within 12 months of purchase. C-Class shares of each Fund automatically convert to A-Class shares of the same Fund on or about the 10th day of the month following the 10-year anniversary of the purchase of the C-Class shares. This conversion will be executed without any sales charge, fee or other charge. After the conversion is completed, the shares will be subject to all features and expenses of A-Class shares. Institutional Class shares are offered primarily for direct investment by institutions such as pension and profit sharing plans, endowments, foundations and corporations. Institutional Class shares require a minimum initial investment of $2 million and a minimum account balance of $1 million. R6-Class shares are offered primarily through qualified retirement and benefit plans. R6-Class shares are also offered through certain other plans and platforms sponsored by financial intermediaries. Certain institutional investors and others deemed appropriate by Guggenheim Investments (“GI”) may also be eligible to purchase R6-Class shares subject to a $2 million minimum initial investment. At September 30, 2019, the Trust consisted of twenty funds (the “Funds”).
This report covers the following Funds:
Fund Name | Investment
Company Type |
Alpha Opportunity Fund | Diversified |
Large Cap Value Fund | Diversified |
Market Neutral Real Estate Fund | Diversified |
Risk Managed Real Estate Fund | Diversified |
Small Cap Value Fund | Diversified |
StylePlus—Large Core Fund | Diversified |
StylePlus—Mid Growth Fund | Diversified |
World Equity Income Fund | Diversified |
At September 30, 2019, only A-Class, C-Class, P-Class and Institutional Class shares have been issued by the Funds.
Security Investors, LLC and Guggenheim Partners Investment Management, LLC (“GPIM”), which operate under the name Guggenheim Investments, provide advisory services. Guggenheim Funds Distributors, LLC (“GFD”) acts as principal underwriter for the Trust. GI and GFD are affiliated entities.
Significant Accounting Policies
The Funds operate as investment companies and, accordingly, follow the investment company accounting and reporting guidance of the Financial Accounting Standards Board (“FASB”) Accounting Standards Codification Topic 946 Financial Services – Investment Companies.
The following significant accounting policies are in conformity with U.S. generally accepted accounting principles (“U.S. GAAP”) and are consistently followed by the Trust. This requires management to make estimates and assumptions that affect the reported amount of assets and liabilities, contingent assets and liabilities at the date of the financial statements, and the reported amounts of revenues and expenses during the reporting period. Actual results could differ from these estimates. All time references are based on Eastern Time.
The NAV of each Class of a fund is calculated by dividing the market value of a fund’s securities and other assets, less all liabilities, attributable to the Class by the number of outstanding shares of the Class.
(a) Valuation of Investments
The Board of Trustees of the Funds (the “Board”) has adopted policies and procedures for the valuation of the Funds’ investments (the “Valuation Procedures”). Pursuant to the Valuation Procedures, the Board has delegated to a valuation committee, consisting of representatives from Guggenheim’s investment management, fund administration, legal and compliance departments (the “Valuation Committee”), the day-to-day responsibility for implementing the Valuation Procedures, including, under most circumstances, the responsibility for determining the fair value of the Funds’ securities and/or other assets.
Valuations of the Funds’ securities are supplied primarily by pricing services appointed pursuant to the processes set forth in the Valuation Procedures. The Valuation Committee convenes monthly, or more frequently as needed, to review the valuation of all assets which have been fair valued for reasonableness. The Funds’ officers, through the Valuation Committee and consistent with the
| | THE GUGGENHEIM FUNDS ANNUAL REPORT | 119 |
NOTES TO FINANCIAL STATEMENTS (continued) |
monitoring and review responsibilities set forth in the Valuation Procedures, regularly review procedures used and valuations provided by the pricing services.
If the pricing service cannot or does not provide a valuation for a particular investment or such valuation is deemed unreliable, such investment is fair valued by the Valuation Committee.
Equity securities listed or traded on a recognized U.S. securities exchange or the National Association of Securities Dealers Automated Quotations (“NASDAQ”) National Market System shall generally be valued on the basis of the last sale price on the primary U.S. exchange or market on which the security is listed or traded; provided, however, that securities listed on NASDAQ will be valued at the NASDAQ Official Closing Price, which may not necessarily represent the last sale price. If there is no sale on the valuation date, exchange-traded U.S. equity securities will be valued on the basis of the last bid price.
Generally, trading in foreign securities markets is substantially completed each day at various times prior to the close of the NYSE. The values of foreign securities are determined as of the close of such foreign markets or the close of the New York Stock Exchange (“NYSE”), if earlier. All investments quoted in foreign currencies are valued in U.S. dollars on the basis of the foreign currency exchange rates prevailing at the close of U.S. business at 4:00 p.m. Investments in foreign securities may involve risks not present in domestic investments. The Valuation Committee will determine the current value of such foreign securities by taking into consideration certain factors which may include those discussed above, as well as the following factors, among others: the value of the securities traded on other foreign markets, ADR trading, closed-end fund trading, foreign currency exchange activity, and the trading prices of financial products that are tied to foreign securities. In addition, under the Valuation Procedures, the Valuation Committee and GI are authorized to use prices and other information supplied by a third party pricing vendor in valuing foreign securities.
Open-end investment companies are valued at their NAV as of the close of business, on the valuation date. Exchange-traded funds are valued at the last quoted sale price.
The value of futures contracts is accounted for using the unrealized appreciation or depreciation on the contracts that is determined by marking the contracts to their current realized settlement prices. Financial futures contracts are valued at the 4:00 p.m. price on the valuation date. In the event that the exchange for a specific futures contract closes earlier than 4:00 p.m., the futures contract is valued at the official settlement price of the exchange. However, the underlying securities from which the futures contract value is derived are monitored until 4:00 p.m. to determine if fair valuation would provide a more accurate valuation.
The values of over-the-counter (“OTC”) swap agreements entered into by a fund are accounted for using the unrealized appreciation or depreciation on the agreements that are determined by marking the agreements to the last quoted value of the index that the swaps pertain to at the close of the NYSE.
The value of equity swaps with custom portfolio baskets shall be computed by using the last exchange sale price for each underlying equity security with the swap agreement. A custom portfolio equity swap will be adjusted to include dividends accrued, financing charges and/or interest, as applicable, under the swap agreement.
Investments for which market quotations are not readily available are fair-valued as determined in good faith by GI, subject to review and approval by the Valuation Committee, pursuant to methods established or ratified by the Board. Valuations in accordance with these methods are intended to reflect each security’s (or asset’s or liability’s) “fair value”. Each such determination is based on a consideration of all relevant factors, which are likely to vary from one pricing context to another. Examples of such factors may include, but are not limited to market prices; sale prices; broker quotes; and models which derive prices based on inputs such as prices of securities with comparable maturities and characteristics, or based on inputs such as anticipated cash flows or collateral, spread over U.S. Treasury securities, and other information analysis.
In connection with futures contracts and other derivative investments, such factors may include obtaining information as to how (a) these contracts and other derivative investments trade in the futures or other derivative markets, respectively, and (b) the securities underlying these contracts and other derivative investments trade in the cash market.
(b) Short Sales
When a Fund engages in a short sale of a security, an amount equal to the proceeds is reflected as an asset and an equivalent liability. The amount of the liability is subsequently marked-to-market to reflect the market value of the short sale. The Fund maintains a segregated account of cash and/or securities as collateral for short sales.
Fees, if any, paid to brokers to borrow securities in connection with short sales are recorded as interest expense. In addition, the Fund must pay out the dividend rate of the equity or coupon rate of the obligation to the lender and record this as an expense. Short dividend or interest expense is a cost associated with the investment objective of short sales transactions, rather than an operational cost associated with the day-to-day management of any mutual fund. The Fund may also receive rebate income from the broker resulting from the investment of the proceeds from securities sold short.
120 | THE GUGGENHEIM FUNDS ANNUAL REPORT | |
NOTES TO FINANCIAL STATEMENTS (continued) |
(c) Futures Contracts
Upon entering into a futures contract, a Fund deposits and maintains as collateral such initial margin as required by the exchange on which the transaction is affected. Pursuant to the contract, the Fund agrees to receive from or pay to the broker an amount of cash equal to the daily fluctuation in value of the contract. Such receipts or payments are known as variation margin and are recorded by the Fund as unrealized appreciation or depreciation. When the contract is closed, the Fund records a realized gain or loss equal to the difference between the value of the contract at the time it was opened and the value at the time it was closed.
(d) Swap Agreements
Swap agreements are marked-to-market daily and the change, if any, is recorded as unrealized appreciation or depreciation. Payments received or made as a result of an agreement or termination of an agreement are recognized as realized gains or losses.
(e) Currency Translations
The accounting records of the Funds are maintained in U.S. dollars. All assets and liabilities initially expressed in foreign currencies are converted into U.S. dollars at prevailing exchange rates. Purchases and sales of investment securities, dividend and interest income, and certain expenses are translated at the rates of exchange prevailing on the respective dates of such transactions.
Changes in the relationship of these foreign currencies to the U.S. dollar can significantly affect the value of the investments and earnings of the Funds. Foreign investments may also subject the Funds to foreign government exchange restrictions, expropriation, taxation, or other political, social or economic developments, all of which could affect the market and/or credit risk of the investments.
The Funds do not isolate that portion of the results of operations resulting from changes in the foreign exchange rates on investments from the fluctuations arising from changes in the market prices of securities held. Such fluctuations are included with the net realized gain or loss and unrealized appreciation or depreciation on investments.
Reported net realized foreign exchange gains and losses arise from sales of foreign currencies and currency gains or losses realized between the trade and settlement dates on investment transactions. Net unrealized exchange appreciation and depreciation arise from changes in the fair values of assets and liabilities other than investments in securities at the fiscal period end, resulting from changes in exchange rates.
(f) Foreign Taxes
The Funds may be subject to foreign taxes (a portion of which may be reclaimable) on income, stock dividends, capital gains on investments or certain foreign currency transactions. All foreign taxes are recorded in accordance with the applicable foreign tax regulations and rates that exist in the foreign jurisdictions in which the Funds invest. These foreign taxes, if any, are paid by the Funds and reflected in their Statements of Operations as follows: foreign taxes withheld at source are presented as a reduction of income and foreign taxes on capital gains from sales of investments are included with the net realized gain (loss) on investments. Foreign taxes payable or deferred as of September 30, 2019, if any, are disclosed in the Funds’ Statements of Assets and Liabilities.
(g) Security Transactions
Security transactions are recorded on the trade date for financial reporting purposes. Realized gains and losses from securities transactions are recorded using the identified cost basis. Proceeds from lawsuits related to investment holdings are recorded as a reduction to cost if the securities are still held and as realized gains if no longer held in the respective Fund. Dividend income is recorded on the ex-dividend date, net of applicable taxes withheld by foreign countries.Taxable non-cash dividends are recorded as dividend income. Interest income, including amortization of premiums and accretion of discounts, is accrued on a daily basis. Amendment fees are earned as compensation for evaluating and accepting changes to the original loan agreement and are recognized when received. Dividend income from Real Estate Investment Trusts (“REITs”) is recorded based on the income included in the distributions received from the REIT investments using published REIT classifications, including some management estimates when actual amounts are not available. Distributions received in excess of this estimated amount are recorded as a reduction of the cost of investments or reclassified to realized gains. The actual amounts of income, return of capital, and realized gains are only determined by each REIT after its fiscal year-end, and may differ from the estimated amounts.
(h) Distributions
Dividends from net investment income are declared quarterly in the World Equity Income Fund and Risk Managed Real Estate Fund. Dividends are reinvested in additional shares unless shareholders request payment in cash. Distributions of net investment income in the remaining Funds and distributions of net realized gains, if any, in all Funds are declared at least annually and recorded on the ex-dividend date and are determined in accordance with U.S. federal income tax regulations which may differ from U.S. GAAP.
| | THE GUGGENHEIM FUNDS ANNUAL REPORT | 121 |
NOTES TO FINANCIAL STATEMENTS (continued) |
(i) Class Allocations
Interest and dividend income, most expenses, all realized gains and losses, and all unrealized appreciation and depreciation are allocated to the classes based upon the value of the outstanding shares in each Class. Certain costs, such as distribution and service fees are charged directly to specific classes. In addition, certain expenses have been allocated to the individual Funds in the Trust based on the respective net assets of each Fund included in the Trust.
(j) Earnings Credits
Under the fee arrangement with the custodian, the Funds may earn credits based on overnight custody cash balances. These credits are utilized to reduce related custodial expenses. The custodian fees disclosed in the Statements of Operations are before the reduction in expense from the related earnings credits, if any. Earnings credits for the year ended September 30, 2019, are disclosed in the Statements of Operations.
(k) Cash
The Funds may leave cash overnight in their cash account with the custodian. Periodically, a Fund may have cash due to the custodian bank as an overdraft balance. A fee is incurred on this overdraft, calculated by multiplying the overdraft by a rate based on the federal funds rate, which was 1.90% at September 30, 2019.
(l) Indemnifications
Under the Funds’ organizational documents, the Trustees and Officers are indemnified against certain liabilities arising out of the performance of their duties to the Trust. In addition, throughout the normal course of business, the Funds enter into contracts that contain a variety of representations and warranties which provide general indemnifications. The Funds’ maximum exposure under these arrangements is unknown, as this would involve future claims that may be made against the Funds and/or their affiliates that have not yet occurred. However, based on experience, the Funds expect the risk of loss to be remote.
Note 2 – Financial Instruments and Derivatives
As part of their investment strategy, the Funds utilize short sales and a variety of derivative instruments. These investments involve, to varying degrees, elements of market risk and risks in excess of amounts recognized in the Statements of Assets and Liabilities. Valuation and accounting treatment of these instruments can be found under Significant Accounting Policies in Note 1 of these Notes to Financial Statements.
Short Sales
A short sale is a transaction in which a Fund sells a security it does not own. If the security sold short decreases in price between the time the Fund sells the security and closes its short position, the Fund will realize a gain on the transaction. Conversely, if the security increases in price during the period, the Fund will realize a loss on the transaction. The risk of such price increases is the principal risk of engaging in short sales.
Derivatives
Derivatives are instruments whose values depend on, or are derived from, in whole or in part, the value of one or more other assets, such as securities, currencies, commodities or indices. Derivative instruments may be used to increase investment flexibility (including to maintain cash reserves while maintaining exposure to certain other assets), for risk management (hedging) purposes, to facilitate trading, to reduce transaction costs and to pursue higher investment returns. Derivative instruments may also be used to mitigate certain investment risks, such as foreign currency exchange rate risk, interest rate risk and credit risk. U.S. GAAP requires disclosures to enable investors to better understand how and why a Fund uses derivative instruments, how these derivative instruments are accounted for and their effects on the Fund’s financial position and results of operations.
The Funds may utilize derivatives for the following purposes:
Hedge: an investment made in order to reduce the risk of adverse price movements in a security, by taking an offsetting position to protect against broad market moves.
Index Exposure: the use of an instrument to obtain exposure to a listed or other type of index.
Leverage: gaining total exposure to equities or other assets on the long and short sides at greater than 100% of invested capital.
For any Fund whose investment strategy consistently involves applying leverage, the value of the Fund’s shares will tend to increase or decrease more than the value of any increase or decrease in the underlying index or other asset. In addition, because an investment in derivative instruments generally requires a small investment relative to the amount of investment exposure assumed, an opportunity for increased net income is created; but, at the same time, leverage risk will increase. The Fund’s use of leverage, through borrowings or instruments such as derivatives, may cause the Fund to be more volatile and riskier than if they had not been leveraged.
122 | THE GUGGENHEIM FUNDS ANNUAL REPORT | |
NOTES TO FINANCIAL STATEMENTS (continued) |
Futures Contracts
A futures contract is an agreement to purchase (long) or sell (short) an agreed amount of securities or other instruments at a set price for delivery at a future date. There are significant risks associated with a Fund’s use of futures contracts, including (i) there may be an imperfect or no correlation between the changes in market value of the underlying asset and the prices of futures contracts; (ii) there may not be a liquid secondary market for a futures contract; (iii) trading restrictions or limitations may be imposed by an exchange; and (iv) government regulations may restrict trading in futures contracts. When investing in futures, there is minimal counterparty credit risk to a Fund because futures are exchange-traded and the exchange’s clearinghouse, as counterparty to all exchange-traded futures, guarantees against default. Cash deposits are shown as segregated cash with broker on the Statements of Assets and Liabilities; securities held as collateral are noted on the Schedules of Investments.
The following table represents the Funds’ use and volume of futures on a monthly basis:
| | | | Average Notional Amount | |
Fund | Use | | Long | | | Short | |
StylePlus—Large Core Fund | Index Exposure | | $ | 3,770,773 | | | $ | — | |
StylePlus—Mid Growth Fund | Index Exposure | | | 1,943,200 | | | | — | |
World Equity Income Fund | Hedge | | | — | | | | 7,485,981 | |
Swap Agreements
A swap is an agreement that obligates two parties to exchange a series of cash flows at specified intervals based upon or calculated by reference to changes in specified prices or rates for a specified amount of an underlying asset. When utilizing OTC swaps, a fund bears the risk of loss of the amount expected to be received under a swap agreement in the event of the default or bankruptcy of a swap agreement counterparty or if the underlying asset declines in value. Certain standardized swaps are subject to mandatory central clearing and are executed on a multi-lateral or other trade facility platform, such as a registered exchange. There is limited counterparty credit risk with respect to centrally-cleared swaps as the transaction is facilitated through a central clearinghouse, much like exchange-traded futures contracts. Upon entering into certain centrally-cleared swap transactions, the Fund is required to deposit with its clearing broker an amount of cash or securities as an initial margin. Subsequent variation margin payments or receipts are made or received by the Fund, depending on fluctuations in the fair value of the reference entity. For a fund utilizing centrally cleared swaps, the exchange bears the risk of loss resulting from a counterparty not being able to pay. There is no guarantee that a fund or an underlying fund could eliminate its exposure under an outstanding swap agreement by entering into an offsetting swap agreement with the same or another party.
Total return and custom basket swaps involve commitments where single or multiple cash flows are exchanged based on the price of an underlying reference asset (such as an index or custom basket of securities) for a fixed or variable interest rate. Total return and custom basket swaps will usually be computed based on the current value of the reference asset as of the close of regular trading on the NYSE or other exchange, with the swap value being adjusted to include dividends accrued, financing charges and/or interest associated with the swap agreement. When utilizing total return or custom basket swaps, a fund bears the risk of loss of the amount expected to be received under a swap agreement in the event of the default or bankruptcy of a swap agreement counterparty or if the underlying reference asset declines in value.
The following table represents the Funds’ use and volume of total return and custom basket swaps on a monthly basis:
| | | | Average Notional Amount | |
Fund | Use | | Long | | | Short | |
Alpha Opportunity Fund | Hedge, Leverage | | $ | 38,064,416 | | | $ | 116,927,312 | |
Market Neutral Real Estate Fund | Leverage | | | — | | | | 6,786,932 | |
Risk Managed Real Estate Fund | Leverage | | | 48,273,646 | | | | 47,769,173 | |
StylePlus—Large Core Fund | Index Exposure | | | 158,716,808 | | | | — | |
StylePlus—Mid Growth Fund | Index Expsoure | | | 67,416,935 | | | | — | |
| | THE GUGGENHEIM FUNDS ANNUAL REPORT | 123 |
NOTES TO FINANCIAL STATEMENTS (continued) |
Derivative Investment Holdings Categorized by Risk Exposure
The following is a summary of the location of derivative investments on the Funds’ Statements of Assets and Liabilities as of September 30, 2019:
Derivative Investment Type | Asset Derivatives | Liability Derivatives |
Equity/Currency contracts | Variation margin on futures contracts | Variation margin on futures contracts |
Equity contracts | Unrealized appreciation on OTC swap agreements | Unrealized depreciation on OTC swap agreements |
The following table sets forth the fair value of the Funds’ derivative investments categorized by primary risk exposure at September 30, 2019:
Asset Derivative Investments Value |
Fund | | Futures
Equity
Risk* | | | Swaps
Equity
Risk | | | Futures
Currency
Risk* | | | Total Value at
September 30,
2019 | |
Alpha Opportunity Fund | | $ | — | | | $ | 396,412 | | | $ | — | | | $ | 396,412 | |
Risk Managed Real Estate Fund | | | — | | | | 4,024,685 | | | | — | | | | 4,024,685 | |
World Equity Income Fund | | | — | | | | — | | | | 10,393 | | | | 10,393 | |
Liability Derivative Investments Value |
Fund | | Futures
Equity
Risk* | | | Swaps
Equity
Risk | | | Futures
Currency
Risk* | | | Total Value at
September 30,
2019 | |
Alpha Opportunity Fund | | $ | — | | | $ | 2,664,079 | | | $ | — | | | $ | 2,664,079 | |
Market Neutral Real Estate Fund | | | — | | | | 270,133 | | | | — | | | | 270,133 | |
Risk Managed Real Estate Fund | | | — | | | | 1,642,237 | | | | — | | | | 1,642,237 | |
StylePlus—Large Core Fund | | | 39,215 | | | | — | | | | — | | | | 39,215 | |
StylePlus—Mid Growth Fund | | | 15,067 | | | | — | | | | — | | | | 15,067 | |
* | Includes cumulative appreciation (depreciation) of futures contracts as reported on the Schedules of Investments. Variation margin is reported within the Statements of Assets and Liabilities. |
The following is a summary of the location of derivative investments on the Funds’ Statements of Operations for the year ended September 30, 2019:
Derivative Investment Type | Location of Gain (Loss) on Derivatives |
Equity/Currency contracts | Net realized gain (loss) on futures contracts |
| Net change in unrealized appreciation (depreciation) on futures contracts |
Equity contracts | Net realized gain (loss) on swap agreements |
| Net change in unrealized appreciation (depreciation) on swap agreements |
124 | THE GUGGENHEIM FUNDS ANNUAL REPORT | |
NOTES TO FINANCIAL STATEMENTS (continued) |
The following is a summary of the Funds’ realized gain (loss) and change in unrealized appreciation (depreciation) on derivative investments recognized on the Statements of Operations categorized by primary risk exposure for the year ended September 30, 2019:
Realized Gain (Loss) on Derivative Investments Recognized on the Statements of Operations |
Fund | | Futures
Equity
Risk | | | Swaps
Equity
Risk | | | Futures
Currency
Risk | | | Total | |
Alpha Opportunity Fund | | $ | — | | | $ | (3,722,081 | ) | | $ | — | | | $ | (3,722,081 | ) |
Market Neutral Real Estate Fund | | | — | | | | (350,683 | ) | | | — | | | | (350,683 | ) |
Risk Managed Real Estate Fund | | | — | | | | 3,143,110 | | | | — | | | | 3,143,110 | |
StylePlus—Large Core Fund | | | (524,530 | ) | | | 2,027,836 | | | | — | | | | 1,503,306 | |
StylePlus—Mid Growth Fund | | | (176,444 | ) | | | 1,464,999 | | | | — | | | | 1,288,555 | |
World Equity Income Fund | | | — | | | | — | | | | (103,726 | ) | | | (103,726 | ) |
Change in Unrealized Appreciation (Depreciation) on Derivative Investments Recognized on the Statements of Operations |
Fund | | Futures
Equity
Risk | | | Swaps
Equity
Risk | | | Futures
Currency
Risk | | | Total | |
Alpha Opportunity Fund | | $ | — | | | $ | 7,578,832 | | | $ | — | | | $ | 7,578,832 | |
Market Neutral Real Estate Fund | | | — | | | | (354,351 | ) | | | — | | | | (354,351 | ) |
Risk Managed Real Estate Fund | | | — | | | | 665,617 | | | | — | | | | 665,617 | |
StylePlus—Large Core Fund | | | (48,219 | ) | | | (995,558 | ) | | | — | | | | (1,043,777 | ) |
StylePlus—Mid Growth Fund | | | (14,760 | ) | | | 297,228 | | | | — | | | | 282,468 | |
World Equity Income Fund | | | — | | | | — | | | | (14,632 | ) | | | (14,632 | ) |
In conjunction with short sales and the use of derivative instruments, the Funds are required to maintain collateral in various forms. Depending on the financial instrument utilized and the broker involved, the Funds use margin deposits at the broker, cash and/or securities segregated at the custodian bank, discount notes or repurchase agreements allocated to the Funds as collateral.
Foreign Investments
There are several risks associated with exposure to foreign currencies, foreign issuers and emerging markets. A fund’s indirect and direct exposure to foreign currencies subjects the Fund to the risk that those currencies will decline in value relative to the U.S. dollar, or in the case of short positions, that the U.S. dollar will decline in value relative to the currency being hedged. Currency rates in foreign countries may fluctuate significantly over short periods of time for a number of reasons, including changes in interest rates and the imposition of currency controls or other political developments in the U.S. or abroad. In addition, the Fund may incur transaction costs in connection with conversions between various currencies. The Fund may, but is not obligated to, engage in currency hedging transactions, which generally involve buying currency forward, options or futures contracts. However, not all currency risks may be effectively hedged, and in some cases the costs of hedging techniques may outweigh expected benefits. In such instances, the value of securities denominated in foreign currencies can change significantly when foreign currencies strengthen or weaken relative to the U.S. dollar.
The Funds may invest in securities of foreign companies directly, or in financial instruments, such as ADRs and exchange-traded funds, which are indirectly linked to the performance of foreign issuers. Foreign markets can be more volatile than the U.S. market due to increased risks of adverse issuer, political, regulatory, market, or economic developments and can perform differently from the U.S. market. Investing in securities of foreign companies directly, or in financial instruments that are indirectly linked to the performance of foreign issuers, may involve risks not typically associated with investing in U.S. issuers. The value of securities denominated in foreign currencies, and of dividends from such securities, can change significantly when foreign currencies strengthen or weaken relative to the U.S. dollar. Foreign securities markets generally have less trading volume and less liquidity than U.S. markets, and prices in some foreign markets may fluctuate more than those of securities traded on U.S. markets. Many foreign countries lack accounting and disclosure standards comparable to those that apply to U.S. companies, and it may be more difficult to obtain reliable information regarding a foreign issuer’s financial condition and operations. Transaction costs and costs associated with custody services are generally higher for foreign securities than they are for U.S. securities. Some foreign governments levy withholding taxes against dividend and interest income. Although in some countries portions of these taxes are recoverable, the non-recovered portion will reduce the income received by the Fund.
| | THE GUGGENHEIM FUNDS ANNUAL REPORT | 125 |
NOTES TO FINANCIAL STATEMENTS (continued) |
The Trust has established counterparty credit guidelines and enters into transactions only with financial institutions of investment grade or better. The Trust monitors the counterparty credit risk.
Note 3 – Offsetting
In the normal course of business, the Funds enter into transactions subject to enforceable master netting arrangements or other similar arrangements. Generally, the right to offset in those agreements allows the Funds to counteract the exposure to a specific counterparty with collateral received from or delivered to that counterparty based on the terms of the arrangements. These arrangements provide for the right to liquidate upon the occurrence of an event of default, credit event upon merger or additional termination event.
In order to better define their contractual rights and to secure rights that will help the Funds mitigate their counterparty risk, the Funds may enter into an International Swaps and Derivatives Association, Inc. Master Agreement (“ISDA Master Agreement”) or similar agreement with their derivative contract counterparties. An ISDA Master Agreement is a bilateral agreement between a fund and a counterparty that governs OTC derivatives, including foreign exchange contracts, and typically contains, among other things, collateral posting terms and netting provisions in the event of a default and/or termination event. The provisions of the ISDA Master Agreement typically permit a single net payment in the event of a default (close-out netting) or similar event, including the bankruptcy or insolvency of the counterparty.
For derivatives traded under an ISDA Master Agreement, the collateral requirements are typically calculated by netting the mark-to-market amount for each transaction under such agreement and comparing that amount to the value of any collateral currently pledged by the Funds and the counterparty. For financial reporting purposes, cash collateral that has been pledged to cover obligations of the Funds and cash collateral received from the counterparty, if any, are reported separately on the Statements of Assets and Liabilities as segregated cash with broker/receivable for variation margin, or payable for swap settlement/variation margin. Cash and/or securities pledged or received as collateral by the Funds in connection with an OTC derivative subject to an ISDA Master Agreement generally may not be invested, sold or rehypothecated by the counterparty or the Funds, as applicable, absent an event of default under such agreement, in which case such collateral generally may be applied towards obligations due to and payable by such counterparty or the Funds, as applicable. Generally, the amount of collateral due from or to a counterparty must exceed a minimum transfer amount threshold (e.g., $300,000) before a transfer is required to be made. To the extent amounts due to the Funds from their counterparties are not fully collateralized, contractually or otherwise, the Funds bear the risk of loss from counterparty nonperformance. The Funds attempt to mitigate counterparty risk by only entering into agreements with counterparties that they believe to be of good standing and by monitoring the financial stability of those counterparties.
For financial reporting purposes, the Funds do not offset derivative assets and derivative liabilities that are subject to netting arrangements in the Statements of Assets and Liabilities.
The following tables present derivative financial instruments and secured financing transactions that are subject to enforceable netting arrangements:
| | | | | | | | | | | | | | | | Gross Amounts Not Offset
in the Statements of
Assets and Liabilities | | | | | |
Fund | Instrument | | Gross
Amounts of
Recognized
Assets1 | | | Gross
Amounts
Offset in the
Statements
of Assets and
Liabilities | | | Net Amount
of Assets
Presented on
the Statements
of Assets and
Liabilities | | | Financial
Instruments | | | Cash
Collateral
Received | | | Net
Amount | |
Alpha Opportunity Fund | Custom basket swap agreements | | $ | 396,412 | | | $ | — | | | $ | 396,412 | | | $ | (396,412 | ) | | $ | — | | | $ | — | |
Risk Managed Real Estate Fund | Custom basket swap agreements | | | 4,024,685 | | | | — | | | | 4,024,685 | | | | (1,642,237 | ) | | | (10,000 | ) | | | 2,372,448 | |
126 | THE GUGGENHEIM FUNDS ANNUAL REPORT | |
NOTES TO FINANCIAL STATEMENTS (continued) |
| | | | | | | | | | | | | | | | Gross Amounts Not Offset
in the Statements of
Assets and Liabilities | | | | | |
Fund | Instrument | | Gross
Amounts of
Recognized
Liabilities1 | | | Gross
Amounts
Offset in the
Statements
of Assets and
Liabilities | | | Net Amount
of Liabilities
Presented on
the Statements
of Assets and
Liabilities | | | Financial
Instruments | | | Cash
Collateral
Pledged | | | Net
Amount | |
Alpha Opportunity Fund | Custom basket swap agreements | | $ | 2,664,079 | | | $ | — | | | $ | 2,664,079 | | | $ | (2,664,079 | ) | | $ | — | | | $ | — | |
Market Neutral Real Estate Fund | Custom basket swap agreements | | | 270,133 | | | | — | | | | 270,133 | | | | (270,133 | ) | | | — | | | | — | |
Risk Managed Real Estate Fund | Custom basket swap agreements | | | 1,642,237 | | | | — | | | | 1,642,237 | | | | (1,642,237 | ) | | | — | | | | — | |
1 | Exchange-traded or centrally-cleared derivatives are excluded from these reported amounts. |
The Funds have the right to offset deposits against any related derivative liabilities outstanding with each counterparty with the exception of exchange-traded or centrally-cleared derivatives. The following table presents deposits held by others in connection with derivative investments as of September 30, 2019.
Fund | Counterparty/
Clearing Agent | Asset Type | | Cash Pledged | | | Cash Received | |
Risk Managed Real Estate Fund | Morgan Stanley | Custom basket swap agreements | | $ | — | | | $ | 10,000 | |
StylePlus—Large Core Fund | Morgan Stanley | Futures contracts | | | 163,800 | | | | — | |
| Wells Fargo | Total return swap agreements | | | — | | | | 2,130,000 | |
StylePlus—Large Core Fund Total | | | | | 163,800 | | | | 2,130,000 | |
StylePlus—Mid Growth Fund | Morgan Stanley | Futures contracts | | | 63,000 | | | | — | |
| Wells Fargo | Total return swap agreements | | | — | | | | 750,000 | |
StylePlus—Mid Growth Fund Total | | | | | 63,000 | | | | 750,000 | |
Note 4 – Fair Value Measurement
In accordance with U.S. GAAP, fair value is defined as the price that the Funds would receive to sell an investment or pay to transfer a liability in an orderly transaction with an independent buyer in the principal market, or in the absence of a principal market, the most advantageous market for the investment or liability. U.S. GAAP establishes a three-tier fair value hierarchy based on the types of inputs used to value assets and liabilities and requires corresponding disclosure. The hierarchy and the corresponding inputs are summarized below:
Level 1 — | quoted prices in active markets for identical assets or liabilities. |
Level 2 — | significant other observable inputs (for example quoted prices for securities that are similar based on characteristics such as interest rates, prepayment speeds, credit risk, etc.). |
Level 3 — | significant unobservable inputs based on the best information available under the circumstances, to the extent observable inputs are not available, which may include assumptions. |
The types of inputs available depend on a variety of factors, such as the type of security and the characteristics of the markets in which it trades, if any. Fair valuation determinations that rely on fewer or no observable inputs require greater judgment. Accordingly, fair value determinations for Level 3 securities require the greatest amount of judgment.
| | THE GUGGENHEIM FUNDS ANNUAL REPORT | 127 |
NOTES TO FINANCIAL STATEMENTS (continued) |
The inputs or methodologies used for valuing securities are not necessarily an indication of the risk associated with investing in those securities. The suitability of the techniques and sources employed to determine fair valuation are regularly monitored and subject to change.
Note 5 – Investment Advisory Agreement and Other Agreements
Under the terms of an investment advisory contract, the Funds pay GI investment advisory fees calculated at the annualized rates below, based on the average daily net assets of the Funds:
Fund | | Management Fees
(as a % of Net Assets) | |
Alpha Opportunity Fund | | | 0.90 | % |
Large Cap Value Fund | | | 0.65 | % |
Market Neutral Real Estate Fund | | | 1.10 | % |
Risk Managed Real Estate Fund | | | 0.75 | % |
Small Cap Value Fund | | | 0.75 | % |
StylePlus—Large Core Fund | | | 0.75 | % |
StylePlus—Mid Growth Fund | | | 0.75 | % |
World Equity Income Fund | | | 0.70 | % |
GI engages external service providers to perform other necessary services for the Trust, such as audit and accounting related services, legal services, custody, printing and mailing, etc., on a pass-through basis. Such expenses are allocated to various Funds within the complex based on relative net assets.
The Funds have adopted Distribution Plans related to the offering of A-Class, C-Class and P-Class shares pursuant to Rule 12b-1 under the 1940 Act. The plans provide for payments at an annual rate of 0.25% of the average daily net assets of the Fund’s A-Class and P-Class shares, and 1.00% of the average daily net assets of the Fund’s C-Class shares.
Contractual expense limitation agreements for the following Funds provide that the total expenses be limited to a percentage of average net assets for each class of shares, exclusive of brokerage costs, dividends on securities sold short, expenses of other investment companies in which a Fund invests, interest, taxes, litigation, indemnification and extraordinary expenses. The limits are listed below:
| | Limit | | | Effective
Date | | | Contract
End Date | |
Alpha Opportunity Fund – A-Class | | | 1.76 | % | | | 05/31/17 | | | | 02/01/21 | |
Alpha Opportunity Fund – C-Class | | | 2.51 | % | | | 05/31/17 | | | | 02/01/21 | |
Alpha Opportunity - P-Class | | | 1.76 | % | | | 05/31/17 | | | | 02/01/21 | |
Alpha Opportunity Fund – Institutional Class | | | 1.51 | % | | | 05/31/17 | | | | 02/01/21 | |
Large Cap Value Fund – A-Class | | | 1.15 | % | | | 11/30/12 | | | | 02/01/21 | |
Large Cap Value Fund – C-Class | | | 1.90 | % | | | 11/30/12 | | | | 02/01/21 | |
Large Cap Value Fund – P-Class | | | 1.15 | % | | | 05/01/15 | | | | 02/01/21 | |
Large Cap Value Fund – Institutional Class | | | 0.90 | % | | | 06/05/13 | | | | 02/01/21 | |
Market Neutral Real Estate Fund – A-Class | | | 1.65 | % | | | 02/26/16 | | | | 02/01/21 | |
Market Neutral Real Estate Fund – C-Class | | | 2.40 | % | | | 02/26/16 | | | | 02/01/21 | |
Market Neutral Real Estate Fund – P-Class | | | 1.65 | % | | | 02/26/16 | | | | 02/01/21 | |
Market Neutral Real Estate Fund – Institutional Class | | | 1.40 | % | | | 02/26/16 | | | | 02/01/21 | |
Risk Managed Real Estate Fund – A-Class | | | 1.30 | % | | | 03/26/14 | | | | 02/01/21 | |
Risk Managed Real Estate Fund – C-Class | | | 2.05 | % | | | 03/26/14 | | | | 02/01/21 | |
Risk Managed Real Estate Fund – P-Class | | | 1.30 | % | | | 05/01/15 | | | | 02/01/21 | |
Risk Managed Real Estate Fund – Institutional Class | | | 1.10 | % | | | 03/26/14 | | | | 02/01/21 | |
Small Cap Value Fund – A-Class | | | 1.30 | % | | | 11/30/12 | | | | 02/01/21 | |
Small Cap Value Fund – C-Class | | | 2.05 | % | | | 11/30/12 | | | | 02/01/21 | |
Small Cap Value Fund – P-Class | | | 1.30 | % | | | 05/01/15 | | | | 02/01/21 | |
Small Cap Value Fund – Institutional Class | | | 1.05 | % | | | 11/30/12 | | | | 02/01/21 | |
World Equity Income Fund – A-Class | | | 1.22 | % | | | 08/15/13 | | | | 02/01/21 | |
World Equity Income Fund – C-Class | | | 1.97 | % | | | 08/15/13 | | | | 02/01/21 | |
World Equity Income Fund – P-Class | | | 1.22 | % | | | 05/01/15 | | | | 02/01/21 | |
World Equity Income Fund – Institutional Class | | | 0.97 | % | | | 08/15/13 | | | | 02/01/21 | |
128 | THE GUGGENHEIM FUNDS ANNUAL REPORT | |
NOTES TO FINANCIAL STATEMENTS (continued) |
GI is entitled to reimbursement by the Funds for fees waived or expenses reimbursed during any of the previous 36 months, beginning on the date of the expense limitation agreement, if on any day the estimated operating expenses are less than the indicated percentages. For purposes of this arrangement, GI is entitled to recoupment of previously waived fees or reimbursed expenses for 36 months from the date of the waiver or reimbursement by GI. At September 30, 2019, the amount of fees waived or expenses reimbursed that are subject to recoupment and will expire during the years ended September 30, are presented in the following table:
Fund | | 2020 | | | 2021 | | | 2022 | | | Total | |
Alpha Opportunity Fund | | | | | | | | | | | | | | | | |
A-Class | | $ | — | | | $ | 171 | | | $ | 677 | | | $ | 848 | |
C-Class | | | 1,244 | | | | 574 | | | | 594 | | | | 2,412 | |
P-Class | | | — | | | | — | | | | 149 | | | | 149 | |
Institutional Class | | | — | | | | — | | | | 19 | | | | 19 | |
Large Cap Value Fund | | | | | | | | | | | | | | | | |
A-Class | | | 78,038 | | | | 93,910 | | | | 86,271 | | | | 258,219 | |
C-Class | | | 6,283 | | | | 6,839 | | | | 5,745 | | | | 18,867 | |
P-Class | | | 762 | | | | 552 | | | | 654 | | | | 1,968 | |
Institutional Class | | | 1,773 | | | | 3,127 | | | | 9,093 | | | | 13,993 | |
Market Neutral Real Estate Fund | | | | | | | | | | | | | | | | |
A-Class | | | 3,417 | | | | 13,868 | | | | 61,944 | | | | 79,229 | |
C-Class | | | 4,410 | | | | 4,083 | | | | 3,045 | | | | 11,538 | |
P-Class | | | 5,860 | | | | 16,626 | | | | 6,884 | | | | 29,370 | |
Institutional Class | | | 151,686 | | | | 164,604 | | | | 115,010 | | | | 431,300 | |
Risk Managed Real Estate Fund | | | | | | | | | | | | | | | | |
A-Class | | | — | | | | — | | | | 596 | | | | 596 | |
C-Class | | | 1,084 | | | | 1,513 | | | | 741 | | | | 3,338 | |
P-Class | | | — | | | | 3,625 | | | | 2,877 | | | | 6,502 | |
Institutional Class | | | — | | | | — | | | | — | | | | — | |
Small Cap Value Fund | | | | | | | | | | | | | | | | |
A-Class | | | 71,327 | | | | 91,854 | | | | 101,616 | | | | 264,798 | |
C-Class | | | 29,870 | | | | 31,586 | | | | 21,993 | | | | 83,449 | |
P-Class | | | 336 | | | | 215 | | | | 491 | | | | 1,042 | |
Institutional Class | | | 15,554 | | | | 34,694 | | | | 35,461 | | | | 85,709 | |
World Equity Income Fund | | | | | | | | | | | | | | | | |
A-Class | | | 84,527 | | | | 111,231 | | | | 89,463 | | | | 285,221 | |
C-Class | | | 12,042 | | | | 12,493 | | | | 11,022 | | | | 35,557 | |
P-Class | | | 896 | | | | 531 | | | | 317 | | | | 1,744 | |
Institutional Class | | | 2,846 | | | | 5,983 | | | | 27,702 | | | | 36,531 | |
For the year ended September 30, 2019, GI recouped amounts from the Funds as follows:
Alpha Opportunity Fund | | $ | 10,461 | |
Large Cap Value Fund | | | 339 | |
Market Neutral Real Estate Fund | | | 1,550 | |
Risk Managed Real Estate Fund | | | 20,644 | |
Small Cap Value Fund | | | — | |
World Equity Income Fund | | | 422 | |
If a Fund invests in a fund that is advised by the same adviser or an affiliated adviser, the investing Fund’s adviser has agreed to waive fees at the investing fund level to the extent necessary to offset the proportionate share of any management fee paid by each Fund with respect to its investment in such affiliated fund. Fee waivers will be calculated at the investing Fund level without regard to any expense cap, if any, in effect for the investing Fund. Fees waived under this arrangement are not subject to reimbursement to GI. For the year ended September 30, 2019, the following Funds waived fees related to investments in affiliated funds:
Fund | | Amount Waived | |
StylePlus—Large Core Fund | | $ | 64,734 | |
StylePlus—Mid Growth Fund | | | 27,811 | |
| | THE GUGGENHEIM FUNDS ANNUAL REPORT | 129 |
NOTES TO FINANCIAL STATEMENTS (continued) |
For the year ended September 30, 2019, GFD retained sales charges of $286,511 relating to sales of A-Class shares of the Trust.
Certain trustees and officers of the Trust are also officers of GI and/or GFD. The Trust does not compensate its officers or trustees who are officers, directors and/or employees of GI or GFD.
MUFG Investor Services (US), LLC (“MUIS”) acts as the Funds’ administrator, transfer agent and accounting agent. As administrator, transfer agent and accounting agent, MUIS is responsible for maintaining the books and records of the Funds’ securities and cash. The Bank of New York Mellon Corp. (“BNY”) acts as the Funds’ custodian. As custodian, BNY is responsible for the custody of the Funds’ assets. For providing the aforementioned administrative and accounting services, MUIS is entitled to receive a monthly fee equal to a percentage of the Funds’ average daily net assets and out of pocket expenses. For providing the aforementioned transfer agent and custodian services, MUIS and BNY are entitled to receive a monthly fee based on the number of transactions during the month and the number of accounts under management, subject to certain minimum monthly fees, and out of pocket expenses.
At September 30, 2019, GI and its affiliates owned over twenty percent of the outstanding shares of the Funds, as follows
Fund | | Percent of Outstanding
Shares Owned | |
Alpha Opportunity Fund | | | 74 | % |
Market Neutral Real Estate Fund | | | 66 | % |
Note 6 – Federal Income Tax Information
The Funds intend to comply with the provisions of Subchapter M of the Internal Revenue Code applicable to regulated investment companies and will distribute substantially all taxable net investment income and capital gains sufficient to relieve the Funds from all, or substantially all, federal income, excise and state income taxes. Therefore, no provision for federal or state income tax or federal excise tax is required.
Tax positions taken or expected to be taken in the course of preparing the Funds’ tax returns are evaluated to determine whether the tax positions are “more-likely-than-not” of being sustained by the applicable tax authority. Tax positions not deemed to meet the more-likely-than-not threshold would be recorded as a tax benefit or expense in the current year. Management has analyzed the Funds’ tax positions taken, or to be taken, on U.S. federal income tax returns for all open tax years, and has concluded that no provision for income tax is required in the Funds’ financial statements. The Funds’ U.S. federal income tax returns are subject to examination by the Internal Revenue Service for a period of three years after they are filed.
The tax character of distributions paid during the year ended September 30, 2019 was as follows:
Fund | | Ordinary
Income | | | Long-Term
Capital Gain | | | Total
Distributions | |
Alpha Opportunity Fund | | $ | 2,143,337 | | | $ | — | | | $ | 2,143,337 | |
Large Cap Value Fund | | | 1,106,601 | | | | 2,342,370 | | | | 3,448,971 | |
Market Neutral Real Estate Fund | | | 68,922 | | | | 89,743 | | | | 158,665 | |
Risk Managed Real Estate Fund | | | 2,914,307 | | | | 2,618,643 | | | | 5,532,950 | |
Small Cap Value Fund | | | 159,180 | | | | 1,629,343 | | | | 1,788,523 | |
StylePlus—Large Core Fund | | | 6,372,166 | | | | 27,982,600 | | | | 34,354,766 | |
StylePlus—Mid Growth Fund | | | 2,645,647 | | | | 13,697,302 | | | | 16,342,949 | |
World Equity Income Fund | | | 1,933,062 | | | | 711,960 | | | | 2,645,022 | |
130 | THE GUGGENHEIM FUNDS ANNUAL REPORT | |
NOTES TO FINANCIAL STATEMENTS (continued) |
The tax character of distributions paid during the year ended September 30, 2018 was as follows:
Fund | | Ordinary
Income | | | Long-Term
Capital Gain | | | Total
Distributions | |
Alpha Opportunity Fund | | $ | 8,954,485 | | | $ | 2,150,783 | | | $ | 11,105,268 | |
Large Cap Value Fund | | | 2,185,587 | | | | 3,071,973 | | | | 5,257,560 | |
Market Neutral Real Estate Fund | | | 107,397 | | | | 186,509 | | | | 293,906 | |
Risk Managed Real Estate Fund | | | 6,909,847 | | | | 1,379,189 | | | | 8,289,036 | |
Small Cap Value Fund | | | 701,900 | | | | 806,822 | | | | 1,508,722 | |
StylePlus—Large Core Fund | | | 6,099,024 | | | | 29,626,914 | | | | 35,725,938 | |
StylePlus—Mid Growth Fund | | | 437,238 | | | | 9,677,260 | | | | 10,114,498 | |
World Equity Income Fund | | | 1,413,239 | | | | — | | | | 1,413,239 | |
Note: For U.S. federal income tax purposes, short-term capital gain distributions are treated as ordinary income distributions.
The tax components of distributable earnings/(loss) as of September 30, 2019 were as follows:
Fund | | Undistributed
Ordinary
Income | | | Undistributed
Long-Term
Capital Gain | | | Net Unrealized
Appreciation
(Depreciation) | | | Accumulated
Capital and
Other Losses | | | Other
Temporary
Differences | | | Total | |
Alpha Opportunity Fund | | $ | 714,049 | | | $ | — | | | $ | (1,437,555 | ) | | $ | (23,744,496 | ) | | $ | — | | | $ | (24,468,002 | ) |
Large Cap Value Fund | | | 936,171 | | | | 3,231,088 | | | | 5,536,307 | | | | — | | | | — | | | | 9,703,566 | |
Market Neutral Real Estate Fund | | | 105,833 | | | | 51,566 | | | | 700,836 | | | | — | | | | — | | | | 858,235 | |
Risk Managed Real Estate Fund | | | — | | | | 4,553,697 | | | | 36,742,167 | | | | — | | | | (902,246 | ) | | | 40,393,618 | |
Small Cap Value Fund | | | — | | | | 192,863 | | | | 5,699 | | | | — | | | | — | | | | 198,562 | |
StylePlus—Large Core Fund | | | 2,971,382 | | | | 334,010 | | | | 821,452 | | | | — | | | | — | | | | 4,126,844 | |
StylePlus—Mid Growth Fund | | | 948,765 | | | | 975,021 | | | | 329,096 | | | | — | | | | — | | | | 2,252,882 | |
World Equity Income Fund | | | 354,870 | | | | 181,361 | | | | 3,625,092 | | | | — | | | | — | | | | 4,161,323 | |
For U.S. federal income tax purposes, capital loss carryforwards represent realized losses of the Fund(s) that may be carried forward and applied against future capital gains. Under the RIC Modernization Act of 2010, the Funds are permitted to carry forward capital losses incurred in taxable years beginning after December 22, 2010 for an unlimited period and such capital loss carryforwards will retain their character as either short-term or long-term capital losses. As of September 30, 2019, capital loss carryforwards for the Fund(s) were as follows:
| | | | | | | Unlimited | | | | | |
Fund | | | | | Short-Term | | | Long-Term | | | Total
Capital Loss
Carryforward | |
Alpha Opportunity Fund | | $ | — | | | $ | (18,158,063 | ) | | $ | (5,586,433 | ) | | $ | (23,744,496 | ) |
Net investment income and net realized gains (losses) may differ for financial statement and tax purposes because of temporary or permanent book/tax differences. These differences are primarily due to investments in partnerships, foreign currency gains and losses, losses deferred due to wash sales, investments in real estate investment trusts, distributions in connection with redemption of fund shares, and the “mark-to-market,” recharacterization, or disposition of certain Passive Foreign Investment Companies (PFICs). Additional differences may result from the tax treatment of securities sold short, dividends payable, and “mark-to-market” of certain derivatives. To the extent these differences are permanent and would require a reclassification between Paid in Capital and Total Distributable Earnings (Loss), such reclassifications are made in the period that the differences arise. These reclassifications have no effect on net assets or NAV per share.
| | THE GUGGENHEIM FUNDS ANNUAL REPORT | 131 |
NOTES TO FINANCIAL STATEMENTS (continued) |
The following adjustments were made on the Statements of Assets and Liabilities as of September 30, 2019 for permanent book/tax differences:
Fund | | Paid In
Capital | | | Total
Distributable
Earnings/(Loss) | |
Large Cap Value Fund | | $ | 483,837 | | | $ | (483,837 | ) |
Market Neutral Real Estate Fund | | | 14,185 | | | | (14,185 | ) |
Risk Managed Real Estate Fund | | | 305,860 | | | | (305,860 | ) |
Small Cap Value Fund | | | 88,545 | | | | (88,545 | ) |
StylePlus—Large Core Fund | | | 1,170,284 | | | | (1,170,284 | ) |
StylePlus—Mid Growth Fund | | | 311,106 | | | | (311,106 | ) |
At September 30, 2019, the cost of investments for U.S. federal income tax purposes, the aggregate gross unrealized appreciation for all investments for which there was an excess of value over tax cost and the aggregate gross unrealized depreciation for all investments for which there was an excess of tax cost over value, were as follows:
Fund | | Tax
Cost | | | Tax
Unrealized
Appreciation | | | Tax
Unrealized
Depreciation | | | Net
Unrealized
Appreciation/
(Depreciation) | |
Alpha Opportunity Fund | | $ | 90,642,378 | | | $ | 5,542,332 | | | $ | (6,979,887 | ) | | $ | (1,437,555 | ) |
Large Cap Value Fund | | | 50,151,223 | | | | 9,290,213 | | | | (3,753,906 | ) | | | 5,536,307 | |
Market Neutral Real Estate Fund | | | 8,196,459 | | | | 1,016,168 | | | | (315,332 | ) | | | 700,836 | |
Risk Managed Real Estate Fund | | | 182,317,732 | | | | 40,827,561 | | | | (4,085,394 | ) | | | 36,742,167 | |
Small Cap Value Fund | | | 14,307,296 | | | | 1,905,231 | | | | (1,899,532 | ) | | | 5,699 | |
StylePlus—Large Core Fund | | | 199,901,968 | | | | 3,046,024 | | | | (2,224,572 | ) | | | 821,452 | |
StylePlus—Mid Growth Fund | | | 85,243,825 | | | | 1,568,996 | | | | (1,239,911 | ) | | | 329,085 | |
World Equity Income Fund | | | 63,680,492 | | | | 5,884,142 | | | | (2,256,308 | ) | | | 3,627,834 | |
Note 7 – Securities Transactions
For the year ended September 30, 2019, the cost of purchases and proceeds from sales of investment securities, excluding government securities, short-term investments and derivatives, were as follows:
Fund | | Purchases | | | Sales | |
Alpha Opportunity Fund | | $ | 146,745,840 | | | $ | 246,750,611 | |
Large Cap Value Fund | | | 21,561,466 | | | | 27,881,361 | |
Market Neutral Real Estate Fund | | | 13,088,437 | | | | 12,175,078 | |
Risk Managed Real Estate Fund | | | 269,593,856 | | | | 250,511,604 | |
Small Cap Value Fund | | | 12,180,451 | | | | 14,684,297 | |
StylePlus—Large Core Fund | | | 98,196,806 | | | | 125,195,858 | |
StylePlus—Mid Growth Fund | | | 59,737,107 | | | | 63,834,559 | |
World Equity Income Fund | | | 98,196,433 | | | | 119,329,632 | |
Note 8 – Line of Credit
The Trust, along with other affiliated trusts, secured a 364-day committed, $1,065,000,000 line of credit from Citibank, N.A., which was in place through October 5, 2018, at which time the line of credit was renewed with an increased commitment amount of $1,205,000,000. On October 4, 2019, the line of credit agreement was renewed with an increased commitment amount of $1,230,000,000. A Fund may draw (borrow) from the line of credit as a temporary measure for emergency purposes, to facilitate redemption requests, or for other short-term liquidity purposes consistent with the Fund’s investment objective and program. For example, it may be advantageous for the Fund to borrow money rather than sell existing portfolio positions to meet redemption requests. Fees related to borrowings, if any, vary under this arrangement between the greater of Citibank’s “base rate”, LIBOR plus 1%, or the federal funds rate plus 1/2 of 1%.
132 | THE GUGGENHEIM FUNDS ANNUAL REPORT | |
NOTES TO FINANCIAL STATEMENTS (concluded) |
The commitment fee that may be paid by the Funds is at an annualized rate of 0.15% of the average daily amount of their allocated unused commitment amount. The allocated commitment fee amount for each Fund is referenced in the Statement of Operations under “Line of credit fees”. The Funds did not have any borrowings under this agreement as of and for the year ended September 30, 2019.
Note 9 – Recent Regulatory Reporting Updates
In August 2018, the Financial Accounting Standards Board issued an Accounting Standards Update, ASU 2018-13, Fair Value Measurement (Topic 820), Disclosure Framework - Changes to the Disclosure Requirements for Fair Value Measurement (the “2018 ASU”) which adds, modifies and removes disclosure requirements related to certain aspects of fair value measurement. The 2018 ASU is effective for fiscal years, and interim periods within those fiscal years, beginning after December 15, 2019. Early adoption is permitted. As of September 30, 2019, the Funds have fully adopted the provisions of the 2018 ASU, which did not have a material impact on the Funds’ financial statements and related disclosures or impact the Funds’ net assets or results of operations.
Note 10 – Other Liabilities
StylePlus—Large Core Fund wrote put option contracts through Lehman Brothers Inc., (“LBI”) that were exercised prior to the option contracts’ expiration and prior to the bankruptcy filing by LBI, during September 2008. However, these transactions have not settled and the securities have not been delivered to the Fund as of September 30, 2019.
Although the ultimate resolution of these transactions is uncertain, the Fund has recorded a liability equal to the difference between the strike price on the put options and the market price of the underlying security on the exercise date. The amount of the liability recorded in miscellaneous payables by the Fund as of September 30, 2019, was $18,615.
Note 11 – Large Shareholder Risk
As of September 30, 2019, 73.6% of the Alpha Opportunity Fund (the “Fund”) was held by Guggenheim Macro Opportunities Fund. The Fund may experience adverse effects if a large number of shares of the Fund are held by a single shareholder (e.g., an institutional investor, financial intermediary or another GI Fund). The Fund is subject to the risk that a redemption by those shareholders of all or a large portion of the Fund could cause the Fund to liquidate its assets at inopportune times, or at a loss or depressed value, which could adversely impact the Fund’s performance and cause the value of a shareholder’s investment to decline. Redemptions of a large number of shares also may increase transaction costs or, by necessitating a sale of portfolio securities, have adverse tax consequences for shareholders. They also potentially limit the use of any capital loss carryforwards and certain other losses to offset future realized capital gains (if any) and may limit or prevent a Fund’s use of tax equalization.
Note 12 – Subsequent Events
The Funds evaluated subsequent events through the date the financial statements were available for issue and determined there were no material events that would require adjustment to or disclosure in the Funds’ financial statements.
| | THE GUGGENHEIM FUNDS ANNUAL REPORT | 133 |
REPORT OF INDEPENDENT REGISTERED PUBLIC ACCOUNTING FIRM |
To the Shareholders of Guggenheim Alpha Opportunity Fund, Guggenheim Large Cap Value Fund, Guggenheim Market Neutral Real Estate Fund, Guggenheim Risk Managed Real Estate Fund, Guggenheim Small Cap Value Fund, Guggenheim StylePlus-Large Core Fund, Guggenheim StylePlus-Mid Growth Fund and Guggenheim World Equity Income Fund and the Board of Trustees of Guggenheim Funds Trust
Opinion on the Financial Statements
We have audited the accompanying statements of assets and liabilities of Guggenheim Alpha Opportunity Fund, Guggenheim Large Cap Value Fund, Guggenheim Market Neutral Real Estate Fund, Guggenheim Risk Managed Real Estate Fund, Guggenheim Small Cap Value Fund, Guggenheim StylePlus-Large Core Fund, Guggenheim StylePlus-Mid Growth Fund and Guggenheim World Equity Income Fund (collectively referred to as the “Funds”) (eight of the funds constituting Guggenheim Funds Trust (the “Trust”)), including the schedules of investments, as of September 30, 2019, and the related statements of operations and changes in net assets, and the financial highlights for each of the periods indicated in the table below and the related notes (collectively referred to as the “financial statements”). In our opinion, the financial statements present fairly, in all material respects, the financial position of each of the Funds (eight of the funds constituting Guggenheim Funds Trust) at September 30, 2019, and the results of their operations, changes in net assets and financial highlights for each of the periods indicated in the table below, in conformity with U.S. generally accepted accounting principles.
Individual Fund constituting the
Guggenheim Funds Trust | Statement of
operations | Statements of
changes in net assets | Financial highlights |
Guggenheim Alpha Opportunities Fund Guggenheim Large Cap Value Fund Guggenheim Small Cap Value Fund Guggenheim StylePlus-Large Core Fund Guggenheim StylePlus-Mid Growth Fund Guggenheim World Equity Income Fund Guggenheim Risk Managed Real Estate Fund | For the year ended September 30, 2019 | For each of the two years in the period ended September 30, 2019 | For each of the five years in the period ended September 30, 2019 |
Guggenheim Market Neutral Real Estate Fund | For the year ended September 30, 2019 | For each of the two years in the period ended September 30, 2019 | For each of the three years in the period ended September 30, 2019 and the period from February 26, 2016 (commencement of operations) through September 30, 2016 |
Basis for Opinion
These financial statements are the responsibility of the Trust’s management. Our responsibility is to express an opinion on each of the Funds’ financial statements based on our audits. We are a public accounting firm registered with the Public Company Accounting Oversight Board (United States) (“PCAOB”) and are required to be independent with respect to the Trust in accordance with the U.S. federal securities laws and the applicable rules and regulations of the Securities and Exchange Commission and the PCAOB.
We conducted our audits in accordance with the standards of the PCAOB. Those standards require that we plan and perform the audit to obtain reasonable assurance about whether the financial statements are free of material misstatement, whether due to error or fraud. The Trust is not required to have, nor were we engaged to perform, an audit of the Trust’s internal control over financial reporting. As part of our audits, we are required to obtain an understanding of internal control over financial reporting, but not for the purpose of expressing an opinion on the effectiveness of the Trust’s internal control over financial reporting. Accordingly, we express no such opinion.
Our audits included performing procedures to assess the risks of material misstatement of the financial statements, whether due to error or fraud, and performing procedures that respond to those risks. Such procedures included examining, on a test basis, evidence regarding the amounts and disclosures in the financial statements. Our procedures included confirmation of securities owned as of September 30, 2019, by
134 | THE GUGGENHEIM FUNDS ANNUAL REPORT | |
REPORT OF INDEPENDENT REGISTERED PUBLIC ACCOUNTING FIRM (concluded) |
correspondence with the custodian, transfer agent, and brokers or by other appropriate auditing procedures where replies from brokers were not received. Our audits also included evaluating the accounting principles used and significant estimates made by management, as well as evaluating the overall presentation of the financial statements. We believe that our audits provide a reasonable basis for our opinion.

We have served as the auditor of one or more Guggenheim investment companies since 1979.
Tysons, Virginia
November 26, 2019
| | THE GUGGENHEIM FUNDS ANNUAL REPORT | 135 |
OTHER INFORMATION (Unaudited) |
Federal Income Tax Information
This information is being provided as required by the Internal Revenue Code. Amounts shown may differ from those elsewhere in the report because of differences in tax and financial reporting practice.
In January 2020, shareholders will be advised on IRS Form 1099 DIV or substitute 1099 DIV as to the federal tax status of the distributions received by shareholders in the calendar year 2019.
The Funds’ investment income (dividend income plus short-term gains, if any) qualifies as follows:
Of the taxable ordinary income distributions paid during the fiscal year ending September 30, 2019, the following funds had the corresponding percentages qualify for the reduced tax rate pursuant to the Jobs and Growth Tax Relief and Reconciliation Act of 2003 or for the dividends received deduction for corporations. See the qualified dividend income and dividend received deduction columns, respectively, in the table below.
Additionally, of the taxable ordinary income distributions paid during the fiscal year ended September 30, 2019, the following funds had the corresponding percentages qualify as interest related dividends and qualified short-term capital gains as permitted by IRC Section 871(k)(1) and IRC Section 871(k)(2), respectively. See qualified interest income and qualified short-term capital gain columns, respectively, in the table below.
Fund | | Qualified
Dividend
Income | | | Dividend
Received
Deduction | | | Qualified
Interest
Income | | | Qualified
Short-Term
Capital Gain | |
Alpha Opportunity Fund | | | 100.00 | % | | | 100.00 | % | | | 0.00 | % | | | 0.00 | % |
Large Cap Value Fund | | | 100.00 | % | | | 100.00 | % | | | 0.00 | % | | | 100.00 | % |
Market Neutral Real Estate Fund | | | 8.26 | % | | | 8.26 | % | | | 0.00 | % | | | 0.00 | % |
Risk Managed Real Estate Fund | | | 9.16 | % | | | 9.34 | % | | | 6.02 | % | | | 0.00 | % |
Small Cap Value Fund | | | 97.31 | % | | | 96.88 | % | | | 2.17 | % | | | 100.00 | % |
StylePlus—Large Core Fund | | | 15.09 | % | | | 15.23 | % | | | 0.00 | % | | | 100.00 | % |
StylePlus—Mid Growth Fund | | | 10.58 | % | | | 10.57 | % | | | 0.00 | % | | | 100.00 | % |
World Equity Income Fund | | | 100.00 | % | | | 58.24 | % | | | 0.00 | % | | | 0.00 | % |
With respect to the taxable year ended September 30, 2019, the Funds hereby designate as capital gain dividends the amounts listed below, or, if subsequently determined to be different, the net capital gain of such year:
Fund | | From long-term
capital gain: | | | From long-term capital
gain, using proceeds
from shareholder
redemptions: | |
Large Cap Value Fund | | $ | 2,342,370 | | | $ | 474,685 | |
Market Neutral Real Estate Fund | | | 89,743 | | | | 13,840 | |
Risk Managed Real Estate Fund | | | 2,618,643 | | | | 305,859 | |
Small Cap Value Fund | | | 1,629,343 | | | | 88,545 | |
StylePlus—Large Core Fund | | | 27,982,600 | | | | 1,170,284 | |
StylePlus—Mid Growth Fund | | | 13,697,302 | | | | 310,311 | |
World Equity Income Fund | | | 711,960 | | | | — | |
Proposed regulations dated January 18, 2019 enable a regulated investment company to pay Section 199A dividends to its shareholders. Section 199A, enacted as part of the Tax Cuts and Jobs Act of 2017, may allow non-corporate tax payers a deduction of up to 20% of qualified business income from flow-through entities, including dividends from real estate investment trusts. The qualifying percentage of the Fund’s ordinary income and short-term capital gain distributions, if any, for the purposes of the Section 199A deduction was 43.72% for Market Neutral Real Estate Fund and 90.83% for Risk Managed Real Estate Fund.
136 | THE GUGGENHEIM FUNDS ANNUAL REPORT | |
OTHER INFORMATION (Unaudited)(continued) |
Proxy Voting Information
A description of the policies and procedures that the Trust uses to determine how to vote proxies relating to securities held in the Funds’ portfolios is available, without charge and upon request, by calling 800.820.0888. This information is also available from the EDGAR database on the SEC’s website at https://www.sec.gov.
Information regarding how the Funds voted proxies relating to portfolio securities during the most recent 12-month period ended June 30 is available without charge, upon request, by calling 800.820.0888. This information is also available from the EDGAR database on the SEC’s website at https://www.sec.gov.
Special Meeting of Shareholders — Voting Results
A joint special meeting of shareholders of the Trust was held on October 28, 2019 to elect the following ten nominees to the Board of Trustees of the Trust: Randall C. Barnes, Angela Brock-Kyle, Donald A. Chubb, Jr., Jerry B. Farley, Roman Friedrich III, Thomas F. Lydon, Jr., Ronald A. Nyberg, Sandra G. Sponem, Ronald E. Toupin, Jr. and Amy J. Lee. At the meeting, the following votes were recorded:
Nominee | | Shares For | | | Shares Withheld | |
Randall C. Barnes | | | 919,263,831 | | | | 7,335,759 | |
Angela Brock-Kyle | | | 919,775,822 | | | | 6,823,768 | |
Donald A. Chubb, Jr. | | | 915,120,874 | | | | 11,478,716 | |
Jerry B. Farley | | | 915,377,483 | | | | 11,222,107 | |
Roman Friedrich III | | | 918,807,442 | | | | 7,792,148 | |
Thomas F. Lydon, Jr. | | | 919,122,642 | | | | 7,476,948 | |
Ronald A. Nyberg | | | 918,889,679 | | | | 7,709,911 | |
Sandra G. Sponem | | | 919,600,708 | | | | 6,998,882 | |
Ronald E. Toupin, Jr. | | | 919,043,208 | | | | 7,556,382 | |
Amy J. Lee | | | 919,943,855 | | | | 6,655,735 | |
Sector Classification
Information in the “Schedule of Investments” is categorized by sectors using sector-level Classifications defined by the Bloomberg Industry Classification System, a widely recognized industry classification system provider. Each Fund’s registration statement has investment policies relating to concentration in specific sectors/industries. For purposes of these investment policies, the Funds usually classify sectors/industries based on industry-level Classifications used by widely recognized industry classification system providers such as Bloomberg Industry Classification System, Global Industry Classification Standards and Barclays Global Classification Scheme.
Quarterly Portfolio Schedules Information
The Trust files its complete schedule of portfolio holdings with the SEC for the first and third quarters of each fiscal year as an exhibit to its reports on Form N-PORT, and for reporting periods ended prior to March 31, 2019, filed such information on Form N-Q. The Funds’ Forms N-PORT and N-Q are available on the SEC’s website at https://www.sec.gov. The Funds’ Forms N-PORT and N-Q may be reviewed and copied at the SEC’s Public Reference Room in Washington, DC, and that information on the operation of the Public Reference Room may be obtained by calling 800-SEC-0330. Copies of the portfolio holdings are also available to shareholders, without charge and upon request, by calling 800.820.0888.
| | THE GUGGENHEIM FUNDS ANNUAL REPORT | 137 |
OTHER INFORMATION (Unaudited)(continued) |
Report of the Guggenheim Funds Trust Contracts Review Committee
Guggenheim Funds Trust (the “Trust”) was organized as a Delaware statutory trust on November 8, 2013, and is registered as an open-end management investment company under the Investment Company Act of 1940, as amended (the “1940 Act”). The Trust includes the following series:
● Guggenheim Alpha Opportunity Fund (“Alpha Opportunity Fund”) ● Guggenheim Diversified Income Fund (“Diversified Income Fund”) ● Guggenheim High Yield Fund (“High Yield Fund”) ● Guggenheim Large Cap Value Fund (“Large Cap Value Fund”) ● Guggenheim Macro Opportunities Fund (“Macro Opportunities Fund”) ● Guggenheim SMid Cap Value Fund (“SMid Cap Value Fund”) ● Guggenheim Municipal Income Fund (“Municipal Income Fund”) ● Guggenheim Small Cap Value Fund (“Small Cap Value Fund”) ● Guggenheim StylePlus—Mid Growth Fund (“StylePlus—Mid Growth Fund”) ● Guggenheim Ultra Short Duration Fund (“Ultra Short Duration Fund”) | ● Guggenheim Capital Stewardship Fund (“Capital Stewardship Fund”) ● Guggenheim Floating Rate Strategies Fund (“Floating Rate Strategies Fund”) ● Guggenheim Investment Grade Bond Fund (“Investment Grade Bond Fund”) ● Guggenheim Limited Duration Fund (“Limited Duration Fund”) ● Guggenheim Market Neutral Real Estate Fund (“Market Neutral Real Estate Fund”) ● Guggenheim SMid Cap Value Institutional Fund (“SMid Cap Value Institutional Fund”) ● Guggenheim Risk Managed Real Estate Fund (“Risk Managed Real Estate Fund”) ● Guggenheim StylePlus—Large Core Fund (“StylePlus—Large Core Fund”) ● Guggenheim Total Return Bond Fund (“Total Return Bond Fund”) ● Guggenheim World Equity Income Fund (“World Equity Income Fund”) |
Security Investors, LLC (“Security Investors”), an indirect subsidiary of Guggenheim Partners, LLC, a privately-held, global investment and advisory firm (“Guggenheim Partners”), serves as investment adviser to each of: (i) Alpha Opportunity Fund; (ii) High Yield Fund; (iii) Investment Grade Bond Fund; (iv) Large Cap Value Fund; (v) SMid Cap Value Fund; (vi) SMid Cap Value Institutional Fund; (vii) Municipal Income Fund; (viii) Small Cap Value Fund; (ix) StylePlus—Large Core Fund; (x) StylePlus—Mid Growth Fund; and (xi) World Equity Income Fund (collectively, the “SI-Advised Funds”). (Guggenheim Partners, Security Investors, Guggenheim Partners Investment Management, LLC (“GPIM”) and their affiliates may be referred to herein collectively as “Guggenheim.” Security Investors and GPIM are also known as “Guggenheim Investments,” the global asset management and investment advisory division of Guggenheim Partners that includes other affiliated investment management businesses.)
Under the terms of investment management agreements between Security Investors and the Trust, with respect to the SI-Advised Funds, Security Investors also is responsible for overseeing the activities of GPIM, an indirect subsidiary of Guggenheim Partners, with respect to its service as investment sub-adviser to Municipal Income Fund, pursuant to an investment sub-advisory agreement between Security Investors and GPIM (the “GPIM Sub-Advisory Agreement”).
138 | THE GUGGENHEIM FUNDS ANNUAL REPORT | |
OTHER INFORMATION (Unaudited)(continued) |
GPIM serves as investment adviser with respect to each of: (i) Diversified Income Fund; (ii) Floating Rate Strategies Fund; (iii) Limited Duration Fund; (iv) Macro Opportunities Fund; (v) Market Neutral Real Estate Fund; (vi) Risk Managed Real Estate Fund; (vii) Total Return Bond Fund; and (viii) Ultra Short Duration Fund (collectively, the “GPIM-Advised Funds” and together with the SI-Advised Funds, the “Funds” and individually, a “Fund”).1 Under the supervision of the Board of Trustees of the Trust (the “Board,” with the members of the Board referred to individually as the “Trustees”), the Advisers regularly provide (or, as applicable, oversee the provision of) investment research, advice and supervision, along with a continuous investment program for the Funds, and direct the purchase and sale of securities and other investments for each Fund’s portfolio. GPIM also serves as investment adviser for the Capital Stewardship Fund, which is addressed in a separate report.2
Each of the Advisory Agreements continues in effect from year to year provided that such continuance is specifically approved at least annually by (i) the Board or a majority of the outstanding voting securities (as defined in the 1940 Act) of each Fund, and, in either event, (ii) the vote of a majority of the Trustees who are not “interested person[s],” as defined by the 1940 Act, of the Trust (the “Independent Trustees”) casting votes in person at a meeting called for such purpose. At meetings held in person on April 25, 2019 (the “April Meeting”) and on May 21, 2019 (the “May Meeting”), the members of the Contracts Review Committee of the Board (the “Committee”), consisting solely of the Independent Trustees, met separately from Guggenheim to consider the proposed renewal of the Agreements in connection with the Committee’s annual contract review schedule.
As part of its review process, the Committee was represented by independent legal counsel to the Independent Trustees (“Independent Legal Counsel”), from whom the Independent Trustees received separate legal advice and with whom they met separately. Independent Legal Counsel reviewed and discussed with the Committee various key aspects of the Trustees’ legal responsibilities relating to the proposed renewal of the Agreements and other principal contracts. The Committee took into account various materials received from Guggenheim and Independent Legal Counsel. Recognizing that the evaluation process with respect to the services provided by Guggenheim is an ongoing one, the Committee also considered the variety of written materials, reports and oral presentations the Board receives throughout the year regarding performance and operating results of the Funds and other information relevant to its evaluation of the Agreements.
In connection with the contract review process, FUSE Research Network LLC (“FUSE”), an independent, third-party research provider, was engaged to prepare advisory contract renewal reports designed specifically to help the Board fulfill its advisory contract renewal responsibilities. The objective of the reports is to present the subject funds’ relative position regarding fees, expenses and total return performance, with peer group and universe comparisons. The Committee assessed the data provided in the FUSE reports as well as commentary presented by Guggenheim, including, among other things, a summary of notable distinctions between certain Funds and the applicable peer group identified in the FUSE reports and explanations for custom peer groups created for certain Funds that do not fit well into any particular category.
In addition, Guggenheim provided materials and data in response to formal requests for information sent by Independent Legal Counsel on behalf of the Independent Trustees. Guggenheim also made a presentation at the April Meeting. Throughout the process, the Committee asked questions of management and requested certain additional information, which Guggenheim provided (collectively with the foregoing reports and materials, the “Contract Review Materials”). The Committee considered the Contract Review Materials in the context of its accumulated experience governing the Trust and weighed the factors and standards discussed with Independent Legal Counsel.
Following an analysis and discussion of relevant factors, including those identified below, and in the exercise of its business judgment, the Committee concluded that it was in the best interest of each Fund to recommend that the Board approve the renewal of each of the Advisory Agreements and the GPIM Sub-Advisory Agreement for an additional annual term.
1 | The investment management agreements pertaining to the SI-Advised Funds and the investment management agreements pertaining to the GPIM-Advised Funds are referred to herein together as the “Advisory Agreements” and, together with the GPIM Sub-Advisory Agreement, as the “Agreements.” In addition, unless the context indicates otherwise, GPIM, with respect to its service as investment adviser to the GPIM-Advised Funds, and Security Investors as to the SI-Advised Funds, are each referred to herein as the “Adviser” and together, the “Advisers.” |
2 | Because shares of the Capital Stewardship Fund are only offered for subscription and are held by a limited number of institutional/bank investors, and the Fund issues a shareholder report separate from the other series of the Trust, the factors considered by the Committee in evaluating the proposed renewal of an investment management agreement pertaining to the Capital Stewardship Fund, and the Sub-Advisory Agreement with Concinnity Advisors, LP, are addressed in a separate report of the Committee. Accordingly, references to the “Funds” should be understood as referring to all series of the Trust, excluding Capital Stewardship Fund. |
| | THE GUGGENHEIM FUNDS ANNUAL REPORT | 139 |
OTHER INFORMATION (Unaudited)(continued) |
Advisory Agreements
Nature, Extent and Quality of Services Provided by each Adviser: With respect to the nature, extent and quality of services currently provided by each Adviser, the Committee considered the qualifications, experience and skills of key personnel performing services for the Funds, including those personnel providing compliance and risk oversight, as well as the supervisors and reporting lines for such personnel. The Committee considered Guggenheim’s resources and related efforts to retain, attract and motivate capable personnel to serve the Funds. In evaluating Guggenheim’s resources and capabilities, the Committee considered Guggenheim’s commitment to focusing on, and investing resources in support of, the Funds.
The Committee’s review of the services provided by Guggenheim to the Funds included consideration of Guggenheim’s investment processes and resulting performance, portfolio oversight and risk management, and the related regular quarterly reports and presentations received by the Board. The Committee took into account the risks borne by Guggenheim in sponsoring and providing services to the Funds, including entrepreneurial, legal and regulatory risks. The Committee considered the resources dedicated by Guggenheim to compliance functions and the reporting made to the Board by Guggenheim compliance personnel regarding Guggenheim’s adherence to regulatory requirements. The Committee also considered the regular reports the Board receives from the Trust’s Chief Compliance Officer regarding compliance policies and procedures established pursuant to Rule 38a-1 under the 1940 Act.
In connection with the Committee’s evaluation of the overall package of services provided by Guggenheim, the Committee considered Guggenheim’s administrative services, including its role in supervising, monitoring, coordinating and evaluating the various services provided by the fund administrator, transfer agent, distributor, custodian and other service providers to the Funds. The Committee evaluated the Office of Chief Financial Officer (the “OCFO”), established to oversee the fund administration, accounting and transfer agency services provided to the Funds, including the OCFO’s resources, personnel and services provided.
With respect to Municipal Income Fund, the Committee noted that, although Security Investors delegated responsibility for the investment and reinvestment of the Fund’s assets to the Sub-Adviser, as affiliated companies, both the Adviser and Sub-Adviser are part of the Guggenheim organization. Further, the Committee took into account Guggenheim’s explanation that investment advisory-related services are provided by many Guggenheim employees under different related legal entities and thus, the services provided by the Adviser on the one hand and the Sub-Adviser on the other, as well as the risks assumed by each party, cannot be ascribed to distinct legal entities.3 As a result, the Committee did not evaluate the services provided to Municipal Income Fund under the Advisory Agreement and the GPIM Sub-Advisory Agreement separately.
With respect to Guggenheim’s resources and the ability of each Adviser to carry out its responsibilities under the applicable Advisory Agreement, the Chief Financial Officer of Guggenheim Investments reviewed with the Committee financial information concerning the holding company for Guggenheim Investments, Guggenheim Partners Investment Management Holdings, LLC (“GPIMH”), and the various entities comprising Guggenheim Investments, and provided the audited consolidated financial statements of GPIMH. (Thereafter, the Committee received the audited consolidated financial statements of GPIM.)
The Committee also considered the acceptability of the terms of each Advisory Agreement, including the scope of services required to be performed by each Adviser.
Based on the foregoing, and based on other information received (both oral and written) at the April Meeting and the May Meeting, as well as other considerations, including the Committee’s knowledge of how each Adviser performs its duties obtained through Board meetings, discussions and reports throughout the year, the Committee concluded that each Adviser and its personnel were qualified to serve the Funds in such capacity and may reasonably be expected to continue to provide a high quality of services under each Advisory Agreement with respect to the Funds.
Investment Performance: The Committee received, for each Fund, investment returns for the since-inception, ten-year, five-year, three-year, one-year and three-month periods ended December 31, 2018, as applicable. In addition, the Committee received a comparison of each Fund’s performance to the performance of a benchmark, a universe of funds and a narrower peer group of similar funds based on asset levels as identified by FUSE, in each case for the same periods, as applicable. The Committee also received from FUSE a description of the methodology for identifying each Fund’s peer group and universe for performance and expense comparisons.
3 | Consequently, except where the context indicates otherwise, references to “Adviser” or “Sub-Adviser” should be understood as referring to Guggenheim Investments generally and the services it provides under both Agreements. |
140 | THE GUGGENHEIM FUNDS ANNUAL REPORT | |
OTHER INFORMATION (Unaudited)(continued) |
In seeking to evaluate Fund performance over a full market cycle, the Committee focused its attention on five-year and three-year performance rankings as compared to the relevant universe of funds. The Committee considered more recent performance periods for those Funds that were recently launched, as well as in circumstances in which enhancements were being made to the portfolio management processes or techniques employed for a Fund. Except as to the individual Funds discussed below, the Committee observed that the returns of each Fund’s (other than SMid Cap Value Fund) Institutional Class shares and SMid Cap Value Fund’s Class A shares ranked in the third quartile or better of such Fund’s performance universe for each of the relevant periods considered.
In addition, the Committee made the following observations:
Municipal Income Fund: The returns of the Fund’s Institutional Class shares ranked in the 55th and 82nd percentiles of its performance universe for the five-year and three-year periods ended December 31, 2018, respectively. The Committee noted management’s explanation that the Fund’s increased allocation to floating rate securities in 2016 and the Fund’s more conservative investment approach detracted from performance that year, impacting trailing returns for five-year and three-year periods. In light of the foregoing, the Committee also considered the more recent one-year and three-month periods ended December 31, 2018, and observed that the returns of Fund’s Institutional Class shares ranked in the 30th and 11th percentiles, respectively, of its performance universe. The Committee also took into account management’s statement that it expects the Fund’s performance to continue to improve going forward as it anticipates the effects of recent tax reform and idiosyncratic risks.
Small Cap Value Fund: The returns of the Fund’s Institutional Class shares ranked in the 79th and 56th percentiles of its performance universe for the five-year and three-year periods ended December 31, 2018, respectively. The Committee noted measures taken by the Adviser to remedy longer-term relative underperformance with respect to the Value Funds strategy, including strategy enhancements such as implementation of a refined stock selection process and additional risk controls to enforce the strategy’s sell discipline. In light of the foregoing, the Committee also considered the more recent one-year and three-month periods ended December 31, 2018, and observed that the returns of Fund’s Institutional Class shares ranked in the 19th and 20th percentiles, respectively, of its performance universe.
After reviewing the foregoing and related factors, the Committee concluded that: (i) each Fund’s performance was acceptable; or (ii) it was satisfied with Guggenheim’s responses and efforts to improve investment performance.
Comparative Fees, Costs of Services Provided and the Profits Realized by each Adviser from Its Relationship with the Funds: The Committee compared each Fund’s contractual advisory fee, net effective management fee and total net expense ratio to the applicable peer group. The Committee also reviewed the median advisory fees and expense ratios, including expense ratio components (e.g., transfer agency fees, administration fees, other operating expenses, distribution fees and fee waivers/reimbursements), of the peer group of funds.
As part of its evaluation of each Fund’s advisory fee, the Committee considered how such fees compared to the advisory fee charged by the applicable Adviser to one or more other clients that it manages pursuant to similar investment strategies, to the extent applicable, noting that, in certain instances, Guggenheim charges a lower advisory fee to such other clients. In this connection, the Committee considered, among other things, Guggenheim’s representations about the significant differences between managing mutual funds as compared to other types of accounts. The Committee also considered Guggenheim’s explanation that lower fees are charged in certain instances due to various other factors, including the scope of contract, type of investors, fee structure, applicable legal, governance and capital structures, tax status and historical pricing reasons. In addition, the Committee took into account Guggenheim’s discussion of the entrepreneurial, legal and regulatory risks it faces when offering the Funds as compared to other types of accounts. The Committee concluded that the information it received demonstrated that the aggregate services provided to, or the specific circumstances of, each Fund were sufficiently different from the services provided to, or the specific circumstances of, other clients with similar investment strategies and/or the risks borne by Guggenheim were sufficiently greater than those associated with managing other clients with similar investment strategies to support the difference in fees.
In further considering the comparative fee and expense data presented in the Contract Review Materials and addressed by Guggenheim, the Committee took into account those Funds with currently effective expense limitation agreements with the Adviser. Except as to the individual Funds discussed below, the Committee observed that each Fund’s average contractual advisory fee percentile rank across all share classes of the Fund, net effective management fee4 and asset-weighted total net expense ratio each rank in the third quartile or better of such Fund’s peer group.
4 | The “net effective management fee” for each Fund represents the combined effective advisory fee and administration fee as a percentage of average net assets for the latest fiscal year, after any waivers and/or reimbursements, based on the Fund’s class level peer group percent rank, weighted by class level assets under management. |
| | THE GUGGENHEIM FUNDS ANNUAL REPORT | 141 |
OTHER INFORMATION (Unaudited)(continued) |
In addition, the Committee made the following observations:
Diversified Income Fund: The average contractual advisory fee percentile rank across all share classes of the Fund is in the fourth quartile (78th percentile) of its peer group. The Fund’s net effective management fee ranks in the first quartile (1st percentile) of its peer group. The Committee considered that the Fund’s asset weighted total net expense ratio ranks in the second quartile (38th percentile) of its peer group. The Committee also took into account the Adviser’s statement that the Fund’s currently effective expense limitation agreement with the Adviser is intended to limit the impact of the Fund’s small size.
Floating Rate Strategies Fund: The average contractual advisory fee percentile rank across all share classes of the Fund is in the fourth quartile (92nd percentile) of its peer group. The Fund’s net effective management fee ranks in the fourth quartile (76th percentile) of its peer group. The Committee considered that the Fund’s asset weighted total net expense ratio ranks in the third quartile (58th percentile) of its peer group. The Committee also considered the Adviser’s statement explaining the higher fees that performance is driven by a unique investment approach that requires significant resources. In this regard, the Committee took into consideration the Fund’s strong investment performance for the five-year period ended December 31, 2018. In addition, the Committee noted the Adviser’s statement that the net effective management fee includes 0.08% in administration fees that is not paid to the Adviser. The Committee also took into account the Fund’s currently effective expense limitation agreement with the Adviser.
High Yield Fund: The average contractual advisory fee percentile rank across all share classes of the Fund is in the third quartile (54th percentile) of its peer group. The Fund’s net effective management fee ranks in the fourth quartile (76th percentile) of its peer group. The Fund’s asset weighted total net expense ratio ranks in the third quartile (73rd percentile) of its peer group. The Committee considered the Adviser’s statement explaining the higher fees that performance is driven by a unique investment approach that requires significant resources. In this regard, the Committee took into consideration the Fund’s strong investment performance for the five-year and three-year periods ended December 31, 2018. In addition, the Committee noted the Adviser’s statement that the net effective management fee includes 0.08% in administration fees that is not paid to the Adviser. The Committee also took into account the Fund’s currently effective expense limitation agreement with the Adviser.
Limited Duration Fund: The average contractual advisory fee percentile rank across all share classes of the Fund is in the third quartile (63rd percentile) of its peer group. The Fund’s net effective management fee ranks in the fourth quartile (80th percentile) of its peer group. The Committee considered that the Fund’s asset weighted total net expense ratio ranks in the third quartile (51st percentile) of its peer group. The Committee also considered the Adviser’s statement explaining the higher fees that performance is driven by a unique investment approach that requires significant resources. In this regard, the Committee took into consideration the Fund’s strong investment performance for the five-year and three-year periods ended December 31, 2018. In addition, the Committee noted the Adviser’s statement that the net effective management fee includes 0.08% in administration fees that is not paid to the Adviser. The Committee also took into account the Fund’s currently effective expense limitation agreement with the Adviser.
Macro Opportunities Fund: The average contractual advisory fee percentile rank across all share classes of the Fund, the Fund’s net effective management fee and the Fund’s asset weighted total net expense ratio each rank in the fourth quartile (93rd, 81st and 83rd percentiles, respectively) of its peer group. The Committee noted that the Fund is categorized as a non-traditional bond fund which seeks to add value by investing in many non-traditional securities outside of fixed income, including equities, currencies, commodities and derivatives. The Committee considered the Adviser’s statement explaining the higher fees and expenses that performance is driven by a unique investment approach that requires significant resources. In this regard, the Committee took into consideration the Fund’s strong investment performance for the five-year and three-year periods ended December 31, 2018. The Committee also took into account the Fund’s currently effective expense limitation agreement with the Adviser. The Committee also noted that, in connection with the contract review process, the Adviser formalized an existing expense waiver agreement with the Fund pursuant to which the Adviser waives any Fund expenses attributable to the Fund’s investment in Alpha Opportunity Fund.
SMid Cap Value Institutional Fund: The Fund’s contractual advisory fee ranks in the first quartile (7th percentile) of its peer group. The Fund’s net effective management fee and asset weighted total net expense ratio each rank in the fourth quartile (79th and 86th percentiles, respectively) of its peer group. The Committee considered the Adviser’s statement explaining the higher fees and expenses that it has made adjustments to the strategy of the Fund over the last few years incorporating a more systematic approach in order to improve investment performance. In this regard, the Committee took into consideration the Fund’s strong investment performance for the three-year period ended December 31, 2018. In addition, the Committee noted the Adviser’s statement that the net effective management fee includes 0.08% in administration fees that is
142 | THE GUGGENHEIM FUNDS ANNUAL REPORT | |
OTHER INFORMATION (Unaudited)(continued) |
not paid to the Adviser. The Committee also considered the Adviser’s statement that the Fund has continued to experience outflows resulting in lower relative assets to peers and associated higher other operating expenses, and that the Adviser is evaluating strategic measures to improve the Fund’s positioning.
Risk Managed Real Estate Fund: The average contractual advisory fee percentile rank across all share classes of the Fund is in the first quartile (22nd percentile) of its peer group. The Fund’s net effective management fee ranks in the fourth quartile (78th percentile) of its peer group. The Committee considered that the Fund’s asset weighted total net expense ratio ranks in the second quartile (47th percentile) of its peer group. The Committee took into consideration the Fund’s strong investment performance for the three-year and one-year periods ended December 31, 2018. The Committee also took into account the Fund’s currently effective expense limitation agreement with the Adviser.
StylePlus—Large Core Fund: The average contractual advisory fee percentile rank across all share classes of the Fund is in the third quartile (62nd percentile) of its peer group. The Fund’s net effective management fee ranks in the fourth quartile (86th percentile) of its peer group. The Committee considered that the Fund’s asset weighted total net expense ratio ranks in the third quartile (66th percentile) of its peer group. The Committee also considered the Adviser’s statement explaining the higher fees that performance is driven by a unique combination of passive and actively managed strategies. In this regard, the Committee took into consideration the Fund’s strong investment performance for the five-year and three-year periods ended December 31, 2018.
Total Return Bond Fund: The average contractual advisory fee percentile rank across all share classes of the Fund is in the third quartile (68th percentile) of its peer group. The Fund’s net effective management fee ranks in the fourth quartile (78th percentile) of its peer group. The Committee considered that the Fund’s asset weighted total net expense ratio ranks in the 50th percentile of its peer group. The Committee also considered the Adviser’s statement explaining the higher fees that performance is driven by a unique investment approach that requires significant resources. In this regard, the Committee took into consideration the Fund’s strong investment performance for the five-year and three-year periods ended December 31, 2018. In addition, the Committee noted the Adviser’s statement that the net effective management fee includes 0.08% in administration fees that is not paid to the Adviser. The Committee also took into account the Fund’s currently effective expense limitation agreement with the Adviser.
With respect to the costs of services provided and profits realized by Guggenheim Investments from its relationship with the Funds, the Committee reviewed a profitability analysis and data from management for each Fund setting forth the average assets under management for the twelve months ended December 31, 2018, gross revenues received by Guggenheim Investments, expenses allocated to the Fund, expense waivers (as applicable), earnings and the operating margin/profitability rate, including variance information relative to the foregoing amounts as of December 31, 2017. In addition, the Chief Financial Officer of Guggenheim Investments reviewed with, and addressed questions from, the Committee concerning the expense allocation methodology employed in producing the profitability analysis.
In the course of its review of Guggenheim Investments’ profitability, the Committee took into account the methods used by Guggenheim Investments to determine expenses and profit. The Committee considered all of the foregoing in evaluating the costs of services provided, the profitability to Guggenheim Investments and the profitability rates presented, and concluded that the profits were not unreasonable.
The Committee considered other benefits available to each Adviser because of its relationship with the Funds and noted Guggenheim’s statement that it does not believe the Advisers derive any such “fall-out” benefits. In this regard, the Committee noted Guggenheim’s statement that, although it does not consider such benefits to be fall-out benefits, the Advisers may benefit from marketing synergies arising from offering a broad spectrum of products, including the Funds.
Economies of Scale: The Committee received and considered information regarding whether there have been economies of scale with respect to the management of the Funds as Fund assets grow, whether the Funds have appropriately benefited from any economies of scale, and whether there is potential for realization of any further economies of scale. The Committee considered whether economies of scale in the provision of services to the Funds were being passed along to the shareholders. The Committee noted the Adviser’s statements, including that Guggenheim believes it is appropriately sharing potential economies of scale and that costs continue to increase in many key areas, including compensation of portfolio managers, key analysts and support staff, as well as for infrastructure needs, with respect to risk management oversight, valuation processes and disaster recovery systems, among other things, and that, in this regard, management’s costs for providing services have increased in recent years without regard to asset levels.
| | THE GUGGENHEIM FUNDS ANNUAL REPORT | 143 |
OTHER INFORMATION (Unaudited)(concluded) |
The Committee also noted the process employed by the Adviser to evaluate whether it would be appropriate to institute a new breakpoint for a Fund, with consideration given to, among other things: (i) the Fund’s size and trends in asset levels over recent years; (ii) the competitiveness of the expense levels; (iii) whether expense waivers are in place; (iv) changes and trends in revenue and expenses; (v) whether there are any anticipated expenditures that may benefit the Fund in the future; (vi) Fund profit level margins; (vii) relative Fund performance; (viii) the nature, extent and quality of services management provides to the Fund; and (ix) the complexity of the Fund’s investment strategy and the resources required to support the Fund.
As part of its assessment of economies of scale, the Committee also considered Guggenheim’s view that it seeks to share economies of scale through a number of means, including breakpoints, advisory fees set at competitive rates pre-assuming future asset growth, expense waivers and limitations, and investments in personnel, operations and infrastructure to support the Fund business. Thus, the Committee considered the size of the Funds and the competitiveness of and/or other determinations made regarding the current advisory fee for each Fund, as well as whether a Fund is subject to an expense limitation.
Based on the foregoing, the Committee determined that the advisory fee for each Fund was reasonable.
Sub-Advisory Agreement
Nature, Extent and Quality of Services Provided by the Sub-Adviser: As noted above, because both the Adviser and Sub-Adviser for Municipal Income Fund—Security Investors and GPIM, respectively—are part of and do business as Guggenheim Investments and the services provided by the Adviser on the one hand and the Sub-Adviser on the other cannot be ascribed to distinct legal entities, the Committee did not evaluate the services provided under the Advisory Agreement and Sub-Advisory Agreement separately. Therefore, the Committee considered the qualifications, experience and skills of the Fund’s portfolio management team in connection with the Committee’s evaluation of Guggenheim’s investment professionals under the applicable Advisory Agreement.
With respect to Guggenheim’s resources and the Sub-Adviser’s ability to carry out its responsibilities under the Sub-Advisory Agreement, as noted above, the Committee considered the financial condition of GPIMH and the various entities comprising Guggenheim Investments. (Thereafter, the Committee received the audited consolidated financial statements of GPIM.)
The Committee also considered the acceptability of the terms of the Sub-Advisory Agreement, including the scope of services required to be performed by the Sub-Adviser.
Investment Performance: The Committee considered the returns of the Fund under its evaluation of the Advisory Agreement.
Comparative Fees, Costs of Services Provided and the Profits Realized by the Sub-Adviser from Its Relationship with the Fund: The Committee considered that the Sub-Advisory Agreement is with an affiliate of the Adviser, that the Adviser compensates the Sub-Adviser from its own fees so that the sub-advisory fee rate for the Fund does not impact the fees paid by the Fund and that the Sub-Adviser’s revenues were included in the calculation of Guggenheim Investments’ profitability. Given its determination of the reasonableness of the advisory fee, the Committee concluded that the sub-advisory fee rate for the Fund was not unreasonable.
Economies of Scale: The Committee recognized that, because the Sub-Adviser’s fees are paid by the Adviser and not the Fund, the analysis of economies of scale was more appropriate in the context of the Committee’s consideration of the applicable Advisory Agreement, which was separately considered. (See “Advisory Agreements – Economies of Scale” above.)
Overall Conclusions
Based on the foregoing, the Committee determined that the investment advisory fees are fair and reasonable in light of the extent and quality of the services provided and other benefits received and that the continuation of each of the Agreements is in the best interest of each Fund. In reaching this conclusion, no single factor was determinative or conclusive and each Committee member, in the exercise of his business judgment, may afford different weights to different factors. At the May Meeting, the Committee, constituting all of the Independent Trustees, recommended the renewal of each Advisory Agreement and the Sub-Advisory Agreement for an additional annual term.
144 | THE GUGGENHEIM FUNDS ANNUAL REPORT | |
INFORMATION ON BOARD OF TRUSTEES AND OFFICERS (Unaudited) |
Name, Address* and
Year of Birth of Trustees | Position(s)
Held with
the Trust | Term of Office
and Length of
Time Served** | Principal Occupation(s)
During Past 5 Years | Number of
Portfolios
in Fund
Complex
Overseen | Other
Directorships
Held by Trustees |
INDEPENDENT TRUSTEES | | | |
Randall C. Barnes (1951) | Trustee | Since 2014 | Current: Private Investor (2001-present). Former: Senior Vice President and Treasurer, PepsiCo, Inc. (1993-1997); President, Pizza Hut International (1991-1993); Senior Vice President, Strategic Planning and New Business Development, PepsiCo, Inc. (1987-1990). | 158 | Current: Trustee, Purpose Investments Funds (2013-present). Former: Managed Duration Investment Grade Municipal Fund (2003-2016). |
Angela Brock-Kyle (1959) | Trustee | Since November 2019 | Current: Founder and Chief Executive Officer, B.O.A.R.D.S (consulting firm). Former: Senior Leader, TIAA (financial services firm) (1987-2012). | 157 | None. |
Donald A. Chubb, Jr. (1946) | Trustee and Chairman of the Valuation Oversight Committee | Since 1994 | Current: Retired. Former: Business broker and manager of commercial real estate, Griffith & Blair, Inc. (1997-2017). | 157 | Former: Midland Care, Inc. (2011-2016). |
Jerry B. Farley (1946) | Trustee and Chairman of the Audit Committee | Since 2005 | Current: President, Washburn University (1997-present). | 157 | Current: CoreFirst Bank & Trust (2000-present). Former: Westar Energy, Inc. (2004-2018). |
Roman Friedrich III (1946) | Trustee and Chairman of the Contracts Review Committee | Since 2014 | Current: Founder and Managing Partner, Roman Friedrich & Company (1998-present). | 157 | Former: Zincore Metals, Inc. (2009-January 2019). |
Thomas F. Lydon, Jr. (1960) | Trustee | Since November 2019 | Current: President, Global Trends Investments (registered investment adviser) (1996-present). | 157 | Current: US Global Investors (GROW) (1995-present); and Harvest Volatility Edge Trust (3) (2017-present). |
| | THE GUGGENHEIM FUNDS ANNUAL REPORT | 145 |
INFORMATION ON BOARD OF TRUSTEES AND OFFICERS (Unaudited)(continued) |
Name, Address* and
Year of Birth of Trustees | Position(s)
Held with
the Trust | Term of Office
and Length of
Time Served** | Principal Occupation(s)
During Past 5 Years | Number of
Portfolios
in Fund
Complex
Overseen | Other
Directorships
Held by Trustees |
INDEPENDENT TRUSTEES - concluded | | |
Ronald A. Nyberg (1953) | Trustee and Chairman of the Nominating and Governance Committee | Since 2014 | Current: Partner, Momkus LLC (2016-present). Former: Partner, Nyberg & Cassioppi, LLC (2000-2016); Executive Vice President, General Counsel, and Corporate Secretary, Van Kampen Investments (1982-1999). | 158 | Current: PPM Funds (9) (2018-present); Edward-Elmhurst Healthcare System (2012-present); Western Asset Inflation-Linked Opportunities & Income Fund (2004-present); Western Asset Inflation-Linked Income Fund (2003-present). Former: Managed Duration Investment Grade Municipal Fund (2003-2016). |
Sandra G. Sponem (1958) | Trustee | Since November 2019 | Current: Retired. Former: Senior Vice President and Chief Financial Officer, M.A. Mortenson Companies, Inc. (general contracting firm) (2007-2017). | 157 | Current: SPDR Series Trust (78) (2018-present); SPDR Index Shares Funds (31) (2018-present); SSGA Active Trust (12) (2018-present); and SSGA Master Trust (1) (2018-present). |
Ronald E. Toupin, Jr. (1958) | Trustee and Chairman of the Board | Since 2014 | Current: Portfolio Consultant (2010-present); Member, Governing Council, Independent Directors Council (2013-present); Governor, Board of Governors, Investment Company Institute (2018-present). Former: Member, Executive Committee, Independent Directors Council (2016-2018); Vice President, Manager and Portfolio Manager, Nuveen Asset Management (1998-1999); Vice President, Nuveen Investment Advisory Corp. (1992-1999); Vice President and Manager, Nuveen Unit Investment Trusts (1991-1999); and Assistant Vice President and Portfolio Manager, Nuveen Unit Investment Trusts (1988-1999), each of John Nuveen & Co., Inc. (1982-1999). | 157 | Current: Western Asset Inflation-Linked Opportunities & Income Fund (2004-present); Western Asset Inflation-Linked Income Fund (2003-present). Former: Managed Duration Investment Grade Municipal Fund (2003-2016). |
146 | THE GUGGENHEIM FUNDS ANNUAL REPORT | |
INFORMATION ON BOARD OF TRUSTEES AND OFFICERS (Unaudited)(continued) |
Name, Address* and
Year of Birth of Trustees | Position(s)
Held with
the Trust | Term of Office
and Length of
Time Served** | Principal Occupation(s)
During Past 5 Years | Number of
Portfolios
in Fund
Complex
Overseen | Other
Directorships
Held by Trustees |
INTERESTED TRUSTEE | | | | |
Amy J. Lee*** (1961) | Trustee, Vice President and Chief Legal Officer | Since 2018 (Trustee) Since 2014 (Chief Legal Officer) Since 2007 (Vice President) | Current: Interested Trustee, certain other funds in the Fund Complex (2018-present); Chief Legal Officer, certain other funds in the Fund Complex (2014-present); Vice President, certain other funds in the Fund Complex (2007-present); Senior Managing Director, Guggenheim Investments (2012-present). Former: President and Chief Executive Officer (2017-2018); President, certain other funds in the Fund Complex (2017-November 2019); Vice President, Associate General Counsel and Assistant Secretary, Security Benefit Life Insurance Company and Security Benefit Corporation (2004-2012). | 157 | None. |
* | The business address of each Trustee is c/o Guggenheim Investments, 227 West Monroe Street, Chicago, Illinois 60606. |
** | Each Trustee serves an indefinite term, until his or her successor is elected and qualified. Time served includes time served in the respective position for the Predecessor Corporation. |
*** | This Trustee is deemed to be an “interested person” of the Funds under the 1940 Act by reason of her position with the Funds’ Investment Manager and/or the parent of the Investment Manager. |
| | THE GUGGENHEIM FUNDS ANNUAL REPORT | 147 |
INFORMATION ON BOARD OF TRUSTEES AND OFFICERS (Unaudited)(continued) |
Name, Address*
and Year of Birth | Position(s)
Held with
the Trust | Term of Office
and Length of
Time Served** | Principal Occupations
During Past 5 Years |
OFFICERS | | | |
Brian E. Binder (1972) | President and Chief Executive Officer | Since 2018 | Current: President and Chief Executive Officer, certain other funds in the Fund Complex (2018-present); President and Chief Executive Officer, Guggenheim Funds Investment Advisors, LLC and Security Investors, LLC (2018-present); Senior Managing Director and Chief Administrative Officer, Guggenheim Investments (2018-present). Former: Managing Director and President, Deutsche Funds, and Head of US Product, Trading and Fund Administration, Deutsche Asset Management (2013-2018); Managing Director, Head of Business Management and Consulting, Invesco Ltd. (2010-2012). |
James M. Howley (1972) | Assistant Treasurer | Since 2014 | Current: Managing Director, Guggenheim Investments (2004-present); Assistant Treasurer, certain other funds in the Fund Complex (2006-present). Former: Manager, Mutual Fund Administration of Van Kampen Investments, Inc. (1996-2004). |
Mark E. Mathiasen (1978) | Secretary | Since 2014 | Current: Secretary, certain other funds in the Fund Complex (2007-present); Managing Director, Guggenheim Investments (2007-present). |
Glenn McWhinnie (1969) | Assistant Treasurer | Since 2016 | Current: Vice President, Guggenheim Investments (2009-present); Assistant Treasurer, certain other funds in the Fund complex (2016-present). |
Michael P. Megaris (1984) | Assistant Secretary | Since 2014 | Current: Assistant Secretary, certain other funds in the Fund Complex (2014-present); Director, Guggenheim Investments (2012-present). |
Elisabeth Miller (1968) | Chief Compliance Officer | Since 2012 | Current: Chief Compliance Officer, certain other funds in the Fund Complex (2012-present); Senior Managing Director, Guggenheim Investments (2012-present); Vice President, Guggenheim Funds Distributors, LLC (2014-present). Former: Chief Compliance Officer, Security Investors, LLC and Guggenheim Funds Investment Advisors, LLC (2012-2018); Chief Compliance Officer, Guggenheim Distributors, LLC (2009-2014); Senior Manager, Security Investors, LLC (2004-2014); Senior Manager, Guggenheim Distributors, LLC (2004-2014). |
Margaux Misantone (1978) | AML Officer | Since 2017 | Current: Chief Compliance Officer, Security Investors, LLC and Guggenheim Funds Investment Advisors, LLC (2018-present); AML Officer, Security Investors, LLC and certain other funds in the Fund Complex (2017-present); Managing Director, Guggenheim Investments (2015-present). Former: Assistant Chief Compliance Officer, Security Investors, LLC and Guggenheim Funds Investments Advisors, LLC (2015-2018). |
Adam J. Nelson (1979) | Assistant Treasurer | Since 2015 | Current: Vice President, Guggenheim Investments (2015-present); Assistant Treasurer, certain other funds in the Fund Complex (2015-present). Former: Assistant Vice President and Fund Administration Director, State Street Corporation (2013-2015); Fund Administration Assistant Director, State Street (2011-2013); Fund Administration Manager, State Street (2009-2011). |
148 | THE GUGGENHEIM FUNDS ANNUAL REPORT | |
INFORMATION ON BOARD OF TRUSTEES AND OFFICERS (Unaudited)(concluded) |
Name, Address*
and Year of Birth | Position(s)
Held with
the Trust | Term of Office
and Length of
Time Served** | Principal Occupations
During Past 5 Years |
OFFICERS - concluded | |
Kimberly J. Scott (1974) | Assistant Treasurer | Since 2014 | Current: Director, Guggenheim Investments (2012-present); Assistant Treasurer, certain other funds in the Fund Complex (2012-present). Former: Financial Reporting Manager, Invesco, Ltd. (2010-2011); Vice President/Assistant Treasurer, Mutual Fund Administration for Van Kampen Investments, Inc./Morgan Stanley Investment Management (2009-2010); Manager of Mutual Fund Administration, Van Kampen Investments, Inc./Morgan Stanley Investment Management (2005-2009). |
Bryan Stone (1979) | Vice President | Since 2014 | Current: Vice President, certain other funds in the Fund Complex (2014-present); Managing Director, Guggenheim Investments (2013-present). Former: Senior Vice President, Neuberger Berman Group LLC (2009-2013); Vice President, Morgan Stanley (2002-2009). |
John L. Sullivan (1955) | Chief Financial Officer, Chief Accounting Officer and Treasurer | Since 2014 | Current: Chief Financial Officer, Chief Accounting Officer and Treasurer, certain other funds in the Fund Complex (2010-present); Senior Managing Director, Guggenheim Investments (2010-present). Former: Managing Director and Chief Compliance Officer, each of the funds in the Van Kampen Investments fund complex (2004-2010); Managing Director and Head of Fund Accounting and Administration, Morgan Stanley Investment Management (2002-2004); Chief Financial Officer and Treasurer, Van Kampen Funds (1996-2004). |
Jon Szafran (1989) | Assistant Treasurer | Since 2017 | Current: Vice President, Guggenheim Investments (2017-present); Assistant Treasurer, certain other funds in the Fund Complex (2017-present). Former: Assistant Treasurer of Henderson Global Funds and Manager of US Fund Administration, Henderson Global Investors (North America) Inc. (“HGINA”), (2017); Senior Analyst of US Fund Administration, HGINA (2014-2017); Senior Associate of Fund Administration, Cortland Capital Market Services, LLC (2013-2014); Experienced Associate, PricewaterhouseCoopers LLP (2012-2013). |
* | The business address of each officer is c/o Guggenheim Investments, 227 West Monroe Street, Chicago, Illinois 60606. |
** | Each officer serves an indefinite term, until his or her successor is duly elected and qualified. |
| | THE GUGGENHEIM FUNDS ANNUAL REPORT | 149 |
GUGGENHEIM INVESTMENTS PRIVACY NOTICE (Unaudited) |
Who We Are
This Privacy Notice describes the data protection practices of Guggenheim Investments. Guggenheim Investments as used herein refers to the affiliated investment management businesses of Guggenheim Partners, LLC: Guggenheim Funds Investment Advisors, LLC, Guggenheim Partners Investment Management, LLC, Guggenheim Funds Distributors, LLC, Security Investors, LLC, Guggenheim Investment Advisors (Europe) Limited, Guggenheim Real Estate, LLC, GS Gamma Advisors, LLC, Guggenheim Partners India Management, LLC, Guggenheim Partners Europe Limited, as well as the funds in the Guggenheim Funds complex (the “Funds”) (“Guggenheim Investments,” “we,” “us,” or “our”).
Guggenheim Partners Investment Management Holdings, LLC, located at 330 Madison Avenue, New York, New York 10017 is the data controller for your information. The affiliates who are also controllers of certain of your information are: Guggenheim Investment Advisors (Europe) Limited, Guggenheim Partners Europe Limited, Guggenheim Partners, LLC, Guggenheim Funds Investment Advisors, LLC, Guggenheim Partners Investment Management, LLC, Guggenheim Funds Distributors, LLC and Security Investors, LLC, as well as the Funds.
Our Commitment to You
Guggenheim Investments considers your privacy our utmost concern. When you become our client or investor, you entrust us with not only your hard-earned money but also with your personal and financial information. Because we have access to your private information, we hold ourselves to the highest standards in its safekeeping and use. We strictly limit how we share your information with others, whether you are a current or former Guggenheim Investments client or investor.
The Information We Collect About You
We collect certain nonpublic personal information about you from information you provide on applications, other forms, our website, and/or from third parties including investment advisors. This information includes Social Security or other tax identification number, assets, income, tax information, retirement and estate plan information, transaction history, account balance, payment history, bank account information, marital status, family relationships, information that we collect on our website through the use of “cookies,” and other personal information that you or others provide to us. We may also collect such information through your inquiries by mail, e-mail or telephone. We may also collect customer due diligence information, as required by applicable law and regulation, through third party service providers.
How We Handle Your Personal Information
The legal basis for using your information as set out in this Privacy Notice is as follows: (a) use of your personal data is necessary to perform our obligations under any contract with you (such as a contract for us to provide financial services to you); or (b) where use of your personal data is not necessary for performance of a contract, use of your personal data is necessary for our legitimate interests or the legitimate interests of others (for example, to enforce the legal terms governing our services, operate and market our website and other services we offer, ensure safe environments for our personnel and others, make and receive payments, prevent fraud and to know the customer to whom we are providing the services). Some processing is done to comply with applicable law.
In addition to the specific uses described above, we also use your information in the following manner:
| | ● | We use your information in connection with servicing your accounts. |
| | ● | We use information to respond to your requests or questions. For example, we might use your information to respond to your customer feedback. |
| | ● | We use information to improve our products and services. We may use your information to make our website and products better. We may use your information to customize your experience with us. |
| | ● | We use information for security purposes. We may use your information to protect our company and our customers. |
| | ● | We use information to communicate with you. For example, we will communicate with you about your account or our relationship. We may contact you about your feedback. We might also contact you about this Privacy Notice. We may also enroll you in our email newsletter. |
150 | THE GUGGENHEIM FUNDS ANNUAL REPORT | |
GUGGENHEIM INVESTMENTS PRIVACY NOTICE (Unaudited)(continued) |
| | ● | We use information as otherwise permitted by law, as we may notify you. |
| | ● | Aggregate/Anonymous Data. We may aggregate and/or anonymize any information collected through the website so that such information can no longer be linked to you or your device (“Aggregate/Anonymous Information”). We may use Aggregate/Anonymous Information for any purpose, including without limitation for research and marketing purposes, and may also share such data with any third parties, including advertisers, promotional partners, and sponsors. |
We do not sell information about current or former clients or their accounts to third parties. Nor do we share this information, except when necessary to complete transactions at your request, to make you aware of investment products and services that we or our affiliates offer, or as permitted or required by law.
We provide information about you to companies and individuals not affiliated with Guggenheim Investments to complete certain transactions or account changes, or to perform services for us related to your account. For example, if you ask to transfer assets from another financial institution to Guggenheim Investments, we must provide certain information about you to that company to complete the transaction. We provide the third party with only the information necessary to carry out its responsibilities and only for that purpose. And we require these third parties to treat your private information with the same high degree of confidentiality that we do. To alert you to other Guggenheim Investments products and services, we share your information within our family of affiliated companies. You may limit our sharing with affiliated companies as set out below. We may also share information with any successor to all or part of our business, or in connection with steps leading up to a merger or acquisition. For example, if part of our business was sold we may give customer information as part of that transaction. We may also share information about you with your consent.
We will release information about you if you direct us to do so, if we are compelled by law to do so, or in other circumstances as permitted by law (for example, to protect your account from fraud).
If you close your account(s) or become an inactive client or investor, we will continue to adhere to the privacy policies and practices described in this notice.
Opt-Out Provisions and Your Data Choices
The law allows you to “opt out” of certain kinds of information sharing with third parties. We do not share personal information about you with any third parties that triggers this opt-out right. This means YOU ARE ALREADY OPTED OUT.
When you are no longer our client or investor, we continue to share your information as described in this notice, and you may contact us at any time to limit our sharing by sending an email to CorporateDataPrivacy@GuggenheimPartners.com.
European Union Data Subjects and certain others: In addition to the choices set forth above, residents of the European Union and certain other jurisdictions have certain rights to (1) request access to or rectification or deletion of information we collect about them, (2) request a restriction on the processing of their information, (3) object to the processing of their information, or (4) request the portability of certain information. To exercise these or other rights, please contact us using the contact information below. We will consider all requests and provide our response within the time period stated by applicable law. Please note, however, that certain information may be exempt from such requests in some circumstances, which may include if we need to keep processing your information for our legitimate interests or to comply with a legal obligation. We may request you provide us with information necessary to confirm your identity before responding to your request.
Residents of France and certain other jurisdictions may also provide us with instructions regarding the manner in which we may continue to store, erase and share your information after your death, and where applicable, the person you have designated to exercise these rights after your death.
How We Protect Privacy Online
We take steps to protect your privacy when you use our web site – www.guggenheiminvestments.com – by using secure forms of online communication, including encryption technology, Secure Socket Layer (SSL) protocol, firewalls and user names and passwords. These safeguards vary based on the sensitivity of the information that we collect and store. However, we cannot and do not guarantee that these measures will prevent every unauthorized attempt to access, use, or disclose your information since despite our efforts, no Internet and/or other
| | THE GUGGENHEIM FUNDS ANNUAL REPORT | 151 |
GUGGENHEIM INVESTMENTS PRIVACY NOTICE (Unaudited)(concluded) |
electronic transmissions can be completely secure. Our web site uses “http cookies”—tiny pieces of information that we ask your browser to store. We use cookies for session management and security features on the Guggenheim Investments web site. We do not use them to pull data from your hard drive, to learn your e-mail address, or to view data in cookies created by other web sites. We will not share the information in our cookies or give others access to it. See the legal information area on our web site for more details about web site security and privacy features.
How We Safeguard Your Personal Information and Data Retention
We restrict access to nonpublic personal information about you to our employees and in some cases to third parties (for example, the service providers described above) as permitted by law. We maintain strict physical, electronic and procedural safeguards that comply with federal standards to guard your nonpublic personal information.
We keep your information for no longer than necessary for the purposes for which it is processed. The length of time for which we retain information depends on the purposes for which we collected and use it and/or as required to comply with applicable laws. Information may persist in copies made for backup and business continuity purposes for additional time.
International Visitors
If you are not a resident of the United States, please be aware that your information may be transferred to, stored and processed in the United States where our servers are located and our databases are operated. The data protection and other laws of the United States and other countries might not be as comprehensive as those in your country.
In such cases, we ensure that a legal basis for such a transfer exists and that adequate protection is provided as required by applicable law, for example, by using standard contractual clauses or by transferring your data to a jurisdiction that has obtained an adequacy finding. Individuals whose data may be transferred on the basis of standard contractual clauses may contact us as described below.
We’ll Keep You Informed
If you have any questions or concerns about how we treat your personal data, we encourage you to consult with us first. You may also contact the relevant supervisory authority.
We reserve the right to modify this policy at any time and will inform you promptly of material changes. You may access our privacy policy from our web site at www.guggenheiminvestments.com. Should you have any questions regarding our privacy policy, contact us by email at CorporateDataPrivacy@GuggenheimPartners.com.
152 | THE GUGGENHEIM FUNDS ANNUAL REPORT | |
This page intentionally left blank.
This page intentionally left blank.
This page intentionally left blank.
This page intentionally left blank.
This page intentionally left blank.
9.30.2019
Guggenheim Funds Annual Report
| |
Guggenheim Diversified Income Fund | | |
Guggenheim High Yield Fund | | |
Guggenheim Investment Grade Bond Fund | | |
Guggenheim Municipal Income Fund | | |
Beginning on January 1, 2021, paper copies of the Funds’ annual and semi-annual shareholder reports may no longer be sent by mail, unless you specifically request paper copies of the reports from a fund or from your financial intermediary. Instead, the reports will be made available on a website, and you will be notified by mail each time a report is posted and provided with a website link to access the report.
If you already elected to receive shareholder reports electronically, you will not be affected by this change and you need not take any action. At any time, you may elect to receive reports and other communications from a fund electronically by calling 800.820.0888, going to GuggenheimInvestments.com/myaccount, or by contacting your financial intermediary.
You may elect to receive all future shareholder reports in paper free of charge. If you hold shares of a fund directly, you can inform the Fund that you wish to receive paper copies of reports by calling 800.820.0888. If you hold shares of a fund through a financial intermediary, please contact the financial intermediary to make this election. Your election to receive reports in paper will apply to all Guggenheim Funds in which you are invested and may apply to all funds held with your financial intermediary.
GuggenheimInvestments.com | SBINC-ANN-0919x0920 |

| | |
DEAR SHAREHOLDER | 2 |
ECONOMIC AND MARKET OVERVIEW | 4 |
ABOUT SHAREHOLDERS’ FUND EXPENSES | 6 |
DIVERSIFIED INCOME FUND | 9 |
HIGH YIELD FUND | 19 |
INVESTMENT GRADE BOND FUND | 39 |
MUNICIPAL INCOME FUND | 66 |
NOTES TO FINANCIAL STATEMENTS | 82 |
REPORT OF INDEPENDENT REGISTERED PUBLIC ACCOUNTING FIRM | 103 |
OTHER INFORMATION | 105 |
INFORMATION ON BOARD OF TRUSTEES AND OFFICERS | 114 |
GUGGENHEIM INVESTMENTS PRIVACY NOTICE | 119 |
| | THE GUGGENHEIM FUNDS ANNUAL REPORT | 1 |
Dear Shareholder:
Security Investors, LLC and Guggenheim Partners Investment Management, LLC (the “Investment Advisers”) are pleased to present the shareholder report for a selection of our Funds (the “Funds”) for the annual fiscal period ended September 30, 2019.
The Investment Advisers are part of Guggenheim Investments, which represents the investment management businesses of Guggenheim Partners, LLC (“Guggenheim”), a global, diversified financial services firm.
Guggenheim Funds Distributors, LLC is the distributor of the Funds. Guggenheim Funds Distributors, LLC is affiliated with Guggenheim and the Investment Advisers.
We encourage you to read the Economic and Market Overview section of the report, which follows this letter, and then the Managers’ Commentary for each Fund.
We are committed to providing innovative investment solutions and appreciate the trust you place in us.
Sincerely,
Security Investors, LLC,
Guggenheim Partners Investment Management, LLC,
October 31, 2019
Read a prospectus and summary prospectus (if available) carefully before investing. It contains the investment objectives, risks, charges, expenses and other information, which should be considered carefully before investing. Obtain a prospectus and summary prospectus (if available) at guggenheiminvestments.com or call 800.820.0888.
This material is not intended as a recommendation or as investment advice of any kind, including in connection with rollovers, transfers, and distributions. Such material is not provided in a fiduciary capacity, may not be relied upon for or in connection with the making of investment decisions, and does not constitute a solicitation of an offer to buy or sell securities. All content has been provided for informational or educational purposes only and is not intended to be and should not be construed as legal or tax advice and/or a legal opinion. Always consult a financial, tax and/ or legal professional regarding your specific situation.
Diversified Income Fund may not be suitable for all investors. ● The Fund’s market value will change in response to interest rate changes and market conditions among other factors. In general, bond prices rise when interest rates fall and vice versa. ● The Fund’s exposure to high yield securities may subject the fund to greater volatility. ● Derivatives may pose risks in addition to and greater than those associated with investing directly in securities or other investments, including risks relating to leverage, imperfect correlations with underlying investments or the fund’s other portfolio holdings, high price volatility, lack of availability, counterparty credit, liquidity, valuation and legal restrictions. ● Stock prices, especially stock prices of smaller companies, can be volatile as they reflect changes in the issuing company’s financial conditions and changes in the overall market ● Some asset-backed securities, including mortgage-backed securities, may have structures that make their reaction to interest rates and other factors difficult to predict, making their prices very volatile and they are subject to liquidity risk.● The Fund’s investments in other investment vehicles subject the fund to those risks and expenses affecting the investment vehicle. ● The Fund’s investments in foreign securities carry additional risks when compared to U.S. securities, due to the impact of diplomatic, political or economic developments in the country in question (investments in emerging markets securities are generally subject to an even greater level of risk). ● Investments in syndicated bank loans generally offer a floating interest rate and involve special types of risks. ● Master limited partnerships (“MLPs”) are subject to certain risks inherent in the structure of MLPs, including tax risks, limited control and voting rights and potential conflicts of interest. MLPs that concentrate in a particular industry or a particular geographic region are subject to risks associated with such industry or region. ● The Fund’s investments in real estate securities subject the fund to the same risks as direct investments in real estate, which is particularly sensitive to economic downturns. ● The Fund’s investments and investment strategies, including investments in MLPs and certain investment vehicles, may be subject to special and complex federal income tax provisions that may adversely affect the fund and its distributions to shareholders. ● Leveraging will exaggerate the effect on NAV of any increase or decrease in the market value of the Fund’s portfolio. ● Please read the prospectus for more detailed information regarding these and other risks.
2 | THE GUGGENHEIM FUNDS ANNUAL REPORT | |
High Yield Fund may not be suitable for all investors. ● The Fund’s market value will change in response to interest rate changes and market conditions among other factors. In general, bond prices rise when interest rates fall and vice versa. ● The Fund’s exposure to high yield securities may subject the Fund to greater volatility. ● The Fund may invest in derivative instruments, which may be more volatile and less liquid, increasing the risk of loss when compared to traditional securities. Certain of the derivative instruments are also subject to the risks of counterparty default and adverse tax treatment. ●The Fund’s use of leverage, through borrowings or instruments such as derivatives, may cause the Fund to be more volatile than if it had not been leveraged. ● Instruments and strategies (such as borrowing transactions and reverse repurchase agreements) may provide leveraged exposure to a particular investment, which will magnify any gains or losses on those investments. ● The Fund may invest in foreign securities which carry additional risks when compared to U.S. securities, due to the impact of diplomatic, political, or economic developments in the country in question (investments in emerging markets securities are generally subject to an even greater level of risk). ● Investments in syndicated bank loans generally offer a floating interest rate and involve special types of risks. ● The Fund’s investments in other investment vehicles subject the Fund to those risks and expenses affecting the investment vehicle. ● The Fund’s investments in restricted securities may involve financial and liquidity risk. ● You may have a gain or loss when you sell your shares. ● It is important to note that the Fund is not guaranteed by the U.S. government. ● Please read the prospectus for more detailed information regarding these and other risks.
Investment Grade Bond Fund may not be suitable for all investors. ● The Fund’s market value will change in response to interest rate changes and market conditions among other factors. In general, bond prices rise when interest rates fall and vice versa. ● The Fund’s exposure to high yield securities may subject the Fund to greater volatility. ● When market conditions are deemed appropriate, the Fund may use leverage to the full extent permitted by its investment policies and restrictions and applicable law. Leveraging will exaggerate the effect on net asset value of any increase or decrease in the market value of the Fund’s portfolio. ● The Fund may invest in derivative instruments, which may be more volatile and less liquid, increasing the risk of loss when compared to traditional securities. Certain of the derivative instruments are also subject to the risks of counterparty default and adverse tax treatment. ● Instruments and strategies (such as borrowing transactions and reverse repurchase agreements) may provide leveraged exposure to a particular investment, which will magnify any gains or losses on those investments. ● Investments in reverse repurchase agreements expose the Fund to the many of the same risks as investments in derivatives. ● The Fund’s investments in other investment vehicles subject the Fund to those risks and expenses affecting the investment vehicle. ● The Fund’s investments in foreign securities carry additional risks when compared to U.S. securities, due to the impact of diplomatic, political or economic developments in the country in question (investments in emerging markets securities are generally subject to an even greater level of risk). ● Investments in syndicated bank loans generally offer a floating interest rate and involve special types of risks. ● The Fund’s investments in municipal securities can be affected by events that affect the municipal bond market. ● The Fund’s investments in real estate securities subject the Fund to the same risks as direct investments in real estate, which is particularly sensitive to economic downturns. ● The Fund’s investments in restricted securities may involve financial and liquidity risk. ● You may have a gain or loss when you sell your shares. ● It is important to note that the Fund is not guaranteed by the U.S. government. ● Please read the prospectus for more detailed information regarding these and other risks.
Municipal Income Fund may not be suitable for all investors. ● The Fund will be significantly affected by events that affect the municipal bond market, which could include unfavorable legislative or political developments and adverse changes in the financial conditions of state and municipal issuers or the federal government in case it provides financial support to the municipality. Income from municipal bonds held by the Fund could be declared taxable because of changes in tax laws. The Fund may invest in securities that generate taxable income. A portion of the Fund’s otherwise tax-exempt dividends may be taxable to those shareholders subject to the alternative minimum tax. ● Certain sectors of the municipal bond market have special risks that can affect them more significantly than the market as a whole. Because many municipal instruments are issued to finance similar projects, conditions in these industries can significantly affect the Fund and the overall municipal market. ● Municipalities currently experience budget shortfalls, which could cause them to default on their debt and thus subject the Fund to unforeseen losses. ● Like other funds that hold bonds and other fixed-income investments, the Fund’s market value will change in response to interest rate changes and market conditions, among other factors. In general, bond prices rise when interest rates fall and vice versa. ● The Fund’s exposure to high-yield securities may subject the Fund to greater volatility. ● When market conditions are deemed appropriate, the Fund will leverage to the full extent permitted by its investment policies and restrictions and applicable law. Leveraging will exaggerate the effect on net asset value of any increase or decrease in the market value of the Fund’s portfolio. ● The Fund may invest in derivative instruments, which may be more volatile and less liquid, increasing the risk of loss when compared to traditional securities. Certain of the derivative instruments are also subject to the risks of counterparty default and adverse tax treatment. ●Instruments and strategies (such as reverse repurchase agreements, unfunded commitments, tender option bonds, and borrowings) may expose the Fund to many of the same risks as investments in derivatives and may provide leveraged exposure to a particular investment, which will magnify any gains or losses on those investments. ● The Fund’s investments in other investment vehicles subject the Fund to those risks and expenses affecting the investment vehicle. ● The Fund’s investments in foreign securities carry additional risks when compared to U.S. securities, due to the impact of diplomatic, political, or economic developments in the country in question (investments in emerging markets securities are generally subject to an even greater level of risk). ● Investments in syndicated bank loans generally offer a floating interest rate and involve special types of risks. ● The Fund is subject to active trading risks that may increase volatility and impact its ability to achieve its investment objective. ● You may have a gain or loss when you sell your shares. ● It is important to note that the Fund is not guaranteed by the U.S. government. ● Please read the prospectus for more detailed information regarding these and other risks.
| | THE GUGGENHEIM FUNDS ANNUAL REPORT | 3 |
ECONOMIC AND MARKET OVERVIEW (Unaudited) | September 30, 2019 |
Economic data has been mixed over the past few months. On the positive side, we saw a pickup in the housing market as measured by housing starts and home sales, which could be a delayed response to lower mortgage rates. Industrial production had the strongest month-over-month gain in a year, partially boosted by an increase in oil production in Hurricane Barry’s wake. The unemployment rate fell to a 50-year low of 3.5% in September 2019, despite a continued moderation in payroll gains.
On the negative side, the Institute for Supply Management (“ISM”) Manufacturing Index plunged to the weakest reading since June 2009. The ISM Non-Manufacturing Index also came in well below expectations, the lowest since August 2016. Within both the manufacturing and non-manufacturing ISM indexes, analysts look at the employment component of the survey for an early read on other labor market indicators. Here we find more cause for concern: The non-manufacturing survey’s employment component is now barely above 50 while the manufacturing employment sub-index stands at 46.3, well into contraction territory. Combined, the outlook for output and hiring has dimmed, signaling trouble ahead for consumers.
Retail sales have been steady, but Commerce Department data showed that total consumer spending on goods and services increased only 0.1% month-over-month in August 2019, the smallest gain in six months. It is hard to identify the primary reason why consumers may already be turning more conservative on spending. Income growth looks steady, the equity market is higher year-to-date, and rates are lower, all of which should be boosting consumer confidence. Sentiment surveys, however, show that fewer consumers believe now is a good time to buy homes, vehicles, and household durables, and headline consumer confidence measures have ticked down. We believe trade policy and political concerns are weighing on sentiment, and these headwinds are set to ramp up further. Additional U.S. tariffs on China are due to take effect on December 15, 2019, and the U.S. House of Representatives is pressing forward with its impeachment inquiry into President Trump.
Guggenheim’s dashboard of U.S. recession indicators continues to point to a recession beginning as early as the first half of 2020, and we think the economic data is corroborating this view. Two of the more notable indicators pointing to high recession risk are the three-month/10-year U.S. Treasury yield curve, which has been inverted for 16 consecutive weeks through period end, and the Leading Economic Indicators Index which has slowed from a year-over-year growth rate of 6.6% in September 2018 to 1.1% as of August 2019. The indicators Guggenheim tracks as part of our recession probability model indicate a nearly 50% chance that a recession will come before mid-2020, and a 70% chance that it will arrive by mid-2021.
Over the period, the U.S. Treasury curve continued its overall flattening trend, as the difference between the two-year U.S. Treasury and 10-year U.S. Treasury narrowed to 5 basis points. Equity markets remained volatile, buoyed by a 25 basis point cut in July and September 2019 by the U.S. Federal Reserve (the “Fed”) and relatively strong U.S. economic data, but weighed down by trade war uncertainty and fears of a global slowdown.
With downside risks growing, markets have become more sensitive to the Fed’s communications about the future stance of monetary policy. Despite the two rate cuts, Fed policymakers are deeply divided. It is still unclear whether the Fed will deliver the aggressive and preemptive policy action that would prolong the current expansion.
As it relates to risk-taking, we are not confident that the Fed would succeed in easing credit conditions if conditions were to tighten materially. The Fed may act too late, or its actions may have little impact given that low rates this year have largely failed to stimulate growth. With credit spreads still relatively tight on a historical basis, we believe it is prudent to remain up in quality as we await better opportunities to deploy capital in riskier credit sectors in the coming downturn.
For the 12-month period ended September 30, 2019, the Standard & Poor’s 500® (“S&P 500”) Index* returned 4.25%. The MSCI Europe-Australasia-Far East (“EAFE”) Index* returned -0.82%. The return of the MSCI Emerging Markets Index* was -1.63%.
In the bond market, the Bloomberg Barclays U.S. Aggregate Bond Index* posted a 10.30% return for the period, while the Bloomberg Barclays U.S. Corporate High Yield Index* returned 6.36%. The return of the ICE Bank of America (“BofA”) Merrill Lynch 3-Month U.S. Treasury Bill Index* was 2.39% for the 12-month period.
The opinions and forecasts expressed may not actually come to pass. This information is subject to change at any time, based on market and other conditions, and should not be construed as a recommendation of any specific security or strategy.
4 | THE GUGGENHEIM FUNDS ANNUAL REPORT | |
ECONOMIC AND MARKET OVERVIEW (Unaudited)(concluded) | September 30, 2019 |
*Index Definitions
Indices are unmanaged and not available for direct investment. Index performance does not reflect transaction costs, fees, or expenses.
Bloomberg Barclays U.S. Aggregate Bond Index is a broad-based flagship benchmark that measures the investment grade, U.S. dollar-denominated, fixed-rate taxable bond market, including U.S. Treasuries, government-related and corporate securities, mortgage-backed securities or “MBS” (agency fixed-rate and hybrid adjustable-rate mortgage, or “ARM”, pass-throughs), asset-backed securities (“ABS”), and commercial mortgage-backed securities (“CMBS”) (agency and non-agency).
Bloomberg Barclays U.S. Corporate High Yield Index measures the U.S. dollar-denominated, high yield, fixed-rate corporate bond market. Securities are classified as high yield if the middle rating of Moody’s, Fitch, and S&P is Ba1/BB +/BB + or below.
Bloomberg Barclays Municipal Bond Index is a broad market performance benchmark for the tax-exempt bond market. The bonds included in this index must have a minimum credit rating of at least Baa.
ICE BofA Merrill Lynch 3-Month U.S. Treasury Bill Index is an unmanaged market Index of U.S. Treasury securities maturing in 90 days that assumes reinvestment of all income.
MSCI EAFE Index is a capitalization-weighted measure of stock markets in Europe, Australasia, and the Far East.
MSCI Emerging Markets Index is a free float-adjusted market capitalization-weighted index that is designed to measure equity market performance in the global emerging markets.
S&P 500® is a broad-based index, the performance of which is based on the performance of 500 widely held common stocks chosen for market size, liquidity, and industry group representation.
| | THE GUGGENHEIM FUNDS ANNUAL REPORT | 5 |
ABOUT SHAREHOLDERS’ FUND EXPENSES (Unaudited) | |
All mutual funds have operating expenses, and it is important for our shareholders to understand the impact of costs on their investments. Shareholders of a fund incur two types of costs: (i) transaction costs, including sales charges (loads) on purchase payments, reinvested dividends, other distributions, and exchange fees, and (ii) ongoing costs, including management fees, administrative services, and shareholder reports, among others. These ongoing costs, or operating expenses, are deducted from a fund’s gross income and reduce the investment return of the fund.
A fund’s expenses are expressed as a percentage of its average net assets, which is known as the expense ratio. The following examples are intended to help investors understand the ongoing costs (in dollars) of investing in a fund and to compare these costs with the ongoing costs of investing in other mutual funds.
The examples are based on an investment of $1,000 made at the beginning of the period and held for the entire six-month period beginning March 31, 2019 and ending September 30, 2019.
The following tables illustrate the Funds’ costs in two ways:
Table 1. Based on actual Fund return: This section helps investors estimate the actual expenses paid over the period. The “Ending Account Value” shown is derived from the Fund’s actual return, and the fifth column shows the dollar amount that would have been paid by an investor who started with $1,000 in the Fund. Investors may use the information here, together with the amount invested, to estimate the expenses paid over the period. Simply divide the Fund’s account value by $1,000 (for example, an $8,600 account value divided by $1,000 = 8.6), then multiply the result by the number provided under the heading “Expenses Paid During Period.”
Table 2. Based on hypothetical 5% return: This section is intended to help investors compare a fund’s cost with those of other mutual funds. The table provides information about hypothetical account values and hypothetical expenses based on the Fund’s actual expense ratio and an assumed rate of return of 5% per year before expenses, which is not the Fund’s actual return. The hypothetical account values and expenses may not be used to estimate the actual ending account balance or expenses paid during the period. The example is useful in making comparisons because the U.S. Securities and Exchange Commission (the “SEC”) requires all mutual funds to calculate expenses based on the 5% return. Investors can assess a fund’s costs by comparing this hypothetical example with the hypothetical examples that appear in shareholder reports of other funds.
The calculations illustrated above assume no shares were bought or sold during the period. Actual costs may have been higher or lower, depending on the amount of investment and the timing of any purchases or redemptions.
Please note that the expenses shown in the table are meant to highlight your ongoing costs only and do not reflect any transactional costs, such as sales charges (loads) on purchase payments, and contingent deferred sales charges (“CDSC”) on redemptions, if any. Therefore, the second table is useful in comparing ongoing costs only, and will not help you determine the relative total costs of owning different funds. In addition, if these transactional costs were included, your costs would have been higher.
More information about the Funds’ expenses, including annual expense ratios for periods up to five years (subject to the Fund’s inception date), can be found in the Financial Highlights section of this report. For additional information on operating expenses and other shareholder costs, please refer to the appropriate Fund prospectus.
6 | THE GUGGENHEIM FUNDS ANNUAL REPORT | |
ABOUT SHAREHOLDERS’ FUND EXPENSES (Unaudited)(continued) | |
| Expense
Ratio1 | Fund
Return | Beginning
Account Value
March 31, 2019 | Ending
Account Value
September 30, 2019 | Expenses
Paid During
Period2 |
Table 1. Based on actual Fund return3 | | | | | |
Diversified Income Fund | | | | | |
A-Class | 0.84% | 4.11% | $ 1,000.00 | $ 1,041.10 | $ 4.30 |
C-Class | 1.59% | 3.68% | 1,000.00 | 1,036.80 | 8.12 |
P-Class | 0.84% | 4.03% | 1,000.00 | 1,040.30 | 4.30 |
Institutional Class | 0.59% | 4.20% | 1,000.00 | 1,042.00 | 3.02 |
High Yield Fund | | | | | |
A-Class | 1.21% | 4.35% | 1,000.00 | 1,043.50 | 6.20 |
C-Class | 1.97% | 3.96% | 1,000.00 | 1,039.60 | 10.07 |
P-Class | 1.22% | 4.45% | 1,000.00 | 1,044.50 | 6.25 |
Institutional Class | 0.93% | 4.48% | 1,000.00 | 1,044.80 | 4.77 |
R6-Class | 0.82% | 4.66% | 1,000.00 | 1,046.60 | 4.21 |
Investment Grade Bond Fund | | | | | |
A-Class | 0.80% | 3.72% | 1,000.00 | 1,037.20 | 4.09 |
C-Class | 1.55% | 3.35% | 1,000.00 | 1,033.50 | 7.90 |
P-Class | 0.80% | 3.71% | 1,000.00 | 1,037.10 | 4.09 |
Institutional Class | 0.51% | 3.82% | 1,000.00 | 1,038.20 | 2.61 |
Municipal Income Fund | | | | | |
A-Class | 0.81% | 3.71% | 1,000.00 | 1,037.10 | 4.14 |
C-Class | 1.56% | 3.33% | 1,000.00 | 1,033.30 | 7.95 |
P-Class | 0.81% | 3.79% | 1,000.00 | 1,037.90 | 4.14 |
Institutional Class | 0.56% | 3.92% | 1,000.00 | 1,039.20 | 2.86 |
| | THE GUGGENHEIM FUNDS ANNUAL REPORT | 7 |
ABOUT SHAREHOLDERS’ FUND EXPENSES (Unaudited)(concluded) | |
| Expense
Ratio1 | Fund
Return | Beginning
Account Value
March 31, 2019 | Ending
Account Value
September 30, 2019 | Expenses
Paid During
Period2 |
Table 2. Based on hypothetical 5% return (before expenses) | | | | |
Diversified Income Fund | | | | | |
A-Class | 0.84% | 5.00% | $ 1,000.00 | $ 1,020.86 | $ 4.26 |
C-Class | 1.59% | 5.00% | 1,000.00 | 1,017.10 | 8.04 |
P-Class | 0.84% | 5.00% | 1,000.00 | 1,020.86 | 4.26 |
Institutional Class | 0.59% | 5.00% | 1,000.00 | 1,022.11 | 2.99 |
High Yield Fund | | | | | |
A-Class | 1.21% | 5.00% | 1,000.00 | 1,019.00 | 6.12 |
C-Class | 1.97% | 5.00% | 1,000.00 | 1,015.19 | 9.95 |
P-Class | 1.22% | 5.00% | 1,000.00 | 1,018.95 | 6.17 |
Institutional Class | 0.93% | 5.00% | 1,000.00 | 1,020.41 | 4.71 |
R6-Class | 0.82% | 5.00% | 1,000.00 | 1,020.96 | 4.15 |
Investment Grade Bond Fund | | | | | |
A-Class | 0.80% | 5.00% | 1,000.00 | 1,021.06 | 4.05 |
C-Class | 1.55% | 5.00% | 1,000.00 | 1,017.30 | 7.84 |
P-Class | 0.80% | 5.00% | 1,000.00 | 1,021.06 | 4.05 |
Institutional Class | 0.51% | 5.00% | 1,000.00 | 1,022.51 | 2.59 |
Municipal Income Fund | | | | | |
A-Class | 0.81% | 5.00% | 1,000.00 | 1,021.01 | 4.10 |
C-Class | 1.56% | 5.00% | 1,000.00 | 1,017.25 | 7.89 |
P-Class | 0.81% | 5.00% | 1,000.00 | 1,021.01 | 4.10 |
Institutional Class | 0.56% | 5.00% | 1,000.00 | 1,022.26 | 2.84 |
1 | Annualized and excludes expenses of the underlying funds in which the Funds invest, if any. This ratio represents net expenses, which may include expenses that are excluded from the expense limitation agreement. Excluding these expense, the net expenses ratios for the period would be: |
| | | A-Class | C-Class | P-Class | Institutional
Class | R6-Class |
| | High Yield Fund | 1.15% | 1.92% | 1.17% | 0.88% | 0.76% |
| | Investment Grade Bond Fund | 0.79% | 1.54% | 0.79% | 0.50% | N/A |
| | Municipal Income Fund | 0.80% | 1.55% | 0.80% | 0.55% | N/A |
2 | Expenses are equal to the Fund’s annualized expense ratio, net of any applicable fee waivers, multiplied by the average account value over the period, multiplied by 183/365 (to reflect the one-half year period). |
3 | Actual cumulative return at net asset value for the period March 31, 2019 to September 30, 2019. |
8 | THE GUGGENHEIM FUNDS ANNUAL REPORT | |
MANAGERS’ COMMENTARY (Unaudited) | September 30, 2019 |
To Our Shareholders
Guggenheim Diversified Income Fund (the “Fund”) is managed by a team of seasoned professionals, including Farhan Sharaff, Senior Managing Director and Assistant Chief Investment Officer, Equities; Jayson Flowers, Senior Managing Director and Portfolio Manager; and Patrick Mitchell, Senior Managing Director and Portfolio Manager. In the following paragraphs, the investment team discusses the market environment and the Fund’s performance for the fiscal year ended September 30, 2019.
For the one year period ended September 30, 2019, Guggenheim Diversified Income Fund returned 5.31%1, compared with the 10.30% return of the Bloomberg Barclays U.S. Aggregate Bond Index. A 70/30 blend of the Bloomberg Barclays U.S. Aggregate Bond Index and MSCI World Index, the Fund’s secondary benchmark, returned 7.92%.
The Fund seeks to achieve high current income with consideration for capital appreciation. The twelve month trailing distribution yield was 2.89% and the subsidized SEC 30-day yield was 3.16% for Class A shares. The SEC 30-day yield is based on net investment income for the 30-day period ended September 30, 2019, is annualized, and is divided by the maximum offering price at month-end.
The Fund’s allocation remained stable through the period, with about 70% in fixed income and 30% in equity.
The Fund’s relative return was due to its core fixed-income exposure and world equity exposure both underperforming their respective indices in the blended benchmark. The equity exposure overall added to Fund performance, with contributions from out-of-benchmark holdings in real estate investment trusts and global infrastructure. In the fixed-income part of the portfolio, performance of out-of-benchmark holdings in bank loans and high yield detracted from return.
Performance displayed represents past performance which is no guarantee of future results.
1 | Performance figures are based on Class A shares and do not reflect deduction of the sales charges or taxes that a shareholder would pay on distributions or the redemption of shares. |
The opinions and forecast expressed may not actually come to pass. This information is subject to change at any time, based on market and other conditions, and should not be construed as a recommendation of any specific security or strategy.
| | THE GUGGENHEIM FUNDS ANNUAL REPORT | 9 |
PERFORMANCE REPORT AND FUND PROFILE (Unaudited) | September 30, 2019 |
DIVERSIFIED INCOME FUND
OBECTIVE: Seeks to achieve high current income with consideration for capital appreciation.
Holdings Diversification (Market Exposure as % of Net Assets)
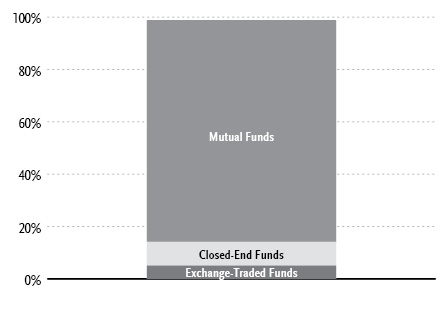
“Holdings Diversification (Market Exposure as % of Net Assets)” excludes any temporary cash investments.
Inception Dates: |
A-Class | January 29, 2016 |
C-Class | January 29, 2016 |
P-Class | January 29, 2016 |
Institutional Class | January 29, 2016 |
Ten Largest Holdings (% of Total Net Assets) |
Guggenheim High Yield Fund — R6-Class | 20.9% |
Guggenheim Investment Grade Bond Fund — Institutional Class | 20.9% |
Guggenheim Floating Rate Strategies Fund — R6-Class | 17.4% |
Guggenheim Limited Duration Fund — R6-Class | 10.4% |
Guggenheim Risk Managed Real Estate Fund — Institutional Class | 10.3% |
Invesco S&P High Income Infrastructure ETF | 5.0% |
Guggenheim World Equity Income Fund — Institutional Class | 5.0% |
John Hancock Investors Trust | 0.3% |
Western Asset Premier Bond Fund | 0.3% |
Neuberger Berman High Yield Strategies Fund, Inc. | 0.3% |
Top Ten Total | 90.8 % |
| | |
“Ten Largest Holdings” excludes any temporary cash investments. |
10 | THE GUGGENHEIM FUNDS ANNUAL REPORT | |
PERFORMANCE REPORT AND FUND PROFILE (Unaudited)(concluded) | September 30, 2019 |
Cumulative Fund Performance*

Average Annual Returns*
Periods Ended September 30, 2019
| 1 Year | Since
Inception
(01/29/16) |
A-Class Shares | 5.31% | 6.59% |
A-Class Shares with sales charge‡ | 1.11% | 5.41% |
C-Class Shares | 4.50% | 5.79% |
C-Class Shares with CDSC§ | 3.50% | 5.79% |
P-Class Shares | 5.23% | 6.57% |
Institutional Class Shares | 5.52% | 6.84% |
Bloomberg Barclays U.S. Aggregate Bond Index | 10.30% | 3.58% |
* | The performance data above represents past performance that is not predictive of future results. The investment return and principal value of an investment in the Fund will fluctuate so that an investor’s shares, when redeemed, may be worth more or less than their original cost. Returns are historical and include changes in principal and reinvested dividends and capital gains and do not reflect the effect of taxes. The Bloomberg Barclays U.S. Aggregate Bond Index is an unmanaged index and, unlike the Fund, has no management fees or operating expenses to reduce its reported return. The graph is based on A-Class shares only; performance for C-Class shares, P-Class shares and Institutional Class shares will vary due to differences in fee structures. |
‡ | Fund returns are calculated using the maximum sales charge of 4.00 %. |
§ | Fund returns include a CDSC of 1% if redeemed within 12 months of purchase. |
| | THE GUGGENHEIM FUNDS ANNUAL REPORT | 11 |
SCHEDULE OF INVESTMENTS | September 30, 2019 |
DIVERSIFIED INCOME FUND | |
| | Shares | | | Value | |
EXCHANGE-TRADED FUNDS† - 5.0% |
Invesco S&P High Income Infrastructure ETF | | | 13,520 | | | $ | 367,882 | |
Total Exchange-Traded Funds | | | | | | | | |
(Cost $284,958) | | | | | | | 367,882 | |
| | | | | | | | | |
MUTUAL FUNDS† - 84.8% |
Guggenheim High Yield Fund — R6-Class1 | | | 141,920 | | | | 1,545,504 | |
Guggenheim Investment Grade Bond Fund — Institutional Class1 | | | 81,709 | | | | 1,545,121 | |
Guggenheim Floating Rate Strategies Fund — R6-Class1 | | | 50,785 | | | | 1,282,310 | |
Guggenheim Limited Duration Fund — R6-Class1 | | | 31,075 | | | | 766,309 | |
Guggenheim Risk Managed Real Estate Fund — Institutional Class1 | | | 22,085 | | | | 762,161 | |
Guggenheim World Equity Income Fund — Institutional Class1 | | | 24,211 | | | | 367,036 | |
Total Mutual Funds | | | | | | | | |
(Cost $6,006,375) | | | | | | | 6,268,441 | |
| | | | | | | | | |
CLOSED-END FUNDS† - 9.1% |
John Hancock Investors Trust | | | 1,278 | | | | 21,752 | |
Western Asset Premier Bond Fund | | | 1,529 | | | | 21,727 | |
Neuberger Berman High Yield Strategies Fund, Inc. | | | 1,763 | | | | 21,279 | |
BlackRock Enhanced Capital and Income Fund, Inc. | | | 1,199 | | | | 19,376 | |
John Hancock Tax-Advantaged Dividend Income Fund | | | 661 | | | | 18,799 | |
BlackRock Limited Duration Income Trust | | | 1,200 | | | | 18,756 | |
PGIM High Yield Bond Fund, Inc. | | | 1,242 | | | | 18,568 | |
BlackRock Multi-Sector Income Trust | | | 1,067 | | | | 18,310 | |
Flaherty & Crumrine Preferred & Income Fund, Inc. | | | 1,202 | | | | 17,946 | |
Eaton Vance Enhanced Equity Income Fund II | | | 1,058 | | | | 17,616 | |
Eaton Vance Tax-Advantaged Dividend Income Fund | | | 712 | | | | 17,494 | |
Calamos Convertible Opportunities and Income Fund | | | 1,644 | | | | 17,114 | |
Eaton Vance Tax-Managed Diversified Equity Income Fund | | | 1,432 | | | | 17,041 | |
Apollo Tactical Income Fund, Inc. | | | 1,095 | | | | 16,589 | |
PIMCO Corporate & Income Strategy Fund | | | 904 | | | | 16,588 | |
Eaton Vance Tax-Managed Buy-Write Income Fund | | | 1,057 | | | | 16,542 | |
BlackRock Credit Allocation Income Trust | | | 1,209 | | | | 16,467 | |
PIMCO Dynamic Credit and Mortgage Income Fund | | | 672 | | | | 16,451 | |
Western Asset Global High Income Fund, Inc. | | | 1,650 | | | | 16,385 | |
Cohen & Steers Total Return Realty Fund, Inc. | | | 1,093 | | | | 16,166 | |
AllianzGI Diversified Income & Convertible Fund | | | 708 | | | | 16,121 | |
Apollo Senior Floating Rate Fund, Inc. | | | 1,074 | | | | 15,927 | |
Western Asset High Income Fund II, Inc. | | | 2,348 | | | | 15,919 | |
First Trust Energy Income and Growth Fund | | | 700 | | | | 15,862 | |
Pioneer High Income Trust | | | 1,717 | | | | 15,831 | |
Clough Global Dividend and Income Fund | | | 1,450 | | | | 15,732 | |
BlackRock Corporate High Yield Fund, Inc. | | | 1,452 | | | | 15,609 | |
Ivy High Income Opportunities Fund | | | 1,128 | | | | 15,465 | |
KKR Income Opportunities Fund | | | 991 | | | | 15,430 | |
Western Asset Emerging Markets Debt Fund, Inc. | | | 1,100 | | | | 15,279 | |
ClearBridge MLP & Midstream Total Return Fund, Inc. | | | 1,700 | | | | 15,147 | |
Brookfield Real Assets Income Fund, Inc. | | | 670 | | | | 15,135 | |
Blackstone / GSO Strategic Credit Fund | | | 1,030 | | | | 15,038 | |
Reaves Utility Income Fund | | | 400 | | | | 14,680 | |
Western Asset Global Corporate Defined Opportunity Fund, Inc. | | | 823 | | | | 14,337 | |
DoubleLine Income Solutions Fund | | | 718 | | | | 14,302 | |
Eaton Vance Senior Floating-Rate Trust | | | 1,077 | | | | 14,044 | |
AllianceBernstein Global High Income Fund, Inc. | | | 1,164 | | | | 13,956 | |
Voya Global Advantage and Premium Opportunity Fund | | | 1,289 | | | | 13,328 | |
Barings Global Short Duration High Yield Fund | | | 748 | | | | 13,015 | |
Nuveen Senior Income Fund | | | 2,251 | | | | 12,988 | |
Total Closed-End Funds | | | | | | | | |
(Cost $638,401) | | | | | | | 674,111 | |
| | | | | | | | | |
MONEY MARKET FUND† - 1.8% |
Goldman Sachs Financial Square Treasury Instruments Fund — Institutional Shares 1.79%2 | | | 134,659 | | | | 134,659 | |
Total Money Market Fund | | | | | | | | |
(Cost $134,659) | | | | | | | 134,659 | |
| | | | | | | | | |
Total Investments - 100.7% | | | | | | | | |
(Cost $7,064,393) | | | | | | $ | 7,445,093 | |
Other Assets & Liabilities, net - (0.7)% | | | | | | | (54,289 | ) |
Total Net Assets - 100.0% | | | | | | $ | 7,390,804 | |
† | Value determined based on Level 1 inputs — See Note 4. |
1 | Affiliated issuer. |
2 | Rate indicated is the 7-day yield as of September 30, 2019. |
| | |
| | See Sector Classification in Other Information section. |
12 | THE GUGGENHEIM FUNDS ANNUAL REPORT | SEE NOTES TO FINANCIAL STATEMENTS. |
SCHEDULE OF INVESTMENTS (concluded) | September 30, 2019 |
DIVERSIFIED INCOME FUND | |
The following table summarizes the inputs used to value the Fund’s investments at September 30, 2019 (See Note 4 in the Notes to Financial Statements):
Investments in Securities (Assets) | | Level 1
Quoted
Prices | | | Level 2
Significant
Observable
Inputs | | | Level 3
Significant
Unobservable
Inputs | | | Total | |
Exchange-Traded Funds | | $ | 367,882 | | | $ | — | | | $ | — | | | $ | 367,882 | |
Mutual Funds | | | 6,268,441 | | | | — | | | | — | | | | 6,268,441 | |
Closed-End Funds | | | 674,111 | | | | — | | | | — | | | | 674,111 | |
Money Market Fund | | | 134,659 | | | | — | | | | — | | | | 134,659 | |
Total Assets | | $ | 7,445,093 | | | $ | — | | | $ | — | | | $ | 7,445,093 | |
Affiliated Transactions
Investments representing 5% or more of the outstanding voting shares of a company, or control of or by, or common control under Guggenheim Investments (“GI”), result in that company being considered an affiliated issuer, as defined in the 1940 Act.
Transactions during the year ended September 30, 2019, in which the company is an affiliated issuer, were as follows:
Security Name | | Value
09/30/18 | | | Additions | | | Reductions | | | Realized
Gain (Loss) | | | Change in
Unrealized
Appreciation
(Depreciation) | | | Value
09/30/19 | | | Shares
09/30/19 | | | Investment
Income | | | Capital Gain
Distributions | |
Mutual Funds | | | | | | | | | | | | | | | | | | | | | | | | | | | | | | | | | | | | |
Guggenheim Floating Rate Strategies Fund — R6-Class | | $ | 639,499 | | | $ | 1,342,955 | | | $ | (664,000 | ) | | $ | (16,286 | ) | | $ | (19,858 | ) | | $ | 1,282,310 | | | | 50,785 | | | $ | 52,663 | | | $ | 6 | |
Guggenheim High Yield Fund — R6-Class | | | 1,072,867 | | | | 1,124,033 | | | | (659,998 | ) | | | 28,113 | | | | (19,511 | ) | | | 1,545,504 | | | | 141,920 | | | | 78,043 | | | | 2,178 | |
Guggenheim Investment Grade Bond Fund — Institutional Class | | | 1,278,508 | | | | 516,483 | | | | (285,680 | ) | | | (4,288 | ) | | | 40,098 | | | | 1,545,121 | | | | 81,709 | | | | 30,185 | | | | — | |
Guggenheim Limited Duration Fund — R6-Class | | | 1,286,329 | | | | 482,441 | | | | (998,991 | ) | | | (3,621 | ) | | | 151 | | | | 766,309 | | | | 31,075 | | | | 28,622 | | | | 24 | |
Guggenheim Risk Managed Real Estate Fund — Institutional Class | | | 469,932 | | | | 723,715 | | | | (550,075 | ) | | | 17,512 | | | | 101,077 | | | | 762,161 | | | | 22,085 | | | | 14,574 | | | | 2,641 | |
Guggenheim World Equity Income Fund — Institutional Class | | | 316,169 | | | | 60,226 | | | | — | | | | — | | | | (9,359 | ) | | | 367,036 | | | | 24,211 | | | | 10,151 | | | | 2,574 | |
| | | $ | 5,063,304 | | | $ | 4,249,853 | | | $ | (3,158,744 | ) | | $ | 21,430 | | | $ | 92,598 | | | $ | 6,268,441 | | | | | | | $ | 214,238 | | | $ | 7,423 | |
SEE NOTES TO FINANCIAL STATEMENTS. | THE GUGGENHEIM FUNDS ANNUAL REPORT | 13 |
STATEMENT OF ASSETS AND LIABILITIES |
September 30, 2019 |
Assets: |
Investments in unaffiliated issuers, at value (cost $1,058,018) | | $ | 1,176,652 | |
Investments in affiliated issuers, at value (cost $6,006,375) | | | 6,268,441 | |
Prepaid expenses | | | 29,448 | |
Receivables: |
Securities sold | | | 490,000 | |
Investment Adviser | | | 34,308 | |
Dividends | | | 22,891 | |
Interest | | | 115 | |
Total assets | | | 8,021,855 | |
| | | | | |
Liabilities: |
Overdraft due to custodian bank | | | 60 | |
Payable for: |
Securities purchased | | | 591,854 | |
Professional fees | | | 24,684 | |
Transfer agent/maintenance fees | | | 4,250 | |
Trustees’ fees* | | | 1,049 | |
Distribution and service fees | | | 696 | |
Fund shares redeemed | | | 219 | |
Miscellaneous | | | 8,239 | |
Total liabilities | | | 631,051 | |
Net assets | | $ | 7,390,804 | |
| | | | | |
Net assets consist of: |
Paid in capital | | $ | 6,956,687 | |
Total distributable earnings (loss) | | | 434,117 | |
Net assets | | $ | 7,390,804 | |
| | | | | |
A-Class: |
Net assets | | $ | 277,717 | |
Capital shares outstanding | | | 10,291 | |
Net asset value per share | | $ | 26.99 | |
Maximum offering price per share (Net asset value divided by 96.00%) | | $ | 28.11 | |
| | | | | |
C-Class: |
Net assets | | $ | 816,385 | |
Capital shares outstanding | | | 30,241 | |
Net asset value per share | | $ | 27.00 | |
| | | | | |
P-Class: |
Net assets | | $ | 131,272 | |
Capital shares outstanding | | | 4,868 | |
Net asset value per share | | $ | 26.97 | |
| | | | | |
Institutional Class: |
Net assets | | $ | 6,165,430 | |
Capital shares outstanding | | | 228,527 | |
Net asset value per share | | $ | 26.98 | |
STATEMENT OF OPERATIONS |
Year Ended September 30, 2019 |
Investment Income: |
Dividends from securities of unaffiliated issuers | | $ | 57,153 | |
Dividends from securities of affiliated issuers | | | 214,238 | |
Interest | | | 1,967 | |
Total investment income | | | 273,358 | |
| | | | | |
Expenses: |
Management fees | | | 50,194 | |
Distribution and service fees: |
A-Class | | | 389 | |
C-Class | | | 5,258 | |
P-Class | | | 315 | |
Transfer agent/maintenance fees: |
A-Class | | | 820 | |
C-Class | | | 2,412 | |
P-Class | | | 644 | |
Institutional Class | | | 21,712 | |
Registration fees | | | 58,638 | |
Professional fees | | | 35,590 | |
Fund accounting/administration fees | | | 24,999 | |
Trustees’ fees* | | | 15,240 | |
Custodian fees | | | 10,096 | |
Line of credit fees | | | 151 | |
Miscellaneous | | | 20,672 | |
Total expenses | | | 247,130 | |
Less: |
Expenses reimbursed by Adviser: |
A Class | | | (3,070 | ) |
C Class | | | (10,209 | ) |
P Class | | | (2,424 | ) |
Institutional Class | | | (104,793 | ) |
Expenses waived by Adviser | | | (80,295 | ) |
Earnings credits applied | | | (66 | ) |
Total waived/reimbursed expenses | | | (200,857 | ) |
Net expenses | | | 46,273 | |
Net investment income | | | 227,085 | |
| | | | | |
Net Realized and Unrealized Gain (Loss): |
Net realized gain (loss) on: |
Investments in unaffiliated issuers | | | (5,368 | ) |
Investments in affiliated issuers | | | 21,430 | |
Distributions received from affiliated investment companies | | | 7,423 | |
Net realized gain | | | 23,485 | |
Net change in unrealized appreciation (depreciation) on: |
Investments in unaffiliated issuers | | | 33,655 | |
Investments in affiliated issuers | | | 92,598 | |
Net change in unrealized appreciation (depreciation) | | | 126,253 | |
Net realized and unrealized gain | | | 149,738 | |
Net increase in net assets resulting from operations | | $ | 376,823 | |
* | Relates to Trustees not deemed “interested persons” within the meaning of Section 2(a)(19) of the 1940 Act. |
14 | THE GUGGENHEIM FUNDS ANNUAL REPORT | SEE NOTES TO FINANCIAL STATEMENTS. |
STATEMENTS OF CHANGES IN NET ASSETS |
| | Year Ended
September 30,
2019 | | | Year Ended
September 30,
2018 | |
Increase (Decrease) in Net Assets from Operations: | | | | | | | | |
Net investment income | | $ | 227,085 | | | $ | 207,632 | |
Net realized gain on investments | | | 23,485 | | | | 73,375 | |
Net change in unrealized appreciation (depreciation) on investments | | | 126,253 | | | | (218,573 | ) |
Net increase in net assets resulting from operations | | | 376,823 | | | | 62,434 | |
| | | | | | | | | |
Distributions to shareholders: | | | | | | | | |
A-Class | | | (6,205 | ) | | | (5,537 | ) |
C-Class | | | (14,082 | ) | | | (4,610 | ) |
P-Class | | | (5,168 | ) | | | (5,100 | ) |
Institutional Class | | | (254,600 | ) | | | (242,306 | ) |
Total distributions to shareholders | | | (280,055 | ) | | | (257,553 | ) |
| | | | | | | | | |
Capital share transactions: | | | | | | | | |
Proceeds from sale of shares | | | | | | | | |
A-Class | | | 128,478 | | | | 2,202 | |
C-Class | | | 706,268 | | | | 25,491 | |
P-Class | | | 1,939 | | | | 8,835 | |
Institutional Class | | | 105,353 | | | | 77,521 | |
Distributions reinvested | | | | | | | | |
A-Class | | | 6,205 | | | | 5,537 | |
C-Class | | | 14,082 | | | | 4,610 | |
P-Class | | | 5,168 | | | | 5,100 | |
Institutional Class | | | 254,600 | | | | 242,306 | |
Cost of shares redeemed | | | | | | | | |
A-Class | | | (15 | ) | | | — | |
C-Class | | | (70,916 | ) | | | (17,551 | ) |
P-Class | | | (2,340 | ) | | | (7,853 | ) |
Institutional Class | | | (22,132 | ) | | | — | |
Net increase from capital share transactions | | | 1,126,690 | | | | 346,198 | |
Net increase in net assets | | | 1,223,458 | | | | 151,079 | |
| | | | | | | | | |
Net assets: | | | | | | | | |
Beginning of year | | | 6,167,346 | | | | 6,016,267 | |
End of year | | $ | 7,390,804 | | | $ | 6,167,346 | |
| | | | | | | | | |
Capital share activity: | | | | | | | | |
Shares sold | | | | | | | | |
A-Class | | | 4,778 | | | | 82 | |
C-Class | | | 27,051 | | | | 951 | |
P-Class | | | 72 | | | | 324 | |
Institutional Class | | | 4,087 | | | | 2,813 | |
Shares issued from reinvestment of distributions | | | | | | | | |
A-Class | | | 239 | | | | 205 | |
C-Class | | | 535 | | | | 171 | |
P-Class | | | 199 | | | | 189 | |
Institutional Class | | | 9,798 | | | | 8,970 | |
Shares redeemed | | | | | | | | |
A-Class | | | (1 | ) | | | — | |
C-Class | | | (2,764 | ) | | | (659 | ) |
P-Class | | | (88 | ) | | | (293 | ) |
Institutional Class | | | (830 | ) | | | — | |
Net increase in shares | | | 43,076 | | | | 12,753 | |
SEE NOTES TO FINANCIAL STATEMENTS. | THE GUGGENHEIM FUNDS ANNUAL REPORT | 15 |
This table is presented to show selected data for a share outstanding throughout each period and to assist shareholders in evaluating a Fund’s performance for the periods presented.
A-Class | | Year Ended
September 30,
2019 | | | Year Ended
September 30,
2018 | | | Year Ended
September 30,
2017 | | | Period Ended
September 30,
2016a | |
Per Share Data | | | | | | | | | | | | | | | | |
Net asset value, beginning of period | | $ | 26.70 | | | $ | 27.58 | | | $ | 27.12 | | | $ | 25.00 | |
Income (loss) from investment operations: |
Net investment income (loss)b | | | .86 | | | | .91 | | | | .96 | | | | .76 | |
Net gain (loss) on investments (realized and unrealized) | | | .50 | | | | (.70 | ) | | | .89 | | | | 2.03 | |
Total from investment operations | | | 1.36 | | | | .21 | | | | 1.85 | | | | 2.79 | |
Less distributions from: |
Net investment income | | | (.77 | ) | | | (.90 | ) | | | (.95 | ) | | | (.67 | ) |
Net realized gains | | | (.30 | ) | | | (.19 | ) | | | (.44 | ) | | | — | |
Total distributions | | | (1.07 | ) | | | (1.09 | ) | | | (1.39 | ) | | | (.67 | ) |
Net asset value, end of period | | $ | 26.99 | | | $ | 26.70 | | | $ | 27.58 | | | $ | 27.12 | |
|
Total Returnc | | | 5.31 | % | | | 0.78 | % | | | 7.00 | % | | | 11.29 | % |
Ratios/Supplemental Data |
Net assets, end of period (in thousands) | | $ | 278 | | | $ | 141 | | | $ | 138 | | | $ | 132 | |
Ratios to average net assets: |
Net investment income (loss) | | | 3.26 | % | | | 3.37 | % | | | 3.53 | % | | | 4.35 | % |
Total expensesd | | | 4.03 | % | | | 4.83 | % | | | 4.16 | % | | | 3.31 | % |
Net expensese,f,g | | | 0.85 | % | | | 0.84 | % | | | 0.85 | % | | | 0.77 | % |
Portfolio turnover rate | | | 58 | % | | | 37 | % | | | 44 | % | | | 83 | % |
C-Class | | Year Ended
September 30,
2019 | | | Year Ended
September 30,
2018 | | | Year Ended
September 30,
2017 | | | Period Ended
September 30,
2016a | |
Per Share Data | | | | | | | | | | | | | | | | |
Net asset value, beginning of period | | $ | 26.69 | | | $ | 27.56 | | | $ | 27.11 | | | $ | 25.00 | |
Income (loss) from investment operations: |
Net investment income (loss)b | | | .69 | | | | .71 | | | | .76 | | | | .63 | |
Net gain (loss) on investments (realized and unrealized) | | | .46 | | | | (.69 | ) | | | .87 | | | | 2.03 | |
Total from investment operations | | | 1.15 | | | | .02 | | | | 1.63 | | | | 2.66 | |
Less distributions from: |
Net investment income | | | (.54 | ) | | | (.70 | ) | | | (.74 | ) | | | (.55 | ) |
Net realized gains | | | (.30 | ) | | | (.19 | ) | | | (.44 | ) | | | — | |
Total distributions | | | (.84 | ) | | | (.89 | ) | | | (1.18 | ) | | | (.55 | ) |
Net asset value, end of period | | $ | 27.00 | | | $ | 26.69 | | | $ | 27.56 | | | $ | 27.11 | |
|
Total Returnc | | | 4.50 | % | | | 0.08 | % | | | 6.17 | % | | | 10.74 | % |
Ratios/Supplemental Data |
Net assets, end of period (in thousands) | | $ | 816 | | | $ | 145 | | | $ | 137 | | | $ | 118 | |
Ratios to average net assets: |
Net investment income (loss) | | | 2.59 | % | | | 2.63 | % | | | 2.78 | % | | | 3.58 | % |
Total expensesd | | | 4.74 | % | | | 5.65 | % | | | 5.13 | % | | | 4.05 | % |
Net expensese,f,g | | | 1.59 | % | | | 1.59 | % | | | 1.60 | % | | | 1.52 | % |
Portfolio turnover rate | | | 58 | % | | | 37 | % | | | 44 | % | | | 83 | % |
16 | THE GUGGENHEIM FUNDS ANNUAL REPORT | SEE NOTES TO FINANCIAL STATEMENTS. |
FINANCIAL HIGHLIGHTS (continued) |
This table is presented to show selected data for a share outstanding throughout each period and to assist shareholders in evaluating a Fund’s performance for the periods presented.
P-Class | | Year Ended
September 30,
2019 | | | Year Ended
September 30,
2018 | | | Year Ended
September 30,
2017 | | | Period Ended
September 30,
2016a | |
Per Share Data | | | | | | | | | | | | | | | | |
Net asset value, beginning of period | | $ | 26.70 | | | $ | 27.58 | | | $ | 27.11 | | | $ | 25.00 | |
Income (loss) from investment operations: |
Net investment income (loss)b | | | .85 | | | | .91 | | | | .95 | | | | .74 | |
Net gain (loss) on investments (realized and unrealized) | | | .51 | | | | (.70 | ) | | | .89 | | | | 2.05 | |
Total from investment operations | | | 1.36 | | | | .21 | | | | 1.84 | | | | 2.79 | |
Less distributions from: |
Net investment income | | | (.79 | ) | | | (.90 | ) | | | (.93 | ) | | | (.68 | ) |
Net realized gains | | | (.30 | ) | | | (.19 | ) | | | (.44 | ) | | | — | |
Total distributions | | | (1.09 | ) | | | (1.09 | ) | | | (1.37 | ) | | | (.68 | ) |
Net asset value, end of period | | $ | 26.97 | | | $ | 26.70 | | | $ | 27.58 | | | $ | 27.11 | |
|
Total Return | | | 5.23 | % | | | 0.82 | % | | | 7.00 | % | | | 11.27 | % |
Ratios/Supplemental Data |
Net assets, end of period (in thousands) | | $ | 131 | | | $ | 125 | | | $ | 123 | | | $ | 111 | |
Ratios to average net assets: |
Net investment income (loss) | | | 3.22 | % | | | 3.37 | % | | | 3.51 | % | | | 4.32 | % |
Total expensesd | | | 3.97 | % | | | 4.82 | % | | | 4.23 | % | | | 3.21 | % |
Net expensese,f,g | | | 0.85 | % | | | 0.84 | % | | | 0.85 | % | | | 0.80 | % |
Portfolio turnover rate | | | 58 | % | | | 37 | % | | | 44 | % | | | 83 | % |
SEE NOTES TO FINANCIAL STATEMENTS. | THE GUGGENHEIM FUNDS ANNUAL REPORT | 17 |
FINANCIAL HIGHLIGHTS (concluded) |
This table is presented to show selected data for a share outstanding throughout each period and to assist shareholders in evaluating a Fund’s performance for the periods presented.
Institutional Class | | Year Ended
September 30,
2019 | | | Year Ended
September 30,
2018 | | | Year Ended
September 30,
2017 | | | Period Ended
September 30,
2016a | |
Per Share Data | | | | | | | | | | | | | | | | |
Net asset value, beginning of period | | $ | 26.72 | | | $ | 27.59 | | | $ | 27.11 | | | $ | 25.00 | |
Income (loss) from investment operations: |
Net investment income (loss)b | | | .92 | | | | .98 | | | | 1.03 | | | | .79 | |
Net gain (loss) on investments (realized and unrealized) | | | .49 | | | | (.70 | ) | | | .89 | | | | 2.04 | |
Total from investment operations | | | 1.41 | | | | .28 | | | | 1.92 | | | | 2.83 | |
Less distributions from: |
Net investment income | | | (.85 | ) | | | (.96 | ) | | | (1.00 | ) | | | (.72 | ) |
Net realized gains | | | (.30 | ) | | | (.19 | ) | | | (.44 | ) | | | — | |
Total distributions | | | (1.15 | ) | | | (1.15 | ) | | | (1.44 | ) | | | (.72 | ) |
Net asset value, end of period | | $ | 26.98 | | | $ | 26.72 | | | $ | 27.59 | | | $ | 27.11 | |
|
Total Return | | | 5.52 | % | | | 1.06 | % | | | 7.30 | % | | | 11.44 | % |
Ratios/Supplemental Data |
Net assets, end of period (in thousands) | | $ | 6,165 | | | $ | 5,757 | | | $ | 5,619 | | | $ | 5,239 | |
Ratios to average net assets: |
Net investment income (loss) | | | 3.47 | % | | | 3.62 | % | | | 3.78 | % | | | 4.57 | % |
Total expensesd | | | 3.58 | % | | | 4.42 | % | | | 3.83 | % | | | 2.93 | % |
Net expensese,f,g | | | 0.60 | % | | | 0.60 | % | | | 0.59 | % | | | 0.54 | % |
Portfolio turnover rate | | | 58 | % | | | 37 | % | | | 44 | % | | | 83 | % |
a | Since commencement of operations: January 29, 2016. Percentage amounts for the period, except total return and portfolio turnover rate, have been annualized. |
b | Net investment income (loss) per share was computed using average shares outstanding throughout the period. |
c | Total return does not reflect the impact of any applicable sales charges. |
d | Does not include expenses of the underlying funds in which the Fund invests. |
e | Net expense information reflects the expense ratios after expense waivers and reimbursements, as applicable. |
f | Net expenses may include expenses that are excluded from the expense limitation agreement. Excluding these expenses, the net expense ratios for the periods would be: |
| | | 09/30/19 | 09/30/18 | 09/30/17 | 09/30/16 |
| | A-Class | 0.85% | 0.84% | 0.82% | 0.76% |
| | C-Class | 1.59% | 1.58% | 1.57% | 1.52% |
| | P-Class | 0.85% | 0.84% | 0.82% | 0.79% |
| | Institutional Class | 0.60% | 0.59% | 0.57% | 0.54% |
g | The portion of the ratios of net expenses to average net assets attributable to recoupments of prior fee reductions or expense reimbursements for the years presented was as follows: |
| | | 09/30/19 | 09/30/18 | 09/30/17 |
| | A-Class | — | — | 0.19% |
| | C-Class | — | — | 0.19% |
| | P-Class | — | — | 0.16% |
| | Institutional Class | — | — | 0.16% |
18 | THE GUGGENHEIM FUNDS ANNUAL REPORT | SEE NOTES TO FINANCIAL STATEMENTS. |
MANAGERS’ COMMENTARY (Unaudited) | September 30, 2019 |
To Our Shareholders
Guggenheim High Yield Fund (the “Fund”) is managed by a team of seasoned professionals, including B. Scott Minerd, Chairman of Investments and Global Chief Investment Officer; Kevin H. Gundersen, Senior Managing Director and Portfolio Manager; Thomas J. Hauser, Senior Managing Director and Portfolio Manager; and Richard de Wet, Director and Portfolio Manager. In the following paragraphs, the investment team discusses the market environment and the Fund’s performance for the fiscal year ended September 30, 2019.
For the one year period ended September 30, 2019, Guggenheim High Yield Bond Fund returned 4.99%1, compared to 6.36% return of its benchmark, the Bloomberg Barclays U.S. Corporate High Yield Index.
The high-yield market delivered its third straight quarter of positive performance, more than offsetting the negative performance from the fourth quarter of 2018. Fundamental factors underlying the corporate sector are supportive of high-yield bonds. Average leverage and interest coverage ratios remain strong coupled with stable corporate earnings. Notably, the trailing 12 month default rate2 in the ICE BofA Merrill Lynch High-Yield Index ticked higher and reached 1.67% at the end of September 2019, driven by the energy sector. However, the default rate excluding energy remains stable at less than 1%. Despite a positive fundamental backdrop, the high-yield market has experienced bouts of volatility on the back of concerns over trade, which has added some uncertainty to future economic growth. We believe credit selection will become increasingly important and expect the Fund to perform well in this type of environment.
The Fund invests in non-U.S. dollar denominated assets when the risk-return profile is favorable. Non-U.S. dollar denominated assets comprise less than 2% of the Fund. The Fund entered into currency forward contracts to hedge exchange rate risk. Over the course of the year, the U.S. dollar appreciated versus foreign currencies which resulted in a positive impact on the forward contracts and added to performance. This was offset by depreciation of the foreign currency assets in U.S. dollar terms.
Fund relative underperformance over the period was primarily due to the exposure to bank loans. During the fourth quarter of 2018, bank loans contributed positively to performance, as they experienced a smaller drawdown versus the broader high yield market. However, in 2019 bank loans have returned about half of the performance of high yield bonds. In addition, some individual investments in the Consumer Non-Cyclical sector underperformed the broader high yield market.
Performance was positively impacted by strong credit selection in energy, driven by defensive positioning in the sector. The Fund typically invests in energy credits that are less exposed to underlying commodity prices as evidenced by the underweight to oil field services and the overweight to midstream companies. In addition, the Fund avoided weak CCC-rated bonds and increased its exposure to higher quality credit, including BB-rated bonds. Over the period, CCCs underperformed higher quality bonds, signaling investor resistance to owning lower quality bonds at this stage of the cycle. The Fund is consistently positioned conservatively in terms of duration, with higher exposure to short-dated bonds and floating rate securities (bank loans), which decreases volatility as well as diversifies sources of return.
Performance displayed represents past performance which is no guarantee of future results.
1 | Performance figures are based on Class A shares and do not reflect deduction of the sales charges or taxes that a shareholder would pay on distributions or the redemption of shares. |
2 | Default rate of ICE BofA Merrill Lynch U.S. High Yield Master II Index. |
The opinions and forecast expressed may not actually come to pass. This information is subject to change at any time, based on market and other conditions, and should not be construed as a recommendation of any specific security or strategy.
| | THE GUGGENHEIM FUNDS ANNUAL REPORT | 19 |
PERFORMANCE REPORT AND FUND PROFILE (Unaudited) | September 30, 2019 |
HIGH YIELD FUND
OBJECTIVE: Seeks high current income. Capital appreciation is a secondary objective.
Holdings Diversification (Market Exposure as % of Net Assets)
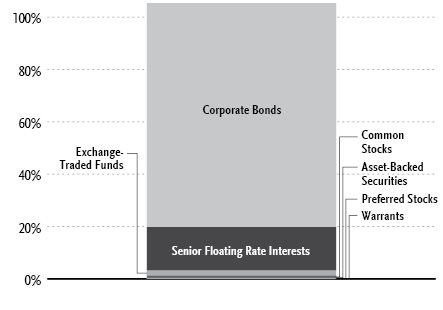
“Holdings Diversification (Market Exposure as % of Net Assets)” excludes any temporary cash investments.
Portfolio Composition by Quality Rating1 |
Rating | | % of Total
Investments | |
Fixed Income Instruments | | | | |
A | | | 0.1 | % |
BBB | | | 7.4 | % |
BB | | | 45.4 | % |
B | | | 34.7 | % |
CCC | | | 7.6 | % |
CC | | | 0.0 | %** |
NR2 | | | 2.0 | % |
Other Instruments | | | 2.8 | % |
Total Investments | | | 100.0 | % |
Inception Dates: |
A-Class | August 5, 1996 |
C-Class | May 1, 2000 |
P-Class | May 1, 2015 |
Institutional Class | July 11, 2008 |
R6-Class | May 15, 2017 |
Ten Largest Holdings (% of Total Net Assets) |
SPDR Bloomberg Barclays Short Term High Yield Bond ETF | 1.9% |
Vector Group Ltd., 6.13% | 1.6% |
LBC Tank Terminals Holding Netherlands BV, 6.88% | 1.5% |
Indigo Natural Resources LLC, 6.88% | 1.5% |
Fidelity & Guaranty Life Holdings, Inc., 5.50% | 1.5% |
Great Lakes Dredge & Dock Corp., 8.00% | 1.5% |
EIG Investors Corp., 10.88% | 1.4% |
American Midstream Partners Limited Partnership / American Midstream Finance Corp., 9.50% | 1.4% |
Altice France S.A., 7.38% | 1.3% |
Terraform Global Operating LLC, 6.13% | 1.3% |
Top Ten Total | 14.9% |
| | |
“Ten Largest Holdings” excludes any temporary cash or derivative investments. |
1 | Source: BlackRock Solutions. Credit quality ratings are measured on a scale that generally ranges from AAA (highest) to D (lowest). All securities except for those labeled “NR” have been rated by Moody’s, Standard & Poor’s (“S&P”), or Fitch, each of which is a Nationally Recognized Statistical Rating Organization (“NRSRO”). For purposes of this presentation, when ratings are available from more than one agency, the highest rating is used. Guggenheim Investments has converted ratings to the equivalent S&P rating. Security ratings are determined at the time of purchase and may change thereafter. |
2 | NR securities do not necessarily indicate low credit quality. |
** | Less than 0.1%. |
20 | THE GUGGENHEIM FUNDS ANNUAL REPORT | |
PERFORMANCE REPORT AND FUND PROFILE (Unaudited)(concluded) | September 30, 2019 |
Cumulative Fund Performance*

Average Annual Returns*
Periods Ended September 30, 2019
| 1 Year | 5 Year | 10 Year |
A-Class Shares | 4.99% | 4.77% | 7.05% |
A-Class Shares with sales charge‡ | 0.79% | 3.76% | 6.53% |
C-Class Shares | 4.12% | 3.98% | 6.25% |
C-Class Shares with CDSC§ | 3.13% | 3.98% | 6.25% |
Institutional Class Shares | 5.15% | 5.03% | 7.35% |
Bloomberg Barclays U.S. Corporate High Yield Index | 6.36% | 5.37% | 7.94% |
| | 1 Year | Since
Inception
(05/01/15) |
P-Class Shares | | 4.98% | 5.03% |
Bloomberg Barclays U.S. Corporate High Yield Index | | 6.36% | 5.46% |
| | 1 Year | Since
Inception
(05/15/17) |
R6-Class Shares | | 5.39% | 4.31% |
Bloomberg Barclays U.S. Corporate High Yield Index | | 6.36% | 5.08% |
* | The performance data above represents past performance that is not predictive of future results. The investment return and principal value of an investment in the Fund will fluctuate so that an investor’s shares, when redeemed, may be worth more or less than their original cost. Returns are historical and include changes in principal and reinvested dividends and capital gains and do not reflect the effect of taxes. The Bloomberg Barclays U.S. Corporate High Yield Index is an unmanaged index and, unlike the Fund, has no management fees or operating expenses to reduce its reported return. The graph is based on A-Class shares only; performance for C-Class shares, P-Class shares, R6-Class shares and Institutional Class shares will vary due to differences in fee structures. |
‡ | Effective October 1, 2015, the maximum sales charge decreased from 4.75% to 4.00%. A 4.75% maximum sales charge is used in the calculation of the Average Annual Returns based on subscriptions made prior to October 1, 2015, and a 4.00% maximum sales charge is used to calculate performance for periods based on subscriptions made on or after October 2, 2015. |
§ | Fund returns include a CDSC of 1% if redeemed within 12 months of purchase. |
| | THE GUGGENHEIM FUNDS ANNUAL REPORT | 21 |
SCHEDULE OF INVESTMENTS | September 30, 2019 |
HIGH YIELD FUND | |
| | Shares | | | Value | |
COMMON STOCKS† - 0.8% |
| | | | | | | | | |
Consumer, Non-cyclical - 0.4% |
Chef Holdings, Inc.*,†††,1 | | | 7,502 | | | $ | 944,052 | |
ATD New Holdings, Inc.*,†† | | | 21,488 | | | | 601,664 | |
Cengage Learning Holdings II, Inc.*,†† | | | 2,107 | | | | 24,231 | |
Targus Group International Equity, Inc.†††,1,2 | | | 12,825 | | | | 21,720 | |
Spectrum Brands Holdings, Inc. | | | 2 | | | | 107 | |
Crimson Wine Group Ltd.* | | | 8 | | | | 60 | |
Total Consumer, Non-cyclical | | | | | | | 1,591,834 | |
| | | | | | | | | |
Utilities - 0.2% |
TexGen Power LLC††† | | | 26,665 | | | | 1,066,600 | |
| | | | | | | | | |
Consumer, Cyclical - 0.1% |
Metro-Goldwyn-Mayer, Inc.*,†† | | | 7,040 | | | | 421,224 | |
| | | | | | | | | |
Energy - 0.1% |
SandRidge Energy, Inc.* | | | 51,278 | | | | 241,007 | |
| | | | | | | | | |
Industrial - 0.0% |
BP Holdco LLC*,†††,1,2 | | | 23,711 | | | | 8,372 | |
Vector Phoenix Holdings, LP*,†††,1 | | | 23,711 | | | | 1,984 | |
Total Industrial | | | | | | | 10,356 | |
| | | | | | | | | |
Financial - 0.0% |
Jefferies Financial Group, Inc. | | | 81 | | | | 1,490 | |
| | | | | | | | | |
Total Common Stocks | | | | | | | | |
(Cost $4,731,879) | | | | | | | 3,332,511 | |
| | | | | | | | | |
PREFERRED STOCKS††† - 0.1% |
Utilities - 0.1% |
MediaNews Group, Inc.*,1 | | | 1,107 | | | | 534,846 | |
| | | | | | | | | |
Industrial – 0.0% |
U.S. Shipping Corp.*,1 | | | 14,718 | | | | — | |
Total Preferred Stocks | | | | | | | | |
(Cost $535,573) | | | | | | | 534,846 | |
| | | | | | | | | |
WARRANTS†† - 0.0% |
SandRidge Energy, Inc. | | | | | | | | |
$41.34, 10/04/22* | | | 488 | | | | 24 | |
SandRidge Energy, Inc. | | | | | | | | |
$42.03, 10/04/22* | | | 205 | | | | 21 | |
Total Warrants | | | | | | | | |
(Cost $43,811) | | | | | | | 45 | |
| | | | | | | | | |
EXCHANGE-TRADED FUNDS† - 1.9% |
SPDR Bloomberg Barclays Short Term High Yield Bond ETF | | | 300,000 | | | | 8,103,000 | |
Total Exchange-Traded Funds | | | | | | | | |
(Cost $8,141,077) | | | | | | | 8,103,000 | |
| | | | | | | | | |
MONEY MARKET FUND† - 0.2% |
Dreyfus Treasury Securities Cash Management Fund — Institutional Shares 1.83%3 | | | 800,763 | | | | 800,763 | |
Total Money Market Fund | | | | | | | | |
(Cost $800,763) | | | | | | | 800,763 | |
| | | | | | | | | |
| | | Face
Amount~ | | | | | |
CORPORATE BONDS†† - 85.6% |
Financial - 17.3% |
Jefferies Finance LLC / JFIN Company-Issuer Corp. | | | | | | | | |
7.25% due 08/15/244 | | | 4,150,000 | | | | 4,134,438 | |
6.25% due 06/03/264 | | | 3,950,000 | | | | 4,078,375 | |
Fidelity & Guaranty Life Holdings, Inc. | | | | | | | | |
5.50% due 05/01/254,5 | | | 5,900,000 | | | | 6,327,750 | |
Hunt Companies, Inc. | | | | | | | | |
6.25% due 02/15/264 | | | 5,315,000 | | | | 5,208,700 | |
LoanCore Capital Markets LLC / JLC Finance Corp. | | | | | | | | |
6.88% due 06/01/204 | | | 5,075,000 | | | | 5,011,563 | |
Quicken Loans, Inc. | | | | | | | | |
5.25% due 01/15/284 | | | 4,350,000 | | | | 4,489,200 | |
5.75% due 05/01/254 | | | 325,000 | | | | 335,156 | |
Icahn Enterprises, LP / Icahn Enterprises Finance Corp. | | | | | | | | |
5.88% due 02/01/22 | | | 4,225,000 | | | | 4,269,891 | |
Kennedy-Wilson, Inc. | | | | | | | | |
5.88% due 04/01/24 | | | 3,553,000 | | | | 3,645,165 | |
AmWINS Group, Inc. | | | | | | | | |
7.75% due 07/01/264 | | | 2,950,000 | | | | 3,171,250 | |
Newmark Group, Inc. | | | | | | | | |
6.13% due 11/15/23 | | | 2,900,000 | | | | 3,146,013 | |
GEO Group, Inc. | | | | | | | | |
5.88% due 10/15/24 | | | 2,000,000 | | | | 1,720,000 | |
6.00% due 04/15/26 | | | 1,050,000 | | | | 847,350 | |
5.88% due 01/15/22 | | | 500,000 | | | | 482,370 | |
Citigroup, Inc. | | | | | | | | |
6.25%6,7 | | | 1,900,000 | | | | 2,116,125 | |
5.95%6,7 | | | 850,000 | | | | 899,954 | |
Springleaf Finance Corp. | | | | | | | | |
6.13% due 03/15/24 | | | 1,125,000 | | | | 1,210,781 | |
7.13% due 03/15/26 | | | 1,050,000 | | | | 1,164,791 | |
6.63% due 01/15/28 | | | 450,000 | | | | 483,885 | |
CoreCivic, Inc. | | | | | | | | |
4.75% due 10/15/27 | | | 2,700,000 | | | | 2,372,625 | |
Oxford Finance LLC / Oxford Finance Company-Issuer II, Inc. | | | | | | | | |
6.38% due 12/15/224,5 | | | 2,250,000 | | | | 2,340,000 | |
American Equity Investment Life Holding Co. | | | | | | | | |
5.00% due 06/15/27 | | | 2,200,000 | | | | 2,312,019 | |
Greystar Real Estate Partners LLC | | | | | | | | |
5.75% due 12/01/254 | | | 2,050,000 | | | | 2,108,937 | |
22 | THE GUGGENHEIM FUNDS ANNUAL REPORT | SEE NOTES TO FINANCIAL STATEMENTS. |
SCHEDULE OF INVESTMENTS (continued) | September 30, 2019 |
HIGH YIELD FUND | |
| | Face
Amount~ | | | Value | |
JPMorgan Chase & Co. | | | | | | | | |
6.13%6,7 | | | 1,250,000 | | | $ | 1,354,463 | |
6.00%6,7 | | | 500,000 | | | | 534,285 | |
USI, Inc. | | | | | | | | |
6.88% due 05/01/254 | | | 1,650,000 | | | | 1,674,717 | |
CNO Financial Group, Inc. | | | | | | | | |
5.25% due 05/30/29 | | | 1,350,000 | | | | 1,478,250 | |
Iron Mountain, Inc. | | | | | | | | |
4.88% due 09/15/294 | | | 1,350,000 | | | | 1,370,655 | |
Goldman Sachs Group, Inc. | | | | | | | | |
5.30%5,6,7 | | | 1,100,000 | | | | 1,155,000 | |
NFP Corp. | | | | | | | | |
6.88% due 07/15/254 | | | 1,150,000 | | | | 1,141,375 | |
Assurant, Inc. | | | | | | | | |
7.00% due 03/27/487 | | | 950,000 | | | | 1,059,250 | |
CIT Bank North America | | | | | | | | |
2.97% due 09/27/257 | | | 850,000 | | | | 849,745 | |
Wilton Re Finance LLC | | | | | | | | |
5.88% due 03/30/334,7 | | | 650,000 | | | | 666,845 | |
Service Properties Trust | | | | | | | | |
4.95% due 02/15/27 | | | 500,000 | | | | 506,584 | |
Equinix, Inc. | | | | | | | | |
5.88% due 01/15/26 | | | 400,000 | | | | 425,564 | |
Wells Fargo & Co. | | | | | | | | |
5.90%6,7 | | | 250,000 | | | | 265,852 | |
Total Financial | | | | | | | 74,358,923 | |
| | | | | | | | | |
Communications - 15.4% |
CCO Holdings LLC / CCO Holdings Capital Corp. | | | | | | | | |
5.38% due 06/01/294 | | | 3,600,000 | | | | 3,834,000 | |
4.75% due 03/01/304 | | | 2,550,000 | | | | 2,588,785 | |
5.13% due 05/01/274 | | | 1,000,000 | | | | 1,043,750 | |
5.13% due 02/15/23 | | | 700,000 | | | | 711,375 | |
5.00% due 02/01/284 | | | 425,000 | | | | 439,344 | |
Level 3 Financing, Inc. | | | | | | | | |
4.63% due 09/15/274 | | | 3,100,000 | | | | 3,128,055 | |
5.38% due 01/15/24 | | | 2,100,000 | | | | 2,141,685 | |
5.63% due 02/01/235 | | | 1,134,000 | | | | 1,148,175 | |
5.38% due 08/15/22 | | | 900,000 | | | | 905,062 | |
5.25% due 03/15/26 | | | 575,000 | | | | 597,914 | |
Altice France S.A. | | | | | | | | |
7.38% due 05/01/264 | | | 5,300,000 | | | | 5,682,713 | |
8.13% due 02/01/274 | | | 1,600,000 | | | | 1,766,000 | |
EIG Investors Corp. | | | | | | | | |
10.88% due 02/01/24 | | | 5,850,000 | | | | 6,084,000 | |
Virgin Media Secured Finance plc | | | | | | | | |
5.50% due 05/15/294 | | | 5,100,000 | | | | 5,323,125 | |
CSC Holdings LLC | | | | | | | | |
6.50% due 02/01/294 | | | 3,200,000 | | | | 3,556,720 | |
5.75% due 01/15/304 | | | 1,300,000 | | | | 1,358,656 | |
Cengage Learning, Inc. | | | | | | | | |
9.50% due 06/15/244 | | | 4,658,000 | | | | 4,262,070 | |
MDC Partners, Inc. | | | | | | | | |
6.50% due 05/01/244 | | | 3,622,000 | | | | 3,300,548 | |
Sirius XM Radio, Inc. | | | | | | | | |
4.63% due 07/15/244 | | | 1,600,000 | | | | 1,658,928 | |
5.50% due 07/01/294 | | | 1,400,000 | | | | 1,494,500 | |
McGraw-Hill Global Education Holdings LLC / McGraw-Hill Global Education Finance | | | | | | | | |
7.88% due 05/15/244 | | | 3,467,000 | | | | 2,998,955 | |
GrubHub Holdings, Inc. | | | | | | | | |
5.50% due 07/01/274 | | | 2,100,000 | | | | 2,142,630 | |
Ziggo BV | | | | | | | | |
5.50% due 01/15/274 | | | 1,900,000 | | | | 1,980,180 | |
Altice Financing S.A. | | | | | | | | |
6.63% due 02/15/234 | | | 1,700,000 | | | | 1,744,625 | |
Sprint Communications, Inc. | | | | | | | | |
7.00% due 03/01/204 | | | 1,600,000 | | | | 1,626,000 | |
Telenet Finance Lux Note | | | | | | | | |
5.50% due 03/01/28 | | | 1,400,000 | | | | 1,466,500 | |
Midcontinent Communications / Midcontinent Finance Corp. | | | | | | | | |
5.38% due 08/15/274 | | | 1,000,000 | | | | 1,052,500 | |
Ziggo Bond Company BV | | | | | | | | |
6.00% due 01/15/274 | | | 850,000 | | | | 887,188 | |
Match Group, Inc. | | | | | | | | |
5.63% due 02/15/294 | | | 820,000 | | | | 879,450 | |
Cogent Communications Group, Inc. | | | | | | | | |
5.38% due 03/01/224 | | | 400,000 | | | | 416,000 | |
Total Communications | | | | | | | 66,219,433 | |
| | | | | | | | | |
Consumer, Non-cyclical - 14.0% |
Vector Group Ltd. | | | | | | | | |
6.13% due 02/01/254,5 | | | 7,335,000 | | | | 7,023,263 | |
Bausch Health Companies, Inc. | | | | | | | | |
7.00% due 03/15/244 | | | 4,900,000 | | | | 5,149,704 | |
6.50% due 03/15/224 | | | 1,000,000 | | | | 1,033,750 | |
5.75% due 08/15/274 | | | 400,000 | | | | 432,332 | |
Midas Intermediate Holdco II LLC / Midas Intermediate Holdco II Finance, Inc. | | | | | | | | |
7.88% due 10/01/224 | | | 5,577,000 | | | | 5,172,667 | |
FAGE International S.A. / FAGE USA Dairy Industry, Inc. | | | | | | | | |
5.63% due 08/15/264,5 | | | 4,790,000 | | | | 4,299,025 | |
Tenet Healthcare Corp. | | | | | | | | |
6.25% due 02/01/274 | | | 2,000,000 | | | | 2,083,100 | |
5.13% due 11/01/274 | | | 2,000,000 | | | | 2,066,700 | |
Par Pharmaceutical, Inc. | | | | | | | | |
7.50% due 04/01/274 | | | 4,350,000 | | | | 3,985,687 | |
Prime Security Services Borrower LLC / Prime Finance, Inc. | | | | | | | | |
5.75% due 04/15/264 | | | 3,350,000 | | | | 3,488,355 | |
5.25% due 04/15/244 | | | 450,000 | | | | 461,948 | |
Harsco Corp. | | | | | | | | |
5.75% due 07/31/274 | | | 2,950,000 | | | | 3,071,835 | |
Beverages & More, Inc. | | | | | | | | |
11.50% due 06/15/228 | | | 3,525,000 | | | | 2,538,000 | |
Nathan’s Famous, Inc. | | | | | | | | |
6.63% due 11/01/254 | | | 2,500,000 | | | | 2,487,500 | |
Nielsen Finance LLC / Nielsen Finance Co. | | | | | | | | |
5.00% due 04/15/224 | | | 2,300,000 | | | | 2,306,440 | |
SEE NOTES TO FINANCIAL STATEMENTS. | THE GUGGENHEIM FUNDS ANNUAL REPORT | 23 |
SCHEDULE OF INVESTMENTS (continued) | September 30, 2019 |
HIGH YIELD FUND | |
| | Face
Amount~ | | | Value | |
HCA, Inc. | | | | | | | | |
5.88% due 02/01/29 | | | 2,050,000 | | | $ | 2,302,622 | |
Endo Dac / Endo Finance LLC / Endo Finco, Inc. | | | | | | | | |
5.88% due 10/15/244 | | | 1,168,000 | | | | 1,033,680 | |
6.00% due 07/15/234 | | | 1,500,000 | | | | 920,025 | |
C&S Group Enterprises LLC | | | | | | | | |
5.38% due 07/15/224 | | | 1,800,000 | | | | 1,820,250 | |
KeHE Distributors LLC / KeHE Finance Corp. | | | | | | | | |
8.63% due 10/15/264 | | | 1,750,000 | | | | 1,785,000 | |
AMN Healthcare, Inc. | | | | | | | | |
4.63% due 10/01/274 | | | 1,600,000 | | | | 1,608,000 | |
DaVita, Inc. | | | | | | | | |
5.00% due 05/01/25 | | | 1,600,000 | | | | 1,593,712 | |
Flexi-Van Leasing, Inc. | | | | | | | | |
10.00% due 02/15/234 | | | 1,375,000 | | | | 1,344,062 | |
BidFair MergeRight, Inc. | | | | | | | | |
7.38% due 10/15/274 | | | 950,000 | | | | 967,879 | |
Avanos Medical, Inc. | | | | | | | | |
6.25% due 10/15/22 | | | 775,000 | | | | 787,594 | |
Post Holdings, Inc. | | | | | | | | |
5.50% due 12/15/294,5 | | | 425,000 | | | | 443,062 | |
Total Consumer, Non-cyclical | | | | | | | 60,206,192 | |
| | | | | | | | | |
Consumer, Cyclical - 11.2% |
LBC Tank Terminals Holding Netherlands BV | | | | | | | | |
6.88% due 05/15/234 | | | 6,465,000 | | | | 6,586,219 | |
Suburban Propane Partners Limited Partnership/Suburban Energy Finance Corp. | | | | | | | | |
5.75% due 03/01/25 | | | 1,950,000 | | | | 1,987,362 | |
5.88% due 03/01/27 | | | 1,610,000 | | | | 1,645,452 | |
5.50% due 06/01/24 | | | 1,225,000 | | | | 1,249,500 | |
Wabash National Corp. | | | | | | | | |
5.50% due 10/01/254 | | | 3,685,000 | | | | 3,620,512 | |
AMC Entertainment Holdings, Inc. | | | | | | | | |
6.13% due 05/15/27 | | | 3,150,000 | | | | 2,850,750 | |
5.88% due 11/15/26 | | | 500,000 | | | | 453,750 | |
Williams Scotsman International, Inc. | | | | | | | | |
6.88% due 08/15/234 | | | 2,550,000 | | | | 2,671,125 | |
7.88% due 12/15/224 | | | 550,000 | | | | 574,750 | |
Titan International, Inc. | | | | | | | | |
6.50% due 11/30/23 | | | 3,100,000 | | | | 2,464,500 | |
JB Poindexter & Company, Inc. | | | | | | | | |
7.13% due 04/15/264 | | | 2,225,000 | | | | 2,302,875 | |
Sabre GLBL, Inc. | | | | | | | | |
5.38% due 04/15/234 | | | 2,100,000 | | | | 2,142,000 | |
Superior Plus Limited Partnership / Superior General Partner, Inc. | | | | | | | | |
7.00% due 07/15/264 | | | 2,000,000 | | | | 2,110,040 | |
MGM Resorts International | | | | | | | | |
5.50% due 04/15/27 | | | 1,800,000 | | | | 1,972,530 | |
HD Supply, Inc. | | | | | | | | |
5.38% due 10/15/264 | | | 1,800,000 | | | | 1,905,750 | |
Party City Holdings, Inc. | | | | | | | | |
6.63% due 08/01/264,5 | | | 1,600,000 | | | | 1,584,000 | |
Anixter, Inc. | | | | | | | | |
6.00% due 12/01/25 | | | 1,400,000 | | | | 1,547,000 | |
VOC Escrow Ltd. | | | | | | | | |
5.00% due 02/15/284 | | | 1,375,000 | | | | 1,419,825 | |
Wynn Las Vegas LLC / Wynn Las Vegas Capital Corp. | | | | | | | | |
5.50% due 03/01/254 | | | 1,250,000 | | | | 1,316,000 | |
Panther BF Aggregator 2 Limited Partnership / Panther Finance Company, Inc. | | | | | | | | |
8.50% due 05/15/274 | | | 1,165,000 | | | | 1,179,562 | |
Resideo Funding, Inc. | | | | | | | | |
6.13% due 11/01/264 | | | 1,050,000 | | | | 1,107,750 | |
Murphy Oil USA, Inc. | | | | | | | | |
5.63% due 05/01/27 | | | 1,000,000 | | | | 1,055,000 | |
Boyne USA, Inc. | | | | | | | | |
7.25% due 05/01/254 | | | 800,000 | | | | 871,680 | |
Cedar Fair, LP | | | | | | | | |
5.25% due 07/15/294 | | | 750,000 | | | | 802,500 | |
1011778 BC ULC / New Red Finance, Inc. | | | | | | | | |
3.88% due 01/15/284 | | | 750,000 | | | | 754,770 | |
Allison Transmission, Inc. | | | | | | | | |
4.75% due 10/01/274 | | | 600,000 | | | | 615,750 | |
Beacon Roofing Supply, Inc. | | | | | | | | |
4.50% due 11/15/264 | | | 500,000 | | | | 505,000 | |
Performance Food Group, Inc. | | | | | | | | |
5.50% due 10/15/274 | | | 450,000 | | | | 473,625 | |
QVC, Inc. | | | | | | | | |
4.85% due 04/01/24 | | | 400,000 | | | | 422,168 | |
Total Consumer, Cyclical | | | | | | | 48,191,745 | |
| | | | | | | | | |
Energy - 10.2% |
Indigo Natural Resources LLC | | | | | | | | |
6.88% due 02/15/264 | | | 7,050,000 | | | | 6,353,812 | |
American Midstream Partners Limited Partnership / American Midstream Finance Corp. | | | | | | | | |
9.50% due 12/15/214 | | | 6,440,000 | | | | 6,053,600 | |
Unit Corp. | | | | | | | | |
6.63% due 05/15/21 | | | 5,643,000 | | | | 4,274,572 | |
Exterran Energy Solutions Limited Partnership / EES Finance Corp. | | | | | | | | |
8.13% due 05/01/25 | | | 3,917,000 | | | | 3,902,312 | |
PDC Energy, Inc. | | | | | | | | |
6.13% due 09/15/24 | | | 2,750,000 | | | | 2,743,125 | |
Antero Midstream Partners Limited Partnership / Antero Midstream Finance Corp. | | | | | | | | |
5.75% due 01/15/284 | | | 2,650,000 | | | | 2,199,500 | |
Summit Midstream Holdings LLC / Summit Midstream Finance Corp. | | | | | | | | |
5.75% due 04/15/25 | | | 2,475,000 | | | | 2,089,395 | |
Antero Resources Corp. | | | | | | | | |
5.13% due 12/01/22 | | | 2,225,000 | | | | 1,955,219 | |
Range Resources Corp. | | | | | | | | |
5.00% due 03/15/23 | | | 1,400,000 | | | | 1,225,000 | |
24 | THE GUGGENHEIM FUNDS ANNUAL REPORT | SEE NOTES TO FINANCIAL STATEMENTS. |
SCHEDULE OF INVESTMENTS (continued) | September 30, 2019 |
HIGH YIELD FUND | |
| | Face
Amount~ | | | Value | |
5.88% due 07/01/22 | | | 650,000 | | | $ | 622,375 | |
NuStar Logistics, LP | | | | | | | | |
5.63% due 04/28/27 | | | 960,000 | | | | 1,014,000 | |
6.00% due 06/01/26 | | | 750,000 | | | | 811,725 | |
CNX Resources Corp. | | | | | | | | |
5.88% due 04/15/22 | | | 1,623,000 | | | | 1,558,080 | |
Global Partners Limited Partnership / GLP Finance Corp. | | | | | | | | |
7.00% due 08/01/274 | | | 1,500,000 | | | | 1,545,000 | |
Moss Creek Resources Holdings, Inc. | | | | | | | | |
7.50% due 01/15/264 | | | 1,879,000 | | | | 1,383,414 | |
SRC Energy, Inc. | | | | | | | | |
6.25% due 12/01/25 | | | 1,375,000 | | | | 1,361,223 | |
Pattern Energy Group, Inc. | | | | | | | | |
5.88% due 02/01/244 | | | 1,275,000 | | | | 1,305,281 | |
Bruin E&P Partners LLC | | | | | | | | |
8.88% due 08/01/234 | | | 1,710,000 | | | | 1,278,225 | |
Crestwood Midstream Partners Limited Partnership / Crestwood Midstream Finance Corp. | | | | | | | | |
5.63% due 05/01/274 | | | 1,250,000 | | | | 1,276,175 | |
Basic Energy Services, Inc. | | | | | | | | |
10.75% due 10/15/238 | | | 1,225,000 | | | | 894,250 | |
Legacy Reserves Limited Partnership / Legacy Reserves Finance Corp. | | | | | | | | |
8.00% due 09/20/239 | | | 1,017,000 | | | | 25,425 | |
SandRidge Energy, Inc. | | | | | | | | |
7.50% due 03/15/21†††,1 | | | 250,000 | | | | — | |
Total Energy | | | | | | | 43,871,708 | |
| | | | | | | | | |
Industrial - 10.0% |
Great Lakes Dredge & Dock Corp. | | | | | | | | |
8.00% due 05/15/22 | | | 5,900,000 | | | | 6,288,220 | |
Grinding Media Inc. / MC Grinding Media Canada Inc. | | | | | | | | |
7.38% due 12/15/234,5 | | | 5,150,000 | | | | 4,918,250 | |
Standard Industries, Inc. | | | | | | | | |
4.75% due 01/15/284 | | | 2,770,000 | | | | 2,863,238 | |
5.38% due 11/15/244 | | | 1,500,000 | | | | 1,545,000 | |
Masonite International Corp. | | | | | | | | |
5.38% due 02/01/284 | | | 1,800,000 | | | | 1,876,500 | |
5.75% due 09/15/264 | | | 1,400,000 | | | | 1,477,000 | |
Ardagh Packaging Finance plc / Ardagh Holdings USA, Inc. | | | | | | | | |
5.25% due 08/15/274 | | | 2,800,000 | | | | 2,835,000 | |
Cleaver-Brooks, Inc. | | | | | | | | |
7.88% due 03/01/234 | | | 2,975,000 | | | | 2,818,813 | |
Amsted Industries, Inc. | | | | | | | | |
5.63% due 07/01/274 | | | 1,650,000 | | | | 1,740,750 | |
5.38% due 09/15/244 | | | 991,000 | | | | 1,012,059 | |
JELD-WEN, Inc. | | | | | | | | |
4.88% due 12/15/274 | | | 1,900,000 | | | | 1,881,000 | |
Intertape Polymer Group, Inc. | | | | | | | | |
7.00% due 10/15/264 | | | 1,800,000 | | | | 1,876,500 | |
Reynolds Group Issuer, Inc. / Reynolds Group Issuer LLC / Reynolds Group Issuer Luxembourg | | | | | | | | |
5.80% (3 Month USD LIBOR + 3.50%) due 07/15/214,10 | | | 1,067,000 | | | | 1,068,334 | |
5.13% due 07/15/234 | | | 1,000,000 | | | | 1,023,750 | |
5.75% due 10/15/20 | | | 726,831 | | | | 728,357 | |
Trinity Industries, Inc. | | | | | | | | |
4.55% due 10/01/24 | | | 1,740,000 | | | | 1,773,845 | |
Berry Global, Inc. | | | | | | | | |
4.88% due 07/15/264 | | | 1,550,000 | | | | 1,602,157 | |
New Enterprise Stone & Lime Company, Inc. | | | | | | | | |
6.25% due 03/15/264 | | | 1,525,000 | | | | 1,559,312 | |
American Woodmark Corp. | | | | | | | | |
4.88% due 03/15/264 | | | 1,075,000 | | | | 1,083,063 | |
Swissport Financing S.a r.l. | | | | | | | | |
5.25% due 08/14/24 | | EUR | 800,000 | | | | 903,838 | |
EnPro Industries, Inc. | | | | | | | | |
5.75% due 10/15/26 | | | 750,000 | | | | 799,687 | |
Summit Materials LLC / Summit Materials Finance Corp. | | | | | | | | |
6.50% due 03/15/274,5 | | | 700,000 | | | | 747,250 | |
TransDigm, Inc. | | | | | | | | |
6.25% due 03/15/264 | | | 350,000 | | | | 375,812 | |
Total Industrial | | | | | | | 42,797,735 | |
| | | | | | | | | |
Utilities - 2.8% |
Terraform Global Operating LLC | | | | | | | | |
6.13% due 03/01/264 | | | 5,330,000 | | | | 5,476,575 | |
AmeriGas Partners, LP / AmeriGas Finance Corp. | | | | | | | | |
5.50% due 05/20/25 | | | 2,550,000 | | | | 2,738,063 | |
5.75% due 05/20/27 | | | 1,100,000 | | | | 1,185,250 | |
Clearway Energy Operating LLC | | | | | | | | |
5.75% due 10/15/254 | | | 1,950,000 | | | | 2,052,375 | |
DPL, Inc. | | | | | | | | |
7.25% due 10/15/21 | | | 512,000 | | | | 549,120 | |
Total Utilities | | | | | | | 12,001,383 | |
| | | | | | | | | |
Basic Materials - 2.4% |
Alcoa Nederland Holding BV | | | | | | | | |
6.75% due 09/30/244 | | | 1,750,000 | | | | 1,839,687 | |
7.00% due 09/30/264 | | | 1,350,000 | | | | 1,464,791 | |
6.13% due 05/15/284 | | | 900,000 | | | | 958,410 | |
Neon Holdings, Inc. | | | | | | | | |
10.13% due 04/01/264 | | | 1,675,000 | | | | 1,687,563 | |
Valvoline, Inc. | | | | | | | | |
5.50% due 07/15/24 | | | 1,500,000 | | | | 1,560,000 | |
Novelis Corp. | | | | | | | | |
5.88% due 09/30/264 | | | 1,300,000 | | | | 1,363,310 | |
United States Steel Corp. | | | | | | | | |
6.88% due 08/15/255 | | | 1,125,000 | | | | 1,015,312 | |
SEE NOTES TO FINANCIAL STATEMENTS. | THE GUGGENHEIM FUNDS ANNUAL REPORT | 25 |
SCHEDULE OF INVESTMENTS (continued) | September 30, 2019 |
HIGH YIELD FUND | |
| | Face
Amount~ | | | Value | |
Yamana Gold, Inc. | | | | | | | | |
4.63% due 12/15/27 | | | 256,000 | | | $ | 271,112 | |
Mirabela Nickel Ltd. | | | | | | | | |
9.50% due 06/24/198,9 | | | 278,115 | | | | 13,906 | |
Total Basic Materials | | | | | | | 10,174,091 | |
| | | | | | | | | |
Technology - 2.3% |
NCR Corp. | | | | | | | | |
6.38% due 12/15/235 | | | 3,900,000 | | | | 4,007,250 | |
6.13% due 09/01/294 | | | 2,250,000 | | | | 2,371,612 | |
TIBCO Software, Inc. | | | | | | | | |
11.38% due 12/01/214 | | | 2,000,000 | | | | 2,086,875 | |
CDK Global, Inc. | | | | | | | | |
5.25% due 05/15/294 | | | 950,000 | | | | 983,250 | |
Qorvo, Inc. | | | | | | | | |
4.38% due 10/15/294 | | | 650,000 | | | | 654,469 | |
Total Technology | | | | | | | 10,103,456 | |
Total Corporate Bonds | | | | | | | | |
(Cost $371,374,378) | | | | | | | 367,924,666 | |
| | | | | | | | | |
SENIOR FLOATING RATE INTERESTS††,10 - 16.7% |
Technology - 3.6% |
MRI Software LLC | | | | | | | | |
7.80% (1 Month USD LIBOR + 5.75%, Rate Floor: 6.75%) due 06/30/23††† | | | 2,528,009 | | | | 2,502,729 | |
7.80% (1 Month USD LIBOR + 5.75%, Rate Floor: 6.75%) due 06/30/23 | | | 541,259 | | | | 535,846 | |
Lytx, Inc. | | | | | | | | |
8.79% (1 Month USD LIBOR + 6.75%, Rate Floor: 7.75%) due 08/31/23†††,1 | | | 2,273,165 | | | | 2,236,461 | |
Park Place Technologies LLC | | | | | | | | |
6.04% (1 Month USD LIBOR + 4.00%, Rate Floor: 5.00%) due 03/29/25 | | | 2,250,119 | | | | 2,235,111 | |
GlobalFoundries, Inc. | | | | | | | | |
6.06% (1 Month USD LIBOR + 4.00%, Rate Floor: 4.00%) due 06/05/26 | | | 1,500,000 | | | | 1,456,875 | |
Planview, Inc. | | | | | | | | |
7.29% (1 Month USD LIBOR + 5.25%, Rate Floor: 6.25%) due 01/27/23†††,1 | | | 1,173,000 | | | | 1,173,000 | |
Advanced Computer Software | | | | | | | | |
6.79% (1 Month USD LIBOR + 4.75%, Rate Floor: 4.75%) due 05/31/24 | | | 1,063,031 | | | | 1,060,820 | |
Emerald TopCo, Inc. (Press Ganey) | | | | | | | | |
5.54% (1 Month USD LIBOR + 3.50%, Rate Floor: 3.50%) due 07/24/26 | | | 1,000,000 | | | | 996,670 | |
Aston FinCo S.A.R.L. | | | | | | | | |
due 09/19/26 | | | 800,000 | | | | 792,504 | |
Cvent, Inc. | | | | | | | | |
5.79% (1 Month USD LIBOR + 3.75%, Rate Floor: 4.75%) due 11/29/24 | | | 742,462 | | | | 732,253 | |
Bullhorn, Inc. | | | | | | | | |
8.91% (3 Month USD LIBOR + 6.75%, Rate Floor: 7.75%) due 11/21/22†††,1 | | | 679,539 | | | | 676,884 | |
Optiv, Inc. | | | | | | | | |
5.29% (1 Month USD LIBOR + 3.25%, Rate Floor: 4.25%) due 02/01/24 | | | 810,679 | | | | 625,577 | |
Aspect Software, Inc. | | | | | | | | |
7.21% (3 Month USD LIBOR + 5.00%, Rate Floor: 6.00%) due 01/15/24 | | | 439,171 | | | | 414,468 | |
Solera LLC | | | | | | | | |
6.54% (1 Month USD LIBOR + 4.50% and 1 Week USD LIBOR + 4.50%, Rate Floor: 4.50%) due 03/03/21†††,1 | | | 208,333 | | | | 196,483 | |
Targus Group International, Inc. | | | | | | | | |
due 05/24/16†††,1,2,9 | | | 153,489 | | | | — | |
Total Technology | | | | | | | 15,635,681 | |
| | | | | | | | | |
Communications - 3.2% |
Resource Label Group LLC | | | | | | | | |
6.82% (3 Month USD LIBOR + 4.50%, Rate Floor: 5.50%) due 05/26/23††† | | | 1,850,530 | | | | 1,646,971 | |
10.82% (3 Month USD LIBOR + 8.50%, Rate Floor: 9.50%) due 11/26/23††† | | | 1,500,000 | | | | 1,245,000 | |
Houghton Mifflin Co. | | | | | | | | |
5.04% (1 Month USD LIBOR + 3.00%, Rate Floor: 4.00%) due 05/28/21 | | | 2,674,052 | | | | 2,591,612 | |
Cengage Learning Acquisitions, Inc. | | | | | | | | |
6.29% (1 Month USD LIBOR + 4.25%, Rate Floor: 5.25%) due 06/07/23 | | | 2,395,951 | | | | 2,262,185 | |
Market Track LLC | | | | | | | | |
6.29% (1 Month USD LIBOR + 4.25%, Rate Floor: 5.25%) due 06/05/24††† | | | 2,450,000 | | | | 2,205,000 | |
McGraw-Hill Global Education Holdings LLC | | | | | | | | |
6.04% (1 Month USD LIBOR + 4.00%, Rate Floor: 5.00%) due 05/04/22 | | | 1,886,384 | | | | 1,770,145 | |
GTT Communications, Inc. | | | | | | | | |
4.79% (1 Month USD LIBOR + 2.75%, Rate Floor: 2.75%) due 05/31/25 | | | 1,431,875 | | | | 1,148,292 | |
Imagine Print Solutions LLC | | | | | | | | |
6.80% (1 Month USD LIBOR + 4.75%, Rate Floor: 5.75%) due 06/21/22 | | | 1,072,500 | | | | 712,140 | |
Total Communications | | | | | | | 13,581,345 | |
| | | | | | | | | |
Industrial - 3.1% |
Bhi Investments LLC | | | | | | | | |
6.70% (6 Month USD LIBOR + 4.50% Rate Floor: 5.50%) due 08/28/24 | | | 1,875,213 | | | | 1,854,117 | |
10.95% (3 Month USD LIBOR + 8.75%, Rate Floor: 9.75%) due 02/28/25†††,1 | | | 1,500,000 | | | | 1,481,250 | |
Diversitech Holdings, Inc. | | | | | | | | |
9.60% (3 Month USD LIBOR + 7.50%, Rate Floor: 8.50%) due 06/02/25 | | | 2,650,000 | | | | 2,583,750 | |
CPG International LLC | | | | | | | | |
5.93% (6 Month USD LIBOR + 3.75%, Rate Floor: 4.75%) due 05/06/24 | | | 1,781,891 | | | | 1,772,981 | |
American Bath Group LLC | | | | | | | | |
6.29% (1 Month USD LIBOR + 4.25%, Rate Floor: 5.25%) due 09/30/23 | | | 1,008,852 | | | | 998,763 | |
STS Operating, Inc. (SunSource) | | | | | | | | |
6.29% (1 Month USD LIBOR + 4.25%, Rate Floor: 5.25%) due 12/11/24 | | | 992,211 | | | | 968,646 | |
26 | THE GUGGENHEIM FUNDS ANNUAL REPORT | SEE NOTES TO FINANCIAL STATEMENTS. |
SCHEDULE OF INVESTMENTS (continued) | September 30, 2019 |
HIGH YIELD FUND | |
| | Face
Amount~ | | | Value | |
Dynasty Acquisition Co. | | | | | | | | |
6.10% (3 Month USD LIBOR + 4.00%, Rate Floor: 4.00%) due 04/06/26 | | | 900,000 | | | $ | 903,654 | |
Tank Holdings Corp. | | | | | | | | |
6.52% (1 Month USD LIBOR + 4.00% and 12 Month USD LIBOR + 4.00% and 3 Month USD LIBOR + 4.00%, Rate Floor: 4.00%) due 03/26/26 | | | 750,000 | | | | 749,377 | |
YAK MAT (YAK ACCESS LLC) | | | | | | | | |
12.06% (1 Month USD LIBOR + 10.00%, Rate Floor: 10.00%) due 07/10/26 | | | 800,000 | | | | 689,336 | |
Bioplan USA, Inc. | | | | | | | | |
6.79% (1 Month USD LIBOR + 4.75%, Rate Floor: 5.75%) due 09/23/21 | | | 749,138 | | | | 681,716 | |
Avison Young (Canada), Inc. | | | | | | | | |
7.16% (3 Month USD LIBOR + 5.00% Rate Floor: 5.00%) due 01/31/26 | | | 545,875 | | | | 534,275 | |
ProAmpac PG Borrower LLC | | | | | | | | |
10.62% (3 Month USD LIBOR + 8.50%, Rate Floor: 9.50%) due 11/18/24 | | | 350,000 | | | | 332,500 | |
Total Industrial | | | | | | | 13,550,365 | |
| | | | | | | | | |
Consumer, Cyclical - 2.9% |
Power Solutions (Panther) | | | | | | | | |
5.54% (1 Month USD LIBOR + 3.50%, Rate Floor: 3.50%) due 04/30/26 | | | 1,625,000 | | | | 1,607,742 | |
American Tire Distributors, Inc. | | | | | | | | |
9.62% (3 Month USD LIBOR + 7.50%, Rate Floor: 8.50%) due 09/02/24 | | | 1,333,443 | | | | 1,168,096 | |
8.15% (3 Month USD LIBOR + 6.00%, Rate Floor: 7.00%) due 09/01/23 | | | 330,924 | | | | 326,582 | |
World Triathlon Corp. | | | | | | | | |
6.29% (1 Month USD LIBOR + 4.25%, Rate Floor: 5.25%) due 08/15/26 | | | 1,300,000 | | | | 1,306,500 | |
Alexander Mann | | | | | | | | |
5.71% (1 Month GBP LIBOR + 5.00%, Rate Floor: 5.00%) due 06/16/25 | | GBP | 1,100,000 | | | | 1,300,753 | |
Midas Intermediate Holdco II LLC | | | | | | | | |
4.85% (3 Month USD LIBOR + 2.75%, Rate Floor: 3.75%) due 08/18/21 | | | 1,280,253 | | | | 1,232,884 | |
BBB Industries, LLC | | | | | | | | |
6.59% (2 Month USD LIBOR + 4.50%, Rate Floor: 4.50%) due 08/01/25 | | | 1,257,474 | | | | 1,229,181 | |
Prime Security Services Borrower LLC (ADT) | | | | | | | | |
5.21% (1 Week USD LIBOR + 3.25%, Rate Floor: 4.25%) due 09/23/26 | | | 1,050,000 | | | | 1,038,355 | |
Accuride Corp. | | | | | | | | |
7.35% (3 Month USD LIBOR + 5.25%, Rate Floor: 6.25%) due 11/17/23 | | | 971,031 | | | | 815,666 | |
Sotheby’s | | | | | | | | |
due 01/15/27 | | | 700,000 | | | | 691,691 | |
EnTrans International, LLC | | | | | | | | |
8.04% (1 Month USD LIBOR + 6.00%, Rate Floor: 6.00%) due 11/01/24††† | | | 566,250 | | | | 546,431 | |
Blue Nile, Inc. | | | | | | | | |
8.62% (3 Month USD LIBOR + 6.50%, Rate Floor: 7.50%) due 02/17/23††† | | | 697,500 | | | | 544,050 | |
Belk, Inc. | | | | | | | | |
6.80% (3 Month USD LIBOR + 4.75%, Rate Floor: 5.75%) due 12/12/22 | | | 486,571 | | | | 352,764 | |
SMG US Midco 2, Inc. | | | | | | | | |
9.04% (1 Month USD LIBOR + 7.00%, Rate Floor: 7.00%) due 01/23/26 | | | 300,000 | | | | 303,000 | |
Total Consumer, Cyclical | | | | | | | 12,463,695 | |
| | | | | | | | | |
Consumer, Non-cyclical - 2.3% |
Springs Window Fashions | | | | | | | | |
6.30% (1 Month USD LIBOR + 4.25%, Rate Floor: 4.25%) due 06/15/25 | | | 1,728,125 | | | | 1,697,883 | |
10.55% (1 Month USD LIBOR + 8.50%, Rate Floor: 8.50%) due 06/15/26 | | | 1,025,000 | | | | 966,062 | |
ScribeAmerica Intermediate Holdco LLC (Healthchannels) | | | | | | | | |
6.54% (1 Month USD LIBOR + 4.50%, Rate Floor: 4.50%) due 04/03/25 | | | 1,185,000 | | | | 1,159,819 | |
Civitas Solutions, Inc. | | | | | | | | |
6.30% (1 Month USD LIBOR + 4.25%, Rate Floor: 4.25%) due 03/09/26 | | | 995,292 | | | | 997,532 | |
CTI Foods Holding Co. LLC | | | | | | | | |
9.26% (3 Month USD LIBOR + 7.00%, Rate Floor: 8.00%) due 05/03/24††† | | | 593,222 | | | | 596,188 | |
11.26% (3 Month USD LIBOR + 9.00%, Rate Floor: 10.00%) due 05/03/24††† | | | 310,427 | | | | 291,802 | |
DaVita, Inc. | | | | | | | | |
4.29% (1 Month USD LIBOR + 2.25%, Rate Floor: 2.25%) due 08/12/26 | | | 800,000 | | | | 804,080 | |
Albertson’s LLC | | | | | | | | |
4.79% (1 Month USD LIBOR + 2.75%, Rate Floor: 3.50%) due 11/17/25 | | | 750,000 | | | | 754,253 | |
Hearthside Group Holdings LLC | | | | | | | | |
5.73% (1 Month USD LIBOR + 3.69%, Rate Floor: 3.69%) due 05/23/25 | | | 740,625 | | | | 693,966 | |
Give and Go Prepared Foods Corp. | | | | | | | | |
6.29% (1 Month USD LIBOR + 4.25%, Rate Floor: 5.25%) due 07/29/23 | | | 695,800 | | | | 649,995 | |
Moran Foods LLC | | | | | | | | |
8.10% (3 Month USD LIBOR + 6.00%, Rate Floor: 7.00%) due 12/05/23 | | | 1,315,314 | | | | 550,235 | |
Packaging Coordinators Midco, Inc. | | | | | | | | |
6.05% (1 Month USD LIBOR + 4.00%, Rate Floor: 4.00%) due 07/01/21†††,1 | | | 369,231 | | | | 353,054 | |
Acosta, Inc. | | | | | | | | |
7.25% (Commercial Prime Lending Rate + 2.25% Rate Floor: 3.25%) due 12/26/19 | | | 825,674 | | | | 259,055 | |
Total Consumer, Non-cyclical | | | | | | | 9,773,924 | |
| | | | | | | | | |
SEE NOTES TO FINANCIAL STATEMENTS. | THE GUGGENHEIM FUNDS ANNUAL REPORT | 27 |
SCHEDULE OF INVESTMENTS (continued) | September 30, 2019 |
HIGH YIELD FUND | |
| | Face
Amount~ | | | Value | |
Utilities - 0.6% |
Panda Power | | | | | | | | |
8.60% (3 Month USD LIBOR + 6.50%, Rate Floor: 7.50%) due 08/21/20 | | | 1,105,578 | | | $ | 946,928 | |
UGI Energy Services, Inc. | | | | | | | | |
5.79% (1 Month USD LIBOR + 3.75%, Rate Floor: 3.75%) due 08/13/26††† | | | 847,875 | | | | 853,174 | |
MRP Generation Holding | | | | | | | | |
9.10% (3 Month USD LIBOR + 7.00%, Rate Floor: 8.00%) due 10/18/22 | | | 703,250 | | | | 692,701 | |
Total Utilities | | | | | | | 2,492,803 | |
| | | | | | | | | |
Basic Materials - 0.5% |
ICP Industrial, Inc. | | | | | | | | |
6.04% (1 Month USD LIBOR + 4.00%, Rate Floor: 5.00%) due 11/03/23††† | | | 1,230,208 | | | | 1,224,057 | |
Big River Steel LLC | | | | | | | | |
7.10% (3 Month USD LIBOR + 5.00%, Rate Floor: 6.00%) due 08/23/23 | | | 882,000 | | | | 873,180 | |
Total Basic Materials | | | | | | | 2,097,237 | |
| | | | | | | | | |
Energy - 0.3% |
Permian Production Partners LLC | | | | | | | | |
8.05% (1 Month USD LIBOR + 6.00%, Rate Floor: 7.00%) due 05/20/24††† | | | 1,187,500 | | | | 593,750 | |
Riverstone Utopia Member LLC | | | | | | | | |
6.29% (1 Month USD LIBOR + 4.25%, Rate Floor: 5.25%) due 10/17/24 | | | 441,472 | | | | 440,368 | |
Summit Midstream Partners, LP | | | | | | | | |
8.04% (1 Month USD LIBOR + 6.00%, Rate Floor: 7.00%) due 05/13/22 | | | 274,129 | | | | 267,687 | |
Total Energy | | | | | | | 1,301,805 | |
| | | | | | | | | |
Financial - 0.2% |
iStar, Inc. | | | | | | | | |
4.81% (1 Month USD LIBOR + 2.75%, Rate Floor: 2.75%) due 06/28/23 | | | 990,000 | | | | 991,238 | |
Total Senior Floating Rate Interests | | | | | | | | |
(Cost $75,924,996) | | | | | | | 71,888,093 | |
| | | | | | | | | |
ASSET-BACKED SECURITIES†† - 0.3% |
Collateralized Loan Obligations - 0.3% |
WhiteHorse X Ltd. | | | | | | | | |
2015-10A, 7.60% (3 Month USD LIBOR + 5.30%, Rate Floor: 5.30%) due 04/17/274,10 | | | 750,000 | | | | 732,708 | |
WhiteHorse VII Ltd. | | | | | | | | |
2013-1A, 6.93% (3 Month USD LIBOR + 4.80%, Rate Floor: 0.00%) due 11/24/254,10 | | | 600,000 | | | | 592,980 | |
Total Collateralized Loan Obligations | | | | | | | 1,325,688 | |
Total Asset-Backed Securities | | | | | | | | |
(Cost $1,200,170) | | | | | | | 1,325,688 | |
| | | | | | | | | |
Total Investments - 105.6% | | | | | | | | |
(Cost $462,752,647) | | | | | | $ | 453,909,612 | |
Other Assets & Liabilities, net - (5.6)% | | | | | | | (23,888,195 | ) |
Total Net Assets - 100.0% | | | | | | $ | 430,021,417 | |
Forward Foreign Currency Exchange Contracts†† |
| |
Counterparty | | Contracts to Sell | | | Currency | | | Settlement
Date | | | Settlement
Value | | | Value at
September 30,
2019 | | | Unrealized
Appreciation | |
Bank of America, N.A. | 836,000 | EUR | | | 10/15/19 | | | $ | 927,116 | | | $ | 912,453 | | | $ | 14,663 | |
Bank of America, N.A. | 1,069,000 | GBP | | | 10/15/19 | | | | 1,323,328 | | | | 1,315,255 | | | | 8,073 | |
| | | | | | | | | | | | | | | | | | | | | | | $ | 22,736 | |
28 | THE GUGGENHEIM FUNDS ANNUAL REPORT | SEE NOTES TO FINANCIAL STATEMENTS. |
SCHEDULE OF INVESTMENTS (continued) | September 30, 2019 |
HIGH YIELD FUND | |
~ | The face amount is denominated in U.S. dollars unless otherwise indicated. |
* | Non-income producing security. |
† | Value determined based on Level 1 inputs, unless otherwise noted — See Note 4. |
†† | Value determined based on Level 2 inputs, unless otherwise noted — See Note 4. |
††† | Value determined based on Level 3 inputs — See Note 4. |
1 | Security was fair valued by the Valuation Committee at September 30, 2019. The total market value of fair valued securities amounts to $7,628,106, (cost $7,675,790) or 1.8% of total net assets. |
2 | Affiliated issuer. |
3 | Rate indicated is the 7-day yield as of September 30, 2019. |
4 | Security is a 144A or Section 4(a)(2) security. These securities have been determined to be liquid under guidelines established by the Board of Trustees. The total market value of 144A or Section 4(a)(2) securities is $256,715,080 (cost $256,895,934), or 59.7% of total net assets. |
5 | All or a portion of this security is pledged as reverse repurchase agreements collateral at September 30, 2019. At September 30, 2019, the total market value of the pledged securities was $35,008,337 — See Note 6. |
6 | Perpetual maturity. |
7 | Security has a fixed rate coupon which will convert to a floating or variable rate coupon on a future date. |
8 | Security is a 144A or Section 4(a)(2) security. These securities have been determined to be illiquid and restricted under guidelines established by the Board of Trustees. The total market value of 144A or Section 4(a)(2) illiquid and restricted securities is $3,446,156 (cost $4,579,645), or 0.8% of total net assets — See Note 10. |
9 | Security is in default of interest and/or principal obligations. |
10 | Variable rate security. Rate indicated is the rate effective at September 30, 2019. In some instances, the effective rate is limited by a minimum rate floor or a maximum rate cap established by the issuer. The settlement status of a position may also impact the effective rate indicated. In some cases, a position may be unsettled at period end and may not have a stated effective rate. In instances where multiple underlying reference rates and spread amounts are shown, the effective rate is based on a weighted average. |
| | EUR — Euro |
| | GBP — British Pound |
| | LIBOR — London Interbank Offered Rate |
| | plc — Public Limited Company |
| | |
| | See Sector Classification in Other Information section. |
The following table summarizes the inputs used to value the Fund’s investments at September 30, 2019 (See Note 4 in the Notes to Financial Statements):
Investments in Securities (Assets) | | Level 1
Quoted
Prices | | | Level 2
Significant
Observable
Inputs | | | Level 3
Significant
Unobservable
Inputs | | | Total | |
Common Stocks | | $ | 242,664 | | | $ | 1,047,119 | | | $ | 2,042,728 | | | $ | 3,332,511 | |
Preferred Stocks | | | — | | | | — | | | | 534,846 | | | | 534,846 | |
Warrants | | | — | | | | 45 | | | | — | | | | 45 | |
Exchange-Traded Funds | | | 8,103,000 | | | | — | | | | — | | | | 8,103,000 | |
Money Market Fund | | | 800,763 | | | | — | | | | — | | | | 800,763 | |
Corporate Bonds | | | — | | | | 367,924,666 | | | | — | * | | | 367,924,666 | |
Senior Floating Rate Interests | | | — | | | | 53,521,809 | | | | 18,366,284 | | | | 71,888,093 | |
Asset-Backed Securities | | | — | | | | 1,325,688 | | | | — | | | | 1,325,688 | |
Forward Foreign Currency Exchange Contracts** | | | — | | | | 22,736 | | | | — | | | | 22,736 | |
Total Assets | | $ | 9,146,427 | | | $ | 423,842,063 | | | $ | 20,943,858 | | | $ | 453,932,348 | |
Investments in Securities (Liabilities) | | Level 1
Quoted
Prices | | | Level 2
Significant
Observable
Inputs | | | Level 3
Significant
Unobservable
Inputs | | | Total | |
Unfunded Loan Commitments (Note 9) | | $ | — | | | $ | — | | | $ | 301,483 | | | $ | 301,483 | |
* | Security has a market value of $0. |
** | This derivative is reported as unrealized appreciation/depreciation at period end. |
SEE NOTES TO FINANCIAL STATEMENTS. | THE GUGGENHEIM FUNDS ANNUAL REPORT | 29 |
SCHEDULE OF INVESTMENTS (continued) | September 30, 2019 |
HIGH YIELD FUND | |
The Fund may hold assets and/or liabilities in which the fair value approximates the carrying amount for financial statement purposes. As of the period end, reverse repurchase agreements of $21,687,382 are categorized as Level 2 within the disclosure hierarchy.
The following is summary of significant unobservable inputs used in the fair valuation of assets and liabilities categorized within the Level 3 of the fair value hierarchy:
Category | | Ending Balance at
September 30, 2019 | | | Valuation Technique | | | Unobservable Inputs | | | Input Range | | | Weighted Average* | |
Assets: | | | | | | | | | | | | | | | | | | | | |
Common Stocks | | $ | 1,066,600 | | Third Party Pricing | Broker Quote | | | — | | | | — | |
Common Stocks | | | 976,128 | | Enterprise Value | Valuation Multiple | | | 1.9x-11.9x | | | | 8.8x | |
Preferred Stocks | | | 534,846 | | Enterprise Value | Valuation Multiple | | | 3.6x | | | | — | |
Senior Floating Rate Interests | | | 12,249,152 | | Third Party Pricing | Broker Quote | | | — | | | | — | |
Senior Floating Rate Interests | | | 2,913,345 | | Yield Analysis | Yield | | | 8.5%-9.3% | | | | 9.1 | % |
Senior Floating Rate Interests | | | 1,481,250 | | Model Price | Market Comparable Yields | | | 10.3 | % | | | — | |
Senior Floating Rate Interests | | | 1,173,000 | | Model Price | Liquidation Value | | | — | | | | — | |
Senior Floating Rate Interests | | | 549,537 | | Model Price | Purchase Price | | | — | | | | — | |
Total Assets | | $ | 20,943,858 | | | | | | | | | | | | | | | | | |
Liabilities: | | | | | | | | | | | | | | | | | | | | |
Unfunded Loan Commitments | | $ | 301,483 | | Model Price | Purchase Price | | | — | | | | — | |
* | Inputs are weighted by the fair value of the instruments. |
Significant changes in a yield, market comparable yields, liquidation value, quote or valuation multiple would generally result in significant changes in the fair value of the security. Any remaining Level 3 securities held by the Fund and excluded from the table above, were not considered material to the Fund.
The Fund’s fair valuation leveling guidelines were recently revised to classify a single daily broker quote, or a vendor price based on a single daily or monthly broker quote, as Level 3 rather than Level 2, if such a quote or price cannot be supported with other available market information.
Transfers between Level 2 and Level 3 may occur as markets fluctuate and/or the availability of data used in an investment’s valuation changes. For the year ended September 30, 2019, the Fund had securities with a total value of $10,319,337 transfer from Level 2 to Level 3 to due to lack of observable inputs. For the year ended September 30, 2019, the Fund had liabilities with a total value of $119,631 transfer from Level 2 to Level 3 to due to lack of observable inputs. There were no other securities that transferred between levels.
30 | THE GUGGENHEIM FUNDS ANNUAL REPORT | SEE NOTES TO FINANCIAL STATEMENTS. |
SCHEDULE OF INVESTMENTS (concluded) | September 30, 2019 |
HIGH YIELD FUND | |
Summary of Fair Value Level 3 Activity
Following is a reconciliation of Level 3 assets for which significant unobservable inputs were used to determine fair value for the year ended September 30, 2019:
| | | Assets | | | | | | | Liabilities | |
| | Common
Stocks | | | Senior
Floating Rate
Interests | | | Preferred
Stocks | | | Total Assets | | | Unfunded
Loan
Commitments | |
Beginning Balance | | $ | 33,198 | | | $ | 10,442,995 | | | $ | 515,827 | | | $ | 10,992,020 | | | $ | (325,938 | ) |
Purchases/(Receipts) | | | 954,408 | | | | 5,983,160 | | | | — | | | | 6,937,568 | | | | (269,721 | ) |
(Sales, maturities and paydowns)/Fundings | | | (12,286 | ) | | | (6,894,086 | ) | | | — | | | | (6,906,372 | ) | | | 327,225 | |
Amortization of discount/premiums | | | — | | | | 88,792 | | | | — | | | | 88,792 | | | | — | |
Total realized gains or losses included in earnings | | | (1,687,664 | ) | | | 1,884 | | | | — | | | | (1,685,780 | ) | | | 148 | |
Total change in unrealized appreciation (depreciation) included in earnings | | | 1,688,472 | | | | (509,198 | ) | | | 19,019 | | | | 1,198,293 | | | | 86,434 | |
Transfers into Level 3 | | | 1,066,600 | | | | 9,252,737 | | | | — | | | | 10,319,337 | | | | (119,631 | ) |
Ending Balance | | $ | 2,042,728 | | | $ | 18,366,284 | | | $ | 534,846 | | | $ | 20,943,858 | | | $ | (301,483 | ) |
Net change in unrealized appreciation (depreciation) for investments in Level 3 securities still held at September 30, 2019 | | $ | 808 | | | $ | (513,833 | ) | | $ | 19,019 | | | $ | (494,006 | ) | | $ | 88,786 | |
Affiliated Transactions
Investments representing 5% or more of the outstanding voting shares of a company, or control of or by, or common control under Guggenheim Investments (“GI”), result in that company being considered an affiliated issuer, as defined in the 1940 Act.
Transactions during the year ended September 30, 2019, in which the company is an affiliated issuer, were as follows:
Security Name | | Value
09/30/18 | | | Additions | | | Reductions | | | Realized
Gain (Loss) | | | Change in
Unrealized
Appreciation
(Depreciation) | | | Value
09/30/19 | | | Shares/Face
Amount
09/30/19 | | | Investment
Income | |
Common Stocks | | | | | | | | | | | | | | | | | | | | | | | | | | | | | | | | |
Aspect Software, Inc.* | | $ | — | ** | | $ | — | | | $ | — | | | $ | (1,687,664 | ) | | $ | 1,687,664 | | | $ | — | | | | — | | | $ | — | |
BP Holdco LLC*,1 | | | — | | | | 8,372 | | | | — | | | | — | | | | — | | | | 8,372 | | | | 23,711 | | | | — | |
Targus Group International Equity, Inc.1 | | | 33,198 | | | | — | | | | (12,286 | ) | | | — | | | | 808 | | | | 21,720 | | | | 12,825 | | | | 1,145 | |
Senior Floating Rate Interests | | | | | | | | | | | | | | | | | | | | | | | | | | | | | | | | |
Aspect Software, Inc. 7.21% (3 Month USD LIBOR + 5.00%), Rate Floor: 6.00%) due 01/15/243 | | | 543,677 | | | | — | | | | (446,321 | ) | | | (204,917 | ) | | | 107,561 | | | | — | | | | — | | | | 30,323 | |
Targus Group International, Inc. due 05/24/161,2,3 | | | — | ** | | | — | | | | — | | | | — | | | | — | | | | — | ** | | | 153,489 | | | | — | |
Warrants | | | | | | | | | | | | | | | | | | | | | | | | | | | | | | | | |
Aspect Software, Inc.* | | | — | ** | | | — | | | | — | | | | — | | | | — | | | | — | | | | — | | | | — | |
| | | $ | 576,875 | | | $ | 8,372 | | | $ | (458,607 | ) | | $ | (1,892,581 | ) | | $ | 1,796,033 | | | $ | 30,092 | | | | | | | $ | 31,468 | |
* | Non-income producing security. |
** | Market value is less than $1. |
1 | Security was fair valued by the Valuation Committee at September 30, 2019. The total market value of fair valued and affiliated securities amounts to $30,092, (cost $152,098) or less than 0.1% of total net assets. |
2 | Security is in default of interest and/or principal obligations. |
3 | Variable rate security. Rate indicated is the rate effective at September 30, 2019. In some instances, the effective rate is limited by a minimum rate floor or a maximum rate cap established by the issuer. The settlement status of a position may also impact the effective rate indicated. In some cases, a position may be unsettled at period end and may not have a stated effective rate. In instances where multiple underlying reference rates and spread amounts are shown, the effective rate is based on a weighted average. |
SEE NOTES TO FINANCIAL STATEMENTS. | THE GUGGENHEIM FUNDS ANNUAL REPORT | 31 |
STATEMENT OF ASSETS AND LIABILITIES |
September 30, 2019 |
Assets: |
Investments in unaffiliated issuers, at value (cost $462,600,549) | | $ | 453,879,520 | |
Investments in affiliated issuers, at value (cost $152,098) | | | 30,092 | |
Foreign currency, at value (cost $6,559) | | | 6,559 | |
Cash | | | 205,751 | |
Unrealized appreciation on forward foreign currency exchange contracts | | | 22,736 | |
Prepaid expenses | | | 61,586 | |
Receivables: |
Interest | | | 6,648,525 | |
Securities sold | | | 884,099 | |
Fund shares sold | | | 409,699 | |
Foreign tax reclaims | | | 25,201 | |
Dividends | | | 4,343 | |
Total assets | | | 462,178,111 | |
| | | | | |
Liabilities: |
Unfunded loan commitments, at value (Note 9) (proceeds $579,830) | | | 301,483 | |
Reverse repurchase agreements (Note 6) | | | 21,687,382 | |
Payable for: |
Securities purchased | | | 8,442,416 | |
Fund shares redeemed | | | 1,076,611 | |
Distributions to shareholders | | | 216,934 | |
Management fees | | | 175,545 | |
Distribution and service fees | | | 31,271 | |
Transfer agent/maintenance fees | | | 26,926 | |
Fund accounting/administration fees | | | 26,254 | |
Due to Investment Adviser | | | 4,552 | |
Trustees’ fees* | | | 1,879 | |
Miscellaneous | | | 165,441 | |
Total liabilities | | | 32,156,694 | |
Commitments and contingent liabilities (Note 14) | | | — | |
Net assets | | $ | 430,021,417 | |
| | | | | |
Net assets consist of: |
Paid in capital | | $ | 449,652,971 | |
Total distributable earnings (loss) | | | (19,631,554 | ) |
Net assets | | $ | 430,021,417 | |
| | | | | |
A-Class: |
Net assets | | $ | 67,916,449 | |
Capital shares outstanding | | | 6,231,859 | |
Net asset value per share | | $ | 10.90 | |
Maximum offering price per share (Net asset value divided by 96.00%) | | $ | 11.35 | |
| | | | | |
C-Class: |
Net assets | | $ | 21,935,319 | |
Capital shares outstanding | | | 1,995,930 | |
Net asset value per share | | $ | 10.99 | |
| | | | | |
P-Class: |
Net assets | | $ | 8,169,910 | |
Capital shares outstanding | | | 749,160 | |
Net asset value per share | | $ | 10.91 | |
| | | | | |
Institutional Class: |
Net assets | | $ | 180,441,537 | |
Capital shares outstanding | | | 20,315,765 | |
Net asset value per share | | $ | 8.88 | |
| | | | | |
R6-Class: |
Net assets | | $ | 151,558,202 | |
Capital shares outstanding | | | 13,922,458 | |
Net asset value per share | | $ | 10.89 | |
* | Relates to Trustees not deemed “interested persons” within the meaning of Section 2(a)(19) of the 1940 Act. |
32 | THE GUGGENHEIM FUNDS ANNUAL REPORT | SEE NOTES TO FINANCIAL STATEMENTS. |
STATEMENT OF OPERATIONS |
Year Ended September 30, 2019 |
Investment Income: |
Dividends from securities of unaffiliated issuers | | $ | 487,396 | |
Dividends from securities of affiliated issuers | | | 1,145 | |
Interest from securities of unaffiliated issuers | | | 28,603,554 | |
Interest from securities of affiliated issuers | | | 30,323 | |
Total investment income | | | 29,122,418 | |
| | | | | |
Expenses: |
Management fees | | | 2,437,032 | |
Distribution and service fees: |
A-Class | | | 175,877 | |
C-Class | | | 210,073 | |
P-Class | | | 21,526 | |
Transfer agent/maintenance fees: |
A-Class | | | 67,105 | |
C-Class | | | 21,477 | |
P-Class | | | 13,187 | |
Institutional Class | | | 170,237 | |
R6-Class | | | 674 | |
Interest expense | | | 395,922 | |
Fund accounting/administration fees | | | 324,940 | |
Custodian fees | | | 39,915 | |
Line of credit fees | | | 33,480 | |
Trustees’ fees* | | | 25,066 | |
Miscellaneous | | | 297,890 | |
Recoupment of previously waived fees: |
A-Class | | | 36,943 | |
C-Class | | | 9,643 | |
P-Class | | | 856 | |
Institutional Class | | | 27,652 | |
Total expenses | | | 4,309,495 | |
Less: |
Expenses reimbursed by Adviser: |
A-Class | | | (8,484 | ) |
C-Class | | | (2,385 | ) |
P-Class | | | (1,626 | ) |
Institutional Class | | | (28,213 | ) |
R6-Class | | | (4,036 | ) |
Expenses waived by Adviser | | | (7,045 | ) |
Earnings credits applied | | | (17,346 | ) |
Total waived/reimbursed expenses | | | (69,135 | ) |
Net expenses | | | 4,240,360 | |
Net investment income | | | 24,882,058 | |
| | | | | |
Net Realized and Unrealized Gain (Loss): |
Net realized gain (loss) on: |
Investments in unaffiliated issuers | | $ | (7,313,900 | ) |
Investments in affiliated issuers | | | (1,892,581 | ) |
Forward foreign currency exchange contracts | | | 366,039 | |
Foreign currency transactions | | | (117,710 | ) |
Net realized loss | | | (8,958,152 | ) |
Net change in unrealized appreciation (depreciation) on: |
Investments in unaffiliated issuers | | | 3,272,598 | |
Investments in affiliated issuers | | | 1,796,033 | |
Forward foreign currency exchange contracts | | | 70,586 | |
Foreign currency translations | | | 1,969 | |
Net change in unrealized appreciation (depreciation) | | | 5,141,186 | |
Net realized and unrealized loss | | | (3,816,966 | ) |
Net increase in net assets resulting from operations | | $ | 21,065,092 | |
* | Relates to Trustees not deemed “interested persons” within the meaning of Section 2(a)(19) of the 1940 Act. |
SEE NOTES TO FINANCIAL STATEMENTS. | THE GUGGENHEIM FUNDS ANNUAL REPORT | 33 |
STATEMENTS OF CHANGES IN NET ASSETS |
| | Year Ended
September 30,
2019 | | | Year Ended
September 30,
2018 | |
Increase (Decrease) in Net Assets from Operations: | | | | | | | | |
Net investment income | | $ | 24,882,058 | | | $ | 30,452,732 | |
Net realized gain (loss) on investments | | | (8,958,152 | ) | | | 1,556,940 | |
Net change in unrealized appreciation (depreciation) on investments | | | 5,141,186 | | | | (21,815,906 | ) |
Net increase in net assets resulting from operations | | | 21,065,092 | | | | 10,193,766 | |
| | | | | | | | | |
Distributions to shareholders: | | | | | | | | |
A-Class | | | (4,333,588 | ) | | | (5,848,923 | ) |
C-Class | | | (1,132,868 | ) | | | (1,388,169 | ) |
P-Class | | | (529,844 | ) | | | (816,570 | ) |
Institutional Class | | | (9,833,829 | ) | | | (9,381,532 | ) |
R6-Class | | | (9,923,537 | ) | | | (13,025,080 | ) |
Total distributions to shareholders | | | (25,753,666 | ) | | | (30,460,274 | ) |
| | | | | | | | | |
Capital share transactions: | | | | | | | | |
Proceeds from sale of shares | | | | | | | | |
A-Class | | | 11,548,636 | | | | 26,096,181 | |
C-Class | | | 5,391,154 | | | | 5,369,804 | |
P-Class | | | 2,776,059 | | | | 6,720,672 | |
Institutional Class | | | 113,823,859 | | | | 83,387,211 | |
R6-Class | | | 7,397,981 | | | | 25,353,579 | |
Redemption fees collected | | | | | | | | |
A-Class | | | 3,471 | | | | 31,637 | |
C-Class | | | 1,022 | | | | 8,663 | |
P-Class | | | 454 | | | | 4,473 | |
Institutional Class | | | 6,625 | | | | 48,326 | |
R6-Class | | | 7,944 | | | | 68,690 | |
Distributions reinvested | | | | | | | | |
A-Class | | | 3,805,869 | | | | 5,079,351 | |
C-Class | | | 997,942 | | | | 1,192,099 | |
P-Class | | | 528,810 | | | | 813,162 | |
Institutional Class | | | 7,714,249 | | | | 7,513,267 | |
R6-Class | | | 9,923,323 | | | | 12,996,541 | |
Cost of shares redeemed | | | | | | | | |
A-Class | | | (21,398,303 | ) | | | (78,069,295 | ) |
C-Class | | | (6,478,775 | ) | | | (13,600,593 | ) |
P-Class | | | (7,072,377 | ) | | | (11,767,318 | ) |
Institutional Class | | | (66,675,004 | ) | | | (153,274,924 | ) |
R6-Class | | | (53,462,016 | ) | | | (39,655,766 | ) |
Net increase (decrease) from capital share transactions | | | 8,840,923 | | | | (121,684,240 | ) |
Net increase (decrease) in net assets | | | 4,152,349 | | | | (141,950,748 | ) |
| | | | | | | | | |
Net assets: | | | | | | | | |
Beginning of year | | | 425,869,068 | | | | 567,819,816 | |
End of year | | $ | 430,021,417 | | | $ | 425,869,068 | |
| | | | | | | | | |
34 | THE GUGGENHEIM FUNDS ANNUAL REPORT | SEE NOTES TO FINANCIAL STATEMENTS. |
STATEMENTS OF CHANGES IN NET ASSETS (concluded) |
| | Year Ended
September 30,
2019 | | | Year Ended
September 30,
2018 | |
Capital share activity: | | | | | | | | |
Shares sold | | | | | | | | |
A-Class | | | 1,071,432 | | | | 2,317,006 | |
C-Class | | | 495,246 | | | | 470,923 | |
P-Class | | | 257,789 | | | | 597,929 | |
Institutional Class | | | 13,057,496 | | | | 9,109,186 | |
R6-Class | | | 690,356 | | | | 2,217,170 | |
Shares issued from reinvestment of distributions | | | | | | | | |
A-Class | | | 353,785 | | | | 452,179 | |
C-Class | | | 91,997 | | | | 105,417 | |
P-Class | | | 49,100 | | | | 72,392 | |
Institutional Class | | | 877,350 | | | | 819,617 | |
R6-Class | | | 922,818 | | | | 1,160,432 | |
Shares redeemed | | | | | | | | |
A-Class | | | (1,986,805 | ) | | | (6,937,082 | ) |
C-Class | | | (598,161 | ) | | | (1,195,508 | ) |
P-Class | | | (654,928 | ) | | | (1,039,994 | ) |
Institutional Class | | | (7,604,434 | ) | | | (16,656,442 | ) |
R6-Class | | | (4,951,144 | ) | | | (3,532,108 | ) |
Net increase (decrease) in shares | | | 2,071,897 | | | | (12,038,883 | ) |
SEE NOTES TO FINANCIAL STATEMENTS. | THE GUGGENHEIM FUNDS ANNUAL REPORT | 35 |
This table is presented to show selected data for a share outstanding throughout each period and to assist shareholders in evaluating a Fund’s performance for the periods presented.
A-Class | | Year Ended
September 30,
2019 | | | Year Ended
September 30,
2018 | | | Year Ended
September 30,
2017 | | | Year Ended
September 30,
2016 | | | Year Ended
September 30,
2015 | |
Per Share Data | | | | | | | | | | | | | | | | | | | | |
Net asset value, beginning of period | | $ | 11.04 | | | $ | 11.50 | | | $ | 11.16 | | | $ | 10.79 | | | $ | 12.02 | |
Income (loss) from investment operations: |
Net investment income (loss)a | | | .64 | | | | .68 | | | | .64 | | | | .67 | | | | .69 | |
Net gain (loss) on investments (realized and unrealized) | | | (.12 | ) | | | (.46 | ) | | | .35 | | | | .41 | | | | (.97 | ) |
Total from investment operations | | | .52 | | | | .22 | | | | .99 | | | | 1.08 | | | | (.28 | ) |
Less distributions from: |
Net investment income | | | (.66 | ) | | | (.68 | ) | | | (.65 | ) | | | (.72 | ) | | | (.74 | ) |
Net realized gains | | | — | | | | — | | | | — | | | | — | | | | (.22 | ) |
Total distributions | | | (.66 | ) | | | (.68 | ) | | | (.65 | ) | | | (.72 | ) | | | (.96 | ) |
Redemption fees collected | | | — | g | | | — | g | | | — | g | | | .01 | | | | .01 | |
Net asset value, end of period | | $ | 10.90 | | | $ | 11.04 | | | $ | 11.50 | | | $ | 11.16 | | | $ | 10.79 | |
|
Total Returnb | | | 4.99 | % | | | 2.00 | % | | | 9.11 | % | | | 10.71 | % | | | (2.40 | %) |
Ratios/Supplemental Data |
Net assets, end of period (in thousands) | | $ | 67,916 | | | $ | 75,028 | | | $ | 126,097 | | | $ | 87,045 | | | $ | 73,236 | |
Ratios to average net assets: |
Net investment income (loss) | | | 5.94 | % | | | 6.05 | % | | | 5.63 | % | | | 6.32 | % | | | 6.01 | % |
Total expensesc | | | 1.27 | % | | | 1.35 | % | | | 1.31 | % | | | 1.25 | % | | | 1.27 | % |
Net expensesd,e,f | | | 1.26 | % | | | 1.33 | % | | | 1.29 | % | | | 1.23 | % | | | 1.20 | % |
Portfolio turnover rate | | | 61 | % | | | 61 | % | | | 62 | % | | | 55 | % | | | 72 | % |
C-Class | | Year Ended
September 30,
2019 | | | Year Ended
September 30,
2018 | | | Year Ended
September 30,
2017 | | | Year Ended
September 30,
2016 | | | Year Ended
September 30,
2015 | |
Per Share Data | | | | | | | | | | | | | | | | | | | | |
Net asset value, beginning of period | | $ | 11.14 | | | $ | 11.60 | | | $ | 11.26 | | | $ | 10.88 | | | $ | 12.12 | |
Income (loss) from investment operations: |
Net investment income (loss)a | | | .56 | | | | .60 | | | | .56 | | | | .60 | | | | .61 | |
Net gain (loss) on investments (realized and unrealized) | | | (.12 | ) | | | (.46 | ) | | | .35 | | | | .41 | | | | (.98 | ) |
Total from investment operations | | | .44 | | | | .14 | | | | .91 | | | | 1.01 | | | | (.37 | ) |
Less distributions from: |
Net investment income | | | (.59 | ) | | | (.60 | ) | | | (.57 | ) | | | (.64 | ) | | | (.66 | ) |
Net realized gains | | | — | | | | — | | | | — | | | | — | | | | (.22 | ) |
Total distributions | | | (.59 | ) | | | (.60 | ) | | | (.57 | ) | | | (.64 | ) | | | (.88 | ) |
Redemption fees collected | | | — | g | | | — | g | | | — | g | | | .01 | | | | .01 | |
Net asset value, end of period | | $ | 10.99 | | | $ | 11.14 | | | $ | 11.60 | | | $ | 11.26 | | | $ | 10.88 | |
|
Total Returnb | | | 4.12 | % | | | 1.27 | % | | | 8.38 | % | | | 9.81 | % | | | (3.14 | %) |
Ratios/Supplemental Data |
Net assets, end of period (in thousands) | | $ | 21,935 | | | $ | 22,350 | | | $ | 30,461 | | | $ | 26,941 | | | $ | 13,671 | |
Ratios to average net assets: |
Net investment income (loss) | | | 5.17 | % | | | 5.31 | % | | | 4.92 | % | | | 5.52 | % | | | 5.25 | % |
Total expensesc | | | 2.03 | % | | | 2.11 | % | | | 2.05 | % | | | 2.01 | % | | | 2.01 | % |
Net expensesd,e,f | | | 2.02 | % | | | 2.09 | % | | | 2.03 | % | | | 1.98 | % | | | 1.95 | % |
Portfolio turnover rate | | | 61 | % | | | 61 | % | | | 62 | % | | | 55 | % | | | 72 | % |
36 | THE GUGGENHEIM FUNDS ANNUAL REPORT | SEE NOTES TO FINANCIAL STATEMENTS. |
FINANCIAL HIGHLIGHTS (continued) |
This table is presented to show selected data for a share outstanding throughout each period and to assist shareholders in evaluating a Fund’s performance for the periods presented.
P-Class | | Year Ended
September 30,
2019 | | | Year Ended
September 30,
2018 | | | Year Ended
September 30,
2017 | | | Year Ended
September 30,
2016 | | | Period Ended
September 30,
2015h | |
Per Share Data | | | | | | | | | | | | | | | | | | | | |
Net asset value, beginning of period | | $ | 11.05 | | | $ | 11.51 | | | $ | 11.17 | | | $ | 10.80 | | | $ | 11.53 | |
Income (loss) from investment operations: |
Net investment income (loss)a | | | .64 | | | | .68 | | | | .64 | | | | .67 | | | | .27 | |
Net gain (loss) on investments (realized and unrealized) | | | (.12 | ) | | | (.46 | ) | | | .37 | | | | .42 | | | | (.73 | ) |
Total from investment operations | | | .52 | | | | .22 | | | | 1.01 | | | | 1.09 | | | | (.46 | ) |
Less distributions from: |
Net investment income | | | (.66 | ) | | | (.68 | ) | | | (.67 | ) | | | (.72 | ) | | | (.27 | ) |
Total distributions | | | (.66 | ) | | | (.68 | ) | | | (.67 | ) | | | (.72 | ) | | | (.27 | ) |
Redemption fees collected | | | — | g | | | — | g | | | — | g | | | — | g | | | — | g |
Net asset value, end of period | | $ | 10.91 | | | $ | 11.05 | | | $ | 11.51 | | | $ | 11.17 | | | $ | 10.80 | |
|
Total Return | | | 4.98 | % | | | 1.95 | % | | | 9.24 | % | | | 10.74 | % | | | (4.06 | %) |
Ratios/Supplemental Data |
Net assets, end of period (in thousands) | | $ | 8,170 | | | $ | 12,124 | | | $ | 16,883 | | | $ | 3,178 | | | $ | 10 | |
Ratios to average net assets: |
Net investment income (loss) | | | 5.93 | % | | | 6.00 | % | | | 5.58 | % | | | 6.20 | % | | | 5.76 | % |
Total expensesc | | | 1.30 | % | | | 1.45 | % | | | 1.29 | % | | | 1.17 | % | | | 3.36 | % |
Net expensesd,e,f | | | 1.28 | % | | | 1.39 | % | | | 1.22 | % | | | 1.17 | % | | | 1.19 | % |
Portfolio turnover rate | | | 61 | % | | | 61 | % | | | 62 | % | | | 55 | % | | | 72 | % |
Institutional Class | | Year Ended
September 30,
2019 | | | Year Ended
September 30,
2018 | | | Year Ended
September 30,
2017 | | | Year Ended
September 30,
2016 | | | Year Ended
September 30,
2015 | |
Per Share Data | | | | | | | | | | | | | | | | | | | | |
Net asset value, beginning of period | | $ | 9.01 | | | $ | 9.38 | | | $ | 9.11 | | | $ | 8.81 | | | $ | 9.87 | |
Income (loss) from investment operations: |
Net investment income (loss)a | | | .54 | | | | .58 | | | | .56 | | | | .58 | | | | .58 | |
Net gain (loss) on investments (realized and unrealized) | | | (.10 | ) | | | (.38 | ) | | | .28 | | | | .34 | | | | (.79 | ) |
Total from investment operations | | | .44 | | | | .20 | | | | .84 | | | | .92 | | | | (.21 | ) |
Less distributions from: |
Net investment income | | | (.57 | ) | | | (.57 | ) | | | (.57 | ) | | | (.62 | ) | | | (.64 | ) |
Net realized gains | | | — | | | | — | | | | — | | | | — | | | | (.22 | ) |
Total distributions | | | (.57 | ) | | | (.57 | ) | | | (.57 | ) | | | (.62 | ) | | | (.86 | ) |
Redemption fees collected | | | — | g | | | — | g | | | — | g | | | — | g | | | .01 | |
Net asset value, end of period | | $ | 8.88 | | | $ | 9.01 | | | $ | 9.38 | | | $ | 9.11 | | | $ | 8.81 | |
|
Total Return | | | 5.15 | % | | | 2.27 | % | | | 9.56 | % | | | 10.95 | % | | | (2.21 | %) |
Ratios/Supplemental Data |
Net assets, end of period (in thousands) | | $ | 180,442 | | | $ | 125,945 | | | $ | 194,280 | | | $ | 141,833 | | | $ | 75,167 | |
Ratios to average net assets: |
Net investment income (loss) | | | 6.17 | % | | | 6.28 | % | | | 6.00 | % | | | 6.58 | % | | | 6.21 | % |
Total expensesc | | | 0.99 | % | | | 1.14 | % | | | 0.94 | % | | | 0.95 | % | | | 0.94 | % |
Net expensesd,e,f | | | 0.97 | % | | | 1.11 | % | | | 0.93 | % | | | 0.94 | % | | | 0.94 | % |
Portfolio turnover rate | | | 61 | % | | | 61 | % | | | 62 | % | | | 55 | % | | | 72 | % |
SEE NOTES TO FINANCIAL STATEMENTS. | THE GUGGENHEIM FUNDS ANNUAL REPORT | 37 |
FINANCIAL HIGHLIGHTS (concluded) |
This table is presented to show selected data for a share outstanding throughout each period and to assist shareholders in evaluating a Fund’s performance for the periods presented.
R6-Class | | Year Ended
September 30,
2019 | | | Year Ended
September 30,
2018 | | | Period Ended
September 30,
2017i | |
Per Share Data | | | | | | | | | | | | |
Net asset value, beginning of period | | $ | 11.03 | | | $ | 11.49 | | | $ | 11.45 | |
Income (loss) from investment operations: |
Net investment income (loss)a | | | .68 | | | | .72 | | | | .24 | |
Net gain (loss) on investments (realized and unrealized) | | | (.12 | ) | | | (.46 | ) | | | .04 | |
Total from investment operations | | | .56 | | | | .26 | | | | .28 | |
Less distributions from: |
Net investment income | | | (.70 | ) | | | (.72 | ) | | | (.24 | ) |
Total distributions | | | (.70 | ) | | | (.72 | ) | | | (.24 | ) |
Redemption fees collected | | | — | g | | | — | g | | | — | g |
Net asset value, end of period | | $ | 10.89 | | | $ | 11.03 | | | $ | 11.49 | |
|
Total Return | | | 5.39 | % | | | 2.34 | % | | | 2.49 | % |
Ratios/Supplemental Data |
Net assets, end of period (in thousands) | | $ | 151,558 | | | $ | 190,421 | | | $ | 200,099 | |
Ratios to average net assets: |
Net investment income (loss) | | | 6.31 | % | | | 6.41 | % | | | 5.41 | % |
Total expensesc | | | 0.89 | % | | | 1.00 | % | | | 0.82 | % |
Net expensesd,e,f | | | 0.88 | % | | | 1.00 | % | | | 0.82 | % |
Portfolio turnover rate | | | 61 | % | | | 61 | % | | | 62 | % |
a | Net investment income (loss) per share was computed using average shares outstanding throughout the period. |
b | Total return does not reflect the impact of any applicable sales charges and has not been annualized. |
c | Does not include expenses of the underlying funds in which the Fund invests. |
d | Net expense information reflects the expense ratios after expense waivers and reimbursements, as applicable. |
e | The portion of the ratios of net expenses to average net assets attributable to recoupments of prior fee reductions or expense reimbursements for the years presented was as follows: |
| | | 09/30/19 | 09/30/18 | 09/30/17 |
| | A-Class | 0.05% | — | 0.09% |
| | C-Class | 0.05% | — | 0.06% |
| | P-Class | 0.01% | 0.03% | 0.00%* |
| | Institutional Class | 0.02% | 0.04% | 0.00%* |
| | R6-Class | 0.00%* | — | — |
f | Net expenses may include expenses that are excluded from the expense limitation agreement. Excluding these expenses, the net expense ratios for the years presented would be: |
| | | 09/30/19 | 09/30/18 | 09/30/17 | 09/30/16 | 09/30/15 |
| | A-Class | 1.15% | 1.10% | 1.15% | 1.16% | 1.16% |
| | C-Class | 1.91% | 1.86% | 1.89% | 1.91% | 1.91% |
| | P-Class | 1.16% | 1.16% | 1.08% | 1.09% | 1.16% |
| | Institutional Class | 0.88% | 0.88% | 0.79% | 0.87% | 0.91% |
| | R6-Class | 0.77% | 0.77% | 0.79% | — | — |
g | Redemption fees collected are less than $0.01 per share. |
h | Since commencement of operations: May 1, 2015. Percentage amounts for the period, except total return and portfolio turnover rate, have been annualized. |
i | Since commencement of operations: May 15, 2017. Percentage amounts for the period, except total return and portfolio turnover rate, have been annualized. |
38 | THE GUGGENHEIM FUNDS ANNUAL REPORT | SEE NOTES TO FINANCIAL STATEMENTS. |
MANAGERS’ COMMENTARY (Unaudited) | September 30, 2019 |
To Our Shareholders
Guggenheim Investment Grade Bond Fund (the “Fund”) is managed by a team of seasoned professionals, including B. Scott Minerd, Chairman of Investments and Global Chief Investment Officer; Anne B. Walsh, Senior Managing Director and Chief Investment Officer, Fixed Income; Steven H. Brown, Senior Managing Director and Portfolio Manager; and Adam J. Bloch, Managing Director and Portfolio Manager. In the following paragraphs, the investment team discusses the market environment and the Fund’s performance for the fiscal year ended September 30, 2019.
For the one-year period ended September 30, 2019, Guggenheim Investment Grade Bond Fund returned 5.72%1, compared with the 10.30% return of its benchmark, the Bloomberg Barclays U.S. Aggregate Bond Index.
The trailing twelve-month period, ending September 30, 2019, faced bouts of uncertainty and volatility as trade tensions, global economic headwinds, shifts in monetary policy, and a corporate earnings slowdown jolted financial markets. From the start, the fourth quarter of 2018 raised concerns across global markets, causing risk-assets to decline as investors sought safety. The S&P 500, high yield, and bank loan indices were off -13.52%, -4.53%, -3.08% in the fourth quarter, respectively, in line with our previously expressed concerns that spreads could widen. We entered the fourth quarter of 2018 defensively positioned, with limited below investment grade exposure, credit hedges in place, and healthy liquidity reserves all of which helped the fund generate a positive absolute return.
In response to the fourth quarter’s market upheaval, the U.S. Federal Reserve (the “Fed”) pivoted from its tightening policy stance and informed markets it would be patient in assessing further interest rate hikes. As 2019 progressed, the Fed recalibrated its approach to sustain the current economic expansion. In total, the Fed increased rates by a quarter of a percentage point one time in December 2018 but later decreased rates by a quarter of a percentage point in each July and September 2019. The Fed’s dovish turn and the low global interest-rate environment supported risk assets in 2019 as credit spreads generally tightened for the remainder of the period.
Our Macroeconomic and Investment Research continued to reinforce a heightened chance that the U.S. economy could be in the later stages of the current credit cycle. Elevated levels of corporate indebtedness combined with deteriorating macroeconomic metrics and relatively tight prevailing credit spreads informed us that investors were not being adequately compensated to take risk in credit. As a result, over the course of the past twelve months, we continued to proactively shift the portfolio to a more defensive stance. As spreads and yields grinded tighter we used the moves as opportunities to shift the portfolio up in credit quality, reduce spread duration, and maintain ample liquidity. For the one-year period, the Fund reduced spread duration to 2.7 years from 3.8 years.
The Fund’s overweight to Agency Commercial Mortgage-Backed Securities (“Agency CMBS”) contributed positively to total return. Agency CMBS offered a relative yield pick-up to Agency Residential Mortgage-Backed Securities (Agency “RMBS”) while featuring stronger prepayment protection, dampening the negative convexity profile inherent in mortgage-backed securities. Moreover, the Fund’s overweight holdings in Agency debt benefitted performance as interest rate-sensitive securities rallied over the period.
The Fund’s allocation to structured credit, specifically collateralized loan obligations (“CLOs”) and commercial asset-backed securities (“ABS”), contributed positively to returns as these securities provided attractive and stable income. Moreover, the Fund’s allocation to Non-Agency RMBS generated positive absolute return primarily from income generation. Supportive housing fundamentals, a strong labor market, and shrinking outstanding supply of pre-crisis RMBS securities reinforced demand throughout the period.
The Fund held a high allocation to short-term investments to prioritize capital preservation, preserve optionality, and maintain sufficient liquidity in light of heightened uncertainty. Within short-term investments, the Fund employed foreign sovereign asset swaps which allowed the Fund to earn additional yield in non-U.S. sovereign securities relative to maturity-equivalent U.S. government securities while hedging non-U.S. currency exposure. The enhanced carry contributed positively to total return. Carry refers to the income received from portfolio investments over a defined period.
The Fund’s overall underweight duration position relative to its benchmark was the largest detractor to performance. Heading into the fourth quarter of 2018, the Fund remained underweight duration relative to the benchmark as we were concerned the Fed may continue to increase interest rates to combat an overheating labor market and higher inflation expectations. The volatility in the fourth quarter along with the Fed’s interest rate cuts ultimately moved rates lower, which caused the Fund’s performance to lag that of the benchmark.
| | THE GUGGENHEIM FUNDS ANNUAL REPORT | 39 |
MANAGERS’ COMMENTARY (Unaudited)(concluded) | September 30, 2019 |
We added about three quarters of a year of duration to the portfolio since the beginning of August 2019, in line with our longer-term view that yields will move lower as the business cycle ages. Given the potential for the Fed to extend the cycle and rates to rise in the near-term, though, we have remained underweight overall duration.
The Fund has remained underweight Investment Grade corporate bonds. In recent years, corporate leverage ratios have continued to move higher suggesting that any economic slowdown could expose the weaknesses inherent in corporate balance sheets. The Fund maintained short-risk positions in Investment Grade credit default swaps to further reduce Investment Grade corporate credit risk which detracted from performance.
Performance displayed represents past performance which is no guarantee of future results.
1 | Performance figures are based on Class A shares and do not reflect deduction of the sales charges or taxes that a shareholder would pay on distributions or the redemption of shares. |
The opinions and forecast expressed may not actually come to pass. This information is subject to change at any time, based on market and other conditions, and should not be construed as a recommendation of any specific security or strategy.
40 | THE GUGGENHEIM FUNDS ANNUAL REPORT | |
PERFORMANCE REPORT AND FUND PROFILE (Unaudited) | September 30, 2019 |
INVESTMENT GRADE BOND FUND
OBJECTIVE: Seeks to provide current income.
Holdings Diversification (Market Exposure as % of Net Assets)

“Holdings Diversification (Market Exposure as % of Net Assets)” excludes any temporary cash investments.
Portfolio Composition by Quality Rating1 |
Rating | | % of Total
Investments | |
Fixed Income Instruments | | | | |
AAA | | | 54.7 | % |
AA | | | 4.5 | % |
A | | | 16.8 | % |
BBB | | | 11.3 | % |
BB | | | 1.9 | % |
B | | | 1.4 | % |
CCC | | | 0.8 | % |
CC | | | 0.5 | % |
C | | | 0.2 | % |
NR2 | | | 3.5 | % |
Other Instruments | | | 4.4 | % |
Total Investments | | | 100.0 | % |
Inception Dates: |
A-Class | August 15, 1985 |
C-Class | May 1, 2000 |
P-Class | May 1, 2015 |
Institutional Class | January 29, 2013 |
Ten Largest Holdings (% of Total Net Assets) |
U.S. Treasury Notes, 2.38% due 02/29/24 | 5.2% |
U.S. Treasury Notes, 2.38% due 03/15/22 | 4.1% |
U.S. Treasury Notes, 2.50% | 3.3% |
Government of Japan | 1.9% |
U.S. Treasury Bonds, 2.25% | 1.9% |
U.S. Treasury Bonds, 2.88% | 1.7% |
Government of Japan, 0.10% due 08/01/21 | 1.7% |
Kingdom of Spain, 0.75% | 1.7% |
U.S. Treasury Notes, 1.75% | 1.3% |
Government of Japan, 0.10% due 07/01/21 | 1.2% |
Top Ten Total | 24.0% |
| | |
“Ten Largest Holdings” excludes any temporary cash or derivative investments. |
1 | Source: BlackRock Solutions. Credit quality ratings are measured on a scale that generally ranges from AAA (highest) to D (lowest). All securities except for those labeled “NR” have been rated by Moody’s, Standard & Poor’s (“S&P”), or Fitch, each of which is a Nationally Recognized Statistical Rating Organization (“NRSRO”). For purposes of this presentation, when ratings are available from more than one agency, the highest rating is used. Guggenheim Investments has converted ratings to the equivalent S&P rating. Security ratings are determined at the time of purchase and may change thereafter. |
2 | NR securities do not necessarily indicate low credit quality. |
| | THE GUGGENHEIM FUNDS ANNUAL REPORT | 41 |
PERFORMANCE REPORT AND FUND PROFILE (Unaudited)(concluded) | September 30, 2019 |
Cumulative Fund Performance*

Average Annual Returns*
Periods Ended September 30, 2019
| 1 Year | 5 Year | 10 Year |
A-Class Shares | 5.72% | 3.82% | 4.91% |
A-Class Shares with sales charge‡ | 1.49% | 2.81% | 4.41% |
C-Class Shares | 4.96% | 3.06% | 4.15% |
C-Class Shares with CDSC§ | 3.96% | 3.06% | 4.15% |
Bloomberg Barclays U.S. Aggregate Bond Index | 10.30% | 3.38% | 3.75% |
| 1 Year | 5 Year | Since
Inception
(01/29/13) |
Institutional Class Shares | 6.03% | 4.11% | 4.56% |
Bloomberg Barclays U.S. Aggregate Bond Index | 10.30% | 3.38% | 2.94% |
| | 1 Year | Since
Inception
(05/01/15) |
P-Class Shares | | 5.77% | 3.81% |
Bloomberg Barclays U.S. Aggregate Bond Index | | 10.30% | 3.20% |
* | The performance data above represents past performance that is not predictive of future results. The investment return and principal value of an investment in the Fund will fluctuate so that an investor’s shares, when redeemed, may be worth more or less than their original cost. Returns are historical and include changes in principal and reinvested dividends and capital gains and do not reflect the effect of taxes. The Bloomberg Barclays U.S. Aggregate Bond Index is an unmanaged index and, unlike the Fund, has no management fees or operating expenses to reduce its reported return. The graph is based on A-Class shares only; performance for C-Class shares, P-Class shares and Institutional Class shares will vary due to differences in fess structures. |
‡ | Effective October 1, 2015, the maximum sales charge decreased from 4.75% to 4.00%. A 4.75% maximum sales charge is used in the calculation of the Average Annual Returns based on subscriptions made prior to October 1, 2015, and a 4.00% maximum sales charge is used to calculate performance for periods based on subscriptions made on or after October 1, 2015. |
§ | Fund returns include a CDSC of 1% if redeemed within 12 months of purchase. |
42 | THE GUGGENHEIM FUNDS ANNUAL REPORT | |
SCHEDULE OF INVESTMENTS | September 30, 2019 |
INVESTMENT GRADE BOND FUND | |
| | Shares | | | Value | |
COMMON STOCKS††† - 0.0% |
| | | | | | | | | |
Industrial – 0.0% |
Constar International Holdings LLC*,1 | | | 68 | | | $ | — | |
| | | | | | | | | |
Total Common Stocks | | | | | | | | |
(Cost $—) | | | | | | | — | |
| | | | | | | | | |
MUTUAL FUNDS† - 0.3% |
Guggenheim Floating Rate Strategies Fund — R6-Class2 | | | 100,770 | | | | 2,544,445 | |
Total Mutual Funds | | | | | | | | |
(Cost $2,625,902) | | | | | | | 2,544,445 | |
| | | | | | | | | |
MONEY MARKET FUND† - 0.2% |
Dreyfus Treasury Securities Cash Management Fund — Institutional Shares 1.83%3 | | | 1,672,341 | | | | 1,672,341 | |
Total Money Market Fund | | | | | | | | |
(Cost $1,672,341) | | | | | | | 1,672,341 | |
| | | | | | | | | |
| | | Face
Amount~ | | | | | |
COLLATERALIZED MORTGAGE OBLIGATIONS†† - 29.3% |
Government Agency - 15.9% |
Fannie Mae | | | | | | | | |
3.59% due 02/01/29 | | | 6,435,000 | | | | 7,165,321 | |
3.71% due 02/01/34 | | | 5,700,000 | | | | 6,443,787 | |
3.03% due 02/01/30 | | | 5,100,000 | | | | 5,451,805 | |
3.66% due 03/01/34 | | | 4,000,000 | | | | 4,491,286 | |
3.60% due 03/01/31 | | | 4,000,000 | | | | 4,446,934 | |
2.55% due 12/01/29††† | | | 3,000,000 | | | | 3,013,673 | |
3.00% due 12/01/29 | | | 2,500,000 | | | | 2,675,382 | |
3.61% due 04/01/34 | | | 2,300,000 | | | | 2,545,689 | |
3.49% due 04/01/30 | | | 2,300,000 | | | | 2,543,572 | |
3.37% due 05/01/31 | | | 2,250,000 | | | | 2,477,523 | |
4.17% due 02/01/49 | | | 2,000,000 | | | | 2,303,383 | |
3.26% due 05/01/34 | | | 2,000,000 | | | | 2,171,026 | |
3.19% due 02/01/29 | | | 2,000,000 | | | | 2,163,439 | |
3.09% due 10/01/29 | | | 2,000,000 | | | | 2,112,720 | |
3.11% due 04/01/30 | | | 1,971,676 | | | | 2,091,742 | |
2.81% due 09/01/39 | | | 2,000,000 | | | | 2,004,519 | |
2.70% due 10/01/39††† | | | 2,000,000 | | | | 1,975,022 | |
3.12% due 10/01/32 | | | 1,700,000 | | | | 1,778,168 | |
3.88% due 07/01/33 | | | 1,500,000 | | | | 1,677,602 | |
3.33% due 05/01/34 | | | 1,500,000 | | | | 1,660,005 | |
3.13% due 01/01/30 | | | 1,500,000 | | | | 1,605,832 | |
3.01% due 12/01/27 | | | 1,500,000 | | | | 1,586,983 | |
2.86% due 09/01/29 | | | 1,450,000 | | | | 1,531,236 | |
4.24% due 08/01/48 | | | 1,000,000 | | | | 1,147,806 | |
4.27% due 12/01/33 | | | 989,200 | | | | 1,125,310 | |
3.68% due 04/01/34 | | | 1,000,000 | | | | 1,125,122 | |
3.70% due 03/01/31 | | | 1,000,000 | | | | 1,125,063 | |
3.67% due 03/01/30 | | | 1,000,000 | | | | 1,120,925 | |
3.83% due 05/01/49 | | | 1,000,000 | | | | 1,120,189 | |
3.56% due 03/01/31 | | | 1,000,000 | | | | 1,118,487 | |
| | Face
Amount~ | | | Value | |
3.74% due 02/01/30 | | | 1,000,000 | | | $ | 1,117,568 | |
3.53% due 04/01/33 | | | 1,000,000 | | | | 1,115,571 | |
3.51% due 04/01/34 | | | 1,000,000 | | | | 1,111,394 | |
3.56% due 04/01/30 | | | 1,000,000 | | | | 1,111,041 | |
3.43% due 09/01/34 | | | 1,000,000 | | | | 1,109,126 | |
3.48% due 04/01/30 | | | 1,000,000 | | | | 1,106,733 | |
3.66% due 03/01/34 | | | 993,092 | | | | 1,105,936 | |
3.34% due 05/01/34 | | | 1,000,000 | | | | 1,104,372 | |
3.42% due 04/01/30 | | | 1,000,000 | | | | 1,100,416 | |
3.31% due 01/01/33 | | | 1,000,000 | | | | 1,095,842 | |
3.36% due 05/01/34 | | | 995,110 | | | | 1,093,755 | |
3.46% due 08/01/49 | | | 998,808 | | | | 1,085,579 | |
3.19% due 02/01/30 | | | 1,000,000 | | | | 1,081,590 | |
3.18% due 01/01/30 | | | 1,000,000 | | | | 1,078,210 | |
3.05% due 01/01/30 | | | 1,000,000 | | | | 1,075,113 | |
3.23% due 01/01/30 | | | 974,941 | | | | 1,056,481 | |
3.12% due 01/01/30 | | | 972,761 | | | | 1,046,462 | |
2.69% due 11/01/34 | | | 1,000,000 | | | | 1,006,172 | |
2.57% due 10/01/29 | | | 1,000,000 | | | | 1,002,347 | |
2.96% due 11/01/29 | | | 900,000 | | | | 950,764 | |
3.08% due 10/01/32 | | | 850,000 | | | | 910,267 | |
4.07% due 05/01/49 | | | 796,687 | | | | 905,943 | |
1.95% due 11/01/20 | | | 900,000 | | | | 897,528 | |
2.90% due 11/01/29 | | | 850,000 | | | | 893,712 | |
4.37% due 10/01/48 | | | 741,733 | | | | 847,307 | |
4.25% due 05/01/48 | | | 658,546 | | | | 741,495 | |
3.14% due 09/01/32 | | | 650,000 | | | | 695,879 | |
2.99% due 09/01/29 | | | 650,000 | | | | 688,472 | |
3.17% due 01/01/30 | | | 550,000 | | | | 593,164 | |
2.82% due 10/01/29 | | | 550,000 | | | | 578,985 | |
3.05% due 10/01/29 | | | 500,000 | | | | 534,218 | |
3.22% due 01/01/30 | | | 450,000 | | | | 487,337 | |
3.94% due 10/01/36 | | | 345,522 | | | | 392,509 | |
Freddie Mac Multifamily Structured Pass Through Certificates | | | | | | | | |
2019-K087, 3.77% due 12/25/28 | | | 4,250,000 | | | | 4,779,737 | |
2017-KGX1, 3.00% due 10/25/27 | | | 3,500,000 | | | | 3,717,904 | |
2017-KW03, 3.02% due 06/25/27 | | | 3,000,000 | | | | 3,168,651 | |
2018-K073, 3.45% (WAC) due 01/25/284 | | | 1,200,000 | | | | 1,311,392 | |
2018-K078, 3.92% due 06/25/28 | | | 1,000,000 | | | | 1,124,346 | |
2018-K074, 3.60% due 02/25/28 | | | 1,000,000 | | | | 1,100,487 | |
2017-K066, 3.20% due 06/25/27 | | | 1,000,000 | | | | 1,071,996 | |
Freddie Mac Seasoned Credit Risk Transfer Trust | | | | | | | | |
2017-3, 3.00% due 07/25/56 | | | 2,917,630 | | | | 2,986,055 | |
2017-4, 3.00% due 06/25/575 | | | 1,848,421 | | | | 1,885,822 | |
2017-4, 3.50% due 06/25/57 | | | 1,519,479 | | | | 1,595,032 | |
2018-1, 2.75% due 05/25/575 | | | 1,490,144 | | | | 1,519,550 | |
Fannie Mae-Aces | | | | | | | | |
2017-M11, 2.98% due 08/25/29 | | | 2,500,000 | | | | 2,648,527 | |
Freddie Mac | | | | | | | | |
2018-4762, 4.00% due 01/15/46 | | | 1,000,000 | | | | 1,048,920 | |
Total Government Agency | | | | | | | 132,479,258 | |
| | | | | | | | | |
SEE NOTES TO FINANCIAL STATEMENTS. | THE GUGGENHEIM FUNDS ANNUAL REPORT | 43 |
SCHEDULE OF INVESTMENTS (continued) | September 30, 2019 |
INVESTMENT GRADE BOND FUND | |
| | Face
Amount~ | | | Value | |
Residential Mortgage Backed Securities - 9.7% |
New Residential Advance Receivables Trust Advance Receivables Backed | | | | | | | | |
2019-T3, 2.51% due 10/20/526 | | | 4,450,000 | | | $ | 4,459,428 | |
2019-T2, 2.52% due 08/15/536 | | | 2,000,000 | | | | 1,995,040 | |
CIM Trust | | | | | | | | |
2018-R2, 3.69% (WAC) due 08/25/574,6 | | | 2,795,203 | | | | 2,810,968 | |
2018-R4, 4.07% (WAC) due 12/26/574,6 | | | 2,594,335 | | | | 2,625,269 | |
Cascade Funding Mortgage Trust | | | | | | | | |
2018-RM2, 4.00% (WAC) due 10/25/684,6 | | | 3,940,836 | | | | 4,072,384 | |
2019-RM3, 2.80% (WAC) due 06/25/694,6 | | | 1,000,000 | | | | 1,012,345 | |
New Residential Mortgage Loan Trust | | | | | | | | |
2018-2A, 3.50% (WAC) due 02/25/584,6 | | | 1,619,282 | | | | 1,651,779 | |
2019-RPL1, 4.33% due 02/26/245,6 | | | 1,186,170 | | | | 1,194,268 | |
2017-5A, 3.52% (1 Month USD LIBOR + 1.50%, Rate Floor: 1.50%) due 06/25/574,6 | | | 936,421 | | | | 950,143 | |
2018-1A, 4.00% (WAC) due 12/25/574,6 | | | 733,837 | | | | 761,133 | |
Structured Asset Securities Corporation Mortgage Loan Trust | | | | | | | | |
2007-WF1, 2.23% (1 Month USD LIBOR + 0.21%, Rate Floor: 0.21%) due 02/25/374 | | | 2,662,445 | | | | 2,621,810 | |
2006-BC3, 2.18% (1 Month USD LIBOR + 0.16%, Rate Floor: 0.16%) due 10/25/364 | | | 947,148 | | | | 879,315 | |
2006-BC4, 2.19% (1 Month USD LIBOR + 0.17%, Rate Floor: 0.17%) due 12/25/364 | | | 769,319 | | | | 746,195 | |
GSAA Home Equity Trust | | | | | | | | |
2005-6, 2.45% (1 Month USD LIBOR + 0.43%, Rate Floor: 0.43%) due 06/25/354 | | | 3,150,000 | | | | 3,141,320 | |
Home Equity Loan Trust | | | | | | | | |
2007-FRE1, 2.21% (1 Month USD LIBOR + 0.19%, Rate Floor: 0.19%) due 04/25/374 | | | 2,980,732 | | | | 2,816,922 | |
Soundview Home Loan Trust | | | | | | | | |
2006-OPT5, 2.16% (1 Month USD LIBOR + 0.14%, Rate Floor: 0.14%) due 07/25/364 | | | 2,743,751 | | | | 2,675,138 | |
HarborView Mortgage Loan Trust | | | | | | | | |
2006-12, 2.25% (1 Month USD LIBOR + 0.19%, Rate Floor: 0.19%) due 01/19/384 | | | 1,835,493 | | | | 1,773,287 | |
2006-14, 2.21% (1 Month USD LIBOR + 0.15%, Rate Floor: 0.15%) due 01/25/474 | | | 896,053 | | | | 889,276 | |
CSMC Trust | | | | | | | | |
2018-RPL9, 3.85% (WAC) due 09/25/574,6 | | | 2,555,155 | | | | 2,651,902 | |
BRAVO Residential Funding Trust | | | | | | | | |
2019-NQM1, 2.67% (WAC) due 07/25/594,6 | | | 2,620,764 | | | | 2,624,250 | |
Towd Point Mortgage Trust | | | | | | | | |
2017-6, 2.75% (WAC) due 10/25/574,6 | | | 1,879,267 | | | | 1,897,184 | |
2017-5, 2.62% (1 Month USD LIBOR + 0.60%, Rate Floor: 0.00%) due 02/25/574,6 | | | 442,832 | | | | 441,129 | |
2018-1, 3.00% (WAC) due 01/25/584,6 | | | 275,609 | | | | 279,075 | |
Ocwen Master Advance Receivables Trust | | | | | | | | |
2019-T2, 2.42% due 08/15/516 | | | 2,300,000 | | | | 2,305,535 | |
NovaStar Mortgage Funding Trust Series | | | | | | | | |
2007-2, 2.22% (1 Month USD LIBOR + 0.20%, Rate Cap/Floor: 11.00%/0.20%) due 09/25/374 | | | 2,130,291 | | | | 2,070,315 | |
Argent Securities Incorporated Asset-Backed Pass-Through Certificates Series | | | | | | | | |
2005-W2, 2.51% (1 Month USD LIBOR + 0.49%, Rate Floor: 0.49%) due 10/25/354 | | | 2,000,000 | | | | 2,002,852 | |
NRPL Trust | | | | | | | | |
2019-3, 3.00% (WAC) due 06/01/594,6 | | | 2,000,000 | | | | 1,994,020 | |
JP Morgan Mortgage Acquisition Trust | | | | | | | | |
2006-WMC4, 2.14% (1 Month USD LIBOR + 0.12%, Rate Floor: 0.12%) due 12/25/364 | | | 3,160,313 | | | | 1,993,439 | |
Starwood Mortgage Residential Trust | | | | | | | | |
2019-1, 2.94% (WAC) due 06/25/494,6 | | | 1,721,217 | | | | 1,724,789 | |
Countrywide Asset-Backed Certificates | | | | | | | | |
2006-6, 2.19% (1 Month USD LIBOR + 0.17%, Rate Floor: 0.17%) due 09/25/364 | | | 1,648,348 | | | | 1,633,424 | |
Deephaven Residential Mortgage Trust | | | | | | | | |
2019-3A, 2.96% (WAC) due 07/25/594,6 | | | 956,657 | | | | 960,902 | |
2017-3A, 2.58% (WAC) due 10/25/474,6 | | | 614,026 | | | | 612,151 | |
Alternative Loan Trust | | | | | | | | |
2007-OA4, 2.19% (1 Month USD LIBOR + 0.17%, Rate Floor: 0.17%) due 05/25/474 | | | 1,555,076 | | | | 1,494,841 | |
American Home Mortgage Investment Trust | | | | | | | | |
2007-1, 2.08% due 05/25/477 | | | 8,967,261 | | | | 1,465,081 | |
Homeward Opportunities Fund I Trust | | | | | | | | |
2019-2, 2.70% (WAC) due 09/25/594,6 | | | 1,456,220 | | | | 1,454,350 | |
Citigroup Mortgage Loan Trust | | | | | | | | |
2019-IMC1, 2.72% (WAC) due 07/25/494,6 | | | 1,439,145 | | | | 1,437,027 | |
Freddie Mac STACR Trust | | | | | | | | |
2019-DNA3, 2.75% (1 Month USD LIBOR + 0.73%, Rate Floor: 0.00%) due 07/25/494,6 | | | 1,250,452 | | | | 1,250,914 | |
GSAMP Trust | | | | | | | | |
2007-NC1, 2.15% (1 Month USD LIBOR + 0.13%, Rate Floor: 0.13%) due 12/25/464 | | | 1,768,579 | | | | 1,141,207 | |
Structured Asset Investment Loan Trust | | | | | | | | |
2005-11, 2.74% (1 Month USD LIBOR + 0.72%, Rate Floor: 0.36%) due 01/25/364 | | | 1,084,315 | | | | 1,073,647 | |
44 | THE GUGGENHEIM FUNDS ANNUAL REPORT | SEE NOTES TO FINANCIAL STATEMENTS. |
SCHEDULE OF INVESTMENTS (continued) | September 30, 2019 |
INVESTMENT GRADE BOND FUND | |
| | Face
Amount~ | | | Value | |
LSTAR Securities Investment Trust | | | | | | | | |
2019-1, 3.79% (1 Month USD LIBOR + 1.70%, Rate Floor: 0.00%) due 03/01/244,6 | | | 709,407 | | | $ | 709,797 | |
2018-2, 3.53% (1 Month USD LIBOR + 1.50%, Rate Floor: 0.00%) due 04/01/234,6 | | | 334,641 | | | | 334,323 | |
Park Place Securities Incorporated Asset Backed Pass Through Certificates Ser | | | | | | | | |
2005-WHQ3, 2.96% (1 Month USD LIBOR + 0.95%, Rate Floor: 0.63%) due 06/25/354 | | | 1,000,000 | | | | 1,002,274 | |
Asset Backed Securities Corporation Home Equity Loan Trust Series AEG | | | | | | | | |
2006-HE1, 2.42% (1 Month USD LIBOR + 0.40%, Rate Floor: 0.40%) due 01/25/364 | | | 1,000,000 | | | | 968,874 | |
COLT Mortgage Loan Trust | | | | | | | | |
2018-3, 3.69% (WAC) due 10/26/484,6 | | | 931,381 | | | | 937,430 | |
Nationstar Home Equity Loan Trust | | | | | | | | |
2007-B, 2.24% (1 Month USD LIBOR + 0.22%, Rate Floor: 0.22%) due 04/25/374 | | | 837,439 | | | | 828,039 | |
Luminent Mortgage Trust | | | | | | | | |
2006-2, 2.22% (1 Month USD LIBOR + 0.20%, Rate Floor: 0.20%) due 02/25/464 | | | 933,263 | | | | 821,688 | |
Legacy Mortgage Asset Trust | | | | | | | | |
2018-GS3, 4.00% due 06/25/585,6 | | | 758,815 | | | | 767,274 | |
Bear Stearns Asset Backed Securities I Trust | | | | | | | | |
2006-HE9, 2.16% (1 Month USD LIBOR + 0.14%, Rate Floor: 0.14%) due 11/25/364 | | | 750,238 | | | | 731,532 | |
CSMC Series | | | | | | | | |
2015-12R, 2.77% (WAC) due 11/30/374,6 | | | 671,099 | | | | 668,290 | |
RALI Series Trust | | | | | | | | |
2006-QO2, 2.24% (1 Month USD LIBOR + 0.22%, Rate Floor: 0.22%) due 02/25/464 | | | 1,789,734 | | | | 663,937 | |
Deutsche Alt-A Securities Mortgage Loan Trust Series | | | | | | | | |
2007-OA2, 3.22% (1 Year CMT Rate + 0.77%, Rate Floor: 0.77%) due 04/25/474 | | | 635,898 | | | | 609,776 | |
GSMSC Resecuritization Trust | | | | | | | | |
2015-5R, 2.29% (1 Month USD LIBOR + 0.14%, Rate Floor: 0.14%) due 04/26/374,6 | | | 475,371 | | | | 473,862 | |
CIT Mortgage Loan Trust | | | | | | | | |
2007-1, 3.47% (1 Month USD LIBOR + 1.45%, Rate Floor: 1.45%) due 10/25/374,6 | | | 457,758 | | | | 459,808 | |
MASTR Adjustable Rate Mortgages Trust | | | | | | | | |
2003-5, 3.29% (WAC) due 11/25/334 | | | 421,302 | | | | 400,702 | |
Banc of America Funding Trust | | | | | | | | |
2015-R4, 2.32% (1 Month USD LIBOR + 0.17%, Rate Floor: 0.17%) due 01/27/354,6 | | | 400,914 | | | | 397,615 | |
Washington Mutual Mortgage Pass-Through Certificates WMALT Series Trust | | | | | | | | |
2006-AR9, 3.29% (1 Year CMT Rate + 0.84%, Rate Floor: 0.84%) due 11/25/464 | | | 431,270 | | | | 392,370 | |
Angel Oak Mortgage Trust LLC | | | | | | | | |
2017-3, 2.71% (WAC) due 11/25/474,6 | | | 386,201 | | | | 385,013 | |
UCFC Manufactured Housing Contract | | | | | | | | |
1997-2, 7.38% due 10/15/28 | | | 122,916 | | | | 129,777 | |
Total Residential Mortgage Backed Securities | | | | | | | 81,266,435 | |
| | | | | | | | | |
Commercial Mortgage Backed Securities - 2.3% |
CGBAM Mezzanine Securities Trust | | | | | | | | |
2015-SMMZ, 8.21% due 04/10/286 | | | 2,650,000 | | | | 2,693,856 | |
COMM Mortgage Trust | | | | | | | | |
2015-CR24, 0.91% (WAC) due 08/10/484,7 | | | 46,319,776 | | | | 1,777,007 | |
2015-CR26, 1.10% (WAC) due 10/10/484,7 | | | 9,419,078 | | | | 443,211 | |
Four Times Square Trust Commercial Mortgage Pass-Through Certificates Series | | | | | | | | |
2006-4TS, 5.40% due 12/13/286 | | | 1,867,959 | | | | 1,925,918 | |
Americold LLC Trust | | | | | | | | |
2010-ARTA, 7.44% due 01/14/296 | | | 1,250,000 | | | | 1,301,219 | |
GRACE Mortgage Trust | | | | | | | | |
2014-GRCE, 3.37% due 06/10/286 | | | 1,000,000 | | | | 1,015,309 | |
Bancorp Commercial Mortgage Trust | | | | | | | | |
2018-CR3, 3.28% (1 Month USD LIBOR + 1.25%, Rate Floor: 1.25%) due 01/15/334,6 | | | 1,000,000 | | | | 1,001,579 | |
GS Mortgage Securities Trust | | | | | | | | |
2019-GC42, 0.81% (WAC) due 09/01/524,7 | | | 15,000,000 | | | | 995,435 | |
CSAIL Commercial Mortgage Trust | | | | | | | | |
2019-C15, 1.22% (WAC) due 03/15/524,7 | | | 12,488,289 | | | | 966,808 | |
BENCHMARK Mortgage Trust | | | | | | | | |
2018-B6, 0.60% (WAC) due 10/10/514,7 | | | 31,408,347 | | | | 918,251 | |
SG Commercial Mortgage Securities Trust | | | | | | | | |
2016-C5, 2.15% (WAC) due 10/10/484,7 | | | 9,680,910 | | | | 891,766 | |
UBS Commercial Mortgage Trust | | | | | | | | |
2017-C2, 1.24% (WAC) due 08/15/504,7 | | | 11,216,990 | | | | 738,352 | |
Citigroup Commercial Mortgage Trust | | | | | | | | |
2016-GC37, 1.93% (WAC) due 04/10/494,7 | | | 3,722,663 | | | | 333,917 | |
2016-C2, 1.92% (WAC) due 08/10/494,7 | | | 2,445,349 | | | | 233,436 | |
2016-P5, 1.67% (WAC) due 10/10/494,7 | | | 1,946,377 | | | | 145,624 | |
GE Business Loan Trust | | | | | | | | |
2007-1A, 2.20% (1 Month USD LIBOR + 0.17%, Rate Floor: 0.17%) due 04/15/354,6 | | | 653,246 | | | | 640,026 | |
SEE NOTES TO FINANCIAL STATEMENTS. | THE GUGGENHEIM FUNDS ANNUAL REPORT | 45 |
SCHEDULE OF INVESTMENTS (continued) | September 30, 2019 |
INVESTMENT GRADE BOND FUND | |
| | Face
Amount~ | | | Value | |
JPMDB Commercial Mortgage Securities Trust | | | | | | | | |
2016-C2, 1.83% (WAC) due 06/15/494,7 | | | 8,745,177 | | | $ | 619,267 | |
Morgan Stanley Capital I Trust | | | | | | | | |
2016-UB11, 1.77% (WAC) due 08/15/494,7 | | | 7,391,248 | | | | 574,967 | |
Wells Fargo Commercial Mortgage Trust | | | | | | | | |
2016-NXS5, 1.67% (WAC) due 01/15/594,7 | | | 4,809,527 | | | | 303,793 | |
2016-C37, 1.14% (WAC) due 12/15/494,7 | | | 3,767,669 | | | | 163,650 | |
Aventura Mall Trust 2013-AVM | | | | | | | | |
2013-AVM, 3.87% (WAC) due 12/05/324,6 | | | 425,000 | | | | 429,993 | |
CGBAM Commercial Mortgage Trust | | | | | | | | |
2015-SMRT, 3.91% (WAC) due 04/10/284,6 | | | 350,000 | | | | 351,569 | |
Americold 2010 LLC | | | | | | | | |
2010-ARTA, 3.85% due 01/14/296 | | | 335,329 | | | | 338,645 | |
CFCRE Commercial Mortgage Trust | | | | | | | | |
2016-C3, 1.19% (WAC) due 01/10/484,7 | | | 5,786,201 | | | | 315,838 | |
CD Mortgage Trust | | | | | | | | |
2016-CD1, 1.55% (WAC) due 08/10/494,7 | | | 2,532,754 | | | | 185,804 | |
Total Commercial Mortgage Backed Securities | | | | | | | 19,305,240 | |
| | | | | | | | | |
Military Housing - 1.4% |
Freddie Mac Military Housing Bonds Resecuritization Trust Certificates | | | | | | | | |
2015-R1, 3.48% (WAC) due 11/25/554,6 | | | 3,933,045 | | | | 4,612,438 | |
2015-R1, 4.11% (WAC) due 11/25/524,6 | | | 1,642,308 | | | | 1,907,357 | |
Capmark Military Housing Trust | | | | | | | | |
2006-RILY, 6.15% due 07/10/516 | | | 2,342,384 | | | | 2,768,277 | |
2007-ROBS, 6.06% due 10/10/526 | | | 470,679 | | | | 576,780 | |
2007-AETC, 5.75% due 02/10/526 | | | 327,407 | | | | 369,908 | |
GMAC Commercial Mortgage Asset Corp. | | | | | | | | |
2007-HCKM, 6.11% due 08/10/526 | | | 1,480,716 | | | | 1,642,322 | |
Total Military Housing | | | | | | | 11,877,082 | |
Total Collateralized Mortgage Obligations | | | | | | | | |
(Cost $234,192,280) | | | | | | | 244,928,015 | |
| | | | | | | | | |
U.S. GOVERNMENT SECURITIES†† - 18.7% |
U.S. Treasury Notes | | | | | | | | |
2.38% due 02/29/24 | | | 42,382,000 | | | | 43,847,159 | |
2.38% due 03/15/22 | | | 33,392,000 | | | | 34,028,535 | |
2.50% due 02/28/26 | | | 26,348,000 | | | | 27,761,117 | |
1.75% due 06/30/24 | | | 10,388,000 | | | | 10,476,054 | |
1.88% due 06/30/26 | | | 2,551,000 | | | | 2,592,952 | |
U.S. Treasury Bonds | | | | | | | | |
2.25% due 08/15/49 | | | 15,139,000 | | | | 15,570,107 | |
2.88% due 05/15/49 | | | 12,493,000 | | | | 14,570,449 | |
U.S. Treasury Inflation Protected Securities | | | | | | | | |
1.38% due 01/15/208 | | | 7,588,278 | | | | 7,565,158 | |
Total U.S. Government Securities | | | | | | | | |
(Cost $151,597,327) | | | | | | | 156,411,531 | |
| | | | | | | | | |
ASSET-BACKED SECURITIES†† - 17.9% |
Collateralized Loan Obligations - 8.3% |
Palmer Square Loan Funding Ltd. | | | | | | | | |
2018-4A, 3.06% (3 Month USD LIBOR + 0.90%, Rate Floor: 0.00%) due 11/15/264,6 | | | 4,553,049 | | | | 4,551,398 | |
2019-3A, 3.17% (3 Month USD LIBOR + 0.85%, Rate Floor: 0.85%) due 08/20/274,6 | | | 1,500,000 | | | | 1,498,575 | |
2018-4A, 3.61% (3 Month USD LIBOR + 1.45%, Rate Floor: 0.00%) due 11/15/264,6 | | | 1,000,000 | | | | 998,424 | |
Denali Capital CLO XI Ltd. | | | | | | | | |
2018-1A, 3.41% (3 Month USD LIBOR + 1.13%, Rate Floor: 0.00%) due 10/20/284,6 | | | 3,000,000 | | | | 2,997,716 | |
2018-1A, 3.93% (3 Month USD LIBOR + 1.65%, Rate Floor: 0.00%) due 10/20/284,6 | | | 2,000,000 | | | | 1,980,388 | |
NewStar Clarendon Fund CLO LLC | | | | | | | | |
2019-1A, 3.58% (3 Month USD LIBOR + 1.30%, Rate Floor: 0.00%) due 01/25/274,6 | | | 4,250,000 | | | | 4,245,781 | |
Golub Capital Partners CLO Ltd. | | | | | | | | |
2018-36A, 3.59% (3 Month USD LIBOR + 1.30%, Rate Floor: 0.00%) due 02/05/314,6 | | | 4,100,000 | | | | 4,038,254 | |
Crown Point CLO III Ltd. | | | | | | | | |
2017-3A, 3.75% (3 Month USD LIBOR + 1.45%, Rate Floor: 0.00%) due 12/31/274,6 | | | 2,000,000 | | | | 1,986,521 | |
2017-3A, 3.21% (3 Month USD LIBOR + 0.91%, Rate Floor: 0.00%) due 12/31/274,6 | | | 1,000,000 | | | | 1,000,402 | |
ALM VI Ltd. | | | | | | | | |
2018-6A, 3.50% (3 Month USD LIBOR + 1.20%, Rate Floor: 0.00%) due 07/15/264,6 | | | 2,800,000 | | | | 2,791,134 | |
THL Credit Wind River CLO Ltd. | | | | | | | | |
2019-1A, 3.18% (3 Month USD LIBOR + 0.88%, Rate Floor: 0.00%) due 01/15/264,6 | | | 2,750,000 | | | | 2,750,621 | |
Carlyle Global Market Strategies CLO Ltd. | | | | | | | | |
2018-2A, 3.04% (3 Month USD LIBOR + 0.78%, Rate Floor: 0.00%) due 04/27/274,6 | | | 2,236,553 | | | | 2,228,296 | |
MP CLO VIII Ltd. | | | | | | | | |
2018-2A, 3.17% (3 Month USD LIBOR + 0.91%, Rate Floor: 0.00%) due 10/28/274,6 | | | 2,200,000 | | | | 2,200,045 | |
Mountain View CLO Ltd. | | | | | | | | |
2018-1A, 3.10% (3 Month USD LIBOR + 0.80%, Rate Floor: 0.80%) due 10/15/264,6 | | | 2,189,931 | | | | 2,191,441 | |
46 | THE GUGGENHEIM FUNDS ANNUAL REPORT | SEE NOTES TO FINANCIAL STATEMENTS. |
SCHEDULE OF INVESTMENTS (continued) | September 30, 2019 |
INVESTMENT GRADE BOND FUND | |
| | Face
Amount~ | | | Value | |
Figueroa CLO Ltd. | | | | | | | | |
2018-2A, 3.01% (3 Month USD LIBOR + 0.85%, Rate Floor: 0.85%) due 06/20/274,6 | | | 2,185,639 | | | $ | 2,177,807 | |
ALM XII Ltd. | | | | | | | | |
2018-12A, 3.21% (3 Month USD LIBOR + 0.89%, Rate Floor: 0.89%) due 04/16/274,6 | | | 2,113,521 | | | | 2,113,216 | |
Fortress Credit Opportunities IX CLO Ltd. | | | | | | | | |
2017-9A, 3.71% (3 Month USD LIBOR + 1.55%, Rate Floor: 0.00%) due 11/15/294,6 | | | 2,086,000 | | | | 2,073,472 | |
Halcyon Loan Advisors Funding Ltd. | | | | | | | | |
2017-3A, 3.20% (3 Month USD LIBOR + 0.90%, Rate Floor: 0.00%) due 10/18/274,6 | | | 2,000,000 | | | | 2,000,880 | |
Golub Capital Partners CLO 16 Ltd. | | | | | | | | |
2017-16A, 4.13% (3 Month USD LIBOR + 1.85%, Rate Floor: 0.00%) due 07/25/294,6 | | | 2,000,000 | | | | 2,000,208 | |
Cerberus Loan Funding XVII Ltd. | | | | | | | | |
2016-3A, 4.83% (3 Month USD LIBOR + 2.53%, Rate Floor: 0.00%) due 01/15/284,6 | | | 2,000,000 | | | | 1,990,633 | |
Fortress Credit Opportunities XI CLO Ltd. | | | | | | | | |
2018-11A, 3.60% (3 Month USD LIBOR + 1.30%, Rate Floor: 0.00%) due 04/15/314,6 | | | 2,000,000 | | | | 1,970,261 | |
Venture XII CLO Ltd. | | | | | | | | |
2018-12A, 2.94% (3 Month USD LIBOR + 0.80%, Rate Floor: 0.80%) due 02/28/264,6 | | | 1,814,970 | | | | 1,809,152 | |
NXT Capital CLO LLC | | | | | | | | |
2017-1A, 3.98% (3 Month USD LIBOR + 1.70%, Rate Floor: 0.00%) due 04/20/294,6 | | | 1,800,000 | | | | 1,800,191 | |
OCP CLO 2014-7 Ltd. | | | | | | | | |
2018-7A, 2.88% (3 Month USD LIBOR + 0.60%, Rate Floor: 0.00%) due 07/20/294,6 | | | 1,428,571 | | | | 1,427,240 | |
Garrison BSL CLO Ltd. | | | | | | | | |
2018-1A, 3.25% (3 Month USD LIBOR + 0.95%, Rate Floor: 0.00%) due 07/17/284,6 | | | 1,300,000 | | | | 1,300,110 | |
KVK CLO Ltd. | | | | | | | | |
2017-1A, 3.20% (3 Month USD LIBOR + 0.90%, Rate Floor: 0.00%) due 01/14/284,6 | | | 1,250,000 | | | | 1,245,632 | |
FDF II Ltd. | | | | | | | | |
2016-2A, 4.29% due 05/12/316 | | | 1,000,000 | | | | 1,018,275 | |
FDF I Ltd. | | | | | | | | |
2015-1A, 4.40% due 11/12/306 | | | 1,000,000 | | | | 1,012,535 | |
NXT Capital CLO 2015-1 LLC | | | | | | | | |
2018-1A, 3.88% (3 Month USD LIBOR + 1.60%, Rate Floor: 0.00%) due 04/21/274,6 | | | 1,000,000 | | | | 1,000,068 | |
TCP Waterman CLO Ltd. | | | | | | | | |
2016-1A, 4.17% (3 Month USD LIBOR + 2.05%, Rate Floor: 0.00%) due 12/15/284,6 | | | 1,000,000 | | | | 999,570 | |
MONROE CAPITAL BSL CLO Ltd. | | | | | | | | |
2017-1A, 3.90% (3 Month USD LIBOR + 1.75%, Rate Floor: 0.00%) due 05/22/274,6 | | | 1,000,000 | | | | 997,690 | |
Diamond CLO Ltd. | | | | | | | | |
2018-1A, 3.78% (3 Month USD LIBOR + 1.50%, Rate Floor: 1.50%) due 07/22/304,6 | | | 1,000,000 | | | | 996,766 | |
NewStar Fairfield Fund CLO Ltd. | | | | | | | | |
2018-2A, 3.55% (3 Month USD LIBOR + 1.27%, Rate Floor: 1.27%) due 04/20/304,6 | | | 1,000,000 | | | | 983,914 | |
BDS | | | | | | | | |
2018-FL2, 2.97% (1 Month USD LIBOR + 0.95%, Rate Floor: 0.95%) due 08/15/354,6 | | | 971,114 | | | | 968,862 | |
VMC Finance LLC | | | | | | | | |
2018-FL1, 2.84% (1 Month USD LIBOR + 0.82%, Rate Floor: 0.82%) due 03/15/354,6 | | | 962,133 | | | | 956,834 | |
Dryden 37 Senior Loan Fund | | | | | | | | |
2015-37A, due 01/15/316,9 | | | 1,000,000 | | | | 879,065 | |
Avery Point V CLO Ltd. | | | | | | | | |
2017-5A, 3.28% (3 Month USD LIBOR + 0.98%, Rate Floor: 0.00%) due 07/17/264,6 | | | 722,170 | | | | 722,464 | |
Monroe Capital CLO Ltd. | | | | | | | | |
2017-1A, 3.63% (3 Month USD LIBOR + 1.35%, Rate Floor: 0.00%) due 10/22/264,6 | | | 610,467 | | | | 610,622 | |
Mountain Hawk II CLO Ltd. | | | | | | | | |
2018-2A, 3.10% (3 Month USD LIBOR + 0.82%, Rate Floor: 0.00%) due 07/20/244,6 | | | 477,128 | | | | 476,990 | |
Treman Park CLO Ltd. | | | | | | | | |
2015-1A, due 10/20/286,9 | | | 500,000 | | | | 413,954 | |
Babson CLO Ltd. | | | | | | | | |
2014-IA, due 07/20/256,9 | | | 650,000 | | | | 161,834 | |
Copper River CLO Ltd. | | | | | | | | |
2007-1A, due 01/20/219,10 | | | 700,000 | | | | 97,156 | |
Total Collateralized Loan Obligations | | | | | | | 69,664,397 | |
| | | | | | | | | |
Financial - 3.0% |
Station Place Securitization Trust | | | | | | | | |
2019-8, 2.64% (1 Month USD LIBOR + 0.60%, Rate Floor: 0.60%) due 03/24/204,6 | | | 6,750,000 | | | | 6,750,000 | |
2019-6, 2.64% (1 Month USD LIBOR + 0.60%, Rate Floor: 0.60%) due 07/24/21†††,4,6 | | | 5,500,000 | | | | 5,500,000 | |
SEE NOTES TO FINANCIAL STATEMENTS. | THE GUGGENHEIM FUNDS ANNUAL REPORT | 47 |
SCHEDULE OF INVESTMENTS (continued) | September 30, 2019 |
INVESTMENT GRADE BOND FUND | |
| | Face
Amount~ | | | Value | |
2019-5, 2.74% (1 Month USD LIBOR + 0.70%, Rate Floor: 0.70%) due 06/24/20†††,4,6 | | | 2,950,000 | | | $ | 2,950,000 | |
2019-2, 2.59% (1 Month USD LIBOR + 0.55%, Rate Floor: 0.55%) due 04/24/214,6 | | | 1,400,000 | | | | 1,400,810 | |
2019-9, 2.74% (1 Month USD LIBOR + 0.70%, Rate Floor: 0.00%) due 10/24/204,6 | | | 1,350,000 | | | | 1,350,000 | |
2019-WL1, 2.67% (1 Month USD LIBOR + 0.65%, Rate Floor: 0.65%) due 08/25/524,6 | | | 1,000,000 | | | | 1,001,013 | |
Barclays Bank plc | | | | | | | | |
GMTN, 2.86% due 10/31/19 | | | 3,850,000 | | | | 3,850,556 | |
Madison Avenue Securitization Trust | | | | | | | | |
due 11/18/204 | | | 1,300,000 | | | | 1,300,000 | |
Nassau LLC | | | | | | | | |
2019-1, 3.98% due 08/15/346 | | | 1,250,000 | | | | 1,243,750 | |
Total Financial | | | | | | | 25,346,129 | |
| | | | | | | | | |
Transport-Aircraft - 2.1% |
Castlelake Aircraft Securitization Trust | | | | | | | | |
2017-1, 3.97% due 07/15/42 | | | 1,684,660 | | | | 1,708,409 | |
2018-1, 4.13% due 06/15/436 | | | 1,546,570 | | | | 1,583,078 | |
AASET US Ltd. | | | | | | | | |
2018-2A, 4.45% due 11/18/386 | | | 3,050,009 | | | | 3,128,743 | |
Sapphire Aviation Finance I Ltd. | | | | | | | | |
2018-1A, 4.25% due 03/15/406 | | | 2,254,173 | | | | 2,308,443 | |
MAPS Ltd. | | | | | | | | |
2018-1A, 4.21% due 05/15/436 | | | 2,227,500 | | | | 2,284,681 | |
Willis Engine Securitization Trust II | | | | | | | | |
2012-A, 5.50% due 09/15/375,6 | | | 1,561,471 | | | | 1,613,080 | |
Apollo Aviation Securitization Equity Trust | | | | | | | | |
2016-2, 4.21% due 11/15/41 | | | 1,517,806 | | | | 1,534,144 | |
AIM Aviation Finance Ltd. | | | | | | | | |
2015-1A, 4.21% due 02/15/406 | | | 828,962 | | | | 838,489 | |
Falcon Aerospace Ltd. | | | | | | | | |
2017-1, 4.58% due 02/15/426 | | | 695,081 | | | | 701,350 | |
Raspro Trust | | | | | | | | |
2005-1A, 3.20% (3 Month USD LIBOR + 0.93%, Rate Floor: 0.93%) due 03/23/244,6 | | | 607,578 | | | | 599,501 | |
AASET Trust | | | | | | | | |
2017-1A, 3.97% due 05/16/426 | | | 468,126 | | | | 473,724 | |
Turbine Engines Securitization Ltd. | | | | | | | | |
2013-1A, 5.13% due 12/13/4810 | | | 435,276 | | | | 436,118 | |
Diamond Head Aviation Ltd. | | | | | | | | |
2015-1, 3.81% due 07/14/286 | | | 226,897 | | | | 227,099 | |
Total Transport-Aircraft | | | | | | | 17,436,859 | |
| | | | | | | | | |
Transport-Container - 0.9% |
Textainer Marine Containers Ltd. | | | | | | | | |
2017-2A, 3.52% due 06/20/426 | | | 2,291,822 | | | | 2,297,926 | |
Global SC Finance II SRL | | | | | | | | |
2014-1A, 3.19% due 07/17/296 | | | 1,450,000 | | | | 1,449,793 | |
CLI Funding LLC | | | | | | | | |
2018-1A, 4.03% due 04/18/436 | | | 1,106,964 | | | | 1,117,532 | |
CAL Funding III Ltd. | | | | | | | | |
2018-1A, 3.96% due 02/25/436 | | | 1,052,083 | | | | 1,061,122 | |
Textainer Marine Containers V Ltd. | | | | | | | | |
2017-1A, 3.72% due 05/20/426 | | | 780,948 | | | | 781,100 | |
Cronos Containers Program Ltd. | | | | | | | | |
2013-1A, 3.08% due 04/18/286 | | | 645,000 | | | | 644,477 | |
Total Transport-Container | | | | | | | 7,351,950 | |
| | | | | | | | | |
Net Lease - 0.9% |
Capital Automotive LLC | | | | | | | | |
2017-1A, 3.87% due 04/15/476 | | | 2,844,979 | | | | 2,871,761 | |
Store Master Funding I-VII | | | | | | | | |
2016-1A, 3.96% due 10/20/466 | | | 2,745,158 | | | | 2,855,653 | |
STORE Master Funding LLC | | | | | | | | |
2014-1A, 5.00% due 04/20/446 | | | 1,460,000 | | | | 1,535,940 | |
Total Net Lease | | | | | | | 7,263,354 | |
| | | | | | | | | |
Whole Business - 0.8% |
SERVPRO Master Issuer LLC | | | | | | | | |
2019-1A, 3.88% due 10/25/496 | | | 4,000,000 | | | | 4,030,105 | |
Taco Bell Funding LLC | | | | | | | | |
2016-1A, 4.97% due 05/25/466 | | | 1,464,381 | | | | 1,554,851 | |
Domino’s Pizza Master Issuer LLC | | | | | | | | |
2017-1A, 3.53% (3 Month USD LIBOR + 1.25%, Rate Floor: 0.00%) due 07/25/474,6 | | | 980,000 | | | | 980,010 | |
Drug Royalty III Limited Partnership | | | | | | | | |
2016-1A, 3.98% due 04/15/276 | | | 184,765 | | | | 185,189 | |
Total Whole Business | | | | | | | 6,750,155 | |
| | | | | | | | | |
Credit Card - 0.7% |
Citibank Credit Card Issuance Trust | | | | | | | | |
2017-A3, 1.92% due 04/07/22 | | | 6,000,000 | | | | 5,996,038 | |
| | | | | | | | | |
Collateralized Debt Obligations - 0.6% |
Anchorage Credit Funding Ltd. | | | | | | | | |
2016-4A, 3.50% due 02/15/356 | | | 3,750,000 | | | | 3,766,104 | |
2016-3A, 3.85% due 10/28/336 | | | 1,000,000 | | | | 1,007,577 | |
Putnam Structured Product Funding Ltd. | | | | | | | | |
2003-1A, 3.03% (1 Month USD LIBOR + 1.00%, Rate Floor: 0.00%) due 10/15/384,6 | | | 300,575 | | | | 297,706 | |
Highland Park CDO I Ltd. | | | | | | | | |
2006-1A, 2.53% (3 Month USD LIBOR + 0.40%, Rate Floor: 0.00%) due 11/25/514,10 | | | 182,217 | | | | 180,565 | |
N-Star REL CDO VIII Ltd. | | | | | | | | |
2006-8A, 2.45% (1 Month USD LIBOR + 0.36%, Rate Floor: 0.36%) due 02/01/414,6 | | | 108,128 | | | | 106,945 | |
Total Collateralized Debt Obligations | | | | | | | 5,358,897 | |
| | | | | | | | | |
Infrastructure - 0.3% |
Secured Tenant Site Contract Revenue Notes Series | | | | | | | | |
2018-1A, 3.97% due 06/15/486 | | | 1,078,192 | | | | 1,105,345 | |
48 | THE GUGGENHEIM FUNDS ANNUAL REPORT | SEE NOTES TO FINANCIAL STATEMENTS. |
SCHEDULE OF INVESTMENTS (continued) | September 30, 2019 |
INVESTMENT GRADE BOND FUND | |
| | Face
Amount~ | | | Value | |
Vantage Data Centers Issuer LLC | | | | | | | | |
2018-1A, 4.07% due 02/16/436 | | | 984,167 | | | $ | 1,023,006 | |
Total Infrastructure | | | | | | | 2,128,351 | |
| | | | | | | | | |
Diversified Payment Rights - 0.1% |
Bib Merchant Voucher Receivables Ltd. | | | | | | | | |
4.18% due 04/07/28†††,1 | | | 1,000,000 | | | | 1,032,761 | |
CIC Receivables Master Trust | | | | | | | | |
REGD, 4.89% due 10/07/21††† | | | 132,485 | | | | 135,090 | |
Total Diversified Payment Rights | | | | | | | 1,167,851 | |
| | | | | | | | | |
Automotive - 0.1% |
Hertz Vehicle Financing II, LP | | | | | | | | |
2017-1A, 2.96% due 10/25/216 | | | 500,000 | | | | 503,484 | |
| | | | | | | | | |
Insurance - 0.1% |
Chesterfield Financial Holdings LLC | | | | | | | | |
2014-1A, 4.50% due 12/15/346 | | | 401,250 | | | | 403,845 | |
Total Asset-Backed Securities | | | | | | | | |
(Cost $148,840,823) | | | | | | | 149,371,310 | |
| | | | | | | | | |
FOREIGN GOVERNMENT DEBT†† - 14.2% |
Government of Japan | | | | | | | | |
due 01/10/2011 | | JPY | 1,702,900,000 | | | | 15,761,708 | |
0.10% due 08/01/21 | | JPY | 1,562,000,000 | | | | 14,558,362 | |
0.10% due 07/01/21 | | JPY | 1,078,000,000 | | | | 10,042,933 | |
due 01/20/2011 | | JPY | 985,000,000 | | | | 9,117,709 | |
0.10% due 05/01/21 | | JPY | 520,000,000 | | | | 4,840,706 | |
0.10% due 12/20/21 | | JPY | 271,900,000 | | | | 2,539,254 | |
0.10% due 06/01/21 | | JPY | 208,000,000 | | | | 1,937,033 | |
0.10% due 03/20/20 | | JPY | 49,000,000 | | | | 454,059 | |
2.40% due 03/20/20 | | JPY | 20,000,000 | | | | 187,302 | |
1.30% due 03/20/20 | | JPY | 8,000,000 | | | | 74,544 | |
State of Israel | | | | | | | | |
1.00% due 04/30/21 | | ILS | 29,760,000 | | | | 8,673,845 | |
5.00% due 01/31/20 | | ILS | 18,100,000 | | | | 5,289,018 | |
5.50% due 01/31/22 | | ILS | 15,760,000 | | | | 5,085,288 | |
0.50% due 01/31/21 | | ILS | 5,570,000 | | | | 1,610,000 | |
Kingdom of Spain | | | | | | | | |
0.75% due 07/30/21 | | EUR | 12,780,000 | | | | 14,254,187 | |
due 01/17/2011 | | EUR | 2,717,000 | | | | 2,966,365 | |
4.00% due 04/30/20 | | EUR | 400,000 | | | | 447,370 | |
Federative Republic of Brazil | | | | | | | | |
due 07/01/2111 | | BRL | 37,920,000 | | | | 8,356,123 | |
due 01/01/2011 | | BRL | 18,300,000 | | | | 4,353,864 | |
due 07/01/2011 | | BRL | 14,360,000 | | | | 3,340,219 | |
Republic of Portugal | | | | | | | | |
due 01/17/2011 | | EUR | 2,550,000 | | | | 2,783,860 | |
4.80% due 06/15/20 | | EUR | 1,950,000 | | | | 2,205,605 | |
Total Foreign Government Debt | | | | | | | | |
(Cost $119,848,261) | | | | | | | 118,879,354 | |
| | | | | | | | | |
CORPORATE BONDS†† - 8.4% |
Financial - 3.1% |
Synchrony Bank | | | | | | | | |
2.73% (3 Month USD LIBOR + 0.63%) due 03/30/204 | | | 2,600,000 | | | | 2,600,958 | |
Discover Bank | | | | | | | | |
3.10% due 06/04/20 | | | 2,000,000 | | | | 2,010,817 | |
AXIS Specialty Finance LLC | | | | | | | | |
5.88% due 06/01/20 | | | 1,800,000 | | | | 1,841,977 | |
Capital One Financial Corp. | | | | | | | | |
2.50% due 05/12/20 | | | 1,750,000 | | | | 1,753,110 | |
Morgan Stanley | | | | | | | | |
5.50% due 07/24/20 | | | 1,700,000 | | | | 1,745,802 | |
Lloyds Bank Corporate Markets plc NY | | | | | | | | |
2.66% (3 Month USD LIBOR + 0.37%) due 08/05/204 | | | 1,730,000 | | | | 1,731,867 | |
Credit Suisse AG NY | | | | | | | | |
2.66% (3 Month USD LIBOR + 0.40%) due 07/31/204 | | | 1,720,000 | | | | 1,721,403 | |
Standard Chartered Bank | | | | | | | | |
2.69% (3 Month USD LIBOR + 0.40%) due 08/04/204 | | | 1,710,000 | | | | 1,712,424 | |
ANZ New Zealand Int’l Ltd. | | | | | | | | |
2.85% due 08/06/206 | | | 1,700,000 | | | | 1,711,923 | |
UBS AG | | | | | | | | |
2.68% (3 Month USD LIBOR + 0.58%, Rate Floor: 0.00%) due 06/08/204,6 | | | 1,700,000 | | | | 1,704,558 | |
American Express Co. | | | | | | | | |
2.20% due 10/30/20 | | | 1,700,000 | | | | 1,702,535 | |
American Tower Corp. | | | | | | | | |
2.80% due 06/01/20 | | | 1,650,000 | | | | 1,656,285 | |
American International Group, Inc. | | | | | | | | |
6.40% due 12/15/20 | | | 1,060,000 | | | | 1,113,878 | |
American Equity Investment Life Holding Co. | | | | | | | | |
5.00% due 06/15/27 | | | 953,000 | | | | 1,001,525 | |
Santander UK plc | | | | | | | | |
2.59% (3 Month USD LIBOR + 0.30%) due 11/03/204 | | | 629,000 | | | | 628,604 | |
2.13% due 11/03/20 | | | 211,000 | | | | 210,794 | |
AerCap Ireland Capital DAC / AerCap Global Aviation Trust | | | | | | | | |
4.25% due 07/01/20 | | | 785,000 | | | | 795,784 | |
Credit Suisse Group Funding Guernsey Ltd. | | | | | | | | |
2.75% due 03/26/20 | | | 300,000 | | | | 300,801 | |
Assurant, Inc. | | | | | | | | |
3.36% (3 Month USD LIBOR + 1.25%) due 03/26/214 | | | 289,000 | | | | 289,026 | |
Total Financial | | | | | | | 26,234,071 | |
| | | | | | | | | |
Consumer, Non-cyclical - 2.0% |
Reynolds American, Inc. | | | | | | | | |
3.25% due 06/12/20 | | | 1,920,000 | | | | 1,932,144 | |
Mondelez International, Inc. | | | | | | | | |
3.00% due 05/07/20 | | | 1,920,000 | | | | 1,929,828 | |
Quest Diagnostics, Inc. | | | | | | | | |
2.50% due 03/30/20 | | | 1,800,000 | | | | 1,801,790 | |
Zimmer Biomet Holdings, Inc. | | | | | | | | |
2.70% due 04/01/20 | | | 1,795,000 | | | | 1,798,063 | |
SEE NOTES TO FINANCIAL STATEMENTS. | THE GUGGENHEIM FUNDS ANNUAL REPORT | 49 |
SCHEDULE OF INVESTMENTS (continued) | September 30, 2019 |
INVESTMENT GRADE BOND FUND | |
| | Face
Amount~ | | | Value | |
Cigna Corp. | | | | | | | | |
2.49% (3 Month USD LIBOR + 0.35%) due 03/17/204 | | | 1,795,000 | | | $ | 1,795,272 | |
Allergan Incorporated/United States | | | | | | | | |
3.38% due 09/15/20 | | | 1,635,000 | | | | 1,653,011 | |
Molson Coors Brewing Co. | | | | | | | | |
2.25% due 03/15/20 | | | 1,600,000 | | | | 1,599,023 | |
Constellation Brands, Inc. | | | | | | | | |
2.25% due 11/06/20 | | | 1,480,000 | | | | 1,480,470 | |
Coca-Cola Femsa SAB de CV | | | | | | | | |
4.63% due 02/15/20 | | | 850,000 | | | | 856,462 | |
Anthem, Inc. | | | | | | | | |
2.50% due 11/21/20 | | | 800,000 | | | | 803,948 | |
Kraft Heinz Foods Co. | | | | | | | | |
2.80% due 07/02/20 | | | 630,000 | | | | 631,087 | |
Allergan Funding SCS | | | | | | | | |
3.39% (3 Month USD LIBOR + 1.26%) due 03/12/204 | | | 165,000 | | | | 165,655 | |
Humana, Inc. | | | | | | | | |
2.50% due 12/15/20 | | | 120,000 | | | | 120,273 | |
Conagra Brands, Inc. | | | | | | | | |
2.81% (3 Month USD LIBOR + 0.50%) due 10/09/204 | | | 100,000 | | | | 99,990 | |
Total Consumer, Non-cyclical | | | | | | | 16,667,016 | |
| | | | | | | | | |
Technology - 0.8% |
Fiserv, Inc. | | | | | | | | |
2.70% due 06/01/20 | | | 2,000,000 | | | | 2,005,330 | |
Analog Devices, Inc. | | | | | | | | |
2.95% due 01/12/21 | | | 1,800,000 | | | | 1,813,504 | |
Broadcom Corporation / Broadcom Cayman Finance Ltd. | | | | | | | | |
2.38% due 01/15/20 | | | 1,800,000 | | | | 1,799,886 | |
Fidelity National Information Services, Inc. | | | | | | | | |
3.63% due 10/15/20 | | | 1,050,000 | | | | 1,064,000 | |
CA, Inc. | | | | | | | | |
5.38% due 12/01/19 | | | 50,000 | | | | 50,240 | |
Total Technology | | | | | | | 6,732,960 | |
| | | | | | | | | |
Industrial - 0.7% |
Rolls-Royce plc | | | | | | | | |
2.38% due 10/14/206 | | | 1,800,000 | | | | 1,802,019 | |
L3Harris Technologies, Inc. | | | | | | | | |
2.70% due 04/27/20 | | | 1,766,000 | | | | 1,769,535 | |
Northrop Grumman Corp. | | | | | | | | |
2.08% due 10/15/20 | | | 1,000,000 | | | | 1,000,336 | |
3.50% due 03/15/21 | | | 400,000 | | | | 407,397 | |
Ingersoll-Rand Luxembourg Finance S.A. | | | | | | | | |
2.63% due 05/01/20 | | | 320,000 | | | | 320,583 | |
Vulcan Materials Co. | | | | | | | | |
2.72% (3 Month USD LIBOR + 0.60%) due 06/15/204 | | | 200,000 | | | | 200,112 | |
Molex Electronic Technologies LLC | | | | | | | | |
2.88% due 04/15/206 | | | 190,000 | | | | 190,306 | |
Total Industrial | | | | | | | 5,690,288 | |
| | | | | | | | | |
Utilities - 0.6% |
NextEra Energy Capital Holdings, Inc. | | | | | | | | |
2.55% (3 Month USD LIBOR + 0.45%) due 09/28/204 | | | 1,830,000 | | | | 1,830,778 | |
Ameren Corp. | | | | | | | | |
2.70% due 11/15/20 | | | 1,800,000 | | | | 1,809,414 | |
Exelon Corp. | | | | | | | | |
2.85% due 06/15/20 | | | 860,000 | | | | 863,597 | |
DTE Energy Co. | | | | | | | | |
2.40% due 12/01/19 | | | 400,000 | | | | 400,030 | |
PSEG Power LLC | | | | | | | | |
5.13% due 04/15/20 | | | 250,000 | | | | 253,792 | |
Pennsylvania Electric Co. | | | | | | | | |
5.20% due 04/01/20 | | | 50,000 | | | | 50,731 | |
Total Utilities | | | | | | | 5,208,342 | |
| | | | | | | | | |
Energy - 0.5% |
Occidental Petroleum Corp. | | | | | | | | |
2.60% due 08/13/21 | | | 1,500,000 | | | | 1,509,770 | |
Sabine Pass Liquefaction LLC | | | | | | | | |
5.63% due 02/01/21 | | | 1,100,000 | | | | 1,136,208 | |
Florida Gas Transmission Company LLC | | | | | | | | |
5.45% due 07/15/206 | | | 740,000 | | | | 757,079 | |
Pioneer Natural Resources Co. | | | | | | | | |
7.50% due 01/15/20 | | | 500,000 | | | | 506,941 | |
Reliance Holding USA, Inc. | | | | | | | | |
4.50% due 10/19/206 | | | 350,000 | | | | 356,779 | |
Total Energy | | | | | | | 4,266,777 | |
| | | | | | | | | |
Consumer, Cyclical - 0.4% |
Marriott International, Inc. | | | | | | | | |
2.74% (3 Month USD LIBOR + 0.60%) due 12/01/204 | | | 1,900,000 | | | | 1,906,127 | |
McDonald’s Corp. | | | | | | | | |
3.50% due 07/15/20 | | | 1,221,000 | | | | 1,235,023 | |
Total Consumer, Cyclical | | | | | | | 3,141,150 | |
| | | | | | | | | |
Basic Materials - 0.2% |
Newmont Goldcorp Corp. | | | | | | | | |
5.13% due 10/01/19 | | | 960,000 | | | | 960,000 | |
Georgia-Pacific LLC | | | | | | | | |
5.40% due 11/01/206 | | | 670,000 | | | | 693,060 | |
Total Basic Materials | | | | | | | 1,653,060 | |
| | | | | | | | | |
Communications - 0.1% |
Deutsche Telekom International Finance BV | | | | | | | | |
2.23% due 01/17/206 | | | 580,000 | | | | 579,908 | |
Telefonica Emisiones S.A. | | | | | | | | |
5.13% due 04/27/20 | | | 430,000 | | | | 436,879 | |
Total Communications | | | | | | | 1,016,787 | |
Total Corporate Bonds | | | | | | | | |
(Cost $70,368,924) | | | | | | | 70,610,451 | |
| | | | | | | | | |
FEDERAL AGENCY BONDS†† - 5.0% |
Fannie Mae Principal Strips | | | | | | | | |
due 07/15/3711,12 | | | 13,000,000 | | | | 8,503,025 | |
50 | THE GUGGENHEIM FUNDS ANNUAL REPORT | SEE NOTES TO FINANCIAL STATEMENTS. |
SCHEDULE OF INVESTMENTS (continued) | September 30, 2019 |
INVESTMENT GRADE BOND FUND | |
| | Face
Amount~ | | | Value | |
due 05/15/3011,12 | | | 6,650,000 | | | $ | 5,301,030 | |
due 01/15/3011,12 | | | 2,575,000 | | | | 2,067,310 | |
Freddie Mac Principal Strips | | | | | | | | |
due 07/15/3211,12 | | | 10,550,000 | | | | 7,888,907 | |
due 03/15/3111,12 | | | 3,850,000 | | | | 2,994,487 | |
Tennessee Valley Authority Principal | | | | | | | | |
due 01/15/4811,12 | | | 9,700,000 | | | | 4,492,490 | |
due 01/15/3811,12 | | | 4,000,000 | | | | 2,435,728 | |
Residual Funding Corporation Principal | | | | | | | | |
due 04/15/3011,12 | | | 3,000,000 | | | | 2,393,763 | |
due 01/15/3011,12 | | | 1,500,000 | | | | 1,204,258 | |
Tennessee Valley Authority | | | | | | | | |
4.25% due 09/15/65 | | | 1,300,000 | | | | 1,796,415 | |
5.38% due 04/01/56 | | | 600,000 | | | | 959,711 | |
Freddie Mac | | | | | | | | |
due 01/02/3411 | | | 1,850,000 | | | | 1,325,521 | |
Total Federal Agency Bonds | | | | | | | | |
(Cost $35,514,541) | | | | | | | 41,362,645 | |
| | | | | | | | | |
MUNICIPAL BONDS†† - 0.6% |
| | | | | | | | | |
California - 0.4% |
Newport Mesa Unified School District General Obligation Unlimited | | | | | | | | |
due 08/01/4411 | | | 2,000,000 | | | | 836,840 | |
due 08/01/4111 | | | 1,540,000 | | | | 737,660 | |
due 08/01/4611 | | | 750,000 | | | | 286,545 | |
Beverly Hills Unified School District California General Obligation Unlimited | | | | | | | | |
due 08/01/3911 | | | 1,410,000 | | | | 695,496 | |
Cypress School District General Obligation Unlimited | | | | | | | | |
due 08/01/4811 | | | 1,000,000 | | | | 356,100 | |
Hanford Joint Union High School District General Obligation Unlimited | | | | | | | | |
due 08/01/3911 | | | 500,000 | | | | 235,595 | |
Total California | | | | | | | 3,148,236 | |
| | | | | | | | | |
Georgia - 0.1% |
Central Storage Safety Project Trust | | | | | | | | |
4.82% due 02/01/3810 | | | 1,000,000 | | | | 1,102,616 | |
| | | | | | | | | |
Illinois - 0.1% |
State of Illinois General Obligation Unlimited | | | | | | | | |
5.65% due 12/01/38 | | | 500,000 | | | | 592,120 | |
Total Municipal Bonds | | | | | | | | |
(Cost $4,321,275) | | | | | | | 4,842,972 | |
| | | | | | | | | |
SENIOR FLOATING RATE INTERESTS ††,4 - 0.3% |
Consumer, Non-cyclical - 0.1% |
Packaging Coordinators Midco, Inc. | | | | | | | | |
6.11% (3 Month USD LIBOR + 4.00%, Rate Floor: 5.00%) due 06/30/23 | | | 499,091 | | | | 497,065 | |
Diamond (BC) BV | | | | | | | | |
5.26% (3 Month USD LIBOR + 3.00%, Rate Floor: 3.00%) due 09/06/24 | | | 393,000 | | | | 373,841 | |
Total Consumer, Non-cyclical | | | | | | | 870,906 | |
| | | | | | | | | |
Consumer, Cyclical - 0.1% |
Mavis Tire Express Services Corp. | | | | | | | | |
5.29% (1 Month USD LIBOR + 3.25%, Rate Floor: 3.25%) due 03/20/25 | | | 417,595 | | | | 407,903 | |
| | | | | | | | | |
Communications - 0.1% |
Internet Brands, Inc. | | | | | | | | |
5.79% (1 Month USD LIBOR + 3.75%, Rate Floor: 3.75%) due 09/13/24 | | | 371,207 | | | | 368,248 | |
| | | | | | | | | |
Technology - 0.0% |
Misys Ltd. | | | | | | | | |
5.70% (1 Month USD LIBOR + 3.50%, Rate Floor: 4.50%) due 06/13/24 | | | 276,191 | | | | 268,464 | |
| | | | | | | | | |
Industrial - 0.0% |
Titan Acquisition Ltd. (Husky) | | | | | | | | |
5.04% (1 Month USD LIBOR + 3.00%, Rate Floor: 3.00%) due 03/28/25 | | | 246,250 | | | | 236,065 | |
Total Senior Floating Rate Interests | | | | | | | | |
(Cost $2,197,141) | | | | | | | 2,151,586 | |
| | | | | | | | | |
REPURCHASE AGREEMENTS††,13 - 3.8% |
J.P. Morgan Securities LLC | | | | | | | | |
issued 09/30/19 at 2.35%
due 10/01/19 | | | 5,084,000 | | | | 5,084,000 | |
issued 09/24/19 at 3.00%
due 10/01/19 | | | 3,000,000 | | | | 3,000,000 | |
issued 09/27/19 at 2.50%
due 10/01/19 | | | 2,977,000 | | | | 2,977,000 | |
issued 09/25/19 at 3.00%
due 10/01/19 | | | 1,500,000 | | | | 1,500,000 | |
issued 09/30/19 at 2.37%
due 10/01/19 | | | 1,013,000 | | | | 1,013,000 | |
Societe Generale | | | | | | | | |
issued 09/10/19 at 2.54% (3 Month USD LIBOR + 0.40%)
due 04/07/204 | | | 12,000,000 | | | | 12,000,000 | |
BNP Paribas | | | | | | | | |
issued 09/16/19 at 2.33%
due 12/16/19 | | | 3,100,000 | | | | 3,100,000 | |
BofA Securities, Inc. | | | | | | | | |
issued 09/25/19 at 2.80%
due 10/01/19 | | | 3,000,000 | | | | 3,000,000 | |
Total Repurchase Agreements | | | | | | | | |
(Cost $31,674,000) | | | | | | | 31,674,000 | |
| | | | | | | | | |
SEE NOTES TO FINANCIAL STATEMENTS. | THE GUGGENHEIM FUNDS ANNUAL REPORT | 51 |
SCHEDULE OF INVESTMENTS (continued) | September 30, 2019 |
INVESTMENT GRADE BOND FUND | |
| | Face
Amount~ | | | Value | |
COMMERCIAL PAPER††, 14 - 2.3% |
Mondelez International, Inc. | | | | | | | | |
2.19% due 10/03/196 | | | 8,000,000 | | | $ | 7,999,027 | |
Spire, Inc. | | | | | | | | |
2.23% due 10/17/196 | | | 5,000,000 | | | | 4,995,044 | |
Walgreens Boots Alliance, Inc. | | | | | | | | |
2.41% due 01/13/20 | | | 3,500,000 | | | | 3,476,521 | |
McKesson Corp. | | | | | | | | |
2.55% due 10/04/196 | | | 2,800,000 | | | | 2,799,405 | |
Total Commercial Paper | | | | | | | | |
(Cost $19,268,704) | | | | | | | 19,269,997 | |
| | | | | | | | | |
| | Notional
Value | | | Value | |
OTC OPTIONS PURCHASED†† - 0.1% |
Put options on: | | | | | | | | |
Bank of America, N.A. 2Y-10 CMS CAP
Expiring July 2022 with strike price of $0.40 | | $ | 311,500,000 | | | $ | 532,674 | |
Morgan Stanley Capital Services LLC 2Y-10 CMS CAP
Expiring July 2022 with strike price of $0.40 | | | 227,800,000 | | | | 389,545 | |
Goldman Sachs International 2Y-10 CMS CAP
Expiring July 2022 with strike price of $0.61 | | | 169,600,000 | | | | 172,358 | |
Goldman Sachs International 2Y-10 CMS CAP
Expiring July 2022 with strike price of $0.40 | | | 54,700,000 | | | | 93,538 | |
Bank of America, N.A. 2Y-10 CMS CAP
Expiring July 2022 with strike price of $0.61 | | | 28,400,000 | | | | 28,862 | |
Total Put options | | | | | | | 1,216,977 | |
Total OTC Options Purchased | | | | | | | | |
(Cost $1,680,896) | | | | | | | 1,216,977 | |
| | | | | | | | | |
Total Investments - 101.1% | | | | | | | | |
(Cost $823,802,415) | | | | | | $ | 844,935,624 | |
Other Assets & Liabilities, net - (1.1)% | | | | | | | (9,133,016 | ) |
Total Net Assets - 100.0% | | | | | | $ | 835,802,608 | |
Centrally Cleared Credit Default Swap Agreements Protection Purchased†† |
| |
Counterparty | Exchange | Index | | Protection
Premium
Rate | | | Payment
Frequency | | | Maturity
Date | | | Notional
Amount | | | Value | | | Upfront
Premiums
Received | | | Unrealized
Depreciation** | |
BofA Securities, Inc. | ICE | CDX.NA.IG.31 | | | 1.00 | % | Quarterly | 12/20/23 | | $ | 119,420,000 | | | $ | (2,592,714 | ) | | $ | (1,232,880 | ) | | $ | (1,359,834 | ) |
OTC Credit Default Swap Agreements Protection Purchased†† |
| |
Counterparty | Index | | Protection
Premium
Rate | | | Payment
Frequency | | | Maturity
Date | | | Notional
Amount | | | Value | | | Upfront
Premiums
Received | | | Unrealized
Depreciation** | |
Morgan Stanley Capital Services LLC | CDX.NA.IG.31 (7-15%) | | | 1.00 | % | Quarterly | 12/20/23 | | $ | 6,080,000 | | | $ | (120,936 | ) | | $ | (1,145 | ) | | $ | (119,791 | ) |
Goldman Sachs International | CDX.NA.IG.31 (7-15%) | | | 1.00 | % | Quarterly | 12/20/23 | | | 13,940,000 | | | | (277,274 | ) | | | (19,495 | ) | | | (257,779 | ) |
| | | | | | | | | | | | | | | | | | | | $ | (398,210 | ) | | $ | (20,640 | ) | | $ | (377,570 | ) |
52 | THE GUGGENHEIM FUNDS ANNUAL REPORT | SEE NOTES TO FINANCIAL STATEMENTS. |
SCHEDULE OF INVESTMENTS (continued) | September 30, 2019 |
INVESTMENT GRADE BOND FUND | |
Centrally Cleared Interest Rate Swap Agreements†† |
| |
Counterparty | Exchange | Floating
Rate
Type | Floating
Rate Index | | Fixed
Rate | | | Payment
Frequency | | | Maturity
Date | | | Notional
Amount | | | Value | | | Upfront
Premiums
Paid | | | Unrealized
Appreciation
(Depreciation)** | |
BofA Securities, Inc. | CME | Pay | 3-Month USD LIBOR | 2.79% | Quarterly | 01/21/20 | | $ | 9,259,000 | | | $ | 18,222 | | | $ | 14,226 | | | $ | 3,996 | |
BofA Securities, Inc. | CME | Receive | 3-Month USD LIBOR | 1.54% | Quarterly | 08/04/21 | | | 2,940,000 | | | | 6,618 | | | | 290 | | | | 6,328 | |
BofA Securities, Inc. | CME | Pay | 3-Month USD LIBOR | 2.84% | Quarterly | 01/31/20 | | | 1,854,000 | | | | 4,141 | | | | 3,330 | | | | 811 | |
BofA Securities, Inc. | CME | Pay | 3-Month USD LIBOR | 2.83% | Quarterly | 01/31/20 | | | 1,158,000 | | | | 2,548 | | | | 2,093 | | | | 455 | |
BofA Securities, Inc. | CME | Receive | 3-Month USD LIBOR | 2.83% | Quarterly | 01/31/20 | | | 1,158,000 | | | | (2,548 | ) | | | 89 | | | | (2,637 | ) |
BofA Securities, Inc. | CME | Receive | 3-Month USD LIBOR | 2.84% | Quarterly | 01/31/20 | | | 1,854,000 | | | | (4,141 | ) | | | 88 | | | | (4,229 | ) |
BofA Securities, Inc. | CME | Receive | 3-Month USD LIBOR | 2.79% | Quarterly | 01/21/20 | | | 9,259,000 | | | | (18,222 | ) | | | 95 | | | | (18,317 | ) |
BofA Securities, Inc. | CME | Pay | 3-Month USD LIBOR | 1.57% | Quarterly | 08/14/21 | | | 33,100,000 | | | | (54,746 | ) | | | 358 | | | | (55,104 | ) |
BofA Securities, Inc. | CME | Pay | Federal Funds Rate | 1.23% | Annually | 08/22/21 | | | 26,300,000 | | | | (67,381 | ) | | | 345 | | | | (67,726 | ) |
BofA Securities, Inc. | CME | Pay | Federal Funds Rate | 1.10% | Annually | 08/28/24 | | | 29,610,000 | | | | (218,471 | ) | | | 425 | | | | (218,896 | ) |
| | | | | | | | | | | | | | | | | | | | | | $ | (333,980 | ) | | $ | 21,339 | | | $ | (355,319 | ) |
Total Return Swap Agreements |
| |
Counterparty | Reference
Obligation | Financing
Rate
Pay | Payment
Frequency | | | Maturity
Date | | | Units | | | Notional
Amount | | | Value and
Unrealized
Depreciation | |
OTC Sovereign Debt Swap Agreements†† |
Deutsche Bank AG | Korea Monetary Stabilization Bond | 2.58% (3 Month USD LIBOR + 0.45%) | At Maturity | | | 08/04/21 | | | | N/A | | | $ | 2,935,205 | | | $ | (14,520 | ) |
Forward Foreign Currency Exchange Contracts†† |
| |
Counterparty | | Contracts to
Sell | | | Currency | | | Settlement
Date | | | Settlement
Value | | | Value at
September 30,
2019 | | | Unrealized
Appreciation | |
JPMorgan Chase Bank, N.A. | 33,200,000 | BRL | | | 10/01/19 | | | $ | 8,467,474 | | | $ | 7,998,458 | | | $ | 469,016 | |
Bank of America, N.A. | 1,042,521,000 | JPY | | | 08/02/21 | | | | 10,287,867 | | | | 10,048,496 | | | | 239,371 | |
Goldman Sachs International | 24,800,000 | BRL | | | 10/01/19 | | | | 6,203,118 | | | | 5,974,752 | | | | 228,366 | |
Citibank N.A., New York | 25,520,000 | BRL | | | 07/01/21 | | | | 6,062,071 | | | | 5,847,053 | | | | 215,018 | |
Goldman Sachs International | 7,880,000 | BRL | | | 07/01/20 | | | | 2,046,222 | | | | 1,868,089 | | | | 178,133 | |
Citibank N.A., New York | 13,210,000 | BRL | | | 10/01/19 | | | | 3,356,056 | | | | 3,182,519 | | | | 173,537 | |
Goldman Sachs International | 6,558,825 | EUR | | | 07/30/21 | | | | 7,618,895 | | | | 7,463,492 | | | | 155,403 | |
Barclays Bank plc | 2,717,000 | EUR | | | 01/17/20 | | | | 3,137,864 | | | | 2,987,560 | | | | 150,304 | |
Goldman Sachs International | 2,550,000 | EUR | | | 01/17/20 | | | | 2,944,533 | | | | 2,803,930 | | | | 140,603 | |
Citibank N.A., New York | 6,480,000 | BRL | | | 07/01/20 | | | | 1,669,071 | | | | 1,536,195 | | | | 132,876 | |
Citibank N.A., New York | 560,280,000 | JPY | | | 07/01/21 | | | | 5,516,848 | | | | 5,390,570 | | | | 126,278 | |
Barclays Bank plc | 518,259,000 | JPY | | | 07/01/21 | | | | 5,095,458 | | | | 4,986,277 | | | | 109,181 | |
JPMorgan Chase Bank, N.A. | 6,317,025 | EUR | | | 07/30/21 | | | | 7,290,921 | | | | 7,188,340 | | | | 102,581 | |
Morgan Stanley Capital Services LLC | 520,260,000 | JPY | | | 08/02/21 | | | | 5,106,095 | | | | 5,014,605 | | | | 91,490 | |
Citibank N.A., New York | 520,260,000 | JPY | | | 05/06/21 | | | | 5,073,727 | | | | 4,989,647 | | | | 84,080 | |
SEE NOTES TO FINANCIAL STATEMENTS. | THE GUGGENHEIM FUNDS ANNUAL REPORT | 53 |
SCHEDULE OF INVESTMENTS (continued) | September 30, 2019 |
INVESTMENT GRADE BOND FUND | |
Counterparty | | Contracts to
Sell | | | Currency | | | Settlement
Date | | | Settlement
Value | | | Value at
September 30,
2019 | | | Unrealized
Appreciation
(Depreciation) | |
Citibank N.A., New York | 18,300,000 | BRL | | | 01/02/20 | | | $ | 4,461,548 | | | $ | 4,387,559 | | | $ | 73,989 | |
Bank of America, N.A. | 985,000,000 | JPY | | | 01/21/20 | | | | 9,258,824 | | | | 9,189,111 | | | | 69,713 | |
Goldman Sachs International | 8,600,000 | BRL | | | 07/01/21 | | | | 2,014,759 | | | | 1,970,402 | | | | 44,357 | |
Goldman Sachs International | 272,035,950 | JPY | | | 12/20/21 | | | | 2,687,836 | | | | 2,643,874 | | | | 43,962 | |
Bank of America, N.A. | 1,100,400 | EUR | | | 06/15/20 | | | | 1,265,432 | | | | 1,221,964 | | | | 43,468 | |
Barclays Bank plc | 208,104,000 | JPY | | | 06/01/21 | | | | 2,037,040 | | | | 1,998,808 | | | | 38,232 | |
Goldman Sachs International | 943,200 | EUR | | | 06/15/20 | | | | 1,085,227 | | | | 1,047,398 | | | | 37,829 | |
JPMorgan Chase Bank, N.A. | 3,800,000 | BRL | | | 07/01/21 | | | | 902,720 | | | | 870,643 | | | | 32,077 | |
Goldman Sachs International | 416,000 | EUR | | | 04/30/20 | | | | 477,069 | | | | 460,594 | | | | 16,475 | |
Goldman Sachs International | 1,362,300,000 | JPY | | | 01/10/20 | | | | 12,706,363 | | | | 12,700,400 | | | | 5,963 | |
JPMorgan Chase Bank, N.A. | 49,024,500 | JPY | | | 03/23/20 | | | | 462,993 | | | | 459,088 | | | | 3,905 | |
Goldman Sachs International | 28,292,000 | JPY | | | 03/23/20 | | | | 267,292 | | | | 264,940 | | | | 2,352 | |
Deutsche Bank AG | 3,538,917,763 | KRW | | | 08/04/21 | | | | 3,018,010 | | | | 3,016,779 | | | | 1,231 | |
Goldman Sachs International | 48,825 | EUR | | | 07/30/20 | | | | 55,499 | | | | 54,375 | | | | 1,124 | |
JPMorgan Chase Bank, N.A. | 47,025 | EUR | | | 07/30/20 | | | | 53,139 | | | | 52,371 | | | | 768 | |
Citibank N.A., New York | 340,600,000 | JPY | | | 01/10/20 | | | | 3,175,669 | | | | 3,175,333 | | | | 336 | |
Bank of America, N.A. | 521,000 | JPY | | | 02/03/20 | | | | 4,984 | | | | 4,864 | | | | 120 | |
Bank of America, N.A. | 521,000 | JPY | | | 02/01/21 | | | | 5,090 | | | | 4,970 | | | | 120 | |
Bank of America, N.A. | 521,000 | JPY | | | 08/03/20 | | | | 5,036 | | | | 4,918 | | | | 118 | |
Citibank N.A., New York | 280,000 | JPY | | | 01/06/20 | | | | 2,678 | | | | 2,610 | | | | 68 | |
Citibank N.A., New York | 280,000 | JPY | | | 07/01/20 | | | | 2,705 | | | | 2,638 | | | | 67 | |
Citibank N.A., New York | 280,000 | JPY | | | 01/04/21 | | | | 2,733 | | | | 2,667 | | | | 66 | |
Barclays Bank plc | 259,000 | JPY | | | 01/06/20 | | | | 2,473 | | | | 2,414 | | | | 59 | |
Barclays Bank plc | 259,000 | JPY | | | 07/01/20 | | | | 2,498 | | | | 2,440 | | | | 58 | |
Barclays Bank plc | 259,000 | JPY | | | 01/04/21 | | | | 2,523 | | | | 2,467 | | | | 56 | |
Morgan Stanley Capital Services LLC | 260,000 | JPY | | | 02/03/20 | | | | 2,472 | | | | 2,427 | | | | 45 | |
Morgan Stanley Capital Services LLC | 260,000 | JPY | | | 08/03/20 | | | | 2,499 | | | | 2,454 | | | | 45 | |
Morgan Stanley Capital Services LLC | 260,000 | JPY | | | 02/01/21 | | | | 2,524 | | | | 2,480 | | | | 44 | |
Citibank N.A., New York | 260,000 | JPY | | | 11/01/19 | | | | 2,451 | | | | 2,410 | | | | 41 | |
Citibank N.A., New York | 260,000 | JPY | | | 05/01/20 | | | | 2,481 | | | | 2,440 | | | | 41 | |
Citibank N.A., New York | 260,000 | JPY | | | 11/02/20 | | | | 2,508 | | | | 2,467 | | | | 41 | |
Goldman Sachs International | 135,950 | JPY | | | 06/21/21 | | | | 1,329 | | | | 1,307 | | | | 22 | |
Goldman Sachs International | 135,950 | JPY | | | 06/22/20 | | | | 1,302 | | | | 1,280 | | | | 22 | |
Goldman Sachs International | 135,950 | JPY | | | 12/21/20 | | | | 1,316 | | | | 1,294 | | | | 22 | |
Goldman Sachs International | 135,950 | JPY | | | 12/20/19 | | | | 1,286 | | | | 1,265 | | | | 21 | |
Barclays Bank plc | 104,000 | JPY | | | 12/02/19 | | | | 985 | | | | 966 | | | | 19 | |
Barclays Bank plc | 104,000 | JPY | | | 06/01/20 | | | | 997 | | | | 978 | | | | 19 | |
Barclays Bank plc | 104,000 | JPY | | | 12/01/20 | | | | 1,007 | | | | 989 | | | | 18 | |
Deutsche Bank AG | 9,447,763 | KRW | | | 02/04/21 | | | | 8,010 | | | | 8,010 | | | | — | |
Deutsche Bank AG | 9,447,763 | KRW | | | 08/05/20 | | | | 7,962 | | | | 7,963 | | | | (1 | ) |
Deutsche Bank AG | 9,447,763 | KRW | | | 11/04/20 | | | | 7,986 | | | | 7,987 | | | | (1 | ) |
Deutsche Bank AG | 9,139,684 | KRW | | | 05/07/21 | | | | 7,769 | | | | 7,770 | | | | (1 | ) |
Deutsche Bank AG | 9,447,763 | KRW | | | 11/06/19 | | | | 7,886 | | | | 7,888 | | | | (2 | ) |
Deutsche Bank AG | 9,242,377 | KRW | | | 05/11/20 | | | | 7,762 | | | | 7,764 | | | | (2 | ) |
Deutsche Bank AG | 9,447,763 | KRW | | | 02/05/20 | | | | 7,909 | | | | 7,911 | | | | (2 | ) |
Citibank N.A., New York | 4,112 | ILS | | | 04/30/20 | | | | 1,181 | | | | 1,201 | | | | (20 | ) |
Bank of America, N.A. | 22,060 | ILS | | | 04/30/20 | | | | 6,348 | | | | 6,445 | | | | (97 | ) |
Bank of America, N.A. | 217,294 | ILS | | | 01/31/20 | | | | 62,342 | | | | 63,080 | | | | (738 | ) |
Bank of America, N.A. | 216,700 | ILS | | | 02/01/21 | | | | 63,316 | | | | 64,204 | | | | (888 | ) |
Goldman Sachs International | 235,243 | ILS | | | 04/30/20 | | | | 67,725 | | | | 68,731 | | | | (1,006 | ) |
Bank of America, N.A. | 2,222,000 | ILS | | | 04/30/21 | | | | 649,689 | | | | 660,861 | | | | (11,172 | ) |
Bank of America, N.A. | 4,156,700 | ILS | | | 01/31/22 | | | | 1,232,346 | | | | 1,249,734 | | | | (17,388 | ) |
Citibank N.A., New York | 4,141,000 | ILS | | | 04/30/21 | | | | 1,209,580 | | | | 1,231,603 | | | | (22,023 | ) |
Goldman Sachs International | 6,249,808 | ILS | | | 02/01/21 | | | | 1,820,490 | | | | 1,851,700 | | | | (31,210 | ) |
Goldman Sachs International | 12,470,100 | ILS | | | 01/31/22 | | | | 3,690,333 | | | | 3,749,201 | | | | (58,868 | ) |
Barclays Bank plc | 8,085,000 | ILS | | | 01/31/20 | | | | 2,287,452 | | | | 2,347,051 | | | | (59,599 | ) |
Goldman Sachs International | 23,694,600 | ILS | | | 04/30/21 | | | | 6,937,799 | | | | 7,047,175 | | | | (109,376 | ) |
Goldman Sachs International | 11,597,950 | ILS | | | 01/31/20 | | | | 3,205,746 | | | | 3,366,849 | | | | (161,103 | ) |
| | | | | | | | | | | | | | | | | | | | | | | $ | 2,539,653 | |
54 | THE GUGGENHEIM FUNDS ANNUAL REPORT | SEE NOTES TO FINANCIAL STATEMENTS. |
SCHEDULE OF INVESTMENTS (continued) | September 30, 2019 |
INVESTMENT GRADE BOND FUND | |
Counterparty | | Contracts to
Buy | | | Currency | | | Settlement
Date | | | Settlement
Value | | | Value at
September 30,
2019 | | | Unrealized
Depreciation | |
Morgan Stanley Capital Services LLC | 17,803,000 | BRL | | | 10/01/19 | | | $ | (4,242,547 | ) | | $ | 4,289,053 | | | $ | 46,506 | |
Citibank N.A., New York | 7,121,000 | BRL | | | 10/01/19 | | | | (1,731,803 | ) | | | 1,715,573 | | | | (16,230 | ) |
Morgan Stanley Capital Services LLC | 46,286,000 | BRL | | | 10/01/19 | | | | (11,287,392 | ) | | | 11,151,103 | | | | (136,289 | ) |
| | | | | | | | | | | | | | | | | | | | | | | $ | (106,013 | ) |
~ | The face amount is denominated in U.S. dollars unless otherwise indicated. |
* | Non-income producing security. |
** | Includes cumulative appreciation (depreciation). Variation margin is reported within the Statement of Assets and Liabilities. |
† | Value determined based on Level 1 inputs — See Note 4. |
†† | Value determined based on Level 2 inputs, unless otherwise noted — See Note 4. |
††† | Value determined based on Level 3 inputs — See Note 4. |
1 | Security was fair valued by the Valuation Committee at September 30, 2019. The total market value of fair valued securities amounts to $1,032,761, (cost $1,000,000) or 0.1% of total net assets. |
2 | Affiliated issuer. |
3 | Rate indicated is the 7-day yield as of September 30, 2019. |
4 | Variable rate security. Rate indicated is the rate effective at September 30, 2019. In some instances, the effective rate is limited by a minimum rate floor or a maximum rate cap established by the issuer. The settlement status of a position may also impact the effective rate indicated. In some cases, a position may be unsettled at period end and may not have a stated effective rate. In instances where multiple underlying reference rates and spread amounts are shown, the effective rate is based on a weighted average. |
5 | Security is a step up/down bond. The coupon increases or decreases at regular intervals until the bond reaches full maturity. Rate indicated is the rate at September 30, 2019. See table below for additional step information for each security. |
6 | Security is a 144A or Section 4(a)(2) security. These securities have been determined to be liquid under guidelines established by the Board of Trustees. The total market value of 144A or Section 4(a)(2) securities is $224,564,174 (cost $223,630,831 ), or 26.9% of total net assets. |
7 | Security is an interest-only strip. |
8 | Face amount of security is adjusted for inflation. |
9 | Security has no stated coupon. However, it is expected to receive residual cash flow payments on defined deal dates. |
10 | Security is a 144A or Section 4(a)(2) security. These securities have been determined to be illiquid and restricted under guidelines established by the Board of Trustees. The total market value of 144A or Section 4(a)(2) illiquid and restricted securities is $1,816,455 (cost $2,450,266), or 0.2% of total net assets — See Note 10. |
11 | Zero coupon rate security. |
12 | Security is a principal-only strip. |
13 | Repurchase Agreements — See additional disclosure in the repurchase agreements table below for more information on repurchase agreements. |
14 | Rate indicated is the effective yield at the time of purchase. |
| | BofA — Bank of America |
| | BRL — Brazilian Real |
| | CDX.NA.IG.31 — Credit Default Swap North American Investment Grade Series 31 Index |
| | CME — Chicago Mercantile Exchange |
| | CMS — Constant Maturity Swap |
| | CMT — Constant Maturity Treasury |
| | EUR — Euro |
| | ICE — Intercontinental Exchange |
| | ILS — Israeli New Shekel |
| | JPY — Japanese Yen |
| | KRW — South Korean Won |
| | LIBOR — London Interbank Offered Rate |
| | plc — Public Limited Company |
| | WAC — Weighted Average Coupon |
| | |
| | See Sector Classification in Other Information section. |
SEE NOTES TO FINANCIAL STATEMENTS. | THE GUGGENHEIM FUNDS ANNUAL REPORT | 55 |
SCHEDULE OF INVESTMENTS (continued) | September 30, 2019 |
INVESTMENT GRADE BOND FUND | |
The following table summarizes the inputs used to value the Fund’s investments at September 30, 2019 (See Note 4 in the Notes to Financial Statements):
Investments in Securities (Assets) | | Level 1
Quoted
Prices | | | Level 2
Significant
Observable
Inputs | | | Level 3
Significant
Unobservable
Inputs | | | Total | |
Common Stocks | | $ | — | | | $ | — | | | $ | — | * | | $ | — | |
Mutual Funds | | | 2,544,445 | | | | — | | | | — | | | | 2,544,445 | |
Money Market Fund | | | 1,672,341 | | | | — | | | | — | | | | 1,672,341 | |
Collateralized Mortgage Obligations | | | — | | | | 239,939,320 | | | | 4,988,695 | | | | 244,928,015 | |
U.S. Government Securities | | | — | | | | 156,411,531 | | | | — | | | | 156,411,531 | |
Asset-Backed Securities | | | — | | | | 139,753,459 | | | | 9,617,851 | | | | 149,371,310 | |
Foreign Government Debt | | | — | | | | 118,879,354 | | | | — | | | | 118,879,354 | |
Corporate Bonds | | | — | | | | 70,610,451 | | | | — | | | | 70,610,451 | |
Federal Agency Bonds | | | — | | | | 41,362,645 | | | | — | | | | 41,362,645 | |
Municipal Bonds | | | — | | | | 4,842,972 | | | | — | | | | 4,842,972 | |
Senior Floating Rate Interests | | | — | | | | 2,151,586 | | | | — | | | | 2,151,586 | |
Repurchase Agreements | | | — | | | | 31,674,000 | | | | — | | | | 31,674,000 | |
Commercial Paper | | | — | | | | 19,269,997 | | | | — | | | | 19,269,997 | |
Options Purchased | | | — | | | | 1,216,977 | | | | — | | | | 1,216,977 | |
Forward Foreign Currency Exchange Contracts** | | | — | | | | 3,059,656 | | | | — | | | | 3,059,656 | |
Interest Rate Swaps Agreements** | | | — | | | | 11,590 | | | | — | | | | 11,590 | |
Total Assets | | $ | 4,216,786 | | | $ | 829,183,538 | | | $ | 14,606,546 | | | $ | 848,006,870 | |
Investments in Securities (Liabilities) | | Level 1
Quoted
Prices | | | Level 2
Significant
Observable
Inputs | | | Level 3
Significant
Unobservable
Inputs | | | Total | |
Credit Default Swap Agreements** | | $ | — | | | $ | 1,737,404 | | | $ | — | | | $ | 1,737,404 | |
Total Return Swap Agreements** | | | — | | | | 14,520 | | | | — | | | | 14,520 | |
Interest Rate Swaps Agreements** | | | — | | | | 366,909 | | | | — | | | | 366,909 | |
Forward Foreign Currency Exchange Contracts** | | | — | | | | 626,016 | | | | — | | | | 626,016 | |
Unfunded Loan Commitments (Note 9) | | | — | | | | — | | | | 929 | | | | 929 | |
Total Liabilities | | $ | — | | | $ | 2,744,849 | | | $ | 929 | | | $ | 2,745,778 | |
* | Includes securities with a market value of $0. |
** | This derivative is reported as unrealized appreciation/depreciation at period end. |
The following is a summary of significant unobservable inputs used in the fair valuation of assets and liabilities categorized within level 3 of the fair value hierarchy:
Category | | Ending Balance at
September 30, 2019 | | Valuation Technique | Unobservable Inputs | | Input Range | | | Weighted Average* | |
Assets: | | | | | | | | | | | | | | |
Asset-Backed Securities | | $ | 8,585,090 | | Option Adjusted Spread off prior month broker quote | Broker Quote | | | — | | | | — | |
Asset Backed Securities | | | 1,032,761 | | Yield Analysis | Yield | | | 3.4 | % | | | — | |
Collateralized Mortgage Obligations | | | 4,988,695 | | Option Adjusted Spread off prior month broker quote | Broker Quote | | | — | | | | — | |
Total Assets | | $ | 14,606,546 | | | | | | | | | | | |
Liabilities: | | | | | | | | | | | | | | |
Unfunded Loan Commitments | | $ | 929 | | Model Price | Purchase Price | | | — | | | | — | |
* | Inputs are weighted by the fair value of the instruments. |
56 | THE GUGGENHEIM FUNDS ANNUAL REPORT | SEE NOTES TO FINANCIAL STATEMENTS. |
SCHEDULE OF INVESTMENTS (continued) | September 30, 2019 |
INVESTMENT GRADE BOND FUND | |
Significant changes in quote, yield, market comparable yields, liquidation value, purchase price or valuation multiples would generally result in significant changes in the fair value of the security.
The Fund’s fair valuation leveling guidelines were recently revised to classify a single daily broker quote, or a vendor price based on a single daily or monthly broker quote, as Level 3 rather than Level 2, if such a quote or price cannot be supported with other available market information.
Transfers between Level 2 and Level 3 may occur as markets fluctate and/or the availability of data used in an inestment’s valuation changes. For the year ended September 30, 2019, the Fund had securities with a total value of $135,090 transfer into Level 3 from Level 2 due to lack of observable inputs. For the year ended September 30, 2019, the Fund had liabilities with a total value of $929 transfer into Level 3 from Level 2 due to lack of observable inputs.
Summary of Fair Value Level 3 Activity
Following is a reconciliation of Level 3 assets for which significant unobservable inputs were used to determine fair value for the year ended September 30, 2019:
| | | Assets | | | | | | | Liabilities | |
| | Asset Backed
Securities | | | Collateralized
Mortgage Obligations | | | Total Assets | | | Unfunded
Loans | |
Beginning Balance | | $ | 988,544 | | | $ | — | | | $ | 988,544 | | | $ | — | |
Purchases/(Receipts) | | | 8,450,000 | | | | 5,103,125 | | | | 13,553,125 | | | | — | |
(Sales, maturities and paydowns)/Fundings | | | — | | | | — | | | | — | | | | — | |
Amortization of premiums/discounts | | | — | | | | — | | | | — | | | | — | |
Total realized gains (losses) included in earnings | | | — | | | | — | | | | — | | | | — | |
Total change in unrealized appreciation (depreciation) included in earnings | | | 44,217 | | | | (114,430 | ) | | | (70,213 | ) | | | — | |
Transfers into Level 3 | | | 135,090 | | | | — | | | | 135,090 | | | | (929 | ) |
Ending Balance | | $ | 9,617,851 | | | $ | 4,988,695 | | | $ | 14,606,546 | | | $ | (929 | ) |
Net change in unrealized appreciation (depreciation) for investments in Level 3 securities still held at September 30, 2019 | | $ | 44,217 | | | $ | (114,430 | ) | | $ | (70,213 | ) | | $ | — | |
Step Coupon Bonds
The following table discloses additional information related to step coupon bonds held by the Fund. Certain securities are subject to multiple rate changes prior to maturity. For those securities a range of rates and corresponding dates have been provided. Rates for all step coupon bonds held by the Fund are scheduled to increase, none are scheduled to decrease.
Name | | Coupon Rate at Next
Reset Date | | | Next Rate
Reset Date | | | Future Reset Rate(s) | | | Future Reset Date(s) | |
Freddie Mac Seasoned Credit Risk Transfer Trust 2018-1, 2.75% due 05/25/57 | | | 3.00 | % | | | 03/25/20 | | | | — | | | | — | |
Freddie Mac Seasoned Credit Risk Transfer Trust 2017-4, 3.00% due 06/25/57 | | | 3.25 | % | | | 12/25/19 | | | | — | | | | — | |
Legacy Mortgage Asset Trust 2018-GS3, 4.00% due 06/25/58 | | | 7.00 | % | | | 07/25/21 | | | | 8.00 | % | 07/26/22 |
New Residential Mortgage Loan Trust 2019-RPL1, 4.33% due 02/26/24 | | | 7.33 | % | | | 02/25/22 | | | | 8.33 | % | 02/25/23 |
Willis Engine Securitization Trust II 2012-A, 5.50% due 09/15/37 | | | 8.50 | % | | | 09/15/20 | | — | — |
SEE NOTES TO FINANCIAL STATEMENTS. | THE GUGGENHEIM FUNDS ANNUAL REPORT | 57 |
SCHEDULE OF INVESTMENTS (continued) | September 30, 2019 |
INVESTMENT GRADE BOND FUND | |
Repurchase Agreements
In connection with transactions in repurchase agreements, it is the Fund’s policy that its custodian takes possession of the underlying collateral. The collateral is in the possession of the Fund’s custodian and is evaluated to ensure that its market value exceeds, at a minimum, 102% of the original face amount of the repurchase agreements.
The Fund may engage in repurchase agreements. Repurchase agreements are fixed income securities in the form of agreements backed by collateral. These agreements typically involve the acquisition by the Fund of securities from the selling institution coupled with the agreement that the selling institution will repurchase the underlying securities at a specified price and at a fixed time in the future. The Fund may accept a wide variety of underlying securities as collateral for the repurchase agreements entered into by the Fund. Any such securities serving as collateral are marked-to-market daily in order to maintain full collateralization. Securities purchased under repurchase agreements are reflected as an asset on the Statement of Assets and Liabilities. Interest earned is recorded as a component of interest income on the Statement of Operations.
The use of repurchase agreements involves certain risks. For example, if the selling institution defaults on its obligation to repurchase the underlying securities at a time when the value of securities has declined, the Fund may incur a loss upon disposition of them. In the event of an insolvency or bankruptcy by the selling institution, the Funds right to control the collateral could be affected and result in certain costs and delays. In addition, the Fund could incur a loss if the value of the underlying collateral falls below the agreed upon repurchase price.
At September 30, 2019, the repurchase agreements in the account were as follows:
Counterparty and
Terms of Agreement | | Face Value | | | Repurchase Price | | | Collateral | | Par Value | | | Fair Value | |
J.P. Morgan Securities LLC | | | | | | | | | | U.S. Treasury Note | | | | | | | | |
2.35% - 3.00% | | | | | | | | | | 2.63% | | | | | | | | |
10/01/19 | | $ | 13,574,000 | | | $ | 13,574,980 | | | 02/28/23 | | $ | 5,000,000 | | | $ | 5,173,000 | |
| | | | | | | | | | | Fannie Mae Pool | | | | | | | | |
| | | | | | | | | | | 3.50% | | | | | | | | |
| | | | | | | | | | | 09/01/49 | | | 3,000,000 | | | | 3,082,200 | |
| | | | | | | | | | | U.S. Treasury Note | | | | | | | | |
| | | | | | | | | | | 2.50% | | | | | | | | |
| | | | | | | | | | | 05/15/24 | | | 2,912,000 | | | | 3,031,974 | |
| | | | | | | | | | | Ginnie Mae II Pool | | | | | | | | |
| | | | | | | | | | | 4.50% | | | | | | | | |
| | | | | | | | | | | 06/20/49 | | | 2,486,000 | | | | 2,610,300 | |
| | | | | | | | | | | | | | 13,398,000 | | | | 13,897,474 | |
| | | | | | | | | | | | | | | | | | | |
Societe Generale | | | | | | | | | | Fannie Mae Connecticut | | | | | | | | |
2.54% (3 Month USD LIBOR + 0.40%) | | | | | | | | | | Avenue Securities 4.12% | | | | | | | | |
04/14/20* | | | 12,000,000 | | | | 12,183,609 | | | 03/25/31 | | | 3,750,000 | | | | 3,774,000 | |
| | | | | | | | | | | STACR Trust | | | | | | | | |
| | | | | | | | | | | 4.17% | | | | | | | | |
| | | | | | | | | | | 12/25/30 | | | 3,741,000 | | | | 3,772,799 | |
| | | | | | | | | | | Fannie Mae Connecticut Avenue Securities | | | | | | | | |
| | | | | | | | | | | 4.02% | | | | | | | | |
| | | | | | | | | | | 03/25/31 | | | 3,742,000 | | | | 3,755,471 | |
| | | | | | | | | | | Freddie Mac Structured Agency Credit Risk Debt Notes | | | | | | | | |
| | | | | | | | | | | 4.67% | | | | | | | | |
| | | | | | | | | | | 12/25/29 | | | 3,740,000 | | | | 3,748,976 | |
| | | | | | | | | | | | | | 14,973,000 | | | | 15,051,246 | |
| | | | | | | | | | | | | | | | | | | |
58 | THE GUGGENHEIM FUNDS ANNUAL REPORT | SEE NOTES TO FINANCIAL STATEMENTS. |
SCHEDULE OF INVESTMENTS (concluded) | September 30, 2019 |
INVESTMENT GRADE BOND FUND | |
Counterparty and
Terms of Agreement | | Face Value | | | Repurchase Price | | | Collateral | | Par Value | | | Fair Value | |
BNP Paribas | | | | | | | | | | Saxon Asset Securities Trust | | | | | | | | |
2.33% | | | | | | | | | | 2.47% | | | | | | | | |
12/16/19 | | $ | 3,100,000 | | | $ | 3,118,219 | | | 11/25/37 | | $ | 3,831,000 | | | $ | 3,734,076 | |
| | | | | | | | | | | | | | | | | | | |
BofA Securities, Inc. | | | | | | | | | | U.S. Treasury Note | | | | | | | | |
2.80% | | | | | | | | | | 1.50% | | | | | | | | |
10/01/19 | | | 3,000,000 | | | | 3,000,233 | | | 09/30/24 | | | 3,076,000 | | | | 3,068,310 | |
* | Variable rate security. Rate indicated is the rate effective at September 30, 2019. In some instances, the effective rate is limited by a minimum rate floor or a maximum rate cap established by the issuer. The settlement status of a position may also impact the effective rate indicated. In some cases, a position may be unsettled at period end and may not have a stated effective rate. In instances where multiple underlying reference rates and spread amounts are shown, the effective rate is based on a weighted average. |
Affiliated Transactions
Investments representing 5% or more of the outstanding voting shares of a company, or control of or by, or common control under Guggenheim Investments (“GI”), result in that company being considered an affiliated issuer, as defined in the 1940 Act.
Transactions during the year ended September 30, 2019, in which the company is an affiliated issuer, were as follows:
Security Name | | Value
09/30/18 | | | Additions | | | Reductions | | | Realized
Gain (Loss) | | | Change in
Unrealized
Appreciation
(Depreciation) | | | Value
09/30/19 | | | Shares/
Face
Amount
09/30/19 | | | Investment
Income | | | Capital Gain
Distributions | |
Mutual Funds | | | | | | | | | | | | | | | | | | | | | | | | | | | | | | | | | | | | |
Guggenheim Floating Rate Strategies Fund — R6-Class | | $ | 2,489,273 | | | $ | 122,837 | | | $ | — | | | $ | — | | | $ | (67,665 | ) | | $ | 2,544,445 | | | | 100,770 | | | $ | 122,825 | | | $ | 12 | |
SEE NOTES TO FINANCIAL STATEMENTS. | THE GUGGENHEIM FUNDS ANNUAL REPORT | 59 |
INVESTMENT GRADE BOND FUND | |
STATEMENT OF ASSETS AND LIABILITIES |
September 30, 2019 |
Assets: |
Investments in unaffiliated issuers, at value (cost $789,502,513) | | $ | 810,717,179 | |
Investments in affiliated issuers, at value (cost $2,625,902) | | | 2,544,445 | |
Repurchase agreements, at value (cost $31,674,000) | | | 31,674,000 | |
Cash | | | 3,499 | |
Segregated cash with broker | | | 3,439,068 | |
Unamortized upfront premiums paid on interest rate swap agreements | | | 21,339 | |
Unrealized appreciation on forward foreign currency exchange contracts | | | 3,059,656 | |
Prepaid expenses | | | 66,886 | |
Receivables: |
Fund shares sold | | | 4,810,046 | |
Interest | | | 2,830,053 | |
Foreign tax reclaims | | | 29,232 | |
Dividends | | | 9,206 | |
Swap settlement | | | 2,373 | |
Securities sold | | | 552 | |
Total assets | | | 859,207,534 | |
| | | | | |
Liabilities: |
Unfunded loan commitments, at value (Note 9) (proceeds $200) | | | 929 | |
Segregated cash due to broker | | | 2,492,799 | |
Unamortized upfront premiums received on credit default swap agreements | | | 1,253,520 | |
Unrealized depreciation on OTC swap agreements | | | 392,090 | |
Unrealized depreciation on forward foreign currency exchange contracts | | | 626,016 | |
Payable for: |
Securities purchased | | | 12,442,040 | |
Fund shares redeemed | | | 5,479,784 | |
Distributions to shareholders | | | 185,689 | |
Management Fees | | | 101,295 | |
Variation margin on interest rate swaps | | | 64,276 | |
Transfer agent/maintenance fees | | | 55,739 | |
Distribution and service fees | | | 55,673 | |
Fund accounting/administration fees | | | 50,685 | |
Protection fees on credit default swaps | | | 42,607 | |
Variation margin on credit default swaps | | | 15,789 | |
Trustees’ fees* | | | 2,130 | |
Miscellaneous | | | 143,865 | |
Total liabilities | | | 23,404,926 | |
Net assets | | $ | 835,802,608 | |
| | | | | |
Net assets consist of: |
Paid in capital | | $ | 818,487,223 | |
Total distributable earnings (loss) | | | 17,315,385 | |
Net assets | | $ | 835,802,608 | |
| | | | | |
A-Class: |
Net assets | | $ | 149,442,293 | |
Capital shares outstanding | | | 7,890,771 | |
Net asset value per share | | $ | 18.94 | |
Maximum offering price per share (Net asset value divided by 96.00%) | | $ | 19.73 | |
| | | | | |
C-Class: |
Net assets | | $ | 22,531,389 | |
Capital shares outstanding | | | 1,194,698 | |
Net asset value per share | | $ | 18.86 | |
| | | | | |
P-Class: |
Net assets | | $ | 50,257,968 | |
Capital shares outstanding | | | 2,651,201 | |
Net asset value per share | | $ | 18.96 | |
| | | | | |
Institutional Class: |
Net assets | | $ | 613,570,958 | |
Capital shares outstanding | | | 32,439,090 | |
Net asset value per share | | $ | 18.91 | |
* | Relates to Trustees not deemed “interested persons” within the meaning of Section 2(a)(19) of the 1940 Act. |
60 | THE GUGGENHEIM FUNDS ANNUAL REPORT | SEE NOTES TO FINANCIAL STATEMENTS. |
INVESTMENT GRADE BOND FUND | |
STATEMENT OF OPERATIONS |
Year Ended September 30, 2019 |
Investment Income: |
Dividends from securities of unaffiliated issuers | | $ | 8,157 | |
Dividends from securities of affiliated issuers | | | 122,825 | |
Interest | | | 21,403,143 | |
Total investment income | | | 21,534,125 | |
| | | | | |
Expenses: |
Management fees | | | 2,774,100 | |
Distribution and service fees |
A-Class | | | 314,712 | |
C-Class | | | 202,369 | |
P-Class | | | 125,953 | |
Transfer agent/maintenance fees |
A-Class | | | 129,294 | |
C-Class | | | 25,384 | |
P-Class | | | 71,469 | |
Institutional Class | | | 387,947 | |
Fund accounting/administration fees | | | 569,053 | |
Line of credit fees | | | 54,877 | |
Professional fees | | | 98,319 | |
Custodian fees | | | 46,758 | |
Trustees’ fees* | | | 32,087 | |
Interest expense | | | 1,170 | |
Miscellaneous | | | 260,864 | |
Recoupment of previously waived fees: |
P-Class | | | 2,049 | |
Total expenses | | | 5,096,405 | |
Less: |
Expenses reimbursed by Adviser: |
A Class | | | (83,587 | ) |
C Class | | | (18,393 | ) |
P Class | | | (54,745 | ) |
Institutional Class | | | (409,099 | ) |
Expenses waived by Adviser | | | (190,985 | ) |
Earnings credits applied | | | (21,147 | ) |
Total waived/reimbursed expenses | | | (777,956 | ) |
Net expenses | | | 4,318,449 | |
Net investment income | | | 17,215,676 | |
| | | | | |
Net Realized and Unrealized Gain (Loss): |
Net realized gain (loss) on: |
Investments in unaffiliated issuers | | | 2,506,692 | |
Distributions received from affiliated investment companies | | | 12 | |
Swap agreements | | | (3,089,665 | ) |
Futures contracts | | | (672,044 | ) |
Options purchased | | | (1,457,279 | ) |
Options written | | | 222,776 | |
Forward foreign currency exchange contracts | | | 865,712 | |
Foreign currency transactions | | | (331,752 | ) |
Net realized loss | | | (1,955,548 | ) |
Net change in unrealized appreciation (depreciation) on: |
Investments in unaffiliated issuers | | | 30,154,638 | |
Investments in affiliated issuers | | | (67,665 | ) |
Swap agreements | | | (4,079,230 | ) |
Options purchased | | | 69,095 | |
Forward foreign currency exchange contracts | | | 1,585,011 | |
Foreign currency translations | | | 12,001 | |
Net change in unrealized appreciation (depreciation) | | | 27,673,850 | |
Net realized and unrealized gain | | | 25,718,302 | |
Net increase in net assets resulting from operations | | $ | 42,933,978 | |
* | Relates to Trustees not deemed “interested persons” within the meaning of Section 2(a)(19) of the 1940 Act. |
SEE NOTES TO FINANCIAL STATEMENTS. | THE GUGGENHEIM FUNDS ANNUAL REPORT | 61 |
INVESTMENT GRADE BOND FUND | |
STATEMENTS OF CHANGES IN NET ASSETS |
| | Year Ended
September 30,
2019 | | | Year Ended
September 30,
2018 | |
Increase (Decrease) in Net Assets from Operations: | | | | | | | | |
Net investment income | | $ | 17,215,676 | | | $ | 12,108,319 | |
Net realized gain (loss) on investments | | | (1,955,548 | ) | | | 2,180,609 | |
Net change in unrealized appreciation (depreciation) on investments | | | 27,673,850 | | | | (7,667,160 | ) |
Net increase in net assets resulting from operations | | | 42,933,978 | | | | 6,621,768 | |
| | | | | | | | | |
Distributions to shareholders: | | | | | | | | |
A-Class | | | (2,893,860 | ) | | | (4,168,019 | ) |
C-Class | | | (315,588 | ) | | | (473,849 | ) |
P-Class | | | (1,152,101 | ) | | | (832,713 | ) |
Institutional Class | | | (13,370,258 | ) | | | (6,667,145 | ) |
Total distributions to shareholders | | | (17,731,807 | ) | | | (12,141,726 | ) |
| | | | | | | | | |
Capital share transactions: | | | | | | | | |
Proceeds from sale of shares | | | | | | | | |
A-Class | | | 64,610,063 | | | | 53,960,443 | |
C-Class | | | 10,545,808 | | | | 5,242,102 | |
P-Class | | | 26,742,004 | | | | 40,693,678 | |
Institutional Class | | | 404,540,927 | | | | 286,726,563 | |
Distributions reinvested | | | | | | | | |
A-Class | | | 2,735,453 | | | | 3,808,487 | |
C-Class | | | 264,333 | | | | 418,766 | |
P-Class | | | 1,152,101 | | | | 831,621 | |
Institutional Class | | | 11,667,156 | | | | 6,230,399 | |
Cost of shares redeemed | | | | | | | | |
A-Class | | | (41,212,570 | ) | | | (107,498,545 | ) |
C-Class | | | (7,745,053 | ) | | | (14,673,803 | ) |
P-Class | | | (27,544,592 | ) | | | (10,133,358 | ) |
Institutional Class | | | (202,256,261 | ) | | | (51,009,557 | ) |
Net increase from capital share transactions | | | 243,499,369 | | | | 214,596,796 | |
Net increase in net assets | | | 268,701,540 | | | | 209,076,838 | |
| | | | | | | | | |
Net assets: | | | | | | | | |
Beginning of year | | | 567,101,068 | | | | 358,024,230 | |
End of year | | $ | 835,802,608 | | | $ | 567,101,068 | |
| | | | | | | | | |
Capital share activity: | | | | | | | | |
Shares sold | | | | | | | | |
A-Class | | | 3,470,553 | | | | 2,921,467 | |
C-Class | | | 566,982 | | | | 284,936 | |
P-Class | | | 1,452,776 | | | | 2,202,577 | |
Institutional Class | | | 21,936,510 | | | | 15,578,745 | |
Shares issued from reinvestment of distributions | | | | | | | | |
A-Class | | | 147,384 | | | | 206,047 | |
C-Class | | | 14,306 | | | | 22,751 | |
P-Class | | | 62,074 | | | | 45,020 | |
Institutional Class | | | 628,866 | | | | 337,987 | |
Shares redeemed | | | | | | | | |
A-Class | | | (2,223,090 | ) | | | (5,830,241 | ) |
C-Class | | | (416,564 | ) | | | (798,082 | ) |
P-Class | | | (1,494,589 | ) | | | (548,740 | ) |
Institutional Class | | | (10,939,242 | ) | | | (2,770,696 | ) |
Net increase in shares | | | 13,205,966 | | | | 11,651,771 | |
62 | THE GUGGENHEIM FUNDS ANNUAL REPORT | SEE NOTES TO FINANCIAL STATEMENTS. |
INVESTMENT GRADE BOND FUND | |
This table is presented to show selected data for a share outstanding throughout each period and to assist shareholders in evaluating a Fund’s performance for the periods presented.
A-Class | | Year Ended
September 30,
2019 | | | Year Ended
September 30,
2018 | | | Year Ended
September 30,
2017 | | | Year Ended
September 30,
2016 | | | Year Ended
September 30,
2015 | |
Per Share Data | | | | | | | | | | | | | | | | | | | | |
Net asset value, beginning of period | | $ | 18.33 | | | $ | 18.55 | | | $ | 18.55 | | | $ | 18.10 | | | $ | 18.50 | |
Income (loss) from investment operations: |
Net investment income (loss)a | | | .41 | | | | .49 | | | | .59 | | | | .64 | | | | .69 | |
Net gain (loss) on investments (realized and unrealized) | | | .63 | | | | (.22 | ) | | | .02 | | | | .50 | | | | (.30 | ) |
Total from investment operations | | | 1.04 | | | | .27 | | | | .61 | | | | 1.14 | | | | .39 | |
Less distributions from: |
Net investment income | | | (.43 | ) | | | (.49 | ) | | | (.61 | ) | | | (.69 | ) | | | (.79 | ) |
Total distributions | | | (.43 | ) | | | (.49 | ) | | | (.61 | ) | | | (.69 | ) | | | (.79 | ) |
Net asset value, end of period | | $ | 18.94 | | | $ | 18.33 | | | $ | 18.55 | | | $ | 18.55 | | | $ | 18.10 | |
|
Total Returnb | | | 5.72 | % | | | 1.46 | % | | | 3.39 | % | | | 6.50 | % | | | 2.12 | % |
Ratios/Supplemental Data |
Net assets, end of period (in thousands) | | $ | 149,442 | | | $ | 119,066 | | | $ | 170,624 | | | $ | 158,932 | | | $ | 115,019 | |
Ratios to average net assets: |
Net investment income (loss) | | | 2.23 | % | | | 2.64 | % | | | 3.19 | % | | | 3.55 | % | | | 3.72 | % |
Total expensesc | | | 0.89 | % | | | 0.93 | % | | | 1.07 | % | | | 1.08 | % | | | 1.17 | % |
Net expensesd,e,g | | | 0.80 | % | | | 0.83 | % | | | 1.02 | % | | | 1.03 | % | | | 1.07 | % |
Portfolio turnover rate | | | 77 | % | | | 53 | % | | | 81 | % | | | 100 | % | | | 57 | % |
C-Class | | Year Ended
September 30,
2019 | | | Year Ended
September 30,
2018 | | | Year Ended
September 30,
2017 | | | Year Ended
September 30,
2016 | | | Year Ended
September 30,
2015 | |
Per Share Data | | | | | | | | | | | | | | | | | | | | |
Net asset value, beginning of period | | $ | 18.25 | | | $ | 18.47 | | | $ | 18.48 | | | $ | 18.02 | | | $ | 18.42 | |
Income (loss) from investment operations: |
Net investment income (loss)a | | | .28 | | | | .35 | | | | .45 | | | | .51 | | | | .55 | |
Net gain (loss) on investments (realized and unrealized) | | | .62 | | | | (.22 | ) | | | .02 | | | | .51 | | | | (.30 | ) |
Total from investment operations | | | .90 | | | | .13 | | | | .47 | | | | 1.02 | | | | .25 | |
Less distributions from: |
Net investment income | | | (.29 | ) | | | (.35 | ) | | | (.48 | ) | | | (.56 | ) | | | (.65 | ) |
Total distributions | | | (.29 | ) | | | (.35 | ) | | | (.48 | ) | | | (.56 | ) | | | (.65 | ) |
Net asset value, end of period | | $ | 18.86 | | | $ | 18.25 | | | $ | 18.47 | | | $ | 18.48 | | | $ | 18.02 | |
|
Total Returnb | | | 4.96 | % | | | 0.71 | % | | | 2.59 | % | | | 5.78 | % | | | 1.36 | % |
Ratios/Supplemental Data |
Net assets, end of period (in thousands) | | $ | 22,531 | | | $ | 18,799 | | | $ | 28,083 | | | $ | 36,040 | | | $ | 24,111 | |
Ratios to average net assets: |
Net investment income (loss) | | | 1.50 | % | | | 1.92 | % | | | 2.47 | % | | | 2.81 | % | | | 3.00 | % |
Total expensesc | | | 1.67 | % | | | 1.75 | % | | | 1.85 | % | | | 1.90 | % | | | 1.99 | % |
Net expensesd,e,g | | | 1.55 | % | | | 1.57 | % | | | 1.77 | % | | | 1.77 | % | | | 1.82 | % |
Portfolio turnover rate | | | 77 | % | | | 53 | % | | | 81 | % | | | 100 | % | | | 57 | % |
SEE NOTES TO FINANCIAL STATEMENTS. | THE GUGGENHEIM FUNDS ANNUAL REPORT | 63 |
INVESTMENT GRADE BOND FUND | |
FINANCIAL HIGHLIGHTS (continued) |
This table is presented to show selected data for a share outstanding throughout each period and to assist shareholders in evaluating a Fund’s performance for the periods presented.
P-Class | | Year Ended
September 30,
2019 | | | Year Ended
September 30,
2018 | | | Year Ended
September 30,
2017 | | | Year Ended
September 30,
2016 | | | Period Ended
September 30,
2015f | |
Per Share Data | | | | | | | | | | | | | | | | | | | | |
Net asset value, beginning of period | | $ | 18.34 | | | $ | 18.56 | | | $ | 18.57 | | | $ | 18.12 | | | $ | 18.45 | |
Income (loss) from investment operations: |
Net investment income (loss)a | | | .41 | | | | .48 | | | | .56 | | | | .59 | | | | .25 | |
Net gain (loss) on investments (realized and unrealized) | | | .63 | | | | (.21 | ) | | | .05 | | | | .55 | | | | (.26 | ) |
Total from investment operations | | | 1.04 | | | | .27 | | | | .61 | | | | 1.14 | | | | (.01 | ) |
Less distributions from: |
Net investment income | | | (.42 | ) | | | (.49 | ) | | | (.62 | ) | | | (.69 | ) | | | (.32 | ) |
Total distributions | | | (.42 | ) | | | (.49 | ) | | | (.62 | ) | | | (.69 | ) | | | (.32 | ) |
Net asset value, end of period | | $ | 18.96 | | | $ | 18.34 | | | $ | 18.56 | | | $ | 18.57 | | | $ | 18.12 | |
|
Total Return | | | 5.77 | % | | | 1.45 | % | | | 3.33 | % | | | 6.51 | % | | | (0.11 | %) |
Ratios/Supplemental Data |
Net assets, end of period (in thousands) | | $ | 50,258 | | | $ | 48,263 | | | $ | 17,303 | | | $ | 3,087 | | | $ | 10 | |
Ratios to average net assets: |
Net investment income (loss) | | | 2.24 | % | | | 2.61 | % | | | 3.06 | % | | | 3.25 | % | | | 3.25 | % |
Total expensesc | | | 0.93 | % | | | 0.94 | % | | | 1.13 | % | | | 0.98 | % | | | 3.29 | % |
Net expensesd,e,g | | | 0.80 | % | | | 0.80 | % | | | 1.01 | % | | | 0.98 | % | | | 1.09 | % |
Portfolio turnover rate | | | 77 | % | | | 53 | % | | | 81 | % | | | 100 | % | | | 57 | % |
64 | THE GUGGENHEIM FUNDS ANNUAL REPORT | SEE NOTES TO FINANCIAL STATEMENTS. |
INVESTMENT GRADE BOND FUND | |
FINANCIAL HIGHLIGHTS (concluded) |
This table is presented to show selected data for a share outstanding throughout each period and to assist shareholders in evaluating a Fund’s performance for the periods presented.
Institutional Class | | Year Ended
September 30,
2019 | | | Year Ended
September 30,
2018 | | | Year Ended
September 30,
2017 | | | Year Ended
September 30,
2016 | | | Year Ended
September 30,
2015 | |
Per Share Data | | | | | | | | | | | | | | | | | | | | |
Net asset value, beginning of period | | $ | 18.30 | | | $ | 18.52 | | | $ | 18.53 | | | $ | 18.07 | | | $ | 18.47 | |
Income (loss) from investment operations: |
Net investment income (loss)a | | | .47 | | | | .54 | | | | .64 | | | | .62 | | | | .74 | |
Net gain (loss) on investments (realized and unrealized) | | | .62 | | | | (.22 | ) | | | .02 | | | | .58 | | | | (.31 | ) |
Total from investment operations | | | 1.09 | | | | .32 | | | | .66 | | | | 1.20 | | | | .43 | |
Less distributions from: |
Net investment income | | | (.48 | ) | | | (.54 | ) | | | (.67 | ) | | | (.74 | ) | | | (.83 | ) |
Total distributions | | | (.48 | ) | | | (.54 | ) | | | (.67 | ) | | | (.74 | ) | | | (.83 | ) |
Net asset value, end of period | | $ | 18.91 | | | $ | 18.30 | | | $ | 18.52 | | | $ | 18.53 | | | $ | 18.07 | |
|
Total Return | | | 6.03 | % | | | 1.75 | % | | | 3.67 | % | | | 6.83 | % | | | 2.37 | % |
Ratios/Supplemental Data |
Net assets, end of period (in thousands) | | $ | 613,571 | | | $ | 380,974 | | | $ | 142,014 | | | $ | 83,168 | | | $ | 6,910 | |
Ratios to average net assets: |
Net investment income (loss) | | | 2.52 | % | | | 2.92 | % | | | 3.51 | % | | | 3.41 | % | | | 4.01 | % |
Total expensesc | | | 0.62 | % | | | 0.60 | % | | | 0.74 | % | | | 0.76 | % | | | 0.94 | % |
Net expensesd,e,g | | | 0.51 | % | | | 0.52 | % | | | 0.70 | % | | | 0.76 | % | | | 0.82 | % |
Portfolio turnover rate | | | 77 | % | | | 53 | % | | | 81 | % | | | 100 | % | | | 57 | % |
a | Net investment income (loss) per share was computed using average shares outstanding throughout the period. |
b | Total return does not reflect the impact of any applicable sales charges. |
c | Does not include expenses of the underlying funds in which the Fund invests. |
d | Net expense information reflects the expense ratios after expense waivers and reimbursements, as applicable. |
e | The portion of the ratios of expenses before and after waivers/reimbursements to average net assets attributable to recoupments of prior fee reductions or expense reimbursements for the periods presented was as follows: |
| | | 09/30/19 | 09/30/18 | 09/30/17 |
| | A-Class | — | 0.00%* | 0.05% |
| | C-Class | — | 0.00%* | 0.03% |
| | P-Class | 0.00%* | 0.00%* | 0.01% |
| | Institutional Class | — | 0.00%* | 0.02% |
f | Since commencement of operations: May 1, 2015. Percentage amounts for the period, except total return and portfolio turnover rate, have been annualized. |
g | Net expenses may include expenses that are excluded from the expense limitation agreement. Excluding these expenses, the net expense ratios for the periods would be: |
| | | 09/30/19 | 09/30/18 | 09/30/17 | 09/30/16 | 09/30/15 |
| | A-Class | 0.79% | 0.82% | 1.00% | 1.00% | 1.00% |
| | C-Class | 1.54% | 1.57% | 1.75% | 1.74% | 1.75% |
| | P-Class | 0.79% | 0.80% | 0.99% | 0.97% | 1.00% |
| | Institutional Class | 0.50% | 0.52% | 0.68% | 0.75% | 0.75% |
SEE NOTES TO FINANCIAL STATEMENTS. | THE GUGGENHEIM FUNDS ANNUAL REPORT | 65 |
MANAGERS’ COMMENTARY (Unaudited) | September 30, 2019 |
To Our Shareholders
Guggenheim Investments Municipal Income Fund (the “Fund”) is managed by a team of seasoned professionals, including B. Scott Minerd, Chairman of Investments and Global Chief Investment Officer; Anne B. Walsh, Senior Managing Director and Chief Investment Officer, Fixed Income; Jeffrey S. Carefoot, CFA, Senior Managing Director and Portfolio Manager; and Allen Li, CFA, Managing Director and Portfolio Manager. In the following paragraphs, the investment team discusses the market environment and the Fund’s performance for the fiscal year ended September 30, 2019.
For the one-year period ended September 30, 2019, the Guggenheim Municipal Income Fund returned 8.13%1, compared with the 8.55% return of the Bloomberg Barclays Municipal Bond Index, the Fund’s benchmark.
The Fund’s short duration bias hindered returns in a year of falling interest rates and record retail inflows into the municipal sector; however, we did own long-dated zero coupon bonds that offset some of the underperformance.
We continue to maintain a defensive posture, and we expect idiosyncratic opportunities to emerge as volatility returns. The broader municipal market, on the back of low supply, record inflows, and positive returns, has slowly but steadily become less disciplined on credit underwriting over the last 4-5 years.
A recent legal development shows the need for greater vigilance in municipal bonds. In late March, the U.S. Court of Appeals for the First Circuit ruled in a Puerto Rican bankruptcy case that, post-bankruptcy, special revenue bond payments are optional and not mandatory under municipal bankruptcy code (“Chapter 9.”)
The special revenue bond is a tax-exempt bond issued for a dedicated purpose, i.e. for transportation funding or water utility capital projects; such bonds would be paid directly from the revenues tied to the transportation project or utility. Market participants have historically interpreted Chapter 9 to say that special revenue bonds are not subject to automatic stay in bankruptcy, and that issuers are required to continue payments even after entering a workout. The First Circuit ruling overturned this interpretation.
We have been skeptical of the special revenue concept in the past, due to the lack of precedence in municipal bankruptcies. Regardless of the intent of the 1988 congressional amendment creating the special revenue protections, the low number of municipal bankruptcies means that case law affirming the concept was limited, allowing leeway for judges to interpret the provision as befitting the circumstances of each case. Further, municipal investors had already tacitly acknowledged the vulnerability of special revenues when bondholders opted to tender Detroit Water & Sewer bonds below par during that city’s 2013 bankruptcy, despite the utility’s being outside of the restructuring case.
Going forward, we expect the market to be much more skeptical of special revenue bonds from weak obligors like Chicago. The First Circuit ruling did not impair the pre-petition liens of special revenue bonds, and other circuit courts do not necessarily have to follow the decision. However, we continue to believe that special revenue features by themselves are insufficient to fully protect bondholders. A security should have additional protections, such as a statutory lien, good financials and demographics, and a cash flow lockbox, to better insulate investors against surprise impairments.
Looser covenants is a well-discussed phenomenon in the bank loan and high yield corporate bonds space. We see parallels in the municipal sector as well. Not-for-profit hospitals, especially those rated single-A or BBB, used to issue bonds with a gamut of structural protections: cash-funded debt service reserves, mortgage liens, high debt service coverage and additional bond test requirements, etc. Such protections were demanded by the market to offset issuer- and industry-specific credit risks.
We have seen these structural features gradually fade away in the last few years. Cash reserve funds and mortgage liens are now rare even among BBB credits, and the required ratios for debt service coverage and additional bonds have declined. Now we see healthcare deals that allow the bond’s entire indenture to be replaced without bondholder consent. Such provisions will have some qualifiers, such as rating agency approval or maintenance of certain financial covenants, but none of the pre-conditions give investors the right to decline. Consequently, investors might find themselves owning a radically different (and likely much weaker) security package from one day to the next, without direct say or compensation. Based on the deals we reviewed, the portion of new healthcare issuance with indenture replacement language has risen from 35% in 2017 to 59% in 2019. The trend merits watching, and municipal investors should proceed with caution.
66 | THE GUGGENHEIM FUNDS ANNUAL REPORT | |
MANAGERS’ COMMENTARY (Unaudited)(concluded) | September 30, 2019 |
Besides looser credit standards, we also have seen more relaxed requirements around the standard market structure for a tax exempt bond–5% coupon, non-callable for the first ten years (“NC10”) after initial issuance. The 5% NC10 structure has been standard going back at least 11 years and represents the most liquid of the various bond structures in the marketplace. Institutional investors, especially mutual funds, have usually preferred that structure because it reduces the risks of a bond falling below the allowed market discount price–resulting in ordinary income taxes on a portion of the accretion to par–if interest rates spike. Thus, sub-5% structures have usually traded at significant discounts to the 5% coupons.
Lately, preference for the 5% NC10 has subsided as investors chase the incremental spread in lower-coupon structures. Year-to-date, sub-5% bonds comprised 46% of new issues, versus 39% for all of 2018. Investors ignoring the potential illiquidity and market discount risks down the line, in return for the wider spread (off of yields, that are already low on an absolute basis) upfront. We are mindful of the old refrain about liquidity–always plentiful when not needed, but otherwise never around. Current yields and spreads on sub-5% coupon bonds provide insufficient compensation for their illiquidity risk, and we have refrained from moving down the coupon structure this year.
The seeds of outperformance (and underperformance) in 2-3 years’ time are being planted today. Errors of commission are just as deadly as errors of omission; what we do and what we avoid doing are both relevant to shareholder returns. Thus, we are maintaining our stringent investment criteria, keeping in mind that certainty of principal repayment must come before any potential for excess returns. As the current economic cycle winds down, we expect our caution to pay off.
Performance displayed represents past performance which is no guarantee of future results.
1 | Performance figures are based on Class A shares and do not reflect deduction of the sales charges or taxes that a shareholder would pay on distributions or the redemption of shares. |
The opinions and forecast expressed may not actually come to pass. This information is subject to change at any time, based on market and other conditions, and should not be construed as a recommendation of any specific security or strategy.
| | THE GUGGENHEIM FUNDS ANNUAL REPORT | 67 |
PERFORMANCE REPORT AND FUND PROFILE (Unaudited) | September 30, 2019 |
MUNICIPAL INCOME FUND
OBECTIVE: Seeks to provide current income with an emphasis on income exempt from federal income tax, while also considering capital appreciation.
Holdings Diversification (Market Exposure as % of Net Assets)
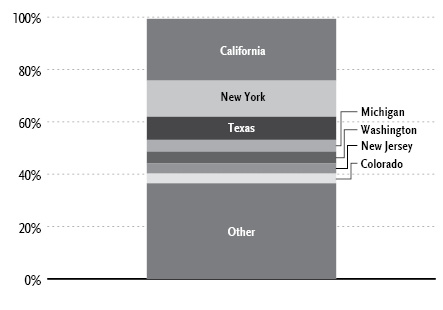
“Holdings Diversification (Market Exposure as % of Net Assets)” excludes any temporary cash investments.
Portfolio Composition by Quality Rating1 |
Rating | | % of Total
Investments | |
Fixed Income Instruments | | | | |
AAA | | | 9.9 | % |
AA | | | 59.1 | % |
A | | | 14.4 | % |
BBB | | | 8.4 | % |
BB | | | 1.7 | % |
NR2 | | | 3.4 | % |
Other Instruments | | | 3.1 | % |
Total Investments | | | 100.0 | % |
Inception Dates: |
A-Class | April 28, 2004 |
C-Class | January 13, 2012 |
P-Class | May 1, 2015 |
Institutional Class | January 13, 2012 |
Ten Largest Holdings (% of Total Net Assets) |
New York City Water & Sewer System Revenue Bonds, 1.76% | 4.4% |
City of New York New York General Obligation Unlimited, 1.77% | 3.7% |
El Camino Healthcare District General Obligation Unlimited | 3.5% |
Stockton Public Financing Authority Revenue Bonds, 6.25% | 2.0% |
Detroit Wayne County Stadium Authority Revenue Bonds, 5.00% | 1.9% |
Tustin Unified School District General Obligation Unlimited, 6.00% | 1.9% |
Hudson County Improvement Authority Revenue Bonds, 6.00% | 1.7% |
New York City Transitional Finance Authority Future Tax Secured Revenue Bonds, 1.76% | 1.7% |
College of the Sequoias Tulare Area Improvement District No. 3 General Obligation Unlimited | 1.4% |
Newport Mesa Unified School District General Obligation Unlimited | 1.2% |
Top Ten Total | 23.4% |
| | |
“Ten Largest Holdings” excludes any temporary cash investments. |
1 | Source: BlackRock Solutions. Credit quality ratings are measured on a scale that generally ranges from AAA (highest) to D (lowest). All securities except for those labeled “NR” have been rated by Moody’s, Standard & Poor’s (“S&P”), or Fitch, each of which is a Nationally Recognized Statistical Rating Organization (“NRSRO”). For purposes of this presentation, when ratings are available from more than one agency, the highest rating is used. Guggenheim Investments has converted ratings to the equivalent S&P rating. Security ratings are determined at the time of purchase and may change thereafter. |
2 | NR securities do not necessarily indicate low credit quality. |
68 | THE GUGGENHEIM FUNDS ANNUAL REPORT | |
PERFORMANCE REPORT AND FUND PROFILE (Unaudited)(concluded) | September 30, 2019 |
Cumulative Fund Performance*
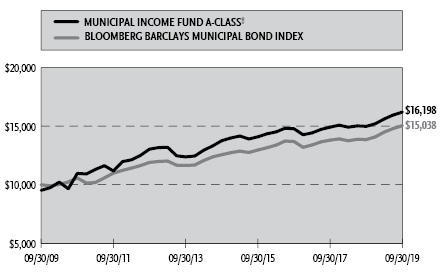
Average Annual Returns*
Periods Ended September 30, 2019
| 1 Year | 5 Year | 10 Year |
A-Class Shares~ | 8.13% | 3.31% | 5.46% |
A-Class Shares with sales charge‡ | 3.80% | 2.32% | 4.94% |
Bloomberg Barclays Municipal Bond Index | 8.55% | 3.66% | 4.16% |
| 1 Year | 5 Year | Since
Inception
(01/13/12) |
C-Class Shares | 7.33% | 2.54% | 3.06% |
C-Class Shares with CDSC§ | 6.33% | 2.54% | 3.06% |
Institutional Class Shares | 8.48% | 3.59% | 4.10% |
Bloomberg Barclays Municipal Bond Index | 8.55% | 3.66% | 3.65% |
| | 1 Year | Since
Inception
(05/01/15) |
P-Class Shares | | 8.20% | 3.23% |
Bloomberg Barclays Municipal Bond Index | | 8.55% | 3.74% |
* | The performance data above represents past performance that is not predictive of future results. The investment return and principal value of an investment in the Fund will fluctuate so that an investor’s shares, when redeemed, may be worth more or less than their original cost. Returns are historical and include changes in principal and reinvested dividends and capital gains and do not reflect the effect of taxes. The Bloomberg Barclays Municipal Bond Index is an unmanaged index and, unlike the Fund, has no management fees or operating expenses to reduce its reported return. The graph is based on A-Class shares only; performance for C-Class shares, P-Class shares and Institutional shares will vary due to differences in fee structures. |
‡ | Effective October 1, 2015, the maximum sales charge decreased from 4.75% to 4.00%. A 4.75% maximum sales charge is used in the calculation of the Average Annual Returns based on subscriptions made prior to October 1, 2015, and a 4.00% maximum sales charge is used to calculate performance for periods based on subscriptions made on or after October 1, 2015. |
§ | Fund returns include a CDSC of 1% if redeemed within 12 months of purchase. |
~ | Effective January 13, 2012, the Fund acquired all of the assets and liabilities of the TS&W/Claymore Tax-Advantage Balanced Fund (“TYW”), a registered closed-end management investment company. The A-Class performance prior to that date reflects performance of TYW. |
| | THE GUGGENHEIM FUNDS ANNUAL REPORT | 69 |
SCHEDULE OF INVESTMENTS | September 30, 2019 |
MUNICIPAL INCOME FUND | |
| | Shares | | | Value | |
CLOSED-END FUNDS† - 3.0% | | | | | | | | |
BlackRock MuniVest Fund, Inc. | | | 30,252 | | | $ | 278,318 | |
BlackRock MuniYield Quality Fund, Inc. | | | 14,702 | | | | 221,118 | |
BNY Mellon Strategic Municipals, Inc. | | | 24,484 | | | | 210,073 | |
BlackRock Municipal Income Quality Trust | | | 12,440 | | | | 176,026 | |
Invesco Municipal Opportunity Trust | | | 13,690 | | | | 171,262 | |
Invesco Trust for Investment Grade Municipals | | | 13,171 | | | | 169,511 | |
Invesco Municipal Trust | | | 12,197 | | | | 153,804 | |
BlackRock MuniYield California Quality Fund, Inc. | | | 10,031 | | | | 144,346 | |
Invesco Advantage Municipal Income Trust II | | | 10,353 | | | | 116,368 | |
DWS Municipal Income Trust | | | 9,595 | | | | 111,206 | |
BlackRock MuniEnhanced Fund, Inc. | | | 4,314 | | | | 48,921 | |
BlackRock MuniHoldings Investment Quality Fund | | | 7 | | | | 95 | |
Total Closed-End Funds | | | | | | | | |
(Cost $1,791,138) | | | | | | | 1,801,048 | |
| |
MONEY MARKET FUND† - 0.1% |
Dreyfus AMT-Free Tax Exempt Cash Management Fund — Institutional Shares 1.39%1 | | | 34,155 | | | | 34,155 | |
Total Money Market Fund | | | | | | | | |
(Cost $34,155) | | | | | | | 34,155 | |
| | | | | | | | | |
| | | Face
Amount | | | | | |
MUNICIPAL BONDS†† - 96.3% |
California - 23.6% |
El Camino Healthcare District General Obligation Unlimited | | | | | | | | |
due 08/01/292 | | $ | 2,500,000 | | | | 2,030,800 | |
Stockton Public Financing Authority Revenue Bonds | | | | | | | | |
6.25% due 10/01/38 | | | 1,000,000 | | | | 1,189,330 | |
6.25% due 10/01/40 | | | 250,000 | | | | 296,892 | |
5.00% due 10/01/33 | | | 200,000 | | | | 252,220 | |
Tustin Unified School District General Obligation Unlimited | | | | | | | | |
6.00% due 08/01/21 | | | 1,000,000 | | | | 1,089,110 | |
Sierra Joint Community College District School Facilities District No. 1 General Obligation Unlimited | | | | | | | | |
due 08/01/312 | | | 705,000 | | | | 541,933 | |
due 08/01/302 | | | 415,000 | | | | 328,946 | |
College of the Sequoias Tulare Area Improvement District No. 3 General Obligation Unlimited | | | | | | | | |
due 08/01/423,6 | | | 1,000,000 | | | | 824,810 | |
Newport Mesa Unified School District General Obligation Unlimited | | | | | | | | |
due 08/01/392 | | | 1,300,000 | | | | 684,944 | |
Los Angeles Department of Water & Power Power System Revenue Bonds | | | | | | | | |
5.00% due 07/01/43 | | | 500,000 | | | | 548,480 | |
Kings Canyon Unified School District General Obligation Unlimited | | | | | | | | |
5.00% due 08/01/28 | | | 445,000 | | | | 532,385 | |
Compton Unified School District General Obligation Unlimited | | | | | | | | |
due 06/01/402 | | | 1,000,000 | | | | 531,400 | |
San Diego Unified School District General Obligation Unlimited | | | | | | | | |
due 07/01/392 | | | 1,000,000 | | | | 481,250 | |
Riverside County Public Financing Authority Tax Allocation | | | | | | | | |
5.00% due 10/01/28 | | | 300,000 | | | | 376,218 | |
Oakland Unified School District/Alameda County General Obligation Unlimited | | | | | | | | |
5.00% due 08/01/22 | | | 220,000 | | | | 235,704 | |
5.00% due 08/01/40 | | | 120,000 | | | | 139,985 | |
Sacramento Municipal Utility District Revenue Bonds | | | | | | | | |
5.00% due 08/15/37 | | | 300,000 | | | | 339,309 | |
Delhi Unified School District General Obligation Unlimited | | | | | | | | |
5.00% due 08/01/44 | | | 250,000 | | | | 300,005 | |
Placer Union High School District General Obligation Unlimited | | | | | | | | |
due 08/01/302 | | | 375,000 | | | | 299,801 | |
Riverside County Redevelopment Successor Agency Tax Allocation | | | | | | | | |
due 10/01/373,6 | | | 250,000 | | | | 269,208 | |
Gustine Unified School District General Obligation Unlimited | | | | | | | | |
5.00% due 08/01/41 | | | 220,000 | | | | 260,187 | |
M-S-R Energy Authority Revenue Bonds | | | | | | | | |
6.13% due 11/01/29 | | | 200,000 | | | | 256,246 | |
Alameda Corridor Transportation Authority Revenue Bonds | | | | | | | | |
5.00% due 10/01/35 | | | 200,000 | | | | 238,730 | |
Department of Veterans Affairs Veteran’s Farm & Home Purchase Program Revenue Bonds | | | | | | | | |
3.45% due 12/01/39 | | | 200,000 | | | | 216,786 | |
Upland Unified School District General Obligation Unlimited | | | | | | | | |
due 08/01/382 | | | 400,000 | | | | 216,516 | |
Stanton Redevelopment Agency Tax Allocation | | | | | | | | |
5.00% due 12/01/40 | | | 180,000 | | | | 212,670 | |
Westside Elementary School District General Obligation Unlimited | | | | | | | | |
5.00% due 08/01/48 | | | 155,000 | | | | 188,010 | |
Culver Redevelopment Agency Successor Agency Tax Allocation | | | | | | | | |
due 11/01/232 | | | 195,000 | | | | 182,695 | |
70 | THE GUGGENHEIM FUNDS ANNUAL REPORT | SEE NOTES TO FINANCIAL STATEMENTS. |
SCHEDULE OF INVESTMENTS (continued) | September 30, 2019 |
MUNICIPAL INCOME FUND | |
| | Face
Amount | | | Value | |
Rio Hondo Community College District General Obligation Unlimited | | | | | | | | |
due 08/01/292 | | $ | 200,000 | | | $ | 164,852 | |
Freddie Mac Multifamily VRD Certificates Revenue Bonds | | | | | | | | |
2.40% due 10/15/29 | | | 150,000 | | | | 155,985 | |
City of Los Angeles Department of Airports Revenue Bonds | | | | | | | | |
5.00% due 05/15/44 | | | 100,000 | | | | 123,938 | |
Washington Township Health Care District Revenue Bonds | | | | | | | | |
5.00% due 07/01/32 | | | 100,000 | | | | 122,778 | |
Buena Park School District General Obligation Unlimited | | | | | | | | |
5.00% due 08/01/47 | | | 100,000 | | | | 119,776 | |
Roseville Joint Union High School District General Obligation Unlimited | | | | | | | | |
due 08/01/302 | | | 100,000 | | | | 80,118 | |
Sequoia Healthcare District Revenue Bonds | | | | | | | | |
5.38% due 08/15/23 | | | 5,000 | | | | 5,449 | |
Total California | | | | | | | 13,837,466 | |
| | | | | | | | | |
New York - 13.9% |
New York City Water & Sewer System Revenue Bonds | | | | | | | | |
1.76% (VRDN) due 06/15/454 | | | 2,600,000 | | | | 2,600,000 | |
City of New York New York General Obligation Unlimited | | | | | | | | |
1.77% (VRDN) due 04/01/364 | | | 2,200,000 | | | | 2,200,000 | |
New York City Transitional Finance Authority Future Tax Secured Revenue Bonds | | | | | | | | |
1.76% (VRDN) due 08/01/424 | | | 1,000,000 | | | | 1,000,000 | |
1.75% (VRDN) due 11/01/364 | | | 500,000 | | | | 500,000 | |
New York State Dormitory Authority Revenue Bonds | | | | | | | | |
5.00% due 10/01/41 | | | 350,000 | | | | 368,665 | |
5.00% due 08/01/26 | | | 250,000 | | | | 302,410 | |
5.00% due 12/01/275 | | | 200,000 | | | | 241,366 | |
5.00% due 02/18/20 | | | 15,000 | | | | 15,214 | |
New York Transportation Development Corp. Revenue Bonds | | | | | | | | |
5.00% due 07/01/34 | | | 200,000 | | | | 224,722 | |
5.00% due 08/01/26 | | | 200,000 | | | | 210,238 | |
New York State Urban Development Corp. Revenue Bonds | | | | | | | | |
5.00% due 03/15/35 | | | 250,000 | | | | 286,182 | |
Westchester County Healthcare Corp. Revenue Bonds | | | | | | | | |
5.00% due 11/01/44 | | | 193,000 | | | | 213,462 | |
Total New York | | | | | | | 8,162,259 | |
| | | | | | | | | |
Texas - 8.8% |
North Texas Tollway Authority Revenue Bonds | | | | | | | | |
due 01/01/362 | | | 1,000,000 | | | | 658,600 | |
Birdville Independent School District General Obligation Unlimited | | | | | | | | |
5.00% due 02/15/27 | | | 305,000 | | | | 361,196 | |
State of Texas General Obligation Unlimited | | | | | | | | |
5.00% due 10/01/29 | | | 250,000 | | | | 301,210 | |
Bexar County Hospital District General Obligation Limited | | | | | | | | |
5.00% due 02/15/32 | | | 200,000 | | | | 249,124 | |
Lindale Independent School District General Obligation Unlimited | | | | | | | | |
5.00% due 02/15/49 | | | 200,000 | | | | 243,868 | |
United Independent School District General Obligation Unlimited | | | | | | | | |
5.00% due 08/15/49 | | | 200,000 | | | | 243,196 | |
Harris County-Houston Sports Authority Revenue Bonds | | | | | | | | |
due 11/15/532 | | | 1,000,000 | | | | 242,500 | |
Bexar County Health Facilities Development Corp. Revenue Bonds | | | | | | | | |
5.00% due 07/15/22 | | | 225,000 | | | | 242,244 | |
Texas Water Development Board Revenue Bonds | | | | | | | | |
5.00% due 10/15/46 | | | 200,000 | | | | 237,592 | |
Central Texas Regional Mobility Authority Revenue Bonds | | | | | | | | |
5.00% due 01/01/27 | | | 200,000 | | | | 237,426 | |
Dallas Area Rapid Transit Revenue Bonds | | | | | | | | |
5.00% due 12/01/41 | | | 200,000 | | | | 235,616 | |
Central Texas Turnpike System Revenue Bonds | | | | | | | | |
5.00% due 08/15/34 | | | 200,000 | | | | 226,658 | |
Arlington Higher Education Finance Corp. Revenue Bonds | | | | | | | | |
5.00% due 12/01/46 | | | 200,000 | | | | 223,514 | |
Texas Municipal Gas Acquisition & Supply Corporation I Revenue Bonds | | | | | | | | |
6.25% due 12/15/26 | | | 185,000 | | | | 215,825 | |
Texas Tech University Revenue Bonds | | | | | | | | |
5.00% due 08/15/32 | | | 200,000 | | | | 211,898 | |
Grand Parkway Transportation Corp. Revenue Bonds | | | | | | | | |
5.00% due 10/01/43 | | | 175,000 | | | | 211,540 | |
Spring Independent School District General Obligation Unlimited | | | | | | | | |
4.00% due 08/15/37 | | | 150,000 | | | | 172,179 | |
City of Fort Worth Texas Water & Sewer System Revenue Bonds | | | | | | | | |
5.00% due 02/15/32 | | | 100,000 | | | | 125,179 | |
Hutto Independent School District General Obligation Unlimited | | | | | | | | |
5.00% due 08/01/49 | | | 100,000 | | | | 121,874 | |
Mansfield Independent School District General Obligation Unlimited | | | | | | | | |
5.00% due 02/15/44 | | | 100,000 | | | | 121,738 | |
University of North Texas System Revenue Bonds | | | | | | | | |
5.00% due 04/15/44 | | | 100,000 | | | | 121,159 | |
SEE NOTES TO FINANCIAL STATEMENTS. | THE GUGGENHEIM FUNDS ANNUAL REPORT | 71 |
SCHEDULE OF INVESTMENTS (continued) | September 30, 2019 |
MUNICIPAL INCOME FUND | |
| | Face
Amount | | | Value | |
City of Arlington Texas Special Tax | | | | | | | | |
5.00% due 02/15/48 | | $ | 100,000 | | | $ | 119,177 | |
Texas A&M University Revenue Bonds | | | | | | | | |
5.00% due 11/15/19 | | | 40,000 | | | | 40,179 | |
Tarrant County Health Facilities Development Corp. Revenue Bonds | | | | | | | | |
6.00% due 09/01/24 | | | 10,000 | | | | 11,297 | |
Leander Independent School District General Obligation Unlimited | | | | | | | | |
due 08/15/242 | | | 5,000 | | | | 2,773 | |
Total Texas | | | | | | | 5,177,562 | |
| | | | | | | | | |
Michigan - 4.6% |
Detroit Wayne County Stadium Authority Revenue Bonds | | | | | | | | |
5.00% due 10/01/26 | | | 1,000,000 | | | | 1,090,650 | |
Detroit City School District General Obligation Unlimited | | | | | | | | |
5.00% due 05/01/32 | | | 500,000 | | | | 542,120 | |
5.00% due 05/01/30 | | | 300,000 | | | | 325,590 | |
Michigan State Housing Development Authority Revenue Bonds | | | | | | | | |
3.35% due 12/01/34 | | | 200,000 | | | | 212,254 | |
4.00% due 12/01/44 | | | 100,000 | | | | 108,216 | |
Michigan State Hospital Finance Authority Revenue Bonds | | | | | | | | |
5.00% due 11/15/47 | | | 200,000 | | | | 234,592 | |
City of Detroit Michigan Water Supply System Revenue Bonds | | | | | | | | |
5.00% due 07/01/41 | | | 200,000 | | | | 210,102 | |
Total Michigan | | | | | | | 2,723,524 | |
| | | | | | | | | |
Washington - 4.4% |
Greater Wenatchee Regional Events Center Public Facilities Dist Revenue Bonds | | | | | | | | |
5.00% due 09/01/27 | | | 500,000 | | | | 516,525 | |
5.25% due 09/01/32 | | | 500,000 | | | | 514,790 | |
King County School District No. 409 Tahoma General Obligation Unlimited | | | | | | | | |
5.00% due 12/01/27 | | | 325,000 | | | | 393,910 | |
Yakima & Kittitas Counties School District No. 119 Selah General Obligation Unlimited | | | | | | | | |
5.00% due 12/01/42 | | | 200,000 | | | | 243,002 | |
County of King Washington Sewer Revenue Bonds | | | | | | | | |
5.00% due 07/01/42 | | | 200,000 | | | | 241,824 | |
Washington State Convention Center Public Facilities District Revenue Bonds | | | | | | | | |
5.00% due 07/01/48 | | | 200,000 | | | | 240,498 | |
Central Puget Sound Regional Transit Authority Revenue Bonds | | | | | | | | |
5.00% due 11/01/41 | | | 200,000 | | | | 240,152 | |
State of Washington General Obligation Unlimited | | | | | | | | |
5.00% due 06/01/41 | | | 195,000 | | | | 205,427 | |
Total Washington | | | | | | | 2,596,128 | |
| | | | | | | | | |
New Jersey - 3.9% |
Hudson County Improvement Authority Revenue Bonds | | | | | | | | |
6.00% due 01/01/40 | | | 1,000,000 | | | | 1,011,310 | |
New Jersey Health Care Facilities Financing Authority Revenue Bonds | | | | | | | | |
5.00% due 07/01/41 | | | 300,000 | | | | 342,273 | |
5.00% due 07/01/36 | | | 200,000 | | | | 230,934 | |
New Jersey Turnpike Authority Revenue Bonds | | | | | | | | |
5.00% due 01/01/31 | | | 300,000 | | | | 375,294 | |
New Jersey Economic Development Authority Revenue Bonds | | | | | | | | |
5.00% due 06/01/28 | | | 250,000 | | | | 304,577 | |
Total New Jersey | | | | | | | 2,264,388 | |
| | | | | | | | | |
Colorado - 3.7% |
University of Colorado Revenue Bonds | | | | | | | | |
5.00% due 06/01/22 | | | 285,000 | | | | 312,584 | |
5.00% due 06/01/26 | | | 200,000 | | | | 246,512 | |
Auraria Higher Education Center Revenue Bonds | | | | | | | | |
5.00% due 04/01/28 | | | 390,000 | | | | 458,223 | |
Denver Health & Hospital Authority Revenue Bonds | | | | | | | | |
5.00% due 12/01/30 | | | 200,000 | | | | 251,634 | |
City & County of Denver Colorado Airport System Revenue Bonds | | | | | | | | |
5.00% due 12/01/28 | | | 200,000 | | | | 251,508 | |
Board of Governors of Colorado State University System Revenue Bonds | | | | | | | | |
5.00% due 03/01/41 | | | 200,000 | | | | 237,202 | |
City & County of Denver Colorado Revenue Bonds | | | | | | | | |
due 08/01/302 | | | 200,000 | | | | 150,294 | |
Colorado Educational & Cultural Facilities Authority Revenue Bonds | | | | | | | | |
5.00% due 03/01/47 | | | 110,000 | | | | 130,328 | |
Colorado School of Mines Revenue Bonds | | | | | | | | |
5.00% due 12/01/47 | | | 100,000 | | | | 119,759 | |
Total Colorado | | | | | | | 2,158,044 | |
| | | | | | | | | |
Illinois - 3.1% |
Will County Township High School District No. 204 Joliet General Obligation Ltd. | | | | | | | | |
6.25% due 01/01/31 | | | 500,000 | | | | 529,530 | |
City of Chicago Illinois Wastewater Transmission Revenue Bonds | | | | | | | | |
5.25% due 01/01/42 | | | 400,000 | | | | 473,536 | |
Chicago O’Hare International Airport Revenue Bonds | | | | | | | | |
5.00% due 01/01/34 | | | 300,000 | | | | 346,899 | |
72 | THE GUGGENHEIM FUNDS ANNUAL REPORT | SEE NOTES TO FINANCIAL STATEMENTS. |
SCHEDULE OF INVESTMENTS (continued) | September 30, 2019 |
MUNICIPAL INCOME FUND | |
| | Face
Amount | | | Value | |
Metropolitan Water Reclamation District of Greater Chicago General Obligation Unlimited | | | | | | | | |
5.00% due 12/01/25 | | $ | 200,000 | | | $ | 240,044 | |
University of Illinois Revenue Bonds | | | | | | | | |
6.00% due 10/01/29 | | | 200,000 | | | | 228,576 | |
Total Illinois | | | | | | | 1,818,585 | |
| | | | | | | | | |
Massachusetts - 2.8% |
Massachusetts Development Finance Agency Revenue Bonds | | | | | | | | |
6.88% due 01/01/21 | | | 1,000,000 | | | | 1,068,464 | |
5.00% due 07/01/29 | | | 200,000 | | | | 239,484 | |
5.70% due 10/01/19 | | | 150,000 | | | | 150,000 | |
5.00% due 07/01/36 | | | 100,000 | | | | 116,956 | |
5.60% due 10/01/19 | | | 50,000 | | | | 50,000 | |
Total Massachusetts | | | | | | | 1,624,904 | |
| | | | | | | | | |
Pennsylvania - 2.7% |
Pennsylvania Economic Development Financing Authority Revenue Bonds | | | | | | | | |
5.00% due 02/01/27 | | | 500,000 | | | | 583,750 | |
Reading School District General Obligation Unlimited | | | | | | | | |
5.00% due 02/01/27 | | | 300,000 | | | | 349,962 | |
Pittsburgh Water & Sewer Authority Revenue Bonds | | | | | | | | |
5.25% due 09/01/36 | | | 300,000 | | | | 342,111 | |
Allegheny County Hospital Development Authority Revenue Bonds | | | | | | | | |
5.00% due 07/15/32 | | | 100,000 | | | | 126,332 | |
5.00% due 11/01/29 | | | 50,000 | | | | 50,129 | |
Northeastern Pennsylvania Hospital & Education Authority Revenue Bonds | | | | | | | | |
5.00% due 05/01/20 | | | 100,000 | | | | 101,874 | |
Berks County Municipal Authority Revenue Bonds | | | | | | | | |
5.25% due 11/01/19 | | | 30,000 | | | | 30,093 | |
City of Erie Pennsylvania General Obligation Unlimited | | | | | | | | |
3.10% due 11/15/25 | | | 5,000 | | | | 5,260 | |
Ridley Park Hospital Authority Revenue Bonds | | | | | | | | |
6.13% due 12/01/20 | | | 5,000 | | | | 5,154 | |
Total Pennsylvania | | | | | | | 1,594,665 | |
| | | | | | | | | |
Louisiana - 2.3% |
Louisiana Local Government Environmental Facilities & Community Development Auth Revenue Bonds | | | | | | | | |
5.00% due 10/01/37 | | | 500,000 | | | | 582,975 | |
5.00% due 10/01/26 | | | 150,000 | | | | 182,685 | |
City of Shreveport Louisiana Water & Sewer Revenue Bonds | | | | | | | | |
5.00% due 12/01/35 | | | 250,000 | | | | 304,037 | |
Lafayette Parish School Board Revenue Bonds | | | | | | | | |
5.00% due 04/01/49 | | | 200,000 | | | | 245,092 | |
Louisiana Public Facilities Authority Revenue Bonds | | | | | | | | |
5.00% due 05/15/26 | | | 5,000 | | | | 6,085 | |
Total Louisiana | | | | | | | 1,320,874 | |
| | | | | | | | | |
Florida - 1.9% |
Miami Beach Redevelopment Agency Tax Allocation | | | | | | | | |
5.00% due 02/01/40 | | | 300,000 | | | | 341,460 | |
City of Jacksonville Florida Revenue Bonds | | | | | | | | |
5.00% due 10/01/29 | | | 300,000 | | | | 330,807 | |
County of Pasco Florida General Obligation Unlimited | | | | | | | | |
5.00% due 10/01/48 | | | 200,000 | | | | 247,152 | |
Greater Orlando Aviation Authority Revenue Bonds | | | | | | | | |
5.00% due 10/01/32 | | | 100,000 | | | | 125,818 | |
Orange County Health Facilities Authority Revenue Bonds | | | | | | | | |
5.13% due 10/01/19 | | | 55,000 | | | | 55,000 | |
Tampa Bay Water Revenue Bonds | | | | | | | | |
5.00% due 10/01/19 | | | 10,000 | | | | 10,000 | |
Total Florida | | | | | | | 1,110,237 | |
| | | | | | | | | |
North Carolina - 1.6% |
North Carolina Central University Revenue Bonds | | | | | | | | |
5.00% due 04/01/44 | | | 300,000 | | | | 368,472 | |
North Carolina Turnpike Authority Revenue Bonds | | | | | | | | |
5.00% due 01/01/27 | | | 300,000 | | | | 366,831 | |
County of New Hanover North Carolina Revenue Bonds | | | | | | | | |
5.00% due 10/01/22 | | | 150,000 | | | | 162,979 | |
4.25% due 10/01/19 | | | 30,000 | | | | 30,000 | |
North Carolina Eastern Municipal Power Agency Revenue Bonds | | | | | | | | |
4.50% due 01/01/22 | | | 10,000 | | | | 10,471 | |
Total North Carolina | | | | | | | 938,753 | |
| | | | | | | | | |
West Virginia - 1.5% |
West Virginia Higher Education Policy Commission Revenue Bonds | | | | | | | | |
5.00% due 04/01/29 | | | 500,000 | | | | 540,825 | |
West Virginia Hospital Finance Authority Revenue Bonds | | | | | | | | |
5.00% due 06/01/42 | | | 300,000 | | | | 352,851 | |
Total West Virginia | | | | | | | 893,676 | |
| | | | | | | | | |
District of Columbia - 1.5% |
District of Columbia General Obligation Unlimited | | | | | | | | |
5.00% due 06/01/41 | | | 285,000 | | | | 338,708 | |
5.00% due 06/01/32 | | | 275,000 | | | | 316,858 | |
5.00% due 06/01/31 | | | 175,000 | | | | 215,168 | |
Total District of Columbia | | | | | | | 870,734 | |
| | | | | | | | | |
SEE NOTES TO FINANCIAL STATEMENTS. | THE GUGGENHEIM FUNDS ANNUAL REPORT | 73 |
SCHEDULE OF INVESTMENTS (continued) | September 30, 2019 |
MUNICIPAL INCOME FUND | |
| | Face
Amount | | | Value | |
Mississippi - 1.3% |
Mississippi Development Bank Revenue Bonds | | | | | | | | |
6.50% due 10/01/31 | | $ | 500,000 | | | $ | 527,550 | |
6.25% due 10/01/26 | | | 230,000 | | | | 242,211 | |
Total Mississippi | | | | | | | 769,761 | |
| | | | | | | | | |
Ohio - 1.2% |
County of Miami Ohio Revenue Bonds | | | | | | | | |
5.00% due 08/01/33 | | | 200,000 | | | | 244,656 | |
American Municipal Power, Inc. Revenue Bonds | | | | | | | | |
5.00% due 02/15/41 | | | 200,000 | | | | 232,084 | |
Ohio Higher Educational Facility Commission Revenue Bonds | | | | | | | | |
5.00% due 10/01/19 | | | 230,000 | | | | 230,000 | |
Total Ohio | | | | | | | 706,740 | |
| | | | | | | | | |
Arizona - 1.2% |
Maricopa County Industrial Development Authority Revenue Bonds | | | | | | | | |
5.00% due 01/01/41 | | | 250,000 | | | | 300,115 | |
Salt Verde Financial Corp. Revenue Bonds | | | | | | | | |
5.00% due 12/01/32 | | | 200,000 | | | | 259,848 | |
Pinal County Elementary School District No. 4 Casa Grande General Obligation Unlimited | | | | | | | | |
5.00% due 07/01/37 | | | 100,000 | | | | 124,666 | |
Industrial Development Authority of the City of Phoenix Revenue Bonds | | | | | | | | |
7.25% due 11/01/195 | | | 10,000 | | | | 10,047 | |
Total Arizona | | | | | | | 694,676 | |
| | | | | | | | | |
Oklahoma - 1.2% |
Oklahoma Development Finance Authority Revenue Bonds | | | | | | | | |
5.00% due 08/15/28 | | | 350,000 | | | | 433,059 | |
Oklahoma City Airport Trust Revenue Bonds | | | | | | | | |
5.00% due 07/01/30 | | | 200,000 | | | | 247,708 | |
Total Oklahoma | | | | | | | 680,767 | |
| | | | | | | | | |
Arkansas - 1.1% |
County of Baxter Arkansas Revenue Bonds | | | | | | | | |
5.00% due 09/01/26 | | | 330,000 | | | | 384,496 | |
University of Arkansas Revenue Bonds | | | | | | | | |
5.00% due 11/01/47 | | | 200,000 | | | | 242,126 | |
Total Arkansas | | | | | | | 626,622 | |
| | | | | | | | | |
South Carolina - 1.0% |
Anderson County School District No. 5 General Obligation Unlimited | | | | | | | | |
5.00% due 03/01/27 | | | 300,000 | | | | 366,951 | |
Charleston County Airport District Revenue Bonds | | | | | | | | |
5.00% due 07/01/43 | | | 200,000 | | | | 248,146 | |
Total South Carolina | | | | | | | 615,097 | |
| | | | | | | | | |
Puerto Rico - 1.0% |
Puerto Rico Highway & Transportation Authority Revenue Bonds | | | | | | | | |
5.25% due 07/01/41 | | | 250,000 | | | | 280,360 | |
Puerto Rico Public Buildings Authority Revenue Bonds | | | | | | | | |
6.00% due 07/01/23 | | | 250,000 | | | | 271,390 | |
Commonwealth of Puerto Rico General Obligation Unlimited | | | | | | | | |
5.25% due 07/01/24 | | | 45,000 | | | | 47,378 | |
Total Puerto Rico | | | | | | | 599,128 | |
| | | | | | | | | |
Alaska - 0.9% |
University of Alaska Revenue Bonds | | | | | | | | |
5.00% due 10/01/40 | | | 260,000 | | | | 297,937 | |
CIVICVentures Revenue Bonds | | | | | | | | |
5.00% due 09/01/27 | | | 200,000 | | | | 234,784 | |
Total Alaska | | | | | | | 532,721 | |
| | | | | | | | | |
Virginia - 0.8% |
Virginia College Building Authority Revenue Bonds | | | | | | | | |
5.00% due 02/01/25 | | | 250,000 | | | | 298,195 | |
Loudoun County Economic Development Authority Revenue Bonds | | | | | | | | |
due 07/01/492 | | | 500,000 | | | | 192,760 | |
Total Virginia | | | | | | | 490,955 | |
| | | | | | | | | |
Nebraska - 0.8% |
Central Plains Energy Project Revenue Bonds | | | | | | | | |
5.00% due 09/01/29 | | | 200,000 | | | | 248,024 | |
Nebraska Investment Finance Authority Revenue Bonds | | | | | | | | |
3.40% due 09/01/39 | | | 200,000 | | | | 209,936 | |
Total Nebraska | | | | | | | 457,960 | |
| | | | | | | | | |
Nevada - 0.8% |
Las Vegas Valley Water District General Obligation Ltd. | | | | | | | | |
5.00% due 06/01/27 | | | 230,000 | | | | 275,390 | |
Las Vegas Convention & Visitors Authority Revenue Bonds | | | | | | | | |
5.00% due 07/01/43 | | | 150,000 | | | | 180,507 | |
Total Nevada | | | | | | | 455,897 | |
| | | | | | | | | |
Kentucky - 0.7% |
Kentucky Economic Development Finance Authority Revenue Bonds | | | | | | | | |
5.00% due 07/01/37 | | | 200,000 | | | | 226,088 | |
City of Ashland Kentucky Revenue Bonds | | | | | | | | |
5.00% due 02/01/22 | | | 200,000 | | | | 202,020 | |
Total Kentucky | | | | | | | 428,108 | |
| | | | | | | | | |
Georgia - 0.5% |
Savannah Economic Development Authority Revenue Bonds | | | | | | | | |
5.00% due 12/01/28 | | | 200,000 | | | | 238,358 | |
74 | THE GUGGENHEIM FUNDS ANNUAL REPORT | SEE NOTES TO FINANCIAL STATEMENTS. |
SCHEDULE OF INVESTMENTS (continued) | September 30, 2019 |
MUNICIPAL INCOME FUND | |
| | Face
Amount | | | Value | |
Fulton County Development Authority Revenue Bonds | | | | | | | | |
5.00% due 11/01/19 | | $ | 50,000 | | | $ | 50,151 | |
Thomasville Hospital Authority Revenue Bonds | | | | | | | | |
5.25% due 11/02/20 | | | 25,000 | | | | 26,056 | |
Total Georgia | | | | | | | 314,565 | |
| | | | | | | | | |
Delaware - 0.5% |
Delaware State Health Facilities Authority Revenue Bonds | | | | | | | | |
5.00% due 06/01/28 | | | 200,000 | | | | 243,906 | |
University of Delaware Revenue Bonds | | | | | | | | |
4.00% due 11/01/19 | | | 35,000 | | | | 35,076 | |
Total Delaware | | | | | | | 278,982 | |
| | | | | | | | | |
Vermont - 0.4% |
Vermont Educational & Health Buildings Financing Agency Revenue Bonds | | | | | | | | |
5.00% due 12/01/46 | | | 200,000 | | | | 232,336 | |
| | | | | | | | | |
North Dakota - 0.4% |
City of Grand Forks North Dakota Revenue Bonds | | | | | | | | |
5.00% due 12/01/24 | | | 200,000 | | | | 230,620 | |
| | | | | | | | | |
South Dakota - 0.3% |
South Dakota Board of Regents Revenue Bonds | | | | | | | | |
5.00% due 04/01/34 | | | 150,000 | | | | 183,113 | |
| | | | | | | | | |
Indiana - 0.3% |
Indiana Finance Authority Revenue Bonds | | | | | | | | |
5.00% due 10/01/41 | | | 100,000 | | | | 118,505 | |
5.25% due 11/01/19 | | | 50,000 | | | | 50,156 | |
Total Indiana | | | | | | | 168,661 | |
| | | | | | | | | |
Idaho - 0.2% |
Idaho Housing & Finance Association Revenue Bonds | | | | | | | | |
5.00% due 07/15/30 | | | 100,000 | | | | 129,065 | |
| | | | | | | | | |
Rhode Island - 0.2% |
Rhode Island Health & Educational Building Corp. Revenue Bonds | | | | | | | | |
5.00% due 05/15/42 | | | 100,000 | | | | 122,482 | |
| | | | | | | | | |
Oregon - 0.2% |
University of Oregon Revenue Bonds | | | | | | | | |
5.00% due 04/01/48 | | | 100,000 | | | | 121,651 | |
| | | | | | | | | |
Utah - 0.2% |
South Davis Metro Fire Service Area Revenue Bonds | | | | | | | | |
5.00% due 12/01/34 | | | 100,000 | | | | 121,593 | |
| | | | | | | | | |
Montana - 0.2% |
Montana State Board of Regents Revenue Bonds | | | | | | | | |
5.00% due 11/15/43 | | | 100,000 | | | | 121,588 | |
| | | | | | | | | |
Kansas - 0.2% |
University of Kansas Hospital Authority Revenue Bonds | | | | | | | | |
5.00% due 09/01/48 | | | 100,000 | | | | 121,227 | |
| | | | | | | | | |
Iowa - 0.2% |
PEFA, Inc. Revenue Bonds | | | | | | | | |
5.00% (VRDN) due 09/01/494 | | | 100,000 | | | | 118,240 | |
| | | | | | | | | |
New Hampshire - 0.1% |
New Hampshire Health and Education Facilities Authority Act Revenue Bonds | | | | | | | | |
6.25% due 10/01/19 | | | 50,000 | | | | 50,000 | |
| | | | | | | | | |
New Mexico - 0.1% |
City of Albuquerque New Mexico Revenue Bonds | | | | | | | | |
5.00% due 07/01/25 | | | 30,000 | | | | 34,238 | |
| | | | | | | | | |
Maryland - 0.0% |
Maryland Health & Higher Educational Facilities Authority Revenue Bonds | | | | | | | | |
5.00% due 07/01/27 | | | 5,000 | | | | 5,825 | |
| | | | | | | | | |
Guam - 0.0% |
Guam Power Authority Revenue Bonds | | | | | | | | |
5.50% due 10/01/20 | | | 5,000 | | | | 5,210 | |
Total Municipal Bonds | | | | | | | | |
(Cost $53,939,148) | | | | | | | 56,509,627 | |
| | | | | | | | | |
Total Investments - 99.4% | | | | | | | | |
(Cost $55,764,441) | | | | | | $ | 58,344,830 | |
Other Assets & Liabilities, net - 0.6% | | | | | | | 325,401 | |
Total Net Assets - 100.0% | | | | | | $ | 58,670,231 | |
SEE NOTES TO FINANCIAL STATEMENTS. | THE GUGGENHEIM FUNDS ANNUAL REPORT | 75 |
SCHEDULE OF INVESTMENTS (concluded) | September 30, 2019 |
MUNICIPAL INCOME FUND | |
† | Value determined based on Level 1 inputs — See Note 4. |
†† | Value determined based on Level 2 inputs — See Note 4. |
1 | Rate indicated is the 7-day yield as of September 30, 2019. |
2 | Zero coupon rate security. |
3 | Security is a step up/down bond. The coupon increases or decreases at regular intervals until the bond reaches full maturity. Rate indicated is the rate at September 30, 2019. See table below for additional step information for each security. |
4 | The rate is adjusted periodically by the counterparty, allows the holder to tender the security upon a rate reset, and is not based upon a set reference rate and spread. Rate indicated is the rate effective at September 30, 2019. |
5 | Security is a 144A or Section 4(a)(2) security. These securities have been determined to be liquid under guidelines established by the Board of Trustees. The total market value of 144A or Section 4(a)(2) securities is $251,413 (cost $225,184), or 0.4% of total net assets. |
6 | Security has no current coupon. However, a coupon rate will come into effect at a future rate reset date. |
| | VRDN — Variable Rate Demand Note |
| | |
| | See Sector Classification in Other Information section. |
The following table summarizes the inputs used to value the Fund’s investments at September 30, 2019 (See Note 4 in the Notes to Financial Statements):
Investments in Securities (Assets) | | Level 1
Quoted
Prices | | | Level 2
Significant
Observable
Inputs | | | Level 3
Significant
Unobservable
Inputs | | | Total | |
Closed-End Funds | | $ | 1,801,048 | | | $ | — | | | $ | — | | | $ | 1,801,048 | |
Money Market Fund | | | 34,155 | | | | — | | | | — | | | | 34,155 | |
Municipal Bonds | | | — | | | | 56,509,627 | | | | — | | | | 56,509,627 | |
Total Assets | | $ | 1,835,203 | | | $ | 56,509,627 | | | $ | — | | | $ | 58,344,830 | |
Step Coupon Bonds
The following table discloses additional information related to step coupon bonds held by the Fund. Certain securities are subject to multiple rate changes prior to maturity. For those securities a range of rates and corresponding dates have been provided. Rates for all step coupon bonds held by the Fund are scheduled to increase, none are scheduled to decrease.
Name | | Coupon Rate at Next
Reset Date | | | Next Rate
Reset Date | | | Future Reset Rate(s) | | | Future Reset Date(s) | |
College of the Sequoias Tulare Area Improvement District No. 3 General Obligation Unlimited, due 08/01/42 | | | 6.85 | % | | | 08/01/32 | | | | — | | — |
Riverside County Redevelopment Successor Agency Tax Allocation, due 10/01/37 | | | 5.00 | % | | | 10/01/21 | | | | — | | — |
76 | THE GUGGENHEIM FUNDS ANNUAL REPORT | SEE NOTES TO FINANCIAL STATEMENTS. |
STATEMENT OF ASSETS AND LIABILITIES |
September 30, 2019 |
Assets: |
Investments, at value (cost $55,764,441) | | $ | 58,344,830 | |
Cash | | | 2,461 | |
Prepaid expenses | | | 34,677 | |
Receivables: |
Interest | | | 578,439 | |
Fund shares sold | | | 28,396 | |
Investment Adviser | | | 13,398 | |
Dividends | | | 2,808 | |
Total assets | | | 59,005,009 | |
| | | | | |
Liabilities: |
Payable for: |
Securities purchased | | | 180,761 | |
Fund shares redeemed | | | 52,968 | |
Pricing fees | | | 26,379 | |
Professional fees | | | 24,652 | |
Distributions to shareholders | | | 13,798 | |
Distribution and service fees | | | 9,725 | |
Transfer agent/maintenance fees | | | 8,331 | |
Fund accounting/administration fees | | | 3,651 | |
Trustees’ fees* | | | 3,242 | |
Miscellaneous | | | 11,271 | |
Total liabilities | | | 334,778 | |
Net assets | | $ | 58,670,231 | |
| | | | | |
Net assets consist of: |
Paid in capital | | $ | 56,218,852 | |
Total distributable earnings (loss) | | | 2,451,379 | |
Net assets | | $ | 58,670,231 | |
| | | | | |
A-Class: |
Net assets | | $ | 42,512,422 | |
Capital shares outstanding | | | 3,239,210 | |
Net asset value per share | | $ | 13.12 | |
Maximum offering price per share (Net asset value divided by 96.00%) | | $ | 13.67 | |
| | | | | |
C-Class: |
Net assets | | $ | 1,981,189 | |
Capital shares outstanding | | | 151,070 | |
Net asset value per share | | $ | 13.11 | |
| | | | | |
P-Class: |
Net assets | | $ | 206,791 | |
Capital shares outstanding | | | 15,754 | |
Net asset value per share | | $ | 13.13 | |
| | | | | |
Institutional Class: |
Net assets | | $ | 13,969,829 | |
Capital shares outstanding | | | 1,064,333 | |
Net asset value per share | | $ | 13.13 | |
STATEMENT OF OPERATIONS |
Year Ended September 30, 2019 |
Investment Income: |
Dividends | | $ | 13,546 | |
Interest | | | 1,308,168 | |
Total investment income | | | 1,321,714 | |
| | | | | |
Expenses: |
Management fees | | | 211,184 | |
Distribution and service fees: |
A-Class | | | 71,984 | |
C-Class | | | 20,511 | |
P-Class | | | 283 | |
Transfer agent/maintenance fees: |
A-Class | | | 34,175 | |
C-Class | | | 2,953 | |
P-Class | | | 378 | |
Institutional Class | | | 12,173 | |
Registration fees | | | 59,679 | |
Fund accounting/administration fees | | | 33,790 | |
Professional fees | | | 33,431 | |
Trustees’ fees* | | | 20,321 | |
Custodian fees | | | 2,869 | |
Line of credit fees | | | 2,800 | |
Miscellaneous | | | 46,385 | |
Recoupment of previously waived fees: |
A-Class | | | 100 | |
Total expenses | | | 553,016 | |
Less: |
Expenses reimbursed by Adviser: |
A Class | | | (53,715 | ) |
C Class | | | (4,238 | ) |
P Class | | | (458 | ) |
Institutional Class | | | (19,281 | ) |
Expenses waived by Adviser | | | (147,443 | ) |
Total waived/reimbursed expenses | | | (225,135 | ) |
Net expenses | | | 327,881 | |
Net investment income | | | 993,833 | |
| | | | | |
Net Realized and Unrealized Gain (Loss): |
Net realized gain (loss) on: |
Investments | | | (42,831 | ) |
Net realized loss | | | (42,831 | ) |
Net change in unrealized appreciation (depreciation) on: |
Investments | | | 2,182,973 | |
Net change in unrealized appreciation (depreciation) | | | 2,182,973 | |
Net realized and unrealized gain | | | 2,140,142 | |
Net increase in net assets resulting from operations | | $ | 3,133,975 | |
* | Relates to Trustees not deemed “interested persons” within the meaning of Section 2(a)(19) of the 1940 Act. |
SEE NOTES TO FINANCIAL STATEMENTS. | THE GUGGENHEIM FUNDS ANNUAL REPORT | 77 |
STATEMENTS OF CHANGES IN NET ASSETS |
| | Year Ended
September 30,
2019 | | | Year Ended
September 30,
2018 | |
Increase (Decrease) in Net Assets from Operations: | | | | | | | | |
Net investment income | | $ | 993,833 | | | $ | 1,068,778 | |
Net realized gain (loss) on investments | | | (42,831 | ) | | | 134,287 | |
Net change in unrealized appreciation (depreciation) on investments | | | 2,182,973 | | | | (999,817 | ) |
Net increase in net assets resulting from operations | | | 3,133,975 | | | | 203,248 | |
| | | | | | | | | |
Distributions to shareholders: | | | | | | | | |
A-Class | | | (736,110 | ) | | | (687,912 | ) |
C-Class | | | (39,446 | ) | | | (49,583 | ) |
P-Class | | | (2,756 | ) | | | (1,608 | ) |
Institutional Class | | | (318,435 | ) | | | (329,776 | ) |
Total distributions to shareholders | | | (1,096,747 | ) | | | (1,068,879 | ) |
| | | | | | | | | |
Capital share transactions: | | | | | | | | |
Proceeds from sale of shares | | | | | | | | |
A-Class | | | 26,456,149 | | | | 1,774,909 | |
C-Class | | | 548,605 | | | | 208,755 | |
P-Class | | | 164,344 | | | | 9,947 | |
Institutional Class | | | 5,941,830 | | | | 3,898,644 | |
Distributions reinvested | | | | | | | | |
A-Class | | | 506,049 | | | | 437,195 | |
C-Class | | | 31,368 | | | | 34,842 | |
P-Class | | | 2,756 | | | | 1,602 | |
Institutional Class | | | 305,395 | | | | 269,005 | |
Cost of shares redeemed | | | | | | | | |
A-Class | | | (11,365,476 | ) | | | (9,596,304 | ) |
C-Class | | | (1,103,845 | ) | | | (1,549,487 | ) |
P-Class | | | (3,449 | ) | | | (83,607 | ) |
Institutional Class | | | (1,928,600 | ) | | | (10,769,834 | ) |
Net increase (decrease) from capital share transactions | | | 19,555,126 | | | | (15,364,333 | ) |
Net increase (decrease) in net assets | | | 21,592,354 | | | | (16,229,964 | ) |
| | | | | | | | | |
Net assets: | | | | | | | | |
Beginning of year | | | 37,077,877 | | | | 53,307,841 | |
End of year | | $ | 58,670,231 | | | $ | 37,077,877 | |
| | | | | | | | | |
Capital share activity: | | | | | | | | |
Shares sold | | | | | | | | |
A-Class | | | 2,038,962 | | | | 140,305 | |
C-Class | | | 42,762 | | | | 16,475 | |
P-Class | | | 12,827 | | | | 788 | |
Institutional Class | | | 464,446 | | | | 308,805 | |
Shares issued from reinvestment of distributions | | | | | | | | |
A-Class | | | 39,477 | | | | 34,710 | |
C-Class | | | 2,466 | | | | 2,768 | |
P-Class | | | 214 | | | | 127 | |
Institutional Class | | | 23,869 | | | | 21,353 | |
Shares redeemed | | | | | | | | |
A-Class | | | (891,195 | ) | | | (761,249 | ) |
C-Class | | | (87,169 | ) | | | (123,092 | ) |
P-Class | | | (264 | ) | | | (6,672 | ) |
Institutional Class | | | (151,514 | ) | | | (855,029 | ) |
Net increase (decrease) in shares | | | 1,494,881 | | | | (1,220,711 | ) |
78 | THE GUGGENHEIM FUNDS ANNUAL REPORT | SEE NOTES TO FINANCIAL STATEMENTS. |
This table is presented to show selected data for a share outstanding throughout each period and to assist shareholders in evaluating a Fund’s performance for the periods presented.
A-Class | | Year Ended
September 30,
2019 | | | Year Ended
September 30,
2018 | | | Year Ended
September 30,
2017 | | | Year Ended
September 30,
2016 | | | Year Ended
September 30,
2015 | |
Per Share Data | | | | | | | | | | | | | | | | | | | | |
Net asset value, beginning of period | | $ | 12.46 | | | $ | 12.70 | | | $ | 12.86 | | | $ | 12.52 | | | $ | 12.51 | |
Income (loss) from investment operations: |
Net investment income (loss)a | | | .30 | | | | .30 | | | | .27 | | | | .26 | | | | .29 | |
Net gain (loss) on investments (realized and unrealized) | | | .70 | | | | (.24 | ) | | | (.15 | ) | | | .34 | | | | .01 | |
Total from investment operations | | | 1.00 | | | | .06 | | | | .12 | | | | .60 | | | | .30 | |
Less distributions from: |
Net investment income | | | (.30 | ) | | | (.30 | ) | | | (.28 | ) | | | (.26 | ) | | | (.29 | ) |
Net realized gains | | | (.04 | ) | | | — | | | | — | | | | — | | | | — | |
Total distributions | | | (.34 | ) | | | (.30 | ) | | | (.28 | ) | | | (.26 | ) | | | (.29 | ) |
Net asset value, end of period | | $ | 13.12 | | | $ | 12.46 | | | $ | 12.70 | | | $ | 12.86 | | | $ | 12.52 | |
|
Total Returnb | | | 8.13 | % | | | 0.44 | % | | | 0.94 | % | | | 4.85 | % | | | 2.39 | % |
Ratios/Supplemental Data |
Net assets, end of period (in thousands) | | $ | 42,512 | | | $ | 25,570 | | | $ | 33,515 | | | $ | 41,283 | | | $ | 49,086 | |
Ratios to average net assets: |
Net investment income (loss) | | | 2.31 | % | | | 2.35 | % | | | 2.19 | % | | | 2.06 | % | | | 2.28 | % |
Total expensesc | | | 1.34 | % | | | 1.30 | % | | | 1.20 | % | | | 1.18 | % | | | 1.17 | % |
Net expensesd,e,g | | | 0.81 | % | | | 0.80 | % | | | 0.82 | % | | | 0.81 | % | | | 0.81 | % |
Portfolio turnover rate | | | 30 | % | | | 13 | % | | | 31 | % | | | 61 | % | | | 80 | % |
C-Class | | Year Ended
September 30,
2019 | | | Year Ended
September 30,
2018 | | | Year Ended
September 30,
2017 | | | Year Ended
September 30,
2016 | | | Year Ended
September 30,
2015 | |
Per Share Data | | | | | | | | | | | | | | | | | | | | |
Net asset value, beginning of period | | $ | 12.45 | | | $ | 12.69 | | | $ | 12.86 | | | $ | 12.52 | | | $ | 12.50 | |
Income (loss) from investment operations: |
Net investment income (loss)a | | | .21 | | | | .20 | | | | .18 | | | | .16 | | | | .19 | |
Net gain (loss) on investments (realized and unrealized) | | | .69 | | | | (.24 | ) | | | (.17 | ) | | | .35 | | | | .02 | |
Total from investment operations | | | .90 | | | | (.04 | ) | | | .01 | | | | .51 | | | | .21 | |
Less distributions from: |
Net investment income | | | (.20 | ) | | | (.20 | ) | | | (.18 | ) | | | (.17 | ) | | | (.19 | ) |
Net realized gains | | | (.04 | ) | | | — | | | | — | | | | — | | | | — | |
Total distributions | | | (.24 | ) | | | (.20 | ) | | | (.18 | ) | | | (.17 | ) | | | (.19 | ) |
Net asset value, end of period | | $ | 13.11 | | | $ | 12.45 | | | $ | 12.69 | | | $ | 12.86 | | | $ | 12.52 | |
|
Total Returnb | | | 7.33 | % | | | (0.30 | %) | | | 0.12 | % | | | 4.06 | % | | | 1.71 | % |
Ratios/Supplemental Data |
Net assets, end of period (in thousands) | | $ | 1,981 | | | $ | 2,403 | | | $ | 3,768 | | | $ | 5,008 | | | $ | 2,472 | |
Ratios to average net assets: |
Net investment income (loss) | | | 1.63 | % | | | 1.60 | % | | | 1.44 | % | | | 1.26 | % | | | 1.54 | % |
Total expensesc | | | 2.12 | % | | | 2.11 | % | | | 1.92 | % | | | 1.89 | % | | | 1.87 | % |
Net expensesd,e,g | | | 1.56 | % | | | 1.55 | % | | | 1.57 | % | | | 1.56 | % | | | 1.56 | % |
Portfolio turnover rate | | | 30 | % | | | 13 | % | | | 31 | % | | | 61 | % | | | 80 | % |
SEE NOTES TO FINANCIAL STATEMENTS. | THE GUGGENHEIM FUNDS ANNUAL REPORT | 79 |
FINANCIAL HIGHLIGHTS (continued) |
This table is presented to show selected data for a share outstanding throughout each period and to assist shareholders in evaluating a Fund’s performance for the periods presented.
P-Class | | Year Ended
September 30,
2019 | | | Year Ended
September 30,
2018 | | | Year Ended
September 30,
2017 | | | Year Ended
September 30,
2016 | | | Period Ended
September 30,
2015f | |
Per Share Data | | | | | | | | | | | | | | | | | | | | |
Net asset value, beginning of period | | $ | 12.46 | | | $ | 12.70 | | | $ | 12.86 | | | $ | 12.52 | | | $ | 12.64 | |
Income (loss) from investment operations: |
Net investment income (loss)a | | | .29 | | | | .29 | | | | .25 | | | | .26 | | | | .13 | |
Net gain (loss) on investments (realized and unrealized) | | | .72 | | | | (.23 | ) | | | (.14 | ) | | | .34 | | | | (.12 | ) |
Total from investment operations | | | 1.01 | | | | .06 | | | | .11 | | | | .60 | | | | .01 | |
Less distributions from: |
Net investment income | | | (.30 | ) | | | (.30 | ) | | | (.27 | ) | | | (.26 | ) | | | (.13 | ) |
Net realized gains | | | (.04 | ) | | | — | | | | — | | | | — | | | | — | |
Total distributions | | | (.34 | ) | | | (.30 | ) | | | (.27 | ) | | | (.26 | ) | | | (.13 | ) |
Net asset value, end of period | | $ | 13.13 | | | $ | 12.46 | | | $ | 12.70 | | | $ | 12.86 | | | $ | 12.52 | |
|
Total Return | | | 8.20 | % | | | 0.44 | % | | | 0.89 | % | | | 4.86 | % | | | 0.06 | % |
Ratios/Supplemental Data |
Net assets, end of period (in thousands) | | $ | 207 | | | $ | 37 | | | $ | 111 | | | $ | 84 | | | $ | 10 | |
Ratios to average net assets: |
Net investment income (loss) | | | 2.25 | % | | | 2.32 | % | | | 2.01 | % | | | 2.00 | % | | | 2.46 | % |
Total expensesc | | | 1.55 | % | | | 1.72 | % | | | 1.27 | % | | | 1.21 | % | | | 3.17 | % |
Net expensesd,e,g | | | 0.81 | % | | | 0.80 | % | | | 0.82 | % | | | 0.79 | % | | | 0.81 | % |
Portfolio turnover rate | | | 30 | % | | | 13 | % | | | 31 | % | | | 61 | % | | | 80 | % |
80 | THE GUGGENHEIM FUNDS ANNUAL REPORT | SEE NOTES TO FINANCIAL STATEMENTS. |
FINANCIAL HIGHLIGHTS (concluded) |
This table is presented to show selected data for a share outstanding throughout each period and to assist shareholders in evaluating a Fund’s performance for the periods presented.
Institutional Class | | Year Ended
September 30,
2019 | | | Year Ended
September 30,
2018 | | | Year Ended
September 30,
2017 | | | Year Ended
September 30,
2016 | | | Year Ended
September 30,
2015 | |
Per Share Data | | | | | | | | | | | | | | | | | | | | |
Net asset value, beginning of period | | $ | 12.46 | | | $ | 12.71 | | | $ | 12.87 | | | $ | 12.53 | | | $ | 12.51 | |
Income (loss) from investment operations: |
Net investment income (loss)a | | | .33 | | | | .33 | | | | .30 | | | | .29 | | | | .32 | |
Net gain (loss) on investments (realized and unrealized) | | | .71 | | | | (.25 | ) | | | (.15 | ) | | | .34 | | | | .02 | |
Total from investment operations | | | 1.04 | | | | .08 | | | | .15 | | | | .63 | | | | .34 | |
Less distributions from: |
Net investment income | | | (.33 | ) | | | (.33 | ) | | | (.31 | ) | | | (.29 | ) | | | (.32 | ) |
Net realized gains | | | (.04 | ) | | | — | | | | — | | | | — | | | | — | |
Total distributions | | | (.37 | ) | | | (.33 | ) | | | (.31 | ) | | | (.29 | ) | | | (.32 | ) |
Net asset value, end of period | | $ | 13.13 | | | $ | 12.46 | | | $ | 12.71 | | | $ | 12.87 | | | $ | 12.53 | |
|
Total Return | | | 8.48 | % | | | 0.61 | % | | | 1.19 | % | | | 5.11 | % | | | 2.73 | % |
Ratios/Supplemental Data |
Net assets, end of period (in thousands) | | $ | 13,970 | | | $ | 9,067 | | | $ | 15,914 | | | $ | 24,126 | | | $ | 8,564 | |
Ratios to average net assets: |
Net investment income (loss) | | | 2.59 | % | | | 2.59 | % | | | 2.43 | % | | | 2.24 | % | | | 2.53 | % |
Total expensesc | | | 1.08 | % | | | 1.09 | % | | | 0.88 | % | | | 0.84 | % | | | 0.89 | % |
Net expensesd,e,g | | | 0.56 | % | | | 0.55 | % | | | 0.57 | % | | | 0.56 | % | | | 0.56 | % |
Portfolio turnover rate | | | 30 | % | | | 13 | % | | | 31 | % | | | 61 | % | | | 80 | % |
a | Net investment income (loss) per share was computed using average shares outstanding throughout the period. |
b | Total return does not reflect the impact of any applicable sales charges. |
c | Does not include expenses of the underlying funds in which the Fund invests. |
d | Net expense information reflects the expense ratios after expense waivers and reimbursements, as applicable. |
e | The portion of the ratios of the ratios of net expenses to average net assets attributable to recoupments of prior fee reductions or expense reimbursements for the years presented was as follows: |
| | | 09/30/19 | 09/30/18 | 09/30/17 |
| | A-Class | 0.00%* | — | — |
| | C-Class | — | — | — |
| | P-Class | — | — | 0.04% |
| | Institutional Class | — | — | — |
f | Since commencement of operations: May 1, 2015. Percentage amounts for the period, except total return and portfolio turnover rate, have been annualized. |
g | Net expenses may include expenses that are excluded from the expense limitation agreement. Excluding these expenses, the net expense ratios for the periods would be : |
| | | 09/30/19 | 09/30/18 | 09/30/17 | 09/30/16 | 09/30/15 |
| | A-Class | 0.80% | 0.80% | 0.80% | 0.80% | 0.80% |
| | C-Class | 1.55% | 1.55% | 1.55% | 1.55% | 1.55% |
| | P-Class | 0.80% | 0.80% | 0.80% | 0.78% | 0.81% |
| | Institutional Class | 0.55% | 0.55% | 0.55% | 0.55% | 0.55% |
SEE NOTES TO FINANCIAL STATEMENTS. | THE GUGGENHEIM FUNDS ANNUAL REPORT | 81 |
NOTES TO FINANCIAL STATEMENTS |
Note 1 – Organization and Significant Accounting Policies
Organization
Guggenheim Funds Trust (the “Trust”), a Delaware statutory trust, is registered with the SEC under the Investment Company Act of 1940 (“1940 Act”), as an open-ended investment company of the series type. Each series, in effect, is representing a separate Fund. The Trust is authorized to issue an unlimited number of shares. The Trust accounts for the assets of each fund separately.
The Trust offers a combination of five separate classes of shares: A-Class shares, C-Class shares, P-Class shares, R6-Class shares and Institutional Class shares. Sales of shares of each Class are made without a front-end sales charge at the net asset value per share (“NAV”), with the exception of A-Class shares. A-Class shares are sold at the NAV, plus the applicable front-end sales charge. The sales charge varies depending on the amount purchased. A-Class share purchases of $1 million or more are exempt from the front-end sales charge but have a 1% contingent deferred sales charge (“CDSC”), if shares are redeemed within 12 months of purchase. C-Class shares have a 1% CDSC if shares are redeemed within 12 months of purchase. C-Class shares of each Fund automatically convert to A-Class shares of the same Fund on or about the 10th day of the month following the 10-year anniversary of the purchase of the C-Class shares. This conversion will be executed without any sales charge, fee or other charge. After the conversion is completed, the shares will be subject to all features and expenses of A-Class shares. Institutional Class shares are offered primarily for direct investment by institutions such as pension and profit sharing plans, endowments, foundations and corporations. Institutional Class shares require a minimum initial investment of $2 million and a minimum account balance of $1 million. The High Yield Fund offers R6-Class shares. R6-Class shares are offered primarily through qualified retirement and benefit plans. R6-Class shares are also offered through certain other plans and platforms sponsored by financial intermediaries. Certain institutional investors and others deemed appropriate by Guggenheim Investments (“GI”) may also be eligible to purchase R6-Class shares, subject to a $2 million minimum initial investment. At September 30, 2019, the Trust consisted of twenty funds (the “Funds”).
As of January 1, 2012, A-Class, C-Class and Institutional Class shares of High Yield Fund are subject to a 2% redemption fee when shares are redeemed or exchanged within 90 days of purchase.
This report covers the following Funds:
Fund Name | Investment
Company Type |
Diversified Income Fund | Diversified |
High Yield Fund | Diversified |
Investment Grade Bond Fund | Diversified |
Municipal Income Fund | Diversified |
Security Investors, LLC and Guggenheim Partners Investment Management, LLC (“GPIM”), which operate under the name Guggenheim Investments, provide advisory services. Guggenheim Funds Distributors, LLC (“GFD”) acts as principal underwriter for the Trust. GI and GFD are affiliated entities.
GPIM, an affiliate of GI, serves as investment sub-advisor (the “Sub-Advisor”) to the Municipal Income Fund and is responsible for the day-to-day management of the Fund’s portfolio.
Significant Accounting Policies
The Funds operate as investment companies and, accordingly, follow the investment company accounting and reporting guidance of the Financial Accounting Standards Board (“FASB”) Accounting Standards Codification Topic 946 Financial Services – Investment Companies.
The following significant accounting policies are in conformity with U.S. generally accepted accounting principles (“U.S. GAAP”) and are consistently followed by the Trust. This requires management to make estimates and assumptions that affect the reported amount of assets and liabilities, contingent assets and liabilities at the date of the financial statements, and the reported amounts of revenues and expenses during the reporting period. Actual results could differ from these estimates. All time references are based on Eastern Time.
The NAV of each Class of a fund is calculated by dividing the market value of a fund’s securities and other assets, less all liabilities, attributable to the Class by the number of outstanding shares of the Class.
(a) Valuation of Investments
The Board of Trustees of the Funds (the “Board”) has adopted policies and procedures for the valuation of the Funds’ investments (the “Valuation Procedures”). Pursuant to the Valuation Procedures, the Board has delegated to a valuation committee, consisting of representatives from Guggenheim’s investment management, fund administration, legal and compliance departments (the “Valuation Committee”), the day-to-day responsibility for implementing the Valuation Procedures,
82 | THE GUGGENHEIM FUNDS ANNUAL REPORT | |
NOTES TO FINANCIAL STATEMENTS (continued) |
including, under most circumstances, the responsibility for determining the fair value of the Funds’ securities and/or other assets.
Valuations of the Funds’ securities are supplied primarily by pricing services appointed pursuant to the processes set forth in the Valuation Procedures. The Valuation Committee convenes monthly, or more frequently as needed, to review the valuation of all assets which have been fair valued for reasonableness. The Funds’ officers, through the Valuation Committee and consistent with the monitoring and review responsibilities set forth in the Valuation Procedures, regularly review procedures used and valuations provided by the pricing services.
If the pricing service cannot or does not provide a valuation for a particular investment or such valuation is deemed unreliable, such investment is fair valued by the Valuation Committee.
Equity securities listed or traded on a recognized U.S. securities exchange or the National Association of Securities Dealers Automated Quotations (“NASDAQ”) National Market System shall generally be valued on the basis of the last sale price on the primary U.S. exchange or market on which the security is listed or traded; provided, however, that securities listed on NASDAQ will be valued at the NASDAQ Official Closing Price, which may not necessarily represent the last sale price. lf there is no sale on the valuation date, exchange-traded U.S. equity securities will be valued on the basis of the last bid price.
Generally, trading in foreign securities markets is substantially completed each day at various times prior to the close of the New York Stock Exchange (“NYSE”). The values of foreign securities are determined as of the close of such foreign markets or the close of the NYSE, if earlier. All investments quoted in foreign currencies are valued in U.S. dollars on the basis of the foreign currency exchange rates prevailing at the close of U.S. business at 4:00 p.m. Investments in foreign securities may involve risks not present in domestic investments. The Valuation Committee will determine the current value of such foreign securities by taking into consideration certain factors which may include those discussed above, as well as the following factors, among others: the value of the securities traded on other foreign markets, ADR trading, closed-end fund trading, foreign currency exchange activity, and the trading prices of financial products that are tied to foreign securities. In addition, under the Valuation Procedures, the Valuation Committee and GI are authorized to use prices and other information supplied by a third party pricing vendor in valuing foreign securities.
Open-end investment companies are valued at their NAV as of the close of business, on the valuation date.
Exchange-traded funds and closed-end investment companies are valued at the last quoted sale price.
Repurchase agreements are values at amortized cost, provided such amounts approximate market value.
U.S. Government securities are valued by either independent pricing services, the last traded fill price, or at the reported bid price at the close of business.
Debt securities with a maturity of greater than 60 days at acquisition are valued at prices that reflect broker-dealer supplied valuations or are obtained from independent pricing services, which may consider the trade activity, treasury spreads, yields or price of bonds of comparable quality, coupon, maturity, and type, as well as prices quoted by dealers who make markets in such securities. Short-term debt securities with a maturity of 60 days or less at acquisition are valued at amortized cost, provided such amount approximates market value. Money market funds are valued at their NAV.
Typically, loans are valued using information provided by an independent third party pricing service which uses broker quotes. If the pricing service cannot or does not provide a valuation for a particular loan, or such valuation is deemed unreliable, such investment is fair valued by the Valuation Committee.
Exchange-traded options are valued at the mean of the bid and ask prices on the principal exchange on which they are traded. Over-the-counter (“OTC”) options are valued using a price provided by a pricing service.
The value of futures contracts is accounted for using the unrealized appreciation or depreciation on the contracts that is determined by marking the contracts to their current realized settlement prices. Financial futures contracts are valued at the 4:00 p.m. price on the valuation date. In the event that the exchange for a specific futures contract closes earlier than 4:00 p.m., the futures contract is valued at the official settlement price of the exchange. However, the underlying securities from which the futures contract value is derived are monitored until 4:00 p.m. to determine if fair valuation would provide a more accurate valuation.
The value of interest rate swap agreements entered into by a fund is accounted for using the unrealized appreciation or depreciation on the agreements that is determined using the spread priced off the previous day’s Chicago Mercantile Exchange price.
The values of other swap agreements entered into by a fund are accounted for using the unrealized appreciation or depreciation on the agreements that are determined by marking the agreements to the last quoted value of the index or other underlying position that the swaps pertain to at the close of the NYSE.
Forward foreign currency exchange contracts are valued daily based on the applicable exchange rate of the underlying currency.
| | THE GUGGENHEIM FUNDS ANNUAL REPORT | 83 |
NOTES TO FINANCIAL STATEMENTS (continued) |
Investments for which market quotations are not readily available are fair-valued as determined in good faith by GI, subject to review and approval by the Valuation Committee, pursuant to methods established or ratified by the Board. Valuations in accordance with these methods are intended to reflect each security’s (or asset’s or liability’s) “fair value”. Each such determination is based on a consideration of all relevant factors, which are likely to vary from one pricing context to another. Examples of such factors may include, but are not limited to market prices; sale prices; broker quotes; and models which derive prices based on inputs such as prices of securities with comparable maturities and characteristics, or based on inputs such as anticipated cash flows or collateral, spread over U.S. Treasury securities, and other information analysis.
In connection with futures contracts and other derivative investments, such factors may include obtaining information as to how (a) these contracts and other derivative investments trade in the futures or other derivative markets, respectively, and (b) the securities underlying these contracts and other derivative investments trade in the cash market.
(b) U.S. Government and Agency Obligations
Inflation-Indexed bonds are fixed-income securities whose principal value is periodically adjusted to the rate of inflation. The interest rate on these securities is generally fixed at issuance at a rate lower than typical bonds. Over the life of an inflation-indexed bond however, interest will be paid based on a principal value which is adjusted for inflation. Any increase in the principal amount of an inflation-indexed bond is recognized as a component of Interest on the Statements of Operations, even though principal is not received until maturity.
(c) Senior Floating Rate Interests
Senior floating rate interests in which the Funds invest generally pay interest rates which are periodically adjusted by reference to a base short-term floating rate, plus a premium. These base lending rates are generally (i) the lending rate offered by one or more major European banks, such as the one-month or three-month London Inter-Bank Offered Rate (“LIBOR”), (ii) the prime rate offered by one or more major United States banks, or (iii) the bank’s certificate of deposit rate. Senior floating rate interests often require prepayments from excess cash flows or permit the borrower to repay at its election. The rate at which the borrower repays cannot be predicted with accuracy. As a result, the actual remaining maturity may be substantially less than the stated maturities disclosed in the Funds’ Schedules of Investments. The interest rate indicated is the rate in effect at September 30, 2019.
(d) Interests in When-Issued Securities
The Funds may purchase and sell interests in securities on a when-issued and delayed delivery basis, with payment and delivery scheduled for a future date. No income accrues to the Fund on such interests or securities in connection with such transactions prior to the date the Funds actually take delivery of such interests or securities. These transactions are subject to market fluctuations and are subject to the risk that the value at delivery may be more or less than the trade date purchase price. Although the Funds will generally purchase these securities with the intention of acquiring such securities, they may sell such securities before the settlement date.
(e) Options
Upon the purchase of an option, the premium paid is recorded as an investment, the value of which is marked-to-market daily. If a purchased option expires, the Fund realizes a loss in the amount of the cost of the option. When the Fund enters into a closing sale transaction, it realizes a gain or loss depending on whether the proceeds from the closing sale transaction are greater or less than the cost of the option. If the Fund exercises a put option, it realizes a gain or loss from the sale of the underlying security and the proceeds from such sale will be decreased by the premium originally paid. When the Fund exercises a call option, the cost of the security purchased by the Fund upon exercise increases by the premium originally paid.
When the Fund writes (sells) an option, an amount equal to the premium received is entered in that Fund’s accounting records as an asset and equivalent liability. The amount of the liability is subsequently marked-to-market to reflect the current value of the option written. When a written option expires, or if the Fund enters into a closing purchase transaction, it realizes a gain (or loss if the cost of a closing purchase transaction exceeds the premium received when the option was sold).
(f) Futures Contracts
Upon entering into a futures contract, a Fund deposits and maintains as collateral such initial margin as required by the exchange on which the transaction is affected. Pursuant to the contract, the Fund agrees to receive from or pay to the broker an amount of cash equal to the daily fluctuation in value of the contract. Such receipts or payments are known as variation margin and are recorded by the Fund as unrealized appreciation or depreciation. When the contract is closed, the Fund records a realized gain or loss equal to the difference between the value of the contract at the time it was opened and the value at the time it was closed.
84 | THE GUGGENHEIM FUNDS ANNUAL REPORT | |
NOTES TO FINANCIAL STATEMENTS (continued) |
(g) Swap Agreements
Swap agreements are marked-to-market daily and the change, if any, is recorded as unrealized appreciation or depreciation. Payments received or made as a result of an agreement or termination of an agreement are recognized as realized gains or losses.
Upfront payments received or made by a Fund on credit default swap agreements and interest rate swap agreements are amortized over the expected life of the agreement. Periodic payments received or paid by a Fund are recorded as realized gains or losses. Payments received or made as a result of a credit event or termination of the contract are recognized, net of a proportional amount of the upfront payment, as realized gains or losses.
(h) Currency Translations
The accounting records of the Funds are maintained in U.S. dollars. All assets and liabilities initially expressed in foreign currencies are converted into U.S. dollars at prevailing exchange rates. Purchases and sales of investment securities, dividend and interest income, and certain expenses are translated at the rates of exchange prevailing on the respective dates of such transactions. Changes in the relationship of these foreign currencies to the U.S. dollar can significantly affect the value of the investments and earnings of the Funds. Foreign investments may also subject the Funds to foreign government exchange restrictions, expropriation, taxation, or other political, social or economic developments, all of which could affect the market and/or credit risk of the investments.
The Funds do not isolate that portion of the results of operations resulting from changes in the foreign exchange rates on investments from the fluctuations arising from changes in the market prices of securities held. Such fluctuations are included with the net realized gain or loss and unrealized appreciation or depreciation on investments.
Reported net realized foreign exchange gains and losses arise from sales of foreign currencies and currency gains or losses realized between the trade and settlement dates on investment transactions. Net unrealized exchange appreciation and depreciation arise from changes in the fair values of assets and liabilities other than investments in securities at the fiscal period end, resulting from changes in exchange rates.
(i) Forward Foreign Currency Exchange Contracts
The change in value of a forward foreign currency exchange contract is recorded as unrealized appreciation or depreciation until the contract is closed. When the contract is closed, the Funds record a realized gain or loss equal to the difference between the value at the time the contract was opened and the value at the time it was closed.
(j) Foreign Taxes
The Funds may be subject to foreign taxes (a portion of which may be reclaimable) on income, stock dividends, capital gains on investments or certain foreign currency transactions. All foreign taxes are recorded in accordance with the applicable foreign tax regulations and rates that exist in the foreign jurisdictions in which the Funds invest. These foreign taxes, if any, are paid by the Funds and reflected in the Statements of Operations as follows: foreign taxes withheld at source are presented as a reduction of income and foreign taxes on capital gains from sales of investments are included with the net realized gain (loss) on investments. Foreign taxes payable or deferred as of September 30, 2019, if any, are disclosed in the Funds’ Statements of Assets and Liabilities.
(k) Security Transactions
Security transactions are recorded on the trade date for financial reporting purposes. Realized gains and losses from securities transactions are recorded using the identified cost basis. Proceeds from lawsuits related to investment holdings are recorded as a reduction to cost if the securities are still held and as realized gains if no longer held in the respective Fund. Dividend income is recorded on the ex-dividend date, net of applicable taxes withheld by foreign countries. Taxable non-cash dividends are recorded as dividend income. Interest income, including amortization of premiums and accretion of discounts, is accrued on a daily basis. Interest income also includes paydown gains and losses on mortgage-backed and asset-backed securities and senior and subordinated loans. Amendment fees are earned as compensation for evaluating and accepting changes to the original loan agreement and are recognized when received. Dividend income from Real Estate Investment Trusts (“REITs”) is recorded based on the income included in the distributions received from the REIT investments using published REIT classifications, including some management estimates when actual amounts are not available. Distributions received in excess of this estimated amount are recorded as a reduction of the cost of investments or reclassified to realized gains. The actual amounts of income, return of capital, and realized gains are only determined by each REIT after its fiscal year-end, and may differ from the estimated amounts.
Income from residual collateralized loan obligations is recognized using the effective interest method. At the time of purchase, management estimates the future expected cash flows and determines the effective yield and estimated maturity date based on the estimated cash flows. Subsequent to the purchase, the estimated cash flows are updated periodically and a revised yield is calculated prospectively.
(l) Distributions
The Funds declare dividends from investment income daily, except for Diversified Income Fund, which declares monthly. Each Fund pays its shareholders from its net investment income monthly
| | THE GUGGENHEIM FUNDS ANNUAL REPORT | 85 |
NOTES TO FINANCIAL STATEMENTS (continued) |
and distributes any net capital gains that it has realized, at least annually. Distributions to shareholders are recorded on the ex-dividend date. Dividends are reinvested in additional shares, unless shareholders request payment in cash. The character of distributions made during the year from net investment income or net realized gains may differ from their ultimate characterization for U.S. federal income tax purposes.
(m) Class Allocations
Interest and dividend income, most expenses, all realized gains and losses, and all unrealized appreciation and depreciation are allocated to the classes based upon the value of the outstanding shares in each Class. Certain costs, such as distribution and service fees are charged directly to specific classes. In addition, certain expenses have been allocated to the individual Funds in the Trust based on the respective net assets of each Fund included in the Trust.
(n) Earnings Credits
Under the fee arrangement with the custodian, the Funds may earn credits based on overnight custody cash balances. These credits are utilized to reduce related custodial expenses. The custodian fees disclosed in the Statements of Operations are before the reduction in expense from the related earnings credits, if any. Earnings credits for the year ended September 30, 2019 are disclosed in the Statements of Operations.
(o) Cash
The Funds may leave cash overnight in their cash account with the custodian. Periodically, a Fund may have cash due to the custodian bank as an overdraft balance. A fee is incurred on this overdraft, calculated by multiplying the overdraft by a rate based on the federal funds rate, which was 1.90% at September 30, 2019.
(p) Indemnifications
Under the Funds’ organizational documents, the Trustees and Officers are indemnified against certain liabilities arising out of the performance of their duties to the Trust. In addition, throughout the normal course of business, the Funds enter into contracts that contain a variety of representations and warranties which provide general indemnifications. The Funds’ maximum exposure under these arrangements is unknown, as this would involve future claims that may be made against the Funds and/or their affiliates that have not yet occurred. However, based on experience, the Funds expect the risk of loss to be remote.
Note 2 – Derivatives
As part of their investment strategy, the Funds utilize a variety of derivative instruments. These investments involve, to varying degrees, elements of market risk and risks in excess of amounts recognized in the Statements of Assets and Liabilities. Valuation and accounting treatment of these instruments can be found under Significant Accounting Policies in Note 1 of these Notes to Financial Statements.
Derivatives are instruments whose values depend on, or are derived from, in whole or in part, the value of one or more other assets, such as securities, currencies, commodities or indices. Derivative instruments may be used to increase investment flexibility (including to maintain cash reserves while maintaining exposure to certain other assets), for risk management (hedging) purposes, to facilitate trading, to reduce transaction costs and to pursue higher investment returns. Derivative instruments may also be used to mitigate certain investment risks, such as foreign currency exchange rate risk, interest rate risk and credit risk. U.S. GAAP requires disclosures to enable investors to better understand how and why a Fund uses derivative instruments, how these derivative instruments are accounted for and their effects on the Fund’s financial position and results of operations.
The Funds may utilize derivatives for the following purposes:
Duration: the use of an instrument to manage the interest rate risk of a portfolio.
Hedge: an investment made in order to reduce the risk of adverse price movements in a security, by taking an offsetting position to protect against broad market moves.
Income: the use if any instrument that distributes cash flows typically based upon some rate of interest.
Options Purchased and Written
A call option on a security gives the purchaser of the option the right to buy, and the writer of a call option the obligation to sell, the underlying security. The purchaser of a put option has the right to sell, and the writer of the put option the obligation to buy, the underlying security at any time during the option period. The risk associated with purchasing options is limited to the premium originally paid.
86 | THE GUGGENHEIM FUNDS ANNUAL REPORT | |
NOTES TO FINANCIAL STATEMENTS (continued) |
The following table represents the Funds’ use and volume of call/put options purchased on a monthly basis:
| | | | Average Notional Amount | |
Fund | Use | | Call | | | Put | |
Investment Grade Bond Fund | Hedge | | $ | 6,373,750 | | | $ | 331,225,392 | |
The risk in writing a call option is that a Fund may incur a loss if the market price of the underlying security increases and the option is exercised. The risk in writing a put option is that a Fund may incur a loss if the market price of the underlying security decreases and the option is exercised. In addition, there may be an imperfect correlation between the movement in prices of options and the underlying securities where a Fund may not be able to enter into a closing transaction because of an illiquid secondary market; or, for OTC options, a Fund may be at risk because of the counterparty’s inability to perform.
The following table represents the Fund’s use and volume of call/put options written on a monthly basis:
| | | | Average Notional Amount | |
Fund | Use | | Call | | | Put | |
Investment Grade Bond Fund | Hedge | | $ | 7,958,725 | | | $ | — | |
Futures Contracts
A futures contract is an agreement to purchase (long) or sell (short) an agreed amount of securities or other instruments at a set price for delivery at a future date. There are significant risks associated with a Fund’s use of futures contracts, including (i) there may be an imperfect or no correlation between the changes in market value of the underlying asset and the prices of futures contracts; (ii) there may not be a liquid secondary market for a futures contract; (iii) trading restrictions or limitations may be imposed by an exchange; and (iv) government regulations may restrict trading in futures contracts. When investing in futures, there is minimal counterparty credit risk to a Fund because futures are exchange-traded and the exchange’s clearinghouse, as counterparty to all exchange-traded futures, guarantees against default. Cash deposits are shown as segregated cash with broker on the Statements of Assets and Liabilities; securities held as collateral are noted on the Schedules of Investments.
The following table represents the Funds’ use and volume of futures on a monthly basis:
| | | | Average Notional Amount | |
Fund | Use | | | | | Short | |
Investment Grade Bond Fund | Hedge | | | | | | $ | 7,796,553 | |
Swap Agreements
A swap is an agreement that obligates two parties to exchange a series of cash flows at specified intervals based upon or calculated by reference to changes in specified prices or rates for a specified amount of an underlying asset. When utilizing OTC swaps, a fund bears the risk of loss of the amount expected to be received under a swap agreement in the event of the default or bankruptcy of a swap agreement counterparty or if the underlying asset declines in value. Certain standardized swaps are subject to mandatory central clearing and are executed on a multi-lateral or other trade facility platform, such as a registered exchange. There is limited counterparty credit risk with respect to centrally-cleared swaps as the transaction is facilitated through a central clearinghouse, much like exchange-traded futures contracts. Upon entering into certain centrally-cleared swap transactions, the Fund is required to deposit with its clearing broker an amount of cash or securities as an initial margin. Subsequent variation margin payments or receipts are made or received by the Fund, depending on fluctuations in the fair value of the reference entity. For a fund utilizing centrally cleared swaps, the exchange bears the risk of loss resulting from a counterparty not being able to pay. There is no guarantee that a fund or an underlying fund could eliminate its exposure under an outstanding swap agreement by entering into an offsetting swap agreement with the same or another party.
Total return swaps involve commitments where single or multiple cash flows are exchanged based on the price of an underlying reference asset (such as index) for a fixed or variable interest rate. Total return swaps will usually be computed based on the current value of the reference asset as of the close of regular trading on the NYSE or other exchange, with the swap value being adjusted to include dividends accrued, financing
| | THE GUGGENHEIM FUNDS ANNUAL REPORT | 87 |
NOTES TO FINANCIAL STATEMENTS (continued) |
charges and/or interest associated with the swap agreement. A fund utilizing total return swaps bears the risk of loss of the amount expected to be received under a swap agreement in the event of the default or bankruptcy of a swap agreement counterparty or if the underlying reference asset declines in value.
The following table represents the Fund’s use and volume of total return swaps on a monthly basis:
| | | | Average Notional Amount | |
Fund | Use | | Long | | | Short | |
Investment Grade Bond Fund | Income | | $ | — | * | | $ | — | |
* | Total return swaps were outstanding for 40 days during the year ended September 30, 2019. The daily average outstanding notional amount of total return swap agreements during year was $2,937,837. |
Interest rate swaps involve the exchange by the Funds with another party for their respective commitment to pay or receive a fixed or variable interest rate on a notional amount of principal. Interest rate swaps are generally centrally-cleared, but central clearing does not make interest rate swap transactions risk free.
The following table represents the Funds’ use and volume of interest rate swaps on a monthly basis:
| | | | Average Notional Amount | |
Fund | Use | | Pay Floating Rate | | | Receive Floating Rate | |
Investment Grade Bond Fund | Duration, Hedge | | $ | 17,902,750 | | | $ | 51,831,667 | |
Credit default swaps are instruments which allow for the full or partial transfer of third party credit risk, with respect to a particular entity or entities, from one counterparty to the other. A fund enters into credit default swaps as a “seller” or “buyer” of protection primarily to gain or reduce exposure to the investment grade and/or high yield bond market. A seller of credit default swaps is selling credit protection or assuming credit risk with respect to the underlying entity or entities. The buyer in a credit default swap is obligated to pay the seller a periodic stream of payments over the term of the contract provided that no event of default on an underlying referenced obligation has occurred. If a credit event occurs, as defined under the terms of the swap agreement, the seller will either (i) pay to the buyer of protection an amount equal to the notional amount of the swap and take delivery of the referenced obligation or underlying securities comprising the referenced index or (ii) pay a net settlement amount in the form of cash or securities equal to the notional amount of the swap less the recovery value of the referenced obligation or underlying securities comprising the referenced index. The Notional Amount reflects the maximum potential amount the seller of credit protection could be required to pay to the buyer if a credit event occurs. The seller of protection receives periodic premium payments from the buyer and may also receive or pay an upfront premium adjustment to the stated periodic payments. In the event a credit default occurs on a credit default swap referencing an index, a factor adjustment will take place and the buyer of protection will receive a payment reflecting the par less the default recovery rate of the defaulted index component based on its weighting in the index. If no default occurs, the counterparty will pay the stream of payments and have no further obligations to the fund selling the credit protection. For a fund utilizing centrally cleared credit default swaps, the exchange bears the risk of loss resulting from a counterparty not being able to pay.. For OTC credit default swaps, a fund bears the risk of loss of the amount expected to be received under a swap agreement in the event of the default or bankruptcy of a swap agreement counterparty, or in the case of a credit default swap in which a fund is selling credit protection, the default of a third party issuer.
The quoted market prices and resulting market values for credit default swap agreements on securities and credit indices serve as an indicator of the current status of the payment/performance risk and represent the likelihood of an expected liability (or profit) for the credit derivative had the notional amount of the swap agreement been closed/sold as of the period end. Increasing market values, in absolute terms when compared to the notional amount of the swap, represent a deterioration of the referenced entity’s credit soundness and a greater likelihood or risk of default or other credit event occurring as defined under the terms of the agreement.
The following table represents the Funds’ use and volume of credit default swaps on a monthly basis:
| | | | Average Notional Amount | |
Fund | Use | | Protection Sold | | | Protection Purchased | |
Investment Grade Bond Fund | Hedge | | $ | — | | | $ | 123,719,167 | |
88 | THE GUGGENHEIM FUNDS ANNUAL REPORT | |
NOTES TO FINANCIAL STATEMENTS (continued) |
Forward Foreign Currency Exchange Contracts
A forward foreign currency exchange contract is an agreement between two parties to exchange two designated currencies at a specific time in the future. Certain types of contracts may be cash settled, in an amount equal to the change in exchange rates during the term of the contract. The contracts can be used to hedge or manage exposure to foreign currency risks with portfolio investments or to gain exposure to foreign currencies.
The market value of a forward foreign currency exchange contract changes with fluctuations in foreign currency exchange rates. Furthermore, the Funds may be exposed to risk if the counterparties cannot meet the contract terms or if the currency value changes unfavorably as compared to the U.S. dollar.
The following table represents the Funds’ use and volume of forward foreign currency exchange contracts on a monthly basis:
Fund | Use | | Purchased | | | Sold | |
High Yield Fund | Hedge | | $ | 978,537 | | | $ | 5,815,386 | |
Investment Grade Bond Fund | Hedge, Income | | | 15,486,014 | | | | 114,419,482 | |
Derivative Investment Holdings Categorized by Risk Exposure
The following is a summary of the location of derivative investments on the Funds’ Statements of Assets and Liabilities as of September 30, 2019:
Derivative Investment Type | Asset Derivatives | Liability Derivatives |
Interest Rate contracts | Unamortized upfront premiums paid on interest rate swap agreements | Variation margin on interest rate swap agreements |
| | Investments in unaffiliated issuers, at value | |
Currency contracts | Unrealized appreciation on forward foreign currency exchange contracts | Unrealized depreciation on forward foreign currency exchange contracts |
Credit contracts | | Variation margin on credit default swap agreements |
| | | Unamortized upfront premiums received on credit default swap agreements |
| | | Unrealized depreciation on OTC swap agreements |
The following table sets forth the fair value of the Funds’ derivative investments categorized by primary risk exposure at September 30, 2019:
Asset Derivative Investments Value |
Fund | | Swaps
Interest Rate
Risk* | | | Swaps
Credit
Risk* | | | Options
Purchased
Interest Rate
Risk | | | Forward
Foreign
Currency
Exchange
Risk | | | Total Value at
September 30,
2019 | |
High Yield Fund | | $ | — | | | $ | — | | | $ | — | | | $ | 22,736 | | | $ | 22,736 | |
Investment Grade Bond Fund | | | 11,590 | | | | — | | | | 1,216,977 | | | | 3,059,656 | | | | 4,288,223 | |
Liability Derivative Investments Value |
Fund | | Swaps
Interest
Rate
Risk* | | | Swaps
Credit
Risk* | | | Options
Purchased
Interest Rate
Risk | | | Forward
Foreign
Currency
Exchange
Risk | | | Total Value at
September 30,
2019 | |
Investment Grade Bond Fund | | $ | 366,909 | | | $ | 1,751,924 | | | $ | — | | | $ | 626,016 | | | $ | 2,744,849 | |
* | Includes cumulative appreciation (depreciation) of OTC and centrally-cleared swap agreements as reported on the Schedules of Investments. For centrally cleared swap agreements, variation margin is reported within the Statements of Assets and Liaiblities. |
| | THE GUGGENHEIM FUNDS ANNUAL REPORT | 89 |
NOTES TO FINANCIAL STATEMENTS (continued) |
The following is a summary of the location of derivative investments on the Funds’ Statements of Operations for the year ended September 30, 2019:
Derivative Investment Type | Location of Gain (Loss) on Derivatives |
Currency contracts | Net realized gain (loss) on forward foreign currency exchange contracts |
| | Net change in unrealized appreciation (depreciation) on forward foreign currency exchange contracts |
Equity/Interest Rate Contracts | Net realized gain (loss) on options purchased |
| | Net change in unrealized appreciation (depreciation) on options purchased |
Credit/Interest Rate contracts | Net realized gain (loss) on swap agreements |
| Net change in unrealized appreciation (depreciation) on swap agreements |
Interest Rate contracts | Net realized gain (loss) on options written |
| Net change in unrealized appreciation (depreciation) on options written |
| | Net realized gain (loss) on futures contracts |
| | Net change in unrealized appreciation (depreciation) on futures contracts |
The following is a summary of the Funds’ realized gain (loss) and change in unrealized appreciation (depreciation) on derivative investments recognized on the Statements of Operations categorized by primary risk exposure for the year ended September 30, 2019:
Realized Gain (Loss) on Derivative Investments Recognized on the Statements of Operations |
Fund | | Futures
Interest
Rate
Risk | | | Swaps
Interest
Rate
Risk | | | Swaps
Credit
Risk | | | Options
Written
Equity
Risk | | | Options
Purchased
Interest Rate
Risk | | | Options
Purchased
Equity
Risk | | | Forward
Foreign
Currency
Exchange
Risk | | | Total | |
High Yield Fund | | $ | — | | | $ | — | | | $ | — | | | $ | — | | | $ | — | | | $ | — | | | $ | 366,039 | | | $ | 366,039 | |
Investment Grade Bond Fund | | | (672,044 | ) | | | (2,171,910 | ) | | | (917,755 | ) | | | 222,776 | | | | (3,075 | ) | | | (1,454,204 | ) | | | 865,712 | | | | (4,130,500 | ) |
Change in Unrealized Appreciation (Depreciation) on Derivative Investments Recognized on the Statements of Operations |
Fund | | Futures
Interest
Rate
Risk | | | Swaps
Interest
Rate
Risk | | | Swaps
Credit
Risk | | | Options
Written
Equity
Risk | | | Options
Purchased
Interest Rate
Risk | | | Options
Purchased
Equity
Risk | | | Forward
Foreign
Currency
Exchange
Risk | | | Total | |
High Yield Fund | | $ | — | | | $ | — | | | $ | — | | | $ | — | | | $ | — | | | $ | — | | | $ | 70,586 | | | $ | 70,586 | |
Investment Grade Bond Fund | | | — | | | | (2,327,306 | ) | | | (1,751,924 | ) | | | — | | | | (463,919 | ) | | | 533,014 | | | | 1,585,011 | | | | (2,425,124 | ) |
In conjunction with the use of derivative instruments, the Funds are required to maintain collateral in various forms. Depending on the financial instrument utilized and the broker involved, the Funds use margin deposits at the broker, cash and/or securities segregated at the custodian bank, discount notes or repurchase agreements allocated to the Funds as collateral.
Foreign Investments
There are several risks associated with exposure to foreign currencies, foreign issuers and emerging markets. A Fund’s indirect and direct exposure to foreign currencies subjects the Fund to the risk that those currencies will decline in value relative to the U.S. dollar, or in the case of short positions, that the U.S. dollar will decline in value relative to the currency being hedged. Currency rates in foreign countries may fluctuate significantly over short periods of time for a number of reasons, including changes in interest rates and the imposition of currency controls or other political developments in the U.S. or abroad. In addition, the Fund may incur transaction costs in connection with conversions between various currencies. The Fund may, but is not obligated to, engage in currency hedging transactions, which generally involve buying currency forward, options or futures contracts. However, not all currency risks may be effectively hedged, and in some cases the costs of hedging techniques may outweigh expected benefits. In such instances, the value of securities denominated in foreign currencies can change significantly when foreign currencies strengthen or weaken relative to the U.S. dollar.
90 | THE GUGGENHEIM FUNDS ANNUAL REPORT | |
NOTES TO FINANCIAL STATEMENTS (continued) |
The Fund may invest in securities of foreign companies directly, or in financial instruments, such as ADRs and exchange-traded funds, which are indirectly linked to the performance of foreign issuers. Foreign markets can be more volatile than the U.S. market due to increased risks of adverse issuer, political, regulatory, market, or economic developments and can perform differently from the U.S. market. Investing in securities of foreign companies directly, or in financial instruments that are indirectly linked to the performance of foreign issuers, may involve risks not typically associated with investing in U.S. issuers. The value of securities denominated in foreign currencies, and of dividends from such securities, can change significantly when foreign currencies strengthen or weaken relative to the U.S. dollar. Foreign securities markets generally have less trading volume and less liquidity than U.S. markets, and prices in some foreign markets may fluctuate more than those of securities traded on U.S. markets. Many foreign countries lack accounting and disclosure standards comparable to those that apply to U.S. companies, and it may be more difficult to obtain reliable information regarding a foreign issuer’s financial condition and operations. Transaction costs and costs associated with custody services are generally higher for foreign securities than they are for U.S. securities. Some foreign governments levy withholding taxes against dividend and interest income. Although in some countries portions of these taxes are recoverable, the non-recovered portion will reduce the income received by the Fund.
The Trust has established counterparty credit guidelines and enters into transactions only with financial institutions of investment grade or better. The Trust monitors the counterparty credit risk.
Note 3 – Offsetting
In the normal course of business, the Funds enter into transactions subject to enforceable master netting arrangements or other similar arrangements. Generally, the right to offset in those agreements allows the Funds to counteract the exposure to a specific counterparty with collateral received from or delivered to that counterparty based on the terms of the arrangements. These arrangements provide for the right to liquidate upon the occurrence of an event of default, credit event upon merger or additional termination event.
In order to better define their contractual rights and to secure rights that will help the Funds mitigate their counterparty risk, the Funds may enter into an International Swaps and Derivatives Association, Inc. Master Agreement (“ISDA Master Agreement”) or similar agreement with their derivative contract counterparties. An ISDA Master Agreement is a bilateral agreement between a fund and a counterparty that governs OTC derivatives, including foreign exchange contracts, and typically contains, among other things, collateral posting terms and netting provisions in the event of a default and/or termination event. The provisions of the ISDA Master Agreement typically permit a single net payment in the event of a default (close-out netting) or similar event, including the bankruptcy or insolvency of the counterparty.
For derivatives traded under an ISDA Master Agreement, the collateral requirements are typically calculated by netting the mark-to-market amount for each transaction under such agreement and comparing that amount to the value of any collateral currently pledged by the Funds and the counterparty. For financial reporting purposes, cash collateral that has been pledged to cover obligations of the Funds and cash collateral received from the counterparty, if any, are reported separately on the Statements of Assets and Liabilities as segregated cash with broker/receivable for variation margin, or payable for swap settlement/variation margin. Cash and/or securities pledged or received as collateral by the Funds in connection with an OTC derivative subject to an ISDA Master Agreement generally may not be invested, sold or rehypothecated by the counterparty or the Funds, as applicable, absent an event of default under such agreement, in which case such collateral generally may be applied towards obligations due to and payable by such counterparty or the Funds, as applicable. Generally, the amount of collateral due from or to a counterparty must exceed a minimum transfer amount threshold (e.g., $300,000) before a transfer is required to be made. To the extent amounts due to the Funds from their counterparties are not fully collateralized, contractually or otherwise, the Funds bear the risk of loss from counterparty nonperformance. The Funds attempt to mitigate counterparty risk by only entering into agreements with counterparties that they believe to be of good standing and by monitoring the financial stability of those counterparties.
For financial reporting purposes, the Funds do not offset derivative assets and derivative liabilities that are subject to netting arrangements in the Statements of Assets and Liabilities.
| | THE GUGGENHEIM FUNDS ANNUAL REPORT | 91 |
NOTES TO FINANCIAL STATEMENTS (continued) |
The following tables present derivative financial instruments and secured financing transactions that are subject to enforceable netting arrangements:
| | | | | | | | | | | | | | | | Gross Amounts Not Offset
in the Statements of
Assets and Liabilities | | | | | |
Fund | Instrument | | Gross
Amounts of
Recognized
Assets1 | | | Gross
Amounts
Offset in the
Statements
of Assets and
Liabilities | | | Net Amount
of Assets
Presented on
the Statements
of Assets and
Liabilities | | | Financial
Instruments | | | Cash
Collateral
Received | | | Net
Amount | |
High Yield Fund | Forward foreign currency exchange contracts | | $ | 22,736 | | | $ | — | | | $ | 22,736 | | | $ | — | | | $ | — | | | $ | 22,736 | |
Investment Grade Bond Fund | Forward foreign currency exchange contracts | | | 3,059,656 | | | | — | | | | 3,059,656 | | | | (627,238 | ) | | | (1,934,468 | ) | | | 497,950 | |
Investment Grade Bond Fund | Options purchased | | | 1,216,977 | | | | — | | | | 1,216,977 | | | | (377,570 | ) | | | (558,331 | ) | | | 281,076 | |
| | | | | | | | | | | | | | | | Gross Amounts Not Offset
in the Statements of
Assets and Liabilities | | | | | |
Fund | Instrument | | Gross
Amounts of
Recognized
Liabilities1 | | | Gross
Amounts
Offset in the
Statements
of Assets and
Liabilities | | | Net Amount
of Liabilities
Presented on
the Statements
of Assets and
Liabilities | | | Financial
Instruments | | | Cash
Collateral
Pledged | | | Net
Amount | |
Investment Grade Bond Fund | Credit default swap agreements | | $ | 377,570 | | | $ | — | | | $ | 377,570 | | | $ | (377,570 | ) | | $ | — | | | $ | — | |
| | Forward foreign currency exchange contracts | | | 626,016 | | | | — | | | | 626,016 | | | | (626,016 | ) | | | — | | | | — | |
| | Total return swaps | | | 14,520 | | | | — | | | | 14,520 | | | | (1,222 | ) | | | — | | | | 13,298 | |
1 | Exchange-traded or centrally-cleared derivatives are excluded from these reported amounts. |
92 | THE GUGGENHEIM FUNDS ANNUAL REPORT | |
NOTES TO FINANCIAL STATEMENTS (continued) |
The Funds have the right to offset deposits against any related derivative liabilities outstanding with each counterparty with the exception of exchange-traded or centrally-cleared derivatives. The following table presents deposits held by others in connection with derivative investments as of September 30, 2019.
Fund | Counterparty/Clearing Agent | Asset Type | | Cash Pledged | | | Cash Received | |
Investment Grade Bond Fund | BofA Securities, Inc. | Credit default swap agreements | | $ | 1,221,834 | | | $ | — | |
| | BofA Securities, Inc. | Forward foreign currency exchange contracts | | | — | | | | 725,000 | |
| | BofA Securities, Inc. | Interest rate swap agreements | | | 2,217,234 | | | | — | |
| | Cititbank N.A. | Forward foreign currency exchange contracts | | | — | | | | 600,000 | |
| | Goldman Sachs & Co. LLC | Forward foreign currency exchange contracts, Credit default swap agreements | | | — | | | | 470,000 | |
| | J.P. Morgan Securities LLC | Forward foreign currency exchange contracts | | | — | | | | 540,000 | |
| Morgan Stanley & Co. LLC
| Forward foreign currency exchange contracts, Credit default swap agreements | | | — | | | | 157,799 | |
| | | | | 3,439,068 | | | | 2,492,799 | |
Note 4 – Fair Value Measurement
In accordance with U.S. GAAP, fair value is defined as the price that the Funds would receive to sell an investment or pay to transfer a liability in an orderly transaction with an independent buyer in the principal market, or in the absence of a principal market, the most advantageous market for the investment or liability. U.S. GAAP establishes a three-tier fair value hierarchy based on the types of inputs used to value assets and liabilities and requires corresponding disclosure. The hierarchy and the corresponding inputs are summarized below:
Level 1 — | quoted prices in active markets for identical assets or liabilities. |
Level 2 — | significant other observable inputs (for example quoted prices for securities that are similar based on characteristics such as interest rates, prepayment speeds, credit risk, etc.). |
Level 3 — | significant unobservable inputs based on the best information available under the circumstances, to the extent observable inputs are not available, which may include assumptions. |
The types of inputs available depend on a variety of factors, such as the type of security and the characteristics of the markets in which it trades, if any. Fair valuation determinations that rely on fewer or no observable inputs require greater judgment. Accordingly, fair value determinations for Level 3 securities require the greatest amount of judgment.
Independent pricing services are used to value a majority of the Funds’ investments. When values are not available from a pricing service, they will be determined using a variety of sources and techniques, including: market prices; broker quotes; and models which derive prices based on inputs such as prices of securities with comparable maturities and characteristics or based on inputs such as anticipated cash flows or collateral, spread over U.S. Treasury securities, and other information and analysis. A significant portion of the Funds’ assets and liabilities are categorized as Level 2, as indicated in this report.
Quotes from broker-dealers, adjusted for fluctuations in criteria such as credit spreads and interest rates, may also be used to value the Funds’ assets and liabilities, i.e. prices provided by a broker-dealer or other market participant who has not committed to trade at that price. Although quotes are typically received from established market participants, the Funds may not have the transparency to view the underlying inputs which support the market quotations. Significant changes in a quote would generally result in significant changes in the fair value of the security.
Certain fixed income securities are valued by obtaining a monthly quote from a broker-dealer, adjusted for fluctuations in criteria such as credit spreads and interest rates.
| | THE GUGGENHEIM FUNDS ANNUAL REPORT | 93 |
NOTES TO FINANCIAL STATEMENTS (continued) |
Certain loans and other securities are valued using a single daily broker quote or a price from a third party vendor based on a single daily or monthly broker quote.
The inputs or methodologies used for valuing securities are not necessarily an indication of the risk associated with investing in those securities. The suitability of the techniques and sources employed to determine fair valuation are regularly monitored and subject to change.
Note 5 – Investment Advisory Agreement and Other Agreements
Under the terms of an investment advisory contract, the Funds pay GI investment advisory fees calculated at the annualized rates below, based on the average daily net assets of the Funds:
Fund | | Management Fees
(as a % of Net Assets) | |
Diversified Income Fund | | | 0.75 | % |
High Yield Fund | | | 0.60 | % |
Investment Grade Bond Fund | | | 0.39 | % |
Municipal Income Fund | | | 0.50 | % |
GI engages external service providers to perform other necessary services for the Trust, such as audit and accounting related services, legal services, custody, printing and mailing, etc., on a pass-through basis. Such expenses are allocated to various Funds within the complex based on relative net assets.
The Funds have adopted Distribution Plans related to the offering of A-Class, C-Class and P-Class shares pursuant to Rule 12b-1 under the 1940 Act. The plans provide for payments at an annual rate of 0.25% of the average daily net assets of the Fund’s A-Class and P-Class shares, and 1.00% of the average daily net assets of the Fund’s C-Class shares.
Contractual expense limitation agreements for the following Funds provide that the total expenses be limited to a percentage of average net assets for each class of shares, exclusive of brokerage costs, dividends on securities sold short, expenses of other investment companies in which a Fund invests, interest, taxes, litigation, indemnification and extraordinary expenses. The limits are listed below:
| | Limit | | | Effective
Date | | | Contract
End Date | |
Diversified Income Fund - A-Class | | | 1.30 | % | | | 01/29/16 | | | | 02/01/21 | |
Diversified Income Fund - C-Class | | | 2.05 | % | | | 01/29/16 | | | | 02/01/21 | |
Diversified Income Fund - P-Class | | | 1.30 | % | | | 01/29/16 | | | | 02/01/21 | |
Diversified Income Fund - Institutional Class | | | 1.05 | % | | | 01/29/16 | | | | 02/01/21 | |
High Yield Fund - A-Class | | | 1.16 | % | | | 11/30/12 | | | | 02/01/21 | |
High Yield Fund - C-Class | | | 1.91 | % | | | 11/30/12 | | | | 02/01/21 | |
High Yield Fund - P-Class | | | 1.16 | % | | | 05/01/15 | | | | 02/01/21 | |
High Yield Fund - Institutional Class | | | 0.91 | % | | | 11/30/12 | | | | 02/01/21 | |
High Yield Fund - R6-Class | | | 0.91 | % | | | 05/15/17 | | | | 02/01/21 | |
Investment Grade Bond Fund - A-Class | | | 0.79 | % | | | 11/30/12 | | | | 02/01/21 | |
Investment Grade Bond Fund - C-Class | | | 1.54 | % | | | 11/30/12 | | | | 02/01/21 | |
Investment Grade Bond Fund - P-Class | | | 0.79 | % | | | 05/01/15 | | | | 02/01/21 | |
Investment Grade Bond Fund - Institutional Class | | | 0.50 | % | | | 11/30/12 | | | | 02/01/21 | |
Municipal Income Fund - A-Class | | | 0.80 | % | | | 11/30/12 | | | | 02/01/21 | |
Municipal Income Fund - C-Class | | | 1.55 | % | | | 11/30/12 | | | | 02/01/21 | |
Municipal Income Fund - P-Class | | | 0.80 | % | | | 05/01/15 | | | | 02/01/21 | |
Municipal Income Fund - Institutional Class | | | 0.55 | % | | | 11/30/12 | | | | 02/01/21 | |
94 | THE GUGGENHEIM FUNDS ANNUAL REPORT | |
NOTES TO FINANCIAL STATEMENTS (continued) |
GI is entitled to reimbursement by the Funds for fees waived or expenses reimbursed during any of the previous 36 months, beginning on the date of the expense limitation agreement, if on any day the estimated operating expenses are less than the indicated percentages. For purposes of this arrangement, GI is entitled to recoupment of previously waived fees or reimbursed expenses for 36 months from the date of the waiver or reimbursement by GI. At September 30, 2019, the amount of fees waived or expenses reimbursed that are subject to recoupment and will expire during the years ended September 30, are presented in the following table:
Fund | | 2020 | | | 2021 | | | 2022 | | | Fund
Total | |
Diversified Income Fund | | | | | | | | | | | | | | | | |
A-Class | | $ | 3,873 | | | $ | 4,873 | | | $ | 4,237 | | | $ | 12,983 | |
C-Class | | | 3,893 | | | | 5,069 | | | | 14,152 | | | | 23,114 | |
P-Class | | | 3,402 | | | | 4,482 | | | | 3,371 | | | | 11,255 | |
Institutional Class | | | 148,686 | | | | 191,684 | | | | 148,929 | | | | 489,299 | |
High Yield Fund | | | | | | | | | | | | | | | | |
A-Class | | | — | | | | 15,915 | | | | 9,601 | | | | 25,516 | |
C-Class | | | 61 | | | | 3,674 | | | | 2,743 | | | | 6,478 | |
P-Class | | | 2,872 | | | | 8,622 | | | | 1,761 | | | | 13,255 | |
Institutional Class | | | — | | | | — | | | | 9,227 | | | | 9,227 | |
R6-Class | | | — | | | | — | | | | 6,529 | | | | 6,529 | |
Investment Grade Bond Fund | | | | | | | | | | | | | | | | |
A-Class | | | 77,376 | | | | 156,533 | | | | 114,831 | | | | 348,740 | |
C-Class | | | 25,128 | | | | 43,011 | | | | 23,323 | | | | 91,462 | |
P-Class | | | 806 | | | | 42,627 | | | | 66,557 | | | | 109,990 | |
Institutional Class | | | 18,798 | | | | 174,956 | | | | 535,891 | | | | 729,644 | |
Municipal Income Fund | | | | | | | | | | | | | | | | |
A-Class | | | 125,964 | | | | 147,177 | | | | 153,746 | | | | 426,887 | |
C-Class | | | 14,699 | | | | 17,294 | | | | 11,587 | | | | 43,580 | |
P-Class | | | 758 | | | | 634 | | | | 838 | | | | 2,230 | |
Institutional Class | | | 58,022 | | | | 67,892 | | | | 58,964 | | | | 184,878 | |
For the year ended September 30, 2019, GI recouped amounts from the Funds as follows:
High Yield Fund | | $ | 75,094 | |
Investment Grade Bond Fund | | | 2,049 | |
Municipal Income Fund | | | 100 | |
If a Fund invests in a fund that is advised by the same adviser or an affiliated adviser, the investing Fund’s adviser has agreed to waive fees at the investing fund level to the extent necessary to offset the proportionate share of any management fee paid by each Fund with respect to its investment in such affiliated fund. Fee waivers will be calculated at the investing Fund level without regard to any expense cap, if any, in effect for the investing Fund. Fees waived under this arrangement are not subject to reimbursement to GI. For theyear ended September 30, 2019, the following Funds waived fees related to investments in affiliated funds:
Fund | | Amount Waived | |
Diversified Income Fund | | $ | 30,102 | |
Investment Grade Bond Fund | | | 16,207 | |
For the year ended September 30, 2019, GFD retained sales charges of $286,511 relating to sales of A-Class shares of the Trust.
Certain trustees and officers of the Trust are also officers of GI and/or GFD. The Trust does not compensate its officers or trustees who are officers, directors and/or employees of GI or GFD.
| | THE GUGGENHEIM FUNDS ANNUAL REPORT | 95 |
NOTES TO FINANCIAL STATEMENTS (continued) |
At September 30, 2019, GI and its affiliates owned over twenty percent of the outstanding shares of the Funds, as follows:
Fund | | Percent of Outstanding
Shares Owned | |
Diversified Income Fund | | | 86 | % |
MUFG Investor Services (US), LLC (“MUIS”) acts as the Funds’ administrator, transfer agent and accounting agent. As administrator, transfer agent and accounting agent, MUIS is responsible for maintaining the books and records of the Funds’ securities and cash. The Bank of New York Mellon Corp. (“BNY”) acts as the Funds’ custodian. As custodian, BNY is responsible for the custody of the Funds’ assets. For providing the aforementioned administrative and accounting services, MUIS is entitled to receive a monthly fee equal to a percentage of the Funds’ average daily net assets and out of pocket expenses. For providing the aforementioned transfer agent and custodian services, MUIS and BNY are entitled to receive a monthly fee based on the number of transactions during the month and the number of accounts under management, subject to certain minimum monthly fees, and out of pocket expenses.
Note 6 – Reverse Repurchase Agreements
Each of the Funds may enter into reverse repurchase agreements. Under a reverse repurchase agreement, a Fund sells securities and agrees to repurchase them at a particular price at a future date. In the event the buyer of securities under a reverse repurchase agreement files for bankruptcy or becomes insolvent, such buyer or its trustee or receiver may receive an extension of time to determine whether to enforce the Fund’s obligation to repurchase the securities, and the Fund’s use of the proceeds of the reverse repurchase agreement may effectively be restricted pending such decision.
For the year ended September 30, 2019, the following Funds entered into reverse repurchase agreements:
Fund | | Number of Days
Outstanding | | | Balance at
September 30, 2019 | | | Average Balance
outstanding | | | Average
Interest Rate | |
High Yield Fund | | | 365 | | | $ | 21,687,382 | | | $ | 15,845,185 | | | | 2.49 | % |
Investment Grade Bond Fund | | | 1 | | | | — | * | | | 17,186,250 | | | | 2.49 | % |
* | As of September 30, 2019, Investment Grade Bond Fund did not have any open reverse repurchase agreements. |
The following table presents reverse repurchase agreements that are subject to netting arrangements and offset in the Statements of Assets of Liabilities in conformity with U.S. GAAP:
| | | | | | | | | | | | | | | | Gross Amounts Not Offset
in the Statements of
Assets and Liabilities | | | | | |
Fund | Instrument | | Gross
Amounts of
Recognized
Liabilities | | | Gross
Amounts
Offset in the
Statements
of Assets and
Liabilities | | | Net Amount
of Liabilities
Presented on
the Statements
of Assets and
Liabilities | | | Financial
Instruments | | | Cash
Collateral
Pledged | | | Net
Amount | |
High Yield Fund | Reverse Repurchase Agreements | | $ | 21,687,382 | | | $ | — | | | $ | 21,687,382 | | | $ | (21,687,382 | ) | | $ | — | | | $ | — | |
96 | THE GUGGENHEIM FUNDS ANNUAL REPORT | |
NOTES TO FINANCIAL STATEMENTS (continued) |
As of September 30, 2019, there was $21,687,382 in reverse repurchase agreements outstanding. As of September 30, 2019, the High Yield Fund had outstanding reverse repurchase agreements with various counterparties. Details of the reverse repurchase agreements by counterparty are as follows:
Counterparty | | Range of
Interest Rate | | | Maturity
Dates | | | Repurchase
Price | |
Barclays Capital, Inc. | 0.00%-1.25% | Open Maturity | | $ | 2,027,555 | |
BMO Capital Markets Corp. | 2.35% | 10/07/19 | | | 6,513,138 | |
J.P. Morgan Securities LLC | 1.85%-2.50% | Open Maturity - 10/03/19 | | | 11,549,514 | |
RBC Capital Markets, LLC | (1.25%)-2.35% | Open Maturity | | | 1,597,175 | |
| | | | | | | | | | | $ | 21,687,382 | |
The following is a summary of the remaining contractual maturities of the reverse repurchase agreements outstanding as of year-end, aggregated by asset class of the related collateral pledged by the Fund:
Portfolio Name | | Asset
Type | | | Overnight and
Continuous | | | Up to
30 days | | | Total | |
High Yield Fund | Corporate Bonds | | $ | 14,851,244 | | | $ | 6,836,138 | | | $ | 21,687,382 | |
Gross amount of recognized liabilities for reverse repurchase agreements | | | $ | 14,851,244 | | | $ | 6,836,138 | | | $ | 21,687,382 | |
Note 7 – Federal Income Tax Information
The Funds intend to comply with the provisions of Subchapter M of the Internal Revenue Code applicable to regulated investment companies and will distribute substantially all taxable net investment income and capital gains sufficient to relieve the Funds from all, or substantially all, federal income, excise and state income taxes. Therefore, no provision for federal or state income tax or federal excise tax is required.
Tax positions taken or expected to be taken in the course of preparing the Funds’ tax returns are evaluated to determine whether the tax positions are “more-likely-than-not” of being sustained by the applicable tax authority. Tax positions not deemed to meet the more-likely-than-not threshold would be recorded as a tax benefit or expense in the current year. Management has analyzed the Funds’ tax positions taken, or to be taken, on U.S. federal income tax returns for all open tax years, and has concluded that no provision for income tax is required in the Funds’ financial statements. The Funds’ U.S. federal income tax returns are subject to examination by the Internal Revenue Service for a period of three years after they are filed.
The tax character of distributions paid during the year ended September 30, 2019 was as follows:
Fund | | Ordinary
Income | | | Long-Term
Capital Gain | | | Tax-Exempt
Income | | | Total
Distributions | |
Diversified Income Fund | | $ | 209,067 | | | $ | 70,988 | | | $ | — | | | $ | 280,055 | |
High Yield Fund | | | 25,753,666 | | | | — | | | | — | | | | 25,753,666 | |
Investment Grade Bond Fund | | | 17,731,807 | | | | — | | | | — | | | | 17,731,807 | |
Municipal Income Fund | | | 101,376 | | | | 98,198 | | | | 897,173 | | | | 1,096,747 | |
The tax character of distributions paid during the year ended September 30, 2018 was as follows:
Fund | | Ordinary
Income | | | Long-Term
Capital Gain | | | Tax-Exempt
Income | | | Total
Distributions | |
Diversified Income Fund | | $ | 232,295 | | | $ | 25,258 | | | $ | — | | | $ | 257,553 | |
High Yield Fund | | | 30,460,274 | | | | — | | | | — | | | | 30,460,274 | |
Investment Grade Bond Fund | | | 12,141,726 | | | | — | | | | — | | | | 12,141,726 | |
Municipal Income Fund | | | 93,124 | | | | — | | | | 975,755 | | | | 1,068,879 | |
Note: For U.S. federal income tax purposes, short-term capital gain distributions are treated as ordinary income distributions.
| | THE GUGGENHEIM FUNDS ANNUAL REPORT | 97 |
NOTES TO FINANCIAL STATEMENTS (continued) |
The tax components of distributable earnings/(loss) as of September 30, 2019 were as follows:
Fund | | Undistributed
Ordinary
Income | | | Undistributed
Long-Term
Capital Gain | | | Net Unrealized
Appreciation
(Depreciation) | | | Accumulated
Capital and
Other Losses | | | Other
Temporary
Differences | | | Total | |
Diversified Income Fund | | $ | 58,454 | | | $ | 15,419 | | | $ | 379,089 | | | $ | — | | | $ | (18,845 | ) | | $ | 434,117 | |
High Yield Fund | | | 2,435,188 | | | | — | | | | (8,556,759 | ) | | | (11,565,403 | ) | | | (1,944,580 | ) | | | (19,631,554 | ) |
Investment Grade Bond Fund | | | 2,593,702 | | | | — | | | | 19,591,868 | | | | (2,742,195 | ) | | | (2,127,990 | ) | | | 17,315,385 | |
Municipal Income Fund | | | 94,007 | | | | — | | | | 2,580,389 | | | | (128,908 | ) | | | (94,109 | ) | | | 2,451,379 | |
For U.S. federal income tax purposes, capital loss carryforwards represent realized losses of the Funds that may be carried forward and applied against future capital gains. Under the RIC Modernization Act of 2010, the Funds are permitted to carry forward capital losses incurred in taxable years beginning after December 22, 2010 for an unlimited period and such capital loss carryforwards will retain their character as either short-term or long-term capital losses. As of September 30, 2019, capital loss carryforwards for the Funds were as follows:
| | | Unlimited | | | | | |
Fund | | Short-Term | | | Long-Term | | | Total
Capital Loss
Carryforward | |
High Yield Fund | | $ | — | | | $ | (11,565,403 | ) | | $ | (11,565,403 | ) |
Investment Grade Bond Fund | | | — | | | | (2,742,195 | ) | | | (2,742,195 | ) |
Municipal Income Fund | | | (88,323 | ) | | | (40,585 | ) | | | (128,908 | ) |
Net investment income and net realized gains (losses) may differ for financial statement and tax purposes because of temporary or permanent book/tax differences. These differences are primarily due to investments in swaps, foreign currency gains and losses, “mark-to-market” of foreign currency exchange contracts, losses deferred due to wash sales, reclassification of distributions, distributions in connection with redemption of fund shares, and dividends payable. Additional differences may result from bond premium/discount amortization, distributions in excess of current year income, the deferral of losses related to tax straddle investments, non-deductible expenses, income accruals on certain investments, and the “mark-to-market” of certain investments denominated in foreign currencies. To the extent these differences are permanent and would require a reclassification between Paid in Capital and Total Distributable Earnings (Loss), such reclassifications are made in the period that the differences arise. These reclassifications have no effect on net assets or NAV per share.
The following adjustments were made on the Statements of Assets and Liabilities as of September 30, 2019 for permanent book/tax differences:
Fund | | Paid In
Capital | | | Total
Distributable
Earnings/(Loss) | |
Diversified Income Fund | | $ | 164 | | | $ | (164 | ) |
Investment Grade Bond Fund | | | 1 | | | | (1 | ) |
Municipal Income Fund | | | (102,914 | ) | | | 102,914 | |
At September 30, 2019, the cost of investments for U.S. federal income tax purposes, the aggregate gross unrealized appreciation for all investments for which there was an excess of value over tax cost and the aggregate gross unrealized depreciation for all investments for which there was an excess of tax cost over value, were as follows:
Fund | | Tax
Cost | | | Tax
Unrealized
Appreciation | | | Tax
Unrealized
Depreciation | | | Net
Unrealized
Appreciation/
(Depreciation) | |
Diversified Income Fund | | $ | 7,066,004 | | | $ | 406,250 | | | $ | (27,161 | ) | | $ | 379,089 | |
High Yield Fund | | | 462,744,326 | | | | 9,826,032 | | | | (18,660,747 | ) | | | (8,834,715 | ) |
Investment Grade Bond Fund | | | 823,246,129 | | | | 25,378,206 | | | | (5,795,954 | ) | | | 19,582,252 | |
Municipal Income Fund | | | 55,764,441 | | | | 2,646,307 | | | | (65,918 | ) | | | 2,580,389 | |
98 | THE GUGGENHEIM FUNDS ANNUAL REPORT | |
NOTES TO FINANCIAL STATEMENTS (continued) |
Note 8 – Securities Transactions
For the year ended September 30, 2019, the cost of purchases and proceeds from sales of investment securities, excluding government securities, short-term investments and derivatives, were as follows:
Fund | | Purchases | | | Sales | |
Diversified Income Fund | | $ | 4,888,231 | | | $ | 3,799,081 | |
High Yield Fund | | | 253,043,549 | | | | 281,532,910 | |
Investment Grade Bond Fund | | | 307,682,572 | | | | 185,151,986 | |
Municipal Income Fund | | | 31,281,763 | | | | 12,473,465 | |
For the year ended September 30, 2019, the cost of purchases and proceeds from sales of government securities were as follows:
Fund | | Purchases | | | Sales | |
Investment Grade Bond | | $ | 299,656,586 | | | $ | 223,800,295 | |
The Funds are permitted to purchase or sell securities from or to certain affiliated funds under specified conditions outlined in procedures adopted by the Board. The procedures have been designed to ensure that any purchase or sale of securities by a Fund from or to another fund or portfolio that is or could be considered an affiliate by virtue of having a common investment adviser (or affiliated investment advisers), common Trustees and/or common officers complies with Rule 17a-7 of the 1940 Act. Further, as defined under these procedures, each transaction is effected at the current market price to save costs, where permissible. For the year ended September 30, 2019, the Funds engaged in purchases and sales of securities, pursuant to Rule 17a-7 of the 1940 Act, as follows:
Fund | | Purchases | | | Sales | | | Realized
Gain (Loss) | |
High Yield Fund | | $ | 31,694,835 | | | $ | 14,700,287 | | | $ | (147,515 | ) |
Investment Grade Bond Fund | | | — | | | | 857,209 | | | | 20,091 | |
Note 9 – Unfunded Loan Commitments
Pursuant to the terms of certain loan agreements, certain Funds held unfunded loan commitments as of September 30, 2019. The Funds are obligated to fund these loan commitments at the borrower’s discretion.
Fund | Borrower | | Maturity Date | | | Face Amount | | | Value | |
High Yield Fund |
| | Acosta, Inc. | | | 12/26/19 | | | $ | 174,326 | | | $ | 119,631 | |
| | Aspect Software, Inc. | | | 07/15/23 | | | | 91,145 | | | | 1,168 | |
| | Bullhorn, Inc. | | | 11/21/22 | | | | 77,789 | | | | 6,123 | |
| | Cypress Intermediate Holdings III, Inc. | | | 04/27/22 | | | | 750,000 | | | | 47,555 | |
| | Epicor Software | | | 06/01/20 | | | | 1,000,000 | | | | 16,217 | |
| | Lytx, Inc. | | | 08/31/22 | | | | 105,263 | | | | 7,682 | |
| | MRI Software LLC | | | 06/30/23 | | | | 118,056 | | | | 6,503 | |
| | National Technical Systems | | | 06/12/21 | | | | 250,000 | | | | 8,843 | |
| | Packaging Coordinators Midco, Inc. | | | 07/01/21 | | | | 1,130,769 | | | | 49,541 | |
| | Solera LLC | | | 03/03/21 | | | | 954,167 | | | | 38,220 | |
| | | | | | | | | | | | | 301,483 | |
Investment Grade Bond Fund |
| | Mavis Tire Express Services Corp. | | | 03/20/25 | | | | 40,016 | | | | 929 | |
| | THE GUGGENHEIM FUNDS ANNUAL REPORT | 99 |
NOTES TO FINANCIAL STATEMENTS (continued) |
Note 10 – Restricted Securities
The securities below are considered illiquid and restricted under guidelines established by the Board:
Fund | Restricted Securities | | Acquisition Date | | | Cost | | | Value | |
High Yield Fund |
| | Basic Energy Services, Inc. | | | | | | | | | | | | |
| | 10.75% due 10/15/23 | | | 09/25/18 | | | $ | 1,215,115 | | | $ | 894,250 | |
| | Beverages & More, Inc. | | | | | | | | | | | | |
| | 11.50% due 06/15/22 | | | 06/16/17 | | | | 3,112,161 | | | | 2,538,000 | |
| | Mirabela Nickel Ltd. | | | | | | | | | | | | |
| | 9.50% due 06/24/193 | | | 12/31/13 | | | | 252,369 | | | | 13,906 | |
| | | | | | | | $ | 4,579,645 | | | $ | 3,446,156 | |
Investment Grade Bond Fund |
| | Central Storage Safety Project Trust | | | | | | | | | | | | |
| | 4.82% due 02/01/38 | | | 03/20/18 | | | | 1,025,454 | | | | 1,102,616 | |
| | Copper River CLO Ltd. | | | | | | | | | | | | |
| | 2007-1A, due 01/20/211 | | | 05/09/14 | | | | 819,000 | | | | 97,156 | |
| | Highland Park CDO I Ltd. | | | | | | | | | | | | |
| | 2006-1A, 2.53% (3 Month USD LIBOR + 0.40%, Rate Floor: 0.00%) due 11/25/512 | | | 07/01/16 | | | | 173,429 | | | | 180,565 | |
| | Turbine Engines Securitization Ltd. | | | | | | | | | | | | |
| | 2013-1A, 5.13% due 12/13/48 | | | 11/27/13 | | | | 432,383 | | | | 436,118 | |
| | | | | | | | $ | 2,450,266 | | | $ | 1,816,455 | |
1 | Security has no stated coupon. However, it is expected to receive residual cash flow payments on defined deal dates. |
2 | Variable rate security. Rate indicated is the rate effective at September 30, 2019. In some instances, the effective rate is limited by a minimum rate floor or a maximum rate cap established by the issuer. The settlement status of a position may also impact the effective rate indicated. In some cases, a position may be unsettled at period end and may not have a stated effective rate. In instances where multiple underlying reference rates and spread amounts are shown, the effective rate is based on a weighted average. |
3 | Security is in default of interest and/or principal obligations. |
Note 11 – Line of Credit
The Trust, along with other affiliated trusts, secured a 364-day committed, $1,065,000,000 line of credit from Citibank, N.A., which was in place through October 5, 2018, at which time the line of credit was renewed with an increased commitment amount of $1,205,000,000. On October 4, 2019, the line of credit agreement was renewed with an increased commitment amount of $1,230,000,000. A Fund may draw (borrow) from the line of credit as a temporary measure for emergency purposes, to facilitate redemption requests, or for other short-term liquidity purposes consistent with the Fund’s investment objective and program. For example, it may be advantageous for the Fund to borrow money rather than sell existing portfolio positions to meet redemption requests. Fees related to borrowings, if any, vary under this arrangement between the greater of Citibank’s “base rate”, LIBOR plus 1%, or the federal funds rate plus 1/2 of 1%.
The commitment fee that may be paid by the Funds is at an annualized rate 0.15% of the average daily amount of its allocated unused commitment amount. The allocated commitment fee amount for each Fund is referenced in the Statement of Operations under “Line of credit fees”. The Funds did not have any borrowings under this agreement as of and for the year ended September 30, 2019.
Note 12 – Recent Regulatory Reporting Updates
In August 2018, the Financial Accounting Standards Board issued an Accounting Standards Update, ASU 2018-13, Fair Value Measurement (Topic 820), Disclosure Framework - Changes to the Disclosure Requirements for Fair Value Measurement (the “2018 ASU”) which adds, modifies and removes disclosure requirements related to certain aspects of fair value measurement. The 2018 ASU is effective for fiscal years, and interim periods within those fiscal years, beginning after December 15, 2019. Early adoption is permitted. As of September 30, 2019, the Funds have fully adopted the provisions of the 2018 ASU, which did not have a material impact on the Funds’ financial statements and related disclosures or impact the Funds’ net assets or results of operations.
100 | THE GUGGENHEIM FUNDS ANNUAL REPORT | |
NOTES TO FINANCIAL STATEMENTS (continued) |
Note 13 – Recent Accounting Pronouncements
In March 2017, the Financial Accounting Standards Board issued an Accounting Standards Update, ASU 2017-08, Receivables – Nonrefundable Fees and Other Costs (Subtopic 310-20), Premium Amortization on Purchased Callable Debt Securities (the “2017 ASU”) which amends the amortization period for certain purchased callable debt securities held at a premium, shortening such period to the earliest call date. The 2017 ASU does not require any accounting change for debt securities held at a discount; the discount continues to be amortized to maturity. The 2017 ASU is effective for fiscal years, and interim periods within those fiscal years, beginning after December 15, 2018. At this time, management is evaluating the implications of these changes on the financial statements.
Note 14 – Legal Proceedings
Motors Liquidation Company
On or about June of 2015, the Guggenheim High Yield Fund was served and became a party to the case entitled Official Committee of Unsecured Creditors of Motors Liquidation Company v. JPMorgan Chase Bank, N.A., et al., Adversary Proceeding No. 09-00504 (MG) (Bankr. S.D.N.Y.), brought by the Motors Liquidation Avoidance Action Trust (the “Motors Trust”). The lawsuit was initially filed in the United States Bankruptcy Court for the Southern District of New York on July 31, 2009 by the Official Committee of Unsecured Creditors of Motors Liquidation Company (f/k/a General Motors) against the former holders of an approximately $1.5 billion term loan issued pursuant to a term loan agreement, dated as of November 29, 2006 (the “Term Loan”), between General Motors, as borrower, JPMorgan Chase Bank, N.A., as administrative agent (“JPMorgan”), and various institutions as lenders, including the Guggenheim High Yield Fund (f/k/a Security Income Fund – High Yield Series). The Term Loan lenders received a full repayment of the Term Loan pursuant to a June 1, 2009 court order issued in connection with the General Motors chapter 11 bankruptcy filing. The plaintiff was seeking a court order that the lenders return at least a portion of the proceeds received in 2009 based on the contention that certain UCC financing statements securing the indebtedness due under the Term Loan were terminated (thus releasing collateral secured by the UCC financing statement), rendering the Term Loan under-secured or completely unsecured. As a result, the lawsuit alleges that the Term Loan lenders were at least partially unsecured creditors at the time General Motors filed for bankruptcy, and should not have been paid as fully secured creditors.
After being served, the Guggenheim High Yield Fund filed a motion to dismiss the lawsuit on November 19, 2015. On June 30, 2016, the Bankruptcy Court denied the motion to dismiss, holding that the orders extending the time to serve defendants were valid. On July 14, 2016, the Guggenheim High Yield Fund filed a motion for leave to file an interlocutory appeal of the Bankruptcy Court’s decision, which was denied on March 8, 2017.
On December 18, 2015, the Guggenheim High Yield Fund filed cross-claims against co-defendant JPMorgan related to JPMorgan’s actions as administrative agent in connection with the Term Loan and the termination of the UCC financing statements.
On November 10, 2016, the Motors Trust filed a stipulation and proposed order dismissing its third claim for relief as set forth in its amended complaint, which was so Ordered on November 17, 2016.
On April 24, 2017, a trial commenced in the Bankruptcy Court for the Southern District of New York on the collateral status and valuation of 40 representative assets (the “Representative Asset Trial”). The evidentiary potion of the trial concluded on May 5, 2017, and closing arguments were held on June 5, 2017.
On September 26, 2017, the Bankruptcy Court issued its decision. The Court held that 33 of the 40 assets at issue (the “Representative Assets”) were fixtures and that the majority of the Representative Assets should be valued on a going concern basis. The Avoidance Trust sought leave to appeal portions of the decision on October 10, 2017. The motion for leave to appeal was denied on September 7, 2018.
The parties agreed to attend mediation in front of David Geronemus, Esq in an attempt to consensually resolve the dispute. On February 1, 2019, the parties informed the Bankruptcy Court that they reached an agreement on terms to resolve the lawsuit. On May 10, 2019, the settlement agreement was signed by all the parties necessary to commence the Bankruptcy Court approval process. On May 13, 2019, the Avoidance Trust filed a settlement approval motion with the Bankruptcy Court. On June 12, 2019, the Bankruptcy Court held a hearing on the settlement approval motion. The Bankruptcy Court entered an order approving the settlement agreement the following day, June 13, 2019.
| | THE GUGGENHEIM FUNDS ANNUAL REPORT | 101 |
NOTES TO FINANCIAL STATEMENTS (concluded) |
This lawsuit does not allege any wrongdoing on the part of the Guggenheim High Yield Fund. Per the terms of the settlement agreement, the Avoidance Trust’s lawsuit is dismissed and the Term Loan Lender parties, including Guggenheim High Yield Fund, will be reimbursed for a portion of their legal fees incurred in defending the litigation.
Note 15 – Subsequent Events
The Funds evaluated subsequent events through the date the financial statements were available for issue and determined there were no material events that would require adjustment to or disclosure in the Funds’ financial statements.
102 | THE GUGGENHEIM FUNDS ANNUAL REPORT | |
REPORT OF INDEPENDENT REGISTERED PUBLIC ACCOUNTING FIRM |
To the Shareholders of Guggenheim Diversified Income Fund, Guggenheim High Yield Fund, Guggenheim Investment Grade Bond Fund and Guggenheim Municipal Income Fund and the Board of Trustees of Guggenheim Funds Trust
Opinion on the Financial Statements
We have audited the accompanying statements of assets and liabilities of Guggenheim Diversified Income Fund, Guggenheim High Yield Fund, Guggenheim Investment Grade Bond Fund and Guggenheim Municipal Income Fund (collectively referred to as the “Funds”), (four of the funds constituting Guggenheim Funds Trust (the “Trust”)), including the schedules of investments, as of September 30, 2019, and the related statements of operations and changes in net assets, and the financial highlights for each of the periods indicated in the table below and the related notes (collectively referred to as the “financial statements”). In our opinion, the financial statements present fairly, in all material respects, the financial position of each of the Funds (four of the funds constituting Guggenheim Funds Trust) at September 30, 2019, and the results of their operations, changes in net assets and financial highlights for each of the periods indicated in the table below, in conformity with U.S. generally accepted accounting principles.
Individual fund constituting the
Guggenheim Funds Trust | Statement of operations | Statements of changes
in net assets | Financial highlights |
Guggenheim Diversified Income Fund | For the year ended September 30, 2019 | For each of the two years in the period ended September 30, 2019 | For each of the three years in the period ended September 30, 2019 and the period from January 29, 2016 (commencement of operations) through September 30, 2016. |
Guggenheim High Yield Fund
Guggenheim Investment Grade Bond Fund
Guggenheim Municipal Income Fund | For the year ended September 30, 2019 | For each of the two years in the period ended September 30, 2019 | For each of the five years in the period ended September 30, 2019. |
Basis for Opinion
These financial statements are the responsibility of the Trust’s management. Our responsibility is to express an opinion on each of the Funds’ financial statements based on our audits. We are a public accounting firm registered with the Public Company Accounting Oversight Board (United States) (“PCAOB”) and are required to be independent with respect to the Trust in accordance with the U.S. federal securities laws and the applicable rules and regulations of the Securities and Exchange Commission and the PCAOB.
We conducted our audits in accordance with the standards of the PCAOB. Those standards require that we plan and perform the audit to obtain reasonable assurance about whether the financial statements are free of material misstatement, whether due to error or fraud. The Trust is not required to have, nor were we engaged to perform, an audit of the Trust’s internal control over financial reporting. As part of our audits, we are required to obtain an understanding of internal control over financial reporting, but not for the purpose of expressing an opinion on the effectiveness of the Trust’s internal control over financial reporting. Accordingly, we express no such opinion.
| | THE GUGGENHEIM FUNDS ANNUAL REPORT | 103 |
REPORT OF INDEPENDENT REGISTERED PUBLIC ACCOUNTING FIRM |
Our audits included performing procedures to assess the risks of material misstatement of the financial statements, whether due to error or fraud, and performing procedures that respond to those risks. Such procedures included examining, on a test basis, evidence regarding the amounts and disclosures in the financial statements. Our procedures included confirmation of securities owned as of September 30, 2019, by correspondence with the custodians, transfer agent, brokers, and paying agents or by other appropriate auditing procedures where replies from brokers or paying agents were not received. Our audits also included evaluating the accounting principles used and significant estimates made by management, as well as evaluating the overall presentation of the financial statements. We believe that our audits provide a reasonable basis for our opinion.

We have served as the auditor of one or more Guggenheim investment companies since 1979.
Tysons, Virginia
November 26, 2019
104 | THE GUGGENHEIM FUNDS ANNUAL REPORT | |
OTHER INFORMATION (Unaudited) |
Federal Income Tax Information
This information is being provided as required by the Internal Revenue Code. Amounts shown may differ from those elsewhere in the report because of differences in tax and financial reporting practice.
In January 2020, shareholders will be advised on IRS Form 1099 DIV or substitute 1099 DIV as to the federal tax status of the distributions received by shareholders in the calendar year 2019.
The Funds’ investment income (dividend income plus short-term gains, if any) qualifies as follows:
Municipal Income Fund designates $897,173 as tax-exempt interest income according to IRC Section 852(b)(5)(A).
Of the taxable ordinary income distributions paid during the fiscal year ending September 30, 2019, the following funds had the corresponding percentages qualify for the reduced tax rate pursuant to the Jobs and Growth Tax Relief and Reconciliation Act of 2003 or for the dividends received deduction for corporations. See the qualified dividend income and dividend received deduction columns, respectively, in the table below.
Additionally, of the taxable ordinary income distributions paid during the fiscal year ended September 30, 2019, the following funds had the corresponding percentages qualify as interest related dividends and qualified short-term capital gains as permitted by IRC Section 871(k)(1) and IRC Section 871(k)(2), respectively. See qualified interest income and qualified short-term capital gain columns, respectively, in the table below.
Fund | | Qualified
Dividend
Income | | | Dividend
Received
Deduction | | | Qualified
Interest
Income | | | Qualified
Short-Term
Capital Gain | |
Diversified Income Fund | | | 29.80 | % | | | 29.80 | % | | | 0.64 | % | | | 0.00 | % |
High Yield Fund | | | 1.41 | % | | | 1.41 | % | | | 90.85 | % | | | 0.00 | % |
Investment Grade Bond Fund | | | 0.01 | % | | | 0.01 | % | | | 73.15 | % | | | 0.00 | % |
Municipal Income Fund | | | 0.00 | % | | | 0.00 | % | | | 0.00 | % | | | 100.00 | % |
With respect to the taxable year ended September 30, 2019, the Funds hereby designate as capital gain dividends the amounts listed below, or, if subsequently determined to be different, the net capital gain of such year:
Fund | | From long-term
capital gain: | | | From long-term capital
gain, using proceeds
from shareholder
redemptions: | |
Diversified Income Fund | | $ | 70,988 | | | $ | 583 | |
Municipal Income Fund | | | 98,198 | | | | — | |
Proxy Voting Information
A description of the policies and procedures that the Trust uses to determine how to vote proxies relating to securities held in the Funds’ portfolios is available, without charge and upon request, by calling 800.820.0888. This information is also available from the EDGAR database on the SEC’s website at https://www.sec.gov.
Information regarding how the Funds’ voted proxies relating to portfolio securities during the most recent 12-month period ended June 30 is available without charge, upon request, by calling 800.820.0888. This information is also available from the EDGAR database on the SEC’s website at https://www.sec.gov.
| | THE GUGGENHEIM FUNDS ANNUAL REPORT | 105 |
OTHER INFORMATION (Unaudited)(continued) |
Special Meeting of Shareholders — Voting Results
A joint special meeting of shareholders of the Trust was held on October 28, 2019 to elect the following ten nominees to the Board of Trustees of the Trust: Randall C. Barnes, Angela Brock-Kyle, Donald A. Chubb, Jr., Jerry B. Farley, Roman Friedrich III, Thomas F. Lydon, Jr., Ronald A. Nyberg, Sandra G. Sponem, Ronald E. Toupin, Jr. and Amy J. Lee. At the meeting, the following votes were recorded:
Nominee | | Shares For | | | Shares Withheld | |
Randall C. Barnes | | | 919,263,831 | | | | 7,335,759 | |
Angela Brock-Kyle | | | 919,775,822 | | | | 6,823,768 | |
Donald A. Chubb, Jr. | | | 915,120,874 | | | | 11,478,716 | |
Jerry B. Farley | | | 915,377,483 | | | | 11,222,107 | |
Roman Friedrich III | | | 918,807,442 | | | | 7,792,148 | |
Thomas F. Lydon, Jr. | | | 919,122,642 | | | | 7,476,948 | |
Ronald A. Nyberg | | | 918,889,679 | | | | 7,709,911 | |
Sandra G. Sponem | | | 919,600,708 | | | | 6,998,882 | |
Ronald E. Toupin, Jr. | | | 919,043,208 | | | | 7,556,382 | |
Amy J. Lee | | | 919,943,855 | | | | 6,655,735 | |
Sector Classification
Information in the “Schedule of Investments” is categorized by sectors using sector-level Classifications defined by the Bloomberg Industry Classification System, a widely recognized industry classification system provider. Each Fund’s registration statement has investment policies relating to concentration in specific sectors/industries. For purposes of these investment policies, the Funds usually classify sectors/industries based on industry-level Classifications used by widely recognized industry classification system providers such as Bloomberg Industry Classification System, Global Industry Classification Standards and Barclays Global Classification Scheme.
Quarterly Portfolio Schedules Information
The Trust files its complete schedule of portfolio holdings with the SEC for the first and third quarters of each fiscal year on Form N-Q; which are available on the SEC’s website at https://www.sec.gov. The Funds’ Forms N-Q may be reviewed and copied at the SEC’s Public Reference Room in Washington, DC, and that information on the operation of the Public Reference Room may be obtained by calling 800-SEC-0330. Copies of the portfolio holdings are also available to shareholders, without charge and upon request, by calling 800.820.0888.
106 | THE GUGGENHEIM FUNDS ANNUAL REPORT | |
OTHER INFORMATION (Unaudited)(continued) |
Report of the Guggenheim Funds Trust Contracts Review Committee
Guggenheim Funds Trust (the “Trust”) was organized as a Delaware statutory trust on November 8, 2013, and is registered as an open-end management investment company under the Investment Company Act of 1940, as amended (the “1940 Act”). The Trust includes the following series:
● Guggenheim Alpha Opportunity Fund (“Alpha Opportunity Fund”) ● Guggenheim Diversified Income Fund (“Diversified Income Fund”) ● Guggenheim High Yield Fund (“High Yield Fund”) ● Guggenheim Large Cap Value Fund (“Large Cap Value Fund”) ● Guggenheim Macro Opportunities Fund (“Macro Opportunities Fund”) ● Guggenheim SMid Cap Value Fund (“SMid Cap Value Fund”) ● Guggenheim Municipal Income Fund (“Municipal Income Fund”) ● Guggenheim Small Cap Value Fund (“Small Cap Value Fund”) ● Guggenheim StylePlus—Mid Growth Fund (“StylePlus—Mid Growth Fund”) ● Guggenheim Ultra Short Duration Fund (“Ultra Short Duration Fund”) | ● Guggenheim Capital Stewardship Fund (“Capital Stewardship Fund”) ● Guggenheim Floating Rate Strategies Fund (“Floating Rate Strategies Fund”) ● Guggenheim Investment Grade Bond Fund (“Investment Grade Bond Fund”) ● Guggenheim Limited Duration Fund (“Limited Duration Fund”) ● Guggenheim Market Neutral Real Estate Fund (“Market Neutral Real Estate Fund”) ● Guggenheim SMid Cap Value Institutional Fund (“SMid Cap Value Institutional Fund”) ● Guggenheim Risk Managed Real Estate Fund (“Risk Managed Real Estate Fund”) ● Guggenheim StylePlus—Large Core Fund (“StylePlus—Large Core Fund”) ● Guggenheim Total Return Bond Fund (“Total Return Bond Fund”) ● Guggenheim World Equity Income Fund (“World Equity Income Fund”) |
Security Investors, LLC (“Security Investors”), an indirect subsidiary of Guggenheim Partners, LLC, a privately-held, global investment and advisory firm (“Guggenheim Partners”), serves as investment adviser to each of: (i) Alpha Opportunity Fund; (ii) High Yield Fund; (iii) Investment Grade Bond Fund; (iv) Large Cap Value Fund; (v) SMid Cap Value Fund; (vi) SMid Cap Value Institutional Fund; (vii) Municipal Income Fund; (viii) Small Cap Value Fund; (ix) StylePlus—Large Core Fund; (x) StylePlus—Mid Growth Fund; and (xi) World Equity Income Fund (collectively, the “SI-Advised Funds”). (Guggenheim Partners, Security Investors, Guggenheim Partners Investment Management, LLC (“GPIM”) and their affiliates may be referred to herein collectively as “Guggenheim.” Security Investors and GPIM are also known as “Guggenheim Investments,” the global asset management and investment advisory division of Guggenheim Partners that includes other affiliated investment management businesses.)
Under the terms of investment management agreements between Security Investors and the Trust, with respect to the SI-Advised Funds, Security Investors also is responsible for overseeing the activities of GPIM, an indirect subsidiary of Guggenheim Partners, with respect to its service as investment sub-adviser to Municipal Income Fund, pursuant to an investment sub-advisory agreement between Security Investors and GPIM (the “GPIM Sub-Advisory Agreement”).
| | THE GUGGENHEIM FUNDS ANNUAL REPORT | 107 |
OTHER INFORMATION (Unaudited)(continued) |
GPIM serves as investment adviser with respect to each of: (i) Diversified Income Fund; (ii) Floating Rate Strategies Fund; (iii) Limited Duration Fund; (iv) Macro Opportunities Fund; (v) Market Neutral Real Estate Fund; (vi) Risk Managed Real Estate Fund; (vii) Total Return Bond Fund; and (viii) Ultra Short Duration Fund (collectively, the “GPIM-Advised Funds” and together with the SI-Advised Funds, the “Funds” and individually, a “Fund”).1 Under the supervision of the Board of Trustees of the Trust (the “Board,” with the members of the Board referred to individually as the “Trustees”), the Advisers regularly provide (or, as applicable, oversee the provision of) investment research, advice and supervision, along with a continuous investment program for the Funds, and direct the purchase and sale of securities and other investments for each Fund’s portfolio. GPIM also serves as investment adviser for the Capital Stewardship Fund, which is addressed in a separate report.2
Each of the Advisory Agreements continues in effect from year to year provided that such continuance is specifically approved at least annually by (i) the Board or a majority of the outstanding voting securities (as defined in the 1940 Act) of each Fund, and, in either event, (ii) the vote of a majority of the Trustees who are not “interested person[s],” as defined by the 1940 Act, of the Trust (the “Independent Trustees”) casting votes in person at a meeting called for such purpose. At meetings held in person on April 25, 2019 (the “April Meeting”) and on May 21, 2019 (the “May Meeting”), the members of the Contracts Review Committee of the Board (the “Committee”), consisting solely of the Independent Trustees, met separately from Guggenheim to consider the proposed renewal of the Agreements in connection with the Committee’s annual contract review schedule.
As part of its review process, the Committee was represented by independent legal counsel to the Independent Trustees (“Independent Legal Counsel”), from whom the Independent Trustees received separate legal advice and with whom they met separately. Independent Legal Counsel reviewed and discussed with the Committee various key aspects of the Trustees’ legal responsibilities relating to the proposed renewal of the Agreements and other principal contracts. The Committee took into account various materials received from Guggenheim and Independent Legal Counsel. Recognizing that the evaluation process with respect to the services provided by Guggenheim is an ongoing one, the Committee also considered the variety of written materials, reports and oral presentations the Board receives throughout the year regarding performance and operating results of the Funds and other information relevant to its evaluation of the Agreements.
In connection with the contract review process, FUSE Research Network LLC (“FUSE”), an independent, third-party research provider, was engaged to prepare advisory contract renewal reports designed specifically to help the Board fulfill its advisory contract renewal responsibilities. The objective of the reports is to present the subject funds’ relative position regarding fees, expenses and total return performance, with peer group and universe comparisons. The Committee assessed the data provided in the FUSE reports as well as commentary presented by Guggenheim, including, among other things, a summary of notable distinctions between certain Funds and the applicable peer group identified in the FUSE reports and explanations for custom peer groups created for certain Funds that do not fit well into any particular category.
In addition, Guggenheim provided materials and data in response to formal requests for information sent by Independent Legal Counsel on behalf of the Independent Trustees. Guggenheim also made a presentation at the April Meeting. Throughout the process, the Committee asked questions of management and requested certain additional information, which Guggenheim provided (collectively with the foregoing reports and materials, the “Contract Review Materials”). The Committee considered the Contract Review Materials in the context of its accumulated experience governing the Trust and weighed the factors and standards discussed with Independent Legal Counsel.
Following an analysis and discussion of relevant factors, including those identified below, and in the exercise of its business judgment, the Committee concluded that it was in the best interest of each Fund to recommend that the Board approve the renewal of each of the Advisory Agreements and the GPIM Sub-Advisory Agreement for an additional annual term.
1 | The investment management agreements pertaining to the SI-Advised Funds and the investment management agreements pertaining to the GPIM-Advised Funds are referred to herein together as the “Advisory Agreements” and, together with the GPIM Sub-Advisory Agreement, as the “Agreements.” In addition, unless the context indicates otherwise, GPIM, with respect to its service as investment adviser to the GPIM-Advised Funds, and Security Investors as to the SI-Advised Funds, are each referred to herein as the “Adviser” and together, the “Advisers.” |
2 | Because shares of the Capital Stewardship Fund are only offered for subscription and are held by a limited number of institutional/bank investors, and the Fund issues a shareholder report separate from the other series of the Trust, the factors considered by the Committee in evaluating the proposed renewal of an investment management agreement pertaining to the Capital Stewardship Fund, and the Sub-Advisory Agreement with Concinnity Advisors, LP, are addressed in a separate report of the Committee. Accordingly, references to the “Funds” should be understood as referring to all series of the Trust, excluding Capital Stewardship Fund. |
108 | THE GUGGENHEIM FUNDS ANNUAL REPORT | |
OTHER INFORMATION (Unaudited)(continued) |
Advisory Agreements
Nature, Extent and Quality of Services Provided by each Adviser: With respect to the nature, extent and quality of services currently provided by each Adviser, the Committee considered the qualifications, experience and skills of key personnel performing services for the Funds, including those personnel providing compliance and risk oversight, as well as the supervisors and reporting lines for such personnel. The Committee considered Guggenheim’s resources and related efforts to retain, attract and motivate capable personnel to serve the Funds. In evaluating Guggenheim’s resources and capabilities, the Committee considered Guggenheim’s commitment to focusing on, and investing resources in support of, the Funds.
The Committee’s review of the services provided by Guggenheim to the Funds included consideration of Guggenheim’s investment processes and resulting performance, portfolio oversight and risk management, and the related regular quarterly reports and presentations received by the Board. The Committee took into account the risks borne by Guggenheim in sponsoring and providing services to the Funds, including entrepreneurial, legal and regulatory risks. The Committee considered the resources dedicated by Guggenheim to compliance functions and the reporting made to the Board by Guggenheim compliance personnel regarding Guggenheim’s adherence to regulatory requirements. The Committee also considered the regular reports the Board receives from the Trust’s Chief Compliance Officer regarding compliance policies and procedures established pursuant to Rule 38a-1 under the 1940 Act.
In connection with the Committee’s evaluation of the overall package of services provided by Guggenheim, the Committee considered Guggenheim’s administrative services, including its role in supervising, monitoring, coordinating and evaluating the various services provided by the fund administrator, transfer agent, distributor, custodian and other service providers to the Funds. The Committee evaluated the Office of Chief Financial Officer (the “OCFO”), established to oversee the fund administration, accounting and transfer agency services provided to the Funds, including the OCFO’s resources, personnel and services provided.
With respect to Municipal Income Fund, the Committee noted that, although Security Investors delegated responsibility for the investment and reinvestment of the Fund’s assets to the Sub-Adviser, as affiliated companies, both the Adviser and Sub-Adviser are part of the Guggenheim organization. Further, the Committee took into account Guggenheim’s explanation that investment advisory-related services are provided by many Guggenheim employees under different related legal entities and thus, the services provided by the Adviser on the one hand and the Sub-Adviser on the other, as well as the risks assumed by each party, cannot be ascribed to distinct legal entities.3 As a result, the Committee did not evaluate the services provided to Municipal Income Fund under the Advisory Agreement and the GPIM Sub-Advisory Agreement separately. With respect to Guggenheim’s resources and the ability of each Adviser to carry out its responsibilities under the applicable Advisory Agreement, the Chief Financial Officer of Guggenheim Investments reviewed with the Committee financial information concerning the holding company for Guggenheim Investments, Guggenheim Partners Investment Management Holdings, LLC (“GPIMH”), and the various entities comprising Guggenheim Investments, and provided the audited consolidated financial statements of GPIMH. (Thereafter, the Committee received the audited consolidated financial statements of GPIM.)
The Committee also considered the acceptability of the terms of each Advisory Agreement, including the scope of services required to be performed by each Adviser.
Based on the foregoing, and based on other information received (both oral and written) at the April Meeting and the May Meeting, as well as other considerations, including the Committee’s knowledge of how each Adviser performs its duties obtained through Board meetings, discussions and reports throughout the year, the Committee concluded that each Adviser and its personnel were qualified to serve the Funds in such capacity and may reasonably be expected to continue to provide a high quality of services under each Advisory Agreement with respect to the Funds.
Investment Performance: The Committee received, for each Fund, investment returns for the since-inception, ten-year, five-year, three-year, one-year and three-month periods ended December 31, 2018, as applicable. In addition, the Committee received a comparison of each Fund’s performance to the performance of a benchmark, a universe of funds and a narrower peer group of similar funds based on asset levels as identified by FUSE, in each case for the same periods, as applicable. The Committee also received from FUSE a description of the methodology for identifying each Fund’s peer group and universe for performance and expense comparisons.
3 | Consequently, except where the context indicates otherwise, references to “Adviser” or “Sub-Adviser” should be understood as referring to Guggenheim Investments generally and the services it provides under both Agreements. |
| | THE GUGGENHEIM FUNDS ANNUAL REPORT | 109 |
OTHER INFORMATION (Unaudited)(continued) |
In seeking to evaluate Fund performance over a full market cycle, the Committee focused its attention on five-year and three-year performance rankings as compared to the relevant universe of funds. The Committee considered more recent performance periods for those Funds that were recently launched, as well as in circumstances in which enhancements were being made to the portfolio management processes or techniques employed for a Fund. Except as to the individual Funds discussed below, the Committee observed that the returns of each Fund’s (other than SMid Cap Value Fund) Institutional Class shares and SMid Cap Value Fund’s Class A shares ranked in the third quartile or better of such Fund’s performance universe for each of the relevant periods considered.
In addition, the Committee made the following observations:
Municipal Income Fund: The returns of the Fund’s Institutional Class shares ranked in the 55th and 82nd percentiles of its performance universe for the five-year and three-year periods ended December 31, 2018, respectively. The Committee noted management’s explanation that the Fund’s increased allocation to floating rate securities in 2016 and the Fund’s more conservative investment approach detracted from performance that year, impacting trailing returns for five-year and three-year periods. In light of the foregoing, the Committee also considered the more recent one-year and three-month periods ended December 31, 2018, and observed that the returns of Fund’s Institutional Class shares ranked in the 30th and 11th percentiles, respectively, of its performance universe. The Committee also took into account management’s statement that it expects the Fund’s performance to continue to improve going forward as it anticipates the effects of recent tax reform and idiosyncratic risks.
Small Cap Value Fund: The returns of the Fund’s Institutional Class shares ranked in the 79th and 56th percentiles of its performance universe for the five-year and three-year periods ended December 31, 2018, respectively. The Committee noted measures taken by the Adviser to remedy longer-term relative underperformance with respect to the Value Funds strategy, including strategy enhancements such as implementation of a refined stock selection process and additional risk controls to enforce the strategy’s sell discipline. In light of the foregoing, the Committee also considered the more recent one-year and three-month periods ended December 31, 2018, and observed that the returns of Fund’s Institutional Class shares ranked in the 19th and 20th percentiles, respectively, of its performance universe.
After reviewing the foregoing and related factors, the Committee concluded that: (i) each Fund’s performance was acceptable; or (ii) it was satisfied with Guggenheim’s responses and efforts to improve investment performance.
Comparative Fees, Costs of Services Provided and the Profits Realized by each Adviser from Its Relationship with the Funds: The Committee compared each Fund’s contractual advisory fee, net effective management fee and total net expense ratio to the applicable peer group. The Committee also reviewed the median advisory fees and expense ratios, including expense ratio components (e.g., transfer agency fees, administration fees, other operating expenses, distribution fees and fee waivers/reimbursements), of the peer group of funds.
As part of its evaluation of each Fund’s advisory fee, the Committee considered how such fees compared to the advisory fee charged by the applicable Adviser to one or more other clients that it manages pursuant to similar investment strategies, to the extent applicable, noting that, in certain instances, Guggenheim charges a lower advisory fee to such other clients. In this connection, the Committee considered, among other things, Guggenheim’s representations about the significant differences between managing mutual funds as compared to other types of accounts. The Committee also considered Guggenheim’s explanation that lower fees are charged in certain instances due to various other factors, including the scope of contract, type of investors, fee structure, applicable legal, governance and capital structures, tax status and historical pricing reasons. In addition, the Committee took into account Guggenheim’s discussion of the entrepreneurial, legal and regulatory risks it faces when offering the Funds as compared to other types of accounts. The Committee concluded that the information it received demonstrated that the aggregate services provided to, or the specific circumstances of, each Fund were sufficiently different from the services provided to, or the specific circumstances of, other clients with similar investment strategies and/or the risks borne by Guggenheim were sufficiently greater than those associated with managing other clients with similar investment strategies to support the difference in fees.
In further considering the comparative fee and expense data presented in the Contract Review Materials and addressed by Guggenheim, the Committee took into account those Funds with currently effective expense limitation agreements with the Adviser. Except as to the individual Funds discussed below, the Committee observed that each Fund’s average contractual advisory fee percentile rank across all share classes of the Fund, net effective management fee4 and asset-weighted total net expense ratio each rank in the third quartile or better of such Fund’s peer group.
4 | The “net effective management fee” for each Fund represents the combined effective advisory fee and administration fee as a percentage of average net assets for the latest fiscal year, after any waivers and/or reimbursements, based on the Fund’s class level peer group percent rank, weighted by class level assets under management. |
110 | THE GUGGENHEIM FUNDS ANNUAL REPORT | |
OTHER INFORMATION (Unaudited)(continued) |
In addition, the Committee made the following observations:
Diversified Income Fund: The average contractual advisory fee percentile rank across all share classes of the Fund is in the fourth quartile (78th percentile) of its peer group. The Fund’s net effective management fee ranks in the first quartile (1st percentile) of its peer group. The Committee considered that the Fund’s asset weighted total net expense ratio ranks in the second quartile (38th percentile) of its peer group. The Committee also took into account the Adviser’s statement that the Fund’s currently effective expense limitation agreement with the Adviser is intended to limit the impact of the Fund’s small size.
Floating Rate Strategies Fund: The average contractual advisory fee percentile rank across all share classes of the Fund is in the fourth quartile (92nd percentile) of its peer group. The Fund’s net effective management fee ranks in the fourth quartile (76th percentile) of its peer group. The Committee considered that the Fund’s asset weighted total net expense ratio ranks in the third quartile (58th percentile) of its peer group. The Committee also considered the Adviser’s statement explaining the higher fees that performance is driven by a unique investment approach that requires significant resources. In this regard, the Committee took into consideration the Fund’s strong investment performance for the five-year period ended December 31, 2018. In addition, the Committee noted the Adviser’s statement that the net effective management fee includes 0.08% in administration fees that is not paid to the Adviser. The Committee also took into account the Fund’s currently effective expense limitation agreement with the Adviser.
High Yield Fund: The average contractual advisory fee percentile rank across all share classes of the Fund is in the third quartile (54th percentile) of its peer group. The Fund’s net effective management fee ranks in the fourth quartile (76th percentile) of its peer group. The Fund’s asset weighted total net expense ratio ranks in the third quartile (73rd percentile) of its peer group. The Committee considered the Adviser’s statement explaining the higher fees that performance is driven by a unique investment approach that requires significant resources. In this regard, the Committee took into consideration the Fund’s strong investment performance for the five-year and three-year periods ended December 31, 2018. In addition, the Committee noted the Adviser’s statement that the net effective management fee includes 0.08% in administration fees that is not paid to the Adviser. The Committee also took into account the Fund’s currently effective expense limitation agreement with the Adviser.
Limited Duration Fund: The average contractual advisory fee percentile rank across all share classes of the Fund is in the third quartile (63rd percentile) of its peer group. The Fund’s net effective management fee ranks in the fourth quartile (80th percentile) of its peer group. The Committee considered that the Fund’s asset weighted total net expense ratio ranks in the third quartile (51st percentile) of its peer group. The Committee also considered the Adviser’s statement explaining the higher fees that performance is driven by a unique investment approach that requires significant resources. In this regard, the Committee took into consideration the Fund’s strong investment performance for the five-year and three-year periods ended December 31, 2018. In addition, the Committee noted the Adviser’s statement that the net effective management fee includes 0.08% in administration fees that is not paid to the Adviser. The Committee also took into account the Fund’s currently effective expense limitation agreement with the Adviser.
Macro Opportunities Fund: The average contractual advisory fee percentile rank across all share classes of the Fund, the Fund’s net effective management fee and the Fund’s asset weighted total net expense ratio each rank in the fourth quartile (93rd, 81st and 83rd percentiles, respectively) of its peer group. The Committee noted that the Fund is categorized as a non-traditional bond fund which seeks to add value by investing in many non-traditional securities outside of fixed income, including equities, currencies, commodities and derivatives. The Committee considered the Adviser’s statement explaining the higher fees and expenses that performance is driven by a unique investment approach that requires significant resources. In this regard, the Committee took into consideration the Fund’s strong investment performance for the five-year and three-year periods ended December 31, 2018. The Committee also took into account the Fund’s currently effective expense limitation agreement with the Adviser. The Committee also noted that, in connection with the contract review process, the Adviser formalized an existing expense waiver agreement with the Fund pursuant to which the Adviser waives any Fund expenses attributable to the Fund’s investment in Alpha Opportunity Fund.
SMid Cap Value Institutional Fund: The Fund’s contractual advisory fee ranks in the first quartile (7th percentile) of its peer group. The Fund’s net effective management fee and asset weighted total net expense ratio each rank in the fourth quartile (79th and 86th percentiles, respectively) of its peer group. The Committee considered the Adviser’s statement explaining the higher fees and expenses that it has made adjustments to the strategy of the Fund over the last few years incorporating a more systematic approach in order to improve investment performance. In this regard, the Committee took into consideration the Fund’s strong investment performance for the three-year period ended December 31, 2018. In addition, the Committee noted the Adviser’s statement that the net effective management fee includes 0.08%
| | THE GUGGENHEIM FUNDS ANNUAL REPORT | 111 |
OTHER INFORMATION (Unaudited)(continued) |
in administration fees that is not paid to the Adviser. The Committee also considered the Adviser’s statement that the Fund has continued to experience outflows resulting in lower relative assets to peers and associated higher other operating expenses, and that the Adviser is evaluating strategic measures to improve the Fund’s positioning.
Risk Managed Real Estate Fund: The average contractual advisory fee percentile rank across all share classes of the Fund is in the first quartile (22nd percentile) of its peer group. The Fund’s net effective management fee ranks in the fourth quartile (78th percentile) of its peer group. The Committee considered that the Fund’s asset weighted total net expense ratio ranks in the second quartile (47th percentile) of its peer group. The Committee took into consideration the Fund’s strong investment performance for the three-year and one-year periods ended December 31, 2018. The Committee also took into account the Fund’s currently effective expense limitation agreement with the Adviser.
StylePlus—Large Core Fund: The average contractual advisory fee percentile rank across all share classes of the Fund is in the third quartile (62nd percentile) of its peer group. The Fund’s net effective management fee ranks in the fourth quartile (86th percentile) of its peer group. The Committee considered that the Fund’s asset weighted total net expense ratio ranks in the third quartile (66th percentile) of its peer group. The Committee also considered the Adviser’s statement explaining the higher fees that performance is driven by a unique combination of passive and actively managed strategies. In this regard, the Committee took into consideration the Fund’s strong investment performance for the five-year and three-year periods ended December 31, 2018.
Total Return Bond Fund: The average contractual advisory fee percentile rank across all share classes of the Fund is in the third quartile (68th percentile) of its peer group. The Fund’s net effective management fee ranks in the fourth quartile (78th percentile) of its peer group. The Committee considered that the Fund’s asset weighted total net expense ratio ranks in the 50th percentile of its peer group. The Committee also considered the Adviser’s statement explaining the higher fees that performance is driven by a unique investment approach that requires significant resources. In this regard, the Committee took into consideration the Fund’s strong investment performance for the five-year and three-year periods ended December 31, 2018. In addition, the Committee noted the Adviser’s statement that the net effective management fee includes 0.08% in administration fees that is not paid to the Adviser. The Committee also took into account the Fund’s currently effective expense limitation agreement with the Adviser.
With respect to the costs of services provided and profits realized by Guggenheim Investments from its relationship with the Funds, the Committee reviewed a profitability analysis and data from management for each Fund setting forth the average assets under management for the twelve months ended December 31, 2018, gross revenues received by Guggenheim Investments, expenses allocated to the Fund, expense waivers (as applicable), earnings and the operating margin/profitability rate, including variance information relative to the foregoing amounts as of December 31, 2017. In addition, the Chief Financial Officer of Guggenheim Investments reviewed with, and addressed questions from, the Committee concerning the expense allocation methodology employed in producing the profitability analysis.
In the course of its review of Guggenheim Investments’ profitability, the Committee took into account the methods used by Guggenheim Investments to determine expenses and profit. The Committee considered all of the foregoing in evaluating the costs of services provided, the profitability to Guggenheim Investments and the profitability rates presented, and concluded that the profits were not unreasonable.
The Committee considered other benefits available to each Adviser because of its relationship with the Funds and noted Guggenheim’s statement that it does not believe the Advisers derive any such “fall-out” benefits. In this regard, the Committee noted Guggenheim’s statement that, although it does not consider such benefits to be fall-out benefits, the Advisers may benefit from marketing synergies arising from offering a broad spectrum of products, including the Funds.
Economies of Scale: The Committee received and considered information regarding whether there have been economies of scale with respect to the management of the Funds as Fund assets grow, whether the Funds have appropriately benefited from any economies of scale, and whether there is potential for realization of any further economies of scale. The Committee considered whether economies of scale in the provision of services to the Funds were being passed along to the shareholders. The Committee noted the Adviser’s statements, including that Guggenheim believes it is appropriately sharing potential economies of scale and that costs continue to increase in many key areas, including compensation of portfolio managers, key analysts and support staff, as well as for infrastructure needs, with respect to risk management oversight, valuation processes and disaster recovery systems, among other things, and that, in this regard, management’s costs for providing services have increased in recent years without regard to asset levels.
112 | THE GUGGENHEIM FUNDS ANNUAL REPORT | |
OTHER INFORMATION (Unaudited)(continued) |
The Committee also noted the process employed by the Adviser to evaluate whether it would be appropriate to institute a new breakpoint for a Fund, with consideration given to, among other things: (i) the Fund’s size and trends in asset levels over recent years; (ii) the competitiveness of the expense levels; (iii) whether expense waivers are in place; (iv) changes and trends in revenue and expenses; (v) whether there are any anticipated expenditures that may benefit the Fund in the future; (vi) Fund profit level margins; (vii) relative Fund performance; (viii) the nature, extent and quality of services management provides to the Fund; and (ix) the complexity of the Fund’s investment strategy and the resources required to support the Fund.
As part of its assessment of economies of scale, the Committee also considered Guggenheim’s view that it seeks to share economies of scale through a number of means, including breakpoints, advisory fees set at competitive rates pre-assuming future asset growth, expense waivers and limitations, and investments in personnel, operations and infrastructure to support the Fund business. Thus, the Committee considered the size of the Funds and the competitiveness of and/or other determinations made regarding the current advisory fee for each Fund, as well as whether a Fund is subject to an expense limitation.
Based on the foregoing, the Committee determined that the advisory fee for each Fund was reasonable.
Sub-Advisory Agreement
Nature, Extent and Quality of Services Provided by the Sub-Adviser: As noted above, because both the Adviser and Sub-Adviser for Municipal Income Fund—Security Investors and GPIM, respectively—are part of and do business as Guggenheim Investments and the services provided by the Adviser on the one hand and the Sub-Adviser on the other cannot be ascribed to distinct legal entities, the Committee did not evaluate the services provided under the Advisory Agreement and Sub-Advisory Agreement separately. Therefore, the Committee considered the qualifications, experience and skills of the Fund’s portfolio management team in connection with the Committee’s evaluation of Guggenheim’s investment professionals under the applicable Advisory Agreement.
With respect to Guggenheim’s resources and the Sub-Adviser’s ability to carry out its responsibilities under the Sub-Advisory Agreement, as noted above, the Committee considered the financial condition of GPIMH and the various entities comprising Guggenheim Investments. (Thereafter, the Committee received the audited consolidated financial statements of GPIM.)
The Committee also considered the acceptability of the terms of the Sub-Advisory Agreement, including the scope of services required to be performed by the Sub-Adviser.
Investment Performance: The Committee considered the returns of the Fund under its evaluation of the Advisory Agreement.
Comparative Fees, Costs of Services Provided and the Profits Realized by the Sub-Adviser from Its Relationship with the Fund: The Committee considered that the Sub-Advisory Agreement is with an affiliate of the Adviser, that the Adviser compensates the Sub-Adviser from its own fees so that the sub-advisory fee rate for the Fund does not impact the fees paid by the Fund and that the Sub-Adviser’s revenues were included in the calculation of Guggenheim Investments’ profitability. Given its determination of the reasonableness of the advisory fee, the Committee concluded that the sub-advisory fee rate for the Fund was not unreasonable.
Economies of Scale: The Committee recognized that, because the Sub-Adviser’s fees are paid by the Adviser and not the Fund, the analysis of economies of scale was more appropriate in the context of the Committee’s consideration of the applicable Advisory Agreement, which was separately considered. (See “Advisory Agreements – Economies of Scale” above.)
Overall Conclusions
Based on the foregoing, the Committee determined that the investment advisory fees are fair and reasonable in light of the extent and quality of the services provided and other benefits received and that the continuation of each of the Agreements is in the best interest of each Fund. In reaching this conclusion, no single factor was determinative or conclusive and each Committee member, in the exercise of his business judgment, may afford different weights to different factors. At the May Meeting, the Committee, constituting all of the Independent Trustees, recommended the renewal of each Advisory Agreement and the Sub-Advisory Agreement for an additional annual term.
| | THE GUGGENHEIM FUNDS ANNUAL REPORT | 113 |
INFORMATION ON BOARD OF TRUSTEES AND OFFICERS (Unaudited) |
Name, Address* and
Year of Birth of Trustees | Position(s)
Held with
the Trust | Term of Office
and Length of
Time Served** | Principal Occupation(s)
During Past 5 Years | Number of
Portfolios
in Fund
Complex
Overseen | Other
Directorships
Held by Trustees |
INDEPENDENT TRUSTEES | | | |
Randall C. Barnes (1951) | Trustee | Since 2014 | Current: Private Investor (2001-present). Former: Senior Vice President and Treasurer, PepsiCo, Inc. (1993-1997); President, Pizza Hut International (1991-1993); Senior Vice President, Strategic Planning and New Business Development, PepsiCo, Inc. (1987-1990). | 158 | Current: Trustee, Purpose Investments Funds (2013-present). Former: Managed Duration Investment Grade Municipal Fund (2003-2016). |
Angela Brock-Kyle (1959) | Trustee | Since November 2019 | Current: Founder and Chief Executive Officer, B.O.A.R.D.S (consulting firm). Former: Senior Leader, TIAA (financial services firm) (1987-2012). | 157 | None. |
Donald A. Chubb, Jr. (1946) | Trustee and Chairman of the Valuation Oversight Committee | Since 1994 | Current: Retired. Former: Business broker and manager of commercial real estate, Griffith & Blair, Inc. (1997-2017). | 157 | Former: Midland Care, Inc. (2011-2016). |
Jerry B. Farley (1946) | Trustee and Chairman of the Audit Committee | Since 2005 | Current: President, Washburn University (1997-present). | 157 | Current: CoreFirst Bank & Trust (2000-present). Former: Westar Energy, Inc. (2004-2018). |
Roman Friedrich III (1946) | Trustee and Chairman of the Contracts Review Committee | Since 2014 | Current: Founder and Managing Partner, Roman Friedrich & Company (1998-present). | 157 | Former: Zincore Metals, Inc. (2009-January 2019). |
Thomas F. Lydon, Jr. (1960) | Trustee | Since November 2019 | Current: President, Global Trends Investments (registered investment adviser) (1996-present). | 157 | Current: US Global Investors (GROW) (1995-present); and Harvest Volatility Edge Trust (3) (2017-present). |
114 | THE GUGGENHEIM FUNDS ANNUAL REPORT | |
INFORMATION ON BOARD OF TRUSTEES AND OFFICERS (Unaudited)(continued) |
Name, Address* and
Year of Birth of Trustees | Position(s)
Held with
the Trust | Term of Office
and Length of
Time Served** | Principal Occupation(s)
During Past 5 Years | Number of
Portfolios
in Fund
Complex
Overseen | Other
Directorships
Held by Trustees |
INDEPENDENT TRUSTEES - concluded | | |
Ronald A. Nyberg (1953) | Trustee and Chairman of the Nominating and Governance Committee | Since 2014 | Current: Partner, Momkus LLC (2016-present). Former: Partner, Nyberg & Cassioppi, LLC (2000-2016); Executive Vice President, General Counsel, and Corporate Secretary, Van Kampen Investments (1982-1999). | 158 | Current: PPM Funds (9) (2018-present); Edward-Elmhurst Healthcare System (2012-present); Western Asset Inflation-Linked Opportunities & Income Fund (2004-present); Western Asset Inflation-Linked Income Fund (2003-present). Former: Managed Duration Investment Grade Municipal Fund (2003-2016). |
Sandra G. Sponem (1958) | Trustee | Since November 2019 | Current: Retired. Former: Senior Vice President and Chief Financial Officer, M.A. Mortenson Companies, Inc. (general contracting firm) (2007-2017). | 157 | Current: SPDR Series Trust (78) (2018-present); SPDR Index Shares Funds (31) (2018-present); SSGA Active Trust (12) (2018-present); and SSGA Master Trust (1) (2018-present). |
Ronald E. Toupin, Jr. (1958) | Trustee and Chairman of the Board | Since 2014 | Current: Portfolio Consultant (2010-present); Member, Governing Council, Independent Directors Council (2013-present); Governor, Board of Governors, Investment Company Institute (2018-present). Former: Member, Executive Committee, Independent Directors Council (2016-2018); Vice President, Manager and Portfolio Manager, Nuveen Asset Management (1998-1999); Vice President, Nuveen Investment Advisory Corp. (1992-1999); Vice President and Manager, Nuveen Unit Investment Trusts (1991-1999); and Assistant Vice President and Portfolio Manager, Nuveen Unit Investment Trusts (1988-1999), each of John Nuveen & Co., Inc. (1982-1999). | 157 | Current: Western Asset Inflation-Linked Opportunities & Income Fund (2004-present); Western Asset Inflation-Linked Income Fund (2003-present). Former: Managed Duration Investment Grade Municipal Fund (2003-2016). |
| | THE GUGGENHEIM FUNDS ANNUAL REPORT | 115 |
INFORMATION ON BOARD OF TRUSTEES AND OFFICERS (Unaudited)(continued) |
Name, Address* and
Year of Birth of Trustees | Position(s)
Held with
the Trust | Term of Office
and Length of
Time Served** | Principal Occupation(s)
During Past 5 Years | Number of
Portfolios
in Fund
Complex
Overseen | Other
Directorships
Held by Trustees |
INTERESTED TRUSTEE | |
Amy J. Lee*** (1961) | Trustee, Vice President and Chief Legal Officer | Since 2018 (Trustee) Since 2014 (Chief Legal Officer) Since 2007 (Vice President) | Current: Interested Trustee, certain other funds in the Fund Complex (2018-present); Chief Legal Officer, certain other funds in the Fund Complex (2014-present); Vice President, certain other funds in the Fund Complex (2007-present); Senior Managing Director, Guggenheim Investments (2012-present). Former: President and Chief Executive Officer (2017-2018); President, certain other funds in the Fund Complex (2017-November 2019); Vice President, Associate General Counsel and Assistant Secretary, Security Benefit Life Insurance Company and Security Benefit Corporation (2004-2012). | 157 | None. |
* | The business address of each Trustee is c/o Guggenheim Investments, 227 West Monroe Street, Chicago, Illinois 60606. |
** | Each Trustee serves an indefinite term, until his or her successor is elected and qualified. Time served includes time served in the respective position for the Predecessor Corporation. |
*** | This Trustee is deemed to be an “interested person” of the Funds under the 1940 Act by reason of her position with the Funds’ Investment Manager and/or the parent of the Investment Manager. |
116 | THE GUGGENHEIM FUNDS ANNUAL REPORT | |
INFORMATION ON BOARD OF TRUSTEES AND OFFICERS (Unaudited)(continued) |
Name, Address*
and Year of Birth | Position(s)
Held with
the Trust | Term of Office
and Length of
Time Served** | Principal Occupations
During Past 5 Years |
OFFICERS | | | |
Brian E. Binder (1972) | President and Chief Executive Officer | Since 2018 | Current: President and Chief Executive Officer, certain other funds in the Fund Complex (2018-present); President and Chief Executive Officer, Guggenheim Funds Investment Advisors, LLC and Security Investors, LLC (2018-present); Senior Managing Director and Chief Administrative Officer, Guggenheim Investments (2018-present). Former: Managing Director and President, Deutsche Funds, and Head of US Product, Trading and Fund Administration, Deutsche Asset Management (2013-2018); Managing Director, Head of Business Management and Consulting, Invesco Ltd. (2010-2012). |
James M. Howley (1972) | Assistant Treasurer | Since 2014 | Current: Managing Director, Guggenheim Investments (2004-present); Assistant Treasurer, certain other funds in the Fund Complex (2006-present). Former: Manager, Mutual Fund Administration of Van Kampen Investments, Inc. (1996-2004). |
Mark E. Mathiasen (1978) | Secretary | Since 2014 | Current: Secretary, certain other funds in the Fund Complex (2007-present); Managing Director, Guggenheim Investments (2007-present). |
Glenn McWhinnie (1969) | Assistant Treasurer | Since 2016 | Current: Vice President, Guggenheim Investments (2009-present); Assistant Treasurer, certain other funds in the Fund complex (2016-present). |
Michael P. Megaris (1984) | Assistant Secretary | Since 2014 | Current: Assistant Secretary, certain other funds in the Fund Complex (2014-present); Director, Guggenheim Investments (2012-present). |
Elisabeth Miller (1968) | Chief Compliance Officer | Since 2012 | Current: Chief Compliance Officer, certain other funds in the Fund Complex (2012-present); Senior Managing Director, Guggenheim Investments (2012-present); Vice President, Guggenheim Funds Distributors, LLC (2014-present). Former: Chief Compliance Officer, Security Investors, LLC and Guggenheim Funds Investment Advisors, LLC (2012-2018); Chief Compliance Officer, Guggenheim Distributors, LLC (2009-2014); Senior Manager, Security Investors, LLC (2004-2014); Senior Manager, Guggenheim Distributors, LLC (2004-2014). |
Margaux Misantone (1978) | AML Officer | Since 2017 | Current: Chief Compliance Officer, Security Investors, LLC and Guggenheim Funds Investment Advisors, LLC (2018-present); AML Officer, Security Investors, LLC and certain other funds in the Fund Complex (2017-present); Managing Director, Guggenheim Investments (2015-present). Former: Assistant Chief Compliance Officer, Security Investors, LLC and Guggenheim Funds Investments Advisors, LLC (2015-2018). |
Adam J. Nelson (1979) | Assistant Treasurer | Since 2015 | Current: Vice President, Guggenheim Investments (2015-present); Assistant Treasurer, certain other funds in the Fund Complex (2015-present). Former: Assistant Vice President and Fund Administration Director, State Street Corporation (2013-2015); Fund Administration Assistant Director, State Street (2011-2013); Fund Administration Manager, State Street (2009-2011). |
| | THE GUGGENHEIM FUNDS ANNUAL REPORT | 117 |
INFORMATION ON BOARD OF TRUSTEES AND OFFICERS (Unaudited)(concluded) |
Name, Address*
and Year of Birth | Position(s)
Held with
the Trust | Term of Office
and Length of
Time Served** | Principal Occupations
During Past 5 Years |
OFFICERS - concluded | |
Kimberly J. Scott (1974) | Assistant Treasurer | Since 2014 | Current: Director, Guggenheim Investments (2012-present); Assistant Treasurer, certain other funds in the Fund Complex (2012-present). Former: Financial Reporting Manager, Invesco, Ltd. (2010-2011); Vice President/Assistant Treasurer, Mutual Fund Administration for Van Kampen Investments, Inc./Morgan Stanley Investment Management (2009-2010); Manager of Mutual Fund Administration, Van Kampen Investments, Inc./Morgan Stanley Investment Management (2005-2009). |
Bryan Stone (1979) | Vice President | Since 2014 | Current: Vice President, certain other funds in the Fund Complex (2014-present); Managing Director, Guggenheim Investments (2013-present). Former: Senior Vice President, Neuberger Berman Group LLC (2009-2013); Vice President, Morgan Stanley (2002-2009). |
John L. Sullivan (1955) | Chief Financial Officer, Chief Accounting Officer and Treasurer | Since 2014 | Current: Chief Financial Officer, Chief Accounting Officer and Treasurer, certain other funds in the Fund Complex (2010-present); Senior Managing Director, Guggenheim Investments (2010-present). Former: Managing Director and Chief Compliance Officer, each of the funds in the Van Kampen Investments fund complex (2004-2010); Managing Director and Head of Fund Accounting and Administration, Morgan Stanley Investment Management (2002-2004); Chief Financial Officer and Treasurer, Van Kampen Funds (1996-2004). |
Jon Szafran (1989) | Assistant Treasurer | Since 2017 | Current: Vice President, Guggenheim Investments (2017-present); Assistant Treasurer, certain other funds in the Fund Complex (2017-present). Former: Assistant Treasurer of Henderson Global Funds and Manager of US Fund Administration, Henderson Global Investors (North America) Inc. (“HGINA”), (2017); Senior Analyst of US Fund Administration, HGINA (2014-2017); Senior Associate of Fund Administration, Cortland Capital Market Services, LLC (2013-2014); Experienced Associate, PricewaterhouseCoopers LLP (2012-2013). |
* | The business address of each officer is c/o Guggenheim Investments, 227 West Monroe Street, Chicago, Illinois 60606. |
** | Each officer serves an indefinite term, until his or her successor is duly elected and qualified. |
118 | THE GUGGENHEIM FUNDS ANNUAL REPORT | |
GUGGENHEIM INVESTMENTS PRIVACY NOTICE (Unaudited) |
Who We Are
This Privacy Notice describes the data protection practices of Guggenheim Investments. Guggenheim Investments as used herein refers to the affiliated investment management businesses of Guggenheim Partners, LLC: Guggenheim Funds Investment Advisors, LLC, Guggenheim Partners Investment Management, LLC, Guggenheim Funds Distributors, LLC, Security Investors, LLC, Guggenheim Investment Advisors (Europe) Limited, Guggenheim Real Estate, LLC, GS Gamma Advisors, LLC, Guggenheim Partners India Management, LLC, Guggenheim Partners Europe Limited, as well as the funds in the Guggenheim Funds complex (the “Funds”) (“Guggenheim Investments,” “we,” “us,” or “our”).
Guggenheim Partners Investment Management Holdings, LLC, located at 330 Madison Avenue, New York, New York 10017 is the data controller for your information. The affiliates who are also controllers of certain of your information are: Guggenheim Investment Advisors (Europe) Limited, Guggenheim Partners Europe Limited, Guggenheim Partners, LLC, Guggenheim Funds Investment Advisors, LLC, Guggenheim Partners Investment Management, LLC, Guggenheim Funds Distributors, LLC and Security Investors, LLC, as well as the Funds.
Our Commitment to You
Guggenheim Investments considers your privacy our utmost concern. When you become our client or investor, you entrust us with not only your hard-earned money but also with your personal and financial information. Because we have access to your private information, we hold ourselves to the highest standards in its safekeeping and use. We strictly limit how we share your information with others, whether you are a current or former Guggenheim Investments client or investor.
The Information We Collect About You
We collect certain nonpublic personal information about you from information you provide on applications, other forms, our website, and/or from third parties including investment advisors. This information includes Social Security or other tax identification number, assets, income, tax information, retirement and estate plan information, transaction history, account balance, payment history, bank account information, marital status, family relationships, information that we collect on our website through the use of “cookies,” and other personal information that you or others provide to us. We may also collect such information through your inquiries by mail, e-mail or telephone. We may also collect customer due diligence information, as required by applicable law and regulation, through third party service providers.
How We Handle Your Personal Information
The legal basis for using your information as set out in this Privacy Notice is as follows: (a) use of your personal data is necessary to perform our obligations under any contract with you (such as a contract for us to provide financial services to you); or (b) where use of your personal data is not necessary for performance of a contract, use of your personal data is necessary for our legitimate interests or the legitimate interests of others (for example, to enforce the legal terms governing our services, operate and market our website and other services we offer, ensure safe environments for our personnel and others, make and receive payments, prevent fraud and to know the customer to whom we are providing the services). Some processing is done to comply with applicable law.
In addition to the specific uses described above, we also use your information in the following manner:
| | ● | We use your information in connection with servicing your accounts. |
| | ● | We use information to respond to your requests or questions. For example, we might use your information to respond to your customer feedback. |
| | ● | We use information to improve our products and services. We may use your information to make our website and products better. We may use your information to customize your experience with us. |
| | ● | We use information for security purposes. We may use your information to protect our company and our customers. |
| | ● | We use information to communicate with you. For example, we will communicate with you about your account or our relationship. We may contact you about your feedback. We might also contact you about this Privacy Notice. We may also enroll you in our email newsletter. |
| | THE GUGGENHEIM FUNDS ANNUAL REPORT | 119 |
GUGGENHEIM INVESTMENTS PRIVACY NOTICE (Unaudited)(continued) |
| | ● | We use information as otherwise permitted by law, as we may notify you. |
| | ● | Aggregate/Anonymous Data. We may aggregate and/or anonymize any information collected through the website so that such information can no longer be linked to you or your device (“Aggregate/Anonymous Information”). We may use Aggregate/Anonymous Information for any purpose, including without limitation for research and marketing purposes, and may also share such data with any third parties, including advertisers, promotional partners, and sponsors. |
We do not sell information about current or former clients or their accounts to third parties. Nor do we share this information, except when necessary to complete transactions at your request, to make you aware of investment products and services that we or our affiliates offer, or as permitted or required by law.
We provide information about you to companies and individuals not affiliated with Guggenheim Investments to complete certain transactions or account changes, or to perform services for us related to your account. For example, if you ask to transfer assets from another financial institution to Guggenheim Investments, we must provide certain information about you to that company to complete the transaction. We provide the third party with only the information necessary to carry out its responsibilities and only for that purpose. And we require these third parties to treat your private information with the same high degree of confidentiality that we do. To alert you to other Guggenheim Investments products and services, we share your information within our family of affiliated companies. You may limit our sharing with affiliated companies as set out below. We may also share information with any successor to all or part of our business, or in connection with steps leading up to a merger or acquisition. For example, if part of our business was sold we may give customer information as part of that transaction. We may also share information about you with your consent.
We will release information about you if you direct us to do so, if we are compelled by law to do so, or in other circumstances as permitted by law (for example, to protect your account from fraud).
If you close your account(s) or become an inactive client or investor, we will continue to adhere to the privacy policies and practices described in this notice.
Opt-Out Provisions and Your Data Choices
The law allows you to “opt out” of certain kinds of information sharing with third parties. We do not share personal information about you with any third parties that triggers this opt-out right. This means YOU ARE ALREADY OPTED OUT.
When you are no longer our client or investor, we continue to share your information as described in this notice, and you may contact us at any time to limit our sharing by sending an email to CorporateDataPrivacy@GuggenheimPartners.com.
European Union Data Subjects and certain others: In addition to the choices set forth above, residents of the European Union and certain other jurisdictions have certain rights to (1) request access to or rectification or deletion of information we collect about them, (2) request a restriction on the processing of their information, (3) object to the processing of their information, or (4) request the portability of certain information. To exercise these or other rights, please contact us using the contact information below. We will consider all requests and provide our response within the time period stated by applicable law. Please note, however, that certain information may be exempt from such requests in some circumstances, which may include if we need to keep processing your information for our legitimate interests or to comply with a legal obligation. We may request you provide us with information necessary to confirm your identity before responding to your request.
Residents of France and certain other jurisdictions may also provide us with instructions regarding the manner in which we may continue to store, erase and share your information after your death, and where applicable, the person you have designated to exercise these rights after your death.
120 | THE GUGGENHEIM FUNDS ANNUAL REPORT | |
GUGGENHEIM INVESTMENTS PRIVACY NOTICE (Unaudited)(concluded) |
How We Protect Privacy Online
We take steps to protect your privacy when you use our web site – www.guggenheiminvestments.com – by using secure forms of online communication, including encryption technology, Secure Socket Layer (SSL) protocol, firewalls and user names and passwords. These safeguards vary based on the sensitivity of the information that we collect and store. However, we cannot and do not guarantee that these measures will prevent every unauthorized attempt to access, use, or disclose your information since despite our efforts, no Internet and/or other electronic transmissions can be completely secure. Our web site uses “http cookies”—tiny pieces of information that we ask your browser to store. We use cookies for session management and security features on the Guggenheim Investments web site. We do not use them to pull data from your hard drive, to learn your e-mail address, or to view data in cookies created by other web sites. We will not share the information in our cookies or give others access to it. See the legal information area on our web site for more details about web site security and privacy features.
How We Safeguard Your Personal Information and Data Retention
We restrict access to nonpublic personal information about you to our employees and in some cases to third parties (for example, the service providers described above) as permitted by law. We maintain strict physical, electronic and procedural safeguards that comply with federal standards to guard your nonpublic personal information.
We keep your information for no longer than necessary for the purposes for which it is processed. The length of time for which we retain information depends on the purposes for which we collected and use it and/or as required to comply with applicable laws. Information may persist in copies made for backup and business continuity purposes for additional time.
International Visitors
If you are not a resident of the United States, please be aware that your information may be transferred to, stored and processed in the United States where our servers are located and our databases are operated. The data protection and other laws of the United States and other countries might not be as comprehensive as those in your country.
In such cases, we ensure that a legal basis for such a transfer exists and that adequate protection is provided as required by applicable law, for example, by using standard contractual clauses or by transferring your data to a jurisdiction that has obtained an adequacy finding. Individuals whose data may be transferred on the basis of standard contractual clauses may contact us as described below.
We’ll Keep You Informed
If you have any questions or concerns about how we treat your personal data, we encourage you to consult with us first. You may also contact the relevant supervisory authority.
We reserve the right to modify this policy at any time and will inform you promptly of material changes. You may access our privacy policy from our web site at www.guggenheiminvestments.com. Should you have any questions regarding our privacy policy, contact us by email at CorporateDataPrivacy@GuggenheimPartners.com.
| | THE GUGGENHEIM FUNDS ANNUAL REPORT | 121 |
This page intentionally left blank.
This page intentionally left blank.
This page intentionally left blank.
This page intentionally left blank.
9.30.2019
Guggenheim Funds Annual Report
Guggenheim SMid Cap Value Fund
(formerly known as Guggenheim Mid Cap Value Fund) | | |
Guggenheim SMid Cap Value Institutional Fund
(formerly known as Guggenheim Mid Cap Value Institutional Fund) | | |
Beginning on January 1, 2021, paper copies of the Funds’ annual and semi-annual shareholder reports may no longer be sent by mail, unless you specifically request paper copies of the reports from a fund or from your financial intermediary. Instead, the reports will be made available on a website, and you will be notified by mail each time a report is posted and provided with a website link to access the report.
If you already elected to receive shareholder reports electronically, you will not be affected by this change and you need not take any action. At any time, you may elect to receive reports and other communications from a fund electronically by calling 800.820.0888, going to GuggenheimInvestments.com/myaccount, or by contacting your financial intermediary.
You may elect to receive all future shareholder reports in paper free of charge. If you hold shares of a fund directly, you can inform the Fund that you wish to receive paper copies of reports by calling 800.820.0888. If you hold shares of a fund through a financial intermediary, please contact the financial intermediary to make this election. Your election to receive reports in paper will apply to all Guggenheim Funds in which you are invested and may apply to all funds held with your financial intermediary.
GuggenheimInvestments.com | SBMCV-ANN-0919x0920 |

| | |
DEAR SHAREHOLDER | 2 |
ECONOMIC AND MARKET OVERVIEW | 4 |
ABOUT SHAREHOLDERS’ FUND EXPENSES | 6 |
SMID CAP VALUE FUND | 9 |
SMID CAP VALUE INSTITUTIONAL FUND | 25 |
NOTES TO FINANCIAL STATEMENTS | 37 |
REPORT OF INDEPENDENT REGISTERED PUBLIC ACCOUNTING FIRM | 47 |
OTHER INFORMATION | 49 |
INFORMATION ON BOARD OF TRUSTEES AND OFFICERS | 63 |
GUGGENHEIM INVESTMENTS PRIVACY NOTICE | 70 |
| | THE GUGGENHEIM FUNDS ANNUAL REPORT | 1 |
Dear Shareholder:
Security Investors, LLC (the “Investment Adviser”) is pleased to present the shareholder report for Guggenheim SMid Cap Value Fund and the Guggenheim SMid Cap Value Institutional Fund (the “Fund” or “Funds”) for the annual fiscal period ended September 30, 2019.
To more accurately align the Funds’ names with the underlying investment strategies, the Board of Trustees of Guggenheim Funds Trust approved changes in the Funds’ names from Guggenheim Mid Cap Value Fund and Guggenheim Mid Cap Value Institutional Fund to Guggenheim SMid Cap Value Fund and Guggenheim SMid Cap Value Institutional Fund, respectively. These name changes went into effect on November 11, 2019. In addition, to streamline our product offerings and seek to benefit shareholders, the Guggenheim SMid Cap Value Institutional Fund will merge into a newly created Institutional share class of the Guggenheim SMid Cap Value Fund. The merger is anticipated to be completed in January 2020.
The Investment Adviser is part of Guggenheim Investments, which represents the investment management businesses of Guggenheim Partners, LLC (“Guggenheim”), a global, diversified financial services firm.
Guggenheim Funds Distributors, LLC is the distributor of the Funds. Guggenheim Funds Distributors, LLC is affiliated with Guggenheim and the vestment Adviser.
We encourage you to read the Economic and Market Overview section of the report, which follows this letter and then the Managers’ Commentary for each Fund.
We are committed to providing innovative investment solutions and appreciate the trust you place in us.
Sincerely,
Security Investors, LLC
October 31, 2019
Read a prospectus and summary prospectus (if available) carefully before investing. It contains the investment objectives, risks, charges, expenses and other information, which should be considered carefully before investing. Obtain a prospectus and summary prospectus (if available) at guggenheiminvestments.com or call 800.820.0888.
This material is not intended as a recommendation or as investment advice of any kind, including in connection with rollovers, transfers, and distributions. Such material is not provided in a fiduciary capacity, may not be relied upon for or in connection with the making of investment decisions, and does not constitute a solicitation of an offer t buy or sell securities. All content has been provided for informational or educational purposes only and is not intended to be and should not be construed as legal or tax advice and/or a legal opinion. Always consult a financial, tax and/or legal professional regarding your specific situation.
2 | THE GUGGENHEIM FUNDS ANNUAL REPORT | |
The Funds may not be suitable for all investors. ● An investment in the Funds will fluctuate and is subject to investment risks, which means investors could lose money. ● The intrinsic value of the underlying stocks may never be realized, or the stock may decline in value. ● Investments in small- and/or mid-sized company securities may present additional risks such as less predictable earnings, higher volatility and less liquidity than larger, more established companies. ● Please read the prospectus for more detailed information regarding these and other risks.
| | THE GUGGENHEIM FUNDS ANNUAL REPORT | 3 |
ECONOMIC AND MARKET OVERVIEW (Unaudited) | September 30, 2019 |
Economic data has been mixed over the past few months. On the positive side, we saw a pickup in the housing market as measured by housing starts and home sales, which could be a delayed response to lower mortgage rates. Industrial production had the strongest month-over-month gain in a year, partially boosted by an increase in oil production in Hurricane Barry’s wake. The unemployment rate fell to a 50-year low of 3.5% in September 2019, despite a continued moderation in payroll gains.
On the negative side, the Institute for Supply Management (“ISM”) Manufacturing Index plunged to the weakest reading since June 2009. The ISM Non-Manufacturing Index also came in well below expectations, the lowest since August 2016. Within both the manufacturing and non-manufacturing ISM indexes, analysts look at the employment component of the survey for an early read on other labor market indicators. Here we find more cause for concern: The non-manufacturing survey’s employment component is now barely above 50 while the manufacturing employment sub-index stands at 46.3, well into contraction territory. Combined, the outlook for output and hiring has dimmed, signaling trouble ahead for consumers.
Retail sales have been steady, but Commerce Department data showed that total consumer spending on goods and services increased only 0.1% month-over-month in August 2019, the smallest gain in six months. It is hard to identify the primary reason why consumers may already be turning more conservative on spending. Income growth looks steady, the equity market is higher year-to-date, and rates are lower, all of which should be boosting consumer confidence. Sentiment surveys, however, show that fewer consumers believe now is a good time to buy homes, vehicles, and household durables, and headline consumer confidence measures have ticked down. We believe trade policy and political concerns are weighing on sentiment, and these headwinds are set to ramp up further. Additional U.S. tariffs on China are due to take effect on December 15, 2019, and the U.S. House of Representatives is pressing forward with its impeachment inquiry into President Trump.
Guggenheim’s dashboard of U.S. recession indicators continues to point to a recession beginning as early as the first half of 2020, and we think the economic data is corroborating this view. Two of the more notable indicators pointing to high recession risk are the three-month/10-year U.S. Treasury yield curve, which has been inverted for 16 consecutive weeks through period end, and the Leading Economic Indicators Index which has slowed from a year-over-year growth rate of 6.6% in September 2018 to 1.1% as of August 2019. The indicators Guggenheim tracks as part of our recession probability model indicate a nearly 50% chance that a recession will come before mid-2020, and a 70% chance that it will arrive by mid-2021.
Over the period, the U.S. Treasury curve continued its overall flattening trend, as the difference between the two-year U.S. Treasury and 10-year U.S. Treasury narrowed to 5 basis points. Equity markets remained volatile, buoyed by a 25 basis point cut in July and September 2019 by the U.S. Federal Reserve (the “Fed”) and relatively strong U.S. economic data, but weighed down by trade war uncertainty and fears of a global slowdown.
4 | THE GUGGENHEIM FUNDS ANNUAL REPORT | |
ECONOMIC AND MARKET OVERVIEW (Unaudited)(concluded) | September 30, 2019 |
With downside risks growing, markets have become more sensitive to the Fed’s communications about the future stance of monetary policy. Despite the two rate cuts, Fed policymakers are deeply divided. It is still unclear whether the Fed will deliver the aggressive and preemptive policy action that would prolong the current expansion.
As it relates to risk-taking, we are not confident that the Fed would succeed in easing credit conditions if conditions were to tighten materially. The Fed may act too late, or its actions may have little impact given that low rates this year have largely failed to stimulate growth. With credit spreads still relatively tight on a historical basis, we believe it is prudent to remain up in quality as we await better opportunities to deploy capital in riskier credit sectors in the coming downturn.
For the 12-month period ended September 30, 2019, the Standard & Poor’s 500® (“S&P 500”) Index* returned 4.25%. The MSCI Europe-Australasia-Far East (“EAFE”) Index* returned -0.82%. The return of the MSCI Emerging Markets Index* was -1.63%.
In the bond market, the Bloomberg Barclays U.S. Aggregate Bond Index* posted a 10.30% return for the period, while the Bloomberg Barclays U.S. Corporate High Yield Index* returned 6.36%. The return of the ICE Bank of America (“BofA”) Merrill Lynch 3-Month U.S. Treasury Bill Index* was 2.39% for the 12-month period.
The opinions and forecasts expressed may not actually come to pass. This information is subject to change at any time, based on market and other conditions, and should not be construed as a recommendation of any specific security or strategy.
*Index Definitions
Indices are unmanaged and not available for direct investment. Index performance does not reflect transaction costs, fees, or expenses.
Bloomberg Barclays U.S. Aggregate Bond Index is a broad-based flagship benchmark that measures the investment grade, U.S. dollar-denominated, fixed-rate taxable bond market, including U.S. Treasuries, government-related and corporate securities, mortgage-backed securities or “MBS” (agency fixed-rate and hybrid adjustable-rate mortgage, or “ARM”, pass-throughs), asset-backed securities (“ABS”), and commercial mortgage-backed securities (“CMBS”) (agency and non-agency).
Bloomberg Barclays U.S. Corporate High Yield Index measures the U.S. dollar-denominated, high yield, fixed-rate corporate bond market. Securities are classified as high yield if the middle rating of Moody’s, Fitch, and S&P is Ba1/BB +/BB + or below.
ICE BofA Merrill Lynch 3-Month U.S. Treasury Bill Index is an unmanaged market Index of U.S. Treasury securities maturing in 90 days that assumes reinvestment of all income.
MSCI EAFE Index is a free floating-adjusted market capitalization index that is designed to measure the equity market performance of developed markets, excluding the U.S. & Canada.
MSCI Emerging Markets Index is a free float-adjusted market capitalization-weighted index that is designed to measure equity market performance in the global emerging markets.
Russell 2500® Value Index measures the performance of the small-to mid-cap value segment of the U.S. equity universe. It includes those Russell 2500 companies with lower price-to-book ratios and lower forecasted growth values.
S&P 500® is a broad-based index, the performance of which is based on the performance of 500 widely held common stocks chosen for market size, liquidity, and industry group representation.
| | THE GUGGENHEIM FUNDS ANNUAL REPORT | 5 |
ABOUT SHAREHOLDERS’ FUND EXPENSES (Unaudited) |
All mutual funds have operating expenses, and it is important for our shareholders to understand the impact of costs on their investments. Shareholders of a fund incur two types of costs: (i) transaction costs, including sales charges (loads) on purchase payments, reinvested dividends, other distributions, and exchange fees, and (ii) ongoing costs, including management fees, administrative services, and shareholder reports, among others. These ongoing costs, or operating expenses, are deducted from a fund’s gross income and reduce the investment return of the fund.
A fund’s expenses are expressed as a percentage of its average net assets, which is known as the expense ratio. The following examples are intended to help investors understand the ongoing costs (in dollars) of investing in a fund and to compare these costs with the ongoing costs of investing in other mutual funds.
The examples are based on an investment of $1,000 made at the beginning of the period and held for the entire six-month period beginning March 31, 2019 and ending September 30, 2019.
The following tables illustrate the Funds’ costs in two ways:
Table 1. Based on actual Fund return: This section helps investors estimate the actual expenses paid over the period. The “Ending Account Value” shown is derived from the Fund’s actual return, and the fifth column shows the dollar amount that would have been paid by an investor who started with $1,000 in the Fund. Investors may use the information here, together with the amount invested, to estimate the expenses paid over the period. Simply divide the Fund’s account value by $1,000 (for example, an $8,600 account value divided by $1,000 = 8.6), then multiply the result by the number provided under the heading “Expenses Paid During Period.”
Table 2. Based on hypothetical 5% return: This section is intended to help investors compare a fund’s cost with those of other mutual funds. The table provides information about hypothetical account values and hypothetical expenses based on the Fund’s actual expense ratio and an assumed rate of return of 5% per year before expenses, which is not the Fund’s actual return. The hypothetical account values and expenses may not be used to estimate the actual ending account balance or expenses paid during the period. The example is useful in making comparisons because the U.S. Securities and Exchange Commission (the “SEC”) requires all mutual funds to calculate expenses based on the 5% return. Investors can assess a fund’s costs by comparing this hypothetical example with the hypothetical examples that appear in shareholder reports of other funds.
The calculations illustrated above assume no shares were bought or sold during the period. Actual costs may have been higher or lower, depending on the amount of investment and the timing of any purchases or redemptions.
6 | THE GUGGENHEIM FUNDS ANNUAL REPORT | |
ABOUT SHAREHOLDERS’ FUND EXPENSES (Unaudited)(continued) |
Please note that the expenses shown in the table are meant to highlight your ongoing costs only and do not reflect any transactional costs, such as sales charges (loads) on purchase payments, and contingent deferred sales charges (“CDSC”) on redemptions, if any. Therefore, the second table is useful in comparing ongoing costs only, and will not help you determine the relative total costs of owning different funds. In addition, if these transactional costs were included, your costs would have been higher.
More information about the Funds’ expenses, including annual expense ratios for periods up to five years (subject to the Fund’s inception date), can be found in the Financial Highlights section of this report. For additional information on operating expenses and other shareholder costs, please refer to the appropriate Fund prospectus.
| | THE GUGGENHEIM FUNDS ANNUAL REPORT | 7 |
ABOUT SHAREHOLDERS’ FUND EXPENSES (Unaudited)(concluded) |
| Expense
Ratio1 | Fund
Return | Beginning
Account Value
March 31,
2019 | Ending
Account Value
September 30,
2019 | Expenses
Paid During
Period2 |
Table 1. Based on actual Fund return3 |
SMid Cap Value Fund |
A-Class | 1.23% | 5.53% | $ 1,000.00 | $ 1,055.30 | $ 6.34 |
C-Class | 2.04% | 5.08% | 1,000.00 | 1,050.80 | 10.49 |
P-Class | 1.32% | 5.47% | 1,000.00 | 1,054.70 | 6.80 |
SMid Cap Value Institutional Fund | 1.19% | 6.47% | 1,000.00 | 1,064.70 | 6.16 |
|
Table 2. Based on hypothetical 5% return (before expenses) |
SMid Cap Value Fund |
A-Class | 1.23% | 5.00% | $ 1,000.00 | $ 1,018.90 | $ 6.23 |
C-Class | 2.04% | 5.00% | 1,000.00 | 1,014.84 | 10.30 |
P-Class | 1.32% | 5.00% | 1,000.00 | 1,018.45 | 6.68 |
SMid Cap Value Institutional Fund | 1.19% | 5.00% | 1,000.00 | 1,019.10 | 6.02 |
1 | Annualized and excludes expenses of the underlying funds in which the Funds invest, if any. |
2 | Expenses are equal to the Fund’s annualized expense ratio, net of any applicable fee waivers, multiplied by the average account value over the period, multiplied by 183/365 (to reflect the one-half year period). |
3 | Actual cumulative return at net asset value for the period March 31, 2019 to September 30, 2019. |
8 | THE GUGGENHEIM FUNDS ANNUAL REPORT | |
MANAGERS’ COMMENTARY (Unaudited) | September 30, 2019 |
To Our Shareholders:
Guggenheim SMid Cap Value Fund is managed by a team of seasoned professionals led by James Schier, CFA, Senior Managing Director and Portfolio Manager; David Toussaint, CFA, CPA, Managing Director and Portfolio Manager; Farhan Sharaff, Senior Managing Director, Assistant Chief Investment Officer, Equities, and Portfolio Manager; Gregg Strohkorb, CFA, Director and Portfolio Manager; and Burak Hurmeydan, Ph.D., Director and Portfolio Manager. In the following paragraphs, the team discusses performance of the Fund for the fiscal year ended September 30, 2019.
For the fiscal year ended September 30, 2019, Guggenheim SMid Cap Value Fund returned -2.51%1, compared with its benchmark, the Russell 2500® Value Index, which returned -4.35%.
Strategy and Market Overview
Our investment approach focuses on understanding how companies make money and how easily companies can improve returns, maintain existing high levels of profitability, or benefit from change that occurs within the industries in which they operate. In today’s rapidly changing environment marked by very sharp and quick, but constrained volatility, our long-term orientation and discipline are a competitive advantage. This should become especially critical when the environment of indiscriminant valuation expansion subsides, and fundamentals once again become a more dominant factor in the market.
Performance Review
The Fund outperformed the index over a volatile one-year period.
For the 12-month period, stock selection was the major factor behind the Fund’s showing relative to the benchmark, with sector allocation providing only a slight tailwind to results.
Highlighting the positive side was selection in Information Technology. A top-performing holding was Cray (not held at period end), which was acquired by Hewlett Packard Enterprise in 2019. Other contributors included optical components company Infinera Corp., which benefited from favorable earnings, and MACOM Technology Solutions Holdings, Inc., which reacted positively to analyst upgrades.
Stock selection also helped in the Materials, Industrials, and Financials sectors. A Materials holding not in the benchmark, U.S. Concrete, was a large individual contributor to performance, benefiting from growth in government projects and a strong market for home building. Industrials had gains from Jacobs Engineering Group, Inc. and a lack of exposure to problematic engineering and construction companies. In Financials, an overweighting and positive performance in reinsurance drove results. Alleghany Corp. was a leading individual contributor, advancing on the strength of favorable pricing dynamics, favorable catastrophe experience, and general lack of economic sensitivity that the sector exhibits.
| | THE GUGGENHEIM FUNDS ANNUAL REPORT | 9 |
MANAGERS’ COMMENTARY (Unaudited)(continued) | September 30, 2019 |
The weighting and selection of Utility holdings, the Fund’s largest overweight, also positively influenced the portfolio. OGE Energy Corp. reported strong earnings and raised its dividend, providing the largest boost; it was among the Fund’s largest holdings in the period.
Negative influences included unfavorable stock selection in the Energy sector. Oil prices softened over the period as economic uncertainty surrounding the trade dispute was especially magnified in smaller exploration and production companies. Range Resources Corp., Oasis Petroleum, Inc. and Whiting Petroleum Corp. each declined significantly in response. A sector bright spot for the Fund was Scorpio Tankers, the Fund’s best individual holding on a relative basis.
For many quarters now, the strategy has chosen to carry a significant underweighting in REITs in favor of a significant overweighting in Utilities. The REIT underweighting was adverse, but the weighting in residential REITs and the performance of the Fund’s storage REIT aided results. Leading the way was Sun Communities, a developer of manufactured housing communities, and Alexandria Real Estate Equities (a life sciences campus developer, which was not in benchmark).
Stock selection detracted in the Health Care sector, led by Evolent Health, Inc. The company’s largest customer, Passport, suffered rate cuts from Kentucky Medicaid that threatened Passport’s viability.
Portfolio Positioning
While this strategy is balanced relative to the benchmark, it does possess defensive characteristics in virtue of emphasizing relatively larger companies found in the benchmark as well as an overweight in Utilities.
At the end of the period, the Fund’s largest overweights relative to the benchmark were in Utilities and Information Technology. The Fund’s largest underweights were in Real Estate and Consumer Discretionary.
Portfolio and Market Outlook
The market volatility late in the year created sudden changes to the market. The perception of a friendlier environment from the Fed and continued hope that trade issues can be relatively quickly and favorably resolved has created an environment where the market is beginning to treat earnings disappointments and reduced outlooks in a less harsh manner since these are being viewed as more temporary issues. The total return potential for stocks now seems more favorable than it was just a few months ago, and the market appears to have begun the early phase of a calculated rebound that may have some duration in time and level.
10 | THE GUGGENHEIM FUNDS ANNUAL REPORT | |
MANAGERS’ COMMENTARY (Unaudited)(concluded) | September 30, 2019 |
Our portfolios tend to reflect a bias toward companies with balance sheet quality. We continue to find niche companies with what we believe to be attractive growth opportunities, and, as such, are constructive on the outlook.
Performance displayed represents past performance which is no guarantee of future results.
1 | Performance figures are based on Class A shares and do not reflect deduction of the sales charges or taxes that a shareholder would pay on distributions or the redemption of shares. |
The opinions and forecast expressed may not actually come to pass. This information is subject to change at any time, based on market and other conditions, and should not be construed as a recommendation of any specific security or strategy.
| | THE GUGGENHEIM FUNDS ANNUAL REPORT | 11 |
PERFORMANCE REPORT AND FUND PROFILE (Unaudited) | September 30, 2019 |
SMID CAP VALUE FUND
OBJECTIVE: Seeks long-term growth of capital.
Holdings Diversification (Market Exposure as % of Net Assets)

“Holdings Diversification (Market Exposure as % of Net Assets)” excludes any temporary cash investments.
Inception Dates: |
A-Class | May 1, 1997 |
C-Class | January 29, 1999 |
P-Class | May 1, 2015 |
Ten Largest Holdings (% of Total Net Assets) |
Alleghany Corp. | 3.0% |
OGE Energy Corp. | 2.7% |
KeyCorp | 2.2% |
Huntington Bancshares, Inc. | 2.1% |
Voya Financial, Inc. | 2.0% |
Zions Bancorp North America | 2.0% |
Willis Towers Watson plc | 2.0% |
Sun Communities, Inc. | 1.9% |
Equity Commonwealth | 1.9% |
Bunge Ltd. | 1.8% |
Top Ten Total | 21.6% |
“Ten Largest Holdings” excludes any temporary cash investments. |
12 | THE GUGGENHEIM FUNDS ANNUAL REPORT | |
PERFORMANCE REPORT AND FUND PROFILE (Unaudited)(concluded) | September 30, 2019 |
Cumulative Fund Performance*
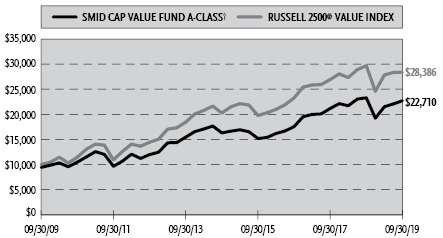
Average Annual Returns*
Periods Ended September 30, 2019
| 1 Year | 5 Year | 10 Year |
A-Class Shares | (2.51%) | 6.85% | 9.19% |
A-Class Shares with sales charge† | (7.15%) | 5.82% | 8.55% |
C-Class Shares | (3.35%) | 6.02% | 8.36% |
C-Class Shares with CDSC§ | (4.13%) | 6.02% | 8.36% |
Russell 2500 Value Index | (4.35%) | 6.98% | 11.00% |
| 1 Year | Since
Inception
(05/01/15) |
P-Class Shares | (2.61%) | 7.13% |
Russell 2500 Value Index | (4.35%) | 6.00% |
* | The performance data above represents past performance that is not predictive of future results. The investment return and principal value of an investment in the Fund will fluctuate so that an investor’s shares, when redeemed, may be worth more or less than their original cost. Returns are historical and include changes in principal and reinvested dividends and capital gains and do not reflect the effect of taxes. The Russell 2500 Value Index is an unmanaged index and, unlike the Fund, has no management fees or operating expenses to reduce its reported return. The graph is based on A-Class shares only; performance for C-Class and P-Class will vary due to difference in fee structures. |
† | Effective February 22, 2011, the maximum sales charge decreased from 5.75% to 4.75%. A 5.75% maximum sales charge is used in the calculation for the Average Annual Returns based on subscriptions made prior to February 22, 2011, and a 4.75% maximum sales charge will be used to calculate performance for periods based on subscriptions made on or after February 22, 2011. |
§ | Fund returns include a CDSC of 1% if redeemed within 12 months of purchase. |
| | THE GUGGENHEIM FUNDS ANNUAL REPORT | 13 |
SCHEDULE OF INVESTMENTS | September 30, 2019 |
SMID CAP VALUE FUND | |
| | Shares | | | Value | |
COMMON STOCKS† - 97.9% |
| | | | | | | | | |
Financial - 39.3% |
Alleghany Corp.* | | | 14,194 | | | $ | 11,323,406 | |
KeyCorp | | | 463,390 | | | | 8,266,878 | |
Huntington Bancshares, Inc. | | | 549,365 | | | | 7,839,439 | |
Voya Financial, Inc. | | | 141,598 | | | | 7,708,595 | |
Zions Bancorp North America | | | 170,946 | | | | 7,610,516 | |
Willis Towers Watson plc | | | 38,698 | | | | 7,467,553 | |
Sun Communities, Inc. REIT | | | 48,006 | | | | 7,126,491 | |
Equity Commonwealth REIT | | | 206,832 | | | | 7,083,996 | |
Axis Capital Holdings Ltd. | | | 96,117 | | | | 6,412,926 | |
Radian Group, Inc. | | | 275,443 | | | | 6,291,118 | |
Alexandria Real Estate Equities, Inc. REIT | | | 40,263 | | | | 6,202,113 | |
Physicians Realty Trust REIT | | | 342,926 | | | | 6,086,936 | |
Federal Agricultural Mortgage Corp. — Class C | | | 69,483 | | | | 5,673,982 | |
First Horizon National Corp. | | | 295,287 | | | | 4,783,649 | |
Umpqua Holdings Corp. | | | 251,296 | | | | 4,136,332 | |
Old Republic International Corp. | | | 174,623 | | | | 4,115,864 | |
Cousins Properties, Inc. REIT | | | 108,052 | | | | 4,061,675 | |
Pinnacle Financial Partners, Inc. | | | 61,189 | | | | 3,472,476 | |
IBERIABANK Corp. | | | 45,767 | | | | 3,457,239 | |
Camden Property Trust REIT | | | 28,376 | | | | 3,150,020 | |
Bancorp, Inc.* | | | 308,065 | | | | 3,049,843 | |
Redwood Trust, Inc. REIT | | | 172,208 | | | | 2,825,933 | |
Hilltop Holdings, Inc. | | | 105,434 | | | | 2,518,818 | |
National Storage Affiliates Trust REIT | | | 71,377 | | | | 2,381,850 | |
Medical Properties Trust, Inc. REIT | | | 115,845 | | | | 2,265,928 | |
Prosperity Bancshares, Inc. | | | 31,877 | | | | 2,251,473 | |
Howard Hughes Corp.* | | | 16,738 | | | | 2,169,245 | |
Stifel Financial Corp. | | | 37,539 | | | | 2,153,988 | |
American National Insurance Co. | | | 17,088 | | | | 2,114,298 | |
WSFS Financial Corp. | | | 47,024 | | | | 2,073,758 | |
BOK Financial Corp. | | | 24,292 | | | | 1,922,712 | |
Unum Group | | | 63,310 | | | | 1,881,573 | |
Total Financial | | | | | | | 149,880,623 | |
| | | | | | | | | |
Industrial - 18.7% |
MDU Resources Group, Inc. | | | 232,625 | | | | 6,557,699 | |
Scorpio Tankers, Inc. | | | 199,423 | | | | 5,934,829 | |
Jacobs Engineering Group, Inc. | | | 62,179 | | | | 5,689,379 | |
US Concrete, Inc.* | | | 81,137 | | | | 4,485,253 | |
FLIR Systems, Inc. | | | 73,874 | | | | 3,885,034 | |
Knight-Swift Transportation Holdings, Inc. | | | 103,098 | | | | 3,742,457 | |
Graphic Packaging Holding Co. | | | 239,555 | | | | 3,533,436 | |
Valmont Industries, Inc. | | | 24,936 | | | | 3,452,140 | |
PGT Innovations, Inc.* | | | 195,917 | | | | 3,383,487 | |
KEMET Corp. | | | 158,756 | | | | 2,886,184 | |
Owens Corning | | | 45,092 | | | | 2,849,814 | |
Plexus Corp.* | | | 38,477 | | | | 2,405,197 | |
Snap-on, Inc. | | | 15,048 | | | | 2,355,614 | |
Advanced Energy Industries, Inc.* | | | 40,506 | | | | 2,325,449 | |
Huntington Ingalls Industries, Inc. | | | 10,362 | | | | 2,194,568 | |
Rexnord Corp.* | | | 79,779 | | | | 2,158,022 | |
Park Aerospace Corp. | | | 122,623 | | | | 2,153,260 | |
Dycom Industries, Inc.* | | | 41,306 | | | | 2,108,671 | |
EnPro Industries, Inc. | | | 29,691 | | | | 2,038,287 | |
Crane Co. | | | 24,234 | | | | 1,953,987 | |
GATX Corp. | | | 24,902 | | | | 1,930,652 | |
Kirby Corp.* | | | 18,332 | | | | 1,506,157 | |
Oshkosh Corp. | | | 17,085 | | | | 1,295,043 | |
Celadon Group, Inc.* | | | 342,670 | | | | 428,338 | |
Total Industrial | | | | | | | 71,252,957 | |
| | | | | | | | | |
14 | THE GUGGENHEIM FUNDS ANNUAL REPORT | SEE NOTES TO FINANCIAL STATEMENTS. |
SCHEDULE OF INVESTMENTS (continued) | September 30, 2019 |
SMID CAP VALUE FUND | |
| | Shares | | | Value | |
Utilities - 8.3% |
OGE Energy Corp. | | | 227,518 | | | $ | 10,324,767 | |
Portland General Electric Co. | | | 121,208 | | | | 6,832,495 | |
Black Hills Corp. | | | 55,464 | | | | 4,255,753 | |
Southwest Gas Holdings, Inc. | | | 44,864 | | | | 4,084,418 | |
Avista Corp. | | | 70,820 | | | | 3,430,521 | |
AES Corp. | | | 166,713 | | | | 2,724,090 | |
Total Utilities | | | | | | | 31,652,044 | |
| | | | | | | | | |
Consumer, Non-cyclical - 7.7% |
Bunge Ltd. | | | 121,741 | | | | 6,892,975 | |
Central Garden & Pet Co. — Class A* | | | 173,605 | | | | 4,813,199 | |
Encompass Health Corp. | | | 75,910 | | | | 4,803,585 | |
Eagle Pharmaceuticals, Inc.* | | | 61,455 | | | | 3,476,510 | |
Premier, Inc. — Class A* | | | 118,721 | | | | 3,433,411 | |
Emergent BioSolutions, Inc.* | | | 63,505 | | | | 3,320,041 | |
Ingredion, Inc. | | | 30,531 | | | | 2,495,604 | |
Total Consumer, Non-cyclical | | | 29,235,325 | |
| | | | | | | | | |
Consumer, Cyclical - 6.5% |
DR Horton, Inc. | | | 102,747 | | | | 5,415,794 | |
PVH Corp. | | | 47,966 | | | | 4,232,040 | |
UniFirst Corp. | | | 21,499 | | | | 4,194,885 | |
Alaska Air Group, Inc. | | | 55,160 | | | | 3,580,436 | |
LKQ Corp.* | | | 111,811 | | | | 3,516,456 | |
BorgWarner, Inc. | | | 53,328 | | | | 1,956,071 | |
Lear Corp. | | | 15,747 | | | | 1,856,571 | |
Total Consumer, Cyclical | | | | | | | 24,752,253 | |
| | | | | | | | | |
Basic Materials - 5.0% |
Olin Corp. | | | 245,967 | | | | 4,604,502 | |
Ashland Global Holdings, Inc. | | | 56,404 | | | | 4,345,928 | |
Reliance Steel & Aluminum Co. | | | 43,329 | | | | 4,318,168 | |
Huntsman Corp. | | | 102,183 | | | | 2,376,777 | |
Nucor Corp. | | | 34,248 | | | | 1,743,566 | |
Commercial Metals Co. | | | 59,062 | | | | 1,026,498 | |
Alcoa Corp.* | | | 41,502 | | | | 832,945 | |
Total Basic Materials | | | | | | | 19,248,384 | |
| | | | | | | | | |
Communications - 4.9% |
Infinera Corp.* | | | 1,054,968 | | | | 5,749,575 | |
Symantec Corp. | | | 240,630 | | | | 5,686,087 | |
Viavi Solutions, Inc.* | | | 328,599 | | | | 4,602,029 | |
Ciena Corp.* | | | 67,412 | | | | 2,644,573 | |
Total Communications | | | | | | | 18,682,264 | |
| | | | | | | | | |
Technology - 4.3% |
MACOM Technology Solutions Holdings, Inc.* | | | 251,404 | | | | 5,403,929 | |
Super Micro Computer, Inc.* | | | 228,255 | | | | 4,382,496 | |
CSG Systems International, Inc. | | | 56,807 | | | | 2,935,786 | |
Lumentum Holdings, Inc.* | | | 34,955 | | | | 1,872,190 | |
Evolent Health, Inc. — Class A* | | | 235,626 | | | | 1,694,151 | |
Total Technology | | | | | | | 16,288,552 | |
| | | | | | | | | |
Energy - 3.2% |
Parsley Energy, Inc. — Class A | | | 285,965 | | | | 4,804,212 | |
Delek US Holdings, Inc. | | | 54,093 | | | | 1,963,576 | |
Oasis Petroleum, Inc.* | | | 514,384 | | | | 1,779,769 | |
Whiting Petroleum Corp.* | | | 216,575 | | | | 1,739,097 | |
Range Resources Corp. | | | 390,216 | | | | 1,490,625 | |
Antero Resources Corp.* | | | 135,685 | | | | 409,769 | |
Total Energy | | | | | | | 12,187,048 | |
| | | | | | | | | |
Total Common Stocks | | | | | | | | |
(Cost $337,863,023) | | | | | | | 373,179,450 | |
| | | | | | | | | |
SEE NOTES TO FINANCIAL STATEMENTS. | THE GUGGENHEIM FUNDS ANNUAL REPORT | 15 |
SCHEDULE OF INVESTMENTS (continued) | September 30, 2019 |
SMID CAP VALUE FUND | |
| | Shares | | | Value | |
CONVERTIBLE PREFERRED STOCKS††† - 0.0% |
Industrial - 0.0% |
Thermoenergy Corp.*,1,2 | | | 858,334 | | | $ | 2 | |
Total Convertible Preferred Stocks | | | | |
(Cost $819,654) | | | | | | | 2 | |
| | | | | | | | | |
RIGHTS††† - 0.0% |
Basic Materials - 0.0% |
Pan American Silver Corp.*,1 | | | 447,792 | | | | — | |
Total Rights | | | | | | | | |
(Cost $—) | | | | | | | — | |
| | | | | | | | | |
MONEY MARKET FUND† - 2.3% |
Dreyfus Treasury Securities Cash Management Fund — Institutional Shares 1.83%3 | | | 8,661,510 | | | | 8,661,510 | |
Total Money Market Fund | | | | | | | | |
(Cost $8,661,510) | | | | | | | 8,661,510 | |
| | | | | | | | | |
Total Investments - 100.2% | | | | |
(Cost $347,344,187) | | | | | | $ | 381,840,962 | |
Other Assets & Liabilities, net - (0.2)% | | | (649,747 | ) |
Total Net Assets - 100.0% | | | | | | $ | 381,191,215 | |
* | Non-income producing security. |
† | Value determined based on Level 1 inputs — See Note 4. |
††† | Value determined based on Level 3 inputs — See Note 4. |
1 | Security was fair valued by the Valuation Committee at September 30, 2019. The total market value of fair valued securities amounts to $2, (cost $819,654) or less than 0.1% of total net assets. |
2 | PIPE (Private Investment in Public Equity) — Stock issued by a company in the secondary market as a means of raising capital more quickly and less expensively than through registration of a secondary public offering. |
3 | Rate indicated is the 7-day yield as of September 30, 2019. |
| | plc — Public Limited Company |
| | REIT — Real Estate Investment Trust |
| | |
| | See Sector Classification in Other Information section. |
16 | THE GUGGENHEIM FUNDS ANNUAL REPORT | SEE NOTES TO FINANCIAL STATEMENTS. |
SCHEDULE OF INVESTMENTS (concluded) | September 30, 2019 |
SMID CAP VALUE FUND | |
The following table summarizes the inputs used to value the Fund’s investments at September 30, 2019 (See Note 4 in the Notes to Financial Statements):
Investments in
Securities (Assets) | | Level 1
Quoted
Prices | | | Level 2
Significant
Observable
Inputs | | | Level 3
Significant
Unobservable
Inputs | | | Total | |
Common Stocks | | $ | 373,179,450 | | | $ | — | | | $ | — | | | $ | 373,179,450 | |
Convertible Preferred Stocks | | | — | | | | — | | | | 2 | | | | 2 | |
Rights | | | — | | | | — | | | | — | * | | | — | |
Money Market Fund | | | 8,661,510 | | | | — | | | | — | | | | 8,661,510 | |
Total Assets | | $ | 381,840,960 | | | $ | — | | | $ | 2 | | | $ | 381,840,962 | |
* | Security has a market value less than $1. |
SEE NOTES TO FINANCIAL STATEMENTS. | THE GUGGENHEIM FUNDS ANNUAL REPORT | 17 |
STATEMENT OF ASSETS AND LIABILITIES |
SMID CAP VALUE FUND |
September 30, 2019
Assets: |
Investments, at value (cost $347,344,187) | | $ | 381,840,962 | |
Prepaid expenses | | | 47,102 | |
Receivables: |
Dividends | | | 555,238 | |
Fund shares sold | | | 94,677 | |
Interest | | | 11,000 | |
Foreign tax reclaims | | | 303 | |
Total assets | | | 382,549,282 | |
| | | | | |
Liabilities: |
Payable for: |
Fund shares redeemed | | | 406,123 | |
Management fees | | | 217,123 | |
Distribution and service fees | | | 91,206 | |
Transfer agent/maintenance fees | | | 38,896 | |
Fund accounting/administration fees | | | 23,393 | |
Trustees’ fees* | | | 5,184 | |
Due to Investment Adviser | | | 174 | |
Miscellaneous (Note 7) | | | 575,968 | |
Total liabilities | | | 1,358,067 | |
Net assets | | $ | 381,191,215 | |
| | | | | |
Net assets consist of: |
Paid in capital | | $ | 341,063,315 | |
Total distributable earnings (loss) | | | 40,127,900 | |
Net assets | | $ | 381,191,215 | |
| | | | | |
A-Class: |
Net assets | | $ | 335,805,524 | |
Capital shares outstanding | | | 11,004,412 | |
Net asset value per share | | $ | 30.52 | |
Maximum offering price per share (Net asset value divided by 95.25%) | | $ | 32.04 | |
| | | | | |
C-Class: |
Net assets | | $ | 31,220,852 | |
Capital shares outstanding | | | 1,524,209 | |
Net asset value per share | | $ | 20.48 | |
| | | | | |
P-Class: |
Net assets | | $ | 14,164,839 | |
Capital shares outstanding | | | 468,227 | |
Net asset value per share | | $ | 30.25 | |
* | Relates to Trustees not deemed “interested persons” within the meaning of Section 2(a)(19) of the 1940 Act. |
18 | THE GUGGENHEIM FUNDS ANNUAL REPORT | SEE NOTES TO FINANCIAL STATEMENTS. |
STATEMENT OF OPERATIONS |
SMID CAP VALUE FUND |
Year Ended September 30, 2019
Investment Income: |
Dividends (net of foreign withholding tax of $1,361) | | $ | 7,563,377 | |
Interest | | | 180,967 | |
Total investment income | | | 7,744,344 | |
| | | | | |
Expenses: |
Management fees | | | 2,976,623 | |
Distribution and service fees: |
A-Class | | | 851,483 | |
C-Class | | | 390,230 | |
P-Class | | | 43,168 | |
Transfer agent/maintenance fees: |
A-Class | | | 274,499 | |
C-Class | | | 63,249 | |
P-Class | | | 29,399 | |
Fund accounting/administration fees | | | 317,510 | |
Custodian fees | | | 11,756 | |
Trustees’ fees* | | | 8,850 | |
Miscellaneous | | | 245,269 | |
Recoupment of previously waived fees: |
A-Class | | | 16,578 | |
C-Class | | | 3,111 | |
P-Class | | | 6,257 | |
Total expenses | | | 5,237,982 | |
Less: |
Expenses reimbursed by Adviser: |
A-Class | | | (15,563 | ) |
C-Class | | | (4,061 | ) |
P-Class | | | (5,793 | ) |
Earnings credits applied | | | (1,091 | ) |
Total waived/reimbursed expenses | | | (26,508 | ) |
Net expenses | | | 5,211,474 | |
Net investment income | | | 2,532,870 | |
| | | | | |
Net Realized and Unrealized Gain (Loss): |
Net realized gain (loss) on: |
Investments | | | 5,835,305 | |
Net realized gain | | | 5,835,305 | |
Net change in unrealized appreciation (depreciation) on: |
Investments | | | (24,887,120 | ) |
Net change in unrealized appreciation (depreciation) | | | (24,887,120 | ) |
Net realized and unrealized loss | | | (19,051,815 | ) |
Net decrease in net assets resulting from operations | | $ | (16,518,945 | ) |
* | Relates to Trustees not deemed “interested persons” within the meaning of Section 2(a)(19) of the 1940 Act. |
SEE NOTES TO FINANCIAL STATEMENTS. | THE GUGGENHEIM FUNDS ANNUAL REPORT | 19 |
STATEMENTS OF CHANGES IN NET ASSETS |
SMID CAP VALUE FUND | |
| | Year Ended
September 30,
2019 | | | Year Ended
September 30,
2018 | |
Increase (Decrease) in Net Assets from Operations: | | | | | | | | |
Net investment income | | $ | 2,532,870 | | | $ | 161,275 | |
Net realized gain on investments | | | 5,835,305 | | | | 65,650,196 | |
Net change in unrealized appreciation (depreciation) on investments | | | (24,887,120 | ) | | | (19,255,452 | ) |
Net increase (decrease) in net assets resulting from operations | | | (16,518,945 | ) | | | 46,556,019 | |
| | | | | | | | | |
Distributions to shareholders: | | | | | | | | |
A-Class | | | (42,473,154 | ) | | | (28,138,220 | ) |
C-Class | | | (7,586,927 | ) | | | (8,265,848 | ) |
P-Class | | | (2,333,056 | ) | | | (1,646,381 | ) |
Total distributions to shareholders | | | (52,393,137 | ) | | | (38,050,449 | ) |
| | | | | | | | | |
Capital share transactions: | | | | | | | | |
Proceeds from sale of shares | | | | | | | | |
A-Class | | | 23,839,358 | | | | 44,722,196 | |
C-Class | | | 1,543,100 | | | | 2,359,664 | |
P-Class | | | 4,916,059 | | | | 12,393,245 | |
Distributions reinvested | | | | | | | | |
A-Class | | | 41,063,260 | | | | 27,178,864 | |
C-Class | | | 6,887,170 | | | | 7,679,358 | |
P-Class | | | 2,333,056 | | | | 1,641,967 | |
Cost of shares redeemed | | | | | | | | |
A-Class | | | (66,171,407 | ) | | | (84,528,678 | ) |
C-Class | | | (19,808,564 | ) | | | (43,771,157 | ) |
P-Class | | | (9,878,311 | ) | | | (16,920,813 | ) |
Net decrease from capital share transactions | | | (15,276,279 | ) | | | (49,245,354 | ) |
Net decrease in net assets | | | (84,188,361 | ) | | | (40,739,784 | ) |
| | | | | | | | | |
Net assets: | | | | | | | | |
Beginning of year | | | 465,379,576 | | | | 506,119,360 | |
End of year | | $ | 381,191,215 | | | $ | 465,379,576 | |
| | | | | | | | | |
Capital share activity: | | | | | | | | |
Shares sold | | | | | | | | |
A-Class | | | 789,707 | | | | 1,245,327 | |
C-Class | | | 80,433 | | | | 91,870 | |
P-Class | | | 161,350 | | | | 353,729 | |
Shares issued from reinvestment of distributions | | | | | | | | |
A-Class | | | 1,599,037 | | | | 788,250 | |
C-Class | | | 396,955 | | | | 307,667 | |
P-Class | | | 91,564 | | | | 47,941 | |
Shares redeemed | | | | | | | | |
A-Class | | | (2,226,793 | ) | | | (2,399,640 | ) |
C-Class | | | (987,491 | ) | | | (1,688,333 | ) |
P-Class | | | (337,998 | ) | | | (480,110 | ) |
Net decrease in shares | | | (433,236 | ) | | | (1,733,299 | ) |
20 | THE GUGGENHEIM FUNDS ANNUAL REPORT | SEE NOTES TO FINANCIAL STATEMENTS. |
FINANCIAL HIGHLIGHTS |
SMID CAP VALUE FUND | |
This table is presented to show selected data for a share outstanding throughout each period and to assist shareholders in evaluating a Fund’s performance for the periods presented.
A-Class | | Year
Ended
Sept. 30,
2019 | | | Year
Ended
Sept. 30,
2018 | | | Year
Ended
Sept. 30,
2017 | | | Year
Ended
Sept. 30,
2016 | | | Year
Ended
Sept. 30,
2015 | |
Per Share Data | | | | | | | | | | | | | | | | | | | | |
Net asset value, beginning of period | | $ | 36.20 | | | $ | 35.37 | | | $ | 30.27 | | | $ | 30.86 | | | $ | 37.73 | |
Income (loss) from investment operations: | | | | | | | | | | | | | | | | | | | | |
Net investment income (loss)a | | | .22 | | | | .06 | | | | .03 | | | | .30 | | | | .06 | |
Net gain (loss) on investments (realized and unrealized) | | | (1.89 | ) | | | 3.37 | | | | 6.09 | | | | 3.95 | | | | (2.24 | ) |
Total from investment operations | | | (1.67 | ) | | | 3.43 | | | | 6.12 | | | | 4.25 | | | | (2.18 | ) |
Less distributions from: | | | | | | | | | | | | | | | | | | | | |
Net investment income | | | (.03 | ) | | | — | | | | (.37 | ) | | | — | | | | — | |
Net realized gains | | | (3.98 | ) | | | (2.60 | ) | | | (.65 | ) | | | (4.84 | ) | | | (4.69 | ) |
Total distributions | | | (4.01 | ) | | | (2.60 | ) | | | (1.02 | ) | | | (4.84 | ) | | | (4.69 | ) |
Net asset value, end of period | | $ | 30.52 | | | $ | 36.20 | | | $ | 35.37 | | | $ | 30.27 | | | $ | 30.86 | |
|
Total Returnb | | | (2.51 | %) | | | 10.05 | % | | | 20.62 | % | | | 15.51 | % | | | (6.83 | %) |
Ratios/Supplemental Data |
Net assets, end of period (in thousands) | | $ | 335,806 | | | $ | 392,495 | | | $ | 396,408 | | | $ | 407,883 | | | $ | 476,792 | |
Ratios to average net assets: | | | | | | | | | | | | | | | | | | | | |
Net investment income (loss) | | | 0.72 | % | | | 0.17 | % | | | 0.11 | % | | | 1.04 | % | | | 0.18 | % |
Total expensesc | | | 1.23 | % | | | 1.26 | % | | | 1.27 | % | | | 1.49 | % | | | 1.42 | % |
Net expensesd,e,f | | | 1.23 | % | | | 1.26 | % | | | 1.27 | % | | | 1.49 | % | | | 1.42 | % |
Portfolio turnover rate | | | 45 | % | | | 54 | % | | | 55 | % | | | 52 | % | | | 84 | % |
SEE NOTES TO FINANCIAL STATEMENTS. | THE GUGGENHEIM FUNDS ANNUAL REPORT | 21 |
FINANCIAL HIGHLIGHTS (continued) |
SMID CAP VALUE FUND | |
This table is presented to show selected data for a share outstanding throughout each period and to assist shareholders in evaluating a Fund’s performance for the periods presented.
C-Class | | Year
Ended
Sept. 30,
2019 | | | Year
Ended
Sept. 30,
2018 | | | Year
Ended
Sept. 30,
2017 | | | Year
Ended
Sept. 30,
2016 | | | Year
Ended
Sept. 30,
2015 | |
Per Share Data | | | | | | | | | | | | | | | | | | | | |
Net asset value, beginning of period | | $ | 26.05 | | | $ | 26.33 | | | $ | 22.78 | | | $ | 24.54 | | | $ | 31.14 | |
Income (loss) from investment operations: | | | | | | | | | | | | | | | | | | | | |
Net investment income (loss)a | | | (.02 | ) | | | (.17 | ) | | | (.17 | ) | | | .06 | | | | (.15 | ) |
Net gain (loss) on investments (realized and unrealized) | | | (1.57 | ) | | | 2.49 | | | | 4.55 | | | | 3.02 | | | | (1.76 | ) |
Total from investment operations | | | (1.59 | ) | | | 2.32 | | | | 4.38 | | | | 3.08 | | | | (1.91 | ) |
Less distributions from: | | | | | | | | | | | | | | | | | | | | |
Net investment income | | | — | | | | — | | | | (.18 | ) | | | — | | | | — | |
Net realized gains | | | (3.98 | ) | | | (2.60 | ) | | | (.65 | ) | | | (4.84 | ) | | | (4.69 | ) |
Total distributions | | | (3.98 | ) | | | (2.60 | ) | | | (.83 | ) | | | (4.84 | ) | | | (4.69 | ) |
Net asset value, end of period | | $ | 20.48 | | | $ | 26.05 | | | $ | 26.33 | | | $ | 22.78 | | | $ | 24.54 | |
|
Total Returnb | | | (3.35 | %) | | | 9.22 | % | | | 19.63 | % | | | 14.64 | % | | | (7.49 | %) |
Ratios/Supplemental Data |
Net assets, end of period (in thousands) | | $ | 31,221 | | | $ | 52,996 | | | $ | 87,508 | | | $ | 98,176 | | | $ | 126,047 | |
Ratios to average net assets: | | | | | | | | | | | | | | | | | | | | |
Net investment income (loss) | | | (0.11 | %) | | | (0.65 | %) | | | (0.68 | %) | | | 0.27 | % | | | (0.53 | %) |
Total expensesc | | | 2.07 | % | | | 2.03 | % | | | 2.07 | % | | | 2.27 | % | | | 2.12 | % |
Net expensesd,e,f | | | 2.06 | % | | | 2.03 | % | | | 2.06 | % | | | 2.27 | % | | | 2.12 | % |
Portfolio turnover rate | | | 45 | % | | | 54 | % | | | 55 | % | | | 52 | % | | | 84 | % |
22 | THE GUGGENHEIM FUNDS ANNUAL REPORT | SEE NOTES TO FINANCIAL STATEMENTS. |
FINANCIAL HIGHLIGHTS (continued) |
SMID CAP VALUE FUND |
This table is presented to show selected data for a share outstanding throughout each period and to assist shareholders in evaluating a Fund’s performance for the periods presented.
P-Class | | Year
Ended
Sept. 30,
2019 | | | Year
Ended
Sept. 30,
2018 | | | Year
Ended
Sept. 30,
2017 | | | Year
Ended
Sept. 30,
2016 | | | Period
Ended
Sept. 30,
2015g | |
Per Share Data | | | | | | | | | | | | | | | | | | | | |
Net asset value, beginning of period | | $ | 35.94 | | | $ | 35.15 | | | $ | 30.18 | | | $ | 30.77 | | | $ | 33.91 | |
Income (loss) from investment operations: | | | | | | | | | | | | | | | | | | | | |
Net investment income (loss)a | | | .19 | | | | .05 | | | | .01 | | | | .14 | | | | .10 | |
Net gain (loss) on investments (realized and unrealized) | | | (1.88 | ) | | | 3.34 | | | | 6.08 | | | | 4.11 | | | | (3.24 | ) |
Total from investment operations | | | (1.69 | ) | | | 3.39 | | | | 6.09 | | | | 4.25 | | | | (3.14 | ) |
Less distributions from: | | | | | | | | | | | | | | | | | | | | |
Net investment income | | | (.02 | ) | | | — | | | | (.47 | ) | | | — | | | | — | |
Net realized gains | | | (3.98 | ) | | | (2.60 | ) | | | (.65 | ) | | | (4.84 | ) | | | — | |
Total distributions | | | (4.00 | ) | | | (2.60 | ) | | | (1.12 | ) | | | (4.84 | ) | | | — | |
Net asset value, end of period | | $ | 30.25 | | | $ | 35.94 | | | $ | 35.15 | | | $ | 30.18 | | | $ | 30.77 | |
|
Total Return | | | (2.61 | %) | | | 10.03 | % | | | 20.57 | % | | | 15.61 | % | | | (9.26 | %) |
Ratios/Supplemental Data |
Net assets, end of period (in thousands) | | $ | 14,165 | | | $ | 19,889 | | | $ | 22,203 | | | $ | 3,423 | | | $ | 57 | |
Ratios to average net assets: | | | | | | | | | | | | | | | | | | | | |
Net investment income (loss) | | | 0.63 | % | | | 0.13 | % | | | 0.02 | % | | | 0.48 | % | | | 0.71 | % |
Total expensesc | | | 1.35 | % | | | 1.35 | % | | | 1.25 | % | | | 1.32 | % | | | 1.32 | % |
Net expensesd,e,f | | | 1.32 | % | | | 1.28 | % | | | 1.23 | % | | | 1.32 | % | | | 1.32 | % |
Portfolio turnover rate | | | 45 | % | | | 54 | % | | | 55 | % | | | 52 | % | | | 84 | % |
SEE NOTES TO FINANCIAL STATEMENTS. | THE GUGGENHEIM FUNDS ANNUAL REPORT | 23 |
FINANCIAL HIGHLIGHTS (concluded) |
SMID CAP VALUE FUND |
a | Net investment income (loss) per share was computed using average shares outstanding throughout the period. |
b | Total return does not reflect the impact of any applicable sales charges. |
c | Does not include expenses for the underlying funds in which the Fund invests. |
d | Net expense information reflects the expense ratios after expense waivers and reimbursements, as applicable. |
e | Net expenses may include expenses that are excluded from the expense limitation agreement and affiliated fund waivers. Excluding these expenses, the net expense ratios for the years would be: |
| | | 09/30/19 | 09/30/18 | 09/30/17 |
| | A-Class | 1.23% | 1.26% | 1.25% |
| | C-Class | 2.06% | 2.03% | 2.04% |
| | P-Class | 1.32% | 1.28% | 1.21% |
f | The portion of the ratios of net expenses to average net assets attributable to recoupments of prior fee reductions or expense reimbursements for the years presented was as follows: |
| | | 09/30/19 | 09/30/18 | 09/30/17 |
| | A-Class | 0.00% | 0.01% | 0.00%* |
| | C-Class | 0.01% | 0.01% | 0.00%* |
| | P-Class | 0.04% | 0.04% | 0.00%* |
g | Since commencement of operations: May 1, 2015. Percentage amounts for the period, except total return and portfolio turnover rate, have been annualized. |
24 | THE GUGGENHEIM FUNDS ANNUAL REPORT | SEE NOTES TO FINANCIAL STATEMENTS. |
MANAGERS’ COMMENTARY (Unaudited) | September 30, 2019 |
To Our Shareholders:
Guggenheim SMid Cap Value Institutional Fund is managed by a team of seasoned professionals led by James Schier, CFA, Senior Managing Director and Portfolio Manager; David Toussaint, CFA, CPA, Managing Director and Portfolio Manager; Farhan Sharaff, Senior Managing Director, Assistant Chief Investment Officer, Equities, and Portfolio Manager; Gregg Strohkorb, CFA, Director and Portfolio Manager; and Burak Hurmeydan, Ph.D., Director and Portfolio Manager. In the following paragraphs, the team discusses performance of the Fund for the fiscal year ended September 30, 2019.
For the fiscal year ended September 30, 2019, Guggenheim SMid Cap Value Institutional Fund returned -1.59%, compared with its benchmark, the Russell 2500® Value Index, which returned -4.35%.
Strategy and Market Overview
Our investment approach focuses on understanding how companies make money and how easily companies can improve returns, maintain existing high levels of profitability, or benefit from change that occurs within the industries in which they operate. In today’s rapidly changing environment marked by very sharp and quick, but constrained volatility, our long-term orientation and discipline are a competitive advantage. This should become especially critical when the environment of indiscriminant valuation expansion subsides, and fundamentals once again become a more dominant factor in the market.
Performance Review
The Fund outperformed the index over a volatile one-year period.
For the 12-month period, stock selection was the major factor behind the Fund’s showing relative to the benchmark, with sector allocation providing only a slight tailwind to results.
Highlighting the positive side was selection in Information Technology. A top-performing holding was Cray (not held at period end), which was acquired by Hewlett Packard Enterprise in 2019. Other contributors included optical components company Infinera Corp., which benefited from favorable earnings, and MACOM Technology Solutions Holdings, Inc., which reacted positively to analyst upgrades.
Stock selection also helped in the Materials, Industrials, and Financials sectors. A Materials holding not in the benchmark, U.S. Concrete, was a large individual contributor to performance, benefiting from growth in government projects and a strong market for home building. Industrials had gains from Jacobs Engineering Group, Inc. and a lack of exposure to problematic engineering and construction companies. In Financials, an overweighting and positive performance in reinsurance drove results. Alleghany Corp. was a leading individual contributor, advancing on the strength of favorable pricing dynamics, favorable catastrophe experience, and general lack of economic sensitivity that the sector exhibits.
| | THE GUGGENHEIM FUNDS ANNUAL REPORT | 25 |
MANAGERS’ COMMENTARY (Unaudited)(concluded) | September 30, 2019 |
The weighting and selection of Utility holdings, the Fund’s largest overweight, also positively influenced the portfolio. OGE Energy Corp. reported strong earnings and raised its dividend, providing the largest boost; it was among the Fund’s largest holdings in the period.
Negative influences included unfavorable stock selection in the Energy sector. Oil prices softened over the period as economic uncertainty surrounding the trade dispute was especially magnified in smaller exploration and production companies. Range Resources Corp., Oasis Petroleum, Inc. and Whiting Petroleum Corp. each declined significantly in response. A sector bright spot for the Fund was Scorpio Tankers, the Fund’s best individual holding on a relative basis.
For many quarters now, the strategy has chosen to carry a significant underweighting in REITs in favor of a significant overweighting in Utilities. The REIT underweighting was adverse, but the weighting in residential REITs and the performance of the Fund’s storage REIT aided results. Leading the way was Sun Communities, a developer of manufactured housing communities, and Alexandria Real Estate Equities (a life sciences campus developer, which was not in benchmark).
Stock selection detracted in the Health Care sector, led by Evolent Health, Inc. The company’s largest customer, Passport, suffered rate cuts from Kentucky Medicaid that threatened Passport’s viability.
Portfolio Positioning
While this strategy is balanced relative to the benchmark, it does possess defensive characteristics in virtue of emphasizing relatively larger companies found in the benchmark as well as an overweight in Utilities.
At the end of the period, the Fund’s largest overweights relative to the benchmark were in Utilities and Information Technology. The Fund’s largest underweights were in Real Estate and Consumer Discretionary.
Portfolio and Market Outlook
The market volatility late in the year created sudden changes to the market. The perception of a friendlier environment from the Fed and continued hope that trade issues can be relatively quickly and favorably resolved has created an environment where the market is beginning to treat earnings disappointments and reduced outlooks in a less harsh manner since these are being viewed as more temporary issues. The total return potential for stocks now seems more favorable than it was just a few months ago, and the market appears to have begun the early phase of a calculated rebound that may have some duration in time and level.
Our portfolios tend to reflect a bias toward companies with balance sheet quality. We continue to find niche companies with what we believe to be attractive growth opportunities, and, as such, are constructive on the outlook.
Performance displayed represents past performance which is no guarantee of future results.
The opinions and forecast expressed may not actually come to pass. This information is subject to change at any time, based on market and other conditions, and should not be construed as a recommendation of any specific security or strategy.
26 | THE GUGGENHEIM FUNDS ANNUAL REPORT | |
PERFORMANCE REPORT AND FUND PROFILE (Unaudited) | September 30, 2019 |
SMID CAP VALUE INSTITUTIONAL FUND
OBJECTIVE: Seeks long-term growth of capital.
Holdings Diversification (Market Exposure as % of Net Assets)
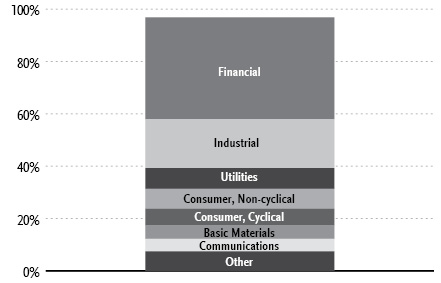
“Holdings Diversification (Market Exposure as % of Net Assets)” excludes any temporary cash investments.
Inception Date: July 11, 2008 |
Ten Largest Holdings (% of Total Net Assets) |
Alleghany Corp. | 3.0% |
OGE Energy Corp. | 2.6% |
KeyCorp | 2.1% |
Huntington Bancshares, Inc. | 2.1% |
Voya Financial, Inc. | 2.0% |
Zions Bancorp North America | 1.9% |
Willis Towers Watson plc | 1.9% |
Bunge Ltd. | 1.8% |
Sun Communities, Inc. | 1.8% |
Equity Commonwealth | 1.8% |
Top Ten Total | 21.0% |
“Ten Largest Holdings” excludes any temporary cash investments. |
| | THE GUGGENHEIM FUNDS ANNUAL REPORT | 27 |
PERFORMANCE REPORT AND FUND PROFILE (Unaudited)(concluded) | September 30, 2019 |
Cumulative Fund Performance*
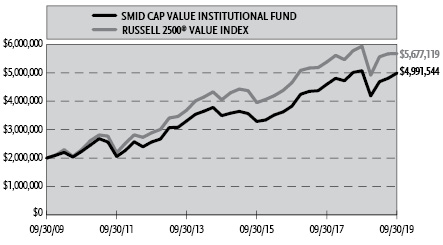
Average Annual Returns*
Periods Ended September 30, 2019
| 1 Year | 5 Year | 10 Year |
SMid Cap Value Institutional Fund | (1.59%) | 7.40% | 9.58% |
Russell 2500 Value Index | (4.35%) | 6.98% | 11.00% |
* | The performance data above represents past performance that is not predictive of future results. The investment return and principal value of an investment in the Fund will fluctuate so that an investor’s shares, when redeemed, may be worth more or less than their original cost. Returns are historical and include changes in principal and reinvested dividends and capital gains and do not reflect the effect of taxes. The Russell 2500 Value Index is an unmanaged index and, unlike the Fund, has no management fees or operating expenses to reduce its reported return. |
| | |
28 | THE GUGGENHEIM FUNDS ANNUAL REPORT | |
SCHEDULE OF INVESTMENTS | September 30, 2019 |
SMID CAP VALUE INSTITUTIONAL FUND | |
| | Shares | | | Value | |
COMMON STOCKS† - 96.9% |
| | | | | | | | | |
Financial - 38.9% |
Alleghany Corp.* | | | 2,152 | | | $ | 1,716,780 | |
KeyCorp | | | 69,263 | | | | 1,235,652 | |
Huntington Bancshares, Inc. | | | 83,118 | | | | 1,186,094 | |
Voya Financial, Inc. | | | 21,424 | | | | 1,166,323 | |
Zions Bancorp North America | | | 25,129 | | | | 1,118,743 | |
Willis Towers Watson plc | | | 5,645 | | | | 1,089,316 | |
Sun Communities, Inc. REIT | | | 7,034 | | | | 1,044,197 | |
Equity Commonwealth REIT | | | 30,344 | | | | 1,039,282 | |
Axis Capital Holdings Ltd. | | | 14,458 | | | | 964,638 | |
Radian Group, Inc. | | | 41,779 | | | | 954,232 | |
Alexandria Real Estate Equities, Inc. REIT | | | 5,863 | | | | 903,137 | |
Physicians Realty Trust REIT | | | 50,018 | | | | 887,819 | |
Federal Agricultural Mortgage Corp. — Class C | | | 10,548 | | | | 861,350 | |
First Horizon National Corp. | | | 44,842 | | | | 726,440 | |
Umpqua Holdings Corp. | | | 38,054 | | | | 626,369 | |
Old Republic International Corp. | | | 26,437 | | | | 623,120 | |
Cousins Properties, Inc. REIT | | | 16,227 | | | | 609,973 | |
IBERIABANK Corp. | | | 6,984 | | | | 527,571 | |
Pinnacle Financial Partners, Inc. | | | 9,158 | | | | 519,717 | |
Camden Property Trust REIT | | | 4,142 | | | | 459,803 | |
Bancorp, Inc.* | | | 46,223 | | | | 457,608 | |
Redwood Trust, Inc. REIT | | | 26,370 | | | | 432,732 | |
Hilltop Holdings, Inc. | | | 16,024 | | | | 382,813 | |
National Storage Affiliates Trust REIT | | | 10,703 | | | | 357,159 | |
Medical Properties Trust, Inc. REIT | | | 17,805 | | | | 348,266 | |
Prosperity Bancshares, Inc. | | | 4,831 | | | | 341,214 | |
Stifel Financial Corp. | | | 5,688 | | | | 326,377 | |
Howard Hughes Corp.* | | | 2,509 | | | | 325,166 | |
American National Insurance Co. | | | 2,587 | | | | 320,089 | |
WSFS Financial Corp. | | | 7,105 | | | | 313,331 | |
BOK Financial Corp. | | | 3,681 | | | | 291,351 | |
Unum Group | | | 9,509 | | | | 282,607 | |
Total Financial | | | | | | | 22,439,269 | |
| | | | | | | | | |
Industrial - 18.7% |
MDU Resources Group, Inc. | | | 35,449 | | | | 999,307 | |
Scorpio Tankers, Inc. | | | 30,201 | | | | 898,782 | |
Jacobs Engineering Group, Inc. | | | 9,450 | | | | 864,675 | |
US Concrete, Inc.* | | | 12,286 | | | | 679,170 | |
FLIR Systems, Inc. | | | 11,246 | | | | 591,427 | |
Knight-Swift Transportation Holdings, Inc. | | | 15,469 | | | | 561,525 | |
Graphic Packaging Holding Co. | | | 34,952 | | | | 515,542 | |
Valmont Industries, Inc. | | | 3,659 | | | | 506,552 | |
PGT Innovations, Inc.* | | | 29,203 | | | | 504,336 | |
KEMET Corp. | | | 24,107 | | | | 438,265 | |
Owens Corning | | | 6,785 | | | | 428,812 | |
Plexus Corp.* | | | 5,837 | | | | 364,871 | |
Snap-on, Inc. | | | 2,278 | | | | 356,598 | |
Advanced Energy Industries, Inc.* | | | 6,087 | | | | 349,455 | |
Huntington Ingalls Industries, Inc. | | | 1,574 | | | | 333,357 | |
Rexnord Corp.* | | | 12,131 | | | | 328,143 | |
Park Aerospace Corp. | | | 18,548 | | | | 325,703 | |
Dycom Industries, Inc.* | | | 6,198 | | | | 316,408 | |
EnPro Industries, Inc. | | | 4,428 | | | | 303,982 | |
Crane Co. | | | 3,676 | | | | 296,396 | |
GATX Corp. | | | 3,736 | | | | 289,652 | |
Kirby Corp.* | | | 2,877 | | | | 236,374 | |
Oshkosh Corp. | | | 2,627 | | | | 199,127 | |
Celadon Group, Inc.* | | | 51,643 | | | | 64,554 | |
Total Industrial | | | | | | | 10,753,013 | |
| | | | | | | | | |
SEE NOTES TO FINANCIAL STATEMENTS. | THE GUGGENHEIM FUNDS ANNUAL REPORT | 29 |
SCHEDULE OF INVESTMENTS (continued) | September 30, 2019 |
SMID CAP VALUE INSTITUTIONAL FUND | |
| | Shares | | | Value | |
Utilities - 8.0% |
OGE Energy Corp. | | | 33,017 | | | $ | 1,498,311 | |
Portland General Electric Co. | | | 17,702 | | | | 997,862 | |
Black Hills Corp. | | | 7,967 | | | | 611,308 | |
Southwest Gas Holdings, Inc. | | | 6,562 | | | | 597,404 | |
Avista Corp. | | | 10,287 | | | | 498,302 | |
AES Corp. | | | 25,102 | | | | 410,167 | |
Total Utilities | | | | | | | 4,613,354 | |
| | | | | | | | | |
Consumer, Non-cyclical - 7.6% |
Bunge Ltd. | | | 18,640 | | | | 1,055,397 | |
Central Garden & Pet Co. — Class A* | | | 25,928 | | | | 718,854 | |
Encompass Health Corp. | | | 11,302 | | | | 715,190 | |
Eagle Pharmaceuticals, Inc.* | | | 9,340 | | | | 528,364 | |
Emergent BioSolutions, Inc.* | | | 9,651 | | | | 504,554 | |
Premier, Inc. — Class A* | | | 17,443 | | | | 504,451 | |
Ingredion, Inc. | | | 4,632 | | | | 378,620 | |
Total Consumer, Non-cyclical | | | 4,405,430 | |
| | | | | | | | | |
Consumer, Cyclical - 6.4% |
DR Horton, Inc. | | | 15,851 | | | | 835,506 | |
PVH Corp. | | | 7,262 | | | | 640,726 | |
UniFirst Corp. | | | 3,158 | | | | 616,189 | |
Alaska Air Group, Inc. | | | 8,179 | | | | 530,899 | |
LKQ Corp.* | | | 16,582 | | | | 521,504 | |
BorgWarner, Inc. | | | 8,001 | | | | 293,477 | |
Lear Corp. | | | 2,362 | | | | 278,480 | |
Total Consumer, Cyclical | | | | | | | 3,716,781 | |
| | | | | | | | | |
Basic Materials - 5.1% |
Olin Corp. | | | 36,661 | | | | 686,294 | |
Ashland Global Holdings, Inc. | | | 8,812 | | | | 678,965 | |
Reliance Steel & Aluminum Co. | | | 6,607 | | | | 658,454 | |
Huntsman Corp. | | | 15,351 | | | | 357,064 | |
Nucor Corp. | | | 5,205 | | | | 264,986 | |
Commercial Metals Co. | | | 8,857 | | | | 153,935 | |
Alcoa Corp.* | | | 6,235 | | | | 125,136 | |
Total Basic Materials | | | | | | | 2,924,834 | |
| | | | | | | | | |
Communications - 4.8% |
Infinera Corp.* | | | 156,651 | | | | 853,748 | |
Symantec Corp. | | | 35,358 | | | | 835,510 | |
Viavi Solutions, Inc.* | | | 49,242 | | | | 689,634 | |
Ciena Corp.* | | | 10,104 | | | | 396,380 | |
Total Communications | | | | | | | 2,775,272 | |
| | | | | | | | | |
Technology - 4.2% |
MACOM Technology Solutions Holdings, Inc.* | | | 37,768 | | | | 811,823 | |
Super Micro Computer, Inc.* | | | 33,348 | | | | 640,281 | |
CSG Systems International, Inc. | | | 8,190 | | | | 423,259 | |
Lumentum Holdings, Inc.* | | | 5,289 | | | | 283,279 | |
Evolent Health, Inc. — Class A* | | | 35,791 | | | | 257,338 | |
Total Technology | | | | | | | 2,415,980 | |
| | | | | | | | | |
Energy - 3.2% |
Parsley Energy, Inc. — Class A | | | 43,397 | | | | 729,070 | |
Delek US Holdings, Inc. | | | 8,153 | | | | 295,954 | |
Oasis Petroleum, Inc.* | | | 76,163 | | | | 263,524 | |
Whiting Petroleum Corp.* | | | 32,623 | | | | 261,963 | |
Range Resources Corp. | | | 58,717 | | | | 224,299 | |
Antero Resources Corp.* | | | 20,767 | | | | 62,716 | |
HydroGen Corp.*,†††,1,2 | | | 1,265,700 | | | | 1 | |
Total Energy | | | | | | | 1,837,527 | |
| | | | | | | | | |
Total Common Stocks | | | | | | | | |
(Cost $52,099,954) | | | | | | | 55,881,460 | |
| | | | | | | | | |
30 | THE GUGGENHEIM FUNDS ANNUAL REPORT | SEE NOTES TO FINANCIAL STATEMENTS. |
SCHEDULE OF INVESTMENTS (continued) | September 30, 2019 |
SMID CAP VALUE INSTITUTIONAL FUND | |
| | Shares | | | Value | |
CONVERTIBLE PREFERRED STOCKS††† - 0.0% |
Industrial - 0.0% |
Thermoenergy Corp.*,1,3 | | | 793,750 | | | $ | 2 | |
Total Convertible Preferred Stocks | | | | |
(Cost $757,980) | | | | | | | 2 | |
| | | | | | | | | |
RIGHTS††† - 0.0% |
Basic Materials – 0.0% |
Pan American Silver Corp.*,1 | | | 68,759 | | | | — | |
Total Rights | | | | | | | | |
(Cost $—) | | | | | | | — | |
| | | | | | | | | |
MONEY MARKET FUND† - 3.2% |
Dreyfus Treasury Securities Cash Management Fund — Institutional Shares 1.83%4 | | | 1,831,059 | | | | 1,831,059 | |
Total Money Market Fund | | | | | | | | |
(Cost $1,831,059) | | | | | | | 1,831,059 | |
| | | | | | | | | |
Total Investments - 100.1% | | | | | | | | |
(Cost $54,688,993) | | | | | | $ | 57,712,521 | |
Other Assets & Liabilities, net - (0.1)% | | | (63,320 | ) |
Total Net Assets - 100.0% | | | | | | $ | 57,649,201 | |
* | Non-income producing security. |
† | Value determined based on Level 1 inputs, unless otherwise noted — See Note 4. |
††† | Value determined based on Level 3 inputs — See Note 4. |
1 | Security was fair valued by the Valuation Committee at September 30, 2019. The total market value of fair valued securities amounts to $3, (cost $760,512) or less than 0.1% of total net assets. |
2 | Affiliated issuer. |
3 | PIPE (Private Investment in Public Equity) — Stock issued by a company in the secondary market as a means of raising capital more quickly and less expensively than through registration of a secondary public offering. |
4 | Rate indicated is the 7-day yield as of September 30, 2019. |
| | plc — Public Limited Company |
| | REIT — Real Estate Investment Trust |
| | |
| | See Sector Classification in Other Information section. |
SEE NOTES TO FINANCIAL STATEMENTS. | THE GUGGENHEIM FUNDS ANNUAL REPORT | 31 |
SCHEDULE OF INVESTMENTS (concluded) | September 30, 2019 |
SMID CAP VALUE INSTITUTIONAL FUND | |
The following table summarizes the inputs used to value the Fund’s investments at September 30, 2019 (See Note 4 in the Notes to Financial Statements):
Investments in
Securities (Assets) | | Level 1
Quoted
Prices | | | Level 2
Significant
Observable
Inputs | | | Level 3
Significant
Unobservable
Inputs | | | Total | |
Common Stocks | | $ | 55,881,459 | | | $ | — | | | $ | 1 | | | $ | 55,881,460 | |
Convertible Preferred Stocks | | | — | | | | — | | | | 2 | | | | 2 | |
Rights | | | — | | | | — | | | | — | * | | | — | |
Money Market Fund | | | 1,831,059 | | | | — | | | | — | | | | 1,831,059 | |
Total Assets | | $ | 57,712,518 | | | $ | — | | | $ | 3 | | | $ | 57,712,521 | |
* | Security has a market value less than $1. |
Affiliated Transactions
Investments representing 5% or more of the outstanding voting shares of a company, or control of or by, or common control under Guggenheim Investments (“GI”), result in that company being considered an affiliated issuer, as defined in the 1940 Act.
Transactions during the year ended September 30, 2019, in which the company is an affiliated issuer, were as follows:
Security Name | | Value
09/30/18 | | | Additions | | | Reductions | | | Realized
Gain (Loss) | | | Change in
Unrealized
Appreciation
(Depreciation) | | | Value
09/30/19 | | | Shares
09/30/19 | | | Investment
Income | |
Common Stock | | | | | | | | | | | | | | | | | | | | | | | | | | | | |
HydroGen Corp.*,1 | | $ | 1 | | | $ | — | | | $ | — | | | $ | — | | | $ | — | | | $ | 1 | | | | 1,265,700 | | | $ | — | |
* | Non-Income producing security. |
1 | Security was fair valued by the Valuation Committee at September 30, 2019. The total market value of fair valued and affiliated securities amounts to $1, (cost $2,531) or less than 0.1% of total net assets. |
32 | THE GUGGENHEIM FUNDS ANNUAL REPORT | SEE NOTES TO FINANCIAL STATEMENTS. |
STATEMENT OF ASSETS AND LIABILITIES |
SMID CAP VALUE INSTITUTIONAL FUND |
September 30, 2019
Assets: |
Investments in unaffiliated issuers, at value (cost $54,686,462) | | $ | 57,712,520 | |
Investments in affiliated issuers, at value (cost $2,531) | | | 1 | |
Prepaid expenses | | | 22,915 | |
Receivables: |
Dividends | | | 83,009 | |
Fund shares sold | | | 19,087 | |
Interest | | | 2,848 | |
Total assets | | | 57,840,380 | |
| | | | | |
Liabilities: |
Payable for: |
Fund shares redeemed | | | 59,782 | |
Management fees | | | 33,181 | |
Professional fees | | | 28,317 | |
Transfer agent/maintenance fees | | | 24,945 | |
Printing fees | | | 16,440 | |
Fund accounting/administration fees | | | 3,540 | |
Trustees’ fees* | | | 1,263 | |
Miscellaneous (Note 7) | | | 23,711 | |
Total liabilities | | | 191,179 | |
Net assets | | $ | 57,649,201 | |
| | | | | |
Net assets consist of: |
Paid in capital | | $ | 54,304,716 | |
Total distributable earnings (loss) | | | 3,344,485 | |
Net assets | | $ | 57,649,201 | |
Capital shares outstanding | | | 5,842,721 | |
Net asset value per share | | $ | 9.87 | |
* | Relates to Trustees not deemed “interested persons” within the meaning of Section 2(a)(19) of the 1940 Act. |
SEE NOTES TO FINANCIAL STATEMENTS. | THE GUGGENHEIM FUNDS ANNUAL REPORT | 33 |
STATEMENT OF OPERATIONS |
SMID CAP VALUE INSTITUTIONAL FUND |
Year Ended September 30, 2019
Investment Income: |
Dividends from securities of unaffiliated issuers (net of foreign withholding tax of $255) | | $ | 1,162,491 | |
Interest | | | 27,745 | |
Total investment income | | | 1,190,236 | |
| | | | | |
Expenses: |
Management fees | | | 455,950 | |
Transfer agent/maintenance fees | | | 90,863 | |
Fund accounting/administration fees | | | 48,635 | |
Professional fees | | | 35,569 | |
Trustees’ fees* | | | 13,206 | |
Custodian fees | | | 1,554 | |
Miscellaneous | | | 60,850 | |
Total expenses | | | 706,627 | |
Net investment income | | | 483,609 | |
| | | | | |
Net Realized and Unrealized Gain (Loss): |
Net realized gain (loss) on: |
Investments in unaffiliated issuers | | | 1,116,590 | |
Net realized gain | | | 1,116,590 | |
Net change in unrealized appreciation (depreciation) on: |
Investments in unaffiliated issuers | | | (4,265,771 | ) |
Net change in unrealized appreciation (depreciation) | | | (4,265,771 | ) |
Net realized and unrealized loss | | | (3,149,181 | ) |
Net decrease in net assets resulting from operations | | $ | (2,665,572 | ) |
* | Relates to Trustees not deemed “interested persons” within the meaning of Section 2(a)(19) of the 1940 Act. |
34 | THE GUGGENHEIM FUNDS ANNUAL REPORT | SEE NOTES TO FINANCIAL STATEMENTS. |
STATEMENTS OF CHANGES IN NET ASSETS |
SMID CAP VALUE INSTITUTIONAL FUND | |
| | Year Ended
September 30,
2019 | | | Year Ended
September 30,
2018 | |
Increase (Decrease) in Net Assets from Operations: | | | | | | | | |
Net investment income | | $ | 483,609 | | | $ | 215,997 | |
Net realized gain on investments | | | 1,116,590 | | | | 9,494,478 | |
Net change in unrealized appreciation (depreciation) on investments | | | (4,265,771 | ) | | | (2,409,347 | ) |
Net increase (decrease) in net assets resulting from operations | | | (2,665,572 | ) | | | 7,301,128 | |
| | | | | | | | | |
Distributions to shareholders | | | (7,489,785 | ) | | | (8,941,778 | ) |
| | | | | | | | | |
Capital share transactions: | | | | | | | | |
Proceeds from sale of shares | | | 13,987,083 | | | | 20,521,609 | |
Distributions reinvested | | | 4,515,542 | | | | 5,265,056 | |
Cost of shares redeemed | | | (24,635,093 | ) | | | (28,017,572 | ) |
Net decrease from capital share transactions | | | (6,132,468 | ) | | | (2,230,907 | ) |
Net decrease in net assets | | | (16,287,825 | ) | | | (3,871,557 | ) |
| | | | | | | | | |
Net assets: | | | | | | | | |
Beginning of year | | | 73,937,026 | | | | 77,808,583 | |
End of year | | $ | 57,649,201 | | | $ | 73,937,026 | |
| | | | | | | | | |
Capital share activity: | | | | | | | | |
Shares sold | | | 1,467,217 | | | | 1,834,588 | |
Shares issued from reinvestment of distributions | | | 549,337 | | | | 481,707 | |
Shares redeemed | | | (2,604,579 | ) | | | (2,505,584 | ) |
Net decrease in shares | | | (588,025 | ) | | | (189,289 | ) |
SEE NOTES TO FINANCIAL STATEMENTS. | THE GUGGENHEIM FUNDS ANNUAL REPORT | 35 |
FINANCIAL HIGHLIGHTS |
SMID CAP VALUE INSTITUTIONAL FUND | |
This table is presented to show selected data for a share outstanding throughout each period and to assist shareholders in evaluating a Fund’s performance for the periods presented.
Institutional Class | | Year
Ended
Sept. 30,
2019 | | | Year
Ended
Sept. 30,
2018 | | | Year
Ended
Sept. 30,
2017 | | | Year
Ended
Sept. 30,
2016 | | | Year
Ended
Sept. 30,
2015 | |
Per Share Data | | | | | | | | | | | | | | | | | | | | |
Net asset value, beginning of period | | $ | 11.50 | | | $ | 11.75 | | | $ | 10.90 | | | $ | 10.41 | | | $ | 12.92 | |
Income (loss) from investment operations: |
Net investment income (loss)a | | | .08 | | | | .03 | | | | (.01 | ) | | | .15 | | | | .06 | |
Net gain (loss) on investments (realized and unrealized) | | | (.51 | ) | | | 1.11 | | | | 2.07 | | | | 1.43 | | | | (.66 | ) |
Total from investment operations | | | (.43 | ) | | | 1.14 | | | | 2.06 | | | | 1.58 | | | | (.60 | ) |
Less distributions from: |
Net investment income | | | (.06 | ) | | | (.05 | ) | | | (.53 | ) | | | (.12 | ) | | | (.07 | ) |
Net realized gains | | | (1.14 | ) | | | (1.34 | ) | | | (.68 | ) | | | (.97 | ) | | | (1.84 | ) |
Total distributions | | | (1.20 | ) | | | (1.39 | ) | | | (1.21 | ) | | | (1.09 | ) | | | (1.91 | ) |
Net asset value, end of period | | $ | 9.87 | | | $ | 11.50 | | | $ | 11.75 | | | $ | 10.90 | | | $ | 10.41 | |
|
Total Return | | | (1.59 | %) | | | 10.32 | % | | | 20.23 | % | | | 16.28 | % | | | (5.85 | %) |
Ratios/Supplemental Data |
Net assets, end of period (in thousands) | | $ | 57,649 | | | $ | 73,937 | | | $ | 77,809 | | | $ | 70,810 | | | $ | 287,370 | |
Ratios to average net assets: |
Net investment income (loss) | | | 0.80 | % | | | 0.29 | % | | | (0.07 | %) | | | 1.52 | % | | | 0.52 | % |
Total expensesb | | | 1.16 | % | | | 1.14 | % | | | 1.14 | % | | | 1.14 | % | | | 1.05 | % |
Portfolio turnover rate | | | 49 | % | | | 63 | % | | | 72 | % | | | 149 | % | | | 95 | % |
a | Net investment income (loss) per share was computed using average shares outstanding throughout the period. |
b | Does not include expenses of the underlying funds in which the Fund invests. |
36 | THE GUGGENHEIM FUNDS ANNUAL REPORT | SEE NOTES TO FINANCIAL STATEMENTS. |
NOTES TO FINANCIAL STATEMENTS |
Note 1 – Organization and Significant Accounting Policies
Organization
Guggenheim Funds Trust (the “Trust”), a Delaware statutory trust, is registered with the SEC under the Investment Company Act of 1940 (“1940 Act”), as an open-ended investment company of the series type. Each series, in effect, is representing a separate fund. The Trust is authorized to issue an unlimited number of no par value shares. The Trust accounts for the assets of each fund separately.
The Trust offers a combination of five separate classes of shares: A-Class shares, C-Class shares, P-Class shares, R6-Class shares and Institutional Class shares. Sales of shares of each Class are made without a front-end sales charge at the net asset value per share (“NAV”), with the exception of A-Class shares. A-Class shares are sold at the NAV, plus the applicable front-end sales charge. The sales charge varies depending on the amount purchased. A-Class share purchases of $1 million or more are exempt from the front-end sales charge but have a 1% contingent deferred sales charge (“CDSC”), if shares are redeemed within 12 months of purchase. C-Class shares have a 1% CDSC if shares are redeemed within 12 months of purchase. C-Class shares of each Fund automatically convert to A-Class shares of the same Fund on or about the 10th day of the month following the 10-year anniversary of the purchase of the C-Class shares. This conversion will be executed without any sales charge, fee or other charge. After the conversion is completed, the shares will be subject to all features and expenses of A-Class shares. Institutional Class shares are offered primarily for direct investment by institutions such as pension and profit sharing plans, endowments, foundations and corporations. Institutional Class shares require a minimum initial investment of $2 million and a minimum account balance of $1 million. R6-Class shares are offered primarily through qualified retirement and benefit plans. R6-Class shares are also offered through certain other plans and platforms sponsored by financial intermediaries. Certain institutional investors and others deemed appropriate by Guggenheim Investments (“GI”) may also be eligible to purchase R6-Class shares subject to a $2 million minimum initial investment. At September 30, 2019, the Trust consisted of twenty funds (the “Funds”).
This report covers the following Funds:
Fund Name | Investment Company Type |
SMid Cap Value Fund (formerly, Mid Cap Value Fund) | Diversified |
SMid Cap Value Institutional Fund (formerly, Mid Cap Value Institutional Fund) | Diversified |
At September 30, 2019, A-Class, C-Class, P-Class and Institutional Class shares have been issued by the Funds.
Security Investors, LLC, which operates under the name Guggenheim Investments, provides advisory services. Guggenheim Funds Distributors, LLC (“GFD”) acts as principal underwriter for the Trust. GI and GFD are affiliated entities.
| | THE GUGGENHEIM FUNDS ANNUAL REPORT | 37 |
NOTES TO FINANCIAL STATEMENTS (continued) |
Significant Accounting Policies
The Funds operate as investment companies and, accordingly, follow the investment company accounting and reporting guidance of the Financial Accounting Standards Board (“FASB”) Accounting Standards Codification Topic 946 Financial Services – Investment Companies.
The following significant accounting policies are in conformity with U.S. generally accepted accounting principles (“U.S. GAAP”) and are consistently followed by the Trust. This requires management to make estimates and assumptions that affect the reported amount of assets and liabilities, contingent assets and liabilities at the date of the financial statements, and the reported amounts of revenues and expenses during the reporting period. Actual results could differ from these estimates. All time references are based on Eastern Time.
The NAV of each Class of a fund is calculated by dividing the market value of a fund’s securities and other assets, less all liabilities, attributable to the Class by the number of outstanding shares of the Class.
(a) Valuation of Investments
The Board of Trustees of the Funds (the “Board”) has adopted policies and procedures for the valuation of the Funds’ investments (the “Valuation Procedures”). Pursuant to the Valuation Procedures, the Board has delegated to a valuation committee, consisting of representatives from Guggenheim’s investment management, fund administration, legal and compliance departments (the “Valuation Committee”), the day-to-day responsibility for implementing the Valuation Procedures, including, under most circumstances, the responsibility for determining the fair value of the Funds’ securities and/or other assets.
Valuations of the Funds’ securities are supplied primarily by pricing services appointed pursuant to the processes set forth in the Valuation Procedures. The Valuation Committee convenes monthly, or more frequently as needed, to review the valuation of all assets which have been fair valued for reasonableness. The Funds’ officers, through the Valuation Committee and consistent with the monitoring and review responsibilities set forth in the Valuation Procedures, regularly review procedures used and valuations provided by the pricing services.
If the pricing service cannot or does not provide a valuation for a particular investment or such valuation is deemed unreliable, such investment is fair valued by the Valuation Committee.
Equity securities listed or traded on a recognized U.S. securities exchange or the National Association of Securities Dealers Automated Quotations (“NASDAQ”) National Market System shall generally be valued on the basis of the last sale price on the primary U.S. exchange or market on which the security is listed or traded; provided, however, that securities listed on NASDAQ will be valued at the NASDAQ Official Closing Price, which may not necessarily represent the last sale price. If there is no sale on the valuation date, exchange-traded U.S. equity securities will be valued on the basis of the last bid price.
38 | THE GUGGENHEIM FUNDS ANNUAL REPORT | |
NOTES TO FINANCIAL STATEMENTS (continued) |
Open-end investment companies are valued at their NAV as of the close of business, on the valuation date.
Investments for which market quotations are not readily available are fair-valued as determined in good faith by GFIA, subject to review and approval by the Valuation Committee, pursuant to methods established or ratified by the Board. Valuations in accordance with these methods are intended to reflect each security’s (or asset’s or liability’s) “fair value”. Each such determination is based on a consideration of all relevant factors, which are likely to vary from one pricing context to another. Examples of such factors may include, but are not limited to market prices; sale prices; broker quotes; and models which derive prices based on inputs such as prices of securities with comparable maturities and characteristics, or based on inputs such as anticipated cash flows or collateral, spread over U.S. Treasury securities, and other information analysis.
(b) Foreign Taxes
The Funds may be subject to foreign taxes (a portion of which may be reclaimable) on income, stock dividends, capital gains on investments or certain foreign currency transactions. All foreign taxes are recorded in accordance with the applicable foreign tax regulations and rates that exist in the foreign jurisdictions in which the Funds invest. These foreign taxes, if any, are paid by the Funds and reflected in their Statements of Operations as follows: foreign taxes withheld at source are presented as a reduction of income and foreign taxes on capital gains from sales of investments are included with the net realized gain (loss) on investments. Foreign taxes payable or deferred as of September 30, 2019, if any, are disclosed in the Funds’ Statements of Assets and Liabilities.
(c) Security Transactions
Security transactions are recorded on the trade date for financial reporting purposes. Realized gains and losses from securities transactions are recorded using the identified cost basis. Proceeds from lawsuits related to investment holdings are recorded as a reduction to cost if the securities are still held and as realized gains if no longer held in the respective Fund. Dividend income is recorded on the ex-dividend date, net of applicable taxes withheld by foreign countries. Taxable non-cash dividends are recorded as dividend income. Interest income, including amortization of premiums and accretion of discounts, is accrued on a daily basis. Dividend income from Real Estate Investment Trusts (“REITs”) is recorded based on the income included in the distributions received from the REIT investments using published REIT classifications, including some management estimates when actual amounts are not available. Distributions received in excess of this estimated amount are recorded as a reduction of the cost of investments or reclassified to realized gains. The actual amounts of income, return of capital, and realized gains are only determined by each REIT after its fiscal year-end, and may differ from the estimated amounts.
| | THE GUGGENHEIM FUNDS ANNUAL REPORT | 39 |
NOTES TO FINANCIAL STATEMENTS (continued) |
(d) Distributions
Distributions of net investment income and net realized gains, if any, are declared and paid at least annually. Dividends are reinvested in additional shares unless shareholders request payment in cash. Distributions are recorded on the ex-dividend date and are determined in accordance with U.S. federal income tax regulations which may differ from U.S. GAAP.
(e) Class Allocations
Interest and dividend income, most expenses, all realized gains and losses, and all unrealized appreciation and depreciation are allocated to the classes based upon the value of the outstanding shares in each Class. Certain costs, such as distribution and service fees are charged directly to specific classes. In addition, certain expenses have been allocated to the individual Funds in the Trust based on the respective net assets of each Fund included in the Trust.
(f) Earnings Credits
Under the fee arrangement with the custodian, the Funds may earn credits based on overnight custody cash balances. These credits are utilized to reduce related custodial expenses. The custodian fees disclosed in the Statements of Operations are before the reduction in expense from the related earnings credits, if any. Earnings credits for the year ended September 30, 2019, are disclosed in the Statements of Operations.
(g) Cash
The Funds may leave cash overnight in their cash account with the custodian. Periodically, a Fund may have cash due to the custodian bank as an overdraft balance. A fee is incurred on this overdraft, calculated by multiplying the overdraft by a rate based on the federal funds rate, which was 1.90% at September 30, 2019.
(h) Indemnifications
Under the Funds’ organizational documents, the Trustees and Officers are indemnified against certain liabilities arising out of the performance of their duties to the Trust. In addition, throughout the normal course of business, the Funds enter into contracts that contain a variety of representations and warranties which provide general indemnifications. The Funds’ maximum exposure under these arrangements is unknown, as this would involve future claims that may be made against the Funds and/or their affiliates that have not yet occurred. However, based on experience, the Funds expect the risk of loss to be remote.
40 | THE GUGGENHEIM FUNDS ANNUAL REPORT | |
NOTES TO FINANCIAL STATEMENTS (continued) |
Note 2 – Investment Advisory Agreement and Other Agreements
Under the terms of an investment advisory contract, the Funds pay GI investment advisory fees calculated at the annualized rates below, based on the average daily net assets of the Funds:
Fund | | Management Fees
(as a % of Net Assets) | |
SMid Cap Value Fund | | | 0.75 | % |
SMid Cap Value Institutional Fund | | | 0.75 | % |
GI engages external service providers to perform other necessary services for the Trust, such as audit and accounting related services, legal services, custody, printing and mailing, etc., on a pass-through basis. Such expenses are allocated to various Funds within the complex based on relative net assets.
The SMid Cap Value Fund has adopted Distribution Plans related to the offering of A-Class, C-Class and P-Class shares pursuant to Rule 12b-1 under the 1940 Act. The plans provide for payments at an annual rate of 0.25% of the average daily net assets of the Fund’s A-Class and P-Class shares, and 1.00% of the average daily net assets of the Fund’s C-Class shares.
Contractual expense limitation agreements for the SMid Cap Value Fund provides that the total expenses be limited to a percentage of average net assets for each class of shares, exclusive of brokerage costs, dividends on securities sold short, expenses of other investment companies in which the Fund invests, interest, taxes, litigation, indemnification and extraordinary expenses. The limits are listed below:
| | Limit | | | Effective
Date | | | Contract
End Date | |
SMid Cap Value Fund – A-Class | | | 1.42 | % | | | 01/30/17 | | | | 02/01/21 | |
SMid Cap Value Fund – C-Class | | | 2.12 | % | | | 01/30/17 | | | | 02/01/21 | |
SMid Cap Value Fund – P-Class | | | 1.32 | % | | | 01/30/17 | | | | 02/01/21 | |
GI is entitled to reimbursement by the SMid Cap Value Fund for fees waived or expenses reimbursed during any of the previous 36 months, beginning on the date of the expense limitation agreement, if on any day the estimated operating expenses are less than the indicated percentages. For purposes of this arrangement, GI is entitled to recoupment of previously waived fees or reimbursed expenses for 36 months from the date of the waiver or reimbursement by GI. At September 30, 2019, the amount of fees waived or expenses reimbursed that are subject to recoupment are presented in the following table:
Fund | | Expires
2020 | | | Expires
2021 | | | Expires
2022 | | | Fund
Total | |
SMid Cap Value Fund | | | | | | | | | | | | | | | | |
C-Class | | $ | — | | | $ | — | | | $ | 1,970 | | | $ | 1,970 | |
P-Class | | | — | | | | 1,264 | | | | 5,793 | | | | 7,057 | |
| | THE GUGGENHEIM FUNDS ANNUAL REPORT | 41 |
NOTES TO FINANCIAL STATEMENTS (continued) |
For the year ended September 30, 2019, GI recouped $25,946 from the SMid Cap Value Fund.
For the year ended September 30, 2019, GFD retained sales charges of $286,511 relating to sales of A-Class shares of the Trust.
Certain trustees and officers of the Trust are also officers of GI and/or GFD. The Trust does not compensate its officers or trustees who are officers, directors and/or employees of GI or GFD.
MUFG Investor Services (US), LLC (“MUIS”) acts as the Funds’ administrator, transfer agent and accounting agent. As administrator, transfer agent and accounting agent, MUIS is responsible for maintaining the books and records of the Funds’ securities and cash. The Bank of New York Mellon Corp. (“BNY”) acts as the Funds’ custodian. As custodian, BNY is responsible for the custody of the Funds’ assets. For providing the aforementioned administrative and accounting services, MUIS is entitled to receive a monthly fee equal to a percentage of the Funds’ average daily net assets and out of pocket expenses. For providing the aforementioned transfer agent and custodian services, MUIS and BNY are entitled to receive a monthly fee based on the number of transactions during the month and the number of accounts under management, subject to certain minimum monthly fees, and out of pocket expenses.
Note 3 – Federal Income Tax Information
The Funds intend to comply with the provisions of Subchapter M of the Internal Revenue Code applicable to regulated investment companies and will distribute substantially all taxable net investment income and capital gains sufficient to relieve the Funds from all, or substantially all, federal income, excise and state income taxes. Therefore, no provision for federal or state income tax or federal excise tax is required.
Tax positions taken or expected to be taken in the course of preparing the Funds’ tax returns are evaluated to determine whether the tax positions are “more-likely-than-not” of being sustained by the applicable tax authority. Tax positions not deemed to meet the more-likely-than-not threshold would be recorded as a tax benefit or expense in the current year. Management has analyzed the Funds’ tax positions taken, or to be taken, on U.S. federal income tax returns for all open tax years, and has concluded that no provision for income tax is required in the Funds’ financial statements. The Funds’ U.S. federal income tax returns are subject to examination by the Internal Revenue Service for a period of three years after they are filed.
The tax character of distributions paid during the year ended September 30, 2019 was as follows:
Fund | | Ordinary
Income | | | Long-Term
Capital Gain | | | Total
Distributions | |
SMid Cap Value Fund | | $ | 8,161,782 | | | $ | 44,231,355 | | | $ | 52,393,137 | |
SMid Cap Value Institutional Fund | | | 1,724,363 | | | | 5,765,422 | | | | 7,489,785 | |
42 | THE GUGGENHEIM FUNDS ANNUAL REPORT | |
NOTES TO FINANCIAL STATEMENTS (continued) |
The tax character of distributions paid during the year ended September 30, 2018 was as follows:
Fund | | Ordinary
Income | | | Long-Term
Capital Gain | | | Total
Distributions | |
SMid Cap Value Fund | | $ | 16,990,651 | | | $ | 21,059,798 | | | $ | 38,050,449 | |
SMid Cap Value Institutional Fund | | | 3,106,345 | | | | 5,835,433 | | | | 8,941,778 | |
Note: For U.S. federal income tax purposes, short-term capital gain distributions are treated as ordinary income distributions.
The tax components of distributable earnings/(loss) as of September 30, 2019 were as follows:
Fund | | Undistributed
Ordinary
Income | | | Undistributed
Long-Term
Capital Gain | | | Net Unrealized
Appreciation
(Depreciation) | | | Accumulated
Capital and
Other Losses | | | Total | |
SMid Cap Value Fund | | $ | 2,482,165 | | | $ | 3,301,308 | | | $ | 34,344,427 | | | $ | — | | | $ | 40,127,900 | |
SMid Cap Value Institutional Fund | | | 55,122 | | | | 495,007 | | | | 2,794,356 | | | | — | | | | 3,344,485 | |
For U.S. federal income tax purposes, capital loss carryforwards represent realized losses of the Funds that may be carried forward and applied against future capital gains. Under the RIC Modernization Act of 2010, the Funds are permitted to carry forward capital losses incurred in taxable years beginning after December 22, 2010 for an unlimited period and such capital loss carryforwards will retain their character as either short-term or long-term capital losses. As of September 30, 2019, the Funds had no capital loss carryforwards.
Net investment income and net realized gains (losses) may differ for financial statement and tax purposes because of temporary or permanent book/tax differences. These differences are primarily due to losses deferred due to wash sales, distributions in connection with redemption of fund shares, and reclassification of distributions. To the extent these differences are permanent and would require a reclassification between Paid in Capital and Total Distributable Earnings (Loss), such reclassifications are made in the period that the differences arise. These reclassifications have no effect on net assets or NAV per share.
The following adjustments were made on the Statements of Assets and Liabilities as of September 30, 2019 for permanent book/tax differences:
Fund | | Paid In
Capital | | | Total
Distributable
Earnings/(Loss) | |
SMid Cap Value Fund | | $ | 2,421,760 | | | $ | (2,421,760 | ) |
SMid Cap Value Institutional Fund | | | 575,528 | | | | (575,528 | ) |
| | THE GUGGENHEIM FUNDS ANNUAL REPORT | 43 |
NOTES TO FINANCIAL STATEMENTS (continued) |
At September 30, 2019, the cost of investments for U.S. federal income tax purposes, the aggregate gross unrealized appreciation for all investments for which there was an excess of value over tax cost and the aggregate gross unrealized depreciation for all investments for which there was an excess of tax cost over value, were as follows:
Fund | | Tax
Cost | | | Tax
Unrealized
Appreciation | | | Tax
Unrealized
Depreciation | | | Net
Unrealized
Appreciation/
(Depreciation) | |
SMid Cap Value Fund | | $ | 347,496,535 | | | $ | 66,007,077 | | | $ | (31,662,650 | ) | | $ | 34,344,427 | |
SMid Cap Value Institutional Fund | | | 54,918,165 | | | | 7,992,439 | | | | (5,198,083 | ) | | | 2,794,356 | |
Note 4 – Fair Value Measurement
In accordance with U.S. GAAP, fair value is defined as the price that the Funds would receive to sell an investment or pay to transfer a liability in an orderly transaction with an independent buyer in the principal market, or in the absence of a principal market, the most advantageous market for the investment or liability. U.S. GAAP establishes a three-tier fair value hierarchy based on the types of inputs used to value assets and liabilities and requires corresponding disclosure. The hierarchy and the corresponding inputs are summarized below:
Level 1 — | quoted prices in active markets for identical assets or liabilities. |
Level 2 — | significant other observable inputs (for example quoted prices for securities that are similar based on characteristics such as interest rates, prepayment speeds, credit risk, etc.). |
Level 3 — | significant unobservable inputs based on the best information available under the circumstances, to the extent observable inputs are not available, which may include assumptions. |
The types of inputs available depend on a variety of factors, such as the type of security and the characteristics of the markets in which it trades, if any. Fair valuation determinations that rely on fewer or no observable inputs require greater judgment. Accordingly, fair value determinations for Level 3 securities require the greatest amount of judgment.
The inputs or methodologies used for valuing securities are not necessarily an indication of the risk associated with investing in those securities. The suitability of the techniques and sources employed to determine fair valuation are regularly monitored and subject to change.
44 | THE GUGGENHEIM FUNDS ANNUAL REPORT | |
NOTES TO FINANCIAL STATEMENTS (continued) |
Note 5 – Securities Transactions
For the year ended September 30, 2019, the cost of purchases and proceeds from sales of investment securities, excluding government securities, short-term investments and derivatives, were as follows:
Fund | | Purchases | | | Sales | |
SMid Cap Value Fund | | $ | 177,081,963 | | | $ | 232,173,858 | |
SMid Cap Value Institutional Fund | | | 29,360,228 | | | | 40,905,181 | |
Note 6 – Line of Credit
The Trust, along with other affiliated trusts, secured a 364-day committed, $1,065,000,000 line of credit from Citibank, N.A., which was in place through October 5, 2018, at which time the line of credit was renewed with an increased commitment amount of $1,205,000,000. On October 4, 2019, the line of credit agreement was renewed with an increased commitment amount of $1,230,000,000. A Fund may draw (borrow) from the line of credit as a temporary measure for emergency purposes, to facilitate redemption requests, or for other short-term liquidity purposes consistent with the Fund’s investment objective and program. For example, it may be advantageous for the Fund to borrow money rather than sell existing portfolio positions to meet redemption requests. Fees related to borrowings, if any, vary under this arrangement between the greater of Citibank’s “base rate”, LIBOR plus 1%, or the federal funds rate plus 1/2 of 1%.
The commitment fee that may be paid by the Funds is at an annualized rate of 0.15% of the average daily amount of their allocated unused commitment amount. The allocated commitment fee amount for each Fund is referenced in the Statement of Operations within “Miscellaneous”. The Funds did not have any borrowings under this agreement as of and for the year ended September 30, 2019.
Note 7 – Other Liabilities
The SMid Cap Value Fund and SMid Cap Value Institutional Fund each wrote put options contracts through Lehman Brothers Inc., (“LBI”) that were exercised prior to the option contracts’ expiration and prior to the bankruptcy filing by LBI, during September 2008. However, these transactions have not settled and the securities have not been delivered to the Fund as of September 30, 2019.
Although the ultimate resolution of these transactions is uncertain, the Funds have recorded a liability on their respective books equal to the difference between the strike price on the put options and the market prices of the underlying security on the exercise date. The amount of the liability recorded by the Funds as of September 30, 2019 was $473,594 for SMid Cap Value Fund and $15,940 for SMid Cap Value Institutional Fund and included in payable for miscellaneous in the Statements of Assets and Liabilities.
| | THE GUGGENHEIM FUNDS ANNUAL REPORT | 45 |
NOTES TO FINANCIAL STATEMENTS (concluded) |
Note 8 – Recent Regulatory Reporting Updates
In August 2018, the Financial Accounting Standards Board issued an Accounting Standards Update, ASU 2018-13, Fair Value Measurement (Topic 820), Disclosure Framework - Changes to the Disclosure Requirements for Fair Value Measurement (the “2018 ASU”) which adds, modifies and removes disclosure requirements related to certain aspects of fair value measurement. The 2018 ASU is effective for fiscal years, and interim periods within those fiscal years, beginning after December 15, 2019. Early adoption is permitted. As of September 30, 2019, the Funds have fully adopted the provisions of the 2018 ASU, which did not have a material impact on the Funds’ financial statements and related disclosures or impact the Funds’ net assets or results of operations.
Note 9 – Subsequent Events
At a meeting held on August 20-21, 2019, the Board of Trustees of Guggenheim Funds Trust approved changing the name of the Guggenheim Mid Cap Value Fund and the Guggenheim Mid Cap Value Institutional Fund to the Guggenheim SMid Cap Value Fund and the Guggenheim SMid Cap Value Institutional Fund, respectively. The name changes took effect on November 11, 2019.
At its August 20-21, 2019 meeting, the Board also approved an Agreement and Plan of Reorganization providing for the merger of the Guggenheim Mid Cap Value Institutional Fund (now known as the Guggenheim SMid Cap Value Institutional Fund) into a newly created Institutional share class of the Guggenheim Mid Cap Value Fund (now known as the Guggenheim SMid Cap Value Fund). The merger is anticipated to be completed in January 2020.
46 | THE GUGGENHEIM FUNDS ANNUAL REPORT | |
REPORT OF INDEPENDENT REGISTERED PUBLIC ACCOUNTING FIRM |
To the Shareholders and the Board of Trustees of Guggenheim SMid Cap Value Fund and Guggenheim SMid Cap Value Institutional Fund
Opinion on the Financial Statements
We have audited the accompanying statements of assets and liabilities of Guggenheim SMid Cap Value Fund and Guggenheim SMid Cap Value Institutional Fund (collectively referred to as the “Funds”), (two of the funds constituting Guggenheim Funds Trust (the “Trust”)), including the schedules of investments, as of September 30, 2019, and the related statements of operations for the year then ended, the statements of changes in net assets for each of the two years in the period then ended, the financial highlights for each of the five years in the period then ended and the related notes (collectively referred to as the “financial statements”). In our opinion, the financial statements present fairly, in all material respects, the financial position of the Funds (two of the funds constituting Guggenheim Funds Trust) at September 30, 2019, the results of their operations for the year then ended, the changes in their net assets for each of the two years in the period then ended and their financial highlights for each of the five years in the period then ended, in conformity with U.S. generally accepted accounting principles.
Basis for Opinion
These financial statements are the responsibility of the Trust’s management. Our responsibility is to express an opinion on each of the Funds’ financial statements based on our audits. We are a public accounting firm registered with the Public Company Accounting Oversight Board (United States) (“PCAOB”) and are required to be independent with respect to the Trust in accordance with the U.S. federal securities laws and the applicable rules and regulations of the Securities and Exchange Commission and the PCAOB.
We conducted our audits in accordance with the standards of the PCAOB. Those standards require that we plan and perform the audit to obtain reasonable assurance about whether the financial statements are free of material misstatement, whether due to error or fraud. The Trust is not required to have, nor were we engaged to perform, an audit of the Fund’s internal control over financial reporting. As part of our audits, we are required to obtain an understanding of internal control over financial reporting, but not for the purpose of expressing an opinion on the effectiveness of the Trust’s internal control over financial reporting. Accordingly, we express no such opinion.
Our audits included performing procedures to assess the risks of material misstatement of the financial statements, whether due to error or fraud, and performing procedures that respond to those risks. Such procedures included examining, on a test basis, evidence regarding the amounts and disclosures in the financial statements. Our procedures included confirmation of securities owned as of September 30, 2019, by correspondence with the custodian. Our audits also included
| | THE GUGGENHEIM FUNDS ANNUAL REPORT | 47 |
REPORT OF INDEPENDENT REGISTERED PUBLIC ACCOUNTING FIRM (concluded) |
evaluating the accounting principles used and significant estimates made by management, as well as evaluating the overall presentation of the financial statements. We believe that our audits provide a reasonable basis for our opinion.

We have served as the auditor of one or more Guggenheim investment companies since 1979.
Tysons, Virginia
November 26, 2019
48 | THE GUGGENHEIM FUNDS ANNUAL REPORT | |
OTHER INFORMATION (Unaudited) |
Federal Income Tax Information
This information is being provided as required by the Internal Revenue Code. Amounts shown may differ from those elsewhere in the report because of differences in tax and financial reporting practice.
In January 2020, shareholders will be advised on IRS Form 1099 DIV or substitute 1099 DIV as to the federal tax status of the distributions received by shareholders in the calendar year 2019.
The Funds’ investment income (dividend income plus short-term gains, if any) qualifies as follows:
Of the taxable ordinary income distributions paid during the fiscal year ending September 30, 2019, the Funds had the corresponding percentages qualify for the reduced tax rate pursuant to the Jobs and Growth Tax Relief and Reconciliation Act of 2003 or for the dividends received deduction for corporations. See the qualified dividend income and dividend received deduction columns, respectively, in the table below.
Additionally, of the taxable ordinary income distributions paid during the fiscal year ended September 30, 2019, the Funds had the corresponding percentages qualify as qualified short-term capital gains as permitted by IRC Section 871(k)(2). See qualified short-term capital gain column in the table below.
Fund | Qualified
Dividend
Income | Dividend
Received
Deduction | Qualified
Short-Term
Capital Gain |
SMid Cap Value Fund | 64.66% | 64.48% | 100% |
SMid Cap Value Institutional Fund | 57.13% | 57.05% | 100% |
With respect to the taxable year ended September 30, 2019, the Funds hereby designate as capital gain dividends the amounts listed below, or, if subsequently determined to be different, the net capital gain of such year:
Fund | | From long-term
capital gain: | | | From long-term capital
gain, using proceeds from
shareholder redemptions: | |
SMid Cap Value Fund | | $ | 44,231,355 | | | $ | 2,378,232 | |
SMid Cap Value Institutional Fund | | | 5,765,422 | | | | 568,346 | |
Proxy Voting Information
A description of the policies and procedures that the Trust uses to determine how to vote proxies relating to securities held in the Funds’ portfolios is available, without charge and upon request, by calling 800.820.0888. This information is also available from the EDGAR database on the SEC’s website at https://www.sec.gov.
| | THE GUGGENHEIM FUNDS ANNUAL REPORT | 49 |
OTHER INFORMATION (Unaudited)(continued) |
Information regarding how the Funds voted proxies relating to portfolio securities during the most recent 12-month period ended June 30 is available without charge, upon request, by calling 800.820.0888. This information is also available from the EDGAR database on the SEC’s website at https://www.sec.gov.
Special Meeting of Shareholders — Voting Results
A joint special meeting of shareholders of the Trust was held on October 28, 2019 to elect the following ten nominees to the Board of Trustees of the Trust: Randall C. Barnes, Angela Brock-Kyle, Donald A. Chubb, Jr., Jerry B. Farley, Roman Friedrich III, Thomas F. Lydon, Jr., Ronald A. Nyberg, Sandra G. Sponem, Ronald E. Toupin, Jr. and Amy J. Lee. At the meeting, the following votes were recorded:
Nominee | | Shares For | | | Shares Withheld | |
Randall C. Barnes | | | 919,263,831 | | | | 7,335,759 | |
Angela Brock-Kyle | | | 919,775,822 | | | | 6,823,768 | |
Donald A. Chubb, Jr. | | | 915,120,874 | | | | 11,478,716 | |
Jerry B. Farley | | | 915,377,483 | | | | 11,222,107 | |
Roman Friedrich III | | | 918,807,442 | | | | 7,792,148 | |
Thomas F. Lydon, Jr. | | | 919,122,642 | | | | 7,476,948 | |
Ronald A. Nyberg | | | 918,889,679 | | | | 7,709,911 | |
Sandra G. Sponem | | | 919,600,708 | | | | 6,998,882 | |
Ronald E. Toupin, Jr. | | | 919,043,208 | | | | 7,556,382 | |
Amy J. Lee | | | 919,943,855 | | | | 6,655,735 | |
Sector Classification
Information in the Schedule of Investments is categorized by sectors using sector-level Classifications defined by the Bloomberg Industry Classification System, a widely recognized industry classification system provider. Each Fund’s registration statement has investment policies relating to concentration in specific sectors/industries. For purposes of these investment policies, the Funds usually classify sectors/industries based on industry-level Classifications used by widely recognized industry classification system providers such as Bloomberg Industry Classification System, Global Industry Classification Standards and Barclays Global Classification Scheme.
Quarterly Portfolio Schedules Information
The Trust files its complete schedule of portfolio holdings with the SEC for the first and third quarters of each fiscal year on Form N-Q, which are available on the SEC’s website at https://www.sec.gov. The Funds’ Forms N-Q may be reviewed and copied at the SEC’s Public Reference Room in Washington, DC, and that information on the operation of the Public Reference Room may be obtained by calling 800-SEC-0330. Copies of the portfolio holdings are also available to shareholders, without charge and upon request, by calling 800.820.0888.
50 | THE GUGGENHEIM FUNDS ANNUAL REPORT | |
OTHER INFORMATION (Unaudited)(continued) |
Report of the Guggenheim Funds Trust Contracts Review Committee
Guggenheim Funds Trust (the “Trust”) was organized as a Delaware statutory trust on November 8, 2013, and is registered as an open-end management investment company under the Investment Company Act of 1940, as amended (the “1940 Act”). The Trust includes the following series:
● Guggenheim Alpha Opportunity Fund (“Alpha Opportunity Fund”) ● Guggenheim Diversified Income Fund (“Diversified Income Fund”) ● Guggenheim High Yield Fund (“High Yield Fund”) ● Guggenheim Large Cap Value Fund (“Large Cap Value Fund”) ● Guggenheim Macro Opportunities Fund (“Macro Opportunities Fund”) ● Guggenheim SMid Cap Value Fund (“SMid Cap Value Fund”) ● Guggenheim Municipal Income Fund (“Municipal Income Fund”) ● Guggenheim Small Cap Value Fund (“Small Cap Value Fund”) ● Guggenheim StylePlus—Mid Growth Fund (“StylePlus—Mid Growth Fund”) ● Guggenheim Ultra Short Duration Fund (“Ultra Short Duration Fund”) | ● Guggenheim Capital Stewardship Fund (“Capital Stewardship Fund”) ● Guggenheim Floating Rate Strategies Fund (“Floating Rate Strategies Fund”) ● Guggenheim Investment Grade Bond Fund (“Investment Grade Bond Fund”) ● Guggenheim Limited Duration Fund (“Limited Duration Fund”) ● Guggenheim Market Neutral Real Estate Fund (“Market Neutral Real Estate Fund”) ● Guggenheim SMid Cap Value Institutional Fund (“SMid Cap Value Institutional Fund”) ● Guggenheim Risk Managed Real Estate Fund (“Risk Managed Real Estate Fund”) ● Guggenheim StylePlus—Large Core Fund (“StylePlus—Large Core Fund”) ● Guggenheim Total Return Bond Fund (“Total Return Bond Fund”) ● Guggenheim World Equity Income Fund (“World Equity Income Fund”) |
Security Investors, LLC (“Security Investors”), an indirect subsidiary of Guggenheim Partners, LLC, a privately-held, global investment and advisory firm (“Guggenheim Partners”), serves as investment adviser to each of: (i) Alpha Opportunity Fund; (ii) High Yield Fund; (iii) Investment Grade Bond Fund; (iv) Large Cap Value Fund; (v) SMid Cap Value Fund; (vi) SMid Cap Value Institutional Fund; (vii) Municipal Income Fund; (viii) Small Cap Value Fund; (ix) StylePlus—Large Core Fund; (x) StylePlus—Mid Growth Fund; and (xi) World Equity Income Fund (collectively, the “SI-Advised Funds”). (Guggenheim Partners, Security Investors, Guggenheim Partners Investment Management, LLC (“GPIM”) and their affiliates may be referred to herein collectively
| | THE GUGGENHEIM FUNDS ANNUAL REPORT | 51 |
OTHER INFORMATION (Unaudited)(continued) |
as “Guggenheim.” Security Investors and GPIM are also known as “Guggenheim Investments,” the global asset management and investment advisory division of Guggenheim Partners that includes other affiliated investment management businesses.)
Under the terms of investment management agreements between Security Investors and the Trust, with respect to the SI-Advised Funds, Security Investors also is responsible for overseeing the activities of GPIM, an indirect subsidiary of Guggenheim Partners, with respect to its service as investment sub-adviser to Municipal Income Fund, pursuant to an investment sub-advisory agreement between Security Investors and GPIM (the “GPIM Sub-Advisory Agreement”).
GPIM serves as investment adviser with respect to each of: (i) Diversified Income Fund; (ii) Floating Rate Strategies Fund; (iii) Limited Duration Fund; (iv) Macro Opportunities Fund; (v) Market Neutral Real Estate Fund; (vi) Risk Managed Real Estate Fund; (vii) Total Return Bond Fund; and (viii) Ultra Short Duration Fund (collectively, the “GPIM-Advised Funds” and together with the SI-Advised Funds, the “Funds” and individually, a “Fund”).1 Under the supervision of the Board of Trustees of the Trust (the “Board,” with the members of the Board referred to individually as the “Trustees”), the Advisers regularly provide (or, as applicable, oversee the provision of) investment research, advice and supervision, along with a continuous investment program for the Funds, and direct the purchase and sale of securities and other investments for each Fund’s portfolio. GPIM also serves as investment adviser for the Capital Stewardship Fund, which is addressed in a separate report.2
Each of the Advisory Agreements continues in effect from year to year provided that such continuance is specifically approved at least annually by (i) the Board or a majority of the outstanding voting securities (as defined in the 1940 Act) of each Fund, and, in either event, (ii) the vote of a majority of the Trustees who are not “interested person[s],” as defined by the 1940 Act, of the Trust (the “Independent Trustees”) casting votes in person at a meeting called for such purpose. At meetings held in person on April 25, 2019 (the “April Meeting”) and on May 21, 2019 (the “May Meeting”), the members of the Contracts Review Committee of the Board (the “Committee”), consisting solely of the Independent Trustees, met separately from Guggenheim to consider the proposed renewal of the Agreements in connection with the Committee’s annual contract review schedule.
1 | The investment management agreements pertaining to the SI-Advised Funds and the investment management agreements pertaining to the GPIM-Advised Funds are referred to herein together as the “Advisory Agreements” and, together with the GPIM Sub-Advisory Agreement, as the “Agreements.” In addition, unless the context indicates otherwise, GPIM, with respect to its service as investment adviser to the GPIM-Advised Funds, and Security Investors as to the SI-Advised Funds, are each referred to herein as the “Adviser” and together, the “Advisers.” |
2 | Because shares of the Capital Stewardship Fund are only offered for subscription and are held by a limited number of institutional/bank investors, and the Fund issues a shareholder report separate from the other series of the Trust, the factors considered by the Committee in evaluating the proposed renewal of an investment management agreement pertaining to the Capital Stewardship Fund, and the Sub-Advisory Agreement with Concinnity Advisors, LP, are addressed in a separate report of the Committee. Accordingly, references to the “Funds” should be understood as referring to all series of the Trust, excluding Capital Stewardship Fund. |
52 | THE GUGGENHEIM FUNDS ANNUAL REPORT | |
OTHER INFORMATION (Unaudited)(continued) |
As part of its review process, the Committee was represented by independent legal counsel to the Independent Trustees (“Independent Legal Counsel”), from whom the Independent Trustees received separate legal advice and with whom they met separately. Independent Legal Counsel reviewed and discussed with the Committee various key aspects of the Trustees’ legal responsibilities relating to the proposed renewal of the Agreements and other principal contracts. The Committee took into account various materials received from Guggenheim and Independent Legal Counsel. Recognizing that the evaluation process with respect to the services provided by Guggenheim is an ongoing one, the Committee also considered the variety of written materials, reports and oral presentations the Board receives throughout the year regarding performance and operating results of the Funds and other information relevant to its evaluation of the Agreements.
In connection with the contract review process, FUSE Research Network LLC (“FUSE”), an independent, third-party research provider, was engaged to prepare advisory contract renewal reports designed specifically to help the Board fulfill its advisory contract renewal responsibilities. The objective of the reports is to present the subject funds’ relative position regarding fees, expenses and total return performance, with peer group and universe comparisons. The Committee assessed the data provided in the FUSE reports as well as commentary presented by Guggenheim, including, among other things, a summary of notable distinctions between certain Funds and the applicable peer group identified in the FUSE reports and explanations for custom peer groups created for certain Funds that do not fit well into any particular category.
In addition, Guggenheim provided materials and data in response to formal requests for information sent by Independent Legal Counsel on behalf of the Independent Trustees. Guggenheim also made a presentation at the April Meeting. Throughout the process, the Committee asked questions of management and requested certain additional information, which Guggenheim provided (collectively with the foregoing reports and materials, the “Contract Review Materials”). The Committee considered the Contract Review Materials in the context of its accumulated experience governing the Trust and weighed the factors and standards discussed with Independent Legal Counsel.
Following an analysis and discussion of relevant factors, including those identified below, and in the exercise of its business judgment, the Committee concluded that it was in the best interest of each Fund to recommend that the Board approve the renewal of each of the Advisory Agreements and the GPIM Sub-Advisory Agreement for an additional annual term.
Advisory Agreements
Nature, Extent and Quality of Services Provided by each Adviser: With respect to the nature, extent and quality of services currently provided by each Adviser, the Committee considered the qualifications, experience and skills of key personnel performing services for the Funds, including those personnel providing compliance and risk oversight, as well as the supervisors and reporting lines for such personnel. The Committee considered Guggenheim’s
| | THE GUGGENHEIM FUNDS ANNUAL REPORT | 53 |
OTHER INFORMATION (Unaudited)(continued) |
resources and related efforts to retain, attract and motivate capable personnel to serve the Funds. In evaluating Guggenheim’s resources and capabilities, the Committee considered Guggenheim’s commitment to focusing on, and investing resources in support of, the Funds.
The Committee’s review of the services provided by Guggenheim to the Funds included consideration of Guggenheim’s investment processes and resulting performance, portfolio oversight and risk management, and the related regular quarterly reports and presentations received by the Board. The Committee took into account the risks borne by Guggenheim in sponsoring and providing services to the Funds, including entrepreneurial, legal and regulatory risks. The Committee considered the resources dedicated by Guggenheim to compliance functions and the reporting made to the Board by Guggenheim compliance personnel regarding Guggenheim’s adherence to regulatory requirements. The Committee also considered the regular reports the Board receives from the Trust’s Chief Compliance Officer regarding compliance policies and procedures established pursuant to Rule 38a-1 under the 1940 Act.
In connection with the Committee’s evaluation of the overall package of services provided by Guggenheim, the Committee considered Guggenheim’s administrative services, including its role in supervising, monitoring, coordinating and evaluating the various services provided by the fund administrator, transfer agent, distributor, custodian and other service providers to the Funds. The Committee evaluated the Office of Chief Financial Officer (the “OCFO”), established to oversee the fund administration, accounting and transfer agency services provided to the Funds, including the OCFO’s resources, personnel and services provided.
With respect to Municipal Income Fund, the Committee noted that, although Security Investors delegated responsibility for the investment and reinvestment of the Fund’s assets to the Sub-Adviser, as affiliated companies, both the Adviser and Sub-Adviser are part of the Guggenheim organization. Further, the Committee took into account Guggenheim’s explanation that investment advisory-related services are provided by many Guggenheim employees under different related legal entities and thus, the services provided by the Adviser on the one hand and the Sub-Adviser on the other, as well as the risks assumed by each party, cannot be ascribed to distinct legal entities.3 As a result, the Committee did not evaluate the services provided to Municipal Income Fund under the Advisory Agreement and the GPIM Sub-Advisory Agreement separately.
With respect to Guggenheim’s resources and the ability of each Adviser to carry out its responsibilities under the applicable Advisory Agreement, the Chief Financial Officer of Guggenheim Investments reviewed with the Committee financial information concerning the holding company for Guggenheim Investments, Guggenheim Partners Investment Management
3 | Consequently, except where the context indicates otherwise, references to “Adviser” or “Sub-Adviser” should be understood as referring to Guggenheim Investments generally and the services it provides under both Agreements. |
54 | THE GUGGENHEIM FUNDS ANNUAL REPORT | |
OTHER INFORMATION (Unaudited)(continued) |
Holdings, LLC (“GPIMH”), and the various entities comprising Guggenheim Investments, and provided the audited consolidated financial statements of GPIMH. (Thereafter, the Committee received the audited consolidated financial statements of GPIM.)
The Committee also considered the acceptability of the terms of each Advisory Agreement, including the scope of services required to be performed by each Adviser.
Based on the foregoing, and based on other information received (both oral and written) at the April Meeting and the May Meeting, as well as other considerations, including the Committee’s knowledge of how each Adviser performs its duties obtained through Board meetings, discussions and reports throughout the year, the Committee concluded that each Adviser and its personnel were qualified to serve the Funds in such capacity and may reasonably be expected to continue to provide a high quality of services under each Advisory Agreement with respect to the Funds.
Investment Performance: The Committee received, for each Fund, investment returns for the since-inception, ten-year, five-year, three-year, one-year and three-month periods ended December 31, 2018, as applicable. In addition, the Committee received a comparison of each Fund’s performance to the performance of a benchmark, a universe of funds and a narrower peer group of similar funds based on asset levels as identified by FUSE, in each case for the same periods, as applicable. The Committee also received from FUSE a description of the methodology for identifying each Fund’s peer group and universe for performance and expense comparisons.
In seeking to evaluate Fund performance over a full market cycle, the Committee focused its attention on five-year and three-year performance rankings as compared to the relevant universe of funds. The Committee considered more recent performance periods for those Funds that were recently launched, as well as in circumstances in which enhancements were being made to the portfolio management processes or techniques employed for a Fund. Except as to the individual Funds discussed below, the Committee observed that the returns of each Fund’s (other than SMid Cap Value Fund) Institutional Class shares and SMid Cap Value Fund’s Class A shares ranked in the third quartile or better of such Fund’s performance universe for each of the relevant periods considered.
In addition, the Committee made the following observations:
Municipal Income Fund: The returns of the Fund’s Institutional Class shares ranked in the 55th and 82nd percentiles of its performance universe for the five-year and three-year periods ended December 31, 2018, respectively. The Committee noted management’s explanation that the Fund’s increased allocation to floating rate securities in 2016 and the Fund’s more conservative investment approach detracted from performance that year, impacting trailing returns for five-year and three-year periods. In light of the foregoing, the Committee also considered the more recent one-year and three-month periods ended December 31, 2018, and observed that the returns of Fund’s Institutional Class shares ranked in the 30th and 11th percentiles, respectively, of its
| | THE GUGGENHEIM FUNDS ANNUAL REPORT | 55 |
OTHER INFORMATION (Unaudited)(continued) |
performance universe. The Committee also took into account management’s statement that it expects the Fund’s performance to continue to improve going forward as it anticipates the effects of recent tax reform and idiosyncratic risks.
Small Cap Value Fund: The returns of the Fund’s Institutional Class shares ranked in the 79th and 56th percentiles of its performance universe for the five-year and three-year periods ended December 31, 2018, respectively. The Committee noted measures taken by the Adviser to remedy longer-term relative underperformance with respect to the Value Funds strategy, including strategy enhancements such as implementation of a refined stock selection process and additional risk controls to enforce the strategy’s sell discipline. In light of the foregoing, the Committee also considered the more recent one-year and three-month periods ended December 31, 2018, and observed that the returns of Fund’s Institutional Class shares ranked in the 19th and 20th percentiles, respectively, of its performance universe.
After reviewing the foregoing and related factors, the Committee concluded that: (i) each Fund’s performance was acceptable; or (ii) it was satisfied with Guggenheim’s responses and efforts to improve investment performance.
Comparative Fees, Costs of Services Provided and the Profits Realized by each Adviser from Its Relationship with the Funds: The Committee compared each Fund’s contractual advisory fee, net effective management fee and total net expense ratio to the applicable peer group. The Committee also reviewed the median advisory fees and expense ratios, including expense ratio components (e.g., transfer agency fees, administration fees, other operating expenses, distribution fees and fee waivers/reimbursements), of the peer group of funds.
As part of its evaluation of each Fund’s advisory fee, the Committee considered how such fees compared to the advisory fee charged by the applicable Adviser to one or more other clients that it manages pursuant to similar investment strategies, to the extent applicable, noting that, in certain instances, Guggenheim charges a lower advisory fee to such other clients. In this connection, the Committee considered, among other things, Guggenheim’s representations about the significant differences between managing mutual funds as compared to other types of accounts. The Committee also considered Guggenheim’s explanation that lower fees are charged in certain instances due to various other factors, including the scope of contract, type of investors, fee structure, applicable legal, governance and capital structures, tax status and historical pricing reasons. In addition, the Committee took into account Guggenheim’s discussion of the entrepreneurial, legal and regulatory risks it faces when offering the Funds as compared to other types of accounts. The Committee concluded that the information it received demonstrated that the aggregate services provided to, or the specific circumstances of, each Fund were sufficiently different from the services provided to, or the specific circumstances of, other clients with similar investment strategies and/or the risks borne by Guggenheim were sufficiently greater than those associated with managing other clients with similar investment strategies to support the difference in fees.
56 | THE GUGGENHEIM FUNDS ANNUAL REPORT | |
OTHER INFORMATION (Unaudited)(continued) |
In further considering the comparative fee and expense data presented in the Contract Review Materials and addressed by Guggenheim, the Committee took into account those Funds with currently effective expense limitation agreements with the Adviser. Except as to the individual Funds discussed below, the Committee observed that each Fund’s average contractual advisory fee percentile rank across all share classes of the Fund, net effective management fee4 and asset-weighted total net expense ratio each rank in the third quartile or better of such Fund’s peer group.
In addition, the Committee made the following observations:
Diversified Income Fund: The average contractual advisory fee percentile rank across all share classes of the Fund is in the fourth quartile (78th percentile) of its peer group. The Fund’s net effective management fee ranks in the first quartile (1st percentile) of its peer group. The Committee considered that the Fund’s asset weighted total net expense ratio ranks in the second quartile (38th percentile) of its peer group. The Committee also took into account the Adviser’s statement that the Fund’s currently effective expense limitation agreement with the Adviser is intended to limit the impact of the Fund’s small size.
Floating Rate Strategies Fund: The average contractual advisory fee percentile rank across all share classes of the Fund is in the fourth quartile (92nd percentile) of its peer group. The Fund’s net effective management fee ranks in the fourth quartile (76th percentile) of its peer group. The Committee considered that the Fund’s asset weighted total net expense ratio ranks in the third quartile (58th percentile) of its peer group. The Committee also considered the Adviser’s statement explaining the higher fees that performance is driven by a unique investment approach that requires significant resources. In this regard, the Committee took into consideration the Fund’s strong investment performance for the five-year period ended December 31, 2018. In addition, the Committee noted the Adviser’s statement that the net effective management fee includes 0.08% in administration fees that is not paid to the Adviser. The Committee also took into account the Fund’s currently effective expense limitation agreement with the Adviser.
High Yield Fund: The average contractual advisory fee percentile rank across all share classes of the Fund is in the third quartile (54th percentile) of its peer group. The Fund’s net effective management fee ranks in the fourth quartile (76th percentile) of its peer group. The Fund’s asset weighted total net expense ratio ranks in the third quartile (73rd percentile) of its peer group. The Committee considered the Adviser’s statement explaining the higher fees that performance is driven by a unique investment approach that requires significant resources. In this regard, the Committee took into consideration the Fund’s strong investment performance for the five-year and three-year periods ended December 31, 2018. In addition, the Committee noted the Adviser’s
4 | The “net effective management fee” for each Fund represents the combined effective advisory fee and administration fee as a percentage of average net assets for the latest fiscal year, after any waivers and/or reimbursements, based on the Fund’s class level peer group percent rank, weighted by class level assets under management. |
| | THE GUGGENHEIM FUNDS ANNUAL REPORT | 57 |
OTHER INFORMATION (Unaudited)(continued) |
statement that the net effective management fee includes 0.08% in administration fees that is not paid to the Adviser. The Committee also took into account the Fund’s currently effective expense limitation agreement with the Adviser.
Limited Duration Fund: The average contractual advisory fee percentile rank across all share classes of the Fund is in the third quartile (63rd percentile) of its peer group. The Fund’s net effective management fee ranks in the fourth quartile (80th percentile) of its peer group. The Committee considered that the Fund’s asset weighted total net expense ratio ranks in the third quartile (51st percentile) of its peer group. The Committee also considered the Adviser’s statement explaining the higher fees that performance is driven by a unique investment approach that requires significant resources. In this regard, the Committee took into consideration the Fund’s strong investment performance for the five-year and three-year periods ended December 31, 2018. In addition, the Committee noted the Adviser’s statement that the net effective management fee includes 0.08% in administration fees that is not paid to the Adviser. The Committee also took into account the Fund’s currently effective expense limitation agreement with the Adviser.
Macro Opportunities Fund: The average contractual advisory fee percentile rank across all share classes of the Fund, the Fund’s net effective management fee and the Fund’s asset weighted total net expense ratio each rank in the fourth quartile (93rd, 81st and 83rd percentiles, respectively) of its peer group. The Committee noted that the Fund is categorized as a non-traditional bond fund which seeks to add value by investing in many non-traditional securities outside of fixed income, including equities, currencies, commodities and derivatives. The Committee considered the Adviser’s statement explaining the higher fees and expenses that performance is driven by a unique investment approach that requires significant resources. In this regard, the Committee took into consideration the Fund’s strong investment performance for the five-year and three-year periods ended December 31, 2018. The Committee also took into account the Fund’s currently effective expense limitation agreement with the Adviser. The Committee also noted that, in connection with the contract review process, the Adviser formalized an existing expense waiver agreement with the Fund pursuant to which the Adviser waives any Fund expenses attributable to the Fund’s investment in Alpha Opportunity Fund.
SMid Cap Value Institutional Fund: The Fund’s contractual advisory fee ranks in the first quartile (7th percentile) of its peer group. The Fund’s net effective management fee and asset weighted total net expense ratio each rank in the fourth quartile (79th and 86th percentiles, respectively) of its peer group. The Committee considered the Adviser’s statement explaining the higher fees and expenses that it has made adjustments to the strategy of the Fund over the last few years incorporating a more systematic approach in order to improve investment performance. In this regard, the Committee took into consideration the Fund’s strong investment performance for the three-year period ended December 31, 2018. In addition, the Committee noted the Adviser’s statement that the net effective management fee includes 0.08% in administration fees that is not paid to the Adviser. The Committee also considered the Adviser’s statement that the Fund has
58 | THE GUGGENHEIM FUNDS ANNUAL REPORT | |
OTHER INFORMATION (Unaudited)(continued) |
continued to experience outflows resulting in lower relative assets to peers and associated higher other operating expenses, and that the Adviser is evaluating strategic measures to improve the Fund’s positioning.
Risk Managed Real Estate Fund: The average contractual advisory fee percentile rank across all share classes of the Fund is in the first quartile (22nd percentile) of its peer group. The Fund’s net effective management fee ranks in the fourth quartile (78th percentile) of its peer group. The Committee considered that the Fund’s asset weighted total net expense ratio ranks in the second quartile (47th percentile) of its peer group. The Committee took into consideration the Fund’s strong investment performance for the three-year and one-year periods ended December 31, 2018. The Committee also took into account the Fund’s currently effective expense limitation agreement with the Adviser.
StylePlus—Large Core Fund: The average contractual advisory fee percentile rank across all share classes of the Fund is in the third quartile (62nd percentile) of its peer group. The Fund’s net effective management fee ranks in the fourth quartile (86th percentile) of its peer group. The Committee considered that the Fund’s asset weighted total net expense ratio ranks in the third quartile (66th percentile) of its peer group. The Committee also considered the Adviser’s statement explaining the higher fees that performance is driven by a unique combination of passive and actively managed strategies. In this regard, the Committee took into consideration the Fund’s strong investment performance for the five-year and three-year periods ended December 31, 2018.
Total Return Bond Fund: The average contractual advisory fee percentile rank across all share classes of the Fund is in the third quartile (68th percentile) of its peer group. The Fund’s net effective management fee ranks in the fourth quartile (78th percentile) of its peer group. The Committee considered that the Fund’s asset weighted total net expense ratio ranks in the 50th percentile of its peer group. The Committee also considered the Adviser’s statement explaining the higher fees that performance is driven by a unique investment approach that requires significant resources. In this regard, the Committee took into consideration the Fund’s strong investment performance for the five-year and three-year periods ended December 31, 2018. In addition, the Committee noted the Adviser’s statement that the net effective management fee includes 0.08% in administration fees that is not paid to the Adviser. The Committee also took into account the Fund’s currently effective expense limitation agreement with the Adviser.
With respect to the costs of services provided and profits realized by Guggenheim Investments from its relationship with the Funds, the Committee reviewed a profitability analysis and data from management for each Fund setting forth the average assets under management for the twelve months ended December 31, 2018, gross revenues received by Guggenheim Investments, expenses allocated to the Fund, expense waivers (as applicable), earnings and the operating margin/profitability rate, including variance information relative to the foregoing amounts
| | THE GUGGENHEIM FUNDS ANNUAL REPORT | 59 |
OTHER INFORMATION (Unaudited)(continued) |
as of December 31, 2017. In addition, the Chief Financial Officer of Guggenheim Investments reviewed with, and addressed questions from, the Committee concerning the expense allocation methodology employed in producing the profitability analysis.
In the course of its review of Guggenheim Investments’ profitability, the Committee took into account the methods used by Guggenheim Investments to determine expenses and profit. The Committee considered all of the foregoing in evaluating the costs of services provided, the profitability to Guggenheim Investments and the profitability rates presented, and concluded that the profits were not unreasonable.
The Committee considered other benefits available to each Adviser because of its relationship with the Funds and noted Guggenheim’s statement that it does not believe the Advisers derive any such “fall-out” benefits. In this regard, the Committee noted Guggenheim’s statement that, although it does not consider such benefits to be fall-out benefits, the Advisers may benefit from marketing synergies arising from offering a broad spectrum of products, including the Funds.
Economies of Scale: The Committee received and considered information regarding whether there have been economies of scale with respect to the management of the Funds as Fund assets grow, whether the Funds have appropriately benefited from any economies of scale, and whether there is potential for realization of any further economies of scale. The Committee considered whether economies of scale in the provision of services to the Funds were being passed along to the shareholders. The Committee noted the Adviser’s statements, including that Guggenheim believes it is appropriately sharing potential economies of scale and that costs continue to increase in many key areas, including compensation of portfolio managers, key analysts and support staff, as well as for infrastructure needs, with respect to risk management oversight, valuation processes and disaster recovery systems, among other things, and that, in this regard, management’s costs for providing services have increased in recent years without regard to asset levels.
The Committee also noted the process employed by the Adviser to evaluate whether it would be appropriate to institute a new breakpoint for a Fund, with consideration given to, among other things: (i) the Fund’s size and trends in asset levels over recent years; (ii) the competitiveness of the expense levels; (iii) whether expense waivers are in place; (iv) changes and trends in revenue and expenses; (v) whether there are any anticipated expenditures that may benefit the Fund in the future; (vi) Fund profit level margins; (vii) relative Fund performance; (viii) the nature, extent and quality of services management provides to the Fund; and (ix) the complexity of the Fund’s investment strategy and the resources required to support the Fund.
As part of its assessment of economies of scale, the Committee also considered Guggenheim’s view that it seeks to share economies of scale through a number of means, including breakpoints, advisory fees set at competitive rates pre-assuming future asset growth, expense waivers and limitations, and investments in personnel, operations and infrastructure to support the Fund
60 | THE GUGGENHEIM FUNDS ANNUAL REPORT | |
OTHER INFORMATION (Unaudited)(continued) |
business. Thus, the Committee considered the size of the Funds and the competitiveness of and/or other determinations made regarding the current advisory fee for each Fund, as well as whether a Fund is subject to an expense limitation.
Based on the foregoing, the Committee determined that the advisory fee for each Fund was reasonable.
Sub-Advisory Agreement
Nature, Extent and Quality of Services Provided by the Sub-Adviser: As noted above, because both the Adviser and Sub-Adviser for Municipal Income Fund—Security Investors and GPIM, respectively—are part of and do business as Guggenheim Investments and the services provided by the Adviser on the one hand and the Sub-Adviser on the other cannot be ascribed to distinct legal entities, the Committee did not evaluate the services provided under the Advisory Agreement and Sub-Advisory Agreement separately. Therefore, the Committee considered the qualifications, experience and skills of the Fund’s portfolio management team in connection with the Committee’s evaluation of Guggenheim’s investment professionals under the applicable Advisory Agreement.
With respect to Guggenheim’s resources and the Sub-Adviser’s ability to carry out its responsibilities under the Sub-Advisory Agreement, as noted above, the Committee considered the financial condition of GPIMH and the various entities comprising Guggenheim Investments. (Thereafter, the Committee received the audited consolidated financial statements of GPIM.)
The Committee also considered the acceptability of the terms of the Sub-Advisory Agreement, including the scope of services required to be performed by the Sub-Adviser.
Investment Performance: The Committee considered the returns of the Fund under its evaluation of the Advisory Agreement.
Comparative Fees, Costs of Services Provided and the Profits Realized by the Sub-Adviser from Its Relationship with the Fund: The Committee considered that the Sub-Advisory Agreement is with an affiliate of the Adviser, that the Adviser compensates the Sub-Adviser from its own fees so that the sub-advisory fee rate for the Fund does not impact the fees paid by the Fund and that the Sub-Adviser’s revenues were included in the calculation of Guggenheim Investments’ profitability. Given its determination of the reasonableness of the advisory fee, the Committee concluded that the sub-advisory fee rate for the Fund was not unreasonable.
Economies of Scale: The Committee recognized that, because the Sub-Adviser’s fees are paid by the Adviser and not the Fund, the analysis of economies of scale was more appropriate in the context of the Committee’s consideration of the applicable Advisory Agreement, which was separately considered. (See “Advisory Agreements – Economies of Scale” above.)
| | THE GUGGENHEIM FUNDS ANNUAL REPORT | 61 |
OTHER INFORMATION (Unaudited)(concluded) |
Overall Conclusions
Based on the foregoing, the Committee determined that the investment advisory fees are fair and reasonable in light of the extent and quality of the services provided and other benefits received and that the continuation of each of the Agreements is in the best interest of each Fund. In reaching this conclusion, no single factor was determinative or conclusive and each Committee member, in the exercise of his business judgment, may afford different weights to different factors. At the May Meeting, the Committee, constituting all of the Independent Trustees, recommended the renewal of each Advisory Agreement and the Sub-Advisory Agreement for an additional annual term.
62 | THE GUGGENHEIM FUNDS ANNUAL REPORT | |
INFORMATION ON BOARD OF TRUSTEES AND OFFICERS (Unaudited) |
Name, Address*
and Year of Birth
of Trustees | Position(s)
Held with
the Trust | Term of Office
and Length of
Time Served** | Principal Occupation(s)
During Past 5 Years | Number of
Portfolios
in Fund
Complex
Overseen | Other Directorships
Held by Trustees |
INDEPENDENT TRUSTEES | | | |
Randall C. Barnes (1951) | Trustee | Since 2014 | Current: Private Investor (2001-present). Former: Senior Vice President and Treasurer, PepsiCo, Inc. (1993-1997); President, Pizza Hut International (1991-1993); Senior Vice President, Strategic Planning and New Business Development, PepsiCo, Inc. (1987-1990). | 158 | Current: Trustee, Purpose Investments Funds (2013-present). Former: Managed Duration Investment Grade Municipal Fund (2003-2016). |
Angela Brock-Kyle (1959) | Trustee | Since November 2019 | Current: Founder and Chief Executive Officer, B.O.A.R.D.S (consulting firm). Former: Senior Leader, TIAA (financial services firm) (1987-2012). | 157 | None. |
Donald A.
Chubb, Jr. (1946) | Trustee and Chairman of the Valuation Oversight Committee | Since 1994 | Current: Retired. Former: Business broker and manager of commercial real estate, Griffith & Blair, Inc. (1997-2017). | 157 | Former: Midland Care, Inc. (2011-2016). |
Jerry B. Farley (1946) | Trustee and Chairman of the Audit Committee | Since 2005 | Current: President, Washburn University (1997-present). | 157 | Current: CoreFirst Bank & Trust (2000-present). Former: Westar Energy, Inc. (2004-2018). |
| | THE GUGGENHEIM FUNDS ANNUAL REPORT | 63 |
INFORMATION ON BOARD OF TRUSTEES AND OFFICERS (Unaudited)(continued) |
Name, Address*
and Year of Birth
of Trustees | Position(s)
Held with
the Trust | Term of Office
and Length of
Time Served** | Principal Occupation(s)
During Past 5 Years | Number of
Portfolios
in Fund
Complex
Overseen | Other Directorships
Held by Trustees |
INDEPENDENT TRUSTEES - continued | | |
Roman
Friedrich III (1946) | Trustee and Chairman of the Contracts Review Committee | Since 2014 | Current: Founder and Managing Partner, Roman Friedrich & Company (1998-present). | 157 | Former: Zincore Metals, Inc. (2009-January 2019). |
Thomas F.
Lydon, Jr. (1960) | Trustee | Since November 2019 | Current: President, Global Trends Investments (registered investment adviser) (1996-present). | 157 | Current: US Global Investors (GROW) (1995-present); and Harvest Volatility Edge Trust (3) (2017-present). |
Ronald A. Nyberg (1953) | Trustee and Chairman of the Nominating and Governance Committee | Since 2014 | Current: Partner, Momkus LLC (2016-present). Former: Partner, Nyberg & Cassioppi, LLC (2000-2016); Executive Vice President, General Counsel, and Corporate Secretary, Van Kampen Investments (1982-1999). | 158 | Current: PPM Funds (9) (2018-present); Edward-Elmhurst Healthcare System (2012-present); Western Asset Inflation-Linked Opportunities & Income Fund (2004-present); Western Asset Inflation-Linked Income Fund (2003-present). Former: Managed Duration Investment Grade Municipal Fund (2003-2016). |
Sandra G. Sponem (1958) | Trustee | Since November 2019 | Current: Retired. Former: Senior Vice President and Chief Financial Officer, M.A. Mortenson Companies, Inc. (general contracting firm) (2007-2017). | 157 | Current: SPDR Series Trust (78) (2018-present); SPDR Index Shares Funds (31) (2018-present); SSGA Active Trust (12) (2018-present); and SSGA Master Trust (1) (2018-present). |
64 | THE GUGGENHEIM FUNDS ANNUAL REPORT | |
INFORMATION ON BOARD OF TRUSTEES AND OFFICERS (Unaudited)(continued) |
Name, Address*
and Year of Birth
of Trustees | Position(s)
Held with
the Trust | Term of Office
and Length of
Time Served** | Principal Occupation(s)
During Past 5 Years | Number of
Portfolios
in Fund
Complex
Overseen | Other Directorships
Held by Trustees |
INDEPENDENT TRUSTEES - concluded | | |
Ronald E.
Toupin, Jr. (1958) | Trustee and Chairman of the Board | Since 2014 | Current: Portfolio Consultant (2010-present); Member, Governing Council, Independent Directors Council (2013-present); Governor, Board of Governors, Investment Company Institute (2018-present). Former: Member, Executive Committee, Independent Directors Council (2016-2018); Vice President, Manager and Portfolio Manager, Nuveen Asset Management (1998-1999); Vice President, Nuveen Investment Advisory Corp. (1992-1999); Vice President and Manager, Nuveen Unit Investment Trusts (1991-1999); and Assistant Vice President and Portfolio Manager, Nuveen Unit Investment Trusts (1988-1999), each of John Nuveen & Co., Inc. (1982-1999). | 157 | Current: Western Asset Inflation-Linked Opportunities & Income Fund (2004-present); Western Asset Inflation-Linked Income Fund (2003-present). Former: Managed Duration Investment Grade Municipal Fund (2003-2016). |
| | THE GUGGENHEIM FUNDS ANNUAL REPORT | 65 |
INFORMATION ON BOARD OF TRUSTEES AND OFFICERS (Unaudited)(continued) |
Name, Address*
and Year of Birth
of Trustees | Position(s)
Held with
the Trust | Term of Office
and Length of
Time Served** | Principal Occupation(s)
During Past 5 Years | Number of
Portfolios
in Fund
Complex
Overseen | Other Directorships
Held by Trustees |
INTERESTED TRUSTEE | |
Amy J. Lee*** (1961) | Trustee, Vice President and Chief Legal Officer | Since 2018 (Trustee) Since 2014 (Chief Legal Officer) Since 2007 (Vice President) | Current: Interested Trustee, certain other funds in the Fund Complex (2018-present); Chief Legal Officer, certain other funds in the Fund Complex (2014-present); Vice President, certain other funds in the Fund Complex (2007-present); Senior Managing Director, Guggenheim Investments (2012-present). Former: President and Chief Executive Officer (2017-2018); President, certain other funds in the Fund Complex (2017-November 2019); Vice President, Associate General Counsel and Assistant Secretary, Security Benefit Life Insurance Company and Security Benefit Corporation (2004-2012). | 157 | None. |
* | The business address of each Trustee is c/o Guggenheim Investments, 227 West Monroe Street, Chicago, Illinois 60606. |
** | Each Trustee serves an indefinite term, until his or her successor is elected and qualified. Time served includes time served in the respective position for the Predecessor Corporation. |
*** | This Trustee is deemed to be an “interested person” of the Funds under the 1940 Act by reason of her position with the Funds’ Investment Manager and/or the parent of the Investment Manager. |
66 | THE GUGGENHEIM FUNDS ANNUAL REPORT | |
INFORMATION ON BOARD OF TRUSTEES AND OFFICERS (Unaudited)(continued) |
Name, Address*
and Year of Birth | Position(s)
Held with
the Trust | Term of Office
and Length of
Time Served** | Principal Occupations
During Past 5 Years |
OFFICERS | | | |
Brian E. Binder (1972) | President and Chief Executive Officer | Since 2018 | Current: President and Chief Executive Officer, certain other funds in the Fund Complex (2018-present); President and Chief Executive Officer, Guggenheim Funds Investment Advisors, LLC and Security Investors, LLC (2018-present); Senior Managing Director and Chief Administrative Officer, Guggenheim Investments (2018-present). Former: Managing Director and President, Deutsche Funds, and Head of US Product, Trading and Fund Administration, Deutsche Asset Management (2013-2018); Managing Director, Head of Business Management and Consulting, Invesco Ltd. (2010-2012). |
James M. Howley (1972) | Assistant Treasurer | Since 2014 | Current: Managing Director, Guggenheim Investments (2004-present); Assistant Treasurer, certain other funds in the Fund Complex (2006-present). Former: Manager, Mutual Fund Administration of Van Kampen Investments, Inc. (1996-2004). |
Mark E. Mathiasen (1978) | Secretary | Since 2014 | Current: Secretary, certain other funds in the Fund Complex (2007-present); Managing Director, Guggenheim Investments (2007-present). |
Glenn McWhinnie (1969) | Assistant Treasurer | Since 2016 | Current: Vice President, Guggenheim Investments (2009-present); Assistant Treasurer, certain other funds in the Fund complex (2016-present). |
Michael P. Megaris (1984) | Assistant Secretary | Since 2014 | Current: Assistant Secretary, certain other funds in the Fund Complex (2014-present); Director, Guggenheim Investments (2012-present). |
Elisabeth Miller (1968) | Chief Compliance Officer | Since 2012 | Current: Chief Compliance Officer, certain other funds in the Fund Complex (2012-present); Senior Managing Director, Guggenheim Investments (2012-present); Vice President, Guggenheim Funds Distributors, LLC (2014-present). Former: Chief Compliance Officer, Security Investors, LLC and Guggenheim Funds Investment Advisors, LLC (2012-2018); Chief Compliance Officer, Guggenheim Distributors, LLC (2009-2014); Senior Manager, Security Investors, LLC (2004-2014); Senior Manager, Guggenheim Distributors, LLC (2004-2014). |
| | THE GUGGENHEIM FUNDS ANNUAL REPORT | 67 |
INFORMATION ON BOARD OF TRUSTEES AND OFFICERS (Unaudited)(continued) |
Name, Address*
and Year of Birth | Position(s)
Held with
the Trust | Term of Office
and Length of
Time Served** | Principal Occupations
During Past 5 Years |
OFFICERS - continued | |
Margaux Misantone (1978) | AML Officer | Since 2017 | Current: Chief Compliance Officer, Security Investors, LLC and Guggenheim Funds Investment Advisors, LLC (2018-present); AML Officer, Security Investors, LLC and certain other funds in the Fund Complex (2017-present); Managing Director, Guggenheim Investments (2015-present). Former: Assistant Chief Compliance Officer, Security Investors, LLC and Guggenheim Funds Investments Advisors, LLC (2015-2018). |
Adam J. Nelson (1979) | Assistant Treasurer | Since 2015 | Current: Vice President, Guggenheim Investments (2015-present); Assistant Treasurer, certain other funds in the Fund Complex (2015-present). Former: Assistant Vice President and Fund Administration Director, State Street Corporation (2013-2015); Fund Administration Assistant Director, State Street (2011-2013); Fund Administration Manager, State Street (2009-2011). |
Kimberly J. Scott (1974) | Assistant Treasurer | Since 2014 | Current: Director, Guggenheim Investments (2012-present); Assistant Treasurer, certain other funds in the Fund Complex (2012-present). Former: Financial Reporting Manager, Invesco, Ltd. (2010-2011); Vice President/Assistant Treasurer, Mutual Fund Administration for Van Kampen Investments, Inc./Morgan Stanley Investment Management (2009-2010); Manager of Mutual Fund Administration, Van Kampen Investments, Inc./Morgan Stanley Investment Management (2005-2009). |
Bryan Stone (1979) | Vice President | Since 2014 | Current: Vice President, certain other funds in the Fund Complex (2014-present); Managing Director, Guggenheim Investments (2013-present). Former: Senior Vice President, Neuberger Berman Group LLC (2009-2013); Vice President, Morgan Stanley (2002-2009). |
68 | THE GUGGENHEIM FUNDS ANNUAL REPORT | |
INFORMATION ON BOARD OF TRUSTEES AND OFFICERS (Unaudited)(concluded) |
Name, Address*
and Year of Birth | Position(s)
Held with
the Trust | Term of Office
and Length of
Time Served** | Principal Occupations
During Past 5 Years |
OFFICERS - concluded | |
John L. Sullivan (1955) | Chief Financial Officer, Chief Accounting Officer and Treasurer | Since 2014 | Current: Chief Financial Officer, Chief Accounting Officer and Treasurer, certain other funds in the Fund Complex (2010-present); Senior Managing Director, Guggenheim Investments (2010-present). Former: Managing Director and Chief Compliance Officer, each of the funds in the Van Kampen Investments fund complex (2004-2010); Managing Director and Head of Fund Accounting and Administration, Morgan Stanley Investment Management (2002-2004); Chief Financial Officer and Treasurer, Van Kampen Funds (1996-2004). |
Jon Szafran (1989) | Assistant Treasurer | Since 2017 | Current: Vice President, Guggenheim Investments (2017-present); Assistant Treasurer, certain other funds in the Fund Complex (2017-present). Former: Assistant Treasurer of Henderson Global Funds and Manager of US Fund Administration, Henderson Global Investors (North America) Inc. (“HGINA”), (2017); Senior Analyst of US Fund Administration, HGINA (2014-2017); Senior Associate of Fund Administration, Cortland Capital Market Services, LLC (2013-2014); Experienced Associate, PricewaterhouseCoopers LLP (2012-2013). |
* | The business address of each officer is c/o Guggenheim Investments, 227 West Monroe Street, Chicago, Illinois 60606. |
** | Each officer serves an indefinite term, until his or her successor is duly elected and qualified. |
| | THE GUGGENHEIM FUNDS ANNUAL REPORT | 69 |
GUGGENHEIM INVESTMENTS PRIVACY NOTICE (Unaudited) |
Who We Are
This Privacy Notice describes the data protection practices of Guggenheim Investments. Guggenheim Investments as used herein refers to the affiliated investment management businesses of Guggenheim Partners, LLC: Guggenheim Funds Investment Advisors, LLC, Guggenheim Partners Investment Management, LLC, Guggenheim Funds Distributors, LLC, Security Investors, LLC, Guggenheim Investment Advisors (Europe) Limited, Guggenheim Real Estate, LLC, GS Gamma Advisors, LLC, Guggenheim Partners India Management, LLC, Guggenheim Partners Europe Limited, as well as the funds in the Guggenheim Funds complex (the “Funds”) (“Guggenheim Investments,” “we,” “us,” or “our”).
Guggenheim Partners Investment Management Holdings, LLC, located at 330 Madison Avenue, New York, New York 10017 is the data controller for your information. The affiliates who are also controllers of certain of your information are: Guggenheim Investment Advisors (Europe) Limited, Guggenheim Partners Europe Limited, Guggenheim Partners, LLC, Guggenheim Funds Investment Advisors, LLC, Guggenheim Partners Investment Management, LLC, Guggenheim Funds Distributors, LLC and Security Investors, LLC, as well as the Funds.
Our Commitment to You
Guggenheim Investments considers your privacy our utmost concern. When you become our client or investor, you entrust us with not only your hard-earned money but also with your personal and financial information. Because we have access to your private information, we hold ourselves to the highest standards in its safekeeping and use. We strictly limit how we share your information with others, whether you are a current or former Guggenheim Investments client or investor.
The Information We Collect About You
We collect certain nonpublic personal information about you from information you provide on applications, other forms, our website, and/or from third parties including investment advisors. This information includes Social Security or other tax identification number, assets, income, tax information, retirement and estate plan information, transaction history, account balance, payment history, bank account information, marital status, family relationships, information that we collect on our website through the use of “cookies,” and other personal information that you or others provide to us. We may also collect such information through your inquiries by mail, e-mail or telephone. We may also collect customer due diligence information, as required by applicable law and regulation, through third party service providers.
How We Handle Your Personal Information
The legal basis for using your information as set out in this Privacy Notice is as follows: (a) use of your personal data is necessary to perform our obligations under any contract with you (such as a contract for us to provide financial services to you); or (b) where use of your personal data is not necessary for performance of a contract, use of your personal data is necessary for our
70 | THE GUGGENHEIM FUNDS ANNUAL REPORT | |
GUGGENHEIM INVESTMENTS PRIVACY NOTICE (Unaudited)(continued) |
legitimate interests or the legitimate interests of others (for example, to enforce the legal terms governing our services, operate and market our website and other services we offer, ensure safe environments for our personnel and others, make and receive payments, prevent fraud and to know the customer to whom we are providing the services). Some processing is done to comply with applicable law.
In addition to the specific uses described above, we also use your information in the following manner:
| | ● | We use your information in connection with servicing your accounts. |
| | ● | We use information to respond to your requests or questions. For example, we might use your information to respond to your customer feedback. |
| | ● | We use information to improve our products and services. We may use your information to make our website and products better. We may use your information to customize your experience with us. |
| | ● | We use information for security purposes. We may use your information to protect our company and our customers. |
| | ● | We use information to communicate with you. For example, we will communicate with you about your account or our relationship. We may contact you about your feedback. We might also contact you about this Privacy Notice. We may also enroll you in our email newsletter. |
| | ● | We use information as otherwise permitted by law, as we may notify you. |
| | ● | Aggregate/Anonymous Data. We may aggregate and/or anonymize any information collected through the website so that such information can no longer be linked to you or your device (“Aggregate/Anonymous Information”). We may use Aggregate/Anonymous Information for any purpose, including without limitation for research and marketing purposes, and may also share such data with any third parties, including advertisers, promotional partners, and sponsors. |
We do not sell information about current or former clients or their accounts to third parties. Nor do we share this information, except when necessary to complete transactions at your request, to make you aware of investment products and services that we or our affiliates offer, or as permitted or required by law.
We provide information about you to companies and individuals not affiliated with Guggenheim Investments to complete certain transactions or account changes, or to perform services for us related to your account. For example, if you ask to transfer assets from another financial institution to Guggenheim Investments, we must provide certain information about you to that company to complete the transaction. We provide the third party with only the information necessary to carry out its responsibilities and only for that purpose. And we require these third
| | THE GUGGENHEIM FUNDS ANNUAL REPORT | 71 |
GUGGENHEIM INVESTMENTS PRIVACY NOTICE (Unaudited)(continued) |
parties to treat your private information with the same high degree of confidentiality that we do. To alert you to other Guggenheim Investments products and services, we share your information within our family of affiliated companies. You may limit our sharing with affiliated companies as set out below. We may also share information with any successor to all or part of our business, or in connection with steps leading up to a merger or acquisition. For example, if part of our business was sold we may give customer information as part of that transaction. We may also share information about you with your consent.
We will release information about you if you direct us to do so, if we are compelled by law to do so, or in other circumstances as permitted by law (for example, to protect your account from fraud).
If you close your account(s) or become an inactive client or investor, we will continue to adhere to the privacy policies and practices described in this notice.
Opt-Out Provisions and Your Data Choices
The law allows you to “opt out” of certain kinds of information sharing with third parties. We do not share personal information about you with any third parties that triggers this opt-out right. This means YOU ARE ALREADY OPTED OUT.
When you are no longer our client or investor, we continue to share your information as described in this notice, and you may contact us at any time to limit our sharing by sending an email to CorporateDataPrivacy@GuggenheimPartners.com.
European Union Data Subjects and certain others: In addition to the choices set forth above, residents of the European Union and certain other jurisdictions have certain rights to (1) request access to or rectification or deletion of information we collect about them, (2) request a restriction on the processing of their information, (3) object to the processing of their information, or (4) request the portability of certain information. To exercise these or other rights, please contact us using the contact information below. We will consider all requests and provide our response within the time period stated by applicable law. Please note, however, that certain information may be exempt from such requests in some circumstances, which may include if we need to keep processing your information for our legitimate interests or to comply with a legal obligation. We may request you provide us with information necessary to confirm your identity before responding to your request.
Residents of France and certain other jurisdictions may also provide us with instructions regarding the manner in which we may continue to store, erase and share your information after your death, and where applicable, the person you have designated to exercise these rights after your death.
How We Protect Privacy Online
We take steps to protect your privacy when you use our web site – www.guggenheiminvestments.com – by using secure forms of online communication, including encryption technology, Secure Socket Layer (SSL) protocol, firewalls and user names and
72 | THE GUGGENHEIM FUNDS ANNUAL REPORT | |
GUGGENHEIM INVESTMENTS PRIVACY NOTICE (Unaudited)(concluded) |
passwords. These safeguards vary based on the sensitivity of the information that we collect and store. However, we cannot and do not guarantee that these measures will prevent every unauthorized attempt to access, use, or disclose your information since despite our efforts, no Internet and/or other electronic transmissions can be completely secure. Our web site uses “http cookies”—tiny pieces of information that we ask your browser to store. We use cookies for session management and security features on the Guggenheim Investments web site. We do not use them to pull data from your hard drive, to learn your e-mail address, or to view data in cookies created by other web sites. We will not share the information in our cookies or give others access to it. See the legal information area on our web site for more details about web site security and privacy features.
How We Safeguard Your Personal Information and Data Retention
We restrict access to nonpublic personal information about you to our employees and in some cases to third parties (for example, the service providers described above) as permitted by law. We maintain strict physical, electronic and procedural safeguards that comply with federal standards to guard your nonpublic personal information.
We keep your information for no longer than necessary for the purposes for which it is processed. The length of time for which we retain information depends on the purposes for which we collected and use it and/or as required to comply with applicable laws. Information may persist in copies made for backup and business continuity purposes for additional time.
International Visitors
If you are not a resident of the United States, please be aware that your information may be transferred to, stored and processed in the United States where our servers are located and our databases are operated. The data protection and other laws of the United States and other countries might not be as comprehensive as those in your country.
In such cases, we ensure that a legal basis for such a transfer exists and that adequate protection is provided as required by applicable law, for example, by using standard contractual clauses or by transferring your data to a jurisdiction that has obtained an adequacy finding. Individuals whose data may be transferred on the basis of standard contractual clauses may contact us as described below.
We’ll Keep You Informed
If you have any questions or concerns about how we treat your personal data, we encourage you to consult with us first. You may also contact the relevant supervisory authority.
We reserve the right to modify this policy at any time and will inform you promptly of material changes. You may access our privacy policy from our web site at www.guggenheiminvestments.com. Should you have any questions regarding our privacy policy, contact us by email at CorporateDataPrivacy@GuggenheimPartners.com.
| | THE GUGGENHEIM FUNDS ANNUAL REPORT | 73 |
9.30.2019
Guggenheim Funds Annual Report
| |
Guggenheim Capital Stewardship Fund | | |
Beginning on January 1, 2021, paper copies of the Fund’s annual and semi-annual shareholder reports may no longer be sent by mail, unless you specifically request paper copies of the reports from a Fund or from your financial intermediary. Instead, the reports will be made available on a website, and you will be notified by mail each time a report is posted and provided with a website link to access the report.
If you already elected to receive shareholder reports electronically, you will not be affected by this change and you need not take any action. At any time, you may elect to receive reports and other communications from a Fund electronically by calling 800.820.0888, going to GuggenheimInvestments.com/myaccount, or by contacting your financial intermediary.
You may elect to receive all future shareholder reports in paper free of charge. If you hold shares of a Fund directly, you can inform the Fund that you wish to receive paper copies of reports by calling 800.820.0888. If you hold shares of a Fund through a financial intermediary, please contact the financial intermediary to make this election. Your election to receive reports in paper will apply to all Guggenheim Funds in which you are invested and may apply to all funds held with your financial intermediary.
GuggenheimInvestments.com | CSF-ANN-0919x0920 |

| | |
DEAR SHAREHOLDER | 2 |
ECONOMIC AND MARKET OVERVIEW | 3 |
ABOUT SHAREHOLDERS’ FUND EXPENSES | 5 |
CAPITAL STEWARDSHIP FUND | 7 |
NOTES TO FINANCIAL STATEMENTS | 15 |
REPORT OF INDEPENDENT REGISTERED PUBLIC ACCOUNTING FIRM | 20 |
OTHER INFORMATION | 21 |
INFORMATION ON BOARD OF TRUSTEES AND OFFICERS | 30 |
GUGGENHEIM INVESTMENTS PRIVACY NOTICE | 35 |
| | THE GUGGENHEIM FUNDS ANNUAL REPORT | 1 |
Dear Shareholder:
Guggenheim Partners Investment Management, LLC (“GPIM” or the “Investment Adviser”) is pleased to present the annual shareholder report for the Guggenheim Capital Stewardship Fund (the “Fund”). The report covers the annual fiscal period ended September 30, 2019.
Concinnity Advisors, LP, serves as the Fund’s sub-adviser (the “Sub-Adviser”).
The Investment Adviser is part of Guggenheim Investments, which represents the investment management businesses of Guggenheim Partners, LLC, (“Guggenheim”) a global, diversified financial services firm.
Guggenheim Funds Distributors, LLC is the distributor of the Fund . Guggenheim Funds Distributors, LLC is affiliated with Guggenheim and the Investment Adviser.
We encourage you to read the Economic and Market Overview section of the report, which follows this letter, and then the Manager’s Commentary for the Fund.
We are committed to providing innovative investment solutions and appreciate the trust you place in us.
Sincerely,
Guggenheim Partners Investment Management, LLC
October 31, 2019
Read a prospectus and summary prospectus (if available) carefully before investing. It contains the investment objectives, risks, charges, expenses and other information, which should be considered carefully before investing. Obtain a prospectus and summary prospectus (if available) at guggenheiminvestments.com or call 800.820.0888.
This material is not intended as a recommendation or as investment advice of any kind, including in connection with rollovers, transfers, and distributions. Such material is not provided in a fiduciary capacity, may not be relied upon for or in connection with the making of investment decisions, and does not constitute a solicitation of an offer to buy or sell securities. All content has been provided for informational or educational purposes only and is not intended to be and should not be construed as legal or tax advice and/or a legal opinion. Always consult a financial, tax and/ or legal professional regarding your specific situation.
There can be no assurance that any investment product will achieve its investment objective(s). There are risks associated with investing, including the entire loss of principal invested. Investing involves market risks. The investment return and principal value of any investment product will fluctuate with changes in market conditions. Please read the prospectus for more detailed information regarding these and other risks.
2 | THE GUGGENHEIM FUNDS ANNUAL REPORT | |
ECONOMIC AND MARKET OVERVIEW (Unaudited) | September 30, 2019 |
Economic data has been mixed over the past few months. On the positive side, we saw a pickup in the housing market as measured by housing starts and home sales, which could be a delayed response to lower mortgage rates. Industrial production had the strongest month-over-month gain in a year, partially boosted by an increase in oil production in Hurricane Barry’s wake. The unemployment rate fell to a 50-year low of 3.5% in September 2019, despite a continued moderation in payroll gains.
On the negative side, the Institute for Supply Management (“ISM”) Manufacturing Index plunged to the weakest reading since June 2009. The ISM Non-Manufacturing Index also came in well below expectations, the lowest since August 2016. Within both the manufacturing and non-manufacturing ISM indexes, analysts look at the employment component of the survey for an early read on other labor market indicators. Here we find more cause for concern: The non-manufacturing survey’s employment component is now barely above 50 while the manufacturing employment sub-index stands at 46.3, well into contraction territory. Combined, the outlook for output and hiring has dimmed, signaling trouble ahead for consumers.
Retail sales have been steady, but Commerce Department data showed that total consumer spending on goods and services increased only 0.1% month-over-month in August 2019, the smallest gain in six months. It is hard to identify the primary reason why consumers may already be turning more conservative on spending. Income growth looks steady, the equity market is higher year-to-date, and rates are lower, all of which should be boosting consumer confidence. Sentiment surveys, however, show that fewer consumers believe now is a good time to buy homes, vehicles, and household durables, and headline consumer confidence measures have ticked down. We believe trade policy and political concerns are weighing on sentiment, and these headwinds are set to ramp up further. Additional U.S. tariffs on China are due to take effect on December 15, 2019 and the U.S. House of Representatives is pressing forward with its impeachment inquiry into President Trump.
Guggenheim’s dashboard of U.S. recession indicators continues to point to a recession beginning as early as the first half of 2020, and we think the economic data is corroborating this view. Two of the more notable indicators pointing to high recession risk are the three-month/10-year U.S. Treasury yield curve, which has been inverted for 16 consecutive weeks through period end, and the Leading Economic Indicators Index which has slowed from a year-over-year growth rate of 6.6% in September 2018 to 1.1% as of August 2019. The indicators Guggenheim tracks as part of our recession probability model indicate a nearly 50% chance that a recession will come before mid-2020, and a 70% chance that it will arrive by mid-2021.
Over the period, the U.S. Treasury curve continued its overall flattening trend, as the difference between the two-year U.S. Treasury and 10-year U.S. Treasury narrowed to 5 basis points. Equity markets remained volatile, buoyed by a 25 basis point cut in July and September 2019 by the U.S. Federal Reserve (the “Fed”) and relatively strong U.S. economic data, but weighed down by trade war uncertainty and fears of a global slowdown.
With downside risks growing, markets have become more sensitive to the Fed’s communications about the future stance of monetary policy. Despite the two rate cuts, Fed policymakers are deeply divided. It is still unclear whether the Fed will deliver the aggressive and preemptive policy action that would prolong the current expansion.
As it relates to risk-taking, we are not confident that the Fed would succeed in easing credit conditions if conditions were to tighten materially. The Fed may act too late, or its actions may have little impact given that low rates this year have largely failed to stimulate growth. With credit spreads still relatively tight on a historical basis, we believe it is prudent to remain up in quality as we await better opportunities to deploy capital in riskier credit sectors in the coming downturn
For the 12-month period ended September 30, 2019, the Standard & Poor’s 500® (“S&P 500”) Index* returned 4.25%. The MSCI Europe-Australasia-Far East (“EAFE”) Index* returned -0.82%. The return of the MSCI Emerging Markets Index* was -1.63%.
In the bond market, the Bloomberg Barclays U.S. Aggregate Bond Index* posted a 10.30% return for the period, while the Bloomberg Barclays U.S. Corporate High Yield Index* returned 6.36%. The return of the ICE Bank of America (“BofA”) Merrill Lynch 3-Month U.S. Treasury Bill Index* was 2.39% for the 12-month period.
The opinions and forecasts expressed may not actually come to pass. This information is subject to change at any time, based on market and other conditions, and should not be construed as a recommendation of any specific security or strategy.
| | THE GUGGENHEIM FUNDS ANNUAL REPORT | 3 |
ECONOMIC AND MARKET OVERVIEW (Unaudited)(concluded) | September 30, 2019 |
*Index Definitions
Indices are unmanaged and not available for direct investment. Index performance does not reflect transaction costs, fees, or expenses.
Bloomberg Barclays U.S. Aggregate Bond Index is a broad-based flagship benchmark that measures the investment grade, U.S. dollar-denominated, fixed-rate taxable bond market, including U.S. Treasuries, government-related and corporate securities, mortgage-backed securities or “MBS” (agency fixed-rate and hybrid adjustable-rate mortgage, or “ARM”, pass-throughs), asset-backed securities (“ABS”), and commercial mortgage-backed securities (“CMBS”) (agency and non-agency).
Bloomberg Barclays U.S. Corporate High Yield Index measures the U.S. dollar-denominated, high yield, fixed-rate corporate bond market. Securities are classified as high yield if the middle rating of Moody’s, Fitch, and S&P is Ba1/BB +/BB + or below.
ICE BofA Merrill Lynch 3-Month U.S. Treasury Bill Index is an unmanaged market Index of U.S. Treasury securities maturing in 90 days that assumes reinvestment of all income.
MSCI EAFE Index is a capitalization-weighted measure of stock markets in Europe, Australasia, and the Far East.
MSCI Emerging Markets Index is a free float-adjusted market capitalization-weighted index that is designed to measure equity market performance in the global emerging markets.
S&P 500® is a broad-based index, the performance of which is based on the performance of 500 widely held common stocks chosen for market size, liquidity, and industry group representation.
4 | THE GUGGENHEIM FUNDS ANNUAL REPORT | |
ABOUT SHAREHOLDERS’ FUND EXPENSES (Unaudited) | |
All mutual funds have operating expenses, and it is important for our shareholders to understand the impact of costs on their investments. Shareholders of a fund incur two types of costs: (i) transaction costs, including sales charges (loads) on purchase payments, reinvested dividends, other distributions, and exchange fees, and (ii) ongoing costs, including management fees, administrative services, and shareholder reports, among others. These ongoing costs, or operating expenses, are deducted from a fund’s gross income and reduce the investment return of the fund.
A fund’s expenses are expressed as a percentage of its average net assets, which is known as the expense ratio. The following examples are intended to help investors understand the ongoing costs (in dollars) of investing in a fund and to compare these costs with the ongoing costs of investing in other mutual funds.
The examples are based on an investment of $1,000 made at the beginning of the period and held for the entire six-month period beginning March 31, 2019 and ending September 30, 2019.
The following tables illustrate the Fund’s costs in two ways:
Table 1. Based on actual Fund return: This section helps investors estimate the actual expenses paid over the period. The “Ending Account Value” shown is derived from the Fund’s actual return, and the fifth column shows the dollar amount that would have been paid by an investor who started with $1,000 in the Fund. Investors may use the information here, together with the amount invested, to estimate the expenses paid over the period. Simply divide the Fund’s account value by $1,000 (for example, an $8,600 account value divided by $1,000 = 8.6), then multiply the result by the number provided under the heading “Expenses Paid During Period.”
Table 2. Based on hypothetical 5% return: This section is intended to help investors compare a Fund’s cost with those of other mutual funds. The table provides information about hypothetical account values and hypothetical expenses based on the Fund’s actual expense ratio and an assumed rate of return of 5% per year before expenses, which is not the Fund’s actual return. The hypothetical account values and expenses may not be used to estimate the actual ending account balance or expenses paid during the period. The example is useful in making comparisons because the U.S. Securities and Exchange Commission (the “SEC”) requires all mutual funds to calculate expenses based on the 5% return. Investors can assess a Fund’s costs by comparing this hypothetical example with the hypothetical examples that appear in shareholder reports of other funds.
The calculations illustrated above assume no shares were bought or sold during the period. Actual costs may have been higher or lower, depending on the amount of investment and the timing of any purchases or redemptions.
Please note that the expenses shown in the table are meant to highlight your ongoing costs only and do not reflect any transactional costs, such as sales charges (loads) on purchase payments, and contingent deferred sales charges (“CDSC”) on redemptions, if any. Therefore, the second table is useful in comparing ongoing costs only, and will not help you determine the relative total costs of owning different funds. In addition, if these transactional costs were included, your costs would have been higher.
More information about the Fund’s expenses, including annual expense ratios for periods up to five years (subject to the Fund’s inception date), can be found in the Financial Highlights section of this report. For additional information on operating expenses and other shareholder costs, please refer to the Fund’s prospectus.
| | THE GUGGENHEIM FUNDS ANNUAL REPORT | 5 |
ABOUT SHAREHOLDERS’ FUND EXPENSES (Unaudited)(concluded) | |
| Expense
Ratio1 | Fund
Return | Beginning
Account Value
March 31, 2019 | Ending
Account Value
September 30,
2019 | Expenses
Paid During
Period2 |
| Table 1. Based on actual Fund return3 | | | | | |
| Capital Stewardship Fund | 1.05% | 6.85% | $ 1,000.00 | $ 1,068.50 | $ 5.44 |
|
| Table 2. Based on hypothetical 5% return (before expenses) | | | | |
| Capital Stewardship Fund | 1.05% | 5.00% | $ 1,000.00 | $ 1,019.80 | $ 5.32 |
1 | Annualized and excludes expenses of the underlying funds in which the Fund invests, if any. |
2 | Expenses are equal to the Fund’s annualized expense ratio, net of any applicable fee waivers, multiplied by the average account value over the period, multiplied by 183/365 (to reflect the one-half year period). |
3 | Actual cumulative return at net asset value for the period March 31, 2019 to September 30, 2019. |
6 | THE GUGGENHEIM FUNDS ANNUAL REPORT | |
MANAGERS’ COMMENTARY (Unaudited) | September 30, 2019 |
To Our Shareholders
Guggenheim Capital Stewardship Fund (the “Fund”) is managed by a team of seasoned professionals led by Farhan Sharaff, Assistant Chief Investment Officer, Equities, and Portfolio Manager; Jayson Flowers, Senior Managing Director and Head of Equity and Derivative Strategies, and Portfolio Manager; Qi Yan, Managing Director and Portfolio Manager; and Peter Derby, Portfolio Manager at Concinnity Partners, LP, an unaffiliated Sub-adviser (the “Sub-adviser”) to the Fund. The following paragraphs discuss the Fund for the fiscal year ended September 30, 2019.
For the one year period ended September 30, 2019, Guggenheim Capital Stewardship Fund Institutional Shares returned 3.56%, compared with the 4.25% return of its benchmark, the S&P 500 Index.
Strategy Overview
The Fund’s investment objective is to seek long-term capital appreciation. It pursues its investment objective by investing in equity securities that the Fund believes will provide attractive long-term returns relative to the S&P 500 Index. Guggenheim Partners Investment Management, LLC, the Fund’s adviser (the “Investment Adviser or Manager”), and Concinnity Advisors, LP, the Fund’s sub-adviser (the “Sub-Adviser”), believe that companies that successfully implement multi-stakeholder management systems are generally better positioned to create sustained long-term value for their shareholders than competing companies that do not implement such systems. The Investment Adviser and Sub-Adviser believe that companies implementing such systems do so by aligning the interests of all of a company’s core stakeholders, including investors, customers, employees, business partners, and communities in which a company does business.
To identify an initial universe of companies that it believes have exemplary multi-stakeholder management systems, the Sub-Adviser uses its proprietary research methodology system, which seeks to identify the components of those management systems, including, but not limited to: (1) customer loyalty; (2) employee engagement, as demonstrated by high levels of loyalty; (3) efficient use of “intangible” assets; and (4) high supplier loyalty, as demonstrated by the maturity of supply chain activities and (5) community engagement.
Performance Review
The Fund on a net basis underperformed its benchmark by 69 basis points for the fiscal year ended September 30, 2019.
Sector allocation detracted from return over all. Relative to the benchmark, overweighting the Communications Services sector positively impacted the Fund, adding 0.20%. Offsetting this were an overweight in Health Care (-0.29%) and Information Technology (-0.21%) and an underweight in Real Estate (-0.20%). The technology sector is the largest in both the Fund and the benchmark, but the Fund’s exposure varied more over the period; it was overweight the sector when the sector underperformed (relative to the index), and underweight when it outperformed (relative to the index), which resulted in the negative contribution from allocation.
Security selection contributed to return over all. Security selection impacts relative to the benchmark were mainly driven by securities from the following sectors: Energy (+0.95%), Consumer Staples (+0.37%), Communication Services (+0.33%), Health Care (-0.22%), and Industrials (-0.54%).
The top individual contributors to return were Procter & Gamble Co., Microsoft Corp., and AT&T, Inc. The top individual detractors were Occidental Petroleum Corp., FedEx Corp., and Pfizer, Inc.
Performance displayed represents past performance which is no guarantee of future results.
The opinions and forecast expressed may not actually come to pass. This information is subject to change at any time, based on market and other conditions, and should not be construed as a recommendation of any specific security or strategy.
| | THE GUGGENHEIM FUNDS ANNUAL REPORT | 7 |
PERFORMANCE REPORT AND FUND PROFILE (Unaudited) | September 30, 2019 |
CAPITAL STEWARDSHIP FUND
OBJECTIVE: Seeks long-term capital appreciation.
Holdings Diversification (Market Exposure as % of Net Assets)
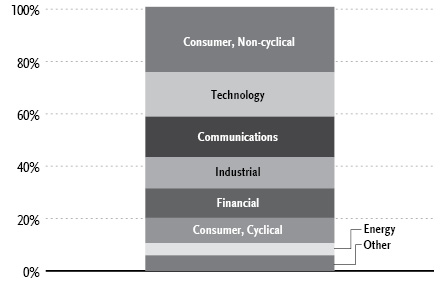
“Holdings Diversification (Market Exposure as % of Net Assets)” excludes any temporary cash investments.
Inception Date: September 26, 2014 |
Ten Largest Holdings (% of Total Net Assets) |
Microsoft Corp. | 4.2% |
Apple, Inc. | 3.1% |
Verizon Communications, Inc. | 2.7% |
Alphabet, Inc. — Class A | 2.6% |
AT&T, Inc. | 2.4% |
Johnson & Johnson | 2.3% |
Pfizer, Inc. | 2.0% |
Visa, Inc. — Class A | 2.0% |
Home Depot, Inc. | 2.0% |
Coca-Cola Co. | 1.7% |
Top Ten Total | 25.0% |
| | |
“Ten Largest Holdings” excludes any temporary cash investments. |
Cumulative Fund Performance*
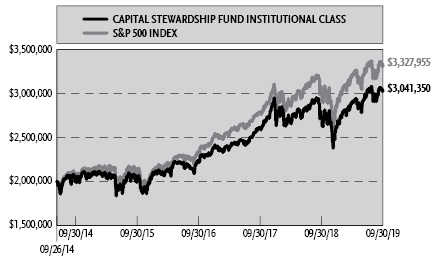
Average Annual Returns*
Periods Ended September 30, 2019
| 1 Year | 5 Year | Since
Inception
(09/26/14) |
Capital Stewardship Fund | 3.56% | 8.93% | 8.72% |
S&P 500 Index | 4.25% | 10.84% | 10.70% |
* | The performance data above represents past performance that is not predictive of future results. The investment return and principal value of an investment in the Fund will fluctuate so that an investor’s shares, when redeemed, may be worth more or less than their original cost. Returns are historical and include changes in principal and reinvested dividends and capital gains and do not reflect the effect of taxes. The S&P 500 Index is an unmanaged index and, unlike the Fund, has no management fees or operating expenses to reduce its reported return. |
| | |
8 | THE GUGGENHEIM FUNDS ANNUAL REPORT | |
SCHEDULE OF INVESTMENTS | September 30, 2019 |
CAPITAL STEWARDSHIP FUND | |
| | Shares | | | Value | |
COMMON STOCKS† - 100.2% |
| | | | | | | | | |
Consumer, Non-cyclical - 24.9% |
Johnson & Johnson | | | 36,563 | | | $ | 4,730,521 | |
Pfizer, Inc. | | | 119,829 | | | | 4,305,456 | |
Coca-Cola Co. | | | 63,670 | | | | 3,466,195 | |
PepsiCo, Inc. | | | 22,375 | | | | 3,067,612 | |
Procter & Gamble Co. | | | 23,424 | | | | 2,913,477 | |
Merck & Company, Inc. | | | 33,881 | | | | 2,852,103 | |
Kimberly-Clark Corp. | | | 19,871 | | | | 2,822,676 | |
Eli Lilly & Co. | | | 24,558 | | | | 2,746,321 | |
Medtronic plc | | | 22,512 | | | | 2,445,254 | |
Gilead Sciences, Inc. | | | 30,631 | | | | 1,941,393 | |
Anthem, Inc. | | | 5,569 | | | | 1,337,117 | |
Amgen, Inc. | | | 6,867 | | | | 1,328,833 | |
Humana, Inc. | | | 5,019 | | | | 1,283,208 | |
General Mills, Inc. | | | 23,270 | | | | 1,282,643 | |
CVS Health Corp. | | | 20,063 | | | | 1,265,374 | |
Zoetis, Inc. | | | 9,441 | | | | 1,176,254 | |
S&P Global, Inc. | | | 4,547 | | | | 1,113,924 | |
Colgate-Palmolive Co. | | | 14,617 | | | | 1,074,496 | |
Verisk Analytics, Inc. — Class A | | | 6,774 | | | | 1,071,240 | |
Becton Dickinson and Co. | | | 4,130 | | | | 1,044,725 | |
Moody’s Corp. | | | 5,051 | | | | 1,034,596 | |
Hershey Co. | | | 6,566 | | | | 1,017,664 | |
Automatic Data Processing, Inc. | | | 5,482 | | | | 884,905 | |
Kroger Co. | | | 30,603 | | | | 788,945 | |
Baxter International, Inc. | | | 8,524 | | | | 745,594 | |
Hologic, Inc.* | | | 13,864 | | | | 699,993 | |
Quest Diagnostics, Inc. | | | 6,080 | | | | 650,742 | |
Biogen, Inc.* | | | 2,611 | | | | 607,893 | |
AbbVie, Inc. | | | 6,388 | | | | 483,699 | |
Regeneron Pharmaceuticals, Inc.* | | | 1,674 | | | | 464,368 | |
Bio-Rad Laboratories, Inc. — Class A* | | | 1,246 | | | | 414,594 | |
Bristol-Myers Squibb Co. | | | 7,224 | | | | 366,329 | |
Church & Dwight Company, Inc. | | | 3,102 | | | | 233,394 | |
Abbott Laboratories | | | 2,552 | | | | 213,526 | |
McCormick & Company, Inc. | | | 1,197 | | | | 187,091 | |
Stryker Corp. | | | 788 | | | | 170,444 | |
Total Consumer, Non-cyclical | | | | | | | 52,232,599 | |
| | | | | | | | | |
Technology - 17.1% |
Microsoft Corp. | | | 64,088 | | | | 8,910,155 | |
Apple, Inc. | | | 29,467 | | | | 6,599,724 | |
Texas Instruments, Inc. | | | 22,184 | | | | 2,867,060 | |
Adobe, Inc.* | | | 9,146 | | | | 2,526,582 | |
Oracle Corp. | | | 43,186 | | | | 2,376,526 | |
salesforce.com, Inc.* | | | 15,651 | | | | 2,323,234 | |
Intel Corp. | | | 34,490 | | | | 1,777,270 | |
Accenture plc — Class A | | | 7,304 | | | | 1,404,924 | |
Intuit, Inc. | | | 4,349 | | | | 1,156,573 | |
International Business Machines Corp. | | | 6,725 | | | | 977,949 | |
Paychex, Inc. | | | 11,021 | | | | 912,208 | |
Cerner Corp. | | | 12,817 | | | | 873,735 | |
HP, Inc. | | | 38,367 | | | | 725,904 | |
QUALCOMM, Inc. | | | 6,889 | | | | 525,493 | |
Jack Henry & Associates, Inc. | | | 3,474 | | | | 507,100 | |
Lam Research Corp. | | | 2,136 | | | | 493,651 | |
NetApp, Inc. | | | 6,956 | | | | 365,260 | |
Micron Technology, Inc.* | | | 8,244 | | | | 353,255 | |
Workday, Inc. — Class A* | | | 1,433 | | | | 243,553 | |
Total Technology | | | | | | | 35,920,156 | |
| | | | | | | | | |
Communications - 15.4% |
Verizon Communications, Inc. | | | 94,677 | | | | 5,714,704 | |
Alphabet, Inc. — Class A* | | | 4,419 | | | | 5,396,218 | |
AT&T, Inc. | | | 131,975 | | | | 4,993,934 | |
Facebook, Inc. — Class A* | | | 18,798 | | | | 3,347,548 | |
Amazon.com, Inc.* | | | 1,772 | | | | 3,076,032 | |
Walt Disney Co. | | | 18,412 | | | | 2,399,452 | |
Cisco Systems, Inc. | | | 39,077 | | | | 1,930,795 | |
Comcast Corp. — Class A | | | 41,232 | | | | 1,858,739 | |
T-Mobile US, Inc.* | | | 12,737 | | | | 1,003,293 | |
Discovery, Inc. — Class A* | | | 34,165 | | | | 909,814 | |
AMC Networks, Inc. — Class A* | | | 14,997 | | | | 737,252 | |
Omnicom Group, Inc. | | | 7,662 | | | | 599,935 | |
eBay, Inc. | | | 12,240 | | | | 477,115 | |
Total Communications | | | | | | | 32,444,831 | |
| | | | | | | | | |
Industrial - 12.0% |
Honeywell International, Inc. | | | 14,588 | | | | 2,468,290 | |
Union Pacific Corp. | | | 15,062 | | | | 2,439,743 | |
Norfolk Southern Corp. | | | 11,752 | | | | 2,111,364 | |
Caterpillar, Inc. | | | 15,424 | | | | 1,948,206 | |
Lockheed Martin Corp. | | | 4,711 | | | | 1,837,573 | |
Cummins, Inc. | | | 10,974 | | | | 1,785,140 | |
United Parcel Service, Inc. — Class B | | | 13,159 | | | | 1,576,711 | |
3M Co. | | | 9,255 | | | | 1,521,522 | |
FedEx Corp. | | | 10,394 | | | | 1,513,055 | |
Northrop Grumman Corp. | | | 2,997 | | | | 1,123,246 | |
Ingersoll-Rand plc | | | 8,476 | | | | 1,044,328 | |
Waste Management, Inc. | | | 8,954 | | | | 1,029,710 | |
Republic Services, Inc. — Class A | | | 11,445 | | | | 990,565 | |
Illinois Tool Works, Inc. | | | 6,200 | | | | 970,238 | |
Allegion plc | | | 6,882 | | | | 713,319 | |
Agilent Technologies, Inc. | | | 7,293 | | | | 558,862 | |
Oshkosh Corp. | | | 5,884 | | | | 446,007 | |
Owens Corning | | | 6,142 | | | | 388,174 | |
Waters Corp.* | | | 1,621 | | | | 361,856 | |
Boeing Co. | | | 886 | | | | 337,096 | |
Total Industrial | | | | | | | 25,165,005 | |
| | | | | | | | | |
Financial - 11.3% |
Visa, Inc. — Class A | | | 24,960 | | | | 4,293,370 | |
Mastercard, Inc. — Class A | | | 10,614 | | | | 2,882,444 | |
American Tower Corp. — Class A REIT | | | 8,834 | | | | 1,953,462 | |
American Express Co. | | | 10,295 | | | | 1,217,693 | |
MetLife, Inc. | | | 24,271 | | | | 1,144,620 | |
Equinix, Inc. REIT | | | 1,979 | | | | 1,141,487 | |
Marsh & McLennan Companies, Inc. | | | 10,524 | | | | 1,052,926 | |
Prologis, Inc. REIT | | | 12,104 | | | | 1,031,503 | |
Aflac, Inc. | | | 19,359 | | | | 1,012,863 | |
Citigroup, Inc. | | | 13,507 | | | | 933,064 | |
JPMorgan Chase & Co. | | | 7,130 | | | | 839,130 | |
SEE NOTES TO FINANCIAL STATEMENTS. | THE GUGGENHEIM FUNDS ANNUAL REPORT | 9 |
SCHEDULE OF INVESTMENTS (continued) | September 30, 2019 |
CAPITAL STEWARDSHIP FUND | |
| | Shares | | | Value | |
Nasdaq, Inc. | | | 8,206 | | | $ | 815,266 | |
BlackRock, Inc. — Class A | | | 1,735 | | | | 773,185 | |
Northern Trust Corp. | | | 8,058 | | | | 751,973 | |
T. Rowe Price Group, Inc. | | | 5,183 | | | | 592,158 | |
Progressive Corp. | | | 7,643 | | | | 590,422 | |
Bank of America Corp. | | | 19,053 | | | | 555,776 | |
Ventas, Inc. REIT | | | 7,292 | | | | 532,535 | |
Franklin Resources, Inc. | | | 16,728 | | | | 482,770 | |
State Street Corp. | | | 6,065 | | | | 358,987 | |
Prudential Financial, Inc. | | | 3,947 | | | | 355,033 | |
U.S. Bancorp | | | 5,995 | | | | 331,763 | |
Allstate Corp. | | | 1,939 | | | | 210,730 | |
Total Financial | | | | | | | 23,853,160 | |
| | | | | | | | | |
Consumer, Cyclical - 9.6% |
Home Depot, Inc. | | | 18,407 | | | | 4,270,792 | |
Starbucks Corp. | | | 23,579 | | | | 2,084,855 | |
Walgreens Boots Alliance, Inc. | | | 28,003 | | | | 1,548,846 | |
Southwest Airlines Co. | | | 22,563 | | | | 1,218,628 | |
Delta Air Lines, Inc. | | | 20,988 | | | | 1,208,909 | |
BorgWarner, Inc. | | | 32,291 | | | | 1,184,434 | |
General Motors Co. | | | 30,265 | | | | 1,134,332 | |
Lear Corp. | | | 8,285 | | | | 976,802 | |
Alaska Air Group, Inc. | | | 14,003 | | | | 908,935 | |
Whirlpool Corp. | | | 5,411 | | | | 856,886 | |
JetBlue Airways Corp.* | | | 47,891 | | | | 802,174 | |
Costco Wholesale Corp. | | | 2,339 | | | | 673,889 | |
Tapestry, Inc. | | | 24,687 | | | | 643,096 | |
NIKE, Inc. — Class B | | | 6,268 | | | | 588,691 | |
Best Buy Company, Inc. | | | 7,535 | | | | 519,840 | |
Royal Caribbean Cruises Ltd. | | | 3,834 | | | | 415,337 | |
Darden Restaurants, Inc. | | | 3,368 | | | | 398,165 | |
WW Grainger, Inc. | | | 1,254 | | | | 372,626 | |
Hilton Worldwide Holdings, Inc. | | | 2,967 | | | | 276,257 | |
Total Consumer, Cyclical | | | | | | | 20,083,494 | |
| | | | | | | | | |
Energy - 4.7% |
Chevron Corp. | | | 21,937 | | | | 2,601,728 | |
Valero Energy Corp. | | | 22,885 | | | | 1,950,718 | |
Phillips 66 | | | 17,763 | | | | 1,818,931 | |
ONEOK, Inc. | | | 19,368 | | | | 1,427,228 | |
ConocoPhillips | | | 22,682 | | | | 1,292,420 | |
Devon Energy Corp. | | | 28,846 | | | | 694,035 | |
Total Energy | | | | | | | 9,785,060 | |
| | | | | | | | | |
Utilities - 4.2% |
NextEra Energy, Inc. | | | 9,132 | | | | 2,127,665 | |
Duke Energy Corp. | | | 12,566 | | | | 1,204,577 | |
Sempra Energy | | | 7,741 | | | | 1,142,649 | |
WEC Energy Group, Inc. | | | 11,880 | | | | 1,129,788 | |
American Water Works Company, Inc. | | | 8,459 | | | | 1,050,861 | |
American Electric Power Company, Inc. | | | 11,196 | | | | 1,048,953 | |
Entergy Corp. | | | 3,849 | | | | 451,719 | |
Pinnacle West Capital Corp. | | | 4,517 | | | | 438,465 | |
Exelon Corp. | | | 5,101 | | | | 246,429 | |
Total Utilities | | | | | | | 8,841,106 | |
| | | | | | | | | |
Basic Materials - 1.0% |
Air Products & Chemicals, Inc. | | | 4,706 | | | | 1,044,073 | |
Ecolab, Inc. | | | 5,106 | | | | 1,011,192 | |
Total Basic Materials | | | | | | | 2,055,265 | |
| | | | | | | | | |
Total Common Stocks | | | | | | | | |
(Cost $194,782,011) | | | | | | | 210,380,676 | |
| | | | | | | | | |
EXCHANGE-TRADED FUNDS† - 0.7% |
SPDR S&P 500 ETF Trust | | | 5,250 | | | | 1,558,042 | |
Total Exchange-Traded Funds | | | | | | | | |
(Cost $1,473,335) | | | | | | | 1,558,042 | |
| | | | | | | | | |
MONEY MARKET FUND† - 0.5% |
Dreyfus Treasury Securities Cash Management Fund — Institutional Shares 1.83%1 | | | 1,116,214 | | | | 1,116,214 | |
Total Money Market Fund | | | | | | | | |
(Cost $1,116,214) | | | | | | | 1,116,214 | |
| | | | | | | | | |
Total Investments - 101.4% | | | | | | | | |
(Cost $197,371,560) | | | | | | $ | 213,054,932 | |
Other Assets & Liabilities, net - (1.4)% | | | | | | | (3,002,075 | ) |
Total Net Assets - 100.0% | | | | | | $ | 210,052,857 | |
* | Non-income producing security. |
† | Value determined based on Level 1 inputs — See Note 4. |
1 | Rate indicated is the 7-day yield as of September 30, 2019. |
| | plc — Public Limited Company |
| | REIT — Real Estate Investment Trust |
| | |
| | See Sector Classification in Other Information section. |
10 | THE GUGGENHEIM FUNDS ANNUAL REPORT | SEE NOTES TO FINANCIAL STATEMENTS. |
SCHEDULE OF INVESTMENTS (concluded) | September 30, 2019 |
CAPITAL STEWARDSHIP FUND | |
The following table summarizes the inputs used to value the Fund’s investments at September 30, 2019 (See Note 4 in the Notes to Financial Statements):
Investments in Securities (Assets) | | Level 1
Quoted
Prices | | | Level 2
Significant
Observable
Inputs | | | Level 3
Significant
Unobservable
Inputs | | | Total | |
Common Stocks | | $ | 210,380,676 | | | $ | — | | | $ | — | | | $ | 210,380,676 | |
Exchange-Traded Funds | | | 1,558,042 | | | | — | | | | — | | | | 1,558,042 | |
Money Market Fund | | | 1,116,214 | | | | — | | | | — | | | | 1,116,214 | |
Total Assets | | $ | 213,054,932 | | | $ | — | | | $ | — | | | $ | 213,054,932 | |
SEE NOTES TO FINANCIAL STATEMENTS. | THE GUGGENHEIM FUNDS ANNUAL REPORT | 11 |
STATEMENT OF ASSETS AND LIABILITIES |
September 30, 2019 |
Assets: |
Investments, at value (cost $197,371,560) | | $ | 213,054,932 | |
Prepaid expenses | | | 9,605 | |
Receivables: |
Dividends | | | 182,198 | |
Interest | | | 1,472 | |
Total assets | | | 213,248,207 | |
| | | | | |
Liabilities: |
Overdraft due to custodian bank | | | 10,643 | |
Payable for: |
Fund shares redeemed | | | 2,978,961 | |
Management fees | | | 147,290 | |
Fund accounting/administration fees | | | 13,093 | |
Transfer agent/maintenance fees | | | 2,941 | |
Trustees’ fees* | | | 1,649 | |
Miscellaneous | | | 40,773 | |
Total liabilities | | | 3,195,350 | |
Net assets | | $ | 210,052,857 | |
| | | | | |
Net assets consist of: |
Paid in capital | | $ | 191,202,952 | |
Total distributable earnings (loss) | | | 18,849,905 | |
Net assets | | $ | 210,052,857 | |
Capital shares outstanding | | | 7,440,257 | |
Net asset value per share | | $ | 28.23 | |
STATEMENT OF OPERATIONS |
Year Ended September 30, 2019 |
Investment Income: |
Dividends | | $ | 4,627,246 | |
Interest | | | 21,264 | |
Total investment income | | | 4,648,510 | |
| | | | | |
Expenses: |
Management fees | | | 1,835,239 | |
Transfer agent/maintenance fees | | | 25,122 | |
Fund accounting/administration fees | | | 163,134 | |
Trustees’ fees* | | | 22,116 | |
Custodian fees | | | 11,526 | |
Miscellaneous | | | 82,388 | |
Total expenses | | | 2,139,525 | |
Less: |
Earnings credits applied | | | (1,129 | ) |
Net expenses | | | 2,138,396 | |
Net investment income | | | 2,510,114 | |
| | | | | |
Net Realized and Unrealized Gain (Loss): |
Net realized gain (loss) on: |
Investments | | | 8,372,757 | |
Net realized gain | | | 8,372,757 | |
Net change in unrealized appreciation (depreciation) on: |
Investments | | | (4,485,796 | ) |
Net change in unrealized appreciation (depreciation) | | | (4,485,796 | ) |
Net realized and unrealized gain | | | 3,886,961 | |
Net increase in net assets resulting from operations | | $ | 6,397,075 | |
* | Relates to Trustees not deemed “interested persons” within the meaning of Section 2(a)(19) of the 1940 Act. |
12 | THE GUGGENHEIM FUNDS ANNUAL REPORT | SEE NOTES TO FINANCIAL STATEMENTS. |
STATEMENTS OF CHANGES IN NET ASSETS |
| | Year Ended
September 30,
2019 | | | Year Ended
September 30,
2018 | |
Increase (Decrease) in Net Assets from Operations: | | | | | | | | |
Net investment income | | $ | 2,510,114 | | | $ | 2,044,580 | |
Net realized gain on investments | | | 8,372,757 | | | | 27,902,511 | |
Net change in unrealized appreciation (depreciation) on investments | | | (4,485,796 | ) | | | 3,665,214 | |
Net increase in net assets resulting from operations | | | 6,397,075 | | | | 33,612,305 | |
| | | | | | | | | |
Distributions to shareholders | | | (23,268,533 | ) | | | (18,271,148 | ) |
| | | | | | | | | |
Capital share transactions: | | | | | | | | |
Proceeds from sale of shares | | | 45,892,534 | | | | 85,091,202 | |
Distributions reinvested | | | 23,250,378 | | | | 18,250,767 | |
Cost of shares redeemed | | | (62,805,517 | ) | | | (114,104,117 | ) |
Net increase (decrease) from capital share transactions | | | 6,337,395 | | | | (10,762,148 | ) |
Net increase (decrease) in net assets | | | (10,534,063 | ) | | | 4,579,009 | |
| | | | | | | | | |
Net assets: | | | | | | | | |
Beginning of year | | | 220,586,920 | | | | 216,007,911 | |
End of year | | $ | 210,052,857 | | | $ | 220,586,920 | |
| | | | | | | | | |
Capital share activity: | | | | | | | | |
Shares sold | | | 1,544,723 | | | | 2,857,242 | |
Shares issued from reinvestment of distributions | | | 1,003,473 | | | | 628,037 | |
Shares redeemed | | | (2,170,634 | ) | | | (3,842,743 | ) |
Net increase (decrease) in shares | | | 377,562 | | | | (357,464 | ) |
SEE NOTES TO FINANCIAL STATEMENTS. | THE GUGGENHEIM FUNDS ANNUAL REPORT | 13 |
This table is presented to show selected data for a share outstanding throughout each period and to assist shareholders in evaluating a Fund’s performance for the periods presented.
Institutional Class | | Year Ended
September 30,
2019 | | | Year Ended
September 30,
2018 | | | Year Ended
September 30,
2017 | | | Year Ended
September 30,
2016 | | | Year Ended
September 30,
2015 | |
Per Share Data | | | | | | | | | | | | | | | | | | | | |
Net asset value, beginning of period | | $ | 31.23 | | | $ | 29.11 | | | $ | 26.55 | | | $ | 23.69 | | | $ | 24.79 | |
Income (loss) from investment operations: | | | | | | | | | | | | | | | | | | | | |
Net investment income (loss)a | | | .33 | | | | .28 | | | | .34 | | | | .35 | | | | .31 | |
Net gain (loss) on investments (realized and unrealized) | | | .05 | | | | 4.34 | | | | 3.51 | | | | 3.22 | | | | (1.33 | ) |
Total from investment operations | | | .38 | | | | 4.62 | | | | 3.85 | | | | 3.57 | | | | (1.02 | ) |
Less distributions from: | | | | | | | | | | | | | | | | | | | | |
Net investment income | | | (.32 | ) | | | (.34 | ) | | | (.37 | ) | | | (.32 | ) | | | (.08 | ) |
Net realized gains | | | (3.06 | ) | | | (2.16 | ) | | | (.92 | ) | | | (.39 | ) | | | — | |
Total distributions | | | (3.38 | ) | | | (2.50 | ) | | | (1.29 | ) | | | (.71 | ) | | | (.08 | ) |
Net asset value, end of period | | $ | 28.23 | | | $ | 31.23 | | | $ | 29.11 | | | $ | 26.55 | | | $ | 23.69 | |
|
Total Return | | | 3.56 | % | | | 16.50 | % | | | 15.01 | % | | | 15.30 | % | | | (4.15 | %) |
Ratios/Supplemental Data | | | | | | | | | | | | | | | | | | | | |
Net assets, end of period (in thousands) | | $ | 210,053 | | | $ | 220,587 | | | $ | 216,008 | | | $ | 208,867 | | | $ | 189,668 | |
Ratios to average net assets: | | | | | | | | | | | | | | | | | | | | |
Net investment income (loss) | | | 1.23 | % | | | 0.93 | % | | | 1.23 | % | | | 1.38 | % | | | 1.22 | % |
Total expensesb | | | 1.05 | % | | | 1.05 | % | | | 1.03 | % | | | 1.07 | % | | | 1.15 | % |
Portfolio turnover rate | | | 131 | % | | | 164 | % | | | 156 | % | | | 209 | % | | | 221 | % |
a | Net investment income (loss) per share was computed using average shares outstanding throughout the period. |
b | Does not include expenses of the underlying funds in which the Fund invests. |
14 | THE GUGGENHEIM FUNDS ANNUAL REPORT | SEE NOTES TO FINANCIAL STATEMENTS. |
NOTES TO FINANCIAL STATEMENTS |
Note 1 – Organization and Significant Accounting Policies
Organization
Guggenheim Funds Trust (the “Trust”), a Delaware statutory trust, is registered with the SEC under the Investment Company Act of 1940 (“1940 Act”), as an open-ended investment company of the series type. Each series, in effect, is representing a separate Fund. The Trust is authorized to issue an unlimited number of shares. The Trust accounts for the assets of each Fund separately.
The Trust offers a combination of five separate classes of shares: A-Class shares, C-Class shares, P-Class shares, R6-Class shares and Institutional Class shares. Sales of shares of each Class are made without a front-end sales charge at the net asset value per share (“NAV”), with the exception of A-Class shares. A-Class shares are sold at the NAV, plus the applicable front-end sales charge. The sales charge varies depending on the amount purchased. A-Class share purchases of $1 million or more are exempt from the front-end sales charge but have a 1% contingent deferred sales charge (“CDSC”), if shares are redeemed within 12 months of purchase. C-Class shares have a 1% CDSC if shares are redeemed within 12 months of purchase. C-Class shares of the Fund automatically convert to A-Class shares on or about the 10th day of the month following the 10-year anniversary of the purchase of the C-Class shares. This conversion will be executed without any sales charge, fee or other charge. After the conversion is completed, the shares will be subject to all features and expenses of A-Class shares. Institutional Class shares are offered primarily for direct investment by institutions such as pension and profit sharing plans, endowments, foundations and corporations. Institutional Class shares require a minimum initial investment of $2 million and a minimum account balance of $1 million. R6-Class shares are offered primarily through qualified retirement and benefit plans. R6-Class shares are also offered through certain other plans and platforms sponsored by financial intermediaries. Certain institutional investors and others deemed appropriate by Guggenheim Investments (“GI”) may also be eligible to purchase R6-Class shares subject to a $2 million minimum initial investment. At September 30, 2019, the Trust consisted of twenty funds (the “Funds”).
This report covers the Capital Stewardship Fund (the “Fund”), a diversified investment company. At September 30, 2019, Institutional Class shares had been issued by the Fund.
Guggenheim Partners Investment Management, LLC (“GPIM”), which operates under the name Guggenheim Investments (“GI”), provides advisory services. Guggenheim Funds Distributors, LLC (“GFD”) acts as principal underwriter for the Trust. GI and GFD are affiliated entities.
Concinnity Advisors, LP (the “Sub-Adviser”) serves as the sub-adviser to the Fund.
Significant Accounting Policies
The Fund operates as an investment company and, accordingly, follows the investment company accounting and reporting guidance of the Financial Accounting Standards Board (“FASB”) Accounting Standards Codification Topic 946 Financial Services – Investment Companies.
The following significant accounting policies are in conformity with U.S. generally accepted accounting principles (“U.S. GAAP”) and are consistently followed by the Trust. This requires management to make estimates and assumptions that affect the reported amount of assets and liabilities, contingent assets and liabilities at the date of the financial statements, and the reported amounts of revenues and expenses during the reporting period. Actual results could differ from these estimates. All time references are based on Eastern Time.
The NAV of the Fund is calculated by dividing the market value of the Fund’s securities and other assets, less all liabilities, by the number of outstanding shares of the Fund.
(a) Valuation of Investments
The Board of Trustees of the Fund (the “Board”) has adopted policies and procedures for the valuation of the Fund’s investments (the “Valuation Procedures”). Pursuant to the Valuation Procedures, the Board has delegated to a valuation committee, consisting of representatives from Guggenheim’s investment management, fund administration, legal and compliance departments (the “Valuation Committee”), the day-to-day responsibility for implementing the Valuation Procedures, including, under most circumstances, the responsibility for determining the fair value of the Fund’s securities and/or other assets.
Valuations of the Fund’s securities are supplied primarily by pricing services appointed pursuant to the processes set forth in the Valuation Procedures. The Valuation Committee convenes monthly, or more frequently as needed, to review the valuation of all assets which have been fair valued for reasonableness. The Fund’s officers, through the Valuation Committee and consistent with the monitoring and review responsibilities set forth in the Valuation Procedures, regularly review procedures used and valuations provided by the pricing services.
If the pricing service cannot or does not provide a valuation for a particular investment or such valuation is deemed unreliable, such investment is fair valued by the Valuation Committee.
Equity securities listed or traded on a recognized U.S. securities exchange or the National Association of Securities Dealers Automated Quotations (“NASDAQ”) National Market System shall generally be valued on the basis of the last sale price on the
| | THE GUGGENHEIM FUNDS ANNUAL REPORT | 15 |
NOTES TO FINANCIAL STATEMENTS (continued) |
primary U.S. exchange or market on which the security is listed or traded; provided, however, that securities listed on NASDAQ will be valued at the NASDAQ Official Closing Price, which may not necessarily represent the last sale price. If there is no sale on the valuation date, exchange-traded U.S. equity securities will be valued on the basis of the last bid price.
Exchange-traded funds are valued at the last quoted sale price.
Money market funds are valued at their NAV.
Investments for which market quotations are not readily available are fair-valued as determined in good faith by GI, subject to review and approval by the Valuation Committee, pursuant to methods established or ratified by the Board. Valuations in accordance with these methods are intended to reflect each security’s (or asset’s or liability’s) “fair value”. Each such determination is based on a consideration of all relevant factors, which are likely to vary from one pricing context to another. Examples of such factors may include, but are not limited to market prices; sale prices; broker quotes; and models which derive prices based on inputs such as prices of securities with comparable maturities and characteristics, or based on inputs such as anticipated cash flows or collateral, spread over U.S. Treasury securities, and other information analysis.
(b) Security Transactions
Security transactions are recorded on the trade date for financial reporting purposes. Realized gains and losses from securities transactions are recorded using the identified cost basis. Proceeds from lawsuits related to investment holdings are recorded as a reduction to cost if the securities are still held and as realized gains if no longer held in the Fund. Taxable non-cash dividends are recorded as dividend income. Interest income, including amortization of premiums and accretion of discounts, is accrued on a daily basis. Amendment fees are earned as compensation for evaluating and accepting changes to the original loan agreement and are recognized when received. Dividend income from Real Estate Investment Trusts (“REITs”) is recorded based on the income included in the distributions received from the REIT investments using published REIT classifications, including some management estimates when actual amounts are not available. Distributions received in excess of this estimated amount are recorded as a reduction of the cost of investments or reclassified to realized gains. The actual amounts of income, return of capital, and realized gains are only determined by each REIT after its fiscal year-end, and may differ from the estimated amounts.
(c) Distributions
Distributions of net investment income and net realized gains, if any, are declared and paid at least annually. Dividends are reinvested in additional shares unless shareholders request payment in cash. Distributions are recorded on the ex-dividend date and are determined in accordance with U.S. federal income tax regulations which may differ from U.S. GAAP.
(d) Expenses
Certain expenses have been allocated to the individual Funds in the Trust based on the respective net assets of each Fund included in the Trust.
(e) Earnings Credits
Under the fee arrangement with the custodian, the Fund may earn credits based on overnight custody cash balances. These credits are utilized to reduce related custodial expenses. The custodian fees disclosed in the Statement of Operations are before the reduction in expense from the related earnings credits, if any. Earnings credits for the year ended September 30, 2019, are disclosed in the Statement of Operations.
(f) Cash
The Fund may leave cash overnight in its cash account with the custodian. Periodically, the Fund may have cash due to the custodian bank as an overdraft balance. A fee is incurred on this overdraft, calculated by multiplying the overdraft by a rate based on the federal funds rate, which was 1.90% at September 30, 2019.
(g) Indemnifications
Under the Fund’s organizational documents, its Trustees and Officers are indemnified against certain liabilities arising out of the performance of their duties to the Trust. In addition, throughout the normal course of business, the Fund enters into contracts that contain a variety of representations and warranties which provide general indemnifications. The Fund’s maximum exposure under these arrangements is unknown, as this would involve future claims that may be made against the Fund and/or its affiliates that have not yet occurred. However, based on experience, the Fund expects the risk of loss to be remote.
Note 2 – Investment Advisory Agreement and Other Agreements
Under the terms of an investment advisory contract, the Fund pays GI investment advisory fees calculated at an annualized rate of 0.90% of the average daily net assets of the Fund.
GI engages external service providers to perform other necessary services for the Trust, such as audit and accounting related services, legal services, custody, printing and mailing, etc., on a pass-through basis. Such expenses are allocated to various Funds within the complex based on relative net assets.
16 | THE GUGGENHEIM FUNDS ANNUAL REPORT | |
NOTES TO FINANCIAL STATEMENTS (continued) |
Certain trustees and officers of the Trust are also officers of GI and/or GFD. The Trust does not compensate its officers or trustees who are officers, directors and/or employees of GI or GFD.
MUFG Investor Services (US), LLC (“MUIS”) acts as the Fund’s administrator, transfer agent and accounting agent. As administrator, transfer agent and accounting agent, MUIS is responsible for maintaining the books and records of the Fund’s securities and cash. The Bank of New York Mellon Corp. (“BNY”) acts as the Fund’s custodian. As custodian, BNY is responsible for the custody of the Fund’s assets. For providing the aforementioned administrative and accounting services, MUIS is entitled to receive a monthly fee equal to a percentage of the Fund’s average daily net assets and out of pocket expenses. For providing the aforementioned transfer agent and custodian services, MUIS and BNY are entitled to receive a monthly fee based on the number of transactions during the month and the number of accounts under management, subject to certain minimum monthly fees, and out of pocket expenses.
Note 3 – Federal Income Tax Information
The Fund intends to comply with the provisions of Subchapter M of the Internal Revenue Code applicable to regulated investment companies and will distribute substantially all taxable net investment income and capital gains sufficient to relieve the Fund from all, or substantially all, federal income, excise and state income taxes. Therefore, no provision for federal or state income tax or federal excise tax is required.
Tax positions taken or expected to be taken in the course of preparing the Fund’s tax returns are evaluated to determine whether the tax positions are “more-likely-than-not” of being sustained by the applicable tax authority. Tax positions not deemed to meet the more-likely-than-not threshold would be recorded as a tax benefit or expense in the current year. Management has analyzed the Fund’s tax positions taken, or to be taken, on U.S. federal income tax returns for all open tax years, and has concluded that no provision for income tax is required in the Fund’s financial statements. The Fund’s U.S. federal income tax returns are subject to examination by the Internal Revenue Service for a period of three years after they are filed.
The tax character of distributions paid during the year ended September 30, 2019 was as follows:
| | Ordinary
Income | | | Long-Term
Capital Gain | | | Total
Distributions | |
| | | $ | 17,031,190 | | | $ | 6,237,343 | | | $ | 23,268,533 | |
The tax character of distributions paid during the year ended September 30, 2018 was as follows:
| | Ordinary
Income | | | Long-Term
Capital Gain | | | Total
Distributions | |
| | | $ | 15,115,526 | | | $ | 3,155,622 | | | $ | 18,271,148 | |
Note: For U.S. federal income tax purposes, short-term capital gain distributions are treated as ordinary income distributions.
The tax components of distributable earnings/(loss) as of September 30, 2019 were as follows:
| | Undistributed
Ordinary
Income | | | Undistributed
Long-Term
Capital Gain | | | Net Unrealized
Appreciation
(Depreciation) | | | Accumulated
Capital and
Other Losses | | | Total | |
| | | $ | 3,331,989 | | | $ | 1,098,448 | | | $ | 14,419,468 | | | $ | — | | | $ | 18,849,905 | |
For U.S. federal income tax purposes, capital loss carryforwards represent realized losses of the Fund that may be carried forward and applied against future capital gains. Under the RIC Modernization Act of 2010, the Fund is permitted to carry forward capital losses incurred in taxable years beginning after December 22, 2010 for an unlimited period and such capital loss carryforwards will retain their character as either short-term or long-term capital losses. As of September 30, 2019, the Fund had no capital loss carryforwards.
| | THE GUGGENHEIM FUNDS ANNUAL REPORT | 17 |
NOTES TO FINANCIAL STATEMENTS (continued) |
Net investment income and net realized gains (losses) may differ for financial statement and tax purposes because of temporary or permanent book/tax differences. These differences are primarily due to distributions in connection with redemption of fund shares and losses deferred due to wash sales. To the extent these differences are permanent and would require a reclassification between Paid in Capital and Total Distributable Earnings (Loss), such reclassifications are made in the period that the differences arise. These reclassifications have no effect on net assets or NAV per share.
The following adjustments were made on the Statement of Assets and Liabilities as of September 30, 2019 for permanent book/tax differences:
| | Paid In
Capital | | | Total
Distributable
Earnings/(Loss) | |
| | | $ | 4,819,266 | | | $ | (4,819,266 | ) |
At September 30, 2019, the cost of investments for U.S. federal income tax purposes, the aggregate gross unrealized appreciation for all investments for which there was an excess of value over tax cost and the aggregate gross unrealized depreciation for all investments for which there was an excess of tax cost over value, were as follows:
| | Tax
Cost | | | Tax
Unrealized
Appreciation | | | Tax
Unrealized
Depreciation | | | Net
Unrealized
Appreciation/
(Depreciation) | |
| | | $ | 198,635,464 | | | $ | 19,264,167 | | | $ | (4,844,699 | ) | | $ | 14,419,468 | |
Note 4 – Fair Value Measurement
In accordance with U.S. GAAP, fair value is defined as the price that the Fund would receive to sell an investment or pay to transfer a liability in an orderly transaction with an independent buyer in the principal market, or in the absence of a principal market, the most advantageous market for the investment or liability. U.S. GAAP establishes a three-tier fair value hierarchy based on the types of inputs used to value assets and liabilities and requires corresponding disclosure. The hierarchy and the corresponding inputs are summarized below:
Level 1 — | quoted prices in active markets for identical assets or liabilities. |
Level 2 — | significant other observable inputs (for example quoted prices for securities that are similar based on characteristics such as interest rates, prepayment speeds, credit risk, etc.). |
Level 3 — | significant unobservable inputs based on the best information available under the circumstances, to the extent observable inputs are not available, which may include assumptions. |
The types of inputs available depend on a variety of factors, such as the type of security and the characteristics of the markets in which it trades, if any. Fair valuation determinations that rely on fewer or no observable inputs require greater judgment. Accordingly, fair value determinations for Level 3 securities require the greatest amount of judgment.
The inputs or methodologies used for valuing securities are not necessarily an indication of the risk associated with investing in those securities. The suitability of the techniques and sources employed to determine fair valuation are regularly monitored and subject to change.
Note 5 – Securities Transactions
For the year ended September 30, 2019, the cost of purchases and proceeds from sales of investment securities, excluding government securities, short-term investments and derivatives, were as follows:
| | Purchases | | | Sales | |
| | | $ | 268,860,333 | | | $ | 282,334,871 | |
18 | THE GUGGENHEIM FUNDS ANNUAL REPORT | |
NOTES TO FINANCIAL STATEMENTS (concluded) |
Note 6 – Recent Regulatory Reporting Updates
In August 2018, the Financial Accounting Standards Board issued an Accounting Standards Update, ASU 2018-13, Fair Value Measurement (Topic 820), Disclosure Framework - Changes to the Disclosure Requirements for Fair Value Measurement (the “2018 ASU”) which adds, modifies and removes disclosure requirements related to certain aspects of fair value measurement. The 2018 ASU is effective for fiscal years, and interim periods within those fiscal years, beginning after December 15, 2019. Early adoption is permitted. As of September 30, 2019, the Fund has fully adopted the provisions of the 2018 ASU, which did not have a material impact on the Fund’s financial statements and related disclosures or impact the Fund’s net assets or results of operations.
Note 7 – Subsequent Events
The Fund evaluated subsequent events through the date the financial statements were available for issue and determined there were no material events that would require adjustment to or disclosure in the Fund’s financial statements.
| | THE GUGGENHEIM FUNDS ANNUAL REPORT | 19 |
REPORT OF INDEPENDENT REGISTERED PUBLIC ACCOUNTING FIRM |
To the Shareholders and the Board of Trustees of Guggenheim Capital Stewardship Fund
Opinion on the Financial Statements
We have audited the accompanying statement of assets and liabilities of Guggenheim Capital Stewardship Fund (the “Fund”) (one of the funds constituting Guggenheim Funds Trust (the “Trust”)), including the schedule of investments, as of September 30, 2019, and the related statement of operations for the year then ended, the statements of changes in net assets for each of the two years in the period then ended, the financial highlights for each of the five years in the period then ended and the related notes (collectively referred to as the “financial statements”). In our opinion, the financial statements present fairly, in all material respects, the financial position of the Fund (one of the funds constituting Guggenheim Funds Trust) at September 30, 2019, the results of its operations for the year then ended, the changes in its net assets for each of the two years in the period then ended and its financial highlights for each of the five years in the period then ended, in conformity with U.S. generally accepted accounting principles.
Basis for Opinion
These financial statements are the responsibility of the Trust’s management. Our responsibility is to express an opinion on the Fund’s financial statements based on our audits. We are a public accounting firm registered with the Public Company Accounting Oversight Board (United States) (“PCAOB”) and are required to be independent with respect to the Trust in accordance with the U.S. federal securities laws and the applicable rules and regulations of the Securities and Exchange Commission and the PCAOB.
We conducted our audits in accordance with the standards of the PCAOB. Those standards require that we plan and perform the audit to obtain reasonable assurance about whether the financial statements are free of material misstatement, whether due to error or fraud. The Trust is not required to have, nor were we engaged to perform, an audit of the Trust’s internal control over financial reporting. As part of our audits, we are required to obtain an understanding of internal control over financial reporting, but not for the purpose of expressing an opinion on the effectiveness of the Trust’s internal control over financial reporting. Accordingly, we express no such opinion.
Our audits included performing procedures to assess the risks of material misstatement of the financial statements, whether due to error or fraud, and performing procedures that respond to those risks. Such procedures included examining, on a test basis, evidence regarding the amounts and disclosures in the financial statements. Our procedures included confirmation of securities owned as of September 30, 2019, by correspondence with the custodian. Our audits also included evaluating the accounting principles used and significant estimates made by management, as well as evaluating the overall presentation of the financial statements. We believe that our audits provide a reasonable basis for our opinion.

We have served as the auditor of one or more Guggenheim investment companies since 1979.
Tysons, Virginia
November 26, 2019
20 | THE GUGGENHEIM FUNDS ANNUAL REPORT | |
OTHER INFORMATION (Unaudited) |
Federal Income Tax Information
This information is being provided as required by the Internal Revenue Code. Amounts shown may differ from those elsewhere in the report because of differences in tax and financial reporting practice.
In January 2020, shareholders will be advised on IRS Form 1099 DIV or substitute 1099 DIV as to the federal tax status of the distributions received by shareholders in the calendar year 2019.
The Fund’s investment income (dividend income plus short-term gains, if any) qualifies as follows:
Of the taxable ordinary income distributions paid during the fiscal year ending September 30, 2019, the Fund had the corresponding percentages qualify for the reduced tax rate pursuant to the Jobs and Growth Tax Relief and Reconciliation Act of 2003 or for the dividends received deduction for corporations. See the qualified dividend income and dividend received deduction columns, respectively, in the table below.
Additionally, of the taxable ordinary income distributions paid during the fiscal year ended September 30, 2019, the Fund had the corresponding percentage qualify as qualified short-term capital gains as permitted by IRC Section 871(k)(2). See qualified short-term capital gain column in the table below.
| | Qualified
Dividend
Income | | | Dividend
Received
Deduction | | | Qualified
Short-Term
Capital Gain | |
| | | | 25.96 | % | | | 25.50 | % | | | 100.00 | % |
With respect to the taxable year ended September 30, 2019, the Fund hereby designates as capital gain dividends the amount listed below, or, if subsequently determined to be different, the net capital gain of such year:
| | From long-term
capital gain: | | | From long-term capital gain,
using proceeds from shareholder redemptions: | |
| | | $ | 6,237,343 | | | $ | 4,792,226 | |
Proxy Voting Information
A description of the policies and procedures that the Trust uses to determine how to vote proxies relating to securities held in the Fund’s portfolios is available, without charge and upon request, by calling 800.820.0888. This information is also available from the EDGAR database on the SEC’s website at https://www.sec.gov.
Information regarding how the Fund’s voted proxies relating to portfolio securities during the most recent 12-month period ended June 30 is available without charge, upon request, by calling 800.820.0888. This information is also available from the EDGAR database on the SEC’s website at https://www.sec.gov.
| | THE GUGGENHEIM FUNDS ANNUAL REPORT | 21 |
OTHER INFORMATION (Unaudited)(continued) |
Special Meeting of Shareholders — Voting Results (Unaudited)
A joint special meeting of shareholders of the Trust was held on October 28, 2019 to elect the following ten nominees to the Board of Trustees of the Trust: Randall C. Barnes, Angela Brock-Kyle, Donald A. Chubb, Jr., Jerry B. Farley, Roman Friedrich III, Thomas F. Lydon, Jr., Ronald A. Nyberg, Sandra G. Sponem, Ronald E. Toupin, Jr. and Amy J. Lee. At the meeting, the following votes were recorded:
Nominee | Shares For | Shares Withheld |
Randall C. Barnes | 919,263,831 | 7,335,759 |
Angela Brock-Kyle | 919,775,822 | 6,823,768 |
Donald A. Chubb, Jr. | 915,120,874 | 11,478,716 |
Jerry B. Farley | 915,377,483 | 11,222,107 |
Roman Friedrich III | 918,807,442 | 7,792,148 |
Thomas F. Lydon, Jr. | 919,122,642 | 7,476,948 |
Ronald A. Nyberg | 918,889,679 | 7,709,911 |
Sandra G. Sponem | 919,600,708 | 6,998,882 |
Ronald E. Toupin, Jr. | 919,043,208 | 7,556,382 |
Amy J. Lee | 919,943,855 | 6,655,735 |
Sector Classification
Information in the Schedule of Investments is categorized by sectors using sector-level Classifications defined by the Bloomberg Industry Classification System, a widely recognized industry classification system provider. The Fund’s registration statement has investment policies relating to concentration in specific sectors/industries. For purposes of these investment policies, the Fund usually classifies sectors/industries based on industry-level Classifications used by widely recognized industry classification system providers such as Bloomberg Industry Classification System, Global Industry Classification Standards and Barclays Global Classification Scheme.
Quarterly Portfolio Schedules Information
The Trust files its complete schedule of portfolio holdings with the SEC for the first and third quarters of each fiscal year as an exhibit to its reports on Form N-PORT, and for reporting periods ended prior to March 31, 2019, filed such information on Form N-Q. The Fund’s Forms N-PORT and N-Q are available on the SEC’s website at https://www.sec.gov. The Fund’s Forms N-PORT and N-Q may be reviewed and copied at the SEC’s Public Reference Room in Washington, DC, and that information on the operation of the Public Reference Room may be obtained by calling 800-SEC-0330. Copies of the portfolio holdings are also available to shareholders, without charge and upon request, by calling 800.820.0888.
Report of the Guggenheim Funds Trust Contracts Review Committee
Guggenheim Funds Trust (the “Trust”) was organized as a Delaware statutory trust on November 8, 2013, and is registered as an open-end management investment company under the Investment Company Act of 1940, as amended (the “1940 Act”). The Trust includes the following series:
● Guggenheim Alpha Opportunity Fund (“Alpha Opportunity Fund”) ● Guggenheim Diversified Income Fund (“Diversified Income Fund”) ● Guggenheim High Yield Fund (“High Yield Fund”) ● Guggenheim Large Cap Value Fund (“Large Cap Value Fund”) ● Guggenheim Macro Opportunities Fund (“Macro Opportunities Fund”) | ● Guggenheim Capital Stewardship Fund (“Capital Stewardship Fund”) ● Guggenheim Floating Rate Strategies Fund (“Floating Rate Strategies Fund”) ● Guggenheim Investment Grade Bond Fund (“Investment Grade Bond Fund”) ● Guggenheim Limited Duration Fund (“Limited Duration Fund”) ● Guggenheim Market Neutral Real Estate Fund (“Market Neutral Real Estate Fund”) |
22 | THE GUGGENHEIM FUNDS ANNUAL REPORT | |
OTHER INFORMATION (Unaudited)(continued) |
● Guggenheim SMid Cap Value Fund (“SMid Cap Value Fund”) ● Guggenheim Municipal Income Fund (“Municipal Income Fund”) ● Guggenheim Small Cap Value Fund (“Small Cap Value Fund”) ● Guggenheim StylePlus—Mid Growth Fund (“StylePlus—Mid Growth Fund”) ● Guggenheim Ultra Short Duration Fund (“Ultra Short Duration Fund”) | ● Guggenheim SMid Cap Value Institutional Fund (“SMid Cap Value Institutional Fund”) ● Guggenheim Risk Managed Real Estate Fund (“Risk Managed Real Estate Fund”) ● Guggenheim StylePlus—Large Core Fund (“StylePlus—Large Core Fund”) ● Guggenheim Total Return Bond Fund (“Total Return Bond Fund”) ● Guggenheim World Equity Income Fund (“World Equity Income Fund”) |
Security Investors, LLC (“Security Investors”), an indirect subsidiary of Guggenheim Partners, LLC, a privately-held, global investment and advisory firm (“Guggenheim Partners”), serves as investment adviser to each of: (i) Alpha Opportunity Fund; (ii) High Yield Fund; (iii) Investment Grade Bond Fund; (iv) Large Cap Value Fund; (v) SMid Cap Value Fund; (vi) SMid Cap Value Institutional Fund; (vii) Municipal Income Fund; (viii) Small Cap Value Fund; (ix) StylePlus—Large Core Fund; (x) StylePlus—Mid Growth Fund; and (xi) World Equity Income Fund (collectively, the “SI-Advised Funds”). (Guggenheim Partners, Security Investors, Guggenheim Partners Investment Management, LLC (“GPIM”) and their affiliates may be referred to herein collectively as “Guggenheim.” Security Investors and GPIM are also known as “Guggenheim Investments,” the global asset management and investment advisory division of Guggenheim Partners that includes other affiliated investment management businesses.)
Under the terms of investment management agreements between Security Investors and the Trust, with respect to the SI-Advised Funds, Security Investors also is responsible for overseeing the activities of GPIM, an indirect subsidiary of Guggenheim Partners, with respect to its service as investment sub-adviser to Municipal Income Fund, pursuant to an investment sub-advisory agreement between Security Investors and GPIM (the “GPIM Sub-Advisory Agreement”).
GPIM serves as investment adviser with respect to each of: (i) Diversified Income Fund; (ii) Floating Rate Strategies Fund; (iii) Limited Duration Fund; (iv) Macro Opportunities Fund; (v) Market Neutral Real Estate Fund; (vi) Risk Managed Real Estate Fund; (vii) Total Return Bond Fund; and (viii) Ultra Short Duration Fund (collectively, the “GPIM-Advised Funds” and together with the SI-Advised Funds, the “Funds” and individually, a “Fund”).1 Under the supervision of the Board of Trustees of the Trust (the “Board,” with the members of the Board referred to individually as the “Trustees”), the Advisers regularly provide (or, as applicable, oversee the provision of) investment research, advice and supervision, along with a continuous investment program for the Funds, and direct the purchase and sale of securities and other investments for each Fund’s portfolio. GPIM also serves as investment adviser for the Capital Stewardship Fund, which is addressed in a separate report.2
Each of the Advisory Agreements continues in effect from year to year provided that such continuance is specifically approved at least annually by (i) the Board or a majority of the outstanding voting securities (as defined in the 1940 Act) of each Fund, and, in either event, (ii) the vote of a majority of the Trustees who are not “interested person[s],” as defined by the 1940 Act, of the Trust (the “Independent Trustees”) casting votes in person at a meeting called for such purpose. At meetings held in person on April 25, 2019 (the “April Meeting”) and on May 21, 2019 (the “May Meeting”), the members of the Contracts Review Committee of the Board (the “Committee”), consisting solely of the Independent Trustees, met separately from Guggenheim to consider the proposed renewal of the Agreements in connection with the Committee’s annual contract review schedule.
1 | The investment management agreements pertaining to the SI-Advised Funds and the investment management agreements pertaining to the GPIM-Advised Funds are referred to herein together as the “Advisory Agreements” and, together with the GPIM Sub-Advisory Agreement, as the “Agreements.” In addition, unless the context indicates otherwise, GPIM, with respect to its service as investment adviser to the GPIM-Advised Funds, and Security Investors as to the SI-Advised Funds, are each referred to herein as the “Adviser” and together, the “Advisers.” |
2 | Because shares of the Capital Stewardship Fund are only offered for subscription and are held by a limited number of institutional/bank investors, and the Fund issues a shareholder report separate from the other series of the Trust, the factors considered by the Committee in evaluating the proposed renewal of an investment management agreement pertaining to the Capital Stewardship Fund, and the Sub-Advisory Agreement with Concinnity Advisors, LP, are addressed in a separate report of the Committee. Accordingly, references to the “Funds” should be understood as referring to all series of the Trust, excluding Capital Stewardship Fund. |
| | THE GUGGENHEIM FUNDS ANNUAL REPORT | 23 |
OTHER INFORMATION (Unaudited)(continued) |
As part of its review process, the Committee was represented by independent legal counsel to the Independent Trustees (“Independent Legal Counsel”), from whom the Independent Trustees received separate legal advice and with whom they met separately. Independent Legal Counsel reviewed and discussed with the Committee various key aspects of the Trustees’ legal responsibilities relating to the proposed renewal of the Agreements and other principal contracts. The Committee took into account various materials received from Guggenheim and Independent Legal Counsel. Recognizing that the evaluation process with respect to the services provided by Guggenheim is an ongoing one, the Committee also considered the variety of written materials, reports and oral presentations the Board receives throughout the year regarding performance and operating results of the Funds and other information relevant to its evaluation of the Agreements.
In connection with the contract review process, FUSE Research Network LLC (“FUSE”), an independent, third-party research provider, was engaged to prepare advisory contract renewal reports designed specifically to help the Board fulfill its advisory contract renewal responsibilities. The objective of the reports is to present the subject funds’ relative position regarding fees, expenses and total return performance, with peer group and universe comparisons. The Committee assessed the data provided in the FUSE reports as well as commentary presented by Guggenheim, including, among other things, a summary of notable distinctions between certain Funds and the applicable peer group identified in the FUSE reports and explanations for custom peer groups created for certain Funds that do not fit well into any particular category.
In addition, Guggenheim provided materials and data in response to formal requests for information sent by Independent Legal Counsel on behalf of the Independent Trustees. Guggenheim also made a presentation at the April Meeting. Throughout the process, the Committee asked questions of management and requested certain additional information, which Guggenheim provided (collectively with the foregoing reports and materials, the “Contract Review Materials”). The Committee considered the Contract Review Materials in the context of its accumulated experience governing the Trust and weighed the factors and standards discussed with Independent Legal Counsel.
Following an analysis and discussion of relevant factors, including those identified below, and in the exercise of its business judgment, the Committee concluded that it was in the best interest of each Fund to recommend that the Board approve the renewal of each of the Advisory Agreements and the GPIM Sub-Advisory Agreement for an additional annual term.
Advisory Agreements
Nature, Extent and Quality of Services Provided by each Adviser: With respect to the nature, extent and quality of services currently provided by each Adviser, the Committee considered the qualifications, experience and skills of key personnel performing services for the Funds, including those personnel providing compliance and risk oversight, as well as the supervisors and reporting lines for such personnel. The Committee considered Guggenheim’s resources and related efforts to retain, attract and motivate capable personnel to serve the Funds. In evaluating Guggenheim’s resources and capabilities, the Committee considered Guggenheim’s commitment to focusing on, and investing resources in support of, the Funds.
The Committee’s review of the services provided by Guggenheim to the Funds included consideration of Guggenheim’s investment processes and resulting performance, portfolio oversight and risk management, and the related regular quarterly reports and presentations received by the Board. The Committee took into account the risks borne by Guggenheim in sponsoring and providing services to the Funds, including entrepreneurial, legal and regulatory risks. The Committee considered the resources dedicated by Guggenheim to compliance functions and the reporting made to the Board by Guggenheim compliance personnel regarding Guggenheim’s adherence to regulatory requirements. The Committee also considered the regular reports the Board receives from the Trust’s Chief Compliance Officer regarding compliance policies and procedures established pursuant to Rule 38a-1 under the 1940 Act.
In connection with the Committee’s evaluation of the overall package of services provided by Guggenheim, the Committee considered Guggenheim’s administrative services, including its role in supervising, monitoring, coordinating and evaluating the various services provided by the fund administrator, transfer agent, distributor, custodian and other service providers to the Funds. The Committee evaluated the Office of Chief Financial Officer (the “OCFO”), established to oversee the fund administration, accounting and transfer agency services provided to the Funds, including the OCFO’s resources, personnel and services provided.
With respect to Municipal Income Fund, the Committee noted that, although Security Investors delegated responsibility for the investment and reinvestment of the Fund’s assets to the Sub-Adviser, as affiliated companies, both the Adviser and Sub-Adviser are part of the Guggenheim organization. Further, the Committee took into account Guggenheim’s explanation that investment advisory-related services are provided by many Guggenheim employees under different related legal entities and thus, the services provided by the Adviser on the one hand and the
24 | THE GUGGENHEIM FUNDS ANNUAL REPORT | |
OTHER INFORMATION (Unaudited)(continued) |
Sub-Adviser on the other, as well as the risks assumed by each party, cannot be ascribed to distinct legal entities.3 As a result, the Committee did not evaluate the services provided to Municipal Income Fund under the Advisory Agreement and the GPIM Sub-Advisory Agreement separately. With respect to Guggenheim’s resources and the ability of each Adviser to carry out its responsibilities under the applicable Advisory Agreement, the Chief Financial Officer of Guggenheim Investments reviewed with the Committee financial information concerning the holding company for Guggenheim Investments, Guggenheim Partners Investment Management Holdings, LLC (“GPIMH”), and the various entities comprising Guggenheim Investments, and provided the audited consolidated financial statements of GPIMH. (Thereafter, the Committee received the audited consolidated financial statements of GPIM.)
The Committee also considered the acceptability of the terms of each Advisory Agreement, including the scope of services required to be performed by each Adviser.
Based on the foregoing, and based on other information received (both oral and written) at the April Meeting and the May Meeting, as well as other considerations, including the Committee’s knowledge of how each Adviser performs its duties obtained through Board meetings, discussions and reports throughout the year, the Committee concluded that each Adviser and its personnel were qualified to serve the Funds in such capacity and may reasonably be expected to continue to provide a high quality of services under each Advisory Agreement with respect to the Funds.
Investment Performance: The Committee received, for each Fund, investment returns for the since-inception, ten-year, five-year, three-year, one-year and three-month periods ended December 31, 2018, as applicable. In addition, the Committee received a comparison of each Fund’s performance to the performance of a benchmark, a universe of funds and a narrower peer group of similar funds based on asset levels as identified by FUSE, in each case for the same periods, as applicable. The Committee also received from FUSE a description of the methodology for identifying each Fund’s peer group and universe for performance and expense comparisons.
In seeking to evaluate Fund performance over a full market cycle, the Committee focused its attention on five-year and three-year performance rankings as compared to the relevant universe of funds. The Committee considered more recent performance periods for those Funds that were recently launched, as well as in circumstances in which enhancements were being made to the portfolio management processes or techniques employed for a Fund. Except as to the individual Funds discussed below, the Committee observed that the returns of each Fund’s (other than SMid Cap Value Fund) Institutional Class shares and SMid Cap Value Fund’s Class A shares ranked in the third quartile or better of such Fund’s performance universe for each of the relevant periods considered.
In addition, the Committee made the following observations:
Municipal Income Fund: The returns of the Fund’s Institutional Class shares ranked in the 55th and 82nd percentiles of its performance universe for the five-year and three-year periods ended December 31, 2018, respectively. The Committee noted management’s explanation that the Fund’s increased allocation to floating rate securities in 2016 and the Fund’s more conservative investment approach detracted from performance that year, impacting trailing returns for five-year and three-year periods. In light of the foregoing, the Committee also considered the more recent one-year and three-month periods ended December 31, 2018, and observed that the returns of Fund’s Institutional Class shares ranked in the 30th and 11th percentiles, respectively, of its performance universe. The Committee also took into account management’s statement that it expects the Fund’s performance to continue to improve going forward as it anticipates the effects of recent tax reform and idiosyncratic risks.
Small Cap Value Fund: The returns of the Fund’s Institutional Class shares ranked in the 79th and 56th percentiles of its performance universe for the five-year and three-year periods ended December 31, 2018, respectively. The Committee noted measures taken by the Adviser to remedy longer-term relative underperformance with respect to the Value Funds strategy, including strategy enhancements such as implementation of a refined stock selection process and additional risk controls to enforce the strategy’s sell discipline. In light of the foregoing, the Committee also considered the more recent one-year and three-month periods ended December 31, 2018, and observed that the returns of Fund’s Institutional Class shares ranked in the 19th and 20th percentiles, respectively, of its performance universe.
3 | Consequently, except where the context indicates otherwise, references to “Adviser” or “Sub-Adviser” should be understood as referring to Guggenheim Investments generally and the services it provides under both Agreements. |
| | THE GUGGENHEIM FUNDS ANNUAL REPORT | 25 |
OTHER INFORMATION (Unaudited)(continued) |
After reviewing the foregoing and related factors, the Committee concluded that: (i) each Fund’s performance was acceptable; or (ii) it was satisfied with Guggenheim’s responses and efforts to improve investment performance.
Comparative Fees, Costs of Services Provided and the Profits Realized by each Adviser from Its Relationship with the Funds: The Committee compared each Fund’s contractual advisory fee, net effective management fee and total net expense ratio to the applicable peer group. The Committee also reviewed the median advisory fees and expense ratios, including expense ratio components (e.g., transfer agency fees, administration fees, other operating expenses, distribution fees and fee waivers/reimbursements), of the peer group of funds.
As part of its evaluation of each Fund’s advisory fee, the Committee considered how such fees compared to the advisory fee charged by the applicable Adviser to one or more other clients that it manages pursuant to similar investment strategies, to the extent applicable, noting that, in certain instances, Guggenheim charges a lower advisory fee to such other clients. In this connection, the Committee considered, among other things, Guggenheim’s representations about the significant differences between managing mutual funds as compared to other types of accounts. The Committee also considered Guggenheim’s explanation that lower fees are charged in certain instances due to various other factors, including the scope of contract, type of investors, fee structure, applicable legal, governance and capital structures, tax status and historical pricing reasons. In addition, the Committee took into account Guggenheim’s discussion of the entrepreneurial, legal and regulatory risks it faces when offering the Funds as compared to other types of accounts. The Committee concluded that the information it received demonstrated that the aggregate services provided to, or the specific circumstances of, each Fund were sufficiently different from the services provided to, or the specific circumstances of, other clients with similar investment strategies and/or the risks borne by Guggenheim were sufficiently greater than those associated with managing other clients with similar investment strategies to support the difference in fees.
In further considering the comparative fee and expense data presented in the Contract Review Materials and addressed by Guggenheim, the Committee took into account those Funds with currently effective expense limitation agreements with the Adviser. Except as to the individual Funds discussed below, the Committee observed that each Fund’s average contractual advisory fee percentile rank across all share classes of the Fund, net effective management fee4 and asset-weighted total net expense ratio each rank in the third quartile or better of such Fund’s peer group.
In addition, the Committee made the following observations:
Diversified Income Fund: The average contractual advisory fee percentile rank across all share classes of the Fund is in the fourth quartile (78th percentile) of its peer group. The Fund’s net effective management fee ranks in the first quartile (1st percentile) of its peer group. The Committee considered that the Fund’s asset weighted total net expense ratio ranks in the second quartile (38th percentile) of its peer group. The Committee also took into account the Adviser’s statement that the Fund’s currently effective expense limitation agreement with the Adviser is intended to limit the impact of the Fund’s small size.
Floating Rate Strategies Fund: The average contractual advisory fee percentile rank across all share classes of the Fund is in the fourth quartile (92nd percentile) of its peer group. The Fund’s net effective management fee ranks in the fourth quartile (76th percentile) of its peer group. The Committee considered that the Fund’s asset weighted total net expense ratio ranks in the third quartile (58th percentile) of its peer group. The Committee also considered the Adviser’s statement explaining the higher fees that performance is driven by a unique investment approach that requires significant resources. In this regard, the Committee took into consideration the Fund’s strong investment performance for the five-year period ended December 31, 2018. In addition, the Committee noted the Adviser’s statement that the net effective management fee includes 0.08% in administration fees that is not paid to the Adviser. The Committee also took into account the Fund’s currently effective expense limitation agreement with the Adviser.
High Yield Fund: The average contractual advisory fee percentile rank across all share classes of the Fund is in the third quartile (54th percentile) of its peer group. The Fund’s net effective management fee ranks in the fourth quartile (76th percentile) of its peer group. The Fund’s asset weighted total net expense ratio ranks in the third quartile (73rd percentile) of its peer group. The Committee considered the Adviser’s statement explaining the higher fees that performance is driven by a unique investment approach that requires significant resources. In this regard, the Committee took into consideration the Fund’s strong investment performance for the five-year and three-year periods
4 | The “net effective management fee” for each Fund represents the combined effective advisory fee and administration fee as a percentage of average net assets for the latest fiscal year, after any waivers and/or reimbursements, based on the Fund’s class level peer group percent rank, weighted by class level assets under management. |
26 | THE GUGGENHEIM FUNDS ANNUAL REPORT | |
OTHER INFORMATION (Unaudited)(continued) |
ended December 31, 2018. In addition, the Committee noted the Adviser’s statement that the net effective management fee includes 0.08% in administration fees that is not paid to the Adviser. The Committee also took into account the Fund’s currently effective expense limitation agreement with the Adviser.
Limited Duration Fund: The average contractual advisory fee percentile rank across all share classes of the Fund is in the third quartile (63rd percentile) of its peer group. The Fund’s net effective management fee ranks in the fourth quartile (80th percentile) of its peer group. The Committee considered that the Fund’s asset weighted total net expense ratio ranks in the third quartile (51st percentile) of its peer group. The Committee also considered the Adviser’s statement explaining the higher fees that performance is driven by a unique investment approach that requires significant resources. In this regard, the Committee took into consideration the Fund’s strong investment performance for the five-year and three-year periods ended December 31, 2018. In addition, the Committee noted the Adviser’s statement that the net effective management fee includes 0.08% in administration fees that is not paid to the Adviser. The Committee also took into account the Fund’s currently effective expense limitation agreement with the Adviser.
Macro Opportunities Fund: The average contractual advisory fee percentile rank across all share classes of the Fund, the Fund’s net effective management fee and the Fund’s asset weighted total net expense ratio each rank in the fourth quartile (93rd, 81st and 83rd percentiles, respectively) of its peer group. The Committee noted that the Fund is categorized as a non-traditional bond fund which seeks to add value by investing in many non-traditional securities outside of fixed income, including equities, currencies, commodities and derivatives. The Committee considered the Adviser’s statement explaining the higher fees and expenses that performance is driven by a unique investment approach that requires significant resources. In this regard, the Committee took into consideration the Fund’s strong investment performance for the five-year and three-year periods ended December 31, 2018. The Committee also took into account the Fund’s currently effective expense limitation agreement with the Adviser. The Committee also noted that, in connection with the contract review process, the Adviser formalized an existing expense waiver agreement with the Fund pursuant to which the Adviser waives any Fund expenses attributable to the Fund’s investment in Alpha Opportunity Fund.
SMid Cap Value Institutional Fund: The Fund’s contractual advisory fee ranks in the first quartile (7th percentile) of its peer group. The Fund’s net effective management fee and asset weighted total net expense ratio each rank in the fourth quartile (79th and 86th percentiles, respectively) of its peer group. The Committee considered the Adviser’s statement explaining the higher fees and expenses that it has made adjustments to the strategy of the Fund over the last few years incorporating a more systematic approach in order to improve investment performance. In this regard, the Committee took into consideration the Fund’s strong investment performance for the three-year period ended December 31, 2018. In addition, the Committee noted the Adviser’s statement that the net effective management fee includes 0.08% in administration fees that is not paid to the Adviser. The Committee also considered the Adviser’s statement that the Fund has continued to experience outflows resulting in lower relative assets to peers and associated higher other operating expenses, and that the Adviser is evaluating strategic measures to improve the Fund’s positioning.
Risk Managed Real Estate Fund: The average contractual advisory fee percentile rank across all share classes of the Fund is in the first quartile (22nd percentile) of its peer group. The Fund’s net effective management fee ranks in the fourth quartile (78th percentile) of its peer group. The Committee considered that the Fund’s asset weighted total net expense ratio ranks in the second quartile (47th percentile) of its peer group. The Committee took into consideration the Fund’s strong investment performance for the three-year and one-year periods ended December 31, 2018. The Committee also took into account the Fund’s currently effective expense limitation agreement with the Adviser.
StylePlus—Large Core Fund: The average contractual advisory fee percentile rank across all share classes of the Fund is in the third quartile (62nd percentile) of its peer group. The Fund’s net effective management fee ranks in the fourth quartile (86th percentile) of its peer group. The Committee considered that the Fund’s asset weighted total net expense ratio ranks in the third quartile (66th percentile) of its peer group. The Committee also considered the Adviser’s statement explaining the higher fees that performance is driven by a unique combination of passive and actively managed strategies. In this regard, the Committee took into consideration the Fund’s strong investment performance for the five-year and three-year periods ended December 31, 2018.
Total Return Bond Fund: The average contractual advisory fee percentile rank across all share classes of the Fund is in the third quartile (68th percentile) of its peer group. The Fund’s net effective management fee ranks in the fourth quartile (78th percentile) of its peer group. The Committee considered that the Fund’s asset weighted total net expense ratio ranks in the 50th percentile of its peer group. The Committee also considered the Adviser’s statement explaining the higher fees that performance is driven by a unique investment approach that requires significant resources. In this regard, the Committee took into consideration the Fund’s strong investment performance for the five-year and
| | THE GUGGENHEIM FUNDS ANNUAL REPORT | 27 |
OTHER INFORMATION (Unaudited)(continued) |
three-year periods ended December 31, 2018. In addition, the Committee noted the Adviser’s statement that the net effective management fee includes 0.08% in administration fees that is not paid to the Adviser. The Committee also took into account the Fund’s currently effective expense limitation agreement with the Adviser.
With respect to the costs of services provided and profits realized by Guggenheim Investments from its relationship with the Funds, the Committee reviewed a profitability analysis and data from management for each Fund setting forth the average assets under management for the twelve months ended December 31, 2018, gross revenues received by Guggenheim Investments, expenses allocated to the Fund, expense waivers (as applicable), earnings and the operating margin/profitability rate, including variance information relative to the foregoing amounts as of December 31, 2017. In addition, the Chief Financial Officer of Guggenheim Investments reviewed with, and addressed questions from, the Committee concerning the expense allocation methodology employed in producing the profitability analysis.
In the course of its review of Guggenheim Investments’ profitability, the Committee took into account the methods used by Guggenheim Investments to determine expenses and profit. The Committee considered all of the foregoing in evaluating the costs of services provided, the profitability to Guggenheim Investments and the profitability rates presented, and concluded that the profits were not unreasonable.
The Committee considered other benefits available to each Adviser because of its relationship with the Funds and noted Guggenheim’s statement that it does not believe the Advisers derive any such “fall-out” benefits. In this regard, the Committee noted Guggenheim’s statement that, although it does not consider such benefits to be fall-out benefits, the Advisers may benefit from marketing synergies arising from offering a broad spectrum of products, including the Funds.
Economies of Scale: The Committee received and considered information regarding whether there have been economies of scale with respect to the management of the Funds as Fund assets grow, whether the Funds have appropriately benefited from any economies of scale, and whether there is potential for realization of any further economies of scale. The Committee considered whether economies of scale in the provision of services to the Funds were being passed along to the shareholders. The Committee noted the Adviser’s statements, including that Guggenheim believes it is appropriately sharing potential economies of scale and that costs continue to increase in many key areas, including compensation of portfolio managers, key analysts and support staff, as well as for infrastructure needs, with respect to risk management oversight, valuation processes and disaster recovery systems, among other things, and that, in this regard, management’s costs for providing services have increased in recent years without regard to asset levels.
The Committee also noted the process employed by the Adviser to evaluate whether it would be appropriate to institute a new breakpoint for a Fund, with consideration given to, among other things: (i) the Fund’s size and trends in asset levels over recent years; (ii) the competitiveness of the expense levels; (iii) whether expense waivers are in place; (iv) changes and trends in revenue and expenses; (v) whether there are any anticipated expenditures that may benefit the Fund in the future; (vi) Fund profit level margins; (vii) relative Fund performance; (viii) the nature, extent and quality of services management provides to the Fund; and (ix) the complexity of the Fund’s investment strategy and the resources required to support the Fund.
As part of its assessment of economies of scale, the Committee also considered Guggenheim’s view that it seeks to share economies of scale through a number of means, including breakpoints, advisory fees set at competitive rates pre-assuming future asset growth, expense waivers and limitations, and investments in personnel, operations and infrastructure to support the Fund business. Thus, the Committee considered the size of the Funds and the competitiveness of and/or other determinations made regarding the current advisory fee for each Fund, as well as whether a Fund is subject to an expense limitation.
Based on the foregoing, the Committee determined that the advisory fee for each Fund was reasonable.
Sub-Advisory Agreement
Nature, Extent and Quality of Services Provided by the Sub-Adviser: As noted above, because both the Adviser and Sub-Adviser for Municipal Income Fund—Security Investors and GPIM, respectively—are part of and do business as Guggenheim Investments and the services provided by the Adviser on the one hand and the Sub-Adviser on the other cannot be ascribed to distinct legal entities, the Committee did not evaluate the services provided under the Advisory Agreement and Sub-Advisory Agreement separately. Therefore, the Committee considered the qualifications, experience and skills of the Fund’s portfolio management team in connection with the Committee’s evaluation of Guggenheim’s investment professionals under the applicable Advisory Agreement.
28 | THE GUGGENHEIM FUNDS ANNUAL REPORT | |
OTHER INFORMATION (Unaudited)(concluded) |
With respect to Guggenheim’s resources and the Sub-Adviser’s ability to carry out its responsibilities under the Sub-Advisory Agreement, as noted above, the Committee considered the financial condition of GPIMH and the various entities comprising Guggenheim Investments. (Thereafter, the Committee received the audited consolidated financial statements of GPIM.)
The Committee also considered the acceptability of the terms of the Sub-Advisory Agreement, including the scope of services required to be performed by the Sub-Adviser.
Investment Performance: The Committee considered the returns of the Fund under its evaluation of the Advisory Agreement.
Comparative Fees, Costs of Services Provided and the Profits Realized by the Sub-Adviser from Its Relationship with the Fund: The Committee considered that the Sub-Advisory Agreement is with an affiliate of the Adviser, that the Adviser compensates the Sub-Adviser from its own fees so that the sub-advisory fee rate for the Fund does not impact the fees paid by the Fund and that the Sub-Adviser’s revenues were included in the calculation of Guggenheim Investments’ profitability. Given its determination of the reasonableness of the advisory fee, the Committee concluded that the sub-advisory fee rate for the Fund was not unreasonable.
Economies of Scale: The Committee recognized that, because the Sub-Adviser’s fees are paid by the Adviser and not the Fund, the analysis of economies of scale was more appropriate in the context of the Committee’s consideration of the applicable Advisory Agreement, which was separately considered. (See “Advisory Agreements – Economies of Scale” above.)
Overall Conclusions
Based on the foregoing, the Committee determined that the investment advisory fees are fair and reasonable in light of the extent and quality of the services provided and other benefits received and that the continuation of each of the Agreements is in the best interest of each Fund. In reaching this conclusion, no single factor was determinative or conclusive and each Committee member, in the exercise of his business judgment, may afford different weights to different factors. At the May Meeting, the Committee, constituting all of the Independent Trustees, recommended the renewal of each Advisory Agreement and the Sub-Advisory Agreement for an additional annual term.
| | THE GUGGENHEIM FUNDS ANNUAL REPORT | 29 |
INFORMATION ON BOARD OF TRUSTEES AND OFFICERS (Unaudited) |
Name, Address* and
Year of Birth of Trustees | Position(s)
Held with
the Trust | Term of Office
and Length of
Time Served** | Principal Occupation(s)
During Past 5 Years | Number of
Portfolios
in Fund
Complex
Overseen | Other
Directorships
Held by Trustees |
INDEPENDENT TRUSTEES | | | |
Randall C. Barnes (1951) | Trustee | Since 2014 | Current: Private Investor (2001-present). Former: Senior Vice President and Treasurer, PepsiCo, Inc. (1993-1997); President, Pizza Hut International (1991-1993); Senior Vice President, Strategic Planning and New Business Development, PepsiCo, Inc. (1987-1990). | 158 | Current: Trustee, Purpose Investments Funds (2013-present). Former: Managed Duration Investment Grade Municipal Fund (2003-2016). |
Angela Brock-Kyle (1959) | Trustee | Since November 2019 | Current: Founder and Chief Executive Officer, B.O.A.R.D.S (consulting firm). Former: Senior Leader, TIAA (financial services firm) (1987-2012). | 157 | None. |
Donald A. Chubb, Jr. (1946) | Trustee and Chairman of the Valuation Oversight Committee | Since 1994 | Current: Retired. Former: Business broker and manager of commercial real estate, Griffith & Blair, Inc. (1997-2017). | 157 | Former: Midland Care, Inc. (2011-2016). |
Jerry B. Farley (1946) | Trustee and Chairman of the Audit Committee | Since 2005 | Current: President, Washburn University (1997-present). | 157 | Current: CoreFirst Bank & Trust (2000-present). Former: Westar Energy, Inc. (2004-2018). |
Roman Friedrich III (1946) | Trustee and Chairman of the Contracts Review Committee | Since 2014 | Current: Founder and Managing Partner, Roman Friedrich & Company (1998-present). | 157 | Former: Zincore Metals, Inc. (2009-January 2019). |
Thomas F. Lydon, Jr. (1960) | Trustee | Since November 2019 | Current: President, Global Trends Investments (registered investment adviser) (1996-present). | 157 | Current: US Global Investors (GROW) (1995-present); and Harvest Volatility Edge Trust (3) (2017-present). |
30 | THE GUGGENHEIM FUNDS ANNUAL REPORT | |
INFORMATION ON BOARD OF TRUSTEES AND OFFICERS (Unaudited)(continued) |
Name, Address* and
Year of Birth of Trustees | Position(s)
Held with
the Trust | Term of Office
and Length of
Time Served** | Principal Occupation(s)
During Past 5 Years | Number of
Portfolios
in Fund
Complex
Overseen | Other
Directorships
Held by Trustees |
INDEPENDENT TRUSTEES - concluded | | |
Ronald A. Nyberg (1953) | Trustee and Chairman of the Nominating and Governance Committee | Since 2014 | Current: Partner, Momkus LLC (2016-present). Former: Partner, Nyberg & Cassioppi, LLC (2000-2016); Executive Vice President, General Counsel, and Corporate Secretary, Van Kampen Investments (1982-1999). | 158 | Current: PPM Funds (9) (2018-present); Edward-Elmhurst Healthcare System (2012-present); Western Asset Inflation-Linked Opportunities & Income Fund (2004-present); Western Asset Inflation-Linked Income Fund (2003-present). Former: Managed Duration Investment Grade Municipal Fund (2003-2016). |
Sandra G. Sponem (1958) | Trustee | Since November 2019 | Current: Retired. Former: Senior Vice President and Chief Financial Officer, M.A. Mortenson Companies, Inc. (general contracting firm) (2007-2017). | 157 | Current: SPDR Series Trust (78) (2018-present); SPDR Index Shares Funds (31) (2018-present); SSGA Active Trust (12) (2018-present); and SSGA Master Trust (1) (2018-present). |
Ronald E. Toupin, Jr. (1958) | Trustee and Chairman of the Board | Since 2014 | Current: Portfolio Consultant (2010-present); Member, Governing Council, Independent Directors Council (2013-present); Governor, Board of Governors, Investment Company Institute (2018-present). Former: Member, Executive Committee, Independent Directors Council (2016-2018); Vice President, Manager and Portfolio Manager, Nuveen Asset Management (1998-1999); Vice President, Nuveen Investment Advisory Corp. (1992-1999); Vice President and Manager, Nuveen Unit Investment Trusts (1991-1999); and Assistant Vice President and Portfolio Manager, Nuveen Unit Investment Trusts (1988-1999), each of John Nuveen & Co., Inc. (1982-1999). | 157 | Current: Western Asset Inflation-Linked Opportunities & Income Fund (2004-present); Western Asset Inflation-Linked Income Fund (2003-present). Former: Managed Duration Investment Grade Municipal Fund (2003-2016). |
| | THE GUGGENHEIM FUNDS ANNUAL REPORT | 31 |
INFORMATION ON BOARD OF TRUSTEES AND OFFICERS (Unaudited)(continued) |
Name, Address* and
Year of Birth of Trustees | Position(s)
Held with
the Trust | Term of Office
and Length of
Time Served** | Principal Occupation(s)
During Past 5 Years | Number of
Portfolios
in Fund
Complex
Overseen | Other
Directorships
Held by Trustees |
INTERESTED TRUSTEE | |
Amy J. Lee*** (1961) | Trustee, Vice President and Chief Legal Officer | Since 2018 (Trustee) Since 2014 (Chief Legal Officer) Since 2007 (Vice President) | Current: Interested Trustee, certain other funds in the Fund Complex (2018-present); Chief Legal Officer, certain other funds in the Fund Complex (2014-present); Vice President, certain other funds in the Fund Complex (2007-present); Senior Managing Director, Guggenheim Investments (2012-present). Former: President and Chief Executive Officer (2017-2018); President, certain other funds in the Fund Complex (2017-November 2019); Vice President, Associate General Counsel and Assistant Secretary, Security Benefit Life Insurance Company and Security Benefit Corporation (2004-2012). | 157 | None. |
* | The business address of each Trustee is c/o Guggenheim Investments, 227 West Monroe Street, Chicago, Illinois 60606. |
** | Each Trustee serves an indefinite term, until his or her successor is elected and qualified. Time served includes time served in the respective position for the Predecessor Corporation. |
*** | This Trustee is deemed to be an “interested person” of the Funds under the 1940 Act by reason of her position with the Funds’ Investment Manager and/or the parent of the Investment Manager. |
32 | THE GUGGENHEIM FUNDS ANNUAL REPORT | |
INFORMATION ON BOARD OF TRUSTEES AND OFFICERS (Unaudited)(continued) |
Name, Address*
and Year of Birth | Position(s)
Held with
the Trust | Term of Office
and Length of
Time Served** | Principal Occupations
During Past 5 Years |
OFFICERS | | | |
Brian E. Binder (1972) | President and Chief Executive Officer | Since 2018 | Current: President and Chief Executive Officer, certain other funds in the Fund Complex (2018-present); President and Chief Executive Officer, Guggenheim Funds Investment Advisors, LLC and Security Investors, LLC (2018-present); Senior Managing Director and Chief Administrative Officer, Guggenheim Investments (2018-present). Former: Managing Director and President, Deutsche Funds, and Head of US Product, Trading and Fund Administration, Deutsche Asset Management (2013-2018); Managing Director, Head of Business Management and Consulting, Invesco Ltd. (2010-2012). |
James M. Howley (1972) | Assistant Treasurer | Since 2014 | Current: Managing Director, Guggenheim Investments (2004-present); Assistant Treasurer, certain other funds in the Fund Complex (2006-present). Former: Manager, Mutual Fund Administration of Van Kampen Investments, Inc. (1996-2004). |
Mark E. Mathiasen (1978) | Secretary | Since 2014 | Current: Secretary, certain other funds in the Fund Complex (2007-present); Managing Director, Guggenheim Investments (2007-present). |
Glenn McWhinnie (1969) | Assistant Treasurer | Since 2016 | Current: Vice President, Guggenheim Investments (2009-present); Assistant Treasurer, certain other funds in the Fund complex (2016-present). |
Michael P. Megaris (1984) | Assistant Secretary | Since 2014 | Current: Assistant Secretary, certain other funds in the Fund Complex (2014-present); Director, Guggenheim Investments (2012-present). |
Elisabeth Miller (1968) | Chief Compliance Officer | Since 2012 | Current: Chief Compliance Officer, certain other funds in the Fund Complex (2012-present); Senior Managing Director, Guggenheim Investments (2012-present); Vice President, Guggenheim Funds Distributors, LLC (2014-present). Former: Chief Compliance Officer, Security Investors, LLC (2012-2018); Chief Compliance Officer, Guggenheim Funds Investment Advisors, LLC (2012-2018); Chief Compliance Officer, Guggenheim Distributors, LLC (2009-2014); Senior Manager, Security Investors, LLC (2004-2014); Senior Manager, Guggenheim Distributors, LLC (2004-2014). |
Margaux Misantone (1978) | AML Officer | Since 2017 | Current: Chief Compliance Officer, Security Investors, LLC and Guggenheim Funds Investment Advisors, LLC (2018-present); AML Officer, Security Investors, LLC and certain other funds in the Fund Complex (2017-present); Managing Director, Guggenheim Investments (2015-present). Former: Assistant Chief Compliance Officer, Security Investors, LLC and Guggenheim Funds Investments Advisors, LLC (2015-2018). |
Adam J. Nelson (1979) | Assistant Treasurer | Since 2015 | Current: Vice President, Guggenheim Investments (2015-present); Assistant Treasurer, certain other funds in the Fund Complex (2015-present). Former: Assistant Vice President and Fund Administration Director, State Street Corporation (2013-2015); Fund Administration Assistant Director, State Street (2011-2013); Fund Administration Manager, State Street (2009-2011). |
| | THE GUGGENHEIM FUNDS ANNUAL REPORT | 33 |
INFORMATION ON BOARD OF TRUSTEES AND OFFICERS (Unaudited)(concluded) |
Name, Address*
and Year of Birth | Position(s)
Held with
the Trust | Term of Office
and Length of
Time Served** | Principal Occupations
During Past 5 Years |
OFFICERS - concluded | |
Kimberly J. Scott (1974) | Assistant Treasurer | Since 2014 | Current: Director, Guggenheim Investments (2012-present); Assistant Treasurer, certain other funds in the Fund Complex (2012-present). Former: Financial Reporting Manager, Invesco, Ltd. (2010-2011); Vice President/Assistant Treasurer, Mutual Fund Administration for Van Kampen Investments, Inc./Morgan Stanley Investment Management (2009-2010); Manager of Mutual Fund Administration, Van Kampen Investments, Inc./Morgan Stanley Investment Management (2005-2009). |
Bryan Stone (1979) | Vice President | Since 2014 | Current: Vice President, certain other funds in the Fund Complex (2014-present); Managing Director, Guggenheim Investments (2013-present). Former: Senior Vice President, Neuberger Berman Group LLC (2009-2013); Vice President, Morgan Stanley (2002-2009). |
John L. Sullivan (1955) | Chief Financial Officer, Chief Accounting Officer and Treasurer | Since 2014 | Current: Chief Financial Officer, Chief Accounting Officer and Treasurer, certain other funds in the Fund Complex (2010-present); Senior Managing Director, Guggenheim Investments (2010-present). Former: Managing Director and Chief Compliance Officer, each of the funds in the Van Kampen Investments fund complex (2004-2010); Managing Director and Head of Fund Accounting and Administration, Morgan Stanley Investment Management (2002-2004); Chief Financial Officer and Treasurer, Van Kampen Funds (1996-2004). |
Jon Szafran (1989) | Assistant Treasurer | Since 2017 | Current: Vice President, Guggenheim Investments (2017-present); Assistant Treasurer, certain other funds in the Fund Complex (2017-present). Former: Assistant Treasurer of Henderson Global Funds and Manager of US Fund Administration, Henderson Global Investors (North America) Inc. (“HGINA”), (2017); Senior Analyst of US Fund Administration, HGINA (2014-2017); Senior Associate of Fund Administration, Cortland Capital Market Services, LLC (2013-2014); Experienced Associate, PricewaterhouseCoopers LLP (2012-2013). |
* | The business address of each officer is c/o Guggenheim Investments, 227 West Monroe Street, Chicago, Illinois 60606. |
** | Each officer serves an indefinite term, until his or her successor is duly elected and qualified. |
34 | THE GUGGENHEIM FUNDS ANNUAL REPORT | |
GUGGENHEIM INVESTMENTS PRIVACY NOTICE (Unaudited) |
Who We Are
This Privacy Notice describes the data protection practices of Guggenheim Investments. Guggenheim Investments as used herein refers to the affiliated investment management businesses of Guggenheim Partners, LLC: Guggenheim Funds Investment Advisors, LLC, Guggenheim Partners Investment Management, LLC, Guggenheim Funds Distributors, LLC, Security Investors, LLC, Guggenheim Investment Advisors (Europe) Limited, Guggenheim Real Estate, LLC, GS Gamma Advisors, LLC, Guggenheim Partners India Management, LLC, Guggenheim Partners Europe Limited, as well as the funds in the Guggenheim Funds complex (the “Funds”) (“Guggenheim Investments,” “we,” “us,” or “our”).
Guggenheim Partners Investment Management Holdings, LLC, located at 330 Madison Avenue, New York, New York 10017 is the data controller for your information. The affiliates who are also controllers of certain of your information are: Guggenheim Investment Advisors (Europe) Limited, Guggenheim Partners Europe Limited, Guggenheim Partners, LLC, Guggenheim Funds Investment Advisors, LLC, Guggenheim Partners Investment Management, LLC, Guggenheim Funds Distributors, LLC and Security Investors, LLC, as well as the Funds.
Our Commitment to You
Guggenheim Investments considers your privacy our utmost concern. When you become our client or investor, you entrust us with not only your hard-earned money but also with your personal and financial information. Because we have access to your private information, we hold ourselves to the highest standards in its safekeeping and use. We strictly limit how we share your information with others, whether you are a current or former Guggenheim Investments client or investor.
The Information We Collect About You
We collect certain nonpublic personal information about you from information you provide on applications, other forms, our website, and/or from third parties including investment advisors. This information includes Social Security or other tax identification number, assets, income, tax information, retirement and estate plan information, transaction history, account balance, payment history, bank account information, marital status, family relationships, information that we collect on our website through the use of “cookies,” and other personal information that you or others provide to us. We may also collect such information through your inquiries by mail, e-mail or telephone. We may also collect customer due diligence information, as required by applicable law and regulation, through third party service providers.
How We Handle Your Personal Information
The legal basis for using your information as set out in this Privacy Notice is as follows: (a) use of your personal data is necessary to perform our obligations under any contract with you (such as a contract for us to provide financial services to you); or (b) where use of your personal data is not necessary for performance of a contract, use of your personal data is necessary for our legitimate interests or the legitimate interests of others (for example, to enforce the legal terms governing our services, operate and market our website and other services we offer, ensure safe environments for our personnel and others, make and receive payments, prevent fraud and to know the customer to whom we are providing the services). Some processing is done to comply with applicable law.
In addition to the specific uses described above, we also use your information in the following manner:
| | ● | We use your information in connection with servicing your accounts. |
| | ● | We use information to respond to your requests or questions. For example, we might use your information to respond to your customer feedback. |
| | ● | We use information to improve our products and services. We may use your information to make our website and products better. We may use your information to customize your experience with us. |
| | ● | We use information for security purposes. We may use your information to protect our company and our customers. |
| | ● | We use information to communicate with you. For example, we will communicate with you about your account or our relationship. We may contact you about your feedback. We might also contact you about this Privacy Notice. We may also enroll you in our email newsletter. |
| | THE GUGGENHEIM FUNDS ANNUAL REPORT | 35 |
GUGGENHEIM INVESTMENTS PRIVACY NOTICE (Unaudited)(continued) |
| | ● | We use information as otherwise permitted by law, as we may notify you. |
| | ● | Aggregate/Anonymous Data. We may aggregate and/or anonymize any information collected through the website so that such information can no longer be linked to you or your device (“Aggregate/Anonymous Information”). We may use Aggregate/Anonymous Information for any purpose, including without limitation for research and marketing purposes, and may also share such data with any third parties, including advertisers, promotional partners, and sponsors. |
We do not sell information about current or former clients or their accounts to third parties. Nor do we share this information, except when necessary to complete transactions at your request, to make you aware of investment products and services that we or our affiliates offer, or as permitted or required by law.
We provide information about you to companies and individuals not affiliated with Guggenheim Investments to complete certain transactions or account changes, or to perform services for us related to your account. For example, if you ask to transfer assets from another financial institution to Guggenheim Investments, we must provide certain information about you to that company to complete the transaction. We provide the third party with only the information necessary to carry out its responsibilities and only for that purpose. And we require these third parties to treat your private information with the same high degree of confidentiality that we do. To alert you to other Guggenheim Investments products and services, we share your information within our family of affiliated companies. You may limit our sharing with affiliated companies as set out below. We may also share information with any successor to all or part of our business, or in connection with steps leading up to a merger or acquisition. For example, if part of our business was sold we may give customer information as part of that transaction. We may also share information about you with your consent.
We will release information about you if you direct us to do so, if we are compelled by law to do so, or in other circumstances as permitted by law (for example, to protect your account from fraud).
If you close your account(s) or become an inactive client or investor, we will continue to adhere to the privacy policies and practices described in this notice.
Opt-Out Provisions and Your Data Choices
The law allows you to “opt out” of certain kinds of information sharing with third parties. We do not share personal information about you with any third parties that triggers this opt-out right. This means YOU ARE ALREADY OPTED OUT.
When you are no longer our client or investor, we continue to share your information as described in this notice, and you may contact us at any time to limit our sharing by sending an email to CorporateDataPrivacy@GuggenheimPartners.com.
European Union Data Subjects and certain others: In addition to the choices set forth above, residents of the European Union and certain other jurisdictions have certain rights to (1) request access to or rectification or deletion of information we collect about them, (2) request a restriction on the processing of their information, (3) object to the processing of their information, or (4) request the portability of certain information. To exercise these or other rights, please contact us using the contact information below. We will consider all requests and provide our response within the time period stated by applicable law. Please note, however, that certain information may be exempt from such requests in some circumstances, which may include if we need to keep processing your information for our legitimate interests or to comply with a legal obligation. We may request you provide us with information necessary to confirm your identity before responding to your request.
Residents of France and certain other jurisdictions may also provide us with instructions regarding the manner in which we may continue to store, erase and share your information after your death, and where applicable, the person you have designated to exercise these rights after your death.
How We Protect Privacy Online
We take steps to protect your privacy when you use our web site – www.guggenheiminvestments.com – by using secure forms of online communication, including encryption technology, Secure Socket Layer (SSL) protocol, firewalls and user names and passwords. These safeguards vary based on the sensitivity of the information that we collect and store. However, we cannot and do not guarantee that these measures will prevent every unauthorized attempt to access, use, or disclose your information since despite our efforts, no Internet and/or other
36 | THE GUGGENHEIM FUNDS ANNUAL REPORT | |
GUGGENHEIM INVESTMENTS PRIVACY NOTICE (Unaudited)(concluded) |
electronic transmissions can be completely secure. Our web site uses “http cookies”—tiny pieces of information that we ask your browser to store. We use cookies for session management and security features on the Guggenheim Investments web site. We do not use them to pull data from your hard drive, to learn your e-mail address, or to view data in cookies created by other web sites. We will not share the information in our cookies or give others access to it. See the legal information area on our web site for more details about web site security and privacy features.
How We Safeguard Your Personal Information and Data Retention
We restrict access to nonpublic personal information about you to our employees and in some cases to third parties (for example, the service providers described above) as permitted by law. We maintain strict physical, electronic and procedural safeguards that comply with federal standards to guard your nonpublic personal information.
We keep your information for no longer than necessary for the purposes for which it is processed. The length of time for which we retain information depends on the purposes for which we collected and use it and/or as required to comply with applicable laws. Information may persist in copies made for backup and business continuity purposes for additional time.
International Visitors
If you are not a resident of the United States, please be aware that your information may be transferred to, stored and processed in the United States where our servers are located and our databases are operated. The data protection and other laws of the United States and other countries might not be as comprehensive as those in your country.
In such cases, we ensure that a legal basis for such a transfer exists and that adequate protection is provided as required by applicable law, for example, by using standard contractual clauses or by transferring your data to a jurisdiction that has obtained an adequacy finding. Individuals whose data may be transferred on the basis of standard contractual clauses may contact us as described below.
We’ll Keep You Informed
If you have any questions or concerns about how we treat your personal data, we encourage you to consult with us first. You may also contact the relevant supervisory authority.
We reserve the right to modify this policy at any time and will inform you promptly of material changes. You may access our privacy policy from our web site at www.guggenheiminvestments.com. Should you have any questions regarding our privacy policy, contact us by email at CorporateDataPrivacy@GuggenheimPartners.com.
| | THE GUGGENHEIM FUNDS ANNUAL REPORT | 37 |
9.30.2019
Guggenheim Funds Annual Report
|
Guggenheim Macro Opportunities Fund | | |
Beginning on January 1, 2021, paper copies of the Fund’s annual and semi-annual shareholder reports may no longer be sent by mail, unless you specifically request paper copies of the reports from a Fund or from your financial intermediary. Instead, the reports will be made available on a website, and you will be notified by mail each time a report is posted and provided with a website link to access the report.
If you already elected to receive shareholder reports electronically, you will not be affected by this change and you need not take any action. At any time, you may elect to receive reports and other communications from a Fund electronically by calling 800.820.0888, going to GuggenheimInvestments.com/myaccount, or by contacting your financial intermediary.
You may elect to receive all future shareholder reports in paper free of charge. If you hold shares of a Fund directly, you can inform the Fund that you wish to receive paper copies of reports by calling 800.820.0888. If you hold shares of a Fund through a financial intermediary, please contact the financial intermediary to make this election. Your election to receive reports in paper will apply to all Guggenheim Funds in which you are invested and may apply to all funds held with your financial intermediary.
GuggenheimInvestments.com | MO-ANN-0919x0920 |

| | |
DEAR SHAREHOLDER | 2 |
ECONOMIC AND MARKET OVERVIEW | 4 |
ABOUT SHAREHOLDERS’ FUND EXPENSES | 6 |
MACRO OPPORTUNITIES FUND | 9 |
NOTES TO CONSOLIDATED FINANCIAL STATEMENTS | 80 |
REPORT OF INDEPENDENT REGISTERED PUBLIC ACCOUNTING FIRM | 108 |
OTHER INFORMATION | 110 |
INFORMATION ON BOARD OF TRUSTEES AND OFFICERS | 124 |
GUGGENHEIM INVESTMENTS PRIVACY NOTICE | 131 |
| | THE GUGGENHEIM FUNDS ANNUAL REPORT | 1 |
Dear Shareholder:
Guggenheim Partners Investment Management, LLC (“GPIM” or the “Investment Adviser”), is pleased to present the shareholder report for Guggenheim Macro Opportunities Fund (the “Fund”) for the annual fiscal period ended September 30, 2019.
The Investment Adviser is part of Guggenheim Investments, which represents the investment management businesses of Guggenheim Partners, LLC (“Guggenheim”), a global, diversified financial services firm.
Guggenheim Funds Distributors, LLC, is the distributor of the Funds. Guggenheim Funds Distributors, LLC, is affiliated with Guggenheim and the Investment Adviser.
We encourage you to read the Economic and Market Overview section of the report, which follows this letter, and then the Managers’ Commentary for the Fund.
We are committed to providing innovative investment solutions and appreciate the trust you place in us.
Sincerely,
Guggenheim Partners Investment Management, LLC
October 31, 2019
Read a prospectus and summary prospectus (if available) carefully before investing. It contains the investment objectives, risks, charges, expenses and other information, which should be considered carefully before investing. Obtain a prospectus and summary prospectus (if available) at guggenheiminvestments.com or call 800.820.0888.
This material is not intended as a recommendation or as investment advice of any kind, including in connection with rollovers, transfers, and distributions. Such material is not provided in a fiduciary capacity, may not be relied upon for or in connection with the making of investment decisions, and does not constitute a solicitation of an offer to buy or sell securities. All content has been provided for informational or educational purposes only and is not intended to be and should not be construed as legal or tax advice and/or a legal opinion. Always consult a financial, tax and/ or legal professional regarding your specific situation.
2 | THE GUGGENHEIM FUNDS ANNUAL REPORT | |
Macro Opportunities Fund may not be suitable for all investors. ● The Fund’s market value will change in response to interest rate changes and market conditions among other factors. In general, bond prices rise when interest rates fall and vice versa. ● The Fund’s exposure to high yield securities may subject the Fund to greater volatility. ● The intrinsic value of the underlying stocks in which the Fund invests may never be realized or the stock may decline in value. ● When market conditions are deemed appropriate, the Fund may use leverage to the full extent permitted by its investment policies and restrictions and applicable law. Leveraging will exaggerate the effect on net asset value of any increase or decrease in the market value of the Fund’s portfolio. ● The use of short selling involves increased risks and costs. You risk paying more for a security than you received from its sale. Theoretically, stocks sold short have the risk of unlimited losses. ● The Fund may invest in derivative instruments, which may be more volatile and less liquid, increasing the risk of loss when compared to traditional securities. Certain of the derivative instruments are also subject to the risks of counterparty default and adverse tax treatment. ● Instruments and strategies (such as borrowing transactions and reverse repurchase agreements) may provide leveraged exposure to a particular investment, which will magnify any gains or losses on those investments. ● Investments in reverse repurchase agreements expose the Fund to the many of the same risks as investments in derivatives. ● The Fund’s investments in other investment vehicles subject the Fund to those risks and expenses affecting the investment vehicle. ● The Fund’s investments in foreign securities carry additional risks when compared to U.S. securities, due to the impact of diplomatic, political or economic developments in the country in question (investments in emerging markets securities are generally subject to an even greater level of risks). ● Investments in syndicated bank loans generally offer a floating interest rate and involve special types of risks. ● A highly liquid secondary market may not exist for the commodity-linked structured notes the Fund invests in, and there can be no assurance that a highly liquid secondary market will develop. ● The Fund’s exposure to the commodity markets may subject the Fund to greater volatility as commodity-linked investments may be affected by changes in overall market movements, commodity index volatility, changes in interest rates or factors affecting a particular industry or commodity such as droughts, floods, weather, embargos, tariffs and international economic, political and regulatory developments. ● The Fund’s investments in municipal securities can be affected by events that affect the municipal bond market. ● The Fund’s investments in real estate securities subject the Fund to the same risks as direct investments in real estate, which is particularly sensitive to economic downturns. ● The Fund’s investments in restricted securities may involve financial and liquidity risk. ● You may have a gain or loss when you sell your shares. ● It is important to note that the Fund is not guaranteed by the U.S. government. ● This Fund is considered nondiversified and can invest a greater portion of its assets in securities of individual issuers than a diversified fund. As a result, changes in the market value of a single security could cause greater fluctuations in the value of fund shares than would occur in a more diversified fund. ● Please read the prospectus for more detailed information regarding these and other risks.
| | THE GUGGENHEIM FUNDS ANNUAL REPORT | 3 |
ECONOMIC AND MARKET OVERVIEW (Unaudited) | September 30, 2019 |
Economic data has been mixed over the past few months. On the positive side, we saw a pickup in the housing market as measured by housing starts and home sales, which could be a delayed response to lower mortgage rates. Industrial production had the strongest month-over-month gain in a year, partially boosted by an increase in oil production in Hurricane Barry’s wake. The unemployment rate fell to a 50-year low of 3.5% in September 2019, despite a continued moderation in payroll gains.
On the negative side, the Institute for Supply Management (“ISM”) Manufacturing Index plunged to the weakest reading since June 2009. The ISM Non-Manufacturing Index also came in well below expectations, the lowest since August 2016. Within both the manufacturing and non-manufacturing ISM indexes, analysts look at the employment component of the survey for an early read on other labor market indicators. Here we find more cause for concern: The non-manufacturing survey’s employment component is now barely above 50 while the manufacturing employment sub-index stands at 46.3, well into contraction territory. Combined, the outlook for output and hiring has dimmed, signaling trouble ahead for consumers.
Retail sales have been steady, but Commerce Department data showed that total consumer spending on goods and services increased only 0.1% month-over-month in August 2019, the smallest gain in six months. It is hard to identify the primary reason why consumers may already be turning more conservative on spending. Income growth looks steady, the equity market is higher year-to-date, and rates are lower, all of which should be boosting consumer confidence. Sentiment surveys, however, show that fewer consumers believe now is a good time to buy homes, vehicles, and household durables, and headline consumer confidence measures have ticked down. We believe trade policy and political concerns are weighing on sentiment, and these headwinds are set to ramp up further. Additional U.S. tariffs on China are due to take effect on December 15, 2019, and the U.S. House of Representatives is pressing forward with its impeachment inquiry into President Trump.
Guggenheim’s dashboard of U.S. recession indicators continues to point to a recession beginning as early as the first half of 2020, and we think the economic data is corroborating this view. Two of the more notable indicators pointing to high recession risk are the three-month/10-year U.S. Treasury yield curve, which has been inverted for 16 consecutive weeks through period end, and the Leading Economic Indicators Index which has slowed from a year-over-year growth rate of 6.6% in September 2018 to 1.1% as of August 2019. The indicators Guggenheim tracks as part of our recession probability model indicate a nearly 50% chance that a recession will come before mid-2020, and a 70% chance that it will arrive by mid-2021.
Over the period, the U.S. Treasury curve continued its overall flattening trend, as the difference between the two-year U.S. Treasury and 10-year U.S. Treasury narrowed to 5 basis points. Equity markets remained volatile, buoyed by a 25 basis point cut in July and September 2019 by the U.S. Federal Reserve (the “Fed”) and relatively strong U.S. economic data, but weighed down by trade war uncertainty and fears of a global slowdown.
4 | THE GUGGENHEIM FUNDS ANNUAL REPORT | |
ECONOMIC AND MARKET OVERVIEW (Unaudited)(concluded) | September 30, 2019 |
With downside risks growing, markets have become more sensitive to the Fed’s communications about the future stance of monetary policy. Despite the two rate cuts, Fed policymakers are deeply divided. It is still unclear whether the Fed will deliver the aggressive and preemptive policy action that would prolong the current expansion.
As it relates to risk-taking, we are not confident that the Fed would succeed in easing credit conditions if conditions were to tighten materially. The Fed may act too late, or its actions may have little impact given that low rates this year have largely failed to stimulate growth. With credit spreads still relatively tight on a historical basis, we believe it is prudent to remain up in quality as we await better opportunities to deploy capital in riskier credit sectors in the coming downturn.
For the 12-month period ended September 30, 2019, the Standard & Poor’s 500® (“S&P 500”) Index* returned 4.25%. The MSCI Europe-Australasia-Far East (“EAFE”) Index* returned -0.82%. The return of the MSCI Emerging Markets Index* was -1.63%.
In the bond market, the Bloomberg Barclays U.S. Aggregate Bond Index* posted a 10.30% return for the period, while the Bloomberg Barclays U.S. Corporate High Yield Index* returned 6.36%. The return of the ICE Bank of America (“BofA”) Merrill Lynch 3-Month U.S. Treasury Bill Index* was 2.39% for the 12-month period.
The opinions and forecasts expressed may not actually come to pass. This information is subject to change at any time, based on market and other conditions, and should not be construed as a recommendation of any specific security or strategy.
*Index Definitions
Indices are unmanaged and not available for direct investment. Index performance does not reflect transaction costs, fees, or expenses.
Bloomberg Barclays U.S. Aggregate Bond Index is a broad-based flagship benchmark that measures the investment grade, U.S. dollar-denominated, fixed-rate taxable bond market, including U.S. Treasuries, government-related and corporate securities, mortgage-backed securities or “MBS” (agency fixed-rate and hybrid adjustable-rate mortgage, or “ARM”, pass-throughs), asset-backed securities (“ABS”), and commercial mortgage-backed securities (“CMBS”) (agency and non-agency).
Bloomberg Barclays U.S. Corporate High Yield Index measures the U.S. dollar-denominated, high yield, fixed-rate corporate bond market. Securities are classified as high yield if the middle rating of Moody’s, Fitch, and S&P is Ba1/BB +/BB + or below.
ICE BofA Merrill Lynch 3-Month U.S. Treasury Bill Index is an unmanaged market Index of U.S. Treasury securities maturing in 90 days that assumes reinvestment of all income.
MSCI EAFE Index is a capitalization-weighted measure of stock markets in Europe, Australasia, and the Far East.
MSCI Emerging Markets Index is a free float-adjusted market capitalization-weighted index that is designed to measure equity market performance in the global emerging markets.
S&P 500® is a broad-based index, the performance of which is based on the performance of 500 widely held common stocks chosen for market size, liquidity, and industry group representation.
| | THE GUGGENHEIM FUNDS ANNUAL REPORT | 5 |
ABOUT SHAREHOLDERS’ FUND EXPENSES (Unaudited) |
All mutual funds have operating expenses, and it is important for our shareholders to understand the impact of costs on their investments. Shareholders of a fund incur two types of costs: (i) transaction costs, including sales charges (loads) on purchase payments, reinvested dividends, other distributions, and exchange fees, and (ii) ongoing costs, including management fees, administrative services, and shareholder reports, among others. These ongoing costs, or operating expenses, are deducted from a fund’s gross income and reduce the investment return of the fund.
A fund’s expenses are expressed as a percentage of its average net assets, which is known as the expense ratio. The following examples are intended to help investors understand the ongoing costs (in dollars) of investing in a fund and to compare these costs with the ongoing costs of investing in other mutual funds.
The examples are based on an investment of $1,000 made at the beginning of the period and held for the entire six-month period beginning March 31, 2019 and ending September 30, 2019.
The following tables illustrate the Fund’s costs in two ways:
Table 1. Based on actual Fund return: This section helps investors estimate the actual expenses paid over the period. The “Ending Account Value” shown is derived from the Fund’s actual return, and the fifth column shows the dollar amount that would have been paid by an investor who started with $1,000 in the Fund. Investors may use the information here, together with the amount invested, to estimate the expenses paid over the period. Simply divide the Fund’s account value by $1,000 (for example, an $8,600 account value divided by $1,000 = 8.6), then multiply the result by the number provided under the heading “Expenses Paid During Period.”
Table 2. Based on hypothetical 5% return: This section is intended to help investors compare a Fund’s cost with those of other mutual funds. The table provides information about hypothetical account values and hypothetical expenses based on the Fund’s actual expense ratio and an assumed rate of return of 5% per year before expenses, which is not the Fund’s actual return. The hypothetical account values and expenses may not be used to estimate the actual ending account balance or expenses paid during the period. The example is useful in making comparisons because the U.S. Securities and Exchange Commission (the “SEC”) requires all mutual funds to calculate expenses based on the 5% return. Investors can assess a Fund’s costs by comparing this hypothetical example with the hypothetical examples that appear in shareholder reports of other funds.
The calculations illustrated above assume no shares were bought or sold during the period. Actual costs may have been higher or lower, depending on the amount of investment and the timing of any purchases or redemptions.
6 | THE GUGGENHEIM FUNDS ANNUAL REPORT | |
ABOUT SHAREHOLDERS’ FUND EXPENSES (Unaudited)(continued) |
Please note that the expenses shown in the table are meant to highlight your ongoing costs only and do not reflect any transactional costs, such as sales charges (loads) on purchase payments, and contingent deferred sales charges (“CDSC”) on redemptions, if any. Therefore, the second table is useful in comparing ongoing costs only, and will not help you determine the relative total costs of owning different funds. In addition, if these transactional costs were included, your costs would have been higher.
More information about the Fund’s expenses, including annual expense ratios for periods up to five years (subject to the Fund’s inception date), can be found in the Financial Highlights section of this report. For additional information on operating expenses and other shareholder costs, please refer to the Fund’s prospectus.
| | THE GUGGENHEIM FUNDS ANNUAL REPORT | 7 |
ABOUT SHAREHOLDERS’ FUND EXPENSES (Unaudited)(concluded) |
| Expense
Ratio1 | Fund
Return | Beginning
Account Value
March 31,
2019 | Ending
Account Value
September 30,
2019 | Expenses
Paid During
Period2 |
Table 1. Based on actual Fund return3 |
A-Class | 1.40% | 1.06% | $ 1,000.00 | $ 1,010.60 | $ 7.06 |
C-Class | 2.15% | 0.65% | 1,000.00 | 1,006.50 | 10.81 |
P-Class | 1.40% | 1.03% | 1,000.00 | 1,010.30 | 7.06 |
Institutional Class | 0.99% | 1.23% | 1,000.00 | 1,012.30 | 4.99 |
R6-Class | 0.99% | 1.25% | 1,000.00 | 1,012.50 | 4.99 |
|
Table 2. Based on hypothetical 5% return (before expenses) |
A-Class | 1.40% | 5.00% | $ 1,000.00 | $ 1,018.05 | $ 7.08 |
C-Class | 2.15% | 5.00% | 1,000.00 | 1,014.29 | 10.86 |
P-Class | 1.40% | 5.00% | 1,000.00 | 1,018.05 | 7.08 |
Institutional Class | 0.99% | 5.00% | 1,000.00 | 1,020.10 | 5.01 |
R6-Class | 0.99% | 5.00% | 1,000.00 | 1,020.10 | 5.01 |
1 | This ratio represents annualized net expenses, which may include short interest expense. Excluding these expenses, the operating expense ratios for the Fund would be 1.34%, 2.09%, 1.33%, 0.92% and 0.92% for the A-Class, C-Class, P-Class, Institutional Class and R6-Class, respectively. Excludes expenses of the underlying funds in which the Fund invests. |
2 | Expenses are equal to the Fund’s annualized expense ratio, net of any applicable fee waivers, multiplied by the average account value over the period, multiplied by 183/365 (to reflect the one-half year period). |
3 | Actual cumulative return at net asset value for the period March 31, 2019 to September 30, 2019. |
8 | THE GUGGENHEIM FUNDS ANNUAL REPORT | |
MANAGERS’ COMMENTARY (Unaudited) | September 30, 2019 |
To Our Shareholders
Guggenheim Macro Opportunities Fund (the “Fund”) is managed by a team of seasoned professionals, including B. Scott Minerd, Chairman of Investments and Global Chief Investment Officer; Anne B. Walsh, Senior Managing Director and Chief Investment Officer, Fixed Income; Kevin H. Gundersen, Senior Managing Director and Portfolio Manager; Steven H. Brown, CFA, Senior Managing Director and Portfolio Manager; and Adam J. Bloch, Managing Director and Portfolio Manager. In the following paragraphs, the investment team discusses the market environment and the Fund’s performance for the fiscal year ended September 30, 2019.
For the one year period ended September 30, 2019, Guggenheim Macro Opportunities Fund (A shares) returned 0.41%1, compared with the 2.39% return of its benchmark, the ICE Bank of America Merrill Lynch 3-Month U.S. Treasury Bill Index.
The Fund seeks to provide total return, comprised of current income and capital appreciation. Unconstrained to a benchmark, the Fund has the flexibility to invest across a broad array of fixed income securities, as well as equities, commodities, and alternative investments.
The trailing twelve-month period ended September 30, 2019, faced bouts of uncertainty and volatility as trade tensions, global economic headwinds, shifts in monetary policy, and a corporate earnings slowdown jolted financial markets. From the start, the fourth quarter of 2018 raised concerns across global markets, causing risk-assets to decline as investors sought safety. The S&P 500, high yield, and bank loan indices were off -13.52%, -4.53%, and -3.08% in the fourth quarter, respectively, in line with our previously expressed concerns that spreads could widen. We entered fourth quarter of 2018 defensively positioned, with limited below investment grade exposure, credit hedges in place, and healthy liquidity reserves, all of which helped the Fund to hold-in well versus various credit indices with a -1.11% return for the fourth quarter.
In response to fourth quarter’s market upheaval, the U.S. Federal Reserve (the “Fed”) pivoted from its tightening policy stance and informed markets it would be patient in assessing further interest rate hikes. As 2019 progressed, the Fed recalibrated its approach to sustain the current economic expansion. In total, the Fed increased rates by a quarter of a percentage point one time in December 2018 but later decreased rates by a quarter of a percentage point in each July and September 2019. The Fed’s dovish turn and the low global interest-rate environment supported risk assets in 2019 as credit spreads generally tightened for the remainder of the period.
Our Macroeconomic and Investment Research continued to reinforce a heightened chance that the U.S. economy could be in the later stages of the current credit cycle. Elevated levels of corporate indebtedness combined with deteriorating macroeconomic metrics and relatively tight prevailing credit spreads informed us that investors were not being adequately compensated to take risk in credit. As a result, over the course of the past twelve months, we continued to proactively shift the portfolio to a more defensive stance. As spreads and yields grinded tighter, we used the moves as opportunities to shift the portfolio up in credit quality, reduce spread duration, and maintain ample liquidity. For the one-year period, the Fund reduced spread duration to 0.7 years from 2.5 years.
| | THE GUGGENHEIM FUNDS ANNUAL REPORT | 9 |
MANAGERS’ COMMENTARY (Unaudited)(concluded) | September 30, 2019 |
The Fund’s allocation to structured credit, specifically collateralized loan obligations (“CLOs”) and commercial asset-backed securities (“ABS”), contributed positively to returns as these securities provided attractive and stable income. Moreover, the Fund’s allocation to Non-Agency residential mortgage-backed securities (“RMBS”) generated positive absolute return with roughly equal contribution coming from carry and interest rate exposure. Carry refers to the income received from portfolio investments over a defined period. Supportive housing fundamentals, a strong labor market, and shrinking outstanding supply of pre-crisis RMBS reinforced investor demand throughout the period.
The Fund held a high allocation to short-term investments to prioritize capital preservation, preserve optionality, and maintain sufficient liquidity in light of heightened uncertainty. Within short-term investments, the Fund employed foreign sovereign asset swaps which allowed the Fund to earn additional yield in non-U.S. sovereign securities relative to maturity-equivalent U.S. government securities while hedging the non-U.S. currency exposure. The enhanced carry contributed positively to total return.
Duration contributed to performance over the period, while credit hedges were the primary detractor to performance. The Fund maintained a short-risk position in Investment Grade credit default swaps to protect the portfolio in the event Investment Grade corporate credit spreads widen. In recent years, corporate leverage ratios have continued to move higher suggesting that any economic slowdown could expose the weaknesses inherent in corporate balance sheets.
The Fund may invest in certain of the underlying series of Guggenheim Funds Trust and Guggenheim Strategy Funds Trust, including Guggenheim Ultra Short Duration Fund (effective November 30, 2018, Guggenheim Strategy Fund I was reorganized with and into the Guggenheim Ultra Short Duration Fund), Guggenheim Strategy Fund II, and Guggenheim Strategy Fund III, (collectively, the “Short Term Investment Vehicles”), each of which are open-end management investment companies managed by Guggenheim Investments. The Short Term Investment Vehicles, which launched on March 11, 2014, are offered as short term investment options only to mutual funds, trusts, and other accounts managed by Guggenheim Investments and/or its affiliates, and are not available to the public, with the exception of Guggenheim Ultra Short Duration Fund, which is available to the public. Guggenheim Strategy Fund II and Guggenheim Strategy Fund III do not charge an investment management fee. Guggenheim Ultra Short Duration Fund charges an investment management fee but that fee is waived by the respective investee fund. For the one-year period ended September 30, 2019, investment in the Short Term Investment Vehicles benefited Fund performance.
Performance displayed represents past performance which is no guarantee of future results.
1 | Performance figures are based on Class A shares and do not reflect deduction of the sales charges or taxes that a shareholder would pay on distributions or the redemption of shares. |
The opinions and forecast expressed may not actually come to pass. This information is subject to change at any time, based on market and other conditions, and should not be construed as a recommendation of any specific security or strategy.
10 | THE GUGGENHEIM FUNDS ANNUAL REPORT | |
PERFORMANCE REPORT AND FUND PROFILE (Unaudited) | September 30, 2019 |
MACRO OPPORTUNITIES FUND
OBJECTIVE: Seeks to provide total return, comprised of current income and capital appreciation.
Holdings Diversification (Market Exposure as % of Net Assets)
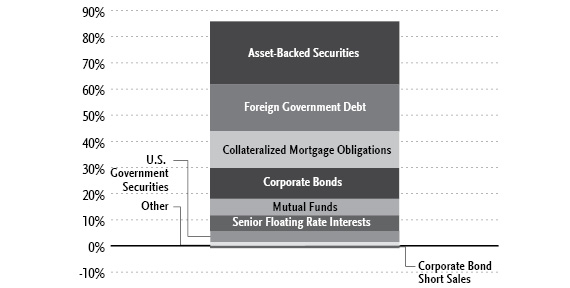
“Holdings Diversification (Market Exposure as % of Net Assets)” excludes any temporary cash investments, investments in Guggenheim Strategy Funds Trust mutual funds, or investments in Guggenheim Ultra Short Duration Fund.
Inception Dates: |
A-Class | November 30, 2011 |
C-Class | November 30, 2011 |
P-Class | May 1, 2015 |
Institutional Class | November 30, 2011 |
R6-Class | March 13, 2019 |
Ten Largest Holdings (% of Total Net Assets) |
Guggenheim Limited Duration Fund — R6-Class | 4.9% |
U.S. Treasury Notes, 2.38% | 3.1% |
Government of Japan, 01/10/20 | 1.9% |
Government of Japan, 0.10% | 1.8% |
Guggenheim Strategy Fund II | 1.6% |
Government of Japan, 01/20/20 | 1.5% |
Guggenheim Ultra Short Duration Fund — Institutional Class | 1.5% |
State of Israel, 1.00% | 1.4% |
Federative Republic of Brazil, 07/01/20 | 1.4% |
Guggenheim Strategy Fund III | 1.3% |
Top Ten Total | 20.4% |
| | |
“Ten Largest Holdings” excludes any temporary cash or derivative investments. |
| | THE GUGGENHEIM FUNDS ANNUAL REPORT | 11 |
PERFORMANCE REPORT AND FUND PROFILE (Unaudited)(continued) | September 30, 2019 |
Portfolio Composition by Quality Rating1 |
Rating | % of Total
Investments |
Fixed Income Instruments | |
AAA | 11.6% |
AA | 7.6% |
A | 21.7% |
BBB | 13.6% |
BB | 5.4% |
B | 3.9% |
CCC | 3.2% |
CC | 4.9% |
C | 0.3% |
D | 0.1% |
NR2 | 7.0% |
Other Instruments | 20.7% |
Total Investments | 100.0% |
1 | Source: BlackRock Solutions. Credit quality ratings are measured on a scale that generally ranges from AAA (highest) to D (lowest). All securities except for those labeled “NR” have been rated by Moody’s, Standard & Poor’s (“S&P”), or Fitch, each of which is a Nationally Recognized Statistical Rating Organization (“NRSRO”). For purposes of this presentation, when ratings are available from more than one agency, the highest rating is used. Guggenheim Investments converts ratings to the equivalent S&P rating. Security ratings are determined at the time of purchase and may change thereafter. |
2 | NR securities do not necessarily indicate low credit quality. |
12 | THE GUGGENHEIM FUNDS ANNUAL REPORT | |
PERFORMANCE REPORT AND FUND PROFILE (Unaudited)(continued) | September 30, 2019 |
Cumulative Fund Performance*

| | THE GUGGENHEIM FUNDS ANNUAL REPORT | 13 |
PERFORMANCE REPORT AND FUND PROFILE (Unaudited)(concluded) | September 30, 2019 |
Average Annual Returns*
Periods Ended September 30, 2019
| 1 Year | 5 Year | Since
Inception
(11/30/11) |
A-Class Shares | 0.41% | 3.24% | 4.86% |
A-Class Shares with sales charge‡ | (3.63%) | 2.24% | 4.21% |
C-Class Shares | (0.37%) | 2.47% | 4.09% |
C-Class Shares with CDSC§ | (1.34%) | 2.47% | 4.09% |
Institutional Class Shares | 0.77% | 3.62% | 5.24% |
ICE BofA Merrill Lynch 3-Month U.S. Treasury Bill Index | 2.39% | 0.98% | 0.65% |
| | 1 Year | Since
Inception
(05/01/15) |
P-Class Shares | | 0.37% | 3.11% |
ICE BofA Merrill Lynch 3-Month U.S. Treasury Bill Index | | 2.39% | 1.11% |
| | | Since
Inception
(03/13/19)† |
R6-Class Shares | | | 1.30% |
ICE BofA Merrill Lynch 3-Month U.S. Treasury Bill Index | | | 2.45% |
* | The performance data above represents past performance that is not predictive of future results. The investment return and principal value of an investment in the Fund will fluctuate so that an investor’s shares, when redeemed, may be worth more or less than their original cost. Returns are historical and include changes in principal and reinvested dividends and capital gains and do not reflect the effect of taxes. The ICE BofA Merrill Lynch 3-Month U.S. Treasury Bill Index is an unmanaged index and, unlike the Fund, has no management fees or operating expenses to reduce its reported return. The graph is based on A-Class shares only; performance for C-Class shares, P-Class shares, Institutional Class shares and R6-Class shares will vary due to differences in fee structures. |
† | Return since commencement of operations is not annualized. |
‡ | Effective October 1, 2015, the maximum sales charge decreased from 4.75% to 4.00%. A 4.75% maximum sales charge is used in the calculation of the Average Annual Returns based on subscriptions made prior to October 1, 2015, and a 4.00% maximum sales charge will be used to calculate performance for periods based on subscriptions made on or after October 1, 2015. |
§ | Fund returns include a CDSC of 1% if redeemed within 12 months of purchase. |
14 | THE GUGGENHEIM FUNDS ANNUAL REPORT | |
CONSOLIDATED SCHEDULE OF INVESTMENTS | September 30, 2019 |
MACRO OPPORTUNITIES FUND | |
| | Shares | | | Value | |
COMMON STOCKS† - 0.3% |
| | | | | | | | | |
Utilities - 0.2% |
TexGen Power LLC††† | | | 233,394 | | | $ | 9,335,760 | |
| | | | | | | | | |
Energy - 0.1% |
Maverick Natural Resources, LLC†††,1 | | | 7,168 | | | | 4,945,920 | |
SandRidge Energy, Inc.* | | | 488,408 | | | | 2,295,517 | |
Total Energy | | | 7,241,437 | |
| | | | | | | | | |
Consumer, Non-cyclical - 0.0% |
ATD New Holdings, Inc.*,†† | | | 42,478 | | | | 1,189,384 | |
Chef Holdings, Inc.*,†††,1 | | | 9,061 | | | | 1,140,236 | |
Cengage Learning Holdings II, Inc.*,†† | | | 21,660 | | | | 249,090 | |
Targus Group International Equity, Inc.†††,1,2 | | | 12,773 | | | | 21,632 | |
Total Consumer, Non-cyclical | | | 2,600,342 | |
| | | | | | | | | |
Industrial - 0.0% |
API Heat Transfer Parent LLC*,††† | | | 1,024,936 | | | | 304,919 | |
BP Holdco LLC*,†††,1,2 | | | 37,539 | | | | 13,255 | |
Vector Phoenix Holdings, LP*,†††,1 | | | 37,539 | | | | 3,141 | |
Total Industrial | | | 321,315 | |
| | | | | | | | | |
Technology - 0.0% |
Qlik Technologies, Inc. - Class A*,†††,1 | | | 177 | | | | 217,604 | |
Qlik Technologies, Inc. - Class B*,†††,1 | | | 43,738 | | | | — | |
Total Technology | | | 217,604 | |
| | | | | | | | | |
Total Common Stocks |
(Cost $24,862,514) | | | | | | | 19,716,458 | |
| | | | | | | | | |
PREFERRED STOCKS†† - 0.0% |
Financial - 0.0% |
AmTrust Financial Services, Inc. 7.50%3 | | | 46,958 | | | | 786,542 | |
AmTrust Financial Services, Inc. 7.75%3 | | | 21,450 | | | | 356,284 | |
AmTrust Financial Services, Inc. 7.25%3 | | | 13,175 | | | | 222,526 | |
AmTrust Financial Services, Inc. 7.63%3 | | | 5,592 | | | | 89,808 | |
Total Financial | | | 1,455,160 | |
| | | | | | | | | |
Industrial - 0.0% |
API Heat Transfer Intermediate* | | | 218 | | | | 159,388 | |
Total Preferred Stocks |
(Cost $1,456,204) | | | | | | | 1,614,548 | |
| | | | | | | | | |
EXCHANGE-TRADED FUNDS† - 1.2% |
iShares Silver Trust* | | | 4,728,500 | | | | 75,277,720 | |
Total Exchange-Traded Funds |
(Cost $68,335,709) | | | | | | | 75,277,720 | |
| | | | | | | | | |
MUTUAL FUNDS† - 10.7% |
Guggenheim Limited Duration Fund — R6-Class2 | | | 12,611,006 | | | | 310,987,415 | |
Guggenheim Strategy Fund II2 | | | 4,154,186 | | | | 103,148,435 | |
Guggenheim Ultra Short Duration Fund — Institutional Class2,18 | | | 9,242,443 | | | | 92,054,728 | |
Guggenheim Strategy Fund III2 | | | 3,285,993 | | | | 81,558,334 | |
Guggenheim Alpha Opportunity Fund — Institutional Class2 | | | 2,726,278 | | | | 69,165,665 | |
SEE NOTES TO CONSOLIDATED FINANCIAL STATEMENTS. | THE GUGGENHEIM FUNDS ANNUAL REPORT | 15 |
CONSOLIDATED SCHEDULE OF INVESTMENTS (continued) | September 30, 2019 |
MACRO OPPORTUNITIES FUND | |
| | Shares | | | Value | |
Guggenheim Risk Managed Real Estate Fund — Institutional Class2 | | | 543,849 | | | $ | 18,768,215 | |
Total Mutual Funds |
(Cost $684,641,452) | | | | | | | 675,682,792 | |
| | | | | | | | | |
MONEY MARKET FUNDS† - 0.8% |
Federated U.S. Treasury Cash Reserve Fund — Institutional Shares 1.86%4 | | | 50,248,098 | | | | 50,248,098 | |
Western Asset Institutional U.S. Treasury Reserves — Institutional Shares 1.87%4 | | | 1 | | | | 1 | |
Total Money Market Funds |
(Cost $50,248,099) | | | | | | | 50,248,099 | |
| | | | | | | | | |
| | | Face
Amount~ | | | | | |
ASSET-BACKED SECURITIES†† - 24.2% |
Collateralized Loan Obligations - 11.4% |
Shackleton 2015-VIII CLO Ltd. | | | | | | | | |
2017-8A, 3.20% (3 Month USD LIBOR + 0.92%, Rate Floor: 0.00%) due 10/20/275,6 | | | 62,000,000 | | | | 61,856,817 | |
Golub Capital Partners CLO Ltd. | | | | | | | | |
2018-36A, 4.39% (3 Month USD LIBOR + 2.10%, Rate Floor: 0.00%) due 02/05/315,6 | | | 20,000,000 | | | | 18,484,160 | |
2018-25A, 4.19% (3 Month USD LIBOR + 1.90%, Rate Floor: 1.90%) due 05/05/305,6 | | | 18,500,000 | | | | 18,054,167 | |
2018-36A, 3.94% (3 Month USD LIBOR + 1.65%, Rate Floor: 0.00%) due 02/05/315,6 | | | 13,200,000 | | | | 12,642,447 | |
2018-39A, 4.48% (3 Month USD LIBOR + 2.20%, Rate Floor: 2.20%) due 10/20/285,6 | | | 5,000,000 | | | | 4,924,117 | |
NewStar Clarendon Fund CLO LLC | | | | | | | | |
2019-1A, 3.58% (3 Month USD LIBOR + 1.30%, Rate Floor: 0.00%) due 01/25/275,6 | | | 18,000,000 | | | | 17,982,133 | |
2019-1A, 4.33% (3 Month USD LIBOR + 2.05%, Rate Floor: 0.00%) due 01/25/275,6 | | | 14,050,000 | | | | 14,033,037 | |
2019-1A, 5.33% (3 Month USD LIBOR + 3.05%, Rate Floor: 0.00%) due 01/25/275,6 | | | 4,000,000 | | | | 3,995,753 | |
2015-1A, 6.63% (3 Month USD LIBOR + 4.35%, Rate Floor: 0.00%) due 01/25/275,6 | | | 1,300,000 | | | | 1,300,488 | |
16 | THE GUGGENHEIM FUNDS ANNUAL REPORT | SEE NOTES TO CONSOLIDATED FINANCIAL STATEMENTS. |
CONSOLIDATED SCHEDULE OF INVESTMENTS (continued) | September 30, 2019 |
MACRO OPPORTUNITIES FUND | |
| | Face
Amount~ | | | Value | |
Halcyon Loan Advisors Funding Ltd. | | | | | | | | |
2017-1A, 3.20% (3 Month USD LIBOR + 0.92%, Rate Floor: 0.00%) due 04/20/275,6 | | | 20,838,856 | | | $ | 20,798,729 | |
2017-3A, 3.20% (3 Month USD LIBOR + 0.90%, Rate Floor: 0.00%) due 10/18/275,6 | | | 10,000,000 | | | | 10,004,399 | |
2012-1A, 5.16% (3 Month USD LIBOR + 3.00%, Rate Floor: 0.00%) due 08/15/235,6 | | | 1,000,000 | | | | 1,002,819 | |
Tralee CLO III Ltd. | | | | | | | | |
2017-3A, 3.73% (3 Month USD LIBOR + 1.45%, Rate Floor: 0.00%) due 10/20/275,6 | | | 31,000,000 | | | | 30,591,851 | |
Telos CLO Ltd. | | | | | | | | |
2017-6A, 3.57% (3 Month USD LIBOR + 1.27%, Rate Floor: 0.00%) due 01/17/275,6 | | | 22,170,139 | | | | 22,186,066 | |
2017-6A, 4.90% (3 Month USD LIBOR + 2.60%, Rate Floor: 0.00%) due 01/17/275,6 | | | 7,500,000 | | | | 7,505,351 | |
Diamond CLO Ltd. | | | | | | | | |
2018-1A, 4.88% (3 Month USD LIBOR + 2.60%, Rate Floor: 2.60%) due 07/22/305,6 | | | 13,500,000 | | | | 13,191,183 | |
2018-1A, 4.08% (3 Month USD LIBOR + 1.80%, Rate Floor: 1.80%) due 07/22/305,6 | | | 11,000,000 | | | | 10,819,354 | |
2018-1A, 5.98% (3 Month USD LIBOR + 3.70%, Rate Floor: 3.70%) due 07/22/305,6 | | | 5,000,000 | | | | 4,891,558 | |
Crown Point CLO III Ltd. | | | | | | | | |
2017-3A, 3.75% (3 Month USD LIBOR + 1.45%, Rate Floor: 0.00%) due 12/31/275,6 | | | 15,000,000 | | | | 14,898,912 | |
2017-3A, 3.21% (3 Month USD LIBOR + 0.91%, Rate Floor: 0.00%) due 12/31/275,6 | | | 8,300,000 | | | | 8,303,334 | |
Treman Park CLO Ltd. | | | | | | | | |
2015-1A, due 10/20/285,7 | | | 32,400,000 | | | | 22,915,531 | |
FDF I Ltd. | | | | | | | | |
2015-1A, 5.50% due 11/12/305 | | | 12,000,000 | | | | 11,990,548 | |
2015-1A, 4.40% due 11/12/305 | | | 10,000,000 | | | | 10,125,350 | |
KVK CLO Ltd. | | | | | | | | |
2018-1A, 3.79% (3 Month USD LIBOR + 1.65%, Rate Floor: 0.00%) due 05/20/295,6 | | | 16,250,000 | | | | 16,133,907 | |
2013-1A, due 01/14/285,7 | | | 11,900,000 | | | | 4,388,173 | |
Palmer Square Loan Funding Ltd. | | | | | | | | |
2018-4A, 3.06% (3 Month USD LIBOR + 0.90%, Rate Floor: 0.00%) due 11/15/265,6 | | | 16,515,151 | | | | 16,509,161 | |
2018-4A, 4.06% (3 Month USD LIBOR + 1.90%, Rate Floor: 0.00%) due 11/15/265,6 | | | 2,800,000 | | | | 2,784,847 | |
SEE NOTES TO CONSOLIDATED FINANCIAL STATEMENTS. | THE GUGGENHEIM FUNDS ANNUAL REPORT | 17 |
CONSOLIDATED SCHEDULE OF INVESTMENTS (continued) | September 30, 2019 |
MACRO OPPORTUNITIES FUND | |
| | Face
Amount~ | | | Value | |
Cerberus Loan Funding XVII Ltd. | | | | | | | | |
2016-3A, 4.83% (3 Month USD LIBOR + 2.53%, Rate Floor: 0.00%) due 01/15/285,6 | | | 18,000,000 | | | $ | 17,915,697 | |
Mountain Hawk II CLO Ltd. | | | | | | | | |
2018-2A, 4.63% (3 Month USD LIBOR + 2.35%, Rate Floor: 0.00%) due 07/20/245,6 | | | 8,250,000 | | | | 8,254,731 | |
2018-2A, 3.10% (3 Month USD LIBOR + 0.82%, Rate Floor: 0.00%) due 07/20/245,6 | | | 4,174,871 | | | | 4,173,659 | |
2013-2A, 5.43% (3 Month USD LIBOR + 3.15%, Rate Floor: 0.00%) due 07/22/245,6 | | | 2,750,000 | | | | 2,741,200 | |
Voya CLO Ltd. | | | | | | | | |
2013-1A, due 10/15/305,7 | | | 28,970,307 | | | | 14,675,199 | |
Avery Point II CLO Ltd. | | | | | | | | |
2013-3X COM, due 01/18/257 | | | 19,800,000 | | | | 14,523,648 | |
Monroe Capital CLO Ltd. | | | | | | | | |
2017-1A, 3.63% (3 Month USD LIBOR + 1.35%, Rate Floor: 0.00%) due 10/22/265,6 | | | 11,293,637 | | | | 11,296,515 | |
2017-1A, 5.88% (3 Month USD LIBOR + 3.60%, Rate Floor: 0.00%) due 10/22/265,6 | | | 3,000,000 | | | | 2,934,076 | |
ABPCI Fund II Warehouse | | | | | | | | |
4.59% due 05/22/29 | | | 13,000,000 | | | | 13,001,469 | |
OZLM XIII Ltd. | | | | | | | | |
2018-13A, 4.37% (3 Month USD LIBOR + 2.10%, Rate Floor: 0.00%) due 07/30/275,6 | | | 12,650,000 | | | | 12,421,342 | |
OHA Credit Partners IX Ltd. | | | | | | | | |
2013-9A, due 10/20/255,7 | | | 14,000,000 | | | | 11,835,886 | |
MP CLO VIII Ltd. | | | | | | | | |
2018-2A, 4.16% (3 Month USD LIBOR + 1.90%, Rate Floor: 0.00%) due 10/28/275,6 | | | 11,950,000 | | | | 11,686,099 | |
TCP Waterman CLO Ltd. | | | | | | | | |
2016-1A, 5.12% (3 Month USD LIBOR + 3.00%, Rate Floor: 0.00%) due 12/15/285,6 | | | 11,000,000 | | | | 10,999,303 | |
Octagon Loan Funding Ltd. | | | | | | | | |
2014-1A, due 11/18/315,7 | | | 19,435,737 | | | | 10,764,541 | |
Marathon CLO V Ltd. | | | | | | | | |
2017-5A, 3.60% (3 Month USD LIBOR + 1.45%, Rate Floor: 0.00%) due 11/21/275,6 | | | 7,920,233 | | | | 7,809,203 | |
2013-5A, due 11/21/275,7 | | | 5,500,000 | | | | 596,238 | |
Dryden 37 Senior Loan Fund | | | | | | | | |
2015-37A, due 01/15/315,7 | | | 9,500,000 | | | | 8,351,118 | |
Atlas Senior Loan Fund IX Ltd. | | | | | | | | |
2018-9A, due 04/20/285,7 | | | 9,600,000 | | | | 4,667,261 | |
18 | THE GUGGENHEIM FUNDS ANNUAL REPORT | SEE NOTES TO CONSOLIDATED FINANCIAL STATEMENTS. |
CONSOLIDATED SCHEDULE OF INVESTMENTS (continued) | September 30, 2019 |
MACRO OPPORTUNITIES FUND | |
| | Face
Amount~ | | | Value | |
2018-9A, 4.08% (3 Month USD LIBOR + 1.80%, Rate Floor: 1.80%) due 04/20/285,6 | | | 3,750,000 | | | $ | 3,648,065 | |
West CLO Ltd. | | | | | | | | |
2017-1A, 3.22% (3 Month USD LIBOR + 0.92%, Rate Floor: 0.00%) due 07/18/265,6 | | | 7,326,900 | | | | 7,314,715 | |
2013-1A, due 11/07/255,7 | | | 5,300,000 | | | | 977,399 | |
Avery Point VI CLO Ltd. | | | | | | | | |
2018-6A, 4.29% (3 Month USD LIBOR + 2.00%, Rate Floor: 0.00%) due 08/05/275,6 | | | 8,000,000 | | | | 7,915,106 | |
Golub Capital BDC CLO LLC | | | | | | | | |
2018-1A, 3.68% (3 Month USD LIBOR + 1.40%, Rate Floor: 0.00%) due 04/25/265,6 | | | 8,000,000 | | | | 7,891,947 | |
Flagship CLO VIII Ltd. | | | | | | | | |
2018-8A, 4.12% (3 Month USD LIBOR + 1.80%, Rate Floor: 0.00%) due 01/16/265,6 | | | 8,025,000 | | | | 7,870,085 | |
Newstar Commercial Loan Funding LLC | | | | | | | | |
2017-1A, 5.66% (3 Month USD LIBOR + 3.50%, Rate Floor: 0.00%) due 03/20/275,6 | | | 7,500,000 | | | | 7,501,899 | |
Dryden 41 Senior Loan Fund | | | | | | | | |
2015-41A, due 04/15/315,7 | | | 11,700,000 | | | | 7,000,707 | |
Seneca Park CLO Limited | | | | | | | | |
2017-1A, 3.42% (3 Month USD LIBOR + 1.12%, Rate Floor: 0.00%) due 07/17/265,6 | | | 6,939,663 | | | | 6,953,887 | |
ACIS CLO Ltd. | | | | | | | | |
2014-4A, 4.80% (3 Month USD LIBOR + 2.55%, Rate Floor: 0.00%) due 05/01/265,6 | | | 3,600,000 | | | | 3,599,161 | |
2015-6A, 5.62% (3 Month USD LIBOR + 3.37%, Rate Floor: 0.00%) due 05/01/275,6 | | | 3,250,000 | | | | 3,252,888 | |
Marathon CRE Ltd. | | | | | | | | |
2018-FL1, 5.03% (1 Month USD LIBOR + 3.00%, Rate Floor: 3.00%) due 06/15/285,6 | | | 6,000,000 | | | | 6,007,231 | |
2018-FL1, 4.63% (1 Month USD LIBOR + 2.60%, Rate Floor: 2.60%) due 06/15/285,6 | | | 650,000 | | | | 652,308 | |
Carlyle Global Market Strategies CLO Ltd. | | | | | | | | |
2012-3A, due 01/14/325,7 | | | 6,400,000 | | | | 4,349,811 | |
2013-3X SUB, due 10/15/307 | | | 4,938,326 | | | | 2,127,920 | |
Ladder Capital Commercial Mortgage Trust | | | | | | | | |
2017-FL1, 5.62% (1 Month USD LIBOR + 3.60%, Rate Floor: 3.60%) due 09/15/345,6 | | | 6,404,971 | | | | 6,387,418 | |
SEE NOTES TO CONSOLIDATED FINANCIAL STATEMENTS. | THE GUGGENHEIM FUNDS ANNUAL REPORT | 19 |
CONSOLIDATED SCHEDULE OF INVESTMENTS (continued) | September 30, 2019 |
MACRO OPPORTUNITIES FUND | |
| | Face
Amount~ | | | Value | |
Venture XIII CLO Ltd. | | | | | | | | |
2013-13A, due 09/10/295,7 | | | 13,790,000 | | | $ | 6,314,965 | |
Dryden 50 Senior Loan Fund | | | | | | | | |
2017-50A, due 07/15/305,7 | | | 7,895,000 | | | | 5,881,838 | |
Hull Street CLO Ltd. | | | | | | | | |
2014-1A, 5.90% (3 Month USD LIBOR + 3.60%, Rate Floor: 0.00%) due 10/18/265,6 | | | 5,785,000 | | | | 5,720,060 | |
Silvermore CLO Ltd. | | | | | | | | |
2014-1A, 5.16% (3 Month USD LIBOR + 3.00%, Rate Floor: 0.00%) due 05/15/265,6 | | | 5,500,000 | | | | 5,504,877 | |
FDF II Ltd. | | | | | | | | |
2016-2A, 6.29% due 05/12/315 | | | 5,250,000 | | | | 5,247,148 | |
Sudbury Mill CLO Ltd. | | | | | | | | |
2017-1A, 4.75% (3 Month USD LIBOR + 2.45%, Rate Floor: 0.00%) due 01/17/265,6 | | | 5,000,000 | | | | 4,997,515 | |
WhiteHorse X Ltd. | | | | | | | | |
2015-10A, 7.60% (3 Month USD LIBOR + 5.30%, Rate Floor: 5.30%) due 04/17/275,6 | | | 4,980,000 | | | | 4,865,184 | |
BNPP IP CLO Ltd. | | | | | | | | |
2014-2A, 7.52% (3 Month USD LIBOR + 5.25%, Rate Floor: 0.00%) due 10/30/255,6 | | | 5,500,000 | | | | 4,610,937 | |
Octagon Investment Partners XIX Ltd. | | | | | | | | |
2017-1A, 3.40% (3 Month USD LIBOR + 1.10%, Rate Floor: 0.00%) due 04/15/265,6 | | | 4,417,325 | | | | 4,419,710 | |
Jackson Mill CLO Ltd. | | | | | | | | |
2018-1A, 4.15% (3 Month USD LIBOR + 1.85%, Rate Floor: 1.85%) due 04/15/275,6 | | | 4,150,000 | | | | 4,128,481 | |
Madison Park Funding XVI Ltd. | | | | | | | | |
2016-16A, 4.93% (3 Month USD LIBOR + 2.65%, Rate Floor: 0.00%) due 04/20/265,6 | | | 4,000,000 | | | | 4,002,895 | |
Adams Mill CLO Ltd. | | | | | | | | |
2014-1A, 7.30% (3 Month USD LIBOR + 5.00%, Rate Floor: 0.00%) due 07/15/265,6 | | | 4,000,000 | | | | 3,818,073 | |
Greywolf CLO III Ltd. | | | | | | | | |
2018-3RA, 2.93% (3 Month USD LIBOR + 0.65%, Rate Floor: 0.65%) due 10/22/285,6 | | | 3,428,571 | | | | 3,425,410 | |
Denali Capital CLO XI Ltd. | | | | | | | | |
2018-1A, 4.43% (3 Month USD LIBOR + 2.15%, Rate Floor: 0.00%) due 10/20/285,6 | | | 2,500,000 | | | | 2,462,185 | |
2018-1A, 2.98% (3 Month USD LIBOR + 0.70%, Rate Floor: 0.00%) due 10/20/285,6 | | | 600,000 | | | | 599,803 | |
20 | THE GUGGENHEIM FUNDS ANNUAL REPORT | SEE NOTES TO CONSOLIDATED FINANCIAL STATEMENTS. |
CONSOLIDATED SCHEDULE OF INVESTMENTS (continued) | September 30, 2019 |
MACRO OPPORTUNITIES FUND | |
| | Face
Amount~ | | | Value | |
Mountain Hawk III CLO Ltd. | | | | | | | | |
2014-3A, 5.10% (3 Month USD LIBOR + 2.80%, Rate Floor: 0.00%) due 04/18/255,6 | | | 3,000,000 | | | $ | 2,996,640 | |
Babson CLO Ltd. | | | | | | | | |
2014-IA, due 07/20/255,7 | | | 11,900,000 | | | | 2,962,814 | |
Staniford Street CLO Ltd. | | | | | | | | |
2017-1A, 3.30% (3 Month USD LIBOR + 1.18%, Rate Floor: 0.00%) due 06/15/255,6 | | | 2,957,715 | | | | 2,956,530 | |
AMMC CLO XI Ltd. | | | | | | | | |
2012-11A, due 04/30/315,7 | | | 5,650,000 | | | | 2,742,860 | |
Figueroa CLO Ltd. | | | | | | | | |
2018-2A, 3.01% (3 Month USD LIBOR + 0.85%, Rate Floor: 0.85%) due 06/20/275,6 | | | 1,581,101 | | | | 1,575,435 | |
Columbia Cent CLO Ltd. | | | | | | | | |
2018-27A, 2.98% (3 Month USD LIBOR + 0.70%, Rate Floor: 0.70%) due 10/25/285,6 | | | 1,458,333 | | | | 1,457,794 | |
Flagship VII Ltd. | | | | | | | | |
2017-7A, 3.40% (3 Month USD LIBOR + 1.12%, Rate Floor: 0.00%) due 01/20/265,6 | | | 1,351,081 | | | | 1,351,188 | |
DRSLF | | | | | | | | |
due 01/15/317 | | | 1,897,598 | | | | 1,222,237 | |
Garrison BSL CLO Ltd. | | | | | | | | |
2018-1A, 3.00% (3 Month USD LIBOR + 0.70%, Rate Floor: 0.00%) due 07/17/285,6 | | | 1,142,857 | | | | 1,142,312 | |
Copper River CLO Ltd. | | | | | | | | |
2007-1A, due 01/20/217,8 | | | 8,150,000 | | | | 1,131,171 | |
Great Lakes CLO Ltd. | | | | | | | | |
2014-1A, due 10/15/295,7 | | | 1,500,000 | | | | 931,579 | |
Shackleton 2014-VI-R CLO Ltd. | | | | | | | | |
2018-6RA, 2.90% (3 Month USD LIBOR + 0.60%, Rate Floor: 0.60%) due 07/17/285,6 | | | 714,286 | | | | 713,383 | |
TICP CLO III-2 Ltd. | | | | | | | | |
2018-3R, 3.12% (3 Month USD LIBOR + 0.84%, Rate Floor: 0.84%) due 04/20/285,6 | | | 250,000 | | | | 248,907 | |
Total Collateralized Loan Obligations | | | 721,843,855 | |
| | | | | | | | | |
Transport-Aircraft - 5.8% |
Castlelake Aircraft Securitization Trust | | | | | | | | |
2017-1, 3.97% due 07/15/42 | | | 28,294,624 | | | | 28,693,502 | |
2018-1, 4.13% due 06/15/435 | | | 22,854,862 | | | | 23,394,372 | |
2016-1, 4.45% due 08/15/41 | | | 20,683,069 | | | | 20,679,677 | |
KDAC Aviation Finance Ltd. | | | | | | | | |
2017-1A, 4.21% due 12/15/425 | | | 53,729,793 | | | | 55,035,953 | |
SEE NOTES TO CONSOLIDATED FINANCIAL STATEMENTS. | THE GUGGENHEIM FUNDS ANNUAL REPORT | 21 |
CONSOLIDATED SCHEDULE OF INVESTMENTS (continued) | September 30, 2019 |
MACRO OPPORTUNITIES FUND | |
| | Face
Amount~ | | | Value | |
Raspro Trust | | | | | | | | |
2005-1A, 3.20% (3 Month USD LIBOR + 0.93%, Rate Floor: 0.93%) due 03/23/245,6 | | | 43,836,782 | | | $ | 43,253,959 | |
2005-1A, 2.56% (3 Month USD LIBOR + 0.40%, Rate Floor: 0.40%) due 03/23/245,6 | | | 66,470 | | | | 66,419 | |
AASET US Ltd. | | | | | | | | |
2018-2A, 5.43% due 11/18/385 | | | 19,593,998 | | | | 19,925,501 | |
2018-2A, 4.45% due 11/18/385 | | | 17,560,658 | | | | 18,013,976 | |
Falcon Aerospace Ltd. | | | | | | | | |
2017-1, 4.58% due 02/15/425 | | | 33,047,961 | | | | 33,346,021 | |
AASET Trust | | | | | | | | |
2017-1A, 3.97% due 05/16/425 | | | 31,551,670 | | | | 31,929,019 | |
Sapphire Aviation Finance I Ltd. | | | | | | | | |
2018-1A, 4.25% due 03/15/405 | | | 28,033,720 | | | | 28,708,632 | |
Apollo Aviation Securitization Equity Trust | | | | | | | | |
2017-1A, 5.93% due 05/16/425 | | | 8,192,199 | | | | 8,461,256 | |
2016-2, 5.93% due 11/15/41 | | | 5,861,871 | | | | 5,910,199 | |
2016-2, 4.21% due 11/15/41 | | | 5,233,814 | | | | 5,290,152 | |
2016-2, 7.87% due 11/15/41 | | | 1,754,946 | | | | 1,757,678 | |
2018-1A, 5.44% due 01/16/385 | | | 1,351,712 | | | | 1,379,112 | |
AIM Aviation Finance Ltd. | | | | | | | | |
2015-1A, 5.07% due 02/15/405 | | | 9,648,399 | | | | 9,735,359 | |
Falcon Aerospace Ltd. | | | | | | | | |
2017-1, 6.30% due 02/15/425 | | | 7,618,719 | | | | 7,733,137 | |
MAPS Ltd. | | | | | | | | |
2018-1A, 4.21% due 05/15/435 | | | 6,995,241 | | | | 7,174,812 | |
Stripes Aircraft Ltd. | | | | | | | | |
2013-1 A1, 5.54% due 03/20/23††† | | | 5,085,503 | | | | 5,010,736 | |
Atlas Ltd. | | | | | | | | |
2014-1 A, 4.88% due 12/15/39 | | | 4,959,108 | | | | 4,820,441 | |
Willis Engine Securitization Trust II | | | | | | | | |
2012-A, 5.50% due 09/15/375,9 | | | 3,406,845 | | | | 3,519,448 | |
Turbine Engines Securitization Ltd. | | | | | | | | |
2013-1A, 5.13% due 12/13/488 | | | 2,031,673 | | | | 2,035,604 | |
2013-1A, 6.38% due 12/13/488 | | | 1,495,309 | | | | 1,319,821 | |
Diamond Head Aviation Ltd. | | | | | | | | |
2015-1, 3.81% due 07/14/285 | | | 794,138 | | | | 794,845 | |
Airplanes Pass Through Trust | | | | | | | | |
2001-1A, 2.88% (1 Month USD LIBOR + 0.55%, Rate Floor: 0.55%) due 03/15/19†††,6,8,17 | | | 2,097,481 | | | | 34,739 | |
Total Transport-Aircraft | | | | | | | 368,024,370 | |
| | | | | | | | | |
22 | THE GUGGENHEIM FUNDS ANNUAL REPORT | SEE NOTES TO CONSOLIDATED FINANCIAL STATEMENTS. |
CONSOLIDATED SCHEDULE OF INVESTMENTS (continued) | September 30, 2019 |
MACRO OPPORTUNITIES FUND | |
| | Face
Amount~ | | | Value | |
Financial - 3.5% |
Station Place Securitization Trust | | | | | | | | |
2019-8, 2.64% (1 Month USD LIBOR + 0.60%, Rate Floor: 0.60%) due 03/24/205,6 | | | 38,300,000 | | | $ | 38,300,000 | |
2019-6, 2.64% (1 Month USD LIBOR + 0.60%, Rate Floor: 0.60%) due 07/24/21†††,5,6 | | | 38,000,000 | | | | 38,000,000 | |
2019-5, 2.74% (1 Month USD LIBOR + 0.70%, Rate Floor: 0.70%) due 06/24/20†††,5,6 | | | 18,550,000 | | | | 18,550,000 | |
2019-2, 2.59% (1 Month USD LIBOR + 0.55%, Rate Floor: 0.55%) due 04/24/215,6 | | | 10,200,000 | | | | 10,205,905 | |
2019-9, 2.74% (1 Month USD LIBOR + 0.70%, Rate Floor: 0.00%) due 10/24/205,6 | | | 7,700,000 | | | | 7,700,000 | |
Barclays Bank plc | | | | | | | | |
GMTN, 2.86% due 10/31/19 | | | 40,600,000 | | | | 40,605,862 | |
Madison Avenue Securitization Trust | | | | | | | | |
due 11/18/206 | | | 33,300,000 | | | | 33,300,000 | |
Nassau LLC | | | | | | | | |
2019-1, 3.98% due 08/15/345 | | | 20,750,000 | | | | 20,646,250 | |
Station Place Securitization Trust Series | | | | | | | | |
2019-WL1, 3.02% (1 Month USD LIBOR + 1.00%, Rate Floor: 1.00%) due 08/25/525,6 | | | 7,500,000 | | | | 7,507,583 | |
2019-WL1, 2.82% (1 Month USD LIBOR + 0.80%, Rate Floor: 0.80%) due 08/25/525,6 | | | 5,000,000 | | | | 5,005,061 | |
Total Financial | | | | | | | 219,820,661 | |
| | | | | | | | | |
Credit Card - 1.1% |
Citibank Credit Card Issuance Trust | | | | | | | | |
2017-A3, 1.92% due 04/07/22 | | | 52,327,000 | | | | 52,292,448 | |
American Express Credit Account Master Trust | | | | | | | | |
2018-1, 2.67% due 10/17/22 | | | 15,000,000 | | | | 15,038,442 | |
Total Credit Card | | | | | | | 67,330,890 | |
| | | | | | | | | |
Whole Business - 0.7% |
TSGE | | | | | | | | |
2017-1, 6.25% due 09/25/31†††,1 | | | 42,550,000 | | | | 43,771,783 | |
Drug Royalty III Limited Partnership 1 | | | | | | | | |
2017-1A, 4.80% (3 Month USD LIBOR + 2.50%, Rate Floor: 2.50%) due 04/15/275,6 | | | 1,965,863 | | | | 1,978,083 | |
Total Whole Business | | | | | | | 45,749,866 | |
| | | | | | | | | |
Collateralized Debt Obligations - 0.5% |
Anchorage Credit Funding 4 Ltd. | | | | | | | | |
2016-4A, 4.50% due 02/15/355 | | | 9,200,000 | | | | 9,189,879 | |
SEE NOTES TO CONSOLIDATED FINANCIAL STATEMENTS. | THE GUGGENHEIM FUNDS ANNUAL REPORT | 23 |
CONSOLIDATED SCHEDULE OF INVESTMENTS (continued) | September 30, 2019 |
MACRO OPPORTUNITIES FUND | |
| | Face
Amount~ | | | Value | |
Putnam Structured Product Funding Ltd. | | | | | | | | |
2003-1A, 3.03% (1 Month USD LIBOR + 1.00%, Rate Floor: 0.00%) due 10/15/385,6 | | | 8,205,703 | | | $ | 8,127,381 | |
N-Star REL CDO VIII Ltd. | | | | | | | | |
2006-8A, 2.45% (1 Month USD LIBOR + 0.36%, Rate Floor: 0.36%) due 02/01/415,6 | | | 7,920,381 | | | | 7,833,732 | |
Banco Bradesco SA | | | | | | | | |
2014-1, 5.44% due 03/12/26††† | | | 2,194,832 | | | | 2,181,888 | |
Highland Park CDO I Ltd. | | | | | | | | |
2006-1A, 2.53% (3 Month USD LIBOR + 0.40%, Rate Floor: 0.00%) due 11/25/516,8 | | | 1,503,289 | | | | 1,489,660 | |
Total Collateralized Debt Obligations | | | 28,822,540 | |
| | | | | | | | | |
Automotive - 0.4% |
Avis Budget Rental Car Funding AESOP LLC | | | | | | | | |
2015-1A, 2.50% due 07/20/215 | | | 23,660,000 | | | | 23,677,982 | |
| | | | | | | | | |
Diversified Payment Rights - 0.3% |
Bib Merchant Voucher Receivables Ltd. | | | | | | | | |
4.18% due 04/07/28†††,1 | | | 15,300,000 | | | | 15,801,242 | |
CIC Receivables Master Trust | | | | | | | | |
REGD, 4.89% due 10/07/21††† | | | 2,870,504 | | | | 2,926,960 | |
Total Diversified Payment Rights | | | 18,728,202 | |
| | | | | | | | | |
Insurance - 0.3% |
LTCG Securitization Issuer LLC | | | | | | | | |
2018-A, 4.59% due 06/15/485 | | | 16,907,847 | | | | 17,066,132 | |
| | | | | | | | | |
Transport-Container - 0.1% |
Global SC Finance II SRL | | | | | | | | |
2013-1A, 2.98% due 04/17/285 | | | 7,525,000 | | | | 7,523,818 | |
| | | | | | | | | |
Infrastructure - 0.1% |
Secured Tenant Site Contract Revenue Notes Series | | | | | | | | |
2018-1A, 4.70% due 06/15/488 | | | 6,861,225 | | | | 7,109,558 | |
Total Asset-Backed Securities | | | | |
(Cost $1,535,778,841) | | | | | | | 1,525,697,874 | |
| | | | | | | | | |
FOREIGN GOVERNMENT DEBT†† - 17.9% |
Government of Japan | | | | | | | | |
due 01/10/2010 | | JPY | 13,267,000,000 | | | | 122,796,748 | |
0.10% due 07/01/21 | | JPY | 12,332,000,000 | | | | 114,888,175 | |
due 01/20/2010 | | JPY | 10,421,000,000 | | | | 96,462,585 | |
due 10/21/1910 | | JPY | 6,915,250,000 | | | | 63,968,555 | |
0.10% due 06/01/20 | | JPY | 6,060,000,000 | | | | 56,202,083 | |
0.10% due 09/01/20 | | JPY | 5,619,000,000 | | | | 52,171,899 | |
0.10% due 06/20/20 | | JPY | 2,287,000,000 | | | | 21,213,854 | |
0.10% due 04/15/20 | | JPY | 1,972,900,000 | | | | 18,287,903 | |
0.10% due 03/20/20 | | JPY | 617,000,000 | | | | 5,717,431 | |
due 10/07/1910 | | JPY | 400,000,000 | | | | 3,699,918 | |
2.40% due 03/20/20 | | JPY | 254,000,000 | | | | 2,378,736 | |
1.30% due 03/20/20 | | JPY | 101,000,000 | | | | 941,111 | |
2.20% due 06/22/20 | | JPY | 91,450,000 | | | | 861,125 | |
State of Israel | | | | | | | | |
1.00% due 04/30/21 | | ILS | 309,410,000 | | | | 90,180,588 | |
5.00% due 01/31/20 | | ILS | 196,300,000 | | | | 57,361,009 | |
0.50% due 01/31/21 | | ILS | 69,480,000 | | | | 20,083,091 | |
5.50% due 01/31/22 | | ILS | 61,420,000 | | | | 19,818,426 | |
Federative Republic of Brazil | | | | | | | | |
due 07/01/2010 | | BRL | 373,800,000 | | | | 86,948,035 | |
due 07/01/2110 | | BRL | 309,600,000 | | | | 68,224,041 | |
due 01/01/2010 | | BRL | 125,900,000 | | | | 29,953,633 | |
24 | THE GUGGENHEIM FUNDS ANNUAL REPORT | SEE NOTES TO CONSOLIDATED FINANCIAL STATEMENTS. |
CONSOLIDATED SCHEDULE OF INVESTMENTS (continued) | September 30, 2019 |
MACRO OPPORTUNITIES FUND | |
| | Face
Amount~ | | | Value | |
Kingdom of Spain | | | | | | | | |
0.75% due 07/30/21 | | EUR | 60,710,000 | | | $ | 67,712,963 | |
4.00% due 04/30/20 | | EUR | 46,700,000 | | | | 52,230,478 | |
due 01/17/2010 | | EUR | 24,540,000 | | | | 26,792,276 | |
Republic of Portugal | | | | | | | | |
due 01/17/2010 | | EUR | 28,600,000 | | | | 31,222,898 | |
4.80% due 06/15/20 | | EUR | 16,230,000 | | | | 18,357,418 | |
Province of Newfoundland | | | | | | | | |
due 10/03/1910 | | CAD | 4,400,000 | | | | 3,321,669 | |
Total Foreign Government Debt | | | | |
(Cost $1,142,729,196) | | | | | | | 1,131,796,648 | |
| | | | | | | | | |
COLLATERALIZED MORTGAGE OBLIGATIONS†† - 14.0% |
Residential Mortgage Backed Securities - 11.5% |
Lehman XS Trust Series | | | | | | | | |
2006-16N, 2.23% (1 Month USD LIBOR + 0.21%, Rate Floor: 0.21%) due 11/25/466 | | | 22,052,282 | | | | 21,126,843 | |
2006-18N, 2.20% (1 Month USD LIBOR + 0.18%, Rate Floor: 0.18%) due 12/25/366 | | | 20,466,041 | | | | 19,420,406 | |
2006-10N, 2.23% (1 Month USD LIBOR + 0.21%, Rate Floor: 0.21%) due 07/25/466 | | | 4,985,525 | | | | 4,957,553 | |
RALI Series Trust | | | | | | | | |
2006-QO6, 2.20% (1 Month USD LIBOR + 0.18%, Rate Floor: 0.18%) due 06/25/466 | | | 36,895,053 | | | | 14,472,649 | |
2007-QO2, 2.17% (1 Month USD LIBOR + 0.15%, Rate Floor: 0.15%) due 02/25/476 | | | 18,373,533 | | | | 10,090,974 | |
2006-QO8, 2.22% (1 Month USD LIBOR + 0.20%, Rate Floor: 0.20%) due 10/25/466 | | | 8,902,936 | | | | 8,616,593 | |
2006-QO6, 2.25% (1 Month USD LIBOR + 0.23%, Rate Floor: 0.23%) due 06/25/466 | | | 9,599,590 | | | | 3,882,194 | |
2006-QO2, 2.29% (1 Month USD LIBOR + 0.27%, Rate Floor: 0.27%) due 02/25/466 | | | 7,157,781 | | | | 2,712,082 | |
2006-QO6, 2.28% (1 Month USD LIBOR + 0.26%, Rate Floor: 0.26%) due 06/25/466 | | | 6,056,523 | | | | 2,492,973 | |
2006-QO2, 2.36% (1 Month USD LIBOR + 0.34%, Rate Floor: 0.34%) due 02/25/466 | | | 3,830,020 | | | | 1,492,322 | |
2006-QO2, 2.24% (1 Month USD LIBOR + 0.22%, Rate Floor: 0.22%) due 02/25/466 | | | 256,727 | | | | 95,238 | |
JP Morgan Mortgage Acquisition Trust | | | | | | | | |
2006-WMC4, 2.17% (1 Month USD LIBOR + 0.15%, Rate Floor: 0.15%) due 12/25/366 | | | 27,675,308 | | | | 17,568,175 | |
2006-WMC3, 2.17% (1 Month USD LIBOR + 0.15%, Rate Floor: 0.15%) due 08/25/366 | | | 12,500,470 | | | | 9,257,632 | |
SEE NOTES TO CONSOLIDATED FINANCIAL STATEMENTS. | THE GUGGENHEIM FUNDS ANNUAL REPORT | 25 |
CONSOLIDATED SCHEDULE OF INVESTMENTS (continued) | September 30, 2019 |
MACRO OPPORTUNITIES FUND | |
| | Face
Amount~ | | | Value | |
2006-HE3, 2.18% (1 Month USD LIBOR + 0.16%, Rate Floor: 0.16%) due 11/25/366 | | | 8,263,641 | | | $ | 7,518,334 | |
2006-WMC4, 2.14% (1 Month USD LIBOR + 0.12%, Rate Floor: 0.12%) due 12/25/366 | | | 9,526,085 | | | | 6,008,795 | |
2006-WMC4, 2.10% (1 Month USD LIBOR + 0.08%, Rate Floor: 0.08%) due 12/25/366 | | | 4,027,962 | | | | 2,519,122 | |
Legacy Mortgage Asset Trust | | | | | | | | |
2018-GS3, 4.00% due 06/25/585,9 | | | 27,298,338 | | | | 27,602,682 | |
2019-GS5, 3.20% due 05/25/595 | | | 9,747,725 | | | | 9,782,041 | |
WaMu Asset-Backed Certificates WaMu Series | | | | | | | | |
2007-HE2, 2.38% (1 Month USD LIBOR + 0.36%, Rate Floor: 0.36%) due 04/25/376 | | | 29,864,854 | | | | 16,028,583 | |
2007-HE2, 2.21% (1 Month USD LIBOR + 0.19%, Rate Floor: 0.19%) due 04/25/376 | | | 22,756,754 | | | | 11,840,747 | |
2007-HE4, 2.19% (1 Month USD LIBOR + 0.17%, Rate Floor: 0.17%) due 07/25/476 | | | 9,142,419 | | | | 7,064,125 | |
2007-HE4, 2.27% (1 Month USD LIBOR + 0.25%, Rate Floor: 0.25%) due 07/25/476 | | | 2,833,416 | | | | 1,974,419 | |
Structured Asset Securities Corporation Mortgage Loan Trust | | | | | | | | |
2008-BC4, 2.65% (1 Month USD LIBOR + 0.63%, Rate Floor: 0.63%) due 11/25/376 | | | 36,883,751 | | | | 36,792,596 | |
CIM Trust | | | | | | | | |
2018-R2, 3.69% (WAC) due 08/25/575,6 | | | 33,806,121 | | | | 33,996,798 | |
GSAA Home Equity Trust | | | | | | | | |
2006-12, 2.17% (1 Month USD LIBOR + 0.15%, Rate Floor: 0.15%) due 08/25/366 | | | 24,034,273 | | | | 14,675,255 | |
2006-3, 2.32% (1 Month USD LIBOR + 0.30%, Rate Floor: 0.30%) due 03/25/366 | | | 16,393,999 | | | | 11,509,722 | |
2006-9, 2.26% (1 Month USD LIBOR + 0.24%, Rate Floor: 0.24%) due 06/25/366 | | | 10,365,441 | | | | 5,318,616 | |
2007-7, 2.29% (1 Month USD LIBOR + 0.27%, Rate Floor: 0.27%) due 07/25/376 | | | 1,757,810 | | | | 1,714,122 | |
Long Beach Mortgage Loan Trust | | | | | | | | |
2006-6, 2.27% (1 Month USD LIBOR + 0.25%, Rate Floor: 0.25%) due 07/25/366 | | | 16,920,350 | | | | 8,822,470 | |
26 | THE GUGGENHEIM FUNDS ANNUAL REPORT | SEE NOTES TO CONSOLIDATED FINANCIAL STATEMENTS. |
CONSOLIDATED SCHEDULE OF INVESTMENTS (continued) | September 30, 2019 |
MACRO OPPORTUNITIES FUND | |
| | Face
Amount~ | | | Value | |
2006-8, 2.18% (1 Month USD LIBOR + 0.16%, Rate Floor: 0.16%) due 09/25/366 | | | 19,699,321 | | | $ | 8,043,568 | |
2006-4, 2.18% (1 Month USD LIBOR + 0.16%, Rate Floor: 0.16%) due 05/25/366 | | | 12,301,504 | | | | 5,275,340 | |
2006-1, 2.21% (1 Month USD LIBOR + 0.19%, Rate Floor: 0.19%) due 02/25/366 | | | 4,944,671 | | | | 4,180,129 | |
2006-6, 2.17% (1 Month USD LIBOR + 0.15%, Rate Floor: 0.15%) due 07/25/366 | | | 5,268,792 | | | | 2,675,946 | |
2006-8, 2.11% (1 Month USD LIBOR + 0.09%, Rate Floor: 0.09%) due 09/25/366 | | | 5,338,146 | | | | 2,137,201 | |
2006-6, 2.12% (1 Month USD LIBOR + 0.10%, Rate Floor: 0.10%) due 07/25/366 | | | 3,049,992 | | | | 1,528,422 | |
American Home Mortgage Assets Trust | | | | | | | | |
2006-6, 2.23% (1 Month USD LIBOR + 0.21%, Rate Floor: 0.21%) due 12/25/466 | | | 14,481,127 | | | | 12,553,127 | |
2006-1, 2.21% (1 Month USD LIBOR + 0.19%, Rate Floor: 0.19%) due 05/25/466 | | | 13,228,157 | | | | 12,005,441 | |
2006-3, 3.42% (1 Year CMT Rate + 0.94%, Rate Floor: 0.94%) due 10/25/466 | | | 7,560,615 | | | | 6,800,881 | |
Morgan Stanley ABS Capital I Incorporated Trust | | | | | | | | |
2006-HE8, 2.24% (1 Month USD LIBOR + 0.22%, Rate Floor: 0.22%) due 10/25/366 | | | 24,981,527 | | | | 15,979,844 | |
2007-HE6, 2.27% (1 Month USD LIBOR + 0.25%, Rate Floor: 0.25%) due 05/25/376 | | | 9,260,278 | | | | 8,496,896 | |
2006-HE6, 2.12% (1 Month USD LIBOR + 0.10%, Rate Floor: 0.10%) due 09/25/366 | | | 5,169,866 | | | | 2,452,573 | |
2007-HE4, 2.25% (1 Month USD LIBOR + 0.23%, Rate Floor: 0.23%) due 02/25/376 | | | 4,410,882 | | | | 2,020,321 | |
Ameriquest Mortgage Securities Trust | | | | | | | | |
2006-M3, 2.19% (1 Month USD LIBOR + 0.18%, Rate Floor: 0.18%) due 10/25/366 | | | 25,724,848 | | | | 17,967,448 | |
2006-M3, 2.12% (1 Month USD LIBOR + 0.10%, Rate Floor: 0.10%) due 10/25/366 | | | 15,940,552 | | | | 6,864,416 | |
SEE NOTES TO CONSOLIDATED FINANCIAL STATEMENTS. | THE GUGGENHEIM FUNDS ANNUAL REPORT | 27 |
CONSOLIDATED SCHEDULE OF INVESTMENTS (continued) | September 30, 2019 |
MACRO OPPORTUNITIES FUND | |
| | Face
Amount~ | | | Value | |
LSTAR Securities Investment Trust | | | | | | | | |
2018-2, 3.53% (1 Month USD LIBOR + 1.50%, Rate Floor: 0.00%) due 04/01/235,6 | | | 18,019,120 | | | $ | 18,002,002 | |
2019-1, 3.79% (1 Month USD LIBOR + 1.70%, Rate Floor: 0.00%) due 03/01/245,6 | | | 6,384,665 | | | | 6,388,177 | |
Ocwen Master Advance Receivables Trust | | | | | | | | |
2019-T2, 2.42% due 08/15/515 | | | 20,000,000 | | | | 20,048,130 | |
2019-T2, 3.04% due 08/15/515 | | | 3,200,000 | | | | 3,207,768 | |
Morgan Stanley IXIS Real Estate Capital Trust | | | | | | | | |
2006-2, 2.24% (1 Month USD LIBOR + 0.22%, Rate Floor: 0.22%) due 11/25/366 | | | 26,110,286 | | | | 13,149,284 | |
2006-2, 2.17% (1 Month USD LIBOR + 0.15%, Rate Floor: 0.15%) due 11/25/366 | | | 19,918,880 | | | | 9,923,166 | |
ACE Securities Corporation Home Equity Loan Trust Series | | | | | | | | |
2007-HE1, 2.17% (1 Month USD LIBOR + 0.15%, Rate Floor: 0.15%) due 01/25/376 | | | 18,810,523 | | | | 12,312,283 | |
2007-ASP1, 2.40% (1 Month USD LIBOR + 0.38%, Rate Floor: 0.38%) due 03/25/376 | | | 13,686,277 | | | | 8,337,379 | |
Impac Secured Assets Trust | | | | | | | | |
2006-3, 2.22% (1 Month USD LIBOR + 0.20%, Rate Floor: 0.20%) due 11/25/366 | | | 17,605,192 | | | | 16,663,692 | |
GSAMP Trust | | | | | | | | |
2007-NC1, 2.15% (1 Month USD LIBOR + 0.13%, Rate Floor: 0.13%) due 12/25/466 | | | 24,429,248 | | | | 15,763,398 | |
IXIS Real Estate Capital Trust | | | | | | | | |
2007-HE1, 2.18% (1 Month USD LIBOR + 0.16%, Rate Floor: 0.16%) due 05/25/376 | | | 26,704,137 | | | | 9,166,144 | |
2007-HE1, 2.25% (1 Month USD LIBOR + 0.23%, Rate Floor: 0.23%) due 05/25/376 | | | 18,919,506 | | | | 6,574,852 | |
NRPL Trust | | | | | | | | |
2019-3, 3.00% (WAC) due 06/01/595,6 | | | 15,500,000 | | | | 15,453,657 | |
Nationstar Home Equity Loan Trust | | | | | | | | |
2007-C, 2.19% (1 Month USD LIBOR + 0.18%, Rate Floor: 0.18%) due 06/25/376 | | | 14,898,552 | | | | 14,501,844 | |
Master Asset Backed Securities Trust | | | | | | | | |
2006-WMC3, 2.18% (1 Month USD LIBOR + 0.16%, Rate Floor: 0.16%) due 08/25/366 | | | 12,477,303 | | | | 5,902,392 | |
28 | THE GUGGENHEIM FUNDS ANNUAL REPORT | SEE NOTES TO CONSOLIDATED FINANCIAL STATEMENTS. |
CONSOLIDATED SCHEDULE OF INVESTMENTS (continued) | September 30, 2019 |
MACRO OPPORTUNITIES FUND | |
| | Face
Amount~ | | | Value | |
2006-HE3, 2.12% (1 Month USD LIBOR + 0.10%, Rate Floor: 0.10%) due 08/25/366 | | | 10,994,081 | | | $ | 4,528,418 | |
2006-HE3, 2.17% (1 Month USD LIBOR + 0.15%, Rate Floor: 0.15%) due 08/25/366 | | | 9,243,396 | | | | 3,856,168 | |
Citigroup Mortgage Loan Trust, Inc. | | | | | | | | |
2007-AMC3, 2.27% (1 Month USD LIBOR + 0.25%, Rate Floor: 0.25%) due 03/25/376 | | | 15,529,694 | | | | 13,426,864 | |
Home Equity Loan Trust | | | | | | | | |
2007-FRE1, 2.21% (1 Month USD LIBOR + 0.19%, Rate Floor: 0.19%) due 04/25/376 | | | 12,778,608 | | | | 12,076,345 | |
Alternative Loan Trust | | | | | | | | |
2007-OA7, 2.20% (1 Month USD LIBOR + 0.18%, Rate Floor: 0.18%) due 05/25/476 | | | 12,141,200 | | | | 11,564,727 | |
Banc of America Funding Trust | | | | | | | | |
2015-R2, 2.28% (1 Month USD LIBOR + 0.26%, Rate Floor: 0.26%) due 04/29/375,6 | | | 10,000,000 | | | | 9,832,908 | |
First NLC Trust | | | | | | | | |
2007-1, 2.30% (1 Month USD LIBOR + 0.28%, Rate Floor: 0.28%) due 08/25/375,6 | | | 8,650,032 | | | | 5,618,210 | |
2007-1, 2.09% (1 Month USD LIBOR + 0.07%, Rate Floor: 0.07%) due 08/25/375,6 | | | 6,559,596 | | | | 4,119,263 | |
WaMu Asset-Backed Certificates WaMu Series Trust | | | | | | | | |
2007-HE1, 2.25% (1 Month USD LIBOR + 0.23%, Rate Floor: 0.23%) due 01/25/376 | | | 9,889,927 | | | | 6,338,121 | |
2007-HE4, 2.19% (1 Month USD LIBOR + 0.17%, Rate Floor: 0.17%) due 07/25/476 | | | 3,968,370 | | | | 2,731,443 | |
New Residential Advance Receivables Trust Advance Receivables Backed | | | | | | | | |
2019-T3, 2.66% due 10/20/525 | | | 4,200,000 | | | | 4,208,846 | |
2019-T3, 2.71% due 10/20/525 | | | 3,000,000 | | | | 3,006,280 | |
Luminent Mortgage Trust | | | | | | | | |
2006-2, 2.22% (1 Month USD LIBOR + 0.20%, Rate Floor: 0.20%) due 02/25/466 | | | 8,091,230 | | | | 7,123,898 | |
CitiMortgage Alternative Loan Trust Series | | | | | | | | |
2007-A7, 2.42% (1 Month USD LIBOR + 0.40%, Rate Cap/Floor: 7.50%/0.40%) due 07/25/376 | | | 8,178,379 | | | | 6,574,603 | |
SEE NOTES TO CONSOLIDATED FINANCIAL STATEMENTS. | THE GUGGENHEIM FUNDS ANNUAL REPORT | 29 |
CONSOLIDATED SCHEDULE OF INVESTMENTS (continued) | September 30, 2019 |
MACRO OPPORTUNITIES FUND | |
| | Face
Amount~ | | | Value | |
HSI Asset Securitization Corporation Trust | | | | | | | | |
2007-HE1, 2.21% (1 Month USD LIBOR + 0.19%, Rate Floor: 0.19%) due 01/25/376 | | | 8,275,517 | | | $ | 6,515,028 | |
Washington Mutual Mortgage Pass-Through Certificates WMALT Series Trust | | | | | | | | |
2006-AR9, 3.29% (1 Year CMT Rate + 0.84%, Rate Floor: 0.84%) due 11/25/466 | | | 6,770,935 | | | | 6,160,206 | |
Morgan Stanley Mortgage Loan Trust | | | | | | | | |
2006-9AR, 2.17% (1 Month USD LIBOR + 0.15%, Rate Floor: 0.15%) due 08/25/366 | | | 10,835,501 | | | | 4,883,593 | |
Nomura Resecuritization Trust | | | | | | | | |
2015-4R, 5.17% (1 Month USD LIBOR + 0.43%, Rate Floor: 0.43%) due 03/26/365,6 | | | 3,981,288 | | | | 3,891,908 | |
Alliance Bancorp Trust | | | | | | | | |
2007-OA1, 2.26% (1 Month USD LIBOR + 0.24%, Rate Floor: 0.24%) due 07/25/376 | | | 3,318,594 | | | | 3,043,018 | |
Wachovia Asset Securitization Issuance II LLC Trust | | | | | | | | |
2007-HE1, 2.16% (1 Month USD LIBOR + 0.14%, Rate Floor: 0.14%) due 07/25/375,6 | | | 1,436,113 | | | | 1,327,099 | |
Morgan Stanley Re-REMIC Trust | | | | | | | | |
2010-R5, 3.37% due 06/26/365 | | | 1,142,658 | | | | 1,060,693 | |
Asset Backed Securities Corporation Home Equity Loan Trust | | | | | | | | |
2006-HE5, 2.16% (1 Month USD LIBOR + 0.14%, Rate Floor: 0.14%) due 07/25/366 | | | 735,017 | | | | 712,893 | |
Total Residential Mortgage Backed Securities | | | 726,330,314 | |
| | | | | | | | | |
Commercial Mortgage Backed Securities - 1.8% |
CGBAM Mezzanine Securities Trust | | | | | | | | |
2015-SMMZ, 8.21% due 04/10/285 | | | 28,200,000 | | | | 28,666,696 | |
CGBAM Commercial Mortgage Trust | | | | | | | | |
2015-SMRT, 3.91% (WAC) due 04/10/285,6 | | | 16,864,000 | | | | 16,939,605 | |
2015-SMRT, 3.77% due 04/10/285 | | | 1,400,000 | | | | 1,405,859 | |
GS Mortgage Securities Corporation Trust | | | | | | | | |
2017-STAY, 4.18% (1 Month USD LIBOR + 2.15%, Rate Floor: 2.15%) due 07/15/325,6 | | | 16,531,000 | | | | 16,170,042 | |
30 | THE GUGGENHEIM FUNDS ANNUAL REPORT | SEE NOTES TO CONSOLIDATED FINANCIAL STATEMENTS. |
CONSOLIDATED SCHEDULE OF INVESTMENTS (continued) | September 30, 2019 |
MACRO OPPORTUNITIES FUND | |
| | Face
Amount~ | | | Value | |
OBP Depositor LLC Trust | | | | | | | | |
2010-OBP, 4.65% due 07/15/455 | | | 11,650,000 | | | $ | 11,726,284 | |
Four Times Square Trust Commercial Mortgage Pass-Through Certificates Series | | | | | | | | |
2006-4TS, 5.40% due 12/13/285 | | | 10,649,235 | | | | 10,979,659 | |
Wells Fargo Commercial Mortgage Trust | | | | | | | | |
2015-NXS1, 2.63% due 05/15/48 | | | 7,450,000 | | | | 7,442,847 | |
Morgan Stanley Capital I Trust | | | | | | | | |
2014-MP, 3.47% due 08/11/335 | | | 4,735,000 | | | | 4,850,294 | |
Credit Suisse First Boston Mortgage Securities Corporation Series | | | | | | | | |
2006-OMA, 5.63% due 05/15/235 | | | 3,850,000 | | | | 3,874,347 | |
Vornado DP LLC Trust | | | | | | | | |
2010-VNO, 4.74% due 09/13/285 | | | 2,400,000 | | | | 2,428,924 | |
2010-VNO, 6.36% due 09/13/285 | | | 970,000 | | | | 988,901 | |
GE Business Loan Trust | | | | | | | | |
2007-1A, 2.48% (1 Month USD LIBOR + 0.45%, Rate Floor: 0.45%) due 04/16/355,6 | | | 1,469,804 | | | | 1,410,100 | |
2007-1A, 2.20% (1 Month USD LIBOR + 0.17%, Rate Floor: 0.17%) due 04/15/355,6 | | | 1,088,744 | | | | 1,066,709 | |
Aventura Mall Trust | | | | | | | | |
2013-AVM, 3.87% (WAC) due 12/05/325,6 | | | 2,050,000 | | | | 2,074,085 | |
Americold LLC Trust | | | | | | | | |
2010-ARTA, 7.44% due 01/14/295 | | | 1,435,000 | | | | 1,493,799 | |
JPMBB Commercial Mortgage Securities Trust | | | | | | | | |
2015-C28, 2.77% due 10/15/48 | | | 1,061,908 | | | | 1,061,115 | |
Americold LLC | | | | | | | | |
2010-ARTA, 4.95% due 01/14/295 | | | 1,000,000 | | | | 1,024,386 | |
Total Commercial Mortgage Backed Securities | | | 113,603,652 | |
| | | | | | | | | |
Government Agency - 0.4% |
Fannie Mae | | | | | | | | |
3.00% due 02/01/57 | | | 22,613,129 | | | | 23,120,866 | |
| | | | | | | | | |
Military Housing - 0.3% |
GMAC Commercial Mortgage Asset Corp. | | | | | | | | |
2004-POKA, 6.36% due 09/10/44†††,5 | | | 9,000,000 | | | | 10,909,455 | |
Capmark Military Housing Trust | | | | | | | | |
2007-AET2, 6.06% due 10/10/525 | | | 5,708,231 | | | | 6,998,814 | |
Total Military Housing | | | | | | | 17,908,269 | |
Total Collateralized Mortgage Obligations | | | | |
(Cost $900,517,388) | | | | | | | 880,963,101 | |
| | | | | | | | | |
SEE NOTES TO CONSOLIDATED FINANCIAL STATEMENTS. | THE GUGGENHEIM FUNDS ANNUAL REPORT | 31 |
CONSOLIDATED SCHEDULE OF INVESTMENTS (continued) | September 30, 2019 |
MACRO OPPORTUNITIES FUND | |
| | Face
Amount~ | | | Value | |
CORPORATE BONDS†† - 11.8% |
Financial - 4.4% |
Synchrony Bank | | | | | | | | |
2.73% (3 Month USD LIBOR + 0.63%) due 03/30/206 | | | 25,800,000 | | | $ | 25,809,508 | |
American Equity Investment Life Holding Co. | | | | | | | | |
5.00% due 06/15/27 | | | 23,799,000 | | | | 25,010,785 | |
ANZ New Zealand Int’l Ltd. | | | | | | | | |
2.85% due 08/06/205 | | | 18,240,000 | | | | 18,367,928 | |
Lloyds Bank Corporate Markets plc NY | | | | | | | | |
2.66% (3 Month USD LIBOR + 0.37%) due 08/05/206 | | | 18,210,000 | | | | 18,229,657 | |
AerCap Ireland Capital DAC / AerCap Global Aviation Trust | | | | | | | | |
4.63% due 10/30/20 | | | 9,850,000 | | | | 10,083,248 | |
4.25% due 07/01/20 | | | 8,000,000 | | | | 8,109,903 | |
Credit Suisse AG NY | | | | | | | | |
2.66% (3 Month USD LIBOR + 0.40%) due 07/31/206 | | | 18,140,000 | | | | 18,154,796 | |
Standard Chartered Bank | | | | | | | | |
2.69% (3 Month USD LIBOR + 0.40%) due 08/04/206 | | | 18,120,000 | | | | 18,145,689 | |
Morgan Stanley | | | | | | | | |
5.50% due 07/24/20 | | | 17,500,000 | | | | 17,971,487 | |
UBS AG | | | | | | | | |
2.68% (3 Month USD LIBOR + 0.58%, Rate Floor: 0.00%) due 06/08/205,6 | | | 14,689,000 | | | | 14,728,382 | |
2.62% (3 Month USD LIBOR + 0.48%) due 12/01/205,6 | | | 2,800,000 | | | | 2,807,090 | |
Credit Agricole Corporate & Investment Bank S.A. | | | | | | | | |
2.69% (3 Month USD LIBOR + 0.40%, Rate Floor: 0.00%) due 05/03/215,6 | | | 17,375,000 | | | | 17,382,749 | |
Capital One Financial Corp. | | | | | | | | |
2.50% due 05/12/20 | | | 7,370,000 | | | | 7,383,096 | |
2.72% (3 Month USD LIBOR + 0.45%) due 10/30/206 | | | 6,745,000 | | | | 6,755,536 | |
2.94% (3 Month USD LIBOR + 0.76%) due 05/12/206 | | | 2,741,000 | | | | 2,749,763 | |
Discover Bank | | | | | | | | |
3.10% due 06/04/20 | | | 15,598,000 | | | | 15,682,360 | |
Atlas Mara Ltd. | | | | | | | | |
8.00% due 12/31/208 | | | 14,400,000 | | | | 12,744,000 | |
American International Group, Inc. | | | | | | | | |
6.40% due 12/15/20 | | | 10,339,000 | | | | 10,864,510 | |
Santander UK plc | | | | | | | | |
2.59% (3 Month USD LIBOR + 0.30%) due 11/03/206 | | | 7,325,000 | | | | 7,320,383 | |
2.13% due 11/03/20 | | | 975,000 | | | | 974,050 | |
Jefferies Finance LLC / JFIN Company-Issuer Corp. | | | | | | | | |
7.25% due 08/15/245 | | | 4,135,000 | | | | 4,119,494 | |
Aon Corp. | | | | | | | | |
5.00% due 09/30/20 | | | 3,225,000 | | | | 3,316,139 | |
AXIS Specialty Finance LLC | | | | | | | | |
5.88% due 06/01/20 | | | 3,110,000 | | | | 3,182,528 | |
ERP Operating, LP | | | | | | | | |
4.75% due 07/15/20 | | | 2,500,000 | | | | 2,533,229 | |
Univest Financial Corp. | | | | | | | | |
5.10% due 03/30/2511 | | | 2,500,000 | | | | 2,509,713 | |
32 | THE GUGGENHEIM FUNDS ANNUAL REPORT | SEE NOTES TO CONSOLIDATED FINANCIAL STATEMENTS. |
CONSOLIDATED SCHEDULE OF INVESTMENTS (continued) | September 30, 2019 |
MACRO OPPORTUNITIES FUND | |
| | Face
Amount~ | | | Value | |
Credit Suisse Group Funding Guernsey Ltd. | | | | | | | | |
2.75% due 03/26/20 | | | 2,120,000 | | | $ | 2,125,662 | |
Total Financial | | | | | | | 277,061,685 | |
| | | | | | | | | |
Consumer, Non-cyclical - 3.0% |
Mondelez International, Inc. | | | | | | | | |
3.00% due 05/07/20 | | | 20,210,000 | | | | 20,313,447 | |
Reynolds American, Inc. | | | | | | | | |
3.25% due 06/12/20 | | | 20,093,000 | | | | 20,220,087 | |
Zimmer Biomet Holdings, Inc. | | | | | | | | |
2.70% due 04/01/20 | | | 17,689,000 | | | | 17,719,188 | |
Coca-Cola Femsa SAB de CV | | | | | | | | |
4.63% due 02/15/20 | | | 17,500,000 | | | | 17,633,037 | |
Molson Coors Brewing Co. | | | | | | | | |
2.25% due 03/15/20 | | | 17,497,000 | | | | 17,486,313 | |
Constellation Brands, Inc. | | | | | | | | |
2.25% due 11/06/20 | | | 16,236,000 | | | | 16,241,158 | |
Allergan Funding SCS | | | | | | | | |
3.39% (3 Month USD LIBOR + 1.26%) due 03/12/206 | | | 11,575,000 | | | | 11,620,971 | |
3.00% due 03/12/20 | | | 2,215,000 | | | | 2,221,327 | |
Cigna Corp. | | | | | | | | |
3.20% due 09/17/20 | | | 7,850,000 | | | | 7,926,080 | |
2.49% (3 Month USD LIBOR + 0.35%) due 03/17/206 | | | 5,816,000 | | | | 5,816,880 | |
General Mills, Inc. | | | | | | | | |
2.86% (3 Month USD LIBOR + 0.54%) due 04/16/216 | | | 13,150,000 | | | | 13,179,856 | |
S&P Global, Inc. | | | | | | | | |
3.30% due 08/14/20 | | | 8,135,000 | | | | 8,212,881 | |
BidFair MergeRight, Inc. | | | | | | | | |
7.38% due 10/15/275 | | | 6,450,000 | | | | 6,571,389 | |
Kraft Heinz Foods Co. | | | | | | | | |
2.80% due 07/02/20 | | | 5,663,000 | | | | 5,672,775 | |
Allergan Incorporated/United States | | | | | | | | |
3.38% due 09/15/20 | | | 4,210,000 | | | | 4,256,377 | |
Zoetis, Inc. | | | | | | | | |
3.45% due 11/13/20 | | | 3,980,000 | | | | 4,031,433 | |
Vector Group Ltd. | | | | | | | | |
6.13% due 02/01/255 | | | 2,500,000 | | | | 2,393,750 | |
Quest Diagnostics, Inc. | | | | | | | | |
2.50% due 03/30/20 | | | 2,260,000 | | | | 2,262,247 | |
KeHE Distributors LLC / KeHE Finance Corp. | | | | | | | | |
8.63% due 10/15/265 | | | 2,140,000 | | | | 2,182,800 | |
Biogen, Inc. | | | | | | | | |
2.90% due 09/15/20 | | | 1,748,000 | | | | 1,760,606 | |
Conagra Brands, Inc. | | | | | | | | |
3.03% (3 Month USD LIBOR + 0.75%) due 10/22/206 | | | 1,500,000 | | | | 1,500,307 | |
Sysco Corp. | | | | | | | | |
2.60% due 10/01/20 | | | 997,000 | | | | 1,001,616 | |
Total Consumer, Non-cyclical | | | 190,224,525 | |
| | | | | | | | | |
Industrial - 1.7% |
Encore Capital Group, Inc. | | | | | | | | |
5.63% due 08/11/24††† | | | 39,600,000 | | | | 39,439,256 | |
L3Harris Technologies, Inc. | | | | | | | | |
2.70% due 04/27/20 | | | 16,800,000 | | | | 16,833,627 | |
Molex Electronic Technologies LLC | | | | | | | | |
2.88% due 04/15/205 | | | 16,475,000 | | | | 16,501,587 | |
Rolls-Royce plc | | | | | | | | |
2.38% due 10/14/205 | | | 10,570,000 | | | | 10,581,855 | |
Textron, Inc. | | | | | | | | |
2.73% (3 Month USD LIBOR + 0.55%) due 11/10/206 | | | 10,250,000 | | | | 10,245,383 | |
SEE NOTES TO CONSOLIDATED FINANCIAL STATEMENTS. | THE GUGGENHEIM FUNDS ANNUAL REPORT | 33 |
CONSOLIDATED SCHEDULE OF INVESTMENTS (continued) | September 30, 2019 |
MACRO OPPORTUNITIES FUND | |
| | Face
Amount~ | | | Value | |
Yamana Gold, Inc. | | | | | | | | |
4.76% due 03/23/22††† | | | 4,750,000 | | | $ | 4,860,363 | |
4.78% due 06/10/23††† | | | 99,699 | | | | 102,798 | |
Aviation Capital Group LLC | | | | | | | | |
7.13% due 10/15/205 | | | 4,500,000 | | | | 4,708,049 | |
Princess Juliana International Airport Operating Company N.V. | | | | | | | | |
5.50% due 12/20/278 | | | 1,394,617 | | | | 1,319,433 | |
GATX Corp. | | | | | | | | |
2.60% due 03/30/20 | | | 1,209,000 | | | | 1,210,139 | |
Vulcan Materials Co. | | | | | | | | |
2.72% (3 Month USD LIBOR + 0.60%) due 06/15/206 | | | 1,050,000 | | | | 1,050,586 | |
Penske Truck Leasing Company Lp / PTL Finance Corp. | | | | | | | | |
3.05% due 01/09/205 | | | 500,000 | | | | 500,602 | |
Total Industrial | | | | | | | 107,353,678 | |
| | | | | | | | | |
Utilities - 0.6% |
NextEra Energy Capital Holdings, Inc. | | | | | | | | |
2.55% (3 Month USD LIBOR + 0.45%) due 09/28/206 | | | 17,820,000 | | | | 17,827,570 | |
Exelon Corp. | | | | | | | | |
2.85% due 06/15/20 | | | 17,356,000 | | | | 17,428,589 | |
PSEG Power LLC | | | | | | | | |
5.13% due 04/15/20 | | | 4,522,000 | | | | 4,590,594 | |
Total Utilities | | | | | | | 39,846,753 | |
| | | | | | | | | |
Energy - 0.6% |
Marathon Petroleum Corp. | | | | | | | | |
3.40% due 12/15/20 | | | 14,880,000 | | | | 15,044,260 | |
Sabine Pass Liquefaction LLC | | | | | | | | |
5.63% due 02/01/21 | | | 13,800,000 | | | | 14,254,239 | |
Reliance Holding USA, Inc. | | | | | | | | |
4.50% due 10/19/205 | | | 3,750,000 | | | | 3,822,636 | |
Energy Transfer Operating, LP | | | | | | | | |
7.50% due 10/15/20 | | | 3,000,000 | | | | 3,152,688 | |
Florida Gas Transmission Company LLC | | | | | | | | |
5.45% due 07/15/205 | | | 1,420,000 | | | | 1,452,774 | |
Basic Energy Services, Inc. | | | | | | | | |
10.75% due 10/15/238 | | | 1,500,000 | | | | 1,095,000 | |
Total Energy | | | | | | | 38,821,597 | |
| | | | | | | | | |
Communications - 0.6% |
Telefonica Emisiones S.A. | | | | | | | | |
5.13% due 04/27/20 | | | 17,300,000 | | | | 17,576,779 | |
Cengage Learning, Inc. | | | | | | | | |
9.50% due 06/15/245 | | | 6,585,000 | | | | 6,025,275 | |
Deutsche Telekom International Finance BV | | | | | | | | |
2.23% due 01/17/205 | | | 5,985,000 | | | | 5,984,050 | |
McGraw-Hill Global Education Holdings LLC / McGraw-Hill Global Education Finance | | | | | | | | |
7.88% due 05/15/245 | | | 4,898,000 | | | | 4,236,770 | |
MDC Partners, Inc. | | | | | | | | |
6.50% due 05/01/245 | | | 2,905,000 | | | | 2,647,181 | |
EIG Investors Corp. | | | | | | | | |
10.88% due 02/01/24 | | | 270,000 | | | | 280,800 | |
Total Communications | | | | | | | 36,750,855 | |
| | | | | | | | | |
Technology - 0.5% |
Broadcom Corporation / Broadcom Cayman Finance Ltd. | | | | | | | | |
2.38% due 01/15/20 | | | 17,902,000 | | | | 17,900,868 | |
34 | THE GUGGENHEIM FUNDS ANNUAL REPORT | SEE NOTES TO CONSOLIDATED FINANCIAL STATEMENTS. |
CONSOLIDATED SCHEDULE OF INVESTMENTS (continued) | September 30, 2019 |
MACRO OPPORTUNITIES FUND | |
| | Face
Amount~ | | | Value | |
Fidelity National Information Services, Inc. | | | | | | | | |
3.63% due 10/15/20 | | | 10,480,000 | | | $ | 10,619,731 | |
Fiserv, Inc. | | | | | | | | |
2.70% due 06/01/20 | | | 2,850,000 | | | | 2,857,596 | |
CA, Inc. | | | | | | | | |
5.38% due 12/01/19 | | | 2,122,000 | | | | 2,132,185 | |
Total Technology | | | | | | | 33,510,380 | |
| | | | | | | | | |
Basic Materials - 0.2% |
Newmont Goldcorp Corp. | | | | | | | | |
5.13% due 10/01/19 | | | 9,680,000 | | | | 9,680,000 | |
Yamana Gold, Inc. | | | | | | | | |
4.63% due 12/15/27 | | | 3,200,000 | | | | 3,388,906 | |
Mirabela Nickel Ltd. | | | | | | | | |
9.50% due 06/24/198,17 | | | 1,885,418 | | | | 94,271 | |
Total Basic Materials | | | | | | | 13,163,177 | |
| | | | | | | | | |
Consumer, Cyclical - 0.2% |
Starbucks Corp. | | | | | | | | |
2.10% due 02/04/21 | | | 10,015,000 | | | | 10,024,432 | |
Panther BF Aggregator 2 Limited Partnership / Panther Finance Company, Inc. | | | | | | | | |
8.50% due 05/15/275 | | | 319,000 | | | | 322,988 | |
Total Consumer, Cyclical | | | 10,347,420 | |
Total Corporate Bonds | | | | | | | | |
(Cost $746,473,304) | | | | | | | 747,080,070 | |
| | | | | | | | | |
SENIOR FLOATING RATE INTERESTS††,6 - 6.0% |
Consumer, Cyclical - 1.9% |
Petco Animal Supplies, Inc. | | | | | | | | |
5.51% (3 Month USD LIBOR + 3.25%, Rate Floor: 4.25%) due 01/26/23 | | | 14,933,677 | | | | 11,269,550 | |
AVSC Holding Corp. | | | | | | | | |
5.32% (1 Month USD LIBOR + 3.25% and 3 Month USD LIBOR + 3.25%, Rate Floor: 4.25%) due 03/03/25 | | | 7,327,776 | | | | 7,077,386 | |
EG Finco Ltd. | | | | | | | | |
6.10% (3 Month USD LIBOR + 4.00%, Rate Floor: 4.00%) due 02/07/25 | | | 5,957,560 | | | | 5,881,601 | |
5.51% (3 Month GBP LIBOR + 4.75%, Rate Floor: 4.75%) due 02/07/25 | | GBP | 987,500 | | | | 1,178,346 | |
Mavis Tire Express Services Corp. | | | | | | | | |
5.29% (1 Month USD LIBOR + 3.25%, Rate Floor: 3.25%) due 03/20/25 | | | 6,916,403 | | | | 6,755,873 | |
Accuride Corp. | | | | | | | | |
7.35% (3 Month USD LIBOR + 5.25%, Rate Floor: 6.25%) due 11/17/23 | | | 7,851,811 | | | | 6,595,521 | |
AI Aqua Zip Bidco Pty Ltd. | | | | | | | | |
5.29% (1 Month USD LIBOR + 3.25%, Rate Floor: 4.25%) due 12/13/23 | | | 6,233,847 | | | | 5,941,286 | |
Zephyr Bidco Ltd. | | | | | | | | |
8.21% (1 Month GBP LIBOR + 7.50%, Rate Floor: 7.50%) due 07/23/26 | | GBP | 4,650,417 | | | | 5,646,832 | |
WESCO | | | | | | | | |
6.45% (1 Month USD LIBOR + 4.50%, Rate Floor: 5.50%) due 06/14/24†††,1 | | CAD | 3,980,000 | | | | 2,993,288 | |
SEE NOTES TO CONSOLIDATED FINANCIAL STATEMENTS. | THE GUGGENHEIM FUNDS ANNUAL REPORT | 35 |
CONSOLIDATED SCHEDULE OF INVESTMENTS (continued) | September 30, 2019 |
MACRO OPPORTUNITIES FUND | |
| | Face
Amount~ | | | Value | |
6.36% (3 Month USD LIBOR + 4.50%, Rate Floor: 5.50%) due 06/14/24†††,1 | | | 2,370,000 | | | $ | 2,360,746 | |
IRB Holding Corp. | | | | | | | | |
5.55% (3 Month USD LIBOR + 3.25%, Rate Floor: 4.25%) due 02/05/25 | | | 5,084,629 | | | | 5,058,494 | |
CD&R Firefly Bidco Ltd. | | | | | | | | |
5.02% (3 Month GBP LIBOR + 4.25%, Rate Floor: 4.25%) due 06/23/25 | | GBP | 3,800,000 | | | | 4,612,240 | |
CPI Acquisition, Inc. | | | | | | | | |
6.71% (3 Month USD LIBOR + 4.50%, Rate Floor: 6.50%) due 08/17/22 | | | 5,602,372 | | | | 4,333,939 | |
Leslie’s Poolmart, Inc. | | | | | | | | |
5.54% (1 Month USD LIBOR + 3.50%, Rate Floor: 3.50%) due 08/16/23 | | | 4,419,708 | | | | 4,198,722 | |
Power Solutions (Panther) | | | | | | | | |
5.54% (1 Month USD LIBOR + 3.50%, Rate Floor: 3.50%) due 04/30/26 | | | 4,000,000 | | | | 3,957,520 | |
Galls LLC | | | | | | | | |
8.37% (3 Month USD LIBOR + 6.25%, Rate Floor: 7.25%) due 01/31/25†††,1 | | | 3,212,852 | | | | 3,185,287 | |
8.29% (1 Month USD LIBOR + 6.25% and Commercial Prime Lending Rate + 5.25%, Rate Floor: 7.25%) due 01/31/24†††,1 | | | 411,232 | | | | 372,529 | |
8.36% (1 Month USD LIBOR + 6.25% and 3 Month USD LIBOR + 6.25%, Rate Floor: 7.25%) due 01/31/25†††,1 | | | 355,445 | | | | 352,395 | |
Alexander Mann | | | | | | | | |
5.71% (1 Month GBP LIBOR + 5.00%, Rate Floor: 5.00%) due 06/16/25 | | GBP | 3,000,000 | | | | 3,547,507 | |
SHO Holding I Corp. | | | | | | | | |
7.26% (3 Month USD LIBOR + 5.00%, Rate Floor: 6.00%) due 10/27/22 | | | 3,700,291 | | | | 3,478,274 | |
EnTrans International, LLC | | | | | | | | |
8.04% (1 Month USD LIBOR + 6.00%, Rate Floor: 6.00%) due 11/01/24††† | | | 3,303,125 | | | | 3,187,516 | |
Truck Hero, Inc. | | | | | | | | |
5.79% (1 Month USD LIBOR + 3.75%, Rate Floor: 3.75%) due 04/22/24 | | | 2,867,549 | | | | 2,677,574 | |
Belk, Inc. | | | | | | | | |
6.80% (3 Month USD LIBOR + 4.75%, Rate Floor: 5.75%) due 12/12/22 | | | 3,640,902 | | | | 2,639,654 | |
At Home Holding III Corp. | | | | | | | | |
5.76% (3 Month USD LIBOR + 3.50%, Rate Floor: 4.50%) due 06/03/22 | | | 2,921,342 | | | | 2,629,208 | |
36 | THE GUGGENHEIM FUNDS ANNUAL REPORT | SEE NOTES TO CONSOLIDATED FINANCIAL STATEMENTS. |
CONSOLIDATED SCHEDULE OF INVESTMENTS (continued) | September 30, 2019 |
MACRO OPPORTUNITIES FUND | |
| | Face
Amount~ | | | Value | |
Blue Nile, Inc. | | | | | | | | |
8.62% (3 Month USD LIBOR + 6.50%, Rate Floor: 7.50%) due 02/17/23††† | | | 3,150,000 | | | $ | 2,457,000 | |
Sotheby’s | | | | | | | | |
due 01/15/27 | | | 2,350,000 | | | | 2,322,106 | |
Nellson Nutraceutical | | | | | | | | |
6.36% (3 Month USD LIBOR + 4.25% and Commercial Prime Lending Rate + 3.25%, Rate Floor: 5.25%) due 12/23/21††† | | | 3,375,590 | | | | 3,139,298 | |
Checkers Drive-In Restaurants, Inc. | | | | | | | | |
6.38% (3 Month USD LIBOR + 4.25%, Rate Floor: 5.25%) due 04/25/24 | | | 3,373,845 | | | | 2,192,999 | |
IBC Capital Ltd. | | | | | | | | |
5.90% (3 Month USD LIBOR + 3.75%, Rate Floor: 3.75%) due 09/11/23 | | | 1,900,083 | | | | 1,885,832 | |
Acosta, Inc. | | | | | | | | |
7.25% (Commercial Prime Lending Rate + 2.25%, Rate Floor: 3.25%) due 09/26/19 | | | 4,954,043 | | | | 1,554,331 | |
Comet Bidco Ltd. | | | | | | | | |
7.12% (3 Month USD LIBOR + 5.00%, Rate Floor: 6.00%) due 09/30/24 | | | 1,576,120 | | | | 1,552,478 | |
Richmond UK Bidco Ltd. | | | | | | | | |
4.97% (1 Month GBP LIBOR + 4.25%, Rate Floor: 4.25%) due 03/03/24 | | GBP | 749,186 | | | | 892,050 | |
K & N Parent, Inc. | | | | | | | | |
6.79% (1 Month USD LIBOR + 4.75%, Rate Floor: 5.75%) due 10/20/23††† | | | 968,968 | | | | 862,382 | |
SMG US Midco 2, Inc. | | | | | | | | |
9.04% (1 Month USD LIBOR + 7.00%, Rate Floor: 7.00%) due 01/23/26 | | | 600,000 | | | | 606,000 | |
American Tire Distributors, Inc. | | | | | | | | |
8.15% (3 Month USD LIBOR + 6.00%, Rate Floor: 7.00%) due 09/01/23 | | | 249,634 | | | | 246,359 | |
9.62% (3 Month USD LIBOR + 7.50%, Rate Floor: 8.50%) due 09/02/24 | | | 165,594 | | | | 145,060 | |
Safe Fleet Holdings LLC | | | | | | | | |
5.04% (1 Month USD LIBOR + 3.00%, Rate Floor: 4.00%) due 02/03/25 | | | 171,050 | | | | 165,349 | |
Total Consumer, Cyclical | | | 117,952,532 | |
| | | | | | | | | |
Technology - 1.2% |
Datix Bidco Ltd. | | | | | | | | |
7.12% (6 Month USD LIBOR + 4.50%, Rate Floor: 4.50%) due 04/28/25†††,1 | | | 9,112,505 | | | | 9,040,268 | |
10.37% (6 Month USD LIBOR + 7.75%, Rate Floor: 7.75%) due 04/27/26†††,1 | | | 461,709 | | | | 457,676 | |
Planview, Inc. | | | | | | | | |
7.29% (1 Month USD LIBOR + 5.25%, Rate Floor: 6.25%) due 01/27/23†††,1 | | | 8,752,298 | | | | 8,752,298 | |
SEE NOTES TO CONSOLIDATED FINANCIAL STATEMENTS. | THE GUGGENHEIM FUNDS ANNUAL REPORT | 37 |
CONSOLIDATED SCHEDULE OF INVESTMENTS (continued) | September 30, 2019 |
MACRO OPPORTUNITIES FUND | |
| | Face
Amount~ | | | Value | |
Lytx, Inc. | | | | | | | | |
8.79% (1 Month USD LIBOR + 6.75%, Rate Floor: 7.75%) due 08/31/23†††,1 | | | 7,842,419 | | | $ | 7,715,790 | |
LANDesk Group, Inc. | | | | | | | | |
6.30% (1 Month USD LIBOR + 4.25%, Rate Floor: 5.25%) due 01/20/24 | | | 6,322,889 | | | | 6,295,258 | |
Misys Ltd. | | | | | | | | |
5.70% (1 Month USD LIBOR + 3.50%, Rate Floor: 4.50%) due 06/13/24 | | | 6,090,385 | | | | 5,919,976 | |
Optiv, Inc. | | | | | | | | |
5.29% (1 Month USD LIBOR + 3.25%, Rate Floor: 4.25%) due 02/01/24 | | | 7,626,789 | | | | 5,885,365 | |
GlobalFoundries, Inc. | | | | | | | | |
6.06% (1 Month USD LIBOR + 4.00%, Rate Floor: 4.00%) due 06/05/26 | | | 4,900,000 | | | | 4,759,125 | |
Peak 10 Holding Corp. | | | | | | | | |
5.60% (3 Month USD LIBOR + 3.50%, Rate Floor: 3.50%) due 08/01/24 | | | 4,900,985 | | | | 4,220,973 | |
Neustar, Inc. | | | | | | | | |
5.54% (1 Month USD LIBOR + 3.50%, Rate Floor: 4.50%) due 08/08/24 | | | 3,631,416 | | | | 3,502,501 | |
Greenway Health LLC | | | | | | | | |
5.85% (3 Month USD LIBOR + 3.75%, Rate Floor: 4.75%) due 02/16/24 | | | 3,545,592 | | | | 3,108,314 | |
24-7 Intouch, Inc. | | | | | | | | |
6.29% (1 Month USD LIBOR + 4.25%, Rate Floor: 4.25%) due 08/25/25††† | | | 3,168,000 | | | | 3,104,640 | |
Ministry Brands LLC | | | | | | | | |
6.04% (1 Month USD LIBOR + 4.00%, Rate Floor: 5.00%) due 12/02/22††† | | | 2,682,914 | | | | 2,682,914 | |
Brave Parent Holdings, Inc. | | | | | | | | |
6.26% (3 Month USD LIBOR + 4.00%, Rate Floor: 4.00%) due 04/18/25 | | | 2,758,219 | | | | 2,640,994 | |
Refinitiv (Financial & Risk Us Holdings, Inc.) | | | | | | | | |
5.79% (1 Month USD LIBOR + 3.75%, Rate Floor: 3.75%) due 10/01/25 | | | 2,084,250 | | | | 2,094,671 | |
Bullhorn, Inc. | | | | | | | | |
8.91% (3 Month USD LIBOR + 6.75%, Rate Floor: 7.75%) due 11/21/22†††,1 | | | 1,941,541 | | | | 1,933,957 | |
MRI Software LLC | | | | | | | | |
7.80% (1 Month USD LIBOR + 5.75%, Rate Floor: 6.75%) due 06/30/23††† | | | 1,338,358 | | | | 1,324,973 | |
7.80% (1 Month USD LIBOR + 5.75%, Rate Floor: 6.75%) due 06/30/23 | | | 480,198 | | | | 475,396 | |
Solera LLC | | | | | | | | |
6.54% (1 Month USD LIBOR + 4.50% and 1 Week USD LIBOR + 4.50%, Rate Floor: 4.50%) due 03/03/21†††,1 | | | 1,350,000 | | | | 1,273,213 | |
38 | THE GUGGENHEIM FUNDS ANNUAL REPORT | SEE NOTES TO CONSOLIDATED FINANCIAL STATEMENTS. |
CONSOLIDATED SCHEDULE OF INVESTMENTS (continued) | September 30, 2019 |
MACRO OPPORTUNITIES FUND | |
| | Face
Amount~ | | | Value | |
Kar Finland Bidco Oy | | | | | | | | |
4.50% (3 Month EURIBOR + 4.50%, Rate Floor: 4.50%) due 11/27/23††† | | EUR | 1,000,000 | | | $ | 1,079,372 | |
Aston FinCo S.A.R.L. | | | | | | | | |
due 09/19/26 | | | 750,000 | | | | 742,972 | |
Aspect Software, Inc. | | | | | | | | |
7.21% (3 Month USD LIBOR + 5.00%, Rate Floor: 6.00%) due 01/15/24 | | | 695,294 | | | | 656,183 | |
Targus Group International, Inc. | | | | | | | | |
due 05/24/16†††,1,2,17 | | | 152,876 | | | | — | |
Total Technology | | | | | | | 77,666,829 | |
| | | | | | | | | |
Industrial - 0.9% |
Tronair Parent, Inc. | | | | | | | | |
6.93% (3 Month USD LIBOR + 4.75% and 3 Month USD LIBOR + 4.75%, Rate Floor: 5.75%) due 09/08/23††† | | | 6,566,501 | | | | 5,909,850 | |
Diversitech Holdings, Inc. | | | | | | | | |
5.10% (3 Month USD LIBOR + 3.00%, Rate Floor: 4.00%) due 06/03/24 | | | 4,294,287 | | | | 4,194,101 | |
9.60% (3 Month USD LIBOR + 7.50%, Rate Floor: 8.50%) due 06/02/25 | | | 1,000,000 | | | | 975,000 | |
PT Intermediate Holdings III LLC | | | | | | | | |
6.04% (1 Month USD LIBOR + 4.00%, Rate Floor: 5.00%) due 12/09/24 | | | 3,954,927 | | | | 3,842,884 | |
10.04% (1 Month USD LIBOR + 8.00%, Rate Floor: 9.00%) due 12/08/25††† | | | 400,000 | | | | 396,000 | |
Hillman Group, Inc. | | | | | | | | |
6.04% (1 Month USD LIBOR + 4.00%, Rate Floor: 4.00%) due 05/30/25 | | | 4,349,950 | | | | 4,214,710 | |
Titan Acquisition Ltd. (Husky) | | | | | | | | |
5.04% (1 Month USD LIBOR + 3.00%, Rate Floor: 3.00%) due 03/28/25 | | | 4,284,750 | | | | 4,107,533 | |
Lineage Logistics LLC | | | | | | | | |
5.04% (1 Month USD LIBOR + 3.00%, Rate Floor: 4.00%) due 02/27/25 | | | 3,356,425 | | | | 3,356,425 | |
YAK MAT (YAK ACCESS LLC) | | | | | | | | |
12.06% (1 Month USD LIBOR + 10.00%, Rate Floor: 10.00%) due 07/10/26 | | | 3,400,000 | | | | 2,929,678 | |
Hanjin International Corp. | | | | | | | | |
4.55% (1 Month USD LIBOR + 2.50%, Rate Floor: 2.50%) due 10/19/20 | | | 2,600,000 | | | | 2,600,000 | |
Fortis Solutions Group LLC | | | | | | | | |
6.54% (1 Month USD LIBOR + 4.50%, Rate Floor: 5.50%) due 12/15/23†††,1 | | | 1,797,801 | | | | 1,797,801 | |
SEE NOTES TO CONSOLIDATED FINANCIAL STATEMENTS. | THE GUGGENHEIM FUNDS ANNUAL REPORT | 39 |
CONSOLIDATED SCHEDULE OF INVESTMENTS (continued) | September 30, 2019 |
MACRO OPPORTUNITIES FUND | |
| | Face
Amount~ | | | Value | |
6.55% (1 Month USD LIBOR + 4.50%, Rate Floor: 5.50%) due 12/15/23†††,1 | | | 748,895 | | | $ | 748,895 | |
Bioplan USA, Inc. | | | | | | | | |
6.79% (1 Month USD LIBOR + 4.75%, Rate Floor: 5.75%) due 09/23/21 | | | 2,620,702 | | | | 2,384,839 | |
Dimora Brands, Inc. | | | | | | | | |
5.54% (1 Month USD LIBOR + 3.50%, Rate Floor: 4.50%) due 08/24/24 | | | 2,435,262 | | | | 2,368,293 | |
Pelican Products, Inc. | | | | | | | | |
5.54% (1 Month USD LIBOR + 3.50%, Rate Floor: 4.50%) due 05/01/25 | | | 2,468,750 | | | | 2,363,828 | |
BWAY Holding Co. | | | | | | | | |
5.59% (3 Month USD LIBOR + 3.25%, Rate Floor: 3.25%) due 04/03/24 | | | 1,880,759 | | | | 1,839,496 | |
Bhi Investments LLC | | | | | | | | |
6.70% (6 Month USD LIBOR + 4.50% and 6 Month USD LIBOR + 4.50%, Rate Floor: 5.50%) due 08/28/24 | | | 1,629,063 | | | | 1,610,736 | |
National Technical Systems | | | | | | | | |
8.35% (1 Month USD LIBOR + 6.25%, Rate Floor: 7.25%) due 06/12/21†††,1 | | | 1,549,252 | | | | 1,498,901 | |
SLR Consulting Ltd. | | | | | | | | |
6.04% (1 Month USD LIBOR + 4.00%, Rate Floor: 4.00%) due 06/23/25†††,1 | | | 1,190,970 | | | | 1,164,581 | |
6.05% (1 Month USD LIBOR + 4.00%, Rate Floor: 4.00%) due 05/23/25†††,1 | | | 124,420 | | | | 121,663 | |
5.70% (1 Month USD LIBOR + 4.00%, Rate Floor: 4.00%) due 06/23/25†††,1 | | GBP | 44,180 | | | | 53,121 | |
Safety Bidco Ltd. | | | | | | | | |
4.97% (1 Month GBP LIBOR + 4.25%, Rate Floor: 4.25%) due 10/25/24†††,1 | | GBP | 850,000 | | | | 1,037,549 | |
Klockner Pentaplast of America, Inc. | | | | | | | | |
4.75% (3 Month EURIBOR + 4.75%, Rate Floor: 4.75%) due 06/30/22 | | EUR | 1,100,000 | | | | 1,010,244 | |
API Heat Transfer | | | | | | | | |
8.10% (3 Month USD LIBOR + 6.00%, Rate Floor: 6.00%) due 01/01/24††† | | | 953,472 | | | | 781,847 | |
8.10% (3 Month USD LIBOR + 6.00%, Rate Floor: 6.00%) due 10/02/23††† | | | 170,110 | | | | 153,099 | |
Flex Acquisition Company, Inc. | | | | | | | | |
5.57% (3 Month USD LIBOR + 3.25%, Rate Floor: 3.25%) due 06/30/25 | | | 837,811 | | | | 805,606 | |
Duran Group Holding GMBH | | | | | | | | |
4.00% (3 Month EURIBOR + 4.00%, Rate Floor: 4.00%) due 03/29/24††† | | EUR | 438,217 | | | | 463,444 | |
40 | THE GUGGENHEIM FUNDS ANNUAL REPORT | SEE NOTES TO CONSOLIDATED FINANCIAL STATEMENTS. |
CONSOLIDATED SCHEDULE OF INVESTMENTS (continued) | September 30, 2019 |
MACRO OPPORTUNITIES FUND | |
| | Face
Amount~ | | | Value | |
4.00% (3 Month EURIBOR + 4.00%, Rate Floor: 4.00%) due 12/20/24††† | | EUR | 149,592 | | | $ | 158,204 | |
Transcendia Holdings, Inc. | | | | | | | | |
5.54% (1 Month USD LIBOR + 3.50%, Rate Floor: 4.50%) due 05/30/24 | | | 638,625 | | | | 528,462 | |
STS Operating, Inc. (SunSource) | | | | | | | | |
6.29% (1 Month USD LIBOR + 4.25%, Rate Floor: 5.25%) due 12/11/24 | | | 325,000 | | | | 317,281 | |
Total Industrial | | | | | | | 53,734,071 | |
| | | | | | | | | |
Consumer, Non-cyclical - 0.6% |
Springs Window Fashions | | | | | | | | |
6.30% (1 Month USD LIBOR + 4.25%, Rate Floor: 4.25%) due 06/15/25 | | | 6,284,023 | | | | 6,174,053 | |
10.55% (1 Month USD LIBOR + 8.50%, Rate Floor: 8.50%) due 06/15/26 | | | 5,500,000 | | | | 5,183,750 | |
Diamond (BC) B.V. | | | | | | | | |
5.26% (3 Month USD LIBOR + 3.00%, Rate Floor: 3.00%) due 09/06/24 | | | 11,161,045 | | | | 10,616,944 | |
ScribeAmerica Intermediate Holdco LLC (Healthchannels) | | | | | | | | |
6.54% (1 Month USD LIBOR + 4.50%, Rate Floor: 4.50%) due 04/03/25 | | | 4,680,148 | | | | 4,580,695 | |
BCPE Eagle Buyer LLC | | | | | | | | |
6.29% (1 Month USD LIBOR + 4.25%, Rate Floor: 5.25%) due 03/18/24 | | | 2,840,644 | | | | 2,789,172 | |
Affordable Care Holdings Corp. | | | | | | | | |
6.84% (2 Month USD LIBOR + 4.75%, Rate Floor: 5.75%) due 10/24/22††† | | | 2,695,655 | | | | 2,601,307 | |
CPI Holdco LLC | | | | | | | | |
5.54% (3 Month USD LIBOR + 3.50%, Rate Floor: 4.50%) due 03/21/24 | | | 1,895,612 | | | | 1,893,242 | |
Certara, Inc. | | | | | | | | |
5.54% (1 Month USD LIBOR + 3.50%, Rate Floor: 3.50%) due 08/15/24††† | | | 1,658,805 | | | | 1,646,364 | |
Give and Go Prepared Foods Corp. | | | | | | | | |
6.29% (1 Month USD LIBOR + 4.25%, Rate Floor: 5.25%) due 07/29/23 | | | 1,671,391 | | | | 1,561,364 | |
CTI Foods Holding Co. LLC | | | | | | | | |
9.26% (3 Month USD LIBOR + 7.00%, Rate Floor: 8.00%) due 05/03/24††† | | | 755,739 | | | | 759,517 | |
SEE NOTES TO CONSOLIDATED FINANCIAL STATEMENTS. | THE GUGGENHEIM FUNDS ANNUAL REPORT | 41 |
CONSOLIDATED SCHEDULE OF INVESTMENTS (continued) | September 30, 2019 |
MACRO OPPORTUNITIES FUND | |
| | Face
Amount~ | | | Value | |
11.26% (3 Month USD LIBOR + 9.00%, Rate Floor: 10.00%) due 05/03/24††† | | | 371,507 | | | $ | 349,216 | |
Executive Consulting Group LLC | | | | | | | | |
6.54% (1 Month USD LIBOR + 4.50%, Rate Floor: 5.50%) due 06/20/24†††,1 | | | 943,934 | | | | 936,505 | |
Recess Holdings, Inc. | | | | | | | | |
5.79% (1 Month USD LIBOR + 3.75%, Rate Floor: 4.75%) due 09/30/24 | | | 783,529 | | | | 769,817 | |
Moran Foods LLC | | | | | | | | |
8.10% (3 Month USD LIBOR + 6.00%, Rate Floor: 7.00%) due 12/05/23 | | | 1,737,622 | | | | 726,900 | |
Total Consumer, Non-cyclical | | | 40,588,846 | |
| | | | | | | | | |
Communications - 0.6% |
Trader Interactive | | | | | | | | |
8.54% (1 Month USD LIBOR + 6.50%, Rate Floor: 7.50%) due 06/17/24†††,1 | | | 10,844,845 | | | | 10,718,300 | |
Mcgraw-Hill Global Education Holdings LLC | | | | | | | | |
6.04% (1 Month USD LIBOR + 4.00%, Rate Floor: 5.00%) due 05/04/22 | | | 9,716,456 | | | | 9,117,728 | |
Flight Bidco, Inc. | | | | | | | | |
5.54% (1 Month USD LIBOR + 3.50%, Rate Floor: 3.50%) due 07/23/25 | | | 3,925,708 | | | | 3,881,544 | |
9.54% (1 Month USD LIBOR + 7.50%, Rate Floor: 7.50%) due 07/23/26 | | | 1,000,000 | | | | 987,500 | |
Market Track LLC | | | | | | | | |
6.29% (1 Month USD LIBOR + 4.25%, Rate Floor: 5.25%) due 06/05/24††† | | | 4,165,000 | | | | 3,748,500 | |
Resource Label Group LLC | | | | | | | | |
6.82% (3 Month USD LIBOR + 4.50%, Rate Floor: 5.50%) due 05/26/23††† | | | 1,947,926 | | | | 1,733,654 | |
10.82% (3 Month USD LIBOR + 8.50%, Rate Floor: 9.50%) due 11/26/23††† | | | 1,500,000 | | | | 1,245,000 | |
Cengage Learning Acquisitions, Inc. | | | | | | | | |
6.29% (1 Month USD LIBOR + 4.25%, Rate Floor: 5.25%) due 06/07/23 | | | 2,213,400 | | | | 2,089,826 | |
SFR Group S.A. | | | | | | | | |
6.03% (1 Month USD LIBOR + 4.00%, Rate Floor: 4.00%) due 08/14/26 | | | 1,786,500 | | | | 1,780,551 | |
Liberty Cablevision of Puerto Rico LLC | | | | | | | | |
5.53% (1 Month USD LIBOR + 3.50%, Rate Floor: 4.50%) due 01/07/22 | | | 1,355,000 | | | | 1,349,919 | |
42 | THE GUGGENHEIM FUNDS ANNUAL REPORT | SEE NOTES TO CONSOLIDATED FINANCIAL STATEMENTS. |
CONSOLIDATED SCHEDULE OF INVESTMENTS (continued) | September 30, 2019 |
MACRO OPPORTUNITIES FUND | |
| | Face
Amount~ | | | Value | |
Houghton Mifflin Co. | | | | | | | | |
5.04% (1 Month USD LIBOR + 3.00%, Rate Floor: 4.00%) due 05/28/21 | | | 1,383,362 | | | $ | 1,340,712 | |
Imagine Print Solutions LLC | | | | | | | | |
6.80% (1 Month USD LIBOR + 4.75%, Rate Floor: 5.75%) due 06/21/22 | | | 1,608,750 | | | | 1,068,210 | |
Total Communications | | | | | | | 39,061,444 | |
| | | | | | | | | |
Financial - 0.3% |
Teneo Holdings LLC | | | | | | | | |
7.29% (1 Month USD LIBOR + 5.25%, Rate Floor: 6.25%) due 07/11/25 | | | 5,550,000 | | | | 5,286,375 | |
USI, Inc. | | | | | | | | |
5.10% (3 Month USD LIBOR + 3.00%, Rate Floor: 3.00%) due 05/16/24 | | | 4,528,977 | | | | 4,450,671 | |
Aretec Group, Inc. | | | | | | | | |
6.29% (1 Month USD LIBOR + 4.25%, Rate Floor: 4.25%) due 10/01/25 | | | 3,870,750 | | | | 3,730,435 | |
Camelia Bidco Banc Civica | | | | | | | | |
5.51% (3 Month GBP LIBOR + 4.75%, Rate Floor: 4.75%) due 10/14/24 | | GBP | 3,000,000 | | | | 3,619,736 | |
Northstar Financial Services LLC | | | | | | | | |
5.54% (1 Month USD LIBOR + 3.50%, Rate Floor: 4.25%) due 05/26/25 | | | 1,333,959 | | | | 1,312,282 | |
Masergy Holdings, Inc. | | | | | | | | |
5.35% (3 Month USD LIBOR + 3.25%, Rate Floor: 4.25%) due 12/15/23 | | | 1,110,068 | | | | 1,090,642 | |
Total Financial | | | | | | | 19,490,141 | |
| | | | | | | | | |
Basic Materials - 0.2% |
GrafTech Finance, Inc. | | | | | | | | |
5.54% (1 Month USD LIBOR + 3.50%, Rate Floor: 4.50%) due 02/12/25 | | | 4,715,100 | | | | 4,577,560 | |
Vectra Co. | | | | | | | | |
5.29% (1 Month USD LIBOR + 3.25%, Rate Floor: 3.25%) due 03/08/25 | | | 2,715,625 | | | | 2,640,945 | |
ICP Industrial, Inc. | | | | | | | | |
6.04% (1 Month USD LIBOR + 4.00%, Rate Floor: 5.00%) due 11/03/23††† | | | 2,460,415 | | | | 2,448,114 | |
LTI Holdings, Inc. | | | | | | | | |
5.54% (1 Month USD LIBOR + 3.50%, Rate Floor: 3.50%) due 09/06/25 | | | 1,485,000 | | | | 1,402,583 | |
ASP Chromaflo Dutch I B.V. | | | | | | | | |
5.54% (1 Month USD LIBOR + 3.50%, Rate Floor: 4.50%) due 11/20/23 | | | 753,404 | | | | 730,335 | |
ASP Chromaflo Intermediate Holdings, Inc. | | | | | | | | |
5.54% (1 Month USD LIBOR + 3.50%, Rate Floor: 4.50%) due 11/20/23 | | | 579,399 | | | | 561,658 | |
Total Basic Materials | | | | | | | 12,361,195 | |
| | | | | | | | | |
SEE NOTES TO CONSOLIDATED FINANCIAL STATEMENTS. | THE GUGGENHEIM FUNDS ANNUAL REPORT | 43 |
CONSOLIDATED SCHEDULE OF INVESTMENTS (continued) | September 30, 2019 |
MACRO OPPORTUNITIES FUND | |
| | Face
Amount~ | | | Value | |
Energy - 0.2% |
Permian Production Partners LLC | | | | | | | | |
8.05% (1 Month USD LIBOR + 6.00%, Rate Floor: 7.00%) due 05/20/24††† | | | 11,732,500 | | | $ | 5,866,250 | |
SeaPort Financing LLC | | | | | | | | |
7.55% (1 Month USD LIBOR + 5.50%, Rate Floor: 5.50%) due 10/31/25 | | | 3,126,375 | | | | 3,063,848 | |
Summit Midstream Partners, LP | | | | | | | | |
8.04% (1 Month USD LIBOR + 6.00%, Rate Floor: 7.00%) due 05/13/22 | | | 1,099,603 | | | | 1,073,762 | |
Ultra Petroleum, Inc. | | | | | | | | |
6.05% (1 Month USD LIBOR + 3.75%, Rate Floor: 4.75%) (in-kind rate was 0.25%) due 04/12/2412 | | | 1,554,907 | | | | 1,022,351 | |
Gavilan Resources LLC | | | | | | | | |
8.04% (1 Month USD LIBOR + 6.00%, Rate Floor: 7.00%) due 03/01/24 | | | 2,050,000 | | | | 884,923 | |
Total Energy | | | | | | | 11,911,134 | |
| | | | | | | | | |
Utilities - 0.1% |
MRP Generation Holding | | | | | | | | |
9.10% (3 Month USD LIBOR + 7.00%, Rate Floor: 8.00%) due 10/18/22 | | | 3,395,000 | | | | 3,344,075 | |
UGI Energy Services, Inc. | | | | | | | | |
5.79% (1 Month USD LIBOR + 3.75%, Rate Floor: 3.75%) due 08/13/26††† | | | 2,194,500 | | | | 2,208,216 | |
Panda Power | | | | | | | | |
8.60% (3 Month USD LIBOR + 6.50%, Rate Floor: 7.50%) due 08/21/20 | | | 2,369,942 | | | | 2,029,856 | |
Total Utilities | | | | | | | 7,582,147 | |
Total Senior Floating Rate Interests | | | | |
(Cost $411,065,657) | | | | | | | 380,348,339 | |
| | | | | | | | | |
U.S. GOVERNMENT SECURITIES†† - 4.2% |
U.S. Treasury Notes | | | | | | | | |
2.38% due 02/29/24 | | | 186,531,000 | | | | 192,979,434 | |
U.S. Treasury Inflation Protected Securities | | | | | | | | |
1.38% due 01/15/2013 | | | 67,828,246 | | | | 67,621,582 | |
Total U.S. Government Securities | | | | |
(Cost $261,704,582) | | | | | | | 260,601,016 | |
| | | | | | | | | |
SENIOR FIXED RATE INTERESTS††† - 0.1% |
Communications - 0.1% |
MHGE Parent LLC | | | | | | | | |
11.00% due 04/20/221 | | | 4,700,000 | | | | 4,504,269 | |
Total Senior Fixed Rate Interests | | | | |
(Cost $4,624,718) | | | | | | | 4,504,269 | |
| | | | | | | | | |
MUNICIPAL BONDS†† - 0.0% |
California - 0.0% |
Palm Desert Redevelopment Agency Successor Agency Tax Allocation | | | | | | | | |
2.00% due 10/01/19 | | | 525,000 | | | | 525,000 | |
44 | THE GUGGENHEIM FUNDS ANNUAL REPORT | SEE NOTES TO CONSOLIDATED FINANCIAL STATEMENTS. |
CONSOLIDATED SCHEDULE OF INVESTMENTS (continued) | September 30, 2019 |
MACRO OPPORTUNITIES FUND | |
| | Face
Amount~ | | | Value | |
Brentwood Infrastructure Financing Authority Revenue Bonds | | | | | | | | |
7.50% due 10/01/19 | | | 35,000 | | | $ | 35,000 | |
Total California | | | | | | | 560,000 | |
| | | | | | | | | |
Utah - 0.0% |
County of Utah Utah Transportation Sales Tax Revenue Revenue Bonds | | | | | | | | |
5.57% due 12/01/19 | | | 100,000 | | | | 100,599 | |
| | | | | | | | | |
Tennessee - 0.0% |
City of Memphis Tennessee Sanitary Sewerage System Revenue Revenue Bonds | | | | | | | | |
6.30% due 10/01/19 | | | 50,000 | | | | 50,000 | |
| | | | | | | | | |
Texas - 0.0% |
Lindale Independent School District General Obligation Unlimited | | | | | | | | |
6.26% due 02/15/20 | | | 25,000 | | | | 25,397 | |
Total Municipal Bonds | | | | | | | | |
(Cost $736,472) | | | | | | | 735,996 | |
| | | | | | | | | |
REPURCHASE AGREEMENTS††,14 - 7.5% |
J.P. Morgan Securities LLC | | | | | | | | |
issued 09/30/19 at 2.35% due 10/01/19 | | | 50,838,000 | | | | 50,838,000 | |
issued 09/24/19 at 3.00% due 10/01/19 | | | 25,000,000 | | | | 25,000,000 | |
issued 09/25/19 at 3.00% due 10/01/19 | | | 10,000,000 | | | | 10,000,000 | |
issued 09/27/19 at 2.50% due 10/01/19 | | | 9,924,000 | | | | 9,924,000 | |
issued 09/30/19 at 2.37% due 10/01/19 | | | 7,646,000 | | | | 7,646,000 | |
BNP Paribas | | | | | | | | |
issued 08/01/19 at 2.47% due 11/01/19 | | | 60,283,132 | | | | 60,283,132 | |
issued 08/01/19 at 2.47% due 10/07/19 | | | 22,714,307 | | | | 22,714,307 | |
issued 08/09/19 at 2.47% due 11/01/19 | | | 14,577,504 | | | | 14,577,504 | |
issued 01/31/19 at 2.10% open maturity15 | | | 93,500 | | | | 93,500 | |
issued 02/06/19 at 2.10% open maturity15 | | | 83,475 | | | | 83,475 | |
Societe Generale | | | | | | | | |
issued 07/09/19 at 2.74% (3 Month USD LIBOR + 0.40%) due 04/07/206 | | | 40,119,998 | | | | 40,119,998 | |
issued 09/10/19 at 2.54% (3 Month USD LIBOR + 0.40%) due 04/07/206 | | | 22,458,000 | | | | 22,458,000 | |
issued 07/26/19 at 2.66% (3 Month USD LIBOR + 0.40%) due 04/07/206 | | | 21,200,000 | | | | 21,200,000 | |
issued 09/12/19 at 2.54% (3 Month USD LIBOR + 0.40%) due 04/07/206 | | | 4,292,000 | | | | 4,292,000 | |
issued 08/15/19 at 2.74% (3 Month USD LIBOR + 0.40%) due 04/07/206 | | | 2,787,790 | | | | 2,787,790 | |
SEE NOTES TO CONSOLIDATED FINANCIAL STATEMENTS. | THE GUGGENHEIM FUNDS ANNUAL REPORT | 45 |
CONSOLIDATED SCHEDULE OF INVESTMENTS (continued) | September 30, 2019 |
MACRO OPPORTUNITIES FUND | |
| | Face
Amount~ | | | Value | |
issued 07/22/19 at 2.74% (3 Month USD LIBOR + 0.40%) due 04/07/206 | | | 2,405,525 | | | $ | 2,405,525 | |
issued 07/15/19 at 2.74% (3 Month USD LIBOR + 0.40%) due 04/07/206 | | | 1,251,803 | | | | 1,251,803 | |
Barclays Capital Inc. | | | | | | | | |
issued 09/05/19 at 2.27% (1 Month USD LIBOR + 0.25%) due 11/04/196 | | | 37,931,821 | | | | 37,931,821 | |
issued 08/05/19 at 1.55% open maturity15 | | | 11,671,438 | | | | 11,671,438 | |
issued 09/11/19 at 2.27% (1 Month USD LIBOR + 0.25%) due 11/04/196 | | | 8,046,200 | | | | 8,046,200 | |
issued 09/18/19 at 2.27% (1 Month USD LIBOR + 0.25%) due 11/04/196 | | | 4,408,125 | | | | 4,408,125 | |
issued 07/24/19 at (13.00)% open maturity15 | | | 1,380,000 | | | | 1,380,000 | |
issued 08/05/19 at 1.75% open maturity15 | | | 740,250 | | | | 740,250 | |
issued 09/25/19 at 2.27% (1 Month USD LIBOR + 0.25%) due 11/04/196 | | | 604,143 | | | | 604,143 | |
issued 08/15/19 at (13.00)% open maturity15 | | | 119,925 | | | | 119,925 | |
issued 08/05/19 at 1.35% open maturity15 | | | 109,725 | | | | 109,725 | |
issued 08/21/19 at (13.00)% open maturity15 | | | 64,050 | | | | 64,050 | |
Deutsche Bank | | | | | | | | |
issued 08/06/19 at 2.62% due 11/06/19 | | | 46,486,000 | | | | 46,486,000 | |
BofA Securities, Inc. | | | | | | | | |
issued 09/25/19 at 2.80% due 10/01/19 | | | 30,000,000 | | | | 30,000,000 | |
issued 08/02/19 at 1.65% open maturity15 | | | 13,933,525 | | | | 13,933,525 | |
issued 08/02/19 at 1.60% open maturity15 | | | 201,250 | | | | 201,250 | |
Citigroup Global Markets Inc. | | | | | | | | |
issued 03/15/19 at 1.60% open maturity15 | | | 16,389,000 | | | | 16,389,000 | |
issued 03/07/19 at 1.55% open maturity15 | | | 1,278,000 | | | | 1,278,000 | |
issued 04/16/19 at 1.50% open maturity15 | | | 719,000 | | | | 719,000 | |
issued 03/05/19 at 1.35% open maturity15 | | | 551,000 | | | | 551,000 | |
issued 02/07/19 at 1.60% open maturity15 | | | 406,000 | | | | 406,000 | |
issued 02/14/19 at 1.60% open maturity15 | | | 230,000 | | | | 230,000 | |
issued 02/04/19 at 1.60% open maturity15 | | | 200,000 | | | | 200,000 | |
46 | THE GUGGENHEIM FUNDS ANNUAL REPORT | SEE NOTES TO CONSOLIDATED FINANCIAL STATEMENTS. |
CONSOLIDATED SCHEDULE OF INVESTMENTS (continued) | September 30, 2019 |
MACRO OPPORTUNITIES FUND | |
| | Face
Amount~ | | | Value | |
issued 04/18/19 at 1.60% open maturity15 | | | 139,000 | | | $ | 139,000 | |
issued 01/31/19 at 1.60% open maturity15 | | | 90,750 | | | | 90,750 | |
issued 02/06/19 at 1.60% open maturity15 | | | 82,000 | | | | 82,000 | |
issued 02/08/19 at 1.60% open maturity15 | | | 56,000 | | | | 56,000 | |
RBC Capital Markets, LLC | | | | | | | | |
issued 09/19/19 at 1.55% open maturity15 | | | 520,125 | | | | 520,125 | |
issued 09/19/19 at 1.65% open maturity15 | | | 211,775 | | | | 211,775 | |
Total Repurchase Agreements | | | | |
(Cost $472,244,136) | | | | | | | 472,244,136 | |
| | | | | | | | | |
COMMERCIAL PAPER†† - 1.8% |
Walgreens Boots Alliance, Inc. | | | | | | | | |
2.41% due 01/13/2016 | | | 30,000,000 | | | | 29,798,750 | |
2.51% due 11/07/1916 | | | 15,000,000 | | | | 14,963,979 | |
2.27% due 10/02/1916 | | | 10,000,000 | | | | 9,999,369 | |
Clorox Co. | | | | | | | | |
2.21% due 10/08/195,16 | | | 20,000,000 | | | | 19,991,406 | |
Public Service Enterprise Group, Inc. | | | | | | | | |
2.25% due 10/22/195,16 | | | 19,300,000 | | | | 19,274,669 | |
Ryder System, Inc. | | | | | | | | |
2.27% due 10/01/1916 | | | 10,000,000 | | | | 10,000,000 | |
Marriott International, Inc. | | | | | | | | |
2.26% due 10/15/195,16 | | | 10,000,000 | | | | 9,991,056 | |
Total Commercial Paper | | | | |
(Cost $114,005,470) | | | | | | | 114,019,229 | |
| | | | | | | | | |
| | | Notional
Value | | | | | |
OTC OPTIONS PURCHASED†† - 0.2% |
Put options on: | | | | | | | | |
Bank of America, N.A. 2Y-10 CMS CAP Expiring July 2022 with strike price of $0.40 | | | 2,402,900,000 | | | | 4,109,031 | |
Morgan Stanley Capital Services LLC 2Y-10 CMS CAP Expiring July 2022 with strike price of $0.40 | | | 2,186,900,000 | | | | 3,739,665 | |
Goldman Sachs International 2Y-10 CMS CAP Expiring July 2022 with strike price of $0.61 | | | 1,601,800,000 | | | | 1,627,845 | |
Goldman Sachs International 2Y-10 CMS CAP Expiring July 2022 with strike price of $0.40 | | | 463,200,000 | | | | 792,086 | |
SEE NOTES TO CONSOLIDATED FINANCIAL STATEMENTS. | THE GUGGENHEIM FUNDS ANNUAL REPORT | 47 |
CONSOLIDATED SCHEDULE OF INVESTMENTS (continued) | September 30, 2019 |
MACRO OPPORTUNITIES FUND | |
| | Notional
Value/Face
Amount~ | | | Value | |
Bank of America, N.A. 2Y-10 CMS CAP Expiring July 2022 with strike price of $0.61 | | | 82,200,000 | | | $ | 83,536 | |
Total OTC Options Purchased | | | | |
(Cost $14,307,624) | | | | | | | 10,352,163 | |
| | | | | | | | | |
Total Investments - 100.7% | | | | |
(Cost $6,433,731,366) | | | | | | | 6,350,882,458 | |
| |
CORPORATE BONDS SOLD SHORT†† - (0.8)% |
Financial - 0.0% |
Enova International, Inc. | | | | | | | | |
8.50% due 09/15/255 | | | 110,000 | | | | (99,963 | ) |
Acrisure LLC / Acrisure Finance, Inc. | | | | | | | | |
7.00% due 11/15/255 | | | 1,000,000 | | | | (932,300 | ) |
Total Financial | | | | | | | (1,032,263 | ) |
| |
Communications - (0.1)% |
Univision Communications, Inc. | | | | | | | | |
5.13% due 05/15/235 | | | 510,000 | | | | (511,594 | ) |
5.13% due 02/15/255 | | | 2,620,000 | | | | (2,546,247 | ) |
Total Communications | | | (3,057,841 | ) |
| | | | | |
Consumer, Non-cyclical - (0.1)% |
Quorum Health Corp. | | | | | | | | |
11.63% due 04/15/23 | | | 1,700,000 | | | | (1,525,750 | ) |
Tenet Healthcare Corp. | | | | | | | | |
8.13% due 04/01/22 | | | 2,425,000 | | | | (2,622,759 | ) |
Total Consumer, Non-cyclical | | | (4,148,509 | ) |
| |
Technology - (0.1)% |
Seagate HDD Cayman | | | | | | | | |
4.75% due 01/01/25 | | | 8,000,000 | | | | (8,292,040 | ) |
| |
Industrial - (0.2)% |
Park-Ohio Industries, Inc. | | | | | | | | |
6.63% due 04/15/27 | | | 1,400,000 | | | | (1,337,000 | ) |
Flex Ltd. | | | | | | | | |
4.75% due 06/15/25 | | | 2,210,000 | | | | (2,380,028 | ) |
Spirit AeroSystems, Inc. | | | | | | | | |
4.60% due 06/15/28 | | | 10,110,000 | | | | (10,887,096 | ) |
Total Industrial | | | | | | | (14,604,124 | ) |
| |
Consumer, Cyclical - (0.3)% |
Harley-Davidson, Inc. | | | | | | | | |
3.50% due 07/28/25 | | | 1,330,000 | | | | (1,369,377 | ) |
Staples, Inc. | | | | | | | | |
10.75% due 04/15/275 | | | 1,875,000 | | | | (1,926,562 | ) |
Dollar Tree, Inc. | | | | | | | | |
4.00% due 05/15/25 | | | 15,080,000 | | | | (15,978,368 | ) |
Total Consumer, Cyclical | | | (19,274,307 | ) |
Total Corporate Bonds Sold Short | | | | |
(Proceeds $46,674,111) | | | | | | | (50,409,084 | ) |
Other Assets & Liabilities, net - 0.1% | | | 6,762,751 | |
Total Net Assets - 100.0% | | $ | 6,307,236,125 | |
Futures Contracts |
| |
Description | | Number of
Contracts | | | Expiration
Date | | | Notional
Amount | | | Value and
Unrealized
Appreciation** | |
Interest Rate Futures Contracts Sold Short† |
U.S. Treasury 5 Year Note Futures Contracts | | | 1,621 | | | | Dec 2019 | | | $ | 193,152,281 | | | $ | 909,673 | |
48 | THE GUGGENHEIM FUNDS ANNUAL REPORT | SEE NOTES TO CONSOLIDATED FINANCIAL STATEMENTS. |
CONSOLIDATED SCHEDULE OF INVESTMENTS (continued) | September 30, 2019 |
MACRO OPPORTUNITIES FUND | |
Centrally Cleared Credit Default Swap Agreements Protection Purchased†† |
| |
Counterparty | Exchange | Index | | Protection
Premium
Rate | | | Payment
Frequency | | | Maturity
Date | |
BofA Securities, Inc. | ICE | CDX.NA.IG.31 | | | 1.00 | % | | | Quarterly | | | | 12/20/23 | |
Counterparty | | Notional
Amount | | | Value | | | Upfront
Premiums
Received | | | Unrealized
Depreciation** | |
BofA Securities, Inc. | | $ | 997,215,000 | | | $ | (21,650,425 | ) | | $ | (9,905,888 | ) | | $ | (11,744,537 | ) |
OTC Credit Default Swap Agreements Protection Purchased†† |
| |
Counterparty | Index/Reference Obligation | | Protection
Premium
Rate | | | Payment
Frequency | | | Maturity
Date | |
Goldman Sachs International | L Brands, Inc. | | | 1.00 | % | | | Quarterly | | | | 12/20/24 | |
Morgan Stanley Capital Services LLC | Hertz Corp. | | | 5.00 | % | | | Quarterly | | | | 12/20/24 | |
Morgan Stanley Capital Services LLC | CDX.NA.IG.31 (7-15%) | | | 1.00 | % | | | Quarterly | | | | 12/20/23 | |
Goldman Sachs International | CDX.NA.IG.31 (7-15%) | | | 1.00 | % | | | Quarterly | | | | 12/20/23 | |
Counterparty | | Notional
Amount | | | Value | | | Upfront
Premiums
Paid
(Received) | | | Unrealized
Appreciation
(Depreciation) | |
Goldman Sachs International | | $ | 410,000 | | | $ | 45,334 | | | $ | 44,888 | | | $ | 446 | |
Morgan Stanley Capital Services LLC | | | 500,000 | | | | (32,642 | ) | | | (37,497 | ) | | | 4,855 | |
Morgan Stanley Capital Services LLC | | | 73,830,000 | | | | (1,468,522 | ) | | | (15,541 | ) | | | (1,452,981 | ) |
Goldman Sachs International | | | 166,350,000 | | | | (3,308,802 | ) | | | (251,525 | ) | | | (3,057,277 | ) |
| | | | | | | $ | (4,764,632 | ) | | $ | (259,675 | ) | | $ | (4,504,957 | ) |
Centrally Cleared Interest Rate Swap Agreements†† |
| |
Counterparty | Exchange | Floating
Rate Type | Floating
Rate Index | | Fixed
Rate | | | Payment
Frequency | | | Maturity
Date | |
BofA Securities, Inc. | CME | Pay | 3-Month USD LIBOR | | | 2.79 | % | | | Quarterly | | | | 01/21/20 | |
BofA Securities, Inc. | CME | Receive | 3-Month USD LIBOR | | | 1.54 | % | | | Quarterly | | | | 08/04/21 | |
BofA Securities, Inc. | CME | Pay | 3-Month USD LIBOR | | | 2.84 | % | | | Quarterly | | | | 01/31/20 | |
BofA Securities, Inc. | CME | Pay | 3-Month USD LIBOR | | | 2.92 | % | | | Quarterly | | | | 01/31/20 | |
BofA Securities, Inc. | CME | Pay | 3-Month USD LIBOR | | | 2.83 | % | | | Quarterly | | | | 01/31/20 | |
BofA Securities, Inc. | CME | Receive | 3-Month USD LIBOR | | | 2.83 | % | | | Quarterly | | | | 01/31/20 | |
BofA Securities, Inc. | CME | Receive | 3-Month USD LIBOR | | | 2.92 | % | | | Quarterly | | | | 01/31/20 | |
BofA Securities, Inc. | CME | Receive | 3-Month USD LIBOR | | | 2.84 | % | | | Quarterly | | | | 01/31/20 | |
BofA Securities, Inc. | CME | Receive | 3-Month USD LIBOR | | | 2.79 | % | | | Quarterly | | | | 01/21/20 | |
BofA Securities, Inc. | CME | Receive | 3-Month USD LIBOR | | | 3.18 | % | | | Quarterly | | | | 11/07/23 | |
BofA Securities, Inc. | CME | Receive | 3-Month USD LIBOR | | | 3.14 | % | | | Quarterly | | | | 11/06/21 | |
SEE NOTES TO CONSOLIDATED FINANCIAL STATEMENTS. | THE GUGGENHEIM FUNDS ANNUAL REPORT | 49 |
CONSOLIDATED SCHEDULE OF INVESTMENTS (continued) | September 30, 2019 |
MACRO OPPORTUNITIES FUND | |
Centrally Cleared Interest Rate Swap Agreements†† (continued) |
| |
Counterparty | | Notional
Amount | | | Value | | | Upfront
Premiums
Paid
(Received) | | | Unrealized
Appreciation
(Depreciation)** | |
BofA Securities, Inc. | | $ | 97,955,000 | | | $ | 192,780 | | | $ | 149,054 | | | $ | 43,726 | |
BofA Securities, Inc. | | | 23,700,000 | | | | 53,352 | | | | 340 | | | | 53,012 | |
BofA Securities, Inc. | | | 16,742,000 | | | | 37,393 | | | | 28,799 | | | | 8,594 | |
BofA Securities, Inc. | | | 9,744,000 | | | | 24,468 | | | | 19,317 | | | | 5,151 | |
BofA Securities, Inc. | | | 10,276,000 | | | | 22,612 | | | | 17,334 | | | | 5,278 | |
BofA Securities, Inc. | | | 10,276,000 | | | | (22,612 | ) | | | 95 | | | | (22,707 | ) |
BofA Securities, Inc. | | | 9,744,000 | | | | (24,468 | ) | | | 92 | | | | (24,560 | ) |
BofA Securities, Inc. | | | 16,742,000 | | | | (37,393 | ) | | | 99 | | | | (37,492 | ) |
BofA Securities, Inc. | | | 97,955,000 | | | | (192,781 | ) | | | 122 | | | | (192,903 | ) |
BofA Securities, Inc. | | | 63,000,000 | | | | (4,168,963 | ) | | | (10,227 | ) | | | (4,158,736 | ) |
BofA Securities, Inc. | | | 830,000,000 | | | | (25,933,632 | ) | | | 148,731 | | | | (26,082,363 | ) |
| | | | | | | $ | (30,049,244 | ) | | $ | 353,756 | | | $ | (30,403,000 | ) |
Total Return Swap Agreements |
| |
Counterparty | Reference
Obligation | Financing
Rate Pay | Payment
Frequency | | Maturity
Date | | | Units | | | Notional
Amount | | | Value and
Unrealized
Depreciation | |
OTC Sovereign Debt Swap Agreements†† |
Deutsche Bank AG | Korea Monetary Stabilization Bond | 2.58% (3 Month USD LIBOR + 0.45%) | At Maturity | | | 08/04/21 | | | | N/A | | | $ | 23,661,343 | | | $ | (117,049 | ) |
Forward Foreign Currency Exchange Contracts††
Counterparty | | Contracts
to Sell | | | Currency | | | Settlement
Date | | | Settlement
Value | | | Value at
September 30,
2019 | | | Unrealized
Appreciation
(Depreciation) | |
JPMorgan Chase Bank, N.A. | | | 302,900,000 | | BRL | | | 10/01/19 | | | $ | 77,203,450 | | | $ | 72,973,885 | | | $ | 4,229,565 | |
Citibank N.A., New York | | | 303,500,000 | | BRL | | | 07/01/20 | | | | 75,789,059 | | | | 71,949,863 | | | | 3,839,196 | |
Citibank N.A., New York | | | 205,550,000 | | BRL | | | 10/01/19 | | | | 52,272,168 | | | | 49,520,574 | | | | 2,751,594 | |
Goldman Sachs International | | | 200,000,000 | | BRL | | | 10/01/19 | | | | 50,131,357 | | | | 48,183,483 | | | | 1,947,874 | |
Goldman Sachs International | | | 48,568,000 | | EUR | | | 04/30/20 | | | | 55,697,782 | | | | 53,774,349 | | | | 1,923,433 | |
JPMorgan Chase Bank, N.A. | | | 178,600,000 | | BRL | | | 07/01/21 | | | | 42,785,007 | | | | 40,920,205 | | | | 1,864,802 | |
Citibank N.A., New York | | | 122,150,000 | | BRL | | | 07/01/21 | | | | 29,677,307 | | | | 27,986,579 | | | | 1,690,728 | |
Goldman Sachs International | | | 70,300,000 | | BRL | | | 07/01/20 | | | | 18,254,999 | | | | 16,665,817 | | | | 1,589,182 | |
Goldman Sachs International | | | 28,600,000 | | EUR | | | 01/17/20 | | | | 33,024,955 | | | | 31,447,995 | | | | 1,576,960 | |
50 | THE GUGGENHEIM FUNDS ANNUAL REPORT | SEE NOTES TO CONSOLIDATED FINANCIAL STATEMENTS. |
CONSOLIDATED SCHEDULE OF INVESTMENTS (continued) | September 30, 2019 |
MACRO OPPORTUNITIES FUND | |
Forward Foreign Currency Exchange Contracts†† (continued) |
| |
Counterparty | | Contracts
to Sell | | | Currency | | | Settlement
Date | | | Settlement
Value | | | Value at
September 30,
2019 | | | Unrealized
Appreciation
(Depreciation) | |
Citibank N.A., New York | | | 6,320,158,500 | | JPY | | | 07/01/21 | | | $ | 62,232,010 | | | $ | 60,807,553 | | | $ | 1,424,457 | |
Barclays Bank plc | | | 24,540,000 | | EUR | | | 01/17/20 | | | | 28,341,246 | | | | 26,983,699 | | | | 1,357,547 | |
Barclays Bank plc | | | 6,018,007,500 | | JPY | | | 07/01/21 | | | | 59,168,297 | | | | 57,900,496 | | | | 1,267,801 | |
Goldman Sachs International | | | 32,149,325 | | EUR | | | 07/30/21 | | | | 37,345,460 | | | | 36,583,721 | | | | 761,739 | |
Bank of America, N.A. | | | 10,421,000,000 | | JPY | | | 01/21/20 | | | | 97,955,539 | | | | 97,217,999 | | | | 737,540 | |
Citibank N.A., New York | | | 125,900,000 | | BRL | | | 01/02/20 | | | | 30,693,310 | | | | 30,185,447 | | | | 507,863 | |
JPMorgan Chase Bank, N.A. | | | 29,016,000 | | EUR | | | 07/30/21 | | | | 33,489,397 | | | | 33,018,213 | | | | 471,184 | |
Bank of America, N.A. | | | 9,065,200 | | EUR | | | 06/15/20 | | | | 10,424,753 | | | | 10,066,659 | | | | 358,094 | |
Goldman Sachs International | | | 7,943,840 | | EUR | | | 06/15/20 | | | | 9,140,024 | | | | 8,821,420 | | | | 318,604 | |
Citibank N.A., New York | | | 5,229,613,500 | | JPY | | | 06/01/20 | | | | 49,474,130 | | | | 49,178,668 | | | | 295,462 | |
JPMorgan Chase Bank, N.A. | | | 5,621,809,500 | | JPY | | | 09/01/20 | | | | 53,437,730 | | | | 53,157,616 | | | | 280,114 | |
Bank of America, N.A. | | | 17,691,000 | | GBP | | | 10/15/19 | | | | 21,899,901 | | | | 21,766,307 | | | | 133,594 | |
Bank of America, N.A. | | | 1,973,886,450 | | JPY | | | 04/15/20 | | | | 18,618,233 | | | | 18,510,037 | | | | 108,196 | |
Goldman Sachs International | | | 6,915,250,000 | | JPY | | | 10/21/19 | | | | 64,153,945 | | | | 64,054,605 | | | | 99,340 | |
Bank of America, N.A. | | | 2,288,143,500 | | JPY | | | 06/22/20 | | | | 21,641,384 | | | | 21,544,448 | | | | 96,936 | |
JPMorgan Chase Bank, N.A. | | | 617,308,500 | | JPY | | | 03/23/20 | | | | 5,829,935 | | | | 5,780,763 | | | | 49,172 | |
Bank of America, N.A. | | | 2,788,000 | | EUR | | | 10/15/19 | | | | 3,091,867 | | | | 3,042,964 | | | | 48,903 | |
Goldman Sachs International | | | 10,613,600,000 | | JPY | | | 01/10/20 | | | | 98,994,535 | | | | 98,948,078 | | | | 46,457 | |
Goldman Sachs International | | | 8,850,000 | | BRL | | | 07/01/21 | | | | 2,073,328 | | | | 2,027,681 | | | | 45,647 | |
JPMorgan Chase Bank, N.A. | | | 833,416,500 | | JPY | | | 06/01/20 | | | | 7,876,910 | | | | 7,837,350 | | | | 39,560 | |
Goldman Sachs International | | | 358,704,500 | | JPY | | | 03/23/20 | | | | 3,388,897 | | | | 3,359,076 | | | | 29,821 | |
JPMorgan Chase Bank, N.A. | | | 3,988,000 | | CAD | | | 10/15/19 | | | | 3,035,837 | | | | 3,011,739 | | | | 24,098 | |
JPMorgan Chase Bank, N.A. | | | 400,000,000 | | JPY | | | 10/07/19 | | | | 3,724,787 | | | | 3,701,250 | | | | 23,537 | |
Deutsche Bank AG | | | 28,528,010,536 | | KRW | | | 08/04/21 | | | | 24,328,851 | | | | 24,318,931 | | | | 9,920 | |
Goldman Sachs International | | | 239,325 | | EUR | | | 07/30/20 | | | | 272,041 | | | | 266,531 | | | | 5,510 | |
Goldman Sachs International | | | 92,466,974 | | JPY | | | 06/22/20 | | | | 875,099 | | | | 870,640 | | | | 4,459 | |
JPMorgan Chase Bank, N.A. | | | 216,000 | | EUR | | | 07/30/20 | | | | 244,084 | | | | 240,554 | | | | 3,530 | |
Citibank N.A., New York | | | 2,653,400,000 | | JPY | | | 01/10/20 | | | | 24,739,634 | | | | 24,737,019 | | | | 2,615 | |
Citibank N.A., New York | | | 3,158,500 | | JPY | | | 01/06/20 | | | | 30,208 | | | | 29,439 | | | | 769 | |
SEE NOTES TO CONSOLIDATED FINANCIAL STATEMENTS. | THE GUGGENHEIM FUNDS ANNUAL REPORT | 51 |
CONSOLIDATED SCHEDULE OF INVESTMENTS (continued) | September 30, 2019 |
MACRO OPPORTUNITIES FUND | |
Forward Foreign Currency Exchange Contracts†† (continued) |
| |
Counterparty | | Contracts
to Sell | | | Currency | | | Settlement
Date | | | Settlement
Value | | | Value at
September 30,
2019 | | | Unrealized
Appreciation
(Depreciation) | |
Citibank N.A., New York | | | 3,158,500 | | JPY | | | 07/01/20 | | | $ | 30,507 | | | $ | 29,755 | | | $ | 752 | |
Citibank N.A., New York | | | 3,158,500 | | JPY | | | 01/04/21 | | | | 30,823 | | | | 30,082 | | | | 741 | |
Barclays Bank plc | | | 3,007,500 | | JPY | | | 01/06/20 | | | | 28,722 | | | | 28,031 | | | | 691 | |
Barclays Bank plc | | | 3,007,500 | | JPY | | | 07/01/20 | | | | 29,011 | | | | 28,333 | | | | 678 | |
Barclays Bank plc | | | 3,007,500 | | JPY | | | 01/04/21 | | | | 29,299 | | | | 28,644 | | | | 655 | |
Citibank N.A., New York | | | 2,613,500 | | JPY | | | 12/02/19 | | | | 24,416 | | | | 24,273 | | | | 143 | |
JPMorgan Chase Bank, N.A. | | | 2,809,500 | | JPY | | | 03/02/20 | | | | 26,403 | | | | 26,276 | | | | 127 | |
Bank of America, N.A. | | | 986,450 | | JPY | | | 10/15/19 | | | | 9,185 | | | | 9,133 | | | | 52 | |
Bank of America, N.A. | | | 1,143,500 | | JPY | | | 12/20/19 | | | | 10,678 | | | | 10,641 | | | | 37 | |
Goldman Sachs International | | | 1,005,950 | | JPY | | | 12/20/19 | | | | 9,398 | | | | 9,361 | | | | 37 | |
JPMorgan Chase Bank, N.A. | | | 416,500 | | JPY | | | 12/02/19 | | | | 3,886 | | | | 3,868 | | | | 18 | |
Deutsche Bank AG | | | 76,160,536 | | KRW | | | 02/04/21 | | | | 64,570 | | | | 64,569 | | | | 1 | |
Deutsche Bank AG | | | 76,160,536 | | KRW | | | 08/05/20 | | | | 64,184 | | | | 64,191 | | | | (7 | ) |
Deutsche Bank AG | | | 76,160,536 | | KRW | | | 11/04/20 | | | | 64,379 | | | | 64,388 | | | | (9 | ) |
Deutsche Bank AG | | | 73,677,040 | | KRW | | | 05/07/21 | | | | 62,624 | | | | 62,636 | | | | (12 | ) |
Deutsche Bank AG | | | 74,504,872 | | KRW | | | 05/11/20 | | | | 62,573 | | | | 62,589 | | | | (16 | ) |
Deutsche Bank AG | | | 76,160,536 | | KRW | | | 02/05/20 | | | | 63,760 | | | | 63,776 | | | | (16 | ) |
Deutsche Bank AG | | | 76,160,536 | | KRW | | | 11/06/19 | | | | 63,568 | | | | 63,585 | | | | (17 | ) |
Bank of America, N.A. | | | 793,970 | | ILS | | | 04/30/20 | | | | 231,603 | | | | 231,972 | | | | (369 | ) |
Bank of America, N.A. | | | 384,952 | | ILS | | | 01/31/20 | | | | 110,443 | | | | 111,750 | | | | (1,307 | ) |
Bank of America, N.A. | | | 383,900 | | ILS | | | 02/01/21 | | | | 112,169 | | | | 113,742 | | | | (1,573 | ) |
Goldman Sachs International | | | 384,350 | | ILS | | | 04/30/20 | | | | 110,657 | | | | 112,295 | | | | (1,638 | ) |
Citibank N.A., New York | | | 1,924,258 | | ILS | | | 04/30/20 | | | | 556,891 | | | | 562,205 | | | | (5,314 | ) |
JPMorgan Chase Bank, N.A. | | | 4,400,000 | | CAD | | | 10/03/19 | | | | 3,315,192 | | | | 3,322,191 | | | | (6,999 | ) |
Bank of America, N.A. | | | 7,363,900 | | ILS | | | 01/31/22 | | | | 2,183,190 | | | | 2,213,995 | | | | (30,805 | ) |
Bank of America, N.A. | | | 79,971,800 | | ILS | | | 04/30/21 | | | | 23,698,471 | | | | 23,784,965 | | | | (86,494 | ) |
Goldman Sachs International | | | 38,713,300 | | ILS | | | 04/30/21 | | | | 11,336,277 | | | | 11,513,990 | | | | (177,713 | ) |
Goldman Sachs International | | | 57,434,200 | | ILS | | | 01/31/22 | | | | 17,016,598 | | | | 17,267,891 | | | | (251,293 | ) |
Goldman Sachs International | | | 72,830,756 | | ILS | | | 02/01/21 | | | | 21,256,017 | | | | 21,578,381 | | | | (322,364 | ) |
Barclays Bank plc | | | 72,975,000 | | ILS | | | 01/31/20 | | | | 20,646,485 | | | | 21,184,420 | | | | (537,935 | ) |
Citibank N.A., New York | | | 193,819,000 | | ILS | | | 04/30/21 | | | | 56,980,496 | | | | 57,645,048 | | | | (664,552 | ) |
Goldman Sachs International | | | 136,481,600 | | ILS | | | 01/31/20 | | | | 37,719,406 | | | | 39,620,192 | | | | (1,900,786 | ) |
| | | | | | | | | | | | | | | | | | | | | | | $ | 25,980,516 | |
52 | THE GUGGENHEIM FUNDS ANNUAL REPORT | SEE NOTES TO CONSOLIDATED FINANCIAL STATEMENTS. |
CONSOLIDATED SCHEDULE OF INVESTMENTS (continued) | September 30, 2019 |
MACRO OPPORTUNITIES FUND | |
Forward Foreign Currency Exchange Contracts†† (continued) |
| |
Counterparty | | Contracts
to Buy | | | Currency | | | Settlement
Date | | | Settlement
Value | | | Value at
September 30,
2019 | | | Unrealized
Appreciation
(Depreciation) | |
Citibank N.A., New York | | | 70,845,000 | | BRL | | | 10/01/19 | | | $ | 17,229,261 | | | $ | 17,067,794 | | | $ | (161,467 | ) |
Morgan Stanley Capital Services LLC | | | 637,605,000 | | BRL | | | 10/01/19 | | | | 154,503,399 | | | | 153,610,147 | | | | (893,252 | ) |
| | | | | | | | | | | | | | | | | | | | | | | $ | (1,054,719 | ) |
~ | The face amount is denominated in U.S. dollars unless otherwise indicated. |
* | Non-income producing security. |
** | Includes cumulative appreciation (depreciation). Variation margin is reported within the Statement of Assets and Liabilities. |
† | Value determined based on Level 1 inputs, unless otherwise noted — See Note 4. |
†† | Value determined based on Level 2 inputs, unless otherwise noted — See Note 4. |
††† | Value determined based on Level 3 inputs — See Note 4. |
1 | Security was fair valued by the Valuation Committee at September 30, 2019. The total market value of fair valued securities amounts to $126,933,845, (cost $125,587,734) or 2.0% of total net assets. |
2 | Affiliated issuer. |
3 | Perpetual maturity. |
4 | Rate indicated is the 7-day yield as of September 30, 2019. |
5 | Security is a 144A or Section 4(a)(2) security. These securities have been determined to be liquid under guidelines established by the Board of Trustees. The total market value of 144A or Section 4(a)(2) securities is $1,662,753,268 (cost $1,666,560,882), or 26.4% of total net assets. |
6 | Variable rate security. Rate indicated is the rate effective at September 30, 2019. In some instances, the effective rate is limited by a minimum rate floor or a maximum rate cap established by the issuer. The settlement status of a position may also impact the effective rate indicated. In some cases, a position may be unsettled at period end and may not have a stated effective rate. In instances where multiple underlying reference rates and spread amounts are shown, the effective rate is based on a weighted average. |
7 | Security has no stated coupon. However, it is expected to receive residual cash flow payments on defined deal dates. |
8 | Security is a 144A or Section 4(a)(2) security. These securities have been determined to be illiquid and restricted under guidelines established by the Board of Trustees. The total market value of 144A or Section 4(a)(2) illiquid and restricted securities is $28,373,257 (cost $33,107,656), or 0.4% of total net assets — See Note 9. |
9 | Security is a step up/down bond. The coupon increases or decreases at regular intervals until the bond reaches full maturity. Rate indicated is the rate at September 30, 2019. See table below for additional step information for each security. |
10 | Zero coupon rate security. |
11 | Security has a fixed rate coupon which will convert to a floating or variable rate coupon on a future date. |
12 | Payment-in-kind security. |
13 | Face amount of security is adjusted for inflation. |
14 | Repurchase Agreements — The interest rate on repurchase agreements is market driven and based on the underlying collateral obtained. See additional disclosure in the repurchase agreements table below for more information on repurchase agreements. |
15 | The rate is adjusted periodically by the counterparty, subject to approval by the Adviser, and is not based upon a set reference rate and spread. Rate indicated is the rate effective at September 30, 2019. |
16 | Rate indicated is the effective yield at the time of purchase. |
17 | Security is in default of interest and/or principal obligations. |
18 | Effective November 30, 2018, Guggenheim Strategy Fund I was reorganized with and into the Guggenheim Ultra Short Duration Fund. |
SEE NOTES TO CONSOLIDATED FINANCIAL STATEMENTS. | THE GUGGENHEIM FUNDS ANNUAL REPORT | 53 |
CONSOLIDATED SCHEDULE OF INVESTMENTS (continued) | September 30, 2019 |
MACRO OPPORTUNITIES FUND | |
| | BofA — Bank of America |
| | BRL — Brazilian Real |
| | CAD — Canadian Dollar |
| | CDX.NA.IG.31 — Credit Default Swap North American Investment Grade Series 31 Index |
| | CME — Chicago Mercantile Exchange |
| | CMS — Constant Maturity Swap |
| | CMT — Constant Maturity Treasury |
| | EUR — Euro |
| | EURIBOR — European Interbank Offered Rate |
| | GBP — British Pound |
| | ICE — Intercontinental Exchange |
| | ILS — Israeli New Shekel |
| | JPY — Japanese Yen |
| | KRW — South Korean Won |
| | LIBOR — London Interbank Offered Rate |
| | plc — Public Limited Company |
| | WAC — Weighted Average Coupon |
| | |
| | See Sector Classification in Other Information section. |
54 | THE GUGGENHEIM FUNDS ANNUAL REPORT | SEE NOTES TO CONSOLIDATED FINANCIAL STATEMENTS. |
CONSOLIDATED SCHEDULE OF INVESTMENTS (continued) | September 30, 2019 |
MACRO OPPORTUNITIES FUND | |
The following table summarizes the inputs used to value the Fund’s investments at September 30, 2019 (See Note 4 in the Notes to Financial Statements):
Investments in Securities (Assets) | | Level 1
Quoted
Prices | | | Level 2
Significant
Observable
Inputs | | | Level 3
Significant
Unobservable
Inputs | | | Total | |
Common Stocks | | $ | 2,295,517 | | | $ | 1,438,474 | | | $ | 15,982,467 | | | $ | 19,716,458 | |
Preferred Stocks | | | — | | | | 1,614,548 | | | | — | | | | 1,614,548 | |
Exchange-Traded Funds | | | 75,277,720 | | | | — | | | | — | | | | 75,277,720 | |
Mutual Funds | | | 675,682,792 | | | | — | | | | — | | | | 675,682,792 | |
Money Market Funds | | | 50,248,099 | | | | — | | | | — | | | | 50,248,099 | |
Asset-Backed Securities | | | — | | | | 1,399,420,526 | | | | 126,277,348 | | | | 1,525,697,874 | |
Foreign Government Debt | | | — | | | | 1,131,796,648 | | | | — | | | | 1,131,796,648 | |
Collateralized Mortgage Obligations | | | — | | | | 870,053,646 | | | | 10,909,455 | | | | 880,963,101 | |
Corporate Bonds | | | — | | | | 702,677,653 | | | | 44,402,417 | | | | 747,080,070 | |
Senior Floating Rate Interests | | | — | | | | 275,526,899 | | | | 104,821,440 | | | | 380,348,339 | |
U.S. Government Securities | | | — | | | | 260,601,016 | | | | — | | | | 260,601,016 | |
Senior Fixed Rate Interests | | | — | | | | — | | | | 4,504,269 | | | | 4,504,269 | |
Municipal Bonds | | | — | | | | 735,996 | | | | — | | | | 735,996 | |
Repurchase Agreements | | | — | | | | 472,244,136 | | | | — | | | | 472,244,136 | |
Commercial Paper | | | — | | | | 114,019,229 | | | | — | | | | 114,019,229 | |
Options Purchased | | | — | | | | 10,352,163 | | | | — | | | | 10,352,163 | |
Interest Rate Futures Contracts** | | | 909,673 | | | | — | | | | — | | | | 909,673 | |
Credit Default Swap Agreements** | | | — | | | | 5,301 | | | | — | | | | 5,301 | |
Interest Rate Swap Agreements** | | | — | | | | 115,761 | | | | — | | | | 115,761 | |
Forward Foreign Currency Exchange Contracts** | | | — | | | | 29,969,735 | | | | — | | | | 29,969,735 | |
Total Assets | | $ | 804,413,801 | | | $ | 5,270,571,731 | | | $ | 306,897,396 | | | $ | 6,381,882,928 | |
Investments in Securities (Liabilities) | | Level 1
Quoted
Prices | | | Level 2
Significant
Observable
Inputs | | | Level 3
Significant
Unobservable
Inputs | | | Total | |
Corporate Bonds Sold Short | | $ | — | | | $ | 50,409,084 | | | $ | — | | | $ | 50,409,084 | |
Credit Default Swap Agreements** | | | — | | | | 16,254,795 | | | | — | | | | 16,254,795 | |
Interest Rate Swap Agreements** | | | — | | | | 30,518,761 | | | | — | | | | 30,518,761 | |
Total Return Swap Agreements** | | | — | | | | 117,049 | | | | — | | | | 117,049 | |
Forward Foreign Currency Exchange Contracts** | | | — | | | | 5,043,938 | | | | — | | | | 5,043,938 | |
Unfunded Loan Commitments (Note 8) | | | — | | | | — | | | | 1,140,482 | | | | 1,140,482 | |
Total Liabilities | | $ | — | | | $ | 102,343,627 | | | $ | 1,140,482 | | | $ | 103,484,109 | |
** | This derivative is reported as unrealized appreciation/depreciation at period end. |
SEE NOTES TO CONSOLIDATED FINANCIAL STATEMENTS. | THE GUGGENHEIM FUNDS ANNUAL REPORT | 55 |
CONSOLIDATED SCHEDULE OF INVESTMENTS (continued) | September 30, 2019 |
MACRO OPPORTUNITIES FUND | |
The following is a summary of significant unobservable inputs used in the fair valuation of assets and liabilities categorized within Level 3 of the fair value hierarchy:
Category | | Ending
Balance at
September 30,
2019 | | Valuation
Technique | Unobservable
Inputs | | Input
Range | | | Weighted
Average* | |
Assets: | | | | | | | | | | | | | | |
Asset-Backed Securities | | $ | 66,704,323 | | Option Adjusted Spread off the prior month broker mark over the 3 Month LIBOR | Broker Quote | | | — | | | | — | |
Asset-Backed Securities | | | 59,573,025 | | Yield Analysis | Yield | | | 3.4%-5.1% | | | | 4.6 | % |
Collateralized Mortgage Obligations | | | 10,909,455 | | Option Adjusted Spread off the prior month broker mark over the 3 Month LIBOR | Broker Quote | | | — | | | | — | |
Common Stocks | | | 9,640,679 | | Third Party Pricing | Broker Quote | | | — | | | | — | |
Common Stocks | | | 6,341,788 | | Enterprise Value | Valuation Multiple | | | 1.9x-15.8x | | | | 5.3x | |
Corporate Bonds | | | 44,402,417 | | Option Adjusted Spread off the prior month broker mark over the 3 Month LIBOR | Broker Quote | | | — | | | | — | |
Senior Fixed Rate Interests | | | 4,504,269 | | Model Price | Market Comparable Yields | | | 8.4 | % | | | — | |
Senior Floating Rate Interests | | | 46,364,923 | | Third Party Pricing | Broker Quote | | | — | | | | — | |
Senior Floating Rate Interests | | | 41,134,621 | | Yield Analysis | Yield | | | 5.1%-10.6% | | | | 8.1 | % |
Senior Floating Rate Interests | | | 8,752,298 | | Model Price | Liquidation Value | | | — | | | | — | |
Senior Floating Rate Interests | | | 2,546,696 | | Enterprise Value | Valuation Multiple | | | 10.4x | | | | — | |
Senior Floating Rate Interests | | | 1,941,754 | | Option Adjusted Spread off the prior month broker mark over the 3 Month LIBOR | Broker Quote | | | — | | | | — | |
Senior Floating Rate Interests | | | 1,645,742 | | Model Price | Purchase Price | | | — | | | | — | |
Senior Floating Rate Interests | | | 1,498,901 | | Model Price | Market Comparable Yields | | | 5.9 | % | | | — | |
Senior Floating Rate Interests | | | 936,505 | | Model Price | Acquisition Price | | | — | | | | — | |
Total Assets | | $ | 306,897,396 | | | | | | | | | | | |
56 | THE GUGGENHEIM FUNDS ANNUAL REPORT | SEE NOTES TO CONSOLIDATED FINANCIAL STATEMENTS. |
CONSOLIDATED SCHEDULE OF INVESTMENTS (continued) | September 30, 2019 |
MACRO OPPORTUNITIES FUND | |
Category | | Ending
Balance at
September 30,
2019 | | Valuation
Technique | Unobservable
Inputs | | Input
Range | | | Weighted
Average* | |
Liabilities: | | | | | | | | | | | | | | |
Unfunded Loan Commitments | | $ | 1,140,482 | | Model Price | Purchase Price | | | — | | | | — | |
* | Inputs are weighted by the fair value of the instruments. |
Significant changes in a quote, yield, market comparable yields, liquidation value or valuation multiples would generally result in significant changes in the fair value of the security.
The Fund’s fair valuation leveling guidelines were recently revised to classify a single daily broker quote, or a vendor price based on a single daily or monthly broker quote, as Level 3 rather than Level 2, if such a quote or price cannot be supported with other available market information.
Transfers between Level 2 and Level 3 may occur as markets fluctuate and/or the availability of data used in an investment’s valuation changes. For the year ended September 30, 2019, the Fund had securities with a total value of $57,067,638 transfer into Level 3 from Level 2 due to lack of observable inputs. For the year ended September 30, 2019, the Fund had liabilities with a total value of $733,171 transfer into Level 3 from Level 2 due to lack of observable inputs. There were no other securities that transferred between levels.
Summary of Fair Value Level 3 Activity
Following is a reconciliation of Level 3 assets for which significant unobservable inputs were used to determine fair value for the year ended September 30, 2019:
| | | Assets | |
| | Asset-
Backed
Securities | | | Collateralized
Mortgage
Obligations | | | Corporate
Bonds | | | Senior
Floating Rate
Interests | | | Common
Stocks | |
Beginning Balance | | $ | 66,401,735 | | | $ | — | | | $ | 43,444,723 | | | $ | 75,522,776 | | | $ | 5,502,560 | |
Purchases/(Receipts) | | | 56,550,000 | | | | — | | | | — | | | | 32,724,068 | | | | 1,658,853 | |
(Sales, maturities and paydowns)/Fundings | | | (1,562,959 | ) | | | — | | | | (481,944 | ) | | | (32,021,927 | ) | | | (12,239 | ) |
Amortization of premiums/discounts | | | 10,916 | | | | — | | | | (3,909 | ) | | | 527,936 | | | | — | |
Total realized gains (losses) included in earnings | | | — | | | | — | | | | 31,752 | | | | (324,274 | ) | | | — | |
Total change in unrealized appreciation (depreciation) included in earnings | | | 1,915,957 | | | | — | | | | 1,411,795 | | | | (5,467,863 | ) | | | (502,467 | ) |
Transfers into Level 3 | | | 2,961,699 | | | | 10,909,455 | | | | — | | | | 33,860,724 | | | | 9,335,760 | |
Transfers out of Level 3 | | | — | | | | — | | | | — | | | | — | | | | — | |
Ending Balance | | $ | 126,277,348 | | | $ | 10,909,455 | | | $ | 44,402,417 | | | $ | 104,821,440 | | | $ | 15,982,467 | |
Net change in unrealized appreciation (depreciation) for investments in Level 3 securities still held at September 30, 2019 | | $ | 1,915,957 | | | $ | — | | | $ | 1,411,795 | | | $ | (5,672,649 | ) | | $ | (502,467 | ) |
SEE NOTES TO CONSOLIDATED FINANCIAL STATEMENTS. | THE GUGGENHEIM FUNDS ANNUAL REPORT | 57 |
CONSOLIDATED SCHEDULE OF INVESTMENTS (continued) | September 30, 2019 |
MACRO OPPORTUNITIES FUND | |
| | | Assets | | | | | | | Liabilities | |
| | Senior
Fixed Rate
Interests | | | Total
Assets | | | Unfunded
Loan
Commitments | |
Beginning Balance | | $ | 4,448,080 | | | $ | 195,319,874 | | | $ | (754,340 | ) |
Purchases/(Receipts) | | | — | | | | 90,932,921 | | | | (540,131 | ) |
(Sales, maturities and paydowns)/Fundings | | | — | | | | (34,079,069 | ) | | | 719,986 | |
Amortization of premiums/discounts | | | 29,180 | | | | 564,123 | | | | (5,926 | ) |
Total realized gains (losses) included in earnings | | | — | | | | (292,522 | ) | | | 3,351 | |
Total change in unrealized appreciation (depreciation) included in earnings | | | 27,009 | | | | (2,615,569 | ) | | | 169,749 | |
Transfers into Level 3 | | | — | | | | 57,067,638 | | | | (733,171 | ) |
Transfers out of Level 3 | | | — | | | | — | | | | — | |
Ending Balance | | $ | 4,504,269 | | | $ | 306,897,396 | | | $ | (1,140,482 | ) |
Net change in unrealized appreciation (depreciation) for investments in Level 3 securities still held at September 30, 2019 | | $ | 27,009 | | | $ | (2,820,355 | ) | | $ | 188,100 | |
Step Coupon Bonds
The following table discloses additional information related to step coupon bonds held by the Fund. Certain securities are subject to multiple rate changes prior to maturity. For those securities a range of rates and corresponding dates have been provided. Rates for all step coupon bonds held by the Fund are scheduled to increase, none are scheduled to decrease.
Name | | Coupon Rate
at Next Reset
Date | | | Next Rate
Reset Date | | | Future
Reset Rate(s) | | | Future
Reset Date(s) | |
Legacy Mortgage Asset Trust 2018-GS3, 4.00% due 06/25/58 | | | 7.00 | % | | | 07/26/21 | | | | 8.00 | % | | | 07/26/22 | |
Willis Engine Securitization Trust II 2012-A, 5.50% due 09/15/37 | | | 8.50 | % | | | 09/15/20 | | | | — | | | | — | |
58 | THE GUGGENHEIM FUNDS ANNUAL REPORT | SEE NOTES TO CONSOLIDATED FINANCIAL STATEMENTS. |
CONSOLIDATED SCHEDULE OF INVESTMENTS (continued) | September 30, 2019 |
MACRO OPPORTUNITIES FUND | |
Repurchase Agreements
In connection with transactions in repurchase agreements, it is the Fund’s policy that its custodian takes possession of the underlying collateral. For the following repurchase agreements, the collateral is in the possession of the Fund’s custodian and is evaluated to ensure that its market value exceeds, at a minimum, 102% of the original face amount of the repurchase agreements, with the exception of where securities are being sold short. The interest rate on repurchase agreements is market driven and based on the underlying collateral obtained.
The Fund may engage in repurchase agreements. Repurchase agreements are fixed income securities in the form of agreements backed by collateral. These agreements typically involve the acquisition by the Fund of securities from the selling institution coupled with the agreement that the selling institution will repurchase the underlying securities at a specified price and at a fixed time in the future. The Fund may accept a wide variety of underlying securities as collateral for the repurchase agreements entered into by the Fund. Any such securities serving as collateral are marked-to-market daily in order to maintain full collateralization. Securities purchased under repurchase agreements are reflected as an asset on the Statement of Assets and Liabilities. Interest earned is recorded as a component of interest income on the Statement of Operations.
The use of repurchase agreements involves certain risks. For example, if the selling institution defaults on its obligation to repurchase the underlying securities at a time when the value of securities has declined, the Fund may incur a loss upon disposition of them. In the event of an insolvency or bankruptcy by the selling institution, the Fund’s right to control the collateral could be affected and result in certain costs and delays. In addition, the Fund could incur a loss if the value of the underlying collateral falls below the agreed upon repurchase price.
At September 30, 2019, the repurchase agreements in the account were as follows:
Counterparty and
Terms of Agreement | | Face
Value | | | Repurchase
Price | | | Collateral | | Par
Value | | | Fair
Value | |
J.P. Morgan Securities LLC | | | | | | | | | | U.S. Treasury Note | | | | | | | | |
2.35% - 3.00% | | | | | | | | | | 2.63% | | | | | | | | |
10/01/19 | | $ | 103,408,000 | | | $ | 103,415,428 | | | 02/28/23 | | $ | 50,000,000 | | | $ | 51,730,000 | |
| | | | | | | | | | | | | | | | | | | |
| | | | | | | | | | | U.S. Treasury Note | | | | | | | | |
| | | | | | | | | | | 2.50% | | | | | | | | |
| | | | | | | | | | | 05/15/24 | | | 24,267,000 | | | | 25,266,800 | |
| | | | | | | | | | | Ginnie Mae II Pool | | | | | | | | |
| | | | | | | | | | | 4.50% | | | | | | | | |
| | | | | | | | | | | 06/20/49 | | | 17,457,000 | | | | 18,329,850 | |
| | | | | | | | | | | Fannie Mae Pool | | | | | | | | |
| | | | | | | | | | | 3.50% | | | | | | | | |
| | | | | | | | | | | 09/01/49 | | | 10,000,000 | | | | 10,274,000 | |
| | | | | | | | | | | | | | 101,724,000 | | | | 105,600,650 | |
| | | | | | | | | | | | | | | | | | | |
SEE NOTES TO CONSOLIDATED FINANCIAL STATEMENTS. | THE GUGGENHEIM FUNDS ANNUAL REPORT | 59 |
CONSOLIDATED SCHEDULE OF INVESTMENTS (continued) | September 30, 2019 |
MACRO OPPORTUNITIES FUND | |
Counterparty and
Terms of Agreement | | Face
Value | | | Repurchase
Price | | | Collateral | | Par
Value | | | Fair
Value | |
BNP Paribas | | | | | | | | | | Morgan Stanley ABS Capital I Inc. Trust | | | | | | | | |
2.47% | | | | | | | | | | 3.04% | | | | | | | | |
10/07/19 - 11/01/19 | | $ | 97,574,943 | | | $ | 98,143,205 | | | 10/25/33 | | $ | 56,315,000 | | | $ | 55,999,636 | |
2.10% | | | | | | | | | | | | | | | | | | |
Open Maturity* | | | 176,975 | | | | 176,975 | | | Long Beach Mortgage Loan Trust | | | | | | | | |
| | | | 97,751,918 | | | | 98,320,180 | | | 3.07% | | | | | | | | |
| | | | | | | | | | | 06/25/35 | | | 27,300,000 | | | | 27,349,140 | |
| | | | | | | | | | | First Franklin Mortgage Loan Trust | | | | | | | | |
| | | | | | | | | | | 2.52% | | | | | | | | |
| | | | | | | | | | | 12/25/35 | | | 23,487,000 | | | | 22,216,353 | |
| | | | | | | | | | | Morgan Stanley ABS Capital I Inc.Trust | | | | | | | | |
| | | | | | | | | | | 2.17% | | | | | | | | |
| | | | | | | | | | | 11/25/36 | | | 27,790,000 | | | | 19,261,249 | |
| | | | | | | | | | | Morgan Stanley ABS Capital I Inc. Trust | | | | | | | | |
| | | | | | | | | | | 2.69% | | | | | | | | |
| | | | | | | | | | | 09/25/35 | | | 17,232,000 | | | | 16,449,667 | |
| | | | | | | | | | | JP Morgan Mortgage Acquisition Corp. | | | | | | | | |
| | | | | | | | | | | 2.64% | | | | | | | | |
| | | | | | | | | | | 12/25/35 | | | 16,459,000 | | | | 16,134,758 | |
| | | | | | | | | | | Morgan Stanley ABS Capital I Inc. Trust | | | | | | | | |
| | | | | | | | | | | 2.80% | | | | | | | | |
| | | | | | | | | | | 01/25/35 | | | 8,000,000 | | | | 7,734,400 | |
| | | | | | | | | | | Fannie Mae Connecticut Avenue Securities | | | | | | | | |
| | | | | | | | | | | 6.47% | | | | | | | | |
| | | | | | | | | | | 01/25/29 | | | 4,000,000 | | | | 4,211,200 | |
| | | | | | | | | | | Structured Asset Securities Corp Mortgage Loan Trust | | | | | | | | |
| | | | | | | | | | | 2.22% | | | | | | | | |
| | | | | | | | | | | 06/25/37 | | | 1,631,000 | | | | 1,128,000 | |
| | | | | | | | | | | Univision Communications Inc. | | | | | | | | |
| | | | | | | | | | | 5.13% | | | | | | | | |
| | | | | | | | | | | 02/15/251 | | | 190,000 | | | | 184,661 | |
| | | | | | | | | | | | | | 182,404,000 | | | | 170,669,064 | |
| | | | | | | | | | | | | | | | | | | |
60 | THE GUGGENHEIM FUNDS ANNUAL REPORT | SEE NOTES TO CONSOLIDATED FINANCIAL STATEMENTS. |
CONSOLIDATED SCHEDULE OF INVESTMENTS (continued) | September 30, 2019 |
MACRO OPPORTUNITIES FUND | |
Counterparty and
Terms of Agreement | | Face
Value | | | Repurchase
Price | | | Collateral | | Par
Value | | | Fair
Value | |
Societe Generale | | | | | | | | | | Connecticut Avenue | | | | | | | | |
2.54% - 2.74% (3 Month USD LIBOR + 0.40%) | | | | | | | | | | Securities Trust 4.12% | | | | | | | | |
04/07/20** | | $ | 94,515,116 | | | $ | 96,305,037 | | | 06/25/39 | | $ | 26,385,455 | | | $ | 26,483,081 | |
| | | | | | | | | | | Connecticut Avenue Securities Trust | | | | | | | | |
| | | | | | | | | | | 4.02% | | | | | | | | |
| | | | | | | | | | | 07/25/39 | | | 20,816,000 | | | | 20,865,958 | |
| | | | | | | | | | | Connecticut Avenue Securities Trust | | | | | | | | |
| | | | | | | | | | | 4.32% | | | | | | | | |
| | | | | | | | | | | 08/25/31 | | | 9,100,000 | | | | 9,146,410 | |
| | | | | | | | | | | STACR Trust | | | | | | | | |
| | | | | | | | | | | 4.12% | | | | | | | | |
| | | | | | | | | | | 09/25/48 | | | 9,100,000 | | | | 9,120,930 | |
| | | | | | | | | | | BX Trust | | | | | | | | |
| | | | | | | | | | | 6.16% | | | | | | | | |
| | | | | | | | | | | 07/15/34 | | | 8,500,000 | | | | 8,521,250 | |
| | | | | | | | | | | Hawaii Hotel Trust | | | | | | | | |
| | | | | | | | | | | 5.06% | | | | | | | | |
| | | | | | | | | | | 05/15/38 | | | 7,600,000 | | | | 7,650,160 | |
| | | | | | | | | | | Motel 6 Trust | | | | | | | | |
| | | | | | | | | | | 6.16% | | | | | | | | |
| | | | | | | | | | | 08/15/34 | | | 6,347,000 | | | | 6,382,543 | |
| | | | | | | | | | | Fannie Mae Connecticut Avenue Securities | | | | | | | | |
| | | | | | | | | | | 4.87% | | | | | | | | |
| | | | | | | | | | | 11/25/29 | | | 5,500,000 | | | | 5,667,200 | |
| | | | | | | | | | | Freddie Mac Structured Agency Credit Risk Debt Notes | | | | | | | | |
| | | | | | | | | | | 6.67% | | | | | | | | |
| | | | | | | | | | | 10/25/28 | | | 3,622,806 | | | | 3,881,837 | |
| | | | | | | | | | | Fannie Mae Connecticut Avenue Securities | | | | | | | | |
| | | | | | | | | | | 5.57% | | | | | | | | |
| | | | | | | | | | | 07/25/29 | | | 3,400,000 | | | | 3,573,400 | |
| | | | | | | | | | | J.P. Morgan Chase Commercial Mortgage Securities Trust | | | | | | | | |
| | | | | | | | | | | 4.32% | | | | | | | | |
| | | | | | | | | | | 06/15/35 | | | 3,000,000 | | | | 2,997,900 | |
| | | | | | | | | | | Fannie Mae Connecticut Avenue Securities | | | | | | | | |
| | | | | | | | | | | 5.02% | | | | | | | | |
| | | | | | | | | | | 10/25/29 | | | 2,870,829 | | | | 2,984,227 | |
SEE NOTES TO CONSOLIDATED FINANCIAL STATEMENTS. | THE GUGGENHEIM FUNDS ANNUAL REPORT | 61 |
CONSOLIDATED SCHEDULE OF INVESTMENTS (continued) | September 30, 2019 |
MACRO OPPORTUNITIES FUND | |
Counterparty and
Terms of Agreement | | Face
Value | | | Repurchase
Price | | | Collateral | | Par
Value | | | Fair
Value | |
| | | | | | | | | | | BXP Trust | | | | | | | | |
| | | | | | | | | | | 5.91% | | | | | | | | |
| | | | | | | | | | | 11/15/34 | | $ | 2,900,000 | | | $ | 2,919,140 | |
| | | | | | | | | | | Credit Suisse Mortgage Capital Certificates | | | | | | | | |
| | | | | | | | | | | 4.56% | | | | | | | | |
| | | | | | | | | | | 05/15/36 | | | 2,700,000 | | | | 2,708,370 | |
| | | | | | | | | | | Bayview Financial Acquisition Trust | | | | | | | | |
| | | | | | | | | | | 6.73% | | | | | | | | |
| | | | | | | | | | | 05/28/37 | | | 2,000,000 | | | | 2,258,800 | |
| | | | | | | | | | | Freddie Mac Structured Agency Credit Risk Debt Notes | | | | | | | | |
| | | | | | | | | | | 6.27% | | | | | | | | |
| | | | | | | | | | | 11/25/23 | | | 1,716,893 | | | | 1,847,549 | |
| | | | | | | | | | | Natixis Commercial Mortgage Securities Trust | | | | | | | | |
| | | | | | | | | | | 5.20% | | | | | | | | |
| | | | | | | | | | | 02/15/33 | | | 1,600,000 | | | | 1,590,400 | |
| | | | | | | | | | | Carlyle Global Market Strategies CLO Ltd. | | | | | | | | |
| | | | | | | | | | | 9.57% | | | | | | | | |
| | | | | | | | | | | 04/22/32 | | | 1,500,000 | | | | 1,474,950 | |
| | | | | | | | | | | OHA Loan Funding Ltd. | | | | | | | | |
| | | | | | | | | | | 8.78% | | | | | | | | |
| | | | | | | | | | | 01/20/28 | | | 1,100,000 | | | | 1,082,290 | |
| | | | | | | | | | | | | | 119,758,983 | | | | 121,156,395 | |
| | | | | | | | | | | | | | | | | | | |
Barclays Capital Inc. | | | | | | | | | | | | | | | | | | |
2.27% (1 Month USD LIBOR + 0.25%) | | | | | | | | | | Standard Chartered plc 3.78% | | | | | | | | |
11/04/19** | | $ | 50,990,289 | | | $ | 51,169,820 | | | Perpetual Maturity | | | 24,300,000 | | | | 19,568,790 | |
(13.00)% - 1.75% | | | | | | | | | | | | | | | | | | |
Open Maturity* | | | 14,085,388 | | | | 14,085,388 | | | Tenet Healthcare Corp. | | | | | | | | |
| | | | 65,075,677 | | | | 65,255,208 | | | 4.63% | | | | | | | | |
| | | | | | | | | | | 07/15/24 | | | 8,787,000 | | | | 9,030,400 | |
| | | | | | | | | | | Seagate HDD Cayman | | | | | | | | |
| | | | | | | | | | | 4.75% | | | | | | | | |
| | | | | | | | | | | 01/01/251 | | | 8,000,000 | | | | 8,292,000 | |
| | | | | | | | | | | CSC Holdings LLC | | | | | | | | |
| | | | | | | | | | | 5.50% | | | | | | | | |
| | | | | | | | | | | 05/15/26 | | | 7,670,000 | | | | 8,071,908 | |
62 | THE GUGGENHEIM FUNDS ANNUAL REPORT | SEE NOTES TO CONSOLIDATED FINANCIAL STATEMENTS. |
CONSOLIDATED SCHEDULE OF INVESTMENTS (continued) | September 30, 2019 |
MACRO OPPORTUNITIES FUND | |
Counterparty and
Terms of Agreement | | Face
Value | | | Repurchase
Price | | | Collateral | | Par
Value | | | Fair
Value | |
| | | | | | | | | | | Charter Communications Operating LLC / Charter Communications Operating Capital | | | | | | | | |
| | | | | | | | | | | 4.20% | | | | | | | | |
| | | | | | | | | | | 03/15/28 | | $ | 7,356,000 | | | $ | 7,736,305 | |
| | | | | | | | | | | Goldman Sachs Group Inc. | | | | | | | | |
| | | | | | | | | | | 5.00% | | | | | | | | |
| | | | | | | | | | | Perpetual Maturity | | | 4,249,000 | | | | 4,171,243 | |
| | | | | | | | | | | DaVita Inc. | | | | | | | | |
| | | | | | | | | | | 5.00% | | | | | | | | |
| | | | | | | | | | | 05/01/25 | | | 3,000,000 | | | | 2,988,300 | |
| | | | | | | | | | | Murphy Oil USA Inc. | | | | | | | | |
| | | | | | | | | | | 4.75% | | | | | | | | |
| | | | | | | | | | | 09/15/29 | | | 2,299,000 | | | | 2,350,728 | |
| | | | | | | | | | | Tenet Healthcare Corp. | | | | | | | | |
| | | | | | | | | | | 8.13% | | | | | | | | |
| | | | | | | | | | | 04/01/221 | | | 1,925,000 | | | | 2,082,080 | |
| | | | | | | | | | | Quorum Health Corp. | | | | | | | | |
| | | | | | | | | | | 11.63% | | | | | | | | |
| | | | | | | | | | | 04/15/231 | | | 1,700,000 | | | | 1,525,750 | |
| | | | | | | | | | | Park-Ohio Industries Inc. | | | | | | | | |
| | | | | | | | | | | 6.63% | | | | | | | | |
| | | | | | | | | | | 04/15/271 | | | 1,400,000 | | | | 1,337,000 | |
| | | | | | | | | | | Staples Inc. | | | | | | | | |
| | | | | | | | | | | 10.75% | | | | | | | | |
| | | | | | | | | | | 04/15/271 | | | 700,000 | | | | 719,250 | |
| | | | | | | | | | | Bausch Health Cos Inc. | | | | | | | | |
| | | | | | | | | | | 5.50% | | | | | | | | |
| | | | | | | | | | | 11/01/25 | | | 500,000 | | | | 523,200 | |
| | | | | | | | | | | Enova International Inc. | | | | | | | | |
| | | | | | | | | | | 8.50% | | | | | | | | |
| | | | | | | | | | | 09/15/251 | | | 110,000 | | | | 99,968 | |
| | | | | | | | | | | | | | 71,996,000 | | | | 68,496,922 | |
| | | | | | | | | | | | | | | | | | | |
Deutsche Bank | | | | | | | | | | Great Wolf Trust | | | | | | | | |
2.62% | | | | | | | | | | 5.98% | | | | | | | | |
11/06/19 | | $ | 46,486,000 | | | $ | 46,797,160 | | | 09/15/34 | | | 49,000,000 | | | | 49,029,400 | |
SEE NOTES TO CONSOLIDATED FINANCIAL STATEMENTS. | THE GUGGENHEIM FUNDS ANNUAL REPORT | 63 |
CONSOLIDATED SCHEDULE OF INVESTMENTS (continued) | September 30, 2019 |
MACRO OPPORTUNITIES FUND | |
Counterparty and
Terms of Agreement | | Face
Value | | | Repurchase
Price | | | Collateral | | Par
Value | | | Fair
Value | |
| | | | | | | | | | | Hilton USA Trust | | | | | | | | |
| | | | | | | | | | | 6.16% | | | | | | | | |
| | | | | | | | | | | 11/05/35 | | $ | 10,000,000 | | | $ | 10,053,000 | |
| | | | | | | | | | | HMH Trust | | | | | | | | |
| | | | | | | | | | | 8.48% | | | | | | | | |
| | | | | | | | | | | 07/05/31 | | | 5,000,000 | | | | 5,375,500 | |
| | | | | | | | | | | | | | 64,000,000 | | | | 64,457,900 | |
| | | | | | | | | | | | | | | | | | | |
BofA Securities, Inc. | | | | | | | | | | U.S. Treasury Note | | | | | | | | |
1.60% - 1.65% | | | | | | | | | | 1.50% | | | | | | | | |
Open Maturity* | | $ | 14,134,775 | | | $ | 14,134,775 | | | 09/30/24 | | | 30,754,000 | | | | 30,677,115 | |
2.80% | | | | | | | | | | | | | | | | | | |
10/01/19 | | | 30,000,000 | | | | 30,002,333 | | | Spirit AeroSystems Inc. | | | | | | | | |
| | | | 44,134,775 | | | | 44,137,108 | | | 4.60% | | | | | | | | |
| | | | | | | | | | | 06/15/281 | | | 5,190,000 | | | | 5,589,111 | |
| | | | | | | | | | | Dollar Tree Inc. | | | | | | | | |
| | | | | | | | | | | 4.00% | | | | | | | | |
| | | | | | | | | | | 05/15/251 | | | 3,630,000 | | | | 3,846,348 | |
| | | | | | | | | | | Flex Ltd. | | | | | | | | |
| | | | | | | | | | | 4.75% | | | | | | | | |
| | | | | | | | | | | 06/15/251 | | | 2,210,000 | | | | 2,379,949 | |
| | | | | | | | | | | Univision Communications Inc. | | | | | | | | |
| | | | | | | | | | | 5.13% | | | | | | | | |
| | | | | | | | | | | 02/15/251 | | | 1,355,000 | | | | 1,316,925 | |
| | | | | | | | | | | Acrisure LLC / Acrisure Finance Inc. | | | | | | | | |
| | | | | | | | | | | 7.00% | | | | | | | | |
| | | | | | | | | | | 11/15/251 | | | 850,000 | | | | 792,455 | |
| | | | | | | | | | | Univision Communications Inc. | | | | | | | | |
| | | | | | | | | | | 5.13% | | | | | | | | |
| | | | | | | | | | | 05/15/231 | | | 200,000 | | | | 200,620 | |
| | | | | | | | | | | | | | 44,189,000 | | | | 44,802,523 | |
| | | | | | | | | | | | | | | | | | | |
Citigroup Global Markets Inc. | | | | | | | | | | Dollar Tree Inc. | | | | | | | | |
1.35% - 1.60% | | | | | | | | | | 4.00% | | | | | | | | |
Open Maturity* | | | 20,140,750 | | | | 20,140,750 | | | 05/15/251 | | | 11,450,000 | | | | 12,132,420 | |
| | | | | | | | | | | Spirit AeroSystems Inc. | | | | | | | | |
| | | | | | | | | | | 4.60% | | | | | | | | |
| | | | | | | | | | | 06/15/281 | | | 4,920,000 | | | | 5,298,348 | |
| | | | | | | | | | | Harley-Davidson Inc. | | | | | | | | |
| | | | | | | | | | | 3.50% | | | | | | | | |
| | | | | | | | | | | 07/28/251 | | | 1,330,000 | | | | 1,369,368 | |
64 | THE GUGGENHEIM FUNDS ANNUAL REPORT | SEE NOTES TO CONSOLIDATED FINANCIAL STATEMENTS. |
CONSOLIDATED SCHEDULE OF INVESTMENTS (continued) | September 30, 2019 |
MACRO OPPORTUNITIES FUND | |
Counterparty and
Terms of Agreement | | Face
Value | | | Repurchase
Price | | | Collateral | | Par
Value | | | Fair
Value | |
| | | | | | | | | | | Univision Communications Inc. | | | | | | | | |
| | | | | | | | | | | 5.13% | | | | | | | | |
| | | | | | | | | | | 02/15/251 | | $ | 860,000 | | | $ | 835,834 | |
| | | | | | | | | | | Staples Inc. | | | | | | | | |
| | | | | | | | | | | 10.75% | | | | | | | | |
| | | | | | | | | | | 04/15/271 | | | 700,000 | | | | 719,250 | |
| | | | | | | | | | | Tenet Healthcare Corp. | | | | | | | | |
| | | | | | | | | | | 8.13% | | | | | | | | |
| | | | | | | | | | | 04/01/221 | | | 500,000 | | | | 540,800 | |
| | | | | | | | | | | Univision Communications Inc. | | | | | | | | |
| | | | | | | | | | | 5.13% | | | | | | | | |
| | | | | | | | | | | 05/15/231 | | | 310,000 | | | | 310,961 | |
| | | | | | | | | | | Acrisure LLC / Acrisure Finance Inc. | | | | | | | | |
| | | | | | | | | | | 7.00% | | | | | | | | |
| | | | | | | | | | | 11/15/251 | | | 150,000 | | | | 139,845 | |
| | | | | | | | | | | | | | 20,220,000 | | | | 21,346,826 | |
RBC Capital Markets, LLC | | | | | | | | | | Staples Inc. | | | | | | | | |
1.55% - 1.65% | | | | | | | | | | 10.75% | | | | | | | | |
Open Maturity* | | $ | 731,900 | | | $ | 731,900 | | | 04/15/271 | | | 475,000 | | | | 488,062 | |
| | | | | | | | | | | Univision Communications Inc. | | | | | | | | |
| | | | | | | | | | | 5.13% | | | | | | | | |
| | | | | | | | | | | 02/15/251 | | | 215,000 | | | | 208,959 | |
| | | | | | | | | | | | | | 690,000 | | | | 697,021 | |
* | The rate is adjusted periodically by the counterparty, subject to approval by the Adviser, and is not based upon a set reference rate and spread. Rate indicated is the rate effective at September 30, 2019. |
** | Variable rate security. Rate indicated is the rate effective at September 30, 2019. In some instances, the effective rate is limited by a minimum rate floor or a maximum rate cap established by the issuer. The settlement status of a position may also impact the effective rate indicated. In some cases, a position may be unsettled at period end and may not have a stated effective rate. In instances where multiple underlying reference rates and spread amounts are shown, the effective rate is based on a weighted average. |
1 | Collateral is related to securities which are being sold short. |
SEE NOTES TO CONSOLIDATED FINANCIAL STATEMENTS. | THE GUGGENHEIM FUNDS ANNUAL REPORT | 65 |
CONSOLIDATED SCHEDULE OF INVESTMENTS (continued) | September 30, 2019 |
MACRO OPPORTUNITIES FUND | |
Affiliated Transactions
Investments representing 5% or more of the outstanding voting shares of a company, or control of or by, or common control under Guggenheim Investments (“GI”), result in that company being considered an affiliated issuer, as defined in the 1940 Act.
The Fund may invest in certain of the underlying series of Guggenheim Strategy Funds Trust, including Guggenheim Strategy Fund II and Guggenheim Strategy Fund III, (collectively, the “Cash Management Funds”), each of which are open-end management investment companies managed by GI. The Cash Management Funds, which launched on March 11, 2014, are offered as cash management options only to mutual funds, trusts, and other accounts managed by GI and/or its affiliates, and are not available to the public. The Cash Management Funds pay no investment management fees. The Cash Management Funds’ annual report on Form N-CSR dated September 30, 2018, is available publicly or upon request. This information is available from the EDGAR database on the SEC’s website at https://www.sec.gov/Archives/edgar/data/1601445/000089180418000513/gug75569-ncsr.htm.
Transactions during the year ended September 30, 2019, in which the company is an affiliated issuer, were as follows:
Security Name | | Value
09/30/18 | | | Additions | | | Reductions | | | Realized
Gain (Loss) | |
Common Stocks | | | | | | | | | | | | | | | | |
Aspect Software Parent, Inc.* | | $ | — | ** | | $ | — | | | $ | — | | | $ | — | |
BP Holdco LLC*,1 | | | — | ** | | | 13,255 | | | | — | | | | — | |
Targus Group International Equity, Inc.1 | | | 33,063 | | | | — | | | | (12,237 | ) | | | — | |
Warrants | | | | | | | | | | | | | | | | |
Aspect Software Parent, Inc.* | | | — | ** | | | — | | | | — | | | | — | |
Mutual Funds | | | | | | | | | | | | | | | | |
Guggenheim Alpha Opportunity Fund — Institutional Class | | | 162,817,511 | | | | 1,810,030 | | | | (84,265,410 | ) | | | (4,702,153 | ) |
Guggenheim Floating Rate Strategies Fund — Institutional Class | | | 13,448,684 | | | | 116,194 | | | | (13,283,868 | ) | | | (80,136 | ) |
Guggenheim Limited Duration Fund — R6-Class | | | 303,269,766 | | | | 8,079,711 | | | | — | | | | — | |
Guggenheim Risk Managed Real Estate Fund — Institutional Class | | | 15,452,163 | | | | 481,171 | | | | — | | | | — | |
Guggenheim Strategy Fund II | | | 100,757,116 | | | | 2,998,608 | | | | — | | | | — | |
Guggenheim Strategy Fund III | | | 79,770,031 | | | | 2,364,094 | | | | — | | | | — | |
Guggenheim Ultra Short Duration Fund — Institutional Class4 | | | 89,926,690 | | | | 2,611,856 | | | | — | | | | — | |
Senior Floating Rate Interests | | | | | | | | | | | | | | | | |
Aspect Software, Inc. 12.67% (3 Month USD LIBOR + 10.50%, Rate Floor: 1.00%) due 05/25/203 | | | 860,746 | | | | — | | | | (707,116 | ) | | | (325,263 | ) |
Targus Group International, Inc. due 05/24/161,2,3 | | | — | ** | | | — | | | | — | | | | — | |
| | | $ | 766,335,770 | | | $ | 18,474,919 | | | $ | (98,268,631 | ) | | $ | (5,107,552 | ) |
66 | THE GUGGENHEIM FUNDS ANNUAL REPORT | SEE NOTES TO CONSOLIDATED FINANCIAL STATEMENTS. |
CONSOLIDATED SCHEDULE OF INVESTMENTS (concluded) | September 30, 2019 |
MACRO OPPORTUNITIES FUND | |
Security Name | | Change in
Unrealized
Appreciation
(Depreciation) | | | Value
09/30/19 | | | Shares/Face
Amount
09/30/19 | | | Investment
Income | | | Capital
Gain
Distributions | |
Common Stocks | | | | | | | | | | | | | | | | | | | | |
Aspect Software Parent, Inc.* | | $ | — | | | $ | — | | | | — | | | $ | — | | | $ | — | |
BP Holdco LLC*,1 | | | — | | | | 13,255 | | | | 37,539 | | | | — | | | | — | |
Targus Group International Equity, Inc.1 | | | 806 | | | | 21,632 | | | | 12,773 | | | | 1,140 | | | | — | |
Warrants | | | | | | | | | | | | | | | | | | | | |
Aspect Software Parent, Inc.* | | | — | | | | — | | | | — | | | | — | | | | — | |
Mutual Funds | | | | | | | | | | | | | | | | | | | | |
Guggenheim Alpha Opportunity Fund — Institutional Class | | | (6,494,313 | ) | | | 69,165,665 | | | | 2,726,278 | | | | 1,810,030 | | | | — | |
Guggenheim Floating Rate Strategies Fund — Institutional Class | | | (200,874 | ) | | | — | | | | — | | | | 123,402 | | | | — | |
Guggenheim Limited Duration Fund — R6-Class | | | (362,062 | ) | | | 310,987,415 | | | | 12,611,006 | | | | 8,073,890 | | | | 5,822 | |
Guggenheim Risk Managed Real Estate Fund — Institutional Class | | | 2,834,881 | | | | 18,768,215 | | | | 543,849 | | | | 342,517 | | | | 138,655 | |
Guggenheim Strategy Fund II | | | (607,289 | ) | | | 103,148,435 | | | | 4,154,186 | | | | 2,944,543 | | | | 54,065 | |
Guggenheim Strategy Fund III | | | (575,791 | ) | | | 81,558,334 | | | | 3,285,993 | | | | 2,361,107 | | | | 2,987 | |
Guggenheim Ultra Short Duration Fund — Institutional Class4 | | | (483,818 | ) | | | 92,054,728 | | | | 9,242,443 | | | | 2,546,337 | | | | 65,518 | |
Senior Floating Rate Interests | | | | | | | | | | | | | | | | | | | | |
Aspect Software, Inc. 12.67% (3 Month USD LIBOR + 10.50%, Rate Floor: 1.00%) due 05/25/203 | | | 171,633 | | | | — | | | | — | | | | 48,008 | | | | — | |
Targus Group International, Inc. due 05/24/161,2,3 | | | — | | | | — | ** | | | 152,876 | | | | — | | | | — | |
| | | $ | (5,716,827 | ) | | $ | 675,717,679 | | | | | | | $ | 18,250,974 | | | $ | 267,047 | |
* | Non-income producing security. |
** | Market value is less than $1. |
1 | Security was fair valued by the Valuation Committee at September 30, 2019. The total market value of fair valued and affiliated securities amounts to $34,887, (cost $162,604) or less than 0.1% of total net assets. |
2 | Security is in default of interest and/or principal obligations. |
3 | Variable rate security. Rate indicated is the rate effective at September 30, 2019. In some instances, the effective rate is limited by a minimum rate floor or a maximum rate cap established by the issuer. The settlement status of a position may also impact the effective rate indicated. In some cases, a position may be unsettled at period end and may not have a stated effective rate. In instances where multiple underlying reference rates and spread amounts are shown, the effective rate is based on a weighted average. |
4 | Effective November 30, 2018, Guggenheim Strategy Fund I was reorganized with and into the Guggenheim Ultra Short Duration Fund. |
SEE NOTES TO CONSOLIDATED FINANCIAL STATEMENTS. | THE GUGGENHEIM FUNDS ANNUAL REPORT | 67 |
CONSOLIDATED STATEMENT OF ASSETS AND LIABILITIES |
MACRO OPPORTUNITIES FUND |
September 30, 2019
Assets: |
Investments in unaffiliated issuers, at value (cost $5,276,683,174) | | $ | 5,202,920,643 | |
Investments in affiliated issuers, at value (cost $684,804,056) | | | 675,717,679 | |
Repurchase agreements, at value (cost $472,244,136) | | | 472,244,136 | |
Foreign currency, at value (cost $22,733) | | | 22,738 | |
Cash | | | 44,725,639 | |
Segregated cash with broker | | | 34,330,166 | |
Unamortized upfront premiums paid on credit default swap agreements | | | 44,888 | |
Unamortized upfront premiums paid on interest rate swap agreements | | | 363,983 | |
Unrealized appreciation on OTC swap agreements | | | 5,301 | |
Unrealized appreciation on forward foreign currency exchange contracts | | | 29,969,735 | |
Prepaid expenses | | | 238,038 | |
Receivables: |
Interest | | | 21,800,978 | |
Fund shares sold | | | 9,741,649 | |
Securities sold | | | 2,429,661 | |
Dividends | | | 1,488,680 | |
Foreign tax reclaims | | | 450,294 | |
Swap settlement | | | 18,662 | |
Other assets | | | 2,682 | |
Total assets | | | 6,496,515,552 | |
| | | | | |
Liabilities: |
Unfunded loan commitments, at value (Note 8) (proceeds $1,443,184) | | | 1,140,482 | |
Securities sold short, at value (proceeds $46,674,111) | | | 50,409,084 | |
Segregated cash due to broker | | | 22,159,903 | |
Unamortized upfront premiums received on credit default swap agreements | | | 10,210,451 | |
Unamortized upfront premiums received on interest rate swap agreements | | | 10,227 | |
Unrealized depreciation on OTC swap agreements | | | 4,627,307 | |
Unrealized depreciation on forward foreign currency exchange contracts | | | 5,043,938 | |
Payable for: |
Securities purchased | | | 44,561,407 | |
Fund shares redeemed | | | 35,415,360 | |
Variation margin on interest rate swap agreements | | | 7,826,326 | |
Management fees | | | 3,392,674 | |
Distributions to shareholders | | | 2,271,577 | |
Fund accounting/administration fees | | | 392,792 | |
Protection fees on credit default swap agreements | | | 378,371 | |
Distribution and service fees | | | 365,494 | |
Transfer agent/maintenance fees | | | 321,050 | |
Variation margin on credit default swap agreements | | | 131,092 | |
Variation margin on futures contracts | | | 101,312 | |
Trustees’ fees* | | | 18,793 | |
Due to Investment Adviser | | | 9,950 | |
Miscellaneous | | | 491,837 | |
Total liabilities | | | 189,279,427 | |
Net assets | | $ | 6,307,236,125 | |
* | Relates to Trustees not deemed “interested persons” within the meaning of Section 2(a)(19) of the 1940 Act. |
68 | THE GUGGENHEIM FUNDS ANNUAL REPORT | SEE NOTES TO CONSOLIDATED FINANCIAL STATEMENTS. |
CONSOLIDATED STATEMENT OF ASSETS AND LIABILITIES (concluded) |
MACRO OPPORTUNITIES FUND |
September 30, 2019
Net assets consist of: |
Paid in capital | | $ | 6,590,567,222 | |
Total distributable earnings (loss) | | | (283,331,097 | ) |
Net assets | | $ | 6,307,236,125 | |
| | | | | |
A-Class: |
Net assets | | $ | 461,781,397 | |
Capital shares outstanding | | | 17,887,798 | |
Net asset value per share | | $ | 25.82 | |
Maximum offering price per share (Net asset value divided by 96.00%) | | $ | 26.90 | |
| | | | | |
C-Class: |
Net assets | | $ | 321,576,122 | |
Capital shares outstanding | | | 12,464,634 | |
Net asset value per share | | $ | 25.80 | |
| | | | | |
P-Class: |
Net assets | | $ | 126,334,395 | |
Capital shares outstanding | | | 4,892,295 | |
Net asset value per share | | $ | 25.82 | |
| | | | | |
Institutional Class: |
Net assets | | $ | 5,396,867,742 | |
Capital shares outstanding | | | 208,783,778 | |
Net asset value per share | | $ | 25.85 | |
| | | | | |
R6-Class: |
Net assets | | $ | 676,469 | |
Capital shares outstanding | | | 26,180 | |
Net asset value per share | | $ | 25.84 | |
SEE NOTES TO CONSOLIDATED FINANCIAL STATEMENTS. | THE GUGGENHEIM FUNDS ANNUAL REPORT | 69 |
CONSOLIDATED STATEMENT OF OPERATIONS |
MACRO OPPORTUNITIES FUND |
Year Ended September 30, 2019
Investment Income: |
Dividends from securities of unaffiliated issuers (net of foreign withholding tax of $73,637) | | $ | 2,210,713 | |
Dividends from securities of affiliated issuers | | | 18,202,966 | |
Interest from securities of unaffiliated issuers (net of foreign withholding tax of $31,154) | | | 267,540,333 | |
Interest from securities of affiliated issuers | | | 48,008 | |
Total investment income | | | 288,002,020 | |
| | | | | |
Expenses: |
Management fees | | | 61,691,345 | |
Distribution and service fees: |
A-Class | | | 1,412,531 | |
C-Class | | | 3,825,725 | |
P-Class | | | 363,876 | |
Transfer agent/maintenance fees: |
A-Class | | | 855,369 | |
C-Class | | | 369,056 | |
P-Class | | | 181,418 | |
Institutional Class | | | 4,632,240 | |
R6-Class | | | 728 | |
Fund accounting/administration fees | | | 5,621,601 | |
Short sales interest expense | | | 3,154,581 | |
Interest expense | | | 398,832 | |
Professional fees | | | 625,201 | |
Line of credit fees | | | 579,355 | |
Custodian fees | | | 397,738 | |
Trustees’ fees* | | | 188,212 | |
Miscellaneous | | | 1,041,567 | |
Recoupment of previously waived fees: |
A-Class | | | 108,635 | |
C-Class | | | 195,122 | |
P-Class | | | 51,551 | |
Institutional Class | | | 10 | |
R6-Class | | | 2 | |
Total expenses | | | 85,694,695 | |
Less: |
Expenses reimbursed by Adviser: |
A-Class | | | (77,395 | ) |
C-Class | | | (6,154 | ) |
P-Class | | | (3,132 | ) |
Institutional Class | | | (4,685,473 | ) |
R6-Class | | | (715 | ) |
Expenses waived by Adviser | | | (4,959,360 | ) |
Earnings credits applied | | | (329,844 | ) |
Total waived/reimbursed expenses | | | (10,062,073 | ) |
Net expenses | | | 75,632,622 | |
Net investment income | | | 212,369,398 | |
* | Relates to Trustees not deemed “interested persons” within the meaning of Section 2(a)(19) of the 1940 Act. |
70 | THE GUGGENHEIM FUNDS ANNUAL REPORT | SEE NOTES TO CONSOLIDATED FINANCIAL STATEMENTS. |
CONSOLIDATED STATEMENT OF OPERATIONS (concluded) |
MACRO OPPORTUNITIES FUND |
Year Ended September 30, 2019
Net Realized and Unrealized Gain (Loss): |
Net realized gain (loss) on: |
Investments in unaffiliated issuers | | $ | (47,172,348 | ) |
Investments in affiliated issuers | | | (5,107,552 | ) |
Distributions received from affiliated investment companies | | | 267,047 | |
Investments sold short | | | 572,830 | |
Swap agreements | | | 191,525 | |
Futures contracts | | | (4,986,350 | ) |
Options purchased | | | (48,012,227 | ) |
Options written | | | 11,621,253 | |
Forward foreign currency exchange contracts | | | 20,424,159 | |
Foreign currency transactions | | | (513,551 | ) |
Net realized loss | | | (72,715,214 | ) |
Net change in unrealized appreciation (depreciation) on: |
Investments in unaffiliated issuers | | | (47,347,611 | ) |
Investments in affiliated issuers | | | (5,716,827 | ) |
Investments sold short | | | (4,023,595 | ) |
Swap agreements | | | (45,556,378 | ) |
Futures contracts | | | 909,673 | |
Options purchased | | | (11,416,682 | ) |
Options written | | | 4,302,425 | |
Forward foreign currency exchange contracts | | | 11,406,050 | |
Foreign currency translations | | | 181,641 | |
Net change in unrealized appreciation (depreciation) | | | (97,261,304 | ) |
Net realized and unrealized loss | | | (169,976,518 | ) |
Net increase in net assets resulting from operations | | $ | 42,392,880 | |
SEE NOTES TO CONSOLIDATED FINANCIAL STATEMENTS. | THE GUGGENHEIM FUNDS ANNUAL REPORT | 71 |
CONSOLIDATED STATEMENTS OF CHANGES IN NET ASSETS |
MACRO OPPORTUNITIES FUND | |
| | Year Ended
September 30,
2019 | | | Year Ended
September 30,
2018 | |
Increase (Decrease) in Net Assets from Operations: | | | | | | | | |
Net investment income | | $ | 212,369,398 | | | $ | 205,322,232 | |
Net realized gain (loss) on investments | | | (72,715,214 | ) | | | 18,070,024 | |
Net change in unrealized appreciation (depreciation) on investments | | | (97,261,304 | ) | | | (43,739,272 | ) |
Net increase in net assets resulting from operations | | | 42,392,880 | | | | 179,652,984 | |
| | | | | | | | | |
Distributions to shareholders: | | | | | | | | |
A-Class | | | (17,823,614 | ) | | | (23,691,782 | ) |
C-Class | | | (9,175,128 | ) | | | (9,668,422 | ) |
P-Class | | | (4,550,901 | ) | | | (5,201,207 | ) |
Institutional Class | | | (208,895,022 | ) | | | (180,095,136 | ) |
R6-Class* | | | (329,596 | ) | | | — | |
Total distributions to shareholders | | | (240,774,261 | ) | | | (218,656,547 | ) |
| | | | | | | | | |
Capital share transactions: | | | | | | | | |
Proceeds from sale of shares | | | | | | | | |
A-Class | | | 162,931,285 | | | | 328,520,122 | |
C-Class | | | 43,872,896 | | | | 91,817,691 | |
P-Class | | | 59,002,809 | | | | 104,834,460 | |
Institutional Class | | | 2,492,047,740 | | | | 3,054,881,732 | |
R6-Class* | | | 18,363,385 | | | | — | |
Distributions reinvested | | | | | | | | |
A-Class | | | 14,407,024 | | | | 19,275,179 | |
C-Class | | | 7,760,314 | | | | 8,238,846 | |
P-Class | | | 4,548,842 | | | | 5,192,408 | |
Institutional Class | | | 179,928,991 | | | | 155,391,320 | |
R6-Class* | | | 232,736 | | | | — | |
Cost of shares redeemed | | | | | | | | |
A-Class | | | (412,939,684 | ) | | | (521,979,332 | ) |
C-Class | | | (152,124,869 | ) | | | (99,156,360 | ) |
P-Class | | | (93,643,368 | ) | | | (137,512,748 | ) |
Institutional Class | | | (3,174,957,945 | ) | | | (1,704,634,359 | ) |
R6-Class* | | | (17,819,420 | ) | | | — | |
Net increase (decrease) from capital share transactions | | | (868,389,264 | ) | | | 1,304,868,959 | |
Net increase (decrease) in net assets | | | (1,066,770,645 | ) | | | 1,265,865,396 | |
| | | | | | | | | |
Net assets: | | | | | | | | |
Beginning of year | | | 7,374,006,770 | | | | 6,108,141,374 | |
End of year | | $ | 6,307,236,125 | | | $ | 7,374,006,770 | |
72 | THE GUGGENHEIM FUNDS ANNUAL REPORT | SEE NOTES TO CONSOLIDATED FINANCIAL STATEMENTS. |
CONSOLIDATED STATEMENTS OF CHANGES IN NET ASSETS (concluded) |
MACRO OPPORTUNITIES FUND | |
| | Year Ended
September 30,
2019 | | | Year Ended
September 30,
2018 | |
Capital share activity: | | | | | | | | |
Shares sold | | | | | | | | |
A-Class | | | 6,250,506 | | | | 12,309,117 | |
C-Class | | | 1,683,895 | | | | 3,442,802 | |
P-Class | | | 2,262,017 | | | | 3,930,414 | |
Institutional Class | | | 95,481,259 | | | | 114,423,497 | |
R6-Class* | | | 706,773 | | | | — | |
Shares issued from reinvestment of distributions | | | | | | | | |
A-Class | | | 553,524 | | | | 723,618 | |
C-Class | | | 298,382 | | | | 309,569 | |
P-Class | | | 174,797 | | | | 194,873 | |
Institutional Class | | | 6,909,300 | | | | 5,827,797 | |
R6-Class* | | | 8,974 | | | | — | |
Shares redeemed | | | | | | | | |
A-Class | | | (15,850,225 | ) | | | (19,582,955 | ) |
C-Class | | | (5,852,054 | ) | | | (3,724,094 | ) |
P-Class | | | (3,594,667 | ) | | | (5,158,216 | ) |
Institutional Class | | | (121,923,636 | ) | | | (63,860,836 | ) |
R6-Class* | | | (689,567 | ) | | | — | |
Net increase (decrease) in shares | | | (33,580,722 | ) | | | 48,835,586 | |
* | Since commencement of operations: March 13, 2019. |
SEE NOTES TO CONSOLIDATED FINANCIAL STATEMENTS. | THE GUGGENHEIM FUNDS ANNUAL REPORT | 73 |
CONSOLIDATED FINANCIAL HIGHLIGHTS |
MACRO OPPORTUNITIES FUND | |
This table is presented to show selected data for a share outstanding throughout each period and to assist shareholders in evaluating a Fund’s performance for the periods presented.
A-Class | | Year
Ended
Sept. 30,
2019 | | | Year
Ended
Sept. 30,
2018 | | | Year
Ended
Sept. 30,
2017 | | | Year
Ended
Sept. 30,
2016 | | | Year
Ended
Sept. 30,
2015 | |
Per Share Data | | | | | | | | | | | | | | | | | | | | |
Net asset value, beginning of period | | $ | 26.53 | | | $ | 26.67 | | | $ | 26.01 | | | $ | 26.07 | | | $ | 26.81 | |
Income (loss) from investment operations: |
Net investment income (loss)a | | | .72 | | | | .72 | | | | .95 | | | | 1.16 | | | | .98 | |
Net gain (loss) on investments (realized and unrealized) | | | (.62 | ) | | | (.08 | ) | | | .68 | | | | .21 | | | | (.55 | ) |
Total from investment operations | | | .10 | | | | .64 | | | | 1.63 | | | | 1.37 | | | | .43 | |
Less distributions from: |
Net investment income | | | (.79 | ) | | | (.78 | ) | | | (.97 | ) | | | (1.43 | ) | | | (1.17 | ) |
Net realized gains | | | (.02 | ) | | | — | | | | — | | | | — | | | | — | |
Total distributions | | | (.81 | ) | | | (.78 | ) | | | (.97 | ) | | | (1.43 | ) | | | (1.17 | ) |
Net asset value, end of period | | $ | 25.82 | | | $ | 26.53 | | | $ | 26.67 | | | $ | 26.01 | | | $ | 26.07 | |
|
Total Returnb | | | 0.41 | % | | | 2.42 | % | | | 6.33 | % | | | 5.57 | % | | | 1.59 | % |
Ratios/Supplemental Data |
Net assets, end of period (in thousands) | | $ | 461,781 | | | $ | 714,630 | | | $ | 893,104 | | | $ | 727,602 | | | $ | 844,523 | |
Ratios to average net assets: |
Net investment income (loss) | | | 2.76 | % | | | 2.72 | % | | | 3.58 | % | | | 4.59 | % | | | 3.67 | % |
Total expensesc | | | 1.47 | % | | | 1.43 | % | | | 1.42 | % | | | 1.65 | % | | | 1.52 | % |
Net expensesd,e,h | | | 1.39 | % | | | 1.33 | % | | | 1.27 | % | | | 1.46 | % | | | 1.38 | % |
Portfolio turnover rate | | | 46 | % | | | 66 | % | | | 61 | % | | | 61 | % | | | 40 | % |
74 | THE GUGGENHEIM FUNDS ANNUAL REPORT | SEE NOTES TO CONSOLIDATED FINANCIAL STATEMENTS. |
CONSOLIDATED FINANCIAL HIGHLIGHTS (continued) |
MACRO OPPORTUNITIES FUND | |
This table is presented to show selected data for a share outstanding throughout each period and to assist shareholders in evaluating a Fund’s performance for the periods presented.
C-Class | | Year
Ended
Sept. 30,
2019 | | | Year
Ended
Sept. 30,
2018 | | | Year
Ended
Sept. 30,
2017 | | | Year
Ended
Sept. 30,
2016 | | | Year
Ended
Sept. 30,
2015 | |
Per Share Data | | | | | | | | | | | | | | | | | | | | |
Net asset value, beginning of period | | $ | 26.52 | | | $ | 26.65 | | | $ | 25.99 | | | $ | 26.05 | | | $ | 26.79 | |
Income (loss) from investment operations: |
Net investment income (loss)a | | | .52 | | | | .53 | | | | .75 | | | | .98 | | | | .78 | |
Net gain (loss) on investments (realized and unrealized) | | | (.62 | ) | | | (.08 | ) | | | .68 | | | | .20 | | | | (.55 | ) |
Total from investment operations | | | (.10 | ) | | | .45 | | | | 1.43 | | | | 1.18 | | | | .23 | |
Less distributions from: |
Net investment income | | | (.60 | ) | | | (.58 | ) | | | (.77 | ) | | | (1.24 | ) | | | (.97 | ) |
Net realized gains | | | (.02 | ) | | | — | | | | — | | | | — | | | | — | |
Total distributions | | | (.62 | ) | | | (.58 | ) | | | (.77 | ) | | | (1.24 | ) | | | (.97 | ) |
Net asset value, end of period | | $ | 25.80 | | | $ | 26.52 | | | $ | 26.65 | | | $ | 25.99 | | | $ | 26.05 | |
|
Total Returnb | | | (0.37 | %) | | | 1.69 | % | | | 5.55 | % | | | 4.79 | % | | | 0.84 | % |
Ratios/Supplemental Data |
Net assets, end of period (in thousands) | | $ | 321,576 | | | $ | 433,121 | | | $ | 434,634 | | | $ | 337,075 | | | $ | 374,633 | |
Ratios to average net assets: |
Net investment income (loss) | | | 2.00 | % | | | 1.98 | % | | | 2.83 | % | | | 3.87 | % | | | 2.90 | % |
Total expensesc | | | 2.20 | % | | | 2.18 | % | | | 2.14 | % | | | 2.36 | % | | | 2.24 | % |
Net expensesd,e,h | | | 2.13 | % | | | 2.09 | % | | | 2.03 | % | | | 2.20 | % | | | 2.13 | % |
Portfolio turnover rate | | | 46 | % | | | 66 | % | | | 61 | % | | | 61 | % | | | 40 | % |
SEE NOTES TO CONSOLIDATED FINANCIAL STATEMENTS. | THE GUGGENHEIM FUNDS ANNUAL REPORT | 75 |
CONSOLIDATED FINANCIAL HIGHLIGHTS (continued) |
MACRO OPPORTUNITIES FUND |
This table is presented to show selected data for a share outstanding throughout each period and to assist shareholders in evaluating a Fund’s performance for the periods presented.
P-Class | | Year
Ended
Sept. 30,
2019 | | | Year
Ended
Sept. 30,
2018 | | | Year
Ended
Sept. 30,
2017 | | | Year
Ended
Sept. 30,
2016 | | | Period
Ended
Sept. 30,
2015f | |
Per Share Data | | | | | | | | | | | | | | | | | | | | |
Net asset value, beginning of period | | $ | 26.54 | | | $ | 26.68 | | | $ | 26.02 | | | $ | 26.07 | | | $ | 26.78 | |
Income (loss) from investment operations: |
Net investment income (loss)a | | | .71 | | | | .73 | | | | .92 | | | | 1.20 | | | | .37 | |
Net gain (loss) on investments (realized and unrealized) | | | (.62 | ) | | | (.09 | ) | | | .71 | | | | .21 | | | | (.62 | ) |
Total from investment operations | | | .09 | | | | .64 | | | | 1.63 | | | | 1.41 | | | | (.25 | ) |
Less distributions from: |
Net investment income | | | (.79 | ) | | | (.78 | ) | | | (.97 | ) | | | (1.46 | ) | | | (.46 | ) |
Net realized gains | | | (.02 | ) | | | — | | | | — | | | | — | | | | — | |
Total distributions | | | (.81 | ) | | | (.78 | ) | | | (.97 | ) | | | (1.46 | ) | | | (.46 | ) |
Net asset value, end of period | | $ | 25.82 | | | $ | 26.54 | | | $ | 26.68 | | | $ | 26.02 | | | $ | 26.07 | |
|
Total Return | | | 0.37 | % | | | 2.42 | % | | | 6.33 | % | | | 5.74 | % | | | (0.95 | %) |
Ratios/Supplemental Data |
Net assets, end of period (in thousands) | | $ | 126,334 | | | $ | 160,578 | | | $ | 188,980 | | | $ | 63,665 | | | $ | 63,819 | |
Ratios to average net assets: |
Net investment income (loss) | | | 2.73 | % | | | 2.73 | % | | | 3.48 | % | | | 4.73 | % | | | 3.36 | % |
Total expensesc | | | 1.46 | % | | | 1.46 | % | | | 1.44 | % | | | 1.49 | % | | | 1.43 | % |
Net expensesd,e,h | | | 1.39 | % | | | 1.33 | % | | | 1.26 | % | | | 1.33 | % | | | 1.30 | % |
Portfolio turnover rate | | | 46 | % | | | 66 | % | | | 61 | % | | | 61 | % | | | 40 | % |
76 | THE GUGGENHEIM FUNDS ANNUAL REPORT | SEE NOTES TO CONSOLIDATED FINANCIAL STATEMENTS. |
CONSOLIDATED FINANCIAL HIGHLIGHTS (continued) |
MACRO OPPORTUNITIES FUND |
This table is presented to show selected data for a share outstanding throughout each period and to assist shareholders in evaluating a Fund’s performance for the periods presented.
Institutional Class | | Year
Ended
Sept. 30,
2019 | | | Year
Ended
Sept. 30,
2018 | | | Year
Ended
Sept. 30,
2017 | | | Year
Ended
Sept. 30,
2016 | | | Year
Ended
Sept. 30,
2015 | |
Per Share Data | | | | | | | | | | | | | | | | | | | | |
Net asset value, beginning of period | | $ | 26.57 | | | $ | 26.71 | | | $ | 26.04 | | | $ | 26.10 | | | $ | 26.84 | |
Income (loss) from investment operations: |
Net investment income (loss)a | | | .81 | | | | .84 | | | | 1.02 | | | | 1.26 | | | | 1.06 | |
Net gain (loss) on investments (realized and unrealized) | | | (.61 | ) | | | (.09 | ) | | | .71 | | | | .21 | | | | (.54 | ) |
Total from investment operations | | | .20 | | | | .75 | | | | 1.73 | | | | 1.47 | | | | .52 | |
Less distributions from: |
Net investment income | | | (.90 | ) | | | (.89 | ) | | | (1.06 | ) | | | (1.53 | ) | | | (1.26 | ) |
Net realized gains | | | (.02 | ) | | | — | | | | — | | | | — | | | | — | |
Total distributions | | | (.92 | ) | | | (.89 | ) | | | (1.06 | ) | | | (1.53 | ) | | | (1.26 | ) |
Net asset value, end of period | | $ | 25.85 | | | $ | 26.57 | | | $ | 26.71 | | | $ | 26.04 | | | $ | 26.10 | |
|
Total Return | | | 0.77 | % | | | 2.83 | % | | | 6.73 | % | | | 5.97 | % | | | 1.92 | % |
Ratios/Supplemental Data |
Net assets, end of period (in thousands) | | $ | 5,396,868 | | | $ | 6,065,678 | | | $ | 4,591,424 | | | $ | 2,204,079 | | | $ | 2,396,622 | |
Ratios to average net assets: |
Net investment income (loss) | | | 3.12 | % | | | 3.15 | % | | | 3.86 | % | | | 4.96 | % | | | 3.97 | % |
Total expensesc | | | 1.13 | % | | | 1.08 | % | | | 1.06 | % | | | 1.29 | % | | | 1.20 | % |
Net expensesd,e,h | | | 0.98 | % | | | 0.93 | % | | | 0.91 | % | | | 1.08 | % | | | 1.05 | % |
Portfolio turnover rate | | | 46 | % | | | 66 | % | | | 61 | % | | | 61 | % | | | 40 | % |
SEE NOTES TO CONSOLIDATED FINANCIAL STATEMENTS. | THE GUGGENHEIM FUNDS ANNUAL REPORT | 77 |
CONSOLIDATED FINANCIAL HIGHLIGHTS (continued) |
MACRO OPPORTUNITIES FUND |
This table is presented to show selected data for a share outstanding throughout each period and to assist shareholders in evaluating a Fund’s performance for the period presented.
R6-Class | | Period
Ended
Sept. 30,
2019g | |
Per Share Data | | | | |
Net asset value, beginning of period | | $ | 25.98 | |
Income (loss) from investment operations: |
Net investment income (loss)a | | | .36 | |
Net gain (loss) on investments (realized and unrealized) | | | (.03 | ) |
Total from investment operations | | | .33 | |
Less distributions from: |
Net investment income | | | (.47 | ) |
Total distributions | | | (.47 | ) |
Net asset value, end of period | | $ | 25.84 | |
|
Total Return | | | 1.30 | % |
Ratios/Supplemental Data |
Net assets, end of period (in thousands) | | $ | 676 | |
Ratios to average net assets: |
Net investment income (loss) | | | 2.79 | % |
Total expensesc | | | 1.11 | % |
Net expensesd,e,h | | | 1.03 | % |
Portfolio turnover rate | | | 46 | % |
78 | THE GUGGENHEIM FUNDS ANNUAL REPORT | SEE NOTES TO CONSOLIDATED FINANCIAL STATEMENTS. |
CONSOLIDATED FINANCIAL HIGHLIGHTS (concluded) |
MACRO OPPORTUNITIES FUND |
a | Net investment income (loss) per share was computed using average shares outstanding throughout the period. |
b | Total return does not reflect the impact of any applicable sales charges. |
c | Does not include expenses of the underlying funds in which the Fund invests. |
d | Net expense information reflects the expense ratios after expense waivers and reimbursements, as applicable. |
e | The portion of the ratios of net expense to average net assets attributable to recoupments of prior fee reductions or expense reimbursements for the years presented was as follows: |
| | | 09/30/19 | 09/30/18 | 09/30/17 |
| | A-Class | 0.02% | 0.04% | 0.02% |
| | C-Class | 0.05% | 0.11% | 0.04% |
| | P-Class | 0.04% | 0.04% | 0.02% |
| | Institutional Class | 0.00%* | — | — |
| | R6-Class | 0.00%* | N/A | N/A |
f | Since commencement of operations: May 1, 2015. Percentage amounts for the period, except total return and portfolio turnover rate, have been annualized. |
g | Since commencement of operations: March 13, 2019. Percentage amounts for the period, except total return and portfolio turnover rate, have been annualized. |
h | Net expenses may include expenses that are excluded from the expense limitation agreement. Excluding these expenses, the net expense ratios for the years would be: |
| | | 09/30/19 | 09/30/18 | 09/30/17 | 09/30/16 | 09/30/15 |
| | A-Class | 1.33% | 1.31% | 1.25% | 1.28% | 1.30% |
| | C-Class | 2.07% | 2.06% | 2.00% | 2.02% | 2.05% |
| | P-Class | 1.33% | 1.31% | 1.24% | 1.15% | 1.21% |
| | Institutional Class | 0.92% | 0.90% | 0.88% | 0.90% | 0.97% |
| | R6-Class | 0.92% | N/A | N/A | N/A | N/A |
SEE NOTES TO CONSOLIDATED FINANCIAL STATEMENTS. | THE GUGGENHEIM FUNDS ANNUAL REPORT | 79 |
NOTES TO CONSOLIDATED FINANCIAL STATEMENTS |
Note 1 – Organization, Consolidation of Subsidiary and Significant Accounting Policies
Organization
Guggenheim Funds Trust (the “Trust”), a Delaware statutory trust, is registered with the SEC under the Investment Company Act of 1940 (“1940 Act”), as an open-ended investment company of the series type. Each series, in effect, is representing a separate fund. The Trust is authorized to issue an unlimited number of shares. The Trust accounts for the assets of each fund separately.
The Trust offers a combination of five separate classes of shares: A-Class shares, C-Class shares, P-Class shares, R6-Class shares and Institutional Class shares. Sales of shares of each Class are made without a front-end sales charge at the net asset value per share (“NAV”), with the exception of A-Class shares. A-Class shares are sold at the NAV, plus the applicable front-end sales charge. The sales charge varies depending on the amount purchased. A-Class share purchases of $1 million or more are exempt from the front-end sales charge but have a 1% contingent deferred sales charge (“CDSC”), if shares are redeemed within 12 months of purchase. C-Class shares have a 1% CDSC if shares are redeemed within 12 months of purchase. C-Class shares of the Fund automatically convert to A-Class shares on or about the 10th day of the month following the 10-year anniversary of the purchase of the C-Class shares. This conversion will be executed without any sales charge, fee or other charge. After the conversion is completed, the shares will be subject to all features and expenses of A-Class shares. Institutional Class shares are offered primarily for direct investment by institutions such as pension and profit sharing plans, endowments, foundations and corporations. Institutional Class shares require a minimum initial investment of $2 million and a minimum account balance of $1 million. R6-Class shares are offered primarily through qualified retirement and benefit plans. R6-Class shares are also offered through certain other plans and platforms sponsored by financial intermediaries. Certain institutional investors and others deemed appropriate by Guggenheim Investments (“GI”) may also be eligible to purchase R6-Class shares subject to a $2 million minimum initial investment. At September 30, 2019, the Trust consisted of twenty funds (the “Funds”).
This report covers the Macro Opportunities Fund (the “Fund”), a diversified investment company. At September 30, 2019, A-Class, C-Class, P-Class, Institutional Class and R6-Class shares had been issued by the Fund.
Guggenheim Partners Investment Management, LLC (“GPIM”), which operates under the name Guggenheim Investments, provides advisory services. Guggenheim Funds Distributors, LLC (“GFD”) acts as principal underwriter for the Trust. GI and GFD are affiliated entities.
Consolidation of Subsidiary
The consolidated financial statements of the Fund includes the accounts of a wholly-owned and controlled Cayman Islands subsidiary (the “Subsidiary”). Significant inter-company accounts and transactions have been eliminated in consolidation for the Fund.
80 | THE GUGGENHEIM FUNDS ANNUAL REPORT | |
NOTES TO CONSOLIDATED FINANCIAL STATEMENTS (continued) |
The Fund may invest up to 25% of its total assets in its Subsidiary which acts as an investment vehicle in order to effect certain investments consistent with the Fund’s investment objectives and policies.
A summary of the Fund’s investment in its Subsidiary is as follows:
| | Inception Date
of Subsidiary | | | Subsidiary
Net Assets at
September 30,
2019 | | | % of Net Assets of
the Fund at
September 30,
2019 | |
| | | | 01/08/15 | | | | $75,111,208 | | | | 1.19 | % |
Significant Accounting Policies
The Fund operates as an investment company and, accordingly, follows the investment company accounting and reporting guidance of the Financial Accounting Standards Board (“FASB”) Accounting Standards Codification Topic 946 Financial Services – Investment Companies.
The following significant accounting policies are in conformity with U.S. generally accepted accounting principles (“U.S. GAAP”) and are consistently followed by the Trust. This requires management to make estimates and assumptions that affect the reported amount of assets and liabilities, contingent assets and liabilities at the date of the consolidated financial statements, and the reported amounts of revenues and expenses during the reporting period. Actual results could differ from these estimates. All time references are based on Eastern Time.
The NAV of each Class of the Fund is calculated by dividing the market value of the Fund’s securities and other assets, less all liabilities, attributable to the Class by the number of outstanding shares of the Class.
(a) Valuation of Investments
The Board of Trustees of the Fund (the “Board”) has adopted policies and procedures for the valuation of the Fund’s investments (the “Valuation Procedures”). Pursuant to the Valuation Procedures, the Board has delegated to a valuation committee, consisting of representatives from Guggenheim’s investment management, fund administration, legal and compliance departments (the “Valuation Committee”), the day-to-day responsibility for implementing the Valuation Procedures, including, under most circumstances, the responsibility for determining the fair value of the Fund’s securities and/or other assets.
Valuations of the Fund’s securities are supplied primarily by pricing services appointed pursuant to the processes set forth in the Valuation Procedures. The Valuation Committee convenes monthly, or more frequently as needed, to review the valuation of all assets which have been fair valued for reasonableness. The Fund’s officers, through the Valuation Committee and consistent with the monitoring and review responsibilities set forth in the Valuation Procedures, regularly review procedures used and valuations provided by the pricing services.
| | THE GUGGENHEIM FUNDS ANNUAL REPORT | 81 |
NOTES TO CONSOLIDATED FINANCIAL STATEMENTS (continued) |
If the pricing service cannot or does not provide a valuation for a particular investment or such valuation is deemed unreliable, such investment is fair valued by the Valuation Committee.
Equity securities listed or traded on a recognized U.S. securities exchange or the National Association of Securities Dealers Automated Quotations (“NASDAQ”) National Market System shall generally be valued on the basis of the last sale price on the primary U.S. exchange or market on which the security is listed or traded; provided, however, that securities listed on NASDAQ will be valued at the NASDAQ Official Closing Price, which may not necessarily represent the last sale price. If there is no sale on the valuation date, exchange-traded U.S. equity securities will be valued on the basis of the last bid price.
Generally, trading in foreign securities markets is substantially completed each day at various times prior to the close of the New York Stock Exchange (“NYSE”). The values of foreign securities are determined as of the close of such foreign markets or the close of the NYSE, if earlier. All investments quoted in foreign currencies are valued in U.S. dollars on the basis of the foreign currency exchange rates prevailing at the close of U.S. business at 4:00 p.m. Investments in foreign securities may involve risks not present in domestic investments. The Valuation Committee will determine the current value of such foreign securities by taking into consideration certain factors which may include those discussed above, as well as the following factors, among others: the value of the securities traded on other foreign markets, ADR trading, closed-end fund trading, foreign currency exchange activity, and the trading prices of financial products that are tied to foreign securities. In addition, under the Valuation Procedures, the Valuation Committee and GI are authorized to use prices and other information supplied by a third party pricing vendor in valuing foreign securities.
Open-end investment companies are valued at their NAV as of the close of business, on the valuation date. Exchange-traded funds and closed-end investment companies are valued at the last quoted sale price.
U.S. Government securities are valued by either independent pricing services, the last traded fill price, or at the reported bid price at the close of business.
Debt securities with a maturity of greater than 60 days at acquisition are valued at prices that reflect broker-dealer supplied valuations or are obtained from independent pricing services, which may consider the trade activity, treasury spreads, yields or price of bonds of comparable quality, coupon, maturity, and type, as well as prices quoted by dealers who make markets in such securities. Short-term debt securities with a maturity of 60 days or less at acquisition are valued at amortized cost, provided such amount approximates market value. Money market funds are valued at their NAV.
Repurchase agreements are valued at amortized cost, provided such amounts approximate market value.
82 | THE GUGGENHEIM FUNDS ANNUAL REPORT | |
NOTES TO CONSOLIDATED FINANCIAL STATEMENTS (continued) |
Typically, loans are valued using information provided by an independent third party pricing service which uses broker quotes. If the pricing service cannot or does not provide a valuation for a particular loan, or such valuation is deemed unreliable, such investment is fair valued by the Valuation Committee.
Exchange-traded options are valued at the mean of the bid and ask prices on the principal exchange on which they are traded. Over-the-counter (“OTC”) options are valued using a price provided by a pricing service.
The value of futures contracts is accounted for using the unrealized appreciation or depreciation on the contracts that is determined by marking the contracts to their current realized settlement prices. Financial futures contracts are valued at the 4:00 p.m. price on the valuation date. In the event that the exchange for a specific futures contract closes earlier than 4:00 p.m., the futures contract is valued at the official settlement price of the exchange. However, the underlying securities from which the futures contract value is derived are monitored until 4:00 p.m. to determine if fair valuation would provide a more accurate valuation.
The value of interest rate swap agreements entered into by the Fund is accounted for using the unrealized appreciation or depreciation on the agreements that is determined using the spread priced off the previous day’s Chicago Mercantile Exchange price.
The values of other swap agreements entered into by a fund are accounted for using the unrealized appreciation or depreciation on the agreements that are determined by marking the agreements to the last quoted value of the index or other underlying positions that the swaps pertain to at the close of the NYSE.
Forward foreign currency exchange contracts are valued daily based on the applicable exchange rate of the underlying currency.
Investments for which market quotations are not readily available are fair-valued as determined in good faith by GI, subject to review and approval by the Valuation Committee, pursuant to methods established or ratified by the Board. Valuations in accordance with these methods are intended to reflect each security’s (or asset’s or liability’s) “fair value”. Each such determination is based on a consideration of all relevant factors, which are likely to vary from one pricing context to another. Examples of such factors may include, but are not limited to market prices; sale prices; broker quotes; and models which derive prices based on inputs such as prices of securities with comparable maturities and characteristics, or based on inputs such as anticipated cash flows or collateral, spread over U.S. Treasury securities, and other information analysis.
In connection with futures contracts and other derivative investments, such factors may include obtaining information as to how (a) these contracts and other derivative investments trade in the futures or other derivative markets, respectively, and (b) the securities underlying these contracts and other derivative investments trade in the cash market.
| | THE GUGGENHEIM FUNDS ANNUAL REPORT | 83 |
NOTES TO CONSOLIDATED FINANCIAL STATEMENTS (continued) |
(b) U.S. Government and Agency Obligations
Certain U.S. Government and Agency Obligations are traded on a discount basis; the interest rates shown on the Consolidated Schedule of Investments reflect the effective rates paid at the time of purchase by the Fund. Other securities bear interest at the rates shown, payable at fixed dates through maturity.
Inflation-Indexed bonds are fixed-income securities whose principal value is periodically adjusted to the rate of inflation. The interest rate on these securities is generally fixed at issuance at a rate lower than typical bonds. Over the life of an inflation-indexed bond however, interest will be paid based on a principal value which is adjusted for inflation. Any increase in the principal amount of an inflation-indexed bond is recognized as a component of Interest on the Consolidated Statement of Operations, even though principal is not received until maturity.
(c) Senior Floating Rate Interests
Senior floating rate interests in which the Fund invests generally pay interest rates which are periodically adjusted by reference to a base short-term floating rate, plus a premium. These base lending rates are generally (i) the lending rate offered by one or more major European banks, such as the one-month or three-month London Inter-Bank Offered Rate (“LIBOR”), (ii) the prime rate offered by one or more major United States banks, or (iii) the bank’s certificate of deposit rate. Senior floating rate interests often require prepayments from excess cash flows or permit the borrower to repay at its election. The rate at which the borrower repays cannot be predicted with accuracy. As a result, the actual remaining maturity may be substantially less than the stated maturities disclosed in the Fund’s Consolidated Schedule of Investments. The interest rate indicated is the rate in effect at September 30, 2019.
(d) Interests in When-Issued Securities
The Fund may purchase and sell interests in securities on a when-issued and delayed delivery basis, with payment and delivery scheduled for a future date. No income accrues to the Fund on such interests or securities in connection with such transactions prior to the date the Fund actually take delivery of such interests or securities. These transactions are subject to market fluctuations and are subject to the risk that the value at delivery may be more or less than the trade date purchase price. Although the Fund will generally purchase these securities with the intention of acquiring such securities, they may sell such securities before the settlement date.
(e) Short Sales
When the Fund engages in a short sale of a security, an amount equal to the proceeds is reflected as an asset and an equivalent liability. The amount of the liability is subsequently marked-to-market to reflect the market value of the short sale. The Fund maintains a segregated account of cash and/or securities as collateral for short sales.
84 | THE GUGGENHEIM FUNDS ANNUAL REPORT | |
NOTES TO CONSOLIDATED FINANCIAL STATEMENTS (continued) |
Fees, if any, paid to brokers to borrow securities in connection with short sales are recorded as interest expense. In addition, the Fund must pay out the dividend rate of the equity or coupon rate of the obligation to the lender and record this as an expense. Short dividend or interest expense is a cost associated with the investment objective of short sales transactions, rather than an operational cost associated with the day-to-day management of any mutual fund. The Fund may also receive rebate income from the broker resulting from the investment of the proceeds from securities sold short.
(f) Options
Upon the purchase of an option, the premium paid is recorded as an investment, the value of which is marked-to-market daily. If a purchased option expires, the Fund realizes a loss in the amount of the cost of the option. When the Fund enters into a closing sale transaction, it realizes a gain or loss depending on whether the proceeds from the closing sale transaction are greater or less than the cost of the option. If the Fund exercises a put option, it realizes a gain or loss from the sale of the underlying security and the proceeds from such sale will be decreased by the premium originally paid. When the Fund exercises a call option, the cost of the security purchased by the Fund upon exercise increases by the premium originally paid.
When the Fund writes (sells) an option, an amount equal to the premium received is entered in that Fund’s accounting records as an asset and equivalent liability. The amount of the liability is subsequently marked-to-market to reflect the current value of the option written. When a written option expires, or if the Fund enters into a closing purchase transaction, it realizes a gain (or loss if the cost of a closing purchase transaction exceeds the premium received when the option was sold).
(g) Futures Contracts
Upon entering into a futures contract, the Fund deposits and maintains as collateral such initial margin as required by the exchange on which the transaction is affected. Pursuant to the contract, the Fund agrees to receive from or pay to the broker an amount of cash equal to the daily fluctuation in value of the contract. Such receipts or payments are known as variation margin and are recorded by the Fund as unrealized appreciation or depreciation. When the contract is closed, the Fund records a realized gain or loss equal to the difference between the value of the contract at the time it was opened and the value at the time it was closed.
(h) Swap Agreements
Swap agreements are marked-to-market daily and the change, if any, is recorded as unrealized appreciation or depreciation. Payments received or made as a result of an agreement or termination of an agreement are recognized as realized gains or losses.
| | THE GUGGENHEIM FUNDS ANNUAL REPORT | 85 |
NOTES TO CONSOLIDATED FINANCIAL STATEMENTS (continued) |
Upfront payments received or made by a Fund on credit default swap agreements and interest rate swap agreements are amortized over the expected life of the agreement. Periodic payments received or paid by a Fund are recorded as realized gains or losses. Payments received or made as a result of a credit event or termination of the contract are recognized, net of a proportional amount of the upfront payment, as realized gains or losses.
(i) Currency Translations
The accounting records of the Fund are maintained in U.S. dollars. All assets and liabilities initially expressed in foreign currencies are converted into U.S. dollars at prevailing exchange rates. Purchases and sales of investment securities, dividend and interest income, and certain expenses are translated at the rates of exchange prevailing on the respective dates of such transactions.
Changes in the relationship of these foreign currencies to the U.S. dollar can significantly affect the value of the investments and earnings of the Fund. Foreign investments may also subject the Fund to foreign government exchange restrictions, expropriation, taxation, or other political, social or economic developments, all of which could affect the market and/or credit risk of the investments.
The Fund does not isolate that portion of the results of operations resulting from changes in the foreign exchange rates on investments from the fluctuations arising from changes in the market prices of securities held. Such fluctuations are included with the net realized gain or loss and unrealized appreciation or depreciation on investments.
Reported net realized foreign exchange gains and losses arise from sales of foreign currencies and currency gains or losses realized between the trade and settlement dates on investment transactions. Net unrealized exchange appreciation and depreciation arise from changes in the fair values of assets and liabilities other than investments in securities at the fiscal period end, resulting from changes in exchange rates.
(j) Forward Foreign Currency Exchange Contracts
The change in value of a forward foreign currency exchange contract is recorded as unrealized appreciation or depreciation until the contract is closed. When the forward is closed, the Fund records a realized gain or loss equal to the difference between the value at the time the contract was opened and the value at the time it was closed.
(k) Foreign Taxes
The Fund may be subject to foreign taxes (a portion of which may be reclaimable) on income, stock dividends, capital gains on investments or certain foreign currency transactions. All foreign taxes are recorded in accordance with the applicable foreign tax regulations and rates that exist in the foreign jurisdictions in which the Fund invests. These foreign taxes, if any, are paid by the Fund and reflected in its Consolidated Statement of Operations as follows: foreign taxes withheld at source are presented as a reduction of income and foreign taxes on capital gains from sales of
86 | THE GUGGENHEIM FUNDS ANNUAL REPORT | |
NOTES TO CONSOLIDATED FINANCIAL STATEMENTS (continued) |
investments are included with the net realized gain (loss) on investments. Foreign taxes payable or deferred as of September 30, 2019, if any, are disclosed in the Fund’s Consolidated Statement of Assets and Liabilities.
(l) Security Transactions
Security transactions are recorded on the trade date for financial reporting purposes. Realized gains and losses from securities transactions are recorded using the identified cost basis. Proceeds from lawsuits related to investment holdings are recorded as a reduction to cost if the securities are still held and as realized gains if no longer held in the Fund. Dividend income is recorded on the ex-dividend date, net of applicable taxes withheld by foreign countries. Taxable non-cash dividends are recorded as dividend income. Interest income, including amortization of premiums and accretion of discounts, is accrued on a daily basis. Interest income also includes paydown gains and losses on mortgage-backed and asset-backed securities and senior and subordinated loans. Amendment fees are earned as compensation for evaluating and accepting changes to the original loan agreement and are recognized when received. Dividend income from Real Estate Investment Trusts (“REITs”) is recorded based on the income included in the distributions received from the REIT investments using published REIT classifications, including some management estimates when actual amounts are not available. Distributions received in excess of this estimated amount are recorded as a reduction of the cost of investments or reclassified to realized gains. The actual amounts of income, return of capital, and realized gains are only determined by each REIT after its fiscal year-end, and may differ from the estimated amounts.
Income from residual collateralized loan obligations is recognized using the effective interest method. At the time of purchase, management estimates the future expected cash flows and determines the effective yield and estimated maturity date based on the estimated cash flows. Subsequent to the purchase, the estimated cash flows are updated periodically and a revised yield is calculated prospectively.
(m) Distributions
The Fund declares dividends from investment income daily. The Fund pays its shareholders from its net investment income monthly and distributes any net capital gains that it has realized, at least annually. Distributions to shareholders are recorded on the ex-dividend date. Dividends are reinvested in additional shares unless shareholders request payment in cash. The character of distributions made during the year from net investment income or net realized gains may differ from their ultimate characterization for U.S. federal income tax purposes.
| | THE GUGGENHEIM FUNDS ANNUAL REPORT | 87 |
NOTES TO CONSOLIDATED FINANCIAL STATEMENTS (continued) |
(n) Class Allocations
Interest and dividend income, most expenses, all realized gains and losses, and all unrealized appreciation and depreciation are allocated to the classes based upon the value of the outstanding shares in each Class. Certain costs, such as distribution and service fees are charged directly to specific classes. In addition, certain expenses have been allocated to the individual Funds in the Trust based on the respective net assets of each Fund included in the Trust.
(o) Earnings Credits
Under the fee arrangement with the custodian, the Fund may earn credits based on overnight custody cash balances. These credits are utilized to reduce related custodial expenses. The custodian fees disclosed in the Consolidated Statement of Operations are before the reduction in expense from the related earnings credits, if any. Earnings credits for the year ended September 30, 2019, are disclosed in the Consolidated Statement of Operations.
(p) Cash
The Fund may leave cash overnight in its cash account with the custodian. Periodically, the Fund may have cash due to the custodian bank as an overdraft balance. A fee is incurred on this overdraft, calculated by multiplying the overdraft by a rate based on the federal funds rate, which was 1.90% at September 30, 2019.
(q) Indemnifications
Under the Fund’s organizational documents, its Trustees and Officers are indemnified against certain liabilities arising out of the performance of their duties to the Trust. In addition, throughout the normal course of business, the Fund enters into contracts that contain a variety of representations and warranties which provide general indemnifications. The Fund’s maximum exposure under these arrangements is unknown, as this would involve future claims that may be made against the Fund and/or its affiliates that have not yet occurred. However, based on experience, the Fund expects the risk of loss to be remote.
Note 2 – Financial Instruments and Derivatives
As part of its investment strategy, the Fund utilizes short sales and a variety of derivative instruments. These investments involve, to varying degrees, elements of market risk. Valuation and accounting treatment of these instruments can be found under Significant Accounting Policies in Note 1 of these Notes to Consolidated Financial Statements.
Short Sales
A short sale is a transaction in which the Fund sells a security it does not own. If the security sold short decreases in price between the time the Fund sells the security and closes its short position, the Fund will realize a gain on the transaction. Conversely, if the security increases in price during the period, the Fund will realize a loss on the transaction. The risk of such price increases is the principal risk of engaging in short sales.
88 | THE GUGGENHEIM FUNDS ANNUAL REPORT | |
NOTES TO CONSOLIDATED FINANCIAL STATEMENTS (continued) |
Derivatives
Derivatives are instruments whose values depend on, or are derived from, in whole or in part, the value of one or more other assets, such as securities, currencies, commodities or indices. Derivative instruments may be used to increase investment flexibility (including to maintain cash reserves while maintaining exposure to certain other assets), for risk management (hedging) purposes, to facilitate trading, to reduce transaction costs and to pursue higher investment returns. Derivative instruments may also be used to mitigate certain investment risks, such as foreign currency exchange rate risk, interest rate risk and credit risk. U.S. GAAP requires disclosures to enable investors to better understand how and why a Fund uses derivative instruments, how these derivative instruments are accounted for and their effects on the Fund’s financial position and results of operations.
The Fund utilized derivatives for the following purposes:
Duration: the use of an instrument to manage the interest rate risk of a portfolio.
Hedge: an investment made in order to reduce the risk of adverse price movements in a security, by taking an offsetting position to protect against broad market moves.
Income: the use of any instrument that distributes cash flows typically based upon some rate of interest.
Speculation: the use of an instrument to express macro-economic and other investment views.
Options Purchased and Written
A call option on a security gives the purchaser of the option the right to buy, and the writer of a call option the obligation to sell, the underlying security. The purchaser of a put option has the right to sell, and the writer of the put option the obligation to buy, the underlying security at any time during the option period. The risk associated with purchasing options is limited to the premium originally paid.
The following table represents the Fund’s use and volume of call/put options purchased on a monthly basis:
| | | Average Notional Amount | |
Use | | Call | | | Put | |
Duration, Hedge, Speculation | | $ | 419,101,084 | | | $ | 5,415,911,275 | |
The risk in writing a call option is that a Fund may incur a loss if the market price of the underlying security increases and the option is exercised. The risk in writing a put option is that a Fund may incur a loss if the market price of the underlying security decreases and the option is exercised. In addition, there may be an imperfect correlation between the movement in prices of options
| | THE GUGGENHEIM FUNDS ANNUAL REPORT | 89 |
NOTES TO CONSOLIDATED FINANCIAL STATEMENTS (continued) |
and the underlying securities where a Fund may not be able to enter into a closing transaction because of an illiquid secondary market; or, for OTC options, a Fund may be at risk because of the counterparty’s inability to perform.
The following table represents the Fund’s use and volume of call/put options written on a monthly basis:
| | | Average Notional Amount | |
Use | | Call | | | Put | |
Duration, Hedge, Speculation | | $ | 25,673,241 | | | $ | 2,569,077,941 | |
Futures Contracts
A futures contract is an agreement to purchase (long) or sell (short) an agreed amount of securities or other instruments at a set price for delivery at a future date. There are significant risks associated with a Fund’s use of futures contracts, including (i) there may be an imperfect or no correlation between the changes in market value of the underlying asset and the prices of futures contracts; (ii) there may not be a liquid secondary market for a futures contract; (iii) trading restrictions or limitations may be imposed by an exchange; and (iv) government regulations may restrict trading in futures contracts. When investing in futures, there is minimal counterparty credit risk to a Fund because futures are exchange-traded and the exchange’s clearinghouse, as counterparty to all exchange-traded futures, guarantees against default. Cash deposits are shown as segregated cash with broker on the Consolidated Statement of Assets and Liabilities; securities held as collateral are noted on the Consolidated Schedule of Investments.
The following table represents the Fund’s use and volume of futures on a monthly basis:
| | | Average Notional Amount | |
Use | | Long | | | Short | |
Hedge, Income | | $ | — | | | $ | 86,568,181 | |
Swap Agreements
A swap is an agreement that obligates two parties to exchange a series of cash flows at specified intervals based upon or calculated by reference to changes in specified prices or rates for a specified amount of an underlying asset. When utilizing OTC swaps, the Fund bears the risk of loss of the amount expected to be received under a swap agreement in the event of the default or bankruptcy of a swap agreement counterparty or if the underlying asset declines in value. Certain standardized swaps are subject to mandatory central clearing and are executed on a multi-lateral or other trade facility platform, such as a registered exchange. There is limited counterparty credit risk with respect to centrally-cleared swaps as the transaction is facilitated through a central clearinghouse, much like exchange-traded futures contracts. Upon entering into certain centrally-cleared swap transactions, the Fund is required to deposit with its clearing broker an amount
90 | THE GUGGENHEIM FUNDS ANNUAL REPORT | |
NOTES TO CONSOLIDATED FINANCIAL STATEMENTS (continued) |
of cash or securities as an initial margin. Subsequent variation margin payments or receipts are made or received by the Fund, depending on fluctuations in the fair value of the reference entity. For a fund utilizing centrally cleared swaps, the exchange bears the risk of loss resulting from a counterparty not being able to pay. There is no guarantee that a fund or an underlying fund could eliminate its exposure under an outstanding swap agreement by entering into an offsetting swap agreement with the same or another party.
Total return and custom basket swaps involve commitments where single or multiple cash flows are exchanged based on the price of an underlying reference asset (such as an index or custom basket of securities) for a fixed or variable interest rate. Total return and custom basket swaps will usually be computed based on the current value of the reference asset as of the close of regular trading on the NYSE or other exchange, with the swap value being adjusted to include dividends accrued, financing charges and/or interest associated with the swap agreement. When utilizing total return or custom basket swaps, the Fund bears the risk of loss of the amount expected to be received under a swap agreement in the event of the default or bankruptcy of a swap agreement counterparty or if the underlying reference asset declines in value.
The following table represents the Fund’s use and volume of custom basket swaps on a monthly basis:
| | | Average Notional Amount | |
Use | | Long | | | Short | |
Hedge, Leverage | | $ | 14,341,456 | | | $ | 39,376,424 | |
There were no custom basket swaps outstanding at September 30, 2019.
The following table represents the Fund’s use and volume of total return swaps on a monthly basis:
| | | Average Notional Amount | |
Use | | Long | | | Short | |
Income | | $ | — | * | | $ | — | |
* | Total return swap agreements were outstanding for 40 days during the year ended September 30, 2019. The daily average outstanding notional amount of total return swap agreements during the period was $23,682,567. |
Interest rate swaps involve the exchange by the Fund with another party for its respective commitment to pay or receive a fixed or variable interest rate on a notional amount of principal. Interest rate swaps are generally centrally-cleared, but central clearing does not make interest rate swap transactions risk free.
| | THE GUGGENHEIM FUNDS ANNUAL REPORT | 91 |
NOTES TO CONSOLIDATED FINANCIAL STATEMENTS (continued) |
The following table represents the Fund’s use and volume of interest rate swaps on a monthly basis:
| | | Average Notional Amount | |
Use | | Pay Floating Rate | | | Receive Floating Rate | |
Duration, Hedge | | $ | 33,679,250 | | | $ | 986,636,833 | |
Credit default swaps are instruments which allow for the full or partial transfer of third party credit risk, with respect to a particular entity or entities, from one counterparty to the other. The Fund enters into credit default swaps as a “seller” or “buyer” of protection primarily to gain or reduce exposure to the investment grade and/or high yield bond market. A seller of credit default swaps is selling credit protection or assuming credit risk with respect to the underlying entity or entities. The buyer in a credit default swap is obligated to pay the seller a periodic stream of payments over the term of the contract provided that no event of default on an underlying reference obligation has occurred. If a credit event occurs, as defined under the terms of the swap agreement, the seller will either (i) pay to the buyer of protection an amount equal to the notional amount of the swap and take delivery of the referenced obligation or underlying securities comprising the referenced index or (ii) pay a net settlement amount in the form of cash or securities equal to the notional amount of the swap less the recovery value of the referenced obligation or underlying securities comprising the referenced index. The Notional Amount reflects the maximum potential amount the seller of credit protection could be required to pay to the buyer if a credit event occurs. The seller of protection receives periodic premium payments from the buyer and may also receive or pay an upfront premium adjustment to the stated periodic payments. In the event a credit default occurs on a credit default swap referencing an index, a factor adjustment will take place and the buyer of protection will receive a payment reflecting the par less the default recovery rate of the defaulted index component based on its weighting in the index. If no default occurs, the counterparty will pay the stream of payments and have no further obligations to the fund selling the credit protection. For a fund utilizing centrally cleared credit default swaps, the exchange bears the risk of loss resulting from a counterparty not being able to pay. For OTC credit default swaps, a fund bears the risk of loss of the amount expected to be received under a swap agreement in the event of the default or bankruptcy of a swap agreement counterparty, or in the case of a credit default swap in which a fund is selling credit protection, the default of a third party issuer.
The quoted market prices and resulting market values for credit default swap agreements on securities and credit indices serve as an indicator of the current status of the payment/performance risk and represent the likelihood of an expected liability (or profit) for the credit derivative had the notional amount of the swap agreement been closed/sold as of the period end. Increasing market values, in absolute terms when compared to the notional amount of the swap, represent a deterioration of the referenced entity’s credit soundness and a greater likelihood or risk of default or other credit event occurring as defined under the terms of the agreement.
92 | THE GUGGENHEIM FUNDS ANNUAL REPORT | |
NOTES TO CONSOLIDATED FINANCIAL STATEMENTS (continued) |
The following table represents the Fund’s use and volume of credit default swaps on a monthly basis:
| | | Average Notional Amount | |
Use | | Protection Sold | | | Protection Purchased | |
Hedge | | $ | — | | | $ | 1,325,726,667 | |
Forward Foreign Currency Exchange Contracts
A forward foreign currency exchange contract is an agreement between two parties to exchange two designated currencies at a specific time in the future. Certain types of contracts may be cash settled, in an amount equal to the change in exchange rates during the term of the contract. The contracts can be used to hedge or manage exposure to foreign currency risks with portfolio investments or to gain exposure to foreign currencies.
The market value of a forward foreign currency exchange contract changes with fluctuations in foreign currency exchange rates. Furthermore, the Fund may be exposed to risk if the counterparties cannot meet the contract terms or if the currency value changes unfavorably as compared to the U.S. dollar.
The following table represents the Fund’s use and volume of forward foreign currency exchange contracts on a monthly basis:
| | | Average Value | |
Use | | Purchased | | | Sold | |
Hedge, Income | | $ | 68,283,261 | | | $ | 1,242,916,365 | |
Derivative Investment Holdings Categorized by Risk Exposure
The following is a summary of the location of derivative investments on the Fund’s Consolidated Statement of Assets and Liabilities as of September 30, 2019:
Derivative Investment Type | Asset Derivatives | Liability Derivatives |
Interest Rate contracts | Investments in unaffiliated issuers, at value | Variation margin on futures contracts |
| | Unamortized upfront premiums paid on interest rate swap agreements | Unamortized upfront premiums received on interest rate swap agreements |
| | Variation margin on interest rate swap agreements |
Credit contracts | Unrealized appreciation on OTC swap agreements | Unrealized depreciation on OTC swap agreements |
| Unamortized upfront premiums paid on credit default swap agreements | Unamortized upfront premiums received on credit default swap agreements |
| | Variation margin on credit default swap agreements |
Currency contracts | Unrealized appreciation on forward foreign currency exchange contracts | Unrealized depreciation on forward foreign currency exchange contracts |
| | THE GUGGENHEIM FUNDS ANNUAL REPORT | 93 |
NOTES TO CONSOLIDATED FINANCIAL STATEMENTS (continued) |
The following table sets forth the fair value of the Fund’s derivative investments categorized by primary risk exposure at September 30, 2019:
| | Asset Derivative Investments Value | |
| | Futures
Interest Rate
Risk* | | | Swaps
Interest Rate
Risk* | | | Swaps
Credit
Risk* | | | Options
Purchased
Interest Rate
Risk | | | Forward
Foreign Currency
Exchange
Risk | | | Total Value at
September 30,
2019 | |
| | $ | 909,673 | | | $ | 115,761 | | | $ | 5,301 | | | $ | 10,352,163 | | | $ | 29,969,735 | | | $ | 41,352,633 | |
| | Liability Derivative Investments Value | |
| | Futures
Interest Rate
Risk* | | | Swaps
Interest Rate
Risk* | | | Swaps
Credit
Risk* | | | Options
Written
Interest Rate
Risk | | | Forward
Foreign Currency
Exchange
Risk | | | Total Value at
September 30,
2019 | |
| | $ | — | | | $ | 30,518,761 | | | $ | 16,371,844 | | | $ | — | | | $ | 5,043,938 | | | $ | 51,934,543 | |
* | Includes cumulative appreciation (depreciation) of exchange-traded, OTC and centrally cleared derivatives as reported on the Consolidated Schedule of Investments. For exchange-traded and centrally cleared derivatives, variation margin is reported within the Consolidated Statement of Assets and Liabilities. |
The following is a summary of the location of derivative investments on the Fund’s Consolidated Statement of Operations for the year ended September 30, 2019:
Derivative Investment Type | Location of Gain (Loss) on Derivatives |
Interest Rate contracts | Net realized gain (loss) on futures contracts |
| Net change in unrealized appreciation (depreciation) on futures contracts |
Equity/Credit/Interest Rate Contracts | Net realized gain (loss) on swap agreements |
| Net change in unrealized appreciation (depreciation) on swap agreements |
Equity/Interest Rate Contracts | Net realized gain (loss) on options purchased |
| | Net change in unrealized appreciation (depreciation) on options purchased |
| | Net realized gain (loss) on options written |
| | Net change in unrealized appreciation (depreciation) on options written |
Currency contracts | Net realized gain (loss) on forward foreign currency exchange contracts |
| | Net change in unrealized appreciation (depreciation) on forward foreign currency exchange contracts |
94 | THE GUGGENHEIM FUNDS ANNUAL REPORT | |
NOTES TO CONSOLIDATED FINANCIAL STATEMENTS (continued) |
The following is a summary of the Fund’s realized gain (loss) and change in unrealized appreciation (depreciation) on derivative investments recognized on the Consolidated Statement of Operations categorized by primary risk exposure for the year ended September 30, 2019:
| | Realized Gain (Loss) on Derivative Investments Recognized on the Consolidated Statement of Operations | |
| | Futures
Interest Rate
Risk | | | Swaps
Equity
Risk | | | Swaps
Interest Rate
Risk | | | Swaps
Credit
Risk | | | Options
Purchased
Interest Rate
Risk | |
| | $ | (4,986,350 | ) | | $ | 7,943,344 | | | $ | 4,387,388 | | | $ | (12,139,207 | ) | | $ | (11,097,127 | ) |
| | Realized Gain (Loss) on Derivative Investments Recognized on the Consolidated Statement of Operations | |
| | Options
Written
Interest Rate
Risk | | | Options
Purchased
Equity
Risk | | | Options
Written
Equity
Risk | | | Forward
Foreign
Currency
Exchange
Risk | | | Total | |
| | $ | 5,564,206 | | | $ | (36,915,100 | ) | | $ | 6,057,047 | | | $ | 20,424,159 | | | $ | (20,761,640 | ) |
| | Change in Unrealized Appreciation (Depreciation) on Derivative Investments
Recognized on the Consolidated Statement of Operations | |
| | Futures
Interest Rate
Risk | | | Swaps
Equity
Risk | | | Swaps
Interest Rate
Risk | | | Swaps
Credit
Risk | | | Options
Purchased
Interest Rate
Risk | |
| | $ | 909,673 | | | $ | 8,762,933 | | | $ | (37,997,301 | ) | | $ | (16,322,010 | ) | | $ | (20,146,895 | ) |
| | Change in Unrealized Appreciation (Depreciation) on Derivative Investments
Recognized on the Consolidated Statement of Operations | |
| | Options
Written
Interest Rate
Risk | | | Options
Purchased
Equity
Risk | | | Options
Written
Equity
Risk | | | Forward
Foreign
Currency
Exchange
Risk | | | Total | |
| | $ | 7,143,945 | | | $ | 8,730,213 | | | $ | (2,841,520 | ) | | $ | 11,406,050 | | | $ | (40,354,912 | ) |
In conjunction with short sales and the use of derivative instruments, the Fund is required to maintain collateral in various forms. Depending on the financial instrument utilized and the broker involved, the Fund uses margin deposits at the broker, cash and/or securities segregated at the custodian bank, discount notes or repurchase agreements allocated to the Fund as collateral.
| | THE GUGGENHEIM FUNDS ANNUAL REPORT | 95 |
NOTES TO CONSOLIDATED FINANCIAL STATEMENTS (continued) |
Foreign Investments
There are several risks associated with exposure to foreign currencies, foreign issuers and emerging markets. A fund’s indirect and direct exposure to foreign currencies subjects the Fund to the risk that those currencies will decline in value relative to the U.S. dollar, or in the case of short positions, that the U.S. dollar will decline in value relative to the currency being hedged. Currency rates in foreign countries may fluctuate significantly over short periods of time for a number of reasons, including changes in interest rates and the imposition of currency controls or other political developments in the U.S. or abroad. In addition, the Fund may incur transaction costs in connection with conversions between various currencies. The Fund may, but is not obligated to, engage in currency hedging transactions, which generally involve buying currency forward, options or futures contracts. However, not all currency risks may be effectively hedged, and in some cases the costs of hedging techniques may outweigh expected benefits. In such instances, the value of securities denominated in foreign currencies can change significantly when foreign currencies strengthen or weaken relative to the U.S. dollar.
The Fund may invest in securities of foreign companies directly, or in financial instruments, such as ADRs and exchange-traded funds, which are indirectly linked to the performance of foreign issuers. Foreign markets can be more volatile than the U.S. market due to increased risks of adverse issuer, political, regulatory, market, or economic developments and can perform differently from the U.S. market. Investing in securities of foreign companies directly, or in financial instruments that are indirectly linked to the performance of foreign issuers, may involve risks not typically associated with investing in U.S. issuers. The value of securities denominated in foreign currencies, and of dividends from such securities, can change significantly when foreign currencies strengthen or weaken relative to the U.S. dollar. Foreign securities markets generally have less trading volume and less liquidity than U.S. markets, and prices in some foreign markets may fluctuate more than those of securities traded on U.S. markets. Many foreign countries lack accounting and disclosure standards comparable to those that apply to U.S. companies, and it may be more difficult to obtain reliable information regarding a foreign issuer’s financial condition and operations. Transaction costs and costs associated with custody services are generally higher for foreign securities than they are for U.S. securities. Some foreign governments levy withholding taxes against dividend and interest income. Although in some countries portions of these taxes are recoverable, the non-recovered portion will reduce the income received by the Funds.
The Trust has established counterparty credit guidelines and enters into transactions only with financial institutions of investment grade or better. The Trust monitors the counterparty credit risk.
Note 3 – Offsetting
In the normal course of business, the Fund enters into transactions subject to enforceable master netting arrangements or other similar arrangements. Generally, the right to offset in those agreements allows the Fund to counteract the exposure to a specific counterparty with collateral
96 | THE GUGGENHEIM FUNDS ANNUAL REPORT | |
NOTES TO CONSOLIDATED FINANCIAL STATEMENTS (continued) |
received from or delivered to that counterparty based on the terms of the arrangements. These arrangements provide for the right to liquidate upon the occurrence of an event of default, credit event upon merger or additional termination event.
In order to better define its contractual rights and to secure rights that will help the Fund mitigate its counterparty risk, the Fund may enter into an International Swaps and Derivatives Association, Inc. Master Agreement (“ISDA Master Agreement”) or similar agreement with its derivative contract counterparties. An ISDA Master Agreement is a bilateral agreement between a fund and a counterparty that governs OTC derivatives, including foreign exchange contracts, and typically contains, among other things, collateral posting terms and netting provisions in the event of a default and/or termination event. The provisions of the ISDA Master Agreement typically permit a single net payment in the event of a default (close-out netting) or similar event, including the bankruptcy or insolvency of the counterparty.
For derivatives traded under an ISDA Master Agreement, the collateral requirements are typically calculated by netting the mark-to-market amount for each transaction under such agreement and comparing that amount to the value of any collateral currently pledged by the Fund and the counterparty. For financial reporting purposes, cash collateral that has been pledged to cover obligations of the Fund and cash collateral received from the counterparty, if any, are reported separately on the Consolidated Statement of Assets and Liabilities as segregated cash with broker/receivable for variation margin, or payable for swap settlement/variation margin. Cash and/or securities pledged or received as collateral by the Fund in connection with an OTC derivative subject to an ISDA Master Agreement generally may not be invested, sold or rehypothecated by the counterparty or the Fund, as applicable, absent an event of default under such agreement, in which case such collateral generally may be applied towards obligations due to and payable by such counterparty or the Fund, as applicable. Generally, the amount of collateral due from or to a counterparty must exceed a minimum transfer amount threshold (e.g., $300,000) before a transfer is required to be made. To the extent amounts due to the Fund from its counterparties are not fully collateralized, contractually or otherwise, the Fund bears the risk of loss from counterparty nonperformance. The Fund attempts to mitigate counterparty risk by only entering into agreements with counterparties that they believe to be of good standing and by monitoring the financial stability of those counterparties.
For financial reporting purposes, the Fund does not offset derivative assets and derivative liabilities that are subject to netting arrangements in the Consolidated Statement of Assets and Liabilities.
| | THE GUGGENHEIM FUNDS ANNUAL REPORT | 97 |
NOTES TO CONSOLIDATED FINANCIAL STATEMENTS (continued) |
The following tables present derivative financial instruments and secured financing transactions that are subject to enforceable netting arrangements:
| | | | | | | | | | | | | | | Gross Amounts Not
Offset in the Statement
of Assets and Liabilities | | | | | |
Instrument | | Gross
Amounts of
Recognized
Assets1 | | | Gross
Amounts
Offset in the
Statement of
Assets and
Liabilities | | | Net Amount
of Assets
Presented on
the Statement
of Assets and
Liabilities | | | Financial
Instruments | | | Cash
Collateral
Received | | | Net Amount | |
Credit default swap agreements | | $ | 5,301 | | | $ | — | | | $ | 5,301 | | | $ | (5,301 | ) | | $ | — | | | $ | — | |
Forward foreign currency exchange contracts | | | 29,969,735 | | | | — | | | | 29,969,735 | | | | (4,797,430 | ) | | | (20,939,903 | ) | | | 4,232,402 | |
Options purchased | | | 10,352,163 | | | | — | | | | 10,352,163 | | | | (4,761,309 | ) | | | (1,220,000 | ) | | | 4,370,854 | |
| | | | | | | | | | | | | | | Gross Amounts Not
Offset in the Statement
of Assets and Liabilities | | | | | |
Instrument | | Gross
Amounts of
Recognized
Liabilities1 | | | Gross
Amounts
Offset in the
Statement of
Assets and
Liabilities | | | Net Amount
of Liabilities
Presented on
the Statement
of Assets and
Liabilities | | | Financial
Instruments | | | Cash
Collateral
Pledged | | | Net Amount | |
Credit default swap agreements | | $ | 4,510,258 | | | $ | — | | | $ | 4,510,258 | | | $ | (4,510,258 | ) | | $ | — | | | $ | — | |
Forward foreign currency exchange contracts | | | 5,043,938 | | | | — | | | | 5,043,938 | | | | (5,043,938 | ) | | | — | | | | — | |
Total return swap agreements | | | 117,049 | | | | — | | | | 117,049 | | | | (9,844 | ) | | | — | | | | 107,205 | |
1 | Exchange-traded or centrally-cleared derivatives are excluded from these reported amounts. |
98 | THE GUGGENHEIM FUNDS ANNUAL REPORT | |
NOTES TO CONSOLIDATED FINANCIAL STATEMENTS (continued) |
The Fund has the right to offset deposits against any related derivative liabilities outstanding with each counterparty with the exception of exchange-traded or centrally-cleared derivatives. The following table presents deposits held by others in connection with derivative investments as of September 30, 2019.
Counterparty | Asset Type | | Cash Pledged | | | Cash Received | |
BofA Securities, Inc. | Credit default swap agreements | | $ | 9,812,887 | | | $ | — | |
BofA Securities, Inc. | Futures contracts | | | 1,296,800 | | | | — | |
BofA Securities, Inc. | Interest rate swap agreements | | | 23,220,479 | | | | — | |
Citibank N.A., New York | Forward foreign currency exchange contracts | | | — | | | | 9,639,903 | |
Goldman Sachs & Co. LLC | Forward foreign currency exchange contracts, Credit default swap agreements | | | — | | | | 4,570,000 | |
JPMorgan Chase Bank, N.A. | Forward foreign currency exchange contracts | | | — | | | | 6,730,000 | |
Morgan Stanley & Co. LLC | Forward foreign currency exchange contracts, Credit default swap agreements | | | — | | | | 1,220,000 | |
| | | | | 34,330,166 | | | | 22,159,903 | |
Note 4 – Fair Value Measurement
In accordance with U.S. GAAP, fair value is defined as the price that the Fund would receive to sell an investment or pay to transfer a liability in an orderly transaction with an independent buyer in the principal market, or in the absence of a principal market, the most advantageous market for the investment or liability. U.S. GAAP establishes a three-tier fair value hierarchy based on the types of inputs used to value assets and liabilities and requires corresponding disclosure. The hierarchy and the corresponding inputs are summarized below:
Level 1 — | quoted prices in active markets for identical assets or liabilities. |
Level 2 — | significant other observable inputs (for example quoted prices for securities that are similar based on characteristics such as interest rates, prepayment speeds, credit risk, etc.). |
Level 3 — | significant unobservable inputs based on the best information available under the circumstances, to the extent observable inputs are not available, which may include assumptions. |
The types of inputs available depend on a variety of factors, such as the type of security and the characteristics of the markets in which it trades, if any. Fair valuation determinations that rely on fewer or no observable inputs require greater judgment. Accordingly, fair value determinations for Level 3 securities require the greatest amount of judgment.
| | THE GUGGENHEIM FUNDS ANNUAL REPORT | 99 |
NOTES TO CONSOLIDATED FINANCIAL STATEMENTS (continued) |
Independent pricing services are used to value a majority of the Fund’s investments. When values are not available from a pricing service, they will be determined using a variety of sources and techniques, including: market prices; broker quotes; and models which derive prices based on inputs such as prices of securities with comparable maturities and characteristics or based on inputs such as anticipated cash flows or collateral, spread over U.S. Treasury securities, and other information and analysis. A significant portion of the Fund’s assets and liabilities are categorized as Level 2, as indicated in this report.
Quotes from broker-dealers, adjusted for fluctuations in criteria such as credit spreads and interest rates, may also be used to value the Fund’s assets and liabilities, i.e. prices provided by a broker-dealer or other market participant who has not committed to trade at that price. Although quotes are typically received from established market participants, the Fund may not have the transparency to view the underlying inputs which support the market quotations. Significant changes in a quote would generally result in significant changes in the fair value of the security.
Certain fixed income securities are valued by obtaining a monthly quote from a broker-dealer, adjusted for fluctuations in criteria such as credit spreads and interest rates.
Certain loans and other securities are valued using a single daily broker quote or a price from a third party vendor based on a single daily or monthly broker quote.
The inputs or methodologies used for valuing securities are not necessarily an indication of the risk associated with investing in those securities. The suitability of the techniques and sources employed to determine fair valuation are regularly monitored and subject to change.
Note 5 – Investment Advisory Agreement and Other Agreements
Under the terms of an investment advisory contract, the Fund pays GI investment advisory fees calculated at an annualized rate of 0.89% of the average daily net assets of the Fund. A breakpoint of 5 basis points (0.05%) on average daily net asets above $5 billion will apply to the Fund’s advisory fees.
GI has contractually agreed to waive the management fee it receives from the Subsidiary in an amount equal to the management fee paid to GI by the Subsidiary. This undertaking will continue in effect for so long as the Fund invests in the Subsidiary, and may not be terminated by GI unless GI obtains the prior approval of the Fund’s Board of Trustees for such termination. Fees waived under this arrangement are not subject to reimbursement to GI. For the year ended September 30, 2019, the Fund waived $164,890 related to advisory fees in the Subsidiary.
GI engages external service providers to perform other necessary services for the Trust, such as audit and accounting related services, legal services, custody, printing and mailing, etc., on a pass-through basis. Such expenses are allocated to various Funds within the complex based on relative net assets.
100 | THE GUGGENHEIM FUNDS ANNUAL REPORT | |
NOTES TO CONSOLIDATED FINANCIAL STATEMENTS (continued) |
The Fund has adopted Distribution Plans related to the offering of A-Class, C-Class and P-Class shares pursuant to Rule 12b-1 under the 1940 Act. The plans provide for payments at an annual rate of 0.25% of the average daily net assets of the Fund’s A-Class and P-Class shares, and 1.00% of the average daily net assets of the Fund’s C-Class shares.
The investment advisory contract for the Fund provides that the total expenses be limited to a percentage of average net assets for each class of shares, exclusive of brokerage costs, dividends or interest on securities sold short, expenses of other investment companies in which a Fund invests, interest, taxes, litigation, indemnification and extraordinary expenses. The limits are listed below:
| | Limit | | | Effective
Date | | | Contract
End Date | |
Macro Opportunities Fund - A-Class | | | 1.36 | % | | | 11/30/12 | | | | 02/01/21 | |
Macro Opportunities Fund - C-Class | | | 2.11 | % | | | 11/30/12 | | | | 02/01/21 | |
Macro Opportunities Fund - P-Class | | | 1.36 | % | | | 05/01/15 | | | | 02/01/21 | |
Macro Opportunities Fund - Institutional Class | | | 0.95 | % | | | 11/30/12 | | | | 02/01/21 | |
Macro Opportunities Fund - R6-Class | | | 0.95 | % | | | 03/13/19 | | | | 02/01/21 | |
GI is entitled to reimbursement by the Fund for fees waived or expenses reimbursed during any of the previous 36 months, beginning on the date of the expense limitation agreement, if on any day the estimated operating expenses are less than the indicated percentages. For purposes of this arrangement, GI is entitled to recoupment of previously waived fees or reimbursed expenses for 36 months from the date of the waiver or reimbursement by GI. At September 30, 2019, the amount of fees waived or expenses reimbursed that are subject to recoupment and will expire during the years ended September 30, are presented in the following table:
| | 2020 | | | 2021 | | | 2022 | | | Total | |
A-Class | | $ | 698,565 | | | $ | 369,679 | | | $ | 254,243 | | | $ | 1,322,487 | |
C-Class | | | 178,863 | | | | 169,716 | | | | 126,349 | | | | 474,928 | |
P-Class | | | 108,779 | | | | 123,284 | | | | 49,360 | | | | 281,423 | |
Institutional Class | | | 2,955,151 | | | | 5,293,700 | | | | 6,566,140 | | | | 14,814,991 | |
R6-Class | | | — | | | | — | | | | 4,516 | | | | 4,516 | |
For the year ended September 30, 2019, GI recouped $355,320 from the Fund.
If the Fund invests in a fund that is advised by the same adviser or an affiliated adviser, the investing Fund’s adviser has agreed to waive fees at the investing fund level to the extent necessary to offset the proportionate share of any management fee paid by the Fund with respect to its investment in such affiliated fund. Fee waivers will be calculated at the investing Fund level without regard to any expense cap, if any, in effect for the investing Fund. Fees waived under this arrangement are not subject to reimbursement to GI. For the year ended September 30, 2019, the Fund waived $2,566,640 related to investments in affiliated funds.
| | THE GUGGENHEIM FUNDS ANNUAL REPORT | 101 |
NOTES TO CONSOLIDATED FINANCIAL STATEMENTS (continued) |
For the year ended September 30, 2019, GFD retained sales charges of $286,511 relating to sales of A-Class shares of the Trust.
Certain trustees and officers of the Trust are also officers of GI and/or GFD. The Trust does not compensate its officers or trustees who are officers, directors and/or employees of GI or GFD.
MUFG Investor Services (US), LLC (“MUIS”) acts as the Fund’s administrator, transfer agent and accounting agent. As administrator, transfer agent and accounting agent, MUIS is responsible for maintaining the books and records of the Fund’s securities and cash. The Bank of New York Mellon Corp. (“BNY”) acts as the Fund’s custodian. As custodian, BNY is responsible for the custody of the Fund’s assets. For providing the aforementioned administrative and accounting services, MUIS is entitled to receive a monthly fee equal to a percentage of the Fund’s average daily net assets and out of pocket expenses. For providing the aforementioned transfer agent and custodian services, MUIS and BNY are entitled to receive a monthly fee based on the number of transactions during the month and the number of accounts under management, subject to certain minimum monthly fees, and out of pocket expenses.
Note 6 – Federal Income Tax Information
The Fund intends to comply with the provisions of Subchapter M of the Internal Revenue Code applicable to regulated investment companies and will distribute substantially all taxable net investment income and capital gains sufficient to relieve the Fund from all, or substantially all, federal income, excise and state income taxes. Therefore, no provision for federal or state income tax or federal excise tax is required.
Tax positions taken or expected to be taken in the course of preparing the Fund’s tax returns are evaluated to determine whether the tax positions are “more-likely-than-not” of being sustained by the applicable tax authority. Tax positions not deemed to meet the more-likely-than-not threshold would be recorded as a tax benefit or expense in the current year. Management has analyzed the Fund’s tax positions taken, or to be taken, on U.S. federal income tax returns for all open tax years, and has concluded that no provision for income tax is required in the Fund’s consolidated financial statements. The Fund’s U.S. federal income tax returns are subject to examination by the Internal Revenue Service for a period of three years after they are filed.
The Fund intends to invest up to 25% of its assets in the Subsidiary which is expected to provide the Fund with exposure to the commodities markets within the limitations of the U.S. federal income tax requirements under Subchapter M of the Internal Revenue Code. The Fund has received a private letter ruling from the IRS that concludes that the income the Fund receives from the Subsidiary will constitute qualifying income for purposes of Subchapter M of the Internal Revenue Code. The Subsidiary will be classified as a corporation for U.S. federal income tax purposes. A foreign corporation, such as the Subsidiary, will generally not be subject to U.S. federal income taxation unless it is deemed to be engaged in a U.S. trade or business.
102 | THE GUGGENHEIM FUNDS ANNUAL REPORT | |
NOTES TO CONSOLIDATED FINANCIAL STATEMENTS (continued) |
The tax character of distributions paid during the year ended September 30, 2019 was as follows:
| | Ordinary
Income | | | Long-Term
Capital Gain | | | Return of
Capital | | | Total
Distributions | |
| | | $ | 240,774,261 | | | $ | — | | | $ | — | | | $ | 240,774,261 | |
The tax character of distributions paid during the year ended September 30, 2018 was as follows:
| | Ordinary
Income | | | Long-Term
Capital Gain | | | Return of
Capital | | | Total
Distributions | |
| | | $ | 218,656,547 | | | $ | — | | | $ | — | | | $ | 218,656,547 | |
Note: For U.S. federal income tax purposes, short-term capital gain distributions are treated as ordinary income distributions.
The tax components of distributable earnings/(loss) as of September 30, 2019 were as follows:
| | Undistributed
Ordinary
Income | | | Undistributed
Long-Term
Capital Gain | | | Net Unrealized
Appreciation
(Depreciation) | | | Accumulated
Capital and
Other Losses | | | Other
Temporary
Differences | | | Total | |
| | | $ | 5,083,944 | | | $ | — | | | $ | (172,642,204 | ) | | $ | (103,183,746 | ) | | $ | (12,589,091 | ) | | $ | (283,331,097 | ) |
For U.S. federal income tax purposes, capital loss carryforwards represent realized losses of the Fund that may be carried forward and applied against future capital gains. Under the RIC Modernization Act of 2010, the Fund is permitted to carry forward capital losses incurred in taxable years beginning after December 22, 2010 for an unlimited period and such capital loss carryforwards will retain their character as either short-term or long-term capital losses. As of September 30, 2019, capital loss carryforwards for the Fund were as follows:
| | | Unlimited | | | | | |
| | Short-Term | | | Long-Term | | | Total
Capital Loss
Carryforward | |
| | | $ | (41,309,635 | ) | | $ | (61,874,111 | ) | | $ | (103,183,746 | ) |
Net investment income and net realized gains (losses) may differ for financial statement and tax purposes because of temporary or permanent book/tax differences. These differences are primarily due to investments in CLO securities, the “mark-to-market” of certain derivatives, investments in swaps, paydown reclasses, investments in bonds, losses deferred due to wash sales, foreign currency gains and losses, dividend payable, amortization, recharacterization of income from investments, the “mark-to-market”, recharacterization, or disposition of Passive Foreign Investment Companies, and transactions with the Fund’s wholly owned foreign subsidiary. Additional differences may result from the investments in partnerships, distribution reclasses,
| | THE GUGGENHEIM FUNDS ANNUAL REPORT | 103 |
NOTES TO CONSOLIDATED FINANCIAL STATEMENTS (continued) |
and the “mark-to-market” of certain foreign currency denominated securities. To the extent these differences are permanent and would require a reclassifcation between Paid in Capital and Total Distributable Earnings (Loss), such reclassifications are made in the period that the differences arise. These reclassifications have no effect on net assets or NAV per share.
The following adjustments were made on the Statement of Assets and Liabilities as of September 30, 2019 for permanent book/tax differences:
| | Paid In
Capital | | | Total
Distributable
Earnings/(Loss) | |
| | | $ | (216,000 | ) | | $ | 216,000 | |
At September 30, 2019, the cost of investments for U.S. federal income tax purposes, the aggregate gross unrealized appreciation for all investments for which there was an excess of value over tax cost and the aggregate gross unrealized depreciation for all investments for which there was an excess of tax cost over value, were as follows:
| | Tax
Cost | | | Tax
Unrealized
Appreciation | | | Tax
Unrealized
Depreciation | | | Net Unrealized
Appreciation/
(Depreciation) | |
| | | $ | 6,515,706,090 | | | $ | 60,222,124 | | | $ | (233,229,085 | ) | | $ | (173,006,961 | ) |
Note 7 – Securities Transactions
For the year ended September 30, 2019, the cost of purchases and proceeds from sales of investment securities, excluding government securities, short-term investments and derivatives, were as follows:
| | Purchases | | | Sales | |
| | $ | 1,754,301,041 | | | $ | 3,082,891,961 | |
For the year ended September 30, 2019, the cost of purchases and proceeds from the sales of government securities were as follows:
| | Purchases | | | Sales | |
| | $ | 402,645,092 | | | $ | 213,620,809 | |
The Fund is permitted to purchase or sell securities from or to certain affiliated funds under specified conditions outlined in procedures adopted by the Board. The procedures have been designed to ensure that any purchase or sale of securities by the Fund from or to another fund or portfolio that is or could be considered an affiliate by virtue of having a common investment adviser (or affiliated investment advisers), common trustees and/or common officers complies with Rule 17a-7 of the 1940 Act. Further, as defined under these procedures, each transaction
104 | THE GUGGENHEIM FUNDS ANNUAL REPORT | |
NOTES TO CONSOLIDATED FINANCIAL STATEMENTS (continued) |
is effected at the current market price to save costs, where permissible. For the year ended September 30, 2019, the Fund engaged in purchases and sales of securities, pursuant to Rule 17a-7 of the 1940 Act, as follows:
| | Purchases | | | Sales | | | Realized
Loss | |
| | $ | 2,125,625 | | | $ | 32,444,132 | | | $ | (755,701 | ) |
Note 8 – Unfunded Loan Commitments
Pursuant to the terms of certain loan agreements, the Fund held unfunded loan commitments as of September 30, 2019. The Fund is obligated to fund these loan commitments at the borrower’s discretion.
The unfunded loan commitments as of September 30, 2019, were as follows:
Borrower | | Maturity
Date | | | Face
Amount* | | | Value | |
Acosta, Inc. | | | 12/26/19 | | | | 1,045,957 | | | $ | 717,788 | |
Aspect Software, Inc. | | | 07/15/23 | | | | 144,301 | | | | 1,849 | |
Bullhorn, Inc. | | | 11/21/22 | | | | 222,254 | | | | 17,495 | |
Epicor Software | | | 06/01/20 | | | | 2,000,000 | | | | 32,435 | |
Fortis Solutions Group LLC | | | 12/15/23 | | | | 503,680 | | | | 43,453 | |
Galls LLC | | | 01/31/24 | | | | 102,808 | | | | 9,676 | |
Galls LLC | | | 01/31/25 | | | | 1,300,936 | | | | 11,161 | |
Lytx, Inc. | | | 08/31/22 | | | | 363,158 | | | | 26,501 | |
Mavis Tire Express Services Corp. | | | 03/20/25 | | | | 662,777 | | | | 15,383 | |
Ministry Brands LLC | | | 12/02/22 | | | | 184,896 | | | | — | |
MRI Software LLC | | | 06/30/23 | | | | 125,340 | | | | 4,043 | |
National Technical Systems | | | 06/12/21 | | | | 250,000 | | | | 8,843 | |
SLR Consulting Ltd. | | | 05/23/25 | | | GBP | 153,748 | | | | 4,189 | |
Solera LLC | | | 03/03/21 | | | | 6,183,000 | | | | 247,666 | |
Trader Interactive | | | 06/15/23 | | | | 461,538 | | | | — | |
| | | | | | | | | | | $ | 1,140,482 | |
* | The face amount is denominated in U.S. dollars unless otherwise indicated. |
| | THE GUGGENHEIM FUNDS ANNUAL REPORT | 105 |
NOTES TO CONSOLIDATED FINANCIAL STATEMENTS (continued) |
Note 9 – Restricted Securities
The securities below are considered illiquid and restricted under guidelines established by the Board:
Restricted
Securities | | Acquisition
Date | | | Cost | | | Value | |
Airplanes Pass Through Trust | | | | | | | | | | | | |
2001-1A, 2.88% (1 Month USD LIBOR + 0.55%, Rate Floor: 0.55%) due 03/15/191,3 | | | 01/18/12 | | | $ | 1,691,717 | | | $ | 34,739 | |
Atlas Mara Ltd. | | | | | | | | | | | | |
8.00% due 12/31/20 | | | 10/01/15 | | | | 13,653,599 | | | | 12,744,000 | |
Basic Energy Services, Inc. | | | | | | | | | | | | |
10.75% due 10/15/23 | | | 09/25/18 | | | | 1,487,896 | | | | 1,095,000 | |
Copper River CLO Ltd. | | | | | | | | | | | | |
2007-1A, due 01/20/212 | | | 05/09/14 | | | | 1,606,213 | | | | 1,131,171 | |
Highland Park CDO I Ltd. | | | | | | | | | | | | |
2006-1A, 2.53% (3 Month USD LIBOR + 0.40%, Rate Floor: 0.00%) due 11/25/511 | | | 04/14/15 | | | | 1,213,255 | | | | 1,489,660 | |
Mirabela Nickel Ltd. | | | | | | | | | | | | |
9.50% due 06/24/193 | | | 12/31/13 | | | | 1,710,483 | | | | 94,271 | |
Princess Juliana International Airport Operating Company N.V. | | | | | | | | | | | | |
5.50% due 12/20/27 | | | 12/17/12 | | | | 1,390,103 | | | | 1,319,433 | |
Secured Tenant Site Contract Revenue Notes Series | | | | | | | | | | | | |
2018-1A, 4.70% due 06/15/48 | | | 05/25/18 | | | | 6,859,482 | | | | 7,109,558 | |
Turbine Engines Securitization Ltd. | | | | | | | | | | | | |
2013-1A, 6.38% due 12/13/48 | | | 11/27/13 | | | | 1,476,735 | | | | 1,319,821 | |
Turbine Engines Securitization Ltd. | | | | | | | | | | | | |
2013-1A, 5.13% due 12/13/48 | | | 11/27/13 | | | | 2,018,173 | | | | 2,035,604 | |
| | | | | | | $ | 33,107,656 | | | $ | 28,373,257 | |
1 | Variable rate security. Rate indicated is the rate effective at September 30, 2019. In some instances, the effective rate is limited by a minimum rate floor or a maximum rate cap established by the issuer. The settlement status of a position may also impact the effective rate indicated. In some cases, a position may be unsettled at period end and may not have a stated effective rate. In instances where multiple underlying reference rates and spread amounts are shown, the effective rate is based on a weighted average. |
2 | Security has no stated coupon. However, it is expected to receive residual cash flow payments on defined deal dates. |
3 | Security is in default of interest and/or principal obligations. |
Note 10 – Line of Credit
The Trust, along with other affiliated trusts, secured a 364-day committed, $1,065,000,000 line of credit from Citibank, N.A., which was in place through October 5, 2018, at which time the line of credit was renewed with an increased commitment amount of $1,205,000,000. On October 4, 2019, the line of credit agreement was renewed with an increased commitment amount of $1,230,000,000. A Fund may draw (borrow) from the line of credit as a temporary measure
106 | THE GUGGENHEIM FUNDS ANNUAL REPORT | |
NOTES TO CONSOLIDATED FINANCIAL STATEMENTS (concluded) |
for emergency purposes, to facilitate redemption requests, or for other short-term liquidity purposes consistent with the Fund’s investment objective and program. For example, it may be advantageous for the Fund to borrow money rather than sell existing portfolio positions to meet redemption requests. Fees related to borrowings, if any, vary under this arrangement between the greater of Citibank’s “base rate”, LIBOR plus 1%, or the federal funds rate plus 1/2 of 1%.
The commitment fee that may be paid by the Fund is at an annualized rate of 0.15% of the average daily amount of its allocated unused commitment amount. The allocated commitment fee amount for the Fund is referenced in the Consolidated Statement of Operations under “Line of credit fees”. The Fund did not have any borrowings under this agreement as of and for the year ended September 30, 2019.
Note 11 – Recent Regulatory Reporting Updates
In August 2018, the Financial Accounting Standards Board issued an Accounting Standards Update, ASU 2018-13, Fair Value Measurement (Topic 820), Disclosure Framework - Changes to the Disclosure Requirements for Fair Value Measurement (the “2018 ASU”) which adds, modifies and removes disclosure requirements related to certain aspects of fair value measurement. The 2018 ASU is effective for fiscal years, and interim periods within those fiscal years, beginning after December 15, 2019. Early adoption is permitted. As of September 30, 2019, the Fund has fully adopted the provisions of the 2018 ASU, which did not have a material impact on the Fund’s consolidated financial statements and related disclosures or impact the Fund’s net assets or results of operations.
Note 12 – Recent Accounting Pronouncements
In March 2017, the Financial Accounting Standards Board issued an Accounting Standards Update, ASU 2017-08, Receivables – Nonrefundable Fees and Other Costs (Subtopic 310-20), Premium Amortization on Purchased Callable Debt Securities (the “2017 ASU”) which amends the amortization period for certain purchased callable debt securities held at a premium, shortening such period to the earliest call date. The 2017 ASU does not require any accounting change for debt securities held at a discount; the discount continues to be amortized to maturity. The 2017 ASU is effective for fiscal years, and interim periods within those fiscal years, beginning after December 15, 2018. At this time, management is evaluating the implications of these changes on the financial statements.
Note 13 – Subsequent Events
The Fund evaluated subsequent events through the date the financial statements were available for issue and determined there were no material events that would require adjustment to or disclosure in the Fund’s consolidated financial statements.
| | THE GUGGENHEIM FUNDS ANNUAL REPORT | 107 |
REPORT OF INDEPENDENT REGISTERED PUBLIC ACCOUNTING FIRM |
To the Shareholders and the Board of Trustees of Guggenheim Macro Opportunities Fund
Opinion on the Financial Statements
We have audited the accompanying consolidated statement of assets and liabilities of Guggenheim Macro Opportunities Fund (the “Fund”), (one of the funds constituting Guggenheim Funds Trust (the “Trust”)), including the consolidated schedule of investments, as of September 30, 2019, and the related consolidated statement of operations for the year then ended, the consolidated statements of changes in net assets for each of the two years in the period then ended, the consolidated financial highlights for each of the five years in the period then ended and the related notes (collectively referred to as the “financial statements”). In our opinion, the financial statements present fairly, in all material respects, the consolidated financial position of the Fund (one of the funds constituting Guggenheim Funds Trust) at September 30, 2019, the consolidated results of its operations for the year then ended, the consolidated changes in its net assets for each of the two years in the period then ended and the consolidated financial highlights for each of the five years in the period then ended, in conformity with U.S. generally accepted accounting principles.
Basis for Opinion
These financial statements are the responsibility of the Trust’s management. Our responsibility is to express an opinion on the Fund’s financial statements based on our audits. We are a public accounting firm registered with the Public Company Accounting Oversight Board (United States) (“PCAOB”) and are required to be independent with respect to the Trust in accordance with the U.S. federal securities laws and the applicable rules and regulations of the Securities and Exchange Commission and the PCAOB.
We conducted our audits in accordance with the standards of the PCAOB. Those standards require that we plan and perform the audit to obtain reasonable assurance about whether the financial statements are free of material misstatement, whether due to error or fraud. The Trust is not required to have, nor were we engaged to perform, an audit of the Trust’s internal control over financial reporting. As part of our audits, we are required to obtain an understanding of internal control over financial reporting, but not for the purpose of expressing an opinion on the effectiveness of the Trust’s internal control over financial reporting. Accordingly, we express no such opinion.
Our audits included performing procedures to assess the risks of material misstatement of the financial statements, whether due to error or fraud, and performing procedures that respond to those risks. Such procedures included examining, on a test basis, evidence regarding the amounts and disclosures in the financial statements. Our procedures included confirmation of securities owned as of September 30, 2019, by correspondence with the custodians, transfer agent, brokers, and paying agents or by other appropriate auditing procedures where replies from brokers or paying agents were not received. Our audits also included evaluating the accounting
108 | THE GUGGENHEIM FUNDS ANNUAL REPORT | |
REPORT OF INDEPENDENT REGISTERED PUBLIC ACCOUNTING FIRM (concluded) |
principles used and significant estimates made by management, as well as evaluating the overall presentation of the financial statements. We believe that our audits provide a reasonable basis for our opinion.

We have served as the auditor of one or more Guggenheim investment companies since 1979.
Tysons, Virginia
November 26, 2019
| | THE GUGGENHEIM FUNDS ANNUAL REPORT | 109 |
OTHER INFORMATION (Unaudited) |
Federal Income Tax Information
This information is being provided as required by the Internal Revenue Code. Amounts shown may differ from those elsewhere in the report because of differences in tax and financial reporting practice.
In January 2020, shareholders will be advised on IRS Form 1099 DIV or substitute 1099 DIV as to the federal tax status of the distributions received by shareholders in the calendar year 2019.
The Fund’s investment income (dividend income plus short-term gains, if any) qualifies as follows:
Of the taxable ordinary income distributions paid during the fiscal year ending September 30, 2019, the Fund had the corresponding percentages qualify for the reduced tax rate pursuant to the Jobs and Growth Tax Relief and Reconciliation Act of 2003 or for the dividends received deduction for corporations. See the qualified dividend income and dividend received deduction columns, respectively, in the table below.
Additionally, of the taxable ordinary income distributions paid during the fiscal year ended September 30, 2019, the Fund had the corresponding percentages qualify as interest related dividends and qualified short-term capital gains as permitted by IRC Section 871(k)(1) and IRC Section 871(k)(2), respectively. See qualified interest income and qualified short-term capital gain columns, respectively, in the table below.
| | Qualified
Dividend
Income | | | Dividend
Received
Deduction | | | Qualified
Interest
Income | | | Qualified
Short-Term
Capital Gain | |
| | | | 1.61 | % | | | 1.60 | % | | | 75.33 | % | | | 100.00 | % |
Proxy Voting Information
A description of the policies and procedures that the Trust uses to determine how to vote proxies relating to securities held in the Fund’s portfolios is available, without charge and upon request, by calling 800.820.0888. This information is also available from the EDGAR database on the SEC’s website at https://www.sec.gov.
Information regarding how the Fund’s voted proxies relating to portfolio securities during the most recent 12-month period ended June 30 is available without charge, upon request, by calling 800.820.0888. This information is also available from the EDGAR database on the SEC’s website at https://www.sec.gov.
110 | THE GUGGENHEIM FUNDS ANNUAL REPORT | |
OTHER INFORMATION (Unaudited)(continued) |
Special Meeting of Shareholders — Voting Results
A joint special meeting of shareholders of the Trust was held on October 28, 2019 to elect the following ten nominees to the Board of Trustees of the Trust: Randall C. Barnes, Angela Brock-Kyle, Donald A. Chubb, Jr., Jerry B. Farley, Roman Friedrich III, Thomas F. Lydon, Jr., Ronald A. Nyberg, Sandra G. Sponem, Ronald E. Toupin, Jr. and Amy J. Lee. At the meeting, the following votes were recorded:
Nominee | Shares For | Shares Withheld |
Randall C. Barnes | 919,263,831 | 7,335,759 |
Angela Brock-Kyle | 919,775,822 | 6,823,768 |
Donald A. Chubb, Jr. | 915,120,874 | 11,478,716 |
Jerry B. Farley | 915,377,483 | 11,222,107 |
Roman Friedrich III | 918,807,442 | 7,792,148 |
Thomas F. Lydon, Jr. | 919,122,642 | 7,476,948 |
Ronald A. Nyberg | 918,889,679 | 7,709,911 |
Sandra G. Sponem | 919,600,708 | 6,998,882 |
Ronald E. Toupin, Jr. | 919,043,208 | 7,556,382 |
Amy J. Lee | 919,943,855 | 6,655,735 |
Sector Classification
Information in the Schedule of Investments is categorized by sectors using sector-level Classifications defined by the Bloomberg Industry Classification System, a widely recognized industry classification system provider. The Fund’s registration statement has investment policies relating to concentration in specific sectors/industries. For purposes of these investment policies, the Fund usually classifies sectors/industries based on industry-level Classifications used by widely recognized industry classification system providers such as Bloomberg Industry Classification System, Global Industry Classification Standards and Barclays Global Classification Scheme.
Quarterly Portfolio Schedules Information
The Trust files its complete schedule of portfolio holdings with the SEC for the first and third quarters of each fiscal year as an exhibit to its reports on Form N-PORT, and for reporting periods ended prior to March 31, 2019, filed such information on Form N-Q. The Fund’s Forms N-PORT and N-Q are available on the SEC’s website at https://www.sec.gov. The Fund’s Forms N-PORT and N-Q may be reviewed and copied at the SEC’s Public Reference Room in Washington, DC, and that information on the operation of the Public Reference Room may be obtained by calling 800-SEC-0330. Copies of the portfolio holdings are also available to shareholders, without charge and upon request, by calling 800.820.0888.
| | THE GUGGENHEIM FUNDS ANNUAL REPORT | 111 |
OTHER INFORMATION (Unaudited)(continued) |
Report of the Guggenheim Funds Trust Contracts Review Committee
Guggenheim Funds Trust (the “Trust”) was organized as a Delaware statutory trust on November 8, 2013, and is registered as an open-end management investment company under the Investment Company Act of 1940, as amended (the “1940 Act”). The Trust includes the following series:
● Guggenheim Alpha Opportunity Fund (“Alpha Opportunity Fund”) ● Guggenheim Diversified Income Fund (“Diversified Income Fund”) ● Guggenheim High Yield Fund (“High Yield Fund”) ● Guggenheim Large Cap Value Fund (“Large Cap Value Fund”) ● Guggenheim Macro Opportunities Fund (“Macro Opportunities Fund”) ● Guggenheim SMid Cap Value Fund (“SMid Cap Value Fund”) ● Guggenheim Municipal Income Fund (“Municipal Income Fund”) ● Guggenheim Small Cap Value Fund (“Small Cap Value Fund”) ● Guggenheim StylePlus—Mid Growth Fund (“StylePlus—Mid Growth Fund”) ● Guggenheim Ultra Short Duration Fund (“Ultra Short Duration Fund”) | ● Guggenheim Capital Stewardship Fund (“Capital Stewardship Fund”) ● Guggenheim Floating Rate Strategies Fund (“Floating Rate Strategies Fund”) ● Guggenheim Investment Grade Bond Fund (“Investment Grade Bond Fund”) ● Guggenheim Limited Duration Fund (“Limited Duration Fund”) ● Guggenheim Market Neutral Real Estate Fund (“Market Neutral Real Estate Fund”) ● Guggenheim SMid Cap Value Institutional Fund (“SMid Cap Value Institutional Fund”) ● Guggenheim Risk Managed Real Estate Fund (“Risk Managed Real Estate Fund”) ● Guggenheim StylePlus—Large Core Fund (“StylePlus—Large Core Fund”) ● Guggenheim Total Return Bond Fund (“Total Return Bond Fund”) ● Guggenheim World Equity Income Fund (“World Equity Income Fund”) |
Security Investors, LLC (“Security Investors”), an indirect subsidiary of Guggenheim Partners, LLC, a privately-held, global investment and advisory firm (“Guggenheim Partners”), serves as investment adviser to each of: (i) Alpha Opportunity Fund; (ii) High Yield Fund; (iii) Investment Grade Bond Fund; (iv) Large Cap Value Fund; (v) SMid Cap Value Fund; (vi) SMid Cap Value Institutional Fund; (vii) Municipal Income Fund; (viii) Small Cap Value Fund; (ix) StylePlus—Large Core Fund; (x) StylePlus—Mid Growth Fund; and (xi) World Equity Income Fund (collectively, the “SI-Advised Funds”). (Guggenheim Partners, Security Investors, Guggenheim Partners Investment Management, LLC (“GPIM”) and their affiliates may be referred to herein collectively
112 | THE GUGGENHEIM FUNDS ANNUAL REPORT | |
OTHER INFORMATION (Unaudited)(continued) |
as “Guggenheim.” Security Investors and GPIM are also known as “Guggenheim Investments,” the global asset management and investment advisory division of Guggenheim Partners that includes other affiliated investment management businesses.)
Under the terms of investment management agreements between Security Investors and the Trust, with respect to the SI-Advised Funds, Security Investors also is responsible for overseeing the activities of GPIM, an indirect subsidiary of Guggenheim Partners, with respect to its service as investment sub-adviser to Municipal Income Fund, pursuant to an investment sub-advisory agreement between Security Investors and GPIM (the “GPIM Sub-Advisory Agreement”).
GPIM serves as investment adviser with respect to each of: (i) Diversified Income Fund; (ii) Floating Rate Strategies Fund; (iii) Limited Duration Fund; (iv) Macro Opportunities Fund; (v) Market Neutral Real Estate Fund; (vi) Risk Managed Real Estate Fund; (vii) Total Return Bond Fund; and (viii) Ultra Short Duration Fund (collectively, the “GPIM-Advised Funds” and together with the SI-Advised Funds, the “Funds” and individually, a “Fund”).1 Under the supervision of the Board of Trustees of the Trust (the “Board,” with the members of the Board referred to individually as the “Trustees”), the Advisers regularly provide (or, as applicable, oversee the provision of) investment research, advice and supervision, along with a continuous investment program for the Funds, and direct the purchase and sale of securities and other investments for each Fund’s portfolio. GPIM also serves as investment adviser for the Capital Stewardship Fund, which is addressed in a separate report.2
Each of the Advisory Agreements continues in effect from year to year provided that such continuance is specifically approved at least annually by (i) the Board or a majority of the outstanding voting securities (as defined in the 1940 Act) of each Fund, and, in either event, (ii) the vote of a majority of the Trustees who are not “interested person[s],” as defined by the 1940 Act, of the Trust (the “Independent Trustees”) casting votes in person at a meeting called for such purpose. At meetings held in person on April 25, 2019 (the “April Meeting”) and on May 21, 2019 (the “May Meeting”), the members of the Contracts Review Committee of the Board (the “Committee”), consisting solely of the Independent Trustees, met separately from Guggenheim to consider the proposed renewal of the Agreements in connection with the Committee’s annual contract review schedule.
1 | The investment management agreements pertaining to the SI-Advised Funds and the investment management agreements pertaining to the GPIM-Advised Funds are referred to herein together as the “Advisory Agreements” and, together with the GPIM Sub-Advisory Agreement, as the “Agreements.” In addition, unless the context indicates otherwise, GPIM, with respect to its service as investment adviser to the GPIM-Advised Funds, and Security Investors as to the SI-Advised Funds, are each referred to herein as the “Adviser” and together, the “Advisers.” |
2 | Because shares of the Capital Stewardship Fund are only offered for subscription and are held by a limited number of institutional/bank investors, and the Fund issues a shareholder report separate from the other series of the Trust, the factors considered by the Committee in evaluating the proposed renewal of an investment management agreement pertaining to the Capital Stewardship Fund, and the Sub-Advisory Agreement with Concinnity Advisors, LP, are addressed in a separate report of the Committee. Accordingly, references to the “Funds” should be understood as referring to all series of the Trust, excluding Capital Stewardship Fund. |
| | THE GUGGENHEIM FUNDS ANNUAL REPORT | 113 |
OTHER INFORMATION (Unaudited)(continued) |
As part of its review process, the Committee was represented by independent legal counsel to the Independent Trustees (“Independent Legal Counsel”), from whom the Independent Trustees received separate legal advice and with whom they met separately. Independent Legal Counsel reviewed and discussed with the Committee various key aspects of the Trustees’ legal responsibilities relating to the proposed renewal of the Agreements and other principal contracts. The Committee took into account various materials received from Guggenheim and Independent Legal Counsel. Recognizing that the evaluation process with respect to the services provided by Guggenheim is an ongoing one, the Committee also considered the variety of written materials, reports and oral presentations the Board receives throughout the year regarding performance and operating results of the Funds and other information relevant to its evaluation of the Agreements.
In connection with the contract review process, FUSE Research Network LLC (“FUSE”), an independent, third-party research provider, was engaged to prepare advisory contract renewal reports designed specifically to help the Board fulfill its advisory contract renewal responsibilities. The objective of the reports is to present the subject funds’ relative position regarding fees, expenses and total return performance, with peer group and universe comparisons. The Committee assessed the data provided in the FUSE reports as well as commentary presented by Guggenheim, including, among other things, a summary of notable distinctions between certain Funds and the applicable peer group identified in the FUSE reports and explanations for custom peer groups created for certain Funds that do not fit well into any particular category.
In addition, Guggenheim provided materials and data in response to formal requests for information sent by Independent Legal Counsel on behalf of the Independent Trustees. Guggenheim also made a presentation at the April Meeting. Throughout the process, the Committee asked questions of management and requested certain additional information, which Guggenheim provided (collectively with the foregoing reports and materials, the “Contract Review Materials”). The Committee considered the Contract Review Materials in the context of its accumulated experience governing the Trust and weighed the factors and standards discussed with Independent Legal Counsel.
Following an analysis and discussion of relevant factors, including those identified below, and in the exercise of its business judgment, the Committee concluded that it was in the best interest of each Fund to recommend that the Board approve the renewal of each of the Advisory Agreements and the GPIM Sub-Advisory Agreement for an additional annual term.
Advisory Agreements
Nature, Extent and Quality of Services Provided by each Adviser: With respect to the nature, extent and quality of services currently provided by each Adviser, the Committee considered the qualifications, experience and skills of key personnel performing services for the Funds, including those personnel providing compliance and risk oversight, as well as the supervisors and reporting lines for such personnel. The Committee considered Guggenheim’s
114 | THE GUGGENHEIM FUNDS ANNUAL REPORT | |
OTHER INFORMATION (Unaudited)(continued) |
resources and related efforts to retain, attract and motivate capable personnel to serve the Funds. In evaluating Guggenheim’s resources and capabilities, the Committee considered Guggenheim’s commitment to focusing on, and investing resources in support of, the Funds.
The Committee’s review of the services provided by Guggenheim to the Funds included consideration of Guggenheim’s investment processes and resulting performance, portfolio oversight and risk management, and the related regular quarterly reports and presentations received by the Board. The Committee took into account the risks borne by Guggenheim in sponsoring and providing services to the Funds, including entrepreneurial, legal and regulatory risks. The Committee considered the resources dedicated by Guggenheim to compliance functions and the reporting made to the Board by Guggenheim compliance personnel regarding Guggenheim’s adherence to regulatory requirements. The Committee also considered the regular reports the Board receives from the Trust’s Chief Compliance Officer regarding compliance policies and procedures established pursuant to Rule 38a-1 under the 1940 Act.
In connection with the Committee’s evaluation of the overall package of services provided by Guggenheim, the Committee considered Guggenheim’s administrative services, including its role in supervising, monitoring, coordinating and evaluating the various services provided by the fund administrator, transfer agent, distributor, custodian and other service providers to the Funds. The Committee evaluated the Office of Chief Financial Officer (the “OCFO”), established to oversee the fund administration, accounting and transfer agency services provided to the Funds, including the OCFO’s resources, personnel and services provided.
With respect to Municipal Income Fund, the Committee noted that, although Security Investors delegated responsibility for the investment and reinvestment of the Fund’s assets to the Sub-Adviser, as affiliated companies, both the Adviser and Sub-Adviser are part of the Guggenheim organization. Further, the Committee took into account Guggenheim’s explanation that investment advisory-related services are provided by many Guggenheim employees under different related legal entities and thus, the services provided by the Adviser on the one hand and the Sub-Adviser on the other, as well as the risks assumed by each party, cannot be ascribed to distinct legal entities.3 As a result, the Committee did not evaluate the services provided to Municipal Income Fund under the Advisory Agreement and the GPIM Sub-Advisory Agreement separately.
With respect to Guggenheim’s resources and the ability of each Adviser to carry out its responsibilities under the applicable Advisory Agreement, the Chief Financial Officer of Guggenheim Investments reviewed with the Committee financial information concerning the holding company for Guggenheim Investments, Guggenheim Partners Investment Management
3 | Consequently, except where the context indicates otherwise, references to “Adviser” or “Sub-Adviser” should be understood as referring to Guggenheim Investments generally and the services it provides under both Agreements. |
| | THE GUGGENHEIM FUNDS ANNUAL REPORT | 115 |
OTHER INFORMATION (Unaudited)(continued) |
Holdings, LLC (“GPIMH”), and the various entities comprising Guggenheim Investments, and provided the audited consolidated financial statements of GPIMH. (Thereafter, the Committee received the audited consolidated financial statements of GPIM.)
The Committee also considered the acceptability of the terms of each Advisory Agreement, including the scope of services required to be performed by each Adviser.
Based on the foregoing, and based on other information received (both oral and written) at the April Meeting and the May Meeting, as well as other considerations, including the Committee’s knowledge of how each Adviser performs its duties obtained through Board meetings, discussions and reports throughout the year, the Committee concluded that each Adviser and its personnel were qualified to serve the Funds in such capacity and may reasonably be expected to continue to provide a high quality of services under each Advisory Agreement with respect to the Funds.
Investment Performance: The Committee received, for each Fund, investment returns for the since-inception, ten-year, five-year, three-year, one-year and three-month periods ended December 31, 2018, as applicable. In addition, the Committee received a comparison of each Fund’s performance to the performance of a benchmark, a universe of funds and a narrower peer group of similar funds based on asset levels as identified by FUSE, in each case for the same periods, as applicable. The Committee also received from FUSE a description of the methodology for identifying each Fund’s peer group and universe for performance and expense comparisons.
In seeking to evaluate Fund performance over a full market cycle, the Committee focused its attention on five-year and three-year performance rankings as compared to the relevant universe of funds. The Committee considered more recent performance periods for those Funds that were recently launched, as well as in circumstances in which enhancements were being made to the portfolio management processes or techniques employed for a Fund. Except as to the individual Funds discussed below, the Committee observed that the returns of each Fund’s (other than SMid Cap Value Fund) Institutional Class shares and SMid Cap Value Fund’s Class A shares ranked in the third quartile or better of such Fund’s performance universe for each of the relevant periods considered.
In addition, the Committee made the following observations:
Municipal Income Fund: The returns of the Fund’s Institutional Class shares ranked in the 55th and 82nd percentiles of its performance universe for the five-year and three-year periods ended December 31, 2018, respectively. The Committee noted management’s explanation that the Fund’s increased allocation to floating rate securities in 2016 and the Fund’s more conservative investment approach detracted from performance that year, impacting trailing returns for five-year and three-year periods. In light of the foregoing, the Committee also considered the more recent one-year and three-month periods ended December 31, 2018, and observed that the returns of Fund’s Institutional Class shares ranked in the 30th and 11th percentiles, respectively, of its
116 | THE GUGGENHEIM FUNDS ANNUAL REPORT | |
OTHER INFORMATION (Unaudited)(continued) |
performance universe. The Committee also took into account management’s statement that it expects the Fund’s performance to continue to improve going forward as it anticipates the effects of recent tax reform and idiosyncratic risks.
Small Cap Value Fund: The returns of the Fund’s Institutional Class shares ranked in the 79th and 56th percentiles of its performance universe for the five-year and three-year periods ended December 31, 2018, respectively. The Committee noted measures taken by the Adviser to remedy longer-term relative underperformance with respect to the Value Funds strategy, including strategy enhancements such as implementation of a refined stock selection process and additional risk controls to enforce the strategy’s sell discipline. In light of the foregoing, the Committee also considered the more recent one-year and three-month periods ended December 31, 2018, and observed that the returns of Fund’s Institutional Class shares ranked in the 19th and 20th percentiles, respectively, of its performance universe.
After reviewing the foregoing and related factors, the Committee concluded that: (i) each Fund’s performance was acceptable; or (ii) it was satisfied with Guggenheim’s responses and efforts to improve investment performance.
Comparative Fees, Costs of Services Provided and the Profits Realized by each Adviser from Its Relationship with the Funds: The Committee compared each Fund’s contractual advisory fee, net effective management fee and total net expense ratio to the applicable peer group. The Committee also reviewed the median advisory fees and expense ratios, including expense ratio components (e.g., transfer agency fees, administration fees, other operating expenses, distribution fees and fee waivers/reimbursements), of the peer group of funds.
As part of its evaluation of each Fund’s advisory fee, the Committee considered how such fees compared to the advisory fee charged by the applicable Adviser to one or more other clients that it manages pursuant to similar investment strategies, to the extent applicable, noting that, in certain instances, Guggenheim charges a lower advisory fee to such other clients. In this connection, the Committee considered, among other things, Guggenheim’s representations about the significant differences between managing mutual funds as compared to other types of accounts. The Committee also considered Guggenheim’s explanation that lower fees are charged in certain instances due to various other factors, including the scope of contract, type of investors, fee structure, applicable legal, governance and capital structures, tax status and historical pricing reasons. In addition, the Committee took into account Guggenheim’s discussion of the entrepreneurial, legal and regulatory risks it faces when offering the Funds as compared to other types of accounts. The Committee concluded that the information it received demonstrated that the aggregate services provided to, or the specific circumstances of, each Fund were sufficiently different from the services provided to, or the specific circumstances of, other clients with similar investment strategies and/or the risks borne by Guggenheim were sufficiently greater than those associated with managing other clients with similar investment strategies to support the difference in fees.
| | THE GUGGENHEIM FUNDS ANNUAL REPORT | 117 |
OTHER INFORMATION (Unaudited)(continued) |
In further considering the comparative fee and expense data presented in the Contract Review Materials and addressed by Guggenheim, the Committee took into account those Funds with currently effective expense limitation agreements with the Adviser. Except as to the individual Funds discussed below, the Committee observed that each Fund’s average contractual advisory fee percentile rank across all share classes of the Fund, net effective management fee4 and asset-weighted total net expense ratio each rank in the third quartile or better of such Fund’s peer group.
In addition, the Committee made the following observations:
Diversified Income Fund: The average contractual advisory fee percentile rank across all share classes of the Fund is in the fourth quartile (78th percentile) of its peer group. The Fund’s net effective management fee ranks in the first quartile (1st percentile) of its peer group. The Committee considered that the Fund’s asset weighted total net expense ratio ranks in the second quartile (38th percentile) of its peer group. The Committee also took into account the Adviser’s statement that the Fund’s currently effective expense limitation agreement with the Adviser is intended to limit the impact of the Fund’s small size.
Floating Rate Strategies Fund: The average contractual advisory fee percentile rank across all share classes of the Fund is in the fourth quartile (92nd percentile) of its peer group. The Fund’s net effective management fee ranks in the fourth quartile (76th percentile) of its peer group. The Committee considered that the Fund’s asset weighted total net expense ratio ranks in the third quartile (58th percentile) of its peer group. The Committee also considered the Adviser’s statement explaining the higher fees that performance is driven by a unique investment approach that requires significant resources. In this regard, the Committee took into consideration the Fund’s strong investment performance for the five-year period ended December 31, 2018. In addition, the Committee noted the Adviser’s statement that the net effective management fee includes 0.08% in administration fees that is not paid to the Adviser. The Committee also took into account the Fund’s currently effective expense limitation agreement with the Adviser.
High Yield Fund: The average contractual advisory fee percentile rank across all share classes of the Fund is in the third quartile (54th percentile) of its peer group. The Fund’s net effective management fee ranks in the fourth quartile (76th percentile) of its peer group. The Fund’s asset weighted total net expense ratio ranks in the third quartile (73rd percentile) of its peer group. The Committee considered the Adviser’s statement explaining the higher fees that performance is driven by a unique investment approach that requires significant resources. In this regard, the Committee took into consideration the Fund’s strong investment performance for the five-year and three-year periods ended December 31, 2018. In addition, the Committee noted the Adviser’s
4 | The “net effective management fee” for each Fund represents the combined effective advisory fee and administration fee as a percentage of average net assets for the latest fiscal year, after any waivers and/or reimbursements, based on the Fund’s class level peer group percent rank, weighted by class level assets under management. |
118 | THE GUGGENHEIM FUNDS ANNUAL REPORT | |
OTHER INFORMATION (Unaudited)(continued) |
statement that the net effective management fee includes 0.08% in administration fees that is not paid to the Adviser. The Committee also took into account the Fund’s currently effective expense limitation agreement with the Adviser.
Limited Duration Fund: The average contractual advisory fee percentile rank across all share classes of the Fund is in the third quartile (63rd percentile) of its peer group. The Fund’s net effective management fee ranks in the fourth quartile (80th percentile) of its peer group. The Committee considered that the Fund’s asset weighted total net expense ratio ranks in the third quartile (51st percentile) of its peer group. The Committee also considered the Adviser’s statement explaining the higher fees that performance is driven by a unique investment approach that requires significant resources. In this regard, the Committee took into consideration the Fund’s strong investment performance for the five-year and three-year periods ended December 31, 2018. In addition, the Committee noted the Adviser’s statement that the net effective management fee includes 0.08% in administration fees that is not paid to the Adviser. The Committee also took into account the Fund’s currently effective expense limitation agreement with the Adviser.
Macro Opportunities Fund: The average contractual advisory fee percentile rank across all share classes of the Fund, the Fund’s net effective management fee and the Fund’s asset weighted total net expense ratio each rank in the fourth quartile (93rd, 81st and 83rd percentiles, respectively) of its peer group. The Committee noted that the Fund is categorized as a non-traditional bond fund which seeks to add value by investing in many non-traditional securities outside of fixed income, including equities, currencies, commodities and derivatives. The Committee considered the Adviser’s statement explaining the higher fees and expenses that performance is driven by a unique investment approach that requires significant resources. In this regard, the Committee took into consideration the Fund’s strong investment performance for the five-year and three-year periods ended December 31, 2018. The Committee also took into account the Fund’s currently effective expense limitation agreement with the Adviser. The Committee also noted that, in connection with the contract review process, the Adviser formalized an existing expense waiver agreement with the Fund pursuant to which the Adviser waives any Fund expenses attributable to the Fund’s investment in Alpha Opportunity Fund.
SMid Cap Value Institutional Fund: The Fund’s contractual advisory fee ranks in the first quartile (7th percentile) of its peer group. The Fund’s net effective management fee and asset weighted total net expense ratio each rank in the fourth quartile (79th and 86th percentiles, respectively) of its peer group. The Committee considered the Adviser’s statement explaining the higher fees and expenses that it has made adjustments to the strategy of the Fund over the last few years incorporating a more systematic approach in order to improve investment performance. In this regard, the Committee took into consideration the Fund’s strong investment performance for the three-year period ended December 31, 2018. In addition, the Committee noted the Adviser’s statement that the net effective management fee includes 0.08% in administration fees that is not paid to the Adviser. The Committee also considered the Adviser’s statement that the Fund has
| | THE GUGGENHEIM FUNDS ANNUAL REPORT | 119 |
OTHER INFORMATION (Unaudited)(continued) |
continued to experience outflows resulting in lower relative assets to peers and associated higher other operating expenses, and that the Adviser is evaluating strategic measures to improve the Fund’s positioning.
Risk Managed Real Estate Fund: The average contractual advisory fee percentile rank across all share classes of the Fund is in the first quartile (22nd percentile) of its peer group. The Fund’s net effective management fee ranks in the fourth quartile (78th percentile) of its peer group. The Committee considered that the Fund’s asset weighted total net expense ratio ranks in the second quartile (47th percentile) of its peer group. The Committee took into consideration the Fund’s strong investment performance for the three-year and one-year periods ended December 31, 2018. The Committee also took into account the Fund’s currently effective expense limitation agreement with the Adviser.
StylePlus—Large Core Fund: The average contractual advisory fee percentile rank across all share classes of the Fund is in the third quartile (62nd percentile) of its peer group. The Fund’s net effective management fee ranks in the fourth quartile (86th percentile) of its peer group. The Committee considered that the Fund’s asset weighted total net expense ratio ranks in the third quartile (66th percentile) of its peer group. The Committee also considered the Adviser’s statement explaining the higher fees that performance is driven by a unique combination of passive and actively managed strategies. In this regard, the Committee took into consideration the Fund’s strong investment performance for the five-year and three-year periods ended December 31, 2018.
Total Return Bond Fund: The average contractual advisory fee percentile rank across all share classes of the Fund is in the third quartile (68th percentile) of its peer group. The Fund’s net effective management fee ranks in the fourth quartile (78th percentile) of its peer group. The Committee considered that the Fund’s asset weighted total net expense ratio ranks in the 50th percentile of its peer group. The Committee also considered the Adviser’s statement explaining the higher fees that performance is driven by a unique investment approach that requires significant resources. In this regard, the Committee took into consideration the Fund’s strong investment performance for the five-year and three-year periods ended December 31, 2018. In addition, the Committee noted the Adviser’s statement that the net effective management fee includes 0.08% in administration fees that is not paid to the Adviser. The Committee also took into account the Fund’s currently effective expense limitation agreement with the Adviser.
With respect to the costs of services provided and profits realized by Guggenheim Investments from its relationship with the Funds, the Committee reviewed a profitability analysis and data from management for each Fund setting forth the average assets under management for the twelve months ended December 31, 2018, gross revenues received by Guggenheim Investments, expenses allocated to the Fund, expense waivers (as applicable), earnings and the operating margin/profitability rate, including variance information relative to the foregoing amounts
120 | THE GUGGENHEIM FUNDS ANNUAL REPORT | |
OTHER INFORMATION (Unaudited)(continued) |
as of December 31, 2017. In addition, the Chief Financial Officer of Guggenheim Investments reviewed with, and addressed questions from, the Committee concerning the expense allocation methodology employed in producing the profitability analysis.
In the course of its review of Guggenheim Investments’ profitability, the Committee took into account the methods used by Guggenheim Investments to determine expenses and profit. The Committee considered all of the foregoing in evaluating the costs of services provided, the profitability to Guggenheim Investments and the profitability rates presented, and concluded that the profits were not unreasonable.
The Committee considered other benefits available to each Adviser because of its relationship with the Funds and noted Guggenheim’s statement that it does not believe the Advisers derive any such “fall-out” benefits. In this regard, the Committee noted Guggenheim’s statement that, although it does not consider such benefits to be fall-out benefits, the Advisers may benefit from marketing synergies arising from offering a broad spectrum of products, including the Funds.
Economies of Scale: The Committee received and considered information regarding whether there have been economies of scale with respect to the management of the Funds as Fund assets grow, whether the Funds have appropriately benefited from any economies of scale, and whether there is potential for realization of any further economies of scale. The Committee considered whether economies of scale in the provision of services to the Funds were being passed along to the shareholders. The Committee noted the Adviser’s statements, including that Guggenheim believes it is appropriately sharing potential economies of scale and that costs continue to increase in many key areas, including compensation of portfolio managers, key analysts and support staff, as well as for infrastructure needs, with respect to risk management oversight, valuation processes and disaster recovery systems, among other things, and that, in this regard, management’s costs for providing services have increased in recent years without regard to asset levels.
The Committee also noted the process employed by the Adviser to evaluate whether it would be appropriate to institute a new breakpoint for a Fund, with consideration given to, among other things: (i) the Fund’s size and trends in asset levels over recent years; (ii) the competitiveness of the expense levels; (iii) whether expense waivers are in place; (iv) changes and trends in revenue and expenses; (v) whether there are any anticipated expenditures that may benefit the Fund in the future; (vi) Fund profit level margins; (vii) relative Fund performance; (viii) the nature, extent and quality of services management provides to the Fund; and (ix) the complexity of the Fund’s investment strategy and the resources required to support the Fund.
As part of its assessment of economies of scale, the Committee also considered Guggenheim’s view that it seeks to share economies of scale through a number of means, including breakpoints, advisory fees set at competitive rates pre-assuming future asset growth, expense waivers and limitations, and investments in personnel, operations and infrastructure to support the Fund
| | THE GUGGENHEIM FUNDS ANNUAL REPORT | 121 |
OTHER INFORMATION (Unaudited)(continued) |
business. Thus, the Committee considered the size of the Funds and the competitiveness of and/or other determinations made regarding the current advisory fee for each Fund, as well as whether a Fund is subject to an expense limitation.
Based on the foregoing, the Committee determined that the advisory fee for each Fund was reasonable.
Sub-Advisory Agreement
Nature, Extent and Quality of Services Provided by the Sub-Adviser: As noted above, because both the Adviser and Sub-Adviser for Municipal Income Fund—Security Investors and GPIM, respectively—are part of and do business as Guggenheim Investments and the services provided by the Adviser on the one hand and the Sub-Adviser on the other cannot be ascribed to distinct legal entities, the Committee did not evaluate the services provided under the Advisory Agreement and Sub-Advisory Agreement separately. Therefore, the Committee considered the qualifications, experience and skills of the Fund’s portfolio management team in connection with the Committee’s evaluation of Guggenheim’s investment professionals under the applicable Advisory Agreement.
With respect to Guggenheim’s resources and the Sub-Adviser’s ability to carry out its responsibilities under the Sub-Advisory Agreement, as noted above, the Committee considered the financial condition of GPIMH and the various entities comprising Guggenheim Investments. (Thereafter, the Committee received the audited consolidated financial statements of GPIM.)
The Committee also considered the acceptability of the terms of the Sub-Advisory Agreement, including the scope of services required to be performed by the Sub-Adviser.
Investment Performance: The Committee considered the returns of the Fund under its evaluation of the Advisory Agreement.
Comparative Fees, Costs of Services Provided and the Profits Realized by the Sub-Adviser from Its Relationship with the Fund: The Committee considered that the Sub-Advisory Agreement is with an affiliate of the Adviser, that the Adviser compensates the Sub-Adviser from its own fees so that the sub-advisory fee rate for the Fund does not impact the fees paid by the Fund and that the Sub-Adviser’s revenues were included in the calculation of Guggenheim Investments’ profitability. Given its determination of the reasonableness of the advisory fee, the Committee concluded that the sub-advisory fee rate for the Fund was not unreasonable.
Economies of Scale: The Committee recognized that, because the Sub-Adviser’s fees are paid by the Adviser and not the Fund, the analysis of economies of scale was more appropriate in the context of the Committee’s consideration of the applicable Advisory Agreement, which was separately considered. (See “Advisory Agreements – Economies of Scale” above.)
122 | THE GUGGENHEIM FUNDS ANNUAL REPORT | |
OTHER INFORMATION (Unaudited)(concluded) |
Overall Conclusions
Based on the foregoing, the Committee determined that the investment advisory fees are fair and reasonable in light of the extent and quality of the services provided and other benefits received and that the continuation of each of the Agreements is in the best interest of each Fund. In reaching this conclusion, no single factor was determinative or conclusive and each Committee member, in the exercise of his business judgment, may afford different weights to different factors. At the May Meeting, the Committee, constituting all of the Independent Trustees, recommended the renewal of each Advisory Agreement and the Sub-Advisory Agreement for an additional annual term.
| | THE GUGGENHEIM FUNDS ANNUAL REPORT | 123 |
INFORMATION ON BOARD OF TRUSTEES AND OFFICERS (Unaudited) |
Name, Address*
and Year of Birth
of Trustees | Position(s)
Held with
the Trust | Term of Office
and Length of
Time Served** | Principal Occupation(s)
During Past 5 Years | Number of
Portfolios
in Fund
Complex
Overseen | Other Directorships
Held by Trustees |
INDEPENDENT TRUSTEES | | | |
Randall C. Barnes (1951) | Trustee | Since 2014 | Current: Private Investor (2001-present). Former: Senior Vice President and Treasurer, PepsiCo, Inc. (1993-1997); President, Pizza Hut International (1991-1993); Senior Vice President, Strategic Planning and New Business Development, PepsiCo, Inc. (1987-1990). | 158 | Current: Trustee, Purpose Investments Funds (2013-present). Former: Managed Duration Investment Grade Municipal Fund (2003-2016). |
Angela Brock-Kyle (1959) | Trustee | Since November 2019 | Current: Founder and Chief Executive Officer, B.O.A.R.D.S (consulting firm). Former: Senior Leader, TIAA (financial services firm) (1987-2012). | 157 | None. |
Donald A.
Chubb, Jr. (1946) | Trustee and Chairman of the Valuation Oversight Committee | Since 1994 | Current: Retired. Former: Business broker and manager of commercial real estate, Griffith & Blair, Inc. (1997-2017). | 157 | Former: Midland Care, Inc. (2011-2016). |
Jerry B. Farley (1946) | Trustee and Chairman of the Audit Committee | Since 2005 | Current: President, Washburn University (1997-present). | 157 | Current: CoreFirst Bank & Trust (2000-present). Former: Westar Energy, Inc. (2004-2018). |
124 | THE GUGGENHEIM FUNDS ANNUAL REPORT | |
INFORMATION ON BOARD OF TRUSTEES AND OFFICERS (Unaudited)(continued) |
Name, Address*
and Year of Birth
of Trustees | Position(s)
Held with
the Trust | Term of Office
and Length of
Time Served** | Principal Occupation(s)
During Past 5 Years | Number of
Portfolios
in Fund
Complex
Overseen | Other Directorships
Held by Trustees |
INDEPENDENT TRUSTEES - continued | | |
Roman
Friedrich III (1946) | Trustee and Chairman of the Contracts Review Committee | Since 2014 | Current: Founder and Managing Partner, Roman Friedrich & Company (1998-present). | 157 | Former: Zincore Metals, Inc. (2009-January 2019). |
Thomas F. Lydon,Jr. (1960) | Trustee | Since November 2019 | Current: President, Global Trends Investments (registered investment adviser) (1996-present). | 157 | Current: US Global Investors (GROW) (1995-present); and Harvest Volatility Edge Trust (3) (2017-present). |
Ronald A. Nyberg (1953) | Trustee and Chairman of the Nominating and Governance Committee | Since 2014 | Current: Partner, Momkus LLC (2016-present). Former: Partner, Nyberg & Cassioppi, LLC (2000-2016); Executive Vice President, General Counsel, and Corporate Secretary, Van Kampen Investments (1982-1999). | 158 | Current: PPM Funds (9) (2018-present); Edward-Elmhurst Healthcare System (2012-present); Western Asset Inflation-Linked Opportunities & Income Fund (2004-present); Western Asset Inflation-Linked Income Fund (2003-present). Former: Managed Duration Investment Grade Municipal Fund (2003-2016). |
| | THE GUGGENHEIM FUNDS ANNUAL REPORT | 125 |
INFORMATION ON BOARD OF TRUSTEES AND OFFICERS (Unaudited)(continued) |
Name, Address*
and Year of Birth
of Trustees | Position(s)
Held with
the Trust | Term of Office
and Length of
Time Served** | Principal Occupation(s)
During Past 5 Years | Number of
Portfolios
in Fund
Complex
Overseen | Other Directorships
Held by Trustees |
INDEPENDENT TRUSTEES - concluded | | |
Sandra G. Sponem (1958) | Trustee | Since November 2019 | Current: Retired. Former: Senior Vice President and Chief Financial Officer, M.A. Mortenson Companies, Inc. (general contracting firm) (2007-2017). | 157 | Current: SPDR Series Trust (78) (2018-present); SPDR Index Shares Funds (31) (2018-present); SSGA Active Trust (12) (2018-present); and SSGA Master Trust (1) (2018-present). |
Ronald E.
Toupin, Jr. (1958) | Trustee and Chairman of the Board | Since 2014 | Current: Portfolio Consultant (2010-present); Member, Governing Council, Independent Directors Council (2013-present); Governor, Board of Governors, Investment Company Institute (2018-present). Former: Member, Executive Committee, Independent Directors Council (2016-2018); Vice President, Manager and Portfolio Manager, Nuveen Asset Management (1998-1999); Vice President, Nuveen Investment Advisory Corp. (1992-1999); Vice President and Manager, Nuveen Unit Investment Trusts (1991-1999); and Assistant Vice President and Portfolio Manager, Nuveen Unit Investment Trusts (1988-1999), each of John Nuveen & Co., Inc. (1982-1999). | 157 | Current: Western Asset Inflation-Linked Opportunities & Income Fund (2004-present); Western Asset Inflation-Linked Income Fund (2003-present). Former: Managed Duration Investment Grade Municipal Fund (2003-2016). |
126 | THE GUGGENHEIM FUNDS ANNUAL REPORT | |
INFORMATION ON BOARD OF TRUSTEES AND OFFICERS (Unaudited)(continued) |
Name, Address*
and Year of Birth
of Trustees | Position(s)
Held with
the Trust | Term of Office
and Length of
Time Served** | Principal Occupation(s)
During Past 5 Years | Number of
Portfolios
in Fund
Complex
Overseen | Other Directorships
Held by Trustees |
INTERESTED TRUSTEE | |
Amy J. Lee*** (1961) | Trustee, Vice President and Chief Legal Officer | Since 2018 (Trustee) Since 2014 (Chief Legal Officer) Since 2007 (Vice President) | Current: Interested Trustee, certain other funds in the Fund Complex (2018-present); Chief Legal Officer, certain other funds in the Fund Complex (2014-present); Vice President, certain other funds in the Fund Complex (2007-present); Senior Managing Director, Guggenheim Investments (2012-present). Former: President and Chief Executive Officer (2017-2018); President, certain other funds in the Fund Complex (2017-November 2019); Vice President, Associate General Counsel and Assistant Secretary, Security Benefit Life Insurance Company and Security Benefit Corporation (2004-2012). | 157 | None. |
* | The business address of each Trustee is c/o Guggenheim Investments, 227 West Monroe Street, Chicago, Illinois 60606. |
** | Each Trustee serves an indefinite term, until his or her successor is elected and qualified. Time served includes time served in the respective position for the Predecessor Corporation. |
*** | This Trustee is deemed to be an “interested person” of the Fund under the 1940 Act by reason of her position with the Fund’s Investment Manager and/or the parent of the Investment Manager. |
| | THE GUGGENHEIM FUNDS ANNUAL REPORT | 127 |
INFORMATION ON BOARD OF TRUSTEES AND OFFICERS (Unaudited)(continued) |
Name, Address*
and Year of Birth | Position(s)
Held with
the Trust | Term of Office
and Length of
Time Served** | Principal Occupations
During Past 5 Years |
OFFICERS | | | |
Brian E. Binder (1972) | President and Chief Executive Officer | Since 2018 | Current: President and Chief Executive Officer, certain other funds in the Fund Complex (2018-present); President and Chief Executive Officer, Guggenheim Funds Investment Advisors, LLC and Security Investors, LLC (2018-present); Senior Managing Director and Chief Administrative Officer, Guggenheim Investments (2018-present). Former: Managing Director and President, Deutsche Funds, and Head of US Product, Trading and Fund Administration, Deutsche Asset Management (2013-2018); Managing Director, Head of Business Management and Consulting, Invesco Ltd. (2010-2012). |
James M. Howley (1972) | Assistant Treasurer | Since 2014 | Current: Managing Director, Guggenheim Investments (2004-present); Assistant Treasurer, certain other funds in the Fund Complex (2006-present). Former: Manager, Mutual Fund Administration of Van Kampen Investments, Inc. (1996-2004). |
Mark E. Mathiasen (1978) | Secretary | Since 2014 | Current: Secretary, certain other funds in the Fund Complex (2007-present); Managing Director, Guggenheim Investments (2007-present). |
Glenn McWhinnie (1969) | Assistant Treasurer | Since 2016 | Current: Vice President, Guggenheim Investments (2009-present); Assistant Treasurer, certain other funds in the Fund complex (2016-present). |
Michael P. Megaris (1984) | Assistant Secretary | Since 2014 | Current: Assistant Secretary, certain other funds in the Fund Complex (2014-present); Director, Guggenheim Investments (2012-present). |
Elisabeth Miller (1968) | Chief Compliance Officer | Since 2012 | Current: Chief Compliance Officer, certain other funds in the Fund Complex (2012-present); Senior Managing Director, Guggenheim Investments (2012-present); Vice President, Guggenheim Funds Distributors, LLC (2014-present). Former: Chief Compliance Officer, Security Investors, LLC and Guggenheim Funds Investment Advisors, LLC (2012-2018); Chief Compliance Officer, Guggenheim Distributors, LLC (2009-2014); Senior Manager, Security Investors, LLC (2004-2014); Senior Manager, Guggenheim Distributors, LLC (2004-2014). |
128 | THE GUGGENHEIM FUNDS ANNUAL REPORT | |
INFORMATION ON BOARD OF TRUSTEES AND OFFICERS (Unaudited)(continued) |
Name, Address*
and Year of Birth | Position(s)
Held with
the Trust | Term of Office
and Length of
Time Served** | Principal Occupations
During Past 5 Years |
OFFICERS - continued | |
Margaux Misantone (1978) | AML Officer | Since 2017 | Current: Chief Compliance Officer, Security Investors, LLC and Guggenheim Funds Investment Advisors, LLC (2018-present); AML Officer, Security Investors, LLC and certain other funds in the Fund Complex (2017-present); Managing Director, Guggenheim Investments (2015-present). Former: Assistant Chief Compliance Officer, Security Investors, LLC and Guggenheim Funds Investments Advisors, LLC (2015-2018). |
Adam J. Nelson (1979) | Assistant Treasurer | Since 2015 | Current: Vice President, Guggenheim Investments (2015-present); Assistant Treasurer, certain other funds in the Fund Complex (2015-present). Former: Assistant Vice President and Fund Administration Director, State Street Corporation (2013-2015); Fund Administration Assistant Director, State Street (2011-2013); Fund Administration Manager, State Street (2009-2011). |
Kimberly J. Scott (1974) | Assistant Treasurer | Since 2014 | Current: Director, Guggenheim Investments (2012-present); Assistant Treasurer, certain other funds in the Fund Complex (2012-present). Former: Financial Reporting Manager, Invesco, Ltd. (2010-2011); Vice President/Assistant Treasurer, Mutual Fund Administration for Van Kampen Investments, Inc./Morgan Stanley Investment Management (2009-2010); Manager of Mutual Fund Administration, Van Kampen Investments, Inc./Morgan Stanley Investment Management (2005-2009). |
Bryan Stone (1979) | Vice President | Since 2014 | Current: Vice President, certain other funds in the Fund Complex (2014-present); Managing Director, Guggenheim Investments (2013-present). Former: Senior Vice President, Neuberger Berman Group LLC (2009-2013); Vice President, Morgan Stanley (2002-2009). |
| | THE GUGGENHEIM FUNDS ANNUAL REPORT | 129 |
INFORMATION ON BOARD OF TRUSTEES AND OFFICERS (Unaudited)(concluded) |
Name, Address*
and Year of Birth | Position(s)
Held with
the Trust | Term of Office
and Length of
Time Served** | Principal Occupations
During Past 5 Years |
OFFICERS - concluded | |
John L. Sullivan (1955) | Chief Financial Officer, Chief Accounting Officer and Treasurer | Since 2014 | Current: Chief Financial Officer, Chief Accounting Officer and Treasurer, certain other funds in the Fund Complex (2010-present); Senior Managing Director, Guggenheim Investments (2010-present). Former: Managing Director and Chief Compliance Officer, each of the funds in the Van Kampen Investments fund complex (2004-2010); Managing Director and Head of Fund Accounting and Administration, Morgan Stanley Investment Management (2002-2004); Chief Financial Officer and Treasurer, Van Kampen Funds (1996-2004). |
Jon Szafran (1989) | Assistant Treasurer | Since 2017 | Current: Vice President, Guggenheim Investments (2017-present); Assistant Treasurer, certain other funds in the Fund Complex (2017-present). Former: Assistant Treasurer of Henderson Global Funds and Manager of US Fund Administration, Henderson Global Investors (North America) Inc. (“HGINA”), (2017); Senior Analyst of US Fund Administration, HGINA (2014-2017); Senior Associate of Fund Administration, Cortland Capital Market Services, LLC (2013-2014); Experienced Associate, PricewaterhouseCoopers LLP (2012-2013). |
* | The business address of each officer is c/o Guggenheim Investments, 227 West Monroe Street, Chicago, Illinois 60606. |
** | Each officer serves an indefinite term, until his or her successor is duly elected and qualified. |
130 | THE GUGGENHEIM FUNDS ANNUAL REPORT | |
GUGGENHEIM INVESTMENTS PRIVACY NOTICE (Unaudited) |
Who We Are
This Privacy Notice describes the data protection practices of Guggenheim Investments. Guggenheim Investments as used herein refers to the affiliated investment management businesses of Guggenheim Partners, LLC: Guggenheim Funds Investment Advisors, LLC, Guggenheim Partners Investment Management, LLC, Guggenheim Funds Distributors, LLC, Security Investors, LLC, Guggenheim Investment Advisors (Europe) Limited, Guggenheim Real Estate, LLC, GS Gamma Advisors, LLC, Guggenheim Partners India Management, LLC, Guggenheim Partners Europe Limited, as well as the funds in the Guggenheim Funds complex (the “Funds”) (“Guggenheim Investments,” “we,” “us,” or “our”).
Guggenheim Partners Investment Management Holdings, LLC, located at 330 Madison Avenue, New York, New York 10017 is the data controller for your information. The affiliates who are also controllers of certain of your information are: Guggenheim Investment Advisors (Europe) Limited, Guggenheim Partners Europe Limited, Guggenheim Partners, LLC, Guggenheim Funds Investment Advisors, LLC, Guggenheim Partners Investment Management, LLC, Guggenheim Funds Distributors, LLC and Security Investors, LLC, as well as the Funds.
Our Commitment to You
Guggenheim Investments considers your privacy our utmost concern. When you become our client or investor, you entrust us with not only your hard-earned money but also with your personal and financial information. Because we have access to your private information, we hold ourselves to the highest standards in its safekeeping and use. We strictly limit how we share your information with others, whether you are a current or former Guggenheim Investments client or investor.
The Information We Collect About You
We collect certain nonpublic personal information about you from information you provide on applications, other forms, our website, and/or from third parties including investment advisors. This information includes Social Security or other tax identification number, assets, income, tax information, retirement and estate plan information, transaction history, account balance, payment history, bank account information, marital status, family relationships, information that we collect on our website through the use of “cookies,” and other personal information that you or others provide to us. We may also collect such information through your inquiries by mail, e-mail or telephone. We may also collect customer due diligence information, as required by applicable law and regulation, through third party service providers.
How We Handle Your Personal Information
The legal basis for using your information as set out in this Privacy Notice is as follows: (a) use of your personal data is necessary to perform our obligations under any contract with you (such as a contract for us to provide financial services to you); or (b) where use of your personal data is not necessary for performance of a contract, use of your personal data is necessary for our
| | THE GUGGENHEIM FUNDS ANNUAL REPORT | 131 |
GUGGENHEIM INVESTMENTS PRIVACY NOTICE (Unaudited)(continued) |
legitimate interests or the legitimate interests of others (for example, to enforce the legal terms governing our services, operate and market our website and other services we offer, ensure safe environments for our personnel and others, make and receive payments, prevent fraud and to know the customer to whom we are providing the services). Some processing is done to comply with applicable law.
In addition to the specific uses described above, we also use your information in the following manner:
| | ● | We use your information in connection with servicing your accounts. |
| | ● | We use information to respond to your requests or questions. For example, we might use your information to respond to your customer feedback. |
| | ● | We use information to improve our products and services. We may use your information to make our website and products better. We may use your information to customize your experience with us. |
| | ● | We use information for security purposes. We may use your information to protect our company and our customers. |
| | ● | We use information to communicate with you. For example, we will communicate with you about your account or our relationship. We may contact you about your feedback. We might also contact you about this Privacy Notice. We may also enroll you in our email newsletter. |
| | ● | We use information as otherwise permitted by law, as we may notify you. |
| | ● | Aggregate/Anonymous Data. We may aggregate and/or anonymize any information collected through the website so that such information can no longer be linked to you or your device (“Aggregate/Anonymous Information”). We may use Aggregate/Anonymous Information for any purpose, including without limitation for research and marketing purposes, and may also share such data with any third parties, including advertisers, promotional partners, and sponsors. |
We do not sell information about current or former clients or their accounts to third parties. Nor do we share this information, except when necessary to complete transactions at your request, to make you aware of investment products and services that we or our affiliates offer, or as permitted or required by law.
We provide information about you to companies and individuals not affiliated with Guggenheim Investments to complete certain transactions or account changes, or to perform services for us related to your account. For example, if you ask to transfer assets from another financial institution to Guggenheim Investments, we must provide certain information about you to that company to complete the transaction. We provide the third party with only the information necessary to carry out its responsibilities and only for that purpose. And we require these third
132 | THE GUGGENHEIM FUNDS ANNUAL REPORT | |
GUGGENHEIM INVESTMENTS PRIVACY NOTICE (Unaudited)(continued) |
parties to treat your private information with the same high degree of confidentiality that we do. To alert you to other Guggenheim Investments products and services, we share your information within our family of affiliated companies. You may limit our sharing with affiliated companies as set out below. We may also share information with any successor to all or part of our business, or in connection with steps leading up to a merger or acquisition. For example, if part of our business was sold we may give customer information as part of that transaction. We may also share information about you with your consent.
We will release information about you if you direct us to do so, if we are compelled by law to do so, or in other circumstances as permitted by law (for example, to protect your account from fraud).
If you close your account(s) or become an inactive client or investor, we will continue to adhere to the privacy policies and practices described in this notice.
Opt-Out Provisions and Your Data Choices
The law allows you to “opt out” of certain kinds of information sharing with third parties. We do not share personal information about you with any third parties that triggers this opt-out right. This means YOU ARE ALREADY OPTED OUT.
When you are no longer our client or investor, we continue to share your information as described in this notice, and you may contact us at any time to limit our sharing by sending an email to CorporateDataPrivacy@GuggenheimPartners.com.
European Union Data Subjects and certain others: In addition to the choices set forth above, residents of the European Union and certain other jurisdictions have certain rights to (1) request access to or rectification or deletion of information we collect about them, (2) request a restriction on the processing of their information, (3) object to the processing of their information, or (4) request the portability of certain information. To exercise these or other rights, please contact us using the contact information below. We will consider all requests and provide our response within the time period stated by applicable law. Please note, however, that certain information may be exempt from such requests in some circumstances, which may include if we need to keep processing your information for our legitimate interests or to comply with a legal obligation. We may request you provide us with information necessary to confirm your identity before responding to your request.
Residents of France and certain other jurisdictions may also provide us with instructions regarding the manner in which we may continue to store, erase and share your information after your death, and where applicable, the person you have designated to exercise these rights after your death.
How We Protect Privacy Online
We take steps to protect your privacy when you use our web site – www.guggenheiminvestments.com – by using secure forms of online communication, including encryption technology, Secure Socket Layer (SSL) protocol, firewalls and user names and
| | THE GUGGENHEIM FUNDS ANNUAL REPORT | 133 |
GUGGENHEIM INVESTMENTS PRIVACY NOTICE (Unaudited)(concluded) |
passwords. These safeguards vary based on the sensitivity of the information that we collect and store. However, we cannot and do not guarantee that these measures will prevent every unauthorized attempt to access, use, or disclose your information since despite our efforts, no Internet and/or other electronic transmissions can be completely secure. Our web site uses “http cookies”—tiny pieces of information that we ask your browser to store. We use cookies for session management and security features on the Guggenheim Investments web site. We do not use them to pull data from your hard drive, to learn your e-mail address, or to view data in cookies created by other web sites. We will not share the information in our cookies or give others access to it. See the legal information area on our web site for more details about web site security and privacy features.
How We Safeguard Your Personal Information and Data Retention
We restrict access to nonpublic personal information about you to our employees and in some cases to third parties (for example, the service providers described above) as permitted by law. We maintain strict physical, electronic and procedural safeguards that comply with federal standards to guard your nonpublic personal information.
We keep your information for no longer than necessary for the purposes for which it is processed. The length of time for which we retain information depends on the purposes for which we collected and use it and/or as required to comply with applicable laws. Information may persist in copies made for backup and business continuity purposes for additional time.
International Visitors
If you are not a resident of the United States, please be aware that your information may be transferred to, stored and processed in the United States where our servers are located and our databases are operated. The data protection and other laws of the United States and other countries might not be as comprehensive as those in your country.
In such cases, we ensure that a legal basis for such a transfer exists and that adequate protection is provided as required by applicable law, for example, by using standard contractual clauses or by transferring your data to a jurisdiction that has obtained an adequacy finding. Individuals whose data may be transferred on the basis of standard contractual clauses may contact us as described below.
We’ll Keep You Informed
If you have any questions or concerns about how we treat your personal data, we encourage you to consult with us first. You may also contact the relevant supervisory authority.
We reserve the right to modify this policy at any time and will inform you promptly of material changes. You may access our privacy policy from our web site at www.guggenheiminvestments.com. Should you have any questions regarding our privacy policy, contact us by email at CorporateDataPrivacy@GuggenheimPartners.com.
134 | THE GUGGENHEIM FUNDS ANNUAL REPORT | |
This page intentionally left blank.
This page intentionally left blank.
This page intentionally left blank.
9.30.2019
Guggenheim Funds Annual Report
| |
Guggenheim Floating Rate Strategies Fund | | |
Beginning on January 1, 2021, paper copies of the Fund’s annual and semi-annual shareholder reports may no longer be sent by mail, unless you specifically request paper copies of the reports from a Fund or from your financial intermediary. Instead, the reports will be made available on a website, and you will be notified by mail each time a report is posted and provided with a website link to access the report.
If you already elected to receive shareholder reports electronically, you will not be affected by this change and you need not take any action. At any time, you may elect to receive reports and other communications from a Fund electronically by calling 800.820.0888, going to GuggenheimInvestments.com/myaccount, or by contacting your financial intermediary.
You may elect to receive all future shareholder reports in paper free of charge. If you hold shares of a Fund directly, you can inform the Fund that you wish to receive paper copies of reports by calling 800.820.0888. If you hold shares of a Fund through a financial intermediary, please contact the financial intermediary to make this election. Your election to receive reports in paper will apply to all Guggenheim Funds in which you are invested and may apply to all funds held with your financial intermediary.
GuggenheimInvestments.com | FR-ANN-0919x0920 |

| | |
DEAR SHAREHOLDER | 2 |
ECONOMIC AND MARKET OVERVIEW | 4 |
ABOUT SHAREHOLDERS’ FUND EXPENSES | 7 |
FLOATING RATE STRATEGIES FUND | 10 |
NOTES TO FINANCIAL STATEMENTS | 48 |
REPORT OF INDEPENDENT REGISTERED PUBLIC ACCOUNTING FIRM | 67 |
OTHER INFORMATION | 69 |
INFORMATION ON BOARD OF TRUSTEES AND OFFICERS | 83 |
GUGGENHEIM INVESTMENTS PRIVACY NOTICE | 90 |
| | THE GUGGENHEIM FUNDS ANNUAL REPORT | 1 |
Dear Shareholder:
Guggenheim Partners Investment Management, LLC (“GPIM” or the “Investment Adviser”) is pleased to present the shareholder report for Guggenheim Floating Rate Strategies Fund (the “Fund”) for the annual fiscal period ended September 30, 2019.
The Investment Adviser is part of Guggenheim Investments, which represents the investment management businesses of Guggenheim Partners, LLC (“Guggenheim”), a global, diversified financial services firm.
Guggenheim Funds Distributors, LLC is the distributor of the Funds. Guggenheim Funds Distributors, LLC is affiliated with Guggenheim and the Investment Adviser.
We encourage you to read the Economic and Market Overview section of the report, which follows this letter, and then the Manager’s Commentary for the Fund.
We are committed to providing innovative investment solutions and appreciate the trust you place in us.
Sincerely,
Guggenheim Partners Investment Management, LLC
October 31, 2019
Read a prospectus and summary prospectus (if available) carefully before investing. It contains the investment objectives, risks, charges, expenses and other information, which should be considered carefully before investing. Obtain a prospectus and summary prospectus (if available) at guggenheiminvestments.com or call 800.820.0888.
This material is not intended as a recommendation or as investment advice of any kind, including in connection with rollovers, transfers, and distributions. Such material is not provided in a fiduciary capacity, may not be relied upon for or in connection with the making of investment decisions, and does not constitute a solicitation of an offer to buy or sell securities. All content has been provided for informational or educational purposes only and is not intended to be and should not be construed as legal or tax advice and/or a legal opinion. Always consult a financial, tax and/ or legal professional regarding your specific situation.
2 | THE GUGGENHEIM FUNDS ANNUAL REPORT | |
Floating Rate Strategies Fund may not be suitable for all investors. ● Investments in floating rate senior secured syndicated bank loans and other floating rate securities involve special types of risks, including credit rate risk, interest rate risk, liquidity risk and prepayment risk. ● The Fund’s market value will change in response to interest rate changes and market conditions among other factors. In general, bond prices rise when interest rates fall and vice versa. ● The Fund’s exposure to high yield securities may subject the Fund to greater volatility. ● When market conditions are deemed appropriate, the Fund may use leverage to the full extent permitted by its investment policies and restrictions and applicable law. Leveraging will exaggerate the effect on net asset value of any increase or decrease in the market value of the Fund’s portfolio. ● The Fund may invest in derivative instruments, which may be more volatile and less liquid, increasing the risk of loss when compared to traditional securities. Certain of the derivative instruments are also subject to the risks of counterparty default and adverse tax treatment. ● Instruments and strategies (such as borrowing transactions and reverse repurchase agreements) may provide leveraged exposure to a particular investment, which will magnify any gains or losses on those investments. ● Investments in reverse repurchase agreements and synthetic instruments (such as synthetic collateralized debt obligations) expose the Fund to the many of the same risks as investments in derivatives. ● The Fund’s investments in other investment vehicles subject the Fund to those risks and expenses affecting the investment vehicle. ● The Fund’s investments in foreign securities carry additional risks when compared to U.S. securities, due to the impact of diplomatic, political or economic developments in the country in question (investments in emerging markets securities are generally subject to an even greater level of risk). ● The Fund’s investments in real estate securities subject the Fund to the same risks as direct investments in real estate, which is particularly sensitive to economic downturns. ● The Fund’s investments in restricted securities may involve financial and liquidity risk. ● The Fund is subject to active trading risks that may increase volatility and impact its ability to achieve its investment objective. ● You may have a gain or loss when you sell your shares. ● It is important to note that the Fund is not guaranteed by the U.S. government. ● Please read the prospectus for more detailed information regarding these and other risks.
| | THE GUGGENHEIM FUNDS ANNUAL REPORT | 3 |
ECONOMIC AND MARKET OVERVIEW (Unaudited) | September 30, 2019 |
Economic data has been mixed over the past few months. On the positive side, we saw a pickup in the housing market as measured by housing starts and home sales, which could be a delayed response to lower mortgage rates. Industrial production had the strongest month-over-month gain in a year, partially boosted by an increase in oil production in Hurricane Barry’s wake. The unemployment rate fell to a 50-year low of 3.5% in September 2019, despite a continued moderation in payroll gains.
On the negative side, the Institute for Supply Management (“ISM”) Manufacturing Index plunged to the weakest reading since June 2009. The ISM Non-Manufacturing Index also came in well below expectations, the lowest since August 2016. Within both the manufacturing and non-manufacturing ISM indexes, analysts look at the employment component of the survey for an early read on other labor market indicators. Here we find more cause for concern: The non-manufacturing survey’s employment component is now barely above 50 while the manufacturing employment sub-index stands at 46.3, well into contraction territory. Combined, the outlook for output and hiring has dimmed, signaling trouble ahead for consumers.
Retail sales have been steady, but Commerce Department data showed that total consumer spending on goods and services increased only 0.1% month-over-month in August 2019, the smallest gain in six months. It is hard to identify the primary reason why consumers may already be turning more conservative on spending. Income growth looks steady, the equity market is higher year-to-date, and rates are lower, all of which should be boosting consumer confidence. Sentiment surveys, however, show that fewer consumers believe now is a good time to buy homes, vehicles, and household durables, and headline consumer confidence measures have ticked down. We believe trade policy and political concerns are weighing on sentiment, and these headwinds are set to ramp up further. Additional U.S. tariffs on China are due to take effect on December 15, 2019, and the U.S. House of Representatives is pressing forward with its impeachment inquiry into President Trump.
Guggenheim’s dashboard of U.S. recession indicators continues to point to a recession beginning as early as the first half of 2020, and we think the economic data is corroborating this view. Two of the more notable indicators pointing to high recession risk are the three-month/10-year U.S. Treasury yield curve, which has been inverted for 16 consecutive weeks through period end, and the Leading Economic Indicators Index which has slowed from a year-over-year growth rate of 6.6% in September 2018 to 1.1% as of August 2019. The indicators Guggenheim tracks as part of our recession probability model indicate a nearly 50% chance that a recession will come before mid-2020, and a 70% chance that it will arrive by mid-2021.
Over the period, the U.S. Treasury curve continued its overall flattening trend, as the difference between the two-year U.S. Treasury and 10-year U.S. Treasury narrowed to 5 basis points. Equity markets remained volatile, buoyed by a 25 basis point cut in July and September 2019 by the U.S. Federal Reserve (the “Fed”) and relatively strong U.S. economic data, but weighed down by trade war uncertainty and fears of a global slowdown.
4 | THE GUGGENHEIM FUNDS ANNUAL REPORT | |
ECONOMIC AND MARKET OVERVIEW (Unaudited)(continued) | September 30, 2019 |
With downside risks growing, markets have become more sensitive to the Fed’s communications about the future stance of monetary policy. Despite the two rate cuts, Fed policymakers are deeply divided. It is still unclear whether the Fed will deliver the aggressive and preemptive policy action that would prolong the current expansion.
As it relates to risk-taking, we are not confident that the Fed would succeed in easing credit conditions if conditions were to tighten materially. The Fed may act too late, or its actions may have little impact given that low rates this year have largely failed to stimulate growth. With credit spreads still relatively tight on a historical basis, we believe it is prudent to remain up in quality as we await better opportunities to deploy capital in riskier credit sectors in the coming downturn.
For the 12-month period ended September 30, 2019, the Standard & Poor’s 500® (“S&P 500”) Index* returned 4.25%. The MSCI Europe-Australasia-Far East (“EAFE”) Index* returned -0.82%. The return of the MSCI Emerging Markets Index* was -1.63%.
In the bond market, the Bloomberg Barclays U.S. Aggregate Bond Index* posted a 10.30% return for the period, while the Bloomberg Barclays U.S. Corporate High Yield Index* returned 6.36%. The return of the ICE Bank of America (“BofA”) Merrill Lynch 3-Month U.S. Treasury Bill Index* was 2.39% for the 12-month period.
The opinions and forecasts expressed may not actually come to pass. This information is subject to change at any time, based on market and other conditions, and should not be construed as a recommendation of any specific security or strategy.
*Index Definitions
Indices are unmanaged and not available for direct investment. Index performance does not reflect transaction costs, fees, or expenses.
Bloomberg Barclays U.S. Aggregate Bond Index is a broad-based flagship benchmark that measures the investment grade, U.S. dollar-denominated, fixed-rate taxable bond market, including U.S. Treasuries, government-related and corporate securities, mortgage-backed securities or “MBS” (agency fixed-rate and hybrid adjustable-rate mortgage, or “ARM”, pass-throughs), asset-backed securities (“ABS”), and commercial mortgage-backed securities (“CMBS”) (agency and non-agency).
Bloomberg Barclays U.S. Corporate High Yield Index measures the U.S. dollar-denominated, high yield, fixed-rate corporate bond market. Securities are classified as high yield if the middle rating of Moody’s, Fitch, and S&P is Ba1/BB +/BB + or below.
Credit Suisse Leveraged Loan Index tracks the investable market of the U.S. dollar denominated leveraged loan market. It consists of issues rated “5B” or lower, meaning that the highest rated issues included in this index are Moody’s/S&P ratings of Baa1/BB+ or Ba1/BBB+. All loans are funded term loans with a tenor of at least one year and are made by issuers domiciled in developed countries.
ICE BofA Merrill Lynch 3-Month U.S. Treasury Bill Index is an unmanaged market Index of U.S. Treasury securities maturing in 90 days that assumes reinvestment of all income.
| | THE GUGGENHEIM FUNDS ANNUAL REPORT | 5 |
ECONOMIC AND MARKET OVERVIEW (Unaudited)(concluded) | September 30, 2019 |
MSCI EAFE Index is a capitalization-weighted measure of stock markets in Europe, Australasia, and the Far East.
MSCI Emerging Markets Index is a free float-adjusted market capitalization-weighted index that is designed to measure equity market performance in the global emerging markets.
S&P 500® is a broad-based index, the performance of which is based on the performance of 500 widely held common stocks chosen for market size, liquidity, and industry group representation.
6 | THE GUGGENHEIM FUNDS ANNUAL REPORT | |
ABOUT SHAREHOLDERS’ FUND EXPENSES (Unaudited) |
All mutual funds have operating expenses, and it is important for our shareholders to understand the impact of costs on their investments. Shareholders of a fund incur two types of costs: (i) transaction costs, including sales charges (loads) on purchase payments, reinvested dividends, other distributions, and exchange fees, and (ii) ongoing costs, including management fees, administrative services, and shareholder reports, among others. These ongoing costs, or operating expenses, are deducted from a fund’s gross income and reduce the investment return of the fund.
A fund’s expenses are expressed as a percentage of its average net assets, which is known as the expense ratio. The following examples are intended to help investors understand the ongoing costs (in dollars) of investing in a fund and to compare these costs with the ongoing costs of investing in other mutual funds.
The examples are based on an investment of $1,000 made at the beginning of the period and held for the entire six-month period beginning March 31, 2019 and ending September 30, 2019.
The following tables illustrate the Fund’s costs in two ways:
Table 1. Based on actual Fund return: This section helps investors estimate the actual expenses paid over the period. The “Ending Account Value” shown is derived from the Fund’s actual return, and the fifth column shows the dollar amount that would have been paid by an investor who started with $1,000 in the Fund. Investors may use the information here, together with the amount invested, to estimate the expenses paid over the period. Simply divide the Fund’s account value by $1,000 (for example, an $8,600 account value divided by $1,000 = 8.6), then multiply the result by the number provided under the heading “Expenses Paid During Period.”
Table 2. Based on hypothetical 5% return: This section is intended to help investors compare a Fund’s cost with those of other mutual funds. The table provides information about hypothetical account values and hypothetical expenses based on the Fund’s actual expense ratio and an assumed rate of return of 5% per year before expenses, which is not the Fund’s actual return. The hypothetical account values and expenses may not be used to estimate the actual ending account balance or expenses paid during the period. The example is useful in making comparisons because the U.S. Securities and Exchange Commission (the “SEC”) requires all mutual funds to calculate expenses based on the 5% return. Investors can assess a Fund’s costs by comparing this hypothetical example with the hypothetical examples that appear in shareholder reports of other funds.
The calculations illustrated above assume no shares were bought or sold during the period. Actual costs may have been higher or lower, depending on the amount of investment and the timing of any purchases or redemptions.
| | THE GUGGENHEIM FUNDS ANNUAL REPORT | 7 |
ABOUT SHAREHOLDERS’ FUND EXPENSES (Unaudited)(continued) |
Please note that the expenses shown in the table are meant to highlight your ongoing costs only and do not reflect any transactional costs, such as sales charges (loads) on purchase payments, and contingent deferred sales charges (“CDSC”) on redemptions, if any. Therefore, the second table is useful in comparing ongoing costs only, and will not help you determine the relative total costs of owning different funds. In addition, if these transactional costs were included, your costs would have been higher.
More information about the Fund’s expenses, including annual expense ratios for periods up to five years (subject to the Fund’s inception date), can be found in the Financial Highlights section of this report. For additional information on operating expenses and other shareholder costs, please refer to the Fund’s prospectus.
8 | THE GUGGENHEIM FUNDS ANNUAL REPORT | |
ABOUT SHAREHOLDERS’ FUND EXPENSES (Unaudited)(concluded) |
| Expense
Ratio1 | Fund
Return | Beginning
Account Value
March 31,
2019 | Ending
Account Value
September 30,
2019 | Expenses
Paid During
Period2 |
Table 1. Based on actual Fund return3 |
A-Class | 1.10% | 2.25% | $ 1,000.00 | $ 1,022.50 | $ 5.58 |
C-Class | 1.85% | 1.87% | 1,000.00 | 1,018.70 | 9.36 |
P-Class | 1.10% | 2.25% | 1,000.00 | 1,022.50 | 5.58 |
Institutional Class | 0.86% | 2.37% | 1,000.00 | 1,023.70 | 4.36 |
R6-Class | 0.84% | 2.38% | 1,000.00 | 1,023.80 | 4.26 |
|
Table 2. Based on hypothetical 5% return (before expenses) |
A-Class | 1.10% | 5.00% | $ 1,000.00 | $ 1,019.55 | $ 5.57 |
C-Class | 1.85% | 5.00% | 1,000.00 | 1,015.79 | 9.35 |
P-Class | 1.10% | 5.00% | 1,000.00 | 1,019.55 | 5.57 |
Institutional Class | 0.86% | 5.00% | 1,000.00 | 1,020.76 | 4.36 |
R6-Class | 0.84% | 5.00% | 1,000.00 | 1,020.86 | 4.26 |
1 | Annualized and excludes expenses of the underlying funds in which the Funds invest, if any. |
2 | Expenses are equal to the Fund’s annualized expense ratio, net of any applicable fee waivers, multiplied by the average account value over the period, multiplied by 183/365 (to reflect the one-half year period). |
3 | Actual cumulative return at net asset value for the period March 31, 2019 to September 30, 2019. |
| | THE GUGGENHEIM FUNDS ANNUAL REPORT | 9 |
MANAGERS’ COMMENTARY (Unaudited) | September 30, 2019 |
To Our Shareholders
Guggenheim Floating Rate Strategies Fund (the “Fund”) is managed by a team of seasoned professionals, including B. Scott Minerd, Chairman of Investments and Global Chief Investment Officer; Anne B. Walsh, Senior Managing Director and Chief Investment Officer, Fixed Income; Kevin H. Gundersen, Senior Managing Director and Portfolio Manager; and Thomas J. Hauser, Senior Managing Director and Portfolio Manager. In the following paragraphs, the investment team discusses the market environment and the Fund’s performance for the fiscal year ended September 30, 2019.
For the one-year period ended September 30, 2019, Guggenheim Floating Rate Strategies Fund returned 2.01%1 net of fees, compared with the 3.11% return of its benchmark, the Credit Suisse Leveraged Loan Index (“Index”).
The bank loan market saw bouts of volatility in the fourth quarter of 2018 and the first quarter of 2019, followed by a more normalized environment in the second quarter of 2019 and the third quarter of 2019. Despite outflows from mutual funds and ETFs in nearly every week of the past year, as retail investors reallocated capital on a shift in the U.S. Federal Reserve (“Fed”) rate hike expectations, loans continued to see some technical tailwinds which helped stabilize prices. At a high level, we have seen investors continue to move up in quality, driven in part by collateralized loan obligation (“CLO”) demand for higher-rated assets. Over the 12-month period ended September 30, 2019, BB-rated credits outperformed, returning 4.20% versus 3.11% for the Index.
The Fund’s returns were positive across every sector with the exception of energy. However, the Fund lagged its benchmark on a net basis. The Fund benefitted from being underweight to CCC-rated assets, which underperformed the broader index, returning -3.96% for the period. We continue to believe it is not the appropriate time in the cycle to move down in credit quality in search of incremental yield. Additionally, the Fund benefitted from strong credit selection in BB-rated names, as well as in the consumer non-cyclical and electric utilities sectors. The Fund also benefitted from its allocation to investment grade corporates, high yield bonds, and asset-backed securities (“ABS”), which all outperformed the Index. The Fund’s returns were negatively impacted by credit selection in the energy and technology sectors, driven mainly by stress on the energy space and certain idiosyncratic credit issues as well as cash drag.
In the fourth quarter of 2018, the leveraged loan market experienced a sharp technical sell-off. This sell-off came as the result of record outflows from retail loan funds, sparked by both geopolitical uncertainty and a dramatic shift in Fed rate hike expectations. Leading up to the fourth quarter, retail investors moved money into leveraged loan mutual funds and ETFs on the expectation that the Fed would continue to raise interest rates as the economy continued to grow. Since rising rates flow through to the floating rate coupons of leveraged loans, increasing returns to lenders, such an environment increases the attractiveness of the asset class. In the second half of 2018, the economy began to slow and the trade war continued to escalate, leading the Fed to change its tone from hawkish to dovish, signaling that rate cuts were now on the horizon. This change,
10 | THE GUGGENHEIM FUNDS ANNUAL REPORT | |
MANAGERS’ COMMENTARY (Unaudited)(continued) | September 30, 2019 |
combined with a flurry of negative press about the leveraged loan market, led to a succession of record weeks of outflows. Mutual funds sold primarily the larger, more liquid capital structures in order to raise cash quickly, thereby driving down loan prices in the secondary market, resulting in a -3.08% return for the Index in the fourth quarter of 2018.
In the first quarter of 2019, the market experienced a technical rebound from the sell-off in the fourth quarter of 2018. While the outflows from retail funds continued, the pace of those outflows slowed dramatically. Additionally, managers collected their year-end interest and amortization payments and CLO issuance began to pick up again, meaning lenders were looking to put cash to work. These factors, among others, led to a sharp snap back in just the first few weeks of the year, particularly in the larger, more liquid, better-rated capital structures which bore the brunt of the sell-off in the fourth quarter of 2018. This rebound resulted in one of the strongest quarters for the loan market on record, and the strongest since the first quarter of 2010, at 3.78%.
The the second quarter of 2019 and the third quarter of 2019 were more benign by comparison, returning 1.58% and 0.92%, respectively. While the markets were moved by some geopolitical concerns, primarily around the continuing escalation of the trade war and an inversion of the yield curve, true credit issues were more idiosyncratic with the exception of the oil and gas and retail sectors, which continue to struggle with distressed ratios (loans trading below 80) of 16.5% and 19.3% respectively, according to Standard and Poor’s (“S&P”).
Broadly speaking, looking back over the past year the leveraged loan market has seen some support from continued (albeit slowing) growth, stable fundamentals, and a modestly positive technical environment despite the outflows from retail funds. We continue to see EBITDA growth across many of the names in our portfolio, and across the broader market, although that growth has slowed over the past year, at least partially due to the roll-off of the one-time tax benefits and stimulus put into place by the Trump administration. Additionally, the technical environment has been supported not only by strong new issue CLO volume, but also by continued demand from foreign institutional investors and relatively limited new issue volumes in 2019, though the market did see a pickup in issuance in the third quarter of 2019. Retail funds have seen consistent outflows, totaling $24 billion in 2019. However, these outflows were more than offset by U.S. new issue CLO volume which totaled 90 billion, only 11% behind 2018’s record pace. For the first nine months of 2019, U.S. institutional loan volume was $237 billion, down 34% from the same period in 2018, according to S&P. This supply/demand imbalance has helped to provide some support to secondary market trading levels throughout the year.
That said, investors appear to be growing more critical of riskier loans, and seem less willing to move down in credit quality in search of incremental yield at this point in the credit cycle. Over the period, lower-rated credits underperformed significantly. Split B, CCC/split CCC, and distressed issues (rated below CCC) in the Index returned -0.68%, -2.59% and -6.49% respectively. This compares to split BBBs and BBs which returned 4.62% and 4.20% respectively, and the
| | THE GUGGENHEIM FUNDS ANNUAL REPORT | 11 |
MANAGERS’ COMMENTARY (Unaudited)(concluded) | September 30, 2019 |
Index itself, which returned 3.11%. This bifurcation is likely due to a combination of regular-way loan investors being more selective in their underwriting, as well as the fact the CLO buyers have limited capacity under their documentation to invest in low-rated credits.
Despite the technical support for leveraged loans from the supply/demand imbalance, the market has softened from a year ago. The default rate in the market remains below the historical average at ~1.3%; however, distressed levels have creeped up over the last few months. Secondary and new issue spreads remain wider than where they were a year ago, particularly in lower-rated credit, as broader geopolitical fears, weaker macroeconomic data, and a temporarily inverted yield curve stoked fears that a recession may be on the horizon. Over the last year, secondary prices have fallen by 2.34 points to 96.18, while spreads have widened 9 basis points, leading to a widening of the discount margin to 3-year by 97 basis points over the last year. That widening is even more dramatic as you move down in credit quality, with split Bs and CCCs widening by 385 basis points and 389 basis points respectively. In the primary market, while higher-rated deals were typically easily syndicated, many lower-quality deals were forced to increase pricing or make other lender concessions to get them across the finish line, and single-B new issue yields remain above 2017 and 2018 levels. These dynamics seem to indicate that investors are favoring higher quality names at this point in the cycle.
As we move towards 2020, we continue to forecast that a recession may begin as early as the middle of next year. While the Fed is attempting to stave off the next recession using rate cuts, historical evidence shows that their skill in achieving this goal is mixed. Numerous headwinds combined with limited policy space globally mean it is a close call as to whether the Fed has cut rates early enough to help extend the expansion. Given that credit spreads are still relatively tight on a historical basis, we continue to believe it is prudent to remain up in quality as we await better opportunities to deploy capital in riskier credits and sectors in the coming downturn. We continue to invest in less cyclical businesses with attractive cash flow profiles, that we believe are best-suited to survive the next downturn whenever it occurs.
Performance displayed represents past performance which is no guarantee of future results.
1 | Performance figures are based on Class A shares and do not reflect deduction of the sales charges or taxes that a shareholder would pay on distributions or the redemption of shares. |
The opinions and forecast expressed may not actually come to pass. This information is subject to change at any time, based on market and other conditions, and should not be construed as a recommendation of any specific security or strategy.
12 | THE GUGGENHEIM FUNDS ANNUAL REPORT | |
PERFORMANCE REPORT AND FUND PROFILE (Unaudited) | September 30, 2019 |
FLOATING RATE STRATEGIES FUND
OBJECTIVE: Seeks to provide a high level of current income while maximizing total return.
Holdings Diversification (Market Exposure as % of Net Assets)
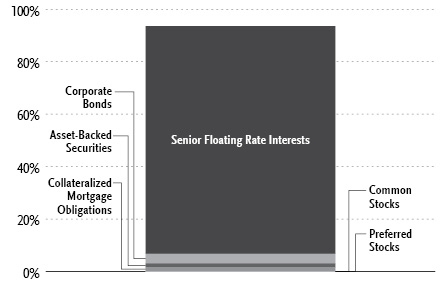
“Holdings Diversification (Market Exposure as % of Net Assets)” excludes any temporary cash investments, investments in Guggenheim Strategy Funds Trust mutual funds, or investments in Guggenheim Ultra Short Duration Fund. Investments in those Funds do not provide “market exposure” to meet the Fund’s investment objective, but will significantly increase the portfolio’s exposure to certain other asset categories (and their associated risks), which may cause the Fund to deviate from its principal investment strategy, including: (i) high yield, high risk debt securities rated below the top four long-term rating categories by a nationally recognized statistical rating organization (also known as “junk bonds”); (ii) securities issued by the U.S. government or its agencies and instrumentalities; (iii) CLOs and similar investments; and (iv) other short-term fixed income securities.
Inception Dates: |
A-Class | November 30, 2011 |
C-Class | November 30, 2011 |
P-Class | May 1, 2015 |
Institutional Class | November 30, 2011 |
R6-Class | March 13, 2019 |
Ten Largest Holdings (% of Total Net Assets) |
American Tire Distributors, Inc., 9.62% | 1.0% |
Optiv, Inc., 5.29% | 1.0% |
Planview, Inc., 7.29% | 1.0% |
Sprint Communications, Inc., 4.56% | 1.0% |
Flex Acquisition Company, Inc., 5.32% | 0.9% |
CD&R Firefly Bidco Ltd., 5.02% | 0.9% |
CSC Holdings, LLC, 4.28% | 0.9% |
Lineage Logistics LLC, 5.04% | 0.9% |
Amwins Group LLC, 4.80% | 0.9% |
USIC Holding, Inc., 5.29% | 0.9% |
Top Ten Total | 9.4% |
| | |
“Ten Largest Holdings” excludes any temporary cash or derivative investments. |
| | THE GUGGENHEIM FUNDS ANNUAL REPORT | 13 |
PERFORMANCE REPORT AND FUND PROFILE (Unaudited)(continued) | September 30, 2019 |
Cumulative Fund Performance*
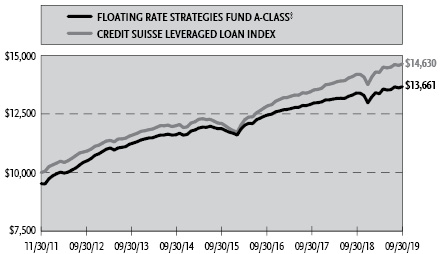
14 | THE GUGGENHEIM FUNDS ANNUAL REPORT | |
PERFORMANCE REPORT AND FUND PROFILE (Unaudited)(continued) | September 30, 2019 |
Average Annual Returns*
Periods Ended September 30, 2019
| 1 Year | 5 Year | Since
Inception
(11/30/11) |
A-Class Shares | 2.01% | 3.33% | 4.71% |
A-Class Shares with sales charge‡ | (1.04%) | 2.33% | 4.06% |
C-Class Shares | 1.26% | 2.57% | 3.93% |
C-Class Shares with CDSC§ | 0.28% | 2.57% | 3.93% |
Institutional Class Shares | 2.21% | 3.57% | 4.96% |
Credit Suisse Leveraged Loan Index | 3.11% | 4.11% | 4.98% |
| | 1 Year | Since
Inception
(05/01/15) |
P-Class Shares | | 2.01% | 3.17% |
Credit Suisse Leveraged Loan Index | | 3.11% | 4.06% |
| | | Since
Inception
(03/13/19)†† |
R6-Class Shares | | | 2.20% |
Credit Suisse Leveraged Loan Index | | | 4.39% |
* | The performance data above represents past performance that is not predictive of future results. The investment return and principal value of an investment in the Fund will fluctuate so that an investor’s shares, when redeemed, may be worth more or less than their original cost. Returns are historical and include changes in principal and reinvested dividends and capital gains and do not reflect the effect of taxes. The Credit Suisse Leveraged Loan Index is an unmanaged index and, unlike the Fund, has no management fees or operating expenses to reduce its reported return. The graph is based on A-Class shares only; performance for C-Class shares, P-Class shares, Institutional Class shares and R6-Class shares will vary due to differences in fee structures. |
‡ | Effective October 1, 2015, the maximum sales charge decreased from 4.75% to 3.00%. A 4.75% maximum sales charge is used in the calculation of the Average Annual Returns based on subscriptions made prior to October 1, 2015, and a 3.00% maximum sales charge is used to calculate performance for periods based on subscriptions made on or after October 1, 2015. |
§ | Fund returns include a CDSC of 1% if redeemed within 12 months of purchase. |
†† | Return since commencement of operations is not annualized. |
| | THE GUGGENHEIM FUNDS ANNUAL REPORT | 15 |
PERFORMANCE REPORT AND FUND PROFILE (Unaudited)(concluded) | September 30, 2019 |
Portfolio Composition by Quality Rating1 |
Rating | % of Total
Investments |
Fixed Income Instruments | |
AAA | 0.3% |
AA | 0.5% |
A | 0.4% |
BBB | 5.9% |
BB | 28.7% |
B | 52.7% |
CCC | 1.8% |
CC | 0.7% |
NR2 | 4.1% |
Other Instruments | 4.9% |
Total Investments | 100.0% |
1 | Source: BlackRock Solutions. Credit quality ratings are measured on a scale that generally ranges from AAA (highest) to D (lowest). All securities except for those labeled “NR” have been rated by Moody’s, Standard & Poor’s (“S&P”), or Fitch, each of which is a Nationally Recognized Statistical Rating Organization (“NRSRO”). For purposes of this presentation, when ratings are available from more than one agency, the highest rating is used. Guggenheim Investments has converted ratings to the equivalent S&P rating. Security ratings are determined at the time of purchase and may change thereafter. |
2 | NR securities do not necessarily indicate low credit quality. |
16 | THE GUGGENHEIM FUNDS ANNUAL REPORT | |
SCHEDULE OF INVESTMENTS | September 30, 2019 |
FLOATING RATE STRATEGIES FUND | |
| | Shares | | | Value | |
COMMON STOCKS††† - 0.2% |
| |
Consumer, Non-cyclical - 0.1% |
Chef Holdings, Inc.*,1 | | | 14,334 | | | $ | 1,803,791 | |
Targus Group International, Inc1,2 | | | 12,773 | | | | 21,632 | |
Total Consumer, Non-cyclical | | | 1,825,423 | |
| | | | | | | | | |
Industrial - 0.1% |
API Heat Transfer Parent LLC* | | | 2,902,566 | | | | 863,513 | |
BP Holdco LLC*,1,2 | | | 244,278 | | | | 86,255 | |
Vector Phoenix Holdings, LP*,1 | | | 244,278 | | | | 20,441 | |
Total Industrial | | | | | | | 970,209 | |
| | | | | | | | | |
Total Common Stocks | | | | | | | | |
(Cost $3,337,771) | | | | | | | 2,795,632 | |
| | | | | | | | | |
PREFERRED STOCKS†† - 0.0% |
Industrial - 0.0% |
API Heat Transfer Intermediate* | | | 618 | | | | 451,374 | |
Total Preferred Stocks | | | | | | | | |
(Cost $493,920) | | | | | | | 451,374 | |
| | | | | | | | | |
MONEY MARKET FUND† - 4.7% |
Federated U.S. Treasury Cash Reserve Fund — Institutional Shares 1.86%3 | | | 75,718,373 | | | | 75,718,373 | |
Total Money Market Fund | | | | | | | | |
(Cost $75,718,373) | | | | | | | 75,718,373 | |
| | Face
Amount~ | | | | |
SENIOR FLOATING RATE INTERESTS††,8 - 86.9% |
Consumer, Cyclical - 19.8% |
American Tire Distributors, Inc. | | | | | | | | |
9.62% (3 Month USD LIBOR + 7.50%, Rate Floor: 8.50%) due 09/02/24 | | | 19,128,054 | | | | 16,756,176 | |
8.15% (3 Month USD LIBOR + 6.00%, Rate Floor: 7.00%) due 09/01/23 | | | 2,017,146 | | | | 1,990,681 | |
AI Aqua Zip Bidco Pty Ltd. | | | | | | | | |
5.29% (1 Month USD LIBOR + 3.25%, Rate Floor: 4.25%) due 12/13/23 | | | 18,988,398 | | | | 18,093,268 | |
Zephyr Bidco Ltd. | | | | | | | | |
8.21% (1 Month GBP LIBOR + 7.50%, Rate Floor: 7.50%) due 07/23/26 | | GBP | 8,542,917 | | | | 10,373,354 | |
5.21% (1 Month GBP LIBOR + 4.50%, Rate Floor: 4.50%) due 07/23/25 | | GBP | 5,265,000 | | | | 6,250,152 | |
CD&R Firefly Bidco Ltd. | | | | | | | | |
5.02% (3 Month GBP LIBOR + 4.25%, Rate Floor: 4.25%) due 06/23/25 | | GBP | 12,450,000 | | | | 15,111,154 | |
Navistar Inc. | | | | | | | | |
5.53% (1 Month USD LIBOR + 3.50%, Rate Floor: 3.50%) due 11/06/24 | | | 14,937,500 | | | | 14,848,771 | |
Equinox Holdings, Inc. | | | | | | | | |
5.04% (1 Month USD LIBOR + 3.00%, Rate Floor: 4.00%) due 03/08/24 | | | 13,964,377 | | | | 13,958,512 | |
SEE NOTES TO FINANCIAL STATEMENTS. | THE GUGGENHEIM FUNDS ANNUAL REPORT | 17 |
SCHEDULE OF INVESTMENTS (continued) | September 30, 2019 |
FLOATING RATE STRATEGIES FUND | |
| | Face
Amount~ | | | Value | |
Mavis Tire Express Services Corp. | | | | | | | | |
5.29% (1 Month USD LIBOR + 3.25%, Rate Floor: 3.25%) due 03/20/25 | | | 14,000,854 | | | $ | 13,675,894 | |
Petco Animal Supplies, Inc. | | | | | | | | |
5.51% (3 Month USD LIBOR + 3.25%, Rate Floor: 4.25%) due 01/26/23 | | | 17,705,313 | | | | 13,361,137 | |
Cartrawler | | | | | | | | |
4.50% (1 Month EURIBOR + 4.50%, Rate Floor: 4.50%) due 04/29/21 | | EUR | 13,810,629 | | | | 12,949,347 | |
EG Finco Ltd. | | | | | | | | |
6.10% (3 Month USD LIBOR + 4.00%, Rate Floor: 4.00%) due 02/07/25 | | | 6,451,788 | | | | 6,369,528 | |
4.00% (3 Month EURIBOR + 4.00%, Rate Floor: 4.00%) due 02/07/25 | | EUR | 5,422,271 | | | | 5,783,953 | |
Peer Holding III BV | | | | | | | | |
3.25% (3 Month EURIBOR + 3.25%, Rate Floor: 3.25%) due 03/08/25 | | EUR | 9,900,000 | | | | 10,817,358 | |
At Home Holding III Corp. | | | | | | | | |
5.76% (3 Month USD LIBOR + 3.50%, Rate Floor: 4.50%) due 06/03/22 | | | 11,968,750 | | | | 10,771,875 | |
Argo Merchants | | | | | | | | |
5.85% (3 Month USD LIBOR + 3.75%, Rate Floor: 4.75%) due 12/06/24 | | | 10,567,101 | | | | 10,593,518 | |
AMC Entertainment, Inc. | | | | | | | | |
5.23% (3 Month USD LIBOR + 3.00%, Rate Floor: 3.00%) due 04/22/26 | | | 10,324,125 | | | | 10,358,504 | |
Party City Holdings, Inc. | | | | | | | | |
4.55% (1 Month USD LIBOR + 2.50%, Rate Floor: 3.25%) due 08/19/22 | | | 9,064,468 | | | | 8,977,631 | |
Life Time Fitness, Inc. | | | | | | | | |
4.87% (3 Month USD LIBOR + 2.75%, Rate Floor: 3.75%) due 06/10/22 | | | 8,679,648 | | | | 8,673,746 | |
Packers Sanitation Services, Inc. | | | | | | | | |
5.57% (3 Month USD LIBOR + 3.25%, Rate Floor: 4.25%) due 12/04/24 | | | 8,563,132 | | | | 8,498,909 | |
IBC Capital Ltd. | | | | | | | | |
5.90% (3 Month USD LIBOR + 3.75%, Rate Floor: 3.75%) due 09/11/23 | | | 8,520,250 | | | | 8,456,348 | |
Leslie’s Poolmart, Inc. | | | | | | | | |
5.54% (1 Month USD LIBOR + 3.50%, Rate Floor: 3.50%) due 08/16/23 | | | 8,535,401 | | | | 8,108,631 | |
Power Solutions (Panther) | | | | | | | | |
5.54% (1 Month USD LIBOR + 3.50%, Rate Floor: 3.50%) due 04/30/26 | | | 8,125,000 | | | | 8,038,712 | |
Titan AcquisitionCo New Zealand Ltd. (Trade Me) | | | | | | | | |
6.35% (3 Month USD LIBOR + 4.25%, Rate Floor: 4.25%) due 05/01/26 | | | 6,733,125 | | | | 6,751,641 | |
18 | THE GUGGENHEIM FUNDS ANNUAL REPORT | SEE NOTES TO FINANCIAL STATEMENTS. |
SCHEDULE OF INVESTMENTS (continued) | September 30, 2019 |
FLOATING RATE STRATEGIES FUND | |
| | Face
Amount~ | | | Value | |
Wyndham Hotels & Resorts, Inc. | | | | | | | | |
3.79% (1 Month USD LIBOR + 1.75%, Rate Floor: 1.75%) due 05/30/25 | | | 6,435,000 | | | $ | 6,462,735 | |
Columbus Finance, Inc. | | | | | | | | |
4.75% (6 Month EURIBOR + 4.75%, Rate Floor: 4.75%) due 07/05/24 | | EUR | 5,500,000 | | | | 6,041,485 | |
Truck Hero, Inc. | | | | | | | | |
5.79% (1 Month USD LIBOR + 3.75%, Rate Floor: 3.75%) due 04/22/24 | | | 6,446,885 | | | | 6,019,779 | |
Sapphire Bidco BV | | | | | | | | |
3.25% (3 Month EURIBOR + 3.25%, Rate Floor: 3.25%) due 05/05/25 | | EUR | 5,900,000 | | | | 5,995,203 | |
IRB Holding Corp. | | | | | | | | |
5.55% (3 Month USD LIBOR + 3.25%, Rate Floor: 4.25%) due 02/05/25 | | | 5,741,709 | | | | 5,712,196 | |
Amaya Holdings BV | | | | | | | | |
3.75% (3 Month EURIBOR + 3.75%, Rate Floor: 3.75%) due 07/10/25 | | EUR | 5,100,000 | | | | 5,620,176 | |
Nellson Nutraceutical | | | | | | | | |
6.36% (3 Month USD LIBOR + 4.25% and Commercial Prime Lending Rate + 3.25%, Rate Floor: 5.25%) due 12/23/21††† | | | 5,663,974 | | | | 5,267,496 | |
Burlington Stores, Inc. | | | | | | | | |
4.03% (1 Month USD LIBOR + 2.00%, Rate Floor: 2.00%) due 11/17/24 | | | 5,000,000 | | | | 5,011,250 | |
Midas Intermediate Holdco II LLC | | | | | | | | |
4.85% (3 Month USD LIBOR + 2.75%, Rate Floor: 3.75%) due 08/18/21 | | | 5,171,741 | | | | 4,980,386 | |
Prime Security Services Borrower LLC (ADT) | | | | | | | | |
5.21% (1 Week USD LIBOR + 3.25%, Rate Floor: 4.25%) due 09/23/26 | | | 4,800,000 | | | | 4,746,768 | |
Crown Finance US, Inc. | | | | | | | | |
4.29% (1 Month USD LIBOR + 2.25%, Rate Floor: 2.25%) due 02/28/25 | | | 4,472,499 | | | | 4,440,655 | |
Belk, Inc. | | | | | | | | |
6.80% (3 Month USD LIBOR + 4.75%, Rate Floor: 5.75%) due 12/12/22 | | | 4,030,628 | | | | 2,922,205 | |
International Car Wash Group Ltd. | | | | | | | | |
5.29% (1 Month USD LIBOR + 3.25%, Rate Floor: 4.25%) due 10/03/24 | | | 2,890,359 | | | | 2,822,927 | |
Geo Group, Inc. | | | | | | | | |
4.05% (1 Month USD LIBOR + 2.00%, Rate Floor: 2.75%) due 03/22/24 | | | 2,486,250 | | | | 2,216,915 | |
Alexander Mann | | | | | | | | |
5.71% (1 Month GBP LIBOR + 5.00%, Rate Floor: 5.00%) due 06/16/25 | | GBP | 1,540,000 | | | | 1,821,054 | |
SHO Holding I Corp. | | | | | | | | |
7.26% (3 Month USD LIBOR + 5.00%, Rate Floor: 6.00%) due 10/27/22 | | | 573,514 | | | | 539,103 | |
Total Consumer, Cyclical | | | | | | | 320,189,133 | |
| | | | | | | | | |
SEE NOTES TO FINANCIAL STATEMENTS. | THE GUGGENHEIM FUNDS ANNUAL REPORT | 19 |
SCHEDULE OF INVESTMENTS (continued) | September 30, 2019 |
FLOATING RATE STRATEGIES FUND | |
| | Face
Amount~ | | | Value | |
Industrial - 17.5% |
Flex Acquisition Company, Inc. | | | | | | | | |
5.32% (3 Month USD LIBOR + 3.00%, Rate Floor: 4.00%) due 12/29/23 | | | 15,714,395 | | | $ | 15,113,319 | |
Lineage Logistics LLC | | | | | | | | |
5.04% (1 Month USD LIBOR + 3.00%, Rate Floor: 4.00%) due 02/27/25 | | | 14,962,025 | | | | 14,962,025 | |
USIC Holding, Inc. | | | | | | | | |
5.29% (1 Month USD LIBOR + 3.25%, Rate Floor: 4.25%) due 12/08/23 | | | 15,028,463 | | | | 14,903,276 | |
TransDigm Group, Inc. | | | | | | | | |
4.54% (1 Month USD LIBOR + 2.50%, Rate Floor: 2.50%) due 05/30/25 | | | 14,813,211 | | | | 14,740,775 | |
Altra Industrial Motion Corp. | | | | | | | | |
4.04% (1 Month USD LIBOR + 2.00%, Rate Floor: 2.00%) due 10/01/25 | | | 14,686,567 | | | | 14,649,851 | |
Berry Global, Inc. | | | | | | | | |
4.55% (1 Month USD LIBOR + 2.50%, Rate Floor: 2.50%) due 07/01/26 | | | 14,526,135 | | | | 14,589,759 | |
VC GB Holdings, Inc. | | | | | | | | |
5.04% (1 Month USD LIBOR + 3.00%, Rate Floor: 4.00%) due 02/28/24††† | | | 14,606,800 | | | | 14,387,698 | |
Engineered Machinery Holdings, Inc. | | | | | | | | |
5.35% (3 Month USD LIBOR + 3.25%, Rate Floor: 4.25%) due 07/19/24 | | | 13,459,458 | | | | 13,184,616 | |
Charter Nex US, Inc. | | | | | | | | |
5.04% (1 Month USD LIBOR + 3.00%, Rate Floor: 4.00%) due 05/16/24 | | | 10,968,263 | | | | 10,851,781 | |
5.54% (1 Month USD LIBOR + 3.50%, Rate Floor: 3.50%) due 05/16/24 | | | 2,294,250 | | | | 2,290,900 | |
Advanced Disposal Services, Inc. | | | | | | | | |
4.20% (1 Week USD LIBOR + 2.25%, Rate Floor: 3.00%) due 11/10/23 | | | 12,885,272 | | | | 12,919,160 | |
BWAY Holding Co. | | | | | | | | |
5.59% (3 Month USD LIBOR + 3.25%, Rate Floor: 3.25%) due 04/03/24 | | | 13,189,442 | | | | 12,900,066 | |
CPG International LLC | | | | | | | | |
5.93% (6 Month USD LIBOR + 3.75%, Rate Floor: 4.75%) due 05/06/24 | | | 12,527,011 | | | | 12,464,376 | |
American Bath Group LLC | | | | | | | | |
6.29% (1 Month USD LIBOR + 4.25%, Rate Floor: 5.25%) due 09/30/23 | | | 11,681,440 | | | | 11,564,626 | |
Hillman Group, Inc. | | | | | | | | |
6.04% (1 Month USD LIBOR + 4.00%, Rate Floor: 4.00%) due 05/30/25 | | | 11,929,198 | | | | 11,558,319 | |
STS Operating, Inc. (SunSource) | | | | | | | | |
6.29% (1 Month USD LIBOR + 4.25%, Rate Floor: 5.25%) due 12/11/24 | | | 11,651,757 | | | | 11,375,028 | |
20 | THE GUGGENHEIM FUNDS ANNUAL REPORT | SEE NOTES TO FINANCIAL STATEMENTS. |
SCHEDULE OF INVESTMENTS (continued) | September 30, 2019 |
FLOATING RATE STRATEGIES FUND | |
| | Face
Amount~ | | | Value | |
Quikrete Holdings, Inc. | | | | | | | | |
4.79% (1 Month USD LIBOR + 2.75%, Rate Floor: 2.75%) due 11/15/23 | | | 9,980,769 | | | $ | 9,938,351 | |
Titan Acquisition Ltd. (Husky) | | | | | | | | |
5.04% (1 Month USD LIBOR + 3.00%, Rate Floor: 3.00%) due 03/28/25 | | | 10,047,000 | | | | 9,631,456 | |
Hayward Industries, Inc. | | | | | | | | |
5.54% (1 Month USD LIBOR + 3.50%, Rate Floor: 3.50%) due 08/05/24 | | | 9,610,694 | | | | 9,267,112 | |
Hanjin International Corp. | | | | | | | | |
4.55% (1 Month USD LIBOR + 2.50%, Rate Floor: 2.50%) due 10/19/20 | | | 7,250,000 | | | | 7,250,000 | |
Duran Group Holding GMBH | | | | | | | | |
4.00% (3 Month EURIBOR + 4.00%, Rate Floor: 4.00%) due 03/29/24††† | | EUR | 3,992,645 | | | | 4,222,488 | |
4.00% (3 Month EURIBOR + 4.00%, Rate Floor: 4.00%) due 12/20/24††† | | EUR | 1,346,330 | | | | 1,423,833 | |
Consolidated Container Co. LLC | | | | | | | | |
4.79% (1 Month USD LIBOR + 2.75%, Rate Floor: 3.75%) due 05/22/24 | | | 5,515,797 | | | | 5,481,323 | |
CHI Overhead Doors, Inc. | | | | | | | | |
5.29% (1 Month USD LIBOR + 3.25%, Rate Floor: 4.25%) due 07/29/22 | | | 4,974,164 | | | | 4,971,080 | |
Pelican Products, Inc. | | | | | | | | |
5.54% (1 Month USD LIBOR + 3.50%, Rate Floor: 4.50%) due 05/01/25 | | | 4,710,375 | | | | 4,510,184 | |
II-VI Incorporated | | | | | | | | |
5.54% (1 Month USD LIBOR + 3.50%, Rate Floor: 3.50%) due 09/24/26 | | | 3,950,000 | | | | 3,950,000 | |
Minerva Bidco Ltd. | | | | | | | | |
5.52% (3 Month GBP LIBOR + 4.75%, Rate Floor: 4.75%) due 07/28/25 | | GBP | 3,100,000 | | | | 3,811,866 | |
Reece Ltd. | | | | | | | | |
4.11% (3 Month USD LIBOR + 2.00%, Rate Floor: 2.00%) due 07/02/25††† | | | 3,443,799 | | | | 3,452,408 | |
Corialis Group Ltd. | | | | | | | | |
3.25% (1 Month EURIBOR + 3.25%, Rate Floor: 3.25%) due 03/29/24 | | EUR | 3,075,000 | | | | 3,346,996 | |
KUEHG Corp. (KinderCare) | | | | | | | | |
5.85% (3 Month USD LIBOR + 3.75%, Rate Floor: 4.75%) due 02/21/25 | | | 2,851,194 | | | | 2,845,264 | |
API Heat Transfer | | | | | | | | |
8.10% (3 Month USD LIBOR + 6.00%, Rate Floor: 6.00%) due 01/01/24††† | | | 2,700,186 | | | | 2,214,153 | |
8.10% (3 Month USD LIBOR + 6.00%, Rate Floor: 6.00%) due 10/02/23††† | | | 481,742 | | | | 433,568 | |
Filtration Group Corp. | | | | | | | | |
5.04% (1 Month USD LIBOR + 3.00%, Rate Floor: 3.00%) due 03/31/25 | | | 2,535,001 | | | | 2,539,970 | |
SEE NOTES TO FINANCIAL STATEMENTS. | THE GUGGENHEIM FUNDS ANNUAL REPORT | 21 |
SCHEDULE OF INVESTMENTS (continued) | September 30, 2019 |
FLOATING RATE STRATEGIES FUND | |
| | Face
Amount~ | | | Value | |
YAK MAT (YAK ACCESS LLC) | | | | | | | | |
12.06% (1 Month USD LIBOR + 10.00%, Rate Floor: 10.00%) due 07/10/26 | | | 2,550,000 | | | $ | 2,197,259 | |
Total Industrial | | | | | | | 283,942,886 | |
| | | | | | | | | |
Consumer, Non-cyclical - 12.2% |
Diamond (BC) BV | | | | | | | | |
5.26% (3 Month USD LIBOR + 3.00% Rate Floor: 3.00%) due 09/06/24 | | | 10,758,375 | | | | 10,233,904 | |
3.25% (3 Month EURIBOR + 3.25%, Rate Floor: 3.25%) due 09/06/24 | | EUR | 8,940,750 | | | | 9,435,162 | |
Sterigenics-Norion Holdings | | | | | | | | |
5.04% (1 Month USD LIBOR + 3.00%, Rate Floor: 4.00%) due 05/15/22 | | | 15,046,688 | | | | 14,858,605 | |
Dole Food Company, Inc. | | | | | | | | |
4.80% (1 Month USD LIBOR + 2.75%, Rate Floor: 3.75%) due 04/06/24 | | | 14,901,316 | | | | 14,693,741 | |
Endo Luxembourg Finance Co. | | | | | | | | |
6.38% (3 Month USD LIBOR + 4.25%, Rate Floor: 5.00%) due 04/29/24 | | | 15,636,914 | | | | 14,205,198 | |
Examworks Group, Inc. | | | | | | | | |
5.29% (1 Month USD LIBOR + 3.25%, Rate Floor: 4.25%) due 07/27/23 | | | 12,966,668 | | | | 13,004,530 | |
Springs Window Fashions | | | | | | | | |
6.30% (1 Month USD LIBOR + 4.25%, Rate Floor: 4.25%) due 06/15/25 | | | 11,652,500 | | | | 11,448,581 | |
10.55% (1 Month USD LIBOR + 8.50%, Rate Floor: 8.50%) due 06/15/26 | | | 1,350,000 | | | | 1,272,375 | |
US Foods, Inc. | | | | | | | | |
4.04% (1 Month USD LIBOR + 2.00%, Rate Floor: 2.00%) due 06/27/23 | | | 12,287,156 | | | | 12,326,843 | |
Immucor, Inc. | | | | | | | | |
7.10% (3 Month USD LIBOR + 5.00%, Rate Floor: 6.00%) due 06/15/21 | | | 11,900,442 | | | | 11,874,380 | |
IQVIA Holdings, Inc. | | | | | | | | |
3.85% (3 Month USD LIBOR + 1.75%, Rate Floor: 1.75%) due 06/11/25 | | | 10,972,292 | | | | 10,979,205 | |
CPI Holdco LLC | | | | | | | | |
5.54% (3 Month USD LIBOR + 3.50%, Rate Floor: 4.50%) due 03/21/24 | | | 10,668,879 | | | | 10,655,543 | |
Sigma Holding BV (Flora Food) | | | | | | | | |
3.50% (3 Month EURIBOR + 3.50%, Rate Floor: 3.50%) due 07/02/25 | | EUR | 9,000,000 | | | | 9,809,431 | |
Aspen Dental | | | | | | | | |
4.79% (1 Month USD LIBOR + 2.75%, Rate Floor: 2.75%) due 04/30/25 | | | 9,214,402 | | | | 9,115,348 | |
PAREXEL International Corp. | | | | | | | | |
4.79% (1 Month USD LIBOR + 2.75%, Rate Floor: 2.75%) due 09/27/24 | | | 9,372,847 | | | | 8,885,834 | |
22 | THE GUGGENHEIM FUNDS ANNUAL REPORT | SEE NOTES TO FINANCIAL STATEMENTS. |
SCHEDULE OF INVESTMENTS (continued) | September 30, 2019 |
FLOATING RATE STRATEGIES FUND | |
| | Face
Amount~ | | | Value | |
Cidron New Bidco Ltd. | | | | | | | | |
3.50% (3 Month EURIBOR + 3.50%, Rate Floor: 3.50%) due 04/16/25 | | EUR | 8,125,000 | | | $ | 8,877,882 | |
Syneos Health, Inc. | | | | | | | | |
4.04% (1 Month USD LIBOR + 2.00%, Rate Floor: 2.00%) due 08/01/24 | | | 6,066,659 | | | | 6,084,373 | |
Recess Holdings, Inc. | | | | | | | | |
5.79% (1 Month USD LIBOR + 3.75%, Rate Floor: 4.75%) due 09/30/24 | | | 5,680,582 | | | | 5,581,172 | |
Global Healthcare Exchange LLC | | | | | | | | |
5.35% (3 Month USD LIBOR + 3.25%, Rate Floor: 4.25%) due 06/28/24 | | | 3,519,000 | | | | 3,475,013 | |
CTI Foods Holding Co. LLC | | | | | | | | |
9.26% (3 Month USD LIBOR + 7.00%, Rate Floor: 8.00%) due 05/03/24††† | | | 1,899,665 | | | | 1,909,163 | |
11.26% (3 Month USD LIBOR + 9.00%, Rate Floor: 10.00%) due 05/03/24††† | | | 526,354 | | | | 494,773 | |
Arctic Glacier Group Holdings, Inc. | | | | | | | | |
5.54% (1 Month USD LIBOR + 3.50%, Rate Floor: 4.50%) due 03/20/24 | | | 2,272,564 | | | | 2,207,228 | |
BCPE Eagle Buyer LLC | | | | | | | | |
6.29% (1 Month USD LIBOR + 4.25%, Rate Floor: 5.25%) due 03/18/24 | | | 2,112,186 | | | | 2,073,913 | |
Valeant Pharmaceuticals International, Inc. | | | | | | | | |
5.04% (1 Month USD LIBOR + 3.00%, Rate Floor: 3.00%) due 06/02/25 | | | 1,990,042 | | | | 1,997,306 | |
Avantor, Inc. | | | | | | | | |
5.04% (1 Month USD LIBOR + 3.00%, Rate Floor: 4.00%) due 11/21/24 | | | 1,768,172 | | | | 1,780,885 | |
MPH Acquisition Holdings LLC | | | | | | | | |
4.85% (3 Month USD LIBOR + 2.75%, Rate Floor: 3.75%) due 06/07/23 | | | 925,000 | | | | 879,712 | |
Total Consumer, Non-cyclical | | | 198,160,100 | |
| | | | | | | | | |
Communications - 12.1% |
Sprint Communications, Inc. | | | | | | | | |
4.56% (1 Month USD LIBOR + 2.50%, Rate Floor: 3.25%) due 02/02/24 | | | 15,565,120 | | | | 15,443,556 | |
CSC Holdings, LLC | | | | | | | | |
4.28% (1 Month USD LIBOR + 2.25%, Rate Floor: 2.25%) due 07/17/25 | | | 15,000,000 | | | | 14,975,850 | |
SFR Group S.A. | | | | | | | | |
5.72% (1 Month USD LIBOR + 3.69%, Rate Floor: 3.69%) due 01/31/26 | | | 15,000,000 | | | | 14,878,200 | |
McGraw-Hill Global Education Holdings LLC | | | | | | | | |
6.04% (1 Month USD LIBOR + 4.00%, Rate Floor: 5.00%) due 05/04/22 | | | 15,717,043 | | | | 14,748,559 | |
SEE NOTES TO FINANCIAL STATEMENTS. | THE GUGGENHEIM FUNDS ANNUAL REPORT | 23 |
SCHEDULE OF INVESTMENTS (continued) | September 30, 2019 |
FLOATING RATE STRATEGIES FUND | |
| | Face
Amount~ | | | Value | |
Radiate HoldCo LLC | | | | | | | | |
5.04% (1 Month USD LIBOR + 3.00%, Rate Floor: 3.75%) due 02/01/24 | | | 12,953,606 | | | $ | 12,894,667 | |
Internet Brands, Inc. | | | | | | | | |
5.79% (1 Month USD LIBOR + 3.75%, Rate Floor: 3.75%) due 09/13/24 | | | 12,966,921 | | | | 12,863,575 | |
Market Track LLC | | | | | | | | |
6.29% (1 Month USD LIBOR + 4.25%, Rate Floor: 5.25%) due 06/05/24††† | | | 13,538,375 | | | | 12,184,538 | |
Cengage Learning Acquisitions, Inc. | | | | | | | | |
6.29% (1 Month USD LIBOR + 4.25%, Rate Floor: 5.25%) due 06/07/23 | | | 12,301,791 | | | | 11,614,982 | |
Ziggo Secured Finance BV | | | | | | | | |
4.53% (1 Month USD LIBOR + 2.50%, Rate Floor: 2.50%) due 04/15/25 | | | 11,275,000 | | | | 11,246,361 | |
Charter Communications Operating, LLC | | | | | | | | |
4.05% (1 Month USD LIBOR + 2.00%, Rate Floor: 2.00%) due 04/30/25 | | | 10,365,375 | | | | 10,422,385 | |
Houghton Mifflin Co. | | | | | | | | |
5.04% (1 Month USD LIBOR + 3.00%, Rate Floor: 4.00%) due 05/28/21 | | | 10,687,870 | | | | 10,358,363 | |
GTT Communications BV | | | | | | | | |
3.25% (1 Month EURIBOR + 3.25%, Rate Floor: 3.25%) due 05/31/25 | | EUR | 10,936,438 | | | | 10,068,153 | |
Virgin Media Bristol LLC | | | | | | | | |
4.53% (1 Month USD LIBOR + 2.50%, Rate Floor: 2.50%) due 01/15/26 | | | 10,000,000 | | | | 10,000,000 | |
WMG Acquisition Corp. | | | | | | | | |
4.17% (1 Month USD LIBOR + 2.13%, Rate Floor: 2.13%) due 11/01/23 | | | 8,637,894 | | | | 8,642,213 | |
Imagine Print Solutions LLC | | | | | | | | |
6.80% (1 Month USD LIBOR + 4.75%, Rate Floor: 5.75%) due 06/21/22 | | | 10,481,250 | | | | 6,959,550 | |
Authentic Brands | | | | | | | | |
5.54% (1 Month USD LIBOR + 3.50%, Rate Floor: 4.50%) due 09/27/24 | | | 5,624,933 | | | | 5,602,658 | |
GTT Communications, Inc. | | | | | | | | |
4.79% (1 Month USD LIBOR + 2.75%, Rate Floor: 2.75%) due 05/31/25 | | | 6,221,250 | | | | 4,989,131 | |
Level 3 Financing, Inc. | | | | | | | | |
4.29% (1 Month USD LIBOR + 2.25%, Rate Floor: 2.25%) due 02/22/24 | | | 4,950,000 | | | | 4,957,227 | |
SFR Group SA | | | | | | | | |
4.79% (1 Month USD LIBOR + 2.75%, Rate Floor: 2.75%) due 07/31/25 | | | 1,684,048 | | | | 1,640,364 | |
Liberty Cablevision of Puerto Rico LLC | | | | | | | | |
5.53% (1 Month USD LIBOR + 3.50%, Rate Floor: 4.50%) due 01/07/22 | | | 1,075,000 | | | | 1,070,969 | |
Total Communications | | | | | | | 195,561,301 | |
| | | | | | | | | |
24 | THE GUGGENHEIM FUNDS ANNUAL REPORT | SEE NOTES TO FINANCIAL STATEMENTS. |
SCHEDULE OF INVESTMENTS (continued) | September 30, 2019 |
FLOATING RATE STRATEGIES FUND | |
| | Face
Amount~ | | | Value | |
Technology - 11.8% |
Optiv, Inc. | | | | | | | | |
5.29% (1 Month USD LIBOR + 3.25%, Rate Floor: 4.25%) due 02/01/24 | | | 20,622,551 | | | $ | 15,913,804 | |
Planview, Inc. | | | | | | | | |
7.29% (1 Month USD LIBOR + 5.25%, Rate Floor: 6.25%) due 01/27/23†††,1 | | | 15,600,000 | | | | 15,600,000 | |
Solera LLC | | | | | | | | |
4.79% (1 Month USD LIBOR + 2.75%, Rate Floor: 2.75%) due 03/03/23 | | | 14,885,111 | | | | 14,805,327 | |
Peak 10 Holding Corp. | | | | | | | | |
5.60% (3 Month USD LIBOR + 3.50%, Rate Floor: 3.50%) due 08/01/24 | | | 17,052,000 | | | | 14,686,035 | |
Misys Ltd. | | | | | | | | |
5.70% (1 Month USD LIBOR + 3.50%, Rate Floor: 4.50%) due 06/13/24 | | | 14,959,831 | | | | 14,541,255 | |
WEX, Inc. | | | | | | | | |
4.29% (1 Month USD LIBOR + 2.25%, Rate Floor: 2.25%) due 05/15/26 | | | 11,612,632 | | | | 11,666,515 | |
LANDesk Group, Inc. | | | | | | | | |
6.30% (1 Month USD LIBOR + 4.25%, Rate Floor: 5.25%) due 01/20/24 | | | 11,226,400 | | | | 11,177,341 | |
Cologix Holdings, Inc. | | | | | | | | |
5.04% (1 Month USD LIBOR + 3.00%, Rate Floor: 4.00%) due 03/20/24 | | | 10,650,403 | | | | 10,341,541 | |
Seattle Spinco, Inc. | | | | | | | | |
4.54% (1 Month USD LIBOR + 2.50%, Rate Floor: 2.50%) due 06/21/24 | | | 9,047,729 | | | | 8,919,522 | |
Cvent, Inc. | | | | | | | | |
5.79% (1 Month USD LIBOR + 3.75%, Rate Floor: 4.75%) due 11/29/24 | | | 8,533,862 | | | | 8,416,521 | |
Greenway Health LLC | | | | | | | | |
5.85% (3 Month USD LIBOR + 3.75%, Rate Floor: 4.75%) due 02/16/24 | | | 8,716,247 | | | | 7,641,272 | |
EIG Investors Corp. | | | | | | | | |
5.88% (3 Month USD LIBOR + 3.75%, Rate Floor: 4.75%) due 02/09/23 | | | 7,564,541 | | | | 7,396,986 | |
Micron Technology, Inc. | | | | | | | | |
4.05% (1 Month USD LIBOR + 2.00%, Rate Floor: 2.00%) due 05/29/25 | | | 7,186,145 | | | | 7,197,356 | |
Park Place Technologies LLC | | | | | | | | |
6.04% (1 Month USD LIBOR + 4.00%, Rate Floor: 5.00%) due 03/29/25 | | | 6,750,356 | | | | 6,705,332 | |
10.04% (1 Month USD LIBOR + 8.00%, Rate Floor: 9.00%) due 03/30/26 | | | 408,434 | | | | 402,307 | |
TIBCO Software, Inc. | | | | | | | | |
6.07% (1 Month USD LIBOR + 4.00%, Rate Floor: 4.00%) due 06/30/26 | | | 6,700,000 | | | | 6,702,814 | |
MA Financeco LLC | | | | | | | | |
4.29% (1 Month USD LIBOR + 2.25%, Rate Floor: 2.25%) due 11/19/21 | | | 5,848,734 | | | | 5,836,568 | |
SEE NOTES TO FINANCIAL STATEMENTS. | THE GUGGENHEIM FUNDS ANNUAL REPORT | 25 |
SCHEDULE OF INVESTMENTS (continued) | September 30, 2019 |
FLOATING RATE STRATEGIES FUND | |
| | Face
Amount~ | | | Value | |
Emerald TopCo, Inc. (Press Ganey) | | | | | | | | |
5.54% (1 Month USD LIBOR + 3.50%, Rate Floor: 3.50%) due 07/24/26 | | | 4,400,000 | | | $ | 4,385,348 | |
Aspect Software, Inc. | | | | | | | | |
7.21% (3 Month USD LIBOR + 5.00%, Rate Floor: 6.00%) due 01/15/24 | | | 4,513,169 | | | | 4,259,303 | |
Lumentum Holdings, Inc. | | | | | | | | |
4.54% (1 Month USD LIBOR + 2.50%, Rate Floor: 2.50%) due 12/10/25 | | | 4,044,782 | | | | 4,054,894 | |
Brave Parent Holdings, Inc. | | | | | | | | |
6.26% (3 Month USD LIBOR + 4.00%, Rate Floor: 4.00%) due 04/18/25 | | | 3,217,419 | | | | 3,080,678 | |
Sabre GLBL, Inc. | | | | | | | | |
4.04% (1 Month USD LIBOR + 2.00%, Rate Floor: 2.00%) due 02/22/24 | | | 2,327,700 | | | | 2,335,893 | |
Precise Midco BV (Exact Software) | | | | | | | | |
4.25% (3 Month EURIBOR + 4.25%, Rate Floor: 4.25%) due 05/13/26 | | EUR | 2,000,000 | | | | 2,204,623 | |
EXC Holdings III Corp. | | | | | | | | |
5.60% (3 Month USD LIBOR + 3.50%, Rate Floor: 4.50%) due 12/02/24 | | | 1,989,563 | | | | 1,988,329 | |
Miami Escrow Borrower LLC | | | | | | | | |
4.54% (1 Month USD LIBOR + 2.50%, Rate Floor: 2.50%) due 06/21/24 | | | 1,339,760 | | | | 1,320,776 | |
Targus Group International, Inc. | | | | | | | | |
due 05/24/16†††,1,2,10 | | | 152,876 | | | | — | |
Total Technology | | | | | | | 191,580,340 | |
| | | | | | | | | |
Financial - 7.5% |
Amwins Group LLC | | | | | | | | |
4.80% (1 Month USD LIBOR + 2.75%, Rate Floor: 3.75%) due 01/25/24 | | | 14,962,750 | | | | 14,958,111 | |
Alliant Holdings Intermediate LLC | | | | | | | | |
5.05% (1 Month USD LIBOR + 3.00%, Rate Floor: 3.00%) due 05/09/25 | | | 14,962,121 | | | | 14,697,591 | |
National Financial Partners Corp. | | | | | | | | |
5.04% (1 Month USD LIBOR + 3.00%, Rate Floor: 3.00%) due 01/08/24 | | | 14,961,000 | | | | 14,689,906 | |
LPL Holdings, Inc. | | | | | | | | |
4.30% (1 Month USD LIBOR + 2.25%, Rate Floor: 2.25%) due 09/23/24 | | | 12,000,000 | | | | 12,052,560 | |
Virtu Financial, Inc. | | | | | | | | |
6.04% (3 Month USD LIBOR + 3.50%, Rate Floor: 3.50%) due 03/01/26 | | | 11,485,483 | | | | 11,499,840 | |
HUB International Ltd. | | | | | | | | |
5.27% (3 Month USD LIBOR + 3.00%, Rate Floor: 3.00%) due 04/25/25 | | | 9,924,623 | | | | 9,801,955 | |
Delos Finance S.A.R.L (International Lease Finance) | | | | | | | | |
3.85% (3 Month USD LIBOR + 1.75%, Rate Floor: 1.75%) due 10/06/23 | | | 9,375,000 | | | | 9,400,125 | |
26 | THE GUGGENHEIM FUNDS ANNUAL REPORT | SEE NOTES TO FINANCIAL STATEMENTS. |
SCHEDULE OF INVESTMENTS (continued) | September 30, 2019 |
FLOATING RATE STRATEGIES FUND | |
| | Face
Amount~ | | | Value | |
USI, Inc. | | | | | | | | |
5.10% (3 Month USD LIBOR + 3.00%, Rate Floor: 3.00%) due 05/16/24 | | | 8,155,082 | | | $ | 8,014,081 | |
Aretec Group, Inc. | | | | | | | | |
6.29% (1 Month USD LIBOR + 4.25%, Rate Floor: 4.25%) due 10/01/25 | | | 7,791,125 | | | | 7,508,697 | |
HarbourVest Partners LP | | | | | | | | |
4.28% (1 Month USD LIBOR + 2.25%, Rate Floor: 2.25%) due 03/03/25 | | | 7,175,249 | | | | 7,187,232 | |
Camelia Bidco Banc Civica | | | | | | | | |
5.51% (3 Month GBP LIBOR + 4.75%, Rate Floor: 4.75%) due 10/14/24 | | GBP | 5,600,000 | | | | 6,756,840 | |
Jefferies Finance LLC | | | | | | | | |
5.88% (1 Month USD LIBOR + 3.75%, Rate Floor: 3.75%) due 06/03/26 | | | 4,688,250 | | | | 4,680,936 | |
Total Financial | | | | | | | 121,247,874 | |
| | | | | | | | | |
Basic Materials - 4.4% |
Alpha 3 BV | | | | | | | | |
5.10% (3 Month USD LIBOR + 3.00%, Rate Floor: 4.00%) due 01/31/24 | | | 14,847,497 | | | | 14,624,784 | |
GrafTech Finance, Inc. | | | | | | | | |
5.54% (1 Month USD LIBOR + 3.50%, Rate Floor: 4.50%) due 02/12/25 | | | 14,940,806 | | | | 14,504,982 | |
Messer Industries USA, Inc. | | | | | | | | |
4.60% (3 Month USD LIBOR + 2.50%, Rate Floor: 2.50%) due 03/01/26 | | | 12,313,125 | | | | 12,280,865 | |
PQ Corp. | | | | | | | | |
4.76% (3 Month USD LIBOR + 2.50%, Rate Floor: 2.50%) due 02/10/25 | | | 11,527,477 | | | | 11,537,045 | |
LTI Holdings, Inc. | | | | | | | | |
5.54% (1 Month USD LIBOR + 3.50%, Rate Floor: 3.50%) due 09/06/25 | | | 9,058,500 | | | | 8,555,753 | |
Arch Coal, Inc. | | | | | | | | |
4.79% (1 Month USD LIBOR + 2.75%, Rate Floor: 3.75%) due 03/07/24 | | | 6,698,571 | | | | 6,609,279 | |
HB Fuller Co. | | | | | | | | |
4.04% (1 Month USD LIBOR + 2.00%, Rate Floor: 2.00%) due 10/21/24 | | | 3,789,280 | | | | 3,771,205 | |
Total Basic Materials | | | | | | | 71,883,913 | |
| | | | | | | | | |
Energy - 1.6% |
Ultra Petroleum, Inc. | | | | | | | | |
6.05% (1 Month USD LIBOR + 3.75%, Rate Floor: 4.75%) (in-kind rate was 0.25%) due 04/12/244 | | | 16,661,502 | | | | 10,954,937 | |
Penn Virginia Holding Corp. | | | | | | | | |
9.05% (1 Month USD LIBOR + 7.00%, Rate Floor: 8.00%) due 09/29/22††† | | | 10,890,000 | | | | 10,617,750 | |
Permian Production Partners LLC | | | | | | | | |
8.05% (1 Month USD LIBOR + 6.00%, Rate Floor: 7.00%) due 05/20/24††† | | | 8,360,000 | | | | 4,180,000 | |
SEE NOTES TO FINANCIAL STATEMENTS. | THE GUGGENHEIM FUNDS ANNUAL REPORT | 27 |
SCHEDULE OF INVESTMENTS (continued) | September 30, 2019 |
FLOATING RATE STRATEGIES FUND | |
| | Face
Amount~ | | | Value | |
Summit Midstream Partners, LP | | | | | | | | |
8.04% (1 Month USD LIBOR + 6.00%, Rate Floor: 7.00%) due 05/13/22 | | | 499,819 | | | $ | 488,074 | |
Total Energy | | | | | | | 26,240,761 | |
Total Senior Floating Rate Interests | | | | |
(Cost $1,476,811,942) | | | | | | | 1,408,806,308 | |
| | | | | | | | | |
CORPORATE BONDS†† - 3.6% |
Energy - 1.2% |
Sabine Pass Liquefaction LLC | | | | | | | | |
5.63% due 02/01/21 | | | 5,500,000 | | | | 5,681,037 | |
5.63% due 04/15/23 | | | 4,200,000 | | | | 4,563,603 | |
CNX Resources Corp. | | | | | | | | |
5.88% due 04/15/22 | | | 4,398,000 | | | | 4,222,080 | |
Unit Corp. | | | | | | | | |
6.63% due 05/15/21 | | | 3,579,000 | | | | 2,711,093 | |
American Midstream Partners Limited Partnership / American Midstream Finance Corp. | | | | | | | | |
9.50% due 12/15/215 | | | 1,268,000 | | | | 1,191,920 | |
Moss Creek Resources Holdings, Inc. | | | | | | | | |
7.50% due 01/15/265 | | | 1,554,000 | | | | 1,144,132 | |
Total Energy | | | | | | | 19,513,865 | |
| | | | | | | | | |
Consumer, Non-cyclical - 0.6% |
Nathan’s Famous, Inc. | | | | | | | | |
6.63% due 11/01/255 | | | 4,275,000 | | | | 4,253,625 | |
ServiceMaster Co. LLC | | | | | | | | |
5.13% due 11/15/245 | | | 4,000,000 | | | | 4,150,000 | |
HCA, Inc. | | | | | | | | |
4.50% due 02/15/27 | | | 1,500,000 | | | | 1,608,274 | |
Total Consumer, Non-cyclical | | | 10,011,899 | |
| | | | | | | | | |
Communications - 0.4% |
Ziggo BV | | | | | | | | |
5.50% due 01/15/275 | | | 5,000,000 | | | | 5,211,000 | |
MDC Partners, Inc. | | | | | | | | |
6.50% due 05/01/245 | | | 1,700,000 | | | | 1,549,125 | |
Total Communications | | | | | | | 6,760,125 | |
| | | | | | | | | |
Financial - 0.3% |
Icahn Enterprises, LP / Icahn Enterprises Finance Corp. | | | | | | | | |
5.88% due 02/01/22 | | | 5,000,000 | | | | 5,053,125 | |
Lincoln Financing SARL | | | | | | | | |
3.88% due 04/01/24 | | EUR | 350,000 | | | | 384,078 | |
Total Financial | | | | | | | 5,437,203 | |
| | | | | | | | | |
Industrial - 0.3% |
Ardagh Packaging Finance plc / Ardagh Holdings USA, Inc. | | | | | | | | |
4.63% due 05/15/235 | | | 2,100,000 | | | | 2,149,875 | |
4.25% due 09/15/225 | | | 1,500,000 | | | | 1,519,470 | |
Grinding Media Inc. / MC Grinding Media Canada Inc. | | | | | | | | |
7.38% due 12/15/235 | | | 750,000 | | | | 716,250 | |
Total Industrial | | | | | | | 4,385,595 | |
| | | | | | | | | |
Consumer, Cyclical - 0.2% |
Anixter, Inc. | | | | | | | | |
5.50% due 03/01/23 | | | 3,000,000 | | | | 3,240,000 | |
LBC Tank Terminals Holding Netherlands BV | | | | | | | | |
6.88% due 05/15/235 | | | 630,000 | | | | 641,812 | |
Total Consumer, Cyclical | | | | | | | 3,881,812 | |
| | | | | | | | | |
Utilities - 0.2% |
AES Corp. | | | | | | | | |
6.00% due 05/15/26 | | | 2,000,000 | | | | 2,122,500 | |
5.50% due 04/15/25 | | | 1,059,000 | | | | 1,100,036 | |
Total Utilities | | | | | | | 3,222,536 | |
| | | | | | | | | |
Basic Materials - 0.2% |
Novelis Corp. | | | | | | | | |
6.25% due 08/15/245 | | | 2,530,000 | | | | 2,643,850 | |
Mirabela Nickel Ltd. | | | | | | | | |
9.50% due 06/24/196,10 | | | 1,279,819 | | | | 63,991 | |
Total Basic Materials | | | | | | | 2,707,841 | |
| | | | | | | | | |
28 | THE GUGGENHEIM FUNDS ANNUAL REPORT | SEE NOTES TO FINANCIAL STATEMENTS. |
SCHEDULE OF INVESTMENTS (continued) | September 30, 2019 |
FLOATING RATE STRATEGIES FUND | |
| | Face
Amount~ | | | Value | |
Technology - 0.2% |
NCR Corp. | | | | | | | | |
5.88% due 12/15/21 | | | 1,450,000 | | | $ | 1,460,875 | |
6.38% due 12/15/23 | | | 800,000 | | | | 822,000 | |
Total Technology | | | | | | | 2,282,875 | |
Total Corporate Bonds | | | | | | | | |
(Cost $59,358,963) | | | | | | | 58,203,751 | |
| | | | | | | | | |
ASSET-BACKED SECURITIES†† - 1.6% |
Collateralized Loan Obligations - 1.5% |
OHA Credit Partners IX Ltd. | | | | | | | | |
2013-9A, due 10/20/255,7 | | | 6,000,000 | | | | 5,072,522 | |
Cerberus Loan Funding XVII Ltd. | | | | | | | | |
2016-3A, 4.83% (3 Month USD LIBOR + 2.53%, Rate Floor: 0.00%) due 01/15/285,8 | | | 5,000,000 | | | | 4,976,583 | |
Jamestown CLO V Ltd. | | | | | | | | |
2014-5A, 7.40% (3 Month USD LIBOR + 5.10%, Rate Floor: 0.00%) due 01/17/275,8 | | | 4,000,000 | | | | 3,530,326 | |
Avery Point II CLO Ltd. | | | | | | | | |
2013-3X COM, due 01/18/257,8 | | | 4,300,020 | | | | 3,154,141 | |
Halcyon Loan Advisors Funding Ltd. | | | | | | | | |
2012-1A, 5.16% (3 Month USD LIBOR + 3.00%, Rate Floor: 0.00%) due 08/15/235,8 | | | 2,600,000 | | | | 2,607,329 | |
Treman Park CLO Ltd. | | | | | | | | |
2015-1A, due 10/20/285,7,8 | | | 3,000,000 | | | | 2,483,722 | |
Octagon Loan Funding Ltd. | | | | | | | | |
2014-1A, due 11/18/315,7,8 | | | 2,071,948 | | | | 1,147,555 | |
ACIS CLO Ltd. | | | | | | | | |
2015-6A, 5.62% (3 Month USD LIBOR + 3.37%, Rate Floor: 0.00%) due 05/01/275,8 | | | 1,000,000 | | | | 1,000,889 | |
Newstar Commercial Loan Funding LLC | | | | | | | | |
2017-1A, 5.66% (3 Month USD LIBOR + 3.50%, Rate Floor: 0.00%) due 03/20/275,8 | | | 1,000,000 | | | | 1,000,253 | |
Total Collateralized Loan Obligations | | | 24,973,320 | |
| | | | | | | | | |
Collateralized Debt Obligations - 0.1% |
N-Star REL CDO VIII Ltd. | | | | | | | | |
2006-8A, 2.45% (1 Month USD LIBOR + 0.36%, Rate Floor: 0.36%) due 02/01/415,8 | | | 702,832 | | | | 695,143 | |
| | | | | | | | | |
Transport-Aircraft - 0.0% |
Airplanes Pass Through Trust | | | | | | | | |
2001-1A, 2.88% (1 Month USD LIBOR + 0.55%, Rate Floor: 0.55%) due 03/15/19†††,6,8,10 | | | 896,492 | | | | 14,848 | |
Total Asset-Backed Securities | | | | |
(Cost $27,813,433) | | | | | | | 25,683,311 | |
| | | | | | | | | |
COLLATERALIZED MORTGAGE OBLIGATIONS†† - 1.3% |
Residential Mortgage Backed Securities - 1.3% |
RALI Series Trust | | | | | | | | |
2006-QO6, 2.20% (1 Month USD LIBOR + 0.18%, Rate Floor: 0.18%) due 06/25/468 | | | 12,596,132 | | | | 4,941,025 | |
2006-QO2, 2.24% (1 Month USD LIBOR + 0.22%, Rate Floor: 0.22%) due 02/25/468 | | | 501,523 | | | | 186,050 | |
SEE NOTES TO FINANCIAL STATEMENTS. | THE GUGGENHEIM FUNDS ANNUAL REPORT | 29 |
SCHEDULE OF INVESTMENTS (continued) | September 30, 2019 |
FLOATING RATE STRATEGIES FUND | |
| | Face
Amount~ | | | Value | |
Washington Mutual Mortgage Pass-Through Certificates Trust | | | | | | | | |
2007-OA6, 3.26% (1 Year CMT Rate + 0.81%, Rate Floor: 0.81%) due 07/25/478 | | | 3,760,849 | | | $ | 3,431,272 | |
Washington Mutual Mortgage Pass-Through Certificates WMALT Series Trust | | | | | | | | |
2006-AR9, 3.29% (1 Year CMT Rate + 0.84%, Rate Floor: 0.84%) due 11/25/468 | | | 2,781,690 | | | | 2,530,785 | |
American Home Mortgage Assets Trust | | | | | | | | |
2006-4, 2.23% (1 Month USD LIBOR + 0.21%, Rate Floor: 0.21%) due 10/25/468 | | | 3,561,600 | | | | 2,480,166 | |
Lehman XS Trust Series | | | | | | | | |
2006-16N, 2.21% (1 Month USD LIBOR + 0.19%, Rate Floor: 0.19%) due 11/25/468 | | | 2,119,384 | | | | 2,013,197 | |
Wachovia Asset Securitization Issuance II LLC Trust | | | | | | | | |
2007-HE1, 2.16% (1 Month USD LIBOR + 0.14%, Rate Floor: 0.14%) due 07/25/375,8 | | | 1,863,311 | | | | 1,721,869 | |
Nomura Resecuritization Trust | | | | | | | | |
2015-4R, 5.17% (1 Month USD LIBOR + 0.43%, Rate Floor: 0.43%) due 03/26/365,8 | | | 1,546,404 | | | | 1,511,687 | |
Alliance Bancorp Trust | | | | | | | | |
2007-OA1, 2.26% (1 Month USD LIBOR + 0.24%, Rate Floor: 0.24%) due 07/25/378 | | | 603,381 | | | | 553,276 | |
Morgan Stanley Re-REMIC Trust | | | | | | | | |
2010-R5, 3.37% due 06/26/365 | | | 591,030 | | | | 548,634 | |
GSAA Home Equity Trust | | | | | | | | |
2007-7, 2.29% (1 Month USD LIBOR + 0.27%, Rate Floor: 0.27%) due 07/25/378 | | | 465,645 | | | | 454,072 | |
New Century Home Equity Loan Trust | | | | | | | | |
2004-4, 2.81% (1 Month USD LIBOR + 0.80%, Rate Cap/Floor: 12.50%/0.53%) due 02/25/358 | | | 247,976 | | | | 242,566 | |
Total Residential Mortgage Backed Securities | | | 20,614,599 | |
Total Collateralized Mortgage Obligations | | | | |
(Cost $19,963,042) | | | | | | | 20,614,599 | |
| | | | | | | | | |
COMMERCIAL PAPER†† - 0.6% |
Ryder System, Inc. | | | | | | | | |
2.27% due 10/01/199 | | | 10,000,000 | | | | 10,000,000 | |
Total Commercial Paper | | | | | | | | |
(Cost $10,000,000) | | | | | | | 10,000,000 | |
| | | | | | | | | |
Total Investments - 98.9% | | | | | | | | |
(Cost $1,673,497,444) | | | | | | $ | 1,602,273,348 | |
Other Assets & Liabilities, net - 1.1% | | | 18,495,047 | |
Total Net Assets - 100.0% | | | | | | $ | 1,620,768,395 | |
30 | THE GUGGENHEIM FUNDS ANNUAL REPORT | SEE NOTES TO FINANCIAL STATEMENTS. |
SCHEDULE OF INVESTMENTS (continued) | September 30, 2019 |
FLOATING RATE STRATEGIES FUND | |
Forward Foreign Currency Exchange Contracts†† |
Counterparty | Contracts
to Sell | Currency | Settlement
Date | | Settlement
Value | | | Value at
September 30,
2019 | | | Unrealized
Appreciation | |
Bank of America, N.A. | 112,415,000 | EUR | 10/15/19 | | $ | 124,667,223 | | | $ | 122,695,414 | | | $ | 1,971,809 | |
Bank of America, N.A. | 36,304,000 | GBP | 10/15/19 | | | 44,941,158 | | | | 44,667,007 | | | | 274,151 | |
| | | | | | | | | | | | | | $ | 2,245,960 | |
Counterparty | Contracts
to Buy | Currency | Settlement
Date | | Settlement
Value | | | Value at
September 30,
2019 | | | Unrealized
(Depreciation) | |
Goldman Sachs International | 4,530,000 | EUR | 10/15/19 | | $ | 4,986,923 | | | $ | 4,944,271 | | | $ | (42,652 | ) |
Citibank N.A., New York | 7,900,000 | EUR | 10/15/19 | | | 8,748,196 | | | | 8,622,459 | | | | (125,737 | ) |
| | | | | | | | | | | | | | $ | (168,389 | ) |
SEE NOTES TO FINANCIAL STATEMENTS. | THE GUGGENHEIM FUNDS ANNUAL REPORT | 31 |
SCHEDULE OF INVESTMENTS (continued) | September 30, 2019 |
FLOATING RATE STRATEGIES FUND | |
~ | The face amount is denominated in U.S. dollars unless otherwise indicated. |
* | Non-income producing security. |
† | Value determined based on Level 1 inputs — See Note 4. |
†† | Value determined based on Level 2 inputs, unless otherwise noted — See Note 4. |
††† | Value determined based on Level 3 inputs — See Note 4. |
1 | Security was fair valued by the Valuation Committee at September 30, 2019. The total market value of fair valued securities amounts to $17,532,119, (cost $17,528,725) or 1.1% of total net assets. |
2 | Affiliated issuer. |
3 | Rate indicated is the 7-day yield as of September 30, 2019. |
4 | Payment-in-kind security. |
5 | Security is a 144A or Section 4(a)(2) security. These securities have been determined to be liquid under guidelines established by the Board of Trustees. The total market value of 144A or Section 4(a)(2) securities is $51,467,571 (cost $52,158,733), or 3.2% of total net assets. |
6 | Security is a 144A or Section 4(a)(2) security. These securities have been determined to be illiquid and restricted under guidelines established by the Board of Trustees. The total market value of 144A or Section 4(a)(2) illiquid and restricted securities is $78,839 (cost $1,883,995), or less than 0.1% of total net assets — See Note 9. |
7 | Security has no stated coupon. However, it is expected to receive residual cash flow payments on defined deal dates. |
8 | Variable rate security. Rate indicated is the rate effective at September 30, 2019. In some instances, the effective rate is limited by a minimum rate floor or a maximum rate cap established by the issuer. The settlement status of a position may also impact the effective rate indicated. In some cases, a position may be unsettled at period end and may not have a stated effective rate. In instances where multiple underlying reference rates and spread amounts are shown, the effective rate is based on a weighted average. |
9 | Rate indicated is the effective yield at the time of purchase. |
10 | Security is in default of interest and/or principal obligations |
| | CMT — Constant Maturity Treasury |
| | EURIBOR — European Interbank Offered Rate |
| | EUR — Euro |
| | GBP — British Pound |
| | LIBOR — London Interbank Offered Rate |
| | plc — Public Limited Company |
| | |
| | See Sector Classification in Other Information section. |
32 | THE GUGGENHEIM FUNDS ANNUAL REPORT | SEE NOTES TO FINANCIAL STATEMENTS. |
SCHEDULE OF INVESTMENTS (continued) | September 30, 2019 |
FLOATING RATE STRATEGIES FUND | |
The following table summarizes the inputs used to value the Fund’s investments at September 30, 2019 (See Note 4 in the Notes to Financial Statements):
Investments in Securities (Assets) | | Level 1
Quoted
Prices | | | Level 2
Significant
Observable
Inputs | | | Level 3
Significant
Unobservable
Inputs | | | Total | |
Common Stocks | | $ | — | | | $ | — | | | $ | 2,795,632 | | | $ | 2,795,632 | |
Preferred Stocks | | | — | | | | 451,374 | | | | — | | | | 451,374 | |
Money Market Fund | | | 75,718,373 | | | | — | | | | — | | | | 75,718,373 | |
Senior Floating Rate Interests | | | — | | | | 1,332,418,440 | | | | 76,387,868 | | | | 1,408,806,308 | |
Corporate Bonds | | | — | | | | 58,203,751 | | | | — | | | | 58,203,751 | |
Asset-Backed Securities | | | — | | | | 25,668,463 | | | | 14,848 | | | | 25,683,311 | |
Collateralized Mortgage Obligations | | | — | | | | 20,614,599 | | | | — | | | | 20,614,599 | |
Commercial Paper | | | — | | | | 10,000,000 | | | | — | | | | 10,000,000 | |
Forward Foreign Currency Exchange Contracts** | | | — | | | | 2,245,960 | | | | — | | | | 2,245,960 | |
Total Assets | | $ | 75,718,373 | | | $ | 1,449,602,587 | | | $ | 79,198,348 | | | $ | 1,604,519,308 | |
Investments in Securities (Liabilities) | | Level 1
Quoted
Prices | | | Level 2
Significant
Observable
Inputs | | | Level 3
Significant
Unobservable
Inputs | | | Total | |
Forward Foreign Currency Exchange Contracts** | | $ | — | | | $ | 168,389 | | | $ | — | | | $ | 168,389 | |
Unfunded Loan Commitments (Note 8) | | | — | | | | — | | | | 43,173 | | | | 43,173 | |
Total Liabilities | | $ | — | | | $ | 168,389 | | | $ | 43,173 | | | $ | 211,562 | |
** | This derivative is reported as unrealized appreciation/depreciation at period end. |
SEE NOTES TO FINANCIAL STATEMENTS. | THE GUGGENHEIM FUNDS ANNUAL REPORT | 33 |
SCHEDULE OF INVESTMENTS (continued) | September 30, 2019 |
FLOATING RATE STRATEGIES FUND | |
The following is summary of significant unobservable inputs used in the fair valuation of assets and liabilities categorized within the Level 3 of the fair value hierarchy:
Category | | Ending
Balance at
September 30,
2019 | | Valuation Technique | Unobservable
Inputs | | Input
Range | | | Weighted
Average* | |
Assets: | | | | | | | | | | | | | | |
Asset-Backed Securities | | $ | 14,848 | | Option Adjusted Spread off prior month broker quote | Broker Quote | — | — |
Common Stocks | | | 1,932,119 | | Enterprise Value | Valuation Multiple | 1.9x-11.9x | 8.6x |
Common Stocks | | | 863,513 | | Third Party Pricing | Broker Quote | — | — |
Senior Floating Rate Interests | | | 60,787,868 | | Third Party Pricing | Broker Quote | — | — |
Senior Floating Rate Interests | | | 15,600,000 | | Model Price | Liquidation Value | — | — |
Total Assets | | $ | 79,198,348 | | | | | |
| | | | | | | | | | | | | | | |
Liabilities: | | | | | | | | | | | | | | |
Unfunded Loan Commitments | | $ | 43,173 | | Model Price | Purchase Price | — | — |
* | Inputs are weighted by the fair value of the instruments. |
Significant changes in a quote, liquidation value or valuation multiple would generally result in significant changes in the fair value of the security.
The Fund’s fair valuation leveling guidelines were recently revised to classify a single daily broker quote, or a vendor price based on a single daily or monthly broker quote, as Level 3 rather than Level 2, if such a quote or price cannot be supported with other available market information.
34 | THE GUGGENHEIM FUNDS ANNUAL REPORT | SEE NOTES TO FINANCIAL STATEMENTS. |
SCHEDULE OF INVESTMENTS (continued) | September 30, 2019 |
FLOATING RATE STRATEGIES FUND | |
Transfers between Level 2 and Level 3 may occur as markets fluctuate and/or the availability of data used in an investment’s valuation changes. For the year ended September 30, 2019, the Fund had securities with a total value of $52,049,161 transfer into Level 3 from Level 2 due to lack of observable inputs. For the year ended September 30, 2019, the Fund had liabilities with a total value of $31,140 transfer into Level 3 from Level 2 due to lack of observable inputs. There were no other securities that transferred between levels.
Summary of Fair Value Level 3 Activity
Following is a reconciliation of Level 3 assets for which significant unobservable inputs were used to determine fair value for the year ended September 30, 2019:
| | | Assets | | | | | | | Liabilities | |
| | Common
Stocks | | | Senior
Floating Rate
Interests | | | Asset-Backed
Securities | | | Total
Assets | | | Unfunded
Loan
Commitments | |
Beginning Balance | | $ | 33,063 | | | $ | 15,760,000 | | | $ | — | | | $ | 15,793,063 | | | $ | (4,960 | ) |
Purchases/(Receipts) | | | 3,332,746 | | | | 13,600,690 | | | | — | | | | 16,933,436 | | | | (14,086 | ) |
(Sales, maturities and paydowns)/Fundings | | | (12,237 | ) | | | (630,125 | ) | | | — | | | | (642,362 | ) | | | 5,467 | |
Amortization of discount/premiums | | | — | | | | 133,885 | | | | — | | | | 133,885 | | | | — | |
Total realized gains or losses included in earnings | | | — | | | | — | | | | — | | | | — | | | | 38 | |
Total change in unrealized appreciation (depreciation) included in earnings | | | (557,940 | ) | | | (4,510,895 | ) | | | — | | | | (5,068,835 | ) | | | 1,508 | |
Transfers into Level 3 | | | — | | | | 52,034,313 | | | | 14,848 | | | | 52,049,161 | | | | (31,140 | ) |
Ending Balance | | $ | 2,795,632 | | | $ | 76,387,868 | | | $ | 14,848 | | | $ | 79,198,348 | | | $ | (43,173 | ) |
Net change in unrealized appreciation (depreciation) for investments in Level 3 securities still held at September 30, 2019 | | $ | (557,940 | ) | | $ | (4,468,552 | ) | | $ | — | | | $ | (5,026,492 | ) | | $ | 2,052 | |
Affiliated Transactions
Investments representing 5% or more of the outstanding voting shares of a company, or control of or by, or common control under Guggenheim Investments (“GI”), result in that company being considered an affiliated issuer, as defined in the 1940 Act.
The Fund may invest in certain of the underlying series of Guggenheim Strategy Funds Trust, including Guggenheim Strategy Fund II and Guggenheim Strategy Fund III, (collectively, the “Cash Management Funds”), each of which are open-end management investment companies managed by GI. The Cash Management Funds, which launched on March 11, 2014, are offered as cash management options only to mutual funds, trusts, and other accounts managed by GI and/or its affiliates, and are not available to the public. The Cash Management Funds pay no investment management fees. The Cash Management Funds’ annual report on Form N-CSR dated September 30, 2018, is available publicly or upon request. This information is available from the EDGAR database on the SEC’s website at https://www.sec.gov/Archives/edgar/data/1601445/000089180418000513/gug75569-ncsr.htm.
SEE NOTES TO FINANCIAL STATEMENTS. | THE GUGGENHEIM FUNDS ANNUAL REPORT | 35 |
SCHEDULE OF INVESTMENTS (continued) | September 30, 2019 |
FLOATING RATE STRATEGIES FUND | |
Transactions during the year ended September 30, 2019, in which the company is an affiliated issuer, were as follows:
Security Name | | | | | Value
09/30/18 | | | Additions | | | Reductions | | | Realized
Gain (Loss) | |
Common Stocks | | | | | | | | | | | | | | | | | | | | |
Aspect Software, Inc.* | | | | | | $ | — | ** | | $ | — | | | $ | — | | | $ | — | |
BP Holdco LLC *,1 | | | | | | | — | | | | 86,255 | | | | — | | | | — | |
Targus Group International, Inc.,1 | | | | | | | 33,063 | | | | — | | | | (12,237 | ) | | | — | |
Mutual Funds | | | | | | | | | | | | | | | | | | | | |
Guggenheim Strategy Fund II | | | | | | | 7,554,385 | | | | 61,982 | | | | (7,573,814 | ) | | | 309 | |
Guggenheim Strategy Fund III | | | | | | | 7,587,154 | | | | 64,096 | | | | (7,593,287 | ) | | | (66,939 | ) |
Guggenheim Ultra Short Duration Fund — Institutional Class2 | | | | | | | 8,665,910 | | | | 70,076 | | | | (8,689,421 | ) | | | 846 | |
Senior Floating Rate Interests | | | | | | | | | | | | | | | | | | | | |
Aspect Software, Inc. 7.21% (3 Month USD LIBOR + 5.00%), Rate Floor: 6.00%) due 01/15/243 | | | | | | | 5,601,165 | | | | — | | | | (4,601,443 | ) | | | (2,116,596 | ) |
Targus Group International, Inc. due 05/24/161,3,4 | | | | | | | — | ** | | | — | | | | — | | | | — | |
Warrants | | | | | | | | | | | | | | | | | | | | |
Aspect Software Parent, Inc.* | | | | | | | — | ** | | | — | | | | — | | | | — | |
| | | | | | | $ | 29,441,677 | | | $ | 282,409 | | | $ | (28,470,202 | ) | | $ | (2,182,380 | ) |
36 | THE GUGGENHEIM FUNDS ANNUAL REPORT | SEE NOTES TO FINANCIAL STATEMENTS. |
SCHEDULE OF INVESTMENTS (concluded) | September 30, 2019 |
FLOATING RATE STRATEGIES FUND | |
Security Name | | Change in
Unrealized
Appreciation
(Depreciation) | | | Value
09/30/19 | | | Shares/
Face Amount
09/30/19 | | | Investment
Income | | | Capital Gain
Distributions | |
Common Stocks | | | | | | | | | | | | | | | | | | | | |
Aspect Software, Inc.* | | $ | — | | | $ | — | | | | — | | | $ | — | | | $ | — | |
BP Holdco LLC *,1 | | | | | | | 86,255 | | | | 244,278 | | | | — | | | | — | |
Targus Group International, Inc.1 | | | 806 | | | | 21,632 | | | | 12,773 | | | | 1,140 | | | | — | |
Mutual Funds | | | | | | | | | | | | | | | | | | | | |
Guggenheim Strategy Fund II | | | (42,862 | ) | | | — | | | | — | | | | 57,929 | | | | 4,053 | |
Guggenheim Strategy Fund III | | | 8,976 | | | | — | | | | — | | | | 63,812 | | | | 284 | |
Guggenheim Ultra Short Duration Fund — Institutional Class2 | | | (47,411 | ) | | | — | | | | — | | | | 63,763 | | | | 6,314 | |
Senior Floating Rate Interests | | | | | | | | | | | | | | | | | | | | |
Aspect Software, Inc. 7.21% (3 Month USD LIBOR + 5.00%), Rate Floor: 6.00%) due 01/15/243 | | | 1,116,874 | | | | — | | | | — | | | | 312,404 | | | | — | |
Targus Group International, Inc. due 05/24/161,3,4 | | | — | | | | — | ** | | | 152,876 | | | | — | | | | — | |
Warrants | | | | | | | | | | | | | | | | | | | | |
Aspect Software Parent, Inc.* | | | — | | | | — | | | | — | | | | — | | | | — | |
| | | $ | 1,036,383 | | | $ | 107,887 | | | | | | | $ | 499,048 | | | $ | 10,651 | |
* | Non-income producing security. |
** | Market value is less than $1. |
1 | Security was fair valued by the Valuation Committee at September 30, 2019. The total market value of fair valued and affiliated securities amounts to $107,887, (cost $235,584) or less than 0.1% of total net assets. |
2 | Effective November 30, 2018, Guggenheim Strategy Fund I was reorganized with and into the Guggenheim Ultra Short Duration Fund. |
3 | Variable rate security. Rate indicated is the rate effective at June 30, 2019. In some instances, the effective rate is limited by a minimum rate floor or a maximum rate cap established by the issuer. The settlement status of a position may also impact the effective rate indicated. In some cases, a position may be unsettled at period end and may not have a stated effective rate. In instances where multiple underlying reference rates and spread amounts are shown, the effective rate is based on a weighted average. |
4 | Security is in default of interest and/or principal obligations. |
SEE NOTES TO FINANCIAL STATEMENTS. | THE GUGGENHEIM FUNDS ANNUAL REPORT | 37 |
STATEMENT OF ASSETS AND LIABILITIES |
FLOATING RATE STRATEGIES FUND |
September 30, 2019
Assets: |
Investments in unaffiliated issuers, at value (cost $1,673,261,860) | | $ | 1,602,165,461 | |
Investments in affiliated issuers, at value (cost $235,584) | | | 107,887 | |
Foreign currency, at value (cost $9,755,094) | | | 9,754,748 | |
Cash | | | 4,003,440 | |
Unrealized appreciation on forward foreign currency exchange contracts | | | 2,245,960 | |
Prepaid expenses | | | 111,089 | |
Receivables: |
Securities sold | | | 13,886,686 | |
Interest | | | 4,704,601 | |
Fund shares sold | | | 1,900,629 | |
Foreign tax reclaims | | | 71,101 | |
Total assets | | | 1,638,951,602 | |
| | | | | |
Liabilities: |
Unfunded loan commitments, at value (Note 8) (proceeds $20,793) | | | 43,173 | |
Segregated cash due to broker | | | 1,650,000 | |
Unrealized depreciation on forward foreign currency exchange contracts | | | 168,389 | |
Payable for: |
Fund shares redeemed | | | 9,904,841 | |
Securities purchased | | | 3,506,821 | |
Distributions to shareholders | | | 1,056,338 | |
Management fees | | | 636,757 | |
Transfer agent/maintenance fees | | | 507,835 | |
Distribution and service fees | | | 175,248 | |
Fund accounting/administration fees | | | 105,241 | |
Trustees’ fees* | | | 21,309 | |
Due to Investment Adviser | | | 6 | |
Miscellaneous | | | 407,249 | |
Total liabilities | | | 18,183,207 | |
Net assets | | $ | 1,620,768,395 | |
Net assets consist of: |
Paid in capital | | $ | 1,743,009,749 | |
Total distributable earnings (loss) | | | (122,241,354 | ) |
Net assets | | $ | 1,620,768,395 | |
| | | | | |
A-Class: |
Net assets | | $ | 235,752,187 | |
Capital shares outstanding | | | 9,345,336 | |
Net asset value per share | | $ | 25.23 | |
Maximum offering price per share (Net asset value divided by 97.00%) | | $ | 26.01 | |
| | | | | |
C-Class: |
Net assets | | $ | 112,480,639 | |
Capital shares outstanding | | | 4,460,322 | |
Net asset value per share | | $ | 25.22 | |
| | | | | |
P-Class: |
Net assets | | $ | 135,035,920 | |
Capital shares outstanding | | | 5,350,792 | |
Net asset value per share | | $ | 25.24 | |
| | | | | |
Institutional Class: |
Net assets | | $ | 1,065,819,586 | |
Capital shares outstanding | | | 42,211,674 | |
Net asset value per share | | $ | 25.25 | |
| | | | | |
R6-Class: |
Net assets | | $ | 71,680,063 | |
Capital shares outstanding | | | 2,838,961 | |
Net asset value per share | | $ | 25.25 | |
* | Relates to Trustees not deemed “interested persons” within the meaning of Section 2(a)(19) of the 1940 Act. |
38 | THE GUGGENHEIM FUNDS ANNUAL REPORT | SEE NOTES TO FINANCIAL STATEMENTS. |
STATEMENT OF OPERATIONS |
FLOATING RATE STRATEGIES FUND |
Year Ended September 30, 2019
Investment Income: |
Dividends from securities of affiliated issuers | | $ | 186,644 | |
Interest from securities of unaffiliated issuers | | | 130,323,186 | |
Interest from securities of affiliated issuers | | | 312,404 | |
Total investment income | | | 130,822,234 | |
| | | | | |
Expenses: |
Management fees | | | 15,012,189 | |
Distribution and service fees: |
A-Class | | | 780,054 | |
C-Class | | | 1,414,106 | |
P-Class | | | 710,056 | |
Transfer agent/maintenance fees: |
A-Class | | | 480,201 | |
C-Class | | | 156,395 | |
P-Class | | | 427,848 | |
Institutional Class | | | 1,564,134 | |
R6-Class | | | 127 | |
Fund accounting/administration fees | | | 1,847,672 | |
Line of credit fees | | | 824,113 | |
Interest expense | | | 275,000 | |
Custodian fees | | | 162,952 | |
Trustees’ fees* | | | 93,953 | |
Miscellaneous | | | 753,560 | |
Recoupment of previously waived fees: |
R6-Class | | | 6 | |
Total expenses | | | 24,502,366 | |
Less: |
Expenses reimbursed by Adviser: |
A-Class | | | (468,428 | ) |
C-Class | | | (160,509 | ) |
P-Class | | | (414,187 | ) |
Institutional Class | | | (1,335,250 | ) |
R6-Class | | | (37 | ) |
Expenses waived by Adviser | | | (74,316 | ) |
Earnings credits applied | | | (116,410 | ) |
Total waived/reimbursed expenses | | | (2,569,137 | ) |
Net expenses | | | 21,933,229 | |
Net investment income | | | 108,889,005 | |
Net Realized and Unrealized Gain (Loss): |
Net realized gain (loss) on: |
Investments in unaffiliated issuers | | $ | (57,447,856 | ) |
Investments in affiliated issuers | | | (2,182,380 | ) |
Distributions received from affiliated investment companies | | | 10,651 | |
Forward foreign currency exchange contracts | | | 18,132,159 | |
Foreign currency transactions | | | (222,053 | ) |
Net realized loss | | | (41,709,479 | ) |
Net change in unrealized appreciation (depreciation) on: |
Investments in unaffiliated issuers | | | (42,304,674 | ) |
Investments in affiliated issuers | | | 1,036,383 | |
Forward foreign currency exchange contracts | | | 1,989,998 | |
Foreign currency translations | | | (75,301 | ) |
Net change in unrealized appreciation (depreciation) | | | (39,353,594 | ) |
Net realized and unrealized loss | | | (81,063,073 | ) |
Net increase in net assets resulting from operations | | $ | 27,825,932 | |
* | Relates to Trustees not deemed “interested persons” within the meaning of Section 2(a)(19) of the 1940 Act. |
SEE NOTES TO FINANCIAL STATEMENTS. | THE GUGGENHEIM FUNDS ANNUAL REPORT | 39 |
STATEMENTS OF CHANGES IN NET ASSETS |
FLOATING RATE STRATEGIES FUND | |
| | Year Ended
September 30,
2019 | | | Year Ended
September 30,
2018 | |
Increase (Decrease) in Net Assets from Operations: | | | | | | | | |
Net investment income | | $ | 108,889,005 | | | $ | 143,792,027 | |
Net realized gain (loss) on investments | | | (41,709,479 | ) | | | 20,095,310 | |
Net change in unrealized appreciation (depreciation) on investments | | | (39,353,594 | ) | | | (31,396,838 | ) |
Net increase in net assets resulting from operations | | | 27,825,932 | | | | 132,490,499 | |
| | | | | | | | | |
Distributions to shareholders: | | | | | | | | |
A-Class | | | (14,640,261 | ) | | | (19,328,895 | ) |
C-Class | | | (5,587,635 | ) | | | (6,226,360 | ) |
P-Class | | | (13,322,706 | ) | | | (14,036,610 | ) |
Institutional Class | | | (75,137,743 | ) | | | (105,692,526 | ) |
R6-Class* | | | (2,302,137 | ) | | | — | |
Total distributions to shareholders | | | (110,990,482 | ) | | | (145,284,391 | ) |
| | | | | | | | | |
Capital share transactions: | | | | | | | | |
Proceeds from sale of shares | | | | | | | | |
A-Class | | | 60,624,023 | | | | 174,750,198 | |
C-Class | | | 14,215,093 | | | | 25,524,875 | |
P-Class | | | 97,670,860 | | | | 196,163,250 | |
Institutional Class | | | 594,221,256 | | | | 993,737,991 | |
R6-Class* | | | 87,641,260 | | | | — | |
Distributions reinvested | | | | | | | | |
A-Class | | | 12,049,838 | | | | 15,899,450 | |
C-Class | | | 4,283,336 | | | | 4,861,463 | |
P-Class | | | 13,315,826 | | | | 13,987,188 | |
Institutional Class | | | 60,508,720 | | | | 85,084,696 | |
R6-Class* | | | 2,301,889 | | | | — | |
Cost of shares redeemed | | | | | | | | |
A-Class | | | (257,341,946 | ) | | | (292,303,519 | ) |
C-Class | | | (74,471,779 | ) | | | (60,834,101 | ) |
P-Class | | | (351,356,453 | ) | | | (184,687,809 | ) |
Institutional Class | | | (1,759,648,479 | ) | | | (1,431,785,517 | ) |
R6-Class* | | | (17,825,386 | ) | | | — | |
Net decrease from capital share transactions | | | (1,513,811,942 | ) | | | (459,601,835 | ) |
Net decrease in net assets | | | (1,596,976,492 | ) | | | (472,395,727 | ) |
| | | | | | | | | |
Net assets: | | | | | | | | |
Beginning of year | | | 3,217,744,887 | | | | 3,690,140,614 | |
End of year | | $ | 1,620,768,395 | | | $ | 3,217,744,887 | |
40 | THE GUGGENHEIM FUNDS ANNUAL REPORT | SEE NOTES TO FINANCIAL STATEMENTS. |
STATEMENTS OF CHANGES IN NET ASSETS (concluded) |
FLOATING RATE STRATEGIES FUND | |
| | Year Ended
September 30,
2019 | | | Year Ended
September 30,
2018 | |
Capital share activity: | | | | | | | | |
Shares sold | | | | | | | | |
A-Class | | | 2,381,654 | | | | 6,734,757 | |
C-Class | | | 559,608 | | | | 983,543 | |
P-Class | | | 3,847,865 | | | | 7,564,336 | |
Institutional Class | | | 23,392,664 | | | | 38,250,771 | |
R6-Class* | | | 3,453,140 | | | | — | |
Shares issued from reinvestment of distributions | | | | | | | | |
A-Class | | | 475,414 | | | | 613,005 | |
C-Class | | | 169,122 | | | | 187,516 | |
P-Class | | | 525,337 | | | | 539,448 | |
Institutional Class | | | 2,385,506 | | | | 3,277,180 | |
R6-Class* | | | 90,637 | | | | — | |
Shares redeemed | | | | | | | | |
A-Class | | | (10,159,897 | ) | | | (11,264,301 | ) |
C-Class | | | (2,940,946 | ) | | | (2,344,621 | ) |
P-Class | | | (13,879,455 | ) | | | (7,112,156 | ) |
Institutional Class | | | (69,438,343 | ) | | | (55,157,087 | ) |
R6-Class* | | | (704,816 | ) | | | — | |
Net decrease in shares | | | (59,842,510 | ) | | | (17,727,609 | ) |
* | Since commencement of operations: March 13, 2019. |
SEE NOTES TO FINANCIAL STATEMENTS. | THE GUGGENHEIM FUNDS ANNUAL REPORT | 41 |
FINANCIAL HIGHLIGHTS |
FLOATING RATE STRATEGIES FUND | |
This table is presented to show selected data for a share outstanding throughout each period and to assist shareholders in evaluating a Fund’s performance for the periods presented.
A-Class | | Year
Ended
Sept. 30,
2019 | | | Year
Ended
Sept. 30,
2018 | | | Year
Ended
Sept. 30,
2017 | | | Year
Ended
Sept. 30,
2016 | | | Year
Ended
Sept. 30,
2015 | |
Per Share Data | | | | | | | | | | | | | | | | | | | | |
Net asset value, beginning of period | | $ | 25.92 | | | $ | 26.01 | | | $ | 25.92 | | | $ | 25.88 | | | $ | 26.52 | |
Income (loss) from investment operations: |
Net investment income (loss)a | | | 1.17 | | | | 1.04 | | | | .93 | | | | .99 | | | | 1.04 | |
Net gain (loss) on investments (realized and unrealized) | | | (.67 | ) | | | (.07 | ) | | | .10 | | | | .12 | | | | (.42 | ) |
Total from investment operations | | | .50 | | | | .97 | | | | 1.03 | | | | 1.11 | | | | .62 | |
Less distributions from: |
Net investment income | | | (1.19 | ) | | | (1.06 | ) | | | (.94 | ) | | | (1.07 | ) | | | (1.18 | ) |
Net realized gains | | | — | | | | — | | | | — | | | | — | | | | (.08 | ) |
Total distributions | | | (1.19 | ) | | | (1.06 | ) | | | (.94 | ) | | | (1.07 | ) | | | (1.26 | ) |
Net asset value, end of period | | $ | 25.23 | | | $ | 25.92 | | | $ | 26.01 | | | $ | 25.92 | | | $ | 25.88 | |
|
Total Returnb | | | 2.01 | % | | | 3.80 | % | | | 4.03 | % | | | 4.47 | % | | | 2.36 | % |
Ratios/Supplemental Data |
Net assets, end of period (in thousands) | | $ | 235,752 | | | $ | 431,562 | | | $ | 534,911 | | | $ | 452,611 | | | $ | 400,270 | |
Ratios to average net assets: |
Net investment income (loss) | | | 4.60 | % | | | 4.02 | % | | | 3.58 | % | | | 3.88 | % | | | 3.97 | % |
Total expensesc | | | 1.23 | % | | | 1.15 | % | | | 1.13 | % | | | 1.20 | % | | | 1.19 | % |
Net expensesd,e,f | | | 1.07 | % | | | 1.03 | % | | | 1.04 | % | | | 1.03 | % | | | 1.03 | % |
Portfolio turnover rate | | | 10 | % | | | 33 | % | | | 44 | % | | | 35 | % | | | 44 | % |
42 | THE GUGGENHEIM FUNDS ANNUAL REPORT | SEE NOTES TO FINANCIAL STATEMENTS. |
FINANCIAL HIGHLIGHTS (continued) |
FLOATING RATE STRATEGIES FUND | |
This table is presented to show selected data for a share outstanding throughout each period and to assist shareholders in evaluating a Fund’s performance for the periods presented.
C-Class | | Year
Ended
Sept. 30,
2019 | | | Year
Ended
Sept. 30,
2018 | | | Year
Ended
Sept. 30,
2017 | | | Year
Ended
Sept. 30,
2016 | | | Year
Ended
Sept. 30,
2015 | |
Per Share Data | | | | | | | | | | | | | | | | | | | | |
Net asset value, beginning of period | | $ | 25.91 | | | $ | 26.00 | | | $ | 25.91 | | | $ | 25.87 | | | $ | 26.51 | |
Income (loss) from investment operations: |
Net investment income (loss)a | | | .98 | | | | .85 | | | | .74 | | | | .80 | | | | .85 | |
Net gain (loss) on investments (realized and unrealized) | | | (.67 | ) | | | (.07 | ) | | | .10 | | | | .12 | | | | (.43 | ) |
Total from investment operations | | | .31 | | | | .78 | | | | .84 | | | | .92 | | | | .42 | |
Less distributions from: |
Net investment income | | | (1.00 | ) | | | (.87 | ) | | | (.75 | ) | | | (.88 | ) | | | (.98 | ) |
Net realized gains | | | — | | | | — | | | | — | | | | — | | | | (.08 | ) |
Total distributions | | | (1.00 | ) | | | (.87 | ) | | | (.75 | ) | | | (.88 | ) | | | (1.06 | ) |
Net asset value, end of period | | $ | 25.22 | | | $ | 25.91 | | | $ | 26.00 | | | $ | 25.91 | | | $ | 25.87 | |
|
Total Returnb | | | 1.26 | % | | | 3.03 | % | | | 3.26 | % | | | 3.68 | % | | | 1.63 | % |
Ratios/Supplemental Data |
Net assets, end of period (in thousands) | | $ | 112,481 | | | $ | 172,906 | | | $ | 204,008 | | | $ | 197,296 | | | $ | 145,808 | |
Ratios to average net assets: |
Net investment income (loss) | | | 3.86 | % | | | 3.29 | % | | | 2.83 | % | | | 3.13 | % | | | 3.23 | % |
Total expensesc | | | 1.93 | % | | | 1.87 | % | | | 1.83 | % | | | 1.93 | % | | | 1.91 | % |
Net expensesd,e,f | | | 1.82 | % | | | 1.78 | % | | | 1.79 | % | | | 1.78 | % | | | 1.78 | % |
Portfolio turnover rate | | | 10 | % | | | 33 | % | | | 44 | % | | | 35 | % | | | 44 | % |
SEE NOTES TO FINANCIAL STATEMENTS. | THE GUGGENHEIM FUNDS ANNUAL REPORT | 43 |
FINANCIAL HIGHLIGHTS (continued) |
FLOATING RATE STRATEGIES FUND | |
This table is presented to show selected data for a share outstanding throughout each period and to assist shareholders in evaluating a Fund’s performance for the periods presented.
P-Class | | Year
Ended
Sept. 30,
2019 | | | Year
Ended
Sept. 30,
2018 | | | Year
Ended
Sept. 30,
2017 | | | Year
Ended
Sept. 30,
2016 | | | Period
Ended
Sept. 30,
2015g | |
Per Share Data | | | | | | | | | | | | | | | | | | | | |
Net asset value, beginning of period | | $ | 25.93 | | | $ | 26.02 | | | $ | 25.93 | | | $ | 25.89 | | | $ | 26.37 | |
Income (loss) from investment operations: |
Net investment income (loss)a | | | 1.17 | | | | 1.05 | | | | .94 | | | | .99 | | | | .40 | |
Net gain (loss) on investments (realized and unrealized) | | | (.67 | ) | | | (.08 | ) | | | .09 | | | | .12 | | | | (.46 | ) |
Total from investment operations | | | .50 | | | | .97 | | | | 1.03 | | | | 1.11 | | | | (.06 | ) |
Less distributions from: |
Net investment income | | | (1.19 | ) | | | (1.06 | ) | | | (.94 | ) | | | (1.07 | ) | | | (.42 | ) |
Total distributions | | | (1.19 | ) | | | (1.06 | ) | | | (.94 | ) | | | (1.07 | ) | | | (.42 | ) |
Net asset value, end of period | | $ | 25.24 | | | $ | 25.93 | | | $ | 26.02 | | | $ | 25.93 | | | $ | 25.89 | |
|
Total Return | | | 2.01 | % | | | 3.80 | % | | | 4.03 | % | | | 4.46 | % | | | (0.24 | %) |
Ratios/Supplemental Data |
Net assets, end of period (in thousands) | | $ | 135,036 | | | $ | 385,306 | | | $ | 360,829 | | | $ | 124,974 | | | $ | 20,536 | |
Ratios to average net assets: |
Net investment income (loss) | | | 4.59 | % | | | 4.05 | % | | | 3.59 | % | | | 3.86 | % | | | 3.68 | % |
Total expensesc | | | 1.22 | % | | | 1.15 | % | | | 1.16 | % | | | 1.06 | % | | | 1.04 | % |
Net expensesd,e,f | | | 1.07 | % | | | 1.03 | % | | | 1.03 | % | | | 1.03 | % | | | 1.02 | % |
Portfolio turnover rate | | | 10 | % | | | 33 | % | | | 44 | % | | | 35 | % | | | 44 | % |
44 | THE GUGGENHEIM FUNDS ANNUAL REPORT | SEE NOTES TO FINANCIAL STATEMENTS. |
FINANCIAL HIGHLIGHTS (continued) |
FLOATING RATE STRATEGIES FUND | |
This table is presented to show selected data for a share outstanding throughout each period and to assist shareholders in evaluating a Fund’s performance for the periods presented.
Institutional Class | | Year
Ended
Sept. 30,
2019 | | | Year
Ended
Sept. 30,
2018 | | | Year
Ended
Sept. 30,
2017 | | | Year
Ended
Sept. 30,
2016 | | | Year
Ended
Sept. 30,
2015 | |
Per Share Data | | | | | | | | | | | | | | | | | | | | |
Net asset value, beginning of period | | $ | 25.95 | | | $ | 26.03 | | | $ | 25.94 | | | $ | 25.90 | | | $ | 26.54 | |
Income (loss) from investment operations: |
Net investment income (loss)a | | | 1.23 | | | | 1.11 | | | | 1.00 | | | | 1.05 | | | | 1.10 | |
Net gain (loss) on investments (realized and unrealized) | | | (.68 | ) | | | (.07 | ) | | | .10 | | | | .12 | | | | (.42 | ) |
Total from investment operations | | | .55 | | | | 1.04 | | | | 1.10 | | | | 1.17 | | | | .68 | |
Less distributions from: |
Net investment income | | | (1.25 | ) | | | (1.12 | ) | | | (1.01 | ) | | | (1.13 | ) | | | (1.24 | ) |
Net realized gains | | | — | | | | — | | | | — | | | | — | | | | (.08 | ) |
Total distributions | | | (1.25 | ) | | | (1.12 | ) | | | (1.01 | ) | | | (1.13 | ) | | | (1.32 | ) |
Net asset value, end of period | | $ | 25.25 | | | $ | 25.95 | | | $ | 26.03 | | | $ | 25.94 | | | $ | 25.90 | |
|
Total Return | | | 2.21 | % | | | 4.08 | % | | | 4.28 | % | | | 4.71 | % | | | 2.59 | % |
Ratios/Supplemental Data |
Net assets, end of period (in thousands) | | $ | 1,065,820 | | | $ | 2,227,970 | | | $ | 2,590,393 | | | $ | 1,643,932 | | | $ | 1,231,352 | |
Ratios to average net assets: |
Net investment income (loss) | | | 4.83 | % | | | 4.28 | % | | | 3.83 | % | | | 4.11 | % | | | 4.18 | % |
Total expensesc | | | 0.92 | % | | | 0.84 | % | | | 0.82 | % | | | 0.87 | % | | | 0.85 | % |
Net expensesd,e,f | | | 0.83 | % | | | 0.79 | % | | | 0.79 | % | | | 0.79 | % | | | 0.79 | % |
Portfolio turnover rate | | | 10 | % | | | 33 | % | | | 44 | % | | | 35 | % | | | 44 | % |
SEE NOTES TO FINANCIAL STATEMENTS. | THE GUGGENHEIM FUNDS ANNUAL REPORT | 45 |
FINANCIAL HIGHLIGHTS (continued) |
FLOATING RATE STRATEGIES FUND | |
This table is presented to show selected data for a share outstanding throughout each period and to assist shareholders in evaluating a Fund’s performance for the periods presented.
R6-Class | | Period
Ended
Sept. 30,
2019h | |
Per Share Data | | | | |
Net asset value, beginning of period | | $ | 25.38 | |
Income (loss) from investment operations: |
Net investment income (loss)a | | | .69 | |
Net gain (loss) on investments (realized and unrealized) | | | (.14 | ) |
Total from investment operations | | | .55 | |
Less distributions from: |
Net investment income | | | (.68 | ) |
Total distributions | | | (.68 | ) |
Net asset value, end of period | | $ | 25.25 | |
|
Total Return | | | 2.20 | % |
Ratios/Supplemental Data |
Net assets, end of period (in thousands) | | $ | 71,680 | |
Ratios to average net assets: |
Net investment income (loss) | | | 4.89 | % |
Total expensesc | | | 0.85 | % |
Net expensesd,e,f | | | 0.84 | % |
Portfolio turnover rate | | | 10 | % |
46 | THE GUGGENHEIM FUNDS ANNUAL REPORT | SEE NOTES TO FINANCIAL STATEMENTS. |
FINANCIAL HIGHLIGHTS (concluded) |
FLOATING RATE STRATEGIES FUND | |
a | Net investment income (loss) per share was computed using average shares outstanding throughout the period. |
b | Total return does not reflect the impact of any applicable sales charges. |
c | Does not include expenses of the underlying funds in which the Fund invests. |
d | Net expense information reflects the expense ratios after expense waivers and reimbursements, as applicable. |
e | The portion of the ratios of net expenses to average net assets attributable to recoupments of prior fee reductions or expense reimbursements for the periods presented was as follows: |
| | | 09/30/19 | 09/30/18 | 09/30/17 |
| | A-Class | — | — | — |
| | C-Class | — | 0.01% | — |
| | P-Class | — | — | — |
| | Institutional Class | — | — | 0.01% |
| | R6-Class | 0.00%* | N/A | N/A |
f | Net expenses may include expenses that are excluded from the expense limitation agreement. Excluding these expenses, the net expense ratios for the periods would be: |
| | | 09/30/19 | 09/30/18 | 09/30/17 | 09/30/16 | 09/30/15 |
| | A-Class | 1.02% | 1.02% | 1.02% | 1.02% | 1.02% |
| | C-Class | 1.77% | 1.77% | 1.77% | 1.77% | 1.77% |
| | P-Class | 1.02% | 1.02% | 1.02% | 1.02% | 1.01% |
| | Institutional Class | 0.78% | 0.78% | 0.78% | 0.78% | 0.78% |
| | R6-Classh | 0.78% | N/A | N/A | N/A | N/A |
g | Since commencement of operations: May 1, 2015. Percentage amounts for the period, except total return and portfolio turnover rate, have been annualized. |
h | Since commencement of operations: March 13, 2019. Percentage amounts for the period, except total return and portfolio turnover rate, have been annualized. |
SEE NOTES TO FINANCIAL STATEMENTS. | THE GUGGENHEIM FUNDS ANNUAL REPORT | 47 |
NOTES TO FINANCIAL STATEMENTS |
Note 1 – Organization and Significant Accounting Policies
Organization
Guggenheim Funds Trust (the “Trust”), a Delaware statutory trust, is registered with the SEC under the Investment Company Act of 1940 (“1940 Act”), as an open-ended investment company of the series type. Each series, in effect, is representing a separate fund. The Trust is authorized to issue an unlimited number of no par value shares. The Trust accounts for the assets of each fund separately.
The Trust offers a combination of five separate classes of shares, A-Class shares, C-Class shares, P-Class shares, R6-Class shares and Institutional Class shares. Sales of shares of each Class are made without a front-end sales charge at the net asset value per share (“NAV”), with the exception of A-Class shares. A-Class shares are sold at the NAV, plus the applicable front-end sales charge. The sales charge varies depending on the amount purchased. A-Class share purchases of $1 million or more are exempt from the front-end sales charge but have a 1% contingent deferred sales charge (“CDSC”), if shares are redeemed within 12 months of purchase. C-Class shares have a 1% CDSC if shares are redeemed within 12 months of purchase. C-Class shares of the Fund automatically convert to A-Class shares on or about the 10th day of the month following the 10-year anniversary of the purchase of the C-Class shares. This conversion will be executed without any sales charge, fee or other charge. After the conversion is completed, the shares will be subject to all features and expenses of A-Class shares. Institutional Class shares are offered primarily for direct investment by institutions such as pension and profit sharing plans, endowments, foundations and corporations. Institutional Class shares require a minimum initial investment of $2 million and a minimum account balance of $1 million. R6-Class shares are offered primarily through qualified retirement and benefit plans. R6-Class shares are also offered through certain other plans and platforms sponsored by financial intermediaries. Certain institutional investors and others deemed appropriate by Guggenheim Investments (“GI”) may also be eligible to purchase R6-Class shares subject to a $2 million minimum initial investment. At September 30, 2019, the Trust consisted of twenty funds (the “Funds”).
This report covers the Floating Rate Strategies Fund (the “Fund”), a diversified investment company. At September 30, 2019, A-Class, C-Class, P-Class, Institutional Class and R6-Class shares had been issued by the Fund.
Guggenheim Partners Investment Management, LLC (“GPIM”), which operates under the name Guggenheim Investments, provides advisory services. Guggenheim Funds Distributors, LLC (“GFD”) acts as principal underwriter for the Trust. GI and GFD are affiliated entities.
Significant Accounting Policies
The Fund operates as an investment company and, accordingly, follows the investment company accounting and reporting guidance of the Financial Accounting Standards Board (“FASB”) Accounting Standards Codification Topic 946 Financial Services – Investment Companies.
48 | THE GUGGENHEIM FUNDS ANNUAL REPORT | |
NOTES TO FINANCIAL STATEMENTS (continued) |
The following significant accounting policies are in conformity with U.S. generally accepted accounting principles (“U.S. GAAP”) and are consistently followed by the Trust. This requires management to make estimates and assumptions that affect the reported amount of assets and liabilities, contingent assets and liabilities at the date of the financial statements, and the reported amounts of revenues and expenses during the reporting period. Actual results could differ from these estimates. All time references are based on Eastern Time.
The NAV of each Class of the Fund is calculated by dividing the market value of the Fund’s securities and other assets, less all liabilities, attributable to the Class by the number of outstanding shares of the Class.
(a) Valuation of Investments
The Board of Trustees of the Fund (the “Board”) has adopted policies and procedures for the valuation of the Fund’s investments (the “Valuation Procedures”). Pursuant to the Valuation Procedures, the Board has delegated to a valuation committee, consisting of representatives from Guggenheim’s investment management, fund administration, legal and compliance departments (the “Valuation Committee”), the day-to-day responsibility for implementing the Valuation Procedures, including, under most circumstances, the responsibility for determining the fair value of the Fund’s securities and/or other assets.
Valuations of the Fund’s securities are supplied primarily by pricing services appointed pursuant to the processes set forth in the Valuation Procedures. The Valuation Committee convenes monthly, or more frequently as needed, to review the valuation of all assets which have been fair valued for reasonableness. The Fund’s officers, through the Valuation Committee and consistent with the monitoring and review responsibilities set forth in the Valuation Procedures, regularly review procedures used and valuations provided by the pricing services.
If the pricing service cannot or does not provide a valuation for a particular investment or such valuation is deemed unreliable, such investment is fair valued by the Valuation Committee.
Equity securities listed or traded on a recognized U.S. securities exchange or the National Association of Securities Dealers Automated Quotations (“NASDAQ”) National Market System shall generally be valued on the basis of the last sale price on the primary U.S. exchange or market on which the security is listed or traded; provided, however, that securities listed on NASDAQ will be valued at the NASDAQ Official Closing Price, which may not necessarily represent the last sale price. If there is no sale on the valuation date, exchange-traded U.S. equity securities will be valued on the basis of the last bid price.
Generally, trading in foreign securities markets is substantially completed each day at various times prior to the close of the New York Stock Exchange (“NYSE”). The values of foreign securities are determined as of the close of such foreign markets or the close of the NYSE, if earlier. All investments quoted in foreign currencies are valued in U.S. dollars on the basis of the foreign currency exchange rates prevailing at the close of U.S. business at 4:00 p.m. Investments
| | THE GUGGENHEIM FUNDS ANNUAL REPORT | 49 |
NOTES TO FINANCIAL STATEMENTS (continued) |
in foreign securities may involve risks not present in domestic investments. The Valuation Committee will determine the current value of such foreign securities by taking into consideration certain factors which may include those discussed above, as well as the following factors, among others: the value of the securities traded on other foreign markets, ADR trading, closed-end fund trading, foreign currency exchange activity, and the trading prices of financial products that are tied to foreign securities. In addition, under the Valuation Procedures, the Valuation Committee and GI are authorized to use prices and other information supplied by a third party pricing vendor in valuing foreign securities.
Open-end investment companies are valued at their NAV as of the close of business, on the valuation date.
Debt securities with a maturity of greater than 60 days at acquisition are valued at prices that reflect broker-dealer supplied valuations or are obtained from independent pricing services, which may consider the trade activity, treasury spreads, yields or price of bonds of comparable quality, coupon, maturity, and type, as well as prices quoted by dealers who make markets in such securities. Short-term debt securities with a maturity of 60 days or less at acquisition are valued at amortized cost, provided such amount approximates market value. Money market funds are valued at their NAV.
Typically, loans are valued using information provided by an independent third party pricing service which uses broker quotes. If the pricing service cannot or does not provide a valuation for a particular loan, or such valuation is deemed unreliable, such investment is fair valued by the Valuation Committee.
Forward foreign currency exchange contracts are valued daily based on the applicable exchange rate of the underlying currency.
Investments for which market quotations are not readily available are fair-valued as determined in good faith by GI, subject to review and approval by the Valuation Committee, pursuant to methods established or ratified by the Board. Valuations in accordance with these methods are intended to reflect each security’s (or asset’s or liability’s) “fair value”. Each such determination is based on a consideration of all relevant factors, which are likely to vary from one pricing context to another. Examples of such factors may include, but are not limited to market prices; sale prices; broker quotes; and models which derive prices based on inputs such as prices of securities with comparable maturities and characteristics, or based on inputs such as anticipated cash flows or collateral, spread over U.S. Treasury securities, and other information analysis.
In connection with futures contracts and other derivative investments, such factors may include obtaining information as to how (a) these contracts and other derivative investments trade in the futures or other derivative markets, respectively, and (b) the securities underlying these contracts and other derivative investments trade in the cash market.
50 | THE GUGGENHEIM FUNDS ANNUAL REPORT | |
NOTES TO FINANCIAL STATEMENTS (continued) |
(b) Senior Floating Rate Interests
Senior floating rate interests in which the Trust invests generally pay interest rates which are periodically adjusted by reference to a base short-term floating rate, plus a premium. These base lending rates are generally (i) the lending rate offered by one or more major European banks, such as the one-month or three-month London Inter-Bank Offered Rate (“LIBOR”), (ii) the prime rate offered by one or more major United States banks, or (iii) the bank’s certificate of deposit rate. Senior floating rate interests often require prepayments from excess cash flows or permit the borrower to repay at its election. The rate at which the borrower repays cannot be predicted with accuracy. As a result, the actual remaining maturity may be substantially less than the stated maturities disclosed in the Fund’s Schedule of Investments. The interest rate indicated is the rate in effect at September 30, 2019.
(c) Interests in When-Issued Securities
The Fund may purchase and sell interests in securities on a when-issued and delayed delivery basis, with payment and delivery scheduled for a future date. No income accrues to the Fund on such interests or securities in connection with such transactions prior to the date the Fund actually take delivery of such interests or securities. These transactions are subject to market fluctuations and are subject to the risk that the value at delivery may be more or less than the trade date purchase price. Although the Fund will generally purchase these securities with the intention of acquiring such securities, they may sell such securities before the settlement date.
(d) Currency Translations
The accounting records of the Fund are maintained in U.S. dollars. All assets and liabilities initially expressed in foreign currencies are converted into U.S. dollars at prevailing exchange rates. Purchases and sales of investment securities, dividend and interest income, and certain expenses are translated at the rates of exchange prevailing on the respective dates of such transactions. Changes in the relationship of these foreign currencies to the U.S. dollar can significantly affect the value of the investments and earnings of the Fund. Foreign investments may also subject the Fund to foreign government exchange restrictions, expropriation, taxation, or other political, social or economic developments, all of which could affect the market and/or credit risk of the investments.
The Fund does not isolate that portion of the results of operations resulting from changes in the foreign exchange rates on investments from the fluctuations arising from changes in the market prices of securities held. Such fluctuations are included with the net realized gain or loss and unrealized appreciation or depreciation on investments.
Reported net realized foreign exchange gains and losses arise from sales of foreign currencies and currency gains or losses realized between the trade and settlement dates on investment transactions. Net unrealized exchange appreciation and depreciation arise from changes in the fair values of assets and liabilities other than investments in securities at the fiscal period end, resulting from changes in exchange rates.
| | THE GUGGENHEIM FUNDS ANNUAL REPORT | 51 |
NOTES TO FINANCIAL STATEMENTS (continued) |
(e) Forward Foreign Currency Exchange Contracts
The change in value of a forward foreign currency exchange contract is recorded as unrealized appreciation or depreciation until the contract is closed. When the contract is closed, the Fund records a realized gain or loss equal to the difference between the value at the time the contract was opened and the value at the time it was closed.
(f) Foreign Taxes
The Fund may be subject to foreign taxes (a portion of which may be reclaimable) on income, stock dividends, capital gains on investments or certain foreign currency transactions. All foreign taxes are recorded in accordance with the applicable foreign tax regulations and rates that exist in the foreign jurisdictions in which the Fund invests. These foreign taxes, if any, are paid by the Fund and reflected in its Statement of Operations as follows: foreign taxes withheld at source are presented as a reduction of income and foreign taxes on capital gains from sales of investments are included with the net realized gain (loss) on investments. Foreign taxes payable or deferred as of September 30, 2019, if any, are disclosed in the Fund’s Statement of Assets and Liabilities.
(g) Security Transactions
Security transactions are recorded on the trade date for financial reporting purposes. Realized gains and losses from securities transactions are recorded using the identified cost basis. Proceeds from lawsuits related to investment holdings are recorded as a reduction to cost if the securities are still held and as realized gains if no longer held in the Fund. Dividend income is recorded on the ex-dividend date, net of applicable taxes withheld by foreign countries. Taxable non-cash dividends are recorded as dividend income. Interest income, including amortization of premiums and accretion of discounts, is accrued on a daily basis. Interest income also includes paydown gains and losses on mortgage-backed and asset-backed securities and senior and subordinated loans. Amendment fees are earned as compensation for evaluating and accepting changes to the original loan agreement and are recognized when received. Dividend income from Real Estate Investment Trusts (“REITs”) is recorded based on the income included in the distributions received from the REIT investments using published REIT classifications, including some management estimates when actual amounts are not available. Distributions received in excess of this estimated amount are recorded as a reduction of the cost of investments or reclassified to realized gains. The actual amounts of income, return of capital, and realized gains are only determined by each REIT after its fiscal year-end, and may differ from the estimated amounts.
Income from residual collateralized loan obligations is recognized using the effective interest method. At the time of purchase, management estimates the future expected cash flows and determines the effective yield and estimated maturity date based on the estimated cash flows. Subsequent to the purchase, the estimated cash flows are updated periodically and a revised yield is calculated prospectively. Cash flows received in excess of the effective yield are reflected as a return of capital.
52 | THE GUGGENHEIM FUNDS ANNUAL REPORT | |
NOTES TO FINANCIAL STATEMENTS (continued) |
(h) Distributions
The Fund declares dividends from investment income daily. The Fund pays its shareholders from its net investment income monthly and distributes any net capital gains that it has realized, at least annually. Distributions to shareholders are recorded on the ex-dividend date. Dividends are reinvested in additional shares unless shareholders request payment in cash. The character of distributions made during the year from net investment income or net realized gains may differ from their ultimate characterization for federal income tax purposes.
(i) Class Allocations
Interest and dividend income, most expenses, all realized gains and losses, and all unrealized appreciation and depreciation are allocated to the classes based upon the value of the outstanding shares in each Class. Certain costs, such as distribution and service fees are charged directly to specific classes. In addition, certain expenses have been allocated to the individual Funds in the Trust based on the respective net assets of each Fund included in the Trust.
(j) Earnings Credits
Under the fee arrangement with the custodian, the Fund may earn credits based on overnight custody cash balances. These credits are utilized to reduce related custodial expenses. The custodian fees disclosed in the Statement of Operations are before the reduction in expense from the related earnings credits, if any. Earnings credits for the year ended September 30, 2019, are disclosed in the Statement of Operations.
(k) Cash
The Fund may leave cash overnight in its cash account with the custodian. Periodically, the Fund may have cash due to the custodian bank as an overdraft balance. A fee is incurred on this overdraft, calculated by multiplying the overdraft by a rate based on the federal funds rate, which was 1.90% at September 30, 2019.
(l) Indemnifications
Under the Fund’s organizational documents, its Trustees and Officers are indemnified against certain liabilities arising out of the performance of their duties to the Trust. In addition, throughout the normal course of business, the Fund enters into contracts that contain a variety of representations and warranties which provide general indemnifications. The Fund’s maximum exposure under these arrangements is unknown, as this would involve future claims that may be made against the Fund and/or its affiliates that have not yet occurred. However, based on experience, the Fund expects the risk of loss to be remote.
| | THE GUGGENHEIM FUNDS ANNUAL REPORT | 53 |
NOTES TO FINANCIAL STATEMENTS (continued) |
Note 2 – Derivatives
As part of its investment strategy, the Fund utilizes a variety of derivative instruments. These investments involve, to varying degrees, elements of market risk and risks in excess of amounts recognized in the Statement of Assets and Liabilities. Valuation and accounting treatment of these instruments can be found under Significant Accounting Policies in Note 1 of these Notes to Financial Statements.
Derivatives are instruments whose values depend on, or are derived from, in whole or in part, the value of one or more other assets, such as securities, currencies, commodities or indices. Derivative instruments may be used to increase investment flexibility (including to maintain cash reserves while maintaining exposure to certain other assets), for risk management (hedging) purposes, to facilitate trading, to reduce transaction costs and to pursue higher investment returns. Derivative instruments may also be used to mitigate certain investment risks, such as foreign currency exchange rate risk, interest rate risk and credit risk. U.S. GAAP requires disclosures to enable investors to better understand how and why a Fund uses derivative instruments, how these derivative instruments are accounted for and their effects on the Fund’s financial position and results of operations.
The Fund utilized derivatives for the following purpose:
Hedge: an investment made in order to reduce the risk of adverse price movements in a security, by taking an offsetting position to protect against broad market moves.
Forward Foreign Currency Exchange Contracts
A forward foreign currency exchange contract is an agreement between two parties to exchange two designated currencies at a specific time in the future. Certain types of contracts may be cash settled, in an amount equal to the change in exchange rates during the term of the contract. The contracts can be used to hedge or manage exposure to foreign currency risks with portfolio investments or to gain exposure to foreign currencies.
The market value of a forward foreign currency exchange contract changes with fluctuations in foreign currency exchange rates. Furthermore, the Fund may be exposed to risk if the counterparties cannot meet the contract terms or if the currency value changes unfavorably as compared to the U.S. dollar.
The following table represents the Fund’s use, and volume of forward foreign currency exchange contracts on a monthly basis:
| | | Average Value | |
Use | | Purchased | | | Sold | |
Hedge | | $ | 6,705,725 | | | $ | 243,250,323 | |
54 | THE GUGGENHEIM FUNDS ANNUAL REPORT | |
NOTES TO FINANCIAL STATEMENTS (continued) |
Derivative Investment Holdings Categorized by Risk Exposure
The following is a summary of the location of derivative investments on the Fund’s Statement of Assets and Liabilities as of September 30, 2019:
Derivative Investment Type | Asset Derivatives | Liability Derivatives |
Currency contracts | Unrealized appreciation on forward foreign currency exchange contracts | Unrealized depreciation on forward foreign currency exchange contracts |
The following table sets forth the fair value of the Fund’s derivative investments categorized by primary risk exposure at September 30, 2019:
| Primary Risk Exposure | | Forward Foreign Currency
Exchange Risk | |
Asset Derivative Investments Value | Foreign exchange risk | | $ | 2,245,960 | |
Liability Derivative Investments Value | Foreign exchange risk | | $ | 168,389 | |
The following is a summary of the location of derivative investments on the Fund’s Statement of Operations for the year ended September 30, 2019:
Derivative Investment Type | Location of Gain (Loss) on Derivatives |
Currency contracts | Net realized gain (loss) on forward foreign currency exchange contracts |
| Net change in unrealized appreciation (depreciation) on forward foreign currency exchange contracts |
The following is a summary of the Fund’s realized gain (loss) and change in unrealized appreciation (depreciation) on derivative investments recognized on the Statement of Operations categorized by primary risk exposure for the year ended September 30, 2019:
Realized Gain (Loss) on Derivative Investments Recognized on the Statement of Operations |
Primary Risk Exposure | | Forward Foreign Currency
Exchange Risk | |
Foreign exchange risk | | $ | 18,132,159 | |
Change in Unrealized Appreciation (Depreciation) on Derivative Investments Recognized on the Statement of Operations |
Primary Risk Exposure | | Forward Foreign Currency
Exchange Risk | |
Foreign exchange risk | | $ | 1,989,998 | |
| | THE GUGGENHEIM FUNDS ANNUAL REPORT | 55 |
NOTES TO FINANCIAL STATEMENTS (continued) |
In conjunction with the use of derivative instruments, the Fund is required to maintain collateral in various forms. Depending on the financial instrument utilized and the broker involved, the Fund uses margin deposits at the broker, cash and/or securities segregated at the custodian bank, discount notes or repurchase agreements allocated to the Fund as collateral.
The Trust has established counterparty credit guidelines and enters into transactions only with financial institutions of investment grade or better. The Trust monitors the counterparty credit risk.
Note 3 – Offsetting
In the normal course of business, the Fund enters into transactions subject to enforceable master netting arrangements or other similar arrangements. Generally, the right to offset in those agreements allows the Fund to counteract the exposure to a specific counterparty with collateral received from or delivered to that counterparty based on the terms of the arrangements. These arrangements provide for the right to liquidate upon the occurrence of an event of default, credit event upon merger or additional termination event.
In order to better define its contractual rights and to secure rights that will help the Fund mitigate its counterparty risk, the Fund may enter into an International Swaps and Derivatives Association, Inc. Master Agreement (“ISDA Master Agreement”) or similar agreement with its derivative contract counterparties. An ISDA Master Agreement is a bilateral agreement between a fund and a counterparty that governs OTC derivatives, including foreign exchange contracts, and typically contains, among other things, collateral posting terms and netting provisions in the event of a default and/or termination event. The provisions of the ISDA Master Agreement typically permit a single net payment in the event of a default (close-out netting) or similar event, including the bankruptcy or insolvency of the counterparty.
For derivatives traded under an ISDA Master Agreement, the collateral requirements are typically calculated by netting the mark-to-market amount for each transaction under such agreement and comparing that amount to the value of any collateral currently pledged by the Fund and the counterparty. For financial reporting purposes, cash collateral that has been pledged to cover obligations of the Fund and cash collateral received from the counterparty, if any, are reported separately on the Statement of Assets and Liabilities as segregated cash with broker/receivable for variation margin, or payable for swap settlement/variation margin. Cash and/or securities pledged or received as collateral by the Fund in connection with an OTC derivative subject to an ISDA Master Agreement generally may not be invested, sold or rehypothecated by the counterparty or the Fund, as applicable, absent an event of default under such agreement, in which case such collateral generally may be applied towards obligations due to and payable by such counterparty or the Fund, as applicable. Generally, the amount of collateral due from or to a counterparty must exceed a minimum transfer amount threshold (e.g., $300,000) before a transfer is required to be made. To the extent amounts due to the Fund from its counterparties are not fully collateralized, contractually or otherwise, the Fund bears the risk of loss from
56 | THE GUGGENHEIM FUNDS ANNUAL REPORT | |
NOTES TO FINANCIAL STATEMENTS (continued) |
counterparty nonperformance. The Fund attempts to mitigate counterparty risk by only entering into agreements with counterparties that they believe to be of good standing and by monitoring the financial stability of those counterparties.
For financial reporting purposes, the Fund does not offset derivative assets and derivative liabilities that are subject to netting arrangements in the Statement of Assets and Liabilities.
The following tables present derivative financial instruments and secured financing transactions that are subject to enforceable netting arrangements:
| | | | | | | | | | | | | | | Gross Amounts Not
Offset in the Statement
of Assets and Liabilities | | | | | |
Instrument | | Gross
Amounts of
Recognized
Assets | | | Gross
Amounts
Offset in the
Statement
of Assets and
Liabilities | | | Net Amount
of Assets
Presented
on the
Statement
of Assets and
Liabilities | | | Financial
Instruments | | | Cash
Collateral
Received | | | Net
Amount | |
Forward foreign currency exchange contracts | | $ | 2,245,960 | | | $ | — | | | $ | 2,245,960 | | | $ | — | | | $ | (1,650,000 | ) | | $ | 595,960 | |
| | | | | | | | | | | | | | | Gross Amounts Not
Offset in the Statement
of Assets and Liabilities | | | | | |
Instrument | | Gross
Amounts of
Recognized
Liabilities | | | Gross
Amounts
Offset in the
Statement
of Assets and
Liabilities | | | Net Amount
of Liabilities
Presented
on the
Statement
of Assets and
Liabilities | | | Financial
Instruments | | | Cash
Collateral
Pledged | | | Net
Amount | |
Forward foreign currency exchange contracts | | $ | 168,389 | | | $ | — | | | $ | 168,389 | | | $ | — | | | $ | — | | | $ | 168,389 | |
The Fund has the right to offset deposits against any related derivative liabilities outstanding with each counterparty with the exception of exchange-traded or centrally-cleared derivatives. The following table presents deposits held by others in connection with derivative investments as of September 30, 2019.
Counterparty | Asset Type | | Cash
Pledged | | | Cash
Received | |
Bank of America, N.A. | Forward currency contracts | | $ | — | | | $ | 1,650,000 | |
| | THE GUGGENHEIM FUNDS ANNUAL REPORT | 57 |
NOTES TO FINANCIAL STATEMENTS (continued) |
Note 4 – Fair Value Measurement
In accordance with U.S. GAAP, fair value is defined as the price that the Fund would receive to sell an investment or pay to transfer a liability in an orderly transaction with an independent buyer in the principal market, or in the absence of a principal market, the most advantageous market for the investment or liability. U.S. GAAP establishes a three-tier fair value hierarchy based on the types of inputs used to value assets and liabilities and requires corresponding disclosure. The hierarchy and the corresponding inputs are summarized below:
Level 1 — | quoted prices in active markets for identical assets or liabilities. |
Level 2 — | significant other observable inputs (for example quoted prices for securities that are similar based on characteristics such as interest rates, prepayment speeds, credit risk, etc.). |
Level 3 — | significant unobservable inputs based on the best information available under the circumstances, to the extent observable inputs are not available, which may include assumptions. |
The types of inputs available depend on a variety of factors, such as the type of security and the characteristics of the markets in which it trades, if any. Fair valuation determinations that rely on fewer or no observable inputs require greater judgment. Accordingly, fair value determinations for Level 3 securities require the greatest amount of judgment.
Independent pricing services are used to value a majority of the Fund’s investments. When values are not available from a pricing service, they will be determined using a variety of sources and techniques, including: market prices; broker quotes; and models which derive prices based on inputs such as prices of securities with comparable maturities and characteristics or based on inputs such as anticipated cash flows or collateral, spread over U.S. Treasury securities, and other information and analysis. A significant portion of the Fund’s assets and liabilities are categorized as Level 2, as indicated in this report.
Quotes from broker-dealers, adjusted for fluctuations in criteria such as credit spreads and interest rates, may also be used to value the Fund’s assets and liabilities, i.e. prices provided by a broker-dealer or other market participant who has not committed to trade at that price. Although quotes are typically received from established market participants, the Fund may not have the transparency to view the underlying inputs which support the market quotations. Significant changes in a quote would generally result in significant changes in the fair value of the security.
Certain fixed income securities are valued by obtaining a monthly quote from a broker-dealer, adjusted for fluctuations in criteria such as credit spreads and interest rates.
Certain loans and other securities are valued using a single daily broker quote or a price from a third party vendor based on a single daily or monthly broker quote.
58 | THE GUGGENHEIM FUNDS ANNUAL REPORT | |
NOTES TO FINANCIAL STATEMENTS (continued) |
The inputs or methodologies used for valuing securities are not necessarily an indication of the risk associated with investing in those securities. The suitability of the techniques and sources employed to determine fair valuation are regularly monitored and subject to change.
Note 5 – Investment Advisory Agreement and Other Agreements
Under the terms of an investment advisory contract, the Fund pays GI investment advisory fees calculated at an annualized rate of 0.65% of the average daily net assets of the Fund up to $5 billion; and 0.60% of the average daily net assets in excess of $5 billion.
GI engages external service providers to perform other necessary services for the Trust, such as audit and accounting related services, legal services, custody, printing and mailing, etc., on a pass-through basis. Such expenses are allocated to various Funds within the complex based on relative net assets.
The Fund has adopted Distribution Plans related to the offering of A-Class, C-Class and P-Class shares pursuant to Rule 12b-1 under the 1940 Act. The plans provide for payments at an annual rate of 0.25% of the average daily net assets of the Fund’s A-Class and P-Class shares, and 1.00% of the average daily net assets of the Fund’s C-Class shares.
The investment advisory contract for the Fund provides that the total expenses be limited to a percentage of average net assets for each class of shares, exclusive of brokerage costs, dividends on securities sold short, expenses of other investment companies in which a Fund invests, interest, taxes, litigation, indemnification and extraordinary expenses. The limits are listed below:
| Limit | Effective
Date | Contract
End Date |
A-Class | 1.02% | 11/30/12 | 02/01/21 |
C-Class | 1.77% | 11/30/12 | 02/01/21 |
P-Class | 1.02% | 05/01/15 | 02/01/21 |
Institutional Class | 0.78% | 11/30/12 | 02/01/21 |
R6-Class | 0.78%* | 03/13/19 | 02/01/21 |
* | Since the commencement of operations: March 13, 2019. |
GI is entitled to reimbursement by the Fund for fees waived or expenses reimbursed during any of the previous 36 months, beginning on the date of the expense limitation agreement, if on any day the estimated operating expenses are less than the indicated percentages. For purposes of this arrangement, GI is entitled to recoupment of previously waived fees or reimbursed expenses
| | THE GUGGENHEIM FUNDS ANNUAL REPORT | 59 |
NOTES TO FINANCIAL STATEMENTS (continued) |
for 36 months from the date of the waiver or reimbursement by GI. At September 30, 2019, the amount of fees waived or expenses reimbursed that are subject to recoupment and will expire during the years ended September 30, are presented in the following table:
| | 2020 | | | 2021 | | | 2022 | | | Fund
Total | |
A-Class | | $ | 506,871 | | | $ | 572,780 | | | $ | 478,648 | | | $ | 1,558,299 | |
C-Class | | | 104,116 | | | | 176,311 | | | | 165,085 | | | | 445,512 | |
P-Class | | | 320,727 | | | | 442,125 | | | | 423,256 | | | | 1,186,108 | |
Institutional Class | | | 819,172 | | | | 1,285,384 | | | | 1,382,501 | | | | 3,487,057 | |
R6-Class | | | — | | | | — | | | | 2,278 | | | | 2,278 | |
For the year ended September 30, 2019, GI recouped $6 from the Fund.
If the Fund invests in a fund that is advised by the same adviser or an affiliated adviser, the investing Fund’s adviser has agreed to waive fees at the investing fund level to the extent necessary to offset the proportionate share of any management fee paid by the Fund with respect to its investment in such affiliated fund. Fee waivers will be calculated at the investing Fund level without regard to any expense cap, if any, in effect for the investing Fund. Fees waived under this arrangement are not subject to reimbursement to GI. For the year ended September 30, 2019, the Fund waived $952 related to investments in affiliated funds.
For the year ended September 30, 2019, GFD retained sales charges of $286,511 relating to sales of A-Class shares of the Trust.
Certain trustees and officers of the Trust are also officers of GI and/or GFD. The Trust does not compensate its officers or trustees who are officers, directors and/or employees of GI or GFD.
MUFG Investor Services (US), LLC (“MUIS”) acts as the Fund’s administrator, transfer agent and accounting agent. As administrator, transfer agent and accounting agent, MUIS is responsible for maintaining the books and records of the Fund’s securities and cash. The Bank of New York Mellon Corp. (“BNY”) acts as the Fund’s custodian. As custodian, BNY is responsible for the custody of the Fund’s assets. For providing the aforementioned administrative and accounting services, MUIS is entitled to receive a monthly fee equal to a percentage of the Fund’s average daily net assets and out of pocket expenses. For providing the aforementioned transfer agent and custodian services, MUIS and BNY are entitled to receive a monthly fee based on the number of transactions during the month and the number of accounts under management, subject to certain minimum monthly fees, and out of pocket expenses.
60 | THE GUGGENHEIM FUNDS ANNUAL REPORT | |
NOTES TO FINANCIAL STATEMENTS (continued) |
Note 6 – Federal Income Tax Information
The Fund intends to comply with the provisions of Subchapter M of the Internal Revenue Code applicable to regulated investment companies and will distribute substantially all taxable net investment income and capital gains sufficient to relieve the Fund from all, or substantially all, federal income, excise and state income taxes. Therefore, no provision for federal or state income tax or federal excise tax is required.
Tax positions taken or expected to be taken in the course of preparing the Fund’s tax returns are evaluated to determine whether the tax positions are “more-likely-than-not” of being sustained by the applicable tax authority. Tax positions not deemed to meet the more-likely-than-not threshold would be recorded as a tax benefit or expense in the current year. Management has analyzed the Fund’s tax positions taken, or to be taken, on U.S. federal income tax returns for all open tax years, and has concluded that no provision for income tax is required in the Fund’s financial statements. The Fund’s U.S. federal income tax returns are subject to examination by the Internal Revenue Service for a period of three years after they are filed.
The tax character of distributions paid during the year ended September 30, 2019 was as follows:
| | Ordinary
Income | | | Long-Term
Capital Gain | | | Return of
Capital | | | Total
Distributions | |
| | | $ | 110,990,482 | | | $ | — | | | $ | — | | | $ | 110,990,482 | |
The tax character of distributions paid during the year ended September 30, 2018 was as follows:
| | Ordinary
Income | | | Long-Term
Capital Gain | | | Return of
Capital | | | Total
Distributions | |
| | | $ | 145,284,391 | | | $ | — | | | $ | — | | | $ | 145,284,391 | |
Note: For U.S. federal income tax purposes, short-term capital gain distributions are treated as ordinary income distributions.
The tax components of distributable earnings/(loss) as of September 30, 2019 were as follows:
| | Undistributed
Ordinary
Income | | | Undistributed
Long-Term
Capital Gain | | | Net Unrealized
Appreciation
(Depreciation) | | | Accumulated
Capital and
Other Losses | | | Other
Temporary
Differences | | | Total | |
| | | $ | — | | | $ | — | | | $ | (72,482,576 | ) | | $ | (43,707,449 | ) | | $ | (6,051,329 | ) | | $ | (122,241,354 | ) |
| | THE GUGGENHEIM FUNDS ANNUAL REPORT | 61 |
NOTES TO FINANCIAL STATEMENTS (continued) |
For U.S. federal income tax purposes, capital loss carryforwards represent realized losses of the Fund that may be carried forward and applied against future capital gains. Under the RIC Modernization Act of 2010, the Fund is permitted to carry forward capital losses incurred in taxable years beginning after December 22, 2010 for an unlimited period and such capital loss carryforwards will retain their character as either short-term or long-term capital losses. As of September 30, 2019, capital loss carryforwards for the Fund were as follows:
| | | Unlimited | | | Total
Capital Loss | |
| | Short-Term | | | Long-Term | | | Carryforward | |
| | | $ | — | | | $ | (38,999,356 | ) | | $ | (38,999,356 | ) |
Net investment income and net realized gains (losses) may differ for financial statement and tax purposes because of temporary or permanent book/tax differences. These differences are primarily due to investments in CLO securities, distribution reclasses, foreign currency gains and losses, distribution payable, and the “mark-to-market,” recharacterization, or disposition of certain Passive Foreign Investment Companies (PFICs). Additional differences may result from the tax treatment of investments in bonds, losses deferred due to wash sales, and the “mark-to-market” of certain derivatives. To the extent these differences are permanent and would require a reclassification between Paid in Capital and Total Distributable Earnings (Loss), such reclassifications are made in the period that the differences arise. These reclassifications have no effect on net assets or NAV per share.
There were no adjustments made on the Statement of Assets and Liabilities as of September 30, 2019 for permanent book/tax differences.
At September 30, 2019, the cost of investments for U.S. federal income tax purposes, the aggregate gross unrealized appreciation for all investments for which there was an excess of value over tax cost and the aggregate gross unrealized depreciation for all investments for which there was an excess of tax cost over value, were as follows:
| | Tax
Cost | | | Tax
Unrealized
Appreciation | | | Tax
Unrealized
Depreciation | | | Net Unrealized
Appreciation/
(Depreciation) | |
| | | $ | 1,674,702,965 | | | $ | — | | | $ | (72,429,617 | ) | | $ | (72,429,617 | ) |
62 | THE GUGGENHEIM FUNDS ANNUAL REPORT | |
NOTES TO FINANCIAL STATEMENTS (concluded) |
Pursuant to U.S. federal income tax regulations applicable to regulated investment companies, the Fund has elected to treat net capital losses and certain ordinary losses realized between November 1 and September 30 of each year as occurring on the first day of the following tax year. The Fund has also elected to treat certain ordinary losses realized between January 1 and September 30 of each year as occurring on the first day of the following tax year. For the year ended September 30, 2019, the following losses reflected in the accompanying financial statements were deferred for Federal income tax purposes until October 1, 2019:
| | Ordinary | | | Capital | |
| | | $ | (4,708,093 | ) | | $ | — | |
Note 7 – Securities Transactions
For the year ended September 30, 2019, the cost of purchases and proceeds from sales of investment securities, excluding government securities, short-term investments and derivatives, were as follows:
| | Purchases | | | Sales | |
| | | $ | 223,820,628 | | | $ | 1,698,292,149 | |
The Fund is permitted to purchase or sell securities from or to certain affiliated funds under specified conditions outlined in procedures adopted by the Board. The procedures have been designed to ensure that any purchase or sale of securities by the Fund from or to another fund or portfolio that is or could be considered an affiliate by virtue of having a common investment adviser (or affiliated investment advisers), common Trustees and/or common officers complies with Rule 17a-7 of the 1940 Act. Further, as defined under these procedures, each transaction is effected at the current market price to save costs, where permissible. For the year ended September 30, 2019, the Fund engaged in purchases and sales of securities, pursuant to Rule 17a-7 of the 1940 Act, as follows:
| | Purchases | | | Sales | | | Realized
Gain (Loss) | |
| | | $ | 18,732,162 | | | $ | — | | | $ | — | |
Note 8 – Unfunded Loan Commitments
Pursuant to the terms of certain loan agreements, the Fund held unfunded loan commitments as of September 30, 2019. The Fund is obligated to fund these loan commitments at the borrower’s discretion.
| | THE GUGGENHEIM FUNDS ANNUAL REPORT | 63 |
NOTES TO FINANCIAL STATEMENTS (continued) |
The unfunded loan commitments as of September 30, 2019, were as follows:
Borrower | | Maturity
Date | | | Face
Amount | | | Value | |
Aspect Software, Inc. | | | 07/15/23 | | | $ | 939,012 | | | $ | 12,033 | |
Mavis Tire Express Services Corp. | | | 03/20/25 | | | | 1,341,657 | | | | 31,140 | |
| | | | | | | | | | | $ | 43,173 | |
Note 9 – Restricted Securities
The securities below are considered illiquid and restricted under guidelines established by the Board:
Restricted
Securities | | Acquisition
Date | | | Cost | | | Value | |
Airplanes Pass Through Trust | | | | | | | | | | | | |
2001-1A, 2.88% (1 Month USD LIBOR + 0.55%, Rate Floor: 0.55%) due 03/15/191,2 | | | 12/27/11 | | | $ | 723,184 | | | $ | 14,848 | |
Mirabella Nickel Ltd. | | | | | | | | | | | | |
9.50% due 06/24/192 | | | 12/31/13 | | | | 1,160,811 | | | | 63,991 | |
| | | | | | | $ | 1,883,995 | | | $ | 78,839 | |
1 | Variable rate security. Rate indicated is the rate effective at September 30, 2019. In some instances, the effective rate is limited by a minimum rate floor or a maximum rate cap established by the issuer. The settlement status of a position may also impact the effective rate indicated. In some cases, a position may be unsettled at period end and may not have a stated effective rate. In instances where multiple underlying reference rates and spread amounts are shown, the effective rate is based on a weighted average. |
2 | Security is in default of interest and/or principal obligations. |
Note 10 – Reverse Repurchase Agreements
The Fund may enter into reverse repurchase agreements. Under a reverse repurchase agreement, a Fund sells securities and agrees to repurchase them at a particular price at a future date. In the event the buyer of securities under a reverse repurchase agreement files for bankruptcy or becomes insolvent, such buyer or its trustee or receiver may receive an extension of time to determine whether to enforce the Fund’s obligation to repurchase the securities, and the Fund’s use of the proceeds of the reverse repurchase agreement may effectively be restricted pending such decision.
For the year ended September 30, 2019, the Fund entered into reverse repurchase agreements as follows
Number of Days
Outstanding | | Balance at
September 30, 2019 | | | Average Balance
Outstanding | | | Average
Interest Rate | |
45 | | $ | — | * | | $ | 60,585,169 | | | | 3.27 | % |
* | As of September 30, 2019, the Fund did not have any open reverse repurchase agreements. |
64 | THE GUGGENHEIM FUNDS ANNUAL REPORT | |
NOTES TO FINANCIAL STATEMENTS (continued) |
Note 11 – Line of Credit
The Trust, along with other affiliated trusts, secured a 364-day committed, $1,065,000,000 line of credit from Citibank, N.A., which was in place through October 5, 2018, at which time the line of credit was renewed with an increased commitment amount of $1,205,000,000. On October 4, 2019, the line of credit agreement was renewed with an increased commitment amount of $1,230,000,000. A Fund may draw (borrow) from the line of credit as a temporary measure for emergency purposes, to facilitate redemption requests, or for other short-term liquidity purposes consistent with the Fund’s investment objective and program. For example, it may be advantageous for the Fund to borrow money rather than sell existing portfolio positions to meet redemption requests. Fees related to borrowings, if any, vary under this arrangement between the greater of Citibank’s “base rate”, LIBOR plus 1%, or the federal funds rate plus 1/2 of 1%.
The commitment fee that may be paid by the Fund is at an annualized rate of 0.15% of the average daily amount of its allocated unused commitment amount. The allocated commitment fee amount for the Fund is referenced in the Statement of Operations under “Line of credit fees”. The Fund did not have any borrowings under this agreement as of and for the year ended September 30, 2019.
Note 12 – Recent Regulatory Reporting Updates
In August 2018, the U.S. Securities and Exchange Commission adopted amendments to certain disclosure requirements under Regulation S-X to conform to U.S. GAAP, including: (i) an amendment to require presentation of the total, rather than the components, of distributable earnings on the Statement of Assets and Liabilities; and (ii) an amendment to require presentation of the total, rather than the components, of distributions to shareholders, except for tax return of capital distributions, on the Statements of Changes in Net Assets. As of September 30, 2019, management has implemented the amendments to Regulation S-X, which did not have a material impact on the Fund’s financial statements and related disclosures or impact the Fund’s net assets or results of operations.
Note 13 – Recent Accounting Pronouncements
In March 2017, the Financial Accounting Standards Board issued an Accounting Standards Update, ASU 2017-08, Receivables – Nonrefundable Fees and Other Costs (Subtopic 310-20), Premium Amortization on Purchased Callable Debt Securities (the “2017 ASU”) which amends the amortization period for certain purchased callable debt securities held at a premium, shortening such period to the earliest call date. The 2017 ASU does not require any accounting change for debt securities held at a discount; the discount continues to be amortized to maturity. The 2017 ASU is effective for fiscal years, and interim periods within those fiscal years, beginning after December 15, 2018. At this time, management is evaluating the implications of these changes on the financial statements.
| | THE GUGGENHEIM FUNDS ANNUAL REPORT | 65 |
NOTES TO FINANCIAL STATEMENTS (concluded) |
Note 14 – Subsequent Events
The Fund evaluated subsequent events through the date the financial statements were available for issue and determined there were no material events that would require adjustment to or disclosure in the Fund’s financial statements.
66 | THE GUGGENHEIM FUNDS ANNUAL REPORT | |
REPORT OF INDEPENDENT REGISTERED PUBLIC ACCOUNTING FIRM |
To the Shareholders and the Board of Trustees of Guggenheim Floating Rate Strategies Fund
Opinion on the Financial Statements
We have audited the accompanying statement of assets and liabilities of Guggenheim Floating Rate Strategies Fund (the “Fund”), (one of the funds constituting Guggenheim Funds Trust (the “Trust”)), including the schedule of investments, as of September 30, 2019, and the related statement of operations for the year then ended, the statements of changes in net assets for each of the two years in the period then ended, the financial highlights for each of the five years in the period then ended and the related notes (collectively referred to as the “financial statements”). In our opinion, the financial statements present fairly, in all material respects, the financial position of the Fund (one of the funds constituting Guggenheim Funds Trust) at September 30, 2019, the results of its operations for the year then ended, the changes in its net assets for each of the two years in the period then ended and its financial highlights for each of the five years in the period then ended, in conformity with U.S. generally accepted accounting principles.
Basis for Opinion
These financial statements are the responsibility of the Trust’s management. Our responsibility is to express an opinion on the Fund’s financial statements based on our audits. We are a public accounting firm registered with the Public Company Accounting Oversight Board (United States) (“PCAOB”) and are required to be independent with respect to the Trust in accordance with the U.S. federal securities laws and the applicable rules and regulations of the Securities and Exchange Commission and the PCAOB.
We conducted our audits in accordance with the standards of the PCAOB. Those standards require that we plan and perform the audit to obtain reasonable assurance about whether the financial statements are free of material misstatement, whether due to error or fraud. The Trust is not required to have, nor were we engaged to perform, an audit of the Trust’s internal control over financial reporting. As part of our audits, we are required to obtain an understanding of internal control over financial reporting, but not for the purpose of expressing an opinion on the effectiveness of the Trust’s internal control over financial reporting. Accordingly, we express no such opinion.
Our audits included performing procedures to assess the risks of material misstatement of the financial statements, whether due to error or fraud, and performing procedures that respond to those risks. Such procedures included examining, on a test basis, evidence regarding the amounts and disclosures in the financial statements. Our procedures included confirmation of securities owned as of September 30, 2019, by correspondence with the custodian, transfer agent, brokers, and paying agents or by other appropriate auditing procedures where replies from brokers or paying agents were not received. Our audits also included evaluating the accounting
| | THE GUGGENHEIM FUNDS ANNUAL REPORT | 67 |
REPORT OF INDEPENDENT REGISTERED PUBLIC ACCOUNTING FIRM (concluded) |
principles used and significant estimates made by management, as well as evaluating the overall presentation of the financial statements. We believe that our audits provide a reasonable basis for our opinion.

We have served as the auditor of one or more Guggenheim investment companies since 1979.
Tysons, Virginia
November 26, 2019
68 | THE GUGGENHEIM FUNDS ANNUAL REPORT | |
OTHER INFORMATION (Unaudited) |
Federal Income Tax Information
This information is being provided as required by the Internal Revenue Code. Amounts shown may differ from those elsewhere in the report because of differences in tax and financial reporting practice.
In January 2020, shareholders will be advised on IRS Form 1099 DIV or substitute 1099 DIV as to the federal tax status of the distributions received by shareholders in the calendar year 2019.
The Fund’s investment income (dividend income plus short-term gains, if any) qualifies as follows:
Of the taxable ordinary income distributions paid during the fiscal year ending September 30, 2019, the Fund had the corresponding percentages qualify for the reduced tax rate pursuant to the Jobs and Growth Tax Relief and Reconciliation Act of 2003 or for the dividends received deduction for corporations. See the qualified dividend income and dividend received deduction columns, respectively, in the table below.
Additionally, of the taxable ordinary income distributions paid during the fiscal year ended September 30, 2019, the Fund had the corresponding percentages qualify as interest related dividends and qualified short-term capital gains as permitted by IRC Section 871(k)(1) and IRC Section 871(k)(2), respectively. See qualified interest income and qualified short-term capital gain columns, respectively, in the table below.
| Qualified
Dividend
Income | Dividend
Received
Deduction | Qualified
Interest
Income | Qualified
Short-Term
Capital Gain |
| | 0.03% | 0.03% | 96.73% | 100% |
Proxy Voting Information
A description of the policies and procedures that the Trust uses to determine how to vote proxies relating to securities held in the Fund’s portfolios is available, without charge and upon request, by calling 800.820.0888. This information is also available from the EDGAR database on the SEC’s website at https://www.sec.gov.
Information regarding how the Fund’s voted proxies relating to portfolio securities during the most recent 12-month period ended June 30 is available without charge, upon request, by calling 800.820.0888. This information is also available from the EDGAR database on the SEC’s website at https://www.sec.gov.
| | THE GUGGENHEIM FUNDS ANNUAL REPORT | 69 |
OTHER INFORMATION (Unaudited)(continued) |
Special Meeting of Shareholders — Voting Results
A joint special meeting of shareholders of the Trust was held on October 28, 2019 to elect the following ten nominees to the Board of Trustees of the Trust: Randall C. Barnes, Angela Brock-Kyle, Donald A. Chubb, Jr., Jerry B. Farley, Roman Friedrich III, Thomas F. Lydon, Jr., Ronald A. Nyberg, Sandra G. Sponem, Ronald E. Toupin, Jr. and Amy J. Lee. At the meeting, the following votes were recorded:
Nominee | | Shares For | | | Shares Withheld | |
Randall C. Barnes | | | 919,263,831 | | | | 7,335,759 | |
Angela Brock-Kyle | | | 919,775,822 | | | | 6,823,768 | |
Donald A. Chubb, Jr. | | | 915,120,874 | | | | 11,478,716 | |
Jerry B. Farley | | | 915,377,483 | | | | 11,222,107 | |
Roman Friedrich III | | | 918,807,442 | | | | 7,792,148 | |
Thomas F. Lydon, Jr. | | | 919,122,642 | | | | 7,476,948 | |
Ronald A. Nyberg | | | 918,889,679 | | | | 7,709,911 | |
Sandra G. Sponem | | | 919,600,708 | | | | 6,998,882 | |
Ronald E. Toupin, Jr. | | | 919,043,208 | | | | 7,556,382 | |
Amy J. Lee | | | 919,943,855 | | | | 6,655,735 | |
Sector Classification
Information in the Schedule of Investments is categorized by sectors using sector-level Classifications defined by the Bloomberg Industry Classification System, a widely recognized industry classification system provider. The Fund’s registration statement has investment policies relating to concentration in specific sectors/industries. For purposes of these investment policies, the Fund usually classifies sectors/industries based on industry-level Classifications used by widely recognized industry classification system providers such as Bloomberg Industry Classification System, Global Industry Classification Standards and Barclays Global Classification Scheme.
Quarterly Portfolio Schedules Information
The Trust files its complete schedule of portfolio holdings with the SEC for the first and third quarters of each fiscal year as an exhibit to its reports on Form N-PORT, and for reporting periods ended prior to March 31, 2019, filed such information on Form N-Q. The Fund’s Forms N-PORT and N-Q are available on the SEC’s website at https://www.sec.gov. The Fund’s Forms N-PORT and N-Q may be reviewed and copied at the SEC’s Public Reference Room in Washington, DC, and that information on the operation of the Public Reference Room may be obtained by calling 800-SEC-0330. Copies of the portfolio holdings are also available to shareholders, without charge and upon request, by calling 800.820.0888.
70 | THE GUGGENHEIM FUNDS ANNUAL REPORT | |
OTHER INFORMATION (Unaudited)(continued) |
Report of the Guggenheim Funds Trust Contracts Review Committee
Guggenheim Funds Trust (the “Trust”) was organized as a Delaware statutory trust on November 8, 2013, and is registered as an open-end management investment company under the Investment Company Act of 1940, as amended (the “1940 Act”). The Trust includes the following series:
● Guggenheim Alpha Opportunity Fund (“Alpha Opportunity Fund”) ● Guggenheim Diversified Income Fund (“Diversified Income Fund”) ● Guggenheim High Yield Fund (“High Yield Fund”) ● Guggenheim Large Cap Value Fund (“Large Cap Value Fund”) ● Guggenheim Macro Opportunities Fund (“Macro Opportunities Fund”) ● Guggenheim SMid Cap Value Fund (“SMid Cap Value Fund”) ● Guggenheim Municipal Income Fund (“Municipal Income Fund”) ● Guggenheim Small Cap Value Fund (“Small Cap Value Fund”) ● Guggenheim StylePlus—Mid Growth Fund (“StylePlus—Mid Growth Fund”) ● Guggenheim Ultra Short Duration Fund (“Ultra Short Duration Fund”) | ● Guggenheim Capital Stewardship Fund (“Capital Stewardship Fund”) ● Guggenheim Floating Rate Strategies Fund (“Floating Rate Strategies Fund”) ● Guggenheim Investment Grade Bond Fund (“Investment Grade Bond Fund”) ● Guggenheim Limited Duration Fund (“Limited Duration Fund”) ● Guggenheim Market Neutral Real Estate Fund (“Market Neutral Real Estate Fund”) ● Guggenheim SMid Cap Value Institutional Fund (“SMid Cap Value Institutional Fund”) ● Guggenheim Risk Managed Real Estate Fund (“Risk Managed Real Estate Fund”) ● Guggenheim StylePlus—Large Core Fund (“StylePlus—Large Core Fund”) ● Guggenheim Total Return Bond Fund (“Total Return Bond Fund”) ● Guggenheim World Equity Income Fund (“World Equity Income Fund”) |
Security Investors, LLC (“Security Investors”), an indirect subsidiary of Guggenheim Partners, LLC, a privately-held, global investment and advisory firm (“Guggenheim Partners”), serves as investment adviser to each of: (i) Alpha Opportunity Fund; (ii) High Yield Fund; (iii) Investment Grade Bond Fund; (iv) Large Cap Value Fund; (v) SMid Cap Value Fund; (vi) SMid Cap Value Institutional Fund; (vii) Municipal Income Fund; (viii) Small Cap Value Fund; (ix) StylePlus—Large Core Fund; (x) StylePlus—Mid Growth Fund; and (xi) World Equity Income Fund (collectively, the “SI-Advised Funds”). (Guggenheim Partners, Security Investors, Guggenheim Partners Investment Management, LLC (“GPIM”) and their affiliates may be referred to herein collectively
| | THE GUGGENHEIM FUNDS ANNUAL REPORT | 71 |
OTHER INFORMATION (Unaudited)(continued) |
as “Guggenheim.” Security Investors and GPIM are also known as “Guggenheim Investments,” the global asset management and investment advisory division of Guggenheim Partners that includes other affiliated investment management businesses.)
Under the terms of investment management agreements between Security Investors and the Trust, with respect to the SI-Advised Funds, Security Investors also is responsible for overseeing the activities of GPIM, an indirect subsidiary of Guggenheim Partners, with respect to its service as investment sub-adviser to Municipal Income Fund, pursuant to an investment sub-advisory agreement between Security Investors and GPIM (the “GPIM Sub-Advisory Agreement”).
GPIM serves as investment adviser with respect to each of: (i) Diversified Income Fund; (ii) Floating Rate Strategies Fund; (iii) Limited Duration Fund; (iv) Macro Opportunities Fund; (v) Market Neutral Real Estate Fund; (vi) Risk Managed Real Estate Fund; (vii) Total Return Bond Fund; and (viii) Ultra Short Duration Fund (collectively, the “GPIM-Advised Funds” and together with the SI-Advised Funds, the “Funds” and individually, a “Fund”).1 Under the supervision of the Board of Trustees of the Trust (the “Board,” with the members of the Board referred to individually as the “Trustees”), the Advisers regularly provide (or, as applicable, oversee the provision of) investment research, advice and supervision, along with a continuous investment program for the Funds, and direct the purchase and sale of securities and other investments for each Fund’s portfolio. GPIM also serves as investment adviser for the Capital Stewardship Fund, which is addressed in a separate report.2
Each of the Advisory Agreements continues in effect from year to year provided that such continuance is specifically approved at least annually by (i) the Board or a majority of the outstanding voting securities (as defined in the 1940 Act) of each Fund, and, in either event, (ii) the vote of a majority of the Trustees who are not “interested person[s],” as defined by the 1940 Act, of the Trust (the “Independent Trustees”) casting votes in person at a meeting called for such purpose. At meetings held in person on April 25, 2019 (the “April Meeting”) and on May 21, 2019 (the “May Meeting”), the members of the Contracts Review Committee of the Board (the “Committee”), consisting solely of the Independent Trustees, met separately from Guggenheim to consider the proposed renewal of the Agreements in connection with the Committee’s annual contract review schedule.
1 | The investment management agreements pertaining to the SI-Advised Funds and the investment management agreements pertaining to the GPIM-Advised Funds are referred to herein together as the “Advisory Agreements” and, together with the GPIM Sub-Advisory Agreement, as the “Agreements.” In addition, unless the context indicates otherwise, GPIM, with respect to its service as investment adviser to the GPIM-Advised Funds, and Security Investors as to the SI-Advised Funds, are each referred to herein as the “Adviser” and together, the “Advisers.” |
2 | Because shares of the Capital Stewardship Fund are only offered for subscription and are held by a limited number of institutional/bank investors, and the Fund issues a shareholder report separate from the other series of the Trust, the factors considered by the Committee in evaluating the proposed renewal of an investment management agreement pertaining to the Capital Stewardship Fund, and the Sub-Advisory Agreement with Concinnity Advisors, LP, are addressed in a separate report of the Committee. Accordingly, references to the “Funds” should be understood as referring to all series of the Trust, excluding Capital Stewardship Fund. |
72 | THE GUGGENHEIM FUNDS ANNUAL REPORT | |
OTHER INFORMATION (Unaudited)(continued) |
As part of its review process, the Committee was represented by independent legal counsel to the Independent Trustees (“Independent Legal Counsel”), from whom the Independent Trustees received separate legal advice and with whom they met separately. Independent Legal Counsel reviewed and discussed with the Committee various key aspects of the Trustees’ legal responsibilities relating to the proposed renewal of the Agreements and other principal contracts. The Committee took into account various materials received from Guggenheim and Independent Legal Counsel. Recognizing that the evaluation process with respect to the services provided by Guggenheim is an ongoing one, the Committee also considered the variety of written materials, reports and oral presentations the Board receives throughout the year regarding performance and operating results of the Funds and other information relevant to its evaluation of the Agreements.
In connection with the contract review process, FUSE Research Network LLC (“FUSE”), an independent, third-party research provider, was engaged to prepare advisory contract renewal reports designed specifically to help the Board fulfill its advisory contract renewal responsibilities. The objective of the reports is to present the subject funds’ relative position regarding fees, expenses and total return performance, with peer group and universe comparisons. The Committee assessed the data provided in the FUSE reports as well as commentary presented by Guggenheim, including, among other things, a summary of notable distinctions between certain Funds and the applicable peer group identified in the FUSE reports and explanations for custom peer groups created for certain Funds that do not fit well into any particular category.
In addition, Guggenheim provided materials and data in response to formal requests for information sent by Independent Legal Counsel on behalf of the Independent Trustees. Guggenheim also made a presentation at the April Meeting. Throughout the process, the Committee asked questions of management and requested certain additional information, which Guggenheim provided (collectively with the foregoing reports and materials, the “Contract Review Materials”). The Committee considered the Contract Review Materials in the context of its accumulated experience governing the Trust and weighed the factors and standards discussed with Independent Legal Counsel.
Following an analysis and discussion of relevant factors, including those identified below, and in the exercise of its business judgment, the Committee concluded that it was in the best interest of each Fund to recommend that the Board approve the renewal of each of the Advisory Agreements and the GPIM Sub-Advisory Agreement for an additional annual term.
Advisory Agreements
Nature, Extent and Quality of Services Provided by each Adviser: With respect to the nature, extent and quality of services currently provided by each Adviser, the Committee considered the qualifications, experience and skills of key personnel performing services for the Funds, including those personnel providing compliance and risk oversight, as well as the supervisors and reporting lines for such personnel. The Committee considered Guggenheim’s
| | THE GUGGENHEIM FUNDS ANNUAL REPORT | 73 |
OTHER INFORMATION (Unaudited)(continued) |
resources and related efforts to retain, attract and motivate capable personnel to serve the Funds. In evaluating Guggenheim’s resources and capabilities, the Committee considered Guggenheim’s commitment to focusing on, and investing resources in support of, the Funds.
The Committee’s review of the services provided by Guggenheim to the Funds included consideration of Guggenheim’s investment processes and resulting performance, portfolio oversight and risk management, and the related regular quarterly reports and presentations received by the Board. The Committee took into account the risks borne by Guggenheim in sponsoring and providing services to the Funds, including entrepreneurial, legal and regulatory risks. The Committee considered the resources dedicated by Guggenheim to compliance functions and the reporting made to the Board by Guggenheim compliance personnel regarding Guggenheim’s adherence to regulatory requirements. The Committee also considered the regular reports the Board receives from the Trust’s Chief Compliance Officer regarding compliance policies and procedures established pursuant to Rule 38a-1 under the 1940 Act.
In connection with the Committee’s evaluation of the overall package of services provided by Guggenheim, the Committee considered Guggenheim’s administrative services, including its role in supervising, monitoring, coordinating and evaluating the various services provided by the fund administrator, transfer agent, distributor, custodian and other service providers to the Funds. The Committee evaluated the Office of Chief Financial Officer (the “OCFO”), established to oversee the fund administration, accounting and transfer agency services provided to the Funds, including the OCFO’s resources, personnel and services provided.
With respect to Municipal Income Fund, the Committee noted that, although Security Investors delegated responsibility for the investment and reinvestment of the Fund’s assets to the Sub-Adviser, as affiliated companies, both the Adviser and Sub-Adviser are part of the Guggenheim organization. Further, the Committee took into account Guggenheim’s explanation that investment advisory-related services are provided by many Guggenheim employees under different related legal entities and thus, the services provided by the Adviser on the one hand and the Sub-Adviser on the other, as well as the risks assumed by each party, cannot be ascribed to distinct legal entities.3 As a result, the Committee did not evaluate the services provided to Municipal Income Fund under the Advisory Agreement and the GPIM Sub-Advisory Agreement separately.
With respect to Guggenheim’s resources and the ability of each Adviser to carry out its responsibilities under the applicable Advisory Agreement, the Chief Financial Officer of Guggenheim Investments reviewed with the Committee financial information concerning the holding company for Guggenheim Investments, Guggenheim Partners Investment Management
3 | Consequently, except where the context indicates otherwise, references to “Adviser” or “Sub-Adviser” should be understood as referring to Guggenheim Investments generally and the services it provides under both Agreements. |
74 | THE GUGGENHEIM FUNDS ANNUAL REPORT | |
OTHER INFORMATION (Unaudited)(continued) |
Holdings, LLC (“GPIMH”), and the various entities comprising Guggenheim Investments, and provided the audited consolidated financial statements of GPIMH. (Thereafter, the Committee received the audited consolidated financial statements of GPIM.)
The Committee also considered the acceptability of the terms of each Advisory Agreement, including the scope of services required to be performed by each Adviser.
Based on the foregoing, and based on other information received (both oral and written) at the April Meeting and the May Meeting, as well as other considerations, including the Committee’s knowledge of how each Adviser performs its duties obtained through Board meetings, discussions and reports throughout the year, the Committee concluded that each Adviser and its personnel were qualified to serve the Funds in such capacity and may reasonably be expected to continue to provide a high quality of services under each Advisory Agreement with respect to the Funds.
Investment Performance: The Committee received, for each Fund, investment returns for the since-inception, ten-year, five-year, three-year, one-year and three-month periods ended December 31, 2018, as applicable. In addition, the Committee received a comparison of each Fund’s performance to the performance of a benchmark, a universe of funds and a narrower peer group of similar funds based on asset levels as identified by FUSE, in each case for the same periods, as applicable. The Committee also received from FUSE a description of the methodology for identifying each Fund’s peer group and universe for performance and expense comparisons.
In seeking to evaluate Fund performance over a full market cycle, the Committee focused its attention on five-year and three-year performance rankings as compared to the relevant universe of funds. The Committee considered more recent performance periods for those Funds that were recently launched, as well as in circumstances in which enhancements were being made to the portfolio management processes or techniques employed for a Fund. Except as to the individual Funds discussed below, the Committee observed that the returns of each Fund’s (other than SMid Cap Value Fund) Institutional Class shares and SMid Cap Value Fund’s Class A shares ranked in the third quartile or better of such Fund’s performance universe for each of the relevant periods considered.
In addition, the Committee made the following observations:
Municipal Income Fund: The returns of the Fund’s Institutional Class shares ranked in the 55th and 82nd percentiles of its performance universe for the five-year and three-year periods ended December 31, 2018, respectively. The Committee noted management’s explanation that the Fund’s increased allocation to floating rate securities in 2016 and the Fund’s more conservative investment approach detracted from performance that year, impacting trailing returns for five-year and three-year periods. In light of the foregoing, the Committee also considered the more recent one-year and three-month periods ended December 31, 2018, and observed that the returns of Fund’s Institutional Class shares ranked in the 30th and 11th percentiles, respectively, of its
| | THE GUGGENHEIM FUNDS ANNUAL REPORT | 75 |
OTHER INFORMATION (Unaudited)(continued) |
performance universe. The Committee also took into account management’s statement that it expects the Fund’s performance to continue to improve going forward as it anticipates the effects of recent tax reform and idiosyncratic risks.
Small Cap Value Fund: The returns of the Fund’s Institutional Class shares ranked in the 79th and 56th percentiles of its performance universe for the five-year and three-year periods ended December 31, 2018, respectively. The Committee noted measures taken by the Adviser to remedy longer-term relative underperformance with respect to the Value Funds strategy, including strategy enhancements such as implementation of a refined stock selection process and additional risk controls to enforce the strategy’s sell discipline. In light of the foregoing, the Committee also considered the more recent one-year and three-month periods ended December 31, 2018, and observed that the returns of Fund’s Institutional Class shares ranked in the 19th and 20th percentiles, respectively, of its performance universe.
After reviewing the foregoing and related factors, the Committee concluded that: (i) each Fund’s performance was acceptable; or (ii) it was satisfied with Guggenheim’s responses and efforts to improve investment performance.
Comparative Fees, Costs of Services Provided and the Profits Realized by each Adviser from Its Relationship with the Funds: The Committee compared each Fund’s contractual advisory fee, net effective management fee and total net expense ratio to the applicable peer group. The Committee also reviewed the median advisory fees and expense ratios, including expense ratio components (e.g., transfer agency fees, administration fees, other operating expenses, distribution fees and fee waivers/reimbursements), of the peer group of funds.
As part of its evaluation of each Fund’s advisory fee, the Committee considered how such fees compared to the advisory fee charged by the applicable Adviser to one or more other clients that it manages pursuant to similar investment strategies, to the extent applicable, noting that, in certain instances, Guggenheim charges a lower advisory fee to such other clients. In this connection, the Committee considered, among other things, Guggenheim’s representations about the significant differences between managing mutual funds as compared to other types of accounts. The Committee also considered Guggenheim’s explanation that lower fees are charged in certain instances due to various other factors, including the scope of contract, type of investors, fee structure, applicable legal, governance and capital structures, tax status and historical pricing reasons. In addition, the Committee took into account Guggenheim’s discussion of the entrepreneurial, legal and regulatory risks it faces when offering the Funds as compared to other types of accounts. The Committee concluded that the information it received demonstrated that the aggregate services provided to, or the specific circumstances of, each Fund were sufficiently different from the services provided to, or the specific circumstances of, other clients with similar investment strategies and/or the risks borne by Guggenheim were sufficiently greater than those associated with managing other clients with similar investment strategies to support the difference in fees.
76 | THE GUGGENHEIM FUNDS ANNUAL REPORT | |
OTHER INFORMATION (Unaudited)(continued) |
In further considering the comparative fee and expense data presented in the Contract Review Materials and addressed by Guggenheim, the Committee took into account those Funds with currently effective expense limitation agreements with the Adviser. Except as to the individual Funds discussed below, the Committee observed that each Fund’s average contractual advisory fee percentile rank across all share classes of the Fund, net effective management fee4 and asset-weighted total net expense ratio each rank in the third quartile or better of such Fund’s peer group.
In addition, the Committee made the following observations:
Diversified Income Fund: The average contractual advisory fee percentile rank across all share classes of the Fund is in the fourth quartile (78th percentile) of its peer group. The Fund’s net effective management fee ranks in the first quartile (1st percentile) of its peer group. The Committee considered that the Fund’s asset weighted total net expense ratio ranks in the second quartile (38th percentile) of its peer group. The Committee also took into account the Adviser’s statement that the Fund’s currently effective expense limitation agreement with the Adviser is intended to limit the impact of the Fund’s small size.
Floating Rate Strategies Fund: The average contractual advisory fee percentile rank across all share classes of the Fund is in the fourth quartile (92nd percentile) of its peer group. The Fund’s net effective management fee ranks in the fourth quartile (76th percentile) of its peer group. The Committee considered that the Fund’s asset weighted total net expense ratio ranks in the third quartile (58th percentile) of its peer group. The Committee also considered the Adviser’s statement explaining the higher fees that performance is driven by a unique investment approach that requires significant resources. In this regard, the Committee took into consideration the Fund’s strong investment performance for the five-year period ended December 31, 2018. In addition, the Committee noted the Adviser’s statement that the net effective management fee includes 0.08% in administration fees that is not paid to the Adviser. The Committee also took into account the Fund’s currently effective expense limitation agreement with the Adviser.
High Yield Fund: The average contractual advisory fee percentile rank across all share classes of the Fund is in the third quartile (54th percentile) of its peer group. The Fund’s net effective management fee ranks in the fourth quartile (76th percentile) of its peer group. The Fund’s asset weighted total net expense ratio ranks in the third quartile (73rd percentile) of its peer group. The Committee considered the Adviser’s statement explaining the higher fees that performance is driven by a unique investment approach that requires significant resources. In this regard, the Committee took into consideration the Fund’s strong investment performance for the five-year and three-year periods ended December 31, 2018. In addition, the Committee noted the Adviser’s
4 | The “net effective management fee” for each Fund represents the combined effective advisory fee and administration fee as a percentage of average net assets for the latest fiscal year, after any waivers and/or reimbursements, based on the Fund’s class level peer group percent rank, weighted by class level assets under management. |
| | THE GUGGENHEIM FUNDS ANNUAL REPORT | 77 |
OTHER INFORMATION (Unaudited)(continued) |
statement that the net effective management fee includes 0.08% in administration fees that is not paid to the Adviser. The Committee also took into account the Fund’s currently effective expense limitation agreement with the Adviser.
Limited Duration Fund: The average contractual advisory fee percentile rank across all share classes of the Fund is in the third quartile (63rd percentile) of its peer group. The Fund’s net effective management fee ranks in the fourth quartile (80th percentile) of its peer group. The Committee considered that the Fund’s asset weighted total net expense ratio ranks in the third quartile (51st percentile) of its peer group. The Committee also considered the Adviser’s statement explaining the higher fees that performance is driven by a unique investment approach that requires significant resources. In this regard, the Committee took into consideration the Fund’s strong investment performance for the five-year and three-year periods ended December 31, 2018. In addition, the Committee noted the Adviser’s statement that the net effective management fee includes 0.08% in administration fees that is not paid to the Adviser. The Committee also took into account the Fund’s currently effective expense limitation agreement with the Adviser.
Macro Opportunities Fund: The average contractual advisory fee percentile rank across all share classes of the Fund, the Fund’s net effective management fee and the Fund’s asset weighted total net expense ratio each rank in the fourth quartile (93rd, 81st and 83rd percentiles, respectively) of its peer group. The Committee noted that the Fund is categorized as a non-traditional bond fund which seeks to add value by investing in many non-traditional securities outside of fixed income, including equities, currencies, commodities and derivatives. The Committee considered the Adviser’s statement explaining the higher fees and expenses that performance is driven by a unique investment approach that requires significant resources. In this regard, the Committee took into consideration the Fund’s strong investment performance for the five-year and three-year periods ended December 31, 2018. The Committee also took into account the Fund’s currently effective expense limitation agreement with the Adviser. The Committee also noted that, in connection with the contract review process, the Adviser formalized an existing expense waiver agreement with the Fund pursuant to which the Adviser waives any Fund expenses attributable to the Fund’s investment in Alpha Opportunity Fund.
SMid Cap Value Institutional Fund: The Fund’s contractual advisory fee ranks in the first quartile (7th percentile) of its peer group. The Fund’s net effective management fee and asset weighted total net expense ratio each rank in the fourth quartile (79th and 86th percentiles, respectively) of its peer group. The Committee considered the Adviser’s statement explaining the higher fees and expenses that it has made adjustments to the strategy of the Fund over the last few years incorporating a more systematic approach in order to improve investment performance. In this regard, the Committee took into consideration the Fund’s strong investment performance for the three-year period ended December 31, 2018. In addition, the Committee noted the Adviser’s statement that the net effective management fee includes 0.08% in administration fees that is not paid to the Adviser. The Committee also considered the Adviser’s statement that the Fund has
78 | THE GUGGENHEIM FUNDS ANNUAL REPORT | |
OTHER INFORMATION (Unaudited)(continued) |
continued to experience outflows resulting in lower relative assets to peers and associated higher other operating expenses, and that the Adviser is evaluating strategic measures to improve the Fund’s positioning.
Risk Managed Real Estate Fund: The average contractual advisory fee percentile rank across all share classes of the Fund is in the first quartile (22nd percentile) of its peer group. The Fund’s net effective management fee ranks in the fourth quartile (78th percentile) of its peer group. The Committee considered that the Fund’s asset weighted total net expense ratio ranks in the second quartile (47th percentile) of its peer group. The Committee took into consideration the Fund’s strong investment performance for the three-year and one-year periods ended December 31, 2018. The Committee also took into account the Fund’s currently effective expense limitation agreement with the Adviser.
StylePlus—Large Core Fund: The average contractual advisory fee percentile rank across all share classes of the Fund is in the third quartile (62nd percentile) of its peer group. The Fund’s net effective management fee ranks in the fourth quartile (86th percentile) of its peer group. The Committee considered that the Fund’s asset weighted total net expense ratio ranks in the third quartile (66th percentile) of its peer group. The Committee also considered the Adviser’s statement explaining the higher fees that performance is driven by a unique combination of passive and actively managed strategies. In this regard, the Committee took into consideration the Fund’s strong investment performance for the five-year and three-year periods ended December 31, 2018.
Total Return Bond Fund: The average contractual advisory fee percentile rank across all share classes of the Fund is in the third quartile (68th percentile) of its peer group. The Fund’s net effective management fee ranks in the fourth quartile (78th percentile) of its peer group. The Committee considered that the Fund’s asset weighted total net expense ratio ranks in the 50th percentile of its peer group. The Committee also considered the Adviser’s statement explaining the higher fees that performance is driven by a unique investment approach that requires significant resources. In this regard, the Committee took into consideration the Fund’s strong investment performance for the five-year and three-year periods ended December 31, 2018. In addition, the Committee noted the Adviser’s statement that the net effective management fee includes 0.08% in administration fees that is not paid to the Adviser. The Committee also took into account the Fund’s currently effective expense limitation agreement with the Adviser.
With respect to the costs of services provided and profits realized by Guggenheim Investments from its relationship with the Funds, the Committee reviewed a profitability analysis and data from management for each Fund setting forth the average assets under management for the twelve months ended December 31, 2018, gross revenues received by Guggenheim Investments, expenses allocated to the Fund, expense waivers (as applicable), earnings and the operating margin/profitability rate, including variance information relative to the foregoing amounts
| | THE GUGGENHEIM FUNDS ANNUAL REPORT | 79 |
OTHER INFORMATION (Unaudited)(continued) |
as of December 31, 2017. In addition, the Chief Financial Officer of Guggenheim Investments reviewed with, and addressed questions from, the Committee concerning the expense allocation methodology employed in producing the profitability analysis.
In the course of its review of Guggenheim Investments’ profitability, the Committee took into account the methods used by Guggenheim Investments to determine expenses and profit. The Committee considered all of the foregoing in evaluating the costs of services provided, the profitability to Guggenheim Investments and the profitability rates presented, and concluded that the profits were not unreasonable.
The Committee considered other benefits available to each Adviser because of its relationship with the Funds and noted Guggenheim’s statement that it does not believe the Advisers derive any such “fall-out” benefits. In this regard, the Committee noted Guggenheim’s statement that, although it does not consider such benefits to be fall-out benefits, the Advisers may benefit from marketing synergies arising from offering a broad spectrum of products, including the Funds.
Economies of Scale: The Committee received and considered information regarding whether there have been economies of scale with respect to the management of the Funds as Fund assets grow, whether the Funds have appropriately benefited from any economies of scale, and whether there is potential for realization of any further economies of scale. The Committee considered whether economies of scale in the provision of services to the Funds were being passed along to the shareholders. The Committee noted the Adviser’s statements, including that Guggenheim believes it is appropriately sharing potential economies of scale and that costs continue to increase in many key areas, including compensation of portfolio managers, key analysts and support staff, as well as for infrastructure needs, with respect to risk management oversight, valuation processes and disaster recovery systems, among other things, and that, in this regard, management’s costs for providing services have increased in recent years without regard to asset levels.
The Committee also noted the process employed by the Adviser to evaluate whether it would be appropriate to institute a new breakpoint for a Fund, with consideration given to, among other things: (i) the Fund’s size and trends in asset levels over recent years; (ii) the competitiveness of the expense levels; (iii) whether expense waivers are in place; (iv) changes and trends in revenue and expenses; (v) whether there are any anticipated expenditures that may benefit the Fund in the future; (vi) Fund profit level margins; (vii) relative Fund performance; (viii) the nature, extent and quality of services management provides to the Fund; and (ix) the complexity of the Fund’s investment strategy and the resources required to support the Fund.
As part of its assessment of economies of scale, the Committee also considered Guggenheim’s view that it seeks to share economies of scale through a number of means, including breakpoints, advisory fees set at competitive rates pre-assuming future asset growth, expense waivers and limitations, and investments in personnel, operations and infrastructure to support the Fund
80 | THE GUGGENHEIM FUNDS ANNUAL REPORT | |
OTHER INFORMATION (Unaudited)(continued) |
business. Thus, the Committee considered the size of the Funds and the competitiveness of and/or other determinations made regarding the current advisory fee for each Fund, as well as whether a Fund is subject to an expense limitation.
Based on the foregoing, the Committee determined that the advisory fee for each Fund was reasonable.
Sub-Advisory Agreement
Nature, Extent and Quality of Services Provided by the Sub-Adviser: As noted above, because both the Adviser and Sub-Adviser for Municipal Income Fund—Security Investors and GPIM, respectively—are part of and do business as Guggenheim Investments and the services provided by the Adviser on the one hand and the Sub-Adviser on the other cannot be ascribed to distinct legal entities, the Committee did not evaluate the services provided under the Advisory Agreement and Sub-Advisory Agreement separately. Therefore, the Committee considered the qualifications, experience and skills of the Fund’s portfolio management team in connection with the Committee’s evaluation of Guggenheim’s investment professionals under the applicable Advisory Agreement.
With respect to Guggenheim’s resources and the Sub-Adviser’s ability to carry out its responsibilities under the Sub-Advisory Agreement, as noted above, the Committee considered the financial condition of GPIMH and the various entities comprising Guggenheim Investments. (Thereafter, the Committee received the audited consolidated financial statements of GPIM.)
The Committee also considered the acceptability of the terms of the Sub-Advisory Agreement, including the scope of services required to be performed by the Sub-Adviser.
Investment Performance: The Committee considered the returns of the Fund under its evaluation of the Advisory Agreement.
Comparative Fees, Costs of Services Provided and the Profits Realized by the Sub-Adviser from Its Relationship with the Fund: The Committee considered that the Sub-Advisory Agreement is with an affiliate of the Adviser, that the Adviser compensates the Sub-Adviser from its own fees so that the sub-advisory fee rate for the Fund does not impact the fees paid by the Fund and that the Sub-Adviser’s revenues were included in the calculation of Guggenheim Investments’ profitability. Given its determination of the reasonableness of the advisory fee, the Committee concluded that the sub-advisory fee rate for the Fund was not unreasonable.
Economies of Scale: The Committee recognized that, because the Sub-Adviser’s fees are paid by the Adviser and not the Fund, the analysis of economies of scale was more appropriate in the context of the Committee’s consideration of the applicable Advisory Agreement, which was separately considered. (See “Advisory Agreements – Economies of Scale” above.)
| | THE GUGGENHEIM FUNDS ANNUAL REPORT | 81 |
OTHER INFORMATION (Unaudited)(concluded) |
Overall Conclusions
Based on the foregoing, the Committee determined that the investment advisory fees are fair and reasonable in light of the extent and quality of the services provided and other benefits received and that the continuation of each of the Agreements is in the best interest of each Fund. In reaching this conclusion, no single factor was determinative or conclusive and each Committee member, in the exercise of his business judgment, may afford different weights to different factors. At the May Meeting, the Committee, constituting all of the Independent Trustees, recommended the renewal of each Advisory Agreement and the Sub-Advisory Agreement for an additional annual term.
82 | THE GUGGENHEIM FUNDS ANNUAL REPORT | |
INFORMATION ON BOARD OF TRUSTEES AND OFFICERS (Unaudited) |
Name, Address*
and Year of Birth
of Trustees | Position(s)
Held with
the Trust | Term of Office
and Length of
Time Served** | Principal Occupation(s)
During Past 5 Years | Number of
Portfolios
in Fund
Complex
Overseen | Other
Directorships Held
by Trustees |
INDEPENDENT TRUSTEES | | | |
Randall C. Barnes (1951) | Trustee | Since 2014 | Current: Private Investor (2001-present). Former: Senior Vice President and Treasurer, PepsiCo, Inc. (1993-1997); President, Pizza Hut International (1991-1993); Senior Vice President, Strategic Planning and New Business Development, PepsiCo, Inc. (1987-1990). | 158 | Current: Trustee, Purpose Investments Funds (2013-present). Former: Managed Duration Investment Grade Municipal Fund (2003-2016). |
Angela Brock-Kyle (1959) | Trustee | Since November 2019 | Current: Founder and Chief Executive Officer, B.O.A.R.D.S (consulting firm). Former: Senior Leader, TIAA (financial services firm) (1987-2012). | 157 | None. |
Donald A.
Chubb, Jr. (1946) | Trustee and Chairman of the Valuation Oversight Committee | Since 1994 | Current: Retired. Former: Business broker and manager of commercial real estate, Griffith & Blair, Inc. (1997-2017). | 157 | Former: Midland Care, Inc. (2011-2016). |
Jerry B. Farley (1946) | Trustee and Chairman of the Audit Committee | Since 2005 | Current: President, Washburn University (1997-present). | 157 | Current: CoreFirst Bank & Trust (2000-present). Former: Westar Energy, Inc. (2004-2018). |
| | THE GUGGENHEIM FUNDS ANNUAL REPORT | 83 |
INFORMATION ON BOARD OF TRUSTEES AND OFFICERS (Unaudited)(continued) |
Name, Address*
and Year of Birth
of Trustees | Position(s)
Held with
the Trust | Term of Office
and Length of
Time Served** | Principal Occupation(s)
During Past 5 Years | Number of
Portfolios
in Fund
Complex
Overseen | Other
Directorships Held
by Trustees |
INDEPENDENT TRUSTEES - continued | | |
Roman
Friedrich III (1946) | Trustee and Chairman of the Contracts Review Committee | Since 2014 | Current: Founder and Managing Partner, Roman Friedrich & Company (1998-present). | 157 | Former: Zincore Metals, Inc. (2009-January 2019). |
Thomas F.
Lydon, Jr. (1960) | Trustee | Since November 2019 | Current: President, Global Trends Investments (registered investment adviser) (1996-present). | 157 | Current: US Global Investors (GROW) (1995-present); and Harvest Volatility Edge Trust (3) (2017-present). |
Ronald A. Nyberg (1953) | Trustee and Chairman of the Nominating and Governance Committee | Since 2014 | Current: Partner, Momkus LLC (2016-present). Former: Partner, Nyberg & Cassioppi, LLC (2000-2016); Executive Vice President, General Counsel, and Corporate Secretary, Van Kampen Investments (1982-1999). | 158 | Current: PPM Funds (9) (2018-present); Edward-Elmhurst Healthcare System (2012-present); Western Asset Inflation-Linked Opportunities & Income Fund (2004-present); Western Asset Inflation-Linked Income Fund (2003-present). Former: Managed Duration Investment Grade Municipal Fund (2003-2016). |
84 | THE GUGGENHEIM FUNDS ANNUAL REPORT | |
INFORMATION ON BOARD OF TRUSTEES AND OFFICERS (Unaudited)(continued) |
Name, Address*
and Year of Birth
of Trustees | Position(s)
Held with
the Trust | Term of Office
and Length of
Time Served** | Principal Occupation(s)
During Past 5 Years | Number of
Portfolios
in Fund
Complex
Overseen | Other
Directorships Held
by Trustees |
INDEPENDENT TRUSTEES - concluded | | |
Sandra G. Sponem (1958) | Trustee | Since November 2019 | Current: Retired. Former: Senior Vice President and Chief Financial Officer, M.A. Mortenson Companies, Inc. (general contracting firm) (2007-2017). | 157 | Current: SPDR Series Trust (78) (2018-present); SPDR Index Shares Funds (31) (2018-present); SSGA Active Trust (12) (2018-present); and SSGA Master Trust (1) (2018-present). |
Ronald E.
Toupin, Jr. (1958) | Trustee and Chairman of the Board | Since 2014 | Current: Portfolio Consultant (2010-present); Member, Governing Council, Independent Directors Council (2013-present); Governor, Board of Governors, Investment Company Institute (2018-present). Former: Member, Executive Committee, Independent Directors Council (2016-2018); Vice President, Manager and Portfolio Manager, Nuveen Asset Management (1998-1999); Vice President, Nuveen Investment Advisory Corp. (1992-1999); Vice President and Manager, Nuveen Unit Investment Trusts (1991-1999); and Assistant Vice President and Portfolio Manager, Nuveen Unit Investment Trusts (1988-1999), each of John Nuveen & Co., Inc. (1982-1999). | 157 | Current: Western Asset Inflation-Linked Opportunities & Income Fund (2004-present); Western Asset Inflation-Linked Income Fund (2003-present). Former: Managed Duration Investment Grade Municipal Fund (2003-2016). |
| | THE GUGGENHEIM FUNDS ANNUAL REPORT | 85 |
INFORMATION ON BOARD OF TRUSTEES AND OFFICERS (Unaudited)(continued) |
Name, Address*
and Year of Birth
of Trustees | Position(s)
Held with
the Trust | Term of Office
and Length of
Time Served** | Principal Occupation(s)
During Past 5 Years | Number of
Portfolios
in Fund
Complex
Overseen | Other
Directorships Held
by Trustees |
INTERESTED TRUSTEE | |
Amy J. Lee*** (1961) | Trustee, Vice President and Chief Legal Officer | Since 2018 (Trustee) Since 2014 (Chief Legal Officer) Since 2007 (Vice President) | Current: Interested Trustee, certain other funds in the Fund Complex (2018-present); Chief Legal Officer, certain other funds in the Fund Complex (2014-present); Vice President, certain other funds in the Fund Complex (2007-present); Senior Managing Director, Guggenheim Investments (2012-present). Former: President and Chief Executive Officer (2017-2018); President, certain other funds in the Fund Complex (2017-November 2019); Vice President, Associate General Counsel and Assistant Secretary, Security Benefit Life Insurance Company and Security Benefit Corporation (2004-2012). | 157 | None. |
* | The business address of each Trustee is c/o Guggenheim Investments, 227 West Monroe Street, Chicago, Illinois 60606. |
** | Each Trustee serves an indefinite term, until his or her successor is elected and qualified. Time served includes time served in the respective position for the Predecessor Corporation. |
*** | This Trustee is deemed to be an “interested person” of the Funds under the 1940 Act by reason of her position with the Funds’ Investment Manager and/or the parent of the Investment Manager. |
86 | THE GUGGENHEIM FUNDS ANNUAL REPORT | |
INFORMATION ON BOARD OF TRUSTEES AND OFFICERS (Unaudited)(continued) |
Name, Address*
and Year of Birth | Position(s)
Held with
the Trust | Term of Office
and Length of
Time Served** | Principal Occupations
During Past 5 Years |
OFFICERS | | | |
Brian E. Binder (1972) | President and Chief Executive Officer | Since 2018 | Current: President and Chief Executive Officer, certain other funds in the Fund Complex (2018-present); President and Chief Executive Officer, Guggenheim Funds Investment Advisors, LLC and Security Investors, LLC (2018-present); Senior Managing Director and Chief Administrative Officer, Guggenheim Investments (2018-present). Former: Managing Director and President, Deutsche Funds, and Head of US Product, Trading and Fund Administration, Deutsche Asset Management (2013-2018); Managing Director, Head of Business Management and Consulting, Invesco Ltd. (2010-2012). |
James M. Howley (1972) | Assistant Treasurer | Since 2014 | Current: Managing Director, Guggenheim Investments (2004-present); Assistant Treasurer, certain other funds in the Fund Complex (2006-present). Former: Manager, Mutual Fund Administration of Van Kampen Investments, Inc. (1996-2004). |
Mark E. Mathiasen (1978) | Secretary | Since 2014 | Current: Secretary, certain other funds in the Fund Complex (2007-present); Managing Director, Guggenheim Investments (2007-present). |
Glenn McWhinnie (1969) | Assistant Treasurer | Since 2016 | Current: Vice President, Guggenheim Investments (2009-present); Assistant Treasurer, certain other funds in the Fund complex (2016-present). |
Michael P. Megaris (1984) | Assistant Secretary | Since 2014 | Current: Assistant Secretary, certain other funds in the Fund Complex (2014-present); Director, Guggenheim Investments (2012-present). |
Elisabeth Miller (1968) | Chief Compliance Officer | Since 2012 | Current: Chief Compliance Officer, certain other funds in the Fund Complex (2012-present); Senior Managing Director, Guggenheim Investments (2012-present); Vice President, Guggenheim Funds Distributors, LLC (2014-present). Former: Chief Compliance Officer, Security Investors, LLC and Guggenheim Funds Investment Advisors, LLC (2012-2018); Chief Compliance Officer, Guggenheim Distributors, LLC (2009-2014); Senior Manager, Security Investors, LLC (2004-2014); Senior Manager, Guggenheim Distributors, LLC (2004-2014). |
| | THE GUGGENHEIM FUNDS ANNUAL REPORT | 87 |
INFORMATION ON BOARD OF TRUSTEES AND OFFICERS (Unaudited)(continued) |
Name, Address*
and Year of Birth | Position(s)
Held with
the Trust | Term of Office
and Length of
Time Served** | Principal Occupations
During Past 5 Years |
OFFICERS - continued | |
Margaux Misantone (1978) | AML Officer | Since 2017 | Current: Chief Compliance Officer, Security Investors, LLC and Guggenheim Funds Investment Advisors, LLC (2018-present); AML Officer, Security Investors, LLC and certain other funds in the Fund Complex (2017-present); Managing Director, Guggenheim Investments (2015-present). Former: Assistant Chief Compliance Officer, Security Investors, LLC and Guggenheim Funds Investments Advisors, LLC (2015-2018). |
Adam J. Nelson (1979) | Assistant Treasurer | Since 2015 | Current: Vice President, Guggenheim Investments (2015-present); Assistant Treasurer, certain other funds in the Fund Complex (2015-present). Former: Assistant Vice President and Fund Administration Director, State Street Corporation (2013-2015); Fund Administration Assistant Director, State Street (2011-2013); Fund Administration Manager, State Street (2009-2011). |
Kimberly J. Scott (1974) | Assistant Treasurer | Since 2014 | Current: Director, Guggenheim Investments (2012-present); Assistant Treasurer, certain other funds in the Fund Complex (2012-present). Former: Financial Reporting Manager, Invesco, Ltd. (2010-2011); Vice President/Assistant Treasurer, Mutual Fund Administration for Van Kampen Investments, Inc./Morgan Stanley Investment Management (2009-2010); Manager of Mutual Fund Administration, Van Kampen Investments, Inc./Morgan Stanley Investment Management (2005-2009). |
Bryan Stone (1979) | Vice President | Since 2014 | Current: Vice President, certain other funds in the Fund Complex (2014-present); Managing Director, Guggenheim Investments (2013-present). Former: Senior Vice President, Neuberger Berman Group LLC (2009-2013); Vice President, Morgan Stanley (2002-2009). |
88 | THE GUGGENHEIM FUNDS ANNUAL REPORT | |
INFORMATION ON BOARD OF TRUSTEES AND OFFICERS (Unaudited)(concluded) |
Name, Address*
and Year of Birth | Position(s)
Held with
the Trust | Term of Office
and Length of
Time Served** | Principal Occupations
During Past 5 Years |
OFFICERS - concluded | |
John L. Sullivan (1955) | Chief Financial Officer, Chief Accounting Officer and Treasurer | Since 2014 | Current: Chief Financial Officer, Chief Accounting Officer and Treasurer, certain other funds in the Fund Complex (2010-present); Senior Managing Director, Guggenheim Investments (2010-present). Former: Managing Director and Chief Compliance Officer, each of the funds in the Van Kampen Investments fund complex (2004-2010); Managing Director and Head of Fund Accounting and Administration, Morgan Stanley Investment Management (2002-2004); Chief Financial Officer and Treasurer, Van Kampen Funds (1996-2004). |
Jon Szafran (1989) | Assistant Treasurer | Since 2017 | Current: Vice President, Guggenheim Investments (2017-present); Assistant Treasurer, certain other funds in the Fund Complex (2017-present). Former: Assistant Treasurer of Henderson Global Funds and Manager of US Fund Administration, Henderson Global Investors (North America) Inc. (“HGINA”), (2017); Senior Analyst of US Fund Administration, HGINA (2014-2017); Senior Associate of Fund Administration, Cortland Capital Market Services, LLC (2013-2014); Experienced Associate, PricewaterhouseCoopers LLP (2012-2013). |
* | The business address of each officer is c/o Guggenheim Investments, 227 West Monroe Street, Chicago, Illinois 60606. |
** | Each officer serves an indefinite term, until his or her successor is duly elected and qualified. |
| | THE GUGGENHEIM FUNDS ANNUAL REPORT | 89 |
GUGGENHEIM INVESTMENTS PRIVACY NOTICE (Unaudited) |
Who We Are
This Privacy Notice describes the data protection practices of Guggenheim Investments. Guggenheim Investments as used herein refers to the affiliated investment management businesses of Guggenheim Partners, LLC: Guggenheim Funds Investment Advisors, LLC, Guggenheim Partners Investment Management, LLC, Guggenheim Funds Distributors, LLC, Security Investors, LLC, Guggenheim Investment Advisors (Europe) Limited, Guggenheim Real Estate, LLC, GS Gamma Advisors, LLC, Guggenheim Partners India Management, LLC, Guggenheim Partners Europe Limited, as well as the funds in the Guggenheim Funds complex (the “Funds”) (“Guggenheim Investments,” “we,” “us,” or “our”).
Guggenheim Partners Investment Management Holdings, LLC, located at 330 Madison Avenue, New York, New York 10017 is the data controller for your information. The affiliates who are also controllers of certain of your information are: Guggenheim Investment Advisors (Europe) Limited, Guggenheim Partners Europe Limited, Guggenheim Partners, LLC, Guggenheim Funds Investment Advisors, LLC, Guggenheim Partners Investment Management, LLC, Guggenheim Funds Distributors, LLC and Security Investors, LLC, as well as the Funds.
Our Commitment to You
Guggenheim Investments considers your privacy our utmost concern. When you become our client or investor, you entrust us with not only your hard-earned money but also with your personal and financial information. Because we have access to your private information, we hold ourselves to the highest standards in its safekeeping and use. We strictly limit how we share your information with others, whether you are a current or former Guggenheim Investments client or investor.
The Information We Collect About You
We collect certain nonpublic personal information about you from information you provide on applications, other forms, our website, and/or from third parties including investment advisors. This information includes Social Security or other tax identification number, assets, income, tax information, retirement and estate plan information, transaction history, account balance, payment history, bank account information, marital status, family relationships, information that we collect on our website through the use of “cookies,” and other personal information that you or others provide to us. We may also collect such information through your inquiries by mail, e-mail or telephone. We may also collect customer due diligence information, as required by applicable law and regulation, through third party service providers.
How We Handle Your Personal Information
The legal basis for using your information as set out in this Privacy Notice is as follows: (a) use of your personal data is necessary to perform our obligations under any contract with you (such as a contract for us to provide financial services to you); or (b) where use of your personal data is not necessary for performance of a contract, use of your personal data is necessary for our
90 | THE GUGGENHEIM FUNDS ANNUAL REPORT | |
GUGGENHEIM INVESTMENTS PRIVACY NOTICE (Unaudited)(continued) |
legitimate interests or the legitimate interests of others (for example, to enforce the legal terms governing our services, operate and market our website and other services we offer, ensure safe environments for our personnel and others, make and receive payments, prevent fraud and to know the customer to whom we are providing the services). Some processing is done to comply with applicable law.
In addition to the specific uses described above, we also use your information in the following manner:
| | ● | We use your information in connection with servicing your accounts. |
| | ● | We use information to respond to your requests or questions. For example, we might use your information to respond to your customer feedback. |
| | ● | We use information to improve our products and services. We may use your information to make our website and products better. We may use your information to customize your experience with us. |
| | ● | We use information for security purposes. We may use your information to protect our company and our customers. |
| | ● | We use information to communicate with you. For example, we will communicate with you about your account or our relationship. We may contact you about your feedback. We might also contact you about this Privacy Notice. We may also enroll you in our email newsletter. |
| | ● | We use information as otherwise permitted by law, as we may notify you. |
| | ● | Aggregate/Anonymous Data. We may aggregate and/or anonymize any information collected through the website so that such information can no longer be linked to you or your device (“Aggregate/Anonymous Information”). We may use Aggregate/Anonymous Information for any purpose, including without limitation for research and marketing purposes, and may also share such data with any third parties, including advertisers, promotional partners, and sponsors. |
We do not sell information about current or former clients or their accounts to third parties. Nor do we share this information, except when necessary to complete transactions at your request, to make you aware of investment products and services that we or our affiliates offer, or as permitted or required by law.
We provide information about you to companies and individuals not affiliated with Guggenheim Investments to complete certain transactions or account changes, or to perform services for us related to your account. For example, if you ask to transfer assets from another financial institution to Guggenheim Investments, we must provide certain information about you to that company to complete the transaction. We provide the third party with only the information necessary to carry out its responsibilities and only for that purpose. And we require these third
| | THE GUGGENHEIM FUNDS ANNUAL REPORT | 91 |
GUGGENHEIM INVESTMENTS PRIVACY NOTICE (Unaudited)(continued) |
parties to treat your private information with the same high degree of confidentiality that we do. To alert you to other Guggenheim Investments products and services, we share your information within our family of affiliated companies. You may limit our sharing with affiliated companies as set out below. We may also share information with any successor to all or part of our business, or in connection with steps leading up to a merger or acquisition. For example, if part of our business was sold we may give customer information as part of that transaction. We may also share information about you with your consent.
We will release information about you if you direct us to do so, if we are compelled by law to do so, or in other circumstances as permitted by law (for example, to protect your account from fraud).
If you close your account(s) or become an inactive client or investor, we will continue to adhere to the privacy policies and practices described in this notice.
Opt-Out Provisions and Your Data Choices
The law allows you to “opt out” of certain kinds of information sharing with third parties. We do not share personal information about you with any third parties that triggers this opt-out right. This means YOU ARE ALREADY OPTED OUT.
When you are no longer our client or investor, we continue to share your information as described in this notice, and you may contact us at any time to limit our sharing by sending an email to CorporateDataPrivacy@GuggenheimPartners.com.
European Union Data Subjects and certain others: In addition to the choices set forth above, residents of the European Union and certain other jurisdictions have certain rights to (1) request access to or rectification or deletion of information we collect about them, (2) request a restriction on the processing of their information, (3) object to the processing of their information, or (4) request the portability of certain information. To exercise these or other rights, please contact us using the contact information below. We will consider all requests and provide our response within the time period stated by applicable law. Please note, however, that certain information may be exempt from such requests in some circumstances, which may include if we need to keep processing your information for our legitimate interests or to comply with a legal obligation. We may request you provide us with information necessary to confirm your identity before responding to your request.
Residents of France and certain other jurisdictions may also provide us with instructions regarding the manner in which we may continue to store, erase and share your information after your death, and where applicable, the person you have designated to exercise these rights after your death.
How We Protect Privacy Online
We take steps to protect your privacy when you use our web site – www.guggenheiminvestments.com – by using secure forms of online communication, including encryption technology, Secure Socket Layer (SSL) protocol, firewalls and user names and
92 | THE GUGGENHEIM FUNDS ANNUAL REPORT | |
GUGGENHEIM INVESTMENTS PRIVACY NOTICE (Unaudited)(concluded) |
passwords. These safeguards vary based on the sensitivity of the information that we collect and store. However, we cannot and do not guarantee that these measures will prevent every unauthorized attempt to access, use, or disclose your information since despite our efforts, no Internet and/or other electronic transmissions can be completely secure. Our web site uses “http cookies”—tiny pieces of information that we ask your browser to store. We use cookies for session management and security features on the Guggenheim Investments web site. We do not use them to pull data from your hard drive, to learn your e-mail address, or to view data in cookies created by other web sites. We will not share the information in our cookies or give others access to it. See the legal information area on our web site for more details about web site security and privacy features.
How We Safeguard Your Personal Information and Data Retention
We restrict access to nonpublic personal information about you to our employees and in some cases to third parties (for example, the service providers described above) as permitted by law. We maintain strict physical, electronic and procedural safeguards that comply with federal standards to guard your nonpublic personal information.
We keep your information for no longer than necessary for the purposes for which it is processed. The length of time for which we retain information depends on the purposes for which we collected and use it and/or as required to comply with applicable laws. Information may persist in copies made for backup and business continuity purposes for additional time.
International Visitors
If you are not a resident of the United States, please be aware that your information may be transferred to, stored and processed in the United States where our servers are located and our databases are operated. The data protection and other laws of the United States and other countries might not be as comprehensive as those in your country.
In such cases, we ensure that a legal basis for such a transfer exists and that adequate protection is provided as required by applicable law, for example, by using standard contractual clauses or by transferring your data to a jurisdiction that has obtained an adequacy finding. Individuals whose data may be transferred on the basis of standard contractual clauses may contact us as described below.
We’ll Keep You Informed
If you have any questions or concerns about how we treat your personal data, we encourage you to consult with us first. You may also contact the relevant supervisory authority.
We reserve the right to modify this policy at any time and will inform you promptly of material changes. You may access our privacy policy from our web site at www.guggenheiminvestments.com. Should you have any questions regarding our privacy policy, contact us by email at CorporateDataPrivacy@GuggenheimPartners.com.
| | THE GUGGENHEIM FUNDS ANNUAL REPORT | 93 |
This page intentionally left blank.
This page intentionally left blank.
This page intentionally left blank.
This page intentionally left blank.
9.30.2019
Guggenheim Funds Annual Report
| |
Guggenheim Total Return Bond Fund | | |
Beginning on January 1, 2021, paper copies of the Fund’s annual and semi-annual shareholder reports may no longer be sent by mail, unless you specifically request paper copies of the reports from a Fund or from your financial intermediary. Instead, the reports will be made available on a website, and you will be notified by mail each time a report is posted and provided with a website link to access the report.
If you already elected to receive shareholder reports electronically, you will not be affected by this change and you need not take any action. At any time, you may elect to receive reports and other communications from a Fund electronically by calling 800.820.0888, going to GuggenheimInvestments.com/myaccount, or by contacting your financial intermediary.
You may elect to receive all future shareholder reports in paper free of charge. If you hold shares of a Fund directly, you can inform the Fund that you wish to receive paper copies of reports by calling 800.820.0888. If you hold shares of a Fund through a financial intermediary, please contact the financial intermediary to make this election. Your election to receive reports in paper will apply to all Guggenheim Funds in which you are invested and may apply to all funds held with your financial intermediary.
GuggenheimInvestments.com | TRB-ANN-0919x0920 |

| | |
DEAR SHAREHOLDER | 2 |
ECONOMIC AND MARKET OVERVIEW | 4 |
ABOUT SHAREHOLDERS’ FUND EXPENSES | 6 |
TOTAL RETURN BOND FUND | 9 |
NOTES TO FINANCIAL STATEMENTS | 74 |
REPORT OF INDEPENDENT REGISTERED PUBLIC ACCOUNTING FIRM | 100 |
OTHER INFORMATION | 102 |
INFORMATION ON BOARD OF TRUSTEES AND OFFICERS | 116 |
GUGGENHEIM INVESTMENTS PRIVACY NOTICE | 123 |
| | THE GUGGENHEIM FUNDS ANNUAL REPORT | 1 |
Dear Shareholder:
Guggenheim Partners Investment Management, LLC (“GPIM” or the “Investment Adviser”), is pleased to present the shareholder report for Guggenheim Total Return Bond Fund (the “Fund”) for the annual fiscal period ended September 30, 2019.
The Investment Adviser is part of Guggenheim Investments, which represents the investment management businesses of Guggenheim Partners, LLC (“Guggenheim”), a global, diversified financial services firm.
Guggenheim Funds Distributors, LLC is the distributor of the Fund. Guggenheim Funds Distributors, LLC is affiliated with Guggenheim and the Investment Adviser.
We encourage you to read the Economic and Market Overview section of the report, which follows this letter, and then the Managers’ Commentary for the Fund.
We are committed to providing innovative investment solutions and appreciate the trust you place in us.
Sincerely,
Guggenheim Partners Investment Management, LLC
October 31, 2019
Read a prospectus and summary prospectus (if available) carefully before investing. It contains the investment objectives, risks, charges, expenses and other information, which should be considered carefully before investing. Obtain a prospectus and summary prospectus (if available) at guggenheiminvestments.com or call 800.820.0888.
This material is not intended as a recommendation or as investment advice of any kind, including in connection with rollovers, transfers, and distributions. Such material is not provided in a fiduciary capacity, may not be relied upon for or in connection with the making of investment decisions, and does not constitute a solicitation of an offer to buy or sell securities. All content has been provided for informational or educational purposes only and is not intended to be and should not be construed as legal or tax advice and/or a legal opinion. Always consult a financial, tax and/ or legal professional regarding your specific situation.
2 | THE GUGGENHEIM FUNDS ANNUAL REPORT | |
Total Return Bond Fund may not be suitable for all investors. ● The Fund’s market value will change in response to interest rate changes and market conditions among other factors. In general, bond prices rise when interest rates fall and vice versa. ● The Fund’s exposure to high yield securities may subject the Fund to greater volatility. ● When market conditions are deemed appropriate, the Fund will leverage to the full extent permitted by its investment policies and restrictions and applicable law. Leveraging will exaggerate the effect on net asset value of any increase or decrease in the market value of the Fund’s portfolio. ● The Fund may invest in derivative instruments, which may be more volatile and less liquid, increasing the risk of loss when compared to traditional securities. Certain of the derivative instruments are also subject to the risks of counterparty default and adverse tax treatment. ● Instruments and strategies (such as borrowing transactions and reverse repurchase agreements) may provide leveraged exposure to a particular investment, which will magnify any gains or losses on those investments. ● Investments in reverse repurchase agreements expose the Fund to the many of the same risks as investments in derivatives. ● The Fund’s investments in other investment vehicles subject the Fund to those risks and expenses affecting the investment vehicle. ● The Fund’s investments in foreign securities carry additional risks when compared to U.S. securities, due to the impact of diplomatic, political, or economic developments in the country in question (investments in emerging markets securities are generally subject to an even greater level of risk). ● Investments in syndicated bank loans generally offer a floating interest rate and involve special types of risks. ● The Fund’s investments in municipal securities can be affected by events that affect the municipal bond market. ● The Fund’s investments in real estate securities subject the Fund to the same risks as direct investments in real estate, which is particularly sensitive to economic downturns. ● The Fund’s investments in restricted securities may involve financial and liquidity risk. ● You may have a gain or loss when you sell your shares. ● It is important to note that the Fund is not guaranteed by the U.S. government. ● Please read the prospectus for more detailed information regarding these and other risks.
| | THE GUGGENHEIM FUNDS ANNUAL REPORT | 3 |
ECONOMIC AND MARKET OVERVIEW (Unaudited) | September 30, 2019 |
Economic data has been mixed over the past few months. On the positive side, we saw a pickup in the housing market as measured by housing starts and home sales, which could be a delayed response to lower mortgage rates. Industrial production had the strongest month-over-month gain in a year, partially boosted by an increase in oil production in Hurricane Barry’s wake. The unemployment rate fell to a 50-year low of 3.5% in September 2019, despite a continued moderation in payroll gains.
On the negative side, the Institute for Supply Management (“ISM”) Manufacturing Index plunged to the weakest reading since June 2009. The ISM Non-Manufacturing Index also came in well below expectations, the lowest since August 2016. Within both the manufacturing and non-manufacturing ISM indexes, analysts look at the employment component of the survey for an early read on other labor market indicators. Here we find more cause for concern: The non-manufacturing survey’s employment component is now barely above 50 while the manufacturing employment sub-index stands at 46.3, well into contraction territory. Combined, the outlook for output and hiring has dimmed, signaling trouble ahead for consumers.
Retail sales have been steady, but Commerce Department data showed that total consumer spending on goods and services increased only 0.1% month-over-month in August 2019, the smallest gain in six months. It is hard to identify the primary reason why consumers may already be turning more conservative on spending. Income growth looks steady, the equity market is higher year-to-date, and rates are lower, all of which should be boosting consumer confidence. Sentiment surveys, however, show that fewer consumers believe now is a good time to buy homes, vehicles, and household durables, and headline consumer confidence measures have ticked down. We believe trade policy and political concerns are weighing on sentiment, and these headwinds are set to ramp up further. Additional U.S. tariffs on China are due to take effect on December 15, 2019 and the U.S. House of Representatives is pressing forward with its impeachment inquiry into President Trump.
Guggenheim’s dashboard of U.S. recession indicators continues to point to a recession beginning as early as the first half of 2020, and we think the economic data is corroborating this view. Two of the more notable indicators pointing to high recession risk are the three-month/10-year U.S. Treasury yield curve, which has been inverted for 16 consecutive weeks through period end, and the Leading Economic Indicators Index which has slowed from a year-over-year growth rate of 6.6% in September 2018 to 1.1% as of August 2019. The indicators Guggenheim tracks as part of our recession probability model indicate a nearly 50% chance that a recession will come before mid-2020, and a 70% chance that it will arrive by mid-2021.
Over the period, the U.S. Treasury curve continued its overall flattening trend, as the difference between the two-year U.S. Treasury and 10-year U.S. Treasury narrowed to 5 basis points. Equity markets remained volatile, buoyed by a 25 basis point cut in July and September 2019 by the U.S. Federal Reserve (the “Fed”) and relatively strong U.S. economic data, but weighed down by trade war uncertainty and fears of a global slowdown.
4 | THE GUGGENHEIM FUNDS ANNUAL REPORT | |
ECONOMIC AND MARKET OVERVIEW (Unaudited)(concluded) | September 30, 2019 |
With downside risks growing, markets have become more sensitive to the Fed’s communications about the future stance of monetary policy. Despite the two rate cuts, Fed policymakers are deeply divided. It is still unclear whether the Fed will deliver the aggressive and preemptive policy action that would prolong the current expansion.
As it relates to risk-taking, we are not confident that the Fed would succeed in easing credit conditions if conditions were to tighten materially. The Fed may act too late, or its actions may have little impact given that low rates this year have largely failed to stimulate growth. With credit spreads still relatively tight on a historical basis, we believe it is prudent to remain up in quality as we await better opportunities to deploy capital in riskier credit sectors in the coming downturn.
For the 12-month period ended September 30, 2019, the Standard & Poor’s 500® (“S&P 500”) Index* returned 4.25%. The MSCI Europe-Australasia-Far East (“EAFE”) Index* returned -0.82%. The return of the MSCI Emerging Markets Index* was -1.63%.
In the bond market, the Bloomberg Barclays U.S. Aggregate Bond Index* posted a 10.30% return for the period, while the Bloomberg Barclays U.S. Corporate High Yield Index* returned 6.36%. The return of the ICE Bank of America (“BofA”) Merrill Lynch 3-Month U.S. Treasury Bill Index* was 2.39% for the 12-month period.
The opinions and forecasts expressed may not actually come to pass. This information is subject to change at any time, based on market and other conditions, and should not be construed as a recommendation of any specific security or strategy.
*Index Definitions
Indices are unmanaged and not available for direct investment. Index performance does not reflect transaction costs, fees, or expenses.
Bloomberg Barclays U.S. Aggregate Bond Index is a broad-based flagship benchmark that measures the investment grade, U.S. dollar-denominated, fixed-rate taxable bond market, including U.S. Treasuries, government-related and corporate securities, mortgage-backed securities or “MBS” (agency fixed-rate and hybrid adjustable-rate mortgage, or “ARM”, pass-throughs), asset-backed securities (“ABS”), and commercial mortgage-backed securities (“CMBS”) (agency and non-agency).
Bloomberg Barclays U.S. Corporate High Yield Index measures the U.S. dollar-denominated, high yield, fixed-rate corporate bond market. Securities are classified as high yield if the middle rating of Moody’s, Fitch, and S&P is Ba1/BB +/BB + or below.
ICE BofA Merrill Lynch 3-Month U.S. Treasury Bill Index is an unmanaged market Index of U.S. Treasury securities maturing in 90 days that assumes reinvestment of all income.
MSCI EAFE Index is a capitalization-weighted measure of stock markets in Europe, Australasia, and the Far East.
MSCI Emerging Markets Index is a free float-adjusted market capitalization-weighted index that is designed to measure equity market performance in the global emerging markets.
S&P 500® is a broad-based index, the performance of which is based on the performance of 500 widely held common stocks chosen for market size, liquidity, and industry group representation.
| | THE GUGGENHEIM FUNDS ANNUAL REPORT | 5 |
ABOUT SHAREHOLDERS’ FUND EXPENSES (Unaudited) |
All mutual funds have operating expenses, and it is important for our shareholders to understand the impact of costs on their investments. Shareholders of a fund incur two types of costs: (i) transaction costs, including sales charges (loads) on purchase payments, reinvested dividends, other distributions, and exchange fees, and (ii) ongoing costs, including management fees, administrative services, and shareholder reports, among others. These ongoing costs, or operating expenses, are deducted from a fund’s gross income and reduce the investment return of the fund.
A fund’s expenses are expressed as a percentage of its average net assets, which is known as the expense ratio. The following examples are intended to help investors understand the ongoing costs (in dollars) of investing in a fund and to compare these costs with the ongoing costs of investing in other mutual funds.
The examples are based on an investment of $1,000 made at the beginning of the period and held for the entire six-month period beginning March 31, 2019 and ending September 30, 2019.
The following tables illustrate the Fund’s costs in two ways:
Table 1. Based on actual Fund return: This section helps investors estimate the actual expenses paid over the period. The “Ending Account Value” shown is derived from the Fund’s actual return, and the fifth column shows the dollar amount that would have been paid by an investor who started with $1,000 in the Fund. Investors may use the information here, together with the amount invested, to estimate the expenses paid over the period. Simply divide the Fund’s account value by $1,000 (for example, an $8,600 account value divided by $1,000 = 8.6), then multiply the result by the number provided under the heading “Expenses Paid During Period.”
Table 2. Based on hypothetical 5% return: This section is intended to help investors compare a Fund’s cost with those of other mutual funds. The table provides information about hypothetical account values and hypothetical expenses based on the Fund’s actual expense ratio and an assumed rate of return of 5% per year before expenses, which is not the Fund’s actual return. The hypothetical account values and expenses may not be used to estimate the actual ending account balance or expenses paid during the period. The example is useful in making comparisons because the U.S. Securities and Exchange Commission (the “SEC”) requires all mutual funds to calculate expenses based on the 5% return. Investors can assess a Fund’s costs by comparing this hypothetical example with the hypothetical examples that appear in shareholder reports of other funds.
The calculations illustrated above assume no shares were bought or sold during the period. Actual costs may have been higher or lower, depending on the amount of investment and the timing of any purchases or redemptions.
6 | THE GUGGENHEIM FUNDS ANNUAL REPORT | |
ABOUT SHAREHOLDERS’ FUND EXPENSES (Unaudited)(continued) |
Please note that the expenses shown in the table are meant to highlight your ongoing costs only and do not reflect any transactional costs, such as sales charges (loads) on purchase payments, and contingent deferred sales charges (“CDSC”) on redemptions, if any. Therefore, the second table is useful in comparing ongoing costs only, and will not help you determine the relative total costs of owning different funds. In addition, if these transactional costs were included, your costs would have been higher.
More information about the Fund’s expenses, including annual expense ratios for periods up to five years (subject to the Fund’s inception date), can be found in the Financial Highlights section of this report. For additional information on operating expenses and other shareholder costs, please refer to the Fund’s prospectus.
| | THE GUGGENHEIM FUNDS ANNUAL REPORT | 7 |
ABOUT SHAREHOLDERS’ FUND EXPENSES (Unaudited)(concluded) |
| Expense
Ratio1 | Fund
Return | Beginning
Account Value
March 31,
2019 | Ending
Account Value
September 30,
2019 | Expenses
Paid During
Period2 |
Table 1. Based on actual Fund return3 |
A-Class | 0.81% | 3.76% | $ 1,000.00 | $ 1,037.60 | $ 4.14 |
C-Class | 1.55% | 3.40% | 1,000.00 | 1,034.00 | 7.90 |
P-Class | 0.80% | 3.80% | 1,000.00 | 1,038.00 | 4.09 |
Institutional Class | 0.51% | 3.94% | 1,000.00 | 1,039.40 | 2.61 |
R6-Class | 0.51% | 3.90% | 1,000.00 | 1,039.00 | 2.61 |
|
Table 2. Based on hypothetical 5% return (before expenses) |
A-Class | 0.81% | 5.00% | $ 1,000.00 | $ 1,021.01 | $ 4.10 |
C-Class | 1.55% | 5.00% | 1,000.00 | 1,017.30 | 7.84 |
P-Class | 0.80% | 5.00% | 1,000.00 | 1,021.06 | 4.05 |
Institutional Class | 0.51% | 5.00% | 1,000.00 | 1,022.51 | 2.59 |
R6-Class | 0.51% | 5.00% | 1,000.00 | 1,022.51 | 2.59 |
1 | Annualized and excludes expenses of the underlying funds in which the Fund invests, if any. This ratio represents net expenses, which may include expenses that are excluded from the expense limitation agreement. Excluding these expenses, the net expense ratio for the Fund would be 0.79%, 1.54%, 0.79%, 0.50% and 0.50% for the A-Class, C-Class, P-Class, Institutional Class and R6-Class, respectively. |
2 | Expenses are equal to the Fund’s annualized expense ratio, net of any applicable fee waivers, multiplied by the average account value over the period, multiplied by 183/365 (to reflect the one-half year period). |
3 | Actual cumulative return at net asset value for the period March 31, 2019 to September 30, 2019. |
8 | THE GUGGENHEIM FUNDS ANNUAL REPORT | |
MANAGERS’ COMMENTARY (Unaudited) | September 30, 2019 |
To Our Shareholders
Guggenheim Total Return Bond Fund (the “Fund”) is managed by a team of seasoned professionals, including B. Scott Minerd, Chairman of Investments and Global Chief Investment Officer; Anne B. Walsh, Senior Managing Director and Chief Investment Officer, Fixed Income; Steven H. Brown, CFA, Senior Managing Director and Portfolio Manager; and Adam J. Bloch, Managing Director and Portfolio Manager. In the following paragraphs, the investment team discusses the market environment and the Fund’s performance for the fiscal year ended September 30, 2019.
For the one year period ended September 30, 2019, Guggenheim Total Return Bond Fund returned 5.70%1, compared with the 10.30% return of its benchmark, the Bloomberg Barclays U.S. Aggregate Bond Index.
The Fund seeks to provide total return, comprised of current income and capital appreciation. The Fund pursues its investment objective by investing primarily in high-quality, investment-grade fixed-income securities across multiple sectors. The Fund employs a relative-value sector allocation strategy, offering the opportunity to capitalize on total return potential created by changing market conditions.
The trailing twelve-month period, ending September 30, 2019, faced bouts of uncertainty and volatility as trade tensions, global economic headwinds, shifts in monetary policy, and a corporate earnings slowdown jolted financial markets. From the start, the fourth quarter of 2018 raised concerns across global markets, causing risk-assets to decline as investors sought safety. The S&P 500, high yield, and bank loan indices were off -13.52%, -4.53%, -3.08% in the fourth quarter, respectively, in line with our previously expressed concerns that spreads could widen. We entered the fourth quarter of 2018 defensively positioned, with limited below investment grade exposure, credit hedges in place, and healthy liquidity reserves all of which helped the fund generate a positive absolute return.
In response to the fourth quarter’s market upheaval, the U.S. Federal Reserve (the “Fed”) pivoted from its tightening policy stance and informed markets it would be patient in assessing further interest rate hikes. As 2019 progressed, the Fed recalibrated its approach to sustain the current economic expansion. In total, the Fed increased rates by a quarter of a percentage point one time in December 2018 but later decreased rates by a quarter of a percentage point in each July and September 2019. The Fed’s dovish turn and the low global interest-rate environment supported risk assets in 2019 as credit spreads generally tightened for the remainder of the period.
Our Macroeconomic and Investment Research continued to reinforce a heightened chance that the U.S. economy could be in the later stages of the current credit cycle. Elevated levels of corporate indebtedness combined with deteriorating macroeconomic metrics and relatively tight prevailing credit spreads informed us that investors were not being adequately compensated to take risk in credit. As a result, over the course of the past twelve months, we continued to
| | THE GUGGENHEIM FUNDS ANNUAL REPORT | 9 |
MANAGERS’ COMMENTARY (Unaudited)(continued) | September 30, 2019 |
proactively shift the portfolio to a more defensive stance. As spreads and yields grinded tighter we used the moves as opportunities to shift the portfolio up in credit quality, reduce spread duration, and maintain ample liquidity. For the one-year period, the Fund reduced spread duration to 2.7 years from 3.8 years.
The Fund’s overweight to Agency Commercial Mortgage-Backed Securities (“Agency CMBS”) contributed positively to total return. Agency CMBS offered a relative yield pick-up to Agency Residential Mortgage-Backed Securities (“Agency RMBS”) while featuring stronger prepayment protection, dampening the negative convexity profile inherent in mortgage-backed securities. Moreover, the Fund’s overweight holdings in Agency debt benefitted performance as interest rate-sensitive securities rallied over the period.
The Fund’s allocation to structured credit, specifically collateralized loan obligations (“CLOs”) and commercial asset-backed securities (“ABS”), contributed positively to returns as these securities provided attractive and stable income. Moreover, the Fund’s allocation to Non-Agency RMBS generated positive absolute return primarily from income generation. Supportive housing fundamentals, a strong labor market, and shrinking outstanding supply of pre-crisis RMBS securities reinforced demand throughout the period.
The Fund held a high allocation to short-term investments to prioritize capital preservation, preserve optionality, and maintain sufficient liquidity in light of heightened uncertainty. Within short-term investments, the Fund employed foreign sovereign asset swaps which allowed the Fund to earn additional yield in non-U.S. sovereign securities relative to maturity-equivalent U.S. government securities while hedging non-U.S. currency exposure. The enhanced carry contributed positively to total return. Carry refers to the income received from portfolio investments over a defined period.
The Fund’s overall underweight duration position relative to its benchmark was the largest detractor to performance. Heading into the fourth quarter of 2018, the Fund remained underweight duration relative to the benchmark as we were concerned the Fed may continue to increase interest rates to combat an overheating labor market and higher inflation expectations. The volatility in the fourth quarter along with the Fed’s interest rate cuts ultimately moved rates lower, which caused the Fund’s performance to lag that of the benchmark.
We added about three quarters of a year of duration to the portfolio since the beginning of August 2019, in line with our longer-term view that yields will move lower as the business cycle ages. Given the potential for the Fed to extend the cycle and rates to rise in the near-term, though, we have remained underweight overall duration.
The Fund has remained underweight Investment Grade corporate bonds. In recent years, corporate leverage ratios have continued to move higher suggesting that any economic slowdown could expose the weaknesses inherent in corporate balance sheets. The Fund maintained short-risk positions in Investment Grade credit default swaps to further reduce Investment Grade corporate credit risk which detracted from performance.
10 | THE GUGGENHEIM FUNDS ANNUAL REPORT | |
MANAGERS’ COMMENTARY (Unaudited)(concluded) | September 30, 2019 |
The Fund may invest in certain of the underlying series of Guggenheim Funds Trust and Guggenheim Strategy Funds Trust, including Guggenheim Ultra Short Duration Fund (effective November 30, 2018, Guggenheim Strategy Fund I was reorganized with and into the Guggenheim Ultra Short Duration Fund), Guggenheim Strategy Fund II, and Guggenheim Strategy Fund III, (collectively, the “Short Term Investment Vehicles”), each of which are open-end management investment companies managed by Guggenheim Investments. The Short Term Investment Vehicles, which launched on March 11, 2014, are offered as short term investment options only to mutual funds, trusts, and other accounts managed by Guggenheim Investments and/or its affiliates, and are not available to the public, with the exception of Guggenheim Ultra Short Duration Fund, which is available to the public. Guggenheim Strategy Fund II and Guggenheim Strategy Fund III do not charge an investment management fee. Guggenheim Ultra Short Duration Fund charges an investment management fee but that fee is waived by the respective investee fund. For the one-year period ended September 30, 2019, investment in the Short Term Investment Vehicles benefited Fund performance.
Performance displayed represents past performance which is no guarantee of future results.
1 | Performance figures are based on Class A shares and do not reflect deduction of the sales charges or taxes that a shareholder would pay on distributions or the redemption of shares. |
The opinions and forecast expressed may not actually come to pass. This information is subject to change at any time, based on market and other conditions, and should not be construed as a recommendation of any specific security or strategy.
| | THE GUGGENHEIM FUNDS ANNUAL REPORT | 11 |
PERFORMANCE REPORT AND FUND PROFILE (Unaudited) | September 30, 2019 |
TOTAL RETURN BOND FUND
OBJECTIVE: Seeks to provide total return, comprised of current income and capital appreciation.
Holdings Diversification (Market Exposure as % of Net Assets)
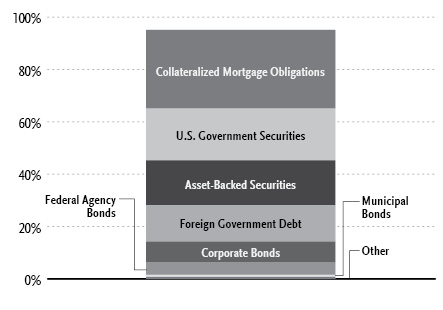
“Holdings Diversification (Market Exposure as % of Net Assets)” excludes any temporary cash investments, investments in Guggenheim Strategy Funds Trust mutual funds, or investments in Guggenheim Ultra Short Duration Fund.
12 | THE GUGGENHEIM FUNDS ANNUAL REPORT | |
PERFORMANCE REPORT AND FUND PROFILE (Unaudited)(continued) | September 30, 2019 |
Inception Dates: |
A-Class | November 30, 2011 |
C-Class | November 30, 2011 |
P-Class | May 1, 2015 |
Institutional Class | November 30, 2011 |
R6-Class | October 19, 2016 |
Portfolio Composition by Quality Rating1 |
Rating | | % of Total
Investments | |
Fixed Income Instruments | | | | |
AAA | | | 54.0 | % |
AA | | | 5.0 | % |
A | | | 17.6 | % |
BBB | | | 8.7 | % |
BB | | | 2.4 | % |
B | | | 1.8 | % |
CCC | | | 1.3 | % |
CC | | | 0.7 | % |
C | | | 0.2 | % |
NR2 | | | 3.4 | % |
Other Instruments | | | 4.9 | % |
Total Investments | | | 100.0 | % |
Ten Largest Holdings (% of Total Net Assets) |
U.S. Treasury Notes, 2.50% due 02/15/22 | 4.6% |
U.S. Treasury Notes, 2.50% due 01/31/24 | 3.7% |
U.S. Treasury Notes, 2.38% | 3.3% |
U.S. Treasury Bonds, 2.88% | 2.5% |
U.S. Treasury Notes, 2.50% due 02/28/26 | 2.4% |
U.S. Treasury Bonds, 2.25% | 1.8% |
Government of Japan, 0.10% | 1.7% |
Kingdom of Spain, 0.75% | 1.7% |
State of Israel, 1.00% | 1.1% |
Government of Japan | 1.1% |
Top Ten Total | 23.9% |
| | |
“Ten Largest Holdings” excludes any temporary cash or derivative investments. |
1 | Source: BlackRock Solutions. Credit quality ratings are measured on a scale that generally ranges from AAA (highest) to D (lowest). All securities except for those labeled “NR” have been rated by Moody’s, Standard & Poor’s (“S&P”), or Fitch, each of which is a Nationally Recognized Statistical Rating Organization (“NRSRO”). For purposes of this presentation, when ratings are available from more than one agency, the highest rating is used. Guggenheim Investments has converted ratings to the equivalent S&P rating. Security ratings are determined at the time of purchase and may change thereafter. |
2 | NR securities do not necessarily indicate low credit quality. |
| | THE GUGGENHEIM FUNDS ANNUAL REPORT | 13 |
PERFORMANCE REPORT AND FUND PROFILE (Unaudited)(continued) | September 30, 2019 |
Cumulative Fund Performance*
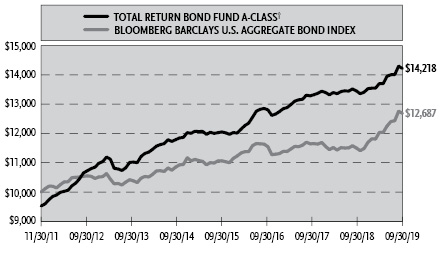
14 | THE GUGGENHEIM FUNDS ANNUAL REPORT | |
PERFORMANCE REPORT AND FUND PROFILE (Unaudited)(concluded) | September 30, 2019 |
Average Annual Returns*
Periods Ended September 30, 2019
| 1 Year | 5 Year | Since
Inception
(11/30/11) |
A-Class Shares | 5.70% | 3.93% | 5.25% |
A-Class Shares with sales charge† | 1.48% | 2.92% | 4.59% |
C-Class Shares | 4.95% | 3.17% | 4.48% |
C-Class Shares with CDSC§ | 3.95% | 3.17% | 4.48% |
Institutional Class Shares | 6.03% | 4.28% | 5.60% |
Bloomberg Barclays U.S. Aggregate Bond Index | 10.30% | 3.38% | 3.08% |
| | 1 Year | Since
Inception
(05/01/15) |
P-Class Shares | | 5.70% | 3.85% |
Bloomberg Barclays U.S. Aggregate Bond Index | | 10.30% | 3.20% |
| | 1 Year | Since
Inception
(10/19/16) |
R6-Class Shares | | 5.99% | 3.90% |
Bloomberg Barclays U.S. Aggregate Bond Index | | 10.30% | 3.11% |
* | The performance data above represents past performance that is not predictive of future results. The investment return and principal value of an investment in the Fund will fluctuate so that an investor’s shares, when redeemed, may be worth more or less than their original cost. Returns are historical and include changes in principal and reinvested dividends and capital gains and do not reflect the effect of taxes. The Bloomberg Barclays U.S. Aggregate Bond Index is an unmanaged index and, unlike the Fund, has no management fees or operating expenses to reduce its reported return. The graph is based on A-Class shares only; performance for C-Class shares, P-Class shares, R6-Class shares and Institutional Class shares will vary due to differences in fee structures. |
† | Effective October 1, 2015, the maximum sales charge decreased from 4.75% to 4.00%. A 4.75% maximum sales charge is used in the calculation of the Average Annual Returns based on subscriptions made prior to October 1, 2015, and a 4.00% maximum sales charge will be used to calculate performance for periods based on subscriptions made on or after October 1, 2015. |
§ | Fund returns include a CDSC of 1% if redeemed within 12 months of purchase. |
| | THE GUGGENHEIM FUNDS ANNUAL REPORT | 15 |
SCHEDULE OF INVESTMENTS | September 30, 2019 |
TOTAL RETURN BOND FUND | |
| | Shares | | | Value | |
COMMON STOCKS† - 0.0% |
| | | | | | | | | |
Industrial - 0.0% |
API Heat Transfer Parent LLC*,††† | | | 42,528 | | | $ | 12,652 | |
BP Holdco LLC*,†††,1,2 | | | 532 | | | | 188 | |
Vector Phoenix Holdings, LP*,†††,1 | | | 532 | | | | 45 | |
Total Industrial | | | | | | | 12,885 | |
| | | | | | | | | |
Total Common Stocks | | | | | | | | |
(Cost $21,071) | | | | | | | 12,885 | |
| | | | | | | | | |
PREFERRED STOCKS†† - 0.0% |
Industrial - 0.0% |
API Heat Transfer Intermediate* | | | 9 | | | | 6,614 | |
Total Preferred Stocks | | | | | | | | |
(Cost $7,237) | | | | | | | 6,614 | |
| | | | | | | | | |
MUTUAL FUNDS† - 0.9% |
Guggenheim Floating Rate Strategies Fund — R6-Class2 | | | 1,879,263 | | | | 47,451,399 | |
Guggenheim Ultra Short Duration Fund — Institutional Class2,14 | | | 2,616,539 | | | | 26,060,726 | |
Guggenheim Strategy Fund II2 | | | 1,048,701 | | | | 26,039,254 | |
Guggenheim Strategy Fund III2 | | | 1,048,126 | | | | 26,014,479 | |
Total Mutual Funds | | | | | | | | |
(Cost $127,283,933) | | | | | | | 125,565,858 | |
| | | | | | | | | |
MONEY MARKET FUND† - 0.5% |
Federated U.S. Treasury Cash Reserve Fund — Institutional Shares 1.86%3 | | | 63,759,824 | | | | 63,759,824 | |
Total Money Market Fund | | | | |
(Cost $63,759,824) | | | | | | | 63,759,824 | |
| | Face
Amount~ | | | Value | |
COLLATERALIZED MORTGAGE OBLIGATIONS†† - 30.1% |
Government Agency - 16.2% |
Fannie Mae | | | | | | | | |
3.59% due 02/01/29 | | | 110,497,332 | | | $ | 122,873,717 | |
3.37% due 06/01/39 | | | 50,450,000 | | | | 55,582,693 | |
2.89% due 10/01/29 | | | 38,458,000 | | | | 40,738,068 | |
3.26% due 05/01/34 | | | 37,000,000 | | | | 40,163,987 | |
3.01% due 09/01/29 | | | 36,899,000 | | | | 39,215,275 | |
3.61% due 04/01/34 | | | 31,110,000 | | | | 34,822,101 | |
3.19% due 02/01/29 | | | 29,250,000 | | | | 31,640,291 | |
3.71% due 04/01/34 | | | 26,913,000 | | | | 30,319,908 | |
3.56% due 04/01/30 | | | 26,256,938 | | | | 29,127,835 | |
3.33% due 05/01/34 | | | 25,400,000 | | | | 28,109,415 | |
3.40% due 02/01/33 | | | 25,000,000 | | | | 27,434,010 | |
3.60% due 03/01/31 | | | 24,586,000 | | | | 27,333,083 | |
3.12% due 10/01/32 | | | 24,800,000 | | | | 25,940,333 | |
3.23% due 01/01/33 | | | 23,568,326 | | | | 25,593,063 | |
3.43% due 09/01/34 | | | 22,550,000 | | | | 25,010,786 | |
3.48% due 04/01/29 | | | 21,529,000 | | | | 23,818,752 | |
3.68% due 04/01/34 | | | 20,000,000 | | | | 22,502,438 | |
2.90% due 11/01/29 | | | 21,378,000 | | | | 22,477,384 | |
3.37% due 05/01/31 | | | 19,375,000 | | | | 21,334,284 | |
3.83% due 05/01/49 | | | 19,000,000 | | | | 21,283,588 | |
2.87% due 09/01/29 | | | 20,000,000 | | | | 21,161,978 | |
2.81% due 09/01/39 | | | 20,780,000 | | | | 20,826,958 | |
3.56% due 03/01/31 | | | 18,550,000 | | | | 20,747,930 | |
3.49% due 04/01/30 | | | 18,530,222 | | | | 20,479,100 | |
2.96% due 11/01/29 | | | 18,620,000 | | | | 19,670,246 | |
3.17% due 02/01/28 | | | 18,350,000 | | | | 19,573,247 | |
3.66% due 03/01/31 | | | 16,821,000 | | | | 18,850,529 | |
2.70% due 10/01/39††† | | | 18,700,000 | | | | 18,466,455 | |
4.17% due 02/01/49 | | | 15,500,000 | | | | 17,851,215 | |
3.62% due 04/01/34 | | | 14,435,000 | | | | 16,218,316 | |
2.24% due 11/01/22 | | | 16,010,047 | | | | 16,154,623 | |
1.95% due 11/01/20 | | | 15,550,000 | | | | 15,507,290 | |
3.75% due 03/01/34 | | | 13,500,000 | | | | 15,342,078 | |
3.19% due 02/01/30 | | | 13,694,445 | | | | 14,742,717 | |
4.08% due 04/01/49 | | | 12,879,000 | | | | 14,490,093 | |
3.42% due 09/01/47 | | | 13,076,995 | | | | 14,021,638 | |
3.07% due 01/01/28 | | | 13,100,000 | | | | 13,689,507 | |
3.66% due 03/01/34 | | | 12,041,241 | | | | 13,409,478 | |
2.82% due 10/01/29 | | | 12,100,000 | | | | 12,737,660 | |
3.59% due 04/01/33 | | | 11,280,000 | | | | 12,219,157 | |
16 | THE GUGGENHEIM FUNDS ANNUAL REPORT | SEE NOTES TO FINANCIAL STATEMENTS. |
SCHEDULE OF INVESTMENTS (continued) | September 30, 2019 |
TOTAL RETURN BOND FUND | |
| | Face
Amount~ | | | Value | |
2.55% due 12/01/29††† | | | 11,868,000 | | | $ | 11,922,091 | |
3.03% due 12/01/27 | | | 10,900,000 | | | | 11,362,617 | |
3.41% due 02/01/33 | | | 10,250,000 | | | | 11,286,781 | |
4.21% due 10/01/48 | | | 9,750,000 | | | | 11,260,529 | |
3.08% due 10/01/32 | | | 10,250,000 | | | | 10,976,751 | |
3.51% due 04/01/34 | | | 9,820,000 | | | | 10,913,889 | |
3.42% due 04/01/30 | | | 9,800,000 | | | | 10,784,081 | |
3.31% due 01/01/33 | | | 9,700,000 | | | | 10,608,888 | |
3.05% due 10/01/29 | | | 9,100,000 | | | | 9,722,765 | |
3.06% due 12/01/27 | | | 9,000,000 | | | | 9,391,562 | |
3.60% due 03/01/30 | | | 8,341,000 | | | | 9,309,575 | |
3.04% due 01/01/28 | | | 8,900,000 | | | | 9,287,195 | |
3.08% due 01/01/30 | | | 8,500,000 | | | | 9,152,952 | |
2.94% due 10/01/32 | | | 8,453,677 | | | | 8,977,426 | |
3.43% due 03/01/33 | | | 8,100,000 | | | | 8,651,211 | |
3.57% due 06/01/34 | | | 7,510,000 | | | | 8,442,848 | |
3.48% due 04/01/30 | | | 7,000,000 | | | | 7,687,487 | |
3.29% due 03/01/33 | | | 6,700,000 | | | | 7,258,315 | |
3.14% due 01/01/28 | | | 6,900,000 | | | | 7,236,156 | |
2.99% due 09/01/29 | | | 6,800,000 | | | | 7,202,473 | |
3.34% due 05/01/34 | | | 6,500,000 | | | | 7,178,415 | |
3.63% due 04/01/34 | | | 6,338,000 | | | | 7,128,061 | |
2.52% due 11/01/34††† | | | 7,118,000 | | | | 7,082,794 | |
4.04% due 08/01/48 | | | 6,100,000 | | | | 6,839,733 | |
2.51% due 11/01/34††† | | | 6,559,000 | | | | 6,542,402 | |
3.44% due 05/01/34 | | | 5,850,000 | | | | 6,469,365 | |
3.60% due 04/01/33 | | | 5,600,000 | | | | 6,273,104 | |
2.47% due 10/01/34 | | | 6,184,850 | | | | 6,127,302 | |
3.13% due 02/01/28 | | | 5,900,000 | | | | 6,048,593 | |
3.21% due 01/01/33 | | | 5,500,000 | | | | 5,977,239 | |
4.07% due 05/01/49 | | | 4,879,706 | | | | 5,548,902 | |
3.39% due 02/01/30 | | | 4,800,000 | | | | 5,271,471 | |
3.10% due 01/01/33 | | | 4,800,000 | | | | 5,138,585 | |
3.22% due 01/01/30 | | | 4,650,000 | | | | 5,035,818 | |
3.50% due 02/01/48 | | | 4,505,503 | | | | 4,838,667 | |
3.16% due 01/01/30 | | | 4,500,000 | | | | 4,835,375 | |
3.11% due 01/01/28 | | | 4,600,000 | | | | 4,742,117 | |
3.39% due 02/01/33 | | | 4,300,000 | | | | 4,713,241 | |
3.33% due 04/01/30 | | | 4,230,561 | | | | 4,579,870 | |
3.76% due 03/01/37 | | | 4,000,000 | | | | 4,535,153 | |
4.00% due 12/01/38 | | | 4,315,066 | | | | 4,520,197 | |
4.50% due 04/01/48 | | | 4,120,873 | | | | 4,368,626 | |
4.27% due 12/01/33 | | | 3,709,501 | | | | 4,219,914 | |
3.65% due 03/01/33 | | | 3,600,000 | | | | 3,965,241 | |
3.50% due 12/01/47 | | | 3,791,316 | | | | 3,949,820 | |
4.24% due 08/01/48 | | | 3,400,000 | | | | 3,902,541 | |
3.69% due 03/01/29 | | | 3,500,000 | | | | 3,885,541 | |
3.11% due 11/01/27 | | | 3,500,000 | | | | 3,685,972 | |
3.77% due 03/01/31 | | | 3,200,000 | | | | 3,628,999 | |
3.92% due 04/01/39 | | | 3,198,000 | | | | 3,531,726 | |
3.18% due 01/01/30 | | | 3,000,000 | | | | 3,234,629 | |
2.60% due 10/01/34††† | | | 3,200,000 | | | | 3,225,055 | |
3.50% due 12/01/46 | | | 2,998,864 | | | | 3,115,665 | |
3.36% due 05/01/34 | | | 2,736,553 | | | | 3,007,825 | |
2.84% due 01/01/35 | | | 2,915,000 | | | | 3,006,535 | |
3.94% due 06/01/35 | | | 2,600,000 | | | | 2,952,162 | |
2.96% due 10/01/49††† | | | 2,962,500 | | | | 2,943,182 | |
3.12% due 02/01/28 | | | 2,600,000 | | | | 2,789,631 | |
3.53% due 04/01/33 | | | 2,500,000 | | | | 2,788,928 | |
2.66% due 01/01/35††† | | | 2,750,000 | | | | 2,775,159 | |
4.00% due 01/01/46 | | | 2,581,465 | | | | 2,722,854 | |
2.33% due 10/01/31††† | | | 2,684,000 | | | | 2,659,761 | |
2.62% due 10/01/29 | | | 2,635,000 | | | | 2,651,903 | |
3.26% due 11/01/46 | | | 2,519,637 | | | | 2,624,770 | |
2.86% due 01/01/33 | | | 2,524,000 | | | | 2,603,478 | |
3.58% due 12/01/27 | | | 2,269,700 | | | | 2,483,438 | |
3.55% due 04/01/33 | | | 2,150,000 | | | | 2,401,236 | |
2.69% due 11/01/34 | | | 2,350,000 | | | | 2,364,504 | |
3.51% due 11/01/37 | | | 2,150,000 | | | | 2,348,015 | |
4.00% due 08/01/47 | | | 2,058,016 | | | | 2,178,199 | |
3.50% due 12/01/45 | | | 2,075,686 | | | | 2,168,287 | |
3.16% due 11/01/30 | | | 1,997,870 | | | | 2,087,733 | |
3.46% due 08/01/49 | | | 1,747,914 | | | | 1,899,763 | |
3.00% due 07/01/46 | | | 1,771,604 | | | | 1,814,568 | |
3.14% due 12/01/32 | | | 1,600,000 | | | | 1,726,608 | |
2.57% due 10/01/29 | | | 1,700,000 | | | | 1,703,989 | |
3.27% due 01/01/30 | | | 1,350,000 | | | | 1,467,167 | |
3.27% due 08/01/34 | | | 1,325,573 | | | | 1,441,614 | |
2.97% due 11/01/25 | | | 1,369,225 | | | | 1,434,443 | |
3.74% due 02/01/48 | | | 1,296,497 | | | | 1,409,363 | |
3.02% due 11/01/27 | | | 1,300,000 | | | | 1,352,951 | |
4.05% due 09/01/48 | | | 1,194,446 | | | | 1,339,489 | |
3.96% due 06/01/49 | | | 996,525 | | | | 1,111,901 | |
SEE NOTES TO FINANCIAL STATEMENTS. | THE GUGGENHEIM FUNDS ANNUAL REPORT | 17 |
SCHEDULE OF INVESTMENTS (continued) | September 30, 2019 |
TOTAL RETURN BOND FUND | |
| | Face
Amount~ | | | Value | |
4.50% due 02/01/45 | | | 993,356 | | | $ | 1,072,746 | |
3.13% due 01/01/30 | | | 1,000,000 | | | | 1,070,554 | |
3.60% due 10/01/47 | | | 970,108 | | | | 1,053,189 | |
3.63% due 01/01/37 | | | 730,193 | | | | 803,426 | |
5.00% due 05/01/44 | | | 717,022 | | | | 781,006 | |
3.91% due 07/01/49 | | | 698,499 | | | | 777,722 | |
2.75% due 11/01/31 | | | 649,787 | | | | 678,013 | |
4.50% due 05/01/47 | | | 622,611 | | | | 667,592 | |
5.00% due 12/01/44 | | | 569,021 | | | | 622,826 | |
3.50% due 08/01/43 | | | 568,704 | | | | 596,763 | |
4.87% due 04/01/49††† | | | 546,968 | | | | 574,631 | |
4.33% due 09/01/48 | | | 345,199 | | | | 391,758 | |
4.22% due 04/01/49 | | | 315,000 | | | | 356,599 | |
Freddie Mac Multifamily Structured Pass Through Certificates | | | | | | | | |
2017-KIR3, 3.28% due 08/25/27 | | | 91,932,800 | | | | 99,424,606 | |
2019-K087, 3.77% due 12/25/28 | | | 80,750,000 | | | | 90,815,011 | |
2017-KGX1, 3.00% due 10/25/27 | | | 81,400,000 | | | | 86,467,826 | |
2017-KW03, 3.02% due 06/25/27 | | | 65,900,000 | | | | 69,604,694 | |
2018-K074, 3.60% due 02/25/28 | | | 34,823,000 | | | | 38,322,273 | |
2017-K066, 3.20% due 06/25/27 | | | 19,507,000 | | | | 20,911,434 | |
2017-K061, 3.44% (WAC) due 11/25/264 | | | 15,000,000 | | | | 16,279,374 | |
2016-K060, 3.30% (WAC) due 10/25/264 | | | 13,000,000 | | | | 13,972,469 | |
2018-K073, 3.45% (WAC) due 01/25/284 | | | 11,600,000 | | | | 12,676,784 | |
2018-K078, 3.92% due 06/25/28 | | | 10,150,000 | | | | 11,412,114 | |
2017-K069, 3.25% (WAC) due 09/25/274 | | | 10,000,000 | | | | 10,752,953 | |
2016-K057, 2.62% due 08/25/26 | | | 10,000,000 | | | | 10,297,538 | |
2018-K154, 3.46% due 11/25/32 | | | 8,500,000 | | | | 9,410,697 | |
2016-K152, 3.08% due 01/25/31 | | | 7,090,000 | | | | 7,474,263 | |
2017-K070, 3.36% due 12/25/27 | | | 6,000,000 | | | | 6,505,601 | |
2015-K151, 3.51% due 04/25/30 | | | 2,105,000 | | | | 2,296,175 | |
2015-K043, 0.67% (WAC) due 12/25/244,5 | | | 43,985,362 | | | | 1,094,971 | |
2014-K715, 2.86% due 01/25/21 | | | 441,646 | | | | 444,213 | |
Freddie Mac Seasoned Credit Risk Transfer Trust | | | | | | | | |
2017-3, 3.00% due 07/25/56 | | | 65,758,033 | | | | 67,182,477 | |
2017-4, 3.00% due 06/25/576 | | | 57,381,429 | | | | 58,542,485 | |
2018-1, 2.75% due 05/25/576 | | | 39,642,209 | | | | 40,424,508 | |
2017-4, 3.50% due 06/25/57 | | | 29,334,381 | | | | 30,792,975 | |
Fannie Mae-Aces | | | | | | | | |
2017-M11, 2.98% due 08/25/29 | | | 52,100,000 | | | | 55,195,292 | |
2018-M3, 3.19% (WAC) due 02/25/304 | | | 7,800,000 | | | | 8,304,661 | |
Freddie Mac | | | | | | | | |
3.55% due 10/01/33 | | | 4,645,449 | | | | 5,112,198 | |
4.00% due 01/15/46 | | | 4,673,889 | | | | 4,902,535 | |
3.50% due 01/01/44 | | | 2,393,391 | | | | 2,508,840 | |
4.00% due 02/01/46 | | | 2,367,407 | | | | 2,497,492 | |
4.50% due 06/01/48 | | | 2,047,563 | | | | 2,169,495 | |
3.26% due 09/01/45 | | | 1,928,380 | | | | 2,024,724 | |
4.00% due 11/01/45 | | | 1,820,437 | | | | 1,921,632 | |
3.00% due 08/01/46 | | | 1,801,931 | | | | 1,846,646 | |
3.40% due 04/01/31 | | | 1,000,000 | | | | 1,090,804 | |
18 | THE GUGGENHEIM FUNDS ANNUAL REPORT | SEE NOTES TO FINANCIAL STATEMENTS. |
SCHEDULE OF INVESTMENTS (continued) | September 30, 2019 |
TOTAL RETURN BOND FUND | |
| | Face
Amount~ | | | Value | |
FREMF Mortgage Trust | | | | | | | | |
2013-K29, 0.13% due 05/25/465,7 | | | 772,380,678 | | | $ | 2,707,503 | |
Total Government Agency | | | 2,258,150,495 | |
| | | | | | | | | |
Residential Mortgage Backed Securities - 10.7% |
New Residential Advance Receivables Trust Advance Receivables Backed | | | | | | | | |
2019-T3, 2.51% due 10/20/527 | | | 74,650,000 | | | | 74,808,161 | |
2019-T2, 2.52% due 08/15/537 | | | 30,500,000 | | | | 30,424,357 | |
Soundview Home Loan Trust | | | | | | | | |
2006-OPT5, 2.16% (1 Month USD LIBOR + 0.14%, Rate Floor: 0.14%) due 07/25/364 | | | 74,618,374 | | | | 72,752,369 | |
2005-OPT3, 2.49% (1 Month USD LIBOR + 0.47%, Rate Floor: 0.47%) due 11/25/354 | | | 19,495,000 | | | | 19,275,623 | |
2007-1, 2.19% (1 Month USD LIBOR + 0.17%, Rate Floor: 0.17%) due 03/25/374 | | | 1,843,380 | | | | 1,839,087 | |
Home Equity Loan Trust | | | | | | | | |
2007-FRE1, 2.21% (1 Month USD LIBOR + 0.19%, Rate Floor: 0.19%) due 04/25/374 | | | 96,480,432 | | | | 91,178,234 | |
Structured Asset Securities Corporation Mortgage Loan Trust | | | | | | | | |
2008-BC4, 2.65% (1 Month USD LIBOR + 0.63%, Rate Floor: 0.63%) due 11/25/374 | | | 43,858,906 | | | | 43,750,513 | |
2006-BC4, 2.19% (1 Month USD LIBOR + 0.17%, Rate Floor: 0.17%) due 12/25/364 | | | 6,197,288 | | | | 6,011,016 | |
2006-BC3, 2.18% (1 Month USD LIBOR + 0.16%, Rate Floor: 0.16%) due 10/25/364 | | | 5,793,389 | | | | 5,378,476 | |
2006-BC6, 2.19% (1 Month USD LIBOR + 0.17%, Rate Floor: 0.17%) due 01/25/374 | | | 699,627 | | | | 689,654 | |
CIT Mortgage Loan Trust | | | | | | | | |
2007-1, 3.37% (1 Month USD LIBOR + 1.35%, Rate Floor: 1.35%) due 10/25/374,7 | | | 49,368,633 | | | | 49,917,528 | |
2007-1, 3.47% (1 Month USD LIBOR + 1.45%, Rate Floor: 1.45%) due 10/25/374,7 | | | 3,434,762 | | | | 3,450,144 | |
Alternative Loan Trust | | | | | | | | |
2007-OA4, 2.19% (1 Month USD LIBOR + 0.17%, Rate Floor: 0.17%) due 05/25/474 | | | 27,789,939 | | | | 26,713,518 | |
2007-OH3, 2.31% (1 Month USD LIBOR + 0.29%, Rate Cap/Floor: 10.00%/0.29%) due 09/25/474 | | | 10,284,869 | | | | 10,291,043 | |
2005-38, 2.37% (1 Month USD LIBOR + 0.35%, Rate Floor: 0.35%) due 09/25/354 | | | 7,869,077 | | | | 7,777,007 | |
SEE NOTES TO FINANCIAL STATEMENTS. | THE GUGGENHEIM FUNDS ANNUAL REPORT | 19 |
SCHEDULE OF INVESTMENTS (continued) | September 30, 2019 |
TOTAL RETURN BOND FUND | |
| | Face
Amount~ | | | Value | |
2007-OA7, 2.20% (1 Month USD LIBOR + 0.18%, Rate Floor: 0.18%) due 05/25/474 | | | 4,504,497 | | | $ | 4,290,620 | |
NovaStar Mortgage Funding Trust Series | | | | | | | | |
2007-2, 2.22% (1 Month USD LIBOR + 0.20%, Rate Cap/Floor: 11.00%/0.20%) due 09/25/374 | | | 50,375,128 | | | | 48,956,856 | |
CSMC Trust | | | | | | | | |
2018-RPL9, 3.85% (WAC) due 09/25/574,7 | | | 45,609,525 | | | | 47,336,452 | |
BRAVO Residential Funding Trust | | | | | | | | |
2019-NQM1, 2.67% (WAC) due 07/25/594,7 | | | 43,127,660 | | | | 43,185,020 | |
CIM Trust | | | | | | | | |
2018-R4, 4.07% (WAC) due 12/26/574,7 | | | 29,258,492 | | | | 29,607,355 | |
2018-R2, 3.69% (WAC) due 08/25/574,7 | | | 13,361,020 | | | | 13,436,380 | |
New Residential Mortgage Loan Trust | | | | | | | | |
2019-RPL1, 4.33% due 02/26/246,7 | | | 18,409,362 | | | | 18,535,035 | |
2018-1A, 4.00% (WAC) due 12/25/574,7 | | | 14,676,741 | | | | 15,222,666 | |
2018-2A, 3.50% (WAC) due 02/25/584,7 | | | 4,121,809 | | | | 4,204,528 | |
2017-5A, 3.52% (1 Month USD LIBOR + 1.50%, Rate Floor: 1.50%) due 06/25/574,7 | | | 3,121,404 | | | | 3,167,143 | |
Morgan Stanley ABS Capital I Incorporated Trust | | | | | | | | |
2007-HE6, 2.20% (1 Month USD LIBOR + 0.18%, Rate Floor: 0.18%) due 05/25/374 | | | 28,984,670 | | | | 26,446,494 | |
2006-NC1, 2.40% (1 Month USD LIBOR + 0.38%, Rate Floor: 0.38%) due 12/25/354 | | | 7,800,000 | | | | 7,733,854 | |
2007-HE6, 2.08% (1 Month USD LIBOR + 0.06%, Rate Floor: 0.06%) due 05/25/374 | | | 3,946,249 | | | | 3,574,329 | |
2007-HE6, 2.27% (1 Month USD LIBOR + 0.25%, Rate Floor: 0.25%) due 05/25/374 | | | 2,898,600 | | | | 2,659,650 | |
Ocwen Master Advance Receivables Trust | | | | | | | | |
2019-T2, 2.42% due 08/15/517 | | | 39,100,000 | | | | 39,194,094 | |
Bear Stearns Asset Backed Securities I Trust | | | | | | | | |
2006-HE9, 2.16% (1 Month USD LIBOR + 0.14%, Rate Floor: 0.14%) due 11/25/364 | | | 27,721,049 | | | | 27,036,629 | |
2006-HE3, 2.38% (1 Month USD LIBOR + 0.36%, Rate Floor: 0.36%) due 04/25/364 | | | 7,508,005 | | | | 7,464,885 | |
Cascade Funding Mortgage Trust | | | | | | | | |
2018-RM2, 4.00% (WAC) due 10/25/684,7 | | | 19,047,375 | | | | 19,683,190 | |
20 | THE GUGGENHEIM FUNDS ANNUAL REPORT | SEE NOTES TO FINANCIAL STATEMENTS. |
SCHEDULE OF INVESTMENTS (continued) | September 30, 2019 |
TOTAL RETURN BOND FUND | |
| | Face
Amount~ | | | Value | |
2019-RM3, 2.80% (WAC) due 06/25/694,7 | | | 14,000,000 | | | $ | 14,172,826 | |
Citigroup Mortgage Loan Trust | | | | | | | | |
2019-IMC1, 2.72% (WAC) due 07/25/494,7 | | | 21,922,979 | | | | 21,890,707 | |
2005-HE3, 2.75% (1 Month USD LIBOR + 0.74%, Rate Floor: 0.49%) due 09/25/354 | | | 11,687,000 | | | | 11,683,122 | |
NRPL Trust | | | | | | | | |
2019-3, 3.00% (WAC) due 06/01/594,7 | | | 33,203,000 | | | | 33,103,727 | |
Towd Point Mortgage Trust | | | | | | | | |
2017-6, 2.75% (WAC) due 10/25/574,7 | | | 14,664,190 | | | | 14,804,004 | |
2017-5, 2.62% (1 Month USD LIBOR + 0.60%, Rate Floor: 0.00%) due 02/25/574,7 | | | 11,163,064 | | | | 11,120,134 | |
2018-1, 3.00% (WAC) due 01/25/584,7 | | | 6,600,845 | | | | 6,683,851 | |
RALI Series Trust | | | | | | | | |
2007-QO4, 2.21% (1 Month USD LIBOR + 0.19%, Rate Floor: 0.19%) due 05/25/474 | | | 8,765,105 | | | | 8,591,122 | |
2006-QO2, 2.24% (1 Month USD LIBOR + 0.22%, Rate Floor: 0.22%) due 02/25/464 | | | 19,899,849 | | | | 7,382,247 | |
2007-QO2, 2.17% (1 Month USD LIBOR + 0.15%, Rate Floor: 0.15%) due 02/25/474 | | | 10,592,572 | | | | 5,817,573 | |
2005-QO1, 2.32% (1 Month USD LIBOR + 0.30%, Rate Floor: 0.30%) due 08/25/354 | | | 4,283,005 | | | | 3,872,153 | |
2006-QS8, 2.47% (1 Month USD LIBOR + 0.45%, Rate Floor: 0.45%) due 08/25/364 | | | 3,442,560 | | | | 2,694,485 | |
2006-QO2, 2.29% (1 Month USD LIBOR + 0.27%, Rate Floor: 0.27%) due 02/25/464 | | | 4,905,472 | | | | 1,858,682 | |
2007-QO3, 2.18% (1 Month USD LIBOR + 0.16%, Rate Floor: 0.16%) due 03/25/474 | | | 1,676,010 | | | | 1,627,192 | |
Starwood Mortgage Residential Trust | | | | | | | | |
2019-1, 2.94% (WAC) due 06/25/494,7 | | | 29,738,802 | | | | 29,800,516 | |
HSI Asset Securitization Corporation Trust | | | | | | | | |
2006-OPT2, 2.41% (1 Month USD LIBOR + 0.39%, Rate Floor: 0.39%) due 01/25/364 | | | 29,140,000 | | | | 29,040,764 | |
American Home Mortgage Investment Trust | | | | | | | | |
2007-1, 2.08% due 05/25/475 | | | 176,758,504 | | | | 28,878,999 | |
First NLC Trust | | | | | | | | |
2005-4, 2.41% (1 Month USD LIBOR + 0.39%, Rate Cap/Floor: 14.00%/0.39%) due 02/25/364 | | | 23,134,058 | | | | 23,173,192 | |
SEE NOTES TO FINANCIAL STATEMENTS. | THE GUGGENHEIM FUNDS ANNUAL REPORT | 21 |
SCHEDULE OF INVESTMENTS (continued) | September 30, 2019 |
TOTAL RETURN BOND FUND | |
| | Face
Amount~ | | | Value | |
2005-1, 2.48% (1 Month USD LIBOR + 0.46%, Rate Cap/Floor: 14.00%/0.23%) due 05/25/354 | | | 2,858,285 | | | $ | 2,798,428 | |
Homeward Opportunities Fund I Trust | | | | | | | | |
2019-2, 2.70% (WAC) due 09/25/594,7 | | | 24,750,886 | | | | 24,719,106 | |
Countrywide Asset-Backed Certificates | | | | | | | | |
2006-6, 2.19% (1 Month USD LIBOR + 0.17%, Rate Floor: 0.17%) due 09/25/364 | | | 21,897,832 | | | | 21,699,567 | |
2005-15, 2.47% (1 Month USD LIBOR + 0.45%, Rate Floor: 0.45%) due 03/25/364 | | | 1,500,000 | | | | 1,481,321 | |
Deephaven Residential Mortgage Trust | | | | | | | | |
2019-3A, 2.96% (WAC) due 07/25/594,7 | | | 15,545,669 | | | | 15,614,650 | |
2017-3A, 2.58% (WAC) due 10/25/474,7 | | | 4,850,808 | | | | 4,835,991 | |
2018-1A, 3.03% (WAC) due 12/25/574,7 | | | 2,435,477 | | | | 2,432,777 | |
Freddie Mac STACR Trust | | | | | | | | |
2019-DNA3, 2.75% (1 Month USD LIBOR + 0.73%, Rate Floor: 0.00%) due 07/25/494,7 | | | 22,716,546 | | | | 22,724,933 | |
GSAMP Trust | | | | | | | | |
2007-NC1, 2.15% (1 Month USD LIBOR + 0.13%, Rate Floor: 0.13%) due 12/25/464 | | | 34,072,737 | | | | 21,986,026 | |
2005-HE6, 2.46% (1 Month USD LIBOR + 0.44%, Rate Floor: 0.44%) due 11/25/354 | | | 305,742 | | | | 306,435 | |
Washington Mutual Mortgage Pass-Through Certificates WMALT Series Trust | | | | | | | | |
2006-AR9, 3.28% (1 Year CMT Rate + 0.83%, Rate Floor: 0.83%) due 11/25/464 | | | 14,682,763 | | | | 13,749,940 | |
2006-AR9, 3.29% (1 Year CMT Rate + 0.84%, Rate Floor: 0.84%) due 11/25/464 | | | 6,934,818 | | | | 6,309,307 | |
2006-7, 4.29% due 09/25/36 | | | 2,606,379 | | | | 1,222,512 | |
2006-8, 4.38% due 10/25/36 | | | 432,253 | | | | 231,474 | |
HarborView Mortgage Loan Trust | | | | | | | | |
2006-14, 2.21% (1 Month USD LIBOR + 0.15%, Rate Floor: 0.15%) due 01/25/474 | | | 11,098,844 | | | | 11,014,898 | |
2006-12, 2.25% (1 Month USD LIBOR + 0.19%, Rate Floor: 0.19%) due 01/19/384 | | | 9,094,460 | | | | 8,786,245 | |
22 | THE GUGGENHEIM FUNDS ANNUAL REPORT | SEE NOTES TO FINANCIAL STATEMENTS. |
SCHEDULE OF INVESTMENTS (continued) | September 30, 2019 |
TOTAL RETURN BOND FUND | |
| | Face
Amount~ | | | Value | |
Nationstar Home Equity Loan Trust | | | | | | | | |
2007-B, 2.24% (1 Month USD LIBOR + 0.22%, Rate Floor: 0.22%) due 04/25/374 | | | 18,464,023 | | | $ | 18,256,777 | |
LSTAR Securities Investment Trust | | | | | | | | |
2019-1, 3.79% (1 Month USD LIBOR + 1.70%, Rate Floor: 0.00%) due 03/01/244,7 | | | 10,818,461 | | | | 10,824,411 | |
2018-2, 3.53% (1 Month USD LIBOR + 1.50%, Rate Floor: 0.00%) due 04/01/234,7 | | | 7,284,873 | | | | 7,277,952 | |
Credit-Based Asset Servicing & Securitization LLC | | | | | | | | |
2006-CB2, 2.21% (1 Month USD LIBOR + 0.19%, Rate Floor: 0.19%) due 12/25/364 | | | 18,002,952 | | | | 17,645,698 | |
COLT Mortgage Loan Trust | | | | | | | | |
2018-3, 3.69% (WAC) due 10/26/484,7 | | | 15,523,009 | | | | 15,623,832 | |
Legacy Mortgage Asset Trust | | | | | | | | |
2018-GS3, 4.00% due 06/25/586,7 | | | 14,151,883 | | | | 14,309,659 | |
Impac Secured Assets CMN Owner Trust | | | | | | | | |
2005-2, 2.27% (1 Month USD LIBOR + 0.25%, Rate Floor: 0.25%) due 03/25/364 | | | 12,341,387 | | | | 11,915,248 | |
JP Morgan Mortgage Acquisition Trust | | | | | | | | |
2006-WMC4, 2.14% (1 Month USD LIBOR + 0.12%, Rate Floor: 0.12%) due 12/25/364 | | | 15,124,353 | | | | 9,540,030 | |
2006-HE2, 2.16% (1 Month USD LIBOR + 0.14%, Rate Floor: 0.14%) due 07/25/364 | | | 2,302,043 | | | | 2,293,760 | |
Lehman XS Trust Series | | | | | | | | |
2007-2N, 2.20% (1 Month USD LIBOR + 0.18%, Rate Floor: 0.18%) due 02/25/374 | | | 8,010,597 | | | | 7,946,836 | |
2007-15N, 2.27% (1 Month USD LIBOR + 0.25%, Rate Floor: 0.00%) due 08/25/374 | | | 3,357,463 | | | | 3,337,863 | |
Deutsche Alt-A Securities Mortgage Loan Trust Series | | | | | | | | |
2006-AF1, 2.32% (1 Month USD LIBOR + 0.30%, Rate Floor: 0.30%) due 04/25/364 | | | 6,949,723 | | | | 6,727,992 | |
2007-OA2, 3.22% (1 Year CMT Rate + 0.77%, Rate Floor: 0.77%) due 04/25/474 | | | 3,824,664 | | | | 3,667,551 | |
CSMC Series | | | | | | | | |
2015-12R, 2.77% (WAC) due 11/30/374,7 | | | 10,309,115 | | | | 10,265,963 | |
SEE NOTES TO FINANCIAL STATEMENTS. | THE GUGGENHEIM FUNDS ANNUAL REPORT | 23 |
SCHEDULE OF INVESTMENTS (continued) | September 30, 2019 |
TOTAL RETURN BOND FUND | |
| | Face
Amount~ | | | Value | |
Wachovia Asset Securitization Issuance II LLC Trust | | | | | | | | |
2007-HE1, 2.16% (1 Month USD LIBOR + 0.14%, Rate Floor: 0.14%) due 07/25/374,7 | | | 5,735,480 | | | $ | 5,300,107 | |
2007-HE2A, 2.28% (1 Month USD LIBOR + 0.13%, Rate Floor: 0.13%) due 07/25/374,7 | | | 4,826,682 | | | | 4,624,024 | |
American Home Mortgage Assets Trust | | | | | | | | |
2006-4, 2.21% (1 Month USD LIBOR + 0.19%, Rate Floor: 0.19%) due 10/25/464 | | | 10,966,362 | | | | 7,609,586 | |
2006-6, 2.21% (1 Month USD LIBOR + 0.19%, Rate Floor: 0.19%) due 12/25/464 | | | 2,573,526 | | | | 2,228,687 | |
Asset Backed Securities Corporation Home Equity Loan Trust Series AEG | | | | | | | | |
2006-HE1, 2.42% (1 Month USD LIBOR + 0.40%, Rate Floor: 0.40%) due 01/25/364 | | | 10,072,000 | | | | 9,758,499 | |
WaMu Mortgage Pass-Through Certificates Series Trust | | | | | | | | |
2007-OA6, 3.26% (1 Year CMT Rate + 0.81%, Rate Floor: 0.81%) due 07/25/474 | | | 7,510,128 | | | | 6,851,988 | |
2006-AR13, 3.33% (1 Year CMT Rate + 0.88%, Rate Floor: 0.88%) due 10/25/464 | | | 1,612,813 | | | | 1,528,511 | |
2006-AR11, 3.37% (1 Year CMT Rate + 0.92%, Rate Floor: 0.92%) due 09/25/464 | | | 1,348,040 | | | | 1,294,022 | |
Angel Oak Mortgage Trust LLC | | | | | | | | |
2017-3, 2.71% (WAC) due 11/25/474,7 | | | 8,625,164 | | | | 8,598,636 | |
First Frankin Mortgage Loan Trust | | | | | | | | |
2006-FF3, 2.31% (1 Month USD LIBOR + 0.29%, Rate Floor: 0.29%) due 02/25/364 | | | 8,616,000 | | | | 8,487,560 | |
First Franklin Mortgage Loan Trust | | | | | | | | |
2004-FF10, 3.29% (1 Month USD LIBOR + 1.28%, Rate Floor: 0.85%) due 07/25/344 | | | 6,211,969 | | | | 6,239,143 | |
IndyMac INDX Mortgage Loan Trust | | | | | | | | |
2005-AR18, 2.80% (1 Month USD LIBOR + 0.78%, Rate Cap/Floor: 10.50%/0.78%) due 10/25/364 | | | 7,117,875 | | | | 5,954,000 | |
ASG Resecuritization Trust | | | | | | | | |
2010-3, 2.73% (1 Month USD LIBOR + 0.29%, Rate Cap/Floor: 10.50%/0.29%) due 12/28/454,7 | | | 5,898,669 | | | | 5,828,248 | |
24 | THE GUGGENHEIM FUNDS ANNUAL REPORT | SEE NOTES TO FINANCIAL STATEMENTS. |
SCHEDULE OF INVESTMENTS (continued) | September 30, 2019 |
TOTAL RETURN BOND FUND | |
| | Face
Amount~ | | | Value | |
ACE Securities Corporation Home Equity Loan Trust Series | | | | | | | | |
2005-HE2, 3.04% (1 Month USD LIBOR + 1.02%, Rate Floor: 0.68%) due 04/25/354 | | | 5,700,000 | | | $ | 5,711,373 | |
Argent Securities Incorporated Asset-Backed Pass-Through Certificates Series | | | | | | | | |
2005-W2, 2.51% (1 Month USD LIBOR + 0.49%, Rate Floor: 0.49%) due 10/25/354 | | | 5,435,000 | | | | 5,442,750 | |
Structured Asset Investment Loan Trust | | | | | | | | |
2005-11, 2.74% (1 Month USD LIBOR + 0.72%, Rate Floor: 0.36%) due 01/25/364 | | | 5,191,160 | | | | 5,140,084 | |
Morgan Stanley Capital I Incorporated Trust | | | | | | | | |
2006-HE1, 2.31% (1 Month USD LIBOR + 0.29%, Rate Floor: 0.29%) due 01/25/364 | | | 3,906,689 | | | | 3,858,704 | |
Morgan Stanley Resecuritization Trust | | | | | | | | |
2014-R9, 2.28% (1 Month USD LIBOR + 0.14%, Rate Floor: 0.14%) due 11/26/464,7 | | | 3,719,412 | | | | 3,632,222 | |
CWABS Asset-Backed Certificates Trust | | | | | | | | |
2004-15, 3.37% (1 Month USD LIBOR + 1.35%, Rate Floor: 0.90%) due 04/25/354 | | | 3,490,000 | | | | 3,527,672 | |
WaMu Asset-Backed Certificates WaMu Series | | | | | | | | |
2007-HE4, 2.27% (1 Month USD LIBOR + 0.25%, Rate Floor: 0.25%) due 07/25/474 | | | 4,795,114 | | | | 3,341,396 | |
Luminent Mortgage Trust | | | | | | | | |
2006-2, 2.22% (1 Month USD LIBOR + 0.20%, Rate Floor: 0.20%) due 02/25/464 | | | 3,789,967 | | | | 3,336,864 | |
GE-WMC Asset-Backed Pass-Through Certificates Series | | | | | | | | |
2005-2, 2.27% (1 Month USD LIBOR + 0.25%, Rate Floor: 0.25%) due 12/25/354 | | | 3,342,573 | | | | 3,322,281 | |
GSAA Trust | | | | | | | | |
2005-10, 2.67% (1 Month USD LIBOR + 0.65%, Rate Floor: 0.65%) due 06/25/354 | | | 2,597,490 | | | | 2,617,764 | |
Nomura Resecuritization Trust | | | | | | | | |
2015-4R, 5.17% (1 Month USD LIBOR + 0.43%, Rate Floor: 0.43%) due 03/26/364,7 | | | 1,546,404 | | | | 1,511,687 | |
SEE NOTES TO FINANCIAL STATEMENTS. | THE GUGGENHEIM FUNDS ANNUAL REPORT | 25 |
SCHEDULE OF INVESTMENTS (continued) | September 30, 2019 |
TOTAL RETURN BOND FUND | |
| | Face
Amount~ | | | Value | |
2015-4R, 7.64% (1 Month USD LIBOR + 0.39%, Rate Floor: 0.39%) due 12/26/364,7 | | | 957,711 | | | $ | 942,864 | |
GSAA Home Equity Trust | | | | | | | | |
2006-3, 2.21% (1 Month USD LIBOR + 0.19%, Rate Floor: 0.19%) due 03/25/364 | | | 3,702,624 | | | | 2,069,168 | |
2007-7, 2.29% (1 Month USD LIBOR + 0.27%, Rate Floor: 0.27%) due 07/25/374 | | | 232,822 | | | | 227,036 | |
GSMSC Resecuritization Trust | | | | | | | | |
2015-5R, 2.29% (1 Month USD LIBOR + 0.14%, Rate Floor: 0.14%) due 04/26/374,7 | | | 1,897,110 | | | | 1,891,088 | |
Banc of America Funding Trust | | | | | | | | |
2015-R4, 2.32% (1 Month USD LIBOR + 0.17%, Rate Floor: 0.17%) due 01/27/354,7 | | | 1,764,024 | | | | 1,749,504 | |
Impac Secured Assets Trust | | | | | | | | |
2006-2, 2.19% (1 Month USD LIBOR + 0.17%, Rate Cap/Floor: 11.50%/0.17%) due 08/25/364 | | | 1,644,676 | | | | 1,459,099 | |
RFMSI Series Trust | | | | | | | | |
2006-S11, 6.00% due 11/25/36 | | | 1,398,080 | | | | 1,393,424 | |
Alliance Bancorp Trust | | | | | | | | |
2007-OA1, 2.26% (1 Month USD LIBOR + 0.24%, Rate Floor: 0.24%) due 07/25/374 | | | 905,071 | | | | 829,914 | |
UCFC Manufactured Housing Contract | | | | | | | | |
1997-2, 7.38% due 10/15/28 | | | 530,998 | | | | 560,637 | |
BCAP LLC | | | | | | | | |
2014-RR2, 2.75% (WAC) due 03/26/364,7 | | | 440,017 | | | | 437,502 | |
Morgan Stanley Re-REMIC Trust | | | | | | | | |
2010-R5, 3.37% due 06/26/367 | | | 262,680 | | | | 243,837 | |
Irwin Home Equity Loan Trust | | | | | | | | |
2007-1, 5.85% due 08/25/377 | | | 101,450 | | | | 102,189 | |
Total Residential Mortgage Backed Securities | | | 1,489,386,458 | |
| | | | | | | | | |
Commercial Mortgage Backed Securities - 1.8% |
CGBAM Mezzanine Securities Trust | | | | | | | | |
2015-SMMZ, 8.21% due 04/10/287 | | | 44,400,000 | | | | 45,134,798 | |
Wells Fargo Commercial Mortgage Trust | | | | | | | | |
2017-C38, 1.21% (WAC) due 07/15/504,5 | | | 73,797,052 | | | | 4,676,674 | |
2016-BNK1, 1.91% (WAC) due 08/15/494,5 | | | 37,075,112 | | | | 3,594,406 | |
2017-RB1, 1.43% (WAC) due 03/15/504,5 | | | 40,931,683 | | | | 3,209,871 | |
2016-C35, 2.12% (WAC) due 07/15/484,5 | | | 26,710,790 | | | | 2,715,531 | |
26 | THE GUGGENHEIM FUNDS ANNUAL REPORT | SEE NOTES TO FINANCIAL STATEMENTS. |
SCHEDULE OF INVESTMENTS (continued) | September 30, 2019 |
TOTAL RETURN BOND FUND | |
| | Face
Amount~ | | | Value | |
2017-C42, 1.04% (WAC) due 12/15/504,5 | | | 35,234,029 | | | $ | 2,160,336 | |
2016-NXS5, 1.67% (WAC) due 01/15/594,5 | | | 29,819,065 | | | | 1,883,515 | |
2015-NXS4, 1.05% (WAC) due 12/15/484,5 | | | 38,789,969 | | | | 1,686,677 | |
2017-RC1, 1.67% (WAC) due 01/15/604,5 | | | 20,529,507 | | | | 1,654,857 | |
2016-C32, 4.88% (WAC) due 01/15/594 | | | 1,400,000 | | | | 1,557,474 | |
2015-P2, 1.13% (WAC) due 12/15/484,5 | | | 34,087,495 | | | | 1,462,879 | |
2015-C30, 1.05% (WAC) due 09/15/584,5 | | | 31,543,550 | | | | 1,417,946 | |
2015-NXS1, 1.27% (WAC) due 05/15/484,5 | | | 11,462,286 | | | | 464,908 | |
2015-NXS4, 4.22% (WAC) due 12/15/484 | | | 64,000 | | | | 68,535 | |
Citigroup Commercial Mortgage Trust | | | | | | | | |
2019-GC41, 1.19% (WAC) due 08/10/564,5 | | | 104,984,699 | | | | 8,486,018 | |
2016-C2, 1.92% (WAC) due 08/10/494,5 | | | 33,843,629 | | | | 3,230,757 | |
2016-P4, 2.14% (WAC) due 07/10/494,5 | | | 32,191,307 | | | | 3,169,463 | |
2016-P5, 1.67% (WAC) due 10/10/494,5 | | | 31,142,033 | | | | 2,329,978 | |
2016-GC37, 1.93% (WAC) due 04/10/494,5 | | | 18,744,815 | | | | 1,681,380 | |
2015-GC35, 1.01% (WAC) due 11/10/484,5 | | | 33,521,269 | | | | 1,193,216 | |
2015-GC29, 1.24% (WAC) due 04/10/484,5 | | | 23,590,632 | | | | 1,012,340 | |
2016-C3, 1.31% (WAC) due 11/15/494,5 | | | 12,161,630 | | | | 706,793 | |
2013-GC15, 4.37% (WAC) due 09/10/464 | | | 380,000 | | | | 409,677 | |
CGBAM Commercial Mortgage Trust | | | | | | | | |
2015-SMRT, 3.52% due 04/10/287 | | | 9,900,000 | | | | 9,933,622 | |
2015-SMRT, 3.91% (WAC) due 04/10/284,7 | | | 5,900,000 | | | | 5,926,451 | |
2015-SMRT, 3.77% due 04/10/287 | | | 2,400,000 | | | | 2,410,044 | |
COMM Mortgage Trust | | | | | | | | |
2015-CR26, 1.10% (WAC) due 10/10/484,5 | | | 86,618,576 | | | | 4,075,802 | |
2018-COR3, 0.59% (WAC) due 05/10/514,5 | | | 84,083,918 | | | | 2,929,543 | |
2013-WWP, 3.90% due 03/10/317 | | | 2,000,000 | | | | 2,118,822 | |
2015-CR24, 0.91% (WAC) due 08/10/484,5 | | | 48,525,479 | | | | 1,861,627 | |
2015-CR23, 1.08% (WAC) due 05/10/484,5 | | | 47,716,358 | | | | 1,664,504 | |
2015-CR27, 1.26% (WAC) due 10/10/484,5 | | | 30,691,531 | | | | 1,389,943 | |
2013-CR13, 0.93% (WAC) due 11/10/464,5 | | | 37,542,314 | | | | 1,056,944 | |
2015-CR23, 3.80% due 05/10/48 | | | 700,000 | | | | 745,445 | |
SEE NOTES TO FINANCIAL STATEMENTS. | THE GUGGENHEIM FUNDS ANNUAL REPORT | 27 |
SCHEDULE OF INVESTMENTS (continued) | September 30, 2019 |
TOTAL RETURN BOND FUND | |
| | Face
Amount~ | | | Value | |
2014-LC15, 1.27% (WAC) due 04/10/474,5 | | | 11,667,735 | | | $ | 483,701 | |
JPMDB Commercial Mortgage Securities Trust | | | | | | | | |
2017-C7, 1.05% (WAC) due 10/15/504,5 | | | 137,992,649 | | | | 7,622,286 | |
2016-C4, 0.95% (WAC) due 12/15/494,5 | | | 86,496,956 | | | | 4,143,247 | |
2016-C2, 1.83% (WAC) due 06/15/494,5 | | | 32,391,353 | | | | 2,293,709 | |
2017-C5, 1.14% (WAC) due 03/15/504,5 | | | 8,666,830 | | | | 490,403 | |
Morgan Stanley Capital I Trust | | | | | | | | |
2014-MP, 3.47% due 08/11/337 | | | 11,000,000 | | | | 11,267,841 | |
2016-UBS9, 4.69% (WAC) due 03/15/494 | | | 275,000 | | | | 296,424 | |
CSAIL Commercial Mortgage Trust | | | | | | | | |
2019-C15, 1.22% (WAC) due 03/15/524,5 | | | 97,408,652 | | | | 7,541,105 | |
2015-C1, 1.00% (WAC) due 04/15/504,5 | | | 55,099,655 | | | | 2,005,639 | |
GS Mortgage Securities Trust | | | | | | | | |
2019-GC42, 0.81% (WAC) due 09/01/524,5 | | | 70,000,000 | | | | 4,645,361 | |
2017-GS6, 1.19% (WAC) due 05/10/504,5 | | | 42,676,994 | | | | 2,938,367 | |
2015-GC28, 1.23% (WAC) due 02/10/484,5 | | | 20,626,317 | | | | 746,087 | |
Bancorp Commercial Mortgage Trust | | | | | | | | |
2018-CR3, 3.28% (1 Month USD LIBOR + 1.25%, Rate Floor: 1.25%) due 01/15/334,7 | | | 7,075,000 | | | | 7,086,174 | |
Aventura Mall Trust | | | | | | | | |
2013-AVM, 3.87% (WAC) due 12/05/324,7 | | | 6,600,000 | | | | 6,677,542 | |
CD Mortgage Trust | | | | | | | | |
2017-CD6, 1.11% (WAC) due 11/13/504,5 | | | 47,249,530 | | | | 2,580,684 | |
2016-CD1, 1.55% (WAC) due 08/10/494,5 | | | 35,166,317 | | | | 2,579,819 | |
2016-CD2, 0.81% (WAC) due 11/10/494,5 | | | 34,682,838 | | | | 1,208,180 | |
GRACE Mortgage Trust | | | | | | | | |
2014-GRCE, 3.37% due 06/10/287 | | | 6,000,000 | | | | 6,091,855 | |
UBS Commercial Mortgage Trust | | | | | | | | |
2017-C5, 1.16% (WAC) due 11/15/504,5 | | | 54,061,906 | | | | 3,213,618 | |
2017-C2, 1.24% (WAC) due 08/15/504,5 | | | 43,278,888 | | | | 2,848,807 | |
JP Morgan Chase Commercial Mortgage Securities Trust | | | | | | | | |
2016-JP3, 1.57% (WAC) due 08/15/494,5 | | | 70,239,732 | | | | 5,404,582 | |
BENCHMARK Mortgage Trust | | | | | | | | |
2018-B2, 0.56% (WAC) due 02/15/514,5 | | | 132,355,754 | | | | 3,507,083 | |
28 | THE GUGGENHEIM FUNDS ANNUAL REPORT | SEE NOTES TO FINANCIAL STATEMENTS. |
SCHEDULE OF INVESTMENTS (continued) | September 30, 2019 |
TOTAL RETURN BOND FUND | |
| | Face
Amount~ | | | Value | |
2018-B6, 0.60% (WAC) due 10/10/514,5 | | | 64,810,875 | | | $ | 1,894,804 | |
JPMBB Commercial Mortgage Securities Trust | | | | | | | | |
2015-C27, 1.43% (WAC) due 02/15/484,5 | | | 94,306,666 | | | | 4,100,699 | |
2013-C12, 0.60% (WAC) due 07/15/454,5 | | | 36,442,015 | | | | 529,346 | |
CD Commercial Mortgage Trust | | | | | | | | |
2017-CD4, 1.47% (WAC) due 05/10/504,5 | | | 32,263,416 | | | | 2,347,047 | |
2017-CD3, 1.18% (WAC) due 02/10/504,5 | | | 34,629,119 | | | | 2,113,789 | |
JPMCC Commercial Mortgage Securities Trust | | | | | | | | |
2017-JP6, 1.46% (WAC) due 07/15/504,5 | | | 59,471,261 | | | | 3,628,889 | |
BBCMS Mortgage Trust | | | | | | | | |
2018-C2, 0.77% (WAC) due 12/15/514,5 | | | 58,388,247 | | | | 3,496,820 | |
CGMS Commercial Mortgage Trust | | | | | | | | |
2017-B1, 0.99% (WAC) due 08/15/504,5 | | | 65,944,943 | | | | 3,360,211 | |
Vornado DP LLC Trust | | | | | | | | |
2010-VNO, 4.00% due 09/13/287 | | | 3,260,000 | | | | 3,288,181 | |
BANK | | | | | | | | |
2017-BNK6, 1.00% (WAC) due 07/15/604,5 | | | 43,702,879 | | | | 2,201,109 | |
2017-BNK4, 1.59% (WAC) due 05/15/504,5 | | | 13,127,879 | | | | 1,045,267 | |
Morgan Stanley Bank of America Merrill Lynch Trust | | | | | | | | |
2015-C27, 1.07% (WAC) due 12/15/474,5 | | | 72,081,603 | | | | 3,233,401 | |
GE Business Loan Trust | | | | | | | | |
2007-1A, 2.20% (1 Month USD LIBOR + 0.17%, Rate Floor: 0.17%) due 04/15/354,7 | | | 3,043,038 | | | | 2,981,452 | |
Cam Commercial Mortgage Corp. | | | | | | | | |
2002-CAM2, 6.16% due 12/14/217 | | | 2,661,129 | | | | 2,813,553 | |
CFCRE Commercial Mortgage Trust | | | | | | | | |
2016-C3, 1.19% (WAC) due 01/10/484,5 | | | 39,539,042 | | | | 2,158,227 | |
Banc of America Commercial Mortgage Trust | | | | | | | | |
2017-BNK3, 1.28% (WAC) due 02/15/504,5 | | | 24,172,940 | | | | 1,524,551 | |
DBJPM Mortgage Trust | | | | | | | | |
2017-C6, 1.17% (WAC) due 06/10/504,5 | | | 24,888,930 | | | | 1,411,008 | |
Americold LLC Trust | | | | | | | | |
2010-ARTA, 3.85% due 01/14/297 | | | 654,301 | | | | 660,771 | |
BAMLL Commercial Mortgage Securities Trust | | | | | | | | |
2012-PARK, 2.96% due 12/10/307 | | | 500,000 | | | | 514,515 | |
WFRBS Commercial Mortgage Trust | | | | | | | | |
2013-C12, 1.38% (WAC) due 03/15/484,5,7 | | | 9,333,412 | | | | 307,485 | |
SEE NOTES TO FINANCIAL STATEMENTS. | THE GUGGENHEIM FUNDS ANNUAL REPORT | 29 |
SCHEDULE OF INVESTMENTS (continued) | September 30, 2019 |
TOTAL RETURN BOND FUND | |
| | Face
Amount~ | | | Value | |
GS Mortgage Securities Corporation II | | | | | | | | |
2013-GC10, 2.94% due 02/10/46 | | | 225,000 | | | $ | 230,748 | |
Total Commercial Mortgage Backed Securities | | | 257,535,163 | |
| | | | | | | | | |
Military Housing - 1.4% |
Freddie Mac Military Housing Bonds Resecuritization Trust Certificates | | | | | | | | |
2015-R1, 3.48% (WAC) due 11/25/554,7 | | | 65,211,846 | | | | 76,462,872 | |
2015-R1, 4.11% (WAC) due 11/25/524,7 | | | 14,264,619 | | | | 15,902,037 | |
2015-R1, 4.10% (WAC) due 10/25/524,7 | | | 13,808,270 | | | | 15,395,122 | |
Capmark Military Housing Trust | | | | | | | | |
2006-RILY, 6.15% due 07/10/517 | | | 12,180,395 | | | | 14,395,043 | |
2008-AMCW, 6.90% due 07/10/557 | | | 8,317,767 | | | | 11,420,831 | |
2007-AETC, 5.75% due 02/10/527 | | | 8,091,642 | | | | 9,142,019 | |
2007-ROBS, 6.06% due 10/10/527 | | | 4,706,786 | | | | 5,767,800 | |
2006-RILY, 2.42% (1 Month USD LIBOR + 0.37%, Rate Floor: 0.37%) due 07/10/514,7 | | | 7,047,342 | | | | 5,003,491 | |
2007-AET2, 6.06% due 10/10/527 | | | 2,140,587 | | | | 2,624,555 | |
GMAC Commercial Mortgage Asset Corp. | | | | | | | | |
2007-HCKM, 6.11% due 08/10/527 | | | 22,354,039 | | | | 24,793,760 | |
2005-DRUM, 5.47% due 05/10/50†††,7 | | | 4,583,495 | | | | 4,935,478 | |
2005-BLIS, 5.25% due 07/10/507 | | | 2,500,000 | | | | 2,790,415 | |
Total Military Housing | | | | | | | 188,633,423 | |
Total Collateralized Mortgage Obligations | | | | |
(Cost $4,019,837,077) | | | 4,193,705,539 | |
| | | | | | | | | |
U.S. GOVERNMENT SECURITIES†† - 19.8% |
U.S. Treasury Notes | | | | | | | | |
2.50% due 02/15/22 | | | 626,769,000 | | | | 639,426,794 | |
2.50% due 01/31/24 | | | 500,000,000 | | | | 519,355,470 | |
2.38% due 02/29/24 | | | 441,533,200 | | | | 456,797,140 | |
2.50% due 02/28/26 | | | 318,091,000 | | | | 335,151,114 | |
2.00% due 04/30/24 | | | 19,330,000 | | | | 19,697,723 | |
2.25% due 08/15/27 | | | 5,050,000 | | | | 5,279,420 | |
U.S. Treasury Bonds | | | | | | | | |
2.88% due 05/15/49 | | | 292,422,000 | | | | 341,048,579 | |
2.25% due 08/15/49 | | | 245,978,000 | | | | 252,982,607 | |
8.13% due 08/15/21 | | | 9,900,000 | | | | 11,065,957 | |
4.38% due 05/15/40 | | | 5,850,000 | | | | 8,227,705 | |
8.75% due 08/15/20 | | | 6,500,000 | | | | 6,882,637 | |
8.00% due 11/15/21 | | | 5,600,000 | | | | 6,334,781 | |
8.75% due 05/15/20 | | | 6,030,000 | | | | 6,287,453 | |
7.88% due 02/15/21 | | | 5,500,000 | | | | 5,952,676 | |
2.88% due 08/15/45 | | | 4,600,000 | | | | 5,300,602 | |
2.75% due 11/15/42 | | | 2,580,000 | | | | 2,895,143 | |
U.S. Treasury Inflation Protected Securities | | | | | | | | |
1.38% due 01/15/208 | | | 129,616,479 | | | | 129,221,553 | |
Total U.S. Government Securities | | | | |
(Cost $2,662,218,966) | | | 2,751,907,354 | |
| | | | | | | | | |
ASSET-BACKED SECURITIES†† - 17.2% |
Collateralized Loan Obligations - 8.7% |
THL Credit Wind River CLO Ltd. | | | | | | | | |
2019-1A, 3.18% (3 Month USD LIBOR + 0.88%, Rate Floor: 0.00%) due 01/15/264,7 | | | 47,650,000 | | | | 47,660,764 | |
2017-2A, 3.17% (3 Month USD LIBOR + 0.87%, Rate Floor: 0.00%) due 10/15/274,7 | | | 43,880,000 | | | | 43,872,580 | |
30 | THE GUGGENHEIM FUNDS ANNUAL REPORT | SEE NOTES TO FINANCIAL STATEMENTS. |
SCHEDULE OF INVESTMENTS (continued) | September 30, 2019 |
TOTAL RETURN BOND FUND | |
| | Face
Amount~ | | | Value | |
Golub Capital Partners CLO Ltd. | | | | | | | | |
2018-36A, 3.59% (3 Month USD LIBOR + 1.30%, Rate Floor: 0.00%) due 02/05/314,7 | | | 76,300,000 | | | $ | 75,150,930 | |
2018-36A, 3.94% (3 Month USD LIBOR + 1.65%, Rate Floor: 0.00%) due 02/05/314,7 | | | 13,250,000 | | | | 12,690,335 | |
NewStar Clarendon Fund CLO LLC | | | | | | | | |
2019-1A, 3.58% (3 Month USD LIBOR + 1.30%, Rate Floor: 0.00%) due 01/25/274,7 | | | 70,254,743 | | | | 70,185,008 | |
2019-1A, 5.33% (3 Month USD LIBOR + 3.05%, Rate Floor: 0.00%) due 01/25/274,7 | | | 2,000,000 | | | | 1,997,876 | |
Palmer Square Loan Funding Ltd. | | | | | | | | |
2018-4A, 3.06% (3 Month USD LIBOR + 0.90%, Rate Floor: 0.00%) due 11/15/264,7 | | | 24,201,526 | | | | 24,192,748 | |
2019-3A, 3.17% (3 Month USD LIBOR + 0.85%, Rate Floor: 0.85%) due 08/20/274,7 | | | 23,750,000 | | | | 23,727,433 | |
2018-4A, 3.61% (3 Month USD LIBOR + 1.45%, Rate Floor: 0.00%) due 11/15/264,7 | | | 12,000,000 | | | | 11,981,087 | |
Halcyon Loan Advisors Funding Ltd. | | | | | | | | |
2017-3A, 3.20% (3 Month USD LIBOR + 0.90%, Rate Floor: 0.00%) due 10/18/274,7 | | | 50,550,000 | | | | 50,572,237 | |
Fortress Credit Opportunities IX CLO Ltd. | | | | | | | | |
2017-9A, 3.71% (3 Month USD LIBOR + 1.55%, Rate Floor: 0.00%) due 11/15/294,7 | | | 49,188,000 | | | | 48,892,597 | |
MP CLO VIII Ltd. | | | | | | | | |
2018-2A, 3.17% (3 Month USD LIBOR + 0.91%, Rate Floor: 0.00%) due 10/28/274,7 | | | 48,350,000 | | | | 48,350,991 | |
Denali Capital CLO XI Ltd. | | | | | | | | |
2018-1A, 3.41% (3 Month USD LIBOR + 1.13%, Rate Floor: 0.00%) due 10/20/284,7 | | | 42,800,000 | | | | 42,767,416 | |
2018-1A, 3.93% (3 Month USD LIBOR + 1.65%, Rate Floor: 0.00%) due 10/20/284,7 | | | 4,600,000 | | | | 4,554,892 | |
Fortress Credit Opportunities XI CLO Ltd. | | | | | | | | |
2018-11A, 3.60% (3 Month USD LIBOR + 1.30%, Rate Floor: 0.00%) due 04/15/314,7 | | | 44,300,000 | | | | 43,641,290 | |
SEE NOTES TO FINANCIAL STATEMENTS. | THE GUGGENHEIM FUNDS ANNUAL REPORT | 31 |
SCHEDULE OF INVESTMENTS (continued) | September 30, 2019 |
TOTAL RETURN BOND FUND | |
| | Face
Amount~ | | | Value | |
Mountain View CLO Ltd. | | | | | | | | |
2018-1A, 3.10% (3 Month USD LIBOR + 0.80%, Rate Floor: 0.80%) due 10/15/264,7 | | | 42,010,928 | | | $ | 42,039,886 | |
Venture XII CLO Ltd. | | | | | | | | |
2018-12A, 2.94% (3 Month USD LIBOR + 0.80%, Rate Floor: 0.80%) due 02/28/264,7 | | | 41,485,034 | | | | 41,352,037 | |
NXT Capital CLO LLC | | | | | | | | |
2017-1A, 3.98% (3 Month USD LIBOR + 1.70%, Rate Floor: 0.00%) due 04/20/294,7 | | | 33,000,000 | | | | 33,003,495 | |
Telos CLO Ltd. | | | | | | | | |
2017-6A, 4.05% (3 Month USD LIBOR + 1.75%, Rate Floor: 0.00%) due 01/17/274,7 | | | 32,000,000 | | | | 31,930,783 | |
Cerberus Loan Funding XVII Ltd. | | | | | | | | |
2016-3A, 4.83% (3 Month USD LIBOR + 2.53%, Rate Floor: 0.00%) due 01/15/284,7 | | | 31,500,000 | | | | 31,352,470 | |
Garrison BSL CLO Ltd. | | | | | | | | |
2018-1A, 3.25% (3 Month USD LIBOR + 0.95%, Rate Floor: 0.00%) due 07/17/284,7 | | | 27,300,000 | | | | 27,302,312 | |
FDF II Ltd. | | | | | | | | |
2016-2A, 4.29% due 05/12/317 | | | 20,500,000 | | | | 20,874,646 | |
2016-2A, 5.29% due 05/12/317 | | | 5,000,000 | | | | 4,993,274 | |
Crown Point CLO III Ltd. | | | | | | | | |
2017-3A, 3.21% (3 Month USD LIBOR + 0.91%, Rate Floor: 0.00%) due 12/31/274,7 | | | 16,850,000 | | | | 16,856,769 | |
2017-3A, 3.75% (3 Month USD LIBOR + 1.45%, Rate Floor: 0.00%) due 12/31/274,7 | | | 8,280,000 | | | | 8,224,199 | |
Golub Capital Partners CLO 16 Ltd. | | | | | | | | |
2017-16A, 3.98% (3 Month USD LIBOR + 1.70%, Rate Floor: 0.00%) due 07/25/294,7 | | | 17,500,000 | | | | 17,501,974 | |
2017-16A, 4.13% (3 Month USD LIBOR + 1.85%, Rate Floor: 0.00%) due 07/25/294,7 | | | 6,700,000 | | | | 6,700,697 | |
ALM XII Ltd. | | | | | | | | |
2018-12A, 3.21% (3 Month USD LIBOR + 0.89%, Rate Floor: 0.89%) due 04/16/274,7 | | | 22,191,973 | | | | 22,188,768 | |
Monroe Capital CLO Ltd. | | | | | | | | |
2017-1A, 3.63% (3 Month USD LIBOR + 1.35%, Rate Floor: 0.00%) due 10/22/264,7 | | | 11,171,543 | | | | 11,174,391 | |
2017-1A, 3.98% (3 Month USD LIBOR + 1.70%, Rate Floor: 0.00%) due 10/22/264,7 | | | 10,100,000 | | | | 10,058,718 | |
32 | THE GUGGENHEIM FUNDS ANNUAL REPORT | SEE NOTES TO FINANCIAL STATEMENTS. |
SCHEDULE OF INVESTMENTS (continued) | September 30, 2019 |
TOTAL RETURN BOND FUND | |
| | Face
Amount~ | | | Value | |
Marathon CLO V Ltd. | | | | | | | | |
2017-5A, 3.02% (3 Month USD LIBOR + 0.87%, Rate Floor: 0.00%) due 11/21/274,7 | | | 10,794,661 | | | $ | 10,751,939 | |
2017-5A, 3.60% (3 Month USD LIBOR + 1.45%, Rate Floor: 0.00%) due 11/21/274,7 | | | 10,520,137 | | | | 10,372,660 | |
NewStar Fairfield Fund CLO Ltd. | | | | | | | | |
2018-2A, 3.55% (3 Month USD LIBOR + 1.27%, Rate Floor: 1.27%) due 04/20/304,7 | | | 21,400,000 | | | | 21,055,768 | |
Mountain Hawk II CLO Ltd. | | | | | | | | |
2018-2A, 3.88% (3 Month USD LIBOR + 1.60%, Rate Floor: 0.00%) due 07/20/244,7 | | | 14,750,000 | | | | 14,752,034 | |
2018-2A, 3.10% (3 Month USD LIBOR + 0.82%, Rate Floor: 0.00%) due 07/20/244,7 | | | 5,064,951 | | | | 5,063,481 | |
Flagship VII Ltd. | | | | | | | | |
2017-7A, 3.83% (3 Month USD LIBOR + 1.55%, Rate Floor: 0.00%) due 01/20/264,7 | | | 19,125,000 | | | | 19,119,308 | |
Newstar Commercial Loan Funding LLC | | | | | | | | |
2017-1A, 4.66% (3 Month USD LIBOR + 2.50%, Rate Floor: 0.00%) due 03/20/274,7 | | | 12,750,000 | | | | 12,744,579 | |
2016-1A, 5.88% (3 Month USD LIBOR + 3.75%) due 02/25/284,7 | | | 5,750,000 | | | | 5,751,134 | |
Diamond CLO Ltd. | | | | | | | | |
2018-1A, 3.78% (3 Month USD LIBOR + 1.50%, Rate Floor: 1.50%) due 07/22/304,7 | | | 18,000,000 | | | | 17,941,783 | |
Avery Point V CLO Ltd. | | | | | | | | |
2017-5A, 3.28% (3 Month USD LIBOR + 0.98%, Rate Floor: 0.00%) due 07/17/264,7 | | | 16,393,269 | | | | 16,399,938 | |
FDF I Ltd. | | | | | | | | |
2015-1A, 4.40% due 11/12/307 | | | 15,000,000 | | | | 15,188,025 | |
VMC Finance LLC | | | | | | | | |
2018-FL1, 2.84% (1 Month USD LIBOR + 0.82%, Rate Floor: 0.82%) due 03/15/354,7 | | | 14,169,596 | | | | 14,091,558 | |
Seneca Park CLO Limited | | | | | | | | |
2017-1A, 3.80% (3 Month USD LIBOR + 1.50%, Rate Floor: 0.00%) due 07/17/264,7 | | | 12,900,000 | | | | 12,870,972 | |
Marathon CLO VII Ltd. | | | | | | | | |
2017-7A, 3.91% (3 Month USD LIBOR + 1.65%, Rate Floor: 0.00%) due 10/28/254,7 | | | 12,600,000 | | | | 12,582,806 | |
Sudbury Mill CLO Ltd. | | | | | | | | |
2017-1A, 3.95% (3 Month USD LIBOR + 1.65%, Rate Floor: 0.00%) due 01/17/264,7 | | | 11,850,000 | | | | 11,794,050 | |
SEE NOTES TO FINANCIAL STATEMENTS. | THE GUGGENHEIM FUNDS ANNUAL REPORT | 33 |
SCHEDULE OF INVESTMENTS (continued) | September 30, 2019 |
TOTAL RETURN BOND FUND | |
| | Face
Amount~ | | | Value | |
BDS | | | | | | | | |
2018-FL2, 2.97% (1 Month USD LIBOR + 0.95%, Rate Floor: 0.95%) due 08/15/354,7 | | | 10,488,026 | | | $ | 10,463,706 | |
Shackleton 2015-VIII CLO Ltd. | | | | | | | | |
2017-8A, 3.58% (3 Month USD LIBOR + 1.30%, Rate Floor: 0.00%) due 10/20/274,7 | | | 5,510,000 | | | | 5,454,093 | |
2017-8A, 3.20% (3 Month USD LIBOR + 0.92%, Rate Floor: 0.00%) due 10/20/274,7 | | | 4,900,000 | | | | 4,888,684 | |
Treman Park CLO Ltd. | | | | | | | | |
2015-1A, due 10/20/287,9 | | | 13,600,000 | | | | 10,124,766 | |
Woodmont Trust | | | | | | | | |
2017-3A, 4.25% (3 Month USD LIBOR + 1.95%, Rate Floor: 0.00%) due 10/18/294,7 | | | 9,800,000 | | | | 9,872,104 | |
Dryden 37 Senior Loan Fund | | | | | | | | |
2015-37A, due 01/15/317,9 | | | 10,000,000 | | | | 8,790,651 | |
KVK CLO Ltd. | | | | | | | | |
2017-1A, 3.20% (3 Month USD LIBOR + 0.90%, Rate Floor: 0.00%) due 01/14/284,7 | | | 8,600,000 | | | | 8,569,946 | |
West CLO Ltd. | | | | | | | | |
2017-1A, 3.22% (3 Month USD LIBOR + 0.92%, Rate Floor: 0.00%) due 07/18/264,7 | | | 8,385,580 | | | | 8,371,634 | |
ACIS CLO Ltd. | | | | | | | | |
2015-6A, 4.73% (3 Month USD LIBOR + 2.48%, Rate Floor: 0.00%) due 05/01/274,7 | | | 7,500,000 | | | | 7,498,676 | |
TCP Waterman CLO Ltd. | | | | | | | | |
2016-1A, 4.17% (3 Month USD LIBOR + 2.05%, Rate Floor: 0.00%) due 12/15/284,7 | | | 7,150,000 | | | | 7,146,924 | |
Carlyle Global Market Strategies CLO Ltd. | | | | | | | | |
2012-3A, due 01/14/327,9 | | | 8,920,000 | | | | 6,062,549 | |
Symphony CLO XII Ltd. | | | | | | | | |
2017-12A, 3.80% (3 Month USD LIBOR + 1.50%, Rate Floor: 0.00%) due 10/15/254,7 | | | 5,750,000 | | | | 5,720,263 | |
Avery Point II CLO Ltd. | | | | | | | | |
2013-3X COM, due 01/18/259 | | | 7,500,060 | | | | 5,501,426 | |
Voya CLO Ltd. | | | | | | | | |
2013-1A, due 10/15/307,9 | | | 10,575,071 | | | | 5,356,908 | |
OHA Credit Partners IX Ltd. | | | | | | | | |
2013-9A, due 10/20/257,9 | | | 6,000,000 | | | | 5,072,522 | |
Oaktree CLO Ltd. | | | | | | | | |
2017-1A, 3.15% (3 Month USD LIBOR + 0.87%) due 10/20/274,7 | | | 4,500,000 | | | | 4,497,373 | |
Atlas Senior Loan Fund III Ltd. | | | | | | | | |
2017-1A, 3.42% (3 Month USD LIBOR + 1.30%, Rate Floor: 0.00%) due 11/17/274,7 | | | 4,300,000 | | | | 4,258,427 | |
34 | THE GUGGENHEIM FUNDS ANNUAL REPORT | SEE NOTES TO FINANCIAL STATEMENTS. |
SCHEDULE OF INVESTMENTS (continued) | September 30, 2019 |
TOTAL RETURN BOND FUND | |
| | Face
Amount~ | | | Value | |
Golub Capital Partners CLO 39B Ltd. | | | | | | | | |
2018-39A, 3.68% (3 Month USD LIBOR + 1.40%, Rate Floor: 1.40%) due 10/20/284,7 | | | 3,100,000 | | | $ | 3,071,365 | |
MONROE CAPITAL BSL CLO Ltd. | | | | | | | | |
2017-1A, 3.90% (3 Month USD LIBOR + 1.75%, Rate Floor: 0.00%) due 05/22/274,7 | | | 3,000,000 | | | | 2,993,071 | |
Ocean Trails CLO IV | | | | | | | | |
2017-4A, 3.98% (3 Month USD LIBOR + 1.80%, Rate Floor: 0.00%) due 08/13/254,7 | | | 2,500,000 | | | | 2,499,767 | |
Golub Capital BDC CLO 2014 LLC | | | | | | | | |
2018-1A, 3.23% (3 Month USD LIBOR + 0.95%, Rate Floor: 0.00%) due 04/25/264,7 | | | 1,947,873 | | | | 1,940,861 | |
Ivy Hill Middle Market Credit Fund IX Ltd. | | | | | | | | |
2017-9A, 4.05% (3 Month USD LIBOR + 1.75%, Rate Floor: 0.00%) due 01/18/304,7 | | | 1,000,000 | | | | 967,774 | |
2017-9A, 4.65% (3 Month USD LIBOR + 2.35%, Rate Floor: 0.00%) due 01/18/304,7 | | | 1,000,000 | | | | 938,796 | |
Catamaran CLO Ltd. | | | | | | | | |
2016-2A, 4.35% (3 Month USD LIBOR + 2.05%, Rate Floor: 2.05%) due 10/18/264,7 | | | 1,750,000 | | | | 1,748,967 | |
Venture XIII CLO Ltd. | | | | | | | | |
2013-13A, due 09/10/297,9 | | | 3,700,000 | | | | 1,694,371 | |
Dryden XXV Senior Loan Fund | | | | | | | | |
2017-25A, 3.65% (3 Month USD LIBOR + 1.35%, Rate Floor: 0.00%) due 10/15/274,7 | | | 766,703 | | | | 755,170 | |
Atlas Senior Loan Fund IX Ltd. | | | | | | | | |
2018-9A, due 04/20/287,9 | | | 1,200,000 | | | | 583,408 | |
Babson CLO Ltd. | | | | | | | | |
2014-IA, due 07/20/257,9 | | | 1,300,000 | | | | 323,669 | |
Great Lakes CLO Ltd. | | | | | | | | |
2014-1A, due 10/15/297,9 | | | 461,538 | | | | 286,640 | |
Copper River CLO Ltd. | | | | | | | | |
2007-1A, due 01/20/219,10 | | | 1,500,000 | | | | 208,191 | |
Total Collateralized Loan Obligations | | | 1,211,935,340 | |
| | | | | | | | | |
Financial - 3.1% |
Station Place Securitization Trust | | | | | | | | |
2019-8, 2.64% (1 Month USD LIBOR + 0.60%, Rate Floor: 0.60%) due 03/24/204,7 | | | 141,950,000 | | | | 141,950,000 | |
2019-6, 2.64% (1 Month USD LIBOR + 0.60%, Rate Floor: 0.60%) due 07/24/21†††,4,7 | | | 74,050,000 | | | | 74,050,000 | |
2019-5, 2.74% (1 Month USD LIBOR + 0.70%, Rate Floor: 0.70%) due 06/24/20†††,4,7 | | | 40,300,000 | | | | 40,300,000 | |
SEE NOTES TO FINANCIAL STATEMENTS. | THE GUGGENHEIM FUNDS ANNUAL REPORT | 35 |
SCHEDULE OF INVESTMENTS (continued) | September 30, 2019 |
TOTAL RETURN BOND FUND | |
| | Face
Amount~ | | | Value | |
2019-9, 2.74% (1 Month USD LIBOR + 0.70%, Rate Floor: 0.00%) due 10/24/204,7 | | | 28,450,000 | | | $ | 28,450,000 | |
2019-2, 2.59% (1 Month USD LIBOR + 0.55%, Rate Floor: 0.55%) due 04/24/214,7 | | | 20,250,000 | | | | 20,261,723 | |
2019-WL1, 2.67% (1 Month USD LIBOR + 0.65%, Rate Floor: 0.65%) due 08/25/524,7 | | | 15,250,000 | | | | 15,265,448 | |
Barclays Bank plc | | | | | | | | |
GMTN, 2.86% due 10/31/19 | | | 64,250,000 | | | | 64,259,277 | |
Madison Avenue Securitization Trust | | | | | | | | |
due 11/18/204 | | | 21,350,000 | | | | 21,350,000 | |
Nassau LLC | | | | | | | | |
2019-1, 3.98% due 08/15/347 | | | 21,050,000 | | | | 20,944,750 | |
Industrial DPR Funding Ltd. | | | | | | | | |
2016-1A, 5.24% due 04/15/267 | | | 3,880,800 | | | | 3,872,996 | |
Total Financial | | | | | | | 430,704,194 | |
| | | | | | | | | |
Transport-Aircraft - 2.2% |
AASET US Ltd. | | | | | | | | |
2018-2A, 4.45% due 11/18/387 | | | 49,262,268 | | | | 50,533,944 | |
2018-2A, 5.43% due 11/18/387 | | | 9,242,452 | | | | 9,398,821 | |
Castlelake Aircraft Securitization Trust | | | | | | | | |
2018-1, 4.13% due 06/15/437 | | | 31,146,194 | | | | 31,881,428 | |
2017-1, 3.97% due 07/15/42 | | | 16,463,719 | | | | 16,695,813 | |
Sapphire Aviation Finance I Ltd. | | | | | | | | |
2018-1A, 4.25% due 03/15/407 | | | 41,599,745 | | | | 42,601,259 | |
KDAC Aviation Finance Ltd. | | | | | | | | |
2017-1A, 4.21% due 12/15/427 | | | 36,578,528 | | | | 37,467,744 | |
MAPS Ltd. | | | | | | | | |
2018-1A, 4.21% due 05/15/437 | | | 27,665,550 | | | | 28,375,736 | |
Apollo Aviation Securitization Equity Trust | | | | | | | | |
2016-2, 4.21% due 11/15/41 | | | 25,043,798 | | | | 25,313,377 | |
AIM Aviation Finance Ltd. | | | | | | | | |
2015-1A, 4.21% due 02/15/407 | | | 16,140,374 | | | | 16,325,872 | |
2015-1A, 5.07% due 02/15/407 | | | 1,355,458 | | | | 1,367,675 | |
Raspro Trust | | | | | | | | |
2005-1A, 3.20% (3 Month USD LIBOR + 0.93%, Rate Floor: 0.93%) due 03/23/244,7 | | | 14,581,882 | | | | 14,388,011 | |
Falcon Aerospace Ltd. | | | | | | | | |
2017-1, 4.58% due 02/15/427 | | | 10,489,410 | | | | 10,584,014 | |
AASET Trust | | | | | | | | |
2017-1A, 3.97% due 05/16/427 | | | 8,356,043 | | | | 8,455,979 | |
Diamond Head Aviation Ltd. | | | | | | | | |
2015-1, 3.81% due 07/14/287 | | | 2,670,572 | | | | 2,672,951 | |
Atlas Ltd. | | | | | | | | |
2014-1 A, 4.88% due 12/15/39 | | | 2,736,060 | | | | 2,659,554 | |
Stripes Aircraft Ltd. | | | | | | | | |
2013-1 A1, 5.54% due 03/20/23††† | | | 1,044,344 | | | | 1,028,990 | |
36 | THE GUGGENHEIM FUNDS ANNUAL REPORT | SEE NOTES TO FINANCIAL STATEMENTS. |
SCHEDULE OF INVESTMENTS (continued) | September 30, 2019 |
TOTAL RETURN BOND FUND | |
| | Face
Amount~ | | | Value | |
Willis Engine Securitization Trust II | | | | | | | | |
2012-A, 5.50% due 09/15/376,7 | | | 851,711 | | | $ | 879,862 | |
ECAF I Ltd. | | | | | | | | |
2015-1A, 3.47% due 06/15/407 | | | 731,129 | | | | 728,960 | |
Turbine Engines Securitization Ltd. | | | | | | | | |
2013-1A, 5.13% due 12/13/4810 | | | 725,845 | | | | 727,250 | |
Airplanes Pass Through Trust | | | | | | | | |
2001-1A, 2.88% (1 Month USD LIBOR + 0.55%, Rate Floor: 0.55%) due 03/15/19†††,4,10,17 | | | 409,604 | | | | 6,784 | |
Total Transport-Aircraft | | | | | | | 302,094,024 | |
| | | | | | | | | |
Transport-Container - 0.9% |
Textainer Marine Containers Ltd. | | | | | | | | |
2017-2A, 3.52% due 06/20/427 | | | 40,802,624 | | | | 40,911,285 | |
CLI Funding LLC | | | | | | | | |
2018-1A, 4.03% due 04/18/437 | | | 25,204,724 | | | | 25,445,352 | |
CAL Funding III Ltd. | | | | | | | | |
2018-1A, 3.96% due 02/25/437 | | | 19,400,417 | | | | 19,567,091 | |
Global SC Finance II SRL | | | | | | | | |
2014-1A, 3.19% due 07/17/297 | | | 14,393,667 | | | | 14,391,610 | |
Textainer Marine Containers V Ltd. | | | | | | | | |
2017-1A, 3.72% due 05/20/427 | | | 13,549,441 | | | | 13,552,085 | |
Cronos Containers Program Ltd. | | | | | | | | |
2013-1A, 3.08% due 04/18/287 | | | 5,679,583 | | | | 5,674,978 | |
Total Transport-Container | | | 119,542,401 | |
| | | | | | | | | |
Net Lease - 0.8% |
Capital Automotive LLC | | | | | | | | |
2017-1A, 3.87% due 04/15/477 | | | 51,541,537 | | | | 52,026,744 | |
Store Master Funding I-VII | | | | | | | | |
2016-1A, 3.96% due 10/20/467 | | | 29,534,109 | | | | 30,722,883 | |
2016-1A, 4.32% due 10/20/467 | | | 10,900,754 | | | | 11,488,662 | |
STORE Master Funding I LLC | | | | | | | | |
2015-1A, 4.17% due 04/20/457 | | | 7,773,460 | | | | 7,978,095 | |
2015-1A, 3.75% due 04/20/457 | | | 1,466,875 | | | | 1,496,973 | |
STORE Master Funding LLC | | | | | | | | |
2014-1A, 5.00% due 04/20/447 | | | 4,380,000 | | | | 4,607,821 | |
2013-3A, 4.24% due 11/20/437 | | | 992,832 | | | | 992,450 | |
Capital Automotive REIT | | | | | | | | |
2014-1A, 3.66% due 10/15/447 | | | 4,326,621 | | | | 4,333,781 | |
Total Net Lease | | | | | | | 113,647,409 | |
| | | | | | | | | |
Collateralized Debt Obligations - 0.5% |
Anchorage Credit Funding Ltd. | | | | | | | | |
2016-4A, 3.50% due 02/15/357 | | | 55,600,000 | | | | 55,838,774 | |
2016-3A, 3.85% due 10/28/337 | | | 7,500,000 | | | | 7,556,824 | |
SEE NOTES TO FINANCIAL STATEMENTS. | THE GUGGENHEIM FUNDS ANNUAL REPORT | 37 |
SCHEDULE OF INVESTMENTS (continued) | September 30, 2019 |
TOTAL RETURN BOND FUND | |
| | Face
Amount~ | | | Value | |
Putnam Structured Product Funding Ltd. | | | | | | | | |
2003-1A, 3.03% (1 Month USD LIBOR + 1.00%, Rate Floor: 0.00%) due 10/15/384,7 | | | 10,610,304 | | | $ | 10,509,031 | |
Highland Park CDO I Ltd. | | | | | | | | |
2006-1A, 2.53% (3 Month USD LIBOR + 0.40%, Rate Floor: 0.00%) due 11/25/514,10 | | | 1,366,626 | | | | 1,354,236 | |
N-Star REL CDO VIII Ltd. | | | | | | | | |
2006-8A, 2.45% (1 Month USD LIBOR + 0.36%, Rate Floor: 0.36%) due 02/01/414,7 | | | 789,335 | | | | 780,700 | |
Total Collateralized Debt Obligations | | | 76,039,565 | |
| | | | | | | | | |
Whole Business - 0.5% |
SERVPRO Master Issuer LLC | | | | | | | | |
2019-1A, 3.88% due 10/25/494,7 | | | 29,500,000 | | | | 29,722,022 | |
Taco Bell Funding LLC | | | | | | | | |
2016-1A, 4.97% due 05/25/467 | | | 20,726,625 | | | | 22,007,116 | |
Domino’s Pizza Master Issuer LLC | | | | | | | | |
2017-1A, 3.53% (3 Month USD LIBOR + 1.25%, Rate Floor: 0.00%) due 07/25/474,7 | | | 16,856,000 | | | | 16,856,169 | |
Planet Fitness Master Issuer LLC | | | | | | | | |
2018-1A, 4.26% due 09/05/487 | | | 2,970,000 | | | | 3,036,439 | |
Drug Royalty III Limited Partnership 1 | | | | | | | | |
2017-1A, 3.60% due 04/15/277 | | | 1,278,995 | | | | 1,280,357 | |
Drug Royalty III Limited Partnership | | | | | | | | |
2016-1A, 3.98% due 04/15/277 | | | 831,444 | | | | 833,352 | |
Total Whole Business | | | | | | | 73,735,455 | |
| | | | | | | | | |
Infrastructure - 0.2% |
Secured Tenant Site Contract Revenue Notes Series | | | | | | | | |
2018-1A, 3.97% due 06/15/487 | | | 22,495,013 | | | | 23,061,522 | |
Vantage Data Centers Issuer LLC | | | | | | | | |
2018-1A, 4.07% due 02/16/437 | | | 10,284,542 | | | | 10,690,409 | |
Total Infrastructure | | | | | | | 33,751,931 | |
| | | | | | | | | |
Diversified Payment Rights - 0.2% |
Bib Merchant Voucher Receivables Ltd. | | | | | | | | |
4.18% due 04/07/28†††,1 | | | 21,400,000 | | | | 22,101,083 | |
CCR Incorporated MT100 Payment Rights Master Trust | | | | | | | | |
2012-CA, 4.75% due 07/10/227 | | | 384,524 | | | | 388,275 | |
CIC Receivables Master Trust | | | | | | | | |
REGD, 4.89% due 10/07/21††† | | | 220,808 | | | | 225,151 | |
Total Diversified Payment Rights | | | 22,714,509 | |
| | | | | | | | | |
Automotive - 0.1% |
Hertz Vehicle Financing II, LP | | | | | | | | |
2017-1A, 2.96% due 10/25/217 | | | 8,355,000 | | | | 8,413,213 | |
| | | | | | | | | |
38 | THE GUGGENHEIM FUNDS ANNUAL REPORT | SEE NOTES TO FINANCIAL STATEMENTS. |
SCHEDULE OF INVESTMENTS (continued) | September 30, 2019 |
TOTAL RETURN BOND FUND | |
| | Face
Amount~ | | | Value | |
Insurance - 0.0% |
Chesterfield Financial Holdings LLC | | | | | | | | |
2014-1A, 4.50% due 12/15/347 | | | 3,343,750 | | | $ | 3,365,377 | |
| | | | | | | | | |
Transport-Rail - 0.0% |
TRIP Rail Master Funding LLC | | | | | | | | |
2017-1A, 2.71% due 08/15/477 | | | 2,020,383 | | | | 2,021,308 | |
Total Asset-Backed Securities | | | | |
(Cost $2,390,423,367) | | | 2,397,964,726 | |
| | | | | | | | | |
FOREIGN GOVERNMENT DEBT†† - 13.9% |
Government of Japan | | | | | | | | |
0.10% due 08/01/21 | | JPY | 26,008,000,000 | | | | 242,403,259 | |
due 01/20/2011 | | JPY | 16,380,000,000 | | | | 151,622,411 | |
due 01/10/2011 | | JPY | 14,083,400,000 | | | | 130,353,186 | |
0.10% due 07/01/21 | | JPY | 10,000,000,000 | | | | 93,162,646 | |
0.10% due 05/01/21 | | JPY | 8,670,000,000 | | | | 80,709,462 | |
0.10% due 06/01/20 | | JPY | 6,393,900,000 | | | | 59,298,762 | |
0.10% due 09/01/20 | | JPY | 5,928,000,000 | | | | 55,040,936 | |
0.10% due 12/20/21 | | JPY | 4,530,600,000 | | | | 42,310,940 | |
0.10% due 06/01/21 | | JPY | 3,468,000,000 | | | | 32,296,295 | |
0.10% due 06/20/20 | | JPY | 2,412,000,000 | | | | 22,373,335 | |
0.10% due 04/15/20 | | JPY | 2,082,050,000 | | | | 19,299,675 | |
2.20% due 06/22/20 | | JPY | 96,500,000 | | | | 908,677 | |
State of Israel | | | | | | | | |
1.00% due 04/30/21 | | ILS | 530,470,000 | | | | 154,610,700 | |
5.00% due 01/31/20 | | ILS | 278,300,000 | | | | 81,322,307 | |
5.50% due 01/31/22 | | ILS | 227,470,000 | | | | 73,397,872 | |
0.50% due 01/31/21 | | ILS | 103,010,000 | | | | 29,774,888 | |
Kingdom of Spain | | | | | | | | |
0.75% due 07/30/21 | | EUR | 214,670,000 | �� | | | 239,432,414 | |
due 01/17/2011 | | EUR | 46,450,000 | | | | 50,713,170 | |
4.00% due 04/30/20 | | EUR | 7,600,000 | | | | 8,500,035 | |
Federative Republic of Brazil | | | | | | | | |
due 07/01/2111 | | BRL | 653,060,000 | | | | 143,909,535 | |
due 01/01/2011 | | BRL | 291,100,000 | | | | 69,257,368 | |
due 07/01/2011 | | BRL | 242,295,000 | | | | 56,359,214 | |
Republic of Portugal | | | | | | | | |
4.80% due 06/15/20 | | EUR | 43,200,000 | | | | 48,862,629 | |
due 01/17/2011 | | EUR | 42,650,000 | | | | 46,561,420 | |
Total Foreign Government Debt | | | | |
(Cost $1,948,845,322) | | | 1,932,481,136 | |
| | | | | | | | | |
CORPORATE BONDS†† - 8.0% |
Financial - 3.0% |
Synchrony Bank | | | | | | | | |
2.73% (3 Month USD LIBOR + 0.63%) due 03/30/204 | | | 44,250,000 | | | | 44,266,308 | |
AXIS Specialty Finance LLC | | | | | | | | |
5.88% due 06/01/20 | | | 32,000,000 | | | | 32,746,263 | |
Capital One Financial Corp. | | | | | | | | |
2.50% due 05/12/20 | | | 30,800,000 | | | | 30,854,729 | |
2.94% (3 Month USD LIBOR + 0.76%) due 05/12/204 | | | 400,000 | | | | 401,279 | |
ANZ New Zealand Int’l Ltd. | | | | | | | | |
2.85% due 08/06/207 | | | 29,500,000 | | | | 29,706,901 | |
Lloyds Bank Corporate Markets plc NY | | | | | | | | |
2.66% (3 Month USD LIBOR + 0.37%) due 08/05/204 | | | 29,100,000 | | | | 29,131,413 | |
Standard Chartered Bank | | | | | | | | |
2.69% (3 Month USD LIBOR + 0.40%) due 08/04/204 | | | 28,810,000 | | | | 28,850,845 | |
Credit Suisse AG NY | | | | | | | | |
2.66% (3 Month USD LIBOR + 0.40%) due 07/31/204 | | | 28,730,000 | | | | 28,753,434 | |
UBS AG | | | | | | | | |
2.68% (3 Month USD LIBOR + 0.58%, Rate Floor: 0.00%) due 06/08/204,7 | | | 22,000,000 | | | | 22,058,983 | |
2.62% (3 Month USD LIBOR + 0.48%) due 12/01/204,7 | | | 6,000,000 | | | | 6,015,193 | |
SEE NOTES TO FINANCIAL STATEMENTS. | THE GUGGENHEIM FUNDS ANNUAL REPORT | 39 |
SCHEDULE OF INVESTMENTS (continued) | September 30, 2019 |
TOTAL RETURN BOND FUND | |
| | Face
Amount~ | | | Value | |
American Express Co. | | | | | | | | |
2.20% due 10/30/20 | | | 26,950,000 | | | $ | 26,990,189 | |
American Equity Investment Life Holding Co. | | | | | | | | |
5.00% due 06/15/27 | | | 22,855,000 | | | | 24,018,719 | |
Discover Bank | | | | | | | | |
3.10% due 06/04/20 | | | 23,200,000 | | | | 23,325,474 | |
Morgan Stanley | | | | | | | | |
5.50% due 07/24/20 | | | 12,300,000 | | | | 12,631,388 | |
RBC USA Holdco Corp. | | | | | | | | |
5.25% due 09/15/20 | | | 11,158,000 | | | | 11,488,566 | |
Swedbank AB | | | | | | | | |
2.65% due 03/10/217 | | | 8,100,000 | | | | 8,127,462 | |
American Tower Corp. | | | | | | | | |
2.80% due 06/01/20 | | | 6,920,000 | | | | 6,946,359 | |
Assurant, Inc. | | | | | | | | |
3.36% (3 Month USD LIBOR + 1.25%) due 03/26/214 | | | 4,608,000 | | | | 4,608,413 | |
6.75% due 02/15/34 | | | 1,450,000 | | | | 1,782,167 | |
Atlas Mara Ltd. | | | | | | | | |
8.00% due 12/31/2010 | | | 6,600,000 | | | | 5,841,000 | |
Liberty Property, LP | | | | | | | | |
4.75% due 10/01/20 | | | 4,931,000 | | | | 5,056,249 | |
Credit Suisse Group Funding Guernsey Ltd. | | | | | | | | |
2.75% due 03/26/20 | | | 3,950,000 | | | | 3,960,549 | |
Fort Knox Military Housing Privatization Project | | | | | | | | |
5.82% due 02/15/527 | | | 1,921,652 | | | | 2,202,848 | |
2.37% (1 Month USD LIBOR + 0.34%) due 02/15/524,7 | | | 1,723,111 | | | | 1,063,631 | |
MUFG Bank Ltd. | | | | | | | | |
2.30% due 03/05/207 | | | 2,825,000 | | | | 2,827,043 | |
Nomura Holdings, Inc. | | | | | | | | |
6.70% due 03/04/20 | | | 2,263,000 | | | | 2,308,199 | |
Welltower, Inc. | | | | | | | | |
6.50% due 03/15/41 | | | 1,470,000 | | | | 2,007,212 | |
Standard Chartered plc | | | | | | | | |
3.33% (3 Month USD LIBOR + 1.20%) due 09/10/224,7 | | | 1,900,000 | | | | 1,908,151 | |
Reinsurance Group of America, Inc. | | | | | | | | |
6.45% due 11/15/19 | | | 1,860,000 | | | | 1,868,203 | |
Mizuho Financial Group, Inc. | | | | | | | | |
2.56% due 09/13/2512 | | | 1,870,000 | | | | 1,864,866 | |
Transatlantic Holdings, Inc. | | | | | | | | |
8.00% due 11/30/39 | | | 1,135,000 | | | | 1,678,179 | |
Brookfield Finance, Inc. | | | | | | | | |
4.85% due 03/29/29 | | | 1,410,000 | | | | 1,595,761 | |
Hartford Financial Services Group, Inc. | | | | | | | | |
6.10% due 10/01/41 | | | 1,160,000 | | | | 1,578,934 | |
WP Carey, Inc. | | | | | | | | |
3.85% due 07/15/29 | | | 1,460,000 | | | | 1,545,376 | |
EPR Properties | | | | | | | | |
3.75% due 08/15/29 | | | 1,510,000 | | | | 1,509,494 | |
RenaissanceRe Finance, Inc. | | | | | | | | |
3.45% due 07/01/27 | | | 1,460,000 | | | | 1,501,258 | |
Lexington Realty Trust | | | | | | | | |
4.25% due 06/15/23 | | | 1,300,000 | | | | 1,342,379 | |
Univest Financial Corp. | | | | | | | | |
5.10% due 03/30/2512 | | | 1,000,000 | | | | 1,003,885 | |
Atlantic Marine Corporations Communities LLC | | | | | | | | |
5.37% due 12/01/507 | | | 785,717 | | | | 879,638 | |
Pacific Beacon LLC | | | | | | | | |
5.51% due 07/15/367 | | | 500,000 | | | | 602,552 | |
Essex Portfolio, LP | | | | | | | | |
5.20% due 03/15/21 | | | 400,000 | | | | 413,856 | |
KKR Group Finance Company VI LLC | | | | | | | | |
3.75% due 07/01/297 | | | 252,000 | | | | 265,575 | |
Total Financial | | | | | | | 417,528,923 | |
| | | | | | | | | |
40 | THE GUGGENHEIM FUNDS ANNUAL REPORT | SEE NOTES TO FINANCIAL STATEMENTS. |
SCHEDULE OF INVESTMENTS (continued) | September 30, 2019 |
TOTAL RETURN BOND FUND | |
| | Face
Amount~ | | | Value | |
Consumer, Non-cyclical - 2.2% |
Mondelez International, Inc. | | | | | | | | |
3.00% due 05/07/20 | | | 32,300,000 | | | $ | 32,465,331 | |
Anthem, Inc. | | | | | | | | |
2.50% due 11/21/20 | | | 23,600,000 | | | | 23,716,475 | |
4.35% due 08/15/20 | | | 7,900,000 | | | | 8,055,619 | |
Constellation Brands, Inc. | | | | | | | | |
2.25% due 11/06/20 | | | 28,230,000 | | | | 28,238,968 | |
2.00% due 11/07/19 | | | 2,550,000 | | | | 2,548,919 | |
Zimmer Biomet Holdings, Inc. | | | | | | | | |
2.70% due 04/01/20 | | | 30,310,000 | | | | 30,361,727 | |
Allergan Funding SCS | | | | | | | | |
3.00% due 03/12/20 | | | 29,600,000 | | | | 29,684,555 | |
Bayer US Finance LLC | | | | | | | | |
2.38% due 10/08/197 | | | 29,076,000 | | | | 29,075,765 | |
Molson Coors Brewing Co. | | | | | | | | |
2.25% due 03/15/20 | | | 28,977,000 | | | | 28,959,302 | |
BAT International Finance plc | | | | | | | | |
2.75% due 06/15/207 | | | 23,060,000 | | | | 23,128,464 | |
Cigna Corp. | | | | | | | | |
3.20% due 09/17/20 | | | 13,230,000 | | | | 13,358,222 | |
2.49% (3 Month USD LIBOR + 0.35%) due 03/17/204 | | | 9,175,000 | | | | 9,176,388 | |
Quest Diagnostics, Inc. | | | | | | | | |
2.50% due 03/30/20 | | | 20,950,000 | | | | 20,970,828 | |
AstraZeneca plc | | | | | | | | |
2.38% due 11/16/20 | | | 9,443,000 | | | | 9,487,742 | |
S&P Global, Inc. | | | | | | | | |
3.30% due 08/14/20 | | | 5,142,000 | | | | 5,191,227 | |
ERAC USA Finance LLC | | | | | | | | |
5.25% due 10/01/207 | | | 4,260,000 | | | | 4,392,665 | |
Reynolds American, Inc. | | | | | | | | |
6.88% due 05/01/20 | | | 2,890,000 | | | | 2,965,606 | |
AmerisourceBergen Corp. | | | | | | | | |
4.25% due 03/01/45 | | | 1,950,000 | | | | 1,972,014 | |
McKesson Corp. | | | | | | | | |
4.88% due 03/15/44 | | | 1,650,000 | | | | 1,822,506 | |
Humana, Inc. | | | | | | | | |
2.50% due 12/15/20 | | | 1,785,000 | | | | 1,789,068 | |
BAT Capital Corp. | | | | | | | | |
3.22% due 09/06/26 | | | 1,800,000 | | | | 1,777,314 | |
Biogen, Inc. | | | | | | | | |
2.90% due 09/15/20 | | | 1,650,000 | | | | 1,661,899 | |
Aetna, Inc. | | | | | | | | |
6.63% due 06/15/36 | | | 1,190,000 | | | | 1,545,590 | |
Conagra Brands, Inc. | | | | | | | | |
2.81% (3 Month USD LIBOR + 0.50%) due 10/09/204 | | | 1,350,000 | | | | 1,349,863 | |
Coca-Cola Femsa SAB de CV | | | | | | | | |
4.63% due 02/15/20 | | | 459,000 | | | | 462,489 | |
Total Consumer, Non-cyclical | | | 314,158,546 | |
| | | | | | | | | |
Industrial - 0.9% |
L3Harris Technologies, Inc. | | | | | | | | |
2.70% due 04/27/20 | | | 30,367,000 | | | | 30,427,784 | |
Northrop Grumman Corp. | | | | | | | | |
2.08% due 10/15/20 | | | 17,400,000 | | | | 17,405,856 | |
3.50% due 03/15/21 | | | 6,250,000 | | | | 6,365,575 | |
Rolls-Royce plc | | | | | | | | |
2.38% due 10/14/207 | | | 20,350,000 | | | | 20,372,824 | |
United Technologies Corp. | | | | | | | | |
1.90% due 05/04/20 | | | 10,373,000 | | | | 10,361,141 | |
Ryder System, Inc. | | | | | | | | |
2.50% due 05/11/20 | | | 8,627,000 | | | | 8,641,823 | |
Aviation Capital Group LLC | | | | | | | | |
7.13% due 10/15/207 | | | 7,940,000 | | | | 8,307,091 | |
Agnico-Eagle Mines Ltd. | | | | | | | | |
4.84% due 06/30/26††† | | | 6,000,000 | | | | 6,422,750 | |
Ingersoll-Rand Luxembourg Finance S.A. | | | | | | | | |
2.63% due 05/01/20 | | | 4,247,000 | | | | 4,254,738 | |
SEE NOTES TO FINANCIAL STATEMENTS. | THE GUGGENHEIM FUNDS ANNUAL REPORT | 41 |
SCHEDULE OF INVESTMENTS (continued) | September 30, 2019 |
TOTAL RETURN BOND FUND | |
| | Face
Amount~ | | | Value | |
Princess Juliana International Airport Operating Company N.V. | | | | | | | | |
5.50% due 12/20/2710 | | | 2,108,142 | | | $ | 1,994,492 | |
CRH America, Inc. | | | | | | | | |
3.88% due 05/18/257 | | | 1,410,000 | | | | 1,490,429 | |
Oshkosh Corp. | | | | | | | | |
4.60% due 05/15/28 | | | 1,380,000 | | | | 1,487,336 | |
Trimble, Inc. | | | | | | | | |
4.75% due 12/01/24 | | | 1,380,000 | | | | 1,481,183 | |
Vulcan Materials Co. | | | | | | | | |
2.72% (3 Month USD LIBOR + 0.60%) due 06/15/204 | | | 895,000 | | | | 895,499 | |
Total Industrial | | | | | | | 119,908,521 | |
| | | | | | | | | |
Utilities - 0.6% |
NextEra Energy Capital Holdings, Inc. | | | | | | | | |
2.55% (3 Month USD LIBOR + 0.45%) due 09/28/204 | | | 30,310,000 | | | | 30,322,876 | |
Ameren Corp. | | | | | | | | |
2.70% due 11/15/20 | | | 17,540,000 | | | | 17,631,734 | |
Southern Power Co. | | | | | | | | |
2.38% due 06/01/20 | | | 13,295,000 | | | | 13,306,442 | |
5.25% due 07/15/43 | | | 1,350,000 | | | | 1,558,064 | |
DTE Energy Co. | | | | | | | | |
2.40% due 12/01/19 | | | 7,000,000 | | | | 7,000,526 | |
PSEG Power LLC | | | | | | | | |
5.13% due 04/15/20 | | | 3,311,000 | | | | 3,361,225 | |
American Electric Power Company, Inc. | | | | | | | | |
2.15% due 11/13/20 | | | 2,000,000 | | | | 2,001,162 | |
Virginia Electric & Power Co. | | | | | | | | |
8.88% due 11/15/38 | | | 1,100,000 | | | | 1,852,346 | |
Pennsylvania Electric Co. | | | | | | | | |
5.20% due 04/01/20 | | | 1,000,000 | | | | 1,014,628 | |
Total Utilities | | | | | | | 78,049,003 | |
| | | | | | | | | |
Energy - 0.5% |
Occidental Petroleum Corp. | | | | | | | | |
2.60% due 08/13/21 | | | 24,500,000 | | | | 24,659,582 | |
Sabine Pass Liquefaction LLC | | | | | | | | |
5.63% due 02/01/21 | | | 18,152,000 | | | | 18,749,489 | |
Florida Gas Transmission Company LLC | | | | | | | | |
5.45% due 07/15/207 | | | 10,500,000 | | | | 10,742,343 | |
Enterprise Products Operating LLC | | | | | | | | |
2.55% due 10/15/19 | | | 6,240,000 | | | | 6,241,112 | |
Marathon Petroleum Corp. | | | | | | | | |
3.40% due 12/15/20 | | | 4,800,000 | | | | 4,852,987 | |
TransCanada PipeLines Ltd. | | | | | | | | |
6.10% due 06/01/40 | | | 1,200,000 | | | | 1,548,794 | |
Total Energy | | | | | | | 66,794,307 | |
| | | | | | | | | |
Technology - 0.5% |
Analog Devices, Inc. | | | | | | | | |
2.95% due 01/12/21 | | | 26,950,000 | | | | 27,152,178 | |
Broadcom Corporation / Broadcom Cayman Finance Ltd. | | | | | | | | |
2.38% due 01/15/20 | | | 26,890,000 | | | | 26,888,299 | |
Fiserv, Inc. | | | | | | | | |
2.70% due 06/01/20 | | | 7,430,000 | | | | 7,449,802 | |
QUALCOMM, Inc. | | | | | | | | |
2.25% due 05/20/20 | | | 2,600,000 | | | | 2,601,084 | |
Total Technology | | | | | | | 64,091,363 | |
| | | | | | | | | |
Consumer, Cyclical - 0.2% |
Marriott International, Inc. | | | | | | | | |
2.74% (3 Month USD LIBOR + 0.60%) due 12/01/204 | | | 30,350,000 | | | | 30,447,873 | |
HP Communities LLC | | | | | | | | |
5.86% due 09/15/537 | | | 1,420,000 | | | | 1,821,954 | |
42 | THE GUGGENHEIM FUNDS ANNUAL REPORT | SEE NOTES TO FINANCIAL STATEMENTS. |
SCHEDULE OF INVESTMENTS (continued) | September 30, 2019 |
TOTAL RETURN BOND FUND | |
| | Face
Amount~ | | | Value | |
Hasbro, Inc. | | | | | | | | |
6.35% due 03/15/40 | | | 1,500,000 | | | $ | 1,777,918 | |
Total Consumer, Cyclical | | | 34,047,745 | |
| | | | | | | | | |
Basic Materials - 0.1% |
Georgia-Pacific LLC | | | | | | | | |
5.40% due 11/01/207 | | | 12,532,000 | | | | 12,963,316 | |
| | | | | | | | | |
Communications - 0.0% |
Telefonica Emisiones S.A. | | | | | | | | |
5.13% due 04/27/20 | | | 2,710,000 | | | | 2,753,357 | |
Thomson Reuters Corp. | | | | | | | | |
5.65% due 11/23/43 | | | 1,290,000 | | | | 1,543,248 | |
Motorola Solutions, Inc. | | | | | | | | |
5.50% due 09/01/44 | | | 360,000 | | | | 383,637 | |
Total Communications | | | 4,680,242 | |
Total Corporate Bonds | | | | |
(Cost $1,106,147,839) | | | 1,112,221,966 | |
| | | | | | | | | |
FEDERAL AGENCY BONDS†† - 4.7% |
Fannie Mae Principal Strips | | | | | | | | |
due 05/15/3011,13 | | | 86,472,000 | | | | 68,930,926 | |
due 01/15/3011,13 | | | 75,565,000 | | | | 60,666,520 | |
due 07/15/3711,13 | | | 86,350,000 | | | | 56,479,709 | |
due 11/15/3011,13 | | | 37,570,000 | | | | 29,630,918 | |
due 08/06/3811,13 | | | 2,250,000 | | | | 1,419,030 | |
Freddie Mac Principal Strips | | | | | | | | |
due 07/15/3211,13 | | | 123,250,000 | | | | 92,161,871 | |
due 03/15/3111,13 | | | 81,957,000 | | | | 63,745,226 | |
Residual Funding Corporation Principal Strips | | | | | | | | |
due 04/15/3011,13 | | | 98,239,000 | | | | 78,386,973 | |
due 01/15/3011,13 | | | 22,264,000 | | | | 17,874,405 | |
Tennessee Valley Authority | | | | | | | | |
4.25% due 09/15/65 | | | 32,550,000 | | | | 44,979,476 | |
5.38% due 04/01/56 | | | 8,360,000 | | | | 13,371,965 | |
due 09/15/535,11 | | | 1,612,000 | | | | 645,298 | |
due 09/15/555,11 | | | 1,612,000 | | | | 613,340 | |
due 09/15/565,11 | | | 1,612,000 | | | | 596,606 | |
due 03/15/575,11 | | | 1,612,000 | | | | 586,821 | |
due 09/15/575,11 | | | 1,612,000 | | | | 577,119 | |
due 09/15/585,11 | | | 1,612,000 | | | | 558,083 | |
due 03/15/595,11 | | | 1,612,000 | | | | 548,748 | |
due 09/15/595,11 | | | 1,612,000 | | | | 539,496 | |
due 09/15/605,11 | | | 1,612,000 | | | | 521,345 | |
due 09/15/545,11 | | | 1,020,000 | | | | 398,058 | |
due 03/15/615,11 | | | 1,020,000 | | | | 324,258 | |
due 09/15/615,11 | | | 1,020,000 | | | | 318,685 | |
due 09/15/625,11 | | | 1,020,000 | | | | 307,764 | |
due 03/15/635,11 | | | 1,020,000 | | | | 302,416 | |
due 09/15/635,11 | | | 1,020,000 | | | | 297,119 | |
due 09/15/645,11 | | | 1,020,000 | | | | 286,741 | |
due 03/15/655,11 | | | 1,020,000 | | | | 279,195 | |
due 09/15/655,11 | | | 1,020,000 | | | | 275,244 | |
Freddie Mac | | | | | | | | |
due 01/02/3411 | | | 18,000,000 | | | | 12,896,958 | |
due 03/15/3011 | | | 12,050,000 | | | | 9,631,676 | |
due 07/15/3011 | | | 8,600,000 | | | | 6,797,922 | |
due 01/15/3111 | | | 7,750,000 | | | | 6,050,845 | |
1.25% due 10/02/19 | | | 2,500,000 | | | | 2,499,924 | |
due 09/15/3011 | | | 2,906,000 | | | | 2,297,938 | |
due 03/15/3111 | | | 2,500,000 | | | | 1,950,765 | |
due 07/15/3111 | | | 1,800,000 | | | | 1,393,603 | |
due 01/15/3011 | | | 1,050,000 | | | | 842,090 | |
Tennessee Valley Authority Principal | | | | | | | | |
due 01/15/4811,13 | | | 34,650,000 | | | | 16,047,916 | |
due 01/15/3811,13 | | | 15,800,000 | | | | 9,621,126 | |
Fannie Mae | | | | | | | | |
due 01/15/3211 | | | 9,413,000 | | | | 7,145,143 | |
due 01/15/3011 | | | 5,900,000 | | | | 4,736,124 | |
due 07/15/3211,13 | | | 3,963,000 | | | | 2,974,651 | |
due 01/15/3511 | | | 2,250,000 | | | | 1,578,763 | |
due 02/06/3311 | | | 1,456,000 | | | | 1,076,435 | |
due 01/15/3311,13 | | | 1,450,000 | | | | 1,073,415 | |
Overseas Private Investment Corp. | | | | | | | | |
3.17% due 10/05/34 | | | 11,750,000 | | | | 12,678,994 | |
Federal Farm Credit Bank | | | | | | | | |
3.58% due 04/11/47 | | | 4,900,000 | | | | 5,890,989 | |
SEE NOTES TO FINANCIAL STATEMENTS. | THE GUGGENHEIM FUNDS ANNUAL REPORT | 43 |
SCHEDULE OF INVESTMENTS (continued) | September 30, 2019 |
TOTAL RETURN BOND FUND | |
| | Face
Amount~ | | | Value | |
2.53% due 09/04/29 | | | 3,600,000 | | | $ | 3,603,065 | |
Federal Farm Credit Bank Funding Corp. | | | | | | | | |
3.08% due 08/12/39 | | | 7,550,000 | | | | 7,524,809 | |
Total Federal Agency Bonds | | | | |
(Cost $572,916,985) | | | 653,936,506 | |
| | | | | | | | | |
MUNICIPAL BONDS†† - 0.7% |
California - 0.3% |
Poway Unified School District General Obligation Unlimited | | | | | | | | |
due 08/01/4011 | | | 10,000,000 | | | | 5,775,700 | |
due 08/01/3811 | | | 8,460,000 | | | | 5,248,330 | |
Newport Mesa Unified School District General Obligation Unlimited | | | | | | | | |
due 08/01/4511 | | | 8,565,000 | | | | 3,423,859 | |
due 08/01/3911 | | | 4,000,000 | | | | 2,107,520 | |
due 08/01/3811 | | | 2,000,000 | | | | 1,282,980 | |
due 08/01/4011 | | | 2,500,000 | | | | 1,257,650 | |
due 08/01/4111 | | | 2,000,000 | | | | 958,000 | |
due 08/01/4311 | | | 1,900,000 | | | | 831,326 | |
San Diego Unified School District General Obligation Unlimited | | | | | | | | |
due 07/01/3911 | | | 7,150,000 | | | | 4,310,091 | |
due 07/01/4611 | | | 2,200,000 | | | | 1,046,848 | |
due 07/01/4311 | | | 1,350,000 | | | | 711,207 | |
Cypress School District General Obligation Unlimited | | | | | | | | |
due 08/01/4811 | | | 14,450,000 | | | | 5,145,645 | |
Beverly Hills Unified School District California General Obligation Unlimited | | | | | | | | |
due 08/01/3411 | | | 5,295,000 | | | | 3,473,679 | |
Placentia-Yorba Linda Unified School District General Obligation Unlimited | | | | | | | | |
due 08/01/4111 | | | 5,325,000 | | | | 2,850,366 | |
San Bernardino Community College District General Obligation Unlimited | | | | | | | | |
due 08/01/4411 | | | 4,750,000 | | | | 2,202,955 | |
Upland Unified School District General Obligation Unlimited | | | | | | | | |
due 08/01/5011 | | | 5,040,000 | | | | 2,025,526 | |
Hanford Joint Union High School District General Obligation Unlimited | | | | | | | | |
due 08/01/4111 | | | 4,125,000 | | | | 1,746,442 | |
San Marcos Unified School District General Obligation Unlimited | | | | | | | | |
due 08/01/4711 | | | 3,600,000 | | | | 1,615,536 | |
Antelope Valley Community College District General Obligation Unlimited | | | | | | | | |
due 08/01/3611 | | | 2,800,000 | | | | 1,499,876 | |
Wiseburn School District General Obligation Unlimited | | | | | | | | |
due 08/01/3411 | | | 900,000 | | | | 637,740 | |
Santa Ana Unified School District General Obligation Unlimited | | | | | | | | |
due 08/01/3511 | | | 700,000 | | | | 467,810 | |
Total California | | | | | | | 48,619,086 | |
| | | | | | | | | |
Georgia - 0.2% |
Central Storage Safety Project Trust | | | | | | | | |
4.82% due 02/01/3810 | | | 20,500,000 | | | | 22,603,621 | |
| | | | | | | | | |
Illinois - 0.1% |
State of Illinois General Obligation Unlimited | | | | | | | | |
5.65% due 12/01/38 | | | 5,350,000 | | | | 6,335,684 | |
6.63% due 02/01/35 | | | 1,820,000 | | | | 2,298,842 | |
44 | THE GUGGENHEIM FUNDS ANNUAL REPORT | SEE NOTES TO FINANCIAL STATEMENTS. |
SCHEDULE OF INVESTMENTS (continued) | September 30, 2019 |
TOTAL RETURN BOND FUND | |
| | Face
Amount~ | | | Value | |
City of Chicago Illinois General Obligation Unlimited | | | | | | | | |
6.31% due 01/01/44 | | | 4,500,000 | | | $ | 5,996,115 | |
Total Illinois | | | | | | | 14,630,641 | |
| | | | | | | | | |
Texas - 0.1% |
Wylie Independent School District General Obligation Unlimited | | | | | | | | |
due 08/15/4611 | | | 10,000,000 | | | | 3,581,500 | |
due 08/15/4311 | | | 4,000,000 | | | | 1,637,080 | |
Harris County-Houston Sports Authority Revenue Bonds | | | | | | | | |
due 11/15/4511 | | | 2,850,000 | | | | 1,066,983 | |
due 11/15/4111 | | | 1,500,000 | | | | 690,420 | |
Total Texas | | | | | | | 6,975,983 | |
| | | | | | | | | |
Oregon - 0.0% |
Washington & Multnomah Counties School District No. 48J Beaverton General Obligation Unlimited | | | | | | | | |
due 06/15/3311 | | | 3,850,000 | | | | 2,464,385 | |
| | | | | | | | | |
Florida - 0.0% |
County of Miami-Dade Florida Revenue Bonds | | | | | | | | |
due 10/01/4111 | | | 4,100,000 | | | | 2,048,893 | |
| | | | | | | | | |
Pennsylvania - 0.0% |
Pennsylvania Economic Development Financing Authority Revenue Bonds | | | | | | | | |
due 01/01/4111 | | | 995,000 | | | | 512,664 | |
due 01/01/3711 | | | 570,000 | | | | 339,538 | |
Total Pennsylvania | | | | | | | 852,202 | |
| | | | | | | | | |
Minnesota - 0.0% |
Dakota & Washington Counties Housing & Redevelopment Auth/City of Bloomington Minnesota Revenue Bonds | | | | | | | | |
8.38% due 09/01/21 | | | 5,000 | | | | 5,608 | |
Total Municipal Bonds | | | | |
(Cost $83,972,888) | | | | | | | 98,200,419 | |
| | | | | | | | | |
SENIOR FLOATING RATE INTERESTS††,4 - 0.3% |
Consumer, Non-cyclical - 0.1% |
Diamond (BC) B.V. | | | | | | | | |
5.26% (3 Month USD LIBOR + 3.00%, Rate Floor: 3.00%) due 09/06/24 | | | 7,172,250 | | | | 6,822,603 | |
Packaging Coordinators Midco, Inc. | | | | | | | | |
6.11% (3 Month USD LIBOR + 4.00%, Rate Floor: 5.00%) due 06/30/23 | | | 2,294,286 | | | | 2,284,971 | |
Acosta, Inc. | | | | | | | | |
7.25% (Commercial Prime Lending Rate + 2.25%, Rate Floor: 3.25%) due 12/26/19 | | | 976,534 | | | | 306,387 | |
7.25% (Commercial Prime Lending Rate + 2.25%, Rate Floor: 2.25%) due 12/26/19 | | | 839,949 | | | | 263,534 | |
Total Consumer, Non-cyclical | | | 9,677,495 | |
| | | | | | | | | |
Industrial - 0.1% |
Hayward Industries, Inc. | | | | | | | | |
5.54% (1 Month USD LIBOR + 3.50%, Rate Floor: 3.50%) due 08/05/24 | | | 3,392,845 | | | | 3,271,551 | |
SEE NOTES TO FINANCIAL STATEMENTS. | THE GUGGENHEIM FUNDS ANNUAL REPORT | 45 |
SCHEDULE OF INVESTMENTS (continued) | September 30, 2019 |
TOTAL RETURN BOND FUND | |
| | Face
Amount~ | | | Value | |
VC GB Holdings, Inc. | | | | | | | | |
5.04% (1 Month USD LIBOR + 3.00%, Rate Floor: 4.00%) due 02/28/24††† | | | 2,269,654 | | | $ | 2,235,609 | |
Hillman Group, Inc. | | | | | | | | |
6.04% (1 Month USD LIBOR + 4.00%, Rate Floor: 4.00%) due 05/30/25 | | | 987,500 | | | | 956,799 | |
Engineered Machinery Holdings, Inc. | | | | | | | | |
5.35% (3 Month USD LIBOR + 3.25%, Rate Floor: 4.25%) due 07/19/24 | | | 581,830 | | | | 569,949 | |
CHI Overhead Doors, Inc. | | | | | | | | |
5.29% (1 Month USD LIBOR + 3.25%, Rate Floor: 4.25%) due 07/29/22 | | | 485,876 | | | | 485,575 | |
API Heat Transfer | | | | | | | | |
8.10% (3 Month USD LIBOR + 6.00%, Rate Floor: 6.00%) due 01/01/24††† | | | 39,563 | | | | 32,442 | |
8.10% (3 Month USD LIBOR + 6.00%, Rate Floor: 6.00%) due 10/02/23††† | | | 7,058 | | | | 6,353 | |
Total Industrial | | | | | | | 7,558,278 | |
| | | | | | | | | |
Technology - 0.1% |
Misys Ltd. | | | | | | | | |
5.70% (1 Month USD LIBOR + 3.50%, Rate Floor: 4.50%) due 06/13/24 | | | 6,707,940 | | | | 6,520,252 | |
Aspect Software, Inc. | | | | | | | | |
7.21% (3 Month USD LIBOR + 5.00%, Rate Floor: 6.00%) due 01/15/24 | | | 9,856 | | | | 9,302 | |
Total Technology | | | | | | | 6,529,554 | |
| | | | | | | | | |
Basic Materials - 0.0% |
Road Infrastructure Investment | | | | | | | | |
5.54% (1 Month USD LIBOR + 3.50% and Commercial Prime Lending Rate + 2.50%, Rate Floor: 4.50%) due 06/13/23 | | | 4,327,991 | | | | 3,940,289 | |
| | | | | | | | | |
Consumer, Cyclical - 0.0% |
Leslie’s Poolmart, Inc. | | | | | | | | |
5.54% (1 Month USD LIBOR + 3.50%, Rate Floor: 3.50%) due 08/16/23 | | | 4,094,480 | | | | 3,889,756 | |
| | | | | | | | | |
Communications - 0.0% |
Internet Brands, Inc. | | | | | | | | |
5.79% (1 Month USD LIBOR + 3.75%, Rate Floor: 3.75%) due 09/13/24 | | | 3,411,142 | | | | 3,383,956 | |
| | | | | | | | | |
Financial - 0.0% |
USI, Inc. | | | | | | | | |
5.10% (3 Month USD LIBOR + 3.00%, Rate Floor: 3.00%) due 05/16/24 | | | 2,007,932 | | | | 1,973,215 | |
Total Senior Floating Rate Interests | | | | |
(Cost $39,420,779) | | | | | | | 36,952,543 | |
| | | | | | | | | |
46 | THE GUGGENHEIM FUNDS ANNUAL REPORT | SEE NOTES TO FINANCIAL STATEMENTS. |
SCHEDULE OF INVESTMENTS (continued) | September 30, 2019 |
TOTAL RETURN BOND FUND | |
| | Face
Amount~ | | | Value | |
REPURCHASE AGREEMENTS††,15 - 3.5% |
Societe Generale | | | | | | | | |
issued 07/09/19 at 2.74% (3 Month USD LIBOR + 0.40%) due 04/07/204 | | | 74,875,614 | | | $ | 74,875,614 | |
issued 09/10/19 at 2.54% (3 Month USD LIBOR + 0.40%) due 04/07/204 | | | 66,750,000 | | | | 66,750,000 | |
issued 07/26/19 at 2.66% (3 Month USD LIBOR + 0.40%) due 04/07/204 | | | 44,150,000 | | | | 44,150,000 | |
issued 08/15/19 at 2.74% (3 Month USD LIBOR + 0.40%) due 04/07/204 | | | 5,247,604 | | | | 5,247,604 | |
issued 07/22/19 at 2.74% (3 Month USD LIBOR + 0.40%) due 04/07/204 | | | 4,570,497 | | | | 4,570,497 | |
issued 07/15/19 at 2.74% (3 Month USD LIBOR + 0.40%) due 04/07/204 | | | 2,503,606 | | | | 2,503,606 | |
J.P. Morgan Securities LLC | | | | | | | | |
issued 09/30/19 at 2.35% due 10/01/19 | | | 71,173,000 | | | | 71,173,000 | |
issued 09/24/19 at 3.00% due 10/01/19 | | | 50,000,000 | | | | 50,000,000 | |
issued 09/25/19 at 3.00% due 10/01/19 | | | 25,000,000 | | | | 25,000,000 | |
issued 09/27/19 at 2.50% due 10/01/19 | | | 24,811,000 | | | | 24,811,000 | |
issued 09/30/19 at 2.37% due 10/01/19 | | | 10,128,000 | | | | 10,128,000 | |
BNP Paribas | | | | | | | | |
issued 09/16/19 at 2.33% due 12/16/19 | | | 36,555,232 | | | | 36,555,232 | |
issued 08/01/19 at 2.47% due 11/01/19 | | | 14,980,876 | | | | 14,980,876 | |
issued 09/19/19 at 2.47% due 11/01/19 | | | 9,474,540 | | | | 9,474,540 | |
BofA Securities, Inc. | | | | | | | | |
issued 09/25/19 at 2.80% due 10/01/19 | | | 42,000,000 | | | | 42,000,000 | |
Total Repurchase Agreements | | | | |
(Cost $482,219,969) | | | 482,219,969 | |
| | | | | | | | | |
COMMERCIAL PAPER†† - 0.7% |
Walgreens Boots Alliance, Inc. | | | | | | | | |
2.51% due 11/07/1916 | | | 20,000,000 | | | | 19,951,972 | |
2.27% due 10/02/1916 | | | 10,000,000 | | | | 9,999,369 | |
Marriott International, Inc. | | | | | | | | |
2.20% due 10/09/197,16 | | | 13,000,000 | | | | 12,993,644 | |
2.26% due 10/15/197,16 | | | 10,000,000 | | | | 9,991,056 | |
Spire, Inc. | | | | | | | | |
2.23% due 10/17/197,16 | | | 21,350,000 | | | | 21,328,840 | |
2.27% due 10/18/197,16 | | | 1,000,000 | | | | 998,928 | |
Ryder System, Inc. | | | | | | | | |
2.27% due 10/01/1916 | | | 15,000,000 | | | | 15,000,000 | |
SEE NOTES TO FINANCIAL STATEMENTS. | THE GUGGENHEIM FUNDS ANNUAL REPORT | 47 |
SCHEDULE OF INVESTMENTS (continued) | September 30, 2019 |
TOTAL RETURN BOND FUND | |
| | Face
Amount~ | | | Value | |
Entergy Corp. | | | | | | | | |
2.25% due 10/31/197,16 | | | 2,000,000 | | | $ | 1,995,843 | |
E.I. du Pont de Nemours & Co. | | | | | | | | |
2.24% due 11/08/197,16 | | | 1,600,000 | | | | 1,596,217 | |
Total Commercial Paper | | | | |
(Cost $93,852,710) | | | | | | | 93,855,869 | |
| | | | | | | | | |
| | | Contracts/
Notional Value | | | | | |
OTC OPTIONS PURCHASED†† - 0.1% |
Put options on: | | | | | | | | |
BofA Merrill Lynch 2Y-10 CMS CAP Expiring July 2022 with strike price of $0.40 | | | 5,152,600,000 | | | | 8,811,101 | |
Morgan Stanley Capital Services LLC 2Y-10 CMS CAP Expiring July 2022 with strike price of $0.40 | | | 3,921,300,000 | | | | 6,705,541 | |
Goldman Sachs International 2Y-10 CMS CAP Expiring July 2022 with strike price of $0.61 | | | 2,864,900,000 | | | | 2,911,483 | |
Goldman Sachs International 2Y-10 CMS CAP Expiring July 2022 with strike price of $0.40 | | | 816,100,000 | | | | 1,395,555 | |
BofA Merrill Lynch 2Y-10 CMS CAP Expiring July 2022 with strike price of $0.61 | | | 432,100,000 | | | | 439,126 | |
Total OTC Options Purchased | | | | |
(Cost $27,992,960) | | | | | | | 20,262,806 | |
| | | | | | | | | |
Total Investments - 100.4% | | | | |
(Cost $13,618,920,927) | | $ | 13,963,054,014 | |
Other Assets & Liabilities, net - (0.4)% | | | (53,921,502 | ) |
Total Net Assets - 100.0% | | $ | 13,909,132,512 | |
Centrally Cleared Credit Default Swap Agreements Protection Purchased†† |
| |
Counterparty | Exchange | Index | | Protection
Premium
Rate | | Payment
Frequency | Maturity
Date | | Notional
Amount | |
BofA Securities, Inc. | ICE | CDX.NA.IG.31 | 1.00% | Quarterly | 12/20/23 | | $ | 1,801,020,000 | |
Counterparty | | Value | | | Upfront
Premiums
Received | | | Unrealized
Depreciation** | |
BofA Securities, Inc. | | $ | (39,101,746 | ) | | $ | (17,948,012 | ) | | $ | (21,153,734 | ) |
48 | THE GUGGENHEIM FUNDS ANNUAL REPORT | SEE NOTES TO FINANCIAL STATEMENTS. |
SCHEDULE OF INVESTMENTS (continued) | September 30, 2019 |
TOTAL RETURN BOND FUND | |
OTC Credit Default Swap Agreements Protection Purchased†† |
| |
Counterparty | Index | | Protection
Premium
Rate | | Payment
Frequency | Maturity
Date | | Notional
Amount | | | Value | | | Upfront
Premiums
Received | | | Unrealized
Depreciation | |
Morgan Stanley Capital Services LLC | CDX.NA.IG.31 7-15% | 1.00% | Quarterly | 12/20/23 | | $ | 106,080,000 | | | $ | (2,109,997 | ) | | $ | (19,907 | ) | | $ | (2,090,090 | ) |
Goldman Sachs International | CDX.NA.IG.31 7-15% | 1.00% | Quarterly | 12/20/23 | | | 241,590,000 | | | | (4,805,369 | ) | | | (343,872 | ) | | | (4,461,497 | ) |
| | | | | | | | | | | | | | $ | (6,915,366 | ) | | $ | (363,779 | ) | | $ | (6,551,587 | ) |
Centrally Cleared Interest Rate Swap Agreements†† |
| |
Counterparty | Exchange | Floating
Rate Type | Floating Rate Index | | Fixed
Rate | | Payment
Frequency | Maturity
Date | | Notional
Amount | |
BofA Securities, Inc. | CME | Pay | 3-Month USD LIBOR | 2.79% | Quarterly | 01/21/20 | | $ | 153,969,000 | |
BofA Securities, Inc. | CME | Receive | 3-Month USD LIBOR | 1.54% | Quarterly | 08/04/21 | | | 49,180,000 | |
BofA Securities, Inc. | CME | Pay | 3-Month USD LIBOR | 2.84% | Quarterly | 01/31/20 | | | 24,186,000 | |
BofA Securities, Inc. | CME | Pay | 3-Month USD LIBOR | 2.92% | Quarterly | 01/31/20 | | | 14,106,000 | |
BofA Securities, Inc. | CME | Pay | 3-Month USD LIBOR | 2.83% | Quarterly | 01/31/20 | | | 15,573,000 | |
BofA Securities, Inc. | CME | Receive | 3-Month USD LIBOR | 2.83% | Quarterly | 01/31/20 | | | 15,573,000 | |
BofA Securities, Inc. | CME | Receive | 3-Month USD LIBOR | 2.92% | Quarterly | 01/31/20 | | | 14,106,000 | |
BofA Securities, Inc. | CME | Receive | 3-Month USD LIBOR | 2.84% | Quarterly | 01/31/20 | | | 24,186,000 | |
BofA Securities, Inc. | CME | Receive | 3-Month USD LIBOR | 2.79% | Quarterly | 01/21/20 | | | 153,969,000 | |
BofA Securities, Inc. | CME | Pay | 3-Month USD LIBOR | 1.57% | Quarterly | 08/14/21 | | | 504,500,000 | |
BofA Securities, Inc. | CME | Pay | Federal Funds Rate | 1.23% | Annually | 08/22/21 | | | 456,100,000 | |
BofA Securities, Inc. | CME | Pay | Federal Funds Rate | 1.10% | Annually | 08/28/24 | | | 554,980,000 | |
Counterparty | | Value | | | Upfront
Premiums
Paid | | | Unrealized
Appreciation
(Depreciation)** | |
BofA Securities, Inc. | | $ | 303,018 | | | $ | 234,202 | | | $ | 68,816 | |
BofA Securities, Inc. | | | 110,711 | | | | 400 | | | | 110,311 | |
BofA Securities, Inc. | | | 54,019 | | | | 41,533 | | | | 12,486 | |
BofA Securities, Inc. | | | 35,422 | | | | 27,895 | | | | 7,527 | |
BofA Securities, Inc. | | | 34,267 | | | | 26,264 | | | | 8,003 | |
BofA Securities, Inc. | | | (34,267 | ) | | | 99 | | | | (34,366 | ) |
BofA Securities, Inc. | | | (35,422 | ) | | | 95 | | | | (35,517 | ) |
BofA Securities, Inc. | | | (54,019 | ) | | | 104 | | | | (54,123 | ) |
BofA Securities, Inc. | | | (303,018 | ) | | | 140 | | | | (303,158 | ) |
BofA Securities, Inc. | | | (834,428 | ) | | | 1,457 | | | | (835,885 | ) |
BofA Securities, Inc. | | | (1,168,537 | ) | | | 1,360 | | | | (1,169,897 | ) |
BofA Securities, Inc. | | | (4,094,793 | ) | | | 2,745 | | | | (4,097,538 | ) |
| | | $ | (5,987,047 | ) | | $ | 336,294 | | | $ | (6,323,341 | ) |
SEE NOTES TO FINANCIAL STATEMENTS. | THE GUGGENHEIM FUNDS ANNUAL REPORT | 49 |
SCHEDULE OF INVESTMENTS (continued) | September 30, 2019 |
TOTAL RETURN BOND FUND | |
Total Return Swap Agreements |
| |
Counterparty | Reference
Obligation | Financing
Rate Pay | Payment
Frequency | Maturity
Date | Units | | Notional
Amount | | | Value and
Unrealized
Depreciation | |
OTC Sovereign Debt Swap Agreements†† |
Deutsche Bank AG | Korea Monetary Stabilization Bond | 2.58% (3 Month USD LIBOR + 0.45%) | At Maturity | 08/04/21 | N/A | | $ | 49,099,783 | | | $ | (242,890 | ) |
Forward Foreign Currency Exchange Contracts††
Counterparty | | Contracts
to Sell | | Currency | Settlement
Date | | Settlement
Value | | | Value at
September 30,
2019 | | | Unrealized
Appreciation
(Depreciation) | |
JPMorgan Chase Bank, N.A. | | | 481,400,000 | | BRL | 10/01/19 | | $ | 122,763,382 | | | $ | 115,977,643 | | | $ | 6,785,739 | |
Citibank N.A., New York | | | 416,000,000 | | BRL | 10/01/19 | | | 105,634,697 | | | | 100,221,644 | | | | 5,413,053 | |
Bank of America, N.A. | | | 17,346,669,000 | | JPY | 08/02/21 | | | 171,181,419 | | | | 167,198,489 | | | | 3,982,930 | |
Citibank N.A., New York | | | 436,650,000 | | BRL | 07/01/21 | | | 103,795,926 | | | | 100,043,714 | | | | 3,752,212 | |
Goldman Sachs International | | | 133,295,000 | | BRL | 07/01/20 | | | 34,613,087 | | | | 31,599,858 | | | | 3,013,229 | |
Goldman Sachs International | | | 343,000,000 | | BRL | 10/01/19 | | | 85,510,833 | | | | 82,634,673 | | | | 2,876,160 | |
Goldman Sachs International | | | 108,769,700 | | EUR | 07/30/21 | | | 126,349,603 | | | | 123,772,439 | | | | 2,577,164 | |
Barclays Bank plc | | | 46,450,000 | | EUR | 01/17/20 | | | 53,645,105 | | | | 51,075,502 | | | | 2,569,603 | |
Goldman Sachs International | | | 42,650,000 | | EUR | 01/17/20 | | | 49,248,752 | | | | 46,897,097 | | | | 2,351,655 | |
Citibank N.A., New York | | | 109,000,000 | | BRL | 07/01/20 | | | 28,075,417 | | | | 25,840,313 | | | | 2,235,104 | |
JPMorgan Chase Bank, N.A. | | | 107,510,325 | | EUR | 07/30/21 | | | 124,085,192 | | | | 122,339,357 | | | | 1,745,835 | |
JPMorgan Chase Bank, N.A. | | | 10,005,000,000 | | JPY | 07/01/21 | | | 97,867,553 | | | | 96,260,176 | | | | 1,607,377 | |
Morgan Stanley Capital Services LLC | | | 8,674,335,000 | | JPY | 08/02/21 | | | 85,134,312 | | | | 83,608,888 | | | | 1,525,424 | |
Citibank N.A., New York | | | 8,674,335,000 | | JPY | 05/06/21 | | | 84,594,646 | | | | 83,192,771 | | | | 1,401,875 | |
Citibank N.A., New York | | | 291,100,000 | | BRL | 01/02/20 | | | 70,969,753 | | | | 69,793,355 | | | | 1,176,398 | |
Bank of America, N.A. | | | 16,380,000,000 | | JPY | 01/21/20 | | | 153,969,075 | | | | 152,809,790 | | | | 1,159,285 | |
Bank of America, N.A. | | | 24,366,000 | | EUR | 06/15/20 | | | 28,020,291 | | | | 27,057,784 | | | | 962,507 | |
Goldman Sachs International | | | 20,907,600 | | EUR | 06/15/20 | | | 24,055,867 | | | | 23,217,325 | | | | 838,542 | |
Goldman Sachs International | | | 149,210,000 | | BRL | 07/01/21 | | | 34,956,073 | | | | 34,186,471 | | | | 769,602 | |
Goldman Sachs International | | | 4,532,865,300 | | JPY | 12/20/21 | | | 44,786,734 | | | | 44,054,202 | | | | 732,532 | |
Barclays Bank plc | | | 3,469,734,000 | | JPY | 06/01/21 | | | 33,963,723 | | | | 33,326,285 | | | | 637,438 | |
JPMorgan Chase Bank, N.A. | | | 67,200,000 | | BRL | 07/01/21 | | | 15,963,891 | | | | 15,396,628 | | | | 567,263 | |
Goldman Sachs International | | | 7,904,000 | | EUR | 04/30/20 | | | 9,064,307 | | | | 8,751,286 | | | | 313,021 | |
Citibank N.A., New York | | | 5,517,757,500 | | JPY | 06/01/20 | | | 52,200,082 | | | | 51,888,340 | | | | 311,742 | |
JPMorgan Chase Bank, N.A. | | | 5,930,964,000 | | JPY | 09/01/20 | | | 56,376,377 | | | | 56,080,859 | | | | 295,518 | |
Bank of America, N.A. | | | 2,083,091,025 | | JPY | 04/15/20 | | | 19,648,281 | | | | 19,534,099 | | | | 114,182 | |
Bank of America, N.A. | | | 2,413,206,000 | | JPY | 06/22/20 | | | 22,824,231 | | | | 22,721,997 | | | | 102,234 | |
Goldman Sachs International | | | 11,266,700,000 | | JPY | 01/10/20 | | | 105,086,089 | | | | 105,036,774 | | | | 49,315 | |
JPMorgan Chase Bank, N.A. | | | 879,339,450 | | JPY | 06/01/20 | | | 8,310,944 | | | | 8,269,204 | | | | 41,740 | |
Deutsche Bank AG | | | 59,198,631,145 | | KRW | 08/04/21 | | | 50,484,932 | | | | 50,464,347 | | | | 20,585 | |
Goldman Sachs International | | | 809,700 | | EUR | 07/30/20 | | | 920,386 | | | | 901,745 | | | | 18,641 | |
JPMorgan Chase Bank, N.A. | | | 800,325 | | EUR | 07/30/20 | | | 904,383 | | | | 891,304 | | | | 13,079 | |
Goldman Sachs International | | | 99,838,432 | | JPY | 06/22/20 | | | 945,114 | | | | 940,047 | | | | 5,067 | |
50 | THE GUGGENHEIM FUNDS ANNUAL REPORT | SEE NOTES TO FINANCIAL STATEMENTS. |
SCHEDULE OF INVESTMENTS (continued) | September 30, 2019 |
TOTAL RETURN BOND FUND | |
Counterparty | | Contracts
to Sell | | Currency | Settlement
Date | | Settlement
Value | | | Value at
September 30,
2019 | | | Unrealized
Appreciation
(Depreciation) | |
Citibank N.A., New York | | | 2,816,700,000 | | JPY | 01/10/20 | | $ | 26,262,203 | | | $ | 26,259,427 | | | $ | 2,776 | |
Bank of America, N.A. | | | 8,669,000 | | JPY | 02/01/21 | | | 84,687 | | | | 82,697 | | | | 1,990 | |
Bank of America, N.A. | | | 8,669,000 | | JPY | 02/03/20 | | | 82,928 | | | | 80,938 | | | | 1,990 | |
Bank of America, N.A. | | | 8,669,000 | | JPY | 08/03/20 | | | 83,799 | | | | 81,829 | | | | 1,970 | |
JPMorgan Chase Bank, N.A. | | | 5,000,000 | | JPY | 01/06/20 | | | 47,492 | | | | 46,602 | | | | 890 | |
JPMorgan Chase Bank, N.A. | | | 5,000,000 | | JPY | 07/01/20 | | | 47,966 | | | | 47,104 | | | | 862 | |
JPMorgan Chase Bank, N.A. | | | 5,000,000 | | JPY | 01/04/21 | | | 48,459 | | | | 47,621 | | | | 838 | |
Morgan Stanley Capital Services LLC | | | 4,335,000 | | JPY | 02/03/20 | | | 41,219 | | | | 40,474 | | | | 745 | |
Morgan Stanley Capital Services LLC | | | 4,335,000 | | JPY | 08/03/20 | | | 41,662 | | | | 40,919 | | | | 743 | |
Morgan Stanley Capital Services LLC | | | 4,335,000 | | JPY | 02/01/21 | | | 42,095 | | | | 41,353 | | | | 742 | |
Citibank N.A., New York | | | 4,335,000 | | JPY | 05/01/20 | | | 41,378 | | | | 40,690 | | | | 688 | |
Citibank N.A., New York | | | 4,335,000 | | JPY | 11/01/19 | | | 40,870 | | | | 40,187 | | | | 683 | |
Citibank N.A., New York | | | 4,335,000 | | JPY | 11/02/20 | | | 41,820 | | | | 41,138 | | | | 682 | |
Goldman Sachs International | | | 3,326,800 | | JPY | 12/20/19 | | | 31,345 | | | | 30,959 | | | | 386 | |
Goldman Sachs International | | | 2,265,300 | | JPY | 06/21/21 | | | 22,155 | | | | 21,783 | | | | 372 | |
Goldman Sachs International | | | 2,265,300 | | JPY | 12/21/20 | | | 21,919 | | | | 21,558 | | | | 361 | |
Barclays Bank plc | | | 1,734,000 | | JPY | 12/02/19 | | | 16,420 | | | | 16,105 | | | | 315 | |
Barclays Bank plc | | | 1,734,000 | | JPY | 06/01/20 | | | 16,618 | | | | 16,306 | | | | 312 | |
Barclays Bank plc | | | 1,734,000 | | JPY | 12/01/20 | | | 16,789 | | | | 16,483 | | | | 306 | |
Citibank N.A., New York | | | 2,757,500 | | JPY | 12/02/19 | | | 25,762 | | | | 25,611 | | | | 151 | |
JPMorgan Chase Bank, N.A. | | | 2,964,000 | | JPY | 03/02/20 | | | 27,855 | | | | 27,721 | | | | 134 | |
Bank of America, N.A. | | | 1,041,025 | | JPY | 10/15/19 | | | 9,694 | | | | 9,639 | | | | 55 | |
Bank of America, N.A. | | | 1,206,000 | | JPY | 12/20/19 | | | 11,262 | | | | 11,223 | | | | 39 | |
JPMorgan Chase Bank, N.A. | | | 439,450 | | JPY | 12/02/19 | | | 4,100 | | | | 4,081 | | | | 19 | |
Deutsche Bank AG | | | 158,041,145 | | KRW | 02/04/21 | | | 133,990 | | | | 133,987 | | | | 3 | |
Deutsche Bank AG | | | 158,041,146 | | KRW | 08/05/20 | | | 133,188 | | | | 133,203 | | | | (15 | ) |
Deutsche Bank AG | | | 158,041,145 | | KRW | 11/04/20 | | | 133,594 | | | | 133,613 | | | | (19 | ) |
Deutsche Bank AG | | | 152,887,630 | | KRW | 05/07/21 | | | 129,951 | | | | 129,976 | | | | (25 | ) |
Deutsche Bank AG | | | 158,041,146 | | KRW | 02/05/20 | | | 132,307 | | | | 132,341 | | | | (34 | ) |
Deutsche Bank AG | | | 154,605,468 | | KRW | 05/11/20 | | | 129,844 | | | | 129,878 | | | | (34 | ) |
Deutsche Bank AG | | | 158,041,146 | | KRW | 11/06/19 | | | 131,910 | | | | 131,946 | | | | (36 | ) |
Bank of America, N.A. | | | 328,899 | | ILS | 04/30/20 | | | 94,117 | | | | 96,094 | | | | (1,977 | ) |
Citibank N.A., New York | | | 745,838 | | ILS | 04/30/20 | | | 214,316 | | | | 217,910 | | | | (3,594 | ) |
Bank of America, N.A. | | | 3,959,820 | | ILS | 01/31/20 | | | 1,136,084 | | | | 1,149,524 | | | | (13,440 | ) |
Bank of America, N.A. | | | 3,949,000 | | ILS | 02/01/21 | | | 1,153,835 | | | | 1,170,014 | | | | (16,179 | ) |
Goldman Sachs International | | | 4,244,498 | | ILS | 04/30/20 | | | 1,221,971 | | | | 1,240,104 | | | | (18,133 | ) |
Bank of America, N.A. | | | 33,128,000 | | ILS | 04/30/21 | | | 9,634,433 | | | | 9,852,827 | | | | (218,394 | ) |
Bank of America, N.A. | | | 75,749,000 | | ILS | 01/31/22 | | | 22,457,456 | | | | 22,774,331 | | | | (316,875 | ) |
Citibank N.A., New York | | | 75,123,800 | | ILS | 04/30/21 | | | 21,943,566 | | | | 22,343,088 | | | | (399,522 | ) |
Goldman Sachs International | | | 112,111,771 | | ILS | 02/01/21 | | | 32,654,346 | | | | 33,216,606 | | | | (562,260 | ) |
Barclays Bank plc | | | 97,125,000 | | ILS | 01/31/20 | | | 27,479,134 | | | | 28,195,091 | | | | (715,957 | ) |
Goldman Sachs International | | | 164,231,850 | | ILS | 01/31/22 | | | 48,573,458 | | | | 49,377,161 | | | | (803,703 | ) |
SEE NOTES TO FINANCIAL STATEMENTS. | THE GUGGENHEIM FUNDS ANNUAL REPORT | 51 |
SCHEDULE OF INVESTMENTS (continued) | September 30, 2019 |
TOTAL RETURN BOND FUND | |
Counterparty | | Contracts
to Sell | | Currency | Settlement
Date | | Settlement
Value | | | Value at
September 30,
2019 | | | Unrealized
Appreciation
(Depreciation) | |
Goldman Sachs International | | | 427,522,900 | | ILS | 04/30/21 | | $ | 125,180,155 | | | $ | 127,152,539 | | | $ | (1,972,384 | ) |
Goldman Sachs International | | | 204,166,900 | | ILS | 01/31/20 | | | 56,463,636 | | | | 59,269,028 | | | | (2,805,392 | ) |
| | | | | | | | | | | | | | | | | $ | 42,136,130 | |
Counterparty | | Contracts
to Buy | | Currency | Settlement
Date | | Settlement
Value | | | Value at
September 30,
2019 | | | Unrealized
Appreciation
(Depreciation) | |
Citibank N.A., New York | | | 124,040,000 | | BRL | 10/01/19 | | $ | 30,166,103 | | | $ | 29,883,396 | | | $ | (282,707 | ) |
Morgan Stanley Capital Services LLC | | | 1,116,360,000 | | BRL | 10/01/19 | | | 270,514,522 | | | | 268,950,564 | | | | (1,563,958 | ) |
| | | | | | | | | | | | | | | | | $ | (1,846,665 | ) |
~ | The face amount is denominated in U.S. dollars unless otherwise indicated. |
* | Non-income producing security. |
** | Includes cumulative appreciation (depreciation). Variation margin is reported within the Statement of Assets and Liabilities. |
† | Value determined based on Level 1 inputs, unless otherwise noted — See Note 4. |
†† | Value determined based on Level 2 inputs, unless otherwise noted — See Note 4. |
††† | Value determined based on Level 3 inputs — See Note 4. |
1 | Security was fair valued by the Valuation Committee at September 30, 2019. The total market value of fair valued securities amounts to $22,101,316, (cost $21,400,232) or 0.2% of total net assets. |
2 | Affiliated issuer. |
3 | Rate indicated is the 7-day yield as of September 30, 2019. |
4 | Variable rate security. Rate indicated is the rate effective at September 30, 2019. In some instances, the effective rate is limited by a minimum rate floor or a maximum rate cap established by the issuer. The settlement status of a position may also impact the effective rate indicated. In some cases, a position may be unsettled at period end and may not have a stated effective rate. In instances where multiple underlying reference rates and spread amounts are shown, the effective rate is based on a weighted average. |
5 | Security is an interest-only strip. |
6 | Security is a step up/down bond. The coupon increases or decreases at regular intervals until the bond reaches full maturity. Rate indicated is the rate at September 30, 2019. See table below for additional step information for each security. |
7 | Security is a 144A or Section 4(a)(2) security. These securities have been determined to be liquid under guidelines established by the Board of Trustees. The total market value of 144A or Section 4(a)(2) securities is $3,459,183,982 (cost $3,433,375,079), or 24.9% of total net assets. |
8 | Face amount of security is adjusted for inflation. |
9 | Security has no stated coupon. However, it is expected to receive residual cash flow payments on defined deal dates. |
10 | Security is a 144A or Section 4(a)(2) security. These securities have been determined to be illiquid and restricted under guidelines established by the Board of Trustees. The total market value of 144A or Section 4(a)(2) illiquid and restricted securities is $32,735,574 (cost $32,233,809), or 0.2% of total net assets — See Note 10. |
11 | Zero coupon rate security. |
12 | Security has a fixed rate coupon which will convert to a floating or variable rate coupon on a future date. |
13 | Security is a principal-only strip. |
52 | THE GUGGENHEIM FUNDS ANNUAL REPORT | SEE NOTES TO FINANCIAL STATEMENTS. |
SCHEDULE OF INVESTMENTS (continued) | September 30, 2019 |
TOTAL RETURN BOND FUND | |
14 | Effective November 30, 2018, Guggenheim Strategy Fund I was reorganized with and into the Guggenheim Ultra Short Duration Fund. |
15 | Repurchase Agreements — See additional disclosure in the repurchase agreements table below for more information on repurchase agreements. |
16 | Rate indicated is the effective yield at the time of purchase. |
17 | Security is in default of interest and/or principal obligations. |
| | BofA — Bank of America |
| | BRL — Brazilian Real |
| | CDX.NA.IG.31 Index — Credit Default Swap North American Investment Grade Series 31 Index |
| | CME — Chicago Mercantile Exchange |
| | CMS — Constant Maturity Swap |
| | CMT — Constant Maturity Treasury |
| | EUR — Euro |
| | ICE — Intercontinental Exchange |
| | ILS — Israeli New Shekel |
| | JPY — Japanese Yen |
| | KRW — South Korean Won |
| | LIBOR — London Interbank Offered Rate |
| | plc — Public Limited Company |
| | REIT — Real Estate Investment Trust |
| | REMIC — Real Estate Mortgage Investment Conduit |
| | WAC — Weighted Average Coupon |
| | |
| | See Sector Classification in Other Information section. |
SEE NOTES TO FINANCIAL STATEMENTS. | THE GUGGENHEIM FUNDS ANNUAL REPORT | 53 |
SCHEDULE OF INVESTMENTS (continued) | September 30, 2019 |
TOTAL RETURN BOND FUND | |
The following table summarizes the inputs used to value the Fund’s investments at September 30, 2019 (See Note 4 in the Notes to Financial Statements):
Investments in
Securities (Assets) | | Level 1
Quoted
Prices | | | Level 2
Significant
Observable
Inputs | | | Level 3
Significant
Unobservable
Inputs | | | Total | |
Common Stocks | | $ | — | | | $ | — | | | $ | 12,885 | | | $ | 12,885 | |
Preferred Stocks | | | — | | | | 6,614 | | | | — | | | | 6,614 | |
Mutual Funds | | | 125,565,858 | | | | — | | | | — | | | | 125,565,858 | |
Money Market Fund | | | 63,759,824 | | | | — | | | | — | | | | 63,759,824 | |
Collateralized Mortgage Obligations | | | — | | | | 4,132,578,531 | | | | 61,127,008 | | | | 4,193,705,539 | |
U.S. Government Securities | | | — | | | | 2,751,907,354 | | | | — | | | | 2,751,907,354 | |
Asset-Backed Securities | | | — | | | | 2,260,252,718 | | | | 137,712,008 | | | | 2,397,964,726 | |
Foreign Government Debt | | | — | | | | 1,932,481,136 | | | | — | | | | 1,932,481,136 | |
Corporate Bonds | | | — | | | | 1,105,799,216 | | | | 6,422,750 | | | | 1,112,221,966 | |
Federal Agency Bonds | | | — | | | | 653,936,506 | | | | — | | | | 653,936,506 | |
Municipal Bonds | | | — | | | | 98,200,419 | | | | — | | | | 98,200,419 | |
Senior Floating Rate Interests | | | — | | | | 34,678,139 | | | | 2,274,404 | | | | 36,952,543 | |
Repurchase Agreements | | | — | | | | 482,219,969 | | | | — | | | | 482,219,969 | |
Commercial Paper | | | — | | | | 93,855,869 | | | | — | | | | 93,855,869 | |
Options Purchased | | | — | | | | 20,262,806 | | | | — | | | | 20,262,806 | |
Forward Foreign Currency Exchange Contracts** | | | — | | | | 49,984,103 | | | | — | | | | 49,984,103 | |
Interest Rate Swap Agreements** | | | — | | | | 207,143 | | | | — | | | | 207,143 | |
Total Assets | | $ | 189,325,682 | | | $ | 13,616,370,523 | | | $ | 207,549,055 | | | $ | 14,013,245,260 | |
Investments in Securities
(Liabilities) | | Level 1
Quoted
Prices | | | Level 2
Significant
Observable
Inputs | | | Level 3
Significant
Unobservable
Inputs | | | Total | |
Credit Default Swap Agreements** | | $ | — | | | $ | 27,705,321 | | | $ | — | | | $ | 27,705,321 | |
Forward Foreign Currency Exchange Contracts** | | | — | | | | 9,694,638 | | | | — | | | | 9,694,638 | |
Interest Rate Swap Agreements** | | | — | | | | 6,530,484 | | | | — | | | | 6,530,484 | |
Total Return Swap Agreements** | | | — | | | | 242,890 | | | | — | | | | 242,890 | |
Unfunded Loan Commitments (Note 9) | | | — | | | | — | | | | 263,215 | | | | 263,215 | |
Total Liabilities | | $ | — | | | $ | 44,173,333 | | | $ | 263,215 | | | $ | 44,436,548 | |
** | This derivative is reported as unrealized appreciation/depreciation at period end. |
54 | THE GUGGENHEIM FUNDS ANNUAL REPORT | SEE NOTES TO FINANCIAL STATEMENTS. |
SCHEDULE OF INVESTMENTS (continued) | September 30, 2019 |
TOTAL RETURN BOND FUND | |
The following is a summary of significant unobservable inputs used in the fair valuation of assets and liabilities categorized within Level 3 of the fair value hierarchy:
Category | | Ending
Balance at
September 30,
2019 | | Valuation Technique | Unobservable
Inputs | | Input
Range | | | Weighted
Average* | |
Assets: | | | | | | | | | | | | | | |
Asset-Backed Securities | | $ | 115,610,925 | | Option Adjusted Spread off the prior month end broker quote | Broker Quote | — | — |
Asset-Backed Securities | | | 22,101,083 | | Yield Analysis | Yield | 3.4% | — |
Collateralized Mortgage Obligations | | | 61,127,008 | | Option Adjusted Spread off the prior month end broker quote | Broker Quote | — | — |
Common Stocks | | | 12,652 | | Third Party Pricing | Broker Quote | — | — |
Common Stocks | | | 233 | | Enterprise Value | Valuation Multiple | 1.9x-11.9x | 3.8x |
Corporate Bonds | | | 6,422,750 | | Option Adjusted Spread off the prior month end broker quote | Broker Quote | — | — |
Senior Floating Rate Interests | | | 2,274,404 | | Third Party Pricing | Broker Quote | — | — |
Total | | $ | 207,549,055 | | | | | | | | | | | |
| | | | | | | | | | | | | | | |
Liabilities: | | | | | | | | | | | | | | |
Unfunded Loan Commitments | | | 263,215 | | Model Price | Purchase Price | — | — |
* | Inputs are weighted by the fair value of the instruments. |
Significant changes in a quote, yield, market comparable yields, or valuation multiples would generally result in significant changes in the fair value of the security.
Any remaining Level 3 securities held by the Fund and excluded from the tables above, were not considered material to the Fund.
The Fund’s fair valuation leveling guidelines were recently revised to classify a single daily broker quote, or a vendor price based on a single daily or monthly broker quote, as Level 3 rather than Level 2, if such a quote or price cannot be supported with other available market information.
Transfers between Level 2 and Level 3 may occur as markets fluctuate and/or the availability of data used in an investment’s valuation changes. For the year ended September 30, 2019, the Fund had assets with a total value of $2,467,544 and liabilities with a total value of $263,189 transfer into Level 3 from Level 2 due to the lack of observable inputs and had assets with a total value of $7,793,906 transfer out of Level 3 into Level 2 due to changes in the securities valuation methods based on the availability of observable market inputs.
SEE NOTES TO FINANCIAL STATEMENTS. | THE GUGGENHEIM FUNDS ANNUAL REPORT | 55 |
SCHEDULE OF INVESTMENTS (continued) | September 30, 2019 |
TOTAL RETURN BOND FUND | |
Summary of Fair Value Level 3 Activity
Following is a reconciliation of Level 3 assets for which significant unobservable inputs were used to determine fair value for the year ended September 30, 2019:
| | | Assets | | | | | | | Liabilities | |
| | Asset-
Backed
Securities | | | Collateralized
Mortgage
Obligations | | | Corporate
Bonds | | | Senior
Floating
Rate
Interests | | | Common
Stocks | | | Warrants | | | Total
Assets | | | Unfunded
Loan
Commitments | |
Beginning Balance | | $ | 22,443,434 | | | $ | 12,469,266 | | | $ | 5,891,932 | | | $ | — | | | $ | — | * | | $ | — | * | | $ | 40,804,632 | | | $ | — | * |
Purchases/(Receipts) | | | 114,350,000 | | | | 57,445,898 | | | | — | | | | 46,868 | | | | 21,072 | | | | — | | | | 171,863,838 | | | | (30 | ) |
(Sales, maturities and paydowns)/Fundings | | | (256,966 | ) | | | (118,892 | ) | | | — | | | | (352 | ) | | | — | | | | — | * | | | (376,210 | ) | | | — | |
Amortization of premiums/discounts | | | 2,275 | | | | 73,196 | | | | — | | | | 21 | | | | — | | | | — | | | | 75,492 | | | | — | |
Total realized gains (losses) included in earnings | | | (4 | ) | | | (3,628 | ) | | | — | | | | — | | | | — | | | | — | | | | (3,632 | ) | | | — | |
Total change in unrealized appreciation (depreciation) included in earnings | | | 941,334 | | | | (944,926 | ) | | | 530,818 | | | | (7,742 | ) | | | (8,187 | ) | | | — | | | | 511,297 | | | | 4 | |
Transfers into Level 3 | | | 231,935 | | | | — | | | | — | | | | 2,235,609 | | | | — | | | | — | | | | 2,467,544 | | | | (263,189 | ) |
Transfers out of Level 3 | | | — | | | | (7,793,906 | ) | | | — | | | | — | | | | — | | | | — | | | | (7,793,906 | ) | | | — | |
Ending Balance | | $ | 137,712,008 | | | $ | 61,127,008 | | | $ | 6,422,750 | | | $ | 2,274,404 | | | $ | 12,885 | | | $ | — | | | $ | 207,549,055 | | | $ | (263,215 | ) |
Net change in unrealized appreciation (depreciation) for investments in Level 3 securities still held at September 30, 2019 | | $ | 941,334 | | | $ | (1,030,582 | ) | | $ | 530,818 | | | $ | (7,742 | ) | | $ | (8,187 | ) | | $ | — | | | $ | 433,828 | | | $ | 4 | |
* | Security has a market value of $0. |
56 | THE GUGGENHEIM FUNDS ANNUAL REPORT | SEE NOTES TO FINANCIAL STATEMENTS. |
SCHEDULE OF INVESTMENTS (continued) | September 30, 2019 |
TOTAL RETURN BOND FUND | |
Step Coupon Bonds
The following table discloses additional information related to step coupon bonds held by the Fund. Certain securities are subject to multiple rate changes prior to maturity. For those securities a range of rates and corresponding dates have been provided. Rates for all step coupon bonds held by the Fund are scheduled to increase, none are scheduled to decrease.
Name | | Coupon Rate at
Next Reset Date | | | Next Rate
Reset Date | | | Future Reset
Rate(s) | | | Future Reset
Date(s) | |
Freddie Mac Seasoned Credit Risk Transfer Trust 2017-4, 3.00% due 06/25/57 | | | 3.25 | % | | | 12/25/19 | | | | — | | | | — | |
Freddie Mac Seasoned Credit Risk Transfer Trust 2018-1, 2.75% due 05/25/57 | | | 3.00 | % | | | 03/25/20 | | | | — | | | | — | |
Legacy Mortgage Asset Trust 2018-GS3, 4.00% due 06/25/58 | | | 7.00 | % | | | 07/26/21 | | | | 8.00 | % | | | 07/26/22 | |
New Residential Mortgage Loan Trust 2019-RPL1, 4.33% due 02/26/24 | | | 7.33 | % | | | 02/25/22 | | | | 8.33 | % | | | 02/25/23 | |
Willis Engine Securitization Trust II 2012-A, 5.50% due 09/15/37 | | | 8.50 | % | | | 09/15/20 | | | | — | | | | — | |
Repurchase Agreements
In connection with transactions in repurchase agreements, it is the Fund’s policy that its custodian take possession of the underlying collateral. The collateral is in the possession of the Fund’s custodian and is evaluated to ensure that its market value exceeds, at a minimum, 102% of the original face amount of the repurchase agreements.
The Fund may engage in repurchase agreements. Repurchase agreements are fixed income securities in the form of agreements backed by collateral. These agreements typically involve the acquisition by the Fund of securities from the selling institution coupled with the agreement that the selling institution will repurchase the underlying securities at a specified price and at a fixed time in the future. The Fund may accept a wide variety of underlying securities as collateral for the repurchase agreements entered into by the Fund. Any such securities serving as collateral are marked-to-market daily in order to maintain full collateralization. Securities purchased under repurchase agreements are reflected as an asset on the Statement of Assets and Liabilities. Interest earned is recorded as a component of interest income on the Statement of Operations.
The use of repurchase agreements involves certain risks. For example, if the selling institution defaults on its obligation to repurchase the underlying securities at a time when the value of securities has declined, the Fund may incur a loss upon disposition of them. In the event of an insolvency or bankruptcy by the selling institution, the Fund’s right to control the collateral could be affected and result in certain costs and delays. In addition, the Fund could incur a loss if the value of the underlying collateral falls below the agreed upon repurchase price.
At September 30, 2019, the repurchase agreements in the account were as follows:
Counterparty and
Terms of Agreement | | Face
Value | | | Repurchase
Price | | | Collateral | | Par
Value | | | Fair
Value | |
BNP Paribas | | | | | | | | | | Countrywide Asset-Backed Certificates | | | | | | | | |
2.33% - 2.47% | | | | | | | | | | 2.15% | | | | | | | | |
11/01/19 - 12/16/19 | | $ | 61,010,648 | | | $ | 61,347,853 | | | 12/25/36 | | $ | 158,648,000 | | | $ | 148,415,204 | |
SEE NOTES TO FINANCIAL STATEMENTS. | THE GUGGENHEIM FUNDS ANNUAL REPORT | 57 |
SCHEDULE OF INVESTMENTS (continued) | September 30, 2019 |
TOTAL RETURN BOND FUND | |
Counterparty and
Terms of Agreement | | Face
Value | | | Repurchase
Price | | | Collateral | | Par
Value | | | Fair
Value | |
| | | | | | | | | | | MASTR Adjustable Rate Mortgages Trust | | | | | | | | |
| | | | | | | | | | | 2.22% | | | | | | | | |
| | | | | | | | | | | 05/25/47 | | $ | 64,321,000 | | | $ | 70,560,137 | |
| | | | | | | | | | | Countrywide Asset-Backed Certificates | | | | | | | | |
| | | | | | | | | | | 2.24% | | | | | | | | |
| | | | | | | | | | | 06/25/47 | | | 19,000,000 | | | | 15,889,700 | |
| | | | | | | | | | | Bayview Financial Mortgage Pass-Through Trust | | | | | | | | |
| | | | | | | | | | | 6.19% | | | | | | | | |
| | | | | | | | | | | 11/28/36 | | | 12,765,000 | | | | 7,699,848 | |
| | | | | | | | | | | Saxon Asset Securities Trust | | | | | | | | |
| | | | | | | | | | | 2.47% | | | | | | | | |
| | | | | | | | | | | 11/25/37 | | | 5,648,000 | | | | 5,505,106 | |
| | | | | | | | | | | Nationstar Home Equity Loan Trust | | | | | | | | |
| | | | | | | | | | | 2.34% | | | | | | | | |
| | | | | | | | | | | 04/25/37 | | | 2,000,000 | | | | 1,934,000 | |
| | | | | | | | | | | Structured Asset Securities Corp Mortgage Loan Trust | | | | | | | | |
| | | | | | | | | | | 2.22% | | | | | | | | |
| | | | | | | | | | | 06/25/37 | | | 2,770,000 | | | | 1,915,732 | |
| | | | | | | | | | | Fannie Mae Connecticut Avenue Securities | | | | | | | | |
| | | | | | | | | | | 6.47% | | | | | | | | |
| | | | | | | | | | | 01/25/29 | | | 463,000 | | | | 487,446 | |
| | | | | | | | | | | | | $ | 265,615,000 | | | $ | 252,407,173 | |
| | | | | | | | | | | | | | | | | | | |
Societe Generale | | | | | | | | | | Freddie Mac Structured Agency Credit Risk | | | | | | | | |
2.54% - 2.74% (3 Month USD LIBOR + 0.40%) | | | | | | | | | | Debt Notes 5.27% | | | | | | | | |
04/07/20* | | $ | 198,097,321 | | | $ | 201,789,654 | | | 07/25/29 | | $ | 23,652,995 | | | $ | 24,797,800 | |
| | | | | | | | | | | Morgan Stanley Capital I Trust | | | | | | | | |
| | | | | | | | | | | 6.26% | | | | | | | | |
| | | | | | | | | | | 11/15/34 | | | 21,800,000 | | | | 21,786,920 | |
| | | | | | | | | | | Connecticut Avenue Securities Trust | | | | | | | | |
| | | | | | | | | | | 4.32% | | | | | | | | |
| | | | | | | | | | | 08/25/31 | | | 17,200,000 | | | | 17,287,720 | |
58 | THE GUGGENHEIM FUNDS ANNUAL REPORT | SEE NOTES TO FINANCIAL STATEMENTS. |
SCHEDULE OF INVESTMENTS (continued) | September 30, 2019 |
TOTAL RETURN BOND FUND | |
Counterparty and
Terms of Agreement | | Face
Value | | | Repurchase
Price | | | Collateral | | Par
Value | | | Fair
Value | |
| | | | | | | | | | | STACR Trust | | | | | | | | |
| | | | | | | | | | | 4.12% | | | | | | | | |
| | | | | | | | | | | 09/25/48 | | $ | 17,100,000 | | | $ | 17,139,330 | |
| | | | | | | | | | | Connecticut Avenue Securities Trust | | | | | | | | |
| | | | | | | | | | | 4.17% | | | | | | | | |
| | | | | | | | | | | 09/25/31 | | | 15,097,162 | | | | 15,169,628 | |
| | | | | | | | | | | Freddie Mac STACR Trust | | | | | | | | |
| | | | | | | | | | | 4.07% | | | | | | | | |
| | | | | | | | | | | 04/25/49 | | | 14,950,925 | | | | 15,007,739 | |
| | | | | | | | | | | Hawaii Hotel Trust | | | | | | | | |
| | | | | | | | | | | 5.06% | | | | | | | | |
| | | | | | | | | | | 05/15/38 | | | 14,300,000 | | | | 14,394,380 | |
| | | | | | | | | | | JP Morgan Chase Commercial Mortgage Securities Trust | | | | | | | | |
| | | | | | | | | | | 4.91% | | | | | | | | |
| | | | | | | | | | | 06/15/35 | | | 14,000,000 | | | | 14,109,200 | |
| | | | | | | | | | | JP Morgan Chase Commercial Mortgage Securities Trust | | | | | | | | |
| | | | | | | | | | | 5.01% | | | | | | | | |
| | | | | | | | | | | 07/15/36 | | | 11,000,000 | | | | 11,040,700 | |
| | | | | | | | | | | Fannie Mae Connecticut Avenue Securities | | | | | | | | |
| | | | | | | | | | | 4.87% | | | | | | | | |
| | | | | | | | | | | 11/25/29 | | | 10,300,000 | | | | 10,613,120 | |
| | | | | | | | | | | Motel 6 Trust | | | | | | | | |
| | | | | | | | | | | 6.16% | | | | | | | | |
| | | | | | | | | | | 08/15/34 | | | 9,553,000 | | | | 9,606,497 | |
| | | | | | | | | | | Waikiki Beach Hotel Trust | | | | | | | | |
| | | | | | | | | | | 5.00% | | | | | | | | |
| | | | | | | | | | | 12/15/33 | | | 8,730,000 | | | | 8,773,650 | |
| | | | | | | | | | | GS Mortgage Securities Corp. Trust | | | | | | | | |
| | | | | | | | | | | 5.91% | | | | | | | | |
| | | | | | | | | | | 07/15/32 | | | 8,733,000 | | | | 8,763,565 | |
| | | | | | | | | | | HMH Trust | | | | | | | | |
| | | | | | | | | | | 8.48% | | | | | | | | |
| | | | | | | | | | | 07/05/31 | | | 6,857,000 | | | | 7,371,961 | |
SEE NOTES TO FINANCIAL STATEMENTS. | THE GUGGENHEIM FUNDS ANNUAL REPORT | 59 |
SCHEDULE OF INVESTMENTS (continued) | September 30, 2019 |
TOTAL RETURN BOND FUND | |
Counterparty and
Terms of Agreement | | Face
Value | | | Repurchase
Price | | | Collateral | | Par
Value | | | Fair
Value | |
| | | | | | | | | | | Freddie Mac Structured Agency Credit Risk Debt Notes | | | | | | | | |
| | | | | | | | | | | 6.67% | | | | | | | | |
| | | | | | | | | | | 10/25/28 | | $ | 6,156,847 | | | $ | 6,597,062 | |
| | | | | | | | | | | Fannie Mae Connecticut Avenue Securities | | | | | | | | |
| | | | | | | | | | | 5.57% | | | | | | | | |
| | | | | | | | | | | 07/25/29 | | | 6,200,000 | | | | 6,516,200 | |
| | | | | | | | | | | JP Morgan Chase Commercial Mortgage Securities Trust | | | | | | | | |
| | | | | | | | | | | 4.32% | | | | | | | | |
| | | | | | | | | | | 06/15/35 | | | 5,700,000 | | | | 5,696,010 | |
| | | | | | | | | | | Fannie Mae Connecticut Avenue Securities | | | | | | | | |
| | | | | | | | | | | 5.02% | | | | | | | | |
| | | | | | | | | | | 10/25/29 | | | 5,454,574 | | | | 5,670,030 | |
| | | | | | | | | | | BXP Trust | | | | | | | | |
| | | | | | | | | | | 5.91% | | | | | | | | |
| | | | | | | | | | | 11/15/34 | | | 5,500,000 | | | | 5,536,300 | |
| | | | | | | | | | | Credit Suisse Mortgage Capital Certificates | | | | | | | | |
| | | | | | | | | | | 4.56% | | | | | | | | |
| | | | | | | | | | | 05/15/36 | | | 5,000,000 | | | | 5,015,500 | |
| | | | | | | | | | | Bayview Financial Acquisition Trust | | | | | | | | |
| | | | | | | | | | | 6.73% | | | | | | | | |
| | | | | | | | | | | 05/28/37 | | | 3,600,000 | | | | 4,065,840 | |
| | | | | | | | | | | Fannie Mae Connecticut Avenue Securities | | | | | | | | |
| | | | | | | | | | | 4.17% | | | | | | | | |
| | | | | | | | | | | 10/25/30 | | | 4,015,000 | | | | 4,045,915 | |
| | | | | | | | | | | Freddie Mac Structured Agency Credit Risk Debt Notes | | | | | | | | |
| | | | | | | | | | | 6.27% | | | | | | | | |
| | | | | | | | | | | 11/25/23 | | | 3,433,787 | | | | 3,695,098 | |
| | | | | | | | | | | Natixis Commercial Mortgage Securities Trust | | | | | | | | |
| | | | | | | | | | | 5.20% | | | | | | | | |
| | | | | | | | | | | 02/15/33 | | | 3,200,000 | | | | 3,180,800 | |
60 | THE GUGGENHEIM FUNDS ANNUAL REPORT | SEE NOTES TO FINANCIAL STATEMENTS. |
SCHEDULE OF INVESTMENTS (continued) | September 30, 2019 |
TOTAL RETURN BOND FUND | |
Counterparty and
Terms of Agreement | | Face
Value | | | Repurchase
Price | | | Collateral | | Par
Value | | | Fair
Value | |
| | | | | | | | | | | Carlyle Global Market Strategies CLO Ltd. | | | | | | | | |
| | | | | | | | | | | 9.57% | | | | | | | | |
| | | | | | | | | | | 04/22/32 | | $ | 2,900,000 | | | $ | 2,851,570 | |
| | | | | | | | | | | OHA Loan Funding Ltd. | | | | | | | | |
| | | | | | | | | | | 8.78% | | | | | | | | |
| | | | | | | | | | | 01/20/28 | | | 1,400,000 | | | | 1,377,460 | |
| | | | | | | | | | | | | $ | 245,834,290 | | | $ | 250,109,995 | |
| | | | | | | | | | | | | | | | | | | |
J.P. Morgan Securities LLC | | | | | | | | | | U.S. Treasury Note | | | | | | | | |
2.35% - 3.00% | | | | | | | | | | 2.63% | | | | | | | | |
10/01/19 | | $ | 181,112,000 | | | $ | 181,125,286 | | | 02/28/23 | | $ | 70,000,000 | | | $ | 72,422,000 | |
| | | | | | | | | | | U.S. Treasury Note | | | | | | | | |
| | | | | | | | | | | 2.50% | | | | | | | | |
| | | | | | | | | | | 05/15/24 | | | 48,533,000 | | | | 50,532,560 | |
| | | | | | | | | | | Ginnie Mae II Pool | | | | | | | | |
| | | | | | | | | | | 4.50% | | | | | | | | |
| | | | | | | | | | | 06/20/49 | | | 34,767,000 | | | | 36,505,350 | |
| | | | | | | | | | | Fannie Mae Pool | | | | | | | | |
| | | | | | | | | | | 3.50% | | | | | | | | |
| | | | | | | | | | | 09/01/49 | | $ | 25,000,000 | | | $ | 25,685,000 | |
| | | | | | | | | | | | | $ | 178,300,000 | | | $ | 185,144,910 | |
| | | | | | | | | | | | | | | | | | | |
BofA Securities, Inc. | | | | | | | | | | U.S. Treasury Note | | | | | | | | |
2.80% | | | | | | | | | | 1.50% | | | | | | | | |
10/01/19 | | $ | 42,000,000 | | | $ | 42,003,267 | | | 09/30/24 | | $ | 43,056,000 | | | $ | 42,948,360 | |
* | Variable rate security. Rate indicated is the rate effective at September 30, 2019. In some instances, the effective rate is limited by a minimum rate floor or a maximum rate cap established by the issuer. The settlement status of a position may also impact the effective rate indicated. In some cases, a position may be unsettled at period end and may not have a stated effective rate. In instances where multiple underlying reference rates and spread amounts are shown, the effective rate is based on a weighted average. |
SEE NOTES TO FINANCIAL STATEMENTS. | THE GUGGENHEIM FUNDS ANNUAL REPORT | 61 |
SCHEDULE OF INVESTMENTS (continued) | September 30, 2019 |
TOTAL RETURN BOND FUND | |
Affiliated Transactions
Investments representing 5% or more of the outstanding voting shares of a company, or control of or by, or common control under Guggenheim Investments (“GI”), result in that company being considered an affiliated issuer, as defined in the 1940 Act.
The Fund may invest in certain of the underlying series of Guggenheim Strategy Funds Trust, including Guggenheim Strategy Fund II and Guggenheim Strategy Fund III, (collectively, the “Cash Management Funds”), each of which are open-end management investment companies managed by GI. The Cash Management Funds, which launched on March 11, 2014, are offered as cash management options only to mutual funds, trusts, and other accounts managed by GI and/or its affiliates, and are not available to the public. The Cash Management Funds pay no investment management fees. The Cash Management Funds’ annual report on Form N-CSR dated September 30, 2018, is available publicly or upon request. This information is available from the EDGAR database on the SEC’s website at https://www.sec.gov/Archives/edgar/data/1601445/000089180418000513/gug75569-ncsr.htm.
Transactions during the year ended September 30, 2019, in which the company is an affiliated issuer, were as follows:
Security Name | | Value
09/30/18 | | | Additions | | | Reductions | | | Realized
Gain (Loss) | | | Change in
Unrealized
Appreciation
(Depreciation) | |
Common Stocks | | | | | | | | | | | | | | | | | | | | |
Aspect Software Parent, Inc.* | | $ | — | ** | | $ | — | | | $ | — | | | $ | — | | | $ | — | |
BP Holdco LLC*,1 | | | — | | | | 188 | | | | — | | | | — | | | | — | |
Mutual Funds | | | | | | | | | | | | | | | | | | | | |
Guggenheim Floating Rate Strategies Fund — R6-Class | | | 105,685,870 | | | | 3,262,886 | | | | (58,870,000 | ) | | | (1,599,128 | ) | | | (1,028,229 | ) |
Guggenheim Strategy Fund II | | | 25,435,578 | | | | 756,982 | | | | — | | | | — | | | | (153,306 | ) |
Guggenheim Strategy Fund III | | | 25,444,068 | | | | 754,070 | | | | — | | | | — | | | | (183,659 | ) |
Guggenheim Ultra Short Duration Fund — Institutional Class2 | | | 25,458,278 | | | | 739,417 | | | | — | | | | — | | | | (136,969 | ) |
Senior Floating Rate Interests3 | | | | | | | | | | | | | | | | | | | | |
Aspect Software, Inc. 12.67% (3 Month USD LIBOR + 10.50%, Rate Floor: 1.00%) due 05/25/20 | | | 12,202 | | | | — | | | | (10,024 | ) | | | (4,611 | ) | | | 2,433 | |
Warrants | | | | | | | | | | | | | | | | | | | | |
Aspect Software, Inc. | | | — | ** | | | — | | | | — | | | | — | | | | — | |
| | | $ | 182,035,996 | | | $ | 5,513,543 | | | $ | (58,880,024 | ) | | $ | (1,603,739 | ) | | $ | (1,499,730 | ) |
62 | THE GUGGENHEIM FUNDS ANNUAL REPORT | SEE NOTES TO FINANCIAL STATEMENTS. |
SCHEDULE OF INVESTMENTS (concluded) | September 30, 2019 |
TOTAL RETURN BOND FUND | |
Security Name | | Value
09/30/19 | | | Shares/
Face Amount
09/30/19 | | | Investment
Income | | | Capital Gain
Distributions | |
Common Stocks | | | | | | | | | | | | | | | | |
Aspect Software Parent, Inc.* | | $ | — | | | | — | | | $ | — | | | $ | — | |
BP Holdco LLC*,1 | | | 188 | | | | 532 | | | | — | | | | — | |
Mutual Funds | | | | | | | | | | | | | | | | |
Guggenheim Floating Rate Strategies Fund — R6-Class | | | 47,451,399 | | | | 1,879,263 | | | | 3,262,494 | | | | 392 | |
Guggenheim Strategy Fund II | | | 26,039,254 | | | | 1,048,701 | | | | 743,333 | | | | 13,648 | |
Guggenheim Strategy Fund III | | | 26,014,479 | | | | 1,048,126 | | | | 753,117 | | | | 953 | |
Guggenheim Ultra Short Duration Fund — Institutional Class2 | | | 26,060,726 | | | | 2,616,539 | | | | 720,869 | | | | 18,548 | |
Senior Floating Rate Interests3 | | | | | | | | | | | | | | | | |
Aspect Software, Inc. 12.67% (3 Month USD LIBOR + 10.50%, Rate Floor: 1.00%) due 05/25/20 | | | — | | | | — | | | | 681 | | | | — | |
Warrants | | | | | | | | | | | | | | | | |
Aspect Software, Inc. | | | — | | | | — | | | | — | | | | — | |
| | | $ | 125,566,046 | | | | | | | $ | 5,480,494 | | | $ | 33,541 | |
* | Non-income producing security. |
** | Security has a market value of $0. |
1 | Security was fair valued by the Valuation Committee at September 30, 2019. The total market value of fair valued and affiliated securities amounts to $188, (cost $188) or less than 0.1% of total net assets. |
2 | Effective November 30, 2018, Guggenheim Strategy Fund I was reorganized with and into the Guggenheim Ultra Short Duration Fund. |
3 | Variable rate security. Rate indicated is the rate effective at September 30, 2019. In some instances, the effective rate is limited by a minimum rate floor or a maximum rate cap established by the issuer. The settlement status of a position may also impact the effective rate indicated. In some cases, a position may be unsettled at period end and may not have a stated effective rate. In instances where multiple underlying reference rates and spread amounts are shown, the effective rate is based on a weighted average. |
SEE NOTES TO FINANCIAL STATEMENTS. | THE GUGGENHEIM FUNDS ANNUAL REPORT | 63 |
STATEMENT OF ASSETS AND LIABILITIES |
TOTAL RETURN BOND FUND |
September 30, 2019
Assets: |
Investments in unaffiliated issuers, at value (cost $13,009,416,837) | | $ | 13,355,267,999 | |
Investments in affiliated issuers, at value (cost $127,284,121) | | | 125,566,046 | |
Repurchase agreements, at value (cost $482,219,969) | | | 482,219,969 | |
Segregated cash with broker | | | 52,772,667 | |
Unamortized upfront premiums paid on interest rate swap agreements | | | 336,294 | |
Unrealized appreciation on forward foreign currency exchange contracts | | | 49,984,103 | |
Prepaid expenses | | | 459,009 | |
Receivables: |
Interest | | | 49,850,897 | |
Fund shares sold | | | 29,331,476 | |
Securities sold | | | 1,320,000 | |
Foreign tax reclaims | | | 494,223 | |
Dividends | | | 335,302 | |
Swap settlement | | | 39,693 | |
Investment Adviser | | | 357 | |
Total assets | | | 14,147,978,035 | |
| | | | | |
Liabilities: |
Unfunded loan commitments, at value (Note 9) (proceeds $49,815) | | | 263,215 | |
Overdraft due to custodian bank | | | 675,479 | |
Segregated cash due to broker | | | 37,798,000 | |
Unamortized upfront premiums received on credit default swap agreements | | | 18,311,791 | |
Unrealized depreciation on OTC swap agreements | | | 6,794,477 | |
Unrealized depreciation on forward foreign currency exchange contracts | | | 9,694,638 | |
Payable for: |
Securities purchased | | | 127,360,430 | |
Fund shares redeemed | | | 25,458,454 | |
Distributions to shareholders | | | 5,195,862 | |
Management fees | | | 2,783,586 | |
Variation margin on interest rate swap agreements | | | 1,059,902 | |
Fund accounting/administration fees | | | 844,870 | |
Protection fees on credit default swap agreements | | | 656,544 | |
Transfer agent/maintenance fees | | | 611,275 | |
Distribution and service fees | | | 492,447 | |
Variation margin on centrally cleared credit default swap agreements | | | 236,871 | |
Trustees’ fees* | | | 17,517 | |
Miscellaneous | | | 590,165 | |
Total liabilities | | | 238,845,523 | |
Net assets | | $ | 13,909,132,512 | |
| | | | | |
Net assets consist of: |
Paid in capital | | $ | 13,613,811,661 | |
Total distributable earnings (loss) | | | 295,320,851 | |
Net assets | | $ | 13,909,132,512 | |
| | | | | |
A-Class: |
Net assets | | $ | 609,602,096 | |
Capital shares outstanding | | | 22,228,140 | |
Net asset value per share | | $ | 27.42 | |
Maximum offering price per share (Net asset value divided by 96.00%) | | $ | 28.56 | |
| | | | | |
C-Class: |
Net assets | | $ | 286,049,513 | |
Capital shares outstanding | | | 10,429,311 | |
Net asset value per share | | $ | 27.43 | |
| | | | | |
P-Class: |
Net assets | | $ | 819,770,259 | |
Capital shares outstanding | | | 29,899,271 | |
Net asset value per share | | $ | 27.42 | |
| | | | | |
Institutional Class: |
Net assets | | $ | 12,138,270,105 | |
Capital shares outstanding | | | 442,224,615 | |
Net asset value per share | | $ | 27.45 | |
| | | | | |
R6-Class: |
Net assets | | $ | 55,440,539 | |
Capital shares outstanding | | | 2,018,671 | |
Net asset value per share | | $ | 27.46 | |
* | Relates to Trustees not deemed “interested persons” within the meaning of Section 2(a)(19) of the 1940 Act. |
64 | THE GUGGENHEIM FUNDS ANNUAL REPORT | SEE NOTES TO FINANCIAL STATEMENTS. |
STATEMENT OF OPERATIONS |
TOTAL RETURN BOND FUND |
Year Ended September 30, 2019
Investment Income: |
Dividends from securities of unaffiliated issuers | | $ | 35,866 | |
Dividends from securities of affiliated issuers | | | 5,479,813 | |
Interest from unaffiliated issuers | | | 375,969,837 | |
Interest from affiliated issuers | | | 681 | |
Other income | | | 12,255 | |
Total investment income | | | 381,498,452 | |
| | | | | |
Expenses: |
Management fees | | | 47,218,416 | |
Distribution and service fees: |
A-Class | | | 1,547,698 | |
C-Class | | | 2,732,709 | |
P-Class | | | 1,911,850 | |
Transfer agent/maintenance fees: |
A-Class | | | 1,278,184 | |
C-Class | | | 275,068 | |
P-Class | | | 896,639 | |
Institutional Class | | | 7,946,140 | |
R6-Class | | | 5,785 | |
Fund accounting/administration fees | | | 9,685,942 | |
Line of credit fees | | | 970,902 | |
Professional fees | | | 746,278 | |
Custodian fees | | | 409,395 | |
Trustees’ fees* | | | 266,401 | |
Interest expense | | | 17,030 | |
Miscellaneous | | | 1,364,293 | |
Recoupment of previously waived fees: |
P-Class | | | 9,203 | |
R6-Class | | | 2,007 | |
Total expenses | | | 77,283,940 | |
Less: |
Expenses reimbursed by Adviser: |
A-Class | | | (963,213 | ) |
C-Class | | | (135,932 | ) |
P-Class | | | (519,999 | ) |
Institutional Class | | | (6,786,818 | ) |
R6-Class | | | (2,761 | ) |
Expenses waived by Adviser | | | (638,150 | ) |
Earnings credits applied | | | (341,586 | ) |
Total waived/reimbursed expenses | | | (9,388,459 | ) |
Net expenses | | | 67,895,481 | |
Net investment income | | | 313,602,971 | |
| | | | | |
Net Realized and Unrealized Gain (Loss): |
Net realized gain (loss) on: |
Investments in unaffiliated issuers | | | 43,184,084 | |
Investments in affiliated issuers | | | (1,603,739 | ) |
Distributions received from affiliated investment companies | | | 33,541 | |
Swap agreements | | | (52,953,040 | ) |
Futures contracts | | | (11,798,503 | ) |
Options purchased | | | (19,497,984 | ) |
Options written | | | 3,818,640 | |
Forward foreign currency exchange contracts | | | 26,623,106 | |
Foreign currency transactions | | | (1,307,983 | ) |
Net realized loss | | | (13,501,878 | ) |
Net change in unrealized appreciation (depreciation) on: |
Investments in unaffiliated issuers | | | 491,233,269 | |
Investments in affiliated issuers | | | (1,499,730 | ) |
Swap agreements | | | (74,620,213 | ) |
Options purchased | | | (5,190,154 | ) |
Forward foreign currency exchange contracts | | | 14,016,777 | |
Foreign currency translations | | | 244,707 | |
Net change in unrealized appreciation (depreciation) | | | 424,184,656 | |
Net realized and unrealized gain | | | 410,682,778 | |
Net increase in net assets resulting from operations | | $ | 724,285,749 | |
* | Relates to Trustees not deemed “interested persons” within the meaning of Section 2(a)(19) of the 1940 Act. |
SEE NOTES TO FINANCIAL STATEMENTS. | THE GUGGENHEIM FUNDS ANNUAL REPORT | 65 |
STATEMENTS OF CHANGES IN NET ASSETS |
TOTAL RETURN BOND FUND | |
| | Year Ended
September 30,
2019 | | | Year Ended
September 30,
2018 | |
Increase (Decrease) in Net Assets from Operations: | | | | | | | | |
Net investment income | | $ | 313,602,971 | | | $ | 274,573,149 | |
Net realized gain (loss) on investments | | | (13,501,878 | ) | | | 43,660,869 | |
Net change in unrealized appreciation (depreciation) on investments | | | 424,184,656 | | | | (182,445,396 | ) |
Net increase in net assets resulting from operations | | | 724,285,749 | | | | 135,788,622 | |
| | | | | | | | | |
Distributions to shareholders: | | | | | | | | |
A-Class | | | (17,650,066 | ) | | | (18,699,133 | ) |
C-Class | | | (5,704,804 | ) | | | (4,951,071 | ) |
P-Class | | | (21,602,062 | ) | | | (18,342,874 | ) |
Institutional Class | | | (321,960,314 | ) | | | (226,254,584 | ) |
R6-Class | | | (1,386,227 | ) | | | (865,517 | ) |
Total distributions to shareholders | | | (368,303,473 | ) | | | (269,113,179 | ) |
| | | | | | | | | |
Capital share transactions: | | | | | | | | |
Proceeds from sale of shares | | | | | | | | |
A-Class | | | 291,044,602 | | | | 407,895,750 | |
C-Class | | | 79,694,391 | | | | 81,807,500 | |
P-Class | | | 351,341,399 | | | | 449,910,679 | |
Institutional Class | | | 6,140,295,101 | | | | 5,167,683,542 | |
R6-Class | | | 24,004,225 | | | | 41,692,891 | |
Distributions reinvested | | | | | | | | |
A-Class | | | 15,903,479 | | | | 15,679,136 | |
C-Class | | | 4,753,753 | | | | 4,111,804 | |
P-Class | | | 21,298,550 | | | | 18,176,643 | |
Institutional Class | | | 260,717,634 | | | | 183,827,711 | |
R6-Class | | | 1,386,227 | | | | 791,740 | |
Cost of shares redeemed | | | | | | | | |
A-Class | | | (304,339,035 | ) | | | (568,610,410 | ) |
C-Class | | | (71,478,334 | ) | | | (67,984,756 | ) |
P-Class | | | (313,106,525 | ) | | | (291,745,596 | ) |
Institutional Class | | | (3,528,943,102 | ) | | | (2,703,743,736 | ) |
R6-Class | | | (8,999,085 | ) | | | (18,007,700 | ) |
Net increase from capital share transactions | | | 2,963,573,280 | | | | 2,721,485,198 | |
Net increase in net assets | | | 3,319,555,556 | | | | 2,588,160,641 | |
| | | | | | | | | |
Net assets: | | | | | | | | |
Beginning of year | | | 10,589,576,956 | | | | 8,001,416,315 | |
End of year | | $ | 13,909,132,512 | | | $ | 10,589,576,956 | |
66 | THE GUGGENHEIM FUNDS ANNUAL REPORT | SEE NOTES TO FINANCIAL STATEMENTS. |
STATEMENTS OF CHANGES IN NET ASSETS (concluded) |
TOTAL RETURN BOND FUND | |
| | Year Ended
September 30,
2019 | | | Year Ended
September 30,
2018 | |
Capital share activity: | | | | | | | | |
Shares sold | | | | | | | | |
A-Class | | | 10,870,632 | | | | 15,135,128 | |
C-Class | | | 2,970,672 | | | | 3,034,563 | |
P-Class | | | 13,120,761 | | | | 16,683,240 | |
Institutional Class | | | 228,795,854 | | | | 191,850,977 | |
R6-Class | | | 890,426 | | | | 1,544,316 | |
Shares issued from reinvestment of distributions | | | | | | | | |
A-Class | | | 592,684 | | | | 582,204 | |
C-Class | | | 177,175 | | | | 152,729 | |
P-Class | | | 793,377 | | | | 675,415 | |
Institutional Class | | | 9,694,369 | | | | 6,824,628 | |
R6-Class | | | 51,500 | | | | 29,388 | |
Shares redeemed | | | | | | | | |
A-Class | | | (11,329,916 | ) | | | (21,162,856 | ) |
C-Class | | | (2,663,801 | ) | | | (2,526,601 | ) |
P-Class | | | (11,696,424 | ) | | | (10,851,945 | ) |
Institutional Class | | | (131,586,335 | ) | | | (100,449,512 | ) |
R6-Class | | | (334,949 | ) | | | (668,132 | ) |
Net increase in shares | | | 110,346,025 | | | | 100,853,542 | |
SEE NOTES TO FINANCIAL STATEMENTS. | THE GUGGENHEIM FUNDS ANNUAL REPORT | 67 |
FINANCIAL HIGHLIGHTS |
TOTAL RETURN BOND FUND | |
This table is presented to show selected data for a share outstanding throughout each period and to assist shareholders in evaluating a Fund’s performance for the periods presented.
A-Class | | Year
Ended
Sept. 30,
2019 | | | Year
Ended
Sept. 30,
2018 | | | Year
Ended
Sept. 30,
2017 | | | Year
Ended
Sept. 30,
2016 | | | Year
Ended
Sept. 30,
2015 | |
Per Share Data | | | | | | | | | | | | | | | | | | | | |
Net asset value, beginning of period | | $ | 26.69 | | | $ | 27.05 | | | $ | 27.23 | | | $ | 26.50 | | | $ | 26.94 | |
Income (loss) from investment operations: |
Net investment income (loss)a | | | .64 | | | | .72 | | | | .83 | | | | .96 | | | | .94 | |
Net gain (loss) on investments (realized and unrealized) | | | .85 | | | | (.37 | ) | | | .05 | | | | .81 | | | | (.25 | ) |
Total from investment operations | | | 1.49 | | | | .35 | | | | .88 | | | | 1.77 | | | | .69 | |
Less distributions from: |
Net investment income | | | (.65 | ) | | | (.71 | ) | | | (.95 | ) | | | (1.04 | ) | | | (1.09 | ) |
Net realized gains | | | (.11 | ) | | | — | | | | (.11 | ) | | | — | | | | (.04 | ) |
Total distributions | | | (.76 | ) | | | (.71 | ) | | | (1.06 | ) | | | (1.04 | ) | | | (1.13 | ) |
Net asset value, end of period | | $ | 27.42 | | | $ | 26.69 | | | $ | 27.05 | | | $ | 27.23 | | | $ | 26.50 | |
|
Total Returnb | | | 5.70 | % | | | 1.28 | % | | | 3.33 | % | | | 6.88 | % | | | 2.56 | % |
Ratios/Supplemental Data |
Net assets, end of period (in thousands) | | $ | 609,602 | | | $ | 589,760 | | | $ | 744,989 | | | $ | 548,223 | | | $ | 435,760 | |
Ratios to average net assets: |
Net investment income (loss) | | | 2.37 | % | | | 2.66 | % | | | 3.08 | % | | | 3.63 | % | | | 3.50 | % |
Total expensesc | | | 0.96 | % | | | 0.93 | % | | | 1.02 | % | | | 1.15 | % | | | 1.10 | % |
Net expensesd,e,h | | | 0.80 | % | | | 0.81 | % | | | 0.87 | % | | | 0.97 | % | | | 0.91 | % |
Portfolio turnover rate | | | 68 | % | | | 48 | % | | | 72 | % | | | 86 | % | | | 74 | % |
68 | THE GUGGENHEIM FUNDS ANNUAL REPORT | SEE NOTES TO FINANCIAL STATEMENTS. |
FINANCIAL HIGHLIGHTS (continued) |
TOTAL RETURN BOND FUND | |
This table is presented to show selected data for a share outstanding throughout each period and to assist shareholders in evaluating a Fund’s performance for the periods presented.
C-Class | | Year
Ended
Sept. 30,
2019 | | | Year
Ended
Sept. 30,
2018 | | | Year
Ended
Sept. 30,
2017 | | | Year
Ended
Sept. 30,
2016 | | | Year
Ended
Sept. 30,
2015 | |
Per Share Data | | | | | | | | | | | | | | | | | | | | |
Net asset value, beginning of period | | $ | 26.69 | | | $ | 27.05 | | | $ | 27.23 | | | $ | 26.50 | | | $ | 26.94 | |
Income (loss) from investment operations: |
Net investment income (loss)a | | | .43 | | | | .52 | | | | .65 | | | | .75 | | | | .74 | |
Net gain (loss) on investments (realized and unrealized) | | | .87 | | | | (.38 | ) | | | .03 | | | | .82 | | | | (.25 | ) |
Total from investment operations | | | 1.30 | | | | .14 | | | | .68 | | | | 1.57 | | | | .49 | |
Less distributions from: |
Net investment income | | | (.45 | ) | | | (.50 | ) | | | (.75 | ) | | | (.84 | ) | | | (.89 | ) |
Net realized gains | | | (.11 | ) | | | — | | | | (.11 | ) | | | — | | | | (.04 | ) |
Total distributions | | | (.56 | ) | | | (.50 | ) | | | (.86 | ) | | | (.84 | ) | | | (.93 | ) |
Net asset value, end of period | | $ | 27.43 | | | $ | 26.69 | | | $ | 27.05 | | | $ | 27.23 | | | $ | 26.50 | |
|
Total Returnb | | | 4.95 | % | | | 0.53 | % | | | 2.58 | % | | | 6.08 | % | | | 1.82 | % |
Ratios/Supplemental Data |
Net assets, end of period (in thousands) | | $ | 286,050 | | | $ | 265,486 | | | $ | 251,177 | | | $ | 216,255 | | | $ | 89,320 | |
Ratios to average net assets: |
Net investment income (loss) | | | 1.62 | % | | | 1.93 | % | | | 2.44 | % | | | 2.82 | % | | | 2.75 | % |
Total expensesc | | | 1.60 | % | | | 1.62 | % | | | 1.74 | % | | | 1.83 | % | | | 1.80 | % |
Net expensesd,e,h | | | 1.55 | % | | | 1.55 | % | | | 1.60 | % | | | 1.69 | % | | | 1.63 | % |
Portfolio turnover rate | | | 68 | % | | | 48 | % | | | 72 | % | | | 86 | % | | | 74 | % |
SEE NOTES TO FINANCIAL STATEMENTS. | THE GUGGENHEIM FUNDS ANNUAL REPORT | 69 |
FINANCIAL HIGHLIGHTS (continued) |
TOTAL RETURN BOND FUND |
This table is presented to show selected data for a share outstanding throughout each period and to assist shareholders in evaluating a Fund’s performance for the periods presented.
P-Class | | Year
Ended
Sept. 30,
2019 | | | Year
Ended
Sept. 30,
2018 | | | Year
Ended
Sept. 30,
2017 | | | Year
Ended
Sept. 30,
2016 | | | Period
Ended
Sept. 30,
2015f | |
Per Share Data | | | | | | | | | | | | | | | | | | | | |
Net asset value, beginning of period | | $ | 26.69 | | | $ | 27.04 | | | $ | 27.23 | | | $ | 26.49 | | | $ | 26.98 | |
Income (loss) from investment operations: |
Net investment income (loss)a | | | .63 | | | | .72 | | | | .85 | | | | .96 | | | | .36 | |
Net gain (loss) on investments (realized and unrealized) | | | .86 | | | | (.36 | ) | | | .03 | | | | .84 | | | | (.43 | ) |
Total from investment operations | | | 1.49 | | | | .36 | | | | .88 | | | | 1.80 | | | | (.07 | ) |
Less distributions from: |
Net investment income | | | (.65 | ) | | | (.71 | ) | | | (.96 | ) | | | (1.06 | ) | | | (.42 | ) |
Net realized gains | | | (.11 | ) | | | — | | | | (.11 | ) | | | — | | | | — | |
Total distributions | | | (.76 | ) | | | (.71 | ) | | | (1.07 | ) | | | (1.06 | ) | | | (.42 | ) |
Net asset value, end of period | | $ | 27.42 | | | $ | 26.69 | | | $ | 27.04 | | | $ | 27.23 | | | $ | 26.49 | |
|
Total Return | | | 5.70 | % | | | 1.32 | % | | | 3.34 | % | | | 6.97 | % | | | (0.21 | %) |
Ratios/Supplemental Data |
Net assets, end of period (in thousands) | | $ | 819,770 | | | $ | 738,694 | | | $ | 572,644 | | | $ | 161,928 | | | $ | 12,509 | |
Ratios to average net assets: |
Net investment income (loss) | | | 2.37 | % | | | 2.69 | % | | | 3.14 | % | | | 3.58 | % | | | 3.20 | % |
Total expensesc | | | 0.87 | % | | | 0.91 | % | | | 1.03 | % | | | 0.96 | % | | | 1.02 | % |
Net expensesd,e,h | | | 0.80 | % | | | 0.80 | % | | | 0.86 | % | | | 0.82 | % | | | 0.84 | % |
Portfolio turnover rate | | | 68 | % | | | 48 | % | | | 72 | % | | | 86 | % | | | 74 | % |
70 | THE GUGGENHEIM FUNDS ANNUAL REPORT | SEE NOTES TO FINANCIAL STATEMENTS. |
FINANCIAL HIGHLIGHTS (continued) |
TOTAL RETURN BOND FUND | |
This table is presented to show selected data for a share outstanding throughout each period and to assist shareholders in evaluating a Fund’s performance for the periods presented.
Institutional Class | | Year
Ended
Sept. 30,
2019 | | | Year
Ended
Sept. 30,
2018 | | | Year
Ended
Sept. 30,
2017 | | | Year
Ended
Sept. 30,
2016 | | | Year
Ended
Sept. 30,
2015 | |
Per Share Data | | | | | | | | | | | | | | | | | | | | |
Net asset value, beginning of period | | $ | 26.71 | | | $ | 27.07 | | | $ | 27.26 | | | $ | 26.53 | | | $ | 26.97 | |
Income (loss) from investment operations: |
Net investment income (loss)a | | | .71 | | | | .80 | | | | .93 | | | | 1.05 | | | | 1.03 | |
Net gain (loss) on investments (realized and unrealized) | | | .87 | | | | (.37 | ) | | | .04 | | | | .82 | | | | (.25 | ) |
Total from investment operations | | | 1.58 | | | | .43 | | | | .97 | | | | 1.87 | | | | .78 | |
Less distributions from: |
Net investment income | | | (.73 | ) | | | (.79 | ) | | | (1.05 | ) | | | (1.14 | ) | | | (1.18 | ) |
Net realized gains | | | (.11 | ) | | | — | | | | (.11 | ) | | | — | | | | (.04 | ) |
Total distributions | | | (.84 | ) | | | (.79 | ) | | | (1.16 | ) | | | (1.14 | ) | | | (1.22 | ) |
Net asset value, end of period | | $ | 27.45 | | | $ | 26.71 | | | $ | 27.07 | | | $ | 27.26 | | | $ | 26.53 | |
|
Total Return | | | 6.03 | % | | | 1.59 | % | | | 3.68 | % | | | 7.26 | % | | | 2.91 | % |
Ratios/Supplemental Data |
Net assets, end of period (in thousands) | | $ | 12,138,270 | | | $ | 8,957,902 | | | $ | 6,418,897 | | | $ | 3,024,918 | | | $ | 1,409,171 | |
Ratios to average net assets: |
Net investment income (loss) | | | 2.64 | % | | | 2.99 | % | | | 3.47 | % | | | 3.94 | % | | | 3.83 | % |
Total expensesc | | | 0.58 | % | | | 0.58 | % | | | 0.68 | % | | | 0.79 | % | | | 0.76 | % |
Net expensesd,e,h | | | 0.51 | % | | | 0.50 | % | | | 0.52 | % | | | 0.59 | % | | | 0.57 | % |
Portfolio turnover rate | | | 68 | % | | | 48 | % | | | 72 | % | | | 86 | % | | | 74 | % |
SEE NOTES TO FINANCIAL STATEMENTS. | THE GUGGENHEIM FUNDS ANNUAL REPORT | 71 |
FINANCIAL HIGHLIGHTS (continued) |
TOTAL RETURN BOND FUND |
This table is presented to show selected data for a share outstanding throughout each period and to assist shareholders in evaluating a Fund’s performance for the periods presented.
R6-Class | | Year
Ended
Sept. 30,
2019 | | | Year
Ended
Sept. 30,
2018 | | | Period
Ended
Sept. 30,
2017g | |
Per Share Data | | | | | | | | | | | | |
Net asset value, beginning of period | | $ | 26.73 | | | $ | 27.09 | | | $ | 27.15 | |
Income (loss) from investment operations: |
Net investment income (loss)a | | | .71 | | | | .81 | | | | .86 | |
Net gain (loss) on investments (realized and unrealized) | | | .86 | | | | (.38 | ) | | | .18 | |
Total from investment operations | | | 1.57 | | | | .43 | | | | 1.04 | |
Less distributions from: |
Net investment income | | | (.73 | ) | | | (.79 | ) | | | (.99 | ) |
Net realized gains | | | (.11 | ) | | | — | | | | (.11 | ) |
Total distributions | | | (.84 | ) | | | (.79 | ) | | | (1.10 | ) |
Net asset value, end of period | | $ | 27.46 | | | $ | 26.73 | | | $ | 27.09 | |
|
Total Return | | | 5.99 | % | | | 1.59 | % | | | 3.97 | % |
Ratios/Supplemental Data |
Net assets, end of period (in thousands) | | $ | 55,441 | | | $ | 37,735 | | | $ | 13,709 | |
Ratios to average net assets: |
Net investment income (loss) | | | 2.64 | % | | | 3.00 | % | | | 3.35 | % |
Total expensesc | | | 0.52 | % | | | 0.53 | % | | | 0.65 | % |
Net expensesd,e,h | | | 0.51 | % | | | 0.50 | % | | | 0.51 | % |
Portfolio turnover rate | | | 68 | % | | | 48 | % | | | 72 | % |
72 | THE GUGGENHEIM FUNDS ANNUAL REPORT | SEE NOTES TO FINANCIAL STATEMENTS. |
FINANCIAL HIGHLIGHTS (concluded) |
TOTAL RETURN BOND FUND |
a | Net investment income (loss) per share was computed using average shares outstanding throughout the period. |
b | Total return does not reflect the impact of any applicable sales charges. |
c | Does not include expenses of the underlying funds in which the Fund invests. |
d | Net expense information reflects the expense ratios after expense waivers and reimbursements, as applicable. |
e | The portion of the ratios of total and net expenses before and after waivers/reimbursements to average net assets attributable to recoupments of prior fee reductions or expense reimbursements for the years presented was as follows: |
| | | 09/30/19 | 09/30/18 | 09/30/17 |
| | A-Class | — | 0.00%* | 0.01% |
| | C-Class | — | 0.00%* | 0.01% |
| | P-Class | 0.00%* | 0.00%* | 0.01% |
| | Institutional Class | — | 0.00%* | — |
| | R6-Class | 0.00%* | 0.00%* | — |
f | Since commencement of operations: May 1, 2015. Percentage amounts for the period, except total return and portfolio turnover rate, have been annualized. |
g | Since commencement of operations: October 19, 2016. Percentage amounts for the period, except total return and portfolio turnover rate, have been annualized. |
h | Net expenses may include expenses that are excluded from the expense limitation agreement. Excluding these expenses, the net expense ratio for the year would be: |
| | | 09/30/19 | 09/30/18 | 09/30/17 | 09/30/16 | 09/30/15 |
| | A-Class | 0.79% | 0.80% | 0.84% | 0.87% | 0.84% |
| | C-Class | 1.54% | 1.55% | 1.57% | 1.60% | 1.56% |
| | P-Class | 0.79% | 0.80% | 0.83% | 0.75% | 0.75% |
| | Institutional Class | 0.50% | 0.49% | 0.49% | 0.49% | 0.50% |
| | R6-Class | 0.50% | 0.49% | 0.48% | — | — |
SEE NOTES TO FINANCIAL STATEMENTS. | THE GUGGENHEIM FUNDS ANNUAL REPORT | 73 |
NOTES TO FINANCIAL STATEMENTS |
Note 1 – Organization and Significant Accounting Policies
Organization
Guggenheim Funds Trust (the “Trust”), a Delaware statutory trust, is registered with the SEC under the Investment Company Act of 1940 (“1940 Act”), as an open-ended investment company of the series type. Each series, in effect, is representing a separate fund. The Trust is authorized to issue an unlimited number of shares. The Trust accounts for the assets of each fund separately.
The Trust offers a combination of five separate classes of shares: A-Class shares, C-Class shares, P-Class shares, R6-Class shares and Institutional Class shares. Sales of shares of each Class are made without a front-end sales charge at the net asset value per share (“NAV”), with the exception of A-Class shares. A-Class shares are sold at the NAV, plus the applicable front-end sales charge. The sales charge varies depending on the amount purchased. A-Class share purchases of $1 million or more are exempt from the front-end sales charge but have a 1% contingent deferred sales charge (“CDSC”), if shares are redeemed within 12 months of purchase. C-Class shares have a 1% CDSC if shares are redeemed within 12 months of purchase. C-Class shares of the Fund automatically convert to A-Class shares on or about the 10th day of the month following the 10-year anniversary of the purchase of the C-Class shares. This conversion will be executed without any sales charge, fee or other charge. After the conversion is completed, the shares will be subject to all features and expenses of A-Class shares. Institutional Class shares are offered primarily for direct investment by institutions such as pension and profit sharing plans, endowments, foundations and corporations. Institutional Class shares require a minimum initial investment of $2 million and a minimum account balance of $1 million. R6-Class shares are offered primarily through qualified retirement and benefit plans. R6-Class shares are also offered through certain other plans and platforms sponsored by financial intermediaries. Certain institutional investors and others deemed appropriate by Guggenheim Investments (“GI”) may also be eligible to purchase R6-Class shares subject to a $2 million minimum initial investment. At September 30, 2019, the Trust consisted of twenty funds (the “Funds”).
This report covers the Total Return Bond Fund (the “Fund”), a diversified investment company. At September 30, 2019, A-Class, C-Class, P-Class, Institutional Class and R6-Class shares had been issued by the Fund.
Guggenheim Partners Investment Management, LLC (“GPIM”), which operates under the name Guggenheim Investments, provides advisory services. Guggenheim Funds Distributors, LLC (“GFD”) acts as principal underwriter for the Trust. GI and GFD are affiliated entities.
Significant Accounting Policies
The Fund operates as an investment company and, accordingly, follows the investment company accounting and reporting guidance of the Financial Accounting Standards Board (“FASB”) Accounting Standards Codification Topic 946 Financial Services – Investment Companies.
74 | THE GUGGENHEIM FUNDS ANNUAL REPORT | |
NOTES TO FINANCIAL STATEMENTS (continued) |
The following significant accounting policies are in conformity with U.S. generally accepted accounting principles (“U.S. GAAP”) and are consistently followed by the Trust. This requires management to make estimates and assumptions that affect the reported amount of assets and liabilities, contingent assets and liabilities at the date of the financial statements, and the reported amounts of revenues and expenses during the reporting period. Actual results could differ from these estimates. All time references are based on Eastern Time.
The NAV of each Class of the Fund is calculated by dividing the market value of the Fund’s securities and other assets, less all liabilities, attributable to the Class by the number of outstanding shares of the Class.
(a) Valuation of Investments
The Board of Trustees of the Fund (the “Board”) has adopted policies and procedures for the valuation of the Fund’s investments (the “Valuation Procedures”). Pursuant to the Valuation Procedures, the Board has delegated to a valuation committee, consisting of representatives from Guggenheim’s investment management, fund administration, legal and compliance departments (the “Valuation Committee”), the day-to-day responsibility for implementing the Valuation Procedures, including, under most circumstances, the responsibility for determining the fair value of the Fund’s securities and/or other assets.
Valuations of the Fund’s securities are supplied primarily by pricing services appointed pursuant to the processes set forth in the Valuation Procedures. The Valuation Committee convenes monthly, or more frequently as needed, to review the valuation of all assets which have been fair valued for reasonableness. The Fund’s officers, through the Valuation Committee and consistent with the monitoring and review responsibilities set forth in the Valuation Procedures, regularly review procedures used and valuations provided by the pricing services.
If the pricing service cannot or does not provide a valuation for a particular investment or such valuation is deemed unreliable, such investment is fair valued by the Valuation Committee.
Equity securities listed or traded on a recognized U.S. securities exchange or the National Association of Securities Dealers Automated Quotations (“NASDAQ”) National Market System shall generally be valued on the basis of the last sale price on the primary U.S. exchange or market on which the security is listed or traded; provided, however, that securities listed on NASDAQ will be valued at the NASDAQ Official Closing Price, which may not necessarily represent the last sale price. If there is no sale on the valuation date, exchange-traded U.S. equity securities will be valued on the basis of the last bid price.
Generally, trading in foreign securities markets is substantially completed each day at various times prior to the close of the New York Stock Exchange (“NYSE”). The values of foreign securities are determined as of the close of such foreign markets or the close of the NYSE, if earlier. All investments quoted in foreign currencies are valued in U.S. dollars on the basis of the foreign currency exchange rates prevailing at the close of U.S. business at 4:00 p.m. Investments
| | THE GUGGENHEIM FUNDS ANNUAL REPORT | 75 |
NOTES TO FINANCIAL STATEMENTS (continued) |
in foreign securities may involve risks not present in domestic investments. The Valuation Committee will determine the current value of such foreign securities by taking into consideration certain factors which may include those discussed above, as well as the following factors, among others: the value of the securities traded on other foreign markets, ADR trading, closed-end fund trading, foreign currency exchange activity, and the trading prices of financial products that are tied to foreign securities. In addition, under the Valuation Procedures, the Valuation Committee and GI are authorized to use prices and other information supplied by a third party pricing vendor in valuing foreign securities.
Open-end investment companies are valued at their NAV as of the close of business, on the valuation date. Exchange-traded funds and closed-end investment companies are valued at the last quoted sale price.
U.S. Government securities are valued by either independent pricing services, the last traded fill price, or at the reported bid price at the close of business.
Debt securities with a maturity of greater than 60 days at acquisition are valued at prices that reflect broker-dealer supplied valuations or are obtained from independent pricing services, which may consider the trade activity, treasury spreads, yields or price of bonds of comparable quality, coupon, maturity, and type, as well as prices quoted by dealers who make markets in such securities. Short-term debt securities with a maturity of 60 days or less at acquisition are valued at amortized cost, provided such amount approximates market value.
Repurchase agreements are valued at amortized cost, provided such amounts approximate market value.
Typically, loans are valued using information provided by an independent third party pricing service which uses broker quotes. If the pricing service cannot or does not provide a valuation for a particular loan, or such valuation is deemed unreliable, such investment is fair valued by the Valuation Committee.
Exchange-traded options are valued at the mean of the bid and ask prices on the principal exchange on which they are traded. Over-the-counter (“OTC”) options are valued using a price provided by a pricing service.
The value of interest rate swap agreements entered into by the Fund is accounted for using the unrealized appreciation or depreciation on the agreements that is determined using the spread priced off the previous day’s Chicago Mercantile Exchange (“CME”) price.
The values of other swap agreements entered into by the Fund are accounted for using the unrealized appreciation or depreciation on the agreements that are determined by marking the agreements to the last quoted value of the index or other underlying positions that the swaps pertain to at the close of the NYSE.
76 | THE GUGGENHEIM FUNDS ANNUAL REPORT | |
NOTES TO FINANCIAL STATEMENTS (continued) |
Forward foreign currency exchange contracts are valued daily based on the applicable exchange rate of the underlying security.
Investments for which market quotations are not readily available are fair-valued as determined in good faith by GI, subject to review and approval by the Valuation Committee, pursuant to methods established or ratified by the Board. Valuations in accordance with these methods are intended to reflect each security’s (or asset’s or liability’s) “fair value”. Each such determination is based on a consideration of all relevant factors, which are likely to vary from one pricing context to another. Examples of such factors may include, but are not limited to market prices; sale prices; broker quotes; and models which derive prices based on inputs such as prices of securities with comparable maturities and characteristics, or based on inputs such as anticipated cash flows or collateral, spread over U.S. Treasury securities, and other information analysis.
In connection with futures contracts and other derivative investments, such factors may include obtaining information as to how (a) these contracts and other derivative investments trade in the futures or other derivative markets, respectively, and (b) the securities underlying these contracts and other derivative investments trade in the cash market.
(b) U.S. Government and Agency Obligations
Certain U.S. Government and Agency Obligations are traded on a discount basis; the interest rates shown on the Schedule of Investments reflect the effective rates paid at the time of purchase by the Fund. Other securities bear interest at the rates shown, payable at fixed dates through maturity.
Inflation-Indexed bonds are fixed-income securities whose principal value is periodically adjusted to the rate of inflation. The interest rate on these securities is generally fixed at issuance at a rate lower than typical bonds. Over the life of an inflation-indexed bond however, interest will be paid based on a principal value which is adjusted for inflation. Any increase in the principal amount of an inflation-indexed bond is recognized as a component of Interest on the Statement of Operations, even though principal is not received until maturity.
(c) Senior Floating Rate Interests
Senior floating rate interests in which the Fund invests generally pay interest rates which are periodically adjusted by reference to a base short-term floating rate, plus a premium. These base lending rates are generally (i) the lending rate offered by one or more major European banks, such as the one-month or three-month London Inter-Bank Offered Rate (“LIBOR”), (ii) the prime rate offered by one or more major United States banks, or (iii) the bank’s certificate of deposit rate. Senior floating rate interests often require prepayments from excess cash flows or permit the borrower to repay at its election. The rate at which the borrower repays cannot be predicted with accuracy. As a result, the actual remaining maturity may be substantially less than the stated maturities disclosed in the Fund’s Schedule of Investments. The interest rate indicated is the rate in effect at September 30, 2019.
| | THE GUGGENHEIM FUNDS ANNUAL REPORT | 77 |
NOTES TO FINANCIAL STATEMENTS (continued) |
(d) Interests in When-Issued Securities
The Fund may purchase and sell interests in securities on a when-issued and delayed delivery basis, with payment and delivery scheduled for a future date. No income accrues to the Fund on such interests or securities in connection with such transactions prior to the date the Fund actually take delivery of such interests or securities. These transactions are subject to market fluctuations and are subject to the risk that the value at delivery may be more or less than the trade date purchase price. Although the Fund will generally purchase these securities with the intention of acquiring such securities, they may sell such securities before the settlement date.
(e) Options
Upon the purchase of an option, the premium paid is recorded as an investment, the value of which is marked-to-market daily. If a purchased option expires, the Fund realizes a loss in the amount of the cost of the option. When the Fund enters into a closing sale transaction, it realizes a gain or loss depending on whether the proceeds from the closing sale transaction are greater or less than the cost of the option. If the Fund exercises a put option, it realizes a gain or loss from the sale of the underlying security and the proceeds from such sale will be decreased by the premium originally paid. When the Fund exercises a call option, the cost of the security purchased by the Fund upon exercise increases by the premium originally paid.
When the Fund writes (sells) an option, an amount equal to the premium received is entered in that Fund’s accounting records as an asset and equivalent liability. The amount of the liability is subsequently marked-to-market to reflect the current value of the option written. When a written option expires, or if the Fund enters into a closing purchase transaction, it realizes a gain (or loss if the cost of a closing purchase transaction exceeds the premium received when the option was sold).
(f) Futures Contracts
Upon entering into a futures contract, a Fund deposits and maintains as collateral such initial margin as required by the exchange on which the transaction is affected. Pursuant to the contract, the Fund agrees to receive from or pay to the broker an amount of cash equal to the daily fluctuation in value of the contract. Such receipts or payments are known as variation margin and are recorded by the Fund as unrealized appreciation or depreciation. When the contract is closed, the Fund records a realized gain or loss equal to the difference between the value of the contract at the time it was opened and the value at the time it was closed.
(g) Swap Agreements
Swap agreements are marked-to-market daily and the change, if any, is recorded as unrealized appreciation or depreciation. Payments received or made as a result of an agreement or termination of an agreement are recognized as realized gains or losses.
78 | THE GUGGENHEIM FUNDS ANNUAL REPORT | |
NOTES TO FINANCIAL STATEMENTS (continued) |
Upfront payments received or made by a Fund on credit default and interest rate swap agreements are amortized over the expected life of the agreement. Periodic payments received or paid by a Fund are recorded as realized gains or losses. Payments received or made as a result of a credit event or termination of the contract are recognized, net of a proportional amount of the upfront payment, as realized gains or losses.
(h) Forward Foreign Currency Exchange Contracts
The change in value of a forward foreign currency exchange contract is recorded as unrealized appreciation or depreciation until the contract is closed. When the contract is closed, the Fund records a realized gain or loss equal to the difference between the value at the time the contract was opened and the value at the time it was closed.
(i) Currency Translations
The accounting records of the Fund are maintained in U.S. dollars. All assets and liabilities initially expressed in foreign currencies are converted into U.S. dollars at prevailing exchange rates. Purchases and sales of investment securities, dividend and interest income, and certain expenses are translated at the rates of exchange prevailing on the respective dates of such transactions. Changes in the relationship of these foreign currencies to the U.S. dollar can significantly affect the value of the investments and earnings of the Fund. Foreign investments may also subject the Fund to foreign government exchange restrictions, expropriation, taxation, or other political, social or economic developments, all of which could affect the market and/or credit risk of the investments.
The Fund does not isolate that portion of the results of operations resulting from changes in the foreign exchange rates on investments from the fluctuations arising from changes in the market prices of securities held. Such fluctuations are included with the net realized gain or loss and unrealized appreciation or depreciation on investments.
Reported net realized foreign exchange gains and losses arise from sales of foreign currencies and currency gains or losses realized between the trade and settlement dates on investment transactions. Net unrealized exchange appreciation and depreciation arise from changes in the fair values of assets and liabilities other than investments in securities at the fiscal period end, resulting from changes in exchange rates.
(j) Foreign Taxes
The Fund may be subject to foreign taxes (a portion of which may be reclaimable) on income, stock dividends, capital gains on investments or certain foreign currency transactions. All foreign taxes are recorded in accordance with the applicable foreign tax regulations and rates that exist in the foreign jurisdictions in which the Fund invests. These foreign taxes, if any, are paid by the Fund and reflected in its Statement of Operations as follows: foreign taxes withheld at source are
| | THE GUGGENHEIM FUNDS ANNUAL REPORT | 79 |
NOTES TO FINANCIAL STATEMENTS (continued) |
presented as a reduction of income and foreign taxes on capital gains from sales of investments are included with the net realized gain (loss) on investments. Foreign taxes payable or deferred as of September 30, 2019, if any, are disclosed in the Fund’s Statement of Assets and Liabilities.
(k) Security Transactions
Security transactions are recorded on the trade date for financial reporting purposes. Realized gains and losses from securities transactions are recorded using the identified cost basis. Proceeds from lawsuits related to investment holdings are recorded as a reduction to cost if the securities are still held and as realized gains if no longer held in the Fund. Dividend income is recorded on the ex-dividend date, net of applicable taxes withheld by foreign countries. Taxable non-cash dividends are recorded as dividend income. Interest income, including amortization of premiums and accretion of discounts, is accrued on a daily basis. Interest income also includes paydown gains and losses on mortgage-backed and asset-backed securities and senior and subordinated loans. Amendment fees are earned as compensation for evaluating and accepting changes to the original loan agreement and are recognized when received. Dividend income from Real Estate Investment Trusts (“REITs”) is recorded based on the income included in the distributions received from the REIT investments using published REIT classifications, including some management estimates when actual amounts are not available. Distributions received in excess of this estimated amount are recorded as a reduction of the cost of investments or reclassified to realized gains. The actual amounts of income, return of capital, and realized gains are only determined by each REIT after its fiscal year-end, and may differ from the estimated amounts.
Income from residual collateralized loan obligations is recognized using the effective interest method. At the time of purchase, management estimates the future expected cash flows and determines the effective yield and estimated maturity date based on the estimated cash flows. Subsequent to the purchase, the estimated cash flows are updated periodically and a revised yield is calculated prospectively.
(l) Distributions
The Fund declares dividends from investment income daily. The Fund pays its shareholders from its net investment income monthly and distributes any net capital gains that it has realized, at least annually. Distributions to shareholders are recorded on the ex-dividend date. Dividends are reinvested in additional shares unless shareholders request payment in cash. The character of distributions made during the year from net investment income or net realized gains may differ from their ultimate characterization for U.S. federal income tax purposes.
80 | THE GUGGENHEIM FUNDS ANNUAL REPORT | |
NOTES TO FINANCIAL STATEMENTS (continued) |
(m) Class Allocations
Interest and dividend income, most expenses, all realized gains and losses, and all unrealized appreciation and depreciation are allocated to the classes based upon the value of the outstanding shares in each Class. Certain costs, such as distribution and service fees are charged directly to specific classes. In addition, certain expenses have been allocated to the individual Funds in the Trust based on the respective net assets of each Fund included in the Trust.
(n) Earnings Credits
Under the fee arrangement with the custodian, the Fund may earn credits based on overnight custody cash balances. These credits are utilized to reduce related custodial expenses. The custodian fees disclosed in the Statement of Operations are before the reduction in expense from the related earnings credits, if any. Earnings credits for the year ended September 30, 2019, are disclosed in the Statement of Operations.
(o) Cash
The Fund may leave cash overnight in its cash account with the custodian. Periodically, the Fund may have cash due to the custodian bank as an overdraft balance. A fee is incurred on this overdraft, calculated by multiplying the overdraft by a rate based on the federal funds rate, which was 1.90% at September 30, 2019.
(p) Indemnifications
Under the Fund’s organizational documents, its Trustees and Officers are indemnified against certain liabilities arising out of the performance of their duties to the Trust. In addition, throughout the normal course of business, the Fund enters into contracts that contain a variety of representations and warranties which provide general indemnifications. The Fund’s maximum exposure under these arrangements is unknown, as this would involve future claims that may be made against the Fund and/or its affiliates that have not yet occurred. However, based on experience, the Fund expects the risk of loss to be remote.
Note 2 – Derivatives
As part of its investment strategy, the Fund utilizes a variety of derivative instruments. These investments involve, to varying degrees, elements of market risk. Valuation and accounting treatment of these instruments can be found under Significant Accounting Policies in Note 1 of these Notes to Financial Statements.
Derivatives are instruments whose values depend on, or are derived from, in whole or in part, the value of one or more other assets, such as securities, currencies, commodities or indices. Derivative instruments may be used to increase investment flexibility (including to maintain cash reserves while maintaining exposure to certain other assets), for risk management (hedging) purposes, to facilitate trading, to reduce transaction costs and to pursue higher investment returns. Derivative instruments may also be used to mitigate certain investment risks, such
| | THE GUGGENHEIM FUNDS ANNUAL REPORT | 81 |
NOTES TO FINANCIAL STATEMENTS (continued) |
as foreign currency exchange rate risk, interest rate risk and credit risk. U.S. GAAP requires disclosures to enable investors to better understand how and why a Fund uses derivative instruments, how these derivative instruments are accounted for and their effects on the Fund’s financial position and results of operations.
The Fund utilized derivatives for the following purposes:
Duration: the use of an instrument to manage the interest rate risk of a portfolio.
Hedge: an investment made in order to reduce the risk of adverse price movements in a security, by taking an offsetting position to protect against broad market moves.
Income: the use of any instrument that distributes cash flows typically based upon some rate of interest.
Options Purchased and Written
A call option on a security gives the purchaser of the option the right to buy, and the writer of a call option the obligation to sell, the underlying security. The purchaser of a put option has the right to sell, and the writer of the put option the obligation to buy, the underlying security at any time during the option period. The risk associated with purchasing options is limited to the premium originally paid.
The following table represents the Fund’s use and volume of call/put options purchased on a monthly basis:
| | | Average Notional Purchased | |
Use | | Call | | | Put | |
Hedge, Income | | $ | 143,983,828 | | | $ | 5,507,775,243 | |
The risk in writing a call option is that a Fund may incur a loss if the market price of the underlying security increases and the option is exercised. The risk in writing a put option is that a Fund may incur a loss if the market price of the underlying security decreases and the option is exercised. In addition, there may be an imperfect correlation between the movement in prices of options and the underlying securities where a Fund may not be able to enter into a closing transaction because of an illiquid secondary market; or, for OTC options, a Fund may be at risk because of the counterparty’s inability to perform.
The following table represents the Fund’s use and volume of call/put options written on a monthly basis:
| | | Average Notional Written | |
Use | | Call | | | Put | |
Hedge | | $ | — | | | $ | 136,641,910 | |
82 | THE GUGGENHEIM FUNDS ANNUAL REPORT | |
NOTES TO FINANCIAL STATEMENTS (continued) |
Futures Contracts
A futures contract is an agreement to purchase (long) or sell (short) an agreed amount of securities or other instruments at a set price for delivery at a future date. There are significant risks associated with a Fund’s use of futures contracts, including (i) there may be an imperfect or no correlation between the changes in market value of the underlying asset and the prices of futures contracts; (ii) there may not be a liquid secondary market for a futures contract; (iii) trading restrictions or limitations may be imposed by an exchange; and (iv) government regulations may restrict trading in futures contracts. When investing in futures, there is minimal counterparty credit risk to the Fund because futures are exchange-traded and the exchange’s clearinghouse, as counterparty to all exchange-traded futures, guarantees against default. Cash deposits are shown as segregated cash with broker on the Statement of Assets and Liabilities; securities held as collateral are noted on the Schedule of Investments.
The following table represents the Fund’s use and volume of futures on a monthly basis:
| | | Average Notional Purchased | |
Use | | Long | | | Short | |
Hedge | | $ | — | | | $ | 118,224,046 | |
Swap Agreements
A swap is an agreement that obligates two parties to exchange a series of cash flows at specified intervals based upon or calculated by reference to changes in specified prices or rates for a specified amount of an underlying asset. When utilizing OTC swaps, the Fund bears the risk of loss of the amount expected to be received under a swap agreement in the event of the default or bankruptcy of a swap agreement counterparty or if the underlying asset declines in value. Certain standardized swaps are subject to mandatory central clearing and are executed on a multi-lateral or other trade facility platform, such as a registered exchange. There is limited counterparty credit risk with respect to centrally-cleared swaps as the transaction is facilitated through a central clearinghouse, much like exchange-traded futures contracts. Upon entering into certain centrally-cleared swap transactions, the Fund is required to deposit with its clearing broker an amount of cash or securities as an initial margin. Subsequent variation margin payments or receipts are made or received by the Fund, depending on fluctuations in the fair value of the reference entity. For a fund utilizing centrally cleared swaps, the exchange bears the risk of loss resulting from a counterparty not being able to pay. There is no guarantee that a fund or an underlying fund could eliminate its exposure under an outstanding swap agreement by entering into an offsetting swap agreement with the same or another party.
Total return swaps involve commitments where single or multiple cash flows are exchanged based on the price of an underlying reference asset (such as an index) for a fixed or variable interest rate. Total return swaps will usually be computed based on the current value of the reference asset as of the close of regular trading on the NYSE or other exchange, with the swap value being adjusted to include dividends accrued, financing charges and/or interest associated with the swap
| | THE GUGGENHEIM FUNDS ANNUAL REPORT | 83 |
NOTES TO FINANCIAL STATEMENTS (continued) |
agreement. A fund utilizing total return swaps bears the risk of loss of the amount expected to be received under a swap agreement in the event of the default or bankruptcy of a swap agreement counterparty or if the underlying reference asset declines in value.
The following table represents the Fund’s use and volume of total return swaps on a monthly basis:
| | | Average Notional Amount | |
Use | | Long | | | Short | |
Income | | $ | — | * | | $ | — | |
* | Total return swap agreements were outstanding for 40 days during the year ended September 30, 2019. The daily average outstanding notional amount of total return swap agreements during the period was $49,143,824. |
Interest rate swaps involve the exchange by the Fund with another party for its respective commitment to pay or receive a fixed or variable interest rate on a notional amount of principal. Interest rate swaps are generally centrally-cleared, but central clearing does not make interest rate swap transactions risk free.
The following table represents the Fund’s use and volume of interest rate swaps on a monthly basis:
| | | Average Notional Amount | |
Use | | Pay Floating Rate | | | Receive Floating Rate | |
Duration, Hedge | | $ | 304,555,167 | | | $ | 956,554,417 | |
Credit default swaps are instruments which allow for the full or partial transfer of third party credit risk, with respect to a particular entity or entities, from one counterparty to the other. The Fund enters into credit default swaps as a “seller” or “buyer” of protection primarily to gain or reduce exposure to the investment grade and/or high yield bond market. A seller of credit default swaps is selling credit protection or assuming credit risk with respect to the underlying entity or entities. The buyer in a credit default swap is obligated to pay the seller a periodic stream of payments over the term of the contract provided that no event of default on an underlying reference obligation has occurred. If a credit event occurs, as defined under the terms of the swap agreement, the seller will either (i) pay to the buyer of protection an amount equal to the notional amount of the swap and take delivery of the referenced obligation or underlying securities comprising the referenced index or (ii) pay a net settlement amount in the form of cash or securities equal to the notional amount of the swap less the recovery value of the referenced obligation or underlying securities comprising the referenced index. The Notional Amount reflects the maximum potential amount the seller of credit protection could be required to pay to the buyer if a credit event occurs. The seller of protection receives periodic premium payments from the buyer and may also receive or pay an upfront premium adjustment to the stated periodic payments. In the event a credit default occurs on a credit default swap referencing an index, a factor adjustment will
84 | THE GUGGENHEIM FUNDS ANNUAL REPORT | |
NOTES TO FINANCIAL STATEMENTS (continued) |
take place and the buyer of protection will receive a payment reflecting the par less the default recovery rate of the defaulted index component based on its weighting in the index. If no default occurs, the counterparty will pay the stream of payments and have no further obligations to the fund selling the credit protection. For a fund utilizing centrally cleared credit default swaps, the exchange bears the risk of loss resulting from a counterparty not being able to pay. For OTC credit default swaps, a fund bears the risk of loss of the amount expected to be received under a swap agreement in the event of the default or bankruptcy of a swap agreement counterparty, or in the case of a credit default swap in which a fund is selling credit protection, the default of a third party issuer.
The quoted market prices and resulting market values for credit default swap agreements on securities and credit indices serve as an indicator of the current status of the payment/performance risk and represent the likelihood of an expected liability (or profit) for the credit derivative had the notional amount of the swap agreement been closed/sold as of the period end. Increasing market values, in absolute terms when compared to the notional amount of the swap, represent a deterioration of the referenced entity’s credit soundness and a greater likelihood or risk of default or other credit event occurring as defined under the terms of the agreement.
The following table represents the Fund’s use and volume of credit default swaps on a monthly basis:
| | | Average Notional Amount | |
Use | | Protection Sold | | | Protection Purchased | |
Hedge | | $ | — | | | $ | 1,967,988,333 | |
Forward Foreign Currency Exchange Contracts
A forward foreign currency exchange contract is an agreement between two parties to exchange two designated currencies at a specific time in the future. Certain types of contracts may be cash settled, in an amount equal to the change in exchange rates during the term of the contract. The contracts can be used to hedge or manage exposure to foreign currency risks with portfolio investments or to gain exposure to foreign currencies.
The market value of a forward foreign currency exchange contract changes with fluctuations in foreign currency exchange rates. Furthermore, the Fund may be exposed to risk if the counterparties cannot meet the contract terms or if the currency value changes unfavorably as compared to the U.S. dollar.
The following table represents the Fund’s use, and volume of forward foreign currency exchange contracts on a monthly basis:
| | THE GUGGENHEIM FUNDS ANNUAL REPORT | 85 |
NOTES TO FINANCIAL STATEMENTS (continued) |
| | | Average Value | |
Use | | Purchased | | | Sold | |
Hedge, Income | | $ | 219,360,969 | | | $ | 1,890,891,342 | |
Derivative Investment Holdings Categorized by Risk Exposure
The following is a summary of the location of derivative investments on the Fund’s Statement of Assets and Liabilities as of September 30, 2019:
Derivative Investment Type | Asset Derivatives | Liability Derivatives |
Currency contracts | Unrealized appreciation on forward foreign currency exchange contracts | Unrealized depreciation on forward foreign currency exchange contracts |
Interest Rate contracts | Investments in unaffiliated issuers, at value | Variation margin on interest rate swap agreements |
| | Unamortized upfront premiums paid on interest rate swap agreements | |
Credit contracts | | Unamortized upfront premiums received on credit default swap agreements |
| | Variation margin on credit default swap agreements |
| | | Unrealized depreciation on OTC swap agreements |
The following table sets forth the fair value of the Fund’s derivative investments categorized by primary risk exposure at September 30, 2019:
| | Asset Derivative Investments Value | |
| | Swaps
Interest
Rate
Risk* | | | Swaps
Credit
Risk* | | | Options
Purchased
Interest
Rate Risk | | | Forward
Foreign
Currency
Exchange
Risk | | | Total Value at
September 30,
2019 | |
| | $ | 207,143 | | | $ | — | | | $ | 20,262,806 | | | $ | 49,984,103 | | | $ | 70,454,052 | |
| | Liability Derivative Investments Value | |
| | Swaps
Interest
Rate
Risk* | | | Swaps
Credit
Risk* | | | Options
Written
Interest
Rate Risk | | | Forward
Foreign
Currency
Exchange
Risk | | | Total Value at
September 30,
2019 | |
| | $ | 6,530,484 | | | $ | 27,948,211 | | | $ | — | | | $ | 9,694,638 | | | $ | 44,173,333 | |
* | Includes cumulative appreciation (depreciation) of OTC and centrally-cleared swap agreements as reported on the Schedule of Investments. For centrally-cleared swaps, variation margin is reported within the Statement of Assets and Liabilities. |
86 | THE GUGGENHEIM FUNDS ANNUAL REPORT | |
NOTES TO FINANCIAL STATEMENTS (continued) |
The following is a summary of the location of derivative investments on the Fund’s Statement of Operations for the year ended September 30, 2019:
Derivative Investment Type | Location of Gain (Loss) on Derivatives |
Currency contracts | Net realized gain (loss) on forward foreign currency exchange contracts |
| Net change in unrealized appreciation (depreciation) on forward foreign currency exchange contracts |
Interest Rate/Credit contracts | Net realized gain (loss) on swap agreements |
| Net change in unrealized appreciation (depreciation) on swap agreements |
Interest Rate contracts | Net realized gain (loss) on futures contracts |
| | Net realized gain (loss) on options purchased |
| | Net change in unrealized appreciation (depreciation) on options purchased |
Equity contracts | Net realized gain (loss) on options written |
The following is a summary of the Fund’s realized gain (loss) and change in unrealized appreciation (depreciation) on derivative investments recognized on the Statement of Operations categorized by primary risk exposure for the year ended September 30, 2019:
| | Realized Gain (Loss) on Derivative Investments Recognized on the Statements of Operations | |
| | Futures
Interest
Rate
Risk | | | Swaps
Interest
Rate
Risk | | | Swaps
Credit
Risk | | | Options
Written
Equity
Risk | | | Options
Purchased
Interest Rate
Risk | | | Options
Purchased
Equity
Risk | | | Forward
Foreign
Currency
Exchange
Risk | | | Total | |
| | $ | (11,798,503 | ) | | $ | (37,910,713 | ) | | $ | (15,042,327 | ) | | $ | 3,818,640 | | | $ | (15,769 | ) | | $ | (19,482,215 | ) | | $ | 26,623,106 | | | $ | (53,807,781 | ) |
| | Change in Unrealized Appreciation (Depreciation) on Derivative Investments Recognized on the Statements of Operations | |
| | Futures
Interest
Rate
Risk | | | Swaps
Interest
Rate
Risk | | | Swaps
Credit
Risk | | | Options
Written
Equity
Risk | | | Options
Purchased
Interest Rate
Risk | | | Options
Purchased
Equity
Risk | | | Forward
Foreign
Currency
Exchange
Risk | | | Total | |
| | $ | — | | | $ | (46,672,002 | ) | | $ | (27,948,211 | ) | | $ | — | | | $ | (7,730,154 | ) | | $ | 2,540,000 | | | $ | 14,016,777 | | | $ | (65,793,590 | ) |
In conjunction with the use of derivative instruments, the Fund is required to maintain collateral in various forms. Depending on the financial instrument utilized and the broker involved, the Fund uses margin deposits at the broker, cash and/or securities segregated at the custodian bank, discount notes or repurchase agreements allocated to the Fund as collateral.
| | THE GUGGENHEIM FUNDS ANNUAL REPORT | 87 |
NOTES TO FINANCIAL STATEMENTS (continued) |
Foreign Investments
There are several risks associated with exposure to foreign currencies, foreign issuers and emerging markets. A fund’s indirect and direct exposure to foreign currencies subjects the Fund to the risk that those currencies will decline in value relative to the U.S. dollar, or in the case of short positions, that the U.S. dollar will decline in value relative to the currency being hedged. Currency rates in foreign countries may fluctuate significantly over short periods of time for a number of reasons, including changes in interest rates and the imposition of currency controls or other political developments in the U.S. or abroad. In addition, the Fund may incur transaction costs in connection with conversions between various currencies. The Fund may, but is not obligated to, engage in currency hedging transactions, which generally involve buying currency forward, options or futures contracts. However, not all currency risks may be effectively hedged, and in some cases the costs of hedging techniques may outweigh expected benefits. In such instances, the value of securities denominated in foreign currencies can change significantly when foreign currencies strengthen or weaken relative to the U.S. dollar.
The Fund may invest in securities of foreign companies directly, or in financial instruments, such as ADRs and exchange-traded funds, which are indirectly linked to the performance of foreign issuers. Foreign markets can be more volatile than the U.S. market due to increased risks of adverse issuer, political, regulatory, market, or economic developments and can perform differently from the U.S. market. Investing in securities of foreign companies directly, or in financial instruments that are indirectly linked to the performance of foreign issuers, may involve risks not typically associated with investing in U.S. issuers. The value of securities denominated in foreign currencies, and of dividends from such securities, can change significantly when foreign currencies strengthen or weaken relative to the U.S. dollar. Foreign securities markets generally have less trading volume and less liquidity than U.S. markets, and prices in some foreign markets may fluctuate more than those of securities traded on U.S. markets. Many foreign countries lack accounting and disclosure standards comparable to those that apply to U.S. companies, and it may be more difficult to obtain reliable information regarding a foreign issuer’s financial condition and operations. Transaction costs and costs associated with custody services are generally higher for foreign securities than they are for U.S. securities. Some foreign governments levy withholding taxes against dividend and interest income. Although in some countries portions of these taxes are recoverable, the non-recovered portion will reduce the income received by the Funds.
The Trust has established counterparty credit guidelines and enters into transactions only with financial institutions of investment grade or better. The Trust monitors the counterparty credit risk.
Note 3 – Offsetting
In the normal course of business, the Fund enters into transactions subject to enforceable master netting arrangements or other similar arrangements. Generally, the right to offset in those agreements allows the Fund to counteract the exposure to a specific counterparty with collateral
88 | THE GUGGENHEIM FUNDS ANNUAL REPORT | |
NOTES TO FINANCIAL STATEMENTS (continued) |
received from or delivered to that counterparty based on the terms of the arrangements. These arrangements provide for the right to liquidate upon the occurrence of an event of default, credit event upon merger or additional termination event.
In order to better define its contractual rights and to secure rights that will help the Fund mitigate its counterparty risk, the Fund may enter into an International Swaps and Derivatives Association, Inc. Master Agreement (“ISDA Master Agreement”) or similar agreement with its derivative contract counterparties. An ISDA Master Agreement is a bilateral agreement between a fund and a counterparty that governs OTC derivatives, including foreign exchange contracts, and typically contains, among other things, collateral posting terms and netting provisions in the event of a default and/or termination event. The provisions of the ISDA Master Agreement typically permit a single net payment in the event of a default (close-out netting) or similar event, including the bankruptcy or insolvency of the counterparty.
For derivatives traded under an ISDA Master Agreement, the collateral requirements are typically calculated by netting the mark-to-market amount for each transaction under such agreement and comparing that amount to the value of any collateral currently pledged by the Fund and the counterparty. For financial reporting purposes, cash collateral that has been pledged to cover obligations of the Fund and cash collateral received from the counterparty, if any, are reported separately on the Statement of Assets and Liabilities as segregated cash with broker/receivable for variation margin, or payable for swap settlement/variation margin. Cash and/or securities pledged or received as collateral by the Fund in connection with an OTC derivative subject to an ISDA Master Agreement generally may not be invested, sold or rehypothecated by the counterparty or the Fund, as applicable, absent an event of default under such agreement, in which case such collateral generally may be applied towards obligations due to and payable by such counterparty or the Fund, as applicable. Generally, the amount of collateral due from or to a counterparty must exceed a minimum transfer amount threshold (e.g., $300,000) before a transfer is required to be made. To the extent amounts due to the Fund from its counterparties are not fully collateralized, contractually or otherwise, the Fund bears the risk of loss from counterparty nonperformance. The Fund attempts to mitigate counterparty risk by only entering into agreements with counterparties that they believe to be of good standing and by monitoring the financial stability of those counterparties.
For financial reporting purposes, the Fund does not offset derivative assets and derivative liabilities that are subject to netting arrangements in the Statement of Assets and Liabilities.
| | THE GUGGENHEIM FUNDS ANNUAL REPORT | 89 |
NOTES TO FINANCIAL STATEMENTS (continued) |
The following tables present derivative financial instruments and secured financing transactions that are subject to enforceable netting arrangements:
| | | | | | | | | | | | | | | Gross Amounts Not Offset
in the Statement of
Assets and Liabilities | | | | | |
Instrument | | Gross
Amounts of
Recognized
Assets1 | | | Gross
Amounts
Offset in the
Statement of
Assets and
Liabilities | | | Net Amount
of Assets
Presented on
the Statement
of Assets and
Liabilities | | | Financial
Instruments | | | Cash
Collateral
Received | | | Net
Amount | |
Forward foreign currency exchange contracts | | $ | 49,984,103 | | | $ | — | | | $ | 49,984,103 | | | $ | (9,833,218 | ) | | $ | (33,005,716 | ) | | $ | 7,145,169 | |
Options purchased contracts | | | 20,262,806 | | | | — | | | | 20,262,806 | | | | (6,433,432 | ) | | | (4,130,000 | ) | | | 9,699,374 | |
| | | | | | | | | | | | | | | Gross Amounts Not Offset
in the Statement of
Assets and Liabilities | | | | | |
Instrument | | Gross
Amounts of
Recognized
Liabilities1 | | | Gross
Amounts
Offset in the
Statement of
Assets and
Liabilities | | | Net Amount
of Liabilities
Presented on
the Statement
of Assets and
Liabilities | | | Financial
Instruments | | | Cash
Collateral
Pledged | | | Net
Amount | |
Credit default swap agreements | | $ | 6,551,587 | | | $ | — | | | $ | 6,551,587 | | | $ | (6,551,587 | ) | | $ | — | | | $ | — | |
Forward foreign currency exchange contracts | | | 9,694,638 | | | | — | | | | 9,694,638 | | | | (9,694,638 | ) | | | — | | | | — | |
Total return swap agreements | | | 242,890 | | | | — | | | | 242,890 | | | | (20,425 | ) | | | (222,465 | ) | | | — | |
1 | Exchange-traded or centrally-cleared derivatives are excluded from these reported amounts. |
90 | THE GUGGENHEIM FUNDS ANNUAL REPORT | |
NOTES TO FINANCIAL STATEMENTS (continued) |
The Fund has the right to offset deposits against any related derivative liabilities outstanding with each counterparty with the exception of exchange-traded or centrally-cleared derivatives. The following table presents deposits held by others in connection with derivative investments and repurchase agreements as of September 30, 2019.
Counterparty | Asset Type | | Cash Pledged | | | Cash Received | |
BofA Securities, Inc. | Credit default swap agreements | | $ | 17,780,162 | | | $ | — | |
BofA Securities, Inc. | Forward foreign currency exchange contracts | | | — | | | | 2,025,000 | |
BofA Securities, Inc. | Interest rate swap agreements | | | 34,662,505 | | | | — | |
Citibank N.A. | Forward foreign currency exchange contracts | | | — | | | | 13,571,000 | |
Deutsche Bank | Forward foreign currency exchange contracts, Total return swap agreements | | | 330,000 | | | | — | |
Goldman Sachs & Co. LLC | Forward foreign currency exchange contracts, Credit default swap agreements | | | — | | | | 7,240,000 | |
J.P. Morgan Securities LLC | Forward foreign currency exchange contracts | | | — | | | | 10,180,000 | |
Morgan Stanley & Co. LLC | Forward foreign currency exchange contracts, Credit default swap agreements | | | — | | | | 4,130,000 | |
Societe Generale | Repurchase agreements | | | — | | | | 652,000 | |
Total | | | $ | 52,772,667 | | | $ | 37,798,000 | |
Note 4 – Fair Value Measurement
In accordance with U.S. GAAP, fair value is defined as the price that the Fund would receive to sell an investment or pay to transfer a liability in an orderly transaction with an independent buyer in the principal market, or in the absence of a principal market, the most advantageous market for the investment or liability. U.S. GAAP establishes a three-tier fair value hierarchy based on the types of inputs used to value assets and liabilities and requires corresponding disclosure. The hierarchy and the corresponding inputs are summarized below:
Level 1 — | quoted prices in active markets for identical assets or liabilities. |
Level 2 — | significant other observable inputs (for example quoted prices for securities that are similar based on characteristics such as interest rates, prepayment speeds, credit risk, etc.). |
Level 3 — | significant unobservable inputs based on the best information available under the circumstances, to the extent observable inputs are not available, which may include assumptions. |
The types of inputs available depend on a variety of factors, such as the type of security and the characteristics of the markets in which it trades, if any. Fair valuation determinations that rely on fewer or no observable inputs require greater judgment. Accordingly, fair value determinations for Level 3 securities require the greatest amount of judgment.
| | THE GUGGENHEIM FUNDS ANNUAL REPORT | 91 |
NOTES TO FINANCIAL STATEMENTS (continued) |
Independent pricing services are used to value a majority of the Fund’s investments. When values are not available from a pricing service, they will be determined using a variety of sources and techniques, including: market prices; broker quotes; and models which derive prices based on inputs such as prices of securities with comparable maturities and characteristics or based on inputs such as anticipated cash flows or collateral, spread over U.S. Treasury securities, and other information and analysis. A significant portion of the Fund’s assets and liabilities are categorized as Level 2, as indicated in this report.
Quotes from broker-dealers, adjusted for fluctuations in criteria such as credit spreads and interest rates, may also be used to value the Fund’s assets and liabilities, i.e. prices provided by a broker-dealer or other market participant who has not committed to trade at that price. Although quotes are typically received from established market participants, the Fund may not have the transparency to view the underlying inputs which support the market quotations. Significant changes in a quote would generally result in significant changes in the fair value of the security.
Certain fixed income securities are valued by obtaining a monthly quote from a broker-dealer, adjusted for fluctuations in criteria such as credit spreads and interest rates.
Certain loans and other securities are valued using a single daily broker quote or a price from a third party vendor based on a single daily or monthly broker quote.
The inputs or methodologies used for valuing securities are not necessarily an indication of the risk associated with investing in those securities. The suitability of the techniques and sources employed to determine fair valuation are regularly monitored and subject to change.
Note 5 – Investment Advisory Agreement and Other Agreements
Under the terms of an investment advisory contract, the Fund pays GI investment advisory fees calculated at an annualized rate of 0.39% of the average daily net assets of the Fund.
GI engages external service providers to perform other necessary services for the Trust, such as audit and accounting related services, legal services, custody, printing and mailing, etc., on a pass-through basis. Such expenses are allocated to various Funds within the complex based on relative net assets.
The Fund has adopted Distribution Plans related to the offering of A-Class, C-Class and P-Class shares pursuant to Rule 12b-1 under the 1940 Act. The plans provide for payments at an annual rate of 0.25% of the average daily net assets of the Fund’s A-Class and P-Class shares, and 1.00% of the average daily net assets of the Fund’s C-Class shares.
92 | THE GUGGENHEIM FUNDS ANNUAL REPORT | |
NOTES TO FINANCIAL STATEMENTS (continued) |
The investment advisory contract for the Fund provides that the total expenses be limited to a percentage of average net assets for each class of shares, exclusive of brokerage costs, dividends on securities sold short, expenses of other investment companies in which the Fund invests, interest, taxes, litigation, indemnification and extraordinary expenses. The limits are listed below:
| | Limit | | | Effective
Date | | | Contract
End Date | |
Total Return Bond Fund - A-Class | | | 0.79 | % | | | 11/20/17 | | | | 02/01/21 | |
Total Return Bond Fund - C-Class | | | 1.54 | % | | | 11/20/17 | | | | 02/01/21 | |
Total Return Bond Fund - P-Class | | | 0.79 | % | | | 11/20/17 | | | | 02/01/21 | |
Total Return Bond Fund - Institutional Class | | | 0.50 | % | | | 11/30/12 | | | | 02/01/21 | |
Total Return Bond Fund - R6-Class | | | 0.50 | % | | | 10/19/16 | | | | 02/01/21 | |
GI is entitled to reimbursement by the Fund for fees waived or expenses reimbursed during any of the previous 36 months, beginning on the date of the expense limitation agreement, if on any day the estimated operating expenses are less than the indicated percentages. For purposes of this arrangement, GI is entitled to recoupment of previously waived fees or reimbursed expenses for 36 months from the date of the waiver or reimbursement by GI. At September 30, 2019, the amount of fees waived or expenses reimbursed that are subject to recoupment and will expire during the years ended September 30, are presented in the following table:
| | 2020 | | | 2021 | | | 2022 | | | Total | |
A-Class | | $ | 902,097 | | | $ | 807,942 | | | $ | 970,954 | | | $ | 2,680,993 | |
C-Class | | | 297,149 | | | | 141,993 | | | | 139,409 | | | | 578,551 | |
P-Class | | | 562,669 | | | | 661,267 | | | | 529,763 | | | | 1,753,699 | |
Institutional Class | | | 6,941,687 | | | | 5,917,973 | | | | 6,918,582 | | | | 19,778,242 | |
R6-Class | | | 949 | | | | 5,254 | | | | 3,324 | | | | 9,527 | |
For the year ended September 30, 2019, GI recouped $11,210 from the Fund.
If the Fund invests in a fund that is advised by the same adviser or an affiliated adviser, the investing Fund’s adviser has agreed to waive fees at the investing fund level to the extent necessary to offset the proportionate share of any management fee paid by the Fund with respect to its investment in such affiliated fund. Fee waivers will be calculated at the investing Fund level without regard to any expense cap in effect for the investing Fund. Fees waived under this arrangement are not subject to reimbursement to GI. For the year ended September 30, 2019, the Fund waived $484,841 related to investments in affiliated funds.
For the year ended September 30, 2019, GFD retained sales charges of $286,511 relating to sales of A-Class shares of the Trust.
Certain trustees and officers of the Trust are also officers of GI and/or GFD. The Trust does not compensate its officers or trustees who are officers, directors and/or employees of GI or GFD.
| | THE GUGGENHEIM FUNDS ANNUAL REPORT | 93 |
NOTES TO FINANCIAL STATEMENTS (continued) |
MUFG Investor Services (US), LLC (“MUIS”) acts as the Fund’s administrator, transfer agent and accounting agent. As administrator, transfer agent and accounting agent, MUIS is responsible for maintaining the books and records of the Fund’s securities and cash. The Bank of New York Mellon Corp. (“BNY”) acts as the Fund’s custodian. As custodian, BNY is responsible for the custody of the Fund’s assets. For providing the aforementioned administrative and accounting services, MUIS is entitled to receive a monthly fee equal to a percentage of the Fund’s average daily net assets and out of pocket expenses. For providing the aforementioned transfer agent and custodian services, MUIS and BNY are entitled to receive a monthly fee based on the number of transactions during the month and the number of accounts under management, subject to certain minimum monthly fees, and out of pocket expenses.
Note 6 – Reverse Repurchase Agreements
The Fund may enter into reverse repurchase agreements. Under a reverse repurchase agreement, a Fund sells securities and agrees to repurchase them at a particular price at a future date. In the event the buyer of securities under a reverse repurchase agreement files for bankruptcy or becomes insolvent, such buyer or its trustee or receiver may receive an extension of time to determine whether to enforce the Fund’s obligation to repurchase the securities, and the Fund’s use of the proceeds of the reverse repurchase agreement may effectively be restricted pending such decision.
For the year ended September 30, 2019, the Fund entered into reverse repurchase agreements as follows:
| | Number of Days
Outstanding | | | Balance at
September 30, 2019 | | | Average Balance
Outstanding | | | Average
Interest Rate | |
| | | 1 | | | $ | — | | | $ | 249,468,750 | | | | 2.49 | % |
Note 7 – Federal Income Tax Information
The Fund intends to comply with the provisions of Subchapter M of the Internal Revenue Code applicable to regulated investment companies and will distribute substantially all taxable net investment income and capital gains sufficient to relieve the Fund from all, or substantially all, federal income, excise and state income taxes. Therefore, no provision for federal or state income tax or federal excise tax is required.
Tax positions taken or expected to be taken in the course of preparing the Fund’s tax returns are evaluated to determine whether the tax positions are “more-likely-than-not” of being sustained by the applicable tax authority. Tax positions not deemed to meet the more-likely-than-not threshold would be recorded as a tax benefit or expense in the current year. Management has analyzed the Fund’s tax positions taken, or to be taken, on U.S. federal income tax returns for all open tax years, and has concluded that no provision for income tax is required in the Fund’s financial statements. The Fund’s U.S. federal income tax returns are subject to examination by the Internal Revenue Service for a period of three years after they are filed.
94 | THE GUGGENHEIM FUNDS ANNUAL REPORT | |
NOTES TO FINANCIAL STATEMENTS (continued) |
The tax character of distributions paid during the year ended September 30, 2019 was as follows:
| | Ordinary
Income | | | Long-Term
Capital Gain | | | Total
Distributions | |
| | | $ | 368,303,473 | | | $ | — | | | $ | 368,303,473 | |
The tax character of distributions paid during the year ended September 30, 2018 was as follows:
| | Ordinary
Income | | | Long-Term
Capital Gain | | | Total
Distributions | |
| | | $ | 268,599,387 | | | $ | 513,792 | | | $ | 269,113,179 | |
Note: For U.S. federal income tax purposes, short-term capital gain distributions are treated as ordinary income distributions.
The tax components of distributable earnings/(loss) as of September 30, 2019 were as follows:
| | Undistributed
Ordinary
Income | | | Undistributed
Long-Term
Capital Gain | | | Net Unrealized
Appreciation
(Depreciation) | | | Accumulated
Capital and
Other Losses | | | Other
Temporary
Differences | | | Total | |
| | | $ | 29,062,850 | | | $ | — | | | $ | 314,327,144 | | | $ | (12,384,098 | ) | | $ | (35,685,045 | ) | | $ | 295,320,851 | |
For U.S. federal income tax purposes, capital loss carryforwards represent realized losses of the Fund that may be carried forward and applied against future capital gains. Under the RIC Modernization Act of 2010, the Fund is permitted to carry forward capital losses incurred in taxable years beginning after December 22, 2010 for an unlimited period and such capital loss carryforwards will retain their character as either short-term or long-term capital losses. As of September 30, 2019, capital loss carryforwards for the Fund were as follows:
| | | Unlimited | | | Total
Capital Loss | |
| | Short-Term | | | Long-Term | | | Carryforward | |
| | | $ | — | | | $ | (12,384,098 | ) | | $ | (12,384,098 | ) |
Net investment income and net realized gains (losses) may differ for financial statement and tax purposes because of temporary or permanent book/tax differences. These differences are primarily due to investments in swaps, foreign currency gains and losses, “mark-to-market” of foreign currency exchange contracts, losses deferred due to wash sales, reclassification of distributions, dividends payable, and the “mark-to-market,” recharacterization, or disposition of certain Passive Foreign Investment Companies (PFICs). Additional differences may result from bond premium/discount amortization, income accruals on certain investments, the deferral of losses related to tax straddle investments, and the “mark-to-market” of certain investments denominated in foreign currencies. To the extent these differences are permanent and would
| | THE GUGGENHEIM FUNDS ANNUAL REPORT | 95 |
NOTES TO FINANCIAL STATEMENTS (continued) |
require a reclassification between Paid in Capital and Total Distributable Earnings (Loss), such reclassifications are made in the period that the differences arise. These reclassifications have no effect on net assets or NAV per share.
There were no adjustments made on the Statement of Assets and Liabilities as of September 30, 2019 for permanent book/tax differences.
At September 30, 2019, the cost of investments for U.S. federal income tax purposes, the aggregate gross unrealized appreciation for all investments for which there was an excess of value over tax cost and the aggregate gross unrealized depreciation for all investments for which there was an excess of tax cost over value, were as follows:
| | Tax Cost | | | Tax Unrealized
Appreciation | | | Tax Unrealized
Depreciation | | | Net Unrealized
Appreciation/
(Depreciation) | |
| | | $ | 13,614,403,180 | | | $ | 417,321,754 | | | $ | (102,942,472 | ) | | $ | 314,379,282 | |
Note 8 – Securities Transactions
For the year ended September 30, 2019, the cost of purchases and proceeds from sales of investment securities, excluding government securities, short-term investments and derivatives, were as follows:
| | Purchases | | | Sales | |
| | | $ | 4,273,532,467 | | | $ | 3,238,733,476 | |
For the year ended September 30, 2019, the cost of purchases and proceeds from sales of government securities were as follows:
| | Purchases | | | Sales | |
| | | $ | 4,419,862,020 | | | $ | 3,197,938,529 | |
The Fund is permitted to purchase or sell securities from or to certain affiliated funds under specified conditions outlined in procedures adopted by the Board. The procedures have been designed to ensure that any purchase or sale of securities by the Fund from or to another fund or portfolio that is or could be considered an affiliate by virtue of having a common investment adviser (or affiliated investment advisers), common Trustees and/or common officers complies with Rule 17a-7 of the 1940 Act. Further, as defined under these procedures, each transaction
96 | THE GUGGENHEIM FUNDS ANNUAL REPORT | |
NOTES TO FINANCIAL STATEMENTS (continued) |
is effected at the current market price to save costs, where permissible. For the year ended September 30, 2019, the Fund engaged in purchases and sales of securities, pursuant to Rule 17a-7 of the 1940 Act, as follows:
| | Purchases | | | Sales | | | Realized
Gain | |
| | | $ | — | | | $ | 9,201,899 | | | $ | 285,587 | |
Note 9 – Unfunded Loan Commitments
Pursuant to the terms of certain loan agreements, the Fund held unfunded loan commitments as of September 30, 2019. The Fund is obligated to fund these loan commitments at the borrower’s discretion.
The unfunded loan commitments as of September 30, 2019, were as follows:
Borrower | | Maturity
Date | | | Face
Amount | | | Value | |
Acosta, Inc. | | | 12/26/19 | | | $ | 383,518 | | | $ | 263,189 | |
Aspect Software, Inc. | | | 07/15/23 | | | | 2,046 | | | | 26 | |
| | | | | | | | | | | $ | 263,215 | |
| | THE GUGGENHEIM FUNDS ANNUAL REPORT | 97 |
NOTES TO FINANCIAL STATEMENTS (continued) |
Note 10 – Restricted Securities
The securities below are considered illiquid and restricted under guidelines established by the Board:
Restricted
Securities | Acquisition
Date | | Cost | | | Value | |
Airplanes Pass Through Trust | | | | | | | | | |
2001-1A, 2.88% (1 Month USD LIBOR + 0.55%, Rate Floor: 0.55%) due 03/15/191,3 | 11/30/11 | | $ | 335,966 | | | $ | 6,784 | |
Atlas Mara Ltd. | | | | | | | | | |
8.00% due 12/31/20 | 10/01/15 | | | 6,257,062 | | | | 5,841,000 | |
Central Storage Safety Project Trust | | | | | | | | | |
4.82% due 02/01/38 | 02/02/18 | | | 21,222,102 | | | | 22,603,621 | |
Copper River CLO Ltd. | | | | | | | | | |
2007-1A, due 01/20/212 | 05/09/14 | | | 295,621 | | | | 208,191 | |
Highland Park CDO I Ltd. | | | | | | | | | |
2006-1A, 2.53% (3 Month USD LIBOR + 0.40%, Rate Floor: 0.00%) due 11/25/511 | 07/01/16 | | | 1,300,715 | | | | 1,354,236 | |
Princess Juliana International Airport Operating Company N.V. | | | | | | | | | |
5.50% due 12/20/27 | 12/17/12 | | | 2,101,321 | | | | 1,994,492 | |
Turbine Engines Securitization Ltd. | | | | | | | | | |
2013-1A, 5.13% due 12/13/48 | 11/27/13 | | | 721,022 | | | | 727,250 | |
| | | | $ | 32,233,809 | | | $ | 32,735,574 | |
1 | Variable rate security. Rate indicated is the rate effective at September 30, 2019. In some instances, the effective rate is limited by a minimum rate floor or a maximum rate cap established by the issuer. The settlement status of a position may also impact the effective rate indicated. In some cases, a position may be unsettled at period end and may not have a stated effective rate. In instances where multiple underlying reference rates and spread amounts are shown, the effective rate is based on a weighted average. |
2 | Security has no stated coupon. However, it is expected to receive residual cash flow payments on defined deal dates. |
3 | Security is in default of interest and/or principal obligations. |
Note 11 – Line of Credit
The Trust, along with other affiliated trusts, secured a 364-day committed, $1,065,000,000 line of credit from Citibank, N.A., which was in place through October 5, 2018, at which time the line of credit was renewed with an increased commitment amount of $1,205,000,000. On October 4, 2019, the line of credit agreement was renewed with an increased commitment amount of $1,230,000,000. A Fund may draw (borrow) from the line of credit as a temporary measure for emergency purposes, to facilitate redemption requests, or for other short-term liquidity purposes consistent with the Fund’s investment objective and program. For example, it may be advantageous for the Fund to borrow money rather than sell existing portfolio positions to meet redemption requests. Fees related to borrowings, if any, vary under this arrangement between the greater of Citibank’s “base rate”, LIBOR plus 1%, or the federal funds rate plus 1/2 of 1%.
98 | THE GUGGENHEIM FUNDS ANNUAL REPORT | |
NOTES TO FINANCIAL STATEMENTS (concluded) |
The commitment fee that may be paid by the Fund is at an annualized rate of 0.15% of the average daily amount of its allocated unused commitment amount. The allocated commitment fee amount for the Fund is referenced in the Statement of Operations under “Line of credit fees”. The Fund did not have any borrowings under this agreement as of and for the year ended September 30, 2019.
Note 12 – Recent Regulatory Reporting Updates
In August 2018, the Financial Accounting Standards Board issued an Accounting Standards Update, ASU 2018-13, Fair Value Measurement (Topic 820), Disclosure Framework - Changes to the Disclosure Requirements for Fair Value Measurement (the “2018 ASU”) which adds, modifies and removes disclosure requirements related to certain aspects of fair value measurement. The 2018 ASU is effective for fiscal years, and interim periods within those fiscal years, beginning after December 15, 2019. Early adoption is permitted. As of September 30, 2019, the Fund has fully adopted the provisions of the 2018 ASU, which did not have a material impact on the Fund’s financial statements and related disclosures or impact the Fund’s net assets or results of operations.
Note 13 – Recent Accounting Pronouncements
In March 2017, the Financial Accounting Standards Board issued an Accounting Standards Update, ASU 2017-08, Receivables – Nonrefundable Fees and Other Costs (Subtopic 310-20), Premium Amortization on Purchased Callable Debt Securities (the “2017 ASU”) which amends the amortization period for certain purchased callable debt securities held at a premium, shortening such period to the earliest call date. The 2017 ASU does not require any accounting change for debt securities held at a discount; the discount continues to be amortized to maturity. The 2017 ASU is effective for fiscal years, and interim periods within those fiscal years, beginning after December 15, 2018. At this time, management is evaluating the implications of these changes on the financial statements.
Note 14 – Subsequent Events
The Fund evaluated subsequent events through the date the financial statements were available for issue and determined there were no material events that would require adjustment to or disclosure in the Fund’s financial statements.
| | THE GUGGENHEIM FUNDS ANNUAL REPORT | 99 |
REPORT OF INDEPENDENT REGISTERED PUBLIC ACCOUNTING FIRM |
To the Shareholders and the Board of Trustees of Guggenheim Total Return Bond Fund
Opinion on the Financial Statements
We have audited the accompanying statement of assets and liabilities of Guggenheim Total Return Bond Fund (the “Fund”), (one of the funds constituting Guggenheim Funds Trust (the “Trust”)), including the schedule of investments, as of September 30, 2019, and the related statement of operations for the year then ended, the statements of changes in net assets for each of the two years in the period then ended, the financial highlights for each of the five years in the period then ended and the related notes (collectively referred to as the “financial statements”). In our opinion, the financial statements present fairly, in all material respects, the financial position of the Fund (one of the funds constituting Guggenheim Funds Trust) at September 30, 2019, the results of its operations for the year then ended, the changes in its net assets for each of the two years in the period then ended and its financial highlights for each of the five years in the period then ended, in conformity with U.S. generally accepted accounting principles.
Basis for Opinion
These financial statements are the responsibility of the Trust’s management. Our responsibility is to express an opinion on the Fund’s financial statements based on our audits. We are a public accounting firm registered with the Public Company Accounting Oversight Board (United States) (“PCAOB”) and are required to be independent with respect to the Trust in accordance with the U.S. federal securities laws and the applicable rules and regulations of the Securities and Exchange Commission and the PCAOB.
We conducted our audits in accordance with the standards of the PCAOB. Those standards require that we plan and perform the audit to obtain reasonable assurance about whether the financial statements are free of material misstatement, whether due to error or fraud. The Trust is not required to have, nor were we engaged to perform, an audit of the Trust’s internal control over financial reporting. As part of our audits, we are required to obtain an understanding of internal control over financial reporting, but not for the purpose of expressing an opinion on the effectiveness of the Trust’s internal control over financial reporting. Accordingly, we express no such opinion.
Our audits included performing procedures to assess the risks of material misstatement of the financial statements, whether due to error or fraud, and performing procedures that respond to those risks. Such procedures included examining, on a test basis, evidence regarding the amounts and disclosures in the financial statements. Our procedures included confirmation of securities owned as of September 30, 2019, by correspondence with the custodian, transfer agent, brokers, and paying agents or by other appropriate auditing procedures where replies from brokers or paying agents were not received. Our audits also included evaluating the accounting
100 | THE GUGGENHEIM FUNDS ANNUAL REPORT | |
REPORT OF INDEPENDENT REGISTERED PUBLIC ACCOUNTING FIRM (concluded) |
principles used and significant estimates made by management, as well as evaluating the overall presentation of the financial statements. We believe that our audits provide a reasonable basis for our opinion.

We have served as the auditor of one or more Guggenheim investment companies since 1979.
Tysons, Virginia
November 26, 2019
| | THE GUGGENHEIM FUNDS ANNUAL REPORT | 101 |
OTHER INFORMATION (Unaudited) |
Federal Income Tax Information
This information is being provided as required by the Internal Revenue Code. Amounts shown may differ from those elsewhere in the report because of differences in tax and financial reporting practice.
In January 2020, shareholders will be advised on IRS Form 1099 DIV or substitute 1099 DIV as to the federal tax status of the distributions received by shareholders in the calendar year 2019.
The Fund’s investment income (dividend income plus short-term gains, if any) qualifies as follows:
Of the taxable ordinary income distributions paid during the fiscal year ending September 30, 2019, the Fund had the corresponding percentages qualify for the reduced tax rate pursuant to the Jobs and Growth Tax Relief and Reconciliation Act of 2003 or for the dividends received deduction for corporations. See the qualified dividend income and dividend received deduction columns, respectively, in the table below.
Additionally, of the taxable ordinary income distributions paid during the fiscal year ended September 30, 2019, the Fund had the corresponding percentages qualify as interest related dividends and qualified short-term capital gains as permitted by IRC Section 871(k)(1) and IRC Section 871(k)(2), respectively. See qualified interest income and qualified short-term capital gain columns, respectively, in the table below.
| | Qualified
Dividend
Income | | | Dividend
Received
Deduction | | | Qualified
Interest
Income | | | Qualified
Short-Term
Capital Gain | |
| | | | 0.04 | % | | | 0.04 | % | | | 80.42 | % | | | 100.00 | % |
Proxy Voting Information
A description of the policies and procedures that the Trust uses to determine how to vote proxies relating to securities held in the Fund’s portfolios is available, without charge and upon request, by calling 800.820.0888. This information is also available from the EDGAR database on the SEC’s website at https://www.sec.gov.
Information regarding how the Fund’s voted proxies relating to portfolio securities during the most recent 12-month period ended June 30 is available without charge, upon request, by calling 800.820.0888. This information is also available from the EDGAR database on the SEC’s website at https://www.sec.gov.
102 | THE GUGGENHEIM FUNDS ANNUAL REPORT | |
OTHER INFORMATION (Unaudited)(continued) |
Special Meeting of Shareholders — Voting Results (Unaudited)
A joint special meeting of shareholders of Trust was held on October 28, 2019 to elect the following ten nominees to the Board of Trustees of the Trust: Randall C. Barnes, Angela Brock-Kyle, Donald A. Chubb, Jr., Jerry B. Farley, Roman Friedrich III, Thomas F. Lydon, Jr., Ronald A. Nyberg, Sandra G. Sponem, Ronald E. Toupin, Jr. and Amy J. Lee. At the meeting, the following votes were recorded:
Nominee | | Shares For | | | Shares Withheld | |
Randall C. Barnes | | | 919,263,831 | | | | 7,335,759 | |
Angela Brock-Kyle | | | 919,775,822 | | | | 6,823,768 | |
Donald A. Chubb, Jr. | | | 915,120,874 | | | | 11,478,716 | |
Jerry B. Farley | | | 915,377,483 | | | | 11,222,107 | |
Roman Friedrich III | | | 918,807,442 | | | | 7,792,148 | |
Thomas F. Lydon, Jr. | | | 919,122,642 | | | | 7,476,948 | |
Ronald A. Nyberg | | | 918,889,679 | | | | 7,709,911 | |
Sandra G. Sponem | | | 919,600,708 | | | | 6,998,882 | |
Ronald E. Toupin, Jr. | | | 919,043,208 | | | | 7,556,382 | |
Amy J. Lee | | | 919,943,855 | | | | 6,655,735 | |
Sector Classification
Information in the Schedule of Investments is categorized by sectors using sector-level Classifications defined by the Bloomberg Industry Classification System, a widely recognized industry classification system provider. The Fund’s registration statement has investment policies relating to concentration in specific sectors/industries. For purposes of these investment policies, the Fund usually classifies sectors/industries based on industry-level Classifications used by widely recognized industry classification system providers such as Bloomberg Industry Classification System, Global Industry Classification Standards and Barclays Global Classification Scheme.
Quarterly Portfolio Schedules Information
The Trust files its complete schedule of portfolio holdings with the SEC for the first and third quarters of each fiscal year as an exhibit to its reports on Form N-PORT, and for reporting periods ended prior to March 31, 2019, filed such information on Form N-Q. The Fund’s Forms N-PORT and N-Q are available on the SEC’s website at https://www.sec.gov. The Fund’s Forms N-PORT and N-Q may be reviewed and copied at the SEC’s Public Reference Room in Washington, DC, and that information on the operation of the Public Reference Room may be obtained by calling 800-SEC-0330. Copies of the portfolio holdings are also available to shareholders, without charge and upon request, by calling 800.820.0888.
| | THE GUGGENHEIM FUNDS ANNUAL REPORT | 103 |
OTHER INFORMATION (Unaudited)(continued) |
Report of the Guggenheim Funds Trust Contracts Review Committee
Guggenheim Funds Trust (the “Trust”) was organized as a Delaware statutory trust on November 8, 2013, and is registered as an open-end management investment company under the Investment Company Act of 1940, as amended (the “1940 Act”). The Trust includes the following series:
● Guggenheim Alpha Opportunity Fund (“Alpha Opportunity Fund”) ● Guggenheim Diversified Income Fund (“Diversified Income Fund”) ● Guggenheim High Yield Fund (“High Yield Fund”) ● Guggenheim Large Cap Value Fund (“Large Cap Value Fund”) ● Guggenheim Macro Opportunities Fund (“Macro Opportunities Fund”) ● Guggenheim SMid Cap Value Fund (“SMid Cap Value Fund”) ● Guggenheim Municipal Income Fund (“Municipal Income Fund”) ● Guggenheim Small Cap Value Fund (“Small Cap Value Fund”) ● Guggenheim StylePlus—Mid Growth Fund (“StylePlus—Mid Growth Fund”) ● Guggenheim Ultra Short Duration Fund (“Ultra Short Duration Fund”) | ● Guggenheim Capital Stewardship Fund (“Capital Stewardship Fund”) ● Guggenheim Floating Rate Strategies Fund (“Floating Rate Strategies Fund”) ● Guggenheim Investment Grade Bond Fund (“Investment Grade Bond Fund”) ● Guggenheim Limited Duration Fund (“Limited Duration Fund”) ● Guggenheim Market Neutral Real Estate Fund (“Market Neutral Real Estate Fund”) ● Guggenheim SMid Cap Value Institutional Fund (“SMid Cap Value Institutional Fund”) ● Guggenheim Risk Managed Real Estate Fund (“Risk Managed Real Estate Fund”) ● Guggenheim StylePlus—Large Core Fund (“StylePlus—Large Core Fund”) ● Guggenheim Total Return Bond Fund (“Total Return Bond Fund”) ● Guggenheim World Equity Income Fund (“World Equity Income Fund”) |
1 | The investment management agreements pertaining to the SI-Advised Funds and the investment management agreements pertaining to the GPIM-Advised Funds are referred to herein together as the “Advisory Agreements” and, together with the GPIM Sub-Advisory Agreement, as the “Agreements.” In addition, unless the context indicates otherwise, GPIM, with respect to its service as investment adviser to the GPIM-Advised Funds, and Security Investors as to the SI-Advised Funds, are each referred to herein as the “Adviser” and together, the “Advisers.” |
2 | Because shares of the Capital Stewardship Fund are only offered for subscription and are held by a limited number of institutional/bank investors, and the Fund issues a shareholder report separate from the other series of the Trust, the factors considered by the Committee in evaluating the proposed renewal of an investment management agreement pertaining to the Capital Stewardship Fund, and the Sub-Advisory Agreement with Concinnity Advisors, LP, are addressed in a separate report of the Committee. Accordingly, references to the “Funds” should be understood as referring to all series of the Trust, excluding Capital Stewardship Fund. |
104 | THE GUGGENHEIM FUNDS ANNUAL REPORT | |
OTHER INFORMATION (Unaudited)(continued) |
Security Investors, LLC (“Security Investors”), an indirect subsidiary of Guggenheim Partners, LLC, a privately-held, global investment and advisory firm (“Guggenheim Partners”), serves as investment adviser to each of: (i) Alpha Opportunity Fund; (ii) High Yield Fund; (iii) Investment Grade Bond Fund; (iv) Large Cap Value Fund; (v) SMid Cap Value Fund; (vi) SMid Cap Value Institutional Fund; (vii) Municipal Income Fund; (viii) Small Cap Value Fund; (ix) StylePlus—Large Core Fund; (x) StylePlus—Mid Growth Fund; and (xi) World Equity Income Fund (collectively, the “SI-Advised Funds”). (Guggenheim Partners, Security Investors, Guggenheim Partners Investment Management, LLC (“GPIM”) and their affiliates may be referred to herein collectively as “Guggenheim.” Security Investors and GPIM are also known as “Guggenheim Investments,” the global asset management and investment advisory division of Guggenheim Partners that includes other affiliated investment management businesses.)
Under the terms of investment management agreements between Security Investors and the Trust, with respect to the SI-Advised Funds, Security Investors also is responsible for overseeing the activities of GPIM, an indirect subsidiary of Guggenheim Partners, with respect to its service as investment sub-adviser to Municipal Income Fund, pursuant to an investment sub-advisory agreement between Security Investors and GPIM (the “GPIM Sub-Advisory Agreement”).
GPIM serves as investment adviser with respect to each of: (i) Diversified Income Fund; (ii) Floating Rate Strategies Fund; (iii) Limited Duration Fund; (iv) Macro Opportunities Fund; (v) Market Neutral Real Estate Fund; (vi) Risk Managed Real Estate Fund; (vii) Total Return Bond Fund; and (viii) Ultra Short Duration Fund (collectively, the “GPIM-Advised Funds” and together with the SI-Advised Funds, the “Funds” and individually, a “Fund”).1 Under the supervision of the Board of Trustees of the Trust (the “Board,” with the members of the Board referred to individually as the “Trustees”), the Advisers regularly provide (or, as applicable, oversee the provision of) investment research, advice and supervision, along with a continuous investment program for the Funds, and direct the purchase and sale of securities and other investments for each Fund’s portfolio. GPIM also serves as investment adviser for the Capital Stewardship Fund, which is addressed in a separate report.2
Each of the Advisory Agreements continues in effect from year to year provided that such continuance is specifically approved at least annually by (i) the Board or a majority of the outstanding voting securities (as defined in the 1940 Act) of each Fund, and, in either event, (ii) the vote of a majority of the Trustees who are not “interested person[s],” as defined by the 1940 Act, of the Trust (the “Independent Trustees”) casting votes in person at a meeting called for such purpose. At meetings held in person on April 25, 2019 (the “April Meeting”) and on May 21, 2019 (the “May Meeting”), the members of the Contracts Review Committee of the Board (the “Committee”), consisting solely of the Independent Trustees, met separately from Guggenheim to consider the proposed renewal of the Agreements in connection with the Committee’s annual contract review schedule.
| | THE GUGGENHEIM FUNDS ANNUAL REPORT | 105 |
OTHER INFORMATION (Unaudited)(continued) |
As part of its review process, the Committee was represented by independent legal counsel to the Independent Trustees (“Independent Legal Counsel”), from whom the Independent Trustees received separate legal advice and with whom they met separately. Independent Legal Counsel reviewed and discussed with the Committee various key aspects of the Trustees’ legal responsibilities relating to the proposed renewal of the Agreements and other principal contracts. The Committee took into account various materials received from Guggenheim and Independent Legal Counsel. Recognizing that the evaluation process with respect to the services provided by Guggenheim is an ongoing one, the Committee also considered the variety of written materials, reports and oral presentations the Board receives throughout the year regarding performance and operating results of the Funds and other information relevant to its evaluation of the Agreements.
In connection with the contract review process, FUSE Research Network LLC (“FUSE”), an independent, third-party research provider, was engaged to prepare advisory contract renewal reports designed specifically to help the Board fulfill its advisory contract renewal responsibilities. The objective of the reports is to present the subject funds’ relative position regarding fees, expenses and total return performance, with peer group and universe comparisons. The Committee assessed the data provided in the FUSE reports as well as commentary presented by Guggenheim, including, among other things, a summary of notable distinctions between certain Funds and the applicable peer group identified in the FUSE reports and explanations for custom peer groups created for certain Funds that do not fit well into any particular category.
In addition, Guggenheim provided materials and data in response to formal requests for information sent by Independent Legal Counsel on behalf of the Independent Trustees. Guggenheim also made a presentation at the April Meeting. Throughout the process, the Committee asked questions of management and requested certain additional information, which Guggenheim provided (collectively with the foregoing reports and materials, the “Contract Review Materials”). The Committee considered the Contract Review Materials in the context of its accumulated experience governing the Trust and weighed the factors and standards discussed with Independent Legal Counsel.
Following an analysis and discussion of relevant factors, including those identified below, and in the exercise of its business judgment, the Committee concluded that it was in the best interest of each Fund to recommend that the Board approve the renewal of each of the Advisory Agreements and the GPIM Sub-Advisory Agreement for an additional annual term.
Advisory Agreements
Nature, Extent and Quality of Services Provided by each Adviser: With respect to the nature, extent and quality of services currently provided by each Adviser, the Committee considered the qualifications, experience and skills of key personnel performing services for the Funds, including those personnel providing compliance and risk oversight, as well as the supervisors and reporting lines for such personnel. The Committee considered Guggenheim’s
106 | THE GUGGENHEIM FUNDS ANNUAL REPORT | |
OTHER INFORMATION (Unaudited)(continued) |
resources and related efforts to retain, attract and motivate capable personnel to serve the Funds. In evaluating Guggenheim’s resources and capabilities, the Committee considered Guggenheim’s commitment to focusing on, and investing resources in support of, the Funds.
The Committee’s review of the services provided by Guggenheim to the Funds included consideration of Guggenheim’s investment processes and resulting performance, portfolio oversight and risk management, and the related regular quarterly reports and presentations received by the Board. The Committee took into account the risks borne by Guggenheim in sponsoring and providing services to the Funds, including entrepreneurial, legal and regulatory risks. The Committee considered the resources dedicated by Guggenheim to compliance functions and the reporting made to the Board by Guggenheim compliance personnel regarding Guggenheim’s adherence to regulatory requirements. The Committee also considered the regular reports the Board receives from the Trust’s Chief Compliance Officer regarding compliance policies and procedures established pursuant to Rule 38a-1 under the 1940 Act.
In connection with the Committee’s evaluation of the overall package of services provided by Guggenheim, the Committee considered Guggenheim’s administrative services, including its role in supervising, monitoring, coordinating and evaluating the various services provided by the fund administrator, transfer agent, distributor, custodian and other service providers to the Funds. The Committee evaluated the Office of Chief Financial Officer (the “OCFO”), established to oversee the fund administration, accounting and transfer agency services provided to the Funds, including the OCFO’s resources, personnel and services provided.
With respect to Municipal Income Fund, the Committee noted that, although Security Investors delegated responsibility for the investment and reinvestment of the Fund’s assets to the Sub-Adviser, as affiliated companies, both the Adviser and Sub-Adviser are part of the Guggenheim organization. Further, the Committee took into account Guggenheim’s explanation that investment advisory-related services are provided by many Guggenheim employees under different related legal entities and thus, the services provided by the Adviser on the one hand and the Sub-Adviser on the other, as well as the risks assumed by each party, cannot be ascribed to distinct legal entities.3 As a result, the Committee did not evaluate the services provided to Municipal Income Fund under the Advisory Agreement and the GPIM Sub-Advisory Agreement separately.
With respect to Guggenheim’s resources and the ability of each Adviser to carry out its responsibilities under the applicable Advisory Agreement, the Chief Financial Officer of Guggenheim Investments reviewed with the Committee financial information concerning the holding company for Guggenheim Investments, Guggenheim Partners Investment Management
3 | Consequently, except where the context indicates otherwise, references to “Adviser” or “Sub-Adviser” should be understood as referring to Guggenheim Investments generally and the services it provides under both Agreements. |
| | THE GUGGENHEIM FUNDS ANNUAL REPORT | 107 |
OTHER INFORMATION (Unaudited)(continued) |
Holdings, LLC (“GPIMH”), and the various entities comprising Guggenheim Investments, and provided the audited consolidated financial statements of GPIMH. (Thereafter, the Committee received the audited consolidated financial statements of GPIM.)
The Committee also considered the acceptability of the terms of each Advisory Agreement, including the scope of services required to be performed by each Adviser.
Based on the foregoing, and based on other information received (both oral and written) at the April Meeting and the May Meeting, as well as other considerations, including the Committee’s knowledge of how each Adviser performs its duties obtained through Board meetings, discussions and reports throughout the year, the Committee concluded that each Adviser and its personnel were qualified to serve the Funds in such capacity and may reasonably be expected to continue to provide a high quality of services under each Advisory Agreement with respect to the Funds.
Investment Performance: The Committee received, for each Fund, investment returns for the since-inception, ten-year, five-year, three-year, one-year and three-month periods ended December 31, 2018, as applicable. In addition, the Committee received a comparison of each Fund’s performance to the performance of a benchmark, a universe of funds and a narrower peer group of similar funds based on asset levels as identified by FUSE, in each case for the same periods, as applicable. The Committee also received from FUSE a description of the methodology for identifying each Fund’s peer group and universe for performance and expense comparisons.
In seeking to evaluate Fund performance over a full market cycle, the Committee focused its attention on five-year and three-year performance rankings as compared to the relevant universe of funds. The Committee considered more recent performance periods for those Funds that were recently launched, as well as in circumstances in which enhancements were being made to the portfolio management processes or techniques employed for a Fund. Except as to the individual Funds discussed below, the Committee observed that the returns of each Fund’s (other than SMid Cap Value Fund) Institutional Class shares and SMid Cap Value Fund’s Class A shares ranked in the third quartile or better of such Fund’s performance universe for each of the relevant periods considered.
In addition, the Committee made the following observations:
Municipal Income Fund: The returns of the Fund’s Institutional Class shares ranked in the 55th and 82nd percentiles of its performance universe for the five-year and three-year periods ended December 31, 2018, respectively. The Committee noted management’s explanation that the Fund’s increased allocation to floating rate securities in 2016 and the Fund’s more conservative investment approach detracted from performance that year, impacting trailing returns for five-year and three-year periods. In light of the foregoing, the Committee also considered the more recent one-year and three-month periods ended December 31, 2018, and observed that the returns of Fund’s Institutional Class shares ranked in the 30th and 11th percentiles, respectively, of its
108 | THE GUGGENHEIM FUNDS ANNUAL REPORT | |
OTHER INFORMATION (Unaudited)(continued) |
performance universe. The Committee also took into account management’s statement that it expects the Fund’s performance to continue to improve going forward as it anticipates the effects of recent tax reform and idiosyncratic risks.
Small Cap Value Fund: The returns of the Fund’s Institutional Class shares ranked in the 79th and 56th percentiles of its performance universe for the five-year and three-year periods ended December 31, 2018, respectively. The Committee noted measures taken by the Adviser to remedy longer-term relative underperformance with respect to the Value Funds strategy, including strategy enhancements such as implementation of a refined stock selection process and additional risk controls to enforce the strategy’s sell discipline. In light of the foregoing, the Committee also considered the more recent one-year and three-month periods ended December 31, 2018, and observed that the returns of Fund’s Institutional Class shares ranked in the 19th and 20th percentiles, respectively, of its performance universe.
After reviewing the foregoing and related factors, the Committee concluded that: (i) each Fund’s performance was acceptable; or (ii) it was satisfied with Guggenheim’s responses and efforts to improve investment performance.
Comparative Fees, Costs of Services Provided and the Profits Realized by each Adviser from Its Relationship with the Funds: The Committee compared each Fund’s contractual advisory fee, net effective management fee and total net expense ratio to the applicable peer group. The Committee also reviewed the median advisory fees and expense ratios, including expense ratio components (e.g., transfer agency fees, administration fees, other operating expenses, distribution fees and fee waivers/reimbursements), of the peer group of funds.
As part of its evaluation of each Fund’s advisory fee, the Committee considered how such fees compared to the advisory fee charged by the applicable Adviser to one or more other clients that it manages pursuant to similar investment strategies, to the extent applicable, noting that, in certain instances, Guggenheim charges a lower advisory fee to such other clients. In this connection, the Committee considered, among other things, Guggenheim’s representations about the significant differences between managing mutual funds as compared to other types of accounts. The Committee also considered Guggenheim’s explanation that lower fees are charged in certain instances due to various other factors, including the scope of contract, type of investors, fee structure, applicable legal, governance and capital structures, tax status and historical pricing reasons. In addition, the Committee took into account Guggenheim’s discussion of the entrepreneurial, legal and regulatory risks it faces when offering the Funds as compared to other types of accounts. The Committee concluded that the information it received demonstrated that the aggregate services provided to, or the specific circumstances of, each Fund were sufficiently
4 | The “net effective management fee” for each Fund represents the combined effective advisory fee and administration fee as a percentage of average net assets for the latest fiscal year, after any waivers and/or reimbursements, based on the Fund’s class level peer group percent rank, weighted by class level assets under management. |
| | THE GUGGENHEIM FUNDS ANNUAL REPORT | 109 |
OTHER INFORMATION (Unaudited)(continued) |
different from the services provided to, or the specific circumstances of, other clients with similar investment strategies and/or the risks borne by Guggenheim were sufficiently greater than those associated with managing other clients with similar investment strategies to support the difference in fees.
In further considering the comparative fee and expense data presented in the Contract Review Materials and addressed by Guggenheim, the Committee took into account those Funds with currently effective expense limitation agreements with the Adviser. Except as to the individual Funds discussed below, the Committee observed that each Fund’s average contractual advisory fee percentile rank across all share classes of the Fund, net effective management fee4 and asset-weighted total net expense ratio each rank in the third quartile or better of such Fund’s peer group.
In addition, the Committee made the following observations:
Diversified Income Fund: The average contractual advisory fee percentile rank across all share classes of the Fund is in the fourth quartile (78th percentile) of its peer group. The Fund’s net effective management fee ranks in the first quartile (1st percentile) of its peer group. The Committee considered that the Fund’s asset weighted total net expense ratio ranks in the second quartile (38th percentile) of its peer group. The Committee also took into account the Adviser’s statement that the Fund’s currently effective expense limitation agreement with the Adviser is intended to limit the impact of the Fund’s small size.
Floating Rate Strategies Fund: The average contractual advisory fee percentile rank across all share classes of the Fund is in the fourth quartile (92nd percentile) of its peer group. The Fund’s net effective management fee ranks in the fourth quartile (76th percentile) of its peer group. The Committee considered that the Fund’s asset weighted total net expense ratio ranks in the third quartile (58th percentile) of its peer group. The Committee also considered the Adviser’s statement explaining the higher fees that performance is driven by a unique investment approach that requires significant resources. In this regard, the Committee took into consideration the Fund’s strong investment performance for the five-year period ended December 31, 2018. In addition, the Committee noted the Adviser’s statement that the net effective management fee includes 0.08% in administration fees that is not paid to the Adviser. The Committee also took into account the Fund’s currently effective expense limitation agreement with the Adviser.
High Yield Fund: The average contractual advisory fee percentile rank across all share classes of the Fund is in the third quartile (54th percentile) of its peer group. The Fund’s net effective management fee ranks in the fourth quartile (76th percentile) of its peer group. The Fund’s asset weighted total net expense ratio ranks in the third quartile (73rd percentile) of its peer group. The Committee considered the Adviser’s statement explaining the higher fees that performance is driven by a unique investment approach that requires significant resources. In this regard, the Committee took into consideration the Fund’s strong investment performance for the five-year and three-year periods ended December 31, 2018. In addition, the Committee noted the Adviser’s
110 | THE GUGGENHEIM FUNDS ANNUAL REPORT | |
OTHER INFORMATION (Unaudited)(continued) |
statement that the net effective management fee includes 0.08% in administration fees that is not paid to the Adviser. The Committee also took into account the Fund’s currently effective expense limitation agreement with the Adviser.
Limited Duration Fund: The average contractual advisory fee percentile rank across all share classes of the Fund is in the third quartile (63rd percentile) of its peer group. The Fund’s net effective management fee ranks in the fourth quartile (80th percentile) of its peer group. The Committee considered that the Fund’s asset weighted total net expense ratio ranks in the third quartile (51st percentile) of its peer group. The Committee also considered the Adviser’s statement explaining the higher fees that performance is driven by a unique investment approach that requires significant resources. In this regard, the Committee took into consideration the Fund’s strong investment performance for the five-year and three-year periods ended December 31, 2018. In addition, the Committee noted the Adviser’s statement that the net effective management fee includes 0.08% in administration fees that is not paid to the Adviser. The Committee also took into account the Fund’s currently effective expense limitation agreement with the Adviser.
Macro Opportunities Fund: The average contractual advisory fee percentile rank across all share classes of the Fund, the Fund’s net effective management fee and the Fund’s asset weighted total net expense ratio each rank in the fourth quartile (93rd, 81st and 83rd percentiles, respectively) of its peer group. The Committee noted that the Fund is categorized as a non-traditional bond fund which seeks to add value by investing in many non-traditional securities outside of fixed income, including equities, currencies, commodities and derivatives. The Committee considered the Adviser’s statement explaining the higher fees and expenses that performance is driven by a unique investment approach that requires significant resources. In this regard, the Committee took into consideration the Fund’s strong investment performance for the five-year and three-year periods ended December 31, 2018. The Committee also took into account the Fund’s currently effective expense limitation agreement with the Adviser. The Committee also noted that, in connection with the contract review process, the Adviser formalized an existing expense waiver agreement with the Fund pursuant to which the Adviser waives any Fund expenses attributable to the Fund’s investment in Alpha Opportunity Fund.
SMid Cap Value Institutional Fund: The Fund’s contractual advisory fee ranks in the first quartile (7th percentile) of its peer group. The Fund’s net effective management fee and asset weighted total net expense ratio each rank in the fourth quartile (79th and 86th percentiles, respectively) of its peer group. The Committee considered the Adviser’s statement explaining the higher fees and expenses that it has made adjustments to the strategy of the Fund over the last few years incorporating a more systematic approach in order to improve investment performance. In this regard, the Committee took into consideration the Fund’s strong investment performance for the three-year period ended December 31, 2018. In addition, the Committee noted the Adviser’s statement that the net effective management fee includes 0.08% in administration fees that is not paid to the Adviser. The Committee also considered the Adviser’s statement that the Fund has
| | THE GUGGENHEIM FUNDS ANNUAL REPORT | 111 |
OTHER INFORMATION (Unaudited)(continued) |
continued to experience outflows resulting in lower relative assets to peers and associated higher other operating expenses, and that the Adviser is evaluating strategic measures to improve the Fund’s positioning.
Risk Managed Real Estate Fund: The average contractual advisory fee percentile rank across all share classes of the Fund is in the first quartile (22nd percentile) of its peer group. The Fund’s net effective management fee ranks in the fourth quartile (78th percentile) of its peer group. The Committee considered that the Fund’s asset weighted total net expense ratio ranks in the second quartile (47th percentile) of its peer group. The Committee took into consideration the Fund’s strong investment performance for the three-year and one-year periods ended December 31, 2018. The Committee also took into account the Fund’s currently effective expense limitation agreement with the Adviser.
StylePlus—Large Core Fund: The average contractual advisory fee percentile rank across all share classes of the Fund is in the third quartile (62nd percentile) of its peer group. The Fund’s net effective management fee ranks in the fourth quartile (86th percentile) of its peer group. The Committee considered that the Fund’s asset weighted total net expense ratio ranks in the third quartile (66th percentile) of its peer group. The Committee also considered the Adviser’s statement explaining the higher fees that performance is driven by a unique combination of passive and actively managed strategies. In this regard, the Committee took into consideration the Fund’s strong investment performance for the five-year and three-year periods ended December 31, 2018.
Total Return Bond Fund: The average contractual advisory fee percentile rank across all share classes of the Fund is in the third quartile (68th percentile) of its peer group. The Fund’s net effective management fee ranks in the fourth quartile (78th percentile) of its peer group. The Committee considered that the Fund’s asset weighted total net expense ratio ranks in the 50th percentile of its peer group. The Committee also considered the Adviser’s statement explaining the higher fees that performance is driven by a unique investment approach that requires significant resources. In this regard, the Committee took into consideration the Fund’s strong investment performance for the five-year and three-year periods ended December 31, 2018. In addition, the Committee noted the Adviser’s statement that the net effective management fee includes 0.08% in administration fees that is not paid to the Adviser. The Committee also took into account the Fund’s currently effective expense limitation agreement with the Adviser.
With respect to the costs of services provided and profits realized by Guggenheim Investments from its relationship with the Funds, the Committee reviewed a profitability analysis and data from management for each Fund setting forth the average assets under management for the twelve months ended December 31, 2018, gross revenues received by Guggenheim Investments, expenses allocated to the Fund, expense waivers (as applicable), earnings and the operating margin/profitability rate, including variance information relative to the foregoing amounts
112 | THE GUGGENHEIM FUNDS ANNUAL REPORT | |
OTHER INFORMATION (Unaudited)(continued) |
as of December 31, 2017. In addition, the Chief Financial Officer of Guggenheim Investments reviewed with, and addressed questions from, the Committee concerning the expense allocation methodology employed in producing the profitability analysis.
In the course of its review of Guggenheim Investments’ profitability, the Committee took into account the methods used by Guggenheim Investments to determine expenses and profit. The Committee considered all of the foregoing in evaluating the costs of services provided, the profitability to Guggenheim Investments and the profitability rates presented, and concluded that the profits were not unreasonable.
The Committee considered other benefits available to each Adviser because of its relationship with the Funds and noted Guggenheim’s statement that it does not believe the Advisers derive any such “fall-out” benefits. In this regard, the Committee noted Guggenheim’s statement that, although it does not consider such benefits to be fall-out benefits, the Advisers may benefit from marketing synergies arising from offering a broad spectrum of products, including the Funds.
Economies of Scale: The Committee received and considered information regarding whether there have been economies of scale with respect to the management of the Funds as Fund assets grow, whether the Funds have appropriately benefited from any economies of scale, and whether there is potential for realization of any further economies of scale. The Committee considered whether economies of scale in the provision of services to the Funds were being passed along to the shareholders. The Committee noted the Adviser’s statements, including that Guggenheim believes it is appropriately sharing potential economies of scale and that costs continue to increase in many key areas, including compensation of portfolio managers, key analysts and support staff, as well as for infrastructure needs, with respect to risk management oversight, valuation processes and disaster recovery systems, among other things, and that, in this regard, management’s costs for providing services have increased in recent years without regard to asset levels.
The Committee also noted the process employed by the Adviser to evaluate whether it would be appropriate to institute a new breakpoint for a Fund, with consideration given to, among other things: (i) the Fund’s size and trends in asset levels over recent years; (ii) the competitiveness of the expense levels; (iii) whether expense waivers are in place; (iv) changes and trends in revenue and expenses; (v) whether there are any anticipated expenditures that may benefit the Fund in the future; (vi) Fund profit level margins; (vii) relative Fund performance; (viii) the nature, extent and quality of services management provides to the Fund; and (ix) the complexity of the Fund’s investment strategy and the resources required to support the Fund.
As part of its assessment of economies of scale, the Committee also considered Guggenheim’s view that it seeks to share economies of scale through a number of means, including breakpoints, advisory fees set at competitive rates pre-assuming future asset growth, expense waivers and limitations, and investments in personnel, operations and infrastructure to support the Fund
| | THE GUGGENHEIM FUNDS ANNUAL REPORT | 113 |
OTHER INFORMATION (Unaudited)(continued) |
business. Thus, the Committee considered the size of the Funds and the competitiveness of and/or other determinations made regarding the current advisory fee for each Fund, as well as whether a Fund is subject to an expense limitation.
Based on the foregoing, the Committee determined that the advisory fee for each Fund was reasonable.
Sub-Advisory Agreement
Nature, Extent and Quality of Services Provided by the Sub-Adviser: As noted above, because both the Adviser and Sub-Adviser for Municipal Income Fund—Security Investors and GPIM, respectively—are part of and do business as Guggenheim Investments and the services provided by the Adviser on the one hand and the Sub-Adviser on the other cannot be ascribed to distinct legal entities, the Committee did not evaluate the services provided under the Advisory Agreement and Sub-Advisory Agreement separately. Therefore, the Committee considered the qualifications, experience and skills of the Fund’s portfolio management team in connection with the Committee’s evaluation of Guggenheim’s investment professionals under the applicable Advisory Agreement.
With respect to Guggenheim’s resources and the Sub-Adviser’s ability to carry out its responsibilities under the Sub-Advisory Agreement, as noted above, the Committee considered the financial condition of GPIMH and the various entities comprising Guggenheim Investments. (Thereafter, the Committee received the audited consolidated financial statements of GPIM.)
The Committee also considered the acceptability of the terms of the Sub-Advisory Agreement, including the scope of services required to be performed by the Sub-Adviser.
Investment Performance: The Committee considered the returns of the Fund under its evaluation of the Advisory Agreement.
Comparative Fees, Costs of Services Provided and the Profits Realized by the Sub-Adviser from Its Relationship with the Fund: The Committee considered that the Sub-Advisory Agreement is with an affiliate of the Adviser, that the Adviser compensates the Sub-Adviser from its own fees so that the sub-advisory fee rate for the Fund does not impact the fees paid by the Fund and that the Sub-Adviser’s revenues were included in the calculation of Guggenheim Investments’ profitability. Given its determination of the reasonableness of the advisory fee, the Committee concluded that the sub-advisory fee rate for the Fund was not unreasonable.
Economies of Scale: The Committee recognized that, because the Sub-Adviser’s fees are paid by the Adviser and not the Fund, the analysis of economies of scale was more appropriate in the context of the Committee’s consideration of the applicable Advisory Agreement, which was separately considered. (See “Advisory Agreements – Economies of Scale” above.)
114 | THE GUGGENHEIM FUNDS ANNUAL REPORT | |
OTHER INFORMATION (Unaudited)(concluded) |
Overall Conclusions
Based on the foregoing, the Committee determined that the investment advisory fees are fair and reasonable in light of the extent and quality of the services provided and other benefits received and that the continuation of each of the Agreements is in the best interest of each Fund. In reaching this conclusion, no single factor was determinative or conclusive and each Committee member, in the exercise of his business judgment, may afford different weights to different factors. At the May Meeting, the Committee, constituting all of the Independent Trustees, recommended the renewal of each Advisory Agreement and the Sub-Advisory Agreement for an additional annual term.
| | THE GUGGENHEIM FUNDS ANNUAL REPORT | 115 |
INFORMATION ON BOARD OF TRUSTEES AND OFFICERS (Unaudited) |
Name, Address*
and Year of Birth
of Trustees | Position(s)
Held with
the Trust | Term of Office
and Length of
Time Served** | Principal Occupation(s)
During Past 5 Years | Number of
Portfolios
in Fund
Complex
Overseen | Other Directorships
Held by Trustees |
INDEPENDENT TRUSTEES | | | |
Randall C. Barnes (1951) | Trustee | Since 2014 | Current: Private Investor (2001-present). Former: Senior Vice President and Treasurer, PepsiCo, Inc. (1993-1997); President, Pizza Hut International (1991-1993); Senior Vice President, Strategic Planning and New Business Development, PepsiCo, Inc. (1987-1990). | 158 | Current: Trustee, Purpose Investments Funds (2013-present). Former: Managed Duration Investment Grade Municipal Fund (2003-2016). |
Angela Brock-Kyle (1959) | Trustee | Since November 2019 | Current: Founder and Chief Executive Officer, B.O.A.R.D.S (consulting firm). Former: Senior Leader, TIAA (financial services firm) (1987-2012). | 157 | None. |
Donald A.
Chubb, Jr. (1946) | Trustee and Chairman of the Valuation Oversight Committee | Since 1994 | Current: Retired. Former: Business broker and manager of commercial real estate, Griffith & Blair, Inc. (1997-2017). | 157 | Former: Midland Care, Inc. (2011-2016). |
Jerry B. Farley (1946) | Trustee and Chairman of the Audit Committee | Since 2005 | Current: President, Washburn University (1997-present). | 157 | Current: CoreFirst Bank & Trust (2000-present). Former: Westar Energy, Inc. (2004-2018). |
116 | THE GUGGENHEIM FUNDS ANNUAL REPORT | |
INFORMATION ON BOARD OF TRUSTEES AND OFFICERS (Unaudited)(continued) |
Name, Address*
and Year of Birth
of Trustees | Position(s)
Held with
the Trust | Term of Office
and Length of
Time Served** | Principal Occupation(s)
During Past 5 Years | Number of
Portfolios
in Fund
Complex
Overseen | Other Directorships
Held by Trustees |
INDEPENDENT TRUSTEES - continued | | |
Roman
Friedrich III (1946) | Trustee and Chairman of the Contracts Review Committee | Since 2014 | Current: Founder and Managing Partner, Roman Friedrich & Company (1998-present). | 157 | Former: Zincore Metals, Inc. (2009-January 2019). |
Thomas F. Lydon, Jr. (1960) | Trustee | Since November 2019 | Current: President, Global Trends Investments (registered investment adviser) (1996-present). | 157 | Current: US Global Investors (GROW) (1995-present); and Harvest Volatility Edge Trust (3) (2017-present). |
Ronald A. Nyberg (1953) | Trustee and Chairman of the Nominating and Governance Committee | Since 2014 | Current: Partner, Momkus LLC (2016-present). Former: Partner, Nyberg & Cassioppi, LLC (2000-2016); Executive Vice President, General Counsel, and Corporate Secretary, Van Kampen Investments (1982-1999). | 158 | Current: PPM Funds (9) (2018-present); Edward-Elmhurst Healthcare System (2012-present); Western Asset Inflation-Linked Opportunities & Income Fund (2004-present); Western Asset Inflation-Linked Income Fund (2003-present). Former: Managed Duration Investment Grade Municipal Fund (2003-2016). |
| | THE GUGGENHEIM FUNDS ANNUAL REPORT | 117 |
INFORMATION ON BOARD OF TRUSTEES AND OFFICERS (Unaudited)(continued) |
Name, Address*
and Year of Birth
of Trustees | Position(s)
Held with
the Trust | Term of Office
and Length of
Time Served** | Principal Occupation(s)
During Past 5 Years | Number of
Portfolios
in Fund
Complex
Overseen | Other Directorships
Held by Trustees |
INDEPENDENT TRUSTEES - concluded | | |
Sandra G. Sponem (1958) | Trustee | Since November 2019 | Current: Retired. Former: Senior Vice President and Chief Financial Officer, M.A. Mortenson Companies, Inc. (general contracting firm) (2007-2017). | 157 | Current: SPDR Series Trust (78) (2018-present); SPDR Index Shares Funds (31) (2018-present); SSGA Active Trust (12) (2018-present); and SSGA Master Trust (1) (2018-present). |
Ronald E.
Toupin, Jr. (1958) | Trustee and Chairman of the Board | Since 2014 | Current: Portfolio Consultant (2010-present); Member, Governing Council, Independent Directors Council (2013-present); Governor, Board of Governors, Investment Company Institute (2018-present). Former: Member, Executive Committee, Independent Directors Council (2016-2018); Vice President, Manager and Portfolio Manager, Nuveen Asset Management (1998-1999); Vice President, Nuveen Investment Advisory Corp. (1992-1999); Vice President and Manager, Nuveen Unit Investment Trusts (1991-1999); and Assistant Vice President and Portfolio Manager, Nuveen Unit Investment Trusts (1988-1999), each of John Nuveen & Co., Inc. (1982-1999). | 157 | Current: Western Asset Inflation-Linked Opportunities & Income Fund (2004-present); Western Asset Inflation-Linked Income Fund (2003-present). Former: Managed Duration Investment Grade Municipal Fund (2003-2016). |
118 | THE GUGGENHEIM FUNDS ANNUAL REPORT | |
INFORMATION ON BOARD OF TRUSTEES AND OFFICERS (Unaudited)(continued) |
Name, Address*
and Year of Birth
of Trustees | Position(s)
Held with
the Trust | Term of Office
and Length of
Time Served** | Principal Occupation(s)
During Past 5 Years | Number of
Portfolios
in Fund
Complex
Overseen | Other Directorships
Held by Trustees |
INTERESTED TRUSTEE | |
Amy J. Lee*** (1961) | Trustee, Vice President and Chief Legal Officer | Since 2018 (Trustee) Since 2014 (Chief Legal Officer) Since 2007 (Vice President) | Current: Interested Trustee, certain other funds in the Fund Complex (2018-present); Chief Legal Officer, certain other funds in the Fund Complex (2014-present); Vice President, certain other funds in the Fund Complex (2007-present); Senior Managing Director, Guggenheim Investments (2012-present). Former: President and Chief Executive Officer (2017-2018); President, certain other funds in the Fund Complex (2017-November 2019); Vice President, Associate General Counsel and Assistant Secretary, Security Benefit Life Insurance Company and Security Benefit Corporation (2004-2012). | 157 | None. |
* | The business address of each Trustee is c/o Guggenheim Investments, 227 West Monroe Street, Chicago, Illinois 60606. |
** | Each Trustee serves an indefinite term, until his or her successor is elected and qualified. Time served includes time served in the respective position for the Predecessor Corporation. |
*** | This Trustee is deemed to be an “interested person” of the Fund under the 1940 Act by reason of her position with the Fund’s Investment Manager and/or the parent of the Investment Manager. |
| | THE GUGGENHEIM FUNDS ANNUAL REPORT | 119 |
INFORMATION ON BOARD OF TRUSTEES AND OFFICERS (Unaudited)(continued) |
Name, Address*
and Year of Birth | Position(s)
Held with
the Trust | Term of Office
and Length of
Time Served** | Principal Occupations
During Past 5 Years |
OFFICERS | | | |
Brian E. Binder (1972) | President and Chief Executive Officer | Since 2018 | Current: President and Chief Executive Officer, certain other funds in the Fund Complex (2018-present); President and Chief Executive Officer, Guggenheim Funds Investment Advisors, LLC and Security Investors, LLC (2018-present); Senior Managing Director and Chief Administrative Officer, Guggenheim Investments (2018-present). Former: Managing Director and President, Deutsche Funds, and Head of US Product, Trading and Fund Administration, Deutsche Asset Management (2013-2018); Managing Director, Head of Business Management and Consulting, Invesco Ltd. (2010-2012). |
James M. Howley (1972) | Assistant Treasurer | Since 2014 | Current: Managing Director, Guggenheim Investments (2004-present); Assistant Treasurer, certain other funds in the Fund Complex (2006-present). Former: Manager, Mutual Fund Administration of Van Kampen Investments, Inc. (1996-2004). |
Mark E. Mathiasen (1978) | Secretary | Since 2014 | Current: Secretary, certain other funds in the Fund Complex (2007-present); Managing Director, Guggenheim Investments (2007-present). |
Glenn McWhinnie (1969) | Assistant Treasurer | Since 2016 | Current: Vice President, Guggenheim Investments (2009-present); Assistant Treasurer, certain other funds in the Fund complex (2016-present). |
Michael P. Megaris (1984) | Assistant Secretary | Since 2014 | Current: Assistant Secretary, certain other funds in the Fund Complex (2014-present); Director, Guggenheim Investments (2012-present). |
Elisabeth Miller (1968) | Chief Compliance Officer | Since 2012 | Current: Chief Compliance Officer, certain other funds in the Fund Complex (2012-present); Senior Managing Director, Guggenheim Investments (2012-present); Vice President, Guggenheim Funds Distributors, LLC (2014-present). Former: Chief Compliance Officer, Security Investors, LLC and Guggenheim Funds Investment Advisors, LLC (2012-2018); Chief Compliance Officer, Guggenheim Distributors, LLC (2009-2014); Senior Manager, Security Investors, LLC (2004-2014); Senior Manager, Guggenheim Distributors, LLC (2004-2014). |
120 | THE GUGGENHEIM FUNDS ANNUAL REPORT | |
INFORMATION ON BOARD OF TRUSTEES AND OFFICERS (Unaudited)(continued) |
Name, Address*
and Year of Birth | Position(s)
Held with
the Trust | Term of Office
and Length of
Time Served** | Principal Occupations
During Past 5 Years |
OFFICERS - continued | |
Margaux Misantone (1978) | AML Officer | Since 2017 | Current: Chief Compliance Officer, Security Investors, LLC and Guggenheim Funds Investment Advisors, LLC (2018-present); AML Officer, Security Investors, LLC and certain other funds in the Fund Complex (2017-present); Managing Director, Guggenheim Investments (2015-present). Former: Assistant Chief Compliance Officer, Security Investors, LLC and Guggenheim Funds Investments Advisors, LLC (2015-2018). |
Adam J. Nelson (1979) | Assistant Treasurer | Since 2015 | Current: Vice President, Guggenheim Investments (2015-present); Assistant Treasurer, certain other funds in the Fund Complex (2015-present). Former: Assistant Vice President and Fund Administration Director, State Street Corporation (2013-2015); Fund Administration Assistant Director, State Street (2011-2013); Fund Administration Manager, State Street (2009-2011). |
Kimberly J. Scott (1974) | Assistant Treasurer | Since 2014 | Current: Director, Guggenheim Investments (2012-present); Assistant Treasurer, certain other funds in the Fund Complex (2012-present). Former: Financial Reporting Manager, Invesco, Ltd. (2010-2011); Vice President/Assistant Treasurer, Mutual Fund Administration for Van Kampen Investments, Inc./Morgan Stanley Investment Management (2009-2010); Manager of Mutual Fund Administration, Van Kampen Investments, Inc./Morgan Stanley Investment Management (2005-2009). |
Bryan Stone (1979) | Vice President | Since 2014 | Current: Vice President, certain other funds in the Fund Complex (2014-present); Managing Director, Guggenheim Investments (2013-present). Former: Senior Vice President, Neuberger Berman Group LLC (2009-2013); Vice President, Morgan Stanley (2002-2009). |
| | THE GUGGENHEIM FUNDS ANNUAL REPORT | 121 |
INFORMATION ON BOARD OF TRUSTEES AND OFFICERS (Unaudited)(concluded) |
Name, Address*
and Year of Birth | Position(s)
Held with
the Trust | Term of Office
and Length of
Time Served** | Principal Occupations
During Past 5 Years |
OFFICERS - concluded | |
John L. Sullivan (1955) | Chief Financial Officer, Chief Accounting Officer and Treasurer | Since 2014 | Current: Chief Financial Officer, Chief Accounting Officer and Treasurer, certain other funds in the Fund Complex (2010-present); Senior Managing Director, Guggenheim Investments (2010-present). Former: Managing Director and Chief Compliance Officer, each of the funds in the Van Kampen Investments fund complex (2004-2010); Managing Director and Head of Fund Accounting and Administration, Morgan Stanley Investment Management (2002-2004); Chief Financial Officer and Treasurer, Van Kampen Funds (1996-2004). |
Jon Szafran (1989) | Assistant Treasurer | Since 2017 | Current: Vice President, Guggenheim Investments (2017-present); Assistant Treasurer, certain other funds in the Fund Complex (2017-present). Former: Assistant Treasurer of Henderson Global Funds and Manager of US Fund Administration, Henderson Global Investors (North America) Inc. (“HGINA”), (2017); Senior Analyst of US Fund Administration, HGINA (2014-2017); Senior Associate of Fund Administration, Cortland Capital Market Services, LLC (2013-2014); Experienced Associate, PricewaterhouseCoopers LLP (2012-2013). |
* | The business address of each officer is c/o Guggenheim Investments, 227 West Monroe Street, Chicago, Illinois 60606. |
** | Each officer serves an indefinite term, until his or her successor is duly elected and qualified. |
122 | THE GUGGENHEIM FUNDS ANNUAL REPORT | |
GUGGENHEIM INVESTMENTS PRIVACY NOTICE (Unaudited) |
Who We Are
This Privacy Notice describes the data protection practices of Guggenheim Investments. Guggenheim Investments as used herein refers to the affiliated investment management businesses of Guggenheim Partners, LLC: Guggenheim Funds Investment Advisors, LLC, Guggenheim Partners Investment Management, LLC, Guggenheim Funds Distributors, LLC, Security Investors, LLC, Guggenheim Investment Advisors (Europe) Limited, Guggenheim Real Estate, LLC, GS Gamma Advisors, LLC, Guggenheim Partners India Management, LLC, Guggenheim Partners Europe Limited, as well as the funds in the Guggenheim Funds complex (the “Funds”) (“Guggenheim Investments,” “we,” “us,” or “our”).
Guggenheim Partners Investment Management Holdings, LLC, located at 330 Madison Avenue, New York, New York 10017 is the data controller for your information. The affiliates who are also controllers of certain of your information are: Guggenheim Investment Advisors (Europe) Limited, Guggenheim Partners Europe Limited, Guggenheim Partners, LLC, Guggenheim Funds Investment Advisors, LLC, Guggenheim Partners Investment Management, LLC, Guggenheim Funds Distributors, LLC and Security Investors, LLC, as well as the Funds.
Our Commitment to You
Guggenheim Investments considers your privacy our utmost concern. When you become our client or investor, you entrust us with not only your hard-earned money but also with your personal and financial information. Because we have access to your private information, we hold ourselves to the highest standards in its safekeeping and use. We strictly limit how we share your information with others, whether you are a current or former Guggenheim Investments client or investor.
The Information We Collect About You
We collect certain nonpublic personal information about you from information you provide on applications, other forms, our website, and/or from third parties including investment advisors. This information includes Social Security or other tax identification number, assets, income, tax information, retirement and estate plan information, transaction history, account balance, payment history, bank account information, marital status, family relationships, information that we collect on our website through the use of “cookies,” and other personal information that you or others provide to us. We may also collect such information through your inquiries by mail, e-mail or telephone. We may also collect customer due diligence information, as required by applicable law and regulation, through third party service providers.
How We Handle Your Personal Information
The legal basis for using your information as set out in this Privacy Notice is as follows: (a) use of your personal data is necessary to perform our obligations under any contract with you (such as a contract for us to provide financial services to you); or (b) where use of your personal data is not necessary for performance of a contract, use of your personal data is necessary for our
| | THE GUGGENHEIM FUNDS ANNUAL REPORT | 123 |
GUGGENHEIM INVESTMENTS PRIVACY NOTICE (Unaudited)(continued) |
legitimate interests or the legitimate interests of others (for example, to enforce the legal terms governing our services, operate and market our website and other services we offer, ensure safe environments for our personnel and others, make and receive payments, prevent fraud and to know the customer to whom we are providing the services). Some processing is done to comply with applicable law.
In addition to the specific uses described above, we also use your information in the following manner:
| | ● | We use your information in connection with servicing your accounts. |
| | ● | We use information to respond to your requests or questions. For example, we might use your information to respond to your customer feedback. |
| | ● | We use information to improve our products and services. We may use your information to make our website and products better. We may use your information to customize your experience with us. |
| | ● | We use information for security purposes. We may use your information to protect our company and our customers. |
| | ● | We use information to communicate with you. For example, we will communicate with you about your account or our relationship. We may contact you about your feedback. We might also contact you about this Privacy Notice. We may also enroll you in our email newsletter. |
| | ● | We use information as otherwise permitted by law, as we may notify you. |
| | ● | Aggregate/Anonymous Data. We may aggregate and/or anonymize any information collected through the website so that such information can no longer be linked to you or your device (“Aggregate/Anonymous Information”). We may use Aggregate/Anonymous Information for any purpose, including without limitation for research and marketing purposes, and may also share such data with any third parties, including advertisers, promotional partners, and sponsors. |
We do not sell information about current or former clients or their accounts to third parties. Nor do we share this information, except when necessary to complete transactions at your request, to make you aware of investment products and services that we or our affiliates offer, or as permitted or required by law.
We provide information about you to companies and individuals not affiliated with Guggenheim Investments to complete certain transactions or account changes, or to perform services for us related to your account. For example, if you ask to transfer assets from another financial institution to Guggenheim Investments, we must provide certain information about you to that company to complete the transaction. We provide the third party with only the information necessary to carry out its responsibilities and only for that purpose. And we require these third
124 | THE GUGGENHEIM FUNDS ANNUAL REPORT | |
GUGGENHEIM INVESTMENTS PRIVACY NOTICE (Unaudited)(continued) |
parties to treat your private information with the same high degree of confidentiality that we do. To alert you to other Guggenheim Investments products and services, we share your information within our family of affiliated companies. You may limit our sharing with affiliated companies as set out below. We may also share information with any successor to all or part of our business, or in connection with steps leading up to a merger or acquisition. For example, if part of our business was sold we may give customer information as part of that transaction. We may also share information about you with your consent.
We will release information about you if you direct us to do so, if we are compelled by law to do so, or in other circumstances as permitted by law (for example, to protect your account from fraud).
If you close your account(s) or become an inactive client or investor, we will continue to adhere to the privacy policies and practices described in this notice.
Opt-Out Provisions and Your Data Choices
The law allows you to “opt out” of certain kinds of information sharing with third parties. We do not share personal information about you with any third parties that triggers this opt-out right. This means YOU ARE ALREADY OPTED OUT.
When you are no longer our client or investor, we continue to share your information as described in this notice, and you may contact us at any time to limit our sharing by sending an email to CorporateDataPrivacy@GuggenheimPartners.com.
European Union Data Subjects and certain others: In addition to the choices set forth above, residents of the European Union and certain other jurisdictions have certain rights to (1) request access to or rectification or deletion of information we collect about them, (2) request a restriction on the processing of their information, (3) object to the processing of their information, or (4) request the portability of certain information. To exercise these or other rights, please contact us using the contact information below. We will consider all requests and provide our response within the time period stated by applicable law. Please note, however, that certain information may be exempt from such requests in some circumstances, which may include if we need to keep processing your information for our legitimate interests or to comply with a legal obligation. We may request you provide us with information necessary to confirm your identity before responding to your request.
Residents of France and certain other jurisdictions may also provide us with instructions regarding the manner in which we may continue to store, erase and share your information after your death, and where applicable, the person you have designated to exercise these rights after your death.
How We Protect Privacy Online
We take steps to protect your privacy when you use our web site – www.guggenheiminvestments.com – by using secure forms of online communication, including encryption technology, Secure Socket Layer (SSL) protocol, firewalls and user names and
| | THE GUGGENHEIM FUNDS ANNUAL REPORT | 125 |
GUGGENHEIM INVESTMENTS PRIVACY NOTICE (Unaudited)(concluded) |
passwords. These safeguards vary based on the sensitivity of the information that we collect and store. However, we cannot and do not guarantee that these measures will prevent every unauthorized attempt to access, use, or disclose your information since despite our efforts, no Internet and/or other electronic transmissions can be completely secure. Our web site uses “http cookies”—tiny pieces of information that we ask your browser to store. We use cookies for session management and security features on the Guggenheim Investments web site. We do not use them to pull data from your hard drive, to learn your e-mail address, or to view data in cookies created by other web sites. We will not share the information in our cookies or give others access to it. See the legal information area on our web site for more details about web site security and privacy features.
How We Safeguard Your Personal Information and Data Retention
We restrict access to nonpublic personal information about you to our employees and in some cases to third parties (for example, the service providers described above) as permitted by law. We maintain strict physical, electronic and procedural safeguards that comply with federal standards to guard your nonpublic personal information.
We keep your information for no longer than necessary for the purposes for which it is processed. The length of time for which we retain information depends on the purposes for which we collected and use it and/or as required to comply with applicable laws. Information may persist in copies made for backup and business continuity purposes for additional time.
International Visitors
If you are not a resident of the United States, please be aware that your information may be transferred to, stored and processed in the United States where our servers are located and our databases are operated. The data protection and other laws of the United States and other countries might not be as comprehensive as those in your country.
In such cases, we ensure that a legal basis for such a transfer exists and that adequate protection is provided as required by applicable law, for example, by using standard contractual clauses or by transferring your data to a jurisdiction that has obtained an adequacy finding. Individuals whose data may be transferred on the basis of standard contractual clauses may contact us as described below.
We’ll Keep You Informed
If you have any questions or concerns about how we treat your personal data, we encourage you to consult with us first. You may also contact the relevant supervisory authority.
We reserve the right to modify this policy at any time and will inform you promptly of material changes. You may access our privacy policy from our web site at www.guggenheiminvestments.com. Should you have any questions regarding our privacy policy, contact us by email at CorporateDataPrivacy@GuggenheimPartners.com.
126 | THE GUGGENHEIM FUNDS ANNUAL REPORT | |
This page intentionally left blank.
This page intentionally left blank.
This page intentionally left blank.
9.30.2019
Guggenheim Funds Annual Report
| |
Guggenheim Ultra Short Duration Fund | | |
Beginning on January 1, 2021, paper copies of the Fund’s annual and semi-annual shareholder reports may no longer be sent by mail, unless you specifically request paper copies of the reports from a Fund or from your financial intermediary. Instead, the reports will be made available on a website, and you will be notified by mail each time a report is posted and provided with a website link to access the report.
If you already elected to receive shareholder reports electronically, you will not be affected by this change and you need not take any action. At any time, you may elect to receive reports and other communications from a Fund electronically by calling 800.820.0888, going toGuggenheimInvestments.com/myaccount, or by contacting your financial intermediary.
You may elect to receive all future shareholder reports in paper free of charge. If you hold shares of a Fund directly, you can inform the Fund that you wish to receive paper copies of reports by calling 800.820.0888. If you hold shares of a Fund through a financial intermediary, please contact the financial intermediary to make this election. Your election to receive reports in paper will apply to all Guggenheim Funds in which you are invested and may apply to all funds held with your financial intermediary.
GuggenheimInvestments.com | USD-ANN-0919x0920 |

| | |
DEAR SHAREHOLDER | 2 |
ECONOMIC AND MARKET OVERVIEW | 4 |
ABOUT SHAREHOLDERS’ FUND EXPENSES | 7 |
ULTRA SHORT DURATION FUND | 10 |
NOTES TO FINANCIAL STATEMENTS | 41 |
REPORT OF INDEPENDENT REGISTERED PUBLIC ACCOUNTING FIRM | 62 |
OTHER INFORMATION | 64 |
INFORMATION ON BOARD OF TRUSTEES AND OFFICERS | 78 |
GUGGENHEIM INVESTMENTS PRIVACY NOTICE | 85 |
| | THE GUGGENHEIM FUNDS ANNUAL REPORT | 1 |
Dear Shareholder:
Guggenheim Partners Investment Management, LLC (the “Investment Adviser”) is pleased to present the shareholder report for Guggenheim Ultra Short Duration Fund (the “Fund”) for the annual fiscal period ended September 30, 2019.
The Investment Adviser is part of Guggenheim Investments, which represents the investment management businesses of Guggenheim Partners, LLC (“Guggenheim”), a global, diversified financial services firm.
Guggenheim Funds Distributors, LLC is the distributor of the Funds. Guggenheim Funds Distributors, LLC is affiliated with Guggenheim and the Investment Adviser.
We encourage you to read the Economic and Market Overview section of the report, which follows this letter, and then the Managers’ Commentary for the Fund.
We are committed to providing innovative investment solutions and appreciate the trust you place in us.
Sincerely,
Guggenheim Partners Investment Management, LLC
October 31, 2019
Read a prospectus and summary prospectus (if available) carefully before investing. It contains the investment objectives, risks, charges, expenses and other information, which should be considered carefully before investing. Obtain a prospectus and summary prospectus (if available) at guggenheiminvestments.com or call 800.820.0888.
This material is not intended as a recommendation or as investment advice of any kind, including in connection with rollovers, transfers, and distributions. Such material is not provided in a fiduciary capacity, may not be relied upon for or in connection with the making of investment decisions, and does not constitute a solicitation of an offer to buy or sell securities. All content has been provided for informational or educational purposes only and is not intended to be and should not be construed as legal or tax advice and/or a legal opinion. Always consult a financial, tax and/ or legal professional regarding your specific situation.
2 | THE GUGGENHEIM FUNDS ANNUAL REPORT | |
Ultra Short Duration Fund may not be suitable for all investors. The investments in fixed-income instruments are subject to the possibility that interest rates could rise, causing the value of the holdings and share price to decline. Investors in asset- backed securities, including collateralized loan obligations (CLOs) generally receive payments that are part interest and part return of principal. These payments may vary based on the rate loans are repaid. Some asset-backed securities may have structures that make their reaction to interest rates and other factors difficult to predict, making their prices volatile and they are subject to liquidity and valuation risk. CLOs bear similar risks to investing in loans directly. Investments in loans involve special types of risks, including credit, interest rate, counterparty, prepayment, liquidity, and valuation risks. Loans are often below investment grade, may be unrated, and typically offer a fixed or floating interest rate. High yield and unrated debt securities are at a greater risk of default than investment grade bonds and may be less liquid, which may increase volatility. The use of leverage, through borrowings or instruments such as derivatives, may cause the fund to be more volatile and riskier than if it had not been leveraged. The more a fund invests in leveraged instruments, the more the leverage will magnify any gains or losses on those investments. Foreign securities carry unique or additional risks when compared to U.S. securities, including currency fluctuations, adverse political and economic developments, unreliable or untimely information, less liquidity and more volatility, limited legal recourse and higher transactional costs, all of which are enhanced when investing in emerging markets. In addition, investments in emerging markets are subject to risks associated with trading in smaller markets, lower volumes of trading, and being subject to lower levels of government regulation and less extensive accounting, financial and other reporting requirements. Please read the prospectus for more detailed information regarding these and other risks.
| | THE GUGGENHEIM FUNDS ANNUAL REPORT | 3 |
ECONOMIC AND MARKET OVERVIEW(Unaudited) | September 30, 2019 |
Economic data has been mixed over the past few months. On the positive side, we saw a pickup in the housing market as measured by housing starts and home sales, which could be a delayed response to lower mortgage rates. Industrial production had the strongest month-over-month gain in a year, partially boosted by an increase in oil production in Hurricane Barry’s wake. The unemployment rate fell to a 50-year low of 3.5% in September 2019, despite a continued moderation in payroll gains.
On the negative side, the Institute for Supply Management (“ISM”) Manufacturing Index plunged to the weakest reading since June 2009. The ISM Non-Manufacturing Index also came in well below expectations, the lowest since August 2016. Within both the manufacturing and non-manufacturing ISM indexes, analysts look at the employment component of the survey for an early read on other labor market indicators. Here we find more cause for concern: The non-manufacturing survey’s employment component is now barely above 50 while the manufacturing employment sub-index stands at 46.3, well into contraction territory. Combined, the outlook for output and hiring has dimmed, signaling trouble ahead for consumers.
Retail sales have been steady, but Commerce Department data showed that total consumer spending on goods and services increased only 0.1% month-over-month in August 2019, the smallest gain in six months. It is hard to identify the primary reason why consumers may already be turning more conservative on spending. Income growth looks steady, the equity market is higher year-to-date, and rates are lower, all of which should be boosting consumer confidence. Sentiment surveys, however, show that fewer consumers believe now is a good time to buy homes, vehicles, and household durables, and headline consumer confidence measures have ticked down. We believe trade policy and political concerns are weighing on sentiment, and these headwinds are set to ramp up further. Additional U.S. tariffs on China are due to take effect on December 15, 2019, and the U.S. House of Representatives is pressing forward with its impeachment inquiry into President Trump.
Guggenheim’s dashboard of U.S. recession indicators continues to point to a recession beginning as early as the first half of 2020, and we think the economic data is corroborating this view. Two of the more notable indicators pointing to high recession risk are the three-month/10-year U.S. Treasury yield curve, which has been inverted for 16 consecutive weeks through period end, and the Leading Economic Indicators Index which has slowed from a year-over-year growth rate of 6.6% in September 2018 to 1.1% as of August 2019. The indicators Guggenheim tracks as part of our recession probability model indicate a nearly 50% chance that a recession will come before mid-2020, and a 70% chance that it will arrive by mid-2021.
Over the period, the U.S. Treasury curve continued its overall flattening trend, as the difference between the two-year U.S. Treasury and 10-year U.S. Treasury narrowed to 5 basis points. Equity markets remained volatile, buoyed by a 25 basis point cut in July and September 2019 by the U.S. Federal Reserve (the “Fed”) and relatively strong U.S. economic data, but weighed down by trade war uncertainty and fears of a global slowdown.
4 | THE GUGGENHEIM FUNDS ANNUAL REPORT | |
ECONOMIC AND MARKET OVERVIEW(Unaudited)(continued) | September 30, 2019 |
With downside risks growing, markets have become more sensitive to the Fed’s communications about the future stance of monetary policy. Despite the two rate cuts, Fed policymakers are deeply divided. It is still unclear whether the Fed will deliver the aggressive and preemptive policy action that would prolong the current expansion.
As it relates to risk-taking, we are not confident that the Fed would succeed in easing credit conditions if conditions were to tighten materially. The Fed may act too late, or its actions may have little impact given that low rates this year have largely failed to stimulate growth. With credit spreads still relatively tight on a historical basis, we believe it is prudent to remain up in quality as we await better opportunities to deploy capital in riskier credit sectors in the coming downturn.
For the 12-month period ended September 30, 2019, the Standard & Poor’s 500® (“S&P 500”) Index* returned 4.25%. The MSCI Europe-Australasia-Far East (“EAFE”) Index* returned -0.82%. The return of the MSCI Emerging Markets Index* was -1.63%.
In the bond market, the Bloomberg Barclays U.S. Aggregate Bond Index* posted a 10.30% return for the period, while the Bloomberg Barclays U.S. Corporate High Yield Index* returned 6.36%. The return of the ICE Bank of America (“BofA”) Merrill Lynch 3-Month U.S. Treasury Bill Index* was 2.39% for the 12-month period.
The opinions and forecasts expressed may not actually come to pass. This information is subject to change at any time, based on market and other conditions, and should not be construed as a recommendation of any specific security or strategy.
*Index Definitions
Indices are unmanaged and not available for direct investment. Index performance does not reflect transaction costs, fees, or expenses.
Bloomberg Barclays U.S. Aggregate Bond Index is a broad-based flagship benchmark that measures the investment grade, U.S. dollar-denominated, fixed-rate taxable bond market, including U.S. Treasuries, government-related and corporate securities, mortgage-backed securities or “MBS” (agency fixed-rate and hybrid adjustable-rate mortgage, or “ARM”, pass-throughs), asset-backed securities (“ABS”), and commercial mortgage-backed securities (“CMBS”) (agency and non-agency).
Bloomberg Barclays U.S. Corporate High Yield Index measures the U.S. dollar-denominated, high yield, fixed-rate corporate bond market. Securities are classified as high yield if the middle rating of Moody’s, Fitch, and S&P is Ba1/BB +/BB + or below.
Bloomberg Barclays 1-3 Month U.S. Treasury Bill Index includes all publicly issued zero-coupon U.S. Treasury Bills that have a remaining maturity of less than 3 months and more than 1 month, are rated investment grade, and have $250 million or more of outstanding face value. In addition, the securities must be denominated in U.S. dollars and must be fixed rate and nonconvertible. The 1-3 Month U.S. Treasury Bill Index is market capitalization weighted and the securities in the index are updated on the last business day of each month.
| | THE GUGGENHEIM FUNDS ANNUAL REPORT | 5 |
ECONOMIC AND MARKET OVERVIEW(Unaudited)(concluded) | September 30, 2019 |
ICE BofA Merrill Lynch 3-Month U.S. Treasury Bill Index is an unmanaged market Index of U.S. Treasury securities maturing in 90 days that assumes reinvestment of all income.
MSCI EAFE Index is a capitalization-weighted measure of stock markets in Europe, Australasia, and the Far East.
MSCI Emerging Markets Index is a free float-adjusted market capitalization-weighted index that is designed to measure equity market performance in the global emerging markets.
S&P 500®is a broad-based index, the performance of which is based on the performance of 500 widely held common stocks chosen for market size, liquidity, and industry group representation.
6 | THE GUGGENHEIM FUNDS ANNUAL REPORT | |
ABOUT SHAREHOLDERS’ FUND EXPENSES(Unaudited) |
All mutual funds have operating expenses, and it is important for our shareholders to understand the impact of costs on their investments. Shareholders of a fund incur two types of costs: (i) transaction costs, including sales charges (loads) on purchase payments, reinvested dividends, other distributions, and exchange fees, and (ii) ongoing costs, including management fees, administrative services, and shareholder reports, among others. These ongoing costs, or operating expenses, are deducted from a fund’s gross income and reduce the investment return of the fund.
A fund’s expenses are expressed as a percentage of its average net assets, which is known as the expense ratio. The following examples are intended to help investors understand the ongoing costs (in dollars) of investing in a fund and to compare these costs with the ongoing costs of investing in other mutual funds.
The examples are based on an investment of $1,000 made at the beginning of the period and held for the entire six-month period beginning March 31, 2019 and ending September 30, 2019.
The following tables illustrate the Fund’s costs in two ways:
Table 1. Based on actual Fund return:This section helps investors estimate the actual expenses paid over the period. The “Ending Account Value” shown is derived from the Fund’s actual return, and the fifth column shows the dollar amount that would have been paid by an investor who started with $1,000 in the Fund. Investors may use the information here, together with the amount invested, to estimate the expenses paid over the period. Simply divide the Fund’s account value by $1,000 (for example, an $8,600 account value divided by $1,000 = 8.6), then multiply the result by the number provided under the heading “Expenses Paid During Period.”
Table 2. Based on hypothetical 5% return:This section is intended to help investors compare a Fund’s cost with those of other mutual funds. The table provides information about hypothetical account values and hypothetical expenses based on the Fund’s actual expense ratio and an assumed rate of return of 5% per year before expenses, which is not the Fund’s actual return. The hypothetical account values and expenses may not be used to estimate the actual ending account balance or expenses paid during the period. The example is useful in making comparisons because the U.S. Securities and Exchange Commission (the “SEC”) requires all mutual funds to calculate expenses based on the 5% return. Investors can assess a Fund’s costs by comparing this hypothetical example with the hypothetical examples that appear in shareholder reports of other funds.
The calculations illustrated above assume no shares were bought or sold during the period. Actual costs may have been higher or lower, depending on the amount of investment and the timing of any purchases or redemptions.
| | THE GUGGENHEIM FUNDS ANNUAL REPORT | 7 |
ABOUT SHAREHOLDERS’ FUND EXPENSES(Unaudited)(continued) |
Please note that the expenses shown in the table are meant to highlight your ongoing costs only and do not reflect any transactional costs, such as sales charges (loads) on purchase payments, and contingent deferred sales charges (“CDSC”) on redemptions, if any. Therefore, the second table is useful in comparing ongoing costs only, and will not help you determine the relative total costs of owning different funds. In addition, if these transactional costs were included, your costs would have been higher.
More information about the Fund’s expenses, including annual expense ratios for periods up to five years (subject to the Fund’s inception date), can be found in the Financial Highlights section of this report. For additional information on operating expenses and other shareholder costs, please refer to the Fund’s prospectus.
8 | THE GUGGENHEIM FUNDS ANNUAL REPORT | |
ABOUT SHAREHOLDERS’ FUND EXPENSES(Unaudited)(concluded) |
| Expense
Ratio1 | Fund
Return | Beginning
Account Value
March 31,
2019 | Ending
Account Value
September 30,
2019 | Expenses
Paid During
Period2 |
Table 1. Based on actual Fund return3 |
Ultra Short Duration Fund |
A-Class | 0.58% | 1.27% | $ 1,000.00 | $ 1,012.70 | $ 2.93 |
Institutional Class | 0.34% | 1.30% | 1,000.00 | 1,013.00 | 1.72 |
|
Table 2. Based on hypothetical 5% return (before expenses) |
Ultra Short Duration Fund | | | | | |
A-Class | 0.58% | 5.00% | $ 1,000.00 | $ 1,022.16 | $ 2.94 |
Institutional Class | 0.34% | 5.00% | 1,000.00 | 1,023.36 | 1.72 |
1 | Annualized. |
2 | Expenses are equal to the Fund’s annualized expense ratio, net of any applicable fee waivers, multiplied by the average account value over the period, multiplied by 183/365 (to reflect the one-half year period). |
3 | Actual cumulative return at net asset value for the period March 31, 2019 to September 30, 2019. |
| | THE GUGGENHEIM FUNDS ANNUAL REPORT | 9 |
MANAGERS’ COMMENTARY(Unaudited) | September 30, 2019 |
To Our Shareholders
Guggenheim Ultra Short Duration Fund (the “Fund”) is managed by a team of seasoned professionals, including B. Scott Minerd, Chairman of Investments and Global Chief Investment Officer; Anne B. Walsh, Senior Managing Director and Chief Investment Officer, Fixed Income; Steven H. Brown, CFA, Senior Managing Director and Portfolio Manager; Adam J. Bloch, Managing Director and Portfolio Manager; and Kris Dorr, Managing Director and Portfolio Manager. In the following paragraphs, the investment team discusses the market environment and the Fund’s performance for the fiscal year ended September 30, 2019.
Effective November 30, 2018, Guggenheim Strategy Fund I was reorganized with and into the Guggenheim Ultra Short Duration Fund. For the fiscal year ended September 30, 2019, Guggenheim Ultra Short Duration Fund Institutional Class returned 2.37%, compared with the 2.33% return of its benchmark, the Bloomberg Barclays 1-3 Month U.S. Treasury Bill Index.
The trailing twelve-month period, ending September 30, 2019, faced bouts of uncertainty and volatility as trade tensions, global economic headwinds, shifts in monetary policy, and a corporate earnings slowdown jolted financial markets. From the start, the fourth quarter of 2018 raised concerns across global markets, causing risk-assets to decline as investors sought safety. The S&P 500, high yield, and bank loan indices were off -13.52%, -4.53%, and -3.08% in the fourth quarter, respectively, in line with our previously expressed concerns that spreads could widen. We entered the fourth quarter of 2018 defensively positioned, with limited below investment grade exposure, credit hedges in place, and healthy liquidity reserves all of which helped the fund generate a positive absolute return.
In response to the fourth quarter’s market upheaval, the U.S. Federal Reserve (the “Fed”) pivoted from its tightening policy stance and informed markets it would be patient in assessing further interest rate hikes. As 2019 progressed, the Fed recalibrated its approach to sustain the current economic expansion. In total, the Fed increased rates by a quarter of a percentage point one time in December 2018 but later decreased rates by a quarter of a percentage point in each July and September 2019. The Fed’s dovish turn and the low global interest-rate environment supported risk assets in 2019 as credit spreads generally tightened for the remainder of the period.
Our Macroeconomic and Investment Research continued to reinforce a heightened chance that the U.S. economy could be in the later stages of the current credit cycle. Elevated levels of corporate indebtedness combined with deteriorating macroeconomic metrics and relatively tight prevailing credit spreads informed us that investors were not being adequately compensated to take risk in credit. As a result, over the course of the past twelve months, we continued to proactively shift the portfolio to a more defensive stance. As spreads and yields grinded tighter we used the moves as opportunities to shift the portfolio up in credit quality, reduce spread duration, and maintain ample liquidity.
10 | THE GUGGENHEIM FUNDS ANNUAL REPORT | |
MANAGERS’ COMMENTARY(Unaudited)(concluded) | September 30, 2019 |
The Fund ended the fiscal year with its largest allocation in short maturity investment grade corporate bonds. Despite our longer-term view of the risks forming in the corporate bond market, we believed short-tenor corporate securities are a high-quality way to earn an attractive coupon. Given the short maturity profile of these instruments, we maintained a high conviction in the return of principal prior to any downturn in the credit markets.
The Fund’s allocation to structured credit, specifically collateralized loan obligations (“CLOs”) and commercial asset-backed securities (“ABS”), contributed positively to returns as these securities provided attractive and stable income. Moreover, the Fund’s allocation to Non-Agency residential mortgage-backed securities (“RMBS”) generated positive absolute return primarily from carry. Carry refers to the income received from portfolio investments over a defined period. Supportive housing fundamentals, a strong labor market, and shrinking outstanding supply of pre-crisis RMBS securities reinforced demand throughout the period.
The Fund employed foreign sovereign asset swaps which allowed the Fund to register additional yield in non-U.S. sovereign securities relative to maturity-equivalent U.S. government securities while hedging non-U.S. currency exposure. The enhanced carry contributed positively to total return.
The Fund maintained short-risk positions in Investment Grade credit default swaps to hedge Investment Grade corporate credit risks, given our long-term cautious outlook on the sector. As high-quality, short-term bonds posted gains, the hedge in the portfolio was a detractor.
The Fund may invest in certain of the underlying series of Guggenheim Strategy Funds Trust, including Guggenheim Strategy Fund II and Guggenheim Strategy Fund III, (collectively, the “Short Term Investment Vehicles”), each of which are open-end management investment companies managed by Guggenheim Investments. The Short Term Investment Vehicles, which launched on March 11, 2014, are offered as short term investment options only to mutual funds, trusts, and other accounts managed by Guggenheim Investments and/or its affiliates, and are not available to the public. Guggenheim Strategy Fund II and Guggenheim Strategy Fund III do not charge an investment management fee. For the one-year period ended September 30, 2019, investment in the Short Term Investment Vehicles benefited Fund performance.
Performance displayed represents past performance which is no guarantee of future results.
The opinions and forecast expressed may not actually come to pass. This information is subject to change at any time, based on market and other conditions, and should not be construed as a recommendation of any specific security or strategy.
| | THE GUGGENHEIM FUNDS ANNUAL REPORT | 11 |
PERFORMANCE REPORT AND FUND PROFILE(Unaudited) | September 30, 2019 |
ULTRA SHORT DURATION FUND
OBJECTIVE:Seeks a high level of income consistent with the preservation of capital.
Holdings Diversification (Market Exposure as % of Net Assets)
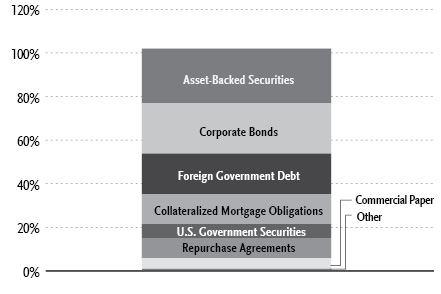
“Holdings Diversification (Market Exposure as % of Net Assets)”
Inception Dates: |
A-Class | November 30, 2018 |
Institutional Class | March 11, 2014 |
Ten Largest Holdings (% of Total Net Assets) |
Government of Japan, 10/21/19 | 3.2% |
U.S. Treasury Notes, 2.38% | 2.9% |
Capital One Multi-Asset Execution Trust, 1.99% | 2.8% |
Government of Japan, 01/10/20 | 2.1% |
Government of Japan, 0.10% | 1.8% |
Ocwen Master Advance Receivables Trust, 2.51% | 1.8% |
American Express Credit Account Master Trust, 2.67% | 1.2% |
State of Israel, 0.50% | 1.1% |
Federative Republic of Brazil, 07/01/20 | 1.1% |
Kingdom of Spain, 0.75% | 1.1% |
Top Ten Total | 19.1% |
| |
“Ten Largest Holdings” excludes any temporary cash or derivative investments. |
12 | THE GUGGENHEIM FUNDS ANNUAL REPORT | |
PERFORMANCE REPORT AND FUND PROFILE(Unaudited)(continued) | September 30, 2019 |
Cumulative Fund Performance*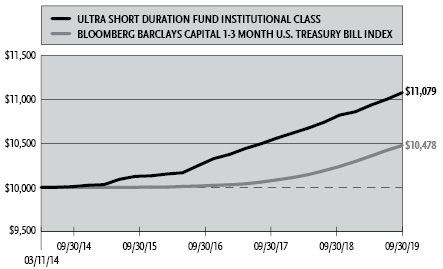
Average Annual Returns*
Periods Ended September 30, 2019
| 1 Year | 5 Year | Since
Inception
(03/11/14) |
Institutional Class Shares | 2.37% | 2.02% | 1.86% |
Bloomberg Barclays Capital 1-3 Month U.S. Treasury Bill Index | 2.33% | 0.94% | 0.84% |
| Since
Inception
(11/30/18)† |
A-Class Shares | 1.89% |
Bloomberg Barclays Capital 1-3 Month U.S. Treasury Bill Index | 1.96% |
* | The performance data above represents past performance that is not predictive of future results. The investment return and principal value of an investment in the Fund will fluctuate so that an investor’s shares, when redeemed, may be worth more or less than their original cost. Returns are historical and include changes in principal and reinvested dividends and capital gains and do not reflect the effect of taxes. The Bloomberg Barclays Capital 1-3 Month U.S. Treasury Bill Index is an unmanaged index and, unlike the Fund, has no management fees or operating expenses to reduce its reported return. The graph is based on Institutional Class shares only; performance for A-Class shares will vary due to differences in fee structure. Prior to November 30, 2018, performance for Institutional Class shares reflects the performance of the Guggenheim Strategy Fund I, which did not charge a management fee and was not publicly offered as a separate investment product. |
† | Return since commencement of operations is not annualized. |
| | THE GUGGENHEIM FUNDS ANNUAL REPORT | 13 |
PERFORMANCE REPORT AND FUND PROFILE(Unaudited)(concluded) | September 30, 2019 |
Portfolio Composition by Quality Rating1 |
Rating | | % of Total
Investments | |
Fixed Income Instruments | | | | |
AAA | | | 33.5 | % |
AA | | | 8.2 | % |
A | | | 24.2 | % |
BBB | | | 17.2 | % |
BB | | | 3.0 | % |
B | | | 0.7 | % |
NR2 | | | 3.8 | % |
Other Instruments | | | 9.4 | % |
Total Investments | | | 100.0 | % |
1 | Source: BlackRock Solutions. Credit quality ratings are measured on a scale that generally ranges from AAA (highest) to D (lowest). All securities except for those labeled “NR” have been rated by Moody’s, Standard & Poor’s (“S&P”), or Fitch, each of which is a Nationally Recognized Statistical Rating Organization (“NRSRO”). For purposes of this presentation, when ratings are available from more than one agency, the highest rating is used. Guggenheim Investments converts ratings to the equivalent S&P rating. Security ratings are determined at the time of purchase and may change thereafter. |
2 | NR securities do not necessarily indicate low credit quality. |
14 | THE GUGGENHEIM FUNDS ANNUAL REPORT | |
SCHEDULE OF INVESTMENTS | September 30, 2019 |
ULTRA SHORT DURATION FUND | |
| | Shares | | | Value | |
MONEY MARKET FUND† - 0.5% |
Dreyfus Treasury Securities Cash Management Fund — Institutional Shares 1.83%1 | | | 2,046,924 | | | $ | 2,046,924 | |
Total Money Market Fund | | | | | | | | |
(Cost $2,046,924) | | | | | | | 2,046,924 | |
| | | Face
Amount~ | | | | | |
ASSET-BACKED SECURITIES†† - 25.2% |
Collateralized Loan Obligations - 13.2% |
Halcyon Loan Advisors Funding Ltd. | | | | | | | | |
2017-3A, 3.20% (3 Month USD LIBOR + 0.90%, Rate Floor: 0.00%) due 10/18/272,3 | | | 4,650,000 | | | | 4,652,045 | |
Mountain View CLO Ltd. | | | | | | | | |
2018-1A, 3.10% (3 Month USD LIBOR + 0.80%, Rate Floor: 0.80%) due 10/15/262,3 | | | 4,558,633 | | | | 4,561,775 | |
Avery Point VI CLO Ltd. | | | | | | | | |
2018-6A, 3.34% (3 Month USD LIBOR + 1.05%, Rate Floor: 0.00%) due 08/05/272,3 | | | 3,600,000 | | | | 3,603,659 | |
OZLM XII Ltd. | | | | | | | | |
2018-12A, 3.32% (3 Month USD LIBOR + 1.05%, Rate Floor: 0.00%) due 04/30/272,3 | | | 3,600,000 | | | | 3,600,019 | |
West CLO Ltd. | | | | | | | | |
2017-1A, 3.22% (3 Month USD LIBOR + 0.92%, Rate Floor: 0.00%) due 07/18/262,3 | | | 3,521,943 | | | | 3,516,086 | |
MP CLO VIII Ltd. | | | | | | | | |
2018-2A, 3.17% (3 Month USD LIBOR + 0.91%, Rate Floor: 0.00%) due 10/28/272,3 | | | 3,450,000 | | | | 3,450,071 | |
Seneca Park CLO Limited | | | | | | | | |
2017-1A, 3.42% (3 Month USD LIBOR + 1.12%, Rate Floor: 0.00%) due 07/17/262,3 | | | 3,434,954 | | | | 3,441,994 | |
Figueroa CLO Ltd. | | | | | | | | |
2018-2A, 3.01% (3 Month USD LIBOR + 0.85%, Rate Floor: 0.85%) due 06/20/272,3 | | | 3,394,717 | | | | 3,382,551 | |
California Street CLO IX, LP | | | | | | | | |
2019-9A, 9.28% (3 Month USD LIBOR + 0.70%, Rate Floor: 0.00%) due 07/16/322,3 | | | 3,000,000 | | | | 3,000,897 | |
Palmer Square Loan Funding Ltd. | | | | | | | | |
2018-4A, 3.06% (3 Month USD LIBOR + 0.90%, Rate Floor: 0.00%) due 11/15/262,3 | | | 1,655,654 | | | | 1,655,054 | |
2019-3A, 3.17% (3 Month USD LIBOR + 0.85%, Rate Floor: 0.85%) due 08/20/272,3 | | | 1,000,000 | | | | 999,050 | |
Crown Point CLO III Ltd. | | | | | | | | |
2017-3A, 3.21% (3 Month USD LIBOR + 0.91%, Rate Floor: 0.00%) due 12/31/272,3 | | | 2,300,000 | | | | 2,300,924 | |
SEE NOTES TO FINANCIAL STATEMENTS. | THE GUGGENHEIM FUNDS ANNUAL REPORT | 15 |
SCHEDULE OF INVESTMENTS(continued) | September 30, 2019 |
ULTRA SHORT DURATION FUND | |
| | Face
Amount~ | | | Value | |
NewStar Clarendon Fund CLO LLC | | | | | | | | |
2019-1A, 3.58% (3 Month USD LIBOR + 1.30%, Rate Floor: 0.00%) due 01/25/272,3 | | | 2,250,000 | | | $ | 2,247,767 | |
Mountain Hawk II CLO Ltd. | | | | | | | | |
2018-2A, 3.88% (3 Month USD LIBOR + 1.60%, Rate Floor: 0.00%) due 07/20/242,3 | | | 2,000,000 | | | | 2,000,276 | |
KVK CLO Ltd. | | | | | | | | |
2017-1A, 3.20% (3 Month USD LIBOR + 0.90%, Rate Floor: 0.00%) due 01/14/282,3 | | | 1,800,000 | | | | 1,793,710 | |
Fortress Credit Opportunities XI CLO Ltd. | | | | | | | | |
2018-11A, 3.60% (3 Month USD LIBOR + 1.30%, Rate Floor: 0.00%) due 04/15/312,3 | | | 1,800,000 | | | | 1,773,235 | |
BlueMountain CLO XXV Ltd. | | | | | | | | |
2019-25A, 2.94% (3 Month USD LIBOR + 0.65%, Rate Floor: 0.65%) due 07/15/322,3 | | | 1,750,000 | | | | 1,750,831 | |
Garrison BSL CLO Ltd. | | | | | | | | |
2018-1A, 3.25% (3 Month USD LIBOR + 0.95%, Rate Floor: 0.00%) due 07/17/282,3 | | | 1,750,000 | | | | 1,750,148 | |
Midocean Credit CLO V | | | | | | | | |
2018-5A, 3.90% (3 Month USD LIBOR + 1.60%, Rate Floor: 0.00%) due 07/19/282,3 | | | 1,750,000 | | | | 1,729,454 | |
THL Credit Wind River CLO Ltd. | | | | | | | | |
2019-1A, 3.18% (3 Month USD LIBOR + 0.88%, Rate Floor: 0.00%) due 01/15/262,3 | | | 1,500,000 | | | | 1,500,339 | |
Voya CLO Ltd. | | | | | | | | |
2019-2A, 2.90% (3 Month USD LIBOR + 0.65%, Rate Floor: 0.65%) due 07/20/322,3 | | | 1,500,000 | | | | 1,500,178 | |
Fortress Credit Opportunities IX CLO Ltd. | | | | | | | | |
2017-9A, 3.71% (3 Month USD LIBOR + 1.55%, Rate Floor: 0.00%) due 11/15/292,3 | | | 1,457,000 | | | | 1,448,250 | |
Marathon CLO V Ltd. | | | | | | | | |
2017-5A, 3.02% (3 Month USD LIBOR + 0.87%, Rate Floor: 0.00%) due 11/21/272,3 | | | 1,021,117 | | | | 1,017,076 | |
BDS | | | | | | | | |
2018-FL2, 2.97% (1 Month USD LIBOR + 0.95%, Rate Floor: 0.95%) due 08/15/352,3 | | | 971,114 | | | | 968,861 | |
Staniford Street CLO Ltd. | | | | | | | | |
2017-1A, 3.30% (3 Month USD LIBOR + 1.18%, Rate Floor: 0.00%) due 06/15/252,3 | | | 778,346 | | | | 778,034 | |
16 | THE GUGGENHEIM FUNDS ANNUAL REPORT | SEE NOTES TO FINANCIAL STATEMENTS. |
SCHEDULE OF INVESTMENTS(continued) | September 30, 2019 |
ULTRA SHORT DURATION FUND | |
| | Face
Amount~ | | | Value | |
GPMT Ltd. | | | | | | | | |
2018-FL1, 2.94% (1 Month USD LIBOR + 0.90%, Rate Floor: 0.90%) due 11/21/352,3 | | | 767,906 | | | $ | 767,466 | |
VMC Finance LLC | | | | | | | | |
2018-FL1, 2.84% (1 Month USD LIBOR + 0.82%, Rate Floor: 0.82%) due 03/15/352,3 | | | 568,533 | | | | 565,402 | |
Venture XVI CLO Ltd. | | | | | | | | |
2018-16A, 3.15% (3 Month USD LIBOR + 0.85%, Rate Floor: 0.85%) due 01/15/282,3 | | | 400,000 | | | | 398,605 | |
Total Collateralized Loan Obligations | | | 60,153,757 | |
| | | | | | | | | |
Credit Card - 4.7% |
Capital One Multi-Asset Execution Trust | | | | | | | | |
2017-A4, 1.99% due 07/17/23 | | | 12,750,000 | | | | 12,752,951 | |
American Express Credit Account Master Trust | | | | | | | | |
2018-1, 2.67% due 10/17/22 | | | 5,650,000 | | | | 5,664,480 | |
Chase Issuance Trust | | | | | | | | |
2015-A4, 1.84% due 04/15/22 | | | 3,100,000 | | | | 3,096,675 | |
Total Credit Card | | | | | | | 21,514,106 | |
| | | | | | | | | |
Financial - 3.4% |
Station Place Securitization Trust | | | | | | | | |
2019-8, 2.64% (1 Month USD LIBOR + 0.60%, Rate Floor: 0.60%) due 03/24/202,3 | | | 3,100,000 | | | | 3,100,000 | |
2019-5, 2.74% (1 Month USD LIBOR + 0.70%, Rate Floor: 0.70%) due 06/24/20†††,2,3 | | | 3,050,000 | | | | 3,050,000 | |
2019-6, 2.64% (1 Month USD LIBOR + 0.60%, Rate Floor: 0.60%) due 07/24/21†††,2,3 | | | 1,850,000 | | | | 1,850,000 | |
2019-WL1, 2.67% (1 Month USD LIBOR + 0.65%, Rate Floor: 0.65%) due 08/25/522,3 | | | 1,000,000 | | | | 1,001,013 | |
2019-2, 2.59% (1 Month USD LIBOR + 0.55%, Rate Floor: 0.55%) due 04/24/212,3 | | | 900,000 | | | | 900,521 | |
2019-9, 2.74% (1 Month USD LIBOR + 0.70%, Rate Floor: 0.00%) due 10/24/202,3 | | | 600,000 | | | | 600,000 | |
Barclays Bank plc | | | | | | | | |
GMTn, 2.62% (1 Month USD LIBOR + 0.60%) due 06/02/202,3 | | | 2,150,000 | | | | 2,145,441 | |
GMTN, 2.86% due 10/31/19 | | | 2,050,000 | | | | 2,050,296 | |
Madison Avenue Securitization Trust | | | | | | | | |
due 11/01/203 | | | 700,000 | | | | 700,000 | |
Total Financial | | | | | | | 15,397,271 | |
| | | | | | | | | |
Automotive - 2.6% |
Hertz Vehicle Financing II, LP | | | | | | | | |
2015-1A, 2.73% due 03/25/212 | | | 4,650,000 | | | | 4,656,528 | |
Avis Budget Rental Car Funding AESOP LLC | | | | | | | | |
2015-1A, 2.50% due 07/20/212 | | | 4,650,000 | | | | 4,653,534 | |
Carmax Auto Owner Trust | | | | | | | | |
2019-3, 2.26% due 08/17/20 | | | 2,423,143 | | | | 2,422,928 | |
Total Automotive | | | | | | | 11,732,990 | |
| | | | | | | | | |
Transport-Container - 0.9% |
Global SC Finance II SRL | | | | | | | | |
2014-1A, 3.19% due 07/17/292 | | | 3,141,667 | | | | 3,141,218 | |
SEE NOTES TO FINANCIAL STATEMENTS. | THE GUGGENHEIM FUNDS ANNUAL REPORT | 17 |
SCHEDULE OF INVESTMENTS(continued) | September 30, 2019 |
ULTRA SHORT DURATION FUND | |
| | Face
Amount~ | | | Value | |
Cronos Containers Program Ltd. | | | | | | | | |
2013-1A, 3.08% due 04/18/282 | | | 1,087,542 | | | $ | 1,086,660 | |
Total Transport-Container | | | | | | | 4,227,878 | |
| | | | | | | | | |
Transport-Aircraft - 0.4% |
AIM Aviation Finance Ltd. | | | | | | | | |
2015-1A, 4.21% due 02/15/402 | | | 975,249 | | | | 986,458 | |
Raspro Trust | | | | | | | | |
2005-1A, 3.20% (3 Month USD LIBOR + 0.93%, Rate Floor: 0.93%) due 03/23/242,3 | | | 607,578 | | | | 599,500 | |
Total Transport-Aircraft | | | | | | | 1,585,958 | |
Total Asset-Backed Securities | | | | |
(Cost $114,644,513) | | | | | | | 114,611,960 | |
| | | | | | | | | |
CORPORATE BONDS†† - 23.0% |
Financial - 11.4% |
Wells Fargo & Co. | | | | | | | | |
3.11% (3 Month USD LIBOR + 0.93%) due 02/11/223 | | | 2,800,000 | | | | 2,817,146 | |
HSBC Holdings plc | | | | | | | | |
2.72% (3 Month USD LIBOR + 0.60%) due 05/18/213 | | | 2,600,000 | | | | 2,602,677 | |
Lloyds Bank plc | | | | | | | | |
2.70% (3 Month USD LIBOR + 0.49%) due 05/07/213 | | | 2,600,000 | | | | 2,599,735 | |
Citigroup, Inc. | | | | | | | | |
3.13% (3 Month USD LIBOR + 0.79%) due 01/10/203 | | | 2,300,000 | | | | 2,302,873 | |
3.48% (3 Month USD LIBOR + 1.38%) due 03/30/213 | | | 250,000 | | | | 253,731 | |
BNZ International Funding Ltd. | | | | | | | | |
2.85% (3 Month USD LIBOR + 0.70%) due 02/21/202,3 | | | 2,550,000 | | | | 2,556,203 | |
UBS Group Funding Switzerland AG | | | | | | | | |
4.08% (3 Month USD LIBOR + 1.78%, Rate Floor: 0.00%) due 04/14/212,3 | | | 1,400,000 | | | | 1,429,241 | |
3.57% (3 Month USD LIBOR + 1.44%) due 09/24/202,3 | | | 1,100,000 | | | | 1,114,463 | |
Capital One Financial Corp. | | | | | | | | |
2.72% (3 Month USD LIBOR + 0.45%) due 10/30/203 | | | 2,535,000 | | | | 2,538,960 | |
Huntington National Bank | | | | | | | | |
2.64% (3 Month USD LIBOR + 0.51%) due 03/10/203 | | | 2,525,000 | | | | 2,529,120 | |
Citizens Bank North America/Providence RI | | | | | | | | |
2.68% (3 Month USD LIBOR + 0.54%) due 03/02/203 | | | 2,525,000 | | | | 2,527,827 | |
Credit Agricole S.A. | | | | | | | | |
3.10% (3 Month USD LIBOR + 0.97%) due 06/10/202,3 | | | 2,495,000 | | | | 2,508,848 | |
Goldman Sachs Group, Inc. | | | | | | | | |
2.83% (3 Month USD LIBOR + 0.73%) due 12/27/203 | | | 1,400,000 | | | | 1,401,356 | |
3.90% (3 Month USD LIBOR + 1.77%) due 02/25/213 | | | 1,050,000 | | | | 1,070,326 | |
Sumitomo Mitsui Trust Bank Ltd. | | | | | | | | |
3.21% (3 Month USD LIBOR + 0.91%) due 10/18/192,3 | | | 2,375,000 | | | | 2,376,269 | |
18 | THE GUGGENHEIM FUNDS ANNUAL REPORT | SEE NOTES TO FINANCIAL STATEMENTS. |
SCHEDULE OF INVESTMENTS(continued) | September 30, 2019 |
ULTRA SHORT DURATION FUND | |
| | Face
Amount~ | | | Value | |
Svenska Handelsbanken AB | | | | | | | | |
2.60% (3 Month USD LIBOR + 0.47%) due 05/24/213 | | | 2,250,000 | | | $ | 2,257,817 | |
American Express Co. | | | | | | | | |
2.65% (3 Month USD LIBOR + 0.53%) due 05/17/213 | | | 2,150,000 | | | | 2,155,595 | |
AvalonBay Communities, Inc. | | | | | | | | |
2.73% (3 Month USD LIBOR + 0.43%) due 01/15/213 | | | 2,050,000 | | | | 2,048,866 | |
Synchrony Financial | | | | | | | | |
3.52% (3 Month USD LIBOR + 1.23%) due 02/03/203 | | | 1,800,000 | | | | 1,803,862 | |
Sumitomo Mitsui Financial Group, Inc. | | | | | | | | |
3.78% (3 Month USD LIBOR + 1.68%) due 03/09/213 | | | 1,350,000 | | | | 1,374,529 | |
Mitsubishi UFJ Financial Group, Inc. | | | | | | | | |
4.02% (3 Month USD LIBOR + 1.88%) due 03/01/213 | | | 1,234,000 | | | | 1,259,862 | |
Discover Bank | | | | | | | | |
3.10% due 06/04/20 | | | 1,100,000 | | | | 1,105,949 | |
AerCap Ireland Capital DAC / AerCap Global Aviation Trust | | | | | | | | |
4.25% due 07/01/20 | | | 900,000 | | | | 912,364 | |
4.63% due 10/30/20 | | | 150,000 | | | | 153,552 | |
AXIS Specialty Finance LLC | | | | | | | | |
5.88% due 06/01/20 | | | 1,000,000 | | | | 1,023,321 | |
Santander UK plc | | | | | | | | |
2.76% (3 Month USD LIBOR + 0.62%) due 06/01/213 | | | 980,000 | | | | 980,895 | |
Standard Chartered Bank | | | | | | | | |
2.69% (3 Month USD LIBOR + 0.40%) due 08/04/203 | | | 920,000 | | | | 921,304 | |
Credit Suisse AG NY | | | | | | | | |
2.66% (3 Month USD LIBOR + 0.40%) due 07/31/203 | | | 920,000 | | | | 920,750 | |
UBS AG | | | | | | | | |
2.68% (3 Month USD LIBOR + 0.58%, Rate Floor: 0.00%) due 06/08/202,3 | | | 870,000 | | | | 872,333 | |
JPMorgan Chase & Co. | | | | | | | | |
2.40% due 06/07/21 | | | 775,000 | | | | 778,685 | |
ANZ New Zealand Int’l Ltd. | | | | | | | | |
2.85% due 08/06/202 | | | 600,000 | | | | 604,208 | |
Morgan Stanley | | | | | | | | |
5.50% due 07/24/20 | | | 555,000 | | | | 569,953 | |
Essex Portfolio, LP | | | | | | | | |
5.20% due 03/15/21 | | | 300,000 | | | | 310,393 | |
Australia & New Zealand Banking Group Ltd. | | | | | | | | |
3.13% (3 Month USD LIBOR + 0.99%) due 06/01/212,3 | | | 300,000 | | | | 303,385 | |
Swedbank AB | | | | | | | | |
2.65% due 03/10/212 | | | 300,000 | | | | 301,017 | |
Credit Suisse Group Funding Guernsey Ltd. | | | | | | | | |
2.75% due 03/26/20 | | | 250,000 | | | | 250,668 | |
American Tower Corp. | | | | | | | | |
2.80% due 06/01/20 | | | 230,000 | | | | 230,876 | |
Assurant, Inc. | | | | | | | | |
3.36% (3 Month USD LIBOR + 1.25%) due 03/26/213 | | | 194,000 | | | | 194,017 | |
Total Financial | | | | | | | 51,962,976 | |
| | | | | | | | | |
Consumer, Non-cyclical - 4.6% |
Allergan Funding SCS | | | | | | | | |
3.39% (3 Month USD LIBOR + 1.26%) due 03/12/203 | | | 2,650,000 | | | | 2,660,525 | |
SEE NOTES TO FINANCIAL STATEMENTS. | THE GUGGENHEIM FUNDS ANNUAL REPORT | 19 |
SCHEDULE OF INVESTMENTS(continued) | September 30, 2019 |
ULTRA SHORT DURATION FUND | |
| | Face
Amount~ | | | Value | |
Express Scripts Holding Co. | | | | | | | | |
2.87% (3 Month USD LIBOR + 0.75%) due 11/30/203 | | | 2,530,000 | | | $ | 2,530,205 | |
Zimmer Biomet Holdings, Inc. | | | | | | | | |
2.91% (3 Month USD LIBOR + 0.75%) due 03/19/213 | | | 1,400,000 | | | | 1,400,025 | |
2.70% due 04/01/20 | | | 1,070,000 | | | | 1,071,826 | |
General Mills, Inc. | | | | | | | | |
2.86% (3 Month USD LIBOR + 0.54%) due 04/16/213 | | | 2,450,000 | | | | 2,455,563 | |
Bayer US Finance II LLC | | | | | | | | |
2.74% (3 Month USD LIBOR + 0.63%) due 06/25/212,3 | | | 1,700,000 | | | | 1,698,047 | |
CVS Health Corp. | | | | | | | | |
2.82% (3 Month USD LIBOR + 0.72%) due 03/09/213 | | | 1,050,000 | | | | 1,055,064 | |
2.73% (3 Month USD LIBOR + 0.63%) due 03/09/203 | | | 115,000 | | | | 115,227 | |
Constellation Brands, Inc. | | | | | | | | |
2.25% due 11/06/20 | | | 1,050,000 | | | | 1,050,334 | |
Mondelez International, Inc. | | | | | | | | |
3.00% due 05/07/20 | | | 1,040,000 | | | | 1,045,323 | |
Quest Diagnostics, Inc. | | | | | | | | |
2.50% due 03/30/20 | | | 1,030,000 | | | | 1,031,024 | |
Molson Coors Brewing Co. | | | | | | | | |
2.25% due 03/15/20 | | | 1,025,000 | | | | 1,024,374 | |
Conagra Brands, Inc. | | | | | | | | |
3.03% (3 Month USD LIBOR + 0.75%) due 10/22/203 | | | 1,000,000 | | | | 1,000,204 | |
Bayer US Finance LLC | | | | | | | | |
2.38% due 10/08/192 | | | 1,000,000 | | | | 999,992 | |
Coca-Cola Femsa SAB de CV | | | | | | | | |
4.63% due 02/15/20 | | | 950,000 | | | | 957,222 | |
Keurig Dr Pepper, Inc. | | | | | | | | |
3.55% due 05/25/21 | | | 500,000 | | | | 510,687 | |
Zoetis, Inc. | | | | | | | | |
3.45% due 11/13/20 | | | 230,000 | | | | 232,972 | |
Biogen, Inc. | | | | | | | | |
2.90% due 09/15/20 | | | 100,000 | | | | 100,721 | |
Total Consumer, Non-cyclical | | | | | | | 20,939,335 | |
| | | | | | | | | |
Industrial - 1.8% |
Siemens Financieringsmaatschappij N.V. | | | | | | | | |
2.73% (3 Month USD LIBOR + 0.61%) due 03/16/222,3 | | | 1,870,000 | | | | 1,885,614 | |
Aviation Capital Group LLC | | | | | | | | |
2.88% due 01/20/222 | | | 1,200,000 | | | | 1,204,856 | |
Rolls-Royce plc | | | | | | | | |
2.38% due 10/14/202 | | | 1,000,000 | | | | 1,001,122 | |
L3Harris Technologies, Inc. | | | | | | | | |
2.70% due 04/27/20 | | | 930,000 | | | | 931,861 | |
Molex Electronic Technologies LLC | | | | | | | | |
2.88% due 04/15/202 | | | 900,000 | | | | 901,453 | |
Northrop Grumman Corp. | | | | | | | | |
2.08% due 10/15/20 | | | 550,000 | | | | 550,185 | |
3.50% due 03/15/21 | | | 250,000 | | | | 254,623 | |
Textron, Inc. | | | | | | | | |
2.73% (3 Month USD LIBOR + 0.55%) due 11/10/203 | | | 600,000 | | | | 599,729 | |
Ryder System, Inc. | | | | | | | | |
2.50% due 05/11/20 | | | 540,000 | | | | 540,928 | |
Penske Truck Leasing Company Lp / PTL Finance Corp. | | | | | | | | |
3.05% due 01/09/202 | | | 320,000 | | | | 320,385 | |
Ingersoll-Rand Luxembourg Finance S.A. | | | | | | | | |
2.63% due 05/01/20 | | | 170,000 | | | | 170,310 | |
20 | THE GUGGENHEIM FUNDS ANNUAL REPORT | SEE NOTES TO FINANCIAL STATEMENTS. |
SCHEDULE OF INVESTMENTS(continued) | September 30, 2019 |
ULTRA SHORT DURATION FUND | |
| | Face
Amount~ | | | Value | |
GATX Corp. | | | | | | | | |
2.60% due 03/30/20 | | | 70,000 | | | $ | 70,066 | |
Total Industrial | | | | | | | 8,431,132 | |
| | | | | | | | | |
Energy - 1.8% |
Equities Corp. | | | | | | | | |
2.87% (3 Month USD LIBOR + 0.77%) due 10/01/203 | | | 2,200,000 | | | | 2,194,992 | |
Sabine Pass Liquefaction LLC | | | | | | | | |
5.63% due 02/01/21 | | | 1,025,000 | | | | 1,058,739 | |
Florida Gas Transmission Company LLC | | | | | | | | |
5.45% due 07/15/202 | | | 980,000 | | | | 1,002,619 | |
Energy Transfer Operating, LP | | | | | | | | |
7.50% due 10/15/20 | | | 900,000 | | | | 945,806 | |
Reliance Holding USA, Inc. | | | | | | | | |
4.50% due 10/19/202 | | | 900,000 | | | | 917,433 | |
Marathon Petroleum Corp. | | | | | | | | |
3.40% due 12/15/20 | | | 885,000 | | | | 894,769 | |
Occidental Petroleum Corp. | | | | | | | | |
2.60% due 08/13/21 | | | 850,000 | | | | 855,536 | |
Phillips 66 | | | | | | | | |
2.73% (3 Month USD LIBOR + 0.60%) due 02/26/213 | | | 350,000 | | | | 350,016 | |
Total Energy | | | | | | | 8,219,910 | |
| | | | | | | | | |
Technology - 1.3% |
Fiserv, Inc. | | | | | | | | |
2.70% due 06/01/20 | | | 1,100,000 | | | | 1,102,931 | |
International Business Machines Corp. | | | | | | | | |
2.80% due 05/13/21 | | | 1,050,000 | | | | 1,064,060 | |
Analog Devices, Inc. | | | | | | | | |
2.95% due 01/12/21 | | | 1,000,000 | | | | 1,007,502 | |
Fidelity National Information Services, Inc. | | | | | | | | |
3.63% due 10/15/20 | | | 900,000 | | | | 912,000 | |
CA, Inc. | | | | | | | | |
5.38% due 12/01/19 | | | 900,000 | | | | 904,320 | |
Broadcom Corporation / Broadcom Cayman Finance Ltd. | | | | | | | | |
2.38% due 01/15/20 | | | 900,000 | | | | 899,943 | |
Total Technology | | | | | | | 5,890,756 | |
| | | | | | | | | |
Consumer, Cyclical - 0.6% |
Marriott International, Inc. | | | | | | | | |
2.74% (3 Month USD LIBOR + 0.60%) due 12/01/203 | | | 1,000,000 | | | | 1,003,225 | |
Starbucks Corp. | | | | | | | | |
2.10% due 02/04/21 | | | 1,000,000 | | | | 1,000,942 | |
McDonald’s Corp. | | | | | | | | |
3.50% due 07/15/20 | | | 700,000 | | | | 708,039 | |
Total Consumer, Cyclical | | | | | | | 2,712,206 | |
| | | | | | | | | |
Communications - 0.6% |
Deutsche Telekom International Finance BV | | | | | | | | |
2.88% (3 Month USD LIBOR + 0.58%) due 01/17/202,3 | | | 2,515,000 | | | | 2,517,989 | |
Telefonica Emisiones S.A. | | | | | | | | |
5.13% due 04/27/20 | | | 75,000 | | | | 76,200 | |
Total Communications | | | | | | | 2,594,189 | |
| | | | | | | | | |
Utilities - 0.6% |
Ameren Corp. | | | | | | | | |
2.70% due 11/15/20 | | | 1,000,000 | | | | 1,005,230 | |
NextEra Energy Capital Holdings, Inc. | | | | | | | | |
2.55% (3 Month USD LIBOR + 0.45%) due 09/28/203 | | | 1,000,000 | | | | 1,000,425 | |
Southern Power Co. | | | | | | | | |
2.38% due 06/01/20 | | | 400,000 | | | | 400,344 | |
PSEG Power LLC | | | | | | | | |
5.13% due 04/15/20 | | | 130,000 | | | | 131,972 | |
Total Utilities | | | | | | | 2,537,971 | |
| | | | | | | | | |
SEE NOTES TO FINANCIAL STATEMENTS. | THE GUGGENHEIM FUNDS ANNUAL REPORT | 21 |
SCHEDULE OF INVESTMENTS(continued) | September 30, 2019 |
ULTRA SHORT DURATION FUND | |
| | Face
Amount~ | | | Value | |
Basic Materials - 0.3% |
Newmont Goldcorp Corp. | | | | | | | | |
5.13% due 10/01/19 | | | 900,000 | | | $ | 900,000 | |
Georgia-Pacific LLC | | | | | | | | |
5.40% due 11/01/202 | | | 400,000 | | | | 413,767 | |
Total Basic Materials | | | | | | | 1,313,767 | |
Total Corporate Bonds | | | | | | | | |
(Cost $104,350,505) | | | | | | | 104,602,242 | |
| | | | | | | | | |
FOREIGN GOVERNMENT DEBT†† - 18.6% |
Government of Japan | | | | | | | | |
due 10/21/195 | | | JPY 1,548,700,000 | | | | 14,326,033 | |
due 01/10/205 | | | JPY 1,027,200,000 | | | | 9,507,562 | |
0.10% due 07/01/21 | | | JPY 893,000,000 | | | | 8,319,424 | |
due 01/20/205 | | | JPY 536,000,000 | | | | 4,961,515 | |
0.10% due 06/01/20 | | | JPY 402,300,000 | | | | 3,731,039 | |
0.10% due 09/01/20 | | | JPY 373,000,000 | | | | 3,463,271 | |
0.10% due 06/20/20 | | | JPY 152,000,000 | | | | 1,409,928 | |
0.10% due 04/15/20 | | | JPY 131,700,000 | | | | 1,220,800 | |
0.10% due 03/20/20 | | | JPY 37,000,000 | | | | 342,861 | |
2.40% due 03/20/20 | | | JPY 15,000,000 | | | | 140,476 | |
2.20% due 06/22/20 | | | JPY 6,100,000 | | | | 57,440 | |
1.30% due 03/20/20 | | | JPY 6,000,000 | | | | 55,908 | |
State of Israel | | | | | | | | |
0.50% due 01/31/21 | | | ILS 18,000,000 | | | | 5,202,874 | |
1.00% due 04/30/21 | | | ILS 12,120,000 | | | | 3,532,493 | |
5.00% due 01/31/20 | | | ILS 9,600,000 | | | | 2,805,225 | |
5.50% due 01/31/22 | | | ILS 3,710,000 | | | | 1,197,108 | |
Federative Republic of Brazil | | | | | | | | |
due 07/01/205 | | | BRL 22,160,000 | | | | 5,154,544 | |
due 07/01/215 | | | BRL 19,000,000 | | | | 4,186,876 | |
due 01/01/205 | | | BRL 9,690,000 | | | | 2,305,406 | |
Kingdom of Spain | | | | | | | | |
0.75% due 07/30/21 | | | EUR 4,590,000 | | | | 5,119,461 | |
4.00% due 04/30/20 | | | EUR 2,950,000 | | | | 3,299,356 | |
due 01/17/205 | | | EUR 1,490,000 | | | | 1,626,752 | |
Republic of Portugal | | | | | | | | |
due 01/17/205 | | | EUR 1,410,000 | | | | 1,539,311 | |
4.80% due 06/15/20 | | | EUR 890,000 | | | | 1,006,660 | |
Total Foreign Government Debt | | | | |
(Cost $85,298,832) | | | | | | | 84,512,323 | |
| | | | | | | | | |
COLLATERALIZED MORTGAGE OBLIGATIONS†† - 13.8% |
Residential Mortgage Backed Securities - 11.4% |
Ocwen Master Advance Receivables Trust | | | | | | | | |
2019-T1, 2.51% due 08/15/502 | | | 8,200,000 | | | | 8,220,287 | |
CSMC Series | | | | | | | | |
2014-7R, 2.30% (WAC) due 10/27/362,3 | | | 3,612,952 | | | | 3,590,348 | |
2014-2R, 2.35% (1 Month USD LIBOR + 0.20%, Rate Floor: 0.20%) due 02/27/462,3 | | | 3,229,587 | | | | 3,139,259 | |
Deephaven Residential Mortgage Trust | | | | | | | | |
2019-3A, 2.96% (WAC) due 07/25/592,3 | | | 4,065,790 | | | | 4,083,832 | |
Towd Point Mortgage Trust | | | | | | | | |
2018-2, 3.25% (WAC) due 03/25/582,3 | | | 1,420,866 | | | | 1,446,844 | |
2017-6, 2.75% (WAC) due 10/25/572,3 | | | 1,315,487 | | | | 1,328,029 | |
2017-5, 2.62% (1 Month USD LIBOR + 0.60%, Rate Floor: 0.00%) due 02/25/572,3 | | | 811,859 | | | | 808,737 | |
CIM Trust | | | | | | | | |
2018-R4, 4.07% (WAC) due 12/26/572,3 | | | 3,155,272 | | | | 3,192,894 | |
Soundview Home Loan Trust | | | | | | | | |
2006-OPT5, 2.16% (1 Month USD LIBOR + 0.14%, Rate Floor: 0.14%) due 07/25/363 | | | 3,123,816 | | | | 3,045,697 | |
New Residential Advance Receivables Trust Advance Receivables Backed | | | | | | | | |
2019-T3, 2.51% due 10/20/522 | | | 2,550,000 | | | | 2,555,403 | |
22 | THE GUGGENHEIM FUNDS ANNUAL REPORT | SEE NOTES TO FINANCIAL STATEMENTS. |
SCHEDULE OF INVESTMENTS(continued) | September 30, 2019 |
ULTRA SHORT DURATION FUND | |
| | Face
Amount~ | | | Value | |
Morgan Stanley ABS Capital I Incorporated Trust | | | | | | | | |
2006-NC1, 2.40% (1 Month USD LIBOR + 0.38%, Rate Floor: 0.38%) due 12/25/353 | | | 2,550,000 | | | $ | 2,528,375 | |
CIT Mortgage Loan Trust | | | | | | | | |
2007-1, 3.37% (1 Month USD LIBOR + 1.35%, Rate Floor: 1.35%) due 10/25/372,3 | | | 2,392,480 | | | | 2,419,080 | |
Accredited Mortgage Loan Trust | | | | | | | | |
2006-2, 2.28% (1 Month USD LIBOR + 0.26%, Rate Floor: 0.26%) due 09/25/363 | | | 2,429,757 | | | | 2,389,247 | |
New Residential Mortgage Loan Trust | | | | | | | | |
2018-2A, 3.50% (WAC) due 02/25/582,3 | | | 1,913,697 | | | | 1,952,102 | |
Ameriquest Mortgage Securities Incorporated Asset-Backed Pass-Through Ctfs Series | | | | | | | | |
2005-R10, 2.45% (1 Month USD LIBOR + 0.43%, Rate Floor: 0.43%) due 01/25/363 | | | 1,500,000 | | | | 1,503,061 | |
BRAVO Residential Funding Trust | | | | | | | | |
2019-NQM1, 2.67% (WAC) due 07/25/592,3 | | | 1,425,328 | | | | 1,427,223 | |
NRPL Trust | | | | | | | | |
2019-3, 3.00% (WAC) due 06/01/592,3 | | | 1,250,000 | | | | 1,246,263 | |
Banc of America Funding Trust | | | | | | | | |
2015-R2, 2.28% (1 Month USD LIBOR + 0.26%, Rate Floor: 0.26%) due 04/29/372,3 | | | 1,200,000 | | | | 1,179,949 | |
COLT Mortgage Loan Trust | | | | | | | | |
2018-3, 3.69% (WAC) due 10/26/482,3 | | | 714,058 | | | | 718,696 | |
2018-2, 3.47% (WAC) due 07/27/482,3 | | | 417,840 | | | | 419,267 | |
Homeward Opportunities Fund I Trust | | | | | | | | |
2019-2, 2.70% (WAC) due 09/25/592,3 | | | 970,813 | | | | 969,567 | |
Starwood Mortgage Residential Trust | | | | | | | | |
2019-1, 2.94% (WAC) due 06/25/492,3 | | | 956,232 | | | | 958,216 | |
Citigroup Mortgage Loan Trust | | | | | | | | |
2019-IMC1, 2.72% (WAC) due 07/25/492,3 | | | 959,430 | | | | 958,018 | |
Freddie Mac STACR Trust | | | | | | | | |
2019-DNA3, 2.75% (1 Month USD LIBOR + 0.73%, Rate Floor: 0.00%) due 07/25/492,3 | | | 833,635 | | | | 833,943 | |
GE-WMC Asset-Backed Pass-Through Certificates Series | | | | | | | | |
2005-2, 2.27% (1 Month USD LIBOR + 0.25%, Rate Floor: 0.25%) due 12/25/353 | | | 589,371 | | | | 585,793 | |
Cascade Funding Mortgage Trust | | | | | | | | |
2019-RM3, 2.80% (WAC) due 06/25/692,3 | | | 500,000 | | | | 506,172 | |
Total Residential Mortgage Backed Securities | | | 52,006,302 | |
| | | | | | | | | |
Commercial Mortgage Backed Securities - 2.4% |
Morgan Stanley Capital I Trust | | | | | | | | |
2018-H3, 1.00% (WAC) due 07/15/513,6 | | | 46,728,884 | | | | 2,703,257 | |
SEE NOTES TO FINANCIAL STATEMENTS. | THE GUGGENHEIM FUNDS ANNUAL REPORT | 23 |
SCHEDULE OF INVESTMENTS(continued) | September 30, 2019 |
ULTRA SHORT DURATION FUND | |
| | Face
Amount~ | | | Value | |
Americold LLC Trust | | | | | | | | |
2010-ARTA, 7.44% due 01/14/292 | | | 2,524,000 | | | $ | 2,627,421 | |
GRACE Mortgage Trust | | | | | | | | |
2014-GRCE, 3.37% due 06/10/282 | | | 2,000,000 | | | | 2,030,618 | |
Citigroup Commercial Mortgage Trust | | | | | | | | |
2019-GC41, 1.19% (WAC) due 08/10/563,6 | | | 24,996,357 | | | | 2,020,480 | |
CGBAM Mezzanine Securities Trust | | | | | | | | |
2015-SMMZ, 8.21% due 04/10/282 | | | 1,400,000 | | | | 1,423,169 | |
Total Commercial Mortgage Backed Securities | | | 10,804,945 | |
Total Collateralized Mortgage Obligations | | | | |
(Cost $62,383,471) | | | | | | | 62,811,247 | |
| | | | | | | | | |
U.S. GOVERNMENT SECURITIES†† - 6.4% |
U.S. Treasury Notes | | | | | | | | |
2.38% due 02/29/24 | | | 12,897,000 | | | | 13,342,853 | |
3.38% due 11/15/19 | | | 4,900,000 | | | | 4,907,763 | |
1.75% due 11/30/19 | | | 2,775,000 | | | | 2,773,585 | |
1.50% due 10/31/19 | | | 2,220,000 | | | | 2,218,912 | |
1.50% due 11/30/19 | | | 1,630,000 | | | | 1,628,508 | |
U.S. Treasury Inflation Protected Securities | | | | | | | | |
1.38% due 01/15/207 | | | 4,254,466 | | | | 4,241,504 | |
Total U.S. Government Securities | | | | |
(Cost $29,180,690) | | | | | | | 29,113,125 | |
| | | | | | | | | |
MUNICIPAL BONDS†† - 0.0% |
Colorado - 0.0% |
State of Colorado Certificate Of Participation | | | | | | | | |
4.86% due 03/15/20 | | | 25,000 | | | | 25,338 | |
| | | | | | | | | |
Texas - 0.0% |
Lindale Independent School District General Obligation Unlimited | | | | | | | | |
6.16% due 02/15/20 | | | 10,000 | | | | 10,155 | |
Total Municipal Bonds | | | | | | | | |
(Cost $35,419) | | | | | | | 35,493 | |
| | | | | | | | | |
REPURCHASE AGREEMENTS††,8 - 9.1% |
J.P. Morgan Securities LLC | | | | | | | | |
issued 09/30/19 at 2.35%
due 10/01/19 | | | 5,084,000 | | | | 5,084,000 | |
issued 09/24/19 at 3.00%
due 10/01/19 | | | 4,000,000 | | | | 4,000,000 | |
issued 09/25/19 at 3.00%
due 10/01/19 | | | 3,000,000 | | | | 3,000,000 | |
issued 09/27/19 at 2.50%
due 10/01/19 | | | 1,985,000 | | | | 1,985,000 | |
issued 09/30/19 at 2.37%
due 10/01/19 | | | 1,519,000 | | | | 1,519,000 | |
BNP Paribas | | | | | | | | |
issued 08/01/19 at 2.47%
due 11/01/19 | | | 6,050,000 | | | | 6,050,000 | |
issued 08/09/19 at 2.47%
due 11/01/19 | | | 750,000 | | | | 750,000 | |
issued 09/16/19 at 2.33%
due 12/16/19 | | | 200,000 | | | | 200,000 | |
Societe Generale | | | | | | | | |
issued 07/09/19 at 2.74% (3 Month USD LIBOR + 0.40%)
due 04/07/203 | | | 2,659,200 | | | | 2,659,200 | |
issued 09/10/19 at 2.54% (3 Month USD LIBOR + 0.40%)
due 04/07/203 | | | 2,250,000 | | | | 2,250,000 | |
24 | THE GUGGENHEIM FUNDS ANNUAL REPORT | SEE NOTES TO FINANCIAL STATEMENTS. |
SCHEDULE OF INVESTMENTS(continued) | September 30, 2019 |
ULTRA SHORT DURATION FUND | |
| | Face
Amount~ | | | Value | |
issued 07/26/19 at 2.66% (3 Month USD LIBOR + 0.40%)
due 04/07/203 | | | 1,650,000 | | | $ | 1,650,000 | |
BofA Securities, Inc. | | | | | | | | |
issued 09/25/19 at 2.80%
due 10/01/19 | | | 5,800,000 | | | | 5,800,000 | |
Barclays Capital Inc. | | | | | | | | |
issued 09/05/19 at 2.27% (1 Month USD LIBOR + 0.25%)
due 11/04/193 | | | 3,221,874 | | | | 3,221,874 | |
Deutsche Bank | | | | | | | | |
issued 08/06/19 at 2.62%
due 11/06/19 | | | 3,216,000 | | | | 3,216,000 | |
Total Repurchase Agreements | | | | |
(Cost $41,385,074) | | | | | | | 41,385,074 | |
| | | | | | | | | |
COMMERCIAL PAPER†† - 5.3% |
Spire, Inc. | | | | | | | | |
2.27% due 10/10/192,4 | | | 4,700,000 | | | | 4,697,333 | |
Marriott International, Inc. | | | | | | | | |
2.24% due 11/18/192,4 | | | 4,700,000 | | | | 4,685,963 | |
McKesson Corp. | | | | | | | | |
2.55% due 10/04/192,4 | | | 4,500,000 | | | | 4,499,044 | |
Vodafone Group plc | | | | | | | | |
2.23% due 12/03/192,4 | | | 4,500,000 | | | | 4,481,999 | |
Walgreens Boots Alliance, Inc. | | | | | | | | |
2.41% due 01/13/204 | | | 3,000,000 | | | | 2,979,875 | |
Ryder System, Inc. | | | | | | | | |
2.27% due 10/01/194 | | | 2,800,000 | | | | 2,800,000 | |
Total Commercial Paper | | | | |
(Cost $24,143,545) | | | | | | | 24,144,214 | |
| | | | | | | | | |
Total Investments - 101.9% | | | | |
(Cost $463,468,973) | | | | | | $ | 463,262,602 | |
Other Assets & Liabilities, net - (1.9)% | | | (8,694,630 | ) |
Total Net Assets - 100.0% | | | | | | $ | 454,567,972 | |
Futures Contracts |
| |
Description | | Number of
Contracts | | | Expiration
Date | | | Notional
Amount | | | Value and
Unrealized
Appreciation** | |
Interest Rate Futures Contracts Sold Short† |
U.S. Treasury 5 Year Note Futures Contracts | | | 112 | | | | Dec 2019 | | | $ | 13,345,500 | | | $ | 62,852 | |
Centrally Cleared Credit Default Swap Agreements Protection Purchased†† |
| |
Counterparty | Exchange | | Index | | Protection
Premium
Rate | | Payment
Frequency | | Maturity
Date | | | Notional
Amount | | | Value | | | Upfront
Premiums
Received | | | Unrealized
Depreciation** | |
BofA Securities, Inc. | ICE | | CDX.NA.IG.31 | | | 1.00 | % | Quarterly | | | 12/20/23 | | | $ | 24,960,000 | | | $ | (541,904 | ) | | $ | (246,140 | ) | | $ | (295,764 | ) |
SEE NOTES TO FINANCIAL STATEMENTS. | THE GUGGENHEIM FUNDS ANNUAL REPORT | 25 |
SCHEDULE OF INVESTMENTS(continued) | September 30, 2019 |
ULTRA SHORT DURATION FUND | |
OTC Credit Default Swap Agreements Protection Purchased†† |
| |
Counterparty | Index | | Protection
Premium
Rate | | Payment
Frequency | | Maturity
Date | | | Notional
Amount | | | Value | | | Upfront
Premiums
Received | | | Unrealized
Depreciation | |
Morgan Stanley Capital Services LLC | CDX.NA.IG.31 (7-15%) | | | 1.00 | % | Quarterly | | | 12/20/23 | | | $ | 3,280,000 | | | $ | (65,240 | ) | | $ | (813 | ) | | $ | (64,427 | ) |
Goldman Sachs International | CDX.NA.IG.31 (7-15%) | | | 1.00 | % | Quarterly | | | 12/20/23 | | | | 6,840,000 | | | | (136,052 | ) | | | (13,359 | ) | | | (122,693 | ) |
| | | | | | | | | | | | | | | | | $ | (201,292 | ) | | $ | (14,172 | ) | | $ | (187,120 | ) |
Centrally Cleared Interest Rate Swap Agreements†† |
| |
Counterparty | Exchange | | Floating
Rate
Type | Floating
Rate
Index | | Fixed
Rate | | Payment
Frequency | | Maturity
Date | | | Notional
Amount | | | Value | | | Upfront
Premiums
Paid
(Received) | | | Unrealized
Appreciation
(Depreciation)** | |
BofA Securities, Inc. | CME | | Pay | 3-Month USD LIBOR | 2.79% | Quarterly | | | 01/21/20 | | | $ | 5,038,000 | | | $ | 9,915 | | | $ | 7,810 | | | $ | 2,105 | |
BofA Securities, Inc. | CME | | Receive | 3-Month USD LIBOR | 1.54% | Quarterly | | | 08/04/21 | | | | 1,550,000 | | | | 3,489 | | | | 287 | | | | 3,202 | |
BofA Securities, Inc. | CME | | Pay | 3-Month USD LIBOR | 2.84% | Quarterly | | | 01/31/20 | | | | 1,014,000 | | | | 2,265 | | | | 1,893 | | | | 372 | |
BofA Securities, Inc. | CME | | Pay | 3-Month USD LIBOR | 2.83% | Quarterly | | | 01/31/20 | | | | 579,000 | | | | 1,274 | | | | 1,125 | | | | 149 | |
BofA Securities, Inc. | CME | | Receive | 3-Month USD LIBOR | 2.83% | Quarterly | | | 01/31/20 | | | | 579,000 | | | | (1,274 | ) | | | 88 | | | | (1,362 | ) |
BofA Securities, Inc. | CME | | Receive | 3-Month USD LIBOR | 2.84% | Quarterly | | | 01/31/20 | | | | 1,014,000 | | | | (2,265 | ) | | | 88 | | | | (2,353 | ) |
BofA Securities, Inc. | CME | | Receive | 3-Month USD LIBOR | 2.79% | Quarterly | | | 01/21/20 | | | | 5,038,000 | | | | (9,915 | ) | | | 94 | | | | (10,009 | ) |
BofA Securities, Inc. | CME | | Receive | 3-Month USD LIBOR | 3.28% | Quarterly | | | 11/07/28 | | | | 550,000 | | | | (81,106 | ) | | | 616 | | | | (81,722 | ) |
BofA Securities, Inc. | CME | | Receive | 3-Month USD LIBOR | 3.18% | Quarterly | | | 11/07/23 | | | | 2,450,000 | | | | (162,126 | ) | | | (256 | ) | | | (161,870 | ) |
BofA Securities, Inc. | CME | | Receive | 3-Month USD LIBOR | 3.21% | Quarterly | | | 11/07/25 | | | | 1,650,000 | | | | (164,027 | ) | | | 475 | | | | (164,502 | ) |
26 | THE GUGGENHEIM FUNDS ANNUAL REPORT | SEE NOTES TO FINANCIAL STATEMENTS. |
SCHEDULE OF INVESTMENTS(continued) | September 30, 2019 |
ULTRA SHORT DURATION FUND | |
Centrally Cleared Interest Rate Swap Agreements†† (continued) |
| |
Counterparty | | Exchange | | Floating
Rate
Type | Floating
Rate
Index | | Fixed
Rate | | Payment
Frequency | | Maturity
Date | | | Notional
Amount | | | Value | | | Upfront
Premiums
Paid
(Received) | | | Unrealized
Appreciation
(Depreciation)** | |
BofA Securities, Inc. | | CME | | Receive | 3-Month USD LIBOR | 3.14% | Quarterly | | | 11/06/21 | | | $ | 11,700,000 | | | $ | (365,571 | ) | | $ | 2,303 | | | $ | (367,874 | ) |
| | | | | | | | | | | | | | | | | | | | | $ | (769,341 | ) | | $ | 14,523 | | | $ | (783,864 | ) |
Total Return Swap Agreements |
| |
Counterparty | Reference
Obligation | | Financing
Rate Pay | | Payment
Frequency | | Maturity
Date | | | Units | | | Notional
Amount | | | Value and
Unrealized
Depreciation | |
OTC Sovereign Debt Swap Agreements†† |
Deutsche Bank AG | Korea Monetary Stabilization Bond | 2.58% (3 Month USD LIBOR + 0.45%) | At Maturity | | | 08/04/21 | | | | N/A | | | $ | 1,547,472 | | | $ | (7,655 | ) |
Forward Foreign Currency Exchange Contracts††
Counterparty | | Contracts
to Sell | | Currency | | Settlement
Date | | | Settlement
Value | | | Value at
September 30,
2019 | | | Unrealized
Appreciation | |
Citibank N.A., New York | | | 17,700,000 | | BRL | | | 07/01/20 | | | $ | 4,423,346 | | | $ | 4,196,087 | | | $ | 227,259 | |
JPMorgan Chase Bank, N.A. | | | 15,500,000 | | BRL | | | 10/01/19 | | | | 3,950,813 | | | | 3,734,220 | | | | 216,593 | |
Citibank N.A., New York | | | 12,050,000 | | BRL | | | 10/01/19 | | | | 3,063,892 | | | | 2,903,055 | | | | 160,837 | |
Goldman Sachs International | | | 3,068,000 | | EUR | | | 04/30/20 | | | | 3,518,383 | | | | 3,396,881 | | | | 121,502 | |
Goldman Sachs International | | | 12,000,000 | | BRL | | | 10/01/19 | | | | 3,005,760 | | | | 2,891,009 | | | | 114,751 | |
Citibank N.A., New York | | | 8,240,000 | | BRL | | | 07/01/21 | | | | 1,997,147 | | | | 1,887,921 | | | | 109,226 | |
Citibank N.A., New York | | | 464,232,000 | | JPY | | | 07/01/21 | | | | 4,571,102 | | | | 4,466,472 | | | | 104,630 | |
JPMorgan Chase Bank, N.A. | | | 9,900,000 | | BRL | | | 07/01/21 | | | | 2,372,110 | | | | 2,268,253 | | | | 103,857 | |
Goldman Sachs International | | | 4,460,000 | | BRL | | | 07/01/20 | | | | 1,158,140 | | | | 1,057,319 | | | | 100,821 | |
Barclays Bank plc | | | 429,214,500 | | JPY | | | 07/01/21 | | | | 4,219,984 | | | | 4,129,562 | | | | 90,422 | |
Barclays Bank plc | | | 1,490,000 | | EUR | | | 01/17/20 | | | | 1,720,801 | | | | 1,638,375 | | | | 82,426 | |
Goldman Sachs International | | | 1,410,000 | | EUR | | | 01/17/20 | | | | 1,628,153 | | | | 1,550,408 | | | | 77,745 | |
Goldman Sachs International | | | 2,216,500 | | EUR | | | 07/30/21 | | | | 2,574,742 | | | | 2,522,225 | | | | 52,517 | |
JPMorgan Chase Bank, N.A. | | | 1,890,000 | | BRL | | | 01/02/20 | | | | 495,023 | | | | 453,141 | | | | 41,882 | |
JPMorgan Chase Bank, N.A. | | | 2,407,925 | | EUR | | | 07/30/21 | | | | 2,779,155 | | | | 2,740,053 | | | | 39,102 | |
Bank of America, N.A. | | | 536,000,000 | | JPY | | | 01/21/20 | | | | 5,038,304 | | | | 5,000,369 | | | | 37,935 | |
Citibank N.A., New York | | | 7,800,000 | | BRL | | | 01/02/20 | | | | 1,901,368 | | | | 1,870,107 | | | | 31,261 | |
Goldman Sachs International | | | 1,548,700,000 | | JPY | | | 10/21/19 | | | | 14,367,553 | | | | 14,345,305 | | | | 22,248 | |
Bank of America, N.A. | | | 513,520 | | EUR | | | 06/15/20 | | | | 590,535 | | | | 570,250 | | | | 20,285 | |
Citibank N.A., New York | | | 347,173,500 | | JPY | | | 06/01/20 | | | | 3,284,394 | | | | 3,264,779 | | | | 19,615 | |
JPMorgan Chase Bank, N.A. | | | 373,186,500 | | JPY | | | 09/01/20 | | | | 3,547,299 | | | | 3,528,704 | | | | 18,595 | |
Goldman Sachs International | | | 419,200 | | EUR | | | 06/15/20 | | | | 482,323 | | | | 465,510 | | | | 16,813 | |
SEE NOTES TO FINANCIAL STATEMENTS. | THE GUGGENHEIM FUNDS ANNUAL REPORT | 27 |
SCHEDULE OF INVESTMENTS(continued) | September 30, 2019 |
ULTRA SHORT DURATION FUND | |
Forward Foreign Currency Exchange Contracts†† (continued) |
| |
Counterparty | | Contracts
to Sell | | Currency | | Settlement
Date | | | Settlement
Value | | | Value at
September 30,
2019 | | | Unrealized
Appreciation
(Depreciation) | |
Bank of America, N.A. | | | 131,765,850 | | JPY | | | 04/15/20 | | | $ | 1,242,852 | | | $ | 1,235,629 | | | $ | 7,223 | |
Bank of America, N.A. | | | 152,076,000 | | JPY | | | 06/22/20 | | | | 1,438,343 | | | | 1,431,900 | | | | 6,443 | |
Goldman Sachs International | | | 860,000 | | BRL | | | 07/01/21 | | | | 201,476 | | | | 197,040 | | | | 4,436 | |
Goldman Sachs International | | | 821,800,000 | | JPY | | | 01/10/20 | | | | 7,665,043 | | | | 7,661,446 | | | | 3,597 | |
JPMorgan Chase Bank, N.A. | | | 37,018,500 | | JPY | | | 03/23/20 | | | | 349,607 | | | | 346,658 | | | | 2,949 | |
JPMorgan Chase Bank, N.A. | | | 55,327,650 | | JPY | | | 06/01/20 | | | | 522,921 | | | | 520,295 | | | | 2,626 | |
Goldman Sachs International | | | 21,219,000 | | JPY | | | 03/23/20 | | | | 200,469 | | | | 198,705 | | | | 1,764 | |
Deutsche Bank AG | | | 1,865,755,963 | | KRW | | | 08/04/21 | | | | 1,591,128 | | | | 1,590,479 | | | | 649 | |
Goldman Sachs International | | | 16,500 | | EUR | | | 07/30/20 | | | | 18,756 | | | | 18,376 | | | | 380 | |
Goldman Sachs International | | | 6,167,835 | | JPY | | | 06/22/20 | | | | 58,371 | | | | 58,074 | | | | 297 | |
JPMorgan Chase Bank, N.A. | | | 17,925 | | EUR | | | 07/30/20 | | | | 20,256 | | | | 19,963 | | | | 293 | |
Citibank N.A., New York | | | 205,400,000 | | JPY | | | 01/10/20 | | | | 1,915,097 | | | | 1,914,895 | | | | 202 | |
Citibank N.A., New York | | | 232,000 | | JPY | | | 01/06/20 | | | | 2,219 | | | | 2,162 | | | | 57 | |
Citibank N.A., New York | | | 232,000 | | JPY | | | 07/01/20 | | | | 2,241 | | | | 2,186 | | | | 55 | |
Citibank N.A., New York | | | 232,000 | | JPY | | | 01/04/21 | | | | 2,264 | | | | 2,210 | | | | 54 | |
Barclays Bank plc | | | 214,500 | | JPY | | | 01/06/20 | | | | 2,048 | | | | 1,999 | | | | 49 | |
Barclays Bank plc | | | 214,500 | | JPY | | | 07/01/20 | | | | 2,069 | | | | 2,021 | | | | 48 | |
Barclays Bank plc | | | 214,500 | | JPY | | | 01/04/21 | | | | 2,090 | | | | 2,043 | | | | 47 | |
Citibank N.A., New York | | | 173,500 | | JPY | | | 12/02/19 | | | | 1,621 | | | | 1,611 | | | | 10 | |
JPMorgan Chase Bank, N.A. | | | 186,500 | | JPY | | | 03/02/20 | | | | 1,752 | | | | 1,744 | | | | 8 | |
Bank of America, N.A. | | | 65,850 | | JPY | | | 10/15/19 | | | | 613 | | | | 610 | | | | 3 | |
Bank of America, N.A. | | | 76,000 | | JPY | | | 12/20/19 | | | | 709 | | | | 707 | | | | 2 | |
Goldman Sachs International | | | 67,100 | | JPY | | | 12/20/19 | | | | 626 | | | | 624 | | | | 2 | |
JPMorgan Chase Bank, N.A. | | | 27,650 | | JPY | | | 12/02/19 | | | | 258 | | | | 257 | | | | 1 | |
Deutsche Bank AG | | | 4,980,963 | | KRW | | | 02/04/21 | | | | 4,223 | | | | 4,223 | | | | 0 | |
Deutsche Bank AG | | | 4,980,963 | | KRW | | | 08/05/20 | | | | 4,198 | | | | 4,198 | | | | 0 | |
Deutsche Bank AG | | | 4,818,541 | | KRW | | | 05/07/21 | | | | 4,095 | | | | 4,096 | | | | (1 | ) |
Deutsche Bank AG | | | 4,980,963 | | KRW | | | 02/05/20 | | | | 4,170 | | | | 4,171 | | | | (1 | ) |
Deutsche Bank AG | | | 4,980,963 | | KRW | | | 11/06/19 | | | | 4,158 | | | | 4,159 | | | | (1 | ) |
Deutsche Bank AG | | | 4,872,681 | | KRW | | | 05/11/20 | | | | 4,092 | | | | 4,093 | | | | (1 | ) |
Deutsche Bank AG | | | 4,980,963 | | KRW | | | 11/04/20 | | | | 4,210 | | | | 4,211 | | | | (1 | ) |
Bank of America, N.A. | | | 39,207 | | ILS | | | 04/30/20 | | | | 11,425 | | | | 11,455 | | | | (30 | ) |
Citibank N.A., New York | | | 40,711 | | ILS | | | 04/30/20 | | | | 11,853 | | | | 11,895 | | | | (42 | ) |
Bank of America, N.A. | | | 33,642 | | ILS | | | 01/31/20 | | | | 9,652 | | | | 9,766 | | | | (114 | ) |
Bank of America, N.A. | | | 33,550 | | ILS | | | 02/01/21 | | | | 9,803 | | | | 9,940 | | | | (137 | ) |
Goldman Sachs International | | | 41,614 | | ILS | | | 04/30/20 | | | | 11,979 | | | | 12,157 | | | | (178 | ) |
Bank of America, N.A. | | | 643,550 | | ILS | | | 01/31/22 | | | | 190,795 | | | | 193,487 | | | | (2,692 | ) |
Bank of America, N.A. | | | 3,949,100 | | ILS | | | 04/30/21 | | | | 1,169,118 | | | | 1,174,529 | | | | (5,411 | ) |
Citibank N.A., New York | | | 4,100,600 | | ILS | | | 04/30/21 | | | | 1,211,792 | | | | 1,219,588 | | | | (7,796 | ) |
Goldman Sachs International | | | 3,270,500 | | ILS | | | 01/31/22 | | | | 968,615 | | | | 983,292 | | | | (14,677 | ) |
Goldman Sachs International | | | 4,177,700 | | ILS | | | 04/30/21 | | | | 1,223,307 | | | | 1,242,519 | | | | (19,212 | ) |
Barclays Bank plc | | | 4,305,000 | | ILS | | | 01/31/20 | | | | 1,217,994 | | | | 1,249,728 | | | | (31,734 | ) |
Goldman Sachs International | | | 18,261,214 | | ILS | | | 02/01/21 | | | | 5,336,843 | | | | 5,410,454 | | | | (73,611 | ) |
28 | THE GUGGENHEIM FUNDS ANNUAL REPORT | SEE NOTES TO FINANCIAL STATEMENTS. |
SCHEDULE OF INVESTMENTS(continued) | September 30, 2019 |
ULTRA SHORT DURATION FUND | |
Forward Foreign Currency Exchange Contracts†† (continued) |
| |
Counterparty | | Contracts
to Buy | | Currency | | Settlement
Date | | | Settlement
Value | | | Value at
September 30,
2019 | | | Unrealized
Depreciation | |
Goldman Sachs International | | | 6,035,500 | | ILS | | | 01/31/20 | | | $ | 1,667,386 | | | $ | 1,752,088 | | | $ | (84,702 | ) |
| | | | | | | | | | | | | | | | | | | | | 1,601,176 | |
Citibank N.A., New York | | | 3,955,000 | | BRL | | | 10/01/19 | | | | 961,842 | | | | 952,828 | | | | (9,014 | ) |
Morgan Stanley Capital Services LLC | | | 35,595,000 | | BRL | | | 10/01/19 | | | | 8,625,325 | | | | 8,575,455 | | | | (49,870 | ) |
| | | | | | | | | | | | | | | | | | | | $ | (58,884 | ) |
~ | The face amount is denominated in U.S. dollars unless otherwise indicated. |
** | Includes cumulative appreciation (depreciation). Variation margin is reported within the Statement of Assets and Liabilities. |
† | Value determined based on Level 1 inputs — See Note 4. |
†† | Value determined based on Level 2 inputs, unless otherwise noted — See Note 4. |
††† | Value determined based on Level 3 inputs — See Note 4. |
1 | Rate indicated is the 7-day yield as of September 30, 2019. |
2 | Security is a 144A or Section 4(a)(2) security. These securities have been determined to be liquid under guidelines established by the Board of Trustees. The total market value of 144A or Section 4(a)(2) securities is $179,253,550 (cost $178,951,232), or 39.4% of total net assets. |
3 | Variable rate security. Rate indicated is the rate effective at September 30, 2019. In some instances, the effective rate is limited by a minimum rate floor or a maximum rate cap established by the issuer. The settlement status of a position may also impact the effective rate indicated. In some cases, a position may be unsettled at period end and may not have a stated effective rate. In instances where multiple underlying reference rates and spread amounts are shown, the effective rate is based on a weighted average. |
4 | Rate indicated is the effective yield at the time of purchase. |
5 | Zero coupon rate security. |
6 | Security is an interest-only strip. |
7 | Face amount of security is adjusted for inflation. |
8 | Repurchase Agreements — See additional disclosure in the repurchase agreements table below for more information on repurchase agreements. |
| | BofA — Bank of America |
| | BRL — Brazilian Real |
| | CDX.NA.IG.31 — Credit Default Swap North American Investment Grade Series 31 Index |
| | CME — Chicago Mercantile Exchange |
| | EUR — Euro |
| | ICE — Intercontinental Exchange |
| | ILS — Israeli New Shekel |
| | JPY — Japanese Yen |
| | KRW — South Korean Won |
| | LIBOR — London Interbank Offered Rate |
| | plc — Public Limited Company |
| | WAC — Weighted Average Coupon |
| | |
| | See Sector Classification in Other Information section. |
SEE NOTES TO FINANCIAL STATEMENTS. | THE GUGGENHEIM FUNDS ANNUAL REPORT | 29 |
SCHEDULE OF INVESTMENTS(continued) | September 30, 2019 |
ULTRA SHORT DURATION FUND | |
The following table summarizes the inputs used to value the Fund’s investments at September 30, 2019 (See Note 4 in the Notes to Financial Statements):
Investments in Securities (Assets) | | Level 1
Quoted
Prices | | | Level 2
Significant
Observable
Inputs | | | Level 3
Significant
Unobservable
Inputs | | | Total | |
Money Market Fund | | $ | 2,046,924 | | | $ | — | | | $ | — | | | $ | 2,046,924 | |
Asset-Backed Securities | | | — | | | | 109,711,960 | | | | 4,900,000 | | | | 114,611,960 | |
Corporate Bonds | | | — | | | | 104,602,242 | | | | — | | | | 104,602,242 | |
Foreign Government Debt | | | — | | | | 84,512,323 | | | | — | | | | 84,512,323 | |
Collateralized Mortgage Obligations | | | — | | | | 62,811,247 | | | | — | | | | 62,811,247 | |
U.S. Government Securities | | | — | | | | 29,113,125 | | | | — | | | | 29,113,125 | |
Municipal Bonds | | | — | | | | 35,493 | | | | — | | | | 35,493 | |
Repurchase Agreements | | | — | | | | 41,385,074 | | | | — | | | | 41,385,074 | |
Commercial Paper | | | — | | | | 24,144,214 | | | | — | | | | 24,144,214 | |
Interest Rate Futures Contracts** | | | 62,852 | | | | — | | | | — | | | | 62,852 | |
Interest Rate Swap Agreements** | | | — | | | | 5,828 | | | | — | | | | 5,828 | |
Forward Foreign Currency Exchange Contracts** | | | — | | | | 1,841,517 | | | | — | | | | 1,841,517 | |
Total Assets | | $ | 2,109,776 | | | $ | 458,163,023 | | | $ | 4,900,000 | | | $ | 465,172,799 | |
Investments in Securities (Liabilities) | | Level 1
Quoted
Prices | | | Level 2
Significant
Observable
Inputs | | | Level 3
Significant
Unobservable
Inputs | | | Total | |
Credit Default Swap Agreements** | | $ | — | | | $ | 482,884 | | | $ | — | | | $ | 482,884 | |
Interest Rate Swap Agreements** | | | — | | | | 789,692 | | | | — | | | | 789,692 | |
Total Return Swap Agreements** | | | — | | | | 7,655 | | | | — | | | | 7,655 | |
Forward Foreign Currency Exchange Contracts** | | | — | | | | 299,225 | | | | — | | | | 299,225 | |
Total Liabilities | | $ | — | | | $ | 1,579,456 | | | $ | — | | | $ | 1,579,456 | |
** | This derivative is reported as unrealized appreciation/depreciation at period end. |
The following is a summary of significant unobservable inputs used in the fair valuation of assets categorized within Level 3 of the fair value hierarchy:
Category | | Ending
Balance at
September 30,
2019 | | Valuation
Technique | Unobservable
Inputs | | Input
Range | | | Weighted
Average* | |
Assets: | | | | | | | | | | | | | | |
Asset-Backed Securities | | $ | 4,900,000 | | Option Adjusted Spread off prior month broker quote | Broker Quote | — | — |
Total Assets | | $ | 4,900,000 | | | | | |
30 | THE GUGGENHEIM FUNDS ANNUAL REPORT | SEE NOTES TO FINANCIAL STATEMENTS. |
SCHEDULE OF INVESTMENTS(continued) | September 30, 2019 |
ULTRA SHORT DURATION FUND | |
Significant changes in a quote would generally result in significant changes in the fair value of the security.
Summary of Fair Value Level 3 Activity
Following is a reconciliation of Level 3 assets for which significant unobservable inputs were used to determine fair value for the year ended September 30, 2019:
| | | Assets | |
| | Asset-Backed Securities | |
Beginning Balance | | $ | — | |
Purchases/(Receipts) | | | 4,900,000 | |
(Sales, maturities and paydowns)/Fundings | | | — | |
Amortization of premiums/discounts | | | — | |
Total realized gains (losses) included in earnings | | | — | |
Total change in unrealized appreciation (depreciation) included in earnings | | | — | |
Ending Balance | | $ | 4,900,000 | |
Net change in unrealized appreciation (depreciation) for investments in Level 3 securities still held at September 30, 2019 | | $ | — | |
Repurchase Agreements
In connection with transactions in repurchase agreements, it is the Fund’s policy that its custodian take possession of the underlying collateral. The collateral is in the possession of the Fund’s custodian and is evaluated to ensure that its market value exceeds, at a minimum, 102% of the original face amount of the repurchase agreements.
The Fund may engage in repurchase agreements. Repurchase agreements are fixed income securities in the form of agreements backed by collateral. These agreements typically involve the acquisition by the Fund of securities from the selling institution coupled with the agreement that the selling institution will repurchase the underlying securities at a specified price and at a fixed time in the future. The Fund may accept a wide variety of underlying securities as collateral for the repurchase agreements entered into by the Fund. Any such securities serving as collateral are marked-to-market daily in order to maintain full collateralization. Securities purchased under repurchase agreements are reflected as an asset on the Statement of Assets and Liabilities. Interest earned is recorded as a component of interest income on the Statement of Operations.
The use of repurchase agreements involves certain risks. For example, if the selling institution defaults on its obligation to repurchase the underlying securities at a time when the value of securities has declined, the Fund may incur a loss upon disposition of them. In the event of an insolvency or bankruptcy by the selling institution, the Fund’s right to control the collateral could be affected and result in certain costs and delays. In addition, the Fund could incur a loss if the value of the underlying collateral falls below the agreed upon repurchase price.
At September 30, 2019, the repurchase agreements in the account were as follows:
Counterparty and
Terms of Agreement | | Face
Value | | | Repurchase
Price | | | Collateral | | Par
Value | | | Fair
Value | |
J.P. Morgan Securities LLC | | | | | | | | | | U.S. Treasury Note | | | | | | | | |
2.35% - 3.00% | | | | | | | | | | 2.63% | | | | | | | | |
10/01/19 | | $ | 15,588,000 | | | $ | 15,589,153 | | | 02/28/23 | | $ | 5,000,000 | | | $ | 5,173,000 | |
| | | | | | | | | | | | | | | | | | | |
| | | | | | | | | | | Ginnie Mae II Pool | | | | | | | | |
| | | | | | | | | | | 4.50% | | | | | | | | |
| | | | | | | | | | | 06/20/49 | | | 4,472,000 | | | | 4,695,600 | |
| | | | | | | | | | | | | | | | | | | |
SEE NOTES TO FINANCIAL STATEMENTS. | THE GUGGENHEIM FUNDS ANNUAL REPORT | 31 |
SCHEDULE OF INVESTMENTS(continued) | September 30, 2019 |
ULTRA SHORT DURATION FUND | |
Counterparty and
Terms of Agreement | | Face
Value | | | Repurchase
Price | | | Collateral | | Par
Value | | | Fair
Value | |
| | | | | | | | | | | U.S. Treasury Note | | | | | | | | |
| | | | | | | | | | | 2.50% | | | | | | | | |
| | | | | | | | | | | 05/15/24 | | $ | 3,883,000 | | | $ | 4,042,980 | |
| | | | | | | | | | | | | | | | | | | |
| | | | | | | | | | | Fannie Mae Pool | | | | | | | | |
| | | | | | | | | | | 3.50% | | | | | | | | |
| | | | | | | | | | | 09/01/49 | | | 2,000,000 | | | | 2,054,800 | |
| | | | | | | | | | | | | | 15,355,000 | | | | 15,966,380 | |
| | | | | | | | | | | | | | | | | | | |
BNP Paribas | | | | | | | | | | HSI Asset Securitization Corp. Trust | | | | | | | | |
2.33% - 2.47% | | | | | | | | | | 2.21% | | | | | | | | |
11/01/19 - 12/16/19 | | $ | 7,000,000 | | | $ | 7,043,635 | | | 01/25/37 | | | 11,060,000 | | | | 8,707,538 | |
| | | | | | | | | | | | | | | | | | | |
| | | | | | | | | | | Structured Asset Securities Corp Mortgage Loan Trust | | | | | | | | |
| | | | | | | | | | | 2.22% | | | | | | | | |
| | | | | | | | | | | 06/25/37 | | | 1,355,000 | | | | 937,118 | |
| | | | | | | | | | | | | | | | | | | |
| | | | | | | | | | | Saxon Asset Securities Trust | | | | | | | | |
| | | | | | | | | | | 2.47% | | | | | | | | |
| | | | | | | | | | | 11/25/37 | | | 247,000 | | | | 240,751 | |
| | | | | | | | | | | | | | 12,662,000 | | | | 9,885,407 | |
| | | | | | | | | | | | | | | | | | | |
Societe Generale | | | | | | | | | | Freddie Mac Structured Agency Credit Risk | | | | | | | | |
2.54% - 2.74% (3 Month USD LIBOR + 0.40%) | | | | | | | | | | Debt Notes 4.32% | | | | | | | | |
04/07/20* | | | 6,559,200 | | | | 6,681,456 | | | 09/25/30 | | | 2,046,060 | | | | 2,065,907 | |
| | | | | | | | | | | | | | | | | | | |
| | | | | | | | | | | Fannie Mae Connecticut Avenue Securities | | | | | | | | |
| | | | | | | | | | | 4.82% | | | | | | | | |
| | | | | | | | | | | 02/25/30 | | | 1,534,000 | | | | 1,563,913 | |
| | | | | | | | | | | | | | | | | | | |
| | | | | | | | | | | Fannie Mae Connecticut Avenue Securities | | | | | | | | |
| | | | | | | | | | | 4.57% | | | | | | | | |
| | | | | | | | | | | 12/25/30 | | | 1,100,000 | | | | 1,118,920 | |
| | | | | | | | | | | | | | | | | | | |
| | | | | | | | | | | Citigroup Commercial Mortgage Trust | | | | | | | | |
| | | | | | | | | | | 4.71% | | | | | | | | |
| | | | | | | | | | | 12/15/36 | | | 1,100,000 | | | | 1,100,660 | |
| | | | | | | | | | | | | | | | | | | |
32 | THE GUGGENHEIM FUNDS ANNUAL REPORT | SEE NOTES TO FINANCIAL STATEMENTS. |
SCHEDULE OF INVESTMENTS(concluded) | September 30, 2019 |
ULTRA SHORT DURATION FUND | |
Counterparty and
Terms of Agreement | | Face
Value | | | Repurchase
Price | | | Collateral | | Par
Value | | | Fair
Value | |
| | | | | | | | | | | BBCMS Trust | | | | | | | | |
| | | | | | | | | | | 5.06% | | | | | | | | |
| | | | | | | | | | | 07/15/37 | | $ | 1,100,000 | | | $ | 1,100,000 | |
| | | | | | | | | | | | | | | | | | | |
| | | | | | | | | | | Connecticut Avenue Securities Trust | | | | | | | | |
| | | | | | | | | | | 4.02% | | | | | | | | |
| | | | | | | | | | | 07/25/39 | | | 624,000 | | | | 625,498 | |
| | | | | | | | | | | | | | | | | | | |
| | | | | | | | | | | Freddie Mac Structured Agency Credit Risk Debt Notes | | | | | | | | |
| | | | | | | | | | | 4.67% | | | | | | | | |
| | | | | | | | | | | 12/25/29 | | | 623,000 | | | | 624,495 | |
| | | | | | | | | | | | | | 8,127,060 | | | | 8,199,393 | |
| | | | | | | | | | | | | | | | | | | |
BofA Securities, Inc. | | | | | | | | | | U.S. Treasury Note | | | | | | | | |
2.80% | | | | | | | | | | 1.50% | | | | | | | | |
10/01/19 | | $ | 5,800,000 | | | $ | 5,800,451 | | | 09/30/24 | | | 5,946,000 | | | | 5,931,135 | |
| | | | | | | | | | | | | | | | | | | |
Deutsche Bank | | | | | | | | | | Covenant Credit Partners CLO III Ltd. | | | | | | | | |
2.62% | | | | | | | | | | 8.45% | | | | | | | | |
11/06/19 | | | 3,216,000 | | | | 3,237,527 | | | 10/15/29 | | | 4,500,000 | | | | 4,175,100 | |
| | | | | | | | | | | | | | | | | | | |
Barclays Capital Inc. | | | | | | | | | | | | | | | | | | |
2.27% (1 Month USD LIBOR + 0.25%) | | | | | | | | | | Hess Corp. 5.60% | | | | | | | | |
11/04/19* | | | 3,221,874 | | | | 3,234,040 | | | 02/15/41 | | | 1,980,000 | | | | 2,209,086 | |
| | | | | | | | | | | | | | | | | | | |
| | | | | | | | | | | Quicken Loans Inc. | | | | | | | | |
| | | | | | | | | | | 5.75% | | | | | | | | |
| | | | | | | | | | | 05/01/25 | | | 1,047,000 | | | | 1,079,666 | |
| | | | | | | | | | | | | | | | | | | |
| | | | | | | | | | | Goldman Sachs Group Inc. | | | | | | | | |
| | | | | | | | | | | 5.00% | | | | | | | | |
| | | | | | | | | | | Perpetual Maturity | | | 175,000 | | | | 171,798 | |
| | | | | | | | | | | | | | 3,202,000 | | | | 3,460,550 | |
* | Variable rate security. Rate indicated is the rate effective at September 30, 2019. In some instances, the effective rate is limited by a minimum rate floor or a maximum rate cap established by the issuer. The settlement status of a position may also impact the effective rate indicated. In some cases, a position may be unsettled at period end and may not have a stated effective rate. In instances where multiple underlying reference rates and spread amounts are shown, the effective rate is based on a weighted average. |
SEE NOTES TO FINANCIAL STATEMENTS. | THE GUGGENHEIM FUNDS ANNUAL REPORT | 33 |
STATEMENT OF ASSETS AND LIABILITIES |
ULTRA SHORT DURATION FUND |
September 30, 2019
Assets: |
Investments, at value (cost $422,083,899) | | $ | 421,877,528 | |
Repurchase agreements, at value (cost $41,385,074) | | | 41,385,074 | |
Cash | | | 4,013,310 | |
Segregated cash with broker | | | 874,643 | |
Unamortized upfront premiums paid on interest rate swap agreements | | | 14,779 | |
Unrealized appreciation on forward foreign currency exchange contracts | | | 1,841,517 | |
Prepaid expenses | | | 19,162 | |
Receivables: |
Interest | | | 1,676,521 | |
Fund shares sold | | | 761,050 | |
Foreign tax reclaims | | | 25,759 | |
Dividends | | | 13,870 | |
Swap settlement | | | 1,251 | |
Total assets | | | 472,504,464 | |
| | | | | |
Liabilities: |
Segregated cash due to broker | | | 870,000 | |
Due to custodian | | | 220 | |
Unamortized upfront premiums received on credit default swap agreements | | | 260,312 | |
Unamortized upfront premiums received on interest rate swap agreements | | | 256 | |
Unrealized depreciation on OTC swap agreements | | | 194,775 | |
Unrealized depreciation on forward foreign currency exchange contracts | | | 299,225 | |
Payable for: |
Fund shares redeemed | | | 15,084,471 | |
Securities purchased | | | 703,883 | |
Distributions to shareholders | | | 163,515 | |
Variation margin on interest rate swap agreements | | | 141,723 | |
Management fees | | | 72,538 | |
Fund accounting/administration fees | | | 12,556 | |
Protection fees on credit default swap agreements | | | 10,719 | |
Variation margin on futures contracts | | | 7,000 | |
Distribution and service fees | | | 5,452 | |
Variation margin on credit default swap agreements | | | 3,278 | |
Trustees’ fees* | | | 1,464 | |
Transfer agent and administrative fees | | | 921 | |
Transfer agent/maintenance fees | | | 197 | |
Due to Investment Adviser | | | 178 | |
Miscellaneous | | | 103,809 | |
Total liabilities | | | 17,936,492 | |
Net assets | | $ | 454,567,972 | |
| | | | | |
Net assets consist of: |
Paid in capital | | $ | 455,425,773 | |
Total distributable earnings (loss) | | | (857,801 | ) |
Net assets | | $ | 454,567,972 | |
| | | | | |
A-Class: |
Net assets | | $ | 31,153,783 | |
Capital shares outstanding | | | 3,126,267 | |
Net asset value per share | | $ | 9.97 | |
| | | | | |
Institutional Class: |
Net assets | | $ | 423,414,189 | |
Capital shares outstanding | | | 42,511,736 | |
Net asset value per share | | $ | 9.96 | |
| | | | | |
* | Relates to Trustees not deemed “interested persons” within the meaning of Section 2(a)(19) of the 1940 Act. |
34 | THE GUGGENHEIM FUNDS ANNUAL REPORT | SEE NOTES TO FINANCIAL STATEMENTS. |
STATEMENT OF OPERATIONS |
ULTRA SHORT DURATION FUND |
Year Ended September 30, 2019
Investment Income: |
Dividends | | $ | 149,408 | |
Interest | | | 10,855,792 | |
Total investment income | | | 11,005,200 | |
| | | | | |
Expenses: |
Management fees | | | 827,640 | |
Distribution and service fees: |
A-Class | | | 14,111 | |
Transfer agent/maintenance fees: |
A-Class | | | 763 | |
Institutional Class | | | 13,096 | |
Fund accounting/administration fees | | | 115,751 | |
Professional fees | | | 64,237 | |
Custodian fees | | | 33,163 | |
Trustees’ fees* | | | 25,814 | |
Miscellaneous | | | 80,393 | |
Recoupment of previously waived fees: |
Institutional Class | | | 1,803 | |
Total expenses | | | 1,176,771 | |
Less: |
Expenses reimbursed by Adviser: |
A-Class | | | (1,335 | ) |
Institutional Class | | | (11,092 | ) |
Expenses waived by Adviser | | | (8,779 | ) |
Earnings credits applied | | | (20,341 | ) |
Total waived/reimbursed expenses | | | (41,547 | ) |
Net expenses | | | 1,135,224 | |
Net investment income | | | 9,869,976 | |
| | | | | |
Net Realized and Unrealized Gain (Loss): |
Net realized gain (loss) on: |
Investments | | | (1,061,106 | ) |
Swap agreements | | | (176,715 | ) |
Futures contracts | | | (97 | ) |
Forward foreign currency exchange contracts | | | 5,906,039 | |
Foreign currency transactions | | | (4,696,147 | ) |
Net realized loss | | | (28,026 | ) |
Net change in unrealized appreciation (depreciation) on: |
Investments | | | (211,744 | ) |
Swap agreements | | | (1,412,541 | ) |
Futures contracts | | | 62,852 | |
Forward foreign currency exchange contracts | | | 1,008,454 | |
Foreign currency translations | | | 4,621 | |
Net change in unrealized appreciation (depreciation) | | | (548,358 | ) |
Net realized and unrealized loss | | | (576,384 | ) |
Net increase in net assets resulting from operations | | $ | 9,293,592 | |
* | Relates to Trustees not deemed “interested persons” within the meaning of Section 2(a)(19) of the 1940 Act. |
SEE NOTES TO FINANCIAL STATEMENTS. | THE GUGGENHEIM FUNDS ANNUAL REPORT | 35 |
STATEMENTS OF CHANGES IN NET ASSETS |
ULTRA SHORT DURATION FUND | |
| | Year Ended
September 30,
2019 | | | Year Ended
September 30,
2018 | |
Increase (Decrease) in Net Assets from Operations: | | | | | | | | |
Net investment income | | $ | 9,869,976 | | | $ | 9,231,656 | |
Net realized gain (loss) on investments | | | (28,026 | ) | | | 540,847 | |
Net change in unrealized appreciation (depreciation) on investments | | | (548,358 | ) | | | (497,223 | ) |
Net increase in net assets resulting from operations | | | 9,293,592 | | | | 9,275,280 | |
| | | | | | | | | |
Distributions to shareholders: | | | | | | | | |
A-Class | | | (139,082 | ) | | | — | |
Institutional Class | | | (10,924,443 | ) | | | (10,147,848 | ) |
Total distributions to shareholders | | | (11,063,525 | ) | | | (10,147,848 | ) |
| | | | | | | | | |
Capital share transactions: | | | | | | | | |
Proceeds from sale of shares | | | | | | | | |
A-Class | | | 36,269,668 | | | | — | |
Institutional Class | | | 403,303,618 | | | | 317,765,844 | |
Distributions reinvested | | | | | | | | |
A-Class | | | 137,329 | | | | — | |
Institutional Class | | | 8,651,860 | | | | 7,941,436 | |
Cost of shares redeemed | | | | | | | | |
A-Class | | | (5,241,855 | ) | | | — | |
Institutional Class | | | (342,911,050 | ) | | | (395,297,978 | ) |
Net increase (decrease) from capital share transactions | | | 100,209,570 | | | | (69,590,698 | ) |
Net increase (decrease) in net assets | | | 98,439,637 | | | | (70,463,266 | ) |
| | | | | | | | | |
Net assets: | | | | | | | | |
Beginning of year | | | 356,128,335 | | | | 426,591,601 | |
End of year | | $ | 454,567,972 | | | $ | 356,128,335 | |
36 | THE GUGGENHEIM FUNDS ANNUAL REPORT | SEE NOTES TO FINANCIAL STATEMENTS. |
STATEMENTS OF CHANGES IN NET ASSETS(concluded) |
ULTRA SHORT DURATION FUND | |
| | Year Ended
September 30,
2019 | | | Year Ended
September 30,
2018 | |
Capital share activity: | | | | | | | | |
Shares sold | | | | | | | | |
A-Class | | | 3,638,332 | | | | — | |
Institutional Class | | | 40,454,632 | 1 | | | 31,708,647 | 1 |
Shares issued from reinvestment of distributions | | | | | | | | |
A-Class | | | 13,774 | | | | — | |
Institutional Class | | | 867,866 | 1 | | | 792,707 | 1 |
Shares redeemed | | | | | | | | |
A-Class | | | (525,839 | ) | | | — | |
Institutional Class | | | (34,376,508 | )1 | | | (39,440,614 | )1 |
Net increase (decrease) in shares | | | 10,072,257 | | | | (6,939,260 | ) |
1 | The capital share activity for the year ended September 30, 2018 and the period October 1, 2018 to November 30, 2018 has been restated to reflect the reorganization of the Guggenheim Strategy Fund I with and into the Guggenheim Ultra Short Duration Fund — Institutional Class effective November 30, 2018. In conjunction with the reorganization, Guggenheim Ultra Short Duration Fund issued 2.501601322 Institutional Class shares for every 1 share of Guggenheim Strategy Fund I. See Note 11 in Notes to Financial Statements. |
SEE NOTES TO FINANCIAL STATEMENTS. | THE GUGGENHEIM FUNDS ANNUAL REPORT | 37 |
FINANCIAL HIGHLIGHTS |
ULTRA SHORT DURATION FUND | |
This table is presented to show selected data for a share outstanding throughout each period and to assist shareholders in evaluating a Fund’s performance for the period presented.
A-Class | | Period
Ended
Sept. 30,
2019a | |
Per Share Data | | | | |
Net asset value, beginning of period | | $ | 10.00 | |
Income (loss) from investment operations: |
Net investment income (loss)b | | | .17 | |
Net gain (loss) on investments (realized and unrealized) | | | .02 | h |
Total from investment operations | | | .19 | |
Less distributions from: |
Net investment income | | | (.21 | ) |
Net realized gains | | | (.01 | ) |
Total distributions | | | (.22 | ) |
Net asset value, end of period | | $ | 9.97 | |
|
Total Return | | | 1.89 | % |
Ratios/Supplemental Data |
Net assets, end of period (in thousands) | | $ | 31,154 | |
Ratios to average net assets: |
Net investment income (loss) | | | 2.05 | % |
Total expenses | | | 0.61 | % |
Net expensesd,g | | | 0.58 | % |
Portfolio turnover rate | | | 55 | % |
38 | THE GUGGENHEIM FUNDS ANNUAL REPORT | SEE NOTES TO FINANCIAL STATEMENTS. |
FINANCIAL HIGHLIGHTS(continued) |
ULTRA SHORT DURATION FUND |
This table is presented to show selected data for a share outstanding throughout each period and to assist shareholders in evaluating a Fund’s performance for the periods presented.
Institutional Class | | Year
Ended
Sept. 30,
2019e | | | Year
Ended
Sept. 30,
2018e | | | Year
Ended
Sept. 30,
2017e | | | Year
Ended
Sept. 30,
2016e | | | Year
Ended
Sept. 30,
2015e | |
Per Share Data | | | | | | | | | | | | | | | | | | | | |
Net asset value, beginning of period | | $ | 10.01 | | | $ | 10.04 | | | $ | 9.99 | | | $ | 9.95 | | | $ | 9.96 | |
Income (loss) from investment operations: |
Net investment income (loss)b | | | .28 | | | | .24 | | | | .17 | | | | .14 | | | | .11 | |
Net gain (loss) on investments (realized and unrealized) | | | (.04 | ) | | | — | | | | .06 | | | | .04 | | | | (.01 | ) |
Total from investment operations | | | .24 | | | | .24 | | | | .23 | | | | .18 | | | | .10 | |
Less distributions from: |
Net investment income | | | (.28 | ) | | | (.27 | ) | | | (.18 | ) | | | (.14 | ) | | | (.11 | ) |
Net realized gains | | | (.01 | ) | | | — | c | | | — | | | | — | | | | — | |
Total distributions | | | (.29 | ) | | | (.27 | ) | | | (.18 | ) | | | (.14 | ) | | | (.11 | ) |
Net asset value, end of period | | $ | 9.96 | | | $ | 10.01 | | | $ | 10.04 | | | $ | 9.99 | | | $ | 9.95 | |
|
Total Return | | | 2.37 | % | | | 2.48 | % | | | 2.24 | % | | | 1.95 | % | | | 1.06 | % |
Ratios/Supplemental Data |
Net assets, end of period (in thousands) | | $ | 423,414 | | | $ | 356,128 | | | $ | 426,592 | | | $ | 407,371 | | | $ | 957,190 | |
Ratios to average net assets: |
Net investment income (loss) | | | 2.54 | % | | | 2.44 | % | | | 1.73 | % | | | 1.37 | % | | | 1.14 | % |
Total expenses | | | 0.30 | % | | | 0.07 | % | | | 0.08 | % | | | 0.07 | % | | | 0.04 | % |
Net expensesd,f,g | | | 0.29 | % | | | 0.07 | % | | | 0.08 | % | | | 0.07 | % | | | 0.04 | % |
Portfolio turnover rate | | | 55 | % | | | 74 | % | | | 65 | % | | | 66 | % | | | 46 | % |
SEE NOTES TO FINANCIAL STATEMENTS. | THE GUGGENHEIM FUNDS ANNUAL REPORT | 39 |
FINANCIAL HIGHLIGHTS(concluded) |
ULTRA SHORT DURATION FUND |
a | Since commencement of operations: November 30, 2018. Percentage amounts for the period, except total return and portfolio turnover rate, have been annualized. |
b | Net investment income (loss) per share was computed using average shares outstanding throughout the period. |
c | Distributions from realized gains are less than $0.01 per share. |
d | Net expense information reflects the expense ratios after expense waivers and reimbursements, as applicable. |
e | The per share data for the years ended September 30, 2015 through September 30, 2018 and the period October 1, 2018 to November 30, 2018 has been restated to reflect the reorganization of the Guggenheim Strategy Fund I with and into the Guggenheim Ultra Short Duration Fund effective November 30, 2018. In conjunction with the reorganization, Guggenheim Ultra Short Duration Fund issued 2.501601322 Institutional Class shares for every 1 share of Guggenheim Strategy Fund I. See Note 11 in Notes to Financial Statements. |
f | The portion of the ratios of net expenses to average net assets attributable to recoupments of prior fee reductions or expense reimbursements for the years presented was as follows: |
| | | 09/30/19 |
| | A-Class | — |
| | Institutional Class | 0.00%* |
g | Net expenses may include expenses that are excluded from the expense limitation agreement. Excluding these expenses, the net expense ratios for the years presented would be: |
| | | 09/30/19 | 09/30/18 | 09/30/17 | 09/30/16 | 09/30/15 |
| | A-Class | 0.58% | N/A | N/A | N/A | N/A |
| | Institutional Class | 0.29% | 0.07% | 0.08% | 0.07% | 0.04% |
h | The amount shown for a share outstanding throughout the period does not accord with the aggregate net losses on investments for the period because of the sales and repurchases of fund shares in relation to fluctuating market value of the investments of the Fund. |
40 | THE GUGGENHEIM FUNDS ANNUAL REPORT | SEE NOTES TO FINANCIAL STATEMENTS. |
NOTES TO FINANCIAL STATEMENTS |
Note 1 – Organization and Significant Accounting Policies
Organization
Guggenheim Funds Trust (the “Trust”), a Delaware statutory trust, is registered with the SEC under the Investment Company Act of 1940 (“1940 Act”), as an open-ended investment company of the series type. Each series, in effect, is representing a separate fund. The Trust is authorized to issue an unlimited number of shares. The Trust accounts for the assets of each fund separately.
The Trust offers a combination of five separate classes of shares: A-Class shares, C-Class shares, P-Class shares, R6-Class shares and Institutional Class shares. Sales of shares of each Class are made without a front-end sales charge at the net asset value per share (“NAV”), with the exception of A-Class shares. A-Class shares are sold at the NAV, plus the applicable front-end sales charge. The sales charge varies depending on the amount purchased. A-Class share purchases of $1 million or more are exempt from the front-end sales charge but have a 1% contingent deferred sales charge (“CDSC”), if shares are redeemed within 12 months of purchase. C-Class shares have a 1% CDSC if shares are redeemed within 12 months of purchase. C-Class shares of the Fund automatically convert to A-Class shares on or about the 10th day of the month following the 10-year anniversary of the purchase of the C-Class shares. This conversion will be executed without any sales charge, fee or other charge. After the conversion is completed, the shares will be subject to all features and expenses of A-Class shares. Institutional Class shares are offered primarily for direct investment by institutions such as pension and profit sharing plans, endowments, foundations and corporations. Institutional Class shares require a minimum initial investment of $2 million and a minimum account balance of $1 million. R6-Class shares are offered primarily through qualified retirement and benefit plans. R6-Class shares are also offered through certain other plans and platforms sponsored by financial intermediaries. Certain institutional investors and others deemed appropriate by Guggenheim Investments (“GI”) may also be eligible to purchase R6-Class shares subject to a $2 million minimum initial investment. At September 30, 2019, the Trust consisted of twenty funds (the “Funds”).
This report covers the Ultra Short Duration Fund (the “Fund”), a diversified investment company. At September 30, 2019, only A-Class and Institutional Class shares had been issues by the Fund.
Guggenheim Partners Investment Management, LLC (“GPIM”), which operates under the name Guggenheim Investments, provides advisory services. Guggenheim Funds Distributors, LLC (“GFD”) acts as principal underwriter for the Trust. GI and GFD are affiliated entities.
Significant Accounting Policies
The Fund operates as an investment company and, accordingly, follows the investment company accounting and reporting guidance of the Financial Accounting Standards Board (“FASB”) Accounting Standards Codification Topic 946 Financial Services – Investment Companies.
| | THE GUGGENHEIM FUNDS ANNUAL REPORT | 41 |
NOTES TO FINANCIAL STATEMENTS(continued) |
The following significant accounting policies are in conformity with U.S. generally accepted accounting principles (“U.S. GAAP”) and are consistently followed by the Trust. This requires management to make estimates and assumptions that affect the reported amount of assets and liabilities, contingent assets and liabilities at the date of the financial statements, and the reported amounts of revenues and expenses during the reporting period. Actual results could differ from these estimates. All time references are based on Eastern Time.
The net asset value per share (“NAV”) of each Class of the Fund is calculated by dividing the market value of the Fund’s securities and other assets, less all liabilities, attributable to the Class by the number of outstanding shares of the Class.
(a) Valuation of Investments
The Board of Trustees of the Fund (the “Board”) has adopted policies and procedures for the valuation of the Fund’s investments (the “Valuation Procedures”). Pursuant to the Valuation Procedures, the Board has delegated to a valuation committee, consisting of representatives from Guggenheim’s investment management, fund administration, legal and compliance departments (the “Valuation Committee”), the day-to-day responsibility for implementing the Valuation Procedures, including, under most circumstances, the responsibility for determining the fair value of the Fund’s securities and/or other assets.
Valuations of the Fund’s securities are supplied primarily by pricing services appointed pursuant to the processes set forth in the Valuation Procedures. The Valuation Committee convenes monthly, or more frequently as needed, to review the valuation of all assets which have been fair valued for reasonableness. The Fund’s officers, through the Valuation Committee and consistent with the monitoring and review responsibilities set forth in the Valuation Procedures, regularly review procedures used and valuations provided by the pricing services.
If the pricing service cannot or does not provide a valuation for a particular investment or such valuation is deemed unreliable, such investment is fair valued by the Valuation Committee.
Generally, trading in foreign securities markets is substantially completed each day at various times prior to the close of the New York Stock Exchange (“NYSE”). The values of foreign securities are determined as of the close of such foreign markets or the close of the NYSE, if earlier. All investments quoted in foreign currencies are valued in U.S. dollars on the basis of the foreign currency exchange rates prevailing at the close of U.S. business at 4:00 p.m. Investments in foreign securities may involve risks not present in domestic investments. The Valuation Committee will determine the current value of such foreign securities by taking into consideration certain factors which may include those discussed above, as well as the following factors, among others: the value of the securities traded on other foreign markets, ADR trading, closed-end fund trading, foreign currency exchange activity, and the trading prices of financial products that are tied to foreign securities. In addition, under the Valuation Procedures, the Valuation Committee and GI are authorized to use prices and other information supplied by a third party pricing vendor in valuing foreign securities.
42 | THE GUGGENHEIM FUNDS ANNUAL REPORT | |
NOTES TO FINANCIAL STATEMENTS(continued) |
U.S. Government securities are valued by either independent pricing services, the last traded fill price, or at the reported bid price at the close of business.
Debt securities with a maturity of greater than 60 days at acquisition are valued at prices that reflect broker-dealer supplied valuations or are obtained from independent pricing services, which may consider the trade activity, treasury spreads, yields or price of bonds of comparable quality, coupon, maturity, and type, as well as prices quoted by dealers who make markets in such securities. Short-term debt securities with a maturity of 60 days or less at acquisition are valued at amortized cost, provided such amount approximates market value. Money market funds are valued at their NAV.
Repurchase agreements are valued at amortized cost, provided such amounts approximate market value.
The value of futures contracts is accounted for using the unrealized appreciation or depreciation on the contracts that is determined by marking the contracts to their current realized settlement prices. Financial futures contracts are valued at the 4:00 p.m. price on the valuation date. In the event that the exchange for a specific futures contract closes earlier than 4:00 p.m., the futures contract is valued at the official settlement price of the exchange. However, the underlying securities from which the futures contract value is derived are monitored until 4:00 p.m. to determine if fair valuation would provide a more accurate valuation.
The value of interest rate swap agreements entered into by the Fund is accounted for using the unrealized appreciation or depreciation on the agreements that is determined using the spread priced off the previous day’s Chicago Mercantile Exchange price.
The values of other swap agreements entered into by a fund are accounted for using the unrealized appreciation or depreciation on the agreements that are determined by marking the agreements to the last quoted value of the index or other underlying position that the swaps pertain to at the close of the NYSE.
Forward foreign currency exchange contracts are valued daily based on the applicable exchange rate of the underlying currency.
Investments for which market quotations are not readily available are fair-valued as determined in good faith by GI, subject to review and approval by the Valuation Committee, pursuant to methods established or ratified by the Board. Valuations in accordance with these methods are intended to reflect each security’s (or asset’s or liability’s) “fair value”. Each such determination is based on a consideration of all relevant factors, which are likely to vary from one pricing context to another. Examples of such factors may include, but are not limited to market prices; sale prices; broker quotes; and models which derive prices based on inputs such as prices of securities with comparable maturities and characteristics, or based on inputs such as anticipated cash flows or collateral, spread over U.S. Treasury securities, and other information analysis.
| | THE GUGGENHEIM FUNDS ANNUAL REPORT | 43 |
NOTES TO FINANCIAL STATEMENTS(continued) |
In connection with futures contracts and other derivative investments, such factors may include obtaining information as to how (a) these contracts and other derivative investments trade in the futures or other derivative markets, respectively, and (b) the securities underlying these contracts and other derivative investments trade in the cash market.
(b) U.S. Government and Agency Obligations
Inflation-Indexed bonds are fixed-income securities whose principal value is periodically adjusted to the rate of inflation. The interest rate on these securities is generally fixed at issuance at a rate lower than typical bonds. Over the life of an inflation-indexed bond however, interest will be paid based on a principal value which is adjusted for inflation. Any increase in the principal amount of an inflation-indexed bond is recognized as a component of Interest on the Statement of Operations, even though principal is not received until maturity.
(c) Interests in When-Issued Securities
The Fund may purchase and sell interests in securities on a when-issued and delayed delivery basis, with payment and delivery scheduled for a future date. No income accrues to the Fund on such interests or securities in connection with such transactions prior to the date the Fund actually takes delivery of such interests or securities. These transactions are subject to market fluctuations and are subject to the risk that the value at delivery may be more or less than the trade date purchase price. Although the Fund will generally purchase these securities with the intention of acquiring such securities, they may sell such securities before the settlement date.
(d) Futures Contracts
Upon entering into a futures contract, the Fund deposits and maintains as collateral such initial margin as required by the exchange on which the transaction is affected. Pursuant to the contract, the Fund agrees to receive from or pay to the broker an amount of cash equal to the daily fluctuation in value of the contract. Such receipts or payments are known as variation margin and are recorded by the Fund as unrealized appreciation or depreciation. When the contract is closed, the Fund records a realized gain or loss equal to the difference between the value of the contract at the time it was opened and the value at the time it was closed.
(e) Swap Agreements
Swap agreements are marked-to-market daily and the change, if any, is recorded as unrealized appreciation or depreciation. Payments received or made as a result of an agreement or termination of an agreement are recognized as realized gains or losses.
Upfront payments received or made by a Fund on credit default swap agreements and interest rate swap agreements are amortized over the expected life of the agreement. Periodic payments received or paid by a Fund are recorded as realized gains or losses. Payments received or made as a result of a credit event or termination of the contract are recognized, net of a proportional amount of the upfront payment, as realized gains or losses.
44 | THE GUGGENHEIM FUNDS ANNUAL REPORT | |
NOTES TO FINANCIAL STATEMENTS(continued) |
(f) Currency Translations
The accounting records of the Fund are maintained in U.S. dollars. All assets and liabilities initially expressed in foreign currencies are converted into U.S. dollars at prevailing exchange rates. Purchases and sales of investment securities, dividend and interest income, and certain expenses are translated at the rates of exchange prevailing on the respective dates of such transactions.
Changes in the relationship of these foreign currencies to the U.S. dollar can significantly affect the value of the investments and earnings of the Fund. Foreign investments may also subject the Fund to foreign government exchange restrictions, expropriation, taxation, or other political, social or economic developments, all of which could affect the market and/or credit risk of the investments.
The Fund does not isolate that portion of the results of operations resulting from changes in the foreign exchange rates on investments from the fluctuations arising from changes in the market prices of securities held. Such fluctuations are included with the net realized gain or loss and unrealized appreciation or depreciation on investments.
Reported net realized foreign exchange gains and losses arise from sales of foreign currencies and currency gains or losses realized between the trade and settlement dates on investment transactions. Net unrealized exchange appreciation and depreciation arise from changes in the fair values of assets and liabilities other than investments in securities at the fiscal period end, resulting from changes in exchange rates.
(g) Forward Foreign Currency Exchange Contracts
The change in value of a forward foreign currency exchange contract is recorded as unrealized appreciation or depreciation until the contract is closed. When the contract is closed, the Fund records a realized gain or loss equal to the difference between the value at the time the contract was opened and the value at the time it was closed.
(h) Foreign Taxes
The Fund may be subject to foreign taxes (a portion of which may be reclaimable) on income, stock dividends, capital gains on investments or certain foreign currency transactions. All foreign taxes are recorded in accordance with the applicable foreign tax regulations and rates that exist in the foreign jurisdictions in which the Fund invests. These foreign taxes, if any, are paid by the Fund and reflected in its Statement of Operations as follows: foreign taxes withheld at source are presented as a reduction of income and foreign taxes on capital gains from sales of investments are included with the net realized gain (loss) on investments. Foreign taxes payable or deferred as of September 30, 2019, if any, are disclosed in the Fund’s Statement of Assets and Liabilities.
| | THE GUGGENHEIM FUNDS ANNUAL REPORT | 45 |
NOTES TO FINANCIAL STATEMENTS(continued) |
(i) Security Transactions
Security transactions are recorded on the trade date for financial reporting purposes. Realized gains and losses from securities transactions are recorded using the identified cost basis. Proceeds from lawsuits related to investment holdings are recorded as a reduction to cost if the securities are still held and as realized gains if no longer held in the Fund. Dividend income is recorded on the ex-dividend date, net of applicable taxes withheld by foreign countries. Taxable non-cash dividends are recorded as dividend income. Interest income, including amortization of premiums and accretion of discounts, is accrued on a daily basis. Interest income also includes paydown gains and losses on mortgage-backed and asset-backed securities.
(j) Distributions
The Fund declares dividends from investment income daily. The Fund pays its shareholders from its net investment income monthly and distributes any net capital gains that it has realized, at least annually. Distributions to shareholders are recorded on the ex-dividend date. Dividends are reinvested in additional shares, unless shareholders request payment in cash. The character of distributions made during the year from net investment income or net realized gains may differ from their ultimate characterization for U.S. federal income tax purposes.
(k) Class Allocations
Interest and dividend income, most expenses, all realized gains and losses, and all unrealized appreciation and depreciation are allocated to the classes based upon the value of the outstanding shares in each Class. Certain costs, such as distribution and service fees are charged directly to specific classes. In addition, certain expenses have been allocated to the individual Funds in the Trust based on the respective net assets of each Fund included in the Trust.
(l) Earnings Credits
Under the fee arrangement with the custodian, the Fund may earn credits based on overnight custody cash balances. These credits are utilized to reduce related custodial expenses. The custodian fees disclosed in the Statement of Operations are before the reduction in expense from the related earnings credits, if any. Earnings credits for the year ended September 30, 2019 are disclosed in the Statement of Operations.
(m) Cash
The Fund may leave cash overnight in its cash account with the custodian. Periodically, the Fund may have cash due to the custodian bank as an overdraft balance. A fee is incurred on this overdraft, calculated by multiplying the overdraft by a rate based on the federal funds rate, which was 1.90% at September 30, 2019.
46 | THE GUGGENHEIM FUNDS ANNUAL REPORT | |
NOTES TO FINANCIAL STATEMENTS(continued) |
(n) Indemnifications
Under the Fund’s organizational documents, its Trustees and Officers are indemnified against certain liabilities arising out of the performance of their duties to the Trust. In addition, throughout the normal course of business, the Fund enters into contracts that contain a variety of representations and warranties which provide general indemnifications. The Fund’s maximum exposure under these arrangements is unknown, as this would involve future claims that may be made against the Fund and/or its affiliates that have not yet occurred. However, based on experience, the Fund expects the risk of loss to be remote.
Note 2 – Derivatives
As part of its investment strategy, the Fund utilizes a variety of derivative instruments. These investments involve, to varying degrees, elements of market risk. Valuation and accounting treatment of these instruments can be found under Significant Accounting Policies in Note 1 of these Notes to Financial Statements.
Derivatives are instruments whose values depend on, or are derived from, in whole or in part, the value of one or more other assets, such as securities, currencies, commodities or indices. Derivative instruments may be used to increase investment flexibility (including to maintain cash reserves while maintaining exposure to certain other assets), for risk management (hedging) purposes, to facilitate trading, to reduce transaction costs and to pursue higher investment returns. Derivative instruments may also be used to mitigate certain investment risks, such as foreign currency exchange rate risk, interest rate risk and credit risk. U.S. GAAP requires disclosures to enable investors to better understand how and why a Fund uses derivative instruments, how these derivative instruments are accounted for and their effects on the Fund’s financial position and results of operations.
The Fund utilized derivatives for the following purposes:
Duration: the use of an instrument to manage the interest rate risk of a portfolio.
Hedge:an investment made in order to reduce the risk of adverse price movements in a security, by taking an offsetting position to protect against broad market moves.
Income: the use of any instrument that distributes cash flows typically based upon some rate of interest.
Futures Contracts
A futures contract is an agreement to purchase (long) or sell (short) an agreed amount of securities or other instruments at a set price for delivery at a future date. There are significant risks associated with a Fund’s use of futures contracts, including (i) there may be an imperfect or no correlation between the changes in market value of the underlying asset and the prices of futures contracts; (ii) there may not be a liquid secondary market for a futures contract; (iii) trading restrictions or limitations may be imposed by an exchange; and (iv) government
| | THE GUGGENHEIM FUNDS ANNUAL REPORT | 47 |
NOTES TO FINANCIAL STATEMENTS(continued) |
regulations may restrict trading in futures contracts. When investing in futures, there is minimal counterparty credit risk to a Fund because futures are exchange-traded and the exchange’s clearinghouse, as counterparty to all exchange-traded futures, guarantees against default. Cash deposits are shown as segregated cash with broker on the Statement of Assets and Liabilities; securities held as collateral are noted on the Schedule of Investments.
The following table represents the Fund’s use and volume of futures on a monthly basis:
| | | Average Notional Amount | |
Use | | Long | | | Short | |
Income | | $ | — | | | $ | — | * |
* | Futures contracts were outstanding for 25 days during the year ended September 30, 2019. The daily average outstanding notional amount of futures contracts during the period was $13,320,545. |
Swap Agreements
A swap is an agreement that obligates two parties to exchange a series of cash flows at specified intervals based upon or calculated by reference to changes in specified prices or rates for a specified amount of an underlying asset. When utilizing over-the-counter (“OTC”) swaps, the Fund bears the risk of loss of the amount expected to be received under a swap agreement in the event of the default or bankruptcy of a swap agreement counterparty or if the underlying asset declines in value. Certain standardized swaps are subject to mandatory central clearing and are executed on a multi-lateral or other trade facility platform, such as a registered exchange. There is limited counterparty credit risk with respect to centrally-cleared swaps as the transaction is facilitated through a central clearinghouse, much like exchange-traded futures contracts. Upon entering into certain centrally-cleared swap transactions, the Fund is required to deposit with its clearing broker an amount of cash or securities as an initial margin. Subsequent variation margin payments or receipts are made or received by the Fund, depending on fluctuations in the fair value of the reference entity. For a fund utilizing centrally cleared swaps, the exchange bears the risk of loss resulting from a counterparty not being able to pay. There is no guarantee that a fund or an underlying fund could eliminate its exposure under an outstanding swap agreement by entering into an offsetting swap agreement with the same or another party.
Total return swaps involve commitments where single or multiple cash flows are exchanged based on the price of an underlying reference asset (such as an index) for a fixed or variable interest rate. Total return swaps will usually be computed based on the current value of the reference asset as of the close of regular trading on the NYSE or other exchange, with the swap value being adjusted to include dividends accrued, financing charges and/or interest associated with the swap agreement. When utilizing total return swaps, the Fund bears the risk of loss of the amount expected to be received under a swap agreement in the event of the default or bankruptcy of a swap agreement counterparty or if the underlying reference asset declines in value.
48 | THE GUGGENHEIM FUNDS ANNUAL REPORT | |
NOTES TO FINANCIAL STATEMENTS(continued) |
The following table represents the Fund’s use and volume of total return swaps on a monthly basis:
| | | Average Notional Amount | |
Use | | Long | | | Short | |
Income | | $ | — | * | | $ | — | |
* | Total return swap agreements were outstanding for 40 days during the year ended September 30, 2019. The daily average outstanding notional amount of total return swap agreements during the period was $1,548,860. |
Interest rate swaps involve the exchange by the Fund with another party for its respective commitment to pay or receive a fixed or variable interest rate on a notional amount of principal. Interest rate swaps are generally centrally-cleared, but central clearing does not make interest rate swap transactions risk free.
The following table represents the Fund’s use and volume of interest rate swaps on a monthly basis:
| | | Average Notional Amount | |
Use | | Pay Floating Rate | | | Receive Floating Rate | |
Duration, Hedge, Income | | $ | 1,657,750 | | | $ | 22,144,250 | |
Credit default swaps are instruments which allow for the full or partial transfer of third party credit risk, with respect to a particular entity or entities, from one counterparty to the other. The Fund enters into credit default swaps as a “seller” or “buyer” of protection primarily to gain or reduce exposure to the investment grade and/or high yield bond market. A seller of credit default swaps is selling credit protection or assuming credit risk with respect to the underlying entity or entities. The buyer in a credit default swap is obligated to pay the seller a periodic stream of payments over the term of the contract provided that no event of default on an underlying reference obligation has occurred. If a credit event occurs, as defined under the terms of the swap agreement, the seller will either (i) pay to the buyer of protection an amount equal to the notional amount of the swap and take delivery of the referenced obligation or underlying securities comprising the referenced index or (ii) pay a net settlement amount in the form of cash or securities equal to the notional amount of the swap less the recovery value of the referenced obligation or underlying securities comprising the referenced index. The Notional Amount reflects the maximum potential amount the seller of credit protection could be required to pay to the buyer if a credit event occurs. The seller of protection receives periodic premium payments from the buyer and may also receive or pay an upfront premium adjustment to the stated periodic payments. In the event a credit default occurs on a credit default swap referencing an index, a factor adjustment will take place and the buyer of protection will receive a payment reflecting the par less the default recovery rate of the defaulted index component based on its weighting in the index. If no default occurs, the counterparty will pay the stream of payments and have no further obligations to the
| | THE GUGGENHEIM FUNDS ANNUAL REPORT | 49 |
NOTES TO FINANCIAL STATEMENTS(continued) |
fund selling the credit protection. For a fund utilizing centrally cleared credit default swaps, the exchange bears the risk of loss resulting from a counterparty not being able to pay. For OTC credit default swaps, a fund bears the risk of loss of the amount expected to be received under a swap agreement in the event of the default or bankruptcy of a swap agreement counterparty, or in the case of a credit default swap in which a fund is selling credit protection, the default of a third party issuer.
The quoted market prices and resulting market values for credit default swap agreements on securities and credit indices serve as an indicator of the current status of the payment/performance risk and represent the likelihood of an expected liability (or profit) for the credit derivative had the notional amount of the swap agreement been closed/sold as of the period end. Increasing market values, in absolute terms when compared to the notional amount of the swap, represent a deterioration of the referenced entity’s credit soundness and a greater likelihood or risk of default or other credit event occurring as defined under the terms of the agreement.
The following table represents the Fund’s use and volume of credit default swaps on a monthly basis:
| | | Average Notional Amount | |
Use | | Protection Sold | | | Protection Purchased | |
Income | | $ | — | | | $ | 34,875,833 | |
Forward Foreign Currency Exchange Contracts
A forward foreign currency exchange contract is an agreement between two parties to exchange two designated currencies at a specific time in the future. Certain types of contracts may be cash settled, in an amount equal to the change in exchange rates during the term of the contract. The contracts can be used to hedge or manage exposure to foreign currency risks with portfolio investments or to gain exposure to foreign currencies.
The market value of a forward foreign currency exchange contract changes with fluctuations in foreign currency exchange rates. Furthermore, the Fund may be exposed to risk if the counterparties cannot meet the contract terms or if the currency value changes unfavorably as compared to the U.S. dollar.
The following table represents the Fund’s use and volume of forward foreign currency exchange contracts on a monthly basis:
| | | Average Value | |
Use | | Purchased | | | Sold | |
Hedge, Income | | $ | 3,587,445 | | | $ | 64,500,214 | |
50 | THE GUGGENHEIM FUNDS ANNUAL REPORT | |
NOTES TO FINANCIAL STATEMENTS(continued) |
Derivative Investment Holdings Categorized by Risk Exposure
The following is a summary of the location of derivative investments on the Fund’s Statement of Assets and Liabilities as of September 30, 2019:
Derivative Investment Type | Asset Derivatives | Liability Derivatives |
Interest Rate contracts | Unamortized upfront premiums paid on interest rate swap agreements | Unamortized upfront premiums received on interest rate swap agreements Variation margin on futures contracts Variation margin on interest rate swap agreements |
Credit contracts | | Unamortized upfront premiums received on credit default swap agreements Unrealized depreciation on OTC swap agreements Variation margin on credit default swap agreements |
Currency contracts | Unrealized appreciation on forward foreign currency exchange contracts | Unrealized depreciation on forward foreign currency exchange contracts |
The following table sets forth the fair value of the Fund’s derivative investments categorized by primary risk exposure at September 30, 2019:
Asset Derivative Investments Value |
| | Futures
Interest Rate
Risk* | | | Swaps
Interest Rate
Risk* | | | Swaps
Credit
Risk* | | | Forward
Foreign Currency
Exchange Risk | | | Total Value at
September 30,
2019 | |
| | | $ | 62,852 | | | $ | 5,828 | | | $ | — | | | $ | 1,841,517 | | | $ | 1,910,197 | |
Liability Derivative Investments Value |
| | Futures
Interest Rate
Risk* | | | Swaps
Interest Rate
Risk* | | | Swaps
Credit
Risk* | | | Forward
Foreign Currency
Exchange Risk | | | Total Value at
September 30,
2019 | |
| | | $ | — | | | $ | 789,692 | | | $ | 490,539 | | | $ | 299,225 | | | $ | 1,579,456 | |
* | Includes cumulative appreciation (depreciation) of exchange-traded, OTC and centrally-cleared derivatves as reported on the Schedule of Investments. For exchange-traded and centrally-cleared derivatives, variation margin is reported within the Statement of Assets and Liabilities. |
| | THE GUGGENHEIM FUNDS ANNUAL REPORT | 51 |
NOTES TO FINANCIAL STATEMENTS(continued) |
The following is a summary of the location of derivative investments on the Fund’s Statement of Operations for the year ended September 30, 2019:
Derivative Investment Type | Location of Gain (Loss) on Derivatives |
Interest Rate contracts | Net realized gain (loss) on futures contracts |
| Net change in unrealized appreciation (depreciation) on futures contracts |
Credit/Interest Rate contracts | Net realized gain (loss) on swap agreements |
| Net change in unrealized appreciation (depreciation) on swap agreements |
Currency contracts | Net realized gain (loss) on forward foreign currency exchange contracts |
| | Net change in unrealized appreciation (depreciation) on forward foreign currency exchange contracts |
The following is a summary of the Fund’s realized gain (loss) and change in unrealized appreciation (depreciation) on derivative investments recognized on the Statement of Operations categorized by primary risk exposure for the year ended September 30, 2019:
Realized Gain (Loss) on Derivative Investments Recognized on the Statement of Operations |
| | Futures
Interest Rate
Risk | | | Swaps
Interest Rate
Risk | | | Swaps
Credit
Risk | | | Forward
Foreign Currency
Exchange Risk | | | Total | |
| | | $ | (97 | ) | | $ | 56,285 | | | $ | (233,000 | ) | | $ | 5,906,039 | | | $ | 5,729,227 | |
Change in Unrealized Appreciation (Depreciation) on Derivative Investments Recognized on the Statement of Operations |
| | Futures
Interest Rate
Risk | | | Swaps
Interest Rate
Risk | | | Swaps
Credit
Risk | | | Forward
Foreign Currency
Exchange Risk | | | Total | |
| | | $ | 62,852 | | | $ | (922,002 | ) | | $ | (490,539 | ) | | $ | 1,008,454 | | | $ | (341,235 | ) |
In conjunction with the use of derivative instruments, the Fund is required to maintain collateral in various forms. Depending on the financial instrument utilized and the broker involved, the Fund uses margin deposits at the broker, cash and/or securities segregated at the custodian bank, discount notes or repurchase agreements allocated to the Fund as collateral.
Foreign Investments
There are several risks associated with exposure to foreign currencies, foreign issuers and emerging markets. A fund’s indirect and direct exposure to foreign currencies subjects the Fund to the risk that those currencies will decline in value relative to the U.S. dollar, or in the case of short positions, that the U.S. dollar will decline in value relative to the currency being hedged. Currency rates in foreign countries may fluctuate significantly over short periods of time for a number of
52 | THE GUGGENHEIM FUNDS ANNUAL REPORT | |
NOTES TO FINANCIAL STATEMENTS(continued) |
reasons, including changes in interest rates and the imposition of currency controls or other political developments in the U.S. or abroad. In addition, the Fund may incur transaction costs in connection with conversions between various currencies. The Fund may, but is not obligated to, engage in currency hedging transactions, which generally involve buying currency forward, options or futures contracts. However, not all currency risks may be effectively hedged, and in some cases the costs of hedging techniques may outweigh expected benefits. In such instances, the value of securities denominated in foreign currencies can change significantly when foreign currencies strengthen or weaken relative to the U.S. dollar.
The Fund may invest in securities of foreign companies directly, or in financial instruments, such as ADRs and exchange-traded funds, which are indirectly linked to the performance of foreign issuers. Foreign markets can be more volatile than the U.S. market due to increased risks of adverse issuer, political, regulatory, market, or economic developments and can perform differently from the U.S. market. Investing in securities of foreign companies directly, or in financial instruments that are indirectly linked to the performance of foreign issuers, may involve risks not typically associated with investing in U.S. issuers. The value of securities denominated in foreign currencies, and of dividends from such securities, can change significantly when foreign currencies strengthen or weaken relative to the U.S. dollar. Foreign securities markets generally have less trading volume and less liquidity than U.S. markets, and prices in some foreign markets may fluctuate more than those of securities traded on U.S. markets. Many foreign countries lack accounting and disclosure standards comparable to those that apply to U.S. companies, and it may be more difficult to obtain reliable information regarding a foreign issuer’s financial condition and operations. Transaction costs and costs associated with custody services are generally higher for foreign securities than they are for U.S. securities. Some foreign governments levy withholding taxes against dividend and interest income. Although in some countries portions of these taxes are recoverable, the non-recovered portion will reduce the income received by the Fund.
The Trust has established counterparty credit guidelines and enters into transactions only with financial institutions of investment grade or better. The Trust monitors the counterparty credit risk.
Note 3 – Offsetting
In the normal course of business, the Fund enters into transactions subject to enforceable master netting arrangements or other similar arrangements. Generally, the right to offset in those agreements allows the Fund to counteract the exposure to a specific counterparty with collateral received from or delivered to that counterparty based on the terms of the arrangements. These arrangements provide for the right to liquidate upon the occurrence of an event of default, credit event upon merger or additional termination event.
In order to better define its contractual rights and to secure rights that will help the Fund mitigate its counterparty risk, the Fund may enter into an International Swaps and Derivatives Association, Inc. Master Agreement (“ISDA Master Agreement”) or similar agreement with its derivative
| | THE GUGGENHEIM FUNDS ANNUAL REPORT | 53 |
NOTES TO FINANCIAL STATEMENTS(continued) |
contract counterparties. An ISDA Master Agreement is a bilateral agreement between a fund and a counterparty that governs OTC derivatives, including foreign exchange contracts, and typically contains, among other things, collateral posting terms and netting provisions in the event of a default and/or termination event. The provisions of the ISDA Master Agreement typically permit a single net payment in the event of a default (close-out netting) or similar event, including the bankruptcy or insolvency of the counterparty.
For derivatives traded under an ISDA Master Agreement, the collateral requirements are typically calculated by netting the mark-to-market amount for each transaction under such agreement and comparing that amount to the value of any collateral currently pledged by the Fund and the counterparty. For financial reporting purposes, cash collateral that has been pledged to cover obligations of the Fund and cash collateral received from the counterparty, if any, are reported separately on the Statement of Assets and Liabilities as segregated cash with broker/receivable for variation margin, or payable for swap settlement/variation margin. Cash and/or securities pledged or received as collateral by the Fund in connection with an OTC derivative subject to an ISDA Master Agreement generally may not be invested, sold or rehypothecated by the counterparty or the Fund, as applicable, absent an event of default under such agreement, in which case such collateral generally may be applied towards obligations due to and payable by such counterparty or the Fund, as applicable. Generally, the amount of collateral due from or to a counterparty must exceed a minimum transfer amount threshold (e.g., $300,000) before a transfer is required to be made. To the extent amounts due to the Fund from its counterparties are not fully collateralized, contractually or otherwise, the Fund bears the risk of loss from counterparty nonperformance. The Fund attempts to mitigate counterparty risk by only entering into agreements with counterparties that they believe to be of good standing and by monitoring the financial stability of those counterparties.
For financial reporting purposes, the Fund does not offset derivative assets and derivative liabilities that are subject to netting arrangements in the Statement of Assets and Liabilities.
The following tables present derivative financial instruments and secured financing transactions that are subject to enforceable netting arrangements:
| | | | | | | | | | | | | | | Gross Amounts Not Offset
in the Statement of
Assets and Liabilities | | | | | |
Instrument | | Gross
Amounts of
Recognized
Assets1 | | | Gross
Amounts
Offset in the
Statement of
Assets and
Liabilities | | | Net Amount
of Assets
Presented on
the Statement
of Assets and
Liabilities | | | Financial
Instruments | | | Cash
Collateral
Received | | | Net
Amount | |
Forward foreign currency exchange contracts | | $ | 1,841,517 | | | $ | — | | | $ | 1,841,517 | | | $ | (372,692 | ) | | $ | (870,000 | ) | | $ | 598,825 | |
54 | THE GUGGENHEIM FUNDS ANNUAL REPORT | |
NOTES TO FINANCIAL STATEMENTS(continued) |
| | | | | | | | | | | | | | | Gross Amounts Not Offset
in the Statement of
Assets and Liabilities | | | | | |
Instrument | | Gross
Amounts of
Recognized
Liabilities1 | | | Gross
Amounts
Offset in the
Statement of
Assets and
Liabilities | | | Net Amount
of Liabilities
Presented on
the Statement
of Assets and
Liabilities | | | Financial
Instruments | | | Cash
Collateral
Pledged | | | Net
Amount | |
Forward foreign currency exchange contracts | | $ | 299,225 | | | $ | — | | | $ | 299,225 | | | $ | (249,355 | ) | | $ | — | | | $ | 49,870 | |
Credit default swap agreements | | | 187,120 | | | | — | | | | 187,120 | | | | (122,693 | ) | | | — | | | | 64,427 | |
Total return swap agreements | | | 7,655 | | | | — | | | | 7,655 | | | | (644 | ) | | | — | | | | 7,011 | |
1 | Exchange-traded or centrally-cleared derivatives are excluded from these reported amounts. |
The Fund has the right to offset deposits against any related derivative liabilities outstanding with each counterparty with the exception of exchange-traded or centrally-cleared derivatives. The following table presents deposits held by others in connection with derivative investments as of September 30, 2019.
Counterparty | Asset Type | | Cash Pledged | | | Cash Received | |
BofA Securities, Inc. | Credit default swap agreements | | $ | 243,809 | | | $ | — | |
BofA Securities, Inc. | Futures contracts | | | 89,600 | | | | — | |
BofA Securities, Inc. | Interest rate swap agreements | | | 541,234 | | | | — | |
Citibank N.A., New York | Forward foreign currency exchange contracts | | | — | | | | 550,000 | |
JPMorgan Chase Bank, N.A. | Forward foreign currency exchange contracts | | | — | | | | 320,000 | |
| | | | | 874,643 | | | | 870,000 | |
Note 4 – Fair Value Measurement
In accordance with U.S. GAAP, fair value is defined as the price that the Fund would receive to sell an investment or pay to transfer a liability in an orderly transaction with an independent buyer in the principal market, or in the absence of a principal market, the most advantageous market for the investment or liability. U.S. GAAP establishes a three-tier fair value hierarchy based on the types of inputs used to value assets and liabilities and requires corresponding disclosure. The hierarchy and the corresponding inputs are summarized below:
Level 1 — | quoted prices in active markets for identical assets or liabilities. |
Level 2 — | significant other observable inputs (for example quoted prices for securities that are similar based on characteristics such as interest rates, prepayment speeds, credit risk, etc.). |
| | THE GUGGENHEIM FUNDS ANNUAL REPORT | 55 |
NOTES TO FINANCIAL STATEMENTS(continued) |
Level 3 — | significant unobservable inputs based on the best information available under the circumstances, to the extent observable inputs are not available, which may include assumptions. |
The types of inputs available depend on a variety of factors, such as the type of security and the characteristics of the markets in which it trades, if any. Fair valuation determinations that rely on fewer or no observable inputs require greater judgment. Accordingly, fair value determinations for Level 3 securities require the greatest amount of judgment.
Independent pricing services are used to value a majority of the Fund’s investments. When values are not available from a pricing service, they will be determined using a variety of sources and techniques, including: market prices; broker quotes; and models which derive prices based on inputs such as prices of securities with comparable maturities and characteristics or based on inputs such as anticipated cash flows or collateral, spread over U.S. Treasury securities, and other information and analysis. A significant portion of the Fund’s assets and liabilities are categorized as Level 2, as indicated in this report.
Quotes from broker-dealers, adjusted for fluctuations in criteria such as credit spreads and interest rates, may also be used to value the Fund’s assets and liabilities, i.e. prices provided by a broker-dealer or other market participant who has not committed to trade at that price. Although quotes are typically received from established market participants, the Fund may not have the transparency to view the underlying inputs which support the market quotations. Significant changes in a quote would generally result in significant changes in the fair value of the security.
Certain fixed income securities are valued by obtaining a monthly quote from a broker-dealer, adjusted for fluctuations in criteria such as credit spreads and interest rates.
The inputs or methodologies used for valuing securities are not necessarily an indication of the risk associated with investing in those securities. The suitability of the techniques and sources employed to determine fair valuation are regularly monitored and subject to change.
Note 5 – Investment Advisory Agreement and Other Agreements
Under the terms of an investment advisory contract, the Fund pays GI investment advisory fees calculated at an annualized rate of 0.25% of the average daily net assets of the Fund. Prior to November 30, 2018, the Institutional Class did not pay GI Investment advisory fees. See Note 11.
GI engages external service providers to perform other necessary services for the Trust, such as audit and accounting related services, legal services, custody, printing and mailing, etc., on a pass-through basis. Such expenses are allocated to various Funds within the complex based on relative net assets.
The Fund has adopted a Distribution Plan related to the offering of A-Class shares pursuant to Rule 12b-1 under the 1940 Act. The plan provides for payments at an annual rate of 0.25% of the average daily net assets of the Fund’s A-Class shares.
56 | THE GUGGENHEIM FUNDS ANNUAL REPORT | |
NOTES TO FINANCIAL STATEMENTS(continued) |
The investment advisory contract for the Fund provides that the total expenses be limited to a percentage of average net assets for each class of shares, exclusive of brokerage costs, dividends on securities sold short, expenses of other investment companies in which the Fund invests, interest, taxes, litigation, indemnification and extraordinary expenses. The limits are listed below:
| | Limit | | | Effective
Date | | | Contract
End Date | |
A-Class | | | 0.58 | % | | | 11/30/18 | | | | 02/01/21 | |
Institutional Class | | | 0.33 | % | | | 11/30/18 | | | | 02/01/21 | |
GI is entitled to reimbursement by the Funds for fees waived or expenses reimbursed during any of the previous 36 months, beginning on the date of the expense limitation agreement, if on any day the estimated operating expenses are less than the indicated percentages. For purposes of this arrangement, GI is entitled to recoupment of previously waived fees or reimbursed expenses for 36 months from the date of the waiver or reimbursement by GI. At September 30, 2019, the amount of fees waived or expenses reimbursed that are subject to recoupment and will expire during the years ended September 30, are presented in the following table:
| | 2020 | | | 2021 | | | 2022 | | | Total | |
A-Class | | $ | — | | | $ | — | | | $ | 1,690 | | | $ | 1,690 | |
Institutional Class | | | — | | | | — | | | | 17,713 | | | | 17,713 | |
For the year ended September 30, 2019, GI recouped $1,803 from the Fund.
For the year ended September 30, 2019, GFD retained sales charges of $286,511 relating to sales of A-Class shares of the Trust.
Certain trustees and officers of the Trust are also officers of GI and/or GFD. The Trust does not compensate its officers or trustees who are officers, directors and/or employees of GI or GFD.
MUFG Investor Services (US), LLC (“MUIS”) acts as the Fund’s administrator, transfer agent and accounting agent. As administrator, transfer agent and accounting agent, MUIS is responsible for maintaining the books and records of the Fund’s securities and cash. The Bank of New York Mellon Corp. (“BNY”) acts as the Fund’s custodian. As custodian, BNY is responsible for the custody of the Fund’s assets. For providing the aforementioned administrative and accounting services, MUIS is entitled to receive a monthly fee equal to a percentage of the Fund’s average daily net assets and out of pocket expenses. For providing the aforementioned transfer agent and custodian services, MUIS and BNY are entitled to receive a monthly fee based on the number of transactions during the month and the number of accounts under management, subject to certain minimum monthly fees, and out of pocket expenses.
At September 30, 2019, GI and its affiliates owned 67% of the outstanding shares of the Fund.
| | THE GUGGENHEIM FUNDS ANNUAL REPORT | 57 |
NOTES TO FINANCIAL STATEMENTS(continued) |
Note 6 – Federal Income Tax Information
The Fund intends to comply with the provisions of Subchapter M of the Internal Revenue Code applicable to regulated investment companies and will distribute substantially all taxable net investment income and capital gains sufficient to relieve the Fund from all, or substantially all, federal income, excise and state income taxes. Therefore, no provision for federal or state income tax or federal excise tax is required.
Tax positions taken or expected to be taken in the course of preparing the Fund’s tax returns are evaluated to determine whether the tax positions are “more-likely-than-not” of being sustained by the applicable tax authority. Tax positions not deemed to meet the more-likely-than-not threshold would be recorded as a tax benefit or expense in the current year. Management has analyzed the Fund’s tax positions taken, or to be taken, on U.S. federal income tax returns for all open tax years, and has concluded that no provision for income tax is required in the Fund’s financial statements. The Fund’s U.S. federal income tax returns are subject to examination by the Internal Revenue Service for a period of three years after they are filed.
The tax character of distributions paid during the year ended September 30, 2019 was as follows:
| | Ordinary
Income | | | Long-Term
Capital Gain | | | Return
of Capital | | | Total
Distributions | |
| | | $ | 10,855,198 | | | $ | 208,327 | | | $ | — | | | $ | 11,063,525 | |
The tax character of distributions paid during the year ended September 30, 2018 was as follows:
| | Ordinary
Income | | | Long-Term
Capital Gain | | | Return
of Capital | | | Total
Distributions | |
| | | $ | 10,038,457 | | | $ | 109,391 | | | $ | — | | | $ | 10,147,848 | |
Note: For U.S. federal income tax purposes, short-term capital gain distributions are treated as ordinary income distributions.
The tax components of distributable earnings/(loss) as of September 30, 2019 were as follows:
| | Undistributed
Ordinary
Income | | | Undistributed
Long-Term
Capital Gain | | | Net Unrealized
Appreciation
(Depreciation) | | | Accumulated
Capital and
Other Losses | | | Other
Temporary
Differences | | | Total | |
| | | $ | 1,840,195 | | | $ | — | | | $ | (1,477,138 | ) | | $ | (239,516 | ) | | $ | (981,342 | ) | | $ | (857,801 | ) |
For U.S. federal income tax purposes, capital loss carryforwards represent realized losses of the Fund that may be carried forward and applied against future capital gains. Under the RIC Modernization Act of 2010, the Fund is permitted to carry forward capital losses incurred in taxable years beginning after December 22, 2010 for an unlimited period and such capital loss carryforwards will retain their character as either short-term or long-term capital losses. As of September 30, 2019, the Fund had no capital loss carryforwards.
58 | THE GUGGENHEIM FUNDS ANNUAL REPORT | |
NOTES TO FINANCIAL STATEMENTS(continued) |
Net investment income and net realized gains (losses) may differ for financial statement and tax purposes because of temporary or permanent book/tax differences. These differences are primarily due to investments in certain bonds and swap contracts, foreign currency gains and losses, and the “mark-to-market” of certain derivatives. Additional differences may result from the tax treatment of dividends payable and paydown reclasses. To the extent these differences are permanent and would require a reclassification between Paid in Capital and Total Distributable Earnings (Loss), such reclassifications are made in the period that the differences arise. These reclassifications have no effect on net assets or NAV per share.
There were no adjustments made on the Statement of Assets and Liabilities as of September 30, 2019 for permanent book/tax differences.
At September 30, 2019, the cost of investments for U.S. federal income tax purposes, the aggregate gross unrealized appreciation for all investments for which there was an excess of value over tax cost and the aggregate gross unrealized depreciation for all investments for which there was an excess of tax cost over value, were as follows:
| | Tax
Cost | | | Tax
Unrealized
Appreciation | | | Tax
Unrealized
Depreciation | | | Net
Unrealized
Depreciation | |
| | | $ | 463,468,973 | | | $ | 1,088,589 | | | $ | (2,569,363 | ) | | $ | (1,480,774 | ) |
Pursuant to U.S. federal income tax regulations applicable to regulated investment companies, the Fund has elected to treat net capital losses and certain ordinary losses realized between November 1 and September 30 of each year as occurring on the first day of the following tax year. The Fund has also elected to treat certain ordinary losses realized between January 1 and September 30 of each year as occurring on the first day of the following tax year. For the year ended September 30, 2019, the following losses reflected in the accompanying financial statements were deferred for Federal income tax purposes until October 1, 2019:
| | Ordinary | | | Capital | |
| | | $ | — | | | $ | (239,516 | ) |
Note 7 – Securities Transactions
For the year ended September 30, 2019, the cost of purchases and proceeds from sales of investment securities, excluding government securities, short-term investments and derivatives, were as follows:
| | Purchases | | | Sales | |
| | | $ | 165,595,518 | | | $ | 117,221,086 | |
| | THE GUGGENHEIM FUNDS ANNUAL REPORT | 59 |
NOTES TO FINANCIAL STATEMENTS(continued) |
For the year ended September 30, 2019, the cost of purchases and proceeds from the sales of government securities were as follows:
| | Purchases | | | Sales | |
| | | $ | 13,409,424 | | | $ | — | |
The Fund is permitted to purchase or sell securities from or to certain affiliated funds under specified conditions outlined in procedures adopted by the Board. The procedures have been designed to ensure that any purchase or sale of securities by the Fund from or to another fund or portfolio that is or could be considered an affiliate by virtue of having a common investment adviser (or affiliated investment advisers), common trustees and/or common officers complies with Rule 17a-7 of the 1940 Act. Further, as defined under these procedures, each transaction is effected at the current market price to save costs, where permissible. For the year ended September 30, 2019, the Fund engaged in purchases and sales of securities, pursuant to Rule 17a-7 of the 1940 Act, as follows:
| | Purchases | | | Sales | | | Realized
Gain (Loss) | |
| | | $ | 510,500 | | | $ | — | | | $ | — | |
Note 8 – Line of Credit
The Trust, along with other affiliated trusts, secured a 364-day committed, $1,065,000,000 line of credit from Citibank, N.A., which was in place through October 5, 2018, at which time the line of credit was renewed with an increased commitment amount of $1,205,000,000. On October 4, 2019, the line of credit agreement was renewed with an increased commitment amount of $1,230,000,000. A Fund may draw (borrow) from the line of credit as a temporary measure for emergency purposes, to facilitate redemption requests, or for other short-term liquidity purposes consistent with the Fund’s investment objective and program. For example, it may be advantageous for the Fund to borrow money rather than sell existing portfolio positions to meet redemption requests. Fees related to borrowings, if any, vary under this arrangement between the greater of Citibank’s “base rate”, LIBOR plus 1%, or the federal funds rate plus 1/2 of 1%.
The commitment fee that may be paid by the Fund is at an annualized rate of 0.15% of the average daily amount of its allocated unused commitment amount. The allocated commitment fee amount for the Fund is referenced in the Statement of Operations under “Line of credit fees” or included within “Miscellaneous.” The Fund did not have any borrowings under this agreement as of and for the year ended September 30, 2019.
Note 9 – Recent Regulatory Reporting Updates
In August 2018, the Financial Accounting Standards Board issued an Accounting Standards Update, ASU 2018-13, Fair Value Measurement (Topic 820), Disclosure Framework - Changes to the Disclosure Requirements for Fair Value Measurement (the “2018 ASU”) which adds, modifies
60 | THE GUGGENHEIM FUNDS ANNUAL REPORT | |
NOTES TO FINANCIAL STATEMENTS(concluded) |
and removes disclosure requirements related to certain aspects of fair value measurement. The 2018 ASU is effective for fiscal years, and interim periods within those fiscal years, beginning after December 15, 2019. Early adoption is permitted. As of September 30, 2019, the Fund has fully adopted the provisions of the 2018 ASU, which did not have a material impact on the Fund’s financial statements and related disclosures or impact the Fund’s net assets or results of operations.
Note 10 – Recent Accounting Pronouncements
In March 2017, the Financial Accounting Standards Board issued an Accounting Standards Update, ASU 2017-08, Receivables – Nonrefundable Fees and Other Costs (Subtopic 310-20), Premium Amortization on Purchased Callable Debt Securities (the “2017 ASU”) which amends the amortization period for certain purchased callable debt securities held at a premium, shortening such period to the earliest call date. The 2017 ASU does not require any accounting change for debt securities held at a discount; the discount continues to be amortized to maturity. The 2017 ASU is effective for fiscal years, and interim periods within those fiscal years, beginning after December 15, 2018. At this time, management is evaluating the implications of these changes on the financial statements.
Note 11 – Merger
On November 14, 2018, the Board approved the reorganization of Guggenheim Strategy Fund I with and into the Guggenheim Ultra Short Duration Fund, a newly organized series of Guggenheim Funds Trust. The reorganization of Guggenheim Strategy Fund I took place on November 30, 2018. For financial reporting purposes, Guggenheim Strategy Fund I is the accounting survivor in the reorganization and, as such, its financial and performance history prior to the reorganization has been carried forward and reflected in Guggenheim Ultra Short Duration Fund’s financial statements and financial highlights. In conjunction with the reorganization, shareholders of Guggenheim Strategy Fund I received Institutional Class shares of Guggenheim Ultra Short Duration Fund at a ratio of 2.501601322 shares for every 1 share of Guggenheim Strategy Fund I. The effect of this reorganization resulted in an increase in the number of shares outstanding and a corresponding decrease in the net asset value per share. The capital share activity in the Statements of Changes in Net Assets for the year ended September 30, 2018 and the period October 1, 2018 to November 30, 2018, and the per share data in the Financial Highlights for the years ended September 30, 2015 through September 30, 2018 and the period October 1, 2018 to November 30, 2018 have been given retroactive effect to reflect the ratio of shares issued in the reorganization. There were no changes in net assets, results of operations or total return as a result of these transactions.
Note 12 – Subsequent Events
The Fund evaluated subsequent events through the date the financial statements were available for issue and determined there were no material events that would require adjustment to or disclosure in the Fund’s financial statements.
| | THE GUGGENHEIM FUNDS ANNUAL REPORT | 61 |
REPORT OF INDEPENDENT REGISTERED PUBLIC ACCOUNTING FIRM |
To the Shareholders and the Board of Trustees of Guggenheim Ultra Short Duration Fund
Opinion on the Financial Statements
We have audited the accompanying statement of assets and liabilities of Guggenheim Ultra Short Duration Fund (the “Fund”), (one of the funds constituting Guggenheim Funds Trust (the “Trust”)), including the schedule of investments, as of September 30, 2019, and the related statement of operations for the year then ended, the statements of changes in net assets for each of the two years in the period then ended, the financial highlights for each of the five years in the period then ended and the related notes (collectively referred to as the “financial statements”). In our opinion, the financial statements present fairly, in all material respects, the financial position of the Fund (one of the funds constituting Guggenheim Funds Trust) at September 30, 2019, the results of its operations for the year then ended, the changes in its net assets for each of the two years in the period then ended and its financial highlights for each of the five years in the period then ended, in conformity with U.S. generally accepted accounting principles.
Basis for Opinion
These financial statements are the responsibility of the Trust’s management. Our responsibility is to express an opinion on the Fund’s financial statements based on our audits. We are a public accounting firm registered with the Public Company Accounting Oversight Board (United States) (“PCAOB”) and are required to be independent with respect to the Trust in accordance with the U.S. federal securities laws and the applicable rules and regulations of the Securities and Exchange Commission and the PCAOB.
We conducted our audits in accordance with the standards of the PCAOB. Those standards require that we plan and perform the audit to obtain reasonable assurance about whether the financial statements are free of material misstatement, whether due to error or fraud. The Trust is not required to have, nor were we engaged to perform, an audit of the Trust’s internal control over financial reporting. As part of our audits, we are required to obtain an understanding of internal control over financial reporting, but not for the purpose of expressing an opinion on the effectiveness of the Trust’s internal control over financial reporting. Accordingly, we express no such opinion.
Our audits included performing procedures to assess the risks of material misstatement of the financial statements, whether due to error or fraud, and performing procedures that respond to those risks. Such procedures included examining, on a test basis, evidence regarding the amounts and disclosures in the financial statements. Our procedures included confirmation of securities owned as of September 30, 2019, by correspondence with the custodian and brokers or by other appropriate auditing procedures where replies from brokers were not received.
62 | THE GUGGENHEIM FUNDS ANNUAL REPORT | |
REPORT OF INDEPENDENT REGISTERED PUBLIC ACCOUNTING FIRM(concluded) |
Our audits also included evaluating the accounting principles used and significant estimates made by management, as well as evaluating the overall presentation of the financial statements. We believe that our audits provide a reasonable basis for our opinion.
We have served as the auditor of one or more Guggenheim investment companies since 1979.

Tysons, Virginia
November 26, 2019
| | THE GUGGENHEIM FUNDS ANNUAL REPORT | 63 |
OTHER INFORMATION(Unaudited) |
Federal Income Tax Information
This information is being provided as required by the Internal Revenue Code. Amounts shown may differ from those elsewhere in the report because of differences in tax and financial reporting practice.
In January 2020, shareholders will be advised on IRS Form 1099 DIV or substitute 1099 DIV as to the federal tax status of the distributions received by shareholders in the calendar year 2019.
The Fund’s investment income (dividend income plus short-term gains, if any) qualifies as follows:
Of the taxable ordinary income distributions paid during the fiscal year ended September 30, 2019, the Fund had the corresponding percentages qualify as interest related dividends and qualified short-term capital gains as permitted by IRC Section 871(k)(1) and IRC Section 871(k)(2), respectively. See qualified interest income and qualified short-term capital gain columns, respectively, in the table below.
| | Qualified
Interest
Income | | | Qualified
Short-Term
Capital Gain | |
| | | | 73.70 | % | | | 100.00 | % |
With respect to the taxable year ended September 30, 2019, the Fund hereby designates as capital gain dividends the amount listed below, or, if subsequently determined to be different, the net capital gain of such year:
| | From long-term capital gain: | |
| | | $ | 208,327 | |
Proxy Voting Information
A description of the policies and procedures that the Trust uses to determine how to vote proxies relating to securities held in the Fund’s portfolios is available, without charge and upon request, by calling 800.820.0888. This information is also available from the EDGAR database on the SEC’s website at https://www.sec.gov.
Information regarding how the Fund’s voted proxies relating to portfolio securities during the most recent 12-month period ended June 30 is available without charge, upon request, by calling 800.820.0888. This information is also available from the EDGAR database on the SEC’s website at https://www.sec.gov.
64 | THE GUGGENHEIM FUNDS ANNUAL REPORT | |
OTHER INFORMATION(Unaudited)(continued) |
Special Meeting of Shareholders — Voting Results
A joint special meeting of shareholders of the Trust was held on October 28, 2019 to elect the following ten nominees to the Board of Trustees of the Trust: Randall C. Barnes, Angela Brock-Kyle, Donald A. Chubb, Jr., Jerry B. Farley, Roman Friedrich III, Thomas F. Lydon, Jr., Ronald A. Nyberg, Sandra G. Sponem, Ronald E. Toupin, Jr. and Amy J. Lee. At the meeting, the following votes were recorded:
Nominee | | Shares For | | | Shares Withheld | |
Randall C. Barnes | | | 919,263,831 | | | | 7,335,759 | |
Angela Brock-Kyle | | | 919,775,822 | | | | 6,823,768 | |
Donald A. Chubb, Jr. | | | 915,120,874 | | | | 11,478,716 | |
Jerry B. Farley | | | 915,377,483 | | | | 11,222,107 | |
Roman Friedrich III | | | 918,807,442 | | | | 7,792,148 | |
Thomas F. Lydon, Jr. | | | 919,122,642 | | | | 7,476,948 | |
Ronald A. Nyberg | | | 918,889,679 | | | | 7,709,911 | |
Sandra G. Sponem | | | 919,600,708 | | | | 6,998,882 | |
Ronald E. Toupin, Jr. | | | 919,043,208 | | | | 7,556,382 | |
Amy J. Lee | | | 919,943,855 | | | | 6,655,735 | |
Sector Classification
Information in the Schedule of Investments is categorized by sectors using sector-level Classifications defined by the Bloomberg Industry Classification System, a widely recognized industry classification system provider. The Fund’s registration statement has investment policies relating to concentration in specific sectors/industries. For purposes of these investment policies, the Fund usually classifies sectors/industries based on industry-level Classifications used by widely recognized industry classification system providers such as Bloomberg Industry Classification System, Global Industry Classification Standards and Barclays Global Classification Scheme.
Quarterly Portfolio Schedules Information
The Trust files its complete schedule of portfolio holdings with the SEC for the first and third quarters of each fiscal year as an exhibit to its reports on Form N-PORT, and for reporting periods ended prior to March 31, 2019, filed such information on Form N-Q. The Fund’s Forms N-PORT and N-Q are available on the SEC’s website at https://www.sec.gov. The Fund’s Forms N-PORT and N-Q may be reviewed and copied at the SEC’s Public Reference Room in Washington, DC, and that information on the operation of the Public Reference Room may be obtained by calling 800-SEC-0330. Copies of the portfolio holdings are also available to shareholders, without charge and upon request, by calling 800.820.0888.
| | THE GUGGENHEIM FUNDS ANNUAL REPORT | 65 |
OTHER INFORMATION(Unaudited)(continued) |
Report of the Guggenheim Funds Trust Contracts Review Committee
Guggenheim Funds Trust (the “Trust”) was organized as a Delaware statutory trust on November 8, 2013, and is registered as an open-end management investment company under the Investment Company Act of 1940, as amended (the “1940 Act”). The Trust includes the following series:
● Guggenheim Alpha Opportunity Fund (“Alpha Opportunity Fund”) ● Guggenheim Diversified Income Fund (“Diversified Income Fund”) ● Guggenheim High Yield Fund (“High Yield Fund”) ● Guggenheim Large Cap Value Fund (“Large Cap Value Fund”) ● Guggenheim Macro Opportunities Fund (“Macro Opportunities Fund”) ● Guggenheim SMid Cap Value Fund (“SMid Cap Value Fund”) ● Guggenheim Municipal Income Fund (“Municipal Income Fund”) ● Guggenheim Small Cap Value Fund (“Small Cap Value Fund”) ● Guggenheim StylePlus—Mid Growth Fund (“StylePlus—Mid Growth Fund”) ● Guggenheim Ultra Short Duration Fund (“Ultra Short Duration Fund”) | ● Guggenheim Capital Stewardship Fund (“Capital Stewardship Fund”) ● Guggenheim Floating Rate Strategies Fund (“Floating Rate Strategies Fund”) ● Guggenheim Investment Grade Bond Fund (“Investment Grade Bond Fund”) ● Guggenheim Limited Duration Fund (“Limited Duration Fund”) ● Guggenheim Market Neutral Real Estate Fund (“Market Neutral Real Estate Fund”) ● Guggenheim SMid Cap Value Institutional Fund (“SMid Cap Value Institutional Fund”) ● Guggenheim Risk Managed Real Estate Fund (“Risk Managed Real Estate Fund”) ● Guggenheim StylePlus—Large Core Fund (“StylePlus—Large Core Fund”) ● Guggenheim Total Return Bond Fund (“Total Return Bond Fund”) ● Guggenheim World Equity Income Fund (“World Equity Income Fund”) |
Security Investors, LLC (“Security Investors”), an indirect subsidiary of Guggenheim Partners, LLC, a privately-held, global investment and advisory firm (“Guggenheim Partners”), serves as investment adviser to each of: (i) Alpha Opportunity Fund; (ii) High Yield Fund; (iii) Investment Grade Bond Fund; (iv) Large Cap Value Fund; (v) SMid Cap Value Fund; (vi) SMid Cap Value Institutional Fund; (vii) Municipal Income Fund; (viii) Small Cap Value Fund; (ix) StylePlus—Large Core Fund; (x) StylePlus—Mid Growth Fund; and (xi) World Equity Income Fund (collectively, the “SI-Advised Funds”). (Guggenheim Partners, Security Investors, Guggenheim Partners Investment Management, LLC (“GPIM”) and their affiliates may be referred to herein collectively
66 | THE GUGGENHEIM FUNDS ANNUAL REPORT | |
OTHER INFORMATION(Unaudited)(continued) |
as “Guggenheim.” Security Investors and GPIM are also known as “Guggenheim Investments,” the global asset management and investment advisory division of Guggenheim Partners that includes other affiliated investment management businesses.)
Under the terms of investment management agreements between Security Investors and the Trust, with respect to the SI-Advised Funds, Security Investors also is responsible for overseeing the activities of GPIM, an indirect subsidiary of Guggenheim Partners, with respect to its service as investment sub-adviser to Municipal Income Fund, pursuant to an investment sub-advisory agreement between Security Investors and GPIM (the “GPIM Sub-Advisory Agreement”).
GPIM serves as investment adviser with respect to each of: (i) Diversified Income Fund; (ii) Floating Rate Strategies Fund; (iii) Limited Duration Fund; (iv) Macro Opportunities Fund; (v) Market Neutral Real Estate Fund; (vi) Risk Managed Real Estate Fund; (vii) Total Return Bond Fund; and (viii) Ultra Short Duration Fund (collectively, the “GPIM-Advised Funds” and together with the SI-Advised Funds, the “Funds” and individually, a “Fund”).1 Under the supervision of the Board of Trustees of the Trust (the “Board,” with the members of the Board referred to individually as the “Trustees”), the Advisers regularly provide (or, as applicable, oversee the provision of) investment research, advice and supervision, along with a continuous investment program for the Funds, and direct the purchase and sale of securities and other investments for each Fund’s portfolio. GPIM also serves as investment adviser for the Capital Stewardship Fund, which is addressed in a separate report.2
Each of the Advisory Agreements continues in effect from year to year provided that such continuance is specifically approved at least annually by (i) the Board or a majority of the outstanding voting securities (as defined in the 1940 Act) of each Fund, and, in either event, (ii) the vote of a majority of the Trustees who are not “interested person[s],” as defined by the 1940 Act, of the Trust (the “Independent Trustees”) casting votes in person at a meeting called for such purpose. At meetings held in person on April 25, 2019 (the “April Meeting”) and on May 21, 2019 (the “May Meeting”), the members of the Contracts Review Committee of the Board (the “Committee”), consisting solely of the Independent Trustees, met separately from Guggenheim to consider the proposed renewal of the Agreements in connection with the Committee’s annual contract review schedule.
1 | The investment management agreements pertaining to the SI-Advised Funds and the investment management agreements pertaining to the GPIM-Advised Funds are referred to herein together as the “Advisory Agreements” and, together with the GPIM Sub-Advisory Agreement, as the “Agreements.” In addition, unless the context indicates otherwise, GPIM, with respect to its service as investment adviser to the GPIM-Advised Funds, and Security Investors as to the SI-Advised Funds, are each referred to herein as the “Adviser” and together, the “Advisers.” |
2 | Because shares of the Capital Stewardship Fund are only offered for subscription and are held by a limited number of institutional/bank investors, and the Fund issues a shareholder report separate from the other series of the Trust, the factors considered by the Committee in evaluating the proposed renewal of an investment management agreement pertaining to the Capital Stewardship Fund, and the Sub-Advisory Agreement with Concinnity Advisors, LP, are addressed in a separate report of the Committee. Accordingly, references to the “Funds” should be understood as referring to all series of the Trust, excluding Capital Stewardship Fund. |
| | THE GUGGENHEIM FUNDS ANNUAL REPORT | 67 |
OTHER INFORMATION(Unaudited)(continued) |
As part of its review process, the Committee was represented by independent legal counsel to the Independent Trustees (“Independent Legal Counsel”), from whom the Independent Trustees received separate legal advice and with whom they met separately. Independent Legal Counsel reviewed and discussed with the Committee various key aspects of the Trustees’ legal responsibilities relating to the proposed renewal of the Agreements and other principal contracts. The Committee took into account various materials received from Guggenheim and Independent Legal Counsel. Recognizing that the evaluation process with respect to the services provided by Guggenheim is an ongoing one, the Committee also considered the variety of written materials, reports and oral presentations the Board receives throughout the year regarding performance and operating results of the Funds and other information relevant to its evaluation of the Agreements.
In connection with the contract review process, FUSE Research Network LLC (“FUSE”), an independent, third-party research provider, was engaged to prepare advisory contract renewal reports designed specifically to help the Board fulfill its advisory contract renewal responsibilities. The objective of the reports is to present the subject funds’ relative position regarding fees, expenses and total return performance, with peer group and universe comparisons. The Committee assessed the data provided in the FUSE reports as well as commentary presented by Guggenheim, including, among other things, a summary of notable distinctions between certain Funds and the applicable peer group identified in the FUSE reports and explanations for custom peer groups created for certain Funds that do not fit well into any particular category.
In addition, Guggenheim provided materials and data in response to formal requests for information sent by Independent Legal Counsel on behalf of the Independent Trustees. Guggenheim also made a presentation at the April Meeting. Throughout the process, the Committee asked questions of management and requested certain additional information, which Guggenheim provided (collectively with the foregoing reports and materials, the “Contract Review Materials”). The Committee considered the Contract Review Materials in the context of its accumulated experience governing the Trust and weighed the factors and standards discussed with Independent Legal Counsel.
Following an analysis and discussion of relevant factors, including those identified below, and in the exercise of its business judgment, the Committee concluded that it was in the best interest of each Fund to recommend that the Board approve the renewal of each of the Advisory Agreements and the GPIM Sub-Advisory Agreement for an additional annual term.
Advisory Agreements
Nature, Extent and Quality of Services Provided by each Adviser: With respect to the nature, extent and quality of services currently provided by each Adviser, the Committee considered the qualifications, experience and skills of key personnel performing services for the Funds, including those personnel providing compliance and risk oversight, as well as the supervisors and reporting lines for such personnel. The Committee considered Guggenheim’s
68 | THE GUGGENHEIM FUNDS ANNUAL REPORT | |
OTHER INFORMATION(Unaudited)(continued) |
resources and related efforts to retain, attract and motivate capable personnel to serve the Funds. In evaluating Guggenheim’s resources and capabilities, the Committee considered Guggenheim’s commitment to focusing on, and investing resources in support of, the Funds.
The Committee’s review of the services provided by Guggenheim to the Funds included consideration of Guggenheim’s investment processes and resulting performance, portfolio oversight and risk management, and the related regular quarterly reports and presentations received by the Board. The Committee took into account the risks borne by Guggenheim in sponsoring and providing services to the Funds, including entrepreneurial, legal and regulatory risks. The Committee considered the resources dedicated by Guggenheim to compliance functions and the reporting made to the Board by Guggenheim compliance personnel regarding Guggenheim’s adherence to regulatory requirements. The Committee also considered the regular reports the Board receives from the Trust’s Chief Compliance Officer regarding compliance policies and procedures established pursuant to Rule 38a-1 under the 1940 Act.
In connection with the Committee’s evaluation of the overall package of services provided by Guggenheim, the Committee considered Guggenheim’s administrative services, including its role in supervising, monitoring, coordinating and evaluating the various services provided by the fund administrator, transfer agent, distributor, custodian and other service providers to the Funds. The Committee evaluated the Office of Chief Financial Officer (the “OCFO”), established to oversee the fund administration, accounting and transfer agency services provided to the Funds, including the OCFO’s resources, personnel and services provided.
With respect to Municipal Income Fund, the Committee noted that, although Security Investors delegated responsibility for the investment and reinvestment of the Fund’s assets to the Sub-Adviser, as affiliated companies, both the Adviser and Sub-Adviser are part of the Guggenheim organization. Further, the Committee took into account Guggenheim’s explanation that investment advisory-related services are provided by many Guggenheim employees under different related legal entities and thus, the services provided by the Adviser on the one hand and the Sub-Adviser on the other, as well as the risks assumed by each party, cannot be ascribed to distinct legal entities.3 As a result, the Committee did not evaluate the services provided to Municipal Income Fund under the Advisory Agreement and the GPIM Sub-Advisory Agreement separately.
With respect to Guggenheim’s resources and the ability of each Adviser to carry out its responsibilities under the applicable Advisory Agreement, the Chief Financial Officer of Guggenheim Investments reviewed with the Committee financial information concerning the holding company for Guggenheim Investments, Guggenheim Partners Investment Management
3 | Consequently, except where the context indicates otherwise, references to “Adviser” or “Sub-Adviser” should be understood as referring to Guggenheim Investments generally and the services it provides under both Agreements. |
| | THE GUGGENHEIM FUNDS ANNUAL REPORT | 69 |
OTHER INFORMATION(Unaudited)(continued) |
Holdings, LLC (“GPIMH”), and the various entities comprising Guggenheim Investments, and provided the audited consolidated financial statements of GPIMH. (Thereafter, the Committee received the audited consolidated financial statements of GPIM.)
The Committee also considered the acceptability of the terms of each Advisory Agreement, including the scope of services required to be performed by each Adviser.
Based on the foregoing, and based on other information received (both oral and written) at the April Meeting and the May Meeting, as well as other considerations, including the Committee’s knowledge of how each Adviser performs its duties obtained through Board meetings, discussions and reports throughout the year, the Committee concluded that each Adviser and its personnel were qualified to serve the Funds in such capacity and may reasonably be expected to continue to provide a high quality of services under each Advisory Agreement with respect to the Funds.
Investment Performance:The Committee received, for each Fund, investment returns for the since-inception, ten-year, five-year, three-year, one-year and three-month periods ended December 31, 2018, as applicable. In addition, the Committee received a comparison of each Fund’s performance to the performance of a benchmark, a universe of funds and a narrower peer group of similar funds based on asset levels as identified by FUSE, in each case for the same periods, as applicable. The Committee also received from FUSE a description of the methodology for identifying each Fund’s peer group and universe for performance and expense comparisons.
In seeking to evaluate Fund performance over a full market cycle, the Committee focused its attention on five-year and three-year performance rankings as compared to the relevant universe of funds. The Committee considered more recent performance periods for those Funds that were recently launched, as well as in circumstances in which enhancements were being made to the portfolio management processes or techniques employed for a Fund. Except as to the individual Funds discussed below, the Committee observed that the returns of each Fund’s (other than SMid Cap Value Fund) Institutional Class shares and SMid Cap Value Fund’s Class A shares ranked in the third quartile or better of such Fund’s performance universe for each of the relevant periods considered.
In addition, the Committee made the following observations:
Municipal Income Fund:The returns of the Fund’s Institutional Class shares ranked in the 55th and 82nd percentiles of its performance universe for the five-year and three-year periods ended December 31, 2018, respectively. The Committee noted management’s explanation that the Fund’s increased allocation to floating rate securities in 2016 and the Fund’s more conservative investment approach detracted from performance that year, impacting trailing returns for five-year and three-year periods. In light of the foregoing, the Committee also considered the more recent one-year and three-month periods ended December 31, 2018, and observed that the returns of Fund’s Institutional Class shares ranked in the 30th and 11th percentiles, respectively, of its
70 | THE GUGGENHEIM FUNDS ANNUAL REPORT | |
OTHER INFORMATION(Unaudited)(continued) |
performance universe. The Committee also took into account management’s statement that it expects the Fund’s performance to continue to improve going forward as it anticipates the effects of recent tax reform and idiosyncratic risks.
Small Cap Value Fund:The returns of the Fund’s Institutional Class shares ranked in the 79th and 56th percentiles of its performance universe for the five-year and three-year periods ended December 31, 2018, respectively. The Committee noted measures taken by the Adviser to remedy longer-term relative underperformance with respect to the Value Funds strategy, including strategy enhancements such as implementation of a refined stock selection process and additional risk controls to enforce the strategy’s sell discipline. In light of the foregoing, the Committee also considered the more recent one-year and three-month periods ended December 31, 2018, and observed that the returns of Fund’s Institutional Class shares ranked in the 19th and 20th percentiles, respectively, of its performance universe.
After reviewing the foregoing and related factors, the Committee concluded that: (i) each Fund’s performance was acceptable; or (ii) it was satisfied with Guggenheim’s responses and efforts to improve investment performance.
Comparative Fees, Costs of Services Provided and the Profits Realized by each Adviser from Its Relationship with the Funds:The Committee compared each Fund’s contractual advisory fee, net effective management fee and total net expense ratio to the applicable peer group. The Committee also reviewed the median advisory fees and expense ratios, including expense ratio components (e.g., transfer agency fees, administration fees, other operating expenses, distribution fees and fee waivers/reimbursements), of the peer group of funds.
As part of its evaluation of each Fund’s advisory fee, the Committee considered how such fees compared to the advisory fee charged by the applicable Adviser to one or more other clients that it manages pursuant to similar investment strategies, to the extent applicable, noting that, in certain instances, Guggenheim charges a lower advisory fee to such other clients. In this connection, the Committee considered, among other things, Guggenheim’s representations about the significant differences between managing mutual funds as compared to other types of accounts. The Committee also considered Guggenheim’s explanation that lower fees are charged in certain instances due to various other factors, including the scope of contract, type of investors, fee structure, applicable legal, governance and capital structures, tax status and historical pricing reasons. In addition, the Committee took into account Guggenheim’s discussion of the entrepreneurial, legal and regulatory risks it faces when offering the Funds as compared to other types of accounts. The Committee concluded that the information it received demonstrated that the aggregate services provided to, or the specific circumstances of, each Fund were sufficiently different from the services provided to, or the specific circumstances of, other clients with similar investment strategies and/or the risks borne by Guggenheim were sufficiently greater than those associated with managing other clients with similar investment strategies to support the difference in fees.
| | THE GUGGENHEIM FUNDS ANNUAL REPORT | 71 |
OTHER INFORMATION(Unaudited)(continued) |
In further considering the comparative fee and expense data presented in the Contract Review Materials and addressed by Guggenheim, the Committee took into account those Funds with currently effective expense limitation agreements with the Adviser. Except as to the individual Funds discussed below, the Committee observed that each Fund’s average contractual advisory fee percentile rank across all share classes of the Fund, net effective management fee4 and asset-weighted total net expense ratio each rank in the third quartile or better of such Fund’s peer group.
In addition, the Committee made the following observations:
Diversified Income Fund:The average contractual advisory fee percentile rank across all share classes of the Fund is in the fourth quartile (78th percentile) of its peer group. The Fund’s net effective management fee ranks in the first quartile (1st percentile) of its peer group. The Committee considered that the Fund’s asset weighted total net expense ratio ranks in the second quartile (38th percentile) of its peer group. The Committee also took into account the Adviser’s statement that the Fund’s currently effective expense limitation agreement with the Adviser is intended to limit the impact of the Fund’s small size.
Floating Rate Strategies Fund:The average contractual advisory fee percentile rank across all share classes of the Fund is in the fourth quartile (92nd percentile) of its peer group. The Fund’s net effective management fee ranks in the fourth quartile (76th percentile) of its peer group. The Committee considered that the Fund’s asset weighted total net expense ratio ranks in the third quartile (58th percentile) of its peer group. The Committee also considered the Adviser’s statement explaining the higher fees that performance is driven by a unique investment approach that requires significant resources. In this regard, the Committee took into consideration the Fund’s strong investment performance for the five-year period ended December 31, 2018. In addition, the Committee noted the Adviser’s statement that the net effective management fee includes 0.08% in administration fees that is not paid to the Adviser. The Committee also took into account the Fund’s currently effective expense limitation agreement with the Adviser.
High Yield Fund:The average contractual advisory fee percentile rank across all share classes of the Fund is in the third quartile (54th percentile) of its peer group. The Fund’s net effective management fee ranks in the fourth quartile (76th percentile) of its peer group. The Fund’s asset weighted total net expense ratio ranks in the third quartile (73rd percentile) of its peer group. The Committee considered the Adviser’s statement explaining the higher fees that performance is driven by a unique investment approach that requires significant resources. In this regard, the Committee took into consideration the Fund’s strong investment performance for the five-year and three-year periods ended December 31, 2018. In addition, the Committee noted the Adviser’s
4 | The “net effective management fee” for each Fund represents the combined effective advisory fee and administration fee as a percentage of average net assets for the latest fiscal year, after any waivers and/or reimbursements, based on the Fund’s class level peer group percent rank, weighted by class level assets under management. |
72 | THE GUGGENHEIM FUNDS ANNUAL REPORT | |
OTHER INFORMATION(Unaudited)(continued) |
statement that the net effective management fee includes 0.08% in administration fees that is not paid to the Adviser. The Committee also took into account the Fund’s currently effective expense limitation agreement with the Adviser.
Limited Duration Fund:The average contractual advisory fee percentile rank across all share classes of the Fund is in the third quartile (63rd percentile) of its peer group. The Fund’s net effective management fee ranks in the fourth quartile (80th percentile) of its peer group. The Committee considered that the Fund’s asset weighted total net expense ratio ranks in the third quartile (51st percentile) of its peer group. The Committee also considered the Adviser’s statement explaining the higher fees that performance is driven by a unique investment approach that requires significant resources. In this regard, the Committee took into consideration the Fund’s strong investment performance for the five-year and three-year periods ended December 31, 2018. In addition, the Committee noted the Adviser’s statement that the net effective management fee includes 0.08% in administration fees that is not paid to the Adviser. The Committee also took into account the Fund’s currently effective expense limitation agreement with the Adviser.
Macro Opportunities Fund:The average contractual advisory fee percentile rank across all share classes of the Fund, the Fund’s net effective management fee and the Fund’s asset weighted total net expense ratio each rank in the fourth quartile (93rd, 81st and 83rd percentiles, respectively) of its peer group. The Committee noted that the Fund is categorized as a non-traditional bond fund which seeks to add value by investing in many non-traditional securities outside of fixed income, including equities, currencies, commodities and derivatives. The Committee considered the Adviser’s statement explaining the higher fees and expenses that performance is driven by a unique investment approach that requires significant resources. In this regard, the Committee took into consideration the Fund’s strong investment performance for the five-year and three-year periods ended December 31, 2018. The Committee also took into account the Fund’s currently effective expense limitation agreement with the Adviser. The Committee also noted that, in connection with the contract review process, the Adviser formalized an existing expense waiver agreement with the Fund pursuant to which the Adviser waives any Fund expenses attributable to the Fund’s investment in Alpha Opportunity Fund.
SMid Cap Value Institutional Fund:The Fund’s contractual advisory fee ranks in the first quartile (7th percentile) of its peer group. The Fund’s net effective management fee and asset weighted total net expense ratio each rank in the fourth quartile (79th and 86th percentiles, respectively) of its peer group. The Committee considered the Adviser’s statement explaining the higher fees and expenses that it has made adjustments to the strategy of the Fund over the last few years incorporating a more systematic approach in order to improve investment performance. In this regard, the Committee took into consideration the Fund’s strong investment performance for the three-year period ended December 31, 2018. In addition, the Committee noted the Adviser’s statement that the net effective management fee includes 0.08% in administration fees that is not paid to the Adviser. The Committee also considered the Adviser’s statement that the Fund has
| | THE GUGGENHEIM FUNDS ANNUAL REPORT | 73 |
OTHER INFORMATION(Unaudited)(continued) |
continued to experience outflows resulting in lower relative assets to peers and associated higher other operating expenses, and that the Adviser is evaluating strategic measures to improve the Fund’s positioning.
Risk Managed Real Estate Fund:The average contractual advisory fee percentile rank across all share classes of the Fund is in the first quartile (22nd percentile) of its peer group. The Fund’s net effective management fee ranks in the fourth quartile (78th percentile) of its peer group. The Committee considered that the Fund’s asset weighted total net expense ratio ranks in the second quartile (47th percentile) of its peer group. The Committee took into consideration the Fund’s strong investment performance for the three-year and one-year periods ended December 31, 2018. The Committee also took into account the Fund’s currently effective expense limitation agreement with the Adviser.
StylePlus—Large Core Fund:The average contractual advisory fee percentile rank across all share classes of the Fund is in the third quartile (62nd percentile) of its peer group. The Fund’s net effective management fee ranks in the fourth quartile (86th percentile) of its peer group. The Committee considered that the Fund’s asset weighted total net expense ratio ranks in the third quartile (66th percentile) of its peer group. The Committee also considered the Adviser’s statement explaining the higher fees that performance is driven by a unique combination of passive and actively managed strategies. In this regard, the Committee took into consideration the Fund’s strong investment performance for the five-year and three-year periods ended December 31, 2018.
Total Return Bond Fund:The average contractual advisory fee percentile rank across all share classes of the Fund is in the third quartile (68th percentile) of its peer group. The Fund’s net effective management fee ranks in the fourth quartile (78th percentile) of its peer group. The Committee considered that the Fund’s asset weighted total net expense ratio ranks in the 50th percentile of its peer group. The Committee also considered the Adviser’s statement explaining the higher fees that performance is driven by a unique investment approach that requires significant resources. In this regard, the Committee took into consideration the Fund’s strong investment performance for the five-year and three-year periods ended December 31, 2018. In addition, the Committee noted the Adviser’s statement that the net effective management fee includes 0.08% in administration fees that is not paid to the Adviser. The Committee also took into account the Fund’s currently effective expense limitation agreement with the Adviser.
With respect to the costs of services provided and profits realized by Guggenheim Investments from its relationship with the Funds, the Committee reviewed a profitability analysis and data from management for each Fund setting forth the average assets under management for the twelve months ended December 31, 2018, gross revenues received by Guggenheim Investments, expenses allocated to the Fund, expense waivers (as applicable), earnings and the operating margin/profitability rate, including variance information relative to the foregoing amounts
74 | THE GUGGENHEIM FUNDS ANNUAL REPORT | |
OTHER INFORMATION(Unaudited)(continued) |
as of December 31, 2017. In addition, the Chief Financial Officer of Guggenheim Investments reviewed with, and addressed questions from, the Committee concerning the expense allocation methodology employed in producing the profitability analysis.
In the course of its review of Guggenheim Investments’ profitability, the Committee took into account the methods used by Guggenheim Investments to determine expenses and profit. The Committee considered all of the foregoing in evaluating the costs of services provided, the profitability to Guggenheim Investments and the profitability rates presented, and concluded that the profits were not unreasonable.
The Committee considered other benefits available to each Adviser because of its relationship with the Funds and noted Guggenheim’s statement that it does not believe the Advisers derive any such “fall-out” benefits. In this regard, the Committee noted Guggenheim’s statement that, although it does not consider such benefits to be fall-out benefits, the Advisers may benefit from marketing synergies arising from offering a broad spectrum of products, including the Funds.
Economies of Scale:The Committee received and considered information regarding whether there have been economies of scale with respect to the management of the Funds as Fund assets grow, whether the Funds have appropriately benefited from any economies of scale, and whether there is potential for realization of any further economies of scale. The Committee considered whether economies of scale in the provision of services to the Funds were being passed along to the shareholders. The Committee noted the Adviser’s statements, including that Guggenheim believes it is appropriately sharing potential economies of scale and that costs continue to increase in many key areas, including compensation of portfolio managers, key analysts and support staff, as well as for infrastructure needs, with respect to risk management oversight, valuation processes and disaster recovery systems, among other things, and that, in this regard, management’s costs for providing services have increased in recent years without regard to asset levels.
The Committee also noted the process employed by the Adviser to evaluate whether it would be appropriate to institute a new breakpoint for a Fund, with consideration given to, among other things: (i) the Fund’s size and trends in asset levels over recent years; (ii) the competitiveness of the expense levels; (iii) whether expense waivers are in place; (iv) changes and trends in revenue and expenses; (v) whether there are any anticipated expenditures that may benefit the Fund in the future; (vi) Fund profit level margins; (vii) relative Fund performance; (viii) the nature, extent and quality of services management provides to the Fund; and (ix) the complexity of the Fund’s investment strategy and the resources required to support the Fund.
As part of its assessment of economies of scale, the Committee also considered Guggenheim’s view that it seeks to share economies of scale through a number of means, including breakpoints, advisory fees set at competitive rates pre-assuming future asset growth, expense waivers and limitations, and investments in personnel, operations and infrastructure to support the Fund
| | THE GUGGENHEIM FUNDS ANNUAL REPORT | 75 |
OTHER INFORMATION(Unaudited)(continued) |
business. Thus, the Committee considered the size of the Funds and the competitiveness of and/or other determinations made regarding the current advisory fee for each Fund, as well as whether a Fund is subject to an expense limitation.
Based on the foregoing, the Committee determined that the advisory fee for each Fund was reasonable.
Sub-Advisory Agreement
Nature, Extent and Quality of Services Provided by the Sub-Adviser:As noted above, because both the Adviser and Sub-Adviser for Municipal Income Fund—Security Investors and GPIM, respectively—are part of and do business as Guggenheim Investments and the services provided by the Adviser on the one hand and the Sub-Adviser on the other cannot be ascribed to distinct legal entities, the Committee did not evaluate the services provided under the Advisory Agreement and Sub-Advisory Agreement separately. Therefore, the Committee considered the qualifications, experience and skills of the Fund’s portfolio management team in connection with the Committee’s evaluation of Guggenheim’s investment professionals under the applicable Advisory Agreement.
With respect to Guggenheim’s resources and the Sub-Adviser’s ability to carry out its responsibilities under the Sub-Advisory Agreement, as noted above, the Committee considered the financial condition of GPIMH and the various entities comprising Guggenheim Investments. (Thereafter, the Committee received the audited consolidated financial statements of GPIM.)
The Committee also considered the acceptability of the terms of the Sub-Advisory Agreement, including the scope of services required to be performed by the Sub-Adviser.
Investment Performance:The Committee considered the returns of the Fund under its evaluation of the Advisory Agreement.
Comparative Fees, Costs of Services Provided and the Profits Realized by the Sub-Adviser from Its Relationship with the Fund:The Committee considered that the Sub-Advisory Agreement is with an affiliate of the Adviser, that the Adviser compensates the Sub-Adviser from its own fees so that the sub-advisory fee rate for the Fund does not impact the fees paid by the Fund and that the Sub-Adviser’s revenues were included in the calculation of Guggenheim Investments’ profitability. Given its determination of the reasonableness of the advisory fee, the Committee concluded that the sub-advisory fee rate for the Fund was not unreasonable.
Economies of Scale:The Committee recognized that, because the Sub-Adviser’s fees are paid by the Adviser and not the Fund, the analysis of economies of scale was more appropriate in the context of the Committee’s consideration of the applicable Advisory Agreement, which was separately considered. (See “Advisory Agreements –Economies of Scale” above.)
76 | THE GUGGENHEIM FUNDS ANNUAL REPORT | |
OTHER INFORMATION(Unaudited)(concluded) |
Overall Conclusions
Based on the foregoing, the Committee determined that the investment advisory fees are fair and reasonable in light of the extent and quality of the services provided and other benefits received and that the continuation of each of the Agreements is in the best interest of each Fund. In reaching this conclusion, no single factor was determinative or conclusive and each Committee member, in the exercise of his business judgment, may afford different weights to different factors. At the May Meeting, the Committee, constituting all of the Independent Trustees, recommended the renewal of each Advisory Agreement and the Sub-Advisory Agreement for an additional annual term.
| | THE GUGGENHEIM FUNDS ANNUAL REPORT | 77 |
INFORMATION ON BOARD OF TRUSTEES AND OFFICERS(Unaudited) |
Name, Address*
and Year of Birth
of Trustees | Position(s)
Held with
the Trust | Term of Office
and Length of
Time Served** | Principal Occupation(s)
During Past 5 Years | Number of
Portfolios
in Fund
Complex
Overseen | Other Directorships
Held by Trustees |
INDEPENDENT TRUSTEES | | | | |
Randall C. Barnes (1951) | Trustee | Since 2014 | Current: Private Investor (2001-present). Former: Senior Vice President and Treasurer, PepsiCo, Inc. (1993-1997); President, Pizza Hut International (1991-1993); Senior Vice President, Strategic Planning and New Business Development, PepsiCo, Inc. (1987-1990). | 158 | Current: Trustee, Purpose Investments Funds (2013-present). Former: Managed Duration Investment Grade Municipal Fund (2003-2016). |
Angela Brock-Kyle (1959) | Trustee | Since November 2019 | Current: Founder and Chief Executive Officer, B.O.A.R.D.S (consulting firm). Former: Senior Leader, TIAA (financial services firm) (1987-2012). | 157 | None. |
Donald A. Chubb, Jr. (1946) | Trustee and Chairman of the Valuation Oversight Committee | Since 1994 | Current: Retired. Former: Business broker and manager of commercial real estate, Griffith & Blair, Inc. (1997-2017). | 157 | Former: Midland Care, Inc. (2011-2016). |
Jerry B. Farley (1946) | Trustee and Chairman of the Audit Committee | Since 2005 | Current: President, Washburn University (1997-present). | 157 | Current: CoreFirst Bank & Trust (2000-present). Former: Westar Energy, Inc. (2004-2018). |
78 | THE GUGGENHEIM FUNDS ANNUAL REPORT | |
INFORMATION ON BOARD OF TRUSTEES AND OFFICERS(Unaudited)(continued) |
Name, Address*
and Year of Birth
of Trustees | Position(s)
Held with
the Trust | Term of Office
and Length of
Time Served** | Principal Occupation(s)
During Past 5 Years | Number of
Portfolios
in Fund
Complex
Overseen | Other Directorships
Held by Trustees |
INDEPENDENT TRUSTEES - continued | | | |
Roman Friedrich III (1946) | Trustee and Chairman of the Contracts Review Committee | Since 2014 | Current: Founder and Managing Partner, Roman Friedrich & Company (1998-present). | 157 | Former: Zincore Metals, Inc. (2009-January 2019). |
Thomas F. Lydon, Jr. (1960) | Trustee | Since November 2019 | Current: President, Global Trends Investments (registered investment adviser) (1996-present). | 157 | Current: US Global Investors (GROW) (1995-present); and Harvest Volatility Edge Trust (3) (2017-present). |
Ronald A. Nyberg (1953) | Trustee and Chairman of the Nominating and Governance Committee | Since 2014 | Current: Partner, Momkus LLC (2016-present). Former: Partner, Nyberg & Cassioppi, LLC (2000-2016); Executive Vice President, General Counsel, and Corporate Secretary, Van Kampen Investments (1982-1999). | 158 | Current: PPM Funds (9) (2018-present); Edward-Elmhurst Healthcare System (2012-present); Western Asset Inflation-Linked Opportunities & Income Fund (2004-present); Western Asset Inflation-Linked Income Fund (2003-present). Former: Managed Duration Investment Grade Municipal Fund (2003-2016). |
| | THE GUGGENHEIM FUNDS ANNUAL REPORT | 79 |
INFORMATION ON BOARD OF TRUSTEES AND OFFICERS(Unaudited)(continued) |
Name, Address*
and Year of Birth
of Trustees | Position(s)
Held with
the Trust | Term of Office
and Length of
Time Served** | Principal Occupation(s)
During Past 5 Years | Number of
Portfolios
in Fund
Complex
Overseen | Other Directorships
Held by Trustees |
INDEPENDENT TRUSTEES - concluded | | | |
Sandra G. Sponem (1958) | Trustee | Since November 2019 | Current: Retired. Former: Senior Vice President and Chief Financial Officer, M.A. Mortenson Companies, Inc. (general contracting firm) (2007-2017). | 157 | Current: SPDR Series Trust (78) (2018-present); SPDR Index Shares Funds (31) (2018-present); SSGA Active Trust (12) (2018-present); and SSGA Master Trust (1) (2018-present). |
Ronald E. Toupin, Jr. (1958) | Trustee and Chairman of the Board | Since 2014 | Current: Portfolio Consultant (2010-present); Member, Governing Council, Independent Directors Council (2013-present); Governor, Board of Governors, Investment Company Institute (2018-present). Former: Member, Executive Committee, Independent Directors Council (2016-2018); Vice President, Manager and Portfolio Manager, Nuveen Asset Management (1998-1999); Vice President, Nuveen Investment Advisory Corp. (1992-1999); Vice President and Manager, Nuveen Unit Investment Trusts (1991-1999); and Assistant Vice President and Portfolio Manager, Nuveen Unit Investment Trusts (1988-1999), each of John Nuveen & Co., Inc. (1982-1999). | 157 | Current: Western Asset Inflation-Linked Opportunities & Income Fund (2004-present); Western Asset Inflation-Linked Income Fund (2003-present). Former: Managed Duration Investment Grade Municipal Fund (2003-2016). |
80 | THE GUGGENHEIM FUNDS ANNUAL REPORT | |
INFORMATION ON BOARD OF TRUSTEES AND OFFICERS(Unaudited)(continued) |
Name, Address*
and Year of Birth
of Trustees | Position(s)
Held with
the Trust | Term of Office
and Length of
Time Served** | Principal Occupation(s)
During Past 5 Years | Number of
Portfolios
in Fund
Complex
Overseen | Other Directorships
Held by Trustees |
INTERESTED TRUSTEE | | | | |
Amy J. Lee*** (1961) | Trustee, Vice President and Chief Legal Officer | Since 2018 (Trustee) Since 2014 (Chief Legal Officer) Since 2007 (Vice President) | Current: Interested Trustee, certain other funds in the Fund Complex (2018-present); Chief Legal Officer, certain other funds in the Fund Complex (2014-present); Vice President, certain other funds in the Fund Complex (2007-present); Senior Managing Director, Guggenheim Investments (2012-present). Former: President and Chief Executive Officer (2017-2018);President, certain other funds in the Fund Complex (2017-November 2019); Vice President, Associate General Counsel and Assistant Secretary, Security Benefit Life Insurance Company and Security Benefit Corporation (2004-2012). | 157 | None. |
* | The business address of each Trustee is c/o Guggenheim Investments, 227 West Monroe Street, Chicago, Illinois 60606. |
** | Each Trustee serves an indefinite term, until his or her successor is elected and qualified. Time served includes time served in the respective position for the Predecessor Corporation. |
*** | This Trustee is deemed to be an “interested person” of the Fund under the 1940 Act by reason of her position with the Fund’s Investment Manager and/or the parent of the Investment Manager. |
| | THE GUGGENHEIM FUNDS ANNUAL REPORT | 81 |
INFORMATION ON BOARD OF TRUSTEES AND OFFICERS(Unaudited)(continued) |
Name, Address*
and Year of Birth | Position(s)
held with
the Trust | Term of Office
and Length of
Time Served** | Principal Occupations
During Past 5 Years |
OFFICERS | | | |
Brian E. Binder (1972) | President and Chief Executive Officer | Since 2018 | Current: President and Chief Executive Officer, certain other funds in the Fund Complex (2018-present); President and Chief Executive Officer, Guggenheim Funds Investment Advisors, LLC and Security Investors, LLC (2018-present); Senior Managing Director and Chief Administrative Officer, Guggenheim Investments (2018-present). Former: Managing Director and President, Deutsche Funds, and Head of US Product, Trading and Fund Administration, Deutsche Asset Management (2013-2018); Managing Director, Head of Business Management and Consulting, Invesco Ltd. (2010-2012). |
James M. Howley (1972) | Assistant Treasurer | Since 2014 | Current: Managing Director, Guggenheim Investments (2004-present); Assistant Treasurer, certain other funds in the Fund Complex (2006-present). Former: Manager, Mutual Fund Administration of Van Kampen Investments, Inc. (1996-2004). |
Mark E. Mathiasen (1978) | Secretary | Since 2014 | Current: Secretary, certain other funds in the Fund Complex (2007-present); Managing Director, Guggenheim Investments (2007-present). |
Glenn McWhinnie (1969) | Assistant Treasurer | Since 2016 | Current: Vice President, Guggenheim Investments (2009-present); Assistant Treasurer, certain other funds in the Fund complex (2016-present). |
Michael P. Megaris (1984) | Assistant Secretary | Since 2014 | Current: Assistant Secretary, certain other funds in the Fund Complex (2014-present); Director, Guggenheim Investments (2012-present). |
Elisabeth Miller (1968) | Chief Compliance Officer | Since 2012 | Current: Chief Compliance Officer, certain other funds in the Fund Complex (2012-present); Senior Managing Director, Guggenheim Investments (2012-present); Vice President, Guggenheim Funds Distributors, LLC (2014-present). Former: Chief Compliance Officer, Security Investors, LLC and Guggenheim Funds Investment Advisors, LLC (2012-2018); Chief Compliance Officer, Guggenheim Distributors, LLC (2009-2014); Senior Manager, Security Investors, LLC (2004-2014); Senior Manager, Guggenheim Distributors, LLC (2004-2014). |
82 | THE GUGGENHEIM FUNDS ANNUAL REPORT | |
INFORMATION ON BOARD OF TRUSTEES AND OFFICERS(Unaudited)(continued) |
Name, Address*
and Year of Birth | Position(s)
held with
the Trust | Term of Office
and Length of
Time Served** | Principal Occupations
During Past 5 Years |
OFFICERS - continued | | |
Margaux Misantone (1978) | AML Officer | Since 2017 | Current: Chief Compliance Officer, Security Investors, LLC and Guggenheim Funds Investment Advisors, LLC (2018-present); AML Officer, Security Investors, LLC and certain other funds in the Fund Complex (2017-present); Managing Director, Guggenheim Investments (2015-present). Former: Assistant Chief Compliance Officer, Security Investors, LLC and Guggenheim Funds Investments Advisors, LLC (2015-2018). |
Adam J. Nelson (1979) | Assistant Treasurer | Since 2015 | Current: Vice President, Guggenheim Investments (2015-present); Assistant Treasurer, certain other funds in the Fund Complex (2015-present). Former: Assistant Vice President and Fund Administration Director, State Street Corporation (2013-2015); Fund Administration Assistant Director, State Street (2011-2013); Fund Administration Manager, State Street (2009-2011). |
Kimberly J. Scott (1974) | Assistant Treasurer | Since 2014 | Current: Director, Guggenheim Investments (2012-present); Assistant Treasurer, certain other funds in the Fund Complex (2012-present). Former: Financial Reporting Manager, Invesco, Ltd. (2010-2011); Vice President/Assistant Treasurer, Mutual Fund Administration for Van Kampen Investments, Inc./Morgan Stanley Investment Management (2009-2010); Manager of Mutual Fund Administration, Van Kampen Investments, Inc./Morgan Stanley Investment Management (2005-2009). |
Bryan Stone (1979) | Vice President | Since 2014 | Current: Vice President, certain other funds in the Fund Complex (2014-present); Managing Director, Guggenheim Investments (2013-present). Former: Senior Vice President, Neuberger Berman Group LLC (2009-2013); Vice President, Morgan Stanley (2002-2009). |
| | THE GUGGENHEIM FUNDS ANNUAL REPORT | 83 |
INFORMATION ON BOARD OF TRUSTEES AND OFFICERS(Unaudited)(concluded) |
Name, Address*
and Year of Birth | Position(s)
held with
the Trust | Term of Office
and Length of
Time Served** | Principal Occupations
During Past 5 Years |
OFFICERS - concluded | | |
John L. Sullivan (1955) | Chief Financial Officer, Chief Accounting Officer and Treasurer | Since 2014 | Current: Chief Financial Officer, Chief Accounting Officer and Treasurer, certain other funds in the Fund Complex (2010-present); Senior Managing Director, Guggenheim Investments (2010-present). Former: Managing Director and Chief Compliance Officer, each of the funds in the Van Kampen Investments fund complex (2004-2010); Managing Director and Head of Fund Accounting and Administration, Morgan Stanley Investment Management (2002-2004); Chief Financial Officer and Treasurer, Van Kampen Funds (1996-2004). |
Jon Szafran (1989) | Assistant Treasurer | Since 2017 | Current: Vice President, Guggenheim Investments (2017-present); Assistant Treasurer, certain other funds in the Fund Complex (2017-present). Former: Assistant Treasurer of Henderson Global Funds and Manager of US Fund Administration, Henderson Global Investors (North America) Inc. (“HGINA”), (2017); Senior Analyst of US Fund Administration, HGINA (2014-2017); Senior Associate of Fund Administration, Cortland Capital Market Services, LLC (2013-2014); Experienced Associate, PricewaterhouseCoopers LLP (2012-2013). |
* | The business address of each officer is c/o Guggenheim Investments, 227 West Monroe Street, Chicago, Illinois 60606. |
** | Each officer serves an indefinite term, until his or her successor is duly elected and qualified. |
84 | THE GUGGENHEIM FUNDS ANNUAL REPORT | |
GUGGENHEIM INVESTMENTS PRIVACY NOTICE(Unaudited) |
Who We Are
This Privacy Notice describes the data protection practices of Guggenheim Investments. Guggenheim Investments as used herein refers to the affiliated investment management businesses of Guggenheim Partners, LLC: Guggenheim Funds Investment Advisors, LLC, Guggenheim Partners Investment Management, LLC, Guggenheim Funds Distributors, LLC, Security Investors, LLC, Guggenheim Investment Advisors (Europe) Limited, Guggenheim Real Estate, LLC, GS Gamma Advisors, LLC, Guggenheim Partners India Management, LLC, Guggenheim Partners Europe Limited, as well as the funds in the Guggenheim Funds complex (the “Funds”) (“Guggenheim Investments,” “we,” “us,” or “our”).
Guggenheim Partners Investment Management Holdings, LLC, located at 330 Madison Avenue, New York, New York 10017 is the data controller for your information. The affiliates who are also controllers of certain of your information are: Guggenheim Investment Advisors (Europe) Limited, Guggenheim Partners Europe Limited, Guggenheim Partners, LLC, Guggenheim Funds Investment Advisors, LLC, Guggenheim Partners Investment Management, LLC, Guggenheim Funds Distributors, LLC and Security Investors, LLC, as well as the Funds.
Our Commitment to You
Guggenheim Investments considers your privacy our utmost concern. When you become our client or investor, you entrust us with not only your hard-earned money but also with your personal and financial information. Because we have access to your private information, we hold ourselves to the highest standards in its safekeeping and use. We strictly limit how we share your information with others, whether you are a current or former Guggenheim Investments client or investor.
The Information We Collect About You
We collect certain nonpublic personal information about you from information you provide on applications, other forms, our website, and/or from third parties including investment advisors. This information includes Social Security or other tax identification number, assets, income, tax information, retirement and estate plan information, transaction history, account balance, payment history, bank account information, marital status, family relationships, information that we collect on our website through the use of “cookies,” and other personal information that you or others provide to us. We may also collect such information through your inquiries by mail, e-mail or telephone. We may also collect customer due diligence information, as required by applicable law and regulation, through third party service providers.
How We Handle Your Personal Information
The legal basis for using your information as set out in this Privacy Notice is as follows: (a) use of your personal data is necessary to perform our obligations under any contract with you (such as a contract for us to provide financial services to you); or (b) where use of your personal data is not necessary for performance of a contract, use of your personal data is necessary for our
| | THE GUGGENHEIM FUNDS ANNUAL REPORT | 85 |
GUGGENHEIM INVESTMENTS PRIVACY NOTICE(Unaudited)(continued) |
legitimate interests or the legitimate interests of others (for example, to enforce the legal terms governing our services, operate and market our website and other services we offer, ensure safe environments for our personnel and others, make and receive payments, prevent fraud and to know the customer to whom we are providing the services). Some processing is done to comply with applicable law.
In addition to the specific uses described above, we also use your information in the following manner:
| | ● | We use your information in connection with servicing your accounts. |
| | ● | We use information to respond to your requests or questions. For example, we might use your information to respond to your customer feedback. |
| | ● | We use information to improve our products and services. We may use your information to make our website and products better. We may use your information to customize your experience with us. |
| | ● | We use information for security purposes. We may use your information to protect our company and our customers. |
| | ● | We use information to communicate with you. For example, we will communicate with you about your account or our relationship. We may contact you about your feedback. We might also contact you about this Privacy Notice. We may also enroll you in our email newsletter. |
| | ● | We use information as otherwise permitted by law, as we may notify you. |
| | ● | Aggregate/Anonymous Data. We may aggregate and/or anonymize any information collected through the website so that such information can no longer be linked to you or your device (“Aggregate/Anonymous Information”). We may use Aggregate/Anonymous Information for any purpose, including without limitation for research and marketing purposes, and may also share such data with any third parties, including advertisers, promotional partners, and sponsors. |
We do not sell information about current or former clients or their accounts to third parties. Nor do we share this information, except when necessary to complete transactions at your request, to make you aware of investment products and services that we or our affiliates offer, or as permitted or required by law.
We provide information about you to companies and individuals not affiliated with Guggenheim Investments to complete certain transactions or account changes, or to perform services for us related to your account. For example, if you ask to transfer assets from another financial institution to Guggenheim Investments, we must provide certain information about you to that company to complete the transaction. We provide the third party with only the information necessary to carry out its responsibilities and only for that purpose. And we require these third
86 | THE GUGGENHEIM FUNDS ANNUAL REPORT | |
GUGGENHEIM INVESTMENTS PRIVACY NOTICE(Unaudited)(continued) |
parties to treat your private information with the same high degree of confidentiality that we do. To alert you to other Guggenheim Investments products and services, we share your information within our family of affiliated companies. You may limit our sharing with affiliated companies as set out below. We may also share information with any successor to all or part of our business, or in connection with steps leading up to a merger or acquisition. For example, if part of our business was sold we may give customer information as part of that transaction. We may also share information about you with your consent.
We will release information about you if you direct us to do so, if we are compelled by law to do so, or in other circumstances as permitted by law (for example, to protect your account from fraud).
If you close your account(s) or become an inactive client or investor, we will continue to adhere to the privacy policies and practices described in this notice.
Opt-Out Provisions and Your Data Choices
The law allows you to “opt out” of certain kinds of information sharing with third parties. We do not share personal information about you with any third parties that triggers this opt-out right. This means YOU ARE ALREADY OPTED OUT.
When you are no longer our client or investor, we continue to share your information as described in this notice, and you may contact us at any time to limit our sharing by sending an email to CorporateDataPrivacy@GuggenheimPartners.com.
European Union Data Subjects and certain others: In addition to the choices set forth above, residents of the European Union and certain other jurisdictions have certain rights to (1) request access to or rectification or deletion of information we collect about them, (2) request a restriction on the processing of their information, (3) object to the processing of their information, or (4) request the portability of certain information. To exercise these or other rights, please contact us using the contact information below. We will consider all requests and provide our response within the time period stated by applicable law. Please note, however, that certain information may be exempt from such requests in some circumstances, which may include if we need to keep processing your information for our legitimate interests or to comply with a legal obligation. We may request you provide us with information necessary to confirm your identity before responding to your request.
Residents of France and certain other jurisdictions may also provide us with instructions regarding the manner in which we may continue to store, erase and share your information after your death, and where applicable, the person you have designated to exercise these rights after your death.
| | THE GUGGENHEIM FUNDS ANNUAL REPORT | 87 |
GUGGENHEIM INVESTMENTS PRIVACY NOTICE(Unaudited)(continued) |
How We Protect Privacy Online
We take steps to protect your privacy when you use our web site – www.guggenheiminvestments.com – by using secure forms of online communication, including encryption technology, Secure Socket Layer (SSL) protocol, firewalls and user names and passwords. These safeguards vary based on the sensitivity of the information that we collect and store. However, we cannot and do not guarantee that these measures will prevent every unauthorized attempt to access, use, or disclose your information since despite our efforts, no Internet and/or other electronic transmissions can be completely secure. Our web site uses “http cookies”—tiny pieces of information that we ask your browser to store. We use cookies for session management and security features on the Guggenheim Investments web site. We do not use them to pull data from your hard drive, to learn your e-mail address, or to view data in cookies created by other web sites. We will not share the information in our cookies or give others access to it. See the legal information area on our web site for more details about web site security and privacy features.
How We Safeguard Your Personal Information and Data Retention
We restrict access to nonpublic personal information about you to our employees and in some cases to third parties (for example, the service providers described above) as permitted by law. We maintain strict physical, electronic and procedural safeguards that comply with federal standards to guard your nonpublic personal information.
We keep your information for no longer than necessary for the purposes for which it is processed. The length of time for which we retain information depends on the purposes for which we collected and use it and/or as required to comply with applicable laws. Information may persist in copies made for backup and business continuity purposes for additional time.
International Visitors
If you are not a resident of the United States, please be aware that your information may be transferred to, stored and processed in the United States where our servers are located and our databases are operated. The data protection and other laws of the United States and other countries might not be as comprehensive as those in your country.
In such cases, we ensure that a legal basis for such a transfer exists and that adequate protection is provided as required by applicable law, for example, by using standard contractual clauses or by transferring your data to a jurisdiction that has obtained an adequacy finding. Individuals whose data may be transferred on the basis of standard contractual clauses may contact us as described below.
88 | THE GUGGENHEIM FUNDS ANNUAL REPORT | |
GUGGENHEIM INVESTMENTS PRIVACY NOTICE(Unaudited)(concluded) |
We’ll Keep You Informed
If you have any questions or concerns about how we treat your personal data, we encourage you to consult with us first. You may also contact the relevant supervisory authority.
We reserve the right to modify this policy at any time and will inform you promptly of material changes. You may access our privacy policy from our web site at www.guggenheiminvestments.com. Should you have any questions regarding our privacy policy, contact us by email at CorporateDataPrivacy@GuggenheimPartners.com.
| | THE GUGGENHEIM FUNDS ANNUAL REPORT | 89 |
This page intentionally left blank.
This page intentionally left blank.
This page intentionally left blank.
This page intentionally left blank.
This page intentionally left blank.
This page intentionally left blank.
This page intentionally left blank.
This page intentionally left blank.
9.30.2019
Guggenheim Funds Annual Report
| |
Guggenheim Limited Duration Fund | | |
Beginning on January 1, 2021, paper copies of the Fund’s annual and semi-annual shareholder reports may no longer be sent by mail, unless you specifically request paper copies of the reports from a Fund or from your financial intermediary. Instead, the reports will be made available on a website, and you will be notified by mail each time a report is posted and provided with a website link to access the report.
If you already elected to receive shareholder reports electronically, you will not be affected by this change and you need not take any action. At any time, you may elect to receive reports and other communications from a Fund electronically by calling 800.820.0888, going to GuggenheimInvestments.com/myaccount, or by contacting your financial intermediary.
You may elect to receive all future shareholder reports in paper free of charge. If you hold shares of a Fund directly, you can inform the Fund that you wish to receive paper copies of reports by calling 800.820.0888. If you hold shares of a Fund through a financial intermediary, please contact the financial intermediary to make this election. Your election to receive reports in paper will apply to all Guggenheim Funds in which you are invested and may apply to all funds held with your financial intermediary.
GuggenheimInvestments.com | LD-ANN-0919x0920 |

| | |
DEAR SHAREHOLDER | 2 |
ECONOMIC AND MARKET OVERVIEW | 3 |
ABOUT SHAREHOLDERS’ FUND EXPENSES | 5 |
LIMITED DURATION FUND | 7 |
NOTES TO FINANCIAL STATEMENTS | 36 |
REPORT OF INDEPENDENT REGISTERED PUBLIC ACCOUNTING FIRM | 51 |
OTHER INFORMATION | 52 |
INFORMATION ON BOARD OF TRUSTEES AND OFFICERS | 61 |
GUGGENHEIM INVESTMENTS PRIVACY NOTICE | 66 |
| | THE GUGGENHEIM FUNDS ANNUAL REPORT | 1 |
Dear Shareholder:
Guggenheim Partners Investment Management, LLC, (the “Investment Adviser”) is pleased to present the shareholder report for Guggenheim Limited Duration Fund (the “Fund”) for the annual fiscal period ended September 30, 2019.
The Investment Adviser is part of Guggenheim Investments, which represents the investment management businesses of Guggenheim Partners, LLC (“Guggenheim”), a global, diversified financial services firm.
Guggenheim Funds Distributors, LLC is the distributor of the Fund. Guggenheim Funds Distributors, LLC is affiliated with Guggenheim and the Investment Adviser.
We encourage you to read the Economic and Market Overview section of the report, which follows this letter, and then the Managers’ Commentary for the Fund.
We are committed to providing innovative investment solutions and appreciate the trust you place in us.
Sincerely,
Guggenheim Partners Investment Management, LLC,
October 31, 2019
Read a prospectus and summary prospectus (if available) carefully before investing. It contains the investment objectives, risks, charges, expenses and other information, which should be considered carefully before investing. Obtain a prospectus and summary prospectus (if available) at guggenheiminvestments.com or call 800.820.0888.
This material is not intended as a recommendation or as investment advice of any kind, including in connection with rollovers, transfers, and distributions. Such material is not provided in a fiduciary capacity, may not be relied upon for or in connection with the making of investment decisions, and does not constitute a solicitation of an offer to buy or sell securities. All content has been provided for informational or educational purposes only and is not intended to be and should not be construed as legal or tax advice and/or a legal opinion. Always consult a financial, tax and/ or legal professional regarding your specific situation.
Limited Duration Fund may not be suitable for all investors. ● The Fund’s market value will change in response to interest rate changes and market conditions among other factors. In general, bond prices rise when interest rates fall and vice versa. ● The Fund’s exposure to high yield securities may subject the Fund to greater volatility. ● When market conditions are deemed appropriate, the Fund may use leverage to the full extent permitted by its investment policies and restrictions and applicable law. Leveraging will exaggerate the effect on net asset value of any increase or decrease in the market value of the Fund’s portfolio. ● The Fund may invest in derivative instruments, which may be more volatile and less liquid, increasing the risk of loss when compared to traditional securities. Certain of the derivative instruments are also subject to the risks of counterparty default and adverse tax treatment. ● Instruments and strategies (such as borrowing transactions and reverse repurchase agreements) may provide leveraged exposure to a particular investment, which will magnify any gains or losses on those investments. ● Investments in reverse repurchase agreements expose the Fund to the many of the same risks as investments in derivatives. ● The Fund’s investments in other investment vehicles subject the Fund to those risks and expenses affecting the investment vehicle. ● The Fund’s investments in foreign securities carry additional risks when compared to U.S. securities, due to the impact of diplomatic, political or economic developments in the country in question (investments in emerging markets securities are generally subject to an even greater level of risks). ● Investments in syndicated bank loans generally offer a floating interest rate and involve special types of risks. ● The Fund’s investments in municipal securities can be affected by events that affect the municipal bond market. ● The Fund’s investments in real estate securities subject the Fund to the same risks as direct investments in real estate, which is particularly sensitive to economic downturns. ● The Fund’s investments in restricted securities may involve financial and liquidity risk. ● You may have a gain or loss when you sell your shares. ● It is important to note that the Fund is not guaranteed by the U.S. government. ● Please read the prospectus for more detailed information regarding these and other risks.
2 | THE GUGGENHEIM FUNDS ANNUAL REPORT | |
ECONOMIC AND MARKET OVERVIEW (Unaudited) | September 30, 2019 |
Economic data has been mixed over the past few months. On the positive side, we saw a pickup in the housing market as measured by housing starts and home sales, which could be a delayed response to lower mortgage rates. Industrial production had the strongest month-over-month gain in a year, partially boosted by an increase in oil production in Hurricane Barry’s wake. The unemployment rate fell to a 50-year low of 3.5% in September 2019, despite a continued moderation in payroll gains.
On the negative side, the Institute for Supply Management (“ISM”) Manufacturing Index plunged to the weakest reading since June 2009. The ISM Non-Manufacturing Index also came in well below expectations, the lowest since August 2016. Within both the manufacturing and non-manufacturing ISM indexes, analysts look at the employment component of the survey for an early read on other labor market indicators. Here we find more cause for concern: The non-manufacturing survey’s employment component is now barely above 50 while the manufacturing employment sub-index stands at 46.3, well into contraction territory. Combined, the outlook for output and hiring has dimmed, signaling trouble ahead for consumers.
Retail sales have been steady, but Commerce Department data showed that total consumer spending on goods and services increased only 0.1% month-over-month in August 2019, the smallest gain in six months. It is hard to identify the primary reason why consumers may already be turning more conservative on spending. Income growth looks steady, the equity market is higher year-to-date, and rates are lower, all of which should be boosting consumer confidence. Sentiment surveys, however, show that fewer consumers believe now is a good time to buy homes, vehicles, and household durables, and headline consumer confidence measures have ticked down. We believe trade policy and political concerns are weighing on sentiment, and these headwinds are set to ramp up further. Additional U.S. tariffs on China are due to take effect on December 15, 2019, and the U.S. House of Representatives is pressing forward with its impeachment inquiry into President Trump.
Guggenheim’s dashboard of U.S. recession indicators continues to point to a recession beginning as early as the first half of 2020, and we think the economic data is corroborating this view. Two of the more notable indicators pointing to high recession risk are the three-month/10-year U.S. Treasury yield curve, which has been inverted for 16 consecutive weeks through period end, and the Leading Economic Indicators Index which has slowed from a year-over-year growth rate of 6.6% in September 2018 to 1.1% as of August 2019. The indicators Guggenheim tracks as part of our recession probability model indicate a nearly 50% chance that a recession will come before mid-2020, and a 70% chance that it will arrive by mid-2021.
Over the period, the U.S. Treasury curve continued its overall flattening trend, as the difference between the two-year U.S. Treasury and 10-year U.S. Treasury narrowed to 5 basis points. Equity markets remained volatile, buoyed by a 25 basis point cut in July and September 2019 by the U.S. Federal Reserve (the “Fed”) and relatively strong U.S. economic data, but weighed down by trade war uncertainty and fears of a global slowdown.
With downside risks growing, markets have become more sensitive to the Fed’s communications about the future stance of monetary policy. Despite the two rate cuts, Fed policymakers are deeply divided. It is still unclear whether the Fed will deliver the aggressive and preemptive policy action that would prolong the current expansion.
As it relates to risk-taking, we are not confident that the Fed would succeed in easing credit conditions if conditions were to tighten materially. The Fed may act too late, or its actions may have little impact given that low rates this year have largely failed to stimulate growth. With credit spreads still relatively tight on a historical basis, we believe it is prudent to remain up in quality as we await better opportunities to deploy capital in riskier credit sectors in the coming downturn.
For the 12-month period ended September 30, 2019, the Standard & Poor’s 500® (“S&P 500”) Index* returned 4.25%. The MSCI Europe-Australasia-Far East (“EAFE”) Index* returned -0.82%. The return of the MSCI Emerging Markets Index* was -1.63%.
In the bond market, the Bloomberg Barclays U.S. Aggregate Bond Index* posted a 10.30% return for the period, while the Bloomberg Barclays U.S. Corporate High Yield Index* returned 6.36%. The return of the ICE Bank of America (“BofA”) Merrill Lynch 3-Month U.S. Treasury Bill Index* was 2.39% for the 12-month period.
The opinions and forecasts expressed may not actually come to pass. This information is subject to change at any time, based on market and other conditions, and should not be construed as a recommendation of any specific security or strategy.
| | THE GUGGENHEIM FUNDS ANNUAL REPORT | 3 |
ECONOMIC AND MARKET OVERVIEW (Unaudited)(concluded) | September 30, 2019 |
*Index Definitions
Indices are unmanaged and not available for direct investment. Index performance does not reflect transaction costs, fees, or expenses.
Bloomberg Barclays U.S. Aggregate Bond Index is a broad-based flagship benchmark that measures the investment grade, U.S. dollar-denominated, fixed-rate taxable bond market, including U.S. Treasuries, government-related and corporate securities, mortgage-backed securities or “MBS” (agency fixed-rate and hybrid adjustable-rate mortgage, or “ARM”, pass-throughs), asset-backed securities (“ABS”), and commercial mortgage-backed securities (“CMBS”) (agency and non-agency).
Bloomberg Barclays U.S. Corporate High Yield Index measures the U.S. dollar-denominated, high yield, fixed-rate corporate bond market. Securities are classified as high yield if the middle rating of Moody’s, Fitch, and S&P is Ba1/BB +/BB + or below.
Bloomberg Barclays U.S. Aggregate Bond 1-3 Year Total Return Index measures the performance of publicly issued investment grade corporate, U.S. Treasury and government agency securities with remaining maturities of one to three years.
ICE BofA Merrill Lynch 3-Month U.S. Treasury Bill Index is an unmanaged market Index of U.S. Treasury securities maturing in 90 days that assumes reinvestment of all income.
MSCI EAFE Index is a capitalization-weighted measure of stock markets in Europe, Australasia, and the Far East.
MSCI Emerging Markets Index is a free float-adjusted market capitalization-weighted index that is designed to measure equity market performance in the global emerging markets.
S&P 500® is a broad-based index, the performance of which is based on the performance of 500 widely held common stocks chosen for market size, liquidity, and industry group representation.
4 | THE GUGGENHEIM FUNDS ANNUAL REPORT | |
ABOUT SHAREHOLDERS’ FUND EXPENSES (Unaudited) | |
All mutual funds have operating expenses, and it is important for our shareholders to understand the impact of costs on their investments. Shareholders of a fund incur two types of costs: (i) transaction costs, including sales charges (loads) on purchase payments, reinvested dividends, other distributions, and exchange fees, and (ii) ongoing costs, including management fees, administrative services, and shareholder reports, among others. These ongoing costs, or operating expenses, are deducted from a fund’s gross income and reduce the investment return of the fund.
A fund’s expenses are expressed as a percentage of its average net assets, which is known as the expense ratio. The following examples are intended to help investors understand the ongoing costs (in dollars) of investing in a fund and to compare these costs with the ongoing costs of investing in other mutual funds.
The examples are based on an investment of $1,000 made at the beginning of the period and held for the entire six-month period beginning March 31, 2019 and ending September 30, 2019.
The following tables illustrate the Fund’s costs in two ways:
Table 1. Based on actual Fund return: This section helps investors estimate the actual expenses paid over the period. The “Ending Account Value” shown is derived from the Fund’s actual return, and the fifth column shows the dollar amount that would have been paid by an investor who started with $1,000 in the Fund. Investors may use the information here, together with the amount invested, to estimate the expenses paid over the period. Simply divide the Fund’s account value by $1,000 (for example, an $8,600 account value divided by $1,000 = 8.6), then multiply the result by the number provided under the heading “Expenses Paid During Period.”
Table 2. Based on hypothetical 5% return: This section is intended to help investors compare a Fund’s cost with those of other mutual funds. The table provides information about hypothetical account values and hypothetical expenses based on the Fund’s actual expense ratio and an assumed rate of return of 5% per year before expenses, which is not the Fund’s actual return. The hypothetical account values and expenses may not be used to estimate the actual ending account balance or expenses paid during the period. The example is useful in making comparisons because the U.S. Securities and Exchange Commission (the “SEC”) requires all mutual funds to calculate expenses based on the 5% return. Investors can assess a Fund’s costs by comparing this hypothetical example with the hypothetical examples that appear in shareholder reports of other funds.
The calculations illustrated above assume no shares were bought or sold during the period. Actual costs may have been higher or lower, depending on the amount of investment and the timing of any purchases or redemptions.
Please note that the expenses shown in the table are meant to highlight your ongoing costs only and do not reflect any transactional costs, such as sales charges (loads) on purchase payments, and contingent deferred sales charges (“CDSC”) on redemptions, if any. Therefore, the second table is useful in comparing ongoing costs only, and will not help you determine the relative total costs of owning different funds. In addition, if these transactional costs were included, your costs would have been higher.
More information about the Fund’s expenses, including annual expense ratios for periods up to five years (subject to the Fund’s inception date), can be found in the Financial Highlights section of this report. For additional information on operating expenses and other shareholder costs, please refer to the Fund’s prospectus.
| | THE GUGGENHEIM FUNDS ANNUAL REPORT | 5 |
ABOUT SHAREHOLDERS’ FUND EXPENSES (Unaudited)(concluded) | |
| Expense
Ratio1 | Fund
Return | Beginning
Account Value
March 31, 2019 | Ending
Account Value
September 30, 2019 | Expenses
Paid During
Period2 |
Table 1. Based on actual Fund return3 | | | | | |
A-Class | 0.75% | 1.48% | $ 1,000.00 | $ 1,014.80 | $ 3.79 |
C-Class | 1.50% | 1.10% | 1,000.00 | 1,011.00 | 7.56 |
P-Class | 0.75% | 1.48% | 1,000.00 | 1,014.80 | 3.79 |
Institutional Class | 0.50% | 1.60% | 1,000.00 | 1,016.00 | 2.53 |
R6-Class | 0.50% | 1.63% | 1,000.00 | 1,016.30 | 2.53 |
|
Table 2. Based on hypothetical 5% return (before expenses) | | | | |
A-Class | 0.75% | 5.00% | $ 1,000.00 | $ 1,021.31 | $ 3.80 |
C-Class | 1.50% | 5.00% | 1,000.00 | 1,017.55 | 7.59 |
P-Class | 0.75% | 5.00% | 1,000.00 | 1,021.31 | 3.80 |
Institutional Class | 0.50% | 5.00% | 1,000.00 | 1,022.56 | 2.54 |
R6-Class | 0.50% | 5.00% | 1,000.00 | 1,022.56 | 2.54 |
1 | Annualized and excludes expenses of the underlying funds in which the Fund invests. |
2 | Expenses are equal to the Fund’s annualized expense ratio, net of any applicable fee waivers, multiplied by the average account value over the period, multiplied by 183/365 (to reflect the one-half year period). |
3 | Actual cumulative return at net asset value for the period March 31, 2019 to September 30, 2019. |
6 | THE GUGGENHEIM FUNDS ANNUAL REPORT | |
MANAGERS’ COMMENTARY (Unaudited) | September 30, 2019 |
To Our Shareholders
Guggenheim Limited Duration Fund (the “Fund”) is managed by a team of seasoned professionals, including Anne B. Walsh, Senior Managing Director and Chief Investment Officer, Fixed Income; Steven H. Brown, CFA, Senior Managing Director and Portfolio Manager; and Adam J. Bloch, Managing Director and Portfolio Manager. In the following paragraphs, the investment team discusses the market environment and the Fund’s performance for the fiscal year ended September 30, 2019.
For the one year period ended September 30, 2019, Guggenheim Limited Duration Fund (A shares) returned 2.27%1, compared with the 4.66% return of its benchmark, the Bloomberg Barclays U.S. Aggregate Bond 1-3 Year Total Return Index.
The Fund seeks to provide a high level of income consistent with the preservation of capital. It invests at least 80% of its assets in a diversified portfolio of debt securities.
The trailing twelve-month period, ending September 30, 2019, faced bouts of uncertainty and volatility as trade tensions, global economic headwinds, shifts in monetary policy, and a corporate earnings slowdown jolted financial markets. From the start, the fourth quarter of 2018 raised concerns across global markets, causing risk-assets to decline as investors sought safety. The S&P 500, high yield, and bank loan indices were off -13.52%, -4.53%, and -3.08% in the fourth quarter, respectively, in line with our previously expressed concerns that spreads could widen. We entered fourth quarter of 2018 defensively positioned, with limited below investment grade exposure, credit hedges in place, and healthy liquidity reserves all of which helped the fund generate a positive absolute return.
In response to fourth quarter’s market upheaval, the U.S. Federal Reserve (the “Fed”) pivoted from its tightening policy stance and informed markets it would be patient in assessing further interest rate hikes. As 2019 progressed, the Fed recalibrated its approach to sustain the current economic expansion. In total, the Fed increased rates by a quarter of a percentage point one time in December 2018 but later decreased rates by a quarter of a percentage point in each July and September 2019. The Fed’s dovish turn and the low global interest-rate environment supported risk assets in 2019 as credit spreads generally tightened for the remainder of the period.
Our Macroeconomic and Investment Research continued to reinforce a heightened chance that the U.S. economy could be in the later stages of the current credit cycle. Elevated levels of corporate indebtedness combined with deteriorating macroeconomic metrics and relatively tight prevailing credit spreads informed us that investors were not being adequately compensated to take risk in credit. As a result, over the course of the past twelve months, we continued to proactively shift the portfolio to a more defensive stance. As spreads and yields grinded tighter we used the moves as opportunities to shift the portfolio up in credit quality, reduce spread duration, and maintain ample liquidity. For the one-year period, the Fund reduced spread duration to 0.7 years from 2.3 years and its weighted average life to 1.3 years from 2.7 years.
The Fund’s allocation to structured credit, specifically collateralized loan obligations (“CLOs”) and commercial asset-backed securities (“ABS”), contributed to returns as these securities provided an attractive uptick in income relative to corporate credit while maintaining a short duration profile. Moreover, the Fund’s allocation to Non-Agency residential mortgage-backed securities (“RMBS”) generated positive absolute return primarily from carry contribution. Carry refers to the income received from portfolio investments over a defined period. Supportive housing dynamics, an improving labor market, and a shrinking outstanding supply of pre-crisis RMBS paper reinforced demand throughout the period.
The Fund held a high allocation to short-term investments to remain opportunistic and maintain sufficient liquidity in light of heightened uncertainty. Within short-term investments, the Fund employed a sovereign asset swap trade that allowed the Fund to register additional yield in non-U.S. sovereign securities relative to maturity-equivalent U.S. government securities while hedging non-U.S. currency exposure. The overweight position and attractive carry contributed to total return.
The Fund’s overall underweight duration position relative to its benchmark, the Bloomberg Barclays U.S. Aggregate Bond 1 – 3 Year Total Return Index, was the largest detractor to performance. Heading into the fourth quarter of 2018, the Fund was underweight duration relative to the benchmark while the Fed was increasing interest rates. The volatility in the fourth quarter along with the Fed’s interest rate cuts ultimately moved short-term rates lower. Over the twelve-month period, the Fund increased duration by approximately one year, moving it closer to the benchmark’s overall duration.
| | THE GUGGENHEIM FUNDS ANNUAL REPORT | 7 |
MANAGERS’ COMMENTARY (Unaudited)(concluded) | September 30, 2019 |
The Fund maintained a short-risk position in Investment Grade credit default swaps to protect the portfolio in the event Investment Grade corporate credit spreads widen. In recent years, corporate leverage ratios have continued to move higher suggesting that any economic slowdown could expose the weaknesses inherent in corporate balance sheets. Short-term Investment Grade corporate bonds rallied over the twelve-month period while the Fund maintained a defensive stance which detracted from performance.
The Fund may invest in certain of the underlying series of Guggenheim Funds Trust and Guggenheim Strategy Funds Trust, including Guggenheim Ultra Short Duration Fund (effective November 30, 2018, Guggenheim Strategy Fund I was reorganized with and into the Guggenheim Ultra Short Duration Fund), Guggenheim Strategy Fund II, and Guggenheim Strategy Fund III, (collectively, the “Short Term Investment Vehicles”), each of which are open-end management investment companies managed by Guggenheim Investments. The Short Term Investment Vehicles, which launched on March 11, 2014, are offered as short term investment options only to mutual funds, trusts, and other accounts managed by Guggenheim Investments and/or its affiliates, and are not available to the public, with the exception of Guggenheim Ultra Short Duration Fund, which is available to the public. Guggenheim Strategy Fund II and Guggenheim Strategy Fund III do not charge an investment management fee. Guggenheim Ultra Short Duration Fund charges an investment management fee but that fee is waived by the respective investee fund. For the one-year period ended September 30, 2019, investment in the Short Term Investment Vehicles benefited Fund performance.
Performance displayed represents past performance which is no guarantee of future results.
1 | Performance figures are based on Class A shares and do not reflect deduction of the sales charges or taxes that a shareholder would pay on distributions or the redemption of shares. |
The opinions and forecast expressed may not actually come to pass. This information is subject to change at any time, based on market and other conditions, and should not be construed as a recommendation of any specific security or strategy.
8 | THE GUGGENHEIM FUNDS ANNUAL REPORT | |
PERFORMANCE REPORT AND FUND PROFILE (Unaudited) | September 30, 2019 |
LIMITED DURATION FUND
OBJECTIVE: Seeks to provide a high level of income consistent with preservation of capital.
Holdings Diversification (Market Exposure as % of Net Assets)
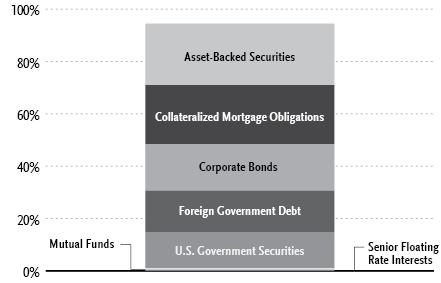
“Holdings Diversification (Market Exposure as % of Net Assets)” excludes any temporary cash investments, investments in Guggenheim Strategy Funds Trust mutual funds, or investments in Guggenheim Ultra Short Duration Fund.
Portfolio Composition by Quality Rating1 |
Rating | | % of Total
Investments | |
Fixed Income Instruments | | | | |
AAA | | | 40.8 | % |
AA | | | 7.5 | % |
A | | | 25.0 | % |
BBB | | | 10.4 | % |
BB | | | 2.8 | % |
B | | | 2.4 | % |
CCC | | | 0.9 | % |
NR2 | | | 5.3 | % |
Other Instruments | | | 4.9 | % |
Total Investments | | | 100.0 | % |
Inception Dates: |
A-Class | December 16, 2013 |
C-Class | December 16, 2013 |
P-Class | May 1, 2015 |
Institutional Class | December 16, 2013 |
R6-Class | March 13, 2019 |
Ten Largest Holdings (% of Total Net Assets) |
U.S. Treasury Notes, 2.38% | | | 7.6 | % |
U.S. Treasury Notes, 1.50% | | | 5.0 | % |
Government of Japan, 01/10/20 | | | 3.1 | % |
Government of Japan, 01/20/20 | | | 1.6 | % |
Federative Republic of Brazil, 07/01/21 | | | 1.1 | % |
Kingdom of Spain, 0.75% | | | 1.0 | % |
U.S. Treasury Inflation Protected Securities, 1.38% | | | 1.0 | % |
Station Place Securitization Trust, 2.64% | | | 1.0 | % |
Government of Japan, 0.10% | | | 1.0 | % |
State of Israel, 0.50% | | | 0.9 | % |
Top Ten Total | | | 23.3 | % |
| | | | | |
“Ten Largest Holdings” excludes any temporary cash or derivative investments. |
1 | Source: BlackRock Solutions. Credit quality ratings are measured on a scale that generally ranges from AAA (highest) to D (lowest). All securities except for those labeled “NR” have been rated by Moody’s, Standard & Poor’s (“S&P”), or Fitch, each of which is a Nationally Recognized Statistical Rating Organization (“NRSRO”). For purposes of this presentation, when ratings are available from more than one agency, the highest rating is used. Guggenheim Investments converts ratings to the equivalent S&P rating. Security ratings are determined at the time of purchase and may change thereafter. |
2 | NR securities do not necessarily indicate low credit quality. |
| | THE GUGGENHEIM FUNDS ANNUAL REPORT | 9 |
PERFORMANCE REPORT AND FUND PROFILE (Unaudited)(concluded) | September 30, 2019 |
Cumulative Fund Performance*

Average Annual Returns*
Periods Ended September 30, 2019
| 1 Year | 5 Year | Since
Inception
(12/16/13) |
A-Class Shares | 2.27% | 2.44% | 2.41% |
A-Class Shares with sales charge‡ | (0.04%) | 1.98% | 2.01% |
C-Class Shares | 1.51% | 1.68% | 1.64% |
C-Class Shares with CDSC§ | 0.51% | 1.68% | 1.64% |
Institutional Class Shares | 2.52% | 2.70% | 2.68% |
Bloomberg Barclays U.S. Aggregate Bond 1-3 Year Total Return Index | 4.66% | 1.61% | 1.49% |
| 1 Year | Since
Inception
(05/01/15) |
P-Class Shares | 2.27% | 2.35% |
Bloomberg Barclays U.S. Aggregate Bond 1-3 Year Total Return Index | 4.66% | 1.64% |
| Since
Inception
(03/13/19)† |
R6-Class Shares | 1.83% |
Bloomberg Barclays U.S. Aggregate Bond 1-3 Year Total Return Index | 2.65% |
* | The performance data above represents past performance that is not predictive of future results. The investment return and principal value of an investment in the Fund will fluctuate so that an investor’s shares, when redeemed, may be worth more or less than their original cost. Returns are historical and include changes in principal and reinvested dividends and capital gains and do not reflect the effect of taxes. The Bloomberg Barclays U.S. Aggregate Bond 1-3 Year Total Return Index is an unmanaged index and, unlike the Fund, has no management fees or operating expenses to reduce its reported return. The graph is based on A-Class shares only; performance for C-Class shares, P-Class shares, Institutional Class shares and R6-Class shares will vary due to differences in fee structures. |
† | Return since commencement of operations is not annualized. |
‡ | Fund returns are calculated using the maximum sales charge of 2.25%. |
§ | Fund returns include a CDSC of 1% if redeemed within 12 months of purchase. |
10 | THE GUGGENHEIM FUNDS ANNUAL REPORT | |
SCHEDULE OF INVESTMENTS | September 30, 2019 |
LIMITED DURATION FUND | |
| | Shares | | | Value | |
MUTUAL FUNDS† - 1.5% |
Guggenheim Floating Rate Strategies Fund — R6-Class1 | | | 799,279 | | | $ | 20,181,794 | |
Guggenheim Strategy Fund II1 | | | 512,405 | | | | 12,723,014 | |
Guggenheim Strategy Fund III1 | | | 439,789 | | | | 10,915,565 | |
Guggenheim Ultra Short Duration Fund — Institutional Class1,7 | | | 871,153 | | | | 8,676,684 | |
Total Mutual Funds | | | | | | | | |
(Cost $53,261,496) | | | | | | | 52,497,057 | |
| | | | | | | | | |
MONEY MARKET FUND† - 0.1% |
Dreyfus Treasury Securities Cash Management Fund — Institutional Shares 1.83%2 | | | 2,239,479 | | | | 2,239,479 | |
Total Money Market Fund | | | | | | | | |
(Cost $2,239,479) | | | | | | | 2,239,479 | |
| | | | | | | | | |
| | | Face
Amount~ | | | | | |
ASSET-BACKED SECURITIES†† - 23.5% |
Collateralized Loan Obligations - 13.1% |
ALM XII Ltd. | | | | | | | | |
2018-12A, 3.21% (3 Month USD LIBOR + 0.89%, Rate Floor: 0.89%) due 04/16/273,4 | | | 32,162,279 | | | | 32,157,635 | |
MP CLO VIII Ltd. | | | | | | | | |
2018-2A, 3.17% (3 Month USD LIBOR + 0.91%, Rate Floor: 0.00%) due 10/28/273,4 | | | 30,300,000 | | | | 30,300,621 | |
Figueroa CLO Ltd. | | | | | | | | |
2018-2A, 3.01% (3 Month USD LIBOR + 0.85%, Rate Floor: 0.85%) due 06/20/273,4 | | | 29,268,968 | | | | 29,164,077 | |
Golub Capital Partners CLO Ltd. | | | | | | | | |
2018-36A, 3.59% (3 Month USD LIBOR + 1.30%, Rate Floor: 0.00%) due 02/05/313,4 | | | 27,500,000 | | | | 27,085,853 | |
Shackleton 2015-VIII CLO Ltd. | | | | | | | | |
2017-8A, 3.20% (3 Month USD LIBOR + 0.92%, Rate Floor: 0.00%) due 10/20/273,4 | | | 23,000,000 | | | | 22,946,884 | |
Halcyon Loan Advisors Funding Ltd. | | | | | | | | |
2017-3A, 3.20% (3 Month USD LIBOR + 0.90%, Rate Floor: 0.00%) due 10/18/273,4 | | | 21,850,000 | | | | 21,859,612 | |
2012-1A, 5.16% (3 Month USD LIBOR + 3.00%, Rate Floor: 0.00%) due 08/15/233,4 | | | 500,000 | | | | 501,410 | |
NewStar Clarendon Fund CLO LLC | | | | | | | | |
2019-1A, 3.58% (3 Month USD LIBOR + 1.30%, Rate Floor: 0.00%) due 01/25/273,4 | | | 20,000,000 | | | | 19,980,148 | |
Venture XII CLO Ltd. | | | | | | | | |
2018-12A, 2.94% (3 Month USD LIBOR + 0.80%, Rate Floor: 0.80%) due 02/28/263,4 | | | 19,878,245 | | | | 19,814,518 | |
Mountain View CLO Ltd. | | | | | | | | |
2018-1A, 3.10% (3 Month USD LIBOR + 0.80%, Rate Floor: 0.80%) due 10/15/263,4 | | | 19,754,075 | | | | 19,767,691 | |
Palmer Square Loan Funding Ltd. | | | | | | | | |
2018-4A, 3.06% (3 Month USD LIBOR + 0.90%, Rate Floor: 0.00%) due 11/15/263,4 | | | 8,899,141 | | | | 8,895,914 | |
2019-3A, 3.17% (3 Month USD LIBOR + 0.85%, Rate Floor: 0.85%) due 08/20/273,4 | | | 6,750,000 | | | | 6,743,586 | |
2018-4A, 3.61% (3 Month USD LIBOR + 1.45%, Rate Floor: 0.00%) due 11/15/263,4 | | | 3,500,000 | | | | 3,494,484 | |
Telos CLO Ltd. | | | | | | | | |
2017-6A, 3.57% (3 Month USD LIBOR + 1.27%, Rate Floor: 0.00%) due 01/17/273,4 | | | 17,682,796 | | | | 17,695,499 | |
Flagship CLO VIII Ltd. | | | | | | | | |
2018-8A, 3.17% (3 Month USD LIBOR + 0.85%, Rate Floor: 0.00%) due 01/16/263,4 | | | 16,924,301 | | | | 16,916,066 | |
Garrison BSL CLO Ltd. | | | | | | | | |
2018-1A, 3.25% (3 Month USD LIBOR + 0.95%, Rate Floor: 0.00%) due 07/17/283,4 | | | 15,770,000 | | | | 15,771,336 | |
Carlyle Global Market Strategies CLO Ltd. | | | | | | | | |
2018-2A, 3.04% (3 Month USD LIBOR + 0.78%, Rate Floor: 0.00%) due 04/27/273,4 | | | 15,510,007 | | | | 15,452,746 | |
Fortress Credit Opportunities IX CLO Ltd. | | | | | | | | |
2017-9A, 3.71% (3 Month USD LIBOR + 1.55%, Rate Floor: 0.00%) due 11/15/293,4 | | | 13,407,000 | | | | 13,326,483 | |
Fortress Credit Opportunities XI CLO Ltd. | | | | | | | | |
2018-11A, 3.60% (3 Month USD LIBOR + 1.30%, Rate Floor: 0.00%) due 04/15/313,4 | | | 13,450,000 | | | | 13,250,008 | |
West CLO Ltd. | | | | | | | | |
2017-1A, 3.22% (3 Month USD LIBOR + 0.92%, Rate Floor: 0.00%) due 07/18/263,4 | | | 10,062,696 | | | | 10,045,960 | |
Crown Point CLO III Ltd. | | | | | | | | |
2017-3A, 3.21% (3 Month USD LIBOR + 0.91%, Rate Floor: 0.00%) due 12/31/273,4 | | | 8,670,000 | | | | 8,673,483 | |
NXT Capital CLO LLC | | | | | | | | |
2017-1A, 3.98% (3 Month USD LIBOR + 1.70%, Rate Floor: 0.00%) due 04/20/293,4 | | | 7,700,000 | | | | 7,700,815 | |
SEE NOTES TO FINANCIAL STATEMENTS. | THE GUGGENHEIM FUNDS ANNUAL REPORT | 11 |
SCHEDULE OF INVESTMENTS (continued) | September 30, 2019 |
LIMITED DURATION FUND | |
| | Face
Amount~ | | | Value | |
NewStar Fairfield Fund CLO Ltd. | | | | | | | | |
2018-2A, 3.55% (3 Month USD LIBOR + 1.27%, Rate Floor: 1.27%) due 04/20/303,4 | | | 6,600,000 | | | $ | 6,493,835 | |
Cerberus Loan Funding XVII Ltd. | | | | | | | | |
2016-3A, 4.83% (3 Month USD LIBOR + 2.53%, Rate Floor: 0.00%) due 01/15/283,4 | | | 6,500,000 | | | | 6,469,557 | |
Diamond CLO Ltd. | | | | | | | | |
2018-1A, 3.78% (3 Month USD LIBOR + 1.50%, Rate Floor: 1.50%) due 07/22/303,4 | | | 6,000,000 | | | | 5,980,594 | |
Seneca Park CLO Limited | | | | | | | | |
2017-1A, 3.80% (3 Month USD LIBOR + 1.50%, Rate Floor: 0.00%) due 07/17/263,4 | | | 4,000,000 | | | | 3,990,999 | |
2017-1A, 3.42% (3 Month USD LIBOR + 1.12%, Rate Floor: 0.00%) due 07/17/263,4 | | | 1,849,590 | | | | 1,853,381 | |
Marathon CLO V Ltd. | | | | | | | | |
2017-5A, 3.02% (3 Month USD LIBOR + 0.87%, Rate Floor: 0.00%) due 11/21/273,4 | | | 5,834,951 | | | | 5,811,858 | |
Monroe Capital CLO Ltd. | | | | | | | | |
2017-1A, 3.63% (3 Month USD LIBOR + 1.35%, Rate Floor: 0.00%) due 10/22/263,4 | | | 4,944,781 | | | | 4,946,042 | |
Golub Capital Partners CLO 16 Ltd. | | | | | | | | |
2017-16A, 3.98% (3 Month USD LIBOR + 1.70%, Rate Floor: 0.00%) due 07/25/293,4 | | | 4,700,000 | | | | 4,700,530 | |
FDF I Ltd. | | | | | | | | |
2015-1A, 4.40% due 11/12/303 | | | 4,500,000 | | | | 4,556,408 | |
Avery Point V CLO Ltd. | | | | | | | | |
2017-5A, 3.28% (3 Month USD LIBOR + 0.98%, Rate Floor: 0.00%) due 07/17/263,4 | | | 4,549,674 | | | | 4,551,525 | |
FDF II Ltd. | | | | | | | | |
2016-2A, 4.29% due 05/12/313 | | | 4,000,000 | | | | 4,073,102 | |
HPS Loan Management 14-2019 Ltd. | | | | | | | | |
2019-19, 2.87% (3 Month USD LIBOR + 0.60%, Rate Floor: 0.60%) due 07/25/303,4 | | | 4,000,000 | | | | 4,001,744 | |
Newstar Commercial Loan Funding LLC | | | | | | | | |
2017-1A, 4.66% (3 Month USD LIBOR + 2.50%, Rate Floor: 0.00%) due 03/20/273,4 | | | 3,000,000 | | | | 2,998,724 | |
2016-1A, 5.88% (3 Month USD LIBOR + 3.75%) due 02/25/283,4 | | | 1,000,000 | | | | 1,000,197 | |
TCP Waterman CLO Ltd. | | | | | | | | |
2016-1A, 4.17% (3 Month USD LIBOR + 2.05%, Rate Floor: 0.00%) due 12/15/283,4 | | | 4,000,000 | | | | 3,998,279 | |
KVK CLO 2018-1 Ltd. | | | | | | | | |
2018-1A, 2.84% (3 Month USD LIBOR + 0.70%, Rate Floor: 0.00%) due 05/20/293,4 | | | 3,977,269 | | | | 3,974,209 | |
VMC Finance LLC | | | | | | | | |
2018-FL1, 2.84% (1 Month USD LIBOR + 0.82%, Rate Floor: 0.82%) due 03/15/353,4 | | | 3,673,599 | | | | 3,653,367 | |
ACIS CLO Ltd. | | | | | | | | |
2014-4A, 3.67% (3 Month USD LIBOR + 1.42%, Rate Floor: 0.00%) due 05/01/263,4 | | | 3,463,884 | | | | 3,468,914 | |
Mountain Hawk II CLO Ltd. | | | | | | | | |
2018-2A, 3.10% (3 Month USD LIBOR + 0.82%, Rate Floor: 0.00%) due 07/20/243,4 | | | 3,011,871 | | | | 3,010,997 | |
Marathon CLO VII Ltd. | | | | | | | | |
2017-7A, 3.91% (3 Month USD LIBOR + 1.65%, Rate Floor: 0.00%) due 10/28/253,4 | | | 3,000,000 | | | | 2,995,906 | |
Northwoods Capital XII-B Ltd. | | | | | | | | |
2018-12BA, 2.87% (3 Month USD LIBOR + 0.75%, Rate Floor: 0.75%) due 06/15/313,4 | | | 2,843,750 | | | | 2,839,723 | |
KVK CLO Ltd. | | | | | | | | |
2017-1A, 3.20% (3 Month USD LIBOR + 0.90%, Rate Floor: 0.00%) due 01/14/283,4 | | | 2,600,000 | | | | 2,590,914 | |
Cent CLO Ltd. | | | | | | | | |
2013-19A, 3.59% (3 Month USD LIBOR + 1.33%, Rate Floor: 0.00%) due 10/29/253,4 | | | 2,259,173 | | | | 2,259,819 | |
Oaktree CLO Ltd. | | | | | | | | |
2017-1A, 3.15% (3 Month USD LIBOR + 0.87%) due 10/20/273,4 | | | 2,000,000 | | | | 1,998,833 | |
Dryden 37 Senior Loan Fund | | | | | | | | |
2015-37A, due 01/15/313,5 | | | 1,500,000 | | | | 1,318,598 | |
Symphony CLO XII Ltd. | | | | | | | | |
2017-12A, 3.80% (3 Month USD LIBOR + 1.50%, Rate Floor: 0.00%) due 10/15/253,4 | | | 1,250,000 | | | | 1,243,535 | |
OHA Credit Partners IX Ltd. | | | | | | | | |
2013-9A, due 10/20/253,5 | | | 1,000,000 | | | | 845,420 | |
Treman Park CLO Ltd. | | | | | | | | |
2015-1A, due 10/20/283,5 | | | 1,000,000 | | | | 827,908 | |
LCM XXII Ltd. | | | | | | | | |
2018-22A, 2.88% (3 Month USD LIBOR + 0.60%, Rate Floor: 0.60%) due 10/20/283,4 | | | 812,500 | | | | 811,950 | |
Flagship VII Ltd. | | | | | | | | |
2017-7A, 3.40% (3 Month USD LIBOR + 1.12%, Rate Floor: 0.00%) due 01/20/263,4 | | | 368,477 | | | | 368,506 | |
12 | THE GUGGENHEIM FUNDS ANNUAL REPORT | SEE NOTES TO FINANCIAL STATEMENTS. |
SCHEDULE OF INVESTMENTS (continued) | September 30, 2019 |
LIMITED DURATION FUND | |
| | Face
Amount~ | | | Value | |
LMREC, Inc. | | | | | | | | |
2016-CRE2, 3.74% (1 Month USD LIBOR + 1.70%, Rate Floor: 1.70%) due 11/24/313,4 | | | 199,123 | | | $ | 200,045 | |
Copper River CLO Ltd. | | | | | | | | |
2007-1A, due 01/20/215,6 | | | 500,000 | | | | 69,397 | |
Total Collateralized Loan Obligations | | | | | | | 459,449,645 | |
| | | | | | | | | |
Financial - 3.7% |
Station Place Securitization Trust | | | | | | | | |
2019-8, 2.64% (1 Month USD LIBOR + 0.60%, Rate Floor: 0.60%) due 03/24/203,4 | | | 35,800,000 | | | | 35,800,000 | |
2019-6, 2.64% (1 Month USD LIBOR + 0.60%, Rate Floor: 0.60%) due 07/24/21†††,3,4 | | | 18,500,000 | | | | 18,500,000 | |
2019-5, 2.74% (1 Month USD LIBOR + 0.70%, Rate Floor: 0.70%) due 06/24/20†††,3,4 | | | 10,800,000 | | | | 10,800,000 | |
2019-9, 2.74% (1 Month USD LIBOR + 0.70%, Rate Floor: 0.00%) due 10/24/203,4 | | | 7,200,000 | | | | 7,200,000 | |
2019-2, 2.59% (1 Month USD LIBOR + 0.55%, Rate Floor: 0.55%) due 04/24/213,4 | | | 5,400,000 | | | | 5,403,126 | |
2019-WL1, 2.67% (1 Month USD LIBOR + 0.65%, Rate Floor: 0.65%) due 08/25/523,4 | | | 5,000,000 | | | | 5,005,065 | |
Barclays Bank plc | | | | | | | | |
GMTN, 2.86% due 10/31/19 | | | 22,800,000 | | | | 22,803,292 | |
GMTN, 2.62% (1 Month USD LIBOR + 0.60%) due 06/02/203,4 | | | 16,450,000 | | | | 16,415,118 | |
Madison Avenue Securitization Trust | | | | | | | | |
due 11/18/204 | | | 6,200,000 | | | | 6,200,000 | |
Total Financial | | | | | | | 128,126,601 | |
| | | | | | | | | |
Transport-Aircraft - 2.7% |
AASET US Ltd. | | | | | | | | |
2018-2A, 4.45% due 11/18/383 | | | 18,438,691 | | | | 18,914,675 | |
Castlelake Aircraft Securitization Trust | | | | | | | | |
2018-1, 4.13% due 06/15/433 | | | 10,181,583 | | | | 10,421,929 | |
2017-1, 3.97% due 07/15/42 | | | 4,441,375 | | | | 4,503,987 | |
Sapphire Aviation Finance I Ltd. | | | | | | | | |
2018-1A, 4.25% due 03/15/403 | | | 13,770,950 | | | | 14,102,486 | |
KDAC Aviation Finance Ltd. | | | | | | | | |
2017-1A, 4.21% due 12/15/423 | | | 10,160,702 | | | | 10,407,707 | |
MAPS Ltd. | | | | | | | | |
2018-1A, 4.21% due 05/15/433 | | | 9,355,500 | | | | 9,595,659 | |
Apollo Aviation Securitization Equity Trust | | | | | | | | |
2016-2, 4.21% due 11/15/41 | | | 7,432,015 | | | | 7,512,016 | |
AIM Aviation Finance Ltd. | | | | | | | | |
2015-1A, 4.21% due 02/15/403 | | | 5,022,533 | | | | 5,080,256 | |
AASET Trust | | | | | | | | |
2017-1A, 3.97% due 05/16/423 | | | 4,213,131 | | | | 4,263,519 | |
Raspro Trust | | | | | | | | |
2005-1A, 3.20% (3 Month USD LIBOR + 0.93%, Rate Floor: 0.93%) due 03/23/243,4 | | | 3,645,470 | | | | 3,597,003 | |
2005-1A, 2.56% (3 Month USD LIBOR + 0.40%, Rate Floor: 0.40%) due 03/23/243,4 | | | 21,035 | | | | 21,018 | |
Falcon Aerospace Ltd. | | | | | | | | |
2017-1, 4.58% due 02/15/423 | | | 2,369,596 | | | | 2,390,967 | |
AASET 2018-1 US Ltd. | | | | | | | | |
2018-1A, 3.84% due 01/16/383 | | | 1,428,953 | | | | 1,437,019 | |
Diamond Head Aviation Ltd. | | | | | | | | |
2015-1, 3.81% due 07/14/283 | | | 862,207 | | | | 862,975 | |
ECAF I Ltd. | | | | | | | | |
2015-1A, 3.47% due 06/15/403 | | | 731,129 | | | | 728,960 | |
Atlas Ltd. | | | | | | | | |
2014-1 A, 4.88% due 12/15/39 | | | 684,015 | | | | 664,888 | |
Total Transport-Aircraft | | | | | | | 94,505,064 | |
| | | | | | | | | |
Automotive - 1.1% |
Hertz Vehicle Financing II, LP | | | | | | | | |
2015-1A, 2.73% due 03/25/213 | | | 31,572,000 | | | | 31,616,321 | |
Avis Budget Rental Car Funding AESOP LLC | | | | | | | | |
2015-1A, 2.50% due 07/20/213 | | | 7,500,000 | | | | 7,505,700 | |
Total Automotive | | | | | | | 39,122,021 | |
| | | | | | | | | |
Transport-Container - 1.1% |
Textainer Marine Containers Ltd. | | | | | | | | |
2017-2A, 3.52% due 06/20/423 | | | 12,700,789 | | | | 12,734,612 | |
CLI Funding LLC | | | | | | | | |
2018-1A, 4.03% due 04/18/433 | | | 7,748,750 | | | | 7,822,726 | |
CAL Funding III Ltd. | | | | | | | | |
2018-1A, 3.96% due 02/25/433 | | | 6,060,000 | | | | 6,112,063 | |
Global SC Finance II SRL | | | | | | | | |
2013-1A, 2.98% due 04/17/283 | | | 5,652,708 | | | | 5,651,821 | |
Textainer Marine Containers V Ltd. | | | | | | | | |
2017-1A, 3.72% due 05/20/423 | | | 4,607,591 | | | | 4,608,490 | |
Cronos Containers Program Ltd. | | | | | | | | |
2013-1A, 3.08% due 04/18/283 | | | 1,583,833 | | | | 1,582,549 | |
Total Transport-Container | | | | | | | 38,512,261 | |
| | | | | | | | | |
Net Lease - 0.9% |
Capital Automotive LLC | | | | | | | | |
2017-1A, 3.87% due 04/15/473 | | | 16,026,715 | | | | 16,177,589 | |
STORE Master Funding I LLC | | | | | | | | |
2015-1A, 4.17% due 04/20/453 | | | 10,463,708 | | | | 10,739,165 | |
2015-1A, 3.75% due 04/20/453 | | | 1,760,250 | | | | 1,796,367 | |
Capital Automotive REIT | | | | | | | | |
2014-1A, 3.66% due 10/15/443 | | | 961,471 | | | | 963,063 | |
Total Net Lease | | | | | | | 29,676,184 | |
| | | | | | | | | |
Collateralized Debt Obligations - 0.4% |
Anchorage Credit Funding Ltd. | | | | | | | | |
2016-4A, 3.50% due 02/15/353 | | | 11,650,000 | | | | 11,700,031 | |
2016-3A, 3.85% due 10/28/333 | | | 1,500,000 | | | | 1,511,365 | |
SEE NOTES TO FINANCIAL STATEMENTS. | THE GUGGENHEIM FUNDS ANNUAL REPORT | 13 |
SCHEDULE OF INVESTMENTS (continued) | September 30, 2019 |
LIMITED DURATION FUND | |
| | Face
Amount~ | | | Value | |
Putnam Structured Product Funding Ltd. | | | | | | | | |
2003-1A, 3.03% (1 Month USD LIBOR + 1.00%, Rate Floor: 0.00%) due 10/15/383,4 | | | 901,726 | | | $ | 893,119 | |
Total Collateralized Debt Obligations | | | | | | | 14,104,515 | |
| | | | | | | | | |
Infrastructure - 0.3% |
Secured Tenant Site Contract Revenue Notes Series | | | | | | | | |
2018-1A, 3.97% due 06/15/483 | | | 7,351,311 | | | | 7,536,445 | |
Vantage Data Centers Issuer LLC | | | | | | | | |
2018-1A, 4.07% due 02/16/433 | | | 3,149,333 | | | | 3,273,618 | |
Total Infrastructure | | | | | | | 10,810,063 | |
| | | | | | | | | |
Whole Business - 0.2% |
Domino’s Pizza Master Issuer LLC | | | | | | | | |
2017-1A, 3.53% (3 Month USD LIBOR + 1.25%, Rate Floor: 0.00%) due 07/25/473,4 | | | 5,145,000 | | | | 5,145,052 | |
Taco Bell Funding LLC | | | | | | | | |
2016-1A, 4.97% due 05/25/463 | | | 2,628,376 | | | | 2,790,757 | |
Drug Royalty III Limited Partnership | | | | | | | | |
2016-1A, 3.98% due 04/15/273 | | | 369,531 | | | | 370,379 | |
Drug Royalty II Limited Partnership 2 | | | | | | | | |
2014-1, 3.48% due 07/15/233 | | | 98,250 | | | | 98,237 | |
Total Whole Business | | | | | | | 8,404,425 | |
| | | | | | | | | |
Transport-Rail - 0.0% |
TRIP Rail Master Funding LLC | | | | | | | | |
2017-1A, 2.71% due 08/15/473 | | | 577,252 | | | | 577,516 | |
| | | | | | | | | |
Insurance - 0.0% |
Chesterfield Financial Holdings LLC | | | | | | | | |
2014-1A, 4.50% due 12/15/343 | | | 401,250 | | | | 403,845 | |
Total Asset-Backed Securities | | | | | | | | |
(Cost $821,959,468) | | | | | | | 823,692,140 | |
| | | | | | | | | |
COLLATERALIZED MORTGAGE OBLIGATIONS†† - 22.6% |
Residential Mortgage Backed Securities - 15.2% |
CIM Trust | | | | | | | | |
2018-R2, 3.69% (WAC) due 08/25/573,4 | | | 28,605,129 | | | | 28,766,471 | |
2018-R4, 4.07% (WAC) due 12/26/573,4 | | | 28,046,866 | | | | 28,381,283 | |
Towd Point Mortgage Trust | | | | | | | | |
2017-6, 2.75% (WAC) due 10/25/573,4 | | | 26,057,184 | | | | 26,305,624 | |
2017-5, 2.62% (1 Month USD LIBOR + 0.60%, Rate Floor: 0.00%) due 02/25/573,4 | | | 14,270,270 | | | | 14,215,391 | |
2018-2, 3.25% (WAC) due 03/25/583,4 | | | 12,645,708 | | | | 12,876,914 | |
2018-1, 3.00% (WAC) due 01/25/583,4 | | | 1,956,827 | | | | 1,981,434 | |
Structured Asset Securities Corporation Mortgage Loan Trust | | | | | | | | |
2007-WF1, 2.23% (1 Month USD LIBOR + 0.21%, Rate Floor: 0.21%) due 02/25/374 | | | 17,978,852 | | | | 17,704,454 | |
2008-BC4, 2.65% (1 Month USD LIBOR + 0.63%, Rate Floor: 0.63%) due 11/25/374 | | | 13,715,754 | | | | 13,681,857 | |
2006-BC4, 2.19% (1 Month USD LIBOR + 0.17%, Rate Floor: 0.17%) due 12/25/364 | | | 1,752,337 | | | | 1,699,667 | |
2006-BC3, 2.18% (1 Month USD LIBOR + 0.16%, Rate Floor: 0.16%) due 10/25/364 | | | 1,783,796 | | | | 1,656,043 | |
2007-BC1, 2.15% (1 Month USD LIBOR + 0.13%, Rate Floor: 0.13%) due 02/25/374 | | | 270,837 | | | | 262,943 | |
Soundview Home Loan Trust | | | | | | | | |
2006-OPT5, 2.16% (1 Month USD LIBOR + 0.14%, Rate Floor: 0.14%) due 07/25/364 | | | 21,398,136 | | | | 20,863,027 | |
2006-1, 2.32% (1 Month USD LIBOR + 0.30%, Rate Floor: 0.30%) due 02/25/364 | | | 6,826,798 | | | | 6,824,002 | |
2005-OPT3, 2.49% (1 Month USD LIBOR + 0.47%, Rate Floor: 0.47%) due 11/25/354 | | | 4,000,000 | | | | 3,954,988 | |
New Residential Mortgage Loan Trust | | | | | | | | |
2018-2A, 3.50% (WAC) due 02/25/583,4 | | | 16,560,840 | | | | 16,893,194 | |
2019-RPL1, 4.33% due 02/26/243,8 | | | 6,642,553 | | | | 6,687,899 | |
2018-1A, 4.00% (WAC) due 12/25/573,4 | | | 4,256,255 | | | | 4,414,573 | |
2017-5A, 3.52% (1 Month USD LIBOR + 1.50%, Rate Floor: 1.50%) due 06/25/573,4 | | | 1,820,819 | | | | 1,847,500 | |
Home Equity Loan Trust | | | | | | | | |
2007-FRE1, 2.21% (1 Month USD LIBOR + 0.19%, Rate Floor: 0.19%) due 04/25/374 | | | 20,524,003 | | | | 19,396,081 | |
New Residential Advance Receivables Trust Advance Receivables Backed | | | | | | | | |
2019-T3, 2.51% due 10/20/523 | | | 19,350,000 | | | | 19,390,997 | |
Cascade Funding Mortgage Trust | | | | | | | | |
2018-RM2, 4.00% (WAC) due 10/25/683,4 | | | 13,136,121 | | | | 13,574,614 | |
2019-RM3, 2.80% (WAC) due 06/25/693,4 | | | 4,000,000 | | | | 4,049,379 | |
CSMC Trust | | | | | | | | |
2018-RPL9, 3.85% (WAC) due 09/25/573,4 | | | 15,330,933 | | | | 15,911,412 | |
NovaStar Mortgage Funding Trust Series | | | | | | | | |
2007-2, 2.22% (1 Month USD LIBOR + 0.20%, Rate Cap/Floor: 11.00%/0.20%) due 09/25/374 | | | 14,389,910 | | | | 13,984,774 | |
Bear Stearns Asset Backed Securities I Trust | | | | | | | | |
2006-HE9, 2.16% (1 Month USD LIBOR + 0.14%, Rate Floor: 0.14%) due 11/25/364 | | | 8,859,487 | | | | 8,640,809 | |
2006-HE3, 2.38% (1 Month USD LIBOR + 0.36%, Rate Floor: 0.36%) due 04/25/364 | | | 3,951,582 | | | | 3,928,887 | |
Ameriquest Mortgage Securities Incorporated Asset-Backed Pass-Through Ctfs Series | | | | | | | | |
2005-R10, 2.45% (1 Month USD LIBOR + 0.43%, Rate Floor: 0.43%) due 01/25/364 | | | 12,500,000 | | | | 12,525,507 | |
14 | THE GUGGENHEIM FUNDS ANNUAL REPORT | SEE NOTES TO FINANCIAL STATEMENTS. |
SCHEDULE OF INVESTMENTS (continued) | September 30, 2019 |
LIMITED DURATION FUND | |
| | Face
Amount~ | | | Value | |
Banc of America Funding Trust | | | | | | | | |
2015-R2, 2.28% (1 Month USD LIBOR + 0.26%, Rate Floor: 0.26%) due 04/29/373,4 | | | 10,278,000 | | | $ | 10,106,263 | |
2015-R4, 2.32% (1 Month USD LIBOR + 0.17%, Rate Floor: 0.17%) due 01/27/353,4 | | | 2,245,121 | | | | 2,226,642 | |
CIT Mortgage Loan Trust | | | | | | | | |
2007-1, 3.37% (1 Month USD LIBOR + 1.35%, Rate Floor: 1.35%) due 10/25/373,4 | | | 11,266,175 | | | | 11,391,436 | |
2007-1, 3.47% (1 Month USD LIBOR + 1.45%, Rate Floor: 1.45%) due 10/25/373,4 | | | 735,885 | | | | 739,181 | |
Alternative Loan Trust | | | | | | | | |
2007-OA7, 2.16% (1 Month USD LIBOR + 0.14%, Rate Floor: 0.14%) due 05/25/474 | | | 8,688,198 | | | | 8,235,616 | |
2007-OH3, 2.31% (1 Month USD LIBOR + 0.29%, Rate Cap/Floor: 10.00%/0.29%) due 09/25/474 | | | 3,475,999 | | | | 3,478,086 | |
BRAVO Residential Funding Trust | | | | | | | | |
2019-NQM1, 2.67% (WAC) due 07/25/593,4 | | | 11,678,492 | | | | 11,694,025 | |
Ocwen Master Advance Receivables Trust | | | | | | | | |
2019-T2, 2.42% due 08/15/513 | | | 9,000,000 | | | | 9,021,658 | |
American Home Mortgage Investment Trust | | | | | | | | |
2006-3, 2.38% (1 Month USD LIBOR + 0.36%, Rate Cap/Floor: 10.50%/0.18%) due 12/25/464 | | | 9,298,437 | | | | 8,916,158 | |
NRPL Trust | | | | | | | | |
2019-3, 3.00% (WAC) due 06/01/593,4 | | | 8,750,000 | | | | 8,723,839 | |
Starwood Mortgage Residential Trust | | | | | | | | |
2019-1, 2.94% (WAC) due 06/25/493,4 | | | 8,414,838 | | | | 8,432,300 | |
Morgan Stanley Home Equity Loan Trust | | | | | | | | |
2006-2, 2.30% (1 Month USD LIBOR + 0.28%, Rate Floor: 0.28%) due 02/25/364 | | | 7,575,890 | | | | 7,592,821 | |
Argent Securities Incorporated Asset-Backed Pass-Through Certificates Series | | | | | | | | |
2005-W2, 2.51% (1 Month USD LIBOR + 0.49%, Rate Floor: 0.49%) due 10/25/354 | | | 7,250,000 | | | | 7,260,338 | |
Park Place Securities Incorporated Asset Backed Pass Through Certificates Ser | | | | | | | | |
2005-WHQ3, 2.96% (1 Month USD LIBOR + 0.95%, Rate Floor: 0.63%) due 06/25/354 | | | 7,025,000 | | | | 7,040,976 | |
Deephaven Residential Mortgage Trust | | | | | | | | |
2019-3A, 2.96% (WAC) due 07/25/593,4 | | | 4,304,955 | | | | 4,324,057 | |
2017-3A, 2.58% (WAC) due 10/25/473,4 | | | 2,578,910 | | | | 2,571,033 | |
Freddie Mac STACR Trust | | | | | | | | |
2019-DNA3, 2.75% (1 Month USD LIBOR + 0.73%, Rate Floor: 0.00%) due 07/25/493,4 | | | 6,669,078 | | | | 6,671,540 | |
Homeward Opportunities Fund I Trust | | | | | | | | |
2019-2, 2.70% (WAC) due 09/25/593,4 | | | 6,601,531 | | | | 6,593,054 | |
HarborView Mortgage Loan Trust | | | | | | | | |
2006-14, 2.21% (1 Month USD LIBOR + 0.15%, Rate Floor: 0.15%) due 01/25/474 | | | 3,489,178 | | | | 3,462,787 | |
2006-12, 2.25% (1 Month USD LIBOR + 0.19%, Rate Floor: 0.19%) due 01/19/384 | | | 3,040,035 | | | | 2,937,007 | |
First NLC Trust | | | | | | | | |
2005-4, 2.41% (1 Month USD LIBOR + 0.39%, Rate Cap/Floor: 14.00%/0.39%) due 02/25/364 | | | 6,330,629 | | | | 6,341,338 | |
Countrywide Asset-Backed Certificates | | | | | | | | |
2006-6, 2.19% (1 Month USD LIBOR + 0.17%, Rate Floor: 0.17%) due 09/25/364 | | | 4,395,595 | | | | 4,355,797 | |
2006-5, 2.31% (1 Month USD LIBOR + 0.29%, Rate Floor: 0.29%) due 08/25/364 | | | 1,699,927 | | | | 1,697,098 | |
Nationstar Home Equity Loan Trust | | | | | | | | |
2007-B, 2.24% (1 Month USD LIBOR + 0.22%, Rate Floor: 0.22%) due 04/25/374 | | | 5,947,963 | | | | 5,881,201 | |
LSTAR Securities Investment Trust | | | | | | | | |
2019-1, 3.79% (1 Month USD LIBOR + 1.70%, Rate Floor: 0.00%) due 03/01/243,4 | | | 3,547,036 | | | | 3,548,987 | |
2018-2, 3.53% (1 Month USD LIBOR + 1.50%, Rate Floor: 0.00%) due 04/01/233,4 | | | 2,239,519 | | | | 2,237,392 | |
FBR Securitization Trust | | | | | | | | |
2005-2, 2.77% (1 Month USD LIBOR + 0.75%, Rate Cap/Floor: 14.00%/0.50%) due 09/25/354 | | | 5,534,900 | | | | 5,545,903 | |
COLT Mortgage Loan Trust | | | | | | | | |
2018-3, 3.69% (WAC) due 10/26/483,4 | | | 5,433,053 | | | | 5,468,341 | |
Structured Asset Investment Loan Trust | | | | | | | | |
2006-3, 2.17% (1 Month USD LIBOR + 0.15%, Rate Floor: 0.15%) due 06/25/364 | | | 4,757,590 | | | | 4,644,957 | |
2005-2, 2.75% (1 Month USD LIBOR + 0.74%, Rate Floor: 0.49%) due 03/25/354 | | | 539,966 | | | | 540,541 | |
2005-1, 2.74% (1 Month USD LIBOR + 0.72%, Rate Floor: 0.48%) due 02/25/353,4 | | | 215,536 | | | | 215,725 | |
JP Morgan Mortgage Acquisition Trust | | | | | | | | |
2006-HE2, 2.16% (1 Month USD LIBOR + 0.14%, Rate Floor: 0.14%) due 07/25/364 | | | 5,269,736 | | | | 5,250,776 | |
Citigroup Mortgage Loan Trust | | | | | | | | |
2019-IMC1, 2.72% (WAC) due 07/25/493,4 | | | 4,797,151 | | | | 4,790,089 | |
Legacy Mortgage Asset Trust | | | | | | | | |
2018-GS3, 4.00% due 06/25/583,8 | | | 4,666,707 | | | | 4,718,735 | |
Credit-Based Asset Servicing & Securitization LLC | | | | | | | | |
2006-CB2, 2.21% (1 Month USD LIBOR + 0.19%, Rate Floor: 0.19%) due 12/25/364 | | | 4,032,661 | | | | 3,952,636 | |
CWABS Incorporated Asset-Backed Certificates Trust | | | | | | | | |
2004-4, 2.74% (1 Month USD LIBOR + 0.72%, Rate Floor: 0.48%) due 07/25/344 | | | 3,732,164 | | | | 3,745,778 | |
SEE NOTES TO FINANCIAL STATEMENTS. | THE GUGGENHEIM FUNDS ANNUAL REPORT | 15 |
SCHEDULE OF INVESTMENTS (continued) | September 30, 2019 |
LIMITED DURATION FUND | |
| | Face
Amount~ | | | Value | |
CSMC Series | | | | | | | | |
2015-12R, 2.77% (WAC) due 11/30/373,4 | | | 3,510,365 | | | $ | 3,495,671 | |
2014-2R, 2.35% (1 Month USD LIBOR + 0.20%, Rate Floor: 0.20%) due 02/27/463,4 | | | 223,684 | | | | 217,428 | |
Asset Backed Securities Corporation Home Equity Loan Trust Series AEG | | | | | | | | |
2006-HE1, 2.42% (1 Month USD LIBOR + 0.40%, Rate Floor: 0.40%) due 01/25/364 | | | 3,350,000 | | | | 3,245,728 | |
ACE Securities Corporation Home Equity Loan Trust Series | | | | | | | | |
2005-HE2, 3.04% (1 Month USD LIBOR + 1.02%, Rate Floor: 0.68%) due 04/25/354 | | | 2,000,000 | | | | 2,003,991 | |
Morgan Stanley Capital I Incorporated Trust | | | | | | | | |
2006-HE1, 2.31% (1 Month USD LIBOR + 0.29%, Rate Floor: 0.29%) due 01/25/364 | | | 1,551,185 | | | | 1,532,132 | |
Morgan Stanley ABS Capital I Incorporated Trust | | | | | | | | |
2006-NC1, 2.40% (1 Month USD LIBOR + 0.38%, Rate Floor: 0.38%) due 12/25/354 | | | 1,500,000 | | | | 1,487,280 | |
Deutsche Alt-A Securities Mortgage Loan Trust Series | | | | | | | | |
2006-AF1, 2.32% (1 Month USD LIBOR + 0.30%, Rate Floor: 0.30%) due 04/25/364 | | | 1,262,736 | | | | 1,222,448 | |
First Franklin Mortgage Loan Trust | | | | | | | | |
2004-FF10, 3.29% (1 Month USD LIBOR + 1.28%, Rate Floor: 0.85%) due 07/25/344 | | | 1,216,840 | | | | 1,222,163 | |
Nomura Resecuritization Trust | | | | | | | | |
2015-4R, 5.17% (1 Month USD LIBOR + 0.43%, Rate Floor: 0.43%) due 03/26/363,4 | | | 1,030,936 | | | | 1,007,792 | |
GE-WMC Asset-Backed Pass-Through Certificates Series | | | | | | | | |
2005-2, 2.27% (1 Month USD LIBOR + 0.25%, Rate Floor: 0.25%) due 12/25/354 | | | 959,832 | | | | 954,005 | |
GSMSC Resecuritization Trust | | | | | | | | |
2015-5R, 2.29% (1 Month USD LIBOR + 0.14%, Rate Floor: 0.14%) due 04/26/373,4 | | | 627,490 | | | | 625,498 | |
Encore Credit Receivables Trust | | | | | | | | |
2005-4, 2.46% (1 Month USD LIBOR + 0.44%, Rate Floor: 0.44%) due 01/25/364 | | | 617,627 | | | | 617,730 | |
UCFC Manufactured Housing Contract | | | | | | | | |
1997-2, 7.38% due 10/15/28 | | | 314,665 | | | | 332,229 | |
GSAMP Trust | | | | | | | | |
2005-HE6, 2.46% (1 Month USD LIBOR + 0.44%, Rate Floor: 0.44%) due 11/25/354 | | | 171,980 | | | | 172,370 | |
Morgan Stanley Re-REMIC Trust | | | | | | | | |
2010-R5, 3.37% due 06/26/363 | | | 105,072 | | | | 97,535 | |
First Frankin Mortgage Loan Trust | | | | | | | | |
2006-FF4, 2.21% (1 Month USD LIBOR + 0.19%, Rate Floor: 0.19%) due 03/25/364 | | | 17,930 | | | | 17,895 | |
Accredited Mortgage Loan Trust | | | | | | | | |
2007-1, 2.15% (1 Month USD LIBOR + 0.13%, Rate Cap/Floor: 14.00%/0.13%) due 02/25/374 | | | 11,726 | | | | 11,703 | |
Total Residential Mortgage Backed Securities | | | | | | | 533,037,433 | |
| | | | | | | | | |
Government Agency - 4.9% |
Fannie Mae | | | | | | | | |
2.34% due 11/01/22 | | | 28,700,000 | | | | 29,029,633 | |
3.59% due 02/01/29 | | | 10,200,000 | | | | 11,030,988 | |
2.63% due 09/01/21 | | | 7,150,000 | | | | 7,200,247 | |
3.01% due 12/01/27 | | | 4,600,000 | | | | 4,905,904 | |
2.24% due 11/01/22 | | | 4,592,694 | | | | 4,634,168 | |
1.95% due 11/01/20 | | | 4,550,000 | | | | 4,537,503 | |
2.99% due 03/01/30 | | | 4,000,000 | | | | 4,277,057 | |
3.71% due 03/01/31 | | | 3,000,000 | | | | 3,391,123 | |
3.13% due 01/01/30 | | | 3,050,000 | | | | 3,265,191 | |
3.23% due 01/01/30 | | | 2,924,824 | | | | 3,169,443 | |
3.12% due 01/01/30 | | | 2,918,283 | | | | 3,139,385 | |
3.21% due 08/01/27 | | | 2,151,859 | | | | 2,299,725 | |
3.17% due 01/01/30 | | | 1,700,000 | | | | 1,833,415 | |
3.22% due 01/01/30 | | | 1,300,000 | | | | 1,407,863 | |
2.25% due 07/01/21 | | | 970,956 | | | | 972,075 | |
Freddie Mac Seasoned Credit Risk Transfer Trust | | | | | | | | |
2018-1, 2.75% due 05/25/578 | | | 25,332,445 | | | | 25,832,356 | |
2017-4, 3.00% due 06/25/578 | | | 16,434,877 | | | | 16,767,420 | |
2017-4, 3.50% due 06/25/57 | | | 8,399,341 | | | | 8,816,981 | |
2017-3, 3.00% due 07/25/56 | | | 878,313 | | | | 896,085 | |
Freddie Mac Multifamily Structured Pass Through Certificates | | | | | | | | |
2018-K074, 3.60% due 02/25/28 | | | 14,000,000 | | | | 15,406,824 | |
2017-KGX1, 3.00% due 10/25/27 | | | 14,000,000 | | | | 14,871,616 | |
2018-K078, 3.92% due 06/25/28 | | | 3,350,000 | | | | 3,766,560 | |
2013-K035, 0.52% (WAC) due 08/25/234,9 | | | 105,640,499 | | | | 1,401,691 | |
Total Government Agency | | | | | | | 172,853,253 | |
| | | | | | | | | |
Commercial Mortgage Backed Securities - 2.5% |
CGBAM Mezzanine Securities Trust | | | | | | | | |
2015-SMMZ, 8.21% due 04/10/283 | | | 15,800,000 | | | | 16,061,482 | |
Americold LLC Trust | | | | | | | | |
2010-ARTA, 6.81% due 01/14/293 | | | 8,995,000 | | | | 9,346,052 | |
2010-ARTA, 7.44% due 01/14/293 | | | 3,500,000 | | | | 3,643,413 | |
Wells Fargo Commercial Mortgage Trust | | | | | | | | |
2016-C37, 1.14% (WAC) due 12/15/494,9 | | | 37,531,778 | | | | 1,630,200 | |
2017-C38, 1.21% (WAC) due 07/15/504,9 | | | 25,582,978 | | | | 1,621,247 | |
2015-LC22, 0.99% (WAC) due 09/15/584,9 | | | 23,717,556 | | | | 927,269 | |
2017-C42, 1.04% (WAC) due 12/15/504,9 | | | 14,887,618 | | | | 912,818 | |
2017-RB1, 1.43% (WAC) due 03/15/504,9 | | | 9,904,701 | | | | 776,729 | |
2016-NXS5, 1.67% (WAC) due 01/15/594,9 | | | 6,733,337 | | | | 425,310 | |
JP Morgan Chase Commercial Mortgage Securities Trust 2016-JP2 | | | | | | | | |
2016-JP2, 1.98% (WAC) due 08/15/494,9 | | | 37,492,350 | | | | 3,766,751 | |
16 | THE GUGGENHEIM FUNDS ANNUAL REPORT | SEE NOTES TO FINANCIAL STATEMENTS. |
SCHEDULE OF INVESTMENTS (continued) | September 30, 2019 |
LIMITED DURATION FUND | |
| | Face
Amount~ | | | Value | |
COMM Mortgage Trust | | | | | | | | |
2015-CR24, 0.91% (WAC) due 08/10/484,9 | | | 64,516,830 | | | $ | 2,475,117 | |
2018-COR3, 0.59% (WAC) due 05/10/514,9 | | | 35,608,492 | | | | 1,240,625 | |
Banc of America Commercial Mortgage Trust | | | | | | | | |
2017-BNK3, 1.28% (WAC) due 02/15/504,9 | | | 33,311,490 | | | | 2,100,906 | |
2016-UB10, 2.13% (WAC) due 07/15/494,9 | | | 18,859,436 | | | | 1,551,788 | |
DBJPM Mortgage Trust | | | | | | | | |
2017-C6, 1.17% (WAC) due 06/10/504,9 | | | 62,569,381 | | | | 3,547,196 | |
BENCHMARK Mortgage Trust | | | | | | | | |
2018-B2, 0.56% (WAC) due 02/15/514,9 | | | 123,512,164 | | | | 3,272,751 | |
UBS Commercial Mortgage Trust | | | | | | | | |
2017-C2, 1.24% (WAC) due 08/15/504,9 | | | 31,033,673 | | | | 2,042,773 | |
2017-C5, 1.16% (WAC) due 11/15/504,9 | | | 13,922,792 | | | | 827,617 | |
Morgan Stanley Bank of America Merrill Lynch Trust | | | | | | | | |
2015-C27, 1.07% (WAC) due 12/15/474,9 | | | 34,497,715 | | | | 1,547,481 | |
2017-C34, 0.96% (WAC) due 11/15/524,9 | | | 24,534,267 | | | | 1,273,343 | |
JPMDB Commercial Mortgage Securities Trust | | | | | | | | |
2016-C4, 0.95% (WAC) due 12/15/494,9 | | | 39,316,798 | | | | 1,883,294 | |
2016-C2, 1.83% (WAC) due 06/15/494,9 | | | 8,745,177 | | | | 619,267 | |
2017-C5, 1.14% (WAC) due 03/15/504,9 | | | 3,559,777 | | | | 201,426 | |
Morgan Stanley Capital I Trust | | | | | | | | |
2014-MP, 3.82% (WAC) due 08/11/333,4 | | | 2,000,000 | | | | 2,056,678 | |
2014-MP, 3.69% due 08/11/333 | | | 365,000 | | | | 375,105 | |
BANK | | | | | | | | |
2017-BNK7, 0.93% (WAC) due 09/15/604,9 | | | 34,518,512 | | | | 1,654,431 | |
2017-BNK6, 1.00% (WAC) due 07/15/604,9 | | | 15,355,066 | | | | 773,363 | |
CSAIL Commercial Mortgage Trust | | | | | | | | |
2019-C15, 1.22% (WAC) due 03/15/524,9 | | | 19,981,262 | | | | 1,546,893 | |
2016-C6, 1.94% (WAC) due 01/15/494,9 | | | 9,758,291 | | | | 784,893 | |
Aventura Mall Trust | | | | | | | | |
2013-AVM, 3.87% (WAC) due 12/05/323,4 | | | 2,200,000 | | | | 2,225,847 | |
Bancorp Commercial Mortgage Trust | | | | | | | | |
2018-CR3, 3.28% (1 Month USD LIBOR + 1.25%, Rate Floor: 1.25%) due 01/15/333,4 | | | 2,200,000 | | | | 2,203,475 | |
Credit Suisse First Boston Mortgage Securities Corporation Series | | | | | | | | |
2006-OMA, 5.63% due 05/15/233 | | | 2,000,000 | | | | 2,012,648 | |
BBCMS Mortgage Trust | | | | | | | | |
2018-C2, 0.77% (WAC) due 12/15/514,9 | | | 29,942,691 | | | | 1,793,241 | |
BAMLL Commercial Mortgage Securities Trust | | | | | | | | |
2012-PARK, 2.96% due 12/10/303 | | | 1,300,000 | | | | 1,337,740 | |
CD Mortgage Trust | | | | | | | | |
2017-CD6, 1.11% (WAC) due 11/13/504,9 | | | 14,753,558 | | | | 805,813 | |
2016-CD1, 1.55% (WAC) due 08/10/494,9 | | | 6,916,367 | | | | 507,388 | |
CD Commercial Mortgage Trust | | | | | | | | |
2017-CD4, 1.47% (WAC) due 05/10/504,9 | | | 17,069,024 | | | | 1,241,710 | |
CGMS Commercial Mortgage Trust | | | | | | | | |
2017-B1, 0.99% (WAC) due 08/15/504,9 | | | 22,178,792 | | | | 1,130,116 | |
Citigroup Commercial Mortgage Trust | | | | | | | | |
2016-C2, 1.92% (WAC) due 08/10/494,9 | | | 6,651,349 | | | | 634,946 | |
2016-GC37, 1.93% (WAC) due 04/10/494,9 | | | 3,722,663 | | | | 333,917 | |
Americold LLC | | | | | | | | |
2010-ARTA, 4.95% due 01/14/293 | | | 840,000 | | | | 860,485 | |
Morgan Stanley Capital I Trust | | | | | | | | |
2014-MP, 3.47% due 08/11/333 | | | 800,000 | | | | 819,479 | |
GS Mortgage Securities Trust | | | | | | | | |
2017-GS6, 1.19% (WAC) due 05/10/504,9 | | | 11,526,266 | | | | 793,598 | |
JPMBB Commercial Mortgage Securities Trust | | | | | | | | |
2013-C17, 0.93% (WAC) due 01/15/474,9 | | | 23,514,093 | | | | 647,719 | |
GE Business Loan Trust | | | | | | | | |
2007-1A, 2.20% (1 Month USD LIBOR + 0.17%, Rate Floor: 0.17%) due 04/15/353,4 | | | 220,471 | | | | 216,009 | |
Total Commercial Mortgage Backed Securities | | | | | | | 86,450,349 | |
Total Collateralized Mortgage Obligations | | | | | | | | |
(Cost $777,682,099) | | | | | | | 792,341,035 | |
| | | | | | | | | |
CORPORATE BONDS†† - 17.8% |
Financial - 8.7% |
Santander UK plc | | | | | | | | |
2.76% (3 Month USD LIBOR + 0.62%) due 06/01/214 | | | 30,740,000 | | | | 30,768,057 | |
Wells Fargo & Co. | | | | | | | | |
3.11% (3 Month USD LIBOR + 0.93%) due 02/11/224 | | | 29,450,000 | | | | 29,630,341 | |
Capital One Financial Corp. | | | | | | | | |
2.94% (3 Month USD LIBOR + 0.76%) due 05/12/204 | | | 22,900,000 | | | | 22,973,212 | |
Mitsubishi UFJ Financial Group, Inc. | | | | | | | | |
2.92% (3 Month USD LIBOR + 0.65%) due 07/26/214 | | | 11,450,000 | | | | 11,488,708 | |
3.19% (3 Month USD LIBOR + 1.06%) due 09/13/214 | | | 5,990,000 | | | | 6,055,111 | |
4.02% (3 Month USD LIBOR + 1.88%) due 03/01/214 | | | 453,000 | | | | 462,494 | |
Goldman Sachs Group, Inc. | | | | | | | | |
2.83% (3 Month USD LIBOR + 0.73%) due 12/27/204 | | | 15,700,000 | | | | 15,715,208 | |
3.32% (3 Month USD LIBOR + 1.20%) due 09/15/204 | | | 1,000,000 | | | | 1,007,709 | |
Citibank North America | | | | | | | | |
2.83% (3 Month USD LIBOR + 0.57%) due 07/23/214 | | | 16,390,000 | | | | 16,483,285 | |
Sumitomo Mitsui Banking Corp. | | | | | | | | |
2.65% (3 Month USD LIBOR + 0.35%) due 01/17/204 | | | 15,450,000 | | | | 15,464,314 | |
Svenska Handelsbanken AB | | | | | | | | |
2.60% (3 Month USD LIBOR + 0.47%) due 05/24/214 | | | 13,500,000 | | | | 13,546,903 | |
3.35% due 05/24/21 | | | 1,179,000 | | | | 1,203,713 | |
UBS Group Funding Switzerland AG | | | | | | | | |
2.95% due 09/24/203 | | | 7,670,000 | | | | 7,736,142 | |
4.08% (3 Month USD LIBOR + 1.78%, Rate Floor: 0.00%) due 04/14/213,4 | | | 5,700,000 | | | | 5,819,055 | |
3.57% (3 Month USD LIBOR + 1.44%) due 09/24/203,4 | | | 1,000,000 | | | | 1,013,148 | |
SEE NOTES TO FINANCIAL STATEMENTS. | THE GUGGENHEIM FUNDS ANNUAL REPORT | 17 |
SCHEDULE OF INVESTMENTS (continued) | September 30, 2019 |
LIMITED DURATION FUND | |
| | Face
Amount~ | | | Value | |
Synchrony Bank | | | | | | | | |
2.73% (3 Month USD LIBOR + 0.63%) due 03/30/204 | | | 14,450,000 | | | $ | 14,455,326 | |
JPMorgan Chase & Co. | | | | | | | | |
2.82% (3 Month USD LIBOR + 0.68%) due 06/01/214 | | | 8,100,000 | | | | 8,112,948 | |
2.40% due 06/07/21 | | | 3,578,000 | | | | 3,595,011 | |
Credit Agricole S.A. | | | | | | | | |
3.10% (3 Month USD LIBOR + 0.97%) due 06/10/203,4 | | | 11,550,000 | | | | 11,614,105 | |
Credit Suisse AG NY | | | | | | | | |
2.66% (3 Month USD LIBOR + 0.40%) due 07/31/204 | | | 10,190,000 | | | | 10,198,312 | |
Standard Chartered Bank | | | | | | | | |
2.69% (3 Month USD LIBOR + 0.40%) due 08/04/204 | | | 10,170,000 | | | | 10,184,418 | |
ANZ New Zealand Int’l Ltd. | | | | | | | | |
2.85% due 08/06/203 | | | 10,000,000 | | | | 10,070,136 | |
Citizens Bank North America/Providence RI | | | | | | | | |
2.70% (3 Month USD LIBOR + 0.57%) due 05/26/204 | | | 8,050,000 | | | | 8,069,570 | |
Lloyds Bank plc | | | | | | | | |
2.70% (3 Month USD LIBOR + 0.49%) due 05/07/214 | | | 8,050,000 | | | | 8,049,180 | |
Sumitomo Mitsui Trust Bank Ltd. | | | | | | | | |
3.21% (3 Month USD LIBOR + 0.91%) due 10/18/193,4 | | | 7,600,000 | | | | 7,604,061 | |
Morgan Stanley | | | | | | | | |
5.50% due 07/24/20 | | | 4,951,000 | | | | 5,084,390 | |
3.10% (3 Month USD LIBOR + 0.98%) due 06/16/204 | | | 1,650,000 | | | | 1,658,316 | |
Westpac Banking Corp. | | | | | | | | |
3.19% (3 Month USD LIBOR + 0.85%) due 01/11/224 | | | 5,000,000 | | | | 5,056,729 | |
SVB Financial Group | | | | | | | | |
5.38% due 09/15/20 | | | 4,130,000 | | | | 4,253,375 | |
Bank of America Corp. | | | | | | | | |
2.97% (3 Month USD LIBOR + 0.65%) due 10/01/214 | | | 4,200,000 | | | | 4,212,902 | |
Essex Portfolio, LP | | | | | | | | |
5.20% due 03/15/21 | | | 2,650,000 | | | | 2,741,799 | |
Lloyds Bank Corporate Markets plc NY | | | | | | | | |
2.66% (3 Month USD LIBOR + 0.37%) due 08/05/204 | | | 2,070,000 | | | | 2,072,235 | |
AXIS Specialty Finance LLC | | | | | | | | |
5.88% due 06/01/20 | | | 1,994,000 | | | | 2,040,501 | |
Sumitomo Mitsui Financial Group, Inc. | | | | | | | | |
3.78% (3 Month USD LIBOR + 1.68%) due 03/09/214 | | | 1,000,000 | | | | 1,018,170 | |
3.44% (3 Month USD LIBOR + 1.14%) due 10/19/214 | | | 702,000 | | | | 710,819 | |
Assurant, Inc. | | | | | | | | |
3.36% (3 Month USD LIBOR + 1.25%) due 03/26/214 | | | 1,592,000 | | | | 1,592,143 | |
Mizuho Financial Group, Inc. | | | | | | | | |
3.27% (3 Month USD LIBOR + 1.14%) due 09/13/214 | | | 1,500,000 | | | | 1,517,652 | |
Credit Suisse Group Funding Guernsey Ltd. | | | | | | | | |
2.75% due 03/26/20 | | | 1,180,000 | | | | 1,183,151 | |
UBS AG | | | | | | | | |
2.62% (3 Month USD LIBOR + 0.48%) due 12/01/203,4 | | | 1,000,000 | | | | 1,002,532 | |
Total Financial | | | | | | | 305,465,181 | |
| | | | | | | | | |
Consumer, Non-cyclical - 4.3% |
Express Scripts Holding Co. | | | | | | | | |
2.87% (3 Month USD LIBOR + 0.75%) due 11/30/204 | | | 21,875,000 | | | | 21,876,775 | |
Zimmer Biomet Holdings, Inc. | | | | | | | | |
2.91% (3 Month USD LIBOR + 0.75%) due 03/19/214 | | | 11,050,000 | | | | 11,050,194 | |
2.70% due 04/01/20 | | | 9,780,000 | | | | 9,796,690 | |
General Mills, Inc. | | | | | | | | |
2.86% (3 Month USD LIBOR + 0.54%) due 04/16/214 | | | 20,750,000 | | | | 20,797,111 | |
Mondelez International, Inc. | | | | | | | | |
3.00% due 05/07/20 | | | 11,330,000 | | | | 11,387,994 | |
Allergan Funding SCS | | | | | | | | |
3.39% (3 Month USD LIBOR + 1.26%) due 03/12/204 | | | 11,300,000 | | | | 11,344,879 | |
CVS Health Corp. | | | | | | | | |
2.82% (3 Month USD LIBOR + 0.72%) due 03/09/214 | | | 9,200,000 | | | | 9,244,368 | |
2.73% (3 Month USD LIBOR + 0.63%) due 03/09/204 | | | 894,000 | | | | 895,765 | |
Coca-Cola Femsa SAB de CV | | | | | | | | |
4.63% due 02/15/20 | | | 9,700,000 | | | | 9,773,740 | |
Biogen, Inc. | | | | | | | | |
2.90% due 09/15/20 | | | 9,700,000 | | | | 9,769,953 | |
Molson Coors Brewing Co. | | | | | | | | |
2.25% due 03/15/20 | | | 9,700,000 | | | | 9,694,075 | |
Coca-Cola European Partners plc | | | | | | | | |
3.50% due 09/15/20 | | | 7,000,000 | | | | 7,081,013 | |
Reynolds American, Inc. | | | | | | | | |
6.88% due 05/01/20 | | | 4,802,000 | | | | 4,927,627 | |
Anthem, Inc. | | | | | | | | |
4.35% due 08/15/20 | | | 4,180,000 | | | | 4,262,340 | |
Cigna Corp. | | | | | | | | |
2.79% (3 Month USD LIBOR + 0.65%) due 09/17/214 | | �� | 4,100,000 | | | | 4,100,144 | |
Zoetis, Inc. | | | | | | | | |
3.45% due 11/13/20 | | | 2,180,000 | | | | 2,208,172 | |
Bayer US Finance LLC | | | | | | | | |
2.38% due 10/08/193 | | | 1,000,000 | | | | 999,992 | |
Conagra Brands, Inc. | | | | | | | | |
3.03% (3 Month USD LIBOR + 0.75%) due 10/22/204 | | | 850,000 | | | | 850,174 | |
Laboratory Corporation of America Holdings | | | | | | | | |
2.63% due 02/01/20 | | | 500,000 | | | | 500,351 | |
18 | THE GUGGENHEIM FUNDS ANNUAL REPORT | SEE NOTES TO FINANCIAL STATEMENTS. |
SCHEDULE OF INVESTMENTS (continued) | September 30, 2019 |
LIMITED DURATION FUND | |
| | Face
Amount~ | | | Value | |
Constellation Brands, Inc. | | | | | | | | |
2.25% due 11/06/20 | | | 380,000 | | | $ | 380,121 | |
Total Consumer, Non-cyclical | | | | | | | 150,941,478 | |
| | | | | | | | | |
Industrial - 1.5% |
Siemens Financieringsmaatschappij N.V. | | | | | | | | |
2.73% (3 Month USD LIBOR + 0.61%) due 03/16/223,4 | | | 20,410,000 | | | | 20,580,415 | |
Aviation Capital Group LLC | | | | | | | | |
2.88% due 01/20/223 | | | 8,000,000 | | | | 8,032,373 | |
7.13% due 10/15/203 | | | 2,500,000 | | | | 2,615,583 | |
L3Harris Technologies, Inc. | | | | | | | | |
2.70% due 04/27/20 | | | 8,976,000 | | | | 8,993,967 | |
Rolls-Royce plc | | | | | | | | |
2.38% due 10/14/203 | | | 6,550,000 | | | | 6,557,346 | |
Textron, Inc. | | | | | | | | |
2.73% (3 Month USD LIBOR + 0.55%) due 11/10/204 | | | 5,700,000 | | | | 5,697,433 | |
Molex Electronic Technologies LLC | | | | | | | | |
2.88% due 04/15/203 | | | 1,030,000 | | | | 1,031,662 | |
Total Industrial | | | | | | | 53,508,779 | |
| | | | | | | | | |
Energy - 1.4% |
Equities Corp. | | | | | | | | |
2.87% (3 Month USD LIBOR + 0.77%) due 10/01/204 | | | 11,450,000 | | | | 11,423,936 | |
Marathon Petroleum Corp. | | | | | | | | |
3.40% due 12/15/20 | | | 9,800,000 | | | | 9,908,182 | |
Phillips 66 | | | | | | | | |
2.73% (3 Month USD LIBOR + 0.60%) due 02/26/214 | | | 8,700,000 | | | | 8,700,389 | |
Sabine Pass Liquefaction LLC | | | | | | | | |
5.63% due 02/01/21 | | | 7,600,000 | | | | 7,850,160 | |
Occidental Petroleum Corp. | | | | | | | | |
2.60% due 08/13/21 | | | 6,650,000 | | | | 6,693,315 | |
Reliance Holding USA, Inc. | | | | | | | | |
4.50% due 10/19/203 | | | 2,000,000 | | | | 2,038,739 | |
Energy Transfer Operating, LP | | | | | | | | |
7.50% due 10/15/20 | | | 1,754,000 | | | | 1,843,272 | |
Florida Gas Transmission Company LLC | | | | | | | | |
5.45% due 07/15/203 | | | 800,000 | | | | 818,464 | |
Total Energy | | | | | | | 49,276,457 | |
| | | | | | | | | |
Technology - 0.7% |
International Business Machines Corp. | | | | | | | | |
2.80% due 05/13/21 | | | 9,550,000 | | | | 9,677,874 | |
Broadcom Corporation / Broadcom Cayman Finance Ltd. | | | | | | | | |
2.38% due 01/15/20 | | | 9,165,000 | | | | 9,164,420 | |
Fidelity National Information Services, Inc. | | | | | | | | |
3.63% due 10/15/20 | | | 5,820,000 | | | | 5,897,599 | |
CA, Inc. | | | | | | | | |
5.38% due 12/01/19 | | | 280,000 | | | | 281,344 | |
Total Technology | | | | | | | 25,021,237 | |
| | | | | | | | | |
Communications - 0.6% |
Telefonica Emisiones S.A. | | | | | | | | |
5.13% due 04/27/20 | | | 9,600,000 | | | | 9,753,589 | |
Deutsche Telekom International Finance BV | | | | | | | | |
2.88% (3 Month USD LIBOR + 0.58%) due 01/17/203,4 | | | 9,400,000 | | | | 9,411,172 | |
Total Communications | | | | | | | 19,164,761 | |
| | | | | | | | | |
Utilities - 0.3% |
NextEra Energy Capital Holdings, Inc. | | | | | | | | |
2.55% (3 Month USD LIBOR + 0.45%) due 09/28/204 | | | 10,010,000 | | | | 10,014,252 | |
PSEG Power LLC | | | | | | | | |
5.13% due 04/15/20 | | | 1,290,000 | | | | 1,309,568 | |
Total Utilities | | | | | | | 11,323,820 | |
| | | | | | | | | |
Basic Materials - 0.3% |
Newmont Goldcorp Corp. | | | | | | | | |
5.13% due 10/01/19 | | | 5,380,000 | | | | 5,380,000 | |
Georgia-Pacific LLC | | | | | | | | |
5.40% due 11/01/203 | | | 3,159,000 | | | | 3,267,724 | |
Total Basic Materials | | | | | | | 8,647,724 | |
Total Corporate Bonds | | | | | | | | |
(Cost $621,455,800) | | | | | | | 623,349,437 | |
| | | | | | | | | |
FOREIGN GOVERNMENT DEBT†† - 16.0% |
Government of Japan | | | | | | | | |
due 01/10/2010 | | JPY | 11,558,600,000 | | | | 106,984,133 | |
due 01/20/2010 | | JPY | 5,903,000,000 | | | | 54,641,459 | |
0.10% due 06/01/20 | | JPY | 3,700,800,000 | | | | 34,322,223 | |
0.10% due 09/01/20 | | JPY | 3,432,000,000 | | | | 31,865,805 | |
0.10% due 07/01/21 | | JPY | 1,755,000,000 | | | | 16,350,044 | |
0.10% due 06/20/20 | | JPY | 1,397,000,000 | | | | 12,958,353 | |
0.10% due 04/15/20 | | JPY | 1,204,700,000 | | | | 11,167,031 | |
2.20% due 06/22/20 | | JPY | 55,850,000 | | | | 525,903 | |
State of Israel | | | | | | | | |
0.50% due 01/31/21 | | ILS | 114,000,000 | | | | 32,951,531 | |
1.00% due 04/30/21 | | ILS | 90,090,000 | | | | 26,257,617 | |
5.00% due 01/31/20 | | ILS | 65,800,000 | | | | 19,227,480 | |
5.50% due 01/31/22 | | ILS | 52,470,000 | | | | 16,930,524 | |
Kingdom of Spain | | | | | | | | |
0.75% due 07/30/21 | | EUR | 32,750,000 | | | | 36,527,748 | |
4.00% due 04/30/20 | | EUR | 25,200,000 | | | | 28,184,326 | |
due 01/17/2010 | | EUR | 13,409,000 | | | | 14,639,675 | |
Federative Republic of Brazil | | | | | | | | |
due 07/01/2110 | | BRL | 179,720,000 | | | | 39,603,439 | |
due 07/01/2010 | | BRL | 70,200,000 | | | | 16,328,924 | |
due 01/01/2010 | | BRL | 64,400,000 | | | | 15,321,795 | |
Republic of Portugal | | | | | | | | |
4.80% due 06/15/20 | | EUR | 23,260,000 | | | | 26,308,906 | |
due 01/17/2010 | | EUR | 15,990,000 | | | | 17,456,439 | |
Total Foreign Government Debt | | | | | | | | |
(Cost $561,544,963) | | | | | | | 558,553,355 | |
| | | | | | | | | |
SEE NOTES TO FINANCIAL STATEMENTS. | THE GUGGENHEIM FUNDS ANNUAL REPORT | 19 |
SCHEDULE OF INVESTMENTS (continued) | September 30, 2019 |
LIMITED DURATION FUND | |
| | Face
Amount~ | | | Value | |
U.S. GOVERNMENT SECURITIES†† - 13.6% |
U.S. Treasury Notes | | | | | | | | |
2.38% due 03/15/22 | | | 259,858,000 | | | $ | 264,811,543 | |
1.50% due 08/15/22 | | | 175,000,000 | | | | 174,596,679 | |
U.S. Treasury Inflation Protected Securities | | | | | | | | |
1.38% due 01/15/2011 | | | 36,622,104 | | | | 36,510,521 | |
Total U.S. Government Securities | | | | | | | | |
(Cost $471,884,095) | | | | | | | 475,918,743 | |
| | | | | | | | | |
SENIOR FLOATING RATE INTERESTS††,4 - 0.4% |
Financial - 0.1% |
iStar, Inc. | | | | | | | | |
4.81% (1 Month USD LIBOR + 2.75%, Rate Floor: 2.75%) due 06/28/23 | | | 3,960,000 | | | | 3,964,950 | |
Masergy Holdings, Inc. | | | | | | | | |
5.35% (3 Month USD LIBOR + 3.25%, Rate Floor: 4.25%) due 12/15/23 | | | 119,714 | | | | 117,619 | |
Total Financial | | | | | | | 4,082,569 | |
| | | | | | | | | |
Consumer, Cyclical - 0.1% |
Mavis Tire Express Services Corp. | | | | | | | | |
5.29% (1 Month USD LIBOR + 3.25%, Rate Floor: 3.25%) due 03/20/25 | | | 2,870,960 | | | | 2,804,325 | |
| | | | | | | | | |
Consumer, Non-cyclical - 0.1% |
Diamond (BC) B.V. | | | | | | | | |
5.26% (3 Month USD LIBOR + 3.00%, Rate Floor: 3.00%) due 09/06/24 | | | 2,161,500 | | | | 2,056,127 | |
| | | | | | | | | |
Technology - 0.1% |
Misys Ltd. | | | | | | | | |
5.70% (1 Month USD LIBOR + 3.50%, Rate Floor: 4.50%) due 06/13/24 | | | 1,737,029 | | | | 1,688,427 | |
Neustar, Inc. | | | | | | | | |
5.54% (1 Month USD LIBOR + 3.50%, Rate Floor: 4.50%) due 08/08/24 | | | 295,477 | | | | 284,988 | |
Total Technology | | | | | | | 1,973,415 | |
| | | | | | | | | |
Communications - 0.0% |
Internet Brands, Inc. | | | | | | | | |
5.79% (1 Month USD LIBOR + 3.75%, Rate Floor: 3.75%) due 09/13/24 | | | 1,073,715 | | | | 1,065,158 | |
| | | | | | | | | |
Industrial - 0.0% |
CHI Overhead Doors, Inc. | | | | | | | | |
5.29% (1 Month USD LIBOR + 3.25%, Rate Floor: 4.25%) due 07/29/22 | | | 974,240 | | | | 973,635 | |
Total Senior Floating Rate Interests | | | | | | | | |
(Cost $13,191,856) | | | | | | | 12,955,229 | |
| | | | | | | | | |
REPURCHASE AGREEMENTS††,12 - 3.6% |
BNP Paribas | | | | | | | | |
issued 09/16/19 at 2.33%
due 12/16/19 | | | 53,169,752 | | | | 53,169,752 | |
Societe Generale | | | | | | | | |
issued 07/26/19 at 2.66% (3 Month
USD LIBOR + 0.40%)
due 04/07/204 | | | 36,700,000 | | | | 36,700,000 | |
issued 09/10/19 at 2.54% (3 Month
USD LIBOR + 0.40%)
due 04/07/204 | | | 15,000,000 | | | | 15,000,000 | |
J.P. Morgan Securities LLC | | | | | | | | |
issued 09/30/19 at 2.35%
due 10/01/19 | | | 10,168,000 | | | | 10,168,000 | |
issued 09/27/19 at 2.50%
due 10/01/19 | | | 6,947,000 | | | | 6,947,000 | |
issued 09/30/19 at 2.37%
due 10/01/19 | | | 3,038,000 | | | | 3,038,000 | |
issued 09/25/19 at 3.00%
due 10/01/19 | | | 1,000,000 | | | | 1,000,000 | |
BofA Securities, Inc. | | | | | | | | |
issued 09/25/19 at 2.80%
due 10/01/19 | | | 1,000,000 | | | | 1,000,000 | |
Total Repurchase Agreements | | | | | | | | |
(Cost $127,022,752) | | | | | | | 127,022,752 | |
| | | | | | | | | |
COMMERCIAL PAPER†† - 0.4% |
Walgreens Boots Alliance, Inc. | | | | | | | | |
2.51% due 11/07/1913 | | | 15,000,000 | | | | 14,963,979 | |
Total Commercial Paper | | | | | | | | |
(Cost $14,961,304) | | | | | | | 14,963,979 | |
| | | | | | | | | |
| | | Notional
Value | | | | | |
OTC OPTIONS PURCHASED†† - 0.1% |
Put options on: | | | | | | | | |
Goldman Sachs International 2Y-10 CMS CAP Expiring July 2022 with strike price of $0.40 | | | 772,000,000 | | | | 1,320,143 | |
Goldman Sachs International 2Y-10 CMS CAP Expiring July 2022 with strike price of $0.61 | | | 296,000,000 | | | | 300,813 | |
Bank of America, N.A. 2Y-10 CMS CAP Expiring July 2022 with strike price of $0.40 | | | 115,000,000 | | | | 196,653 | |
Total OTC Options Purchased | | | | | | | | |
(Cost $2,446,140) | | | | | | | 1,817,609 | |
| | | | | | | | | |
Total Investments - 99.6% | | | | | | | | |
(Cost $3,467,649,452) | | | | | | $ | 3,485,350,815 | |
Other Assets & Liabilities, net - 0.4% | | | | | | | 14,872,255 | |
Total Net Assets - 100.0% | | | | | | $ | 3,500,223,070 | |
20 | THE GUGGENHEIM FUNDS ANNUAL REPORT | SEE NOTES TO FINANCIAL STATEMENTS. |
SCHEDULE OF INVESTMENTS (continued) | September 30, 2019 |
LIMITED DURATION FUND | |
Centrally Cleared Credit Default Swap Agreements Protection Purchased†† |
| |
Counterparty | Exchange | Index | | Protection
Premium
Rate | | Payment
Frequency | | Maturity
Date | | | Notional
Amount | | | Value | | | Upfront
Premiums
Received | | | Unrealized
Depreciation** | |
BofA Securities, Inc. | ICE | CDX.NA.IG.31 | | | 1.00 | % | Quarterly | 12/20/23 | | $ | 553,310,000 | | | $ | (12,012,852 | ) | | $ | (5,503,732 | ) | | $ | (6,509,120 | ) |
OTC Credit Default Swap Agreements Protection Purchased†† |
| |
Counterparty | | Index | | Protection
Premium
Rate | | Payment
Frequency | | Maturity
Date | | | Notional
Amount | | | Value | | | Upfront
Premiums
Received | | | Unrealized
Depreciation | |
Morgan Stanley Capital Services LLC | | CDX.NA.IG.31 (7-15%) | | | 1.00 | % | Quarterly | 12/20/23 | | $ | 37,820,000 | | | $ | (752,263 | ) | | $ | (6,742 | ) | | $ | (745,521 | ) |
Goldman Sachs International | | CDX.NA.IG.31 (7-15%) | | | 1.00 | % | Quarterly | 12/20/23 | | | 87,130,000 | | | | (1,733,068 | ) | | | (118,355 | ) | | | (1,614,713 | ) |
| | | | | | | | | | | | | | | | | | $ | (2,485,331 | ) | | $ | (125,097 | ) | | $ | (2,360,234 | ) |
Centrally Cleared Interest Rate Swap Agreements†† |
| | | | | | | | | | | | | | | | | | | | | | | |
Counterparty | Exchange | Floating
Rate
Type | Floating
Rate Index | Fixed
Rate | Payment
Frequency | Maturity
Date | | Notional
Amount | | | Value | | | Upfront
Premiums
Paid | | | Unrealized
Appreciation
(Depreciation)** | |
BofA Securities, Inc. | CME | Pay | Federal Funds Rate | 1.46% | Annually | 09/17/21 | | $ | 216,600,000 | | | $ | 464,897 | | | $ | 821 | | | $ | 464,076 | |
BofA Securities, Inc. | CME | Pay | 3-Month USD LIBOR | 2.79% | Quarterly | 01/21/20 | | | 55,487,000 | | | | 109,201 | | | | 84,498 | | | | 24,703 | |
BofA Securities, Inc. | CME | Receive | 3-Month USD LIBOR | 1.54% | Quarterly | 08/04/21 | | | 13,030,000 | | | | 29,332 | | | | 314 | | | | 29,018 | |
BofA Securities, Inc. | CME | Pay | Federal Funds Rate | 1.37% | Annually | 09/30/21 | | | 43,200,000 | | | | 19,662 | | | | 406 | | | | 19,256 | |
BofA Securities, Inc. | CME | Pay | 3-Month USD LIBOR | 2.84% | Quarterly | 01/31/20 | | | 8,574,000 | | | | 19,149 | | | | 14,825 | | | | 4,324 | |
BofA Securities, Inc. | CME | Pay | 3-Month USD LIBOR | 2.92% | Quarterly | 01/31/20 | | | 5,235,000 | | | | 13,146 | | | | 10,452 | | | | 2,694 | |
BofA Securities, Inc. | CME | Pay | 3-Month USD LIBOR | 2.83% | Quarterly | 01/31/20 | | | 5,268,000 | | | | 11,592 | | | | 8,963 | | | | 2,629 | |
BofA Securities, Inc. | CME | Receive | 3-Month USD LIBOR | 2.83% | Quarterly | 01/31/20 | | | 5,268,000 | | | | (11,591 | ) | | | 92 | | | | (11,683 | ) |
BofA Securities, Inc. | CME | Receive | 3-Month USD LIBOR | 2.92% | Quarterly | 01/31/20 | | | 5,235,000 | | | | (13,145 | ) | | | 89 | | | | (13,234 | ) |
BofA Securities, Inc. | CME | Receive | 3-Month USD LIBOR | 2.84% | Quarterly | 01/31/20 | | | 8,574,000 | | | | (19,150 | ) | | | 93 | | | | (19,243 | ) |
BofA Securities, Inc. | CME | Receive | 3-Month USD LIBOR | 2.79% | Quarterly | 01/21/20 | | | 55,487,000 | | | | (109,202 | ) | | | 109 | | | | (109,311 | ) |
SEE NOTES TO FINANCIAL STATEMENTS. | THE GUGGENHEIM FUNDS ANNUAL REPORT | 21 |
SCHEDULE OF INVESTMENTS (continued) | September 30, 2019 |
LIMITED DURATION FUND | |
Centrally Cleared Interest Rate Swap Agreements†† (continued) |
| | | | | | | | | | | | | | | | | | | | | | | |
Counterparty | Exchange | Floating
Rate
Type | Floating
Rate Index | Fixed
Rate | Payment
Frequency | Maturity
Date | | Notional
Amount | | | Value | | | Upfront
Premiums
Paid | | | Unrealized
Appreciation
(Depreciation)** | |
BofA Securities, Inc. | CME | Pay | Federal Funds Rate | 1.23% | Annually | 08/22/21 | | $ | 44,400,000 | | | $ | (113,754 | ) | | $ | 388 | | | $ | (114,142 | ) |
BofA Securities, Inc. | CME | Pay | 3-Month USD LIBOR | 1.58% | Quarterly | 08/14/21 | | | 139,000,000 | | | | (208,101 | ) | | | 604 | | | | (208,705 | ) |
BofA Securities, Inc. | CME | Pay | Federal Funds Rate | 1.10% | Annually | 08/28/24 | | | 84,270,000 | | | | (621,766 | ) | | | 667 | | | | (622,433 | ) |
| | | | | | | | | | | | | $ | (429,730 | ) | | $ | 122,321 | | | $ | (552,051 | ) |
Total Return Swap Agreements |
| |
Counterparty | Reference
Obligation | | Financing
Rate Pay | | Payment
Frequency | | Maturity
Date | | | Units | | | Notional
Amount | | | Value and
Unrealized
Depreciation | |
OTC Sovereign Debt Swap Agreements†† |
Deutsche Bank AG | Korea Monetary Stabilization Bond | 2.58% (3 Month USD LIBOR + 0.45%) | At Maturity | | | 08/04/21 | | | | N/A | | | $ | 13,008,747 | | | $ | (64,352 | ) |
Forward Foreign Currency Exchange Contracts†† |
| |
Counterparty | | Contracts to
Sell | | Currency | | Settlement
Date | | | Settlement
Value | | | Value at
September 30,
2019 | | | Unrealized
Appreciation | |
JPMorgan Chase Bank, N.A. | 172,000,000 | BRL | | | 10/01/19 | | | $ | 43,855,867 | | | $ | 41,437,795 | | | $ | 2,418,072 | |
Citibank N.A., New York | 107,970,000 | BRL | | | 10/01/19 | | | | 27,458,070 | | | | 26,011,852 | | | | 1,446,218 | |
Citibank N.A., New York | 121,120,000 | BRL | | | 07/01/21 | | | | 28,823,147 | | | | 27,750,588 | | | | 1,072,559 | |
Goldman Sachs International | 111,000,000 | BRL | | | 10/01/19 | | | | 27,800,660 | | | | 26,741,833 | | | | 1,058,827 | |
Goldman Sachs International | 26,208,000 | EUR | | | 04/30/20 | | | | 30,055,334 | | | | 29,017,421 | | | | 1,037,913 | |
Goldman Sachs International | 15,990,000 | EUR | | | 01/17/20 | | | | 18,463,952 | | | | 17,582,288 | | | | 881,664 | |
Goldman Sachs International | 38,600,000 | BRL | | | 07/01/20 | | | | 10,023,371 | | | | 9,150,790 | | | | 872,581 | |
Barclays Bank plc | 13,409,000 | EUR | | | 01/17/20 | | | | 15,486,054 | | | | 14,744,271 | | | | 741,783 | |
Citibank N.A., New York | 31,600,000 | BRL | | | 07/01/20 | | | | 8,139,295 | | | | 7,491,320 | | | | 647,975 | |
Bank of America, N.A. | 13,152,400 | EUR | | | 06/15/20 | | | | 15,124,931 | | | | 14,605,384 | | | | 519,547 | |
Goldman Sachs International | 11,224,080 | EUR | | | 06/15/20 | | | | 12,914,202 | | | | 12,464,037 | | | | 450,165 | |
Bank of America, N.A. | 5,903,000,000 | JPY | | | 01/21/20 | | | | 55,487,146 | | | | 55,069,365 | | | | 417,781 | |
JPMorgan Chase Bank, N.A. | 21,006,375 | EUR | | | 07/30/21 | | | | 24,244,928 | | | | 23,903,810 | | | | 341,118 | |
Goldman Sachs International | 11,989,250 | EUR | | | 07/30/21 | | | | 13,927,013 | | | | 13,642,943 | | | | 284,070 | |
Citibank N.A., New York | 64,400,000 | BRL | | | 01/02/20 | | | | 15,691,328 | | | | 15,440,371 | | | | 250,957 | |
Goldman Sachs International | 40,300,000 | BRL | | | 07/01/21 | | | | 9,441,256 | | | | 9,233,395 | | | | 207,861 | |
Citibank N.A., New York | 912,456,000 | JPY | | | 07/01/21 | | | | 8,984,580 | | | | 8,778,928 | | | | 205,652 | |
Citibank N.A., New York | 3,193,596,000 | JPY | | | 06/01/20 | | | | 30,212,632 | | | | 30,032,200 | | | | 180,432 | |
Barclays Bank plc | 843,421,500 | JPY | | | 07/01/21 | | | | 8,292,415 | | | | 8,114,733 | | | | 177,682 | |
JPMorgan Chase Bank, N.A. | 3,433,716,000 | JPY | | | 09/01/20 | | | | 32,638,955 | | | | 32,467,866 | | | | 171,089 | |
JPMorgan Chase Bank, N.A. | 18,300,000 | BRL | | | 07/01/21 | | | | 4,347,310 | | | | 4,192,832 | | | | 154,478 | |
Bank of America, N.A. | 1,205,302,350 | JPY | | | 04/15/20 | | | | 11,368,739 | | | | 11,302,672 | | | | 66,067 | |
Bank of America, N.A. | 1,397,698,500 | JPY | | | 06/22/20 | | | | 13,219,507 | | | | 13,160,294 | | | | 59,213 | |
Goldman Sachs International | 9,246,900,000 | JPY | | | 01/10/20 | | | | 86,247,132 | | | | 86,206,657 | | | | 40,475 | |
JPMorgan Chase Bank, N.A. | 509,054,400 | JPY | | | 06/01/20 | | | | 4,811,251 | | | | 4,787,088 | | | | 24,163 | |
Deutsche Bank AG | 15,684,387,227 | KRW | | | 08/04/21 | | | | 13,375,735 | | | | 13,370,281 | | | | 5,454 | |
Goldman Sachs International | 56,471,082 | JPY | | | 06/22/20 | | | | 534,438 | | | | 531,715 | | | | 2,723 | |
JPMorgan Chase Bank, N.A. | 156,375 | EUR | | | 07/30/20 | | | | 176,707 | | | | 174,151 | | | | 2,556 | |
22 | THE GUGGENHEIM FUNDS ANNUAL REPORT | SEE NOTES TO FINANCIAL STATEMENTS. |
SCHEDULE OF INVESTMENTS (continued) | September 30, 2019 |
LIMITED DURATION FUND | |
Forward Foreign Currency Exchange Contracts†† (continued) |
| |
Counterparty | | Contracts to
Sell | | Currency | | Settlement
Date | | | Settlement
Value | | | Value at
September 30,
2019 | | | Unrealized
Appreciation
(Depreciation) | |
Citibank N.A., New York | 2,311,700,000 | JPY | | | 01/10/20 | | | $ | 21,553,709 | | | $ | 21,551,431 | | | $ | 2,278 | |
Goldman Sachs International | 89,250 | EUR | | | 07/30/20 | | | | 101,450 | | | | 99,395 | | | | 2,055 | |
Citibank N.A., New York | 456,000 | JPY | | | 01/06/20 | | | | 4,361 | | | | 4,250 | | | | 111 | |
Citibank N.A., New York | 456,000 | JPY | | | 07/01/20 | | | | 4,404 | | | | 4,296 | | | | 108 | |
Citibank N.A., New York | 456,000 | JPY | | | 01/04/21 | | | | 4,450 | | | | 4,343 | | | | 107 | |
Barclays Bank plc | 421,500 | JPY | | | 01/06/20 | | | | 4,025 | | | | 3,928 | | | | 97 | |
Barclays Bank plc | 421,500 | JPY | | | 07/01/20 | | | | 4,066 | | | | 3,971 | | | | 95 | |
Barclays Bank plc | 421,500 | JPY | | | 01/04/21 | | | | 4,106 | | | | 4,014 | | | | 92 | |
Citibank N.A., New York | 1,596,000 | JPY | | | 12/02/19 | | | | 14,911 | | | | 14,823 | | | | 88 | |
JPMorgan Chase Bank, N.A. | 1,716,000 | JPY | | | 03/02/20 | | | | 16,126 | | | | 16,049 | | | | 77 | |
Bank of America, N.A. | 602,350 | JPY | | | 10/15/19 | | | | 5,609 | | | | 5,577 | | | | 32 | |
Goldman Sachs International | 614,350 | JPY | | | 12/20/19 | | | | 5,740 | | | | 5,717 | | | | 23 | |
Bank of America, N.A. | 698,500 | JPY | | | 12/20/19 | | | | 6,523 | | | | 6,500 | | | | 23 | |
JPMorgan Chase Bank, N.A. | 254,400 | JPY | | | 12/02/19 | | | | 2,374 | | | | 2,363 | | | | 11 | |
Deutsche Bank AG | 41,872,227 | KRW | | | 02/04/21 | | | | 35,500 | | | | 35,499 | | | | 1 | |
Deutsche Bank AG | 41,872,227 | KRW | | | 08/05/20 | | | | 35,288 | | | | 35,292 | | | | (4 | ) |
Deutsche Bank AG | 41,872,227 | KRW | | | 11/04/20 | | | | 35,395 | | | | 35,400 | | | | (5 | ) |
Deutsche Bank AG | 40,506,828 | KRW | | | 05/07/21 | | | | 34,430 | | | | 34,437 | | | | (7 | ) |
Deutsche Bank AG | 40,961,962 | KRW | | | 05/11/20 | | | | 34,402 | | | | 34,411 | | | | (9 | ) |
Deutsche Bank AG | 41,872,227 | KRW | | | 02/05/20 | | | | 35,054 | | | | 35,063 | | | | (9 | ) |
Deutsche Bank AG | 41,872,227 | KRW | | | 11/06/19 | | | | 34,949 | | | | 34,959 | | | | (10 | ) |
Bank of America, N.A. | 54,148 | ILS | | | 04/30/20 | | | | 15,495 | | | | 15,821 | | | | (326 | ) |
Citibank N.A., New York | 124,340 | ILS | | | 04/30/20 | | | | 35,729 | | | | 36,328 | | | | (599 | ) |
Bank of America, N.A. | 686,075 | ILS | | | 01/31/20 | | | | 196,837 | | | | 199,166 | | | | (2,329 | ) |
Bank of America, N.A. | 684,200 | ILS | | | 02/01/21 | | | | 199,912 | | | | 202,715 | | | | (2,803 | ) |
Goldman Sachs International | 724,881 | ILS | | | 04/30/20 | | | | 208,691 | | | | 211,786 | | | | (3,095 | ) |
Bank of America, N.A. | 5,454,000 | ILS | | | 04/30/21 | | | | 1,586,157 | | | | 1,622,112 | | | | (35,955 | ) |
Bank of America, N.A. | 13,124,200 | ILS | | | 01/31/22 | | | | 3,890,958 | | | | 3,945,860 | | | | (54,902 | ) |
Citibank N.A., New York | 12,524,000 | ILS | | | 04/30/21 | | | | 3,658,245 | | | | 3,724,850 | | | | (66,605 | ) |
Goldman Sachs International | 42,231,650 | ILS | | | 01/31/22 | | | | 12,500,228 | | | | 12,697,166 | | | | (196,938 | ) |
Goldman Sachs International | 73,012,900 | ILS | | | 04/30/21 | | | | 21,378,671 | | | | 21,715,271 | | | | (336,600 | ) |
Goldman Sachs International | 116,779,244 | ILS | | | 02/01/21 | | | | 34,113,576 | | | | 34,599,491 | | | | (485,915 | ) |
Goldman Sachs International | 71,861,650 | ILS | | | 01/31/20 | | | | 19,871,410 | | | | 20,861,217 | | | | (989,807 | ) |
| | | | | | | | | | | | | | | | | | | | $ | 11,568,355 | |
Counterparty | | Contracts to
Buy | | Currency | | Settlement
Date | | | Settlement
Value | | | Value at
September 30,
2019 | | | Unrealized
Appreciation
(Depreciation) | |
Citibank N.A., New York | 39,097,000 | BRL | | | 10/01/19 | | | $ | 9,508,256 | | | $ | 9,419,148 | | | $ | (89,108 | ) |
Morgan Stanley Capital Services LLC | 351,873,000 | BRL | | | 10/01/19 | | | | 85,265,285 | | | | 84,772,333 | | | | (492,952 | ) |
| | | | | | | | | | | | | | | | | | | | $ | (582,060 | ) |
SEE NOTES TO FINANCIAL STATEMENTS. | THE GUGGENHEIM FUNDS ANNUAL REPORT | 23 |
SCHEDULE OF INVESTMENTS (continued) | September 30, 2019 |
LIMITED DURATION FUND | |
~ | The face amount is denominated in U.S. dollars unless otherwise indicated. |
** | Includes cumulative appreciation (depreciation). Variation margin is reported within the Statement of Assets and Liabilities. |
† | Value determined based on Level 1 inputs — See Note 4. |
†† | Value determined based on Level 2 inputs, unless otherwise noted — See Note 4. |
††† | Value determined based on Level 3 inputs — See Note 4. |
1 | Affiliated issuer. |
2 | Rate indicated is the 7-day yield as of September 30, 2019. |
3 | Security is a 144A or Section 4(a)(2) security. These securities have been determined to be liquid under guidelines established by the Board of Trustees. The total market value of 144A or Section 4(a)(2) securities is $1,227,524,528 (cost $1,221,375,783), or 35.1% of total net assets. |
4 | Variable rate security. Rate indicated is the rate effective at September 30, 2019. In some instances, the effective rate is limited by a minimum rate floor or a maximum rate cap established by the issuer. The settlement status of a position may also impact the effective rate indicated. In some cases, a position may be unsettled at period end and may not have a stated effective rate. In instances where multiple underlying reference rates and spread amounts are shown, the effective rate is based on a weighted average. |
5 | Security has no stated coupon. However, it is expected to receive residual cash flow payments on defined deal dates. |
6 | Security is a 144A or Section 4(a)(2) security. These securities have been determined to be illiquid and restricted under guidelines established by the Board of Trustees. The total market value of 144A or Section 4(a)(2) illiquid and restricted securities is $69,397 (cost $98,541), or less than 0.1% of total net assets — See Note 9. |
7 | Effective November 30, 2018, Guggenheim Strategy Fund I was reorganized with and into the Guggenheim Ultra Short Duration Fund. |
8 | Security is a step up/down bond. The coupon increases or decreases at regular intervals until the bond reaches full maturity. Rate indicated is the rate at September 30, 2019. See table below for additional step information for each security. |
9 | Security is an interest-only strip. |
10 | Zero coupon rate security. |
11 | Face amount of security is adjusted for inflation. |
12 | Repurchase Agreements — See additional disclosure in the repurchase agreements table below for more information on repurchase agreements. |
13 | Rate indicated is the effective yield at the time of purchase. |
| | BofA — Bank of America |
| | BRL — Brazilian Real |
| | CDX.NA.IG.31 — Credit Default Swap North American Investment Grade Series 31 Index |
| | CME — Chicago Mercantile Exchange |
| | CMS — Constant Maturity Swap |
| | EUR — Euro |
| | ICE — Intercontinental Exchange |
| | ILS — Israeli New Shekel |
| | JPY — Japanese Yen |
| | KRW — South Korean Won |
| | LIBOR — London Interbank Offered Rate |
| | plc — Public Limited Company |
| | REIT — Real Estate Investment Trust |
| | WAC — Weighted Average Coupon |
| | |
| | See Sector Classification in Other Information section. |
24 | THE GUGGENHEIM FUNDS ANNUAL REPORT | SEE NOTES TO FINANCIAL STATEMENTS. |
SCHEDULE OF INVESTMENTS (continued) | September 30, 2019 |
LIMITED DURATION FUND | |
The following table summarizes the inputs used to value the Fund’s investments at September 30, 2019 (See Note 4 in the Notes to Financial Statements):
Investments in Securities (Assets) | | Level 1
Quoted
Prices | | | Level 2
Significant
Observable
Inputs | | | Level 3
Significant
Unobservable
Inputs | | | Total | |
Mutual Funds | | $ | 52,497,057 | | | $ | — | | | $ | — | | | $ | 52,497,057 | |
Money Market Fund | | | 2,239,479 | | | | — | | | | — | | | | 2,239,479 | |
Asset-Backed Securities | | | — | | | | 794,392,140 | | | | 29,300,000 | | | | 823,692,140 | |
Collateralized Mortgage Obligations | | | — | | | | 792,341,035 | | | | — | | | | 792,341,035 | |
Corporate Bonds | | | — | | | | 623,349,437 | | | | — | | | | 623,349,437 | |
Foreign Government Debt | | | — | | | | 558,553,355 | | | | — | | | | 558,553,355 | |
U.S. Government Securities | | | — | | | | 475,918,743 | | | | — | | | | 475,918,743 | |
Senior Floating Rate Interests | | | — | | | | 12,955,229 | | | | — | | | | 12,955,229 | |
Repurchase Agreements | | | — | | | | 127,022,752 | | | | — | | | | 127,022,752 | |
Commercial Paper | | | — | | | | 14,963,979 | | | | — | | | | 14,963,979 | |
Options Purchased | | | — | | | | 1,817,609 | | | | — | | | | 1,817,609 | |
Interest Rate Swap Agreements** | | | — | | | | 546,700 | | | | — | | | | 546,700 | |
Forward Foreign Currency Exchange Contracts** | | | — | | | | 13,744,273 | | | | — | | | | 13,744,273 | |
Total Assets | | $ | 54,736,536 | | | $ | 3,415,605,252 | | | $ | 29,300,000 | | | $ | 3,499,641,788 | |
Investments in Securities (Liabilities) | | Level 1
Quoted
Prices | | | Level 2
Significant
Observable
Inputs | | | Level 3
Significant
Unobservable
Inputs | | | Total | |
Credit Default Swap Agreements** | | $ | — | | | $ | 8,869,354 | | | $ | — | | | $ | 8,869,354 | |
Interest Rate Swap Agreements** | | | — | | | | 1,098,751 | | | | — | | | | 1,098,751 | |
Total Return Swap Agreements** | | | — | | | | 64,352 | | | | — | | | | 64,352 | |
Forward Foreign Currency Exchange Contracts** | | | — | | | | 2,757,978 | | | | — | | | | 2,757,978 | |
Unfunded Loan Commitments (Note 8) | | | — | | | | — | | | | 6,385 | | | | 6,385 | |
Total Liabilities | | $ | — | | | $ | 12,790,435 | | | $ | 6,385 | | | $ | 12,796,820 | |
** | This derivative is reported as unrealized appreciation/depreciation at period end. |
Step Coupon Bonds
The following table discloses additional information related to step coupon bonds held by the Fund. Certain securities are subject to multiple rate changes prior to maturity. For those securities a range of rates and corresponding dates have been provided. Rates for all step coupon bonds held by the Fund are scheduled to increase, none are scheduled to decrease.
Name | | Coupon Rate at
Next Reset Date | | | Next Rate
Reset Date | | | Future
Reset Rate(s) | | | Future
Reset Date(s) | |
Freddie Mac Seasoned Credit Risk Transfer Trust 2018-1, 2.75% due 05/25/57 | | | 3.00 | % | | | 03/25/20 | | | | — | | — |
Freddie Mac Seasoned Credit Risk Transfer Trust 2017-4, 3.00% due 06/25/57 | | | 3.25 | % | | | 12/25/19 | | | | — | | — |
Legacy Mortgage Asset Trust 2018-GS3, 4.00% due 06/25/58 | | | 7.00 | % | | | 07/26/21 | | | | 8.00 | % | 07/26/22 |
New Residential Mortgage Loan Trust 2019-RPL1, 4.33% due 02/26/24 | | | 7.33 | % | | | 02/25/22 | | | | 8.33 | % | 02/25/23 |
SEE NOTES TO FINANCIAL STATEMENTS. | THE GUGGENHEIM FUNDS ANNUAL REPORT | 25 |
SCHEDULE OF INVESTMENTS (continued) | September 30, 2019 |
LIMITED DURATION FUND | |
Repurchase Agreements
In connection with transactions in repurchase agreements, it is the Fund’s policy that its custodian take possession of the underlying collateral. The collateral is in the possession of the Fund’s custodian and is evaluated to ensure that its market value exceeds, at a minimum, 102% of the original face amount of the repurchase agreements.
The Fund may engage in repurchase agreements. Repurchase agreements are fixed income securities in the form of agreements backed by collateral. These agreements typically involve the acquisition by the Fund of securities from the selling institution coupled with the agreement that the selling institution will repurchase the underlying securities at a specified price and at a fixed time in the future. The Fund may accept a wide variety of underlying securities as collateral for the repurchase agreements entered into by the Fund. Any such securities serving as collateral are marked-to-market daily in order to maintain full collateralization. Securities purchased under repurchase agreements are reflected as an asset on the Statement of Assets and Liabilities. Interest earned is recorded as a component of interest income on the Statement of Operations.
The use of repurchase agreements involves certain risks. For example, if the selling institution defaults on its obligation to repurchase the underlying securities at a time when the value of securities has declined, the Fund may incur a loss upon disposition of them. In the event of an insolvency or bankruptcy by the selling institution, the Fund’s right to control the collateral could be affected and result in certain costs and delays. In addition, the Fund could incur a loss if the value of the underlying collateral falls below the agreed upon repurchase price.
At September 30, 2019, the repurchase agreements in the account were as follows:
Counterparty and
Terms of Agreement | | Face
Value | | | Repurchase
Price | | | Collateral | | Par
Value | | | Fair
Value | |
BNP Paribas | | | | | | | | | | Countrywide Asset-Backed Certificates | | | | | | | | |
2.33% | | | | | | | | | | 2.26% | | | | | | | | |
12/16/19 | | $ | 53,169,752 | | | $ | 53,482,235 | | | 03/25/36 | | $ | 363,803,000 | | | $ | 336,117,592 | |
| | | | | | | | | | | Citigroup Mortgage Loan Trust | | | | | | | | |
| | | | | | | | | | | 2.16% | | | | | | | | |
| | | | | | | | | | | 01/25/37 | | | 107,890,000 | | | | 95,417,916 | |
| | | | | | | | | | | Soundview Home Loan Trust | | | | | | | | |
| | | | | | | | | | | 2.52% | | | | | | | | |
| | | | | | | | | | | 03/25/36 | | | 16,004,500 | | | | 15,535,568 | |
| | | | | | | | | | | Countrywide Asset-Backed Certificates | | | | | | | | |
| | | | | | | | | | | 2.15% | | | | | | | | |
| | | | | | | | | | | 12/25/36 | | | 11,892,000 | | | | 11,124,966 | |
| | | | | | | | | | | Fannie Mae Connecticut Avenue Securities | | | | | | | | |
| | | | | | | | | | | 6.47% | | | | | | | | |
| | | | | | | | | | | 01/25/29 | | | 2,736,000 | | | | 2,880,461 | |
| | | | | | | | | | | | | | 502,325,500 | | | | 461,076,503 | |
| | | | | | | | | | | | | | | | | | | |
Societe Generale | | | | | | | | | | Freddie Mac Structured Agency Credit Risk Debt Notes | | | | | | | | |
2.54% - 2.66% (3 Month | | | | | | | | | | 5.47% | | | | | | | | |
USD LIBOR + 0.40%) | | | 51,700,000 | | | | 52,628,084 | | | 10/25/29 | | | 20,685,287 | | | | 21,822,978 | |
04/07/20* | | | | | | | | | | Connecticut Avenue Securities Trust | | | | | | | | |
| | | | | | | | | | | 4.42% | | | | | | | | |
| | | | | | | | | | | 04/25/31 | | | 13,588,294 | | | | 13,720,100 | |
| | | | | | | | | | | Fannie Mae Connecticut Avenue Securities | | | | | | | | |
| | | | | | | | | | | 5.67% | | | | | | | | |
| | | | | | | | | | | 09/25/29 | | | 9,411,473 | | | | 9,893,340 | |
26 | THE GUGGENHEIM FUNDS ANNUAL REPORT | SEE NOTES TO FINANCIAL STATEMENTS. |
SCHEDULE OF INVESTMENTS (continued) | September 30, 2019 |
LIMITED DURATION FUND | |
Counterparty and
Terms of Agreement | | Face
Value | | | Repurchase
Price | | | Collateral | | Par
Value | | | Fair
Value | |
| | | | | | | | | | | Freddie Mac Structured Agency Credit Risk Debt Notes | | | | | | | | |
| | | | | | | | | | | 4.67% | | | | | | | | |
| | | | | | | | | | | 12/25/29 | | $ | 9,826,000 | | | $ | 9,849,582 | |
| | | | | | | | | | | Ashford Hospitality Trust | | | | | | | | |
| | | | | | | | | | | 5.01% | | | | | | | | |
| | | | | | | | | | | 04/15/35 | | | 4,501,000 | | | | 4,526,206 | |
| | | | | | | | | | | Atrium Hotel Portfolio Trust | | | | | | | | |
| | | | | | | | | | | 5.31% | | | | | | | | |
| | | | | | | | | | | 06/15/35 | | | 4,361,000 | | | | 4,385,422 | |
| | | | | | | | | | | | | | 62,373,054 | | | | 64,197,628 | |
| | | | | | | | | | | | | | | | | | | |
J.P. Morgan Securities LLC | | | | | | | | | | U.S. Treasury Note | | | | | | | | |
2.35% - 3.00% | | | | | | | | | | 2.63% | | | | | | | | |
10/01/19 | | $ | 21,153,000 | | | $ | 21,154,430 | | | 02/28/23 | | | 10,000,000 | | | | 10,346,000 | |
| | | | | | | | | | | Fannie Mae Pool | | | | | | | | |
| | | | | | | | | | | 3.50% | | | | | | | | |
| | | | | | | | | | | 09/01/49 | | | 7,000,000 | | | | 7,191,800 | |
| | | | | | | | | | | Ginnie Mae II Pool | | | | | | | | |
| | | | | | | | | | | 4.50% | | | | | | | | |
| | | | | | | | | | | 06/20/49 | | | 3,990,000 | | | | 4,189,500 | |
| | | | | | | | | | | | | | 20,990,000 | | | | 21,727,300 | |
| | | | | | | | | | | | | | | | | | | |
BofA Securities, Inc. | | | | | | | | | | U.S. Treasury Note | | | | | | | | |
2.80% | | | | | | | | | | 1.50% | | | | | | | | |
10/01/19 | | | 1,000,000 | | | | 1,000,078 | | | 09/30/24 | | | 1,026,000 | | | | 1,023,435 | |
* | Variable rate security. Rate indicated is the rate effective at September 30, 2019. In some instances, the effective rate is limited by a minimum rate floor or a maximum rate cap established by the issuer. The settlement status of a position may also impact the effective rate indicated. In some cases, a position may be unsettled at period end and may not have a stated effective rate. In instances where multiple underlying reference rates and spread amounts are shown, the effective rate is based on a weighted average. |
Affiliated Transactions
Investments representing 5% or more of the outstanding voting shares of a company, or control of or by, or common control under Guggenheim Investments (“GI”), result in that company being considered an affiliated issuer, as defined in the 1940 Act.
The Fund may invest in certain of the underlying series of Guggenheim Strategy Funds Trust, including Guggenheim Strategy Fund II and Guggenheim Strategy Fund III, (collectively, the “Cash Management Funds”), each of which are open-end management investment companies managed by GI. The Cash Management Funds, which launched on March 11, 2014, are offered as cash management options only to mutual funds, trusts, and other accounts managed by GI and/or its affiliates, and are not available to the public. The Cash Management Funds pay no investment management fees. The Cash Management Funds’ annual report on Form N-CSR dated September 30, 2018, is available publicly or upon request. This information is available from the EDGAR database on the SEC’s website at https://www.sec.gov/Archives/edgar/data/1601445/000089180418000513/gug75569-ncsr.htm.
SEE NOTES TO FINANCIAL STATEMENTS. | THE GUGGENHEIM FUNDS ANNUAL REPORT | 27 |
SCHEDULE OF INVESTMENTS (concluded) | September 30, 2019 |
LIMITED DURATION FUND | |
Transactions during the year ended September 30, 2019, in which the company is an affiliated issuer, were as follows:
Security Name | | Value
09/30/18 | | | Additions | | | Reductions | | | Realized
Gain (Loss) | | | Change in
Unrealized
Appreciation
(Depreciation) | | | Value
09/30/19 | | | Shares
09/30/19 | | | Investment
Income | | | Capital Gain
Distributions | |
Mutual Funds | | | | | | | | | | | | | | | | | | | | | | | | | | | | | | | | | | | | |
Guggenheim Floating Rate Strategies Fund — R6-Class | | $ | 34,179,223 | | | $ | 1,278,605 | | | $ | (14,400,000 | ) | | $ | (404,618 | ) | | $ | (471,416 | ) | | $ | 20,181,794 | | | | 799,279 | | | $ | 1,278,465 | | | $ | 141 | |
Guggenheim Strategy Fund II | | | 14,722,876 | | | | 381,065 | | | | (2,300,000 | ) | | | 9,881 | | | | (90,808 | ) | | | 12,723,014 | | | | 512,405 | | | | 373,861 | | | | 7,204 | |
Guggenheim Strategy Fund III | | | 12,175,294 | | | | 329,389 | | | | (1,500,000 | ) | | | (12,097 | ) | | | (77,021 | ) | | | 10,915,565 | | | | 439,789 | | | | 328,932 | | | | 456 | |
Guggenheim Ultra Short Duration Fund — Institutional Class1 | | | 9,971,325 | | | | 256,514 | | | | (1,500,000 | ) | | | 5,840 | | | | (56,995 | ) | | | 8,676,684 | | | | 871,153 | | | | 249,613 | | | | 6,901 | |
| | | $ | 71,048,718 | | | $ | 2,245,573 | | | $ | (19,700,000 | ) | | $ | (400,994 | ) | | $ | (696,240 | ) | | $ | 52,497,057 | | | | | | | $ | 2,230,871 | | | $ | 14,702 | |
1 | Effective November 30, 2018, Guggenheim Strategy Fund I was reorganized with and into the Guggenheim Ultra Short Duration Fund. |
28 | THE GUGGENHEIM FUNDS ANNUAL REPORT | SEE NOTES TO FINANCIAL STATEMENTS. |
STATEMENT OF ASSETS AND LIABILITIES |
September 30, 2019 |
Assets: |
Investments in unaffiliated issuers, at value (cost $3,287,365,204) | | $ | 3,305,831,006 | |
Investments in affiliated issuers, at value (cost $53,261,496) | | | 52,497,057 | |
Repurchase agreements, at value (cost $127,022,752) | | | 127,022,752 | |
Cash | | | 426,780 | |
Segregated cash with broker | | | 15,682,124 | |
Unamortized upfront premiums paid on interest rate swap agreements | | | 122,321 | |
Unrealized appreciation on forward foreign currency exchange contracts | | | 13,744,273 | |
Prepaid expenses | | | 187,833 | |
Receivables: |
Fund shares sold | | | 12,548,310 | |
Interest | | | 11,953,928 | |
Securities sold | | | 4,103,795 | |
Foreign tax reclaims | | | 346,287 | |
Dividends | | | 183,376 | |
Swap settlement | | | 10,517 | |
Total assets | | | 3,544,660,359 | |
| | | | | |
Liabilities: |
Unfunded loan commitments, at value (Note 8) (proceeds $1,376) | | | 6,385 | |
Segregated cash due to broker | | | 9,810,000 | |
Unamortized upfront premiums received on credit default swap agreements | | | 5,628,829 | |
Unrealized depreciation on OTC swap agreements | | | 2,424,586 | |
Unrealized depreciation on forward foreign currency exchange contracts | | | 2,757,978 | |
Payable for: |
Fund shares redeemed | | | 14,284,750 | |
Securities purchased | | | 6,381,863 | |
Distributions to shareholders | | | 1,316,588 | |
Management fees | | | 583,482 | |
Variation margin on interest rate swap agreements | | | 248,314 | |
Fund accounting/administration fees | | | 217,451 | |
Protection fees on credit default swap agreements | | | 207,246 | |
Distribution and service fees | | | 195,739 | |
Transfer agent/maintenance fees | | | 116,294 | |
Variation margin on credit default swap agreements | | | 72,752 | |
Trustees’ fees* | | | 4,908 | |
Due to Investment Adviser | | | 7 | |
Miscellaneous | | | 180,117 | |
Total liabilities | | | 44,437,289 | |
Net assets | | $ | 3,500,223,070 | |
| | | | | |
Net assets consist of: |
Paid in capital | | $ | 3,509,065,629 | |
Total distributable earnings (loss) | | | (8,842,559 | ) |
Net assets | | $ | 3,500,223,070 | |
| | | | | |
A-Class: |
Net assets | | $ | 570,353,146 | |
Capital shares outstanding | | | 23,111,071 | |
Net asset value per share | | $ | 24.68 | |
Maximum offering price per share (Net asset value divided by 97.75%) | | $ | 25.25 | |
| | | | | |
C-Class: |
Net assets | | $ | 85,100,071 | |
Capital shares outstanding | | | 3,450,732 | |
Net asset value per share | | $ | 24.66 | |
| | | | | |
P-Class: |
Net assets | | $ | 108,690,623 | |
Capital shares outstanding | | | 4,404,374 | |
Net asset value per share | | $ | 24.68 | |
| | | | | |
Institutional Class: |
Net assets | | $ | 2,421,315,074 | |
Capital shares outstanding | | | 98,137,753 | |
Net asset value per share | | $ | 24.67 | |
| | | | | |
R6-Class: |
Net assets | | $ | 314,764,156 | |
Capital shares outstanding | | | 12,765,301 | |
Net asset value per share | | $ | 24.66 | |
* | Relates to Trustees not deemed “interested persons” within the meaning of Section 2(a)(19) of the 1940 Act. |
SEE NOTES TO FINANCIAL STATEMENTS. | THE GUGGENHEIM FUNDS ANNUAL REPORT | 29 |
STATEMENT OF OPERATIONS |
Year Ended September 30, 2019 |
Investment Income: |
Dividends from securities of unaffiliated issuers | | $ | 411,112 | |
Dividends from securities of affiliated issuers | | | 2,230,871 | |
Interest | | | 108,508,283 | |
Total investment income | | | 111,150,266 | |
| | | | | |
Expenses: |
Management fees | | | 14,829,329 | |
Distribution and service fees: |
A-Class | | | 1,560,197 | |
C-Class | | | 851,148 | |
P-Class | | | 388,898 | |
Transfer agent/maintenance fees: |
A-Class | | | 468,601 | |
C-Class | | | 80,424 | |
P-Class | | | 199,521 | |
Institutional Class | | | 1,928,835 | |
R6-Class | | | 150 | |
Fund accounting/administration fees | | | 3,041,949 | |
Line of credit fees | | | 180,151 | |
Custodian fees | | | 145,112 | |
Trustees’ fees* | | | 99,919 | |
Miscellaneous | | | 877,960 | |
Recoupment of previously waived fees: |
A-Class | | | 197 | |
P-Class | | | 30 | |
Institutional Class | | | 15,737 | |
R6-Class | | | 1,875 | |
Total expenses | | | 24,670,033 | |
Less: |
Expenses reimbursed by Adviser: |
A-Class | | | (421,088 | ) |
C-Class | | | (74,090 | ) |
P-Class | | | (187,745 | ) |
Institutional Class | | | (1,724,938 | ) |
R6-Class | | | (181 | ) |
Expenses waived by Adviser | | | (373,151 | ) |
Earnings credits applied | | | (86,843 | ) |
Total waived/reimbursed expenses | | | (2,868,036 | ) |
Net expenses | | | 21,801,997 | |
Net investment income | | | 89,348,269 | |
| | | | | |
Net Realized and Unrealized Gain (Loss): |
Net realized gain (loss) on: |
Investments in unaffiliated issuers | | | (3,560,884 | ) |
Investments in affiliated issuers | | | (400,994 | ) |
Distributions received from affiliated investment companies | | | 14,702 | |
Swap agreements | | | (13,170,585 | ) |
Options purchased | | | (9,326,569 | ) |
Options written | | | 1,160,145 | |
Forward foreign currency exchange contracts | | | 6,817,763 | |
Foreign currency transactions | | | (155,177 | ) |
Net realized loss | | | (18,621,599 | ) |
Net change in unrealized appreciation (depreciation) on: |
Investments in unaffiliated issuers | | | 25,041,130 | |
Investments in affiliated issuers | | | (696,240 | ) |
Swap agreements | | | (11,883,426 | ) |
Options purchased | | | 2,967,341 | |
Forward foreign currency exchange contracts | | | 5,617,059 | |
Foreign currency translations | | | 41,195 | |
Net change in unrealized appreciation (depreciation) | | | 21,087,059 | |
Net realized and unrealized gain | | | 2,465,460 | |
Net increase in net assets resulting from operations | | $ | 91,813,729 | |
* | Relates to Trustees not deemed “interested persons” within the meaning of Section 2(a)(19) of the 1940 Act. |
30 | THE GUGGENHEIM FUNDS ANNUAL REPORT | SEE NOTES TO FINANCIAL STATEMENTS. |
STATEMENTS OF CHANGES IN NET ASSETS |
| | Year Ended
September 30,
2019 | | | Year Ended
September 30,
2018 | |
Increase (Decrease) in Net Assets from Operations: | | | | | | | | |
Net investment income | | $ | 89,348,269 | | | $ | 66,125,524 | |
Net realized gain (loss) on investments | | | (18,621,599 | ) | | | 2,129,861 | |
Net change in unrealized appreciation (depreciation) on investments | | | 21,087,059 | | | | (13,060,674 | ) |
Net increase in net assets resulting from operations | | | 91,813,729 | | | | 55,194,711 | |
| | | | | | | | | |
Distributions to shareholders: | | | | | | | | |
A-Class | | | (14,490,141 | ) | | | (14,531,941 | ) |
C-Class | | | (1,345,090 | ) | | | (976,834 | ) |
P-Class | | | (3,585,141 | ) | | | (3,531,968 | ) |
Institutional Class | | | (70,974,312 | ) | | | (53,984,980 | ) |
R6-Class | | | (4,640,230 | ) | | | — | |
Total distributions to shareholders | | | (95,034,914 | ) | | | (73,025,723 | ) |
| | | | | | | | | |
Capital share transactions: | | | | | | | | |
Proceeds from sale of shares | | | | | | | | |
A-Class | | | 309,962,216 | | | | 420,082,761 | |
C-Class | | | 41,603,888 | | | | 36,102,270 | |
P-Class | | | 71,749,161 | | | | 194,420,699 | |
Institutional Class | | | 1,798,075,210 | | | | 1,948,541,092 | |
R6-Class | | | 309,636,132 | | | | — | |
Distributions reinvested | | | | | | | | |
A-Class | | | 11,798,782 | | | | 11,467,034 | |
C-Class | | | 1,030,733 | | | | 753,493 | |
P-Class | | | 3,570,643 | | | | 3,515,551 | |
Institutional Class | | | 58,289,694 | | | | 45,162,931 | |
R6-Class | | | 4,640,204 | | | | — | |
Cost of shares redeemed | | | | | | | | |
A-Class | | | (378,427,690 | ) | | | (309,311,321 | ) |
C-Class | | | (28,468,610 | ) | | | (16,238,186 | ) |
P-Class | | | (156,281,336 | ) | | | (99,572,539 | ) |
Institutional Class | | | (2,061,077,029 | ) | | | (989,425,440 | ) |
R6-Class | | | (490,000 | ) | | | — | |
Net increase (decrease) from capital share transactions | | | (14,388,002 | ) | | | 1,245,498,345 | |
Net increase (decrease) in net assets | | | (17,609,187 | ) | | | 1,227,667,333 | |
| | | | | | | | | |
Net assets: | | | | | | | | |
Beginning of year | | | 3,517,832,257 | | | | 2,290,164,924 | |
End of year | | $ | 3,500,223,070 | | | $ | 3,517,832,257 | |
SEE NOTES TO FINANCIAL STATEMENTS. | THE GUGGENHEIM FUNDS ANNUAL REPORT | 31 |
STATEMENTS OF CHANGES IN NET ASSETS (concluded) |
| | Year Ended
September 30,
2019 | | | Year Ended
September 30,
2018 | |
Capital share activity: | | | | | | | | |
Shares sold | | | | | | | | |
A-Class | | | 12,576,401 | | | | 16,952,205 | |
C-Class | | | 1,689,208 | | | | 1,458,935 | |
P-Class | | | 2,910,455 | | | | 7,852,162 | |
Institutional Class | | | 72,971,122 | | | | 78,739,381 | |
R6-Class | | | 12,596,998 | | | | — | |
Shares issued from reinvestment of distributions | | | | | | | | |
A-Class | | | 478,517 | | | | 463,353 | |
C-Class | | | 41,842 | | | | 30,471 | |
P-Class | | | 144,833 | | | | 142,114 | |
Institutional Class | | | 2,365,246 | | | | 1,825,515 | |
R6-Class | | | 188,173 | | | | — | |
Shares redeemed | | | | | | | | |
A-Class | | | (15,351,648 | ) | | | (12,500,453 | ) |
C-Class | | | (1,155,901 | ) | | | (656,417 | ) |
P-Class | | | (6,342,173 | ) | | | (4,024,388 | ) |
Institutional Class | | | (83,680,392 | ) | | | (39,976,154 | ) |
R6-Class | | | (19,870 | ) | | | — | |
Net increase (decrease) in shares | | | (587,189 | ) | | | 50,306,724 | |
32 | THE GUGGENHEIM FUNDS ANNUAL REPORT | SEE NOTES TO FINANCIAL STATEMENTS. |
This table is presented to show selected data for a share outstanding throughout each period and to assist shareholders in evaluating a Fund’s performance for the periods presented.
A-Class | | Year Ended
September 30,
2019 | | | Year Ended
September 30,
2018 | | | Year Ended
September 30,
2017 | | | Year Ended
September 30,
2016 | | | Year Ended
September 30,
2015 | |
Per Share Data | | | | | | | | | | | | | | | | | | | | |
Net asset value, beginning of period | | $ | 24.70 | | | $ | 24.86 | | | $ | 24.71 | | | $ | 24.65 | | | $ | 24.97 | |
Income (loss) from investment operations: |
Net investment income (loss)a | | | .54 | | | | .51 | | | | .53 | | | | .67 | | | | .69 | |
Net gain (loss) on investments (realized and unrealized) | | | .01 | | | | (.09 | ) | | | .20 | | | | .08 | | | | (.16 | ) |
Total from investment operations | | | .55 | | | | .42 | | | | .73 | | | | .75 | | | | .53 | |
Less distributions from: |
Net investment income | | | (.57 | ) | | | (.57 | ) | | | (.58 | ) | | | (.69 | ) | | | (.84 | ) |
Net realized gains | | | — | b | | | (.01 | ) | | | — | b | | | — | | | | (.01 | ) |
Total distributions | | | (.57 | ) | | | (.58 | ) | | | (.58 | ) | | | (.69 | ) | | | (.85 | ) |
Net asset value, end of period | | $ | 24.68 | | | $ | 24.70 | | | $ | 24.86 | | | $ | 24.71 | | | $ | 24.65 | |
|
Total Returnc | | | 2.27 | % | | | 1.69 | % | | | 2.95 | % | | | 3.16 | % | | | 2.15 | % |
Ratios/Supplemental Data |
Net assets, end of period (in thousands) | | $ | 570,353 | | | $ | 627,570 | | | $ | 509,410 | | | $ | 215,856 | | | $ | 117,628 | |
Ratios to average net assets: |
Net investment income (loss) | | | 2.18 | % | | | 2.07 | % | | | 2.14 | % | | | 2.73 | % | | | 2.79 | % |
Total expensesd | | | 0.83 | % | | | 0.81 | % | | | 0.86 | % | | | 0.93 | % | | | 0.99 | % |
Net expensese,f,i | | | 0.75 | % | | | 0.75 | % | | | 0.81 | % | | | 0.84 | % | | | 0.87 | % |
Portfolio turnover rate | | | 72 | % | | | 45 | % | | | 55 | % | | | 39 | % | | | 26 | % |
C-Class | | Year Ended
September 30,
2019 | | | Year Ended
September 30,
2018 | | | Year Ended
September 30,
2017 | | | Year Ended
September 30,
2016 | | | Year Ended
September 30,
2015 | |
Per Share Data | | | | | | | | | | | | | | | | | | | | |
Net asset value, beginning of period | | $ | 24.68 | | | $ | 24.84 | | | $ | 24.70 | | | $ | 24.63 | | | $ | 24.96 | |
Income (loss) from investment operations: |
Net investment income (loss)a | | | .35 | | | | .33 | | | | .35 | | | | .48 | | | | .49 | |
Net gain (loss) on investments (realized and unrealized) | | | .02 | | | | (.10 | ) | | | .18 | | | | .10 | | | | (.16 | ) |
Total from investment operations | | | .37 | | | | .23 | | | | .53 | | | | .58 | | | | .33 | |
Less distributions from: |
Net investment income | | | (.39 | ) | | | (.38 | ) | | | (.39 | ) | | | (.51 | ) | | | (.65 | ) |
Net realized gains | | | — | b | | | (.01 | ) | | | — | b | | | — | | | | (.01 | ) |
Total distributions | | | (.39 | ) | | | (.39 | ) | | | (.39 | ) | | | (.51 | ) | | | (.66 | ) |
Net asset value, end of period | | $ | 24.66 | | | $ | 24.68 | | | $ | 24.84 | | | $ | 24.70 | | | $ | 24.63 | |
|
Total Returnc | | | 1.51 | % | | | 0.94 | % | | | 2.18 | % | | | 2.39 | % | | | 1.37 | % |
Ratios/Supplemental Data |
Net assets, end of period (in thousands) | | $ | 85,100 | | | $ | 70,981 | | | $ | 50,743 | | | $ | 26,802 | | | $ | 10,323 | |
Ratios to average net assets: |
Net investment income (loss) | | | 1.42 | % | | | 1.34 | % | | | 1.41 | % | | | 1.98 | % | | | 1.96 | % |
Total expensesd | | | 1.60 | % | | | 1.59 | % | | | 1.65 | % | | | 1.73 | % | | | 1.76 | % |
Net expensese,f,i | | | 1.50 | % | | | 1.51 | % | | | 1.56 | % | | | 1.58 | % | | | 1.62 | % |
Portfolio turnover rate | | | 72 | % | | | 45 | % | | | 55 | % | | | 39 | % | | | 26 | % |
SEE NOTES TO FINANCIAL STATEMENTS. | THE GUGGENHEIM FUNDS ANNUAL REPORT | 33 |
FINANCIAL HIGHLIGHTS (continued) |
This table is presented to show selected data for a share outstanding throughout each period and to assist shareholders in evaluating a Fund’s performance for the periods presented.
P-Class | | Year Ended
September 30,
2019 | | | Year Ended
September 30,
2018 | | | Year Ended
September 30,
2017 | | | Year Ended
September 30,
2016 | | | Period Ended
September 30,
2015g | |
Per Share Data | | | | | | | | | | | | | | | | | | | | |
Net asset value, beginning of period | | $ | 24.70 | | | $ | 24.86 | | | $ | 24.72 | | | $ | 24.65 | | | $ | 24.86 | |
Income (loss) from investment operations: |
Net investment income (loss)a | | | .54 | | | | .52 | | | | .47 | | | | .68 | | | | .25 | |
Net gain (loss) on investments (realized and unrealized) | | | .01 | | | | (.10 | ) | | | .24 | | | | .08 | | | | (.17 | ) |
Total from investment operations | | | .55 | | | | .42 | | | | .71 | | | | .76 | | | | .08 | |
Less distributions from: |
Net investment income | | | (.57 | ) | | | (.57 | ) | | | (.57 | ) | | | (.69 | ) | | | (.29 | ) |
Net realized gains | | | — | b | | | (.01 | ) | | | — | b | | | — | | | | — | |
Total distributions | | | (.57 | ) | | | (.58 | ) | | | (.57 | ) | | | (.69 | ) | | | (.29 | ) |
Net asset value, end of period | | $ | 24.68 | | | $ | 24.70 | | | $ | 24.86 | | | $ | 24.72 | | | $ | 24.65 | |
|
Total Return | | | 2.27 | % | | | 1.69 | % | | | 2.93 | % | | | 3.17 | % | | | 0.32 | % |
Ratios/Supplemental Data |
Net assets, end of period (in thousands) | | $ | 108,691 | | | $ | 189,965 | | | $ | 92,503 | | | $ | 1,646 | | | $ | 2,736 | |
Ratios to average net assets: |
Net investment income (loss) | | | 2.18 | % | | | 2.12 | % | | | 1.89 | % | | | 2.76 | % | | | 2.39 | % |
Total expensesd | | | 0.88 | % | | | 0.87 | % | | | 0.92 | % | | | 0.94 | % | | | 0.94 | % |
Net expensese,f,i | | | 0.75 | % | | | 0.75 | % | | | 0.81 | % | | | 0.84 | % | | | 0.88 | % |
Portfolio turnover rate | | | 72 | % | | | 45 | % | | | 55 | % | | | 39 | % | | | 26 | % |
Institutional Class | | Year Ended
September 30,
2019 | | | Year Ended
September 30,
2018 | | | Year Ended
September 30,
2017 | | | Year Ended
September 30,
2016 | | | Year Ended
September 30,
2015 | |
Per Share Data | | | | | | | | | | | | | | | | | | | | |
Net asset value, beginning of period | | $ | 24.69 | | | $ | 24.85 | | | $ | 24.71 | | | $ | 24.64 | | | $ | 24.96 | |
Income (loss) from investment operations: |
Net investment income (loss)a | | | .60 | | | | .58 | | | | .59 | | | | .73 | | | | .78 | |
Net gain (loss) on investments (realized and unrealized) | | | .01 | | | | (.11 | ) | | | .19 | | | | .09 | | | | (.19 | ) |
Total from investment operations | | | .61 | | | | .47 | | | | .78 | | | | .82 | | | | .59 | |
Less distributions from: |
Net investment income | | | (.63 | ) | | | (.62 | ) | | | (.64 | ) | | | (.75 | ) | | | (.90 | ) |
Net realized gains | | | — | b | | | (.01 | ) | | | — | b | | | — | | | | (.01 | ) |
Total distributions | | | (.63 | ) | | | (.63 | ) | | | (.64 | ) | | | (.75 | ) | | | (.91 | ) |
Net asset value, end of period | | $ | 24.67 | | | $ | 24.69 | | | $ | 24.85 | | | $ | 24.71 | | | $ | 24.64 | |
|
Total Return | | | 2.52 | % | | | 1.95 | % | | | 3.21 | % | | | 3.43 | % | | | 2.41 | % |
Ratios/Supplemental Data |
Net assets, end of period (in thousands) | | $ | 2,421,315 | | | $ | 2,629,316 | | | $ | 1,637,509 | | | $ | 476,591 | | | $ | 176,322 | |
Ratios to average net assets: |
Net investment income (loss) | | | 2.43 | % | | | 2.35 | % | | | 2.36 | % | | | 2.97 | % | | | 3.14 | % |
Total expensesd | | | 0.57 | % | | | 0.56 | % | | | 0.61 | % | | | 0.67 | % | | | 0.73 | % |
Net expensese,f,i | | | 0.50 | % | | | 0.50 | % | | | 0.56 | % | | | 0.58 | % | | | 0.62 | % |
Portfolio turnover rate | | | 72 | % | | | 45 | % | | | 55 | % | | | 39 | % | | | 26 | % |
34 | THE GUGGENHEIM FUNDS ANNUAL REPORT | SEE NOTES TO FINANCIAL STATEMENTS. |
FINANCIAL HIGHLIGHTS (concluded) |
This table is presented to show selected data for a share outstanding throughout each period and to assist shareholders in evaluating a Fund’s performance for the period presented.
R6-Class | | Period Ended
September 30,
2019h | |
Per Share Data | | | | |
Net asset value, beginning of period | | $ | 24.58 | |
Income (loss) from investment operations: |
Net investment income (loss)a | | | .31 | |
Net gain (loss) on investments (realized and unrealized) | | | .14 | |
Total from investment operations | | | .45 | |
Less distributions from: |
Net investment income | | | (.37 | ) |
Total distributions | | | (.37 | ) |
Net asset value, end of period | | $ | 24.66 | |
|
Total Return | | | 1.83 | % |
Ratios/Supplemental Data |
Net assets, end of period (in thousands) | | $ | 314,764 | |
Ratios to average net assets: |
Net investment income (loss) | | | 2.24 | % |
Total expensesd | | | 0.51 | % |
Net expensese,f,i | | | 0.50 | % |
Portfolio turnover rate | | | 72 | % |
a | Net investment income (loss) per share was computed using average shares outstanding throughout the period. |
b | Distributions from realized gains are less than $0.01 per share. |
c | Total return does not reflect the impact of any applicable sales charges. |
d | Does not include expenses of the underlying funds in which the Fund invests. |
e | Net expense information reflects the expense ratios after expense waivers and reimbursements, as applicable. |
f | The portion of the ratios of net expenses to average net assets attributable to recoupments of prior fee reductions or expense reimbursements for the years presented was as follows: |
| | | | 09/30/19 | | | 09/30/18 | | | 09/30/17 | |
| | A-Class | | | 0.00 | %* | | | — | | | | — | |
| | C-Class | | | — | | | | — | | | | 0.00 | %* |
| | P-Class | | | 0.00 | %* | | | — | | | | 0.00 | %* |
| | Institutional Class | | | 0.00 | %* | | | — | | | | — | |
| | R6-Class | | | 0.00 | %* | | | — | | | | — | |
g | Since commencement of operations: May 1, 2015. Percentage amounts for the period, except total return and portfolio turnover rate, have been annualized. |
h | Since commencement of operations: March 13, 2019. Percentage amounts for the period, except total return and portfolio turnover rate, have been annualized. |
i | Net expenses may include expenses that are excluded from the expense limitation agreement. Excluding these expenses, the net expense ratios for the years would be: |
| | | | 09/30/19 | | | 09/30/18 | | | 09/30/17 | | | 09/30/16 | | | 09/30/15 | |
| | A-Class | | | 0.75 | % | | | 0.75 | % | | | 0.79 | % | | | 0.80 | % | | | 0.80 | % |
| | C-Class | | | 1.50 | % | | | 1.50 | % | | | 1.54 | % | | | 1.55 | % | | | 1.55 | % |
| | P-Class | | | 0.75 | % | | | 0.75 | % | | | 0.79 | % | | | 0.80 | % | | | 0.80 | % |
| | Institutional Class | | | 0.50 | % | | | 0.50 | % | | | 0.54 | % | | | 0.55 | % | | | 0.55 | % |
| | R6-Class | | | 0.50 | % | | | N/A | | | | N/A | | | | N/A | | | | N/A | |
SEE NOTES TO FINANCIAL STATEMENTS. | THE GUGGENHEIM FUNDS ANNUAL REPORT | 35 |
NOTES TO FINANCIAL STATEMENTS |
Note 1 – Organization and Significant Accounting Policies
Organization
Guggenheim Funds Trust (the “Trust”), a Delaware statutory trust, is registered with the SEC under the Investment Company Act of 1940 (“1940 Act”), as an open-ended investment company of the series type. Each series, in effect, is representing a separate fund. The Trust is authorized to issue an unlimited number of shares. The Trust accounts for the assets of each fund separately.
The Trust offers a combination of five separate classes of shares: A-Class shares, C-Class shares, P-Class shares, R6-Class shares and Institutional Class shares. Sales of shares of each Class are made without a front-end sales charge at the net asset value per share (“NAV”), with the exception of A-Class shares. A-Class shares are sold at the NAV, plus the applicable front-end sales charge. The sales charge varies depending on the amount purchased. A-Class share purchases of $1 million or more are exempt from the front-end sales charge but have a 1% contingent deferred sales charge (“CDSC”), if shares are redeemed within 12 months of purchase. C-Class shares have a 1% CDSC if shares are redeemed within 12 months of purchase. C-Class shares of the Fund automatically convert to A-Class shares on or about the 10th day of the month following the 10-year anniversary of the purchase of the C-Class shares. This conversion will be executed without any sales charge, fee or other charge. After the conversion is completed, the shares will be subject to all features and expenses of A-Class shares. Institutional Class shares are offered primarily for direct investment by institutions such as pension and profit sharing plans, endowments, foundations and corporations. Institutional Class shares require a minimum initial investment of $2 million and a minimum account balance of $1 million. R6-Class shares are offered primarily through qualified retirement and benefit plans. R6-Class shares are also offered through certain other plans and platforms sponsored by financial intermediaries. Certain institutional investors and others deemed appropriate by Guggenheim Investments (“GI”) may also be eligible to purchase R6-Class shares subject to a $2 million minimum initial investment. At September 30, 2019, the Trust consisted of twenty funds (the “Funds”).
This report covers the Limited Duration Fund (the “Fund”), a diversified investment company. At September 30, 2019, A-Class, C-Class, P-Class, Institutional Class and R6-Class shares had been issed by the Fund.
Guggenheim Partners Investment Management, LLC (“GPIM”), which operates under the name Guggenheim Investments, provides advisory services. Guggenheim Funds Distributors, LLC (“GFD”) acts as principal underwriter for the Trust. GI and GFD are affiliated entities.
Significant Accounting Policies
The Fund operates as an investment company and, accordingly, follows the investment company accounting and reporting guidance of the Financial Accounting Standards Board (“FASB”) Accounting Standards Codification Topic 946 Financial Services – Investment Companies.
The following significant accounting policies are in conformity with U.S. generally accepted accounting principles (“U.S. GAAP”) and are consistently followed by the Trust. This requires management to make estimates and assumptions that affect the reported amount of assets and liabilities, contingent assets and liabilities at the date of the financial statements, and the reported amounts of revenues and expenses during the reporting period. Actual results could differ from these estimates. All time references are based on Eastern Time.
The NAV of each Class of the Fund is calculated by dividing the market value of the Fund’s securities and other assets, less all liabilities, attributable to the Class by the number of outstanding shares of the Class.
(a) Valuation of Investments
The Board of Trustees of the Fund (the “Board”) has adopted policies and procedures for the valuation of the Fund’s investments (the “Valuation Procedures”). Pursuant to the Valuation Procedures, the Board has delegated to a valuation committee, consisting of representatives from Guggenheim’s investment management, fund administration, legal and compliance departments (the “Valuation Committee”), the day-to-day responsibility for implementing the Valuation Procedures, including, under most circumstances, the responsibility for determining the fair value of the Fund’s securities and/or other assets.
Valuations of the Fund’s securities are supplied primarily by pricing services appointed pursuant to the processes set forth in the Valuation Procedures. The Valuation Committee convenes monthly, or more frequently as needed, to review the valuation of all assets which have been fair valued for reasonableness. The Fund’s officers, through the Valuation Committee and consistent with the monitoring and review responsibilities set forth in the Valuation Procedures, regularly review procedures used and valuations provided by the pricing services.
If the pricing service cannot or does not provide a valuation for a particular investment or such valuation is deemed unreliable, such investment is fair valued by the Valuation Committee.
Generally, trading in foreign securities markets is substantially completed each day at various times prior to the close of the New York Stock Exchange (“NYSE”). The values of foreign securities are
36 | THE GUGGENHEIM FUNDS ANNUAL REPORT | |
NOTES TO FINANCIAL STATEMENTS (continued) |
determined as of the close of such foreign markets or the close of the NYSE, if earlier. All investments quoted in foreign currencies are valued in U.S. dollars on the basis of the foreign currency exchange rates prevailing at the close of U.S. business at 4:00 p.m. Investments in foreign securities may involve risks not present in domestic investments. The Valuation Committee will determine the current value of such foreign securities by taking into consideration certain factors which may include those discussed above, as well as the following factors, among others: the value of the securities traded on other foreign markets, ADR trading, closed-end fund trading, foreign currency exchange activity, and the trading prices of financial products that are tied to foreign securities. In addition, under the Valuation Procedures, the Valuation Committee and GI are authorized to use prices and other information supplied by a third party pricing vendor in valuing foreign securities.
Open-end investment companies are valued at their NAV as of the close of business, on the valuation date.
U.S. Government securities are valued by either independent pricing services, the last traded fill price, or at the reported bid price at the close of business.
Debt securities with a maturity of greater than 60 days at acquisition are valued at prices that reflect broker-dealer supplied valuations or are obtained from independent pricing services, which may consider the trade activity, treasury spreads, yields or price of bonds of comparable quality, coupon, maturity, and type, as well as prices quoted by dealers who make markets in such securities. Short-term debt securities with a maturity of 60 days or less at acquisition are valued at amortized cost, provided such amount approximates market value. Money market funds are valued at their NAV.
Repurchase agreements are valued at amortized cost, provided such amounts approximate market value.
Typically, loans are valued using information provided by an independent third party pricing service which uses broker quotes. If the pricing service cannot or does not provide a valuation for a particular loan, or such valuation is deemed unreliable, such investment is fair valued by the Valuation Committee.
Exchange-traded options are valued at the mean of the bid and ask prices on the principal exchange on which they are traded. Over-the-counter (“OTC”) options are valued using a price provided by a pricing service.
The value of interest rate swap agreements entered into by the Fund is accounted for using the unrealized appreciation or depreciation on the agreements that is determined using the spread priced off the previous day’s Chicago Mercantile Exchange price.
The values of other swap agreements entered into by a fund are accounted for using the unrealized appreciation or depreciation on the agreements that are determined by marking the agreements to the last quoted value of the index or other underlying position that the swaps pertain to at the close of the NYSE.
Forward foreign currency exchange contracts are valued daily based on the applicable exchange rate of the underlying currency.
Investments for which market quotations are not readily available are fair-valued as determined in good faith by GI, subject to review and approval by the Valuation Committee, pursuant to methods established or ratified by the Board. Valuations in accordance with these methods are intended to reflect each security’s (or asset’s or liability’s) “fair value”. Each such determination is based on a consideration of all relevant factors, which are likely to vary from one pricing context to another. Examples of such factors may include, but are not limited to market prices; sale prices; broker quotes; and models which derive prices based on inputs such as prices of securities with comparable maturities and characteristics, or based on inputs such as anticipated cash flows or collateral, spread over U.S. Treasury securities, and other information analysis.
In connection with futures contracts and other derivative investments, such factors may include obtaining information as to how (a) these contracts and other derivative investments trade in the futures or other derivative markets, respectively, and (b) the securities underlying these contracts and other derivative investments trade in the cash market.
(b) U.S. Government and Agency Obligations
Inflation-Indexed bonds are fixed-income securities whose principal value is periodically adjusted to the rate of inflation. The interest rate on these securities is generally fixed at issuance at a rate lower than typical bonds. Over the life of an inflation-indexed bond however, interest will be paid based on a principal value which is adjusted for inflation. Any increase in the principal amount of an inflation-indexed bond is recognized as a component of Interest on the Statement of Operations, even though principal is not received until maturity.
(c) Senior Floating Rate Interests
Senior floating rate interests in which the Fund invests generally pay interest rates which are periodically adjusted by reference to a base short-term floating rate, plus a premium. These base lending rates are generally (i) the lending rate offered by one or more major European banks, such as the one-month or three-month London Inter-Bank Offered Rate (“LIBOR”), (ii) the prime rate offered by one or more major United States banks, or (iii) the bank’s certificate of deposit rate. Senior floating rate interests often require prepayments from excess cash flows or permit the
| | THE GUGGENHEIM FUNDS ANNUAL REPORT | 37 |
NOTES TO FINANCIAL STATEMENTS (continued) |
borrower to repay at its election. The rate at which the borrower repays cannot be predicted with accuracy. As a result, the actual remaining maturity may be substantially less than the stated maturities disclosed in the Fund’s Schedule of Investments. The interest rate indicated is the rate in effect at September 30, 2019.
(d) Interests in When-Issued Securities
The Fund may purchase and sell interests in securities on a when-issued and delayed delivery basis, with payment and delivery scheduled for a future date. No income accrues to the Fund on such interests or securities in connection with such transactions prior to the date the Fund actually takes delivery of such interests or securities. These transactions are subject to market fluctuations and are subject to the risk that the value at delivery may be more or less than the trade date purchase price. Although the Fund will generally purchase these securities with the intention of acquiring such securities, they may sell such securities before the settlement date.
(e) Options
Upon the purchase of an option, the premium paid is recorded as an investment, the value of which is marked-to-market daily. If a purchased option expires, the Fund realizes a loss in the amount of the cost of the option. When the Fund enters into a closing sale transaction, it realizes a gain or loss depending on whether the proceeds from the closing sale transaction are greater or less than the cost of the option. If the Fund exercises a put option, it realizes a gain or loss from the sale of the underlying security and the proceeds from such sale will be decreased by the premium originally paid. When the Fund exercises a call option, the cost of the security purchased by the Fund upon exercise increases by the premium originally paid.
When the Fund writes (sells) an option, an amount equal to the premium received is entered in that Fund’s accounting records as an asset and equivalent liability. The amount of the liability is subsequently marked-to-market to reflect the current value of the option written. When a written option expires, or if the Fund enters into a closing purchase transaction, it realizes a gain (or loss if the cost of a closing purchase transaction exceeds the premium received when the option was sold).
(f) Swap Agreements
Swap agreements are marked-to-market daily and the change, if any, is recorded as unrealized appreciation or depreciation. Payments received or made as a result of an agreement or termination of an agreement are recognized as realized gains or losses.
Upfront payments received or made by a Fund on credit default swap agreements and interest rate swap agreements are amortized over the expected life of the agreement. Periodic payments received or paid by a Fund are recorded as realized gains or losses. Payments received or made as a result of a credit event or termination of the contract are recognized, net of a proportional amount of the upfront payment, as realized gains or losses.
(g) Currency Translations
The accounting records of the Fund are maintained in U.S. dollars. All assets and liabilities initially expressed in foreign currencies are converted into U.S. dollars at prevailing exchange rates. Purchases and sales of investment securities, dividend and interest income, and certain expenses are translated at the rates of exchange prevailing on the respective dates of such transactions.
Changes in the relationship of these foreign currencies to the U.S. dollar can significantly affect the value of the investments and earnings of the Fund. Foreign investments may also subject the Fund to foreign government exchange restrictions, expropriation, taxation, or other political, social or economic developments, all of which could affect the market and/or credit risk of the investments.
The Fund does not isolate that portion of the results of operations resulting from changes in the foreign exchange rates on investments from the fluctuations arising from changes in the market prices of securities held. Such fluctuations are included with the net realized gain or loss and unrealized appreciation or depreciation on investments.
Reported net realized foreign exchange gains and losses arise from sales of foreign currencies and currency gains or losses realized between the trade and settlement dates on investment transactions. Net unrealized exchange appreciation and depreciation arise from changes in the fair values of assets and liabilities other than investments in securities at the fiscal period end, resulting from changes in exchange rates.
(h) Forward Foreign Currency Exchange Contracts
The change in value of a forward foreign currency exchange contract is recorded as unrealized appreciation or depreciation until the contract is closed. When the contract is closed, the Fund records a realized gain or loss equal to the difference between the value at the time the contract was opened and the value at the time it was closed.
(i) Foreign Taxes
The Fund may be subject to foreign taxes (a portion of which may be reclaimable) on income, stock dividends, capital gains on investments or certain foreign currency transactions. All foreign taxes are recorded in accordance with the applicable foreign tax
38 | THE GUGGENHEIM FUNDS ANNUAL REPORT | |
NOTES TO FINANCIAL STATEMENTS (continued) |
regulations and rates that exist in the foreign jurisdictions in which the Fund invests. These foreign taxes, if any, are paid by the Fund and reflected in its Statement of Operations as follows: foreign taxes withheld at source are presented as a reduction of income and foreign taxes on capital gains from sales of investments are included with the net realized gain (loss) on investments. Foreign taxes payable or deferred as of September 30, 2019, if any, are disclosed in the Fund’s Statement of Assets and Liabilities.
(j) Security Transactions
Security transactions are recorded on the trade date for financial reporting purposes. Realized gains and losses from securities transactions are recorded using the identified cost basis. Proceeds from lawsuits related to investment holdings are recorded as a reduction to cost if the securities are still held and as realized gains if no longer held in the Fund. Dividend income is recorded on the ex-dividend date, net of applicable taxes withheld by foreign countries. Taxable non-cash dividends are recorded as dividend income. Interest income, including amortization of premiums and accretion of discounts, is accrued on a daily basis. Interest income also includes paydown gains and losses on mortgage-backed and asset-backed securities and senior and subordinated loans. Amendment fees are earned as compensation for evaluating and accepting changes to the original loan agreement and are recognized when received.
Income from residual collateralized loan obligations is recognized using the effective interest method. At the time of purchase, management estimates the future expected cash flows and determines the effective yield and estimated maturity date based on the estimated cash flows. Subsequent to the purchase, the estimated cash flows are updated periodically and a revised yield is calculated prospectively.
(k) Distributions
The Fund declares dividends from investment income daily. The Fund pays its shareholders from its net investment income monthly and distributes any net capital gains that it has realized, at least annually. Distributions to shareholders are recorded on the ex-dividend date. Dividends are reinvested in additional shares, unless shareholders request payment in cash. The character of distributions made during the year from net investment income or net realized gains may differ from their ultimate characterization for U.S. federal income tax purposes.
(l) Class Allocations
Interest and dividend income, most expenses, all realized gains and losses, and all unrealized appreciation and depreciation are allocated to the classes based upon the value of the outstanding shares in each Class. Certain costs, such as distribution and service fees are charged directly to specific classes. In addition, certain expenses have been allocated to the individual Funds in the Trust based on the respective net assets of each Fund included in the Trust.
(m) Earnings Credits
Under the fee arrangement with the custodian, the Fund may earn credits based on overnight custody cash balances. These credits are utilized to reduce related custodial expenses. The custodian fees disclosed in the Statement of Operations are before the reduction in expense from the related earnings credits, if any. Earnings credits for the year ended September 30, 2019 are disclosed in the Statement of Operations.
(n) Cash
The Fund may leave cash overnight in its cash account with the custodian. Periodically, the Fund may have cash due to the custodian bank as an overdraft balance. A fee is incurred on this overdraft, calculated by multiplying the overdraft by a rate based on the federal funds rate, which was 1.90% at September 30, 2019.
(o) Indemnifications
Under the Fund’s organizational documents, its Trustees and Officers are indemnified against certain liabilities arising out of the performance of their duties to the Trust. In addition, throughout the normal course of business, the Fund enters into contracts that contain a variety of representations and warranties which provide general indemnifications. The Fund’s maximum exposure under these arrangements is unknown, as this would involve future claims that may be made against the Fund and/or its affiliates that have not yet occurred. However, based on experience, the Fund expects the risk of loss to be remote.
Note 2 – Derivatives
As part of its investment strategy, the Fund utilizes a variety of derivative instruments. These investments involve, to varying degrees, elements of market risk. Valuation and accounting treatment of these instruments can be found under Significant Accounting Policies in Note 1 of these Notes to Financial Statements.
Derivatives are instruments whose values depend on, or are derived from, in whole or in part, the value of one or more other assets, such as securities, currencies, commodities or indices. Derivative instruments may be used to increase investment flexibility (including to maintain cash reserves while maintaining exposure to certain other assets), for risk management (hedging) purposes, to facilitate trading, to reduce transaction costs and to pursue higher investment returns. Derivative instruments may also be used to mitigate certain investment risks, such as foreign
| | THE GUGGENHEIM FUNDS ANNUAL REPORT | 39 |
NOTES TO FINANCIAL STATEMENTS (continued) |
currency exchange rate risk, interest rate risk and credit risk. U.S. GAAP requires disclosures to enable investors to better understand how and why a Fund uses derivative instruments, how these derivative instruments are accounted for and their effects on the Fund’s financial position and results of operations.
The Fund utilized derivatives for the following purposes:
Duration: the use of an instrument to manage the interest rate risk of a portfolio.
Hedge: an investment made in order to reduce the risk of adverse price movements in a security, by taking an offsetting position to protect against broad market moves.
Income: the use of any instrument that distributes cash flows typically based upon some rate of interest.
Options Purchased and Written
A call option on a security gives the purchaser of the option the right to buy, and the writer of a call option the obligation to sell, the underlying security. The purchaser of a put option has the right to sell, and the writer of the put option the obligation to buy, the underlying security at any time during the option period. The risk associated with purchasing options is limited to the premium originally paid.
The following table represents the Fund’s use and volume of call/put options purchased on a monthly basis:
| | | Average Notional Amount | |
Use | | Call | | | Put | |
Hedge | | $ | 42,930,068 | | | $ | 437,069,102 | |
The risk in writing a call option is that a Fund may incur a loss if the market price of the underlying security increases and the option is exercised. The risk in writing a put option is that a Fund may incur a loss if the market price of the underlying security decreases and the option is exercised. In addition, there may be an imperfect correlation between the movement in prices of options and the underlying securities where a Fund may not be able to enter into a closing transaction because of an illiquid secondary market; or, for OTC options, a Fund may be at risk because of the counterparty’s inability to perform.
The following table represents the Fund’s use and volume of options written on a monthly basis:
| | | Average Notional Amount | |
Use | | Call | | | Put | |
Hedge | | $ | — | | | $ | 41,319,102 | |
Swap Agreements
A swap is an agreement that obligates two parties to exchange a series of cash flows at specified intervals based upon or calculated by reference to changes in specified prices or rates for a specified amount of an underlying asset. When utilizing OTC swaps, the Fund bears the risk of loss of the amount expected to be received under a swap agreement in the event of the default or bankruptcy of a swap agreement counterparty or if the underlying asset declines in value. Certain standardized swaps are subject to mandatory central clearing and are executed on a multi-lateral or other trade facility platform, such as a registered exchange. There is limited counterparty credit risk with respect to centrally-cleared swaps as the transaction is facilitated through a central clearinghouse, much like exchange-traded futures contracts. Upon entering into certain centrally-cleared swap transactions, the Fund is required to deposit with its clearing broker an amount of cash or securities as an initial margin. Subsequent variation margin payments or receipts are made or received by the Fund, depending on fluctuations in the fair value of the reference entity. For a fund utilizing centrally cleared swaps, the exchange bears the risk of loss resulting from a counterparty not being able to pay. There is no guarantee that a fund or an underlying fund could eliminate its exposure under an outstanding swap agreement by entering into an offsetting swap agreement with the same or another party.
40 | THE GUGGENHEIM FUNDS ANNUAL REPORT | |
NOTES TO FINANCIAL STATEMENTS (continued) |
Total return swaps involve commitments where single or multiple cash flows are exchanged based on the price of an underlying reference asset (such as an index) for a fixed or variable interest rate. Total return swaps will usually be computed based on the current value of the reference asset as of the close of regular trading on the NYSE or other exchange, with the swap value being adjusted to include dividends accrued, financing charges and/or interest associated with the swap agreement. When utilizing total return swaps, the Fund bears the risk of loss of the amount expected to be received under a swap agreement in the event of the default or bankruptcy of a swap agreement counterparty or if the underlying reference asset declines in value.
The following table represents the Fund’s use and volume of total return swaps on a monthly basis:
| | | Average Notional Amount | |
Use | | Long | | | Short | |
Income | | $ | — | * | | $ | — | |
* | Total return swap agreements were outstanding for 40 days during the year ended September 30, 2019. The daily average outstanding notional amount of total return swap agreements during the period was $13,020,415. |
Interest rate swaps involve the exchange by the Fund with another party for its respective commitment to pay or receive a fixed or variable interest rate on a notional amount of principal. Interest rate swaps are generally centrally-cleared, but central clearing does not make interest rate swap transactions risk free.
The following table represents the Fund’s use and volume of interest rate swaps on a monthly basis:
| | | Average Notional Amount | |
Use | | Pay Floating Rate | | | Receive Floating Rate | |
Duration, Hedge | | $ | 84,902,667 | | | $ | 227,062,833 | |
Credit default swaps are instruments which allow for the full or partial transfer of third party credit risk, with respect to a particular entity or entities, from one counterparty to the other. The Fund enters into credit default swaps as a “seller” or “buyer” of protection primarily to gain or reduce exposure to the investment grade and/or high yield bond market. A seller of credit default swaps is selling credit protection or assuming credit risk with respect to the underlying entity or entities. The buyer in a credit default swap is obligated to pay the seller a periodic stream of payments over the term of the contract provided that no event of default on an underlying reference obligation has occurred. If a credit event occurs, as defined under the terms of the swap agreement, the seller will either (i) pay to the buyer of protection an amount equal to the notional amount of the swap and take delivery of the referenced obligation or underlying securities comprising the referenced index or (ii) pay a net settlement amount in the form of cash or securities equal to the notional amount of the swap less the recovery value of the referenced obligation or underlying securities comprising the referenced index. The Notional Amount reflects the maximum potential amount the seller of credit protection could be required to pay to the buyer if a credit event occurs. The seller of protection receives periodic premium payments from the buyer and may also receive or pay an upfront premium adjustment to the stated periodic payments. In the event a credit default occurs on a credit default swap referencing an index, a factor adjustment will take place and the buyer of protection will receive a payment reflecting the par less the default recovery rate of the defaulted index component based on its weighting in the index. If no default occurs, the counterparty will pay the stream of payments and have no further obligations to the fund selling the credit protection. For a fund utilizing centrally cleared credit default swaps, the exchange bears the risk of loss resulting from a counterparty not being able to pay. For OTC credit default swaps, a fund bears the risk of loss of the amount expected to be received under a swap agreement in the event of the default or bankruptcy of a swap agreement counterparty, or in the case of a credit default swap in which a fund is selling credit protection, the default of a third party issuer.
The quoted market prices and resulting market values for credit default swap agreements on securities and credit indices serve as an indicator of the current status of the payment/performance risk and represent the likelihood of an expected liability (or profit) for the credit derivative had the notional amount of the swap agreement been closed/sold as of the period end. Increasing market values, in absolute terms when compared to the notional amount of the swap, represent a deterioration of the referenced entity’s credit soundness and a greater likelihood or risk of default or other credit event occurring as defined under the terms of the agreement.
| | THE GUGGENHEIM FUNDS ANNUAL REPORT | 41 |
NOTES TO FINANCIAL STATEMENTS (continued) |
The following table represents the Fund’s use and volume of credit default swaps on a monthly basis:
| | | Average Notional Amount | |
Use | | Protection
Sold | | | Protection
Purchased | |
Hedge | | $ | — | | | $ | 687,337,500 | |
Forward Foreign Currency Exchange Contracts
A forward foreign currency exchange contract is an agreement between two parties to exchange two designated currencies at a specific time in the future. Certain types of contracts may be cash settled, in an amount equal to the change in exchange rates during the term of the contract. The contracts can be used to hedge or manage exposure to foreign currency risks with portfolio investments or to gain exposure to foreign currencies.
The market value of a forward foreign currency exchange contract changes with fluctuations in foreign currency exchange rates. Furthermore, the Fund may be exposed to risk if the counterparties cannot meet the contract terms or if the currency value changes unfavorably as compared to the U.S. dollar.
The following table represents the Fund’s use and volume of forward foreign currency exchange contracts on a monthly basis:
| | | Average Value | |
Use | | Purchased | | | Sold | |
Hedge, Income | | $ | 37,059,368 | | | $ | 641,483,517 | |
Derivative Investment Holdings Categorized by Risk Exposure
The following is a summary of the location of derivative investments on the Fund’s Statement of Assets and Liabilities as of September 30, 2019:
Derivative Investment Type | Asset Derivatives | Liability Derivatives |
Currency contracts | Unrealized appreciation on forward foreign currency exchange contracts | Unrealized depreciation on forward foreign currency exchange contracts |
Interest rate contracts | Unamortized upfront premiums paid on interest rate swap agreements | Variation margin on interest rate swap agreements |
| | Investments in unaffiliated issuers, at value | |
Credit contracts | | Variation margin on credit defaut swap agreements |
| | | Unrealized depreciation on OTC swap agreements |
| | | Unamortized upfront premiums received on credit default swap agreements |
The following table sets forth the fair value of the Fund’s derivative investments categorized by primary risk exposure at September 30, 2019:
| | Asset Derivative Investments Value | |
| | Swaps
Credit
Risk* | | | Swaps
Interest
Rate
Risk* | | | Options
Purchased
Interest Rate
Risk | | | Forward
Foreign
Currency
Exchange
Risk | | | Total Value at
September 30,
2019 | |
| | $ | — | | | $ | 546,700 | | | $ | 1,817,609 | | | $ | 13,744,273 | | | $ | 16,108,582 | |
42 | THE GUGGENHEIM FUNDS ANNUAL REPORT | |
NOTES TO FINANCIAL STATEMENTS (continued) |
| | Liability Derivative Investments Value | |
| | Swaps
Credit
Risk* | | | Swaps
Interest
Rate
Risk* | | | Options
Written
Equity
Risk | | | Forward
Foreign
Currency
Exchange
Risk | | | Total Value at
September 30,
2019 | |
| | $ | 8,933,706 | | | $ | 1,098,751 | | | $ | — | | | $ | 2,757,978 | | | $ | 12,790,435 | |
* | Includes cumulative appreciation (depreciation) of OTC and centrally-cleared swap agreements as reported on the Schedule of Investments. For centrally-cleared swaps, variation margin is reported within the Statement of Assets and Liabilities. |
The following is a summary of the location of derivative investments on the Fund’s Statement of Operations for the year ended September 30, 2019:
Derivative Investment Type | Location of Gain (Loss) on Derivatives |
Currency contracts | Net realized gain (loss) on forward foreign currency exchange contracts |
| Net change in unrealized appreciation (depreciation) on forward foreign currency exchange contracts |
Interest Rate/Credit contracts | Net realized gain (loss) on swap agreements |
| Net change in unrealized appreciation (depreciation) on swap agreements |
Equity/Interest Rate contracts | Net realized gain (loss) on options purchased |
| | Net unrealized appreciation (depreciation) on options purchased |
Equity contracts | Net realized gain (loss) on options written |
The following is a summary of the Fund’s realized gain (loss) and change in unrealized appreciation (depreciation) on derivative investments recognized on the Statement of Operations categorized by primary risk exposure for the year ended September 30, 2019:
| | Realized Gain (Loss) on Derivative Investments Recognized on the Statement of Operations | |
| | Swaps
Interest
Rate
Risk | | | Options
Purchased
Interest
Rate Risk | | | Swaps
Credit
Risk | | | Options
Written
Equity
Risk | | | Options
Purchased
Equity
Risk | | | Forward
Foreign
Currency
Exchange
Risk | | | Total | |
| | $ | (7,038,060 | ) | | $ | (625,510 | ) | | $ | (6,132,525 | ) | | $ | 1,160,145 | | | $ | (8,701,059 | ) | | $ | 6,817,763 | | | $ | (14,519,246 | ) |
| | Change in Unrealized Appreciation (Depreciation) on Derivative Investments Recognized on the Statement of Operations | |
| | Swaps
Interest
Rate
Risk | | | Options
Purchased
Interest
Rate Risk | | | Swaps
Credit
Risk | | | Options
Written
Equity
Risk | | | Options
Purchased
Equity
Risk | | | Forward
Foreign
Currency
Exchange
Risk | | | Total | |
| | $ | (2,949,720 | ) | | $ | (628,531 | ) | | $ | (8,933,706 | ) | | $ | — | | | $ | 3,595,872 | | | $ | 5,617,059 | | | $ | (3,299,026 | ) |
In conjunction with the use of derivative instruments, the Fund is required to maintain collateral in various forms. Depending on the financial instrument utilized and the broker involved, the Fund uses margin deposits at the broker, cash and/or securities segregated at the custodian bank, discount notes or repurchase agreements allocated to the Fund as collateral.
Foreign Investments
There are several risks associated with exposure to foreign currencies, foreign issuers and emerging markets. A fund’s indirect and direct exposure to foreign currencies subjects the Fund to the risk that those currencies will decline in value relative to the U.S. dollar, or in the case of short positions, that the U.S. dollar will decline in value relative to the currency being hedged. Currency rates in foreign countries may fluctuate
| | THE GUGGENHEIM FUNDS ANNUAL REPORT | 43 |
NOTES TO FINANCIAL STATEMENTS (continued) |
significantly over short periods of time for a number of reasons, including changes in interest rates and the imposition of currency controls or other political developments in the U.S. or abroad. In addition, the Fund may incur transaction costs in connection with conversions between various currencies. The Fund may, but is not obligated to, engage in currency hedging transactions, which generally involve buying currency forward, options or futures contracts. However, not all currency risks may be effectively hedged, and in some cases the costs of hedging techniques may outweigh expected benefits. In such instances, the value of securities denominated in foreign currencies can change significantly when foreign currencies strengthen or weaken relative to the U.S. dollar.
The Fund may invest in securities of foreign companies directly, or in financial instruments, such as ADRs and exchange-traded funds, which are indirectly linked to the performance of foreign issuers. Foreign markets can be more volatile than the U.S. market due to increased risks of adverse issuer, political, regulatory, market, or economic developments and can perform differently from the U.S. market. Investing in securities of foreign companies directly, or in financial instruments that are indirectly linked to the performance of foreign issuers, may involve risks not typically associated with investing in U.S. issuers. The value of securities denominated in foreign currencies, and of dividends from such securities, can change significantly when foreign currencies strengthen or weaken relative to the U.S. dollar. Foreign securities markets generally have less trading volume and less liquidity than U.S. markets, and prices in some foreign markets may fluctuate more than those of securities traded on U.S. markets. Many foreign countries lack accounting and disclosure standards comparable to those that apply to U.S. companies, and it may be more difficult to obtain reliable information regarding a foreign issuer’s financial condition and operations. Transaction costs and costs associated with custody services are generally higher for foreign securities than they are for U.S. securities. Some foreign governments levy withholding taxes against dividend and interest income. Although in some countries portions of these taxes are recoverable, the non-recovered portion will reduce the income received by the Fund.
The Trust has established counterparty credit guidelines and enters into transactions only with financial institutions of investment grade or better. The Trust monitors the counterparty credit risk.
Note 3 – Offsetting
In the normal course of business, the Fund enters into transactions subject to enforceable master netting arrangements or other similar arrangements. Generally, the right to offset in those agreements allows the Fund to counteract the exposure to a specific counterparty with collateral received from or delivered to that counterparty based on the terms of the arrangements. These arrangements provide for the right to liquidate upon the occurrence of an event of default, credit event upon merger or additional termination event.
In order to better define its contractual rights and to secure rights that will help the Fund mitigate its counterparty risk, the Fund may enter into an International Swaps and Derivatives Association, Inc. Master Agreement (“ISDA Master Agreement”) or similar agreement with its derivative contract counterparties. An ISDA Master Agreement is a bilateral agreement between a fund and a counterparty that governs OTC derivatives, including foreign exchange contracts, and typically contains, among other things, collateral posting terms and netting provisions in the event of a default and/or termination event. The provisions of the ISDA Master Agreement typically permit a single net payment in the event of a default (close-out netting) or similar event, including the bankruptcy or insolvency of the counterparty.
For derivatives traded under an ISDA Master Agreement, the collateral requirements are typically calculated by netting the mark-to-market amount for each transaction under such agreement and comparing that amount to the value of any collateral currently pledged by the Fund and the counterparty. For financial reporting purposes, cash collateral that has been pledged to cover obligations of the Fund and cash collateral received from the counterparty, if any, are reported separately on the Statement of Assets and Liabilities as segregated cash with broker/receivable for variation margin, or payable for swap settlement/variation margin. Cash and/or securities pledged or received as collateral by the Fund in connection with an OTC derivative subject to an ISDA Master Agreement generally may not be invested, sold or rehypothecated by the counterparty or the Fund, as applicable, absent an event of default under such agreement, in which case such collateral generally may be applied towards obligations due to and payable by such counterparty or the Fund, as applicable. Generally, the amount of collateral due from or to a counterparty must exceed a minimum transfer amount threshold (e.g., $300,000) before a transfer is required to be made. To the extent amounts due to the Fund from its counterparties are not fully collateralized, contractually or otherwise, the Fund bears the risk of loss from counterparty nonperformance. The Fund attempts to mitigate counterparty risk by only entering into agreements with counterparties that they believe to be of good standing and by monitoring the financial stability of those counterparties.
For financial reporting purposes, the Fund does not offset derivative assets and derivative liabilities that are subject to netting arrangements in the Statement of Assets and Liabilities.
44 | THE GUGGENHEIM FUNDS ANNUAL REPORT | |
NOTES TO FINANCIAL STATEMENTS (continued) |
The following tables present derivative financial instruments and secured financing transactions that are subject to enforceable netting arrangements:
| | | | | | | | | | | | | | | Gross Amounts Not Offset
in the Statement of
Assets and Liabilities | | | | | |
Instrument | | Gross
Amounts of
Recognized
Assets1 | | | Gross
Amounts
Offset in the
Statement of
Assets and
Liabilities | | | Net Amount
of Assets
Presented on
the Statement
of Assets and
Liabilities | | | Financial
Instruments | | | Cash
Collateral
Received | | | Net Amount | |
Forward foreign currency exchange contracts | | $ | 13,744,273 | | | $ | — | | | $ | 13,744,273 | | | $ | (2,270,437 | ) | | $ | (9,316,002 | ) | | $ | 2,157,834 | |
Options purchased | | | 1,817,609 | | | | — | | | | 1,817,609 | | | | (1,614,713 | ) | | | (6,243 | ) | | | 196,653 | |
| | | | | | | | | | | | | | | Gross Amounts Not Offset
in the Statement of
Assets and Liabilities | | | | | |
Instrument | | Gross
Amounts of
Recognized
Liabilities1 | | | Gross
Amounts
Offset in the
Statement of
Assets and
Liabilities | | | Net Amount
of Liabilities
Presented on
the Statement
of Assets and
Liabilities | | | Financial
Instruments | | | Cash
Collateral
Pledged | | | Net Amount | |
Credit default swap agreements | | $ | 2,360,234 | | | $ | — | | | $ | 2,360,234 | | | $ | (1,614,713 | ) | | $ | — | | | $ | 745,521 | |
Forward foreign currency exchange contracts | | | 2,757,978 | | | | — | | | | 2,757,978 | | | | (2,265,026 | ) | | | (362,000 | ) | | | 130,952 | |
Total return swap agreements | | | 64,352 | | | | — | | | | 64,352 | | | | (5,411 | ) | | | — | | | | 58,941 | |
1 | Exchange-traded or centrally-cleared derivatives are excluded from these reported amounts. |
The Fund has the right to offset deposits against any related derivative liabilities outstanding with each counterparty with the exception of exchange-traded or centrally-cleared derivatives. The following table presents deposits held by others in connection with derivative investments and repurchase agreements as of September 30, 2019.
Counterparty | Asset Type | | Cash Pledged | | | Cash Received | |
BofA Securities, Inc. | Credit default swap agreements | | $ | 5,452,145 | | | $ | — | |
BofA Securities, Inc. | Interest rate swap agreements | | | 9,867,979 | | | | — | |
Citibank N.A., New York | Forward foreign currency exchange contracts | | | — | | | | 3,600,000 | |
Goldman Sachs & Co. LLC | Forward foreign currency exchange contracts, Credit default swap agreements | | | — | | | | 2,990,000 | |
JPMorgan Chase Bank, N.A. | Forward foreign currency exchange contracts | | | — | | | | 2,890,000 | |
Morgan Stanley & Co. LLC | Forward foreign currency exchange contracts, Credit default swap agreements | | | 362,000 | | | | — | |
Societe Generale | Repurchase agreements | | | — | | | | 330,000 | |
| | | | | 15,682,124 | | | | 9,810,000 | |
Note 4 – Fair Value Measurement
In accordance with U.S. GAAP, fair value is defined as the price that the Fund would receive to sell an investment or pay to transfer a liability in an orderly transaction with an independent buyer in the principal market, or in the absence of a principal market, the most advantageous market for the investment or liability. U.S. GAAP establishes a three-tier fair value hierarchy based on the types of inputs used to value assets and liabilities and requires corresponding disclosure. The hierarchy and the corresponding inputs are summarized below:
Level 1 — | quoted prices in active markets for identical assets or liabilities. |
| | THE GUGGENHEIM FUNDS ANNUAL REPORT | 45 |
NOTES TO FINANCIAL STATEMENTS (continued) |
Level 2 — | significant other observable inputs (for example quoted prices for securities that are similar based on characteristics such as interest rates, prepayment speeds, credit risk, etc.). |
Level 3 — | significant unobservable inputs based on the best information available under the circumstances, to the extent observable inputs are not available, which may include assumptions. |
The types of inputs available depend on a variety of factors, such as the type of security and the characteristics of the markets in which it trades, if any. Fair valuation determinations that rely on fewer or no observable inputs require greater judgment. Accordingly, fair value determinations for Level 3 securities require the greatest amount of judgment.
Independent pricing services are used to value a majority of the Fund’s investments. When values are not available from a pricing service, they will be determined using a variety of sources and techniques, including: market prices; broker quotes; and models which derive prices based on inputs such as prices of securities with comparable maturities and characteristics or based on inputs such as anticipated cash flows or collateral, spread over U.S. Treasury securities, and other information and analysis. A significant portion of the Fund’s assets and liabilities are categorized as Level 2, as indicated in this report.
Quotes from broker-dealers, adjusted for fluctuations in criteria such as credit spreads and interest rates, may also be used to value the Fund’s assets and liabilities, i.e. prices provided by a broker-dealer or other market participant who has not committed to trade at that price. Although quotes are typically received from established market participants, the Fund may not have the transparency to view the underlying inputs which support the market quotations. Significant changes in a quote would generally result in significant changes in the fair value of the security.
Certain fixed income securities are valued by obtaining a monthly quote from a broker-dealer, adjusted for fluctuations in criteria such as credit spreads and interest rates.
Certain loans and other securities are valued using a single daily broker quote or a price from a third party vendor based on a single daily or monthly broker quote.
The inputs or methodologies used for valuing securities are not necessarily an indication of the risk associated with investing in those securities. The suitability of the techniques and sources employed to determine fair valuation are regularly monitored and subject to change.
Note 5 – Investment Advisory Agreement and Other Agreements
Under the terms of an investment advisory contract, the Fund pays GI investment advisory fees calculated at an annualized rate of 0.39% of the average daily net assets of the Fund.
GI engages external service providers to perform other necessary services for the Trust, such as audit and accounting related services, legal services, custody, printing and mailing, etc., on a pass-through basis. Such expenses are allocated to various Funds within the complex based on relative net assets.
The Board has adopted Distribution Plans related to the offering of A-Class, C-Class and P-Class shares pursuant to Rule 12b-1 under the 1940 Act. The plans provide for payments at an annual rate of 0.25% of the average daily net assets of the Fund’s A-Class and P-Class shares, and 1.00% of the average daily net assets of the Fund’s C-Class shares.
The investment advisory contract for the Fund provides that the total expenses be limited to a percentage of average net assets for each class of shares, exclusive of brokerage costs, dividends on securities sold short, expenses of other investment companies in which a Fund invests, interest, taxes, litigation, indemnification and extraordinary expenses. The limits are listed below:
| | Limit | | | Effective
Date | | | Contract
End Date | |
Limited Duration Fund - A-Class | | | 0.75 | % | | | 12/01/13 | | | | 02/01/21 | |
Limited Duration Fund - C-Class | | | 1.50 | % | | | 12/01/13 | | | | 02/01/21 | |
Limited Duration Fund - P-Class | | | 0.75 | % | | | 05/01/15 | | | | 02/01/21 | |
Limited Duration Fund - Institutional Class | | | 0.50 | % | | | 12/01/13 | | | | 02/01/21 | |
Limited Duration Fund - R6-Class | | | 0.50 | % | | | 03/13/19 | | | | 02/01/21 | |
46 | THE GUGGENHEIM FUNDS ANNUAL REPORT | |
NOTES TO FINANCIAL STATEMENTS (continued) |
GI is entitled to reimbursement by the Fund for fees waived or expenses reimbursed during any of the previous 36 months, beginning on the date of the expense limitation agreement, if on any day the estimated operating expenses are less than the indicated percentages. For purposes of this arrangement, GI is entitled to recoupment of previously waived fees or reimbursed expenses for 36 months from the date of the waiver or reimbursement by GI. At September 30, 2019, the amount of fees waived or expenses reimbursed that are subject to recoupment and will expire during the years ended September 30, are presented in the following table:
| | 2020 | | | 2021 | | | 2022 | | | Total | |
A-Class | | $ | 152,459 | | | $ | 282,834 | | | $ | 451,627 | | | $ | 886,920 | |
C-Class | | | 31,774 | | | | 47,300 | | | | 78,366 | | | | 157,440 | |
P-Class | | | 41,567 | | | | 163,906 | | | | 194,676 | | | | 400,149 | |
Institutional Class | | | 442,161 | | | | 896,378 | | | | 1,856,165 | | | | 3,194,704 | |
R6-Class | | | — | | | | — | | | | 11,568 | | | | 11,568 | |
For the year ended September 30, 2019, GI recouped $17,839 from the Fund.
If the Fund invests in a fund that is advised by the same adviser or an affiliated adviser, the investing Fund’s adviser has agreed to waive fees at the investing fund level to the extent necessary to offset the proportionate share of any management fee paid by the Fund with respect to its investment in such affiliated fund. Fee waivers will be calculated at the investing Fund level without regard to any expense cap, if any, in effect for the investing Fund. Fees waived under this arrangement are not subject to reimbursement to GI. For the year ended September 30, 2019, the Fund waived $186,916 related to investments in affiliated funds.
For the year ended September 30, 2019, GFD retained sales charges of $286,511 relating to sales of A-Class shares of the Trust.
Certain trustees and officers of the Trust are also officers of GI and/or GFD. The Trust does not compensate its officers or trustees who are officers, directors and/or employees of GI or GFD.
MUFG Investor Services (US), LLC (“MUIS”) acts as the Fund’s administrator, transfer agent and accounting agent. As administrator, transfer agent and accounting agent, MUIS is responsible for maintaining the books and records of the Fund’s securities and cash. The Bank of New York Mellon Corp. (“BNY”) acts as the Fund’s custodian. As custodian, BNY is responsible for the custody of the Fund’s assets. For providing the aforementioned administrative and accounting services, MUIS is entitled to receive a monthly fee equal to a percentage of the Fund’s average daily net assets and out of pocket expenses. For providing the aforementioned transfer agent and custodian services, MUIS and BNY are entitled to receive a monthly fee based on the number of transactions during the month and the number of accounts under management, subject to certain minimum monthly fees, and out of pocket expenses.
Note 6 – Federal Income Tax Information
The Fund intends to comply with the provisions of Subchapter M of the Internal Revenue Code applicable to regulated investment companies and will distribute substantially all taxable net investment income and capital gains sufficient to relieve the Fund from all, or substantially all, federal income, excise and state income taxes. Therefore, no provision for federal or state income tax or federal excise tax is required.
Tax positions taken or expected to be taken in the course of preparing the Fund’s tax returns are evaluated to determine whether the tax positions are “more-likely-than-not” of being sustained by the applicable tax authority. Tax positions not deemed to meet the more-likely-than-not threshold would be recorded as a tax benefit or expense in the current year. Management has analyzed the Fund’s tax positions taken, or to be taken, on U.S. federal income tax returns for all open tax years, and has concluded that no provision for income tax is required in the Fund’s financial statements. The Fund’s U.S. federal income tax returns are subject to examination by the Internal Revenue Service for a period of three years after they are filed.
The tax character of distributions paid during the year ended September 30, 2019 was as follows:
| | Ordinary
Income | | | Long-Term
Capital Gain | | | Total
Distributions | |
| | | $ | 95,034,914 | | | $ | — | | | $ | 95,034,914 | |
| | THE GUGGENHEIM FUNDS ANNUAL REPORT | 47 |
NOTES TO FINANCIAL STATEMENTS (continued) |
The tax character of distributions paid during the year ended September 30, 2018 was as follows:
| | Ordinary
Income | | | Long-Term
Capital Gain | | | Total
Distributions | |
| | | $ | 72,470,245 | | | $ | 555,478 | | | $ | 73,025,723 | |
Note: For U.S. federal income tax purposes, short-term capital gain distributions are treated as ordinary income distributions.
The tax components of distributable earnings/(loss) as of September 30, 2019 were as follows:
| | Undistributed
Ordinary
Income | | | Undistributed
Long-Term
Capital Gain | | | Net
Unrealized
Appreciation
(Depreciation) | | | Accumulated
Capital and
Other Losses | | | Other
Temporary
Differences | | | Total | |
| | | $ | 7,907,972 | | | $ | — | | | $ | 10,890,323 | | | $ | (19,883,983 | ) | | $ | (7,756,871 | ) | | $ | (8,842,559 | ) |
For U.S. federal income tax purposes, capital loss carryforwards represent realized losses of the Fund that may be carried forward and applied against future capital gains. Under the RIC Modernization Act of 2010, the Fund is permitted to carry forward capital losses incurred in taxable years beginning after December 22, 2010 for an unlimited period and such capital loss carryforwards will retain their character as either short-term or long-term capital losses. As of September 30, 2019, capital loss carryforwards for the Fund were as follows:
| | | Unlimited | | | | | |
| | Short-Term | | | Long-Term | | | Total
Capital Loss
Carryforward | |
| | | $ | (13,753,167 | ) | | $ | (6,130,816 | ) | | $ | (19,883,983 | ) |
Net investment income and net realized gains (losses) may differ for financial statement and tax purposes because of temporary or permanent book/tax differences. These differences are primarily due to investments in swaps, foreign currency gains and losses, “mark-to-market” of foreign currency exchange contracts, losses deferred due to wash sales, reclassification of distributions, and dividends payable. Additional differences may result from income accruals on certain investments and the “mark-to-market” of certain investments denominated in foreign currencies. To the extent these differences are permanent and would require a reclassification between Paid in Capital and Total Distributable Earnings (Loss), such reclassifications are made in the period that the differences arise. These reclassifications have no effect on net assets or NAV per share.
There were no adjustments made on the Statement of Assets and Liabilities as of September 30, 2019 for permanent book/tax differences.
At September 30, 2019, the cost of investments for U.S. federal income tax purposes, the aggregate gross unrealized appreciation for all investments for which there was an excess of value over tax cost and the aggregate gross unrealized depreciation for all investments for which there was an excess of tax cost over value, were as follows:
| | Tax Cost | | | Tax Unrealized
Appreciation | | | Tax Unrealized
Depreciation | | | Net Unrealized
Appreciation/
(Depreciation) | |
| | | $ | 3,464,999,857 | | | $ | 33,441,605 | | | $ | (22,576,404 | ) | | $ | 10,865,201 | |
Note 7 – Securities Transactions
For the year ended September 30, 2019, the cost of purchases and proceeds from sales of investment securities, excluding government securities, short-term investments and derivatives, were as follows:
| | Purchases | | | Sales | |
| | | $ | 965,819,657 | | | $ | 1,419,640,833 | |
48 | THE GUGGENHEIM FUNDS ANNUAL REPORT | |
NOTES TO FINANCIAL STATEMENTS (continued) |
For the year ended September 30, 2019, the cost of purchases and proceeds from the sales of government securities were as follows:
| | Purchases | | | Sales | |
| | | $ | 806,234,678 | | | $ | 373,352,550 | |
The Fund is permitted to purchase or sell securities from or to certain affiliated funds under specified conditions outlined in procedures adopted by the Board. The procedures have been designed to ensure that any purchase or sale of securities by the Fund from or to another fund or portfolio that is or could be considered an affiliate by virtue of having a common investment adviser (or affiliated investment advisers), common trustees and/or common officers complies with Rule 17a-7 of the 1940 Act. Further, as defined under these procedures, each transaction is effected at the current market price to save costs, where permissible. For the year ended September 30, 2019, the Fund engaged in purchases and sales of securities, pursuant to Rule 17a-7 of the 1940 Act, as follows:
| | Purchases | | | Sales | | | Realized Loss | |
| | | $ | — | | | $ | 6,111,231 | | | $ | (20,622 | ) |
Note 8 – Unfunded Loan Commitments
Pursuant to the terms of certain loan agreements, the Fund held unfunded loan commitments as of September 30, 2019. The Fund is obligated to fund these loan commitments at the borrower’s discretion.
The unfunded loan commitments as of September 30, 2019, were as follows:
Borrower | Maturity Date | | Face Amount | | | Value | |
Mavis Tire Express Services Corp. | 03/20/25 | | $ | 275,116 | | | $ | 6,385 | |
Note 9 – Restricted Securities
The securities below are considered illiquid and restricted under guidelines established by the Board:
Restricted Securities | Acquisition Date | | Cost | | | Value | |
Copper River CLO Ltd. | | | | | | | | | |
2007-1A, due 01/20/211 | 05/09/14 | | $ | 98,541 | | | $ | 69,397 | |
1 | Security has no stated coupon. However, it is expected to receive residual cash flow payments on defined deal dates. |
Note 10 – Line of Credit
The Trust, along with other affiliated trusts, secured a 364-day committed, $1,065,000,000 line of credit from Citibank, N.A., which was in place through October 5, 2018, at which time the line of credit was renewed with an increased commitment amount of $1,205,000,000. On October 4, 2019, the line of credit agreement was renewed with an increased commitment amount of $1,230,000,000. A Fund may draw (borrow) from the line of credit as a temporary measure for emergency purposes, to facilitate redemption requests, or for other short-term liquidity purposes consistent with the Fund’s investment objective and program. For example, it may be advantageous for the Fund to borrow money rather than sell existing portfolio positions to meet redemption requests. Fees related to borrowings, if any, vary under this arrangement between the greater of Citibank’s “base rate”, LIBOR plus 1%, or the federal funds rate plus 1/2 of 1%.
The commitment fee that may be paid by the Fund is at an annualized rate of 0.15% of the average daily amount of its allocated unused commitment amount. The allocated commitment fee amount for the Fund is referenced in the Statement of Operations under “Line of credit fees”. The Fund did not have any borrowings under this agreement as of and for the year ended September 30, 2019.
| | THE GUGGENHEIM FUNDS ANNUAL REPORT | 49 |
NOTES TO FINANCIAL STATEMENTS (concluded) |
Note 11 – Recent Regulatory Reporting Updates
In August 2018, the Financial Accounting Standards Board issued an Accounting Standards Update, ASU 2018-13, Fair Value Measurement (Topic 820), Disclosure Framework - Changes to the Disclosure Requirements for Fair Value Measurement (the “2018 ASU”) which adds, modifies and removes disclosure requirements related to certain aspects of fair value measurement. The 2018 ASU is effective for fiscal years, and interim periods within those fiscal years, beginning after December 15, 2019. Early adoption is permitted. As of September 30, 2019, the Fund has fully adopted the provisions of the 2018 ASU, which did not have a material impact on the Fund’s financial statements and related disclosures or impact the Fund’s net assets or results of operations.
Note 12 – Recent Accounting Pronouncements
In March 2017, the Financial Accounting Standards Board issued an Accounting Standards Update, ASU 2017-08, Receivables – Nonrefundable Fees and Other Costs (Subtopic 310-20), Premium Amortization on Purchased Callable Debt Securities (the “2017 ASU”) which amends the amortization period for certain purchased callable debt securities held at a premium, shortening such period to the earliest call date. The 2017 ASU does not require any accounting change for debt securities held at a discount; the discount continues to be amortized to maturity. The 2017 ASU is effective for fiscal years, and interim periods within those fiscal years, beginning after December 15, 2018. At this time, management is evaluating the implications of these changes on the financial statements.
Note 13 – Subsequent Events
The Fund evaluated subsequent events through the date the financial statements were available for issue and determined there were no material events that would require adjustment to or disclosure in the Fund’s financial statements.
50 | THE GUGGENHEIM FUNDS ANNUAL REPORT | |
REPORT OF INDEPENDENT REGISTERED PUBLIC ACCOUNTING FIRM |
To the Shareholders and the Board of Trustees of Guggenheim Limited Duration Fund
Opinion on the Financial Statements
We have audited the accompanying statement of assets and liabilities of Guggenheim Limited Duration Fund (the “Fund”), (one of the funds constituting Guggenheim Funds Trust (the “Trust”)), including the schedule of investments, as of September 30, 2019, and the related statement of operations for the year then ended, the statements of changes in net assets for each of the two years in the period then ended, the financial highlights for each of the five years in the period then ended and the related notes (collectively referred to as the “financial statements”). In our opinion, the financial statements present fairly, in all material respects, the financial position of the Fund (one of the funds constituting Guggenheim Funds Trust) at September 30, 2019, the results of its operations for the year then ended, the changes in its net assets for each of the two years in the period then ended and its financial highlights for each of the five years in the period then ended, in conformity with U.S. generally accepted accounting principles.
Basis for Opinion
These financial statements are the responsibility of the Trust’s management. Our responsibility is to express an opinion on the Fund’s financial statements based on our audits. We are a public accounting firm registered with the Public Company Accounting Oversight Board (United States) (“PCAOB”) and are required to be independent with respect to the Trust in accordance with the U.S. federal securities laws and the applicable rules and regulations of the Securities and Exchange Commission and the PCAOB.
We conducted our audits in accordance with the standards of the PCAOB. Those standards require that we plan and perform the audit to obtain reasonable assurance about whether the financial statements are free of material misstatement, whether due to error or fraud. The Trust is not required to have, nor were we engaged to perform, an audit of the Fund’s internal control over financial reporting. As part of our audits, we are required to obtain an understanding of internal control over financial reporting, but not for the purpose of expressing an opinion on the effectiveness of the Trust’s internal control over financial reporting. Accordingly, we express no such opinion.
Our audits included performing procedures to assess the risks of material misstatement of the financial statements, whether due to error or fraud, and performing procedures that respond to those risks. Such procedures included examining, on a test basis, evidence regarding the amounts and disclosures in the financial statements. Our procedures included confirmation of securities owned as of September 30, 2019, by correspondence with the custodians, transfer agent, brokers, and paying agents or by other appropriate auditing procedures where replies from brokers or paying agents were not received. Our audits also included evaluating the accounting principles used and significant estimates made by management, as well as evaluating the overall presentation of the financial statements. We believe that our audits provide a reasonable basis for our opinion.

We have served as the auditor of one or more Guggenheim investment companies since 1979.
Tysons, Virginia
November 26, 2019
| | THE GUGGENHEIM FUNDS ANNUAL REPORT | 51 |
OTHER INFORMATION (Unaudited) |
Federal Income Tax Information
This information is being provided as required by the Internal Revenue Code. Amounts shown may differ from those elsewhere in the report because of differences in tax and financial reporting practice.
In January 2020, shareholders will be advised on IRS Form 1099 DIV or substitute 1099 DIV as to the federal tax status of the distributions received by shareholders in the calendar year 2019.
The Fund’s investment income (dividend income plus short-term gains, if any) qualifies as follows:
Of the taxable ordinary income distributions paid during the fiscal year ending September 30, 2019, the Fund had the corresponding percentages qualify for the reduced tax rate pursuant to the Jobs and Growth Tax Relief and Reconciliation Act of 2003 or for the dividends received deduction for corporations. See the qualified dividend income and dividend received deduction columns, respectively, in the table below.
Additionally, of the taxable ordinary income distributions paid during the fiscal year ended September 30, 2019, the Fund had the corresponding percentages qualify as interest related dividends and qualified short-term capital gains as permitted by IRC Section 871(k)(1) and IRC Section 871(k)(2), respectively. See qualified interest income and qualified short-term capital gain columns, respectively, in the table below.
| | Qualified
Dividend
Income | | | Dividend
Received
Deduction | | | Qualified
Interest
Income | | | Qualified
Short-Term
Capital Gain | |
| | | | 0.07 | % | | | 0.07 | % | | | 78.49 | % | | | 100.00 | % |
Proxy Voting Information
A description of the policies and procedures that the Trust uses to determine how to vote proxies relating to securities held in the Fund’s portfolios is available, without charge and upon request, by calling 800.820.0888. This information is also available from the EDGAR database on the SEC’s website at https://www.sec.gov.
Information regarding how the Fund’s voted proxies relating to portfolio securities during the most recent 12-month period ended June 30 is available without charge, upon request, by calling 800.820.0888. This information is also available from the EDGAR database on the SEC’s website at https://www.sec.gov.
Special Meeting of Shareholders — Voting Results (Unaudited)
A joint special meeting of shareholders of the Trust was held on October 28, 2019 to elect the following ten nominees to the Board of Trustees of the Trust: Randall C. Barnes, Angela Brock-Kyle, Donald A. Chubb, Jr., Jerry B. Farley, Roman Friedrich III, Thomas F. Lydon, Jr., Ronald A. Nyberg, Sandra G. Sponem, Ronald E. Toupin, Jr. and Amy J. Lee. At the meeting, the following votes were recorded:
Nominee | | Shares For | | | Shares Withheld | |
Randall C. Barnes | | | 919,263,831 | | | | 7,335,759 | |
Angela Brock-Kyle | | | 919,775,822 | | | | 6,823,768 | |
Donald A. Chubb, Jr. | | | 915,120,874 | | | | 11,478,716 | |
Jerry B. Farley | | | 915,377,483 | | | | 11,222,107 | |
Roman Friedrich III | | | 918,807,442 | | | | 7,792,148 | |
Thomas F. Lydon, Jr. | | | 919,122,642 | | | | 7,476,948 | |
Ronald A. Nyberg | | | 918,889,679 | | | | 7,709,911 | |
Sandra G. Sponem | | | 919,600,708 | | | | 6,998,882 | |
Ronald E. Toupin, Jr. | | | 919,043,208 | | | | 7,556,382 | |
Amy J. Lee | | | 919,943,855 | | | | 6,655,735 | |
52 | THE GUGGENHEIM FUNDS ANNUAL REPORT | |
OTHER INFORMATION (Unaudited)(continued) |
Sector Classification
Information in the Schedule of Investments is categorized by sectors using sector-level Classifications defined by the Bloomberg Industry Classification System, a widely recognized industry classification system provider. The Fund’s registration statement has investment policies relating to concentration in specific sectors/industries. For purposes of these investment policies, the Fund usually classifies sectors/industries based on industry-level Classifications used by widely recognized industry classification system providers such as Bloomberg Industry Classification System, Global Industry Classification Standards and Barclays Global Classification Scheme.
Quarterly Portfolio Schedules Information
The Trust files its complete schedule of portfolio holdings with the SEC for the first and third quarters of each fiscal year as an exhibit to its reports on Form N-PORT, and for reporting periods ended prior to March 31, 2019, filed such information on Form N-Q. The Fund’s Forms N-PORT and N-Q are available on the SEC’s website at https://www.sec.gov. The Fund’s Forms N-PORT and N-Q may be reviewed and copied at the SEC’s Public Reference Room in Washington, DC, and that information on the operation of the Public Reference Room may be obtained by calling 800-SEC-0330. Copies of the portfolio holdings are also available to shareholders, without charge and upon request, by calling 800.820.0888.
Report of the Guggenheim Funds Trust Contracts Review Committee
Guggenheim Funds Trust (the “Trust”) was organized as a Delaware statutory trust on November 8, 2013, and is registered as an open-end management investment company under the Investment Company Act of 1940, as amended (the “1940 Act”). The Trust includes the following series:
● Guggenheim Alpha Opportunity Fund (“Alpha Opportunity Fund”) ● Guggenheim Diversified Income Fund (“Diversified Income Fund”) ● Guggenheim High Yield Fund (“High Yield Fund”) ● Guggenheim Large Cap Value Fund (“Large Cap Value Fund”) ● Guggenheim Macro Opportunities Fund (“Macro Opportunities Fund”) ● Guggenheim SMid Cap Value Fund (“SMid Cap Value Fund”) ● Guggenheim Municipal Income Fund (“Municipal Income Fund”) ● Guggenheim Small Cap Value Fund (“Small Cap Value Fund”) ● Guggenheim StylePlus—Mid Growth Fund (“StylePlus—Mid Growth Fund”) ● Guggenheim Ultra Short Duration Fund (“Ultra Short Duration Fund”) | ● Guggenheim Capital Stewardship Fund (“Capital Stewardship Fund”) ● Guggenheim Floating Rate Strategies Fund (“Floating Rate Strategies Fund”) ● Guggenheim Investment Grade Bond Fund (“Investment Grade Bond Fund”) ● Guggenheim Limited Duration Fund (“Limited Duration Fund”) ● Guggenheim Market Neutral Real Estate Fund (“Market Neutral Real Estate Fund”) ● Guggenheim SMid Cap Value Institutional Fund (“SMid Cap Value Institutional Fund”) ● Guggenheim Risk Managed Real Estate Fund (“Risk Managed Real Estate Fund”) ● Guggenheim StylePlus—Large Core Fund (“StylePlus—Large Core Fund”) ● Guggenheim Total Return Bond Fund (“Total Return Bond Fund”) ● Guggenheim World Equity Income Fund (“World Equity Income Fund”) |
| | THE GUGGENHEIM FUNDS ANNUAL REPORT | 53 |
OTHER INFORMATION (Unaudited)(continued) |
Security Investors, LLC (“Security Investors”), an indirect subsidiary of Guggenheim Partners, LLC, a privately-held, global investment and advisory firm (“Guggenheim Partners”), serves as investment adviser to each of: (i) Alpha Opportunity Fund; (ii) High Yield Fund; (iii) Investment Grade Bond Fund; (iv) Large Cap Value Fund; (v) SMid Cap Value Fund; (vi) SMid Cap Value Institutional Fund; (vii) Municipal Income Fund; (viii) Small Cap Value Fund; (ix) StylePlus—Large Core Fund; (x) StylePlus—Mid Growth Fund; and (xi) World Equity Income Fund (collectively, the “SI-Advised Funds”). (Guggenheim Partners, Security Investors, Guggenheim Partners Investment Management, LLC (“GPIM”) and their affiliates may be referred to herein collectively as “Guggenheim.” Security Investors and GPIM are also known as “Guggenheim Investments,” the global asset management and investment advisory division of Guggenheim Partners that includes other affiliated investment management businesses.)
Under the terms of investment management agreements between Security Investors and the Trust, with respect to the SI-Advised Funds, Security Investors also is responsible for overseeing the activities of GPIM, an indirect subsidiary of Guggenheim Partners, with respect to its service as investment sub-adviser to Municipal Income Fund, pursuant to an investment sub-advisory agreement between Security Investors and GPIM (the “GPIM Sub-Advisory Agreement”).
GPIM serves as investment adviser with respect to each of: (i) Diversified Income Fund; (ii) Floating Rate Strategies Fund; (iii) Limited Duration Fund; (iv) Macro Opportunities Fund; (v) Market Neutral Real Estate Fund; (vi) Risk Managed Real Estate Fund; (vii) Total Return Bond Fund; and (viii) Ultra Short Duration Fund (collectively, the “GPIM-Advised Funds” and together with the SI-Advised Funds, the “Funds” and individually, a “Fund”).1 Under the supervision of the Board of Trustees of the Trust (the “Board,” with the members of the Board referred to individually as the “Trustees”), the Advisers regularly provide (or, as applicable, oversee the provision of) investment research, advice and supervision, along with a continuous investment program for the Funds, and direct the purchase and sale of securities and other investments for each Fund’s portfolio. GPIM also serves as investment adviser for the Capital Stewardship Fund, which is addressed in a separate report.2
Each of the Advisory Agreements continues in effect from year to year provided that such continuance is specifically approved at least annually by (i) the Board or a majority of the outstanding voting securities (as defined in the 1940 Act) of each Fund, and, in either event, (ii) the vote of a majority of the Trustees who are not “interested person[s],” as defined by the 1940 Act, of the Trust (the “Independent Trustees”) casting votes in person at a meeting called for such purpose. At meetings held in person on April 25, 2019 (the “April Meeting”) and on May 21, 2019 (the “May Meeting”), the members of the Contracts Review Committee of the Board (the “Committee”), consisting solely of the Independent Trustees, met separately from Guggenheim to consider the proposed renewal of the Agreements in connection with the Committee’s annual contract review schedule.
As part of its review process, the Committee was represented by independent legal counsel to the Independent Trustees (“Independent Legal Counsel”), from whom the Independent Trustees received separate legal advice and with whom they met separately. Independent Legal Counsel reviewed and discussed with the Committee various key aspects of the Trustees’ legal responsibilities relating to the proposed renewal of the Agreements and other principal contracts. The Committee took into account various materials received from Guggenheim and Independent Legal Counsel. Recognizing that the evaluation process with respect to the services provided by Guggenheim is an ongoing one, the Committee also considered the variety of written materials, reports and oral presentations the Board receives throughout the year regarding performance and operating results of the Funds and other information relevant to its evaluation of the Agreements.
In connection with the contract review process, FUSE Research Network LLC (“FUSE”), an independent, third-party research provider, was engaged to prepare advisory contract renewal reports designed specifically to help the Board fulfill its advisory contract renewal responsibilities. The objective of the reports is to present the subject funds’ relative position regarding fees, expenses and total return performance, with peer group and universe comparisons. The Committee assessed the data provided in the FUSE reports as well as commentary presented by Guggenheim, including, among other things, a summary of notable distinctions between certain Funds and the applicable peer group identified in the FUSE reports and explanations for custom peer groups created for certain Funds that do not fit well into any particular category.
1 | The investment management agreements pertaining to the SI-Advised Funds and the investment management agreements pertaining to the GPIM-Advised Funds are referred to herein together as the “Advisory Agreements” and, together with the GPIM Sub-Advisory Agreement, as the “Agreements.” In addition, unless the context indicates otherwise, GPIM, with respect to its service as investment adviser to the GPIM-Advised Funds, and Security Investors as to the SI-Advised Funds, are each referred to herein as the “Adviser” and together, the “Advisers.” |
2 | Because shares of the Capital Stewardship Fund are only offered for subscription and are held by a limited number of institutional/bank investors, and the Fund issues a shareholder report separate from the other series of the Trust, the factors considered by the Committee in evaluating the proposed renewal of an investment management agreement pertaining to the Capital Stewardship Fund, and the Sub-Advisory Agreement with Concinnity Advisors, LP, are addressed in a separate report of the Committee. Accordingly, references to the “Funds” should be understood as referring to all series of the Trust, excluding Capital Stewardship Fund. |
54 | THE GUGGENHEIM FUNDS ANNUAL REPORT | |
OTHER INFORMATION (Unaudited)(continued) |
In addition, Guggenheim provided materials and data in response to formal requests for information sent by Independent Legal Counsel on behalf of the Independent Trustees. Guggenheim also made a presentation at the April Meeting. Throughout the process, the Committee asked questions of management and requested certain additional information, which Guggenheim provided (collectively with the foregoing reports and materials, the “Contract Review Materials”). The Committee considered the Contract Review Materials in the context of its accumulated experience governing the Trust and weighed the factors and standards discussed with Independent Legal Counsel.
Following an analysis and discussion of relevant factors, including those identified below, and in the exercise of its business judgment, the Committee concluded that it was in the best interest of each Fund to recommend that the Board approve the renewal of each of the Advisory Agreements and the GPIM Sub-Advisory Agreement for an additional annual term.
Advisory Agreements
Nature, Extent and Quality of Services Provided by each Adviser: With respect to the nature, extent and quality of services currently provided by each Adviser, the Committee considered the qualifications, experience and skills of key personnel performing services for the Funds, including those personnel providing compliance and risk oversight, as well as the supervisors and reporting lines for such personnel. The Committee considered Guggenheim’s resources and related efforts to retain, attract and motivate capable personnel to serve the Funds. In evaluating Guggenheim’s resources and capabilities, the Committee considered Guggenheim’s commitment to focusing on, and investing resources in support of, the Funds.
The Committee’s review of the services provided by Guggenheim to the Funds included consideration of Guggenheim’s investment processes and resulting performance, portfolio oversight and risk management, and the related regular quarterly reports and presentations received by the Board. The Committee took into account the risks borne by Guggenheim in sponsoring and providing services to the Funds, including entrepreneurial, legal and regulatory risks. The Committee considered the resources dedicated by Guggenheim to compliance functions and the reporting made to the Board by Guggenheim compliance personnel regarding Guggenheim’s adherence to regulatory requirements. The Committee also considered the regular reports the Board receives from the Trust’s Chief Compliance Officer regarding compliance policies and procedures established pursuant to Rule 38a-1 under the 1940 Act.
In connection with the Committee’s evaluation of the overall package of services provided by Guggenheim, the Committee considered Guggenheim’s administrative services, including its role in supervising, monitoring, coordinating and evaluating the various services provided by the fund administrator, transfer agent, distributor, custodian and other service providers to the Funds. The Committee evaluated the Office of Chief Financial Officer (the “OCFO”), established to oversee the fund administration, accounting and transfer agency services provided to the Funds, including the OCFO’s resources, personnel and services provided.
With respect to Municipal Income Fund, the Committee noted that, although Security Investors delegated responsibility for the investment and reinvestment of the Fund’s assets to the Sub-Adviser, as affiliated companies, both the Adviser and Sub-Adviser are part of the Guggenheim organization. Further, the Committee took into account Guggenheim’s explanation that investment advisory-related services are provided by many Guggenheim employees under different related legal entities and thus, the services provided by the Adviser on the one hand and the Sub-Adviser on the other, as well as the risks assumed by each party, cannot be ascribed to distinct legal entities.3 As a result, the Committee did not evaluate the services provided to Municipal Income Fund under the Advisory Agreement and the GPIM Sub-Advisory Agreement separately. With respect to Guggenheim’s resources and the ability of each Adviser to carry out its responsibilities under the applicable Advisory Agreement, the Chief Financial Officer of Guggenheim Investments reviewed with the Committee financial information concerning the holding company for Guggenheim Investments, Guggenheim Partners Investment Management Holdings, LLC (“GPIMH”), and the various entities comprising Guggenheim Investments, and provided the audited consolidated financial statements of GPIMH. (Thereafter, the Committee received the audited consolidated financial statements of GPIM.)
The Committee also considered the acceptability of the terms of each Advisory Agreement, including the scope of services required to be performed by each Adviser.
3 | Consequently, except where the context indicates otherwise, references to “Adviser” or “Sub-Adviser” should be understood as referring to Guggenheim Investments generally and the services it provides under both Agreements. |
| | THE GUGGENHEIM FUNDS ANNUAL REPORT | 55 |
OTHER INFORMATION (Unaudited)(continued) |
Based on the foregoing, and based on other information received (both oral and written) at the April Meeting and the May Meeting, as well as other considerations, including the Committee’s knowledge of how each Adviser performs its duties obtained through Board meetings, discussions and reports throughout the year, the Committee concluded that each Adviser and its personnel were qualified to serve the Funds in such capacity and may reasonably be expected to continue to provide a high quality of services under each Advisory Agreement with respect to the Funds.
Investment Performance: The Committee received, for each Fund, investment returns for the since-inception, ten-year, five-year, three-year, one-year and three-month periods ended December 31, 2018, as applicable. In addition, the Committee received a comparison of each Fund’s performance to the performance of a benchmark, a universe of funds and a narrower peer group of similar funds based on asset levels as identified by FUSE, in each case for the same periods, as applicable. The Committee also received from FUSE a description of the methodology for identifying each Fund’s peer group and universe for performance and expense comparisons.
In seeking to evaluate Fund performance over a full market cycle, the Committee focused its attention on five-year and three-year performance rankings as compared to the relevant universe of funds. The Committee considered more recent performance periods for those Funds that were recently launched, as well as in circumstances in which enhancements were being made to the portfolio management processes or techniques employed for a Fund. Except as to the individual Funds discussed below, the Committee observed that the returns of each Fund’s (other than SMid Cap Value Fund) Institutional Class shares and SMid Cap Value Fund’s Class A shares ranked in the third quartile or better of such Fund’s performance universe for each of the relevant periods considered.
In addition, the Committee made the following observations:
Municipal Income Fund: The returns of the Fund’s Institutional Class shares ranked in the 55th and 82nd percentiles of its performance universe for the five-year and three-year periods ended December 31, 2018, respectively. The Committee noted management’s explanation that the Fund’s increased allocation to floating rate securities in 2016 and the Fund’s more conservative investment approach detracted from performance that year, impacting trailing returns for five-year and three-year periods. In light of the foregoing, the Committee also considered the more recent one-year and three-month periods ended December 31, 2018, and observed that the returns of Fund’s Institutional Class shares ranked in the 30th and 11th percentiles, respectively, of its performance universe. The Committee also took into account management’s statement that it expects the Fund’s performance to continue to improve going forward as it anticipates the effects of recent tax reform and idiosyncratic risks.
Small Cap Value Fund: The returns of the Fund’s Institutional Class shares ranked in the 79th and 56th percentiles of its performance universe for the five-year and three-year periods ended December 31, 2018, respectively. The Committee noted measures taken by the Adviser to remedy longer-term relative underperformance with respect to the Value Funds strategy, including strategy enhancements such as implementation of a refined stock selection process and additional risk controls to enforce the strategy’s sell discipline. In light of the foregoing, the Committee also considered the more recent one-year and three-month periods ended December 31, 2018, and observed that the returns of Fund’s Institutional Class shares ranked in the 19th and 20th percentiles, respectively, of its performance universe.
After reviewing the foregoing and related factors, the Committee concluded that: (i) each Fund’s performance was acceptable; or (ii) it was satisfied with Guggenheim’s responses and efforts to improve investment performance.
Comparative Fees, Costs of Services Provided and the Profits Realized by each Adviser from Its Relationship with the Funds: The Committee compared each Fund’s contractual advisory fee, net effective management fee and total net expense ratio to the applicable peer group. The Committee also reviewed the median advisory fees and expense ratios, including expense ratio components (e.g., transfer agency fees, administration fees, other operating expenses, distribution fees and fee waivers/reimbursements), of the peer group of funds.
As part of its evaluation of each Fund’s advisory fee, the Committee considered how such fees compared to the advisory fee charged by the applicable Adviser to one or more other clients that it manages pursuant to similar investment strategies, to the extent applicable, noting that, in certain instances, Guggenheim charges a lower advisory fee to such other clients. In this connection, the Committee considered, among other things, Guggenheim’s representations about the significant differences between managing mutual funds as compared to other types of accounts. The Committee also considered Guggenheim’s explanation that lower fees are charged in certain instances due to various other factors, including the scope of contract, type of investors, fee structure, applicable legal, governance and capital structures, tax status and historical pricing reasons. In addition, the Committee took into account Guggenheim’s discussion of the entrepreneurial, legal and regulatory
56 | THE GUGGENHEIM FUNDS ANNUAL REPORT | |
OTHER INFORMATION (Unaudited)(continued) |
risks it faces when offering the Funds as compared to other types of accounts. The Committee concluded that the information it received demonstrated that the aggregate services provided to, or the specific circumstances of, each Fund were sufficiently different from the services provided to, or the specific circumstances of, other clients with similar investment strategies and/or the risks borne by Guggenheim were sufficiently greater than those associated with managing other clients with similar investment strategies to support the difference in fees.
In further considering the comparative fee and expense data presented in the Contract Review Materials and addressed by Guggenheim, the Committee took into account those Funds with currently effective expense limitation agreements with the Adviser. Except as to the individual Funds discussed below, the Committee observed that each Fund’s average contractual advisory fee percentile rank across all share classes of the Fund, net effective management fee4 and asset-weighted total net expense ratio each rank in the third quartile or better of such Fund’s peer group.
In addition, the Committee made the following observations:
Diversified Income Fund: The average contractual advisory fee percentile rank across all share classes of the Fund is in the fourth quartile (78th percentile) of its peer group. The Fund’s net effective management fee ranks in the first quartile (1st percentile) of its peer group. The Committee considered that the Fund’s asset weighted total net expense ratio ranks in the second quartile (38th percentile) of its peer group. The Committee also took into account the Adviser’s statement that the Fund’s currently effective expense limitation agreement with the Adviser is intended to limit the impact of the Fund’s small size.
Floating Rate Strategies Fund: The average contractual advisory fee percentile rank across all share classes of the Fund is in the fourth quartile (92nd percentile) of its peer group. The Fund’s net effective management fee ranks in the fourth quartile (76th percentile) of its peer group. The Committee considered that the Fund’s asset weighted total net expense ratio ranks in the third quartile (58th percentile) of its peer group. The Committee also considered the Adviser’s statement explaining the higher fees that performance is driven by a unique investment approach that requires significant resources. In this regard, the Committee took into consideration the Fund’s strong investment performance for the five-year period ended December 31, 2018. In addition, the Committee noted the Adviser’s statement that the net effective management fee includes 0.08% in administration fees that is not paid to the Adviser. The Committee also took into account the Fund’s currently effective expense limitation agreement with the Adviser.
High Yield Fund: The average contractual advisory fee percentile rank across all share classes of the Fund is in the third quartile (54th percentile) of its peer group. The Fund’s net effective management fee ranks in the fourth quartile (76th percentile) of its peer group. The Fund’s asset weighted total net expense ratio ranks in the third quartile (73rd percentile) of its peer group. The Committee considered the Adviser’s statement explaining the higher fees that performance is driven by a unique investment approach that requires significant resources. In this regard, the Committee took into consideration the Fund’s strong investment performance for the five-year and three-year periods ended December 31, 2018. In addition, the Committee noted the Adviser’s statement that the net effective management fee includes 0.08% in administration fees that is not paid to the Adviser. The Committee also took into account the Fund’s currently effective expense limitation agreement with the Adviser.
Limited Duration Fund: The average contractual advisory fee percentile rank across all share classes of the Fund is in the third quartile (63rd percentile) of its peer group. The Fund’s net effective management fee ranks in the fourth quartile (80th percentile) of its peer group. The Committee considered that the Fund’s asset weighted total net expense ratio ranks in the third quartile (51st percentile) of its peer group. The Committee also considered the Adviser’s statement explaining the higher fees that performance is driven by a unique investment approach that requires significant resources. In this regard, the Committee took into consideration the Fund’s strong investment performance for the five-year and three-year periods ended December 31, 2018. In addition, the Committee noted the Adviser’s statement that the net effective management fee includes 0.08% in administration fees that is not paid to the Adviser. The Committee also took into account the Fund’s currently effective expense limitation agreement with the Adviser.
Macro Opportunities Fund: The average contractual advisory fee percentile rank across all share classes of the Fund, the Fund’s net effective management fee and the Fund’s asset weighted total net expense ratio each rank in the fourth quartile (93rd, 81st and 83rd percentiles, respectively) of its peer group. The Committee noted that the Fund is categorized as a non-traditional bond fund which seeks to add value by
4 | The “net effective management fee” for each Fund represents the combined effective advisory fee and administration fee as a percentage of average net assets for the latest fiscal year, after any waivers and/or reimbursements, based on the Fund’s class level peer group percent rank, weighted by class level assets under management. |
| | THE GUGGENHEIM FUNDS ANNUAL REPORT | 57 |
OTHER INFORMATION (Unaudited)(continued) |
investing in many non-traditional securities outside of fixed income, including equities, currencies, commodities and derivatives. The Committee considered the Adviser’s statement explaining the higher fees and expenses that performance is driven by a unique investment approach that requires significant resources. In this regard, the Committee took into consideration the Fund’s strong investment performance for the five-year and three-year periods ended December 31, 2018. The Committee also took into account the Fund’s currently effective expense limitation agreement with the Adviser. The Committee also noted that, in connection with the contract review process, the Adviser formalized an existing expense waiver agreement with the Fund pursuant to which the Adviser waives any Fund expenses attributable to the Fund’s investment in Alpha Opportunity Fund.
SMid Cap Value Institutional Fund: The Fund’s contractual advisory fee ranks in the first quartile (7th percentile) of its peer group. The Fund’s net effective management fee and asset weighted total net expense ratio each rank in the fourth quartile (79th and 86th percentiles, respectively) of its peer group. The Committee considered the Adviser’s statement explaining the higher fees and expenses that it has made adjustments to the strategy of the Fund over the last few years incorporating a more systematic approach in order to improve investment performance. In this regard, the Committee took into consideration the Fund’s strong investment performance for the three-year period ended December 31, 2018. In addition, the Committee noted the Adviser’s statement that the net effective management fee includes 0.08% in administration fees that is not paid to the Adviser. The Committee also considered the Adviser’s statement that the Fund has continued to experience outflows resulting in lower relative assets to peers and associated higher other operating expenses, and that the Adviser is evaluating strategic measures to improve the Fund’s positioning.
Risk Managed Real Estate Fund: The average contractual advisory fee percentile rank across all share classes of the Fund is in the first quartile (22nd percentile) of its peer group. The Fund’s net effective management fee ranks in the fourth quartile (78th percentile) of its peer group. The Committee considered that the Fund’s asset weighted total net expense ratio ranks in the second quartile (47th percentile) of its peer group. The Committee took into consideration the Fund’s strong investment performance for the three-year and one-year periods ended December 31, 2018. The Committee also took into account the Fund’s currently effective expense limitation agreement with the Adviser.
StylePlus—Large Core Fund: The average contractual advisory fee percentile rank across all share classes of the Fund is in the third quartile (62nd percentile) of its peer group. The Fund’s net effective management fee ranks in the fourth quartile (86th percentile) of its peer group. The Committee considered that the Fund’s asset weighted total net expense ratio ranks in the third quartile (66th percentile) of its peer group. The Committee also considered the Adviser’s statement explaining the higher fees that performance is driven by a unique combination of passive and actively managed strategies. In this regard, the Committee took into consideration the Fund’s strong investment performance for the five-year and three-year periods ended December 31, 2018.
Total Return Bond Fund: The average contractual advisory fee percentile rank across all share classes of the Fund is in the third quartile (68th percentile) of its peer group. The Fund’s net effective management fee ranks in the fourth quartile (78th percentile) of its peer group. The Committee considered that the Fund’s asset weighted total net expense ratio ranks in the 50th percentile of its peer group. The Committee also considered the Adviser’s statement explaining the higher fees that performance is driven by a unique investment approach that requires significant resources. In this regard, the Committee took into consideration the Fund’s strong investment performance for the five-year and three-year periods ended December 31, 2018. In addition, the Committee noted the Adviser’s statement that the net effective management fee includes 0.08% in administration fees that is not paid to the Adviser. The Committee also took into account the Fund’s currently effective expense limitation agreement with the Adviser.
With respect to the costs of services provided and profits realized by Guggenheim Investments from its relationship with the Funds, the Committee reviewed a profitability analysis and data from management for each Fund setting forth the average assets under management for the twelve months ended December 31, 2018, gross revenues received by Guggenheim Investments, expenses allocated to the Fund, expense waivers (as applicable), earnings and the operating margin/profitability rate, including variance information relative to the foregoing amounts as of December 31, 2017. In addition, the Chief Financial Officer of Guggenheim Investments reviewed with, and addressed questions from, the Committee concerning the expense allocation methodology employed in producing the profitability analysis.
In the course of its review of Guggenheim Investments’ profitability, the Committee took into account the methods used by Guggenheim Investments to determine expenses and profit. The Committee considered all of the foregoing in evaluating the costs of services provided, the profitability to Guggenheim Investments and the profitability rates presented, and concluded that the profits were not unreasonable.
58 | THE GUGGENHEIM FUNDS ANNUAL REPORT | |
OTHER INFORMATION (Unaudited)(continued) |
The Committee considered other benefits available to each Adviser because of its relationship with the Funds and noted Guggenheim’s statement that it does not believe the Advisers derive any such “fall-out” benefits. In this regard, the Committee noted Guggenheim’s statement that, although it does not consider such benefits to be fall-out benefits, the Advisers may benefit from marketing synergies arising from offering a broad spectrum of products, including the Funds.
Economies of Scale: The Committee received and considered information regarding whether there have been economies of scale with respect to the management of the Funds as Fund assets grow, whether the Funds have appropriately benefited from any economies of scale, and whether there is potential for realization of any further economies of scale. The Committee considered whether economies of scale in the provision of services to the Funds were being passed along to the shareholders. The Committee noted the Adviser’s statements, including that Guggenheim believes it is appropriately sharing potential economies of scale and that costs continue to increase in many key areas, including compensation of portfolio managers, key analysts and support staff, as well as for infrastructure needs, with respect to risk management oversight, valuation processes and disaster recovery systems, among other things, and that, in this regard, management’s costs for providing services have increased in recent years without regard to asset levels.
The Committee also noted the process employed by the Adviser to evaluate whether it would be appropriate to institute a new breakpoint for a Fund, with consideration given to, among other things: (i) the Fund’s size and trends in asset levels over recent years; (ii) the competitiveness of the expense levels; (iii) whether expense waivers are in place; (iv) changes and trends in revenue and expenses; (v) whether there are any anticipated expenditures that may benefit the Fund in the future; (vi) Fund profit level margins; (vii) relative Fund performance; (viii) the nature, extent and quality of services management provides to the Fund; and (ix) the complexity of the Fund’s investment strategy and the resources required to support the Fund.
As part of its assessment of economies of scale, the Committee also considered Guggenheim’s view that it seeks to share economies of scale through a number of means, including breakpoints, advisory fees set at competitive rates pre-assuming future asset growth, expense waivers and limitations, and investments in personnel, operations and infrastructure to support the Fund business. Thus, the Committee considered the size of the Funds and the competitiveness of and/or other determinations made regarding the current advisory fee for each Fund, as well as whether a Fund is subject to an expense limitation.
Based on the foregoing, the Committee determined that the advisory fee for each Fund was reasonable.
Sub-Advisory Agreement
Nature, Extent and Quality of Services Provided by the Sub-Adviser: As noted above, because both the Adviser and Sub-Adviser for Municipal Income Fund—Security Investors and GPIM, respectively—are part of and do business as Guggenheim Investments and the services provided by the Adviser on the one hand and the Sub-Adviser on the other cannot be ascribed to distinct legal entities, the Committee did not evaluate the services provided under the Advisory Agreement and Sub-Advisory Agreement separately. Therefore, the Committee considered the qualifications, experience and skills of the Fund’s portfolio management team in connection with the Committee’s evaluation of Guggenheim’s investment professionals under the applicable Advisory Agreement.
With respect to Guggenheim’s resources and the Sub-Adviser’s ability to carry out its responsibilities under the Sub-Advisory Agreement, as noted above, the Committee considered the financial condition of GPIMH and the various entities comprising Guggenheim Investments. (Thereafter, the Committee received the audited consolidated financial statements of GPIM.)
The Committee also considered the acceptability of the terms of the Sub-Advisory Agreement, including the scope of services required to be performed by the Sub-Adviser.
Investment Performance: The Committee considered the returns of the Fund under its evaluation of the Advisory Agreement.
Comparative Fees, Costs of Services Provided and the Profits Realized by the Sub-Adviser from Its Relationship with the Fund: The Committee considered that the Sub-Advisory Agreement is with an affiliate of the Adviser, that the Adviser compensates the Sub-Adviser from its own fees so that the sub-advisory fee rate for the Fund does not impact the fees paid by the Fund and that the Sub-Adviser’s revenues were included in the calculation of Guggenheim Investments’ profitability. Given its determination of the reasonableness of the advisory fee, the Committee concluded that the sub-advisory fee rate for the Fund was not unreasonable.
| | THE GUGGENHEIM FUNDS ANNUAL REPORT | 59 |
OTHER INFORMATION (Unaudited)(concluded) |
Economies of Scale: The Committee recognized that, because the Sub-Adviser’s fees are paid by the Adviser and not the Fund, the analysis of economies of scale was more appropriate in the context of the Committee’s consideration of the applicable Advisory Agreement, which was separately considered. (See “Advisory Agreements – Economies of Scale” above.)
Overall Conclusions
Based on the foregoing, the Committee determined that the investment advisory fees are fair and reasonable in light of the extent and quality of the services provided and other benefits received and that the continuation of each of the Agreements is in the best interest of each Fund. In reaching this conclusion, no single factor was determinative or conclusive and each Committee member, in the exercise of his business judgment, may afford different weights to different factors. At the May Meeting, the Committee, constituting all of the Independent Trustees, recommended the renewal of each Advisory Agreement and the Sub-Advisory Agreement for an additional annual term.
60 | THE GUGGENHEIM FUNDS ANNUAL REPORT | |
INFORMATION ON BOARD OF TRUSTEES AND OFFICERS (Unaudited) |
Name, Address*
and Year of Birth
of Trustees | Position(s)
Held with
the Trust | Term of Office
and Length of
Time Served** | Principal Occupation(s)
During Past 5 Years | Number of
Portfolios
in Fund
Complex
Overseen | Other
Directorships
Held by Trustees |
INDEPENDENT TRUSTEES | | | |
Randall C. Barnes (1951) | Trustee | Since 2014 | Current: Private Investor (2001-present). Former: Senior Vice President and Treasurer, PepsiCo, Inc. (1993-1997); President, Pizza Hut International (1991-1993); Senior Vice President, Strategic Planning and New Business Development, PepsiCo, Inc. (1987-1990). | 158 | Current: Trustee, Purpose Investments Funds (2013-present). Former: Managed Duration Investment Grade Municipal Fund (2003-2016). |
Angela Brock-Kyle (1959) | Trustee | Since November 2019 | Current: Founder and Chief Executive Officer, B.O.A.R.D.S (consulting firm). Former: Senior Leader, TIAA (financial services firm) (1987-2012). | 157 | None. |
Donald A. Chubb, Jr. (1946) | Trustee and Chairman of the Valuation Oversight Committee | Since 1994 | Current: Retired. Former: Business broker and manager of commercial real estate, Griffith & Blair, Inc. (1997-2017). | 157 | Former: Midland Care, Inc. (2011-2016). |
Jerry B. Farley (1946) | Trustee and Chairman of the Audit Committee | Since 2005 | Current: President, Washburn University (1997-present). | 157 | Current: CoreFirst Bank & Trust (2000-present). Former: Westar Energy, Inc. (2004-2018). |
Roman Friedrich III (1946) | Trustee and Chairman of the Contracts Review Committee | Since 2014 | Current: Founder and Managing Partner, Roman Friedrich & Company (1998-present). | 157 | Former: Zincore Metals, Inc. (2009-January 2019). |
Thomas F. Lydon, Jr. (1960) | Trustee | Since November 2019 | Current: President, Global Trends Investments (registered investment adviser) (1996-present). | 157 | Current: US Global Investors (GROW) (1995-present); and Harvest Volatility Edge Trust (3) (2017-present). |
| | THE GUGGENHEIM FUNDS ANNUAL REPORT | 61 |
INFORMATION ON BOARD OF TRUSTEES AND OFFICERS (Unaudited)(continued) |
Name, Address*
and Year of Birth
of Trustees | Position(s)
Held with
the Trust | Term of Office
and Length of
Time Served** | Principal Occupation(s)
During Past 5 Years | Number of
Portfolios
in Fund
Complex
Overseen | Other
Directorships
Held by Trustees |
INDEPENDENT TRUSTEES - concluded | | |
Ronald A. Nyberg (1953) | Trustee and Chairman of the Nominating and Governance Committee | Since 2014 | Current: Partner, Momkus LLC (2016-present). Former: Partner, Nyberg & Cassioppi, LLC (2000-2016); Executive Vice President, General Counsel, and Corporate Secretary, Van Kampen Investments (1982-1999). | 158 | Current: PPM Funds (9) (2018-present); Edward-Elmhurst Healthcare System (2012-present); Western Asset Inflation-Linked Opportunities & Income Fund (2004-present); Western Asset Inflation-Linked Income Fund (2003-present). Former: Managed Duration Investment Grade Municipal Fund (2003-2016). |
Sandra G. Sponem (1958) | Trustee | Since November 2019 | Current: Retired. Former: Senior Vice President and Chief Financial Officer, M.A. Mortenson Companies, Inc. (general contracting firm) (2007-2017). | 157 | Current: SPDR Series Trust (78) (2018-present); SPDR Index Shares Funds (31) (2018-present); SSGA Active Trust (12) (2018-present); and SSGA Master Trust (1) (2018-present). |
Ronald E. Toupin, Jr. (1958) | Trustee and Chairman of the Board | Since 2014 | Current: Portfolio Consultant (2010-present); Member, Governing Council, Independent Directors Council (2013-present); Governor, Board of Governors, Investment Company Institute (2018-present). Former: Member, Executive Committee, Independent Directors Council (2016-2018); Vice President, Manager and Portfolio Manager, Nuveen Asset Management (1998-1999); Vice President, Nuveen Investment Advisory Corp. (1992-1999); Vice President and Manager, Nuveen Unit Investment Trusts (1991-1999); and Assistant Vice President and Portfolio Manager, Nuveen Unit Investment Trusts (1988-1999), each of John Nuveen & Co., Inc. (1982-1999). | 157 | Current: Western Asset Inflation-Linked Opportunities & Income Fund (2004-present); Western Asset Inflation-Linked Income Fund (2003-present). Former: Managed Duration Investment Grade Municipal Fund (2003-2016). |
62 | THE GUGGENHEIM FUNDS ANNUAL REPORT | |
INFORMATION ON BOARD OF TRUSTEES AND OFFICERS (Unaudited)(continued) |
Name, Address*
and Year of Birth
of Trustees | Position(s)
Held with
the Trust | Term of Office
and Length of
Time Served** | Principal Occupation(s)
During Past 5 Years | Number of
Portfolios
in Fund
Complex
Overseen | Other
Directorships
Held by Trustees |
INTERESTED TRUSTEE | |
Amy J. Lee*** (1961) | Trustee, Vice President and Chief Legal Officer | Since 2018 (Trustee) Since 2014 (Chief Legal Officer) Since 2007 (Vice President) | Current: Interested Trustee, certain other funds in the Fund Complex (2018-present); Chief Legal Officer, certain other funds in the Fund Complex (2014-present); Vice President, certain other funds in the Fund Complex (2007-present); Senior Managing Director, Guggenheim Investments (2012-present). Former: President and Chief Executive Officer (2017-2018); President, certain other funds in the Fund Complex (2017-November 2019); Vice President, Associate General Counsel and Assistant Secretary, Security Benefit Life Insurance Company and Security Benefit Corporation (2004-2012). | 157 | None. |
* | The business address of each Trustee is c/o Guggenheim Investments, 227 West Monroe Street, Chicago, Illinois 60606. |
** | Each Trustee serves an indefinite term, until his or her successor is elected and qualified. Time served includes time served in the respective position for the Predecessor Corporation. |
*** | This Trustee is deemed to be an “interested person” of the Fund under the 1940 Act by reason of her position with the Fund’s Investment Manager and/or the parent of the Investment Manager. |
| | THE GUGGENHEIM FUNDS ANNUAL REPORT | 63 |
INFORMATION ON BOARD OF TRUSTEES AND OFFICERS (Unaudited)(continued) |
Name, Address*
and Year of Birth | Position(s)
Held with
the Trust | Term of Office
and Length of
Time Served** | Principal Occupations
During Past 5 Years |
OFFICERS | | | |
Brian E. Binder (1972) | President and Chief Executive Officer | Since 2018 | Current: President and Chief Executive Officer, certain other funds in the Fund Complex (2018-present); President and Chief Executive Officer, Guggenheim Funds Investment Advisors, LLC and Security Investors, LLC (2018-present); Senior Managing Director and Chief Administrative Officer, Guggenheim Investments (2018-present). Former: Managing Director and President, Deutsche Funds, and Head of US Product, Trading and Fund Administration, Deutsche Asset Management (2013-2018); Managing Director, Head of Business Management and Consulting, Invesco Ltd. (2010-2012). |
James M. Howley (1972) | Assistant Treasurer | Since 2014 | Current: Managing Director, Guggenheim Investments (2004-present); Assistant Treasurer, certain other funds in the Fund Complex (2006-present). Former: Manager, Mutual Fund Administration of Van Kampen Investments, Inc. (1996-2004). |
Mark E. Mathiasen (1978) | Secretary | Since 2014 | Current: Secretary, certain other funds in the Fund Complex (2007-present); Managing Director, Guggenheim Investments (2007-present). |
Glenn McWhinnie (1969) | Assistant Treasurer | Since 2016 | Current: Vice President, Guggenheim Investments (2009-present); Assistant Treasurer, certain other funds in the Fund complex (2016-present). |
Michael P. Megaris (1984) | Assistant Secretary | Since 2014 | Current: Assistant Secretary, certain other funds in the Fund Complex (2014-present); Director, Guggenheim Investments (2012-present). |
Elisabeth Miller (1968) | Chief Compliance Officer | Since 2012 | Current: Chief Compliance Officer, certain other funds in the Fund Complex (2012-present); Senior Managing Director, Guggenheim Investments (2012-present); Vice President, Guggenheim Funds Distributors, LLC (2014-present). Former: Chief Compliance Officer, Security Investors, LLC and Guggenheim Funds Investment Advisors, LLC (2012-2018); Chief Compliance Officer, Guggenheim Distributors, LLC (2009-2014); Senior Manager, Security Investors, LLC (2004-2014); Senior Manager, Guggenheim Distributors, LLC (2004-2014). |
Margaux Misantone (1978) | AML Officer | Since 2017 | Current: Chief Compliance Officer, Security Investors, LLC and Guggenheim Funds Investment Advisors, LLC (2018-present); AML Officer, Security Investors, LLC and certain other funds in the Fund Complex (2017-present); Managing Director, Guggenheim Investments (2015-present). Former: Assistant Chief Compliance Officer, Security Investors, LLC and Guggenheim Funds Investments Advisors, LLC (2015-2018). |
Adam J. Nelson (1979) | Assistant Treasurer | Since 2015 | Current: Vice President, Guggenheim Investments (2015-present); Assistant Treasurer, certain other funds in the Fund Complex (2015-present). Former: Assistant Vice President and Fund Administration Director, State Street Corporation (2013-2015); Fund Administration Assistant Director, State Street (2011-2013); Fund Administration Manager, State Street (2009-2011). |
64 | THE GUGGENHEIM FUNDS ANNUAL REPORT | |
INFORMATION ON BOARD OF TRUSTEES AND OFFICERS (Unaudited)(concluded) |
Name, Address*
and Year of Birth | Position(s)
Held with
the Trust | Term of Office
and Length of
Time Served** | Principal Occupations
During Past 5 Years |
OFFICERS - concluded | |
Kimberly J. Scott (1974) | Assistant Treasurer | Since 2014 | Current: Director, Guggenheim Investments (2012-present); Assistant Treasurer, certain other funds in the Fund Complex (2012-present). Former: Financial Reporting Manager, Invesco, Ltd. (2010-2011); Vice President/Assistant Treasurer, Mutual Fund Administration for Van Kampen Investments, Inc./Morgan Stanley Investment Management (2009-2010); Manager of Mutual Fund Administration, Van Kampen Investments, Inc./Morgan Stanley Investment Management (2005-2009). |
Bryan Stone (1979) | Vice President | Since 2014 | Current: Vice President, certain other funds in the Fund Complex (2014-present); Managing Director, Guggenheim Investments (2013-present). Former: Senior Vice President, Neuberger Berman Group LLC (2009-2013); Vice President, Morgan Stanley (2002-2009). |
John L. Sullivan (1955) | Chief Financial Officer, Chief Accounting Officer and Treasurer | Since 2014 | Current: Chief Financial Officer, Chief Accounting Officer and Treasurer, certain other funds in the Fund Complex (2010-present); Senior Managing Director, Guggenheim Investments (2010-present). Former: Managing Director and Chief Compliance Officer, each of the funds in the Van Kampen Investments fund complex (2004-2010); Managing Director and Head of Fund Accounting and Administration, Morgan Stanley Investment Management (2002-2004); Chief Financial Officer and Treasurer, Van Kampen Funds (1996-2004). |
Jon Szafran (1989) | Assistant Treasurer | Since 2017 | Current: Vice President, Guggenheim Investments (2017-present); Assistant Treasurer, certain other funds in the Fund Complex (2017-present). Former: Assistant Treasurer of Henderson Global Funds and Manager of US Fund Administration, Henderson Global Investors (North America) Inc. (“HGINA”), (2017); Senior Analyst of US Fund Administration, HGINA (2014-2017); Senior Associate of Fund Administration, Cortland Capital Market Services, LLC (2013-2014); Experienced Associate, PricewaterhouseCoopers LLP (2012-2013). |
* | The business address of each officer is c/o Guggenheim Investments, 227 West Monroe Street, Chicago, Illinois 60606. |
** | Each officer serves an indefinite term, until his or her successor is duly elected and qualified. |
| | THE GUGGENHEIM FUNDS ANNUAL REPORT | 65 |
GUGGENHEIM INVESTMENTS PRIVACY NOTICE (Unaudited) |
Who We Are
This Privacy Notice describes the data protection practices of Guggenheim Investments. Guggenheim Investments as used herein refers to the affiliated investment management businesses of Guggenheim Partners, LLC: Guggenheim Funds Investment Advisors, LLC, Guggenheim Partners Investment Management, LLC, Guggenheim Funds Distributors, LLC, Security Investors, LLC, Guggenheim Investment Advisors (Europe) Limited, Guggenheim Real Estate, LLC, GS Gamma Advisors, LLC, Guggenheim Partners India Management, LLC, Guggenheim Partners Europe Limited, as well as the funds in the Guggenheim Funds complex (the “Funds”) (“Guggenheim Investments,” “we,” “us,” or “our”).
Guggenheim Partners Investment Management Holdings, LLC, located at 330 Madison Avenue, New York, New York 10017 is the data controller for your information. The affiliates who are also controllers of certain of your information are: Guggenheim Investment Advisors (Europe) Limited, Guggenheim Partners Europe Limited, Guggenheim Partners, LLC, Guggenheim Funds Investment Advisors, LLC, Guggenheim Partners Investment Management, LLC, Guggenheim Funds Distributors, LLC and Security Investors, LLC, as well as the Funds.
Our Commitment to You
Guggenheim Investments considers your privacy our utmost concern. When you become our client or investor, you entrust us with not only your hard-earned money but also with your personal and financial information. Because we have access to your private information, we hold ourselves to the highest standards in its safekeeping and use. We strictly limit how we share your information with others, whether you are a current or former Guggenheim Investments client or investor.
The Information We Collect About You
We collect certain nonpublic personal information about you from information you provide on applications, other forms, our website, and/or from third parties including investment advisors. This information includes Social Security or other tax identification number, assets, income, tax information, retirement and estate plan information, transaction history, account balance, payment history, bank account information, marital status, family relationships, information that we collect on our website through the use of “cookies,” and other personal information that you or others provide to us. We may also collect such information through your inquiries by mail, e-mail or telephone. We may also collect customer due diligence information, as required by applicable law and regulation, through third party service providers.
How We Handle Your Personal Information
The legal basis for using your information as set out in this Privacy Notice is as follows: (a) use of your personal data is necessary to perform our obligations under any contract with you (such as a contract for us to provide financial services to you); or (b) where use of your personal data is not necessary for performance of a contract, use of your personal data is necessary for our legitimate interests or the legitimate interests of others (for example, to enforce the legal terms governing our services, operate and market our website and other services we offer, ensure safe environments for our personnel and others, make and receive payments, prevent fraud and to know the customer to whom we are providing the services). Some processing is done to comply with applicable law.
In addition to the specific uses described above, we also use your information in the following manner:
| | ● | We use your information in connection with servicing your accounts. |
| | ● | We use information to respond to your requests or questions. For example, we might use your information to respond to your customer feedback. |
| | ● | We use information to improve our products and services. We may use your information to make our website and products better. We may use your information to customize your experience with us. |
| | ● | We use information for security purposes. We may use your information to protect our company and our customers. |
| | ● | We use information to communicate with you. For example, we will communicate with you about your account or our relationship. We may contact you about your feedback. We might also contact you about this Privacy Notice. We may also enroll you in our email newsletter. |
66 | THE GUGGENHEIM FUNDS ANNUAL REPORT | |
GUGGENHEIM INVESTMENTS PRIVACY NOTICE (Unaudited)(continued) |
| | ● | We use information as otherwise permitted by law, as we may notify you. |
| | ● | Aggregate/Anonymous Data. We may aggregate and/or anonymize any information collected through the website so that such information can no longer be linked to you or your device (“Aggregate/Anonymous Information”). We may use Aggregate/Anonymous Information for any purpose, including without limitation for research and marketing purposes, and may also share such data with any third parties, including advertisers, promotional partners, and sponsors. |
We do not sell information about current or former clients or their accounts to third parties. Nor do we share this information, except when necessary to complete transactions at your request, to make you aware of investment products and services that we or our affiliates offer, or as permitted or required by law.
We provide information about you to companies and individuals not affiliated with Guggenheim Investments to complete certain transactions or account changes, or to perform services for us related to your account. For example, if you ask to transfer assets from another financial institution to Guggenheim Investments, we must provide certain information about you to that company to complete the transaction. We provide the third party with only the information necessary to carry out its responsibilities and only for that purpose. And we require these third parties to treat your private information with the same high degree of confidentiality that we do. To alert you to other Guggenheim Investments products and services, we share your information within our family of affiliated companies. You may limit our sharing with affiliated companies as set out below. We may also share information with any successor to all or part of our business, or in connection with steps leading up to a merger or acquisition. For example, if part of our business was sold we may give customer information as part of that transaction. We may also share information about you with your consent.
We will release information about you if you direct us to do so, if we are compelled by law to do so, or in other circumstances as permitted by law (for example, to protect your account from fraud).
If you close your account(s) or become an inactive client or investor, we will continue to adhere to the privacy policies and practices described in this notice.
Opt-Out Provisions and Your Data Choices
The law allows you to “opt out” of certain kinds of information sharing with third parties. We do not share personal information about you with any third parties that triggers this opt-out right. This means YOU ARE ALREADY OPTED OUT.
When you are no longer our client or investor, we continue to share your information as described in this notice, and you may contact us at any time to limit our sharing by sending an email to CorporateDataPrivacy@GuggenheimPartners.com.
European Union Data Subjects and certain others: In addition to the choices set forth above, residents of the European Union and certain other jurisdictions have certain rights to (1) request access to or rectification or deletion of information we collect about them, (2) request a restriction on the processing of their information, (3) object to the processing of their information, or (4) request the portability of certain information. To exercise these or other rights, please contact us using the contact information below. We will consider all requests and provide our response within the time period stated by applicable law. Please note, however, that certain information may be exempt from such requests in some circumstances, which may include if we need to keep processing your information for our legitimate interests or to comply with a legal obligation. We may request you provide us with information necessary to confirm your identity before responding to your request.
Residents of France and certain other jurisdictions may also provide us with instructions regarding the manner in which we may continue to store, erase and share your information after your death, and where applicable, the person you have designated to exercise these rights after your death.
How We Protect Privacy Online
We take steps to protect your privacy when you use our web site – www.guggenheiminvestments.com – by using secure forms of online communication, including encryption technology, Secure Socket Layer (SSL) protocol, firewalls and user names and passwords. These safeguards vary based on the sensitivity of the information that we collect and store. However, we cannot and do not guarantee that these measures will prevent every unauthorized attempt to access, use, or disclose your information since despite our efforts, no Internet and/or other
| | THE GUGGENHEIM FUNDS ANNUAL REPORT | 67 |
GUGGENHEIM INVESTMENTS PRIVACY NOTICE (Unaudited)(concluded) |
electronic transmissions can be completely secure. Our web site uses “http cookies”—tiny pieces of information that we ask your browser to store. We use cookies for session management and security features on the Guggenheim Investments web site. We do not use them to pull data from your hard drive, to learn your e-mail address, or to view data in cookies created by other web sites. We will not share the information in our cookies or give others access to it. See the legal information area on our web site for more details about web site security and privacy features.
How We Safeguard Your Personal Information and Data Retention
We restrict access to nonpublic personal information about you to our employees and in some cases to third parties (for example, the service providers described above) as permitted by law. We maintain strict physical, electronic and procedural safeguards that comply with federal standards to guard your nonpublic personal information.
We keep your information for no longer than necessary for the purposes for which it is processed. The length of time for which we retain information depends on the purposes for which we collected and use it and/or as required to comply with applicable laws. Information may persist in copies made for backup and business continuity purposes for additional time.
International Visitors
If you are not a resident of the United States, please be aware that your information may be transferred to, stored and processed in the United States where our servers are located and our databases are operated. The data protection and other laws of the United States and other countries might not be as comprehensive as those in your country.
In such cases, we ensure that a legal basis for such a transfer exists and that adequate protection is provided as required by applicable law, for example, by using standard contractual clauses or by transferring your data to a jurisdiction that has obtained an adequacy finding. Individuals whose data may be transferred on the basis of standard contractual clauses may contact us as described below.
We’ll Keep You Informed
If you have any questions or concerns about how we treat your personal data, we encourage you to consult with us first. You may also contact the relevant supervisory authority.
We reserve the right to modify this policy at any time and will inform you promptly of material changes. You may access our privacy policy from our web site at www.guggenheiminvestments.com. Should you have any questions regarding our privacy policy, contact us by email at CorporateDataPrivacy@GuggenheimPartners.com.
68 | THE GUGGENHEIM FUNDS ANNUAL REPORT | |
This page intentionally left blank.
The registrant’s Board of Trustees has adopted a code of ethics that applies to the registrant’s principal executive officer and principal financial officer. No substantive amendments were approved or waivers were granted to the Code during the period covered by this report. The Code is filed as an exhibit to this Form N-CSR.
| Item 3. | Audit Committee Financial Expert. |
The registrant's Board of Trustees has determined that it has at least one audit committee financial expert serving on its audit committee (the “Audit Committee”), Dr. Jerry B. Farley. Dr. Farley is “independent,” meaning that he is not an “interested person” of the Registrant (as that term is defined in Section 2(a)(19) of the Investment Company Act of 1940, as amended) and he does not accept any consulting, advisory, or other compensatory fee from the Registrant (except in his capacity as a Board or committee member). Dr. Farley qualifies as an audit committee financial expert by virtue of his experience at educational institutions, where his business responsibilities have included all aspects of financial management and reporting.
Under applicable securities laws, a person who is determined to be an audit committee financial expert will not be deemed an "expert" for any purpose, including without limitation for the purposes of Section 11 of the Securities Act of 1933, as a result of being designated or identified as an audit committee financial expert. The designation or identification of a person as an audit committee financial expert does not impose on such person any duties, obligations, or liabilities that are greater than the duties, obligations, and liabilities imposed on such person as a member of the audit committee and Board of Trustees in the absence of such designation or identification. The designation or identification of a person as an audit committee financial expert does not affect the duties, obligations or liability of any other member of the audit committee or Board of Trustees.
| Item 4. | Principal Accountant Fees and Services. |
| (a) | Audit Fees. The aggregate fees billed for each of the last two fiscal years (the “Reporting Periods”) for professional services rendered by the registrant’s principal accountant (the “Auditor”) for the audit of the registrant’s annual financial statements, or services that are normally provided by the Auditor in connection with the statutory and regulatory filings or engagements for the Reporting Periods, were $681,906 in 2019 and $605,778 in 2018. |
| (b) | Audit-Related Fees. The aggregate fees billed in the Reporting Periods for assurance and related services by the Auditor that are reasonably related to the performance of the audit of the registrant’s financial statements and are not reported under paragraph (a) of this Item 4 were $0 in 2019 and $0 in 2018. These audit-related were as follows: issuance of report concerning transfer agent's system of internal accounting control pursuant to Rule 17Ad-13 of the Securities Exchange Act. |
| (c) | Tax Fees. The aggregate fees billed to the registrant in the Reporting Periods for professional services rendered by the Auditor for tax compliance, tax advice and tax planning (“Tax Services”) were $220,496 in 2019 and $229,041 in 2018. These services consisted of (i) preparation of U.S. federal, state and excise tax returns; (ii) U.S. federal and state tax planning, advice and assistance regarding statutory, regulatory or administrative developments, (iii) tax advice regarding tax qualification matters and/or treatment of various financial instruments held or proposed to be acquired and (iv) review of U.S. federal excise distribution calculations. |
The aggregate fees billed in the Reporting Periods for Tax Services by the Auditor to Service Affiliates which required pre-approval by the Audit Committee were $0 in 2019 and $0 in 2018.
| (d) | All Other Fees. The aggregate fees billed to the registrant in the Reporting Periods for products and services provided by the Auditor, other than the services reported in paragraphs (a) through (c) of this Item, were $0 in 2019 and $0 in 2018. |
The aggregate fees billed in the Reporting Periods for Non-Audit Services by the Auditor to Service Affiliates, other than the services reported in paragraphs (b) through (d) of this Item, which required pre-approval by the Audit Committee were $0 in 2019 and $0 in 2018.
| (e) | (1)Audit Committee Pre-Approval Policies and Procedures. |
(1) The registrant’s audit committee reviews, and in its sole discretion, pre-approves, pursuant to written pre-approval procedures (A) all engagements for audit and non-audit services to be provided by the principal accountant to the registrant and (B) all engagements for non-audit services to be provided by the principal accountant (1) to the registrant’s investment adviser (not including a sub-adviser whose role is primarily portfolio management and is subcontracted or overseen by another investment adviser) and (2) to any entity controlling, controlled by or under common control with the registrant’s investment adviser that provides ongoing services to the registrant; but in the case of the services described in subsection (B)(1) or (2), only if the engagement relates directly to the operations and financial reporting of the registrant; provided that such pre-approval need not be obtained in circumstances in which the preapproval requirement is waived under rules promulgated by the Securities and Exchange Commission or New York Stock Exchange listing standards. Sections V.B.2 and V.B.3 of the registrant’s audit committee’s Audit Committee Charter contain the Audit Committee’s Pre-Approval Policies and Procedures and such sections are included below.
V.B.2.Pre-approve any engagement of the independent auditors to provide any non-prohibited services to the Fund, including the fees and other compensation to be paid to the independent auditors (unless an exception is available under Rule 2-01 of Regulation S-X).
(a) The categories of services to be reviewed and considered for pre-approval include the following (collectively, “Identified Services”):
Audit Services
• Annual financial statement audits
• Seed audits (related to new product filings, as required)
• SEC and regulatory filings and consents
Audit-Related Services
• Accounting consultations
• Fund merger/reorganization support services
• Other accounting related matters
• Agreed upon procedures reports
• Attestation reports
• Other internal control reports
Tax Services
• Recurring tax services:
o Preparation of Federal and state income tax returns, including extensions
o Preparation of calculations of taxable income, including fiscal year tax designations
o Preparation of annual Federal excise tax returns (if applicable)
o Preparation of calendar year excise distribution calculations
o Calculation of tax equalization on an as-needed basis
o Preparation of the estimated excise distribution calculations on an as-needed basis
o Preparation of quarterly Federal, state and local and franchise tax estimated tax payments on an as-needed basis
o Preparation of state apportionment calculations to properly allocate Fund taxable income among the states for state tax filing purposes
o Provision of tax compliance services in India for Funds with direct investments in India
o Assistance with management’s identification of passive foreign investment companies (PFICs) for tax purposes
• Permissible non-recurring tax services upon request:
o Assistance with determining ownership changes which impact a Fund’s utilization of loss carryforwards
o Assistance with calendar year shareholder reporting designations on Form 1099
o Assistance with corporate actions and tax treatment of complex securities and structured products
o Assistance with IRS ruling requests and calculation of deficiency dividends
o Conduct training sessions for the Adviser’s internal tax resources
o Assistance with Federal, state, local and international tax planning and advice regarding the tax consequences of proposed or actual transactions
o Tax services related to amendments to Federal, state and local returns and sales and use tax compliance
o RIC qualification reviews
o Tax distribution analysis and planning
o Tax authority examination services
o Tax appeals support services
o Tax accounting methods studies
o Fund merger, reorganization and liquidation support services
o Tax compliance, planning and advice services and related projects
(b) The Committee has pre-approved Identified Services for which the estimated fees are less than $25,000.
(c) For Identified Services with estimated fees of $25,000 or more, but less than $50,000, the Chair or any member of the Committee designated by the Chair is hereby authorized to pre-approve such services on behalf of the Committee.
(d) For Identified Services with estimated fees of $50,000 or more, such services require pre-approval by the Committee.
(e) All requests for Identified Services to be provided by the independent auditor that were pre-approved by the Committee shall be submitted to the Chief Accounting Officer (“CAO”) of the Trust by the independent auditor using the pre-approval request form attached as Appendix C to the Audit Committee Charter. The Trust’s CAO will determine whether such services are included within the list of services that have received the general preapproval of the Committee.
(f) The independent auditors or the CAO of the Trust (or an officer of the Trust who reports to the CAO) shall report to the Committee at each of its regular quarterly meetings all audit, audit-related and permissible non-audit services initiated since the last such report (unless the services were contained in the initial audit plan, as previously presented to, and approved by, the Committee). The report shall include a general description of the services and projected fees, and the means by which such services were approved by the Committee (including the particular category of Identified Services under which pre-approval was obtained).
V.B.3. Pre-approve any engagement of the independent auditors, including the fees and other compensation to be paid to the independent auditors, to provide any non-audit services to the Adviser (or any “control affiliate” of the Adviser providing ongoing services to the Trust), if the engagement relates directly to the operations and financial reporting of the Trust (unless an exception is available under Rule 2-01 of Regulation S-X).
(a) The Chair or any member of the Committee designated by the Chair may grant the pre-approval for non-audit services to the Adviser (or any “control affiliate” of the Adviser providing ongoing services to the Trust) relating directly to the operations and financial reporting of the Trust for which the estimated fees are less than $25,000. All such delegated pre-approvals shall be presented to the Committee no later than the next Committee meeting.
(b) For non-audit services to the Adviser (or any “control affiliate” of the Adviser providing ongoing services to the Trust) relating directly to the operations and financial reporting of the Trust for which the estimated fees are $25,000 or more, such services require pre-approval by the Committee.
(2) None of the services described in each of Items 4(b) through (d) were approved by the Audit Committee pursuant to paragraph (c)(7)(i)(C) of Rule 2-01 of Regulation S-X.
| (g) | Non-Audit Fees. The aggregate non-audit fees were for audit-related and tax services rendered to the registrant, and rendered to Service Affiliates, for the Reporting Periods were $220,496 in 2019 and $229,041 in 2018. |
| (h) | Auditor Independence. The registrant’s Audit Committee was provided with information relating to the provision of non-audit services by Ernst & Young, LLP to the registrant’s investment adviser (not including any sub adviser whose role is primarily portfolio management and is subcontracted with or overseen by another investment adviser), and any entity controlling, controlled by, or under common control with the investment adviser that provides ongoing services to the registrant that were not pre-approved by the Audit Committee so that a determination could be made whether the provision of such services is compatible with maintaining Ernst & Young, LLP’s independence. |
| Item 5. | Audit Committee of Listed Registrants. |
Not applicable.
The Schedule of Investments is included under Item 1 of this form.
| Item 7. | Disclosure of Proxy Voting Policies and Procedures for Closed-End Management Investment Companies. |
Not applicable.
| Item 8. | Portfolio Mangers of Closed-end Management Investment Companies |
Not applicable
| Item 9. | Purchases of Equity Securities by Closed-End Management Investment Company and Affiliated Purchasers. |
Not applicable.
| Item 10. | Submission of Matters to a Vote of Security Holders. |
The registrant does not currently have in place procedures by which shareholders may recommend nominees to the registrant’s board.
There have been no changes to the procedures by which shareholders may recommend nominees to the registrant’s board.
| Item 11. | Controls and Procedures. |
| (a) | The registrant’s President (principal executive officer) and Treasurer (principal financial officer) have evaluated the registrant’s disclosure controls and procedures (as defined in Rule 30a-3(c) under the Investment Company Act) as of a date within 90 days of this filing and have concluded that based on such evaluation as required by Rule 30a-3(b) under the Investment Company Act, that the registrant’s disclosure controls and procedures were effective as of that date in ensuring that information required to be disclosed by the registrant in this Form N-CSR was recorded, processed, summarized, and reported within the time periods specified in the Securities and Exchange Commission’s rules and forms.. |
| (b) | The registrant’s principal executive officer and principal financial officer are aware of no change in the registrant’s internal control over financial reporting that occurred during the registrant’s period covered by this report that has materially affected, or is reasonably likely to materially affect, the registrant’s internal control over financial reporting. |
| Item 12. | Disclosure of Securities Lending Activities for Closed-End Management Investment Companies. |
Not Applicable.
| (a)(1) | The registrant’s code of ethics pursuant to Item 2 of Form N-CSR is attached. |
| (a)(2) | Separate certifications by the President (principal executive officer) and Treasurer (principal financial officer) of the registrant as required by Rule 30a-2(a) under the Act (17 CFR 270.30a-2(a)) are attached. |
| (b) | A certification by the registrant’s President (principal executive officer) and Treasurer (principal financial officer) as required by Rule 30a-2(b) under the Act (17 CFR 270.30a-2(b)) is attached. |
SIGNATURES
Pursuant to the requirements of the Securities Exchange Act of 1934 and the Investment Company Act of 1940, the registrant has duly caused this report to be signed on its behalf by the undersigned, thereunto duly authorized.
| (Registrant) | Guggenheim Funds Trust | |
| | | |
| By (Signature and Title)* | /s/ Brian Binder | |
| Brian Binder, President and Chief Executive Officer | |
| | | |
| Date | December 9, 2019 | |
| | | |
| Pursuant to the requirements of the Securities Exchange Act of 1934 and the Investment Company Act of 1940, this report has been signed below by the following persons on behalf of the registrant and in the capacities and on the dates indicated. |
| | | |
| By (Signature and Title)* | /s/ Brian Binder | |
| Brian Binder, President and Chief Executive Officer | |
| | | |
| Date | December 9, 2019 | |
| | | |
| By (Signature and Title)* | /s/ John L. Sullivan | |
| John L. Sullivan, Chief Financial Officer and Treasurer | |
| | | |
| Date | December 9, 2019 | |
| * | Print the name and title of each signing officer under his or her signature. |


