UNITED STATES
SECURITIES AND EXCHANGE COMMISSION
Washington, D.C. 20549
FORM N-CSR
CERTIFIED SHAREHOLDER REPORT OF REGISTERED
MANAGEMENT INVESTMENT COMPANIES
Investment Company Act file number 811- 01136
Guggenheim Funds Trust
(Exact name of registrant as specified in charter)
702 King Farm Boulevard, Suite 200
Rockville, Maryland 20850
(Address of principal executive offices) (Zip code)
Amy J. Lee
Guggenheim Funds Trust
702 King Farm Boulevard, Suite 200
Rockville, Maryland 20850
(Name and address of agent for service)
Registrant's telephone number, including area code: 1-301-296-5100
Date of fiscal year end: September 30
Date of reporting period: October 1, 2020 - March 31, 2021
Form N-CSR is to be used by management investment companies to file reports with the Commission not later than 10 days after the transmission to stockholders of any report that is required to be transmitted to stockholders under Rule 30e-1 under the Investment Company Act of 1940 (17 CFR 270.30e-1). The Commission may use the information provided on Form N-CSR in its regulatory, disclosure review, inspection, and policymaking roles.
A registrant is required to disclose the information specified by Form N-CSR, and the Commission will make this information public. A registrant is not required to respond to the collection of information contained in Form N-CSR unless the Form displays a currently valid Office of Management and Budget (“OMB”) control number. Please direct comments concerning the accuracy of the information collection burden estimate and any suggestions for reducing the burden to Secretary, Securities and Exchange Commission, 450 Fifth Street, NW, Washington, DC 20549-0609. The OMB has reviewed this collection of information under the clearance requirements of 44 U.S.C. §3507.
| Item 1. | Reports to Stockholders. |
The registrant’s semi-annual report transmitted to shareholders pursuant to Rule 30e-1 under the Investment Company Act of 1940, as amended (the “Investment Company Act”), is as follows:
3.31.2021
Guggenheim Funds Semi-Annual Report
Guggenheim Funds Trust-Equity |
Guggenheim Alpha Opportunity Fund | | |
Guggenheim Large Cap Value Fund | | |
Guggenheim Market Neutral Real Estate Fund | | |
Guggenheim Risk Managed Real Estate Fund | | |
Guggenheim Small Cap Value Fund | | |
Guggenheim StylePlus—Large Core Fund | | |
Guggenheim StylePlus—Mid Growth Fund | | |
Guggenheim World Equity Income Fund | | |
GuggenheimInvestments.com | SBE-SEMI-0321x0921 |

| | |
DEAR SHAREHOLDER | 2 |
ECONOMIC AND MARKET OVERVIEW | 5 |
ABOUT SHAREHOLDERS’ FUND EXPENSES | 7 |
ALPHA OPPORTUNITY FUND | 10 |
LARGE CAP VALUE FUND | 29 |
MARKET NEUTRAL REAL ESTATE FUND | 38 |
RISK MANAGED REAL ESTATE FUND | 49 |
SMALL CAP VALUE FUND | 65 |
STYLEPLUS—LARGE CORE FUND | 74 |
STYLEPLUS—MID GROWTH FUND | 86 |
WORLD EQUITY INCOME FUND | 98 |
NOTES TO FINANCIAL STATEMENTS | 109 |
OTHER INFORMATION | 122 |
INFORMATION ON BOARD OF TRUSTEES AND OFFICERS | 123 |
GUGGENHEIM INVESTMENTS PRIVACY NOTICE | 128 |
| | THE GUGGENHEIM FUNDS SEMI-ANNUAL REPORT | 1 |
Dear Shareholder:
Security Investors, LLC and Guggenheim Partners Investment Management, LLC (“GPIM”) (together, “Investment Advisers”), are pleased to present the shareholder report for eight equity funds (the “Fund” or “Funds”). The report covers the semi-annual period ended March 31, 2021.
The Investment Advisers are part of Guggenheim Investments, which represents the investment management businesses of Guggenheim Partners, LLC, (“Guggenheim”) a global, diversified financial services firm.
Guggenheim Funds Distributors, LLC is the distributor of the Funds. Guggenheim Funds Distributors, LLC is affiliated with Guggenheim and the Investment Advisers.
We encourage you to read the Economic and Market Overview section of the report, which follows this letter.
We are committed to providing innovative investment solutions and appreciate the trust you place in us.
Sincerely,
Security Investors, LLC
Guggenheim Partners Investment Management, LLC
April 30, 2021
Read a prospectus and summary prospectus (if available) carefully before investing. It contains the investment objectives, risks, charges, expenses and other information, which should be considered carefully before investing. Obtain a prospectus and summary prospectus (if available) at guggenheiminvestments.com or call 800.820.0888.
This material is not intended as a recommendation or as investment advice of any kind, including in connection with rollovers, transfers, and distributions. Such material is not provided in a fiduciary capacity, may not be relied upon for or in connection with the making of investment decisions, and does not constitute a solicitation of an offer to buy or sell securities. All content has been provided for informational or educational purposes only and is not intended to be and should not be construed as legal or tax advice and/or a legal opinion. Always consult a financial, tax and/or legal professional regarding your specific situation.
2 | THE GUGGENHEIM FUNDS SEMI-ANNUAL REPORT | |
COVID-19. The global ongoing crisis caused by the outbreak of COVID-19 and the current recovery underway is causing disruption to consumer demand and economic output and supply chains. There are still travel restrictions and quarantines, and adverse impacts on local and global economies. Investors should be aware that in light of the current uncertainty, volatility and distress in economies, the financial markets, and labor and public health conditions around the world, the Funds’ investments and a shareholder’s investment in a Fund are subject to investment risk, including the possible loss of the entire principal amount invested. Firms through which investors invest with the Funds, the Funds, their service providers, the markets in which they invest and market intermediaries are also impacted by quarantines and similar measures intended to respond to and contain the ongoing pandemic, which can obstruct their functioning and subject them to heightened operational and other risks.
Alpha Opportunity Fund is subject to a number of risks and may not suitable for all investors. ● Investments in securities and derivatives, in general, are subject to market risks that may cause their prices to fluctuate over time. An investment in the Fund may lose money. There can be no guarantee the Fund will achieve it investment objective. ● The Fund’s use of derivatives such as futures, options and swap agreements may expose the Fund to additional risks that it would not be subject to if it invested directly in the securities underlying those derivatives. ● Certain of the derivative instruments, such as swaps and structured notes, are also subject to the risks of counterparty default and adverse tax treatment. ● The more the Fund invests in leveraged instruments, the more the leverage will magnify any gains or losses on those investments. ● The Fund’s use of short selling involves increased risk and costs, including paying more for a security than it received from its sale and the risk of unlimited losses. ● In certain circumstances the Fund may be subject to liquidity risk and it may be difficult for the Fund to purchase and sell particular investments within a reasonable time at a fair price. ● In certain circumstances, it may be difficult for the Fund to purchase and sell particular investments within a reasonable time at a fair price. ● The Fund’s fixed income investments will change in value in response to interest rate changes and other factors. ● Please read the prospectus for more detailed information regarding these and other risks.
Large Cap Value Fund may not be suitable for all investors. ● An investment in the Fund will fluctuate and is subject to investment risks, which means an investor could lose money. ● The intrinsic value of the underlying stocks may never be realized, or the stock may decline in value. The Fund is subject to risk that large-capitalization stocks may underperform other segments of the equity market or the equity markets as a whole. ● Please read the prospectus for more detailed information regarding these and other risks.
Market Neutral Real Estate Fund may not be suitable for all investors. ● Investing involves risk, including the possible loss of principal. ● There are no assurances that any fund will achieve its objective and/or strategy. ● The Fund’s investments in real estate securities subject the Fund to the same risks as direct investments in real estate, which is particularly sensitive to economic downturns. ● The Fund’s use of derivatives such as futures, options, and swap agreements may expose the Fund to additional risks that it would not be subject to if it invested directly in the securities underlying those derivatives. ● When market conditions are deemed appropriate, the Fund will leverage to the full extent permitted by its investment policies and restrictions and applicable law. Leveraging will exaggerate the effect on net asset value of any increase or decrease in the market value of the Fund’s portfolio. ● The more the Fund invests in leveraged instruments, the more the leverage will magnify any gains or losses on those investments. ● The Fund’s use of short selling involves increased risk and costs. The Fund risks paying more for a security than it received from its sale. ● The Fund’s investments in other investment vehicles subject the Fund to those risks and expenses affecting the investment vehicle. ● The Fund’s investments in foreign securities carry additional risks when compared to U.S. securities, due to the impact of diplomatic, political, or economic developments in the country in question (investments in emerging markets securities are generally subject to an even greater level of risk). ● The Fund may invest in derivative instruments, which may be more volatile and less liquid, increasing the risk of loss when compared to traditional securities. Certain of the derivative instruments are also subject to the risks of counterparty default and adverse tax treatment. ● Investing in sector funds is more volatile than investing in broadly diversified funds, as there is a greater risk due to the concentration of the funds’ holdings in issuers of the same or similar offerings. ● This Fund is considered non-diversified and can invest a greater portion of its assets in securities of individual issuers than a diversified fund. As a result, changes in the market value of a single security could cause greater fluctuations in the value of fund shares than would occur in a more diversified fund. ● Short selling involves increased risks and costs. You risk paying more for a security than you received from its sale. This strategy may not be suitable for all investors. ● The Fund is subject to active trading risks that may increase volatility and impact its ability to achieve its investment objective. ● You may have a gain or loss when you sell your shares. ● It is important to note that the Fund is not guaranteed by the U.S. government. ● Please read the prospectus for more detailed information regarding these and other risks.
Risk Managed Real Estate Fund may not be suitable for all investors. ● Investments in securities in general are subject to market risks that may cause their prices to fluctuate over time ● Investing involves risk, including the possible loss of principal. ● There are no assurances that any fund will achieve its objective and/or strategy. ● The Fund’s investments in real estate securities subject the Fund to the same risks as direct investments in real estate, which is particularly sensitive to economic downturns. ● The Fund’s use of derivatives such as futures, options and swap agreements may expose the Fund to additional risks that it would not be subject to if it invested directly in the securities underlying those derivatives. ● When market conditions are deemed appropriate, the Fund will leverage to the full extent permitted by its investment policies and restrictions and applicable law. Leveraging will exaggerate the effect on net asset value of any increase or decrease in the market value of the Fund’s portfolio. ● The more the Fund invests in leveraged instruments, the more the leverage will magnify any gains or losses on those investments. ● The Fund’s use of short selling involves increased risk and costs. The Fund risks paying more for a security than it received from its sale. ● The Fund’s investments in other investment vehicles subject the Fund to those risks and expenses affecting the investment vehicle. ● The Fund’s investments in foreign securities carry additional risks when compared to U.S. securities, due to the impact of diplomatic, political or economic developments in the country in question (investments in emerging markets securities are generally subject to an even greater level of risk). ● The Fund may invest in derivative instruments, which may be more volatile and less liquid, increasing the risk of loss when compared to traditional securities. Certain of the derivative instruments are also subject to the risks of counterparty default and adverse tax treatment. ● Investing in sector funds is more volatile than investing in broadly diversified funds, as there is a greater risk due to the concentration of the funds’ holdings in issuers of the same or similar offerings. ● Short selling involves increased risks and costs. You risk paying more for a security than you received from its sale. This strategy may not be suitable for all investors. ● The Fund is subject to active trading risks that may increase volatility and impact its ability to achieve its investment objective. ● You may have a gain or loss when you sell you shares. ● It is important to note that the Fund is not guaranteed by the U.S. government. ● Please read the prospectus for more detailed information regarding these and other risks.
Small Cap Value Fund may not be suitable for all investors. ● An investment in the Fund will fluctuate and is subject to investment risks, which means investors could lose money. ● The intrinsic value of the underlying stocks may never be realized, or the stock may decline in value. ● Investing in securities of small-capitalization companies may involve a greater risk of loss and more abrupt fluctuations in market price than investments in larger-capitalization companies. ● Please read the prospectus for more detailed information regarding these and other risks.
StylePlus—Large Core Fund may not be suitable for all investors. ● Investments in large capitalization stocks may underperform other segments of the equity market or the equity market as a whole. ● Growth stocks may be more volatile than other stocks because they are more sensitive to investor perceptions regarding the growth potential of the issuing companies. Value stocks are subject to the risk that the intrinsic value of the stock may never be realized by the market or that the price goes down.
| | THE GUGGENHEIM FUNDS SEMI-ANNUAL REPORT | 3 |
● The Fund may invest in derivative instruments, which may be more volatile and less liquid, increasing the risk of loss when compared to traditional securities. Certain of the derivative instruments are also subject to the risks of counterparty default and adverse tax treatment. ● The Fund’s use of leverage, through borrowings or instruments such as derivatives, may cause the Fund to be more volatile than if it had not been leveraged. ● The Fund’s investments in other investment vehicles subject the Fund to those risks and expenses affecting the investment vehicle. ● The Fund may invest in foreign securities which carry additional risks when compared to U.S. securities, due to the impact of diplomatic, political or economic developments in the country in question (investments in emerging markets securities are generally subject to an even greater level of risk). ● The Fund may invest in fixed income securities whose market value will change in response to interest rate changes and market conditions among other factors. In general, bond prices rise when interest rates fall and vice versa. ● The Fund’s exposure to high yield securities may subject the Fund to greater volatility. ● The Fund may invest in bank loans and asset-backed securities, including mortgage backed, which involve special types of risks. ● The Fund may invest in restricted securities which may involve financial and liquidity risk. ● You may have a gain or loss when you sell your shares. ● It is important to note that the Fund is not guaranteed by the U.S. government. ● Please read the prospectus for more detailed information regarding these and other risks.
StylePlus—Mid Growth Fund may not be suitable for all investors. ● Investments in mid-sized company securities may present additional risks such as less predictable earnings, higher volatility and less liquidity than larger, more established companies. ● Growth stocks may be more volatile than other stocks because they are more sensitive to investor perceptions regarding the growth potential of the issuing companies. ● The Fund may invest in derivative instruments, which may be more volatile and less liquid, increasing the risk of loss when compared to traditional securities. Certain of the derivative instruments are also subject to the risks of counterparty default and adverse tax treatment. ● The Fund’s use of leverage, through borrowings or instruments such as derivatives, may cause the Fund to be more volatile than if it had not been leveraged. ● The Fund’s investments in other investment vehicles subject the Fund to those risks and expenses affecting the investment vehicle. ● The Fund may invest in foreign securities which carry additional risks when compared to U.S. securities, due to the impact of diplomatic, political or economic developments in the country in question (investments in emerging markets securities are generally subject to an even greater level of risk). ● The Fund may invest in fixed income securities whose market value will change in response to interest rate changes and market conditions, among other factors. In general, bond prices rise when interest rates fall and vice versa. ● The Fund’s exposure to high yield securities may subject the Fund to greater volatility. ● The Fund may invest in bank loans and asset-backed securities, including mortgage backed, which involve special types of risks. ● The Fund may invest in restricted securities which may involve financial and liquidity risk. ● You may have a gain or loss when you sell your shares. ● It is important to note that the Fund is not guaranteed by the U.S. government. ● Please read the prospectus for more detailed information regarding these and other risks.
World Equity Income Fund may not be suitable for all investors. ● Investments in securities in general are subject to market risks that may cause their prices to fluctuate over time. ● The Fund’s investments in foreign securities carry additional risks when compared to U.S. securities, due to the impact of diplomatic, political or economic developments in the country in question (investments in emerging markets are generally subject to an even greater level of risk). Additionally, the Fund’s exposure to foreign currencies subjects the Fund to the risk that those currencies will decline in value relative to the U.S. Dollar. ● The Fund’s investments in derivatives may pose risks in addition to those associated with investing directly in securities or other investments, including illiquidity of the derivatives, imperfect correlations with underlying investments or the Fund’s other portfolio holdings, lack of availability and counterparty risk. ● The Fund’s use of leverage, through instruments such as derivatives, may cause the Fund to be more volatile than if it had not been leveraged. ● The Fund’s investments in other investment vehicles subject the Fund to those risks and expenses affecting the investment vehicle. ● The Fund may have significant exposure to securities in a particular capitalization range e.g., large-, mid- or small-cap securities. As a result, the Fund may be subject to the risk that the pre-denominate capitalization range may underperform other segments of the equity market or the equity market as a whole. ● Please read the prospectus for more detailed information regarding these and other risks.
4 | THE GUGGENHEIM FUNDS SEMI-ANNUAL REPORT | |
ECONOMIC AND MARKET OVERVIEW (Unaudited) | March 31, 2021 |
For the six-month period ended March 31, 2021, the Standard & Poor’s 500® (“S&P 500®”) Index returned 19.07% as the equity market continued to climb after the sharp selloff following the outbreak of COVID-19 in March 2020. This increase was in spite of ongoing personal and economic hardships imposed by COVID-19, highlighting the crucial role of policy support in the form of monetary and fiscal stimulus, which has succeeded in averting a lengthy recession in the U.S. These policy initiatives, particularly on the monetary side, increased market liquidity and lowered borrowing rates, reassuring equity investors that the Federal Reserve (the “Fed”) would do everything in its power to maintain market stability.
Our 2021 U.S. economic growth forecast increased during the first quarter of 2021 from an annualized 5.5% to over 7%, factoring in more fiscal stimulus than previously anticipated. This forecast captures the effect of stimulus representing roughly 11% of 2020–2021 gross domestic product (“GDP”), versus the previous calculation of about 8%. We see strength in the consumer sector and in housing activity. In addition, U.S. vaccinations for COVID-19 continue to accelerate, nearing 3 million doses per day by the end of the first quarter. More than 213 million doses have been administered in the U.S. so far, and about 35% of the U.S. population has been fully vaccinated. The U.S. is seeing the best-case scenario unfold in its vaccine rollout, but other countries have not been as fortunate.
Europe’s vaccine rollout hit a major speedbump during the first quarter when questions surrounding the safety of the AstraZeneca vaccine led several major European countries to temporarily suspend distribution. Safety concerns, coupled with supply constraints, meant that less than 10% of the populations of Germany, France, and Italy had been vaccinated by the end of the first quarter, well under the pace needed to reach 70% inoculated by summer. Any delay in ending the pandemic on a global scale has implications for other countries too, including the U.S., where travel and hospitality workers represent a large share of the unemployed.
Despite vaccination delays in Europe and its implications abroad, we saw meaningful improvement in the domestic labor market during the first quarter as states moved forward with business re-openings. Seasonally adjusted initial jobless claims fell by 97,000 to 684,000 in the week ending March 20, 2021, the lowest level since the pandemic began, before seeing an uptick the following week to 719,000. We saw more positive news across the board in the March payroll report with 916,000 jobs added, and with 156,000 more from revisions. Standing in the way of additional labor market gains are local government restrictions on certain sectors, although easing of these restrictions is expected by summer.
Economic developments drove a sharp increase in U.S. Treasury yields. The market pulled forward expectations of the next Fed rate hike from December 2023 to December 2022, while repricing the long-run terminal Fed funds rate estimate to 2.25% from just 0.55% last August. We do not expect the Fed to raise interest rates as early as the market is anticipating, even though we expect strong GDP growth in coming years.
Year-over-year inflation measures will rise over the next several months due to base effects, which may be compounded by supply chain disruptions in the goods sector and potential capacity constraints for certain services. However, these factors could prove to be short-lived, with base effects set to dampen inflation starting in the summer months. Moreover, the Fed is focused on generating sustainably higher inflation. Even if core inflation rises above the Fed’s 2% target in 2021, the Fed’s focus is on a long-term average of 2%. With years of shortfalls to make up, and the Fed now targeting labor market disparities as part of an expanded definition of full employment, we expect policymakers to remain resolutely patient. Any tapering of asset purchases will likely be deferred until later in 2022, with the first rate hike likely to come sometime after that.
Easy financial conditions and low rates will likely support credit over the next few years. With market optimism pulling forward rate hike expectations and causing bond yields to rise, we view this as an opportunity to add incremental yield to portfolios.
For the six-month period ended March 31, 2021, the S&P 500® Index* returned, as noted, 19.07%. The MSCI Europe-Australasia-Far East (“EAFE”) Index* returned 20.08%. The return of the MSCI Emerging Markets Index* was 22.43%.
In the bond market, the Bloomberg Barclays U.S. Aggregate Bond Index* posted a -2.73% return for the six-month period, while the Bloomberg Barclays U.S. Corporate High Yield Index* returned 7.36%. The return of the ICE Bank of America (“BofA”) Merrill Lynch 3-Month U.S. Treasury Bill Index* was 0.06% for the six-month period.
The opinions and forecasts expressed may not actually come to pass. This information is subject to change at any time, based on market and other conditions, and should not be construed as a recommendation of any specific security or strategy.
| | THE GUGGENHEIM FUNDS SEMI-ANNUAL REPORT | 5 |
ECONOMIC AND MARKET OVERVIEW (Unaudited)(concluded) | March 31, 2021 |
*Index Definitions:
The following indices are referenced throughout this report. Indices are unmanaged and not available for direct investment. Index performance does not reflect transaction costs, fees, or expenses.
Bloomberg Barclays U.S. Aggregate Bond Index is a broad-based flagship benchmark that measures the investment grade, U.S. dollar-denominated, fixed-rate taxable bond market, including U.S. Treasuries, government-related and corporate securities, mortgage-backed securities or “MBS” (agency fixed-rate and hybrid adjustable-rate mortgage, or “ARM”, pass-throughs), asset-backed securities (“ABS”), and commercial mortgage-backed securities (“CMBS”) (agency and non-agency).
Bloomberg Barclays U.S. Corporate High Yield Index measures the U.S. dollar-denominated, high yield, fixed-rate corporate bond market. Securities are classified as high yield if the middle rating of Moody’s, Fitch, and S&P is Ba1/BB +/BB + or below.
Bloomberg Barclays 1-3 Month U.S. Treasury Bill Index includes all publicly issued zero-coupon U.S. Treasury Bills that have a remaining maturity of less than 3 months and more than 1 month, are rated investment grade, and have $250 million or more of outstanding face value. In addition, the securities must be denominated in U.S. dollars and must be fixed rate and nonconvertible. The 1-3 Month U.S. Treasury Bill Index is market capitalization weighted and the securities in the index are updated on the last business day of each month.
FTSE NAREIT Equity REITs Total Return Index (“FNRE”) is one of the FTSE NAREIT U.S. Real Estate Index Series that contains all Equity REITs not designated as Timber REITs or Infrastructure REITs. FTSE NAREIT U.S. Real Estate Index Series is designed to present investors with a comprehensive family of REIT performance indexes that spans the commercial real estate space across the U.S. economy. The index series provides investors with exposure to all investment and property sectors. In addition, the more narrowly focused property sector and sub-sector indexes provide the facility to concentrate commercial real estate exposure in more selected markets. The National Association of Real Estate Investment Trusts (NAREIT) is the trade association for REITs and publicly traded real estate companies with an interest in the U.S. property and investment markets.
ICE BofA Merrill Lynch 3-Month U.S. Treasury Bill Index is an unmanaged market Index of U.S. Treasury securities maturing in 90 days that assumes reinvestment of all income.
Morningstar Long/Short Equity Category Average is the average return of funds Morningstar places in a given category based on their portfolio statistics and compositions over the past three years. Long-short portfolios hold sizeable stakes in both long and short positions in equities, exchange traded funds, and related derivatives. Some funds that fall into this category will shift their exposure to long and short positions depending on their macro outlook or the opportunities they uncover through bottom-up research. At least 75% of the assets are in equity securities or derivatives, and funds in the category will typically have beta values to relevant benchmarks of between 0.3 and 0.8 over a three-year period.
MSCI EAFE Index is a free float-adjusted market capitalization index that is designed to measure the equity market performance of developed markets, excluding the U.S. & Canada.
MSCI Emerging Markets Index is a free float-adjusted market capitalization weighted index that is designed to measure equity market performance in the global emerging markets.
MSCI World Index (Net) is calculated with net dividends reinvested. It is a free float-adjusted market capitalization weighted index that is designed to measure the equity market performance of developed markets.
Russell 1000® Value Index is a measure of the performance for the large-cap value segment of the U.S. equity universe. It includes those Russell 1000 companies with lower price-to-book ratios and lower expected growth values.
Russell 2000® Value Index measures the performance of the small-cap value segment of the U.S. equity universe. It includes those Russell 2000 companies with lower price-to-book ratios and lower forecasted growth values.
Russell 3000® Index measures the performance of the largest 3,000 U.S. companies, representing approximately 98% of the investable U.S. equity market.
Russell Midcap Growth® Index measures the performance of the mid-cap growth segment of the U.S. equity universe. It includes those Russell Midcap Index companies with higher price-to-book ratios and higher forecasted growth values.
S&P 500® is a broad-based index, the performance of which is based on the performance of 500 widely held common stocks chosen for market size, liquidity, and industry group representation.
6 | THE GUGGENHEIM FUNDS SEMI-ANNUAL REPORT | |
ABOUT SHAREHOLDERS’ FUND EXPENSES (Unaudited) | |
All mutual funds have operating expenses, and it is important for our shareholders to understand the impact of costs on their investments. Shareholders of a fund incur two types of costs: (i) transaction costs, including sales charges (loads) on purchase payments, reinvested dividends, other distributions, and exchange fees, and (ii) ongoing costs, including management fees, administrative services, and shareholder reports, among others. These ongoing costs, or operating expenses, are deducted from a fund’s gross income and reduce the investment return of the fund.
A fund’s expenses are expressed as a percentage of its average net assets, which is known as the expense ratio. The following examples are intended to help investors understand the ongoing costs (in dollars) of investing in a fund and to compare these costs with the ongoing costs of investing in other mutual funds.
The examples are based on an investment of $1,000 made at the beginning of the period and held for the entire six-month period beginning September 30, 2020 and ending March 31, 2021.
The following tables illustrate the Funds’ costs in two ways:
Table 1. Based on actual Fund return: This section helps investors estimate the actual expenses paid over the period. The “Ending Account Value” shown is derived from the Fund’s actual return, and the fifth column shows the dollar amount that would have been paid by an investor who started with $1,000 in the Fund. Investors may use the information here, together with the amount invested, to estimate the expenses paid over the period. Simply divide the Fund’s account value by $1,000 (for example, an $8,600 account value divided by $1,000 = 8.6), then multiply the result by the number provided under the heading “Expenses Paid During Period.”
Table 2. Based on hypothetical 5% return: This section is intended to help investors compare a fund’s cost with those of other mutual funds. The table provides information about hypothetical account values and hypothetical expenses based on the Fund’s actual expense ratio and an assumed rate of return of 5% per year before expenses, which is not the Fund’s actual return. The hypothetical account values and expenses may not be used to estimate the actual ending account balance or expenses paid during the period. The example is useful in making comparisons because the U.S. Securities and Exchange Commission (the “SEC”) requires all mutual funds to calculate expenses based on the 5% return. Investors can assess a fund’s costs by comparing this hypothetical example with the hypothetical examples that appear in shareholder reports of other funds.
The calculations illustrated above assume no shares were bought or sold during the period. Actual costs may have been higher or lower, depending on the amount of investment and the timing of any purchases or redemptions.
Please note that the expenses shown in the table are meant to highlight your ongoing costs only and do not reflect any transactional costs, such as sales charges (loads) on purchase payments, and contingent deferred sales charges (“CDSC”) on redemptions, if any. Therefore, the second table is useful in comparing ongoing costs only, and will not help you determine the relative total costs of owning different funds. In addition, if these transactional costs were included, your costs would have been higher.
More information about the Funds’ expenses, including annual expense ratios for periods up to five years (subject to the Fund’s inception date), can be found in the Financial Highlights section of this report. For additional information on operating expenses and other shareholder costs, please refer to the appropriate Fund prospectus.
| | THE GUGGENHEIM FUNDS SEMI-ANNUAL REPORT | 7 |
ABOUT SHAREHOLDERS’ FUND EXPENSES (Unaudited)(continued) | |
| Expense
Ratio1 | Fund
Return | Beginning
Account Value
September 30, 2020 | Ending
Account Value
March 31, 2021 | Expenses
Paid During
Period2 |
Table 1. Based on actual Fund return3 | | | | | |
Alpha Opportunity Fund | | | | | |
A-Class | 1.76% | 12.54% | $ 1,000.00 | $ 1,125.40 | $ 9.33 |
C-Class | 2.51% | 12.14% | 1,000.00 | 1,121.40 | 13.28 |
P-Class | 1.76% | 12.57% | 1,000.00 | 1,125.70 | 9.33 |
Institutional Class | 1.49% | 12.68% | 1,000.00 | 1,126.80 | 7.90 |
Large Cap Value Fund | | | | | |
A-Class | 1.15% | 35.54% | 1,000.00 | 1,355.40 | 6.75 |
C-Class | 1.90% | 35.03% | 1,000.00 | 1,350.30 | 11.13 |
P-Class | 1.15% | 35.53% | 1,000.00 | 1,355.30 | 6.75 |
Institutional Class | 0.90% | 35.71% | 1,000.00 | 1,357.10 | 5.29 |
Market Neutral Real Estate Fund | | | | | |
A-Class | 1.64% | (1.39%) | 1,000.00 | 986.10 | 8.12 |
C-Class | 2.39% | (1.74%) | 1,000.00 | 982.60 | 11.81 |
P-Class | 1.64% | (1.43%) | 1,000.00 | 985.70 | 8.12 |
Institutional Class | 1.39% | (1.27%) | 1,000.00 | 987.30 | 6.89 |
Risk Managed Real Estate Fund | | | | | |
A-Class | 1.31% | 17.64% | 1,000.00 | 1,176.40 | 7.11 |
C-Class | 2.12% | 17.17% | 1,000.00 | 1,171.70 | 11.48 |
P-Class | 1.37% | 17.60% | 1,000.00 | 1,176.00 | 7.43 |
Institutional Class | 1.04% | 17.81% | 1,000.00 | 1,178.10 | 5.65 |
Small Cap Value Fund | | | | | |
A-Class | 1.30% | 50.91% | 1,000.00 | 1,509.10 | 8.13 |
C-Class | 2.05% | 50.36% | 1,000.00 | 1,503.60 | 12.80 |
P-Class | 1.30% | 50.89% | 1,000.00 | 1,508.90 | 8.13 |
Institutional Class | 1.05% | 51.04% | 1,000.00 | 1,510.40 | 6.57 |
StylePlus—Large Core Fund | | | | | |
A-Class | 1.19% | 19.60% | 1,000.00 | 1,196.00 | 6.52 |
C-Class | 2.10% | 19.05% | 1,000.00 | 1,190.50 | 11.47 |
P-Class | 1.32% | 19.58% | 1,000.00 | 1,195.80 | 7.23 |
Institutional Class | 1.06% | 19.70% | 1,000.00 | 1,197.00 | 5.81 |
StylePlus—Mid Growth Fund | | | | | |
A-Class | 1.30% | 21.22% | 1,000.00 | 1,212.20 | 7.17 |
C-Class | 2.18% | 20.68% | 1,000.00 | 1,206.80 | 11.99 |
P-Class | 1.39% | 21.17% | 1,000.00 | 1,211.70 | 7.66 |
Institutional Class | 1.10% | 21.35% | 1,000.00 | 1,213.50 | 6.07 |
World Equity Income Fund | | | | | |
A-Class | 1.21% | 24.11% | 1,000.00 | 1,241.10 | 6.76 |
C-Class | 1.96% | 23.58% | 1,000.00 | 1,235.80 | 10.93 |
P-Class | 1.21% | 24.06% | 1,000.00 | 1,240.60 | 6.76 |
Institutional Class | 0.96% | 24.19% | 1,000.00 | 1,241.90 | 5.37 |
8 | THE GUGGENHEIM FUNDS SEMI-ANNUAL REPORT | |
ABOUT SHAREHOLDERS’ FUND EXPENSES (Unaudited)(concluded) | |
| Expense
Ratio1 | Fund
Return | Beginning
Account Value
September 30, 2020 | Ending
Account Value
March 31, 2021 | Expenses
Paid During
Period2 |
Table 2. Based on hypothetical 5% return (before expenses) | | | | |
Alpha Opportunity Fund | | | | | |
A-Class | 1.76% | 5.00% | $ 1,000.00 | $ 1,016.16 | $ 8.85 |
C-Class | 2.51% | 5.00% | 1,000.00 | 1,012.42 | 12.59 |
P-Class | 1.76% | 5.00% | 1,000.00 | 1,016.16 | 8.85 |
Institutional Class | 1.49% | 5.00% | 1,000.00 | 1,017.50 | 7.49 |
Large Cap Value Fund | | | | | |
A-Class | 1.15% | 5.00% | 1,000.00 | 1,019.20 | 5.79 |
C-Class | 1.90% | 5.00% | 1,000.00 | 1,015.46 | 9.55 |
P-Class | 1.15% | 5.00% | 1,000.00 | 1,019.20 | 5.79 |
Institutional Class | 0.90% | 5.00% | 1,000.00 | 1,020.44 | 4.53 |
Market Neutral Real Estate Fund | | | | | |
A-Class | 1.64% | 5.00% | 1,000.00 | 1,016.75 | 8.25 |
C-Class | 2.39% | 5.00% | 1,000.00 | 1,013.01 | 11.99 |
P-Class | 1.64% | 5.00% | 1,000.00 | 1,016.75 | 8.25 |
Institutional Class | 1.39% | 5.00% | 1,000.00 | 1,018.00 | 6.99 |
Risk Managed Real Estate Fund | | | | | |
A-Class | 1.31% | 5.00% | 1,000.00 | 1,018.40 | 6.59 |
C-Class | 2.12% | 5.00% | 1,000.00 | 1,014.36 | 10.65 |
P-Class | 1.37% | 5.00% | 1,000.00 | 1,018.10 | 6.89 |
Institutional Class | 1.04% | 5.00% | 1,000.00 | 1,019.75 | 5.24 |
Small Cap Value Fund | | | | | |
A-Class | 1.30% | 5.00% | 1,000.00 | 1,018.45 | 6.54 |
C-Class | 2.05% | 5.00% | 1,000.00 | 1,014.71 | 10.30 |
P-Class | 1.30% | 5.00% | 1,000.00 | 1,018.45 | 6.54 |
Institutional Class | 1.05% | 5.00% | 1,000.00 | 1,019.70 | 5.29 |
StylePlus—Large Core Fund | | | | | |
A-Class | 1.19% | 5.00% | 1,000.00 | 1,019.00 | 5.99 |
C-Class | 2.10% | 5.00% | 1,000.00 | 1,014.46 | 10.55 |
P-Class | 1.32% | 5.00% | 1,000.00 | 1,018.35 | 6.64 |
Institutional Class | 1.06% | 5.00% | 1,000.00 | 1,019.65 | 5.34 |
StylePlus—Mid Growth Fund | | | | | |
A-Class | 1.30% | 5.00% | 1,000.00 | 1,018.45 | 6.54 |
C-Class | 2.18% | 5.00% | 1,000.00 | 1,014.06 | 10.95 |
P-Class | 1.39% | 5.00% | 1,000.00 | 1,018.00 | 6.99 |
Institutional Class | 1.10% | 5.00% | 1,000.00 | 1,019.45 | 5.54 |
World Equity Income Fund | | | | | |
A-Class | 1.21% | 5.00% | 1,000.00 | 1,018.90 | 6.09 |
C-Class | 1.96% | 5.00% | 1,000.00 | 1,015.16 | 9.85 |
P-Class | 1.21% | 5.00% | 1,000.00 | 1,018.90 | 6.09 |
Institutional Class | 0.96% | 5.00% | 1,000.00 | 1,020.14 | 4.84 |
1 | This ratio represents annualized net expenses, which may include short dividend and interest expense. Excluding these expenses, the operating expense ratios for the Risk Managed Real Estate Fund would be 1.22%, 2.03%, 1.29% and 0.95% for the A-Class, C-Class, P-Class and Institutional Class, respectively. Excludes expenses of the underlying funds in which the Funds invest, if any. |
2 | Expenses are equal to the Fund’s annualized expense ratio, net of any applicable fee waivers, multiplied by the average account value over the period, multiplied by 182/365 (to reflect the one-half year period). |
3 | Actual cumulative return at net asset value for the period September 30, 2020 to March 31, 2021. |
| | THE GUGGENHEIM FUNDS SEMI-ANNUAL REPORT | 9 |
PERFORMANCE REPORT AND FUND PROFILE (Unaudited) | March 31, 2021 |
ALPHA OPPORTUNITY FUND
OBJECTIVE: Seeks long-term growth of capital.
Holdings Diversification (Market Exposure as % of Net Assets)

“Holdings Diversification (Market Exposure as % of Net Assets)” excludes any temporary cash investments.
Inception Dates: |
A-Class | July 7, 2003 |
C-Class | July 7, 2003 |
P-Class | May 1, 2015 |
Institutional Class | November 7, 2008 |
Ten Largest Holdings (% of Total Net Assets) |
McKesson Corp. | 1.3% |
International Business Machines Corp. | 1.3% |
SS&C Technologies Holdings, Inc. | 1.3% |
Verizon Communications, Inc. | 1.3% |
Molson Coors Beverage Co. — Class B | 1.3% |
MetLife, Inc. | 1.2% |
General Dynamics Corp. | 1.2% |
Amgen, Inc. | 1.2% |
Cisco Systems, Inc. | 1.1% |
Evergy, Inc. | 1.1% |
Top Ten Total | 12.3% |
| | |
“Ten Largest Holdings” excludes any temporary cash or derivative investments. |
10 | THE GUGGENHEIM FUNDS SEMI-ANNUAL REPORT | |
PERFORMANCE REPORT AND FUND PROFILE (Unaudited)(concluded) | March 31, 2021 |
Average Annual Returns*
Periods Ended March 31, 2021
| 6 Month† | 1 Year | 5 Year | 10 Year |
A-Class Shares | 12.54% | 18.58% | 1.32% | 5.25% |
A-Class Shares with sales charge‡ | 7.21% | 12.94% | 0.34% | 4.74% |
C-Class Shares | 12.14% | 17.74% | 0.53% | 4.45% |
C-Class Shares with CDSC§ | 11.14% | 16.74% | 0.53% | 4.45% |
Institutional Class Shares | 12.68% | 18.96% | 1.77% | 5.68% |
ICE BofA Merrill Lynch 3-Month U.S. Treasury Bill Index | 0.06% | 0.12% | 1.19% | 0.63% |
S&P 500 Index | 19.07% | 56.35% | 16.29% | 13.91% |
S&P 500 Index Blended** | 0.06% | 0.12% | 4.46% | 7.96% |
Morningstar Long/Short Equity Category Average | 12.72% | 24.72% | 4.90% | 4.17% |
| 6 Month† | 1 Year | 5 Year | Since
Inception
(05/01/15) |
P-Class Shares | 12.57% | 18.69% | 1.40% | 1.50% |
ICE BofA Merrill Lynch 3-Month U.S. Treasury Bill Index | 0.06% | 0.12% | 1.19% | 1.02% |
S&P 500 Index | 19.07% | 56.35% | 16.29% | 13.55% |
S&P 500 Index Blended** | 0.06% | 0.12% | 4.46% | 3.71% |
Morningstar Long/Short Equity Category Average | 12.72% | 24.72% | 4.90% | 3.15% |
* | The performance data above represents past performance that is not predictive of future results. The investment return and principal value of an investment in the Fund will fluctuate so that an investor’s shares, when redeemed, may be worth more or less than their original cost. Returns are historical and include changes in principal and reinvested dividends and capital gains and do not reflect the effect of taxes. The ICE BofA Merrill Lynch 3-Month U.S. Treasury Bill Index, S&P 500 Index, and the Morningstar Long/Short Equity Category Average are unmanaged indices and, unlike the Fund, have no management fees or operating expenses to reduce their reported return. |
** | Effective March 13, 2017, the Fund changed its principal investment strategy. As a result of the investment strategy change, the Fund’s new benchmark is the ICE BofA Merrill Lynch 3-Month U.S. Treasury Bill Index. The Fund’s performance was previously compared to the S&P 500 Index. The S&P 500 Index-Blended uses performance data for the S&P 500 Index from 03/31/11 to 03/12/17, and the ICE BofA Merrill Lynch 3-Month U.S. Treasury Bill index from 03/13/17 to 03/31/21. |
† | 6 month returns are not annualized. |
‡ | Fund returns are calculated using the maximum sales charge of 4.75%. |
§ | Fund returns include a CDSC of 1% if redeemed within 12 months of purchase. |
| | THE GUGGENHEIM FUNDS SEMI-ANNUAL REPORT | 11 |
SCHEDULE OF INVESTMENTS (Unaudited) | March 31, 2021 |
ALPHA OPPORTUNITY FUND | |
| | Shares | | | Value | |
COMMON STOCKS† - 104.3% |
| | | | | | | | | |
Consumer, Non-cyclical - 34.4% |
McKesson Corp.1 | | | 2,433 | | | $ | 474,532 | |
Molson Coors Beverage Co. — Class B*,1 | | | 9,061 | | | | 463,470 | |
Amgen, Inc.1 | | | 1,684 | | | | 418,996 | |
J M Smucker Co.1 | | | 3,179 | | | | 402,239 | |
Merck & Company, Inc. | | | 5,183 | | | | 399,558 | |
Bristol-Myers Squibb Co.1 | | | 6,324 | | | | 399,234 | |
General Mills, Inc.1 | | | 6,415 | | | | 393,368 | |
Altria Group, Inc.1 | | | 7,573 | | | | 387,435 | |
Philip Morris International, Inc.1 | | | 4,211 | | | | 373,684 | |
Johnson & Johnson1 | | | 2,264 | | | | 372,088 | |
Colgate-Palmolive Co.1 | | | 4,718 | | | | 371,920 | |
Cardinal Health, Inc.1 | | | 5,998 | | | | 364,379 | |
Campbell Soup Co. | | | 7,062 | | | | 355,007 | |
Humana, Inc. | | | 833 | | | | 349,235 | |
Conagra Brands, Inc. | | | 8,825 | | | | 331,820 | |
Procter & Gamble Co.1 | | | 2,318 | | | | 313,927 | |
Kraft Heinz Co. | | | 7,809 | | | | 312,360 | |
United Rentals, Inc.*,1 | | | 944 | | | | 310,869 | |
Kellogg Co. | | | 4,654 | | | | 294,598 | |
Kimberly-Clark Corp.1 | | | 2,004 | | | | 278,656 | |
Gilead Sciences, Inc. | | | 4,103 | | | | 265,177 | |
United Therapeutics Corp.* | | | 1,522 | | | | 254,585 | |
Pfizer, Inc.1 | | | 6,483 | | | | 234,879 | |
Tyson Foods, Inc. — Class A | | | 2,878 | | | | 213,835 | |
Quanta Services, Inc. | | | 2,335 | | | | 205,433 | |
DaVita, Inc.* | | | 1,842 | | | | 198,513 | |
Ingredion, Inc. | | | 2,078 | | | | 186,854 | |
John B Sanfilippo & Son, Inc. | | | 2,051 | | | | 185,349 | |
Quest Diagnostics, Inc. | | | 1,420 | | | | 182,243 | |
Regeneron Pharmaceuticals, Inc.* | | | 381 | | | | 180,266 | |
Sprouts Farmers Market, Inc.* | | | 6,682 | | | | 177,875 | |
Kroger Co. | | | 4,934 | | | | 177,575 | |
Cigna Corp.1 | | | 728 | | | | 175,987 | |
H&R Block, Inc.1 | | | 7,823 | | | | 170,542 | |
Post Holdings, Inc.* | | | 1,491 | | | | 157,628 | |
Laboratory Corporation of America Holdings* | | | 577 | | | | 147,152 | |
Incyte Corp.* | | | 1,765 | | | | 143,442 | |
Coca-Cola Co. | | | 2,689 | | | | 141,737 | |
Hologic, Inc.* | | | 1,856 | | | | 138,049 | |
CVS Health Corp. | | | 1,758 | | | | 132,254 | |
Vector Group Ltd. | | | 9,136 | | | | 127,447 | |
Hill-Rom Holdings, Inc.1 | | | 1,056 | | | | 116,667 | |
Ionis Pharmaceuticals, Inc.*,1 | | | 2,578 | | | | 115,907 | |
Becton Dickinson and Co. | | | 465 | | | | 113,065 | |
Innoviva, Inc.* | | | 8,859 | | | | 105,865 | |
Prestige Consumer Healthcare, Inc.* | | | 2,278 | | | | 100,414 | |
Hershey Co. | | | 593 | | | | 93,789 | |
Perrigo Company plc | | | 2,247 | | | | 90,936 | |
Abbott Laboratories | | | 749 | | | | 89,760 | |
Medtronic plc1 | | | 755 | | | | 89,188 | |
Constellation Brands, Inc. — Class A1 | | | 391 | | | | 89,148 | |
Encompass Health Corp. | | | 1,079 | | | | 88,370 | |
USANA Health Sciences, Inc.* | | | 894 | | | | 87,254 | |
Boston Scientific Corp.* | | | 2,247 | | | | 86,847 | |
FleetCor Technologies, Inc.* | | | 310 | | | | 83,275 | |
Total Consumer, Non-cyclical | | | | | | | 12,514,682 | |
| | | | | | | | | |
Industrial - 17.9% |
General Dynamics Corp. | | | 2,382 | | | | 432,476 | |
Parker-Hannifin Corp. | | | 1,029 | | | | 324,577 | |
Lockheed Martin Corp. | | | 816 | | | | 301,512 | |
3M Co. | | | 1,535 | | | | 295,764 | |
Vishay Intertechnology, Inc. | | | 12,159 | | | | 292,789 | |
Acuity Brands, Inc. | | | 1,542 | | | | 254,430 | |
Oshkosh Corp. | | | 1,920 | | | | 227,827 | |
Arrow Electronics, Inc.*,1 | | | 1,967 | | | | 217,983 | |
Owens Corning | | | 2,362 | | | | 217,516 | |
Union Pacific Corp. | | | 911 | | | | 200,794 | |
Masco Corp.1 | | | 3,344 | | | | 200,306 | |
Trane Technologies plc1 | | | 1,191 | | | | 197,182 | |
CSX Corp. | | | 1,977 | | | | 190,622 | |
Fortive Corp. | | | 2,615 | | | | 184,724 | |
AGCO Corp.1 | | | 1,245 | | | | 178,844 | |
Snap-on, Inc.1 | | | 755 | | | | 174,208 | |
Northrop Grumman Corp. | | | 536 | | | | 173,471 | |
Caterpillar, Inc.1 | | | 745 | | | | 172,743 | |
Timken Co. | | | 2,085 | | | | 169,239 | |
Agilent Technologies, Inc. | | | 1,329 | | | | 168,969 | |
Hubbell, Inc.1 | | | 833 | | | | 155,679 | |
Norfolk Southern Corp. | | | 546 | | | | 146,612 | |
Energizer Holdings, Inc. | | | 2,973 | | | | 141,099 | |
Westinghouse Air Brake Technologies Corp. | | | 1,704 | | | | 134,889 | |
Hillenbrand, Inc. | | | 2,642 | | | | 126,050 | |
Lincoln Electric Holdings, Inc.1 | | | 988 | | | | 121,465 | |
Eaton Corporation plc1 | | | 870 | | | | 120,304 | |
Sanmina Corp.* | | | 2,882 | | | | 119,257 | |
Lennox International, Inc. | | | 374 | | | | 116,535 | |
Waters Corp.*,1 | | | 408 | | | | 115,941 | |
AECOM* | | | 1,626 | | | | 104,243 | |
O-I Glass, Inc.* | | | 7,070 | | | | 104,212 | |
Mettler-Toledo International, Inc.* | | | 87 | | | | 100,545 | |
Berry Global Group, Inc.*,1 | | | 1,481 | | | | 90,933 | |
TE Connectivity Ltd. | | | 695 | | | | 89,732 | |
Westrock Co.1 | | | 1,704 | | | | 88,693 | |
Donaldson Company, Inc. | | | 1,495 | | | | 86,949 | |
Total Industrial | | | | | | | 6,539,114 | |
| | | | | | | | | |
Utilities - 13.8% |
Evergy, Inc. | | | 6,928 | | | | 412,424 | |
PPL Corp.1 | | | 14,151 | | | | 408,115 | |
Public Service Enterprise Group, Inc.1 | | | 6,722 | | | | 404,732 | |
Southern Co. | | | 6,027 | | | | 374,638 | |
UGI Corp. | | | 8,602 | | | | 352,768 | |
Duke Energy Corp. | | | 3,381 | | | | 326,368 | |
Exelon Corp.1 | | | 7,283 | | | | 318,558 | |
IDACORP, Inc. | | | 3,155 | | | | 315,405 | |
Consolidated Edison, Inc. | | | 3,941 | | | | 294,787 | |
ONE Gas, Inc. | | | 3,715 | | | | 285,721 | |
NiSource, Inc. | | | 11,214 | | | | 270,370 | |
OGE Energy Corp.1 | | | 8,329 | | | | 269,526 | |
12 | THE GUGGENHEIM FUNDS SEMI-ANNUAL REPORT | SEE NOTES TO FINANCIAL STATEMENTS. |
SCHEDULE OF INVESTMENTS (Unaudited)(continued) | March 31, 2021 |
ALPHA OPPORTUNITY FUND | |
| | Shares | | | Value | |
Southwest Gas Holdings, Inc. | | | 3,192 | | | $ | 219,322 | |
Pinnacle West Capital Corp. | | | 2,585 | | | | 210,290 | |
CenterPoint Energy, Inc. | | | 8,130 | | | | 184,145 | |
DTE Energy Co. | | | 1,360 | | | | 181,070 | |
Sempra Energy | | | 742 | | | | 98,374 | |
AES Corp. | | | 3,253 | | | | 87,213 | |
Total Utilities | | | | | | | 5,013,826 | |
| | | | | | | | | |
Technology - 12.3% |
International Business Machines Corp.1 | | | 3,547 | | | | 472,673 | |
SS&C Technologies Holdings, Inc.1 | | | 6,685 | | | | 467,081 | |
Cerner Corp. | | | 4,313 | | | | 310,018 | |
Seagate Technology plc | | | 4,026 | | | | 308,995 | |
Dell Technologies, Inc. — Class C* | | | 2,666 | | | | 235,008 | |
CDK Global, Inc.1 | | | 4,178 | | | | 225,863 | |
HP, Inc. | | | 6,112 | | | | 194,056 | |
Kulicke & Soffa Industries, Inc. | | | 3,584 | | | | 176,010 | |
Intel Corp.1 | | | 2,733 | | | | 174,912 | |
Dropbox, Inc. — Class A* | | | 5,933 | | | | 158,174 | |
NetApp, Inc. | | | 2,051 | | | | 149,046 | |
Qorvo, Inc.* | | | 708 | | | | 129,351 | |
Bandwidth, Inc. — Class A* | | | 982 | | | | 124,459 | |
Cirrus Logic, Inc.* | | | 1,454 | | | | 123,285 | |
Texas Instruments, Inc. | | | 637 | | | | 120,387 | |
VMware, Inc. — Class A* | | | 789 | | | | 118,705 | |
Cognizant Technology Solutions Corp. — Class A | | | 1,505 | | | | 117,571 | |
Oracle Corp.1 | | | 1,589 | | | | 111,500 | |
KLA Corp. | | | 317 | | | | 104,737 | |
Skyworks Solutions, Inc. | | | 526 | | | | 96,510 | |
Accenture plc — Class A | | | 347 | | | | 95,859 | |
Microchip Technology, Inc.1 | | | 617 | | | | 95,771 | |
CSG Systems International, Inc. | | | 2,082 | | | | 93,461 | |
Fiserv, Inc.* | | | 782 | | | | 93,089 | |
Paychex, Inc.1 | | | 941 | | | | 92,237 | |
Western Digital Corp. | | | 1,295 | | | | 86,441 | |
Total Technology | | | | | | | 4,475,199 | |
| | | | | | | | | |
Consumer, Cyclical - 9.4% |
Gentex Corp.1 | | | 8,170 | | | | 291,424 | |
Allison Transmission Holdings, Inc.1 | | | 6,911 | | | | 282,176 | |
AutoZone, Inc.*,1 | | | 195 | | | | 273,838 | |
Genuine Parts Co. | | | 2,328 | | | | 269,094 | |
Gentherm, Inc.* | | | 3,256 | | | | 241,302 | |
Best Buy Company, Inc.1 | | | 2,095 | | | | 240,527 | |
AutoNation, Inc.*,1 | | | 2,497 | | | | 232,770 | |
Lowe’s Companies, Inc. | | | 1,009 | | | | 191,892 | |
MSC Industrial Direct Company, Inc. — Class A | | | 2,116 | | | | 190,842 | |
Lear Corp. | | | 1,052 | | | | 190,675 | |
Cummins, Inc. | | | 715 | | | | 185,264 | |
Lennar Corp. — Class A | | | 1,572 | | | | 159,134 | |
PACCAR, Inc. | | | 1,707 | | | | 158,614 | |
PulteGroup, Inc. | | | 2,791 | | | | 146,360 | |
Brunswick Corp.1 | | | 1,414 | | | | 134,853 | |
O’Reilly Automotive, Inc.* | | | 263 | | | | 133,407 | |
Dolby Laboratories, Inc. — Class A1 | | | 1,002 | | | | 98,917 | |
Total Consumer, Cyclical | | | | | | | 3,421,089 | |
| | | | | | | | | |
Communications - 9.1% |
Verizon Communications, Inc.1 | | | 8,006 | | | | 465,549 | |
Cisco Systems, Inc.1 | | | 8,012 | | | | 414,300 | |
Viavi Solutions, Inc.* | | | 20,698 | | | | 324,958 | |
Juniper Networks, Inc.1 | | | 10,290 | | | | 260,646 | |
T-Mobile US, Inc.* | | | 1,761 | | | | 220,636 | |
VeriSign, Inc.* | | | 1,049 | | | | 208,499 | |
Ciena Corp.* | | | 3,651 | | | | 199,783 | |
Charter Communications, Inc. — Class A* | | | 307 | | | | 189,425 | |
Cogent Communications Holdings, Inc. | | | 2,494 | | | | 171,488 | |
Sirius XM Holdings, Inc. | | | 24,866 | | | | 151,434 | |
Omnicom Group, Inc.1 | | | 1,957 | | | | 145,112 | |
Motorola Solutions, Inc. | | | 735 | | | | 138,217 | |
InterDigital, Inc. | | | 2,028 | | | | 128,676 | |
AT&T, Inc.1 | | | 3,955 | | | | 119,718 | |
Vonage Holdings Corp.* | | | 10,000 | | | | 118,200 | |
Facebook, Inc. — Class A* | | | 144 | | | | 42,412 | |
Discovery, Inc. — Class A* | | | 644 | | | | 27,988 | |
Total Communications | | | | | | | 3,327,041 | |
| | | | | | | | | |
Financial - 7.2% |
MetLife, Inc.1 | | | 7,448 | | | | 452,764 | |
Allstate Corp.1 | | | 2,774 | | | | 318,733 | |
Highwoods Properties, Inc. REIT | | | 7,259 | | | | 311,701 | |
Prudential Financial, Inc. | | | 2,669 | | | | 243,146 | |
Travelers Companies, Inc. | | | 1,522 | | | | 228,909 | |
Berkshire Hathaway, Inc. — Class B*,1 | | | 884 | | | | 225,835 | |
Brandywine Realty Trust REIT1 | | | 14,036 | | | | 181,205 | |
Aflac, Inc.1 | | | 3,398 | | | | 173,910 | |
Hartford Financial Services Group, Inc. | | | 2,369 | | | | 158,225 | |
Synchrony Financial | | | 3,233 | | | | 131,454 | |
Western Union Co.1 | | | 4,009 | | | | 98,862 | |
Sabra Health Care REIT, Inc. | | | 5,042 | | | | 87,529 | |
Total Financial | | | | | | | 2,612,273 | |
| | | | | | | | | |
Basic Materials - 0.2% |
International Paper Co. | | | 1,606 | | | | 86,837 | |
| | | | | | | | | |
Total Common Stocks | | | | |
(Cost $33,155,236) | | | | | | | 37,990,061 | |
| | | | | | | | | |
MONEY MARKET FUND† - 4.7% |
Goldman Sachs Financial Square Treasury Instruments Fund — Institutional Shares, 0.01%2 | | | 1,715,994 | | | | 1,715,994 | |
Total Money Market Fund | | | | |
(Cost $1,715,994) | | | | | | | 1,715,994 | |
| | | | | | | | | |
Total Investments - 109.0% | | | | |
(Cost $34,871,230) | | $ | 39,706,055 | |
Other Assets & Liabilities, net - (9.0)% | | | (3,279,105 | ) |
Total Net Assets - 100.0% | | $ | 36,426,950 | |
SEE NOTES TO FINANCIAL STATEMENTS. | THE GUGGENHEIM FUNDS SEMI-ANNUAL REPORT | 13 |
SCHEDULE OF INVESTMENTS (Unaudited)(continued) | March 31, 2021 |
ALPHA OPPORTUNITY FUND | |
Custom Basket Swap Agreements |
Counterparty | Reference Obligation | Financing Rate
Pay (Receive) | Payment
Frequency | | Maturity
Date | | | Notional
Amount | | | Value and
Unrealized
Appreciation
(Depreciation) | |
OTC Custom Basket Swap Agreements†† |
Morgan Stanley Capital Services LLC | MS Equity Custom Basket | 0.47% (Federal Funds Rate + 0.40%) | At Maturity | | | 02/01/24 | | | $ | 3,235,092 | | | $ | 340,231 | |
Goldman Sachs International | GS Equity Custom Basket | 0.52% (Federal Funds Rate + 0.45%) | At Maturity | | | 05/06/24 | | | | 3,235,098 | | | | 339,251 | |
| | | | | | | | | | $ | 6,470,190 | | | $ | 679,482 | |
OTC Custom Basket Swap Agreements Sold Short†† |
Goldman Sachs International | GS Equity Custom Basket | (0.13)% (Federal Funds Rate - 0.20%) | At Maturity | | | 05/06/24 | | | $ | 13,320,112 | | | $ | (1,561,868 | ) |
Morgan Stanley Capital Services LLC | MS Equity Custom Basket | (0.23)% (Federal Funds Rate - 0.30%) | At Maturity | | | 02/01/24 | | | | 13,214,069 | | | | (1,591,166 | ) |
| | | | | | | | | | $ | 26,534,181 | | | $ | (3,153,034 | ) |
| | Shares | | | Percentage
Notional
Amount | | |
Value and
Unrealized
Appreciation
(Depreciation)
| |
MS EQUITY LONG CUSTOM BASKET | | | | | | | | |
Industrial | | | | | | | | | | | | |
Snap-on, Inc. | | | 63 | | | | 0.47 | % | | $ | 6,863 | |
AGCO Corp. | | | 103 | | | | 0.46 | % | | | 6,508 | |
Acuity Brands, Inc. | | | 128 | | | | 0.65 | % | | | 6,144 | |
Oshkosh Corp. | | | 160 | | | | 0.59 | % | | | 4,433 | |
Owens Corning | | | 196 | | | | 0.56 | % | | | 4,419 | |
Caterpillar, Inc. | | | 62 | | | | 0.44 | % | | | 4,305 | |
Vishay Intertechnology, Inc. | | | 1,013 | | | | 0.75 | % | | | 3,958 | |
General Dynamics Corp. | | | 198 | | | | 1.11 | % | | | 3,730 | |
TE Connectivity Ltd. | | | 57 | | | | 0.23 | % | | | 3,538 | |
Hubbell, Inc. | | | 69 | | | | 0.40 | % | | | 3,480 | |
Arrow Electronics, Inc. | | | 164 | | | | 0.56 | % | | | 3,285 | |
Timken Co. | | | 173 | | | | 0.43 | % | | | 2,572 | |
Lincoln Electric Holdings, Inc. | | | 82 | | | | 0.31 | % | | | 2,288 | |
Waters Corp. | | | 34 | | | | 0.30 | % | | | 2,205 | |
3M Co. | | | 128 | | | | 0.76 | % | | | 1,743 | |
Parker-Hannifin Corp. | | | 85 | | | | 0.83 | % | | | 1,432 | |
Eaton Corporation plc | | | 72 | | | | 0.31 | % | | | 1,368 | |
Trane Technologies plc | | | 99 | | | | 0.51 | % | | | 1,258 | |
Masco Corp. | | | 278 | | | | 0.51 | % | | | 1,187 | |
O-I Glass, Inc. | | | 589 | | | | 0.27 | % | | | 1,112 | |
Energizer Holdings, Inc. | | | 247 | | | | 0.36 | % | | | 1,009 | |
Northrop Grumman Corp. | | | 44 | | | | 0.44 | % | | | 983 | |
Lennox International, Inc. | | | 31 | | | | 0.30 | % | | | 877 | |
Lockheed Martin Corp. | | | 68 | | | | 0.78 | % | | | 859 | |
Westinghouse Air Brake Technologies Corp. | | | 142 | | | | 0.35 | % | | | 737 | |
Agilent Technologies, Inc. | | | 110 | | | | 0.43 | % | | | 715 | |
Mettler-Toledo International, Inc. | | | 7 | | | | 0.25 | % | | | 684 | |
AECOM | | | 135 | | | | 0.27 | % | | | 607 | |
Berry Global Group, Inc. | | | 123 | | | | 0.23 | % | | | 575 | |
CSX Corp. | | | 164 | | | | 0.49 | % | | | 507 | |
Union Pacific Corp. | | | 75 | | | | 0.51 | % | | | 498 | |
Sanmina Corp. | | | 240 | | | | 0.31 | % | | | 429 | |
Norfolk Southern Corp. | | | 45 | | | | 0.37 | % | | | 275 | |
Westrock Co. | | | 142 | | | | 0.23 | % | | | 274 | |
Fortive Corp. | | | 218 | | | | 0.48 | % | | | 141 | |
Donaldson Company, Inc. | | | 124 | | | | 0.22 | % | | | (152 | ) |
Hillenbrand, Inc. | | | 220 | | | | 0.32 | % | | | (533 | ) |
Total Industrial | | | | | | | | | | | 74,313 | |
| | | | | | | | | | | | | |
Consumer, Non-cyclical | | | | | | | | | | | | |
United Rentals, Inc. | | | 79 | | | | 0.79 | % | | | 9,362 | |
Cardinal Health, Inc. | | | 457 | | | | 0.86 | % | | | 8,099 | |
Molson Coors Beverage Co. — Class B | | | 755 | | | | 1.19 | % | | | 7,485 | |
McKesson Corp. | | | 202 | | | | 1.22 | % | | | 7,111 | |
Amgen, Inc. | | | 140 | | | | 1.08 | % | | | 4,719 | |
Altria Group, Inc. | | | 631 | | | | 1.00 | % | | | 4,681 | |
Quanta Services, Inc. | | | 194 | | | | 0.53 | % | | | 4,491 | |
Kraft Heinz Co. | | | 651 | | | | 0.80 | % | | | 4,373 | |
United Therapeutics Corp. | | | 126 | | | | 0.65 | % | | | 3,930 | |
Johnson & Johnson | | | 188 | | | | 0.96 | % | | | 3,506 | |
J M Smucker Co. | | | 265 | | | | 1.04 | % | | | 3,498 | |
Campbell Soup Co. | | | 718 | | | | 1.12 | % | | | 2,640 | |
Philip Morris International, Inc. | | | 351 | | | | 0.96 | % | | | 2,425 | |
Sprouts Farmers Market, Inc. | | | 557 | | | | 0.46 | % | | | 2,336 | |
H&R Block, Inc. | | | 652 | | | | 0.44 | % | | | 2,219 | |
Procter & Gamble Co. | | | 193 | | | | 0.81 | % | | | 2,192 | |
Tyson Foods, Inc. — Class A | | | 239 | | | | 0.55 | % | | | 1,993 | |
Cigna Corp. | | | 60 | | | | 0.45 | % | | | 1,980 | |
Laboratory Corporation of America Holdings | | | 48 | | | | 0.38 | % | | | 1,860 | |
14 | THE GUGGENHEIM FUNDS SEMI-ANNUAL REPORT | SEE NOTES TO FINANCIAL STATEMENTS. |
SCHEDULE OF INVESTMENTS (Unaudited)(continued) | March 31, 2021 |
ALPHA OPPORTUNITY FUND | |
| | Shares | | | Percentage
Notional
Amount | | | Value and
Unrealized
Appreciation
(Depreciation) | |
General Mills, Inc. | | | 534 | | | | 1.01 | % | | $ | 1,757 | |
DaVita, Inc. | | | 153 | | | | 0.51 | % | | | 1,751 | |
Vector Group Ltd. | | | 761 | | | | 0.33 | % | | | 1,703 | |
Colgate-Palmolive Co. | | | 393 | | | | 0.96 | % | | | 1,655 | |
Kellogg Co. | | | 387 | | | | 0.76 | % | | | 1,466 | |
Conagra Brands, Inc. | | | 735 | | | | 0.85 | % | | | 1,398 | |
Hill-Rom Holdings, Inc. | | | 88 | | | | 0.30 | % | | | 1,322 | |
Kroger Co. | | | 411 | | | | 0.46 | % | | | 1,283 | |
Pfizer, Inc. | | | 540 | | | | 0.60 | % | | | 1,244 | |
Post Holdings, Inc. | | �� | 124 | | | | 0.41 | % | | | 1,234 | |
Bristol-Myers Squibb Co. | | | 527 | | | | 1.03 | % | | | 1,101 | |
John B Sanfilippo & Son, Inc. | | | 171 | | | | 0.48 | % | | | 1,008 | |
Humana, Inc. | | | 69 | | | | 0.89 | % | | | 966 | |
USANA Health Sciences, Inc. | | | 74 | | | | 0.22 | % | | | 951 | |
Quest Diagnostics, Inc. | | | 118 | | | | 0.47 | % | | | 903 | |
CVS Health Corp. | | | 146 | | | | 0.34 | % | | | 797 | |
Medtronic plc | | | 63 | | | | 0.23 | % | | | 758 | |
Ingredion, Inc. | | | 173 | | | | 0.48 | % | | | 671 | |
Prestige Consumer Healthcare, Inc. | | | 189 | | | | 0.26 | % | | | 567 | |
Constellation Brands, Inc. — Class A | | | 32 | | | | 0.23 | % | | | 554 | |
Kimberly-Clark Corp. | | | 167 | | | | 0.72 | % | | | 465 | |
Innoviva, Inc. | | | 738 | | | | 0.27 | % | | | 456 | |
Abbott Laboratories | | | 62 | | | | 0.23 | % | | | 443 | |
Coca-Cola Co. | | | 224 | | | | 0.36 | % | | | 346 | |
Hershey Co. | | | 49 | | | | 0.24 | % | | | 330 | |
Hologic, Inc. | | | 154 | | | | 0.35 | % | | | 322 | |
Incyte Corp. | | | 147 | | | | 0.37 | % | | | 252 | |
Merck & Company, Inc. | | | 432 | | | | 1.03 | % | | | 207 | |
Encompass Health Corp. | | | 90 | | | | 0.23 | % | | | 6 | |
Becton Dickinson and Co. | | | 38 | | | | 0.29 | % | | | (9 | ) |
Regeneron Pharmaceuticals, Inc. | | | 31 | | | | 0.45 | % | | | (142 | ) |
Perrigo Company plc | | | 187 | | | | 0.23 | % | | | (175 | ) |
Boston Scientific Corp. | | | 187 | | | | 0.22 | % | | | (243 | ) |
Gilead Sciences, Inc. | | | 342 | | | | 0.68 | % | | | (312 | ) |
FleetCor Technologies, Inc. | | | 25 | | | | 0.21 | % | | | (430 | ) |
Ionis Pharmaceuticals, Inc. | | | 214 | | | | 0.30 | % | | | (1,512 | ) |
Total Consumer, Non-cyclical | | | | | | | | | | | 101,993 | |
| | | | | | | | | | | | | |
Financial | | | | | | | | | | | | |
MetLife, Inc. | | | 621 | | | | 1.17 | % | | | 6,812 | |
Hartford Financial Services Group, Inc. | | | 197 | | | | 0.41 | % | | | 4,032 | |
Allstate Corp. | | | 231 | | | | 0.82 | % | | | 2,842 | |
Travelers Companies, Inc. | | | 126 | | | | 0.59 | % | | | 2,040 | |
Aflac, Inc. | | | 283 | | | | 0.45 | % | | | 1,941 | |
Synchrony Financial | | | 269 | | | | 0.34 | % | | | 1,936 | |
Highwoods Properties, Inc. | | | 605 | | | | 0.80 | % | | | 1,837 | |
Western Union Co. | | | 334 | | | | 0.25 | % | | | 1,652 | |
Berkshire Hathaway, Inc. — Class B | | | 73 | | | | 0.58 | % | | | 1,240 | |
Sabra Health Care REIT, Inc. | | | 420 | | | | 0.23 | % | | | (201 | ) |
Prudential Financial, Inc. | | | 222 | | | | 0.63 | % | | | (256 | ) |
Brandywine Realty Trust | | | 1,170 | | | | 0.47 | % | | | (595 | ) |
Total Financial | | | | | | | | | | | 23,280 | |
| | | | | | | | | | | | | |
Utilities | | | | | | | | | | | | |
Evergy, Inc. | | | 577 | | | | 1.06 | % | | | 3,072 | |
Exelon Corp. | | | 607 | | | | 0.82 | % | | | 2,994 | |
UGI Corp. | | | 717 | | | | 0.91 | % | | | 2,824 | |
Public Service Enterprise Group, Inc. | | | 560 | | | | 1.04 | % | | | 2,467 | |
IDACORP, Inc. | | | 263 | | | | 0.81 | % | | | 2,341 | |
PPL Corp. | | | 1,179 | | | | 1.05 | % | | | 2,122 | |
Southern Co. | | | 502 | | | | 0.96 | % | | | 2,067 | |
NiSource, Inc. | | | 934 | | | | 0.70 | % | | | 1,860 | |
CenterPoint Energy, Inc. | | | 677 | | | | 0.47 | % | | | 1,654 | |
ONE Gas, Inc. | | | 309 | | | | 0.73 | % | | | 1,407 | |
Duke Energy Corp. | | | 281 | | | | 0.84 | % | | | 1,062 | |
DTE Energy Co. | | | 113 | | | | 0.47 | % | | | 979 | |
OGE Energy Corp. | | | 694 | | | | 0.69 | % | | | 786 | |
Pinnacle West Capital Corp. | | | 215 | | | | 0.54 | % | | | 777 | |
Consolidated Edison, Inc. | | | 328 | | | | 0.76 | % | | | 706 | |
Sempra Energy | | | 61 | | | | 0.25 | % | | | 572 | |
Southwest Gas Holdings, Inc. | | | 266 | | | | 0.56 | % | | | (157 | ) |
AES Corp. | | | 271 | | | | 0.22 | % | | | (238 | ) |
Total Utilities | | | | | | | | | | | 27,295 | |
| | | | | | | | | | | | | |
Technology | | | | | | | | | | | | |
Seagate Technology plc | | | 335 | | | | 0.79 | % | | | 6,204 | |
HP, Inc. | | | 509 | | | | 0.50 | % | | | 5,842 | |
Texas Instruments, Inc. | | | 53 | | | | 0.31 | % | | | 4,008 | |
Kulicke & Soffa Industries, Inc. | | | 298 | | | | 0.45 | % | | | 3,970 | |
NetApp, Inc. | | | 171 | | | | 0.38 | % | | | 3,750 | |
CDK Global, Inc. | | | 348 | | | | 0.58 | % | | | 3,347 | |
International Business Machines Corp. | | | 295 | | | | 1.22 | % | | | 3,009 | |
SS&C Technologies Holdings, Inc. | | | 557 | | | | 1.20 | % | | | 2,902 | |
Intel Corp. | | | 227 | | | | 0.45 | % | | | 2,530 | |
KLA Corp. | | | 26 | | | | 0.27 | % | | | 2,490 | |
Dell Technologies, Inc. — Class C | | | 222 | | | | 0.60 | % | | | 2,066 | |
Oracle Corp. | | | 132 | | | | 0.29 | % | | | 1,713 | |
Cirrus Logic, Inc. | | | 121 | | | | 0.32 | % | | | 1,668 | |
Microchip Technology, Inc. | | | 51 | | | | 0.24 | % | | | 1,458 | |
Skyworks Solutions, Inc. | | | 43 | | | | 0.24 | % | | | 1,323 | |
Dropbox, Inc. — Class A | | | 494 | | | | 0.41 | % | | | 984 | |
Cerner Corp. | | | 359 | | | | 0.80 | % | | | 760 | |
Qorvo, Inc. | | | 59 | | | | 0.33 | % | | | 710 | |
SEE NOTES TO FINANCIAL STATEMENTS. | THE GUGGENHEIM FUNDS SEMI-ANNUAL REPORT | 15 |
SCHEDULE OF INVESTMENTS (Unaudited)(continued) | March 31, 2021 |
ALPHA OPPORTUNITY FUND | |
| | Shares | | | Percentage
Notional
Amount | | | Value and
Unrealized
Appreciation
(Depreciation) | |
Accenture plc — Class A | | | 28 | | | | 0.24 | % | | $ | 535 | |
Cognizant Technology Solutions Corp. — Class A | | | 125 | | | | 0.30 | % | | | 397 | |
VMware, Inc. — Class A | | | 65 | | | | 0.30 | % | | | 371 | |
Paychex, Inc. | | | 78 | | | | 0.24 | % | | | 279 | |
Fiserv, Inc. | | | 65 | | | | 0.24 | % | | | 116 | |
Western Digital Corp. | | | 108 | | | | 0.22 | % | | | (337 | ) |
CSG Systems International, Inc. | | | 173 | | | | 0.24 | % | | | (422 | ) |
Bandwidth, Inc. — Class A | | | 81 | | | | 0.32 | % | | | (3,462 | ) |
Total Technology | | | | | | | | | | | 46,211 | |
| | | | | | | | | | | | | |
Communications | | | | | | | | | | | | |
Facebook, Inc. — Class A | | | 189 | | | | 1.72 | % | | | 6,245 | |
Cisco Systems, Inc. | | | 667 | | | | 1.07 | % | | | 5,702 | |
Viavi Solutions, Inc. | | | 1,725 | | | | 0.84 | % | | | 2,622 | |
Ciena Corp. | | | 304 | | | | 0.51 | % | | | 2,555 | |
Discovery, Inc. — Class A | | | 686 | | | | 0.92 | % | | | 2,256 | |
Juniper Networks, Inc. | | | 857 | | | | 0.67 | % | | | 1,985 | |
Cogent Communications Holdings, Inc. | | | 207 | | | | 0.44 | % | | | 1,642 | |
Omnicom Group, Inc. | | | 163 | | | | 0.37 | % | | | 1,577 | |
Verizon Communications, Inc. | | | 579 | | | | 1.04 | % | | | 1,522 | |
Motorola Solutions, Inc. | | | 61 | | | | 0.35 | % | | | 1,280 | |
T-Mobile US, Inc. | | | 146 | | | | 0.57 | % | | | 786 | |
VeriSign, Inc. | | | 87 | | | | 0.53 | % | | | 564 | |
Sirius XM Holdings, Inc. | | | 2,072 | | | | 0.39 | % | | | 448 | |
Charter Communications, Inc. — Class A | | | 25 | | | | 0.48 | % | | | (27 | ) |
InterDigital, Inc. | | | 169 | | | | 0.33 | % | | | (217 | ) |
Vonage Holdings Corp. | | | 833 | | | | 0.30 | % | | | (747 | ) |
AT&T, Inc. | | | 329 | | | | 0.31 | % | | | (2,233 | ) |
Total Communications | | | | | | | | | | | 25,960 | |
| | | | | | | | | | | | | |
Consumer, Cyclical | | | | | | | | | | | | |
Gentherm, Inc. | | | 271 | | | | 0.62 | % | | | 5,930 | |
Lear Corp. | | | 87 | | | | 0.49 | % | | | 3,835 | |
AutoZone, Inc. | | | 16 | | | | 0.69 | % | | | 3,543 | |
AutoNation, Inc. | | | 208 | | | | 0.60 | % | | | 3,391 | |
Gentex Corp. | | | 681 | | | | 0.75 | % | | | 2,726 | |
Cummins, Inc. | | | 59 | | | | 0.47 | % | | | 2,677 | |
Brunswick Corp. | | | 117 | | | | 0.34 | % | | | 2,568 | |
Lennar Corp. — Class A | | | 131 | | | | 0.41 | % | | | 2,398 | |
Genuine Parts Co. | | | 194 | | | | 0.69 | % | | | 2,127 | |
MSC Industrial Direct Company, Inc. — Class A | | | 176 | | | | 0.49 | % | | | 1,991 | |
Lowe’s Companies, Inc. | | | 84 | | | | 0.49 | % | | | 1,940 | |
PACCAR, Inc. | | | 142 | | | | 0.41 | % | | | 1,787 | |
PulteGroup, Inc. | | | 232 | | | | 0.38 | % | | | 1,534 | |
Allison Transmission Holdings, Inc. | | | 576 | | | | 0.73 | % | | | 1,382 | |
Best Buy Company, Inc. | | | 174 | | | | 0.62 | % | | | 1,267 | |
Dolby Laboratories, Inc. — Class A | | | 83 | | | | 0.25 | % | | | 1,123 | |
O’Reilly Automotive, Inc. | | | 21 | | | | 0.33 | % | | | 846 | |
Total Consumer, Cyclical | | | | | | | | | | | 41,065 | |
| | | | | | | | | | | | | |
Basic Materials | | | | | | | | | | | | |
International Paper Co. | | | 133 | | | | 0.22 | % | | | 114 | |
| | | | | | | | | | | | | |
Total MS Equity Long Custom Basket | | | | | | $ | 340,231 | |
| | | | | | | | | |
MS EQUITY SHORT CUSTOM BASKET | | | | | | | | |
Basic Materials | | | | | | | | | | | | |
Southern Copper Corp. | | | 1,310 | | | | (0.70 | )% | | $ | 3,686 | |
LyondellBasell Industries N.V. — Class A | | | 686 | | | | (0.56 | )% | | | 2,717 | |
Royal Gold, Inc. | | | 499 | | | | (0.41 | )% | | | (653 | ) |
Westlake Chemical Corp. | | | 613 | | | | (0.41 | )% | | | (756 | ) |
PPG Industries, Inc. | | | 975 | | | | (1.11 | )% | | | (2,591 | ) |
Steel Dynamics, Inc. | | | 1,851 | | | | (0.71 | )% | | | (5,621 | ) |
Huntsman Corp. | | | 3,537 | | | | (0.77 | )% | | | (9,631 | ) |
Axalta Coating Systems Ltd. | | | 2,958 | | | | (0.66 | )% | | | (11,143 | ) |
RPM International, Inc. | | | 764 | | | | (0.53 | )% | | | (13,696 | ) |
Nucor Corp. | | | 1,263 | | | | (0.77 | )% | | | (17,673 | ) |
United States Steel Corp. | | | 3,538 | | | | (0.70 | )% | | | (18,242 | ) |
Air Products and Chemicals, Inc. | | | 883 | | | | (1.88 | )% | | | (19,334 | ) |
Quaker Chemical Corp. | | | 499 | | | | (0.92 | )% | | | (31,577 | ) |
Balchem Corp. | | | 1,074 | | | | (1.02 | )% | | | (33,448 | ) |
Freeport-McMoRan, Inc. | | | 2,566 | | | | (0.64 | )% | | | (39,173 | ) |
Celanese Corp. — Class A | | | 940 | | | | (1.07 | )% | | | (41,024 | ) |
Albemarle Corp. | | | 611 | | | | (0.68 | )% | | | (42,579 | ) |
Linde plc | | | 871 | | | | (1.85 | )% | | | (49,231 | ) |
Total Basic Materials | | | | | | | | | | | (329,969 | ) |
| | | | | | | | | | | | | |
Utilities | | | | | | | | | | | | |
ALLETE, Inc. | | | 806 | | | | (0.41 | )% | | | (1,221 | ) |
California Water Service Group | | | 1,320 | | | | (0.56 | )% | | | (3,911 | ) |
Total Utilities | | | | | | | | | | | (5,132 | ) |
| | | | | | | | | | | | | |
Financial | | | | | | | | | | | | |
Realty Income Corp. | | | 3,976 | | | | (1.91 | )% | | | 14,475 | |
UDR, Inc. | | | 1,509 | | | | (0.50 | )% | | | 6,044 | |
Global Net Lease, Inc. | | | 4,111 | | | | (0.56 | )% | | | 5,541 | |
Goldman Sachs Group, Inc. | | | 686 | | | | (1.70 | )% | | | 5,269 | |
JBG SMITH Properties | | | 3,355 | | | | (0.81 | )% | | | 5,224 | |
CyrusOne, Inc. | | | 1,040 | | | | (0.53 | )% | | | 4,751 | |
Federal Realty Investment Trust | | | 688 | | | | (0.53 | )% | | | 3,719 | |
16 | THE GUGGENHEIM FUNDS SEMI-ANNUAL REPORT | SEE NOTES TO FINANCIAL STATEMENTS. |
SCHEDULE OF INVESTMENTS (Unaudited)(continued) | March 31, 2021 |
ALPHA OPPORTUNITY FUND | |
| | Shares | | | Percentage
Notional
Amount | | | Value and
Unrealized
Appreciation
(Depreciation) | |
QTS Realty Trust, Inc. — Class A | | | 1,081 | | | | (0.51 | )% | | $ | 2,822 | |
Kilroy Realty Corp. | | | 1,217 | | | | (0.60 | )% | | | 2,277 | |
Nasdaq, Inc. | | | 699 | | | | (0.78 | )% | | | (208 | ) |
CubeSmart | | | 1,959 | | | | (0.56 | )% | | | (1,295 | ) |
Host Hotels & Resorts, Inc. | | | 5,135 | | | | (0.65 | )% | | | (1,297 | ) |
Life Storage, Inc. | | | 902 | | | | (0.59 | )% | | | (1,375 | ) |
Intercontinental Exchange, Inc. | | | 997 | | | | (0.84 | )% | | | (1,813 | ) |
Agree Realty Corp. | | | 3,363 | | | | (1.71 | )% | | | (1,878 | ) |
KKR & Company, Inc. — Class A | | | 1,607 | | | | (0.59 | )% | | | (2,352 | ) |
Digital Realty Trust, Inc. | | | 546 | | | | (0.58 | )% | | | (2,931 | ) |
CME Group, Inc. — Class A | | | 591 | | | | (0.91 | )% | | | (3,505 | ) |
Equity LifeStyle Properties, Inc. | | | 1,499 | | | | (0.72 | )% | | | (3,759 | ) |
Americold Realty Trust | | | 2,749 | | | | (0.80 | )% | | | (4,220 | ) |
Duke Realty Corp. | | | 1,959 | | | | (0.62 | )% | | | (6,818 | ) |
Medical Properties Trust, Inc. | | | 5,925 | | | | (0.95 | )% | | | (8,327 | ) |
Healthpeak Properties, Inc. | | | 3,483 | | | | (0.84 | )% | | | (9,459 | ) |
Prologis, Inc. | | | 1,264 | | | | (1.01 | )% | | | (9,979 | ) |
Equinix, Inc. | | | 168 | | | | (0.86 | )% | | | (11,259 | ) |
Camden Property Trust | | | 1,282 | | | | (1.07 | )% | | | (11,940 | ) |
S&T Bancorp, Inc. | | | 2,202 | | | | (0.56 | )% | | | (13,006 | ) |
Rayonier, Inc. | | | 2,607 | | | | (0.64 | )% | | | (13,017 | ) |
TFS Financial Corp. | | | 3,678 | | | | (0.57 | )% | | | (15,184 | ) |
Southside Bancshares, Inc. | | | 2,050 | | | | (0.60 | )% | | | (16,891 | ) |
Alleghany Corp. | | | 294 | | | | (1.39 | )% | | | (16,929 | ) |
First Midwest Bancorp, Inc. | | | 2,692 | | | | (0.45 | )% | | | (17,585 | ) |
EastGroup Properties, Inc. | | | 751 | | | | (0.81 | )% | | | (18,518 | ) |
First Industrial Realty Trust, Inc. | | | 4,942 | | | | (1.71 | )% | | | (19,218 | ) |
Howard Hughes Corp. | | | 993 | | | | (0.71 | )% | | | (19,385 | ) |
Ares Management Corp. — Class A | | | 2,028 | | | | (0.86 | )% | | | (19,457 | ) |
Loews Corp. | | | 1,841 | | | | (0.71 | )% | | | (23,633 | ) |
Terreno Realty Corp. | | | 1,520 | | | | (0.66 | )% | | | (23,811 | ) |
American Tower Corp. — Class A | | | 701 | | | | (1.27 | )% | | | (25,001 | ) |
Brookline Bancorp, Inc. | | | 6,702 | | | | (0.76 | )% | | | (29,890 | ) |
Sun Communities, Inc. | | | 1,091 | | | | (1.24 | )% | | | (31,195 | ) |
First Financial Bankshares, Inc. | | | 2,863 | | | | (1.01 | )% | | | (38,706 | ) |
Rexford Industrial Realty, Inc. | | | 3,328 | | | | (1.27 | )% | | | (42,190 | ) |
First Republic Bank | | | 1,079 | | | | (1.36 | )% | | | (65,143 | ) |
Total Financial | | | | | | | | | | | (481,052 | ) |
| | | | | | | | | | | | | |
Consumer, Non-cyclical | | | | | | | | | | | | |
Nevro Corp. | | | 845 | | | | (0.89 | )% | | | 24,926 | |
Verisk Analytics, Inc. — Class A | | | 739 | | | | (0.99 | )% | | | 8,202 | |
CoStar Group, Inc. | | | 136 | | | | (0.85 | )% | | | 1,675 | |
Moody’s Corp. | | | 253 | | | | (0.57 | )% | | | (6,375 | ) |
Avalara, Inc. | | | 247 | | | | (0.25 | )% | | | (8,843 | ) |
Equifax, Inc. | | | 593 | | | | (0.81 | )% | | | (9,530 | ) |
WD-40 Co. | | | 170 | | | | (0.39 | )% | | | (10,772 | ) |
Avery Dennison Corp. | | | 475 | | | | (0.66 | )% | | | (35,600 | ) |
Total Consumer, Non-cyclical | | | | | | | | | | | (36,317 | ) |
| | | | | | | | | | | | | |
Consumer, Cyclical | | | | | | | | | | | | |
Lululemon Athletica, Inc. | | | 432 | | | | (1.00 | )% | | | 19,611 | |
IAA, Inc. | | | 1,131 | | | | (0.47 | )% | | | 9,233 | |
Wingstop, Inc. | | | 296 | | | | (0.28 | )% | | | (2,061 | ) |
Avient Corp. | | | 3,643 | | | | (1.30 | )% | | | (7,797 | ) |
Copart, Inc. | | | 1,274 | | | | (1.05 | )% | | | (8,950 | ) |
TJX Companies, Inc. | | | 1,103 | | | | (0.55 | )% | | | (11,805 | ) |
Delta Air Lines, Inc. | | | 1,650 | | | | (0.60 | )% | | | (16,776 | ) |
Live Nation Entertainment, Inc. | | | 591 | | | | (0.38 | )% | | | (19,286 | ) |
NIKE, Inc. — Class B | | | 1,123 | | | | (1.13 | )% | | | (21,125 | ) |
Alaska Air Group, Inc. | | | 1,453 | | | | (0.76 | )% | | | (24,665 | ) |
Hilton Worldwide Holdings, Inc. | | | 1,048 | | | | (0.96 | )% | | | (28,642 | ) |
Burlington Stores, Inc. | | | 438 | | | | (0.99 | )% | | | (34,302 | ) |
Southwest Airlines Co. | | | 2,434 | | | | (1.12 | )% | | | (45,291 | ) |
Starbucks Corp. | | | 1,629 | | | | (1.35 | )% | | | (51,775 | ) |
Scotts Miracle-Gro Co. — Class A | | | 477 | | | | (0.88 | )% | | | (57,566 | ) |
Total Consumer, Cyclical | | | | | | | | | | | (301,197 | ) |
| | | | | | | | | | | | | |
Energy | | | | | | | | | | | | |
Exxon Mobil Corp. | | | 2,371 | | | | (1.00 | )% | | | 11,182 | |
Valero Energy Corp. | | | 1,300 | | | | (0.70 | )% | | | 8,410 | |
Chevron Corp. | | | 1,578 | | | | (1.25 | )% | | | 7,828 | |
Cheniere Energy, Inc. | | | 1,280 | | | | (0.70 | )% | | | (274 | ) |
NOV, Inc. | | | 3,123 | | | | (0.32 | )% | | | (7,011 | ) |
Pioneer Natural Resources Co. | | | 321 | | | | (0.39 | )% | | | (8,467 | ) |
Phillips 66 | | | 1,928 | | | | (1.19 | )% | | | (11,340 | ) |
Hess Corp. | | | 715 | | | | (0.38 | )% | | | (12,864 | ) |
Schlumberger N.V. | | | 5,706 | | | | (1.17 | )% | | | (13,310 | ) |
ChampionX Corp. | | | 7,549 | | | | (1.24 | )% | | | (50,591 | ) |
Ovintiv, Inc. | | | 6,565 | | | | (1.18 | )% | | | (66,245 | ) |
Total Energy | | | | | | | | | | | (142,682 | ) |
| | | | | | | | | | | | | |
Technology | | | | | | | | | | | | |
Pegasystems, Inc. | | | 709 | | | | (0.61 | )% | | | 4,960 | |
Clarivate plc | | | 2,969 | | | | (0.59 | )% | | | 1,653 | |
Coupa Software, Inc. | | | 127 | | | | (0.24 | )% | | | (853 | ) |
salesforce.com, Inc. | | | 166 | | | | (0.27 | )% | | | (1,680 | ) |
Rapid7, Inc. | | | 877 | | | | (0.50 | )% | | | (1,782 | ) |
Tyler Technologies, Inc. | | | 87 | | | | (0.28 | )% | | | (3,379 | ) |
Smartsheet, Inc. — Class A | | | 552 | | | | (0.27 | )% | | | (9,494 | ) |
HubSpot, Inc. | | | 79 | | | | (0.27 | )% | | | (13,364 | ) |
SEE NOTES TO FINANCIAL STATEMENTS. | THE GUGGENHEIM FUNDS SEMI-ANNUAL REPORT | 17 |
SCHEDULE OF INVESTMENTS (Unaudited)(continued) | March 31, 2021 |
ALPHA OPPORTUNITY FUND | |
| | Shares | | | Percentage
Notional
Amount | | | Value and
Unrealized
Appreciation
(Depreciation) | |
Varonis Systems, Inc. | | | 1,182 | | | | (0.46 | )% | | $ | (14,805 | ) |
Total Technology | | | | | | | | | | | (38,744 | ) |
| | | | | | | | | | | | | |
Industrial | | | | | | | | | | | | |
Worthington Industries, Inc. | | | 1,083 | | | | (0.55 | )% | | | 3,850 | |
Exponent, Inc. | | | 536 | | | | (0.40 | )% | | | (300 | ) |
Raytheon Technologies Corp. | | | 1,257 | | | | (0.74 | )% | | | (2,476 | ) |
TransDigm Group, Inc. | | | 117 | | | | (0.52 | )% | | | (4,053 | ) |
US Ecology, Inc. | | | 1,452 | | | | (0.46 | )% | | | (5,972 | ) |
HEICO Corp. | | | 418 | | | | (0.40 | )% | | | (6,500 | ) |
Boeing Co. | | | 229 | | | | (0.44 | )% | | | (8,736 | ) |
Ball Corp. | | | 2,211 | | | | (1.42 | )% | | | (12,665 | ) |
Crown Holdings, Inc. | | | 894 | | | | (0.66 | )% | | | (19,897 | ) |
AptarGroup, Inc. | | | 1,503 | | | | (1.61 | )% | | | (21,352 | ) |
Martin Marietta Materials, Inc. | | | 323 | | | | (0.82 | )% | | | (24,174 | ) |
Ingersoll Rand, Inc. | | | 3,218 | | | | (1.20 | )% | | | (27,125 | ) |
Casella Waste Systems, Inc. — Class A | | | 1,865 | | | | (0.90 | )% | | | (28,028 | ) |
Vulcan Materials Co. | | | 589 | | | | (0.75 | )% | | | (29,287 | ) |
Tetra Tech, Inc. | | | 723 | | | | (0.74 | )% | | | (33,027 | ) |
Total Industrial | | | | | | | | | | | (219,742 | ) |
| | | | | | | | | | | | | |
Communications | | | | | | | | | | | | |
Q2 Holdings, Inc. | | | 623 | | | | (0.47 | )% | | | (10,251 | ) |
Liberty Broadband Corp. — Class C | | | 1,272 | | | | (1.45 | )% | | | (11,691 | ) |
Zendesk, Inc. | | | 554 | | | | (0.56 | )% | | | (14,389 | ) |
Total Communications | | | | | | | | | | | (36,331 | ) |
Total MS Equity Short Custom Basket | | | | | | $ | (1,591,166 | ) |
| | | | | | | | | |
GS EQUITY LONG CUSTOM BASKET | | | | | | | | |
Communications | | | | | | | | | | | | |
Facebook, Inc. — Class A | | | 189 | | | | 1.74 | % | | $ | 6,223 | |
Cisco Systems, Inc. | | | 667 | | | | 1.07 | % | | | 5,747 | |
Ciena Corp. | | | 304 | | | | 0.51 | % | | | 2,585 | |
Viavi Solutions, Inc. | | | 1,725 | | | | 0.84 | % | | | 2,535 | |
Discovery, Inc. — Class A | | | 686 | | | | 0.92 | % | | | 2,267 | |
Juniper Networks, Inc. | | | 857 | | | | 0.67 | % | | | 2,066 | |
Cogent Communications Holdings, Inc. | | | 207 | | | | 0.44 | % | | | 1,643 | |
Omnicom Group, Inc. | | | 163 | | | | 0.37 | % | | | 1,620 | |
Motorola Solutions, Inc. | | | 61 | | | | 0.35 | % | | | 1,264 | |
Verizon Communications, Inc. | | | 579 | | | | 1.04 | % | | | 842 | |
T-Mobile US, Inc. | | | 146 | | | | 0.57 | % | | | 777 | |
VeriSign, Inc. | | | 87 | | | | 0.53 | % | | | 566 | |
Sirius XM Holdings, Inc. | | | 2,072 | | | | 0.39 | % | | | 459 | |
Charter Communications, Inc. — Class A | | | 25 | | | | 0.48 | % | | | (22 | ) |
InterDigital, Inc. | | | 169 | | | | 0.33 | % | | | (232 | ) |
Vonage Holdings Corp. | | | 833 | | | | 0.30 | % | | | (731 | ) |
AT&T, Inc. | | | 329 | | | | 0.31 | % | | | (2,258 | ) |
Total Communications | | | | | | | | | | | 25,351 | |
| | | | | | | | | | | | | |
Consumer, Non-cyclical | | | | | | | | | | | | |
United Rentals, Inc. | | | 79 | | | | 0.79 | % | | | 9,334 | |
Cardinal Health, Inc. | | | 457 | | | | 0.86 | % | | | 8,127 | |
Molson Coors Beverage Co. — Class B | | | 755 | | | | 1.19 | % | | | 7,503 | |
McKesson Corp. | | | 202 | | | | 1.22 | % | | | 5,901 | |
Amgen, Inc. | | | 140 | | | | 1.08 | % | | | 5,269 | |
Altria Group, Inc. | | | 631 | | | | 1.00 | % | | | 4,661 | |
Quanta Services, Inc. | | | 194 | | | | 0.53 | % | | | 4,487 | |
Kraft Heinz Co. | | | 651 | | | | 0.80 | % | | | 4,343 | |
United Therapeutics Corp. | | | 126 | | | | 0.65 | % | | | 4,015 | |
Johnson & Johnson | | | 188 | | | | 0.96 | % | | | 3,561 | |
J M Smucker Co. | | | 265 | | | | 1.04 | % | | | 3,493 | |
Campbell Soup Co. | | | 718 | | | | 1.12 | % | | | 2,642 | |
Philip Morris International, Inc. | | | 351 | | | | 0.96 | % | | | 2,410 | |
Sprouts Farmers Market, Inc. | | | 557 | | | | 0.46 | % | | | 2,307 | |
H&R Block, Inc. | | | 652 | | | | 0.44 | % | | | 2,248 | |
Procter & Gamble Co. | | | 193 | | | | 0.81 | % | | | 2,210 | |
Tyson Foods, Inc. — Class A | | | 239 | | | | 0.55 | % | | | 2,004 | |
Cigna Corp. | | | 60 | | | | 0.45 | % | | | 1,987 | |
Laboratory Corporation of America Holdings | | | 48 | | | | 0.38 | % | | | 1,847 | |
DaVita, Inc. | | | 153 | | | | 0.51 | % | | | 1,788 | |
Colgate-Palmolive Co. | | | 393 | | | | 0.96 | % | | | 1,752 | |
General Mills, Inc. | | | 534 | | | | 1.01 | % | | | 1,734 | |
Vector Group Ltd. | | | 761 | | | | 0.33 | % | | | 1,700 | |
Conagra Brands, Inc. | | | 735 | | | | 0.85 | % | | | 1,429 | |
Kellogg Co. | | | 387 | | | | 0.76 | % | | | 1,415 | |
Hill-Rom Holdings, Inc. | | | 88 | | | | 0.30 | % | | | 1,308 | |
Kroger Co. | | | 411 | | | | 0.46 | % | | | 1,287 | |
Post Holdings, Inc. | | | 124 | | | | 0.41 | % | | | 1,270 | |
Bristol-Myers Squibb Co. | | | 527 | | | | 1.03 | % | | | 1,106 | |
John B Sanfilippo & Son, Inc. | | | 171 | | | | 0.48 | % | | | 1,074 | |
USANA Health Sciences, Inc. | | | 74 | | | | 0.22 | % | | | 989 | |
Humana, Inc. | | | 69 | | | | 0.89 | % | | | 988 | |
Ingredion, Inc. | | | 173 | | | | 0.48 | % | | | 906 | |
Quest Diagnostics, Inc. | | | 118 | | | | 0.47 | % | | | 898 | |
Pfizer, Inc. | | | 540 | | | | 0.60 | % | | | 889 | |
CVS Health Corp. | | | 146 | | | | 0.34 | % | | | 790 | |
Prestige Consumer Healthcare, Inc. | | | 189 | | | | 0.26 | % | | | 575 | |
Constellation Brands, Inc. — Class A | | | 32 | | | | 0.23 | % | | | 558 | |
Medtronic plc | | | 63 | | | | 0.23 | % | | | 556 | |
18 | THE GUGGENHEIM FUNDS SEMI-ANNUAL REPORT | SEE NOTES TO FINANCIAL STATEMENTS. |
SCHEDULE OF INVESTMENTS (Unaudited)(continued) | March 31, 2021 |
ALPHA OPPORTUNITY FUND | |
| | Shares | | | Percentage
Notional
Amount | | | Value and
Unrealized
Appreciation
(Depreciation) | |
Innoviva, Inc. | | | 738 | | | | 0.27 | % | | $ | 484 | |
Abbott Laboratories | | | 62 | | | | 0.23 | % | | | 443 | |
Kimberly-Clark Corp. | | | 167 | | | | 0.72 | % | | | 433 | |
Coca-Cola Co. | | | 224 | | | | 0.36 | % | | | 355 | |
Hershey Co. | | | 49 | | | | 0.24 | % | | | 337 | |
Hologic, Inc. | | | 154 | | | | 0.35 | % | | | 315 | |
Incyte Corp. | | | 147 | | | | 0.37 | % | | | 243 | |
Merck & Company, Inc. | | | 432 | | | | 1.03 | % | | | 204 | |
Encompass Health Corp. | | | 90 | | | | 0.23 | % | | | 10 | |
Becton Dickinson and Co. | | | 38 | | | | 0.29 | % | | | (17 | ) |
Regeneron Pharmaceuticals, Inc. | | | 31 | | | | 0.45 | % | | | (140 | ) |
Perrigo Company plc | | | 187 | | | | 0.23 | % | | | (204 | ) |
Boston Scientific Corp. | | | 187 | | | | 0.22 | % | | | (240 | ) |
Gilead Sciences, Inc. | | | 342 | | | | 0.68 | % | | | (270 | ) |
FleetCor Technologies, Inc. | | | 25 | | | | 0.21 | % | | | (418 | ) |
Ionis Pharmaceuticals, Inc. | | | 214 | | | | 0.30 | % | | | (1,487 | ) |
Total Consumer, Non-cyclical | | | | | | | | | | | 101,409 | |
| | | | | | | | | | | | | |
Industrial | | | | | | | | | | | | |
Snap-on, Inc. | | | 63 | | | | 0.45 | % | | | 6,830 | |
AGCO Corp. | | | 103 | | | | 0.46 | % | | | 6,472 | |
Acuity Brands, Inc. | | | 128 | | | | 0.65 | % | | | 6,183 | |
Owens Corning | | | 196 | | | | 0.56 | % | | | 4,439 | |
Oshkosh Corp. | | | 160 | | | | 0.59 | % | | | 4,410 | |
Caterpillar, Inc. | | | 62 | | | | 0.44 | % | | | 4,241 | |
Vishay Intertechnology, Inc. | | | 1,013 | | | | 0.75 | % | | | 3,945 | |
General Dynamics Corp. | | | 198 | | | | 1.11 | % | | | 3,853 | |
TE Connectivity Ltd. | | | 57 | | | | 0.23 | % | | | 3,535 | |
Hubbell, Inc. | | | 69 | | | | 0.40 | % | | | 3,475 | |
Arrow Electronics, Inc. | | | 164 | | | | 0.56 | % | | | 3,283 | |
Timken Co. | | | 173 | | | | 0.43 | % | | | 2,647 | |
Lincoln Electric Holdings, Inc. | | | 82 | | | | 0.31 | % | | | 2,240 | |
Waters Corp. | | | 34 | | | | 0.30 | % | | | 2,196 | |
3M Co. | | | 128 | | | | 0.76 | % | | | 1,793 | |
Parker-Hannifin Corp. | | | 85 | | | | 0.83 | % | | | 1,426 | |
Eaton Corporation plc | | | 72 | | | | 0.31 | % | | | 1,361 | |
Trane Technologies plc | | | 99 | | | | 0.51 | % | | | 1,296 | |
Masco Corp. | | | 278 | | | | 0.51 | % | | | 1,177 | |
O-I Glass, Inc. | | | 589 | | | | 0.27 | % | | | 1,101 | |
Energizer Holdings, Inc. | | | 247 | | | | 0.36 | % | | | 1,012 | |
Northrop Grumman Corp. | | | 44 | | | | 0.44 | % | | | 1,001 | |
Lennox International, Inc. | | | 31 | | | | 0.30 | % | | | 878 | |
Lockheed Martin Corp. | | | 68 | | | | 0.78 | % | | | 847 | |
Westinghouse Air Brake Technologies Corp. | | | 142 | | | | 0.35 | % | | | 737 | |
Agilent Technologies, Inc. | | | 110 | | | | 0.43 | % | | | 722 | |
Mettler-Toledo International, Inc. | | | 7 | | | | 0.25 | % | | | 683 | |
AECOM | | | 135 | | | | 0.27 | % | | | 602 | |
Berry Global Group, Inc. | | | 123 | | | | 0.23 | % | | | 588 | |
Union Pacific Corp. | | | 75 | | | | 0.51 | % | | | 507 | |
CSX Corp. | | | 164 | | | | 0.49 | % | | | 495 | |
Sanmina Corp. | | | 240 | | | | 0.31 | % | | | 425 | |
Westrock Co. | | | 142 | | | | 0.23 | % | | | 283 | |
Norfolk Southern Corp. | | | 45 | | | | 0.37 | % | | | 281 | |
Fortive Corp. | | | 218 | | | | 0.48 | % | | | 140 | |
Donaldson Company, Inc. | | | 124 | | | | 0.22 | % | | | (157 | ) |
Hillenbrand, Inc. | | | 220 | | | | 0.32 | % | | | (533 | ) |
Total Industrial | | | | | | | | | | | 74,414 | |
| | | | | | | | | | | | | |
Financial | | | | | | | | | | | | |
MetLife, Inc. | | | 621 | | | | 1.17 | % | | | 6,863 | |
Hartford Financial Services Group, Inc. | | | 197 | | | | 0.41 | % | | | 4,071 | |
Allstate Corp. | | | 231 | | | | 0.82 | % | | | 2,840 | |
Travelers Companies, Inc. | | | 126 | | | | 0.59 | % | | | 2,032 | |
Aflac, Inc. | | | 283 | | | | 0.45 | % | | | 1,933 | |
Synchrony Financial | | | 269 | | | | 0.34 | % | | | 1,917 | |
Highwoods Properties, Inc. | | | 605 | | | | 0.80 | % | | | 1,848 | |
Western Union Co. | | | 334 | | | | 0.25 | % | | | 1,649 | |
Berkshire Hathaway, Inc. — Class B | | | 73 | | | | 0.58 | % | | | 1,221 | |
Sabra Health Care REIT, Inc. | | | 420 | | | | 0.23 | % | | | (197 | ) |
Prudential Financial, Inc. | | | 222 | | | | 0.63 | % | | | (252 | ) |
Brandywine Realty Trust | | | 1,170 | | | | 0.47 | % | | | (588 | ) |
Total Financial | | | | | | | | | | | 23,337 | |
| | | | | | | | | | | | | |
Basic Materials | | | | | | | | | | | | |
International Paper Co. | | | 133 | | | | 0.22 | % | | | 135 | |
| | | | | | | | | | | | | |
Consumer, Cyclical | | | | | | | | | | | | |
Gentherm, Inc. | | | 271 | | | | 0.62 | % | | | 5,961 | |
Lear Corp. | | | 87 | | | | 0.49 | % | | | 3,842 | |
AutoZone, Inc. | | | 16 | | | | 0.69 | % | | | 3,524 | |
AutoNation, Inc. | | | 208 | | | | 0.60 | % | | | 3,359 | |
Gentex Corp. | | | 681 | | | | 0.75 | % | | | 2,718 | |
Cummins, Inc. | | | 59 | | | | 0.47 | % | | | 2,635 | |
Brunswick Corp. | | | 117 | | | | 0.34 | % | | | 2,552 | |
Lennar Corp. — Class A | | | 131 | | | | 0.41 | % | | | 2,360 | |
Genuine Parts Co. | | | 194 | | | | 0.69 | % | | | 2,162 | |
MSC Industrial Direct Company, Inc. — Class A | | | 176 | | | | 0.49 | % | | | 1,984 | |
Lowe’s Companies, Inc. | | | 84 | | | | 0.49 | % | | | 1,948 | |
PACCAR, Inc. | | | 142 | | | | 0.41 | % | | | 1,780 | |
PulteGroup, Inc. | | | 232 | | | | 0.38 | % | | | 1,536 | |
Allison Transmission Holdings, Inc. | | | 576 | | | | 0.73 | % | | | 1,452 | |
Best Buy Company, Inc. | | | 174 | | | | 0.62 | % | | | 1,250 | |
Dolby Laboratories, Inc. — Class A | | | 83 | | | | 0.25 | % | | | 1,125 | |
O’Reilly Automotive, Inc. | | | 21 | | | | 0.33 | % | | | 874 | |
Total Consumer, Cyclical | | | | | | | | | | | 41,062 | |
| | | | | | | | | | | | | |
Technology | | | | | | | | | | | | |
Seagate Technology plc | | | 335 | | | | 0.79 | % | | | 6,217 | |
SEE NOTES TO FINANCIAL STATEMENTS. | THE GUGGENHEIM FUNDS SEMI-ANNUAL REPORT | 19 |
SCHEDULE OF INVESTMENTS (Unaudited)(continued) | March 31, 2021 |
ALPHA OPPORTUNITY FUND | |
| | Shares | | | Percentage
Notional
Amount | | | Value and
Unrealized
Appreciation
(Depreciation) | |
HP, Inc. | | | 509 | | | | 0.50 | % | | $ | 5,867 | |
Texas Instruments, Inc. | | | 53 | | | | 0.31 | % | | | 4,016 | |
Kulicke & Soffa Industries, Inc. | | | 298 | | | | 0.45 | % | | | 4,014 | |
NetApp, Inc. | | | 171 | | | | 0.38 | % | | | 3,750 | |
CDK Global, Inc. | | | 348 | | | | 0.58 | % | | | 3,379 | |
International Business Machines Corp. | | | 295 | | | | 1.22 | % | | | 3,027 | |
SS&C Technologies Holdings, Inc. | | | 557 | | | | 1.20 | % | | | 2,905 | |
Intel Corp. | | | 227 | | | | 0.45 | % | | | 2,551 | |
KLA Corp. | | | 26 | | | | 0.27 | % | | | 2,490 | |
Dell Technologies, Inc. — Class C | | | 222 | | | | 0.60 | % | | | 2,061 | |
Cirrus Logic, Inc. | | | 121 | | | | 0.32 | % | | | 1,695 | |
Oracle Corp. | | | 132 | | | | 0.29 | % | | | 1,613 | |
Microchip Technology, Inc. | | | 51 | | | | 0.24 | % | | | 1,460 | |
Skyworks Solutions, Inc. | | | 43 | | | | 0.24 | % | | | 1,325 | |
Dropbox, Inc. — Class A | | | 494 | | | | 0.41 | % | | | 967 | |
Cerner Corp. | | | 359 | | | | 0.80 | % | | | 820 | |
Qorvo, Inc. | | | 59 | | | | 0.33 | % | | | 708 | |
Accenture plc — Class A | | | 28 | | | | 0.24 | % | | | 530 | |
Cognizant Technology Solutions Corp. — Class A | | | 125 | | | | 0.30 | % | | | 397 | |
VMware, Inc. — Class A | | | 65 | | | | 0.30 | % | | | 368 | |
Paychex, Inc. | | | 78 | | | | 0.24 | % | | | 278 | |
Fiserv, Inc. | | | 65 | | | | 0.24 | % | | | 116 | |
Western Digital Corp. | | | 108 | | | | 0.22 | % | | | (352 | ) |
CSG Systems International, Inc. | | | 173 | | | | 0.24 | % | | | (424 | ) |
Bandwidth, Inc. — Class A | | | 81 | | | | 0.32 | % | | | (3,450 | ) |
Total Technology | | | | | | | | | | | 46,328 | |
| | | | | | | | | | | | | |
Utilities | | | | | | | | | | | | |
Evergy, Inc. | | | 577 | | | | 1.06 | % | | | 3,108 | |
Exelon Corp. | | | 607 | | | | 0.82 | % | | | 2,966 | |
UGI Corp. | | | 717 | | | | 0.91 | % | | | 2,836 | |
Public Service Enterprise Group, Inc. | | | 560 | | | | 1.04 | % | | | 2,465 | |
IDACORP, Inc. | | | 263 | | | | 0.81 | % | | | 2,341 | |
PPL Corp. | | | 1,179 | | | | 1.05 | % | | | 2,121 | |
Southern Co. | | | 502 | | | | 0.96 | % | | | 1,992 | |
NiSource, Inc. | | | 934 | | | | 0.70 | % | | | 1,868 | |
CenterPoint Energy, Inc. | | | 677 | | | | 0.47 | % | | | 1,648 | |
ONE Gas, Inc. | | | 309 | | | | 0.73 | % | | | 1,440 | |
Duke Energy Corp. | | | 281 | | | | 0.84 | % | | | 1,064 | |
DTE Energy Co. | | | 113 | | | | 0.47 | % | | | 968 | |
Pinnacle West Capital Corp. | | | 215 | | | | 0.54 | % | | | 793 | |
OGE Energy Corp. | | | 694 | | | | 0.69 | % | | | 770 | |
Consolidated Edison, Inc. | | | 328 | | | | 0.76 | % | | | 700 | |
Sempra Energy | | | 61 | | | | 0.25 | % | | | 566 | |
Southwest Gas Holdings, Inc. | | | 266 | | | | 0.56 | % | | | (187 | ) |
AES Corp. | | | 271 | | | | 0.22 | % | | | (244 | ) |
Total Utilities | | | | | | | | | | | 27,215 | |
Total GS Equity Long Custom Basket | | | | | | $ | 339,251 | |
| | | | | | | | | |
GS EQUITY SHORT CUSTOM BASKET | | | | | | | | |
Financial | | | | | | | | | | | | |
Morgan Stanley | | | 4,254 | | | | (2.46 | )% | | $ | 17,974 | |
Realty Income Corp. | | | 3,976 | | | | (1.90 | )% | | | 11,866 | |
UDR, Inc. | | | 1,509 | | | | (0.50 | )% | | | 6,006 | |
Global Net Lease, Inc. | | | 4,111 | | | | (0.56 | )% | | | 5,496 | |
JBG SMITH Properties | | | 3,355 | | | | (0.80 | )% | | | 5,217 | |
CyrusOne, Inc. | | | 1,040 | | | | (0.53 | )% | | | 4,587 | |
Federal Realty Investment Trust | | | 688 | | | | (0.52 | )% | | | 4,095 | |
Kilroy Realty Corp. | | | 1,217 | | | | (0.60 | )% | | | 2,341 | |
Nasdaq, Inc. | | | 699 | | | | (0.77 | )% | | | (181 | ) |
CubeSmart | | | 1,959 | | | | (0.56 | )% | | | (1,028 | ) |
Host Hotels & Resorts, Inc. | | | 5,135 | | | | (0.65 | )% | | | (1,040 | ) |
Life Storage, Inc. | | | 902 | | | | (0.58 | )% | | | (1,308 | ) |
Intercontinental Exchange, Inc. | | | 997 | | | | (0.84 | )% | | | (1,812 | ) |
Agree Realty Corp. | | | 3,363 | | | | (1.70 | )% | | | (2,181 | ) |
KKR & Company, Inc. — Class A | | | 1,607 | | | | (0.59 | )% | | | (2,279 | ) |
Digital Realty Trust, Inc. | | | 546 | | | | (0.58 | )% | | | (2,880 | ) |
CME Group, Inc. — Class A | | | 591 | | | | (0.91 | )% | | | (3,664 | ) |
Equity LifeStyle Properties, Inc. | | | 1,499 | | | | (0.72 | )% | | | (3,698 | ) |
QTS Realty Trust, Inc. — Class A | | | 1,081 | | | | (0.50 | )% | | | (5,457 | ) |
Duke Realty Corp. | | | 1,959 | | | | (0.62 | )% | | | (6,973 | ) |
Equinix, Inc. | | | 168 | | | | (0.86 | )% | | | (8,186 | ) |
Medical Properties Trust, Inc. | | | 5,925 | | | | (0.95 | )% | | | (8,326 | ) |
Healthpeak Properties, Inc. | | | 3,483 | | | | (0.83 | )% | | | (9,477 | ) |
Prologis, Inc. | | | 1,264 | | | | (1.01 | )% | | | (9,783 | ) |
Camden Property Trust | | | 1,282 | | | | (1.06 | )% | | | (11,920 | ) |
Rayonier, Inc. | | | 2,607 | | | | (0.63 | )% | | | (12,923 | ) |
S&T Bancorp, Inc. | | | 2,202 | | | | (0.55 | )% | | | (13,008 | ) |
TFS Financial Corp. | | | 3,678 | | | | (0.56 | )% | | | (15,234 | ) |
Terreno Realty Corp. | | | 1,520 | | | | (0.66 | )% | | | (15,698 | ) |
Alleghany Corp. | | | 294 | | | | (1.38 | )% | | | (16,427 | ) |
Southside Bancshares, Inc. | | | 2,050 | | | | (0.59 | )% | | | (17,112 | ) |
First Midwest Bancorp, Inc. | | | 2,692 | | | | (0.44 | )% | | | (17,438 | ) |
EastGroup Properties, Inc. | | | 751 | | | | (0.81 | )% | | | (17,498 | ) |
Howard Hughes Corp. | | | 993 | | | | (0.71 | )% | | | (19,101 | ) |
Americold Realty Trust | | | 2,749 | | | | (0.79 | )% | | | (19,108 | ) |
First Industrial Realty Trust, Inc. | | | 4,942 | | | | (1.70 | )% | | | (19,229 | ) |
Ares Management Corp. — Class A | | | 2,028 | | | | (0.85 | )% | | | (19,310 | ) |
20 | THE GUGGENHEIM FUNDS SEMI-ANNUAL REPORT | SEE NOTES TO FINANCIAL STATEMENTS. |
SCHEDULE OF INVESTMENTS (Unaudited)(continued) | March 31, 2021 |
ALPHA OPPORTUNITY FUND | |
| | Shares | | | Percentage
Notional
Amount | | | Value and
Unrealized
Appreciation
(Depreciation) | |
Sun Communities, Inc. | | | 1,091 | | | | (1.23 | )% | | $ | (22,135 | ) |
Loews Corp. | | | 1,841 | | | | (0.71 | )% | | | (23,601 | ) |
American Tower Corp. — Class A | | | 701 | | | | (1.26 | )% | | | (24,997 | ) |
Brookline Bancorp, Inc. | | | 6,702 | | | | (0.75 | )% | | | (29,930 | ) |
Rexford Industrial Realty, Inc. | | | 3,328 | | | | (1.26 | )% | | | (32,663 | ) |
First Financial Bankshares, Inc. | | | 2,863 | | | | (1.00 | )% | | | (38,688 | ) |
First Republic Bank | | | 1,079 | | | | (1.35 | )% | | | (64,870 | ) |
Total Financial | | | | | | | | | | | (461,581 | ) |
| | | | | | | | | | | | | |
Industrial | | | | | | | | | | | | |
Worthington Industries, Inc. | | | 1,083 | | | | (0.55 | )% | | | 3,831 | |
Exponent, Inc. | | | 536 | | | | (0.39 | )% | | | (177 | ) |
Raytheon Technologies Corp. | | | 1,257 | | | | (0.73 | )% | | | (2,385 | ) |
TransDigm Group, Inc. | | | 117 | | | | (0.52 | )% | | | (4,098 | ) |
US Ecology, Inc. | | | 1,452 | | | | (0.45 | )% | | | (5,999 | ) |
HEICO Corp. | | | 418 | | | | (0.39 | )% | | | (6,429 | ) |
Boeing Co. | | | 229 | | | | (0.44 | )% | | | (8,775 | ) |
Ball Corp. | | | 2,211 | | | | (1.41 | )% | | | (12,605 | ) |
Crown Holdings, Inc. | | | 894 | | | | (0.65 | )% | | | (19,958 | ) |
AptarGroup, Inc. | | | 1,503 | | | | (1.60 | )% | | | (21,284 | ) |
Martin Marietta Materials, Inc. | | | 323 | | | | (0.81 | )% | | | (24,220 | ) |
Ingersoll Rand, Inc. | | | 3,218 | | | | (1.19 | )% | | | (27,160 | ) |
Casella Waste Systems, Inc. — Class A | | | 1,865 | | | | (0.89 | )% | | | (28,164 | ) |
Vulcan Materials Co. | | | 589 | | | | (0.75 | )% | | | (29,372 | ) |
Tetra Tech, Inc. | | | 723 | | | | (0.74 | )% | | | (33,066 | ) |
Total Industrial | | | | | | | | | | | (219,861 | ) |
| | | | | | | | | | | | | |
Basic Materials | | | | | | | | | | | | |
Southern Copper Corp. | | | 1,310 | | | | (0.67 | )% | | | 3,967 | |
LyondellBasell Industries N.V. — Class A | | | 686 | | | | (0.54 | )% | | | 2,710 | |
Royal Gold, Inc. | | | 499 | | | | (0.40 | )% | | | (546 | ) |
Westlake Chemical Corp. | | | 613 | | | | (0.41 | )% | | | (657 | ) |
PPG Industries, Inc. | | | 975 | | | | (1.10 | )% | | | (2,532 | ) |
Steel Dynamics, Inc. | | | 1,851 | | | | (0.71 | )% | | | (5,867 | ) |
Huntsman Corp. | | | 3,537 | | | | (0.77 | )% | | | (9,549 | ) |
Axalta Coating Systems Ltd. | | | 2,958 | | | | (0.66 | )% | | | (11,076 | ) |
RPM International, Inc. | | | 764 | | | | (0.53 | )% | | | (13,762 | ) |
Nucor Corp. | | | 1,263 | | | | (0.76 | )% | | | (17,796 | ) |
United States Steel Corp. | | | 3,538 | | | | (0.70 | )% | | | (18,233 | ) |
Air Products and Chemicals, Inc. | | | 883 | | | | (1.87 | )% | | | (19,234 | ) |
Balchem Corp. | | | 1,074 | | | | (1.01 | )% | | | (30,175 | ) |
Quaker Chemical Corp. | | | 499 | | | | (0.91 | )% | | | (31,810 | ) |
Freeport-McMoRan, Inc. | | | 2,566 | | | | (0.63 | )% | | | (39,142 | ) |
Celanese Corp. — Class A | | | 940 | | | | (1.06 | )% | | | (41,072 | ) |
Albemarle Corp. | | | 611 | | | | (0.67 | )% | | | (42,704 | ) |
Linde plc | | | 871 | | | | (1.83 | )% | | | (49,135 | ) |
Total Basic Materials | | | | | | | | | | | (326,613 | ) |
| | | | | | | | | | | | | |
Energy | | | | | | | | | | | | |
Exxon Mobil Corp. | | | 2,371 | | | | (0.99 | )% | | | 11,299 | |
Valero Energy Corp. | | | 1,300 | | | | (0.70 | )% | | | 8,436 | |
Chevron Corp. | | | 1,578 | | | | (1.24 | )% | | | 7,947 | |
Cheniere Energy, Inc. | | | 1,280 | | | | (0.69 | )% | | | (126 | ) |
NOV, Inc. | | | 3,123 | | | | (0.32 | )% | | | (7,037 | ) |
Pioneer Natural Resources Co. | | | 321 | | | | (0.38 | )% | | | (8,523 | ) |
Phillips 66 | | | 1,928 | | | | (1.18 | )% | | | (11,282 | ) |
Schlumberger N.V. | | | 5,706 | | | | (1.16 | )% | | | (12,727 | ) |
Hess Corp. | | | 715 | | | | (0.38 | )% | | | (12,886 | ) |
ChampionX Corp. | | | 7,549 | | | | (1.23 | )% | | | (49,619 | ) |
Ovintiv, Inc. | | | 6,565 | | | | (1.17 | )% | | | (65,445 | ) |
Total Energy | | | | | | | | | | | (139,963 | ) |
| | | | | | | | | | | | | |
Consumer, Non-cyclical | | | | | | | | | | | | |
Nevro Corp. | | | 845 | | | | (0.88 | )% | | | 25,686 | |
Verisk Analytics, Inc. — Class A | | | 739 | | | | (0.98 | )% | | | 8,226 | |
CoStar Group, Inc. | | | 136 | | | | (0.84 | )% | | | 1,506 | |
Moody’s Corp. | | | 253 | | | | (0.57 | )% | | | (6,420 | ) |
Avalara, Inc. | | | 247 | | | | (0.25 | )% | | | (7,263 | ) |
Equifax, Inc. | | | 593 | | | | (0.81 | )% | | | (9,627 | ) |
WD-40 Co. | | | 170 | | | | (0.39 | )% | | | (10,815 | ) |
Avery Dennison Corp. | | | 475 | | | | (0.65 | )% | | | (35,711 | ) |
Total Consumer, Non-cyclical | | | | | | | | | | | (34,418 | ) |
| | | | | | | | | | | | | |
Consumer, Cyclical | | | | | | | | | | | | |
Lululemon Athletica, Inc. | | | 432 | | | | (0.99 | )% | | | 19,517 | |
IAA, Inc. | | | 1,131 | | | | (0.47 | )% | | | 9,314 | |
Wingstop, Inc. | | | 296 | | | | (0.28 | )% | | | (2,063 | ) |
Avient Corp. | | | 3,643 | | | | (1.29 | )% | | | (7,269 | ) |
Copart, Inc. | | | 1,274 | | | | (1.04 | )% | | | (9,011 | ) |
TJX Companies, Inc. | | | 1,103 | | | | (0.55 | )% | | | (11,755 | ) |
Delta Air Lines, Inc. | | | 1,650 | | | | (0.60 | )% | | | (16,766 | ) |
Live Nation Entertainment, Inc. | | | 591 | | | | (0.38 | )% | | | (19,230 | ) |
NIKE, Inc. — Class B | | | 1,123 | | | | (1.12 | )% | | | (21,165 | ) |
Alaska Air Group, Inc. | | | 1,453 | | | | (0.75 | )% | | | (24,983 | ) |
Hilton Worldwide Holdings, Inc. | | | 1,048 | | | | (0.95 | )% | | | (28,527 | ) |
Burlington Stores, Inc. | | | 438 | | | | (0.98 | )% | | | (34,752 | ) |
Southwest Airlines Co. | | | 2,434 | | | | (1.12 | )% | | | (45,274 | ) |
Starbucks Corp. | | | 1,629 | | | | (1.34 | )% | | | (51,840 | ) |
Scotts Miracle-Gro Co. — Class A | | | 477 | | | | (0.88 | )% | | | (57,551 | ) |
Total Consumer, Cyclical | | | | | | | | | | | (301,355 | ) |
| | | | | | | | | | | | | |
Utilities | | | | | | | | | | | | |
ALLETE, Inc. | | | 806 | | | | (0.41 | )% | | | (1,236 | ) |
SEE NOTES TO FINANCIAL STATEMENTS. | THE GUGGENHEIM FUNDS SEMI-ANNUAL REPORT | 21 |
SCHEDULE OF INVESTMENTS (Unaudited)(continued) | March 31, 2021 |
ALPHA OPPORTUNITY FUND | |
| | Shares | | | Percentage
Notional
Amount | | |
Value and
Unrealized
Appreciation
(Depreciation)
| |
California Water Service Group | | | 1,320 | | | | (0.56 | )% | | $ | (3,865 | ) |
Total Utilities | | | | | | | | | | | (5,101 | ) |
| | | | | | | | | | | | | |
Communications | | | | | | | | | | | | |
Q2 Holdings, Inc. | | | 623 | | | | (0.47 | )% | | | (8,806 | ) |
Liberty Broadband Corp. — Class C | | | 1,272 | | | | (1.43 | )% | | | (11,647 | ) |
Zendesk, Inc. | | | 554 | | | | (0.55 | )% | | | (14,291 | ) |
Total Communications | | | | | | | | | | | (34,744 | ) |
| | | | | | | | | | | | | |
Technology | | | | | | | | | | | | |
Pegasystems, Inc. | | | 709 | | | | (0.61 | )% | | | 4,994 | |
Clarivate plc | | | 2,969 | | | | (0.59 | )% | | | 1,619 | |
Coupa Software, Inc. | | | 127 | | | | (0.24 | )% | | | (851 | ) |
Rapid7, Inc. | | | 877 | | | | (0.49 | )% | | | (1,366 | ) |
salesforce.com, Inc. | | | 166 | | | | (0.26 | )% | | | (1,822 | ) |
Tyler Technologies, Inc. | | | 87 | | | | (0.28 | )% | | | (3,392 | ) |
Smartsheet, Inc. — Class A | | | 552 | | | | (0.26 | )% | | | (9,510 | ) |
HubSpot, Inc. | | | 79 | | | | (0.27 | )% | | | (13,259 | ) |
Varonis Systems, Inc. | | | 1,182 | | | | (0.46 | )% | | | (14,645 | ) |
Total Technology | | | | | | | | | | | (38,232 | ) |
Total GS Equity Short Custom Basket | | | | | | $ | (1,561,868 | ) |
* | Non-income producing security. |
† | Value determined based on Level 1 inputs — See Note 4. |
†† | Value determined based on Level 2 inputs — See Note 4. |
1 | All or a portion of this security is pledged as custom basket swap collateral at March 31, 2021. |
2 | Rate indicated is the 7-day yield as of March 31, 2021. |
| | GS — Goldman Sachs International |
| | MS — Morgan Stanley Capital Services LLC |
| | plc — Public Limited Company |
| | REIT — Real Estate Investment Trust |
| | |
| | See Sector Classification in Other Information section. |
22 | THE GUGGENHEIM FUNDS SEMI-ANNUAL REPORT | SEE NOTES TO FINANCIAL STATEMENTS. |
SCHEDULE OF INVESTMENTS (Unaudited)(concluded) | March 31, 2021 |
ALPHA OPPORTUNITY FUND | |
The following table summarizes the inputs used to value the Fund’s investments at March 31, 2021 (See Note 4 in the Notes to Financial Statements):
Investments in Securities (Assets) | | Level 1
Quoted
Prices | | | Level 2
Significant
Observable
Inputs | | | Level 3
Significant
Unobservable
Inputs | | | Total | |
Common Stocks | | $ | 37,990,061 | | | $ | — | | | $ | — | | | $ | 37,990,061 | |
Money Market Fund | | | 1,715,994 | | | | — | | | | — | | | | 1,715,994 | |
Equity Custom Basket Swap Agreements** | | | — | | | | 679,482 | | | | — | | | | 679,482 | |
Total Assets | | $ | 39,706,055 | | | $ | 679,482 | | | $ | — | | | $ | 40,385,537 | |
Investments in Securities (Liabilities) | | Level 1
Quoted
Prices | | | Level 2
Significant
Observable
Inputs | | | Level 3
Significant
Unobservable
Inputs | | | Total | |
Equity Custom Basket Swap Agreements** | | $ | — | | | $ | 3,153,034 | | | $ | — | | | $ | 3,153,034 | |
** | This derivative is reported as unrealized appreciation/depreciation at period end. |
SEE NOTES TO FINANCIAL STATEMENTS. | THE GUGGENHEIM FUNDS SEMI-ANNUAL REPORT | 23 |
STATEMENT OF ASSETS AND LIABILITIES (Unaudited) |
March 31, 2021 |
Assets: |
Investments, at value (cost $34,871,230) | | $ | 39,706,055 | |
Cash | | | 592 | |
Unrealized appreciation on OTC swap agreements | | | 679,482 | |
Prepaid expenses | | | 50,614 | |
Receivables: |
Dividends | | | 59,749 | |
Interest | | | 8 | |
Total assets | | | 40,496,500 | |
| | | | | |
Liabilities: |
Unrealized depreciation on OTC swap agreements | | | 3,153,034 | |
Payable for: |
Swap settlement | | | 835,948 | |
Management fees | | | 21,465 | |
Transfer agent/maintenance fees | | | 6,430 | |
Fund accounting/administration fees | | | 6,032 | |
Trustees’ fees* | | | 3,087 | |
Distribution and service fees | | | 1,307 | |
Fund shares redeemed | | | 174 | |
Miscellaneous | | | 42,073 | |
Total liabilities | | | 4,069,550 | |
Net assets | | $ | 36,426,950 | |
| | | | | |
Net assets consist of: |
Paid in capital | | $ | 62,489,280 | |
Total distributable earnings (loss) | | | (26,062,330 | ) |
Net assets | | $ | 36,426,950 | |
| | | | | |
A-Class: |
Net assets | | $ | 3,268,137 | |
Capital shares outstanding | | | 174,003 | |
Net asset value per share | | $ | 18.78 | |
Maximum offering price per share (Net asset value divided by 95.25%) | | $ | 19.72 | |
| | | | | |
C-Class: |
Net assets | | $ | 311,565 | |
Capital shares outstanding | | | 18,931 | |
Net asset value per share | | $ | 16.46 | |
| | | | | |
P-Class: |
Net assets | | $ | 1,830,026 | |
Capital shares outstanding | | | 96,596 | |
Net asset value per share | | $ | 18.95 | |
| | | | | |
Institutional Class: |
Net assets | | $ | 31,017,222 | |
Capital shares outstanding | | | 1,128,958 | |
Net asset value per share | | $ | 27.47 | |
STATEMENT OF OPERATIONS (Unaudited) |
Six Months Ended March 31, 2021 |
Investment Income: |
Dividends | | $ | 466,402 | |
Interest | | | 42 | |
Total investment income | | | 466,444 | |
| | | | | |
Expenses: |
Management fees | | | 165,169 | |
Distribution and service fees: |
A-Class | | | 4,127 | |
C-Class | | | 1,571 | |
P-Class | | | 1,819 | |
Transfer agent/maintenance fees: |
A-Class | | | 2,803 | |
C-Class | | | 464 | |
P-Class | | | 2,017 | |
Institutional Class | | | 10,744 | |
Registration fees | | | 34,003 | |
Professional fees | | | 23,223 | |
Fund accounting/administration fees | | | 17,033 | |
Trustees’ fees* | | | 10,128 | |
Custodian fees | | | 8,595 | |
Line of credit fees | | | 627 | |
Interest expense | | | 78 | |
Miscellaneous | | | 9,044 | |
Recoupment of previously waived fees: |
A-Class | | | 343 | |
Institutional Class | | | 1,490 | |
Total expenses | | | 293,278 | |
Less: |
Expenses reimbursed by Adviser: |
A-Class | | | (2,016 | ) |
C-Class | | | (362 | ) |
P-Class | | | (1,551 | ) |
Institutional Class | | | (4,322 | ) |
Expenses waived by Adviser | | | (3,510 | ) |
Earnings credits applied | | | (7 | ) |
Total waived/reimbursed expenses | | | (11,768 | ) |
Net expenses | | | 281,510 | |
Net investment income | | | 184,934 | |
| | | | | |
Net Realized and Unrealized Gain (Loss): |
Net realized gain (loss) on: |
Investments | | | 4,372,691 | |
Swap agreements | | | (4,057,635 | ) |
Net realized gain | | | 315,056 | |
Net change in unrealized appreciation (depreciation) on: |
Investments | | | 5,371,675 | |
Swap agreements | | | (1,467,379 | ) |
Net change in unrealized appreciation (depreciation) | | | 3,904,296 | |
Net realized and unrealized gain | | | 4,219,352 | |
Net increase in net assets resulting from operations | | $ | 4,404,286 | |
* | Relates to Trustees not deemed “interested persons” within the meaning of Section 2(a)(19) of the 1940 Act. |
24 | THE GUGGENHEIM FUNDS SEMI-ANNUAL REPORT | SEE NOTES TO FINANCIAL STATEMENTS. |
STATEMENTS OF CHANGES IN NET ASSETS |
| | Six Months Ended
March 31, 2021
(Unaudited) | | | Year Ended
September 30,
2020 | |
Increase (Decrease) in Net Assets from Operations: | | | | | | | | |
Net investment income | | $ | 184,934 | | | $ | 560,342 | |
Net realized gain (loss) on investments | | | 315,056 | | | | (4,172,863 | ) |
Net change in unrealized appreciation (depreciation) on investments | | | 3,904,296 | | | | (1,111,702 | ) |
Net increase (decrease) in net assets resulting from operations | | | 4,404,286 | | | | (4,724,223 | ) |
| | | | | | | | | |
Distributions to shareholders: | | | | | | | | |
A-Class | | | (41,923 | ) | | | (62,477 | ) |
C-Class | | | (666 | ) | | | — | |
P-Class | | | (18,203 | ) | | | (14,549 | ) |
Institutional Class | | | (351,160 | ) | | | (785,413 | ) |
Total distributions to shareholders | | | (411,952 | ) | | | (862,439 | ) |
| | | | | | | | | |
Capital share transactions: | | | | | | | | |
Proceeds from sale of shares | | | | | | | | |
A-Class | | | 111,438 | | | | 257,347 | |
C-Class | | | 2,850 | | | | 5,850 | |
P-Class | | | 747,007 | | | | 395,733 | |
Institutional Class | | | 407,167 | | | | 1,995,224 | |
Distributions reinvested | | | | | | | | |
A-Class | | | 39,965 | | | | 60,267 | |
C-Class | | | 628 | | | | — | |
P-Class | | | 18,203 | | | | 14,549 | |
Institutional Class | | | 345,735 | | | | 776,126 | |
Cost of shares redeemed | | | | | | | | |
A-Class | | | (652,883 | ) | | | (3,940,371 | ) |
C-Class | | | (80,924 | ) | | | (339,528 | ) |
P-Class | | | (257,871 | ) | | | (1,089,176 | ) |
Institutional Class | | | (5,450,374 | ) | | | (44,596,146 | ) |
Net decrease from capital share transactions | | | (4,769,059 | ) | | | (46,460,125 | ) |
Net decrease in net assets | | | (776,725 | ) | | | (52,046,787 | ) |
| | | | | | | | | |
Net assets: | | | | | | | | |
Beginning of period | | | 37,203,675 | | | | 89,250,462 | |
End of period | | $ | 36,426,950 | | | $ | 37,203,675 | |
| | | | | | | | | |
Capital share activity: | | | | | | | | |
Shares sold | | | | | | | | |
A-Class | | | 6,299 | | | | 14,992 | |
C-Class | | | 187 | | | | 398 | |
P-Class | | | 42,173 | | | | 22,812 | |
Institutional Class | | | 15,958 | | | | 82,744 | |
Shares issued from reinvestment of distributions | | | | | | | | |
A-Class | | | 2,300 | | | | 3,442 | |
C-Class | | | 41 | | | | — | |
P-Class | | | 1,038 | | | | 823 | |
Institutional Class | | | 13,612 | | | | 30,436 | |
Shares redeemed | | | | | | | | |
A-Class | | | (37,558 | ) | | | (235,922 | ) |
C-Class | | | (5,335 | ) | | | (22,693 | ) |
P-Class | | | (14,658 | ) | | | (64,097 | ) |
Institutional Class | | | (209,120 | ) | | | (1,931,549 | ) |
Net decrease in shares | | | (185,063 | ) | | | (2,098,614 | ) |
SEE NOTES TO FINANCIAL STATEMENTS. | THE GUGGENHEIM FUNDS SEMI-ANNUAL REPORT | 25 |
This table is presented to show selected data for a share outstanding throughout each period and to assist shareholders in evaluating a Fund’s performance for the periods presented.
A-Class | | Six Months Ended
March 31, 2021a | | | Year Ended
September 30,
2020 | | | Year Ended
September 30,
2019 | | | Year Ended
September 30,
2018 | | | Year Ended
September 30,
2017 | | | Year Ended
September 30,
2016 | |
Per Share Data |
Net asset value, beginning of period | | $ | 16.89 | | | $ | 17.42 | | | $ | 19.15 | | | $ | 21.10 | | | $ | 19.08 | | | $ | 18.39 | |
Income (loss) from investment operations: |
Net investment income (loss)b | | | .07 | | | | .11 | | | | .12 | | | | .10 | | | | .31 | | | | (.19 | ) |
Net gain (loss) on investments (realized and unrealized) | | | 2.03 | | | | (.48 | ) | | | (1.64 | ) | | | (.60 | ) | | | 1.72 | | | | .88 | |
Total from investment operations | | | 2.10 | | | | (.37 | ) | | | (1.52 | ) | | | (.50 | ) | | | 2.03 | | | | .69 | |
Less distributions from: |
Net investment income | | | (.21 | ) | | | (.16 | ) | | | (.21 | ) | | | — | | | | — | | | | — | |
Net realized gains | | | — | | | | — | | | | — | | | | (1.45 | ) | | | (.01 | ) | | | — | |
Total distributions | | | (.21 | ) | | | (.16 | ) | | | (.21 | ) | | | (1.45 | ) | | | (.01 | ) | | | — | |
Net asset value, end of period | | $ | 18.78 | | | $ | 16.89 | | | $ | 17.42 | | | $ | 19.15 | | | $ | 21.10 | | | $ | 19.08 | |
|
Total Returnc | | | 12.54 | % | | | (2.15 | %) | | | (7.97 | %) | | | (2.90 | %) | | | 10.70 | % | | | 3.70 | % |
Ratios/Supplemental Data |
Net assets, end of period (in thousands) | | $ | 3,268 | | | $ | 3,429 | | | $ | 7,326 | | | $ | 11,243 | | | $ | 15,011 | | | $ | 16,041 | |
Ratios to average net assets: |
Net investment income (loss) | | | 0.79 | % | | | 0.65 | % | | | 0.64 | % | | | 0.51 | % | | | 1.49 | % | | | (1.02 | %) |
Total expensesd | | | 1.90 | % | | | 1.73 | % | | | 1.65 | % | | | 1.54 | % | | | 2.21 | % | | | 2.69 | % |
Net expensese,f,g | | | 1.76 | % | | | 1.69 | % | | | 1.64 | % | | | 1.54 | % | | | 2.17 | % | | | 2.69 | % |
Portfolio turnover rate | | | 57 | % | | | 209 | % | | | 126 | % | | | 255 | % | | | 92 | % | | | 235 | % |
C-Class | | Six Months Ended
March 31, 2021a | | | Year Ended
September 30,
2020 | | | Year Ended
September 30,
2019 | | | Year Ended
September 30,
2018 | | | Year Ended
September 30,
2017 | | | Year Ended
September 30,
2016 | |
Per Share Data |
Net asset value, beginning of period | | $ | 14.71 | | | $ | 15.16 | | | $ | 16.61 | | | $ | 18.62 | | | $ | 16.96 | | | $ | 16.47 | |
Income (loss) from investment operations: |
Net investment income (loss)b | | | — | h | | | (.02 | ) | | | (.03 | ) | | | (.05 | ) | | | .09 | | | | (.29 | ) |
Net gain (loss) on investments (realized and unrealized) | | | 1.78 | | | | (.43 | ) | | | (1.42 | ) | | | (.51 | ) | | | 1.58 | | | | .78 | |
Total from investment operations | | | 1.78 | | | | (.45 | ) | | | (1.45 | ) | | | (.56 | ) | | | 1.67 | | | | .49 | |
Less distributions from: |
Net investment income | | | (.03 | ) | | | — | | | | — | | | | — | | | | — | | | | — | |
Net realized gains | | | — | | | | — | | | | — | | | | (1.45 | ) | | | (.01 | ) | | | — | |
Total distributions | | | (.03 | ) | | | — | | | | — | | | | (1.45 | ) | | | (.01 | ) | | | — | |
Net asset value, end of period | | $ | 16.46 | | | $ | 14.71 | | | $ | 15.16 | | | $ | 16.61 | | | $ | 18.62 | | | $ | 16.96 | |
|
Total Returnc | | | 12.14 | % | | | (2.97 | %) | | | (8.73 | %) | | | (3.65 | %) | | | 9.91 | % | | | 2.91 | % |
Ratios/Supplemental Data |
Net assets, end of period (in thousands) | | $ | 312 | | | $ | 354 | | | $ | 702 | | | $ | 1,036 | | | $ | 2,508 | | | $ | 1,550 | |
Ratios to average net assets: |
Net investment income (loss) | | | 0.03 | % | | | (0.15 | %) | | | (0.20 | %) | | | (0.31 | %) | | | 0.47 | % | | | (1.72 | %) |
Total expensesd | | | 2.75 | % | | | 2.72 | % | | | 2.55 | % | | | 2.34 | % | | | 2.94 | % | | | 3.91 | % |
Net expensese,f,g | | | 2.51 | % | | | 2.51 | % | | | 2.48 | % | | | 2.31 | % | | | 2.88 | % | | | 3.46 | % |
Portfolio turnover rate | | | 57 | % | | | 209 | % | | | 126 | % | | | 255 | % | | | 92 | % | | | 235 | % |
26 | THE GUGGENHEIM FUNDS SEMI-ANNUAL REPORT | SEE NOTES TO FINANCIAL STATEMENTS. |
FINANCIAL HIGHLIGHTS (continued) |
This table is presented to show selected data for a share outstanding throughout each period and to assist shareholders in evaluating a Fund’s performance for the periods presented.
P-Class | | Six Months Ended
March 31, 2021a | | | Year Ended
September 30,
2020 | | | Year Ended
September 30,
2019 | | | Year Ended
September 30,
2018 | | | Year Ended
September 30,
2017 | | | Year Ended
September 30,
2016 | |
Per Share Data |
Net asset value, beginning of period | | $ | 17.06 | | | $ | 17.56 | | | $ | 19.23 | | | $ | 21.19 | | | $ | 19.11 | | | $ | 18.39 | |
Income (loss) from investment operations: |
Net investment income (loss)b | | | .07 | | | | .12 | | | | .11 | | | | .10 | | | | (.06 | ) | | | (.12 | ) |
Net gain (loss) on investments (realized and unrealized) | | | 2.05 | | | | (.49 | ) | | | (1.64 | ) | | | (.61 | ) | | | 2.15 | | | | .84 | |
Total from investment operations | | | 2.12 | | | | (.37 | ) | | | (1.53 | ) | | | (.51 | ) | | | 2.09 | | | | .72 | |
Less distributions from: |
Net investment income | | | (.23 | ) | | | (.13 | ) | | | (.14 | ) | | | — | | | | — | | | | — | |
Net realized gains | | | — | | | | — | | | | — | | | | (1.45 | ) | | | (.01 | ) | | | — | |
Total distributions | | | (.23 | ) | | | (.13 | ) | | | (.14 | ) | | | (1.45 | ) | | | (.01 | ) | | | — | |
Net asset value, end of period | | $ | 18.95 | | | $ | 17.06 | | | $ | 17.56 | | | $ | 19.23 | | | $ | 21.19 | | | $ | 19.11 | |
|
Total Return | | | 12.57 | % | | | (2.11 | %) | | | (7.99 | %) | | | (2.93 | %) | | | 11.00 | % | | | 3.86 | % |
Ratios/Supplemental Data |
Net assets, end of period (in thousands) | | $ | 1,830 | | | $ | 1,161 | | | $ | 1,905 | | | $ | 4,525 | | | $ | 7,720 | | | $ | 4,453 | |
Ratios to average net assets: |
Net investment income (loss) | | | 0.79 | % | | | 0.70 | % | | | 0.59 | % | | | 0.47 | % | | | (0.31 | %) | | | (0.65 | %) |
Total expensesd | | | 2.00 | % | | | 1.67 | % | | | 1.67 | % | | | 1.58 | % | | | 1.75 | % | | | 2.44 | % |
Net expensese,f,g | | | 1.76 | % | | | 1.64 | % | | | 1.66 | % | | | 1.57 | % | | | 1.72 | % | | | 2.44 | % |
Portfolio turnover rate | | | 57 | % | | | 209 | % | | | 126 | % | | | 255 | % | | | 92 | % | | | 235 | % |
SEE NOTES TO FINANCIAL STATEMENTS. | THE GUGGENHEIM FUNDS SEMI-ANNUAL REPORT | 27 |
FINANCIAL HIGHLIGHTS (concluded) |
This table is presented to show selected data for a share outstanding throughout each period and to assist shareholders in evaluating a Fund’s performance for the periods presented.
Institutional Class | | Six Months Ended
March 31, 2021a | | | Year Ended
September 30,
2020 | | | Year Ended
September 30,
2019 | | | Year Ended
September 30,
2018 | | | Year Ended
September 30,
2017 | | | Year Ended
September 30,
2016 | |
Per Share Data |
Net asset value, beginning of period | | $ | 24.65 | | | $ | 25.37 | | | $ | 27.77 | | | $ | 29.86 | | | $ | 26.82 | | | $ | 25.73 | |
Income (loss) from investment operations: |
Net investment income (loss)b | | | .13 | | | | .25 | | | | .28 | | | | .27 | | | | .12 | | | | (.13 | ) |
Net gain (loss) on investments (realized and unrealized) | | | 2.97 | | | | (.72 | ) | | | (2.37 | ) | | | (.91 | ) | | | 2.93 | | | | 1.22 | |
Total from investment operations | | | 3.10 | | | | (.47 | ) | | | (2.09 | ) | | | (.64 | ) | | | 3.05 | | | | 1.09 | |
Less distributions from: |
Net investment income | | | (.28 | ) | | | (.25 | ) | | | (.31 | ) | | | — | | | | — | | | | — | |
Net realized gains | | | — | | | | — | | | | — | | | | (1.45 | ) | | | (.01 | ) | | | — | |
Total distributions | | | (.28 | ) | | | (.25 | ) | | | (.31 | ) | | | (1.45 | ) | | | (.01 | ) | | | — | |
Net asset value, end of period | | $ | 27.47 | | | $ | 24.65 | | | $ | 25.37 | | | $ | 27.77 | | | $ | 29.86 | | | $ | 26.82 | |
|
Total Return | | | 12.68 | % | | | (1.87 | %) | | | (7.57 | %) | | | (2.50 | %) | | | 11.42 | % | | | 4.20 | % |
Ratios/Supplemental Data |
Net assets, end of period (in thousands) | | $ | 31,017 | | | $ | 32,260 | | | $ | 79,318 | | | $ | 181,095 | | | $ | 196,180 | | | $ | 56,550 | |
Ratios to average net assets: |
Net investment income (loss) | | | 1.05 | % | | | 1.00 | % | | | 1.05 | % | | | 0.94 | % | | | 0.40 | % | | | (0.49 | %) |
Total expensesd | | | 1.54 | % | | | 1.36 | % | | | 1.22 | % | | | 1.12 | % | | | 1.38 | % | | | 2.23 | % |
Net expensese,f,g | | | 1.49 | % | | | 1.36 | % | | | 1.21 | % | | | 1.12 | % | | | 1.37 | % | | | 2.23 | % |
Portfolio turnover rate | | | 57 | % | | | 209 | % | | | 126 | % | | | 255 | % | | | 92 | % | | | 235 | % |
a | Unaudited figures for the period ended March 31, 2021. Percentage amounts for the period, except total return and portfolio turnover rate, have been annualized. |
b | Net investment income (loss) per share was computed using average shares outstanding throughout the period. |
c | Total return does not reflect the impact of any applicable sales charges. |
d | Does not include expenses of the underlying funds in which the Fund invests. |
e | Net expense information reflects the expense ratios after expense waivers and reimbursements, as applicable. |
f | The portion of the ratios of net expenses to average net assets attributable to recoupments of prior fee reductions or expense reimbursements for the periods presented was as follows: |
| | | 03/31/21a | 09/30/20 | 09/30/19 | 09/30/18 | 09/30/17 |
| | A-Class | 0.02% | 0.02% | 0.09% | 0.02% | 0.32% |
| | C-Class | — | 0.01% | 0.04% | 0.07% | 0.64% |
| | P-Class | — | 0.01% | 0.03% | 0.04% | — |
| | Institutional Class | 0.01% | 0.00%* | 0.00%* | — | 0.01% |
g | Net expenses may include expenses that are excluded from the expense limitation agreement. Excluding these expenses, the net expense ratios for the periods presented would be: |
| | | 03/31/21a | 09/30/20 | 09/30/19 | 09/30/18 | 09/30/17 | 09/30/16 |
| | A-Class | 1.75% | 1.69% | 1.64% | 1.52% | 2.00% | 2.11% |
| | C-Class | 2.50% | 2.51% | 2.48% | 2.30% | 2.71% | 2.86% |
| | P-Class | 1.76% | 1.64% | 1.66% | 1.56% | 1.68% | 1.87% |
| | Institutional Class | 1.49% | 1.36% | 1.21% | 1.11% | 1.28% | 1.63% |
h | Net investment income (loss) is less than $0.01 per share. |
28 | THE GUGGENHEIM FUNDS SEMI-ANNUAL REPORT | SEE NOTES TO FINANCIAL STATEMENTS. |
PERFORMANCE REPORT AND FUND PROFILE (Unaudited) | March 31, 2021 |
LARGE CAP VALUE FUND
OBJECTIVE: Seeks long-term growth of capital.
Holdings Diversification (Market Exposure as % of Net Assets)
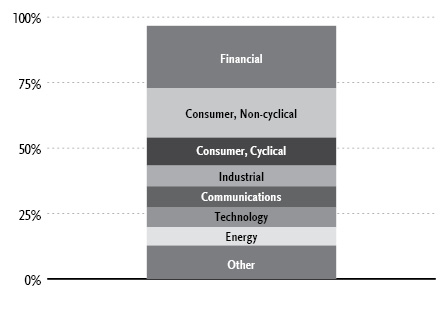
“Holdings Diversification (Market Exposure as % of Net Assets)” excludes any temporary cash investments.
Inception Dates: |
A-Class | August 7, 1944 |
C-Class | January 29, 1999 |
P-Class | May 1, 2015 |
Institutional Class | June 7, 2013 |
Ten Largest Holdings (% of Total Net Assets) |
JPMorgan Chase & Co. | 2.5% |
Verizon Communications, Inc. | 2.5% |
Micron Technology, Inc. | 2.4% |
Berkshire Hathaway, Inc. — Class B | 2.1% |
Johnson & Johnson | 2.1% |
Tyson Foods, Inc. — Class A | 2.0% |
Comcast Corp. — Class A | 1.9% |
Bank of America Corp. | 1.9% |
Wells Fargo & Co. | 1.9% |
Chevron Corp. | 1.7% |
Top Ten Total | 21.0% |
| | |
“Ten Largest Holdings” excludes any temporary cash investments. |
| | THE GUGGENHEIM FUNDS SEMI-ANNUAL REPORT | 29 |
PERFORMANCE REPORT AND FUND PROFILE (Unaudited)(concluded) | March 31, 2021 |
Average Annual Returns*
Periods Ended March 31, 2021
| 6 Month† | 1 Year | 5 Year | 10 Year |
A-Class Shares | 35.54% | 62.64% | 11.93% | 9.55% |
A-Class Shares with sales charge‡ | 29.11% | 54.90% | 10.85% | 9.02% |
C-Class Shares | 35.03% | 61.44% | 11.09% | 8.74% |
C-Class Shares with CDSC§ | 34.03% | 60.44% | 11.09% | 8.74% |
Russell 1000 Value Index | 29.34% | 56.09% | 11.74% | 10.99% |
| 6 Month† | 1 Year | 5 Year | Since
Inception
(05/01/15) |
P-Class Shares | 35.53% | 62.62% | 11.93% | 9.05% |
Russell 1000 Value Index | 29.34% | 56.09% | 11.74% | 9.21% |
| 6 Month† | 1 Year | 5 Year | Since
Inception
(06/07/13) |
Institutional Class Shares | 35.71% | 63.08% | 12.20% | 10.02% |
Russell 1000 Value Index | 29.34% | 56.09% | 11.74% | 10.43% |
* | The performance data above represents past performance that is not predictive of future results. The investment return and principal value of an investment in the Fund will fluctuate so that an investor’s shares, when redeemed, may be worth more or less than their original cost. Returns are historical and include changes in principal and reinvested dividends and capital gains and do not reflect the effect of taxes. The Russell 1000 Value Index is an unmanaged index and, unlike the Fund, has no management fees or operating expenses to reduce its reported return. |
† | 6 month returns are not annualized. |
‡ | Fund returns are calculated using the maximum sales charge of 4.75%. |
§ | Fund returns include a CDSC of 1% if redeemed within 12 months of purchase. |
30 | THE GUGGENHEIM FUNDS SEMI-ANNUAL REPORT | |
SCHEDULE OF INVESTMENTS (Unaudited) | March 31, 2021 |
LARGE CAP VALUE FUND | |
| | Shares | | | Value | |
COMMON STOCKS† - 96.7% |
| | | | | | | | | |
Financial - 23.8% |
JPMorgan Chase & Co. | | | 6,526 | | | $ | 993,453 | |
Berkshire Hathaway, Inc. — Class B* | | | 3,256 | | | | 831,810 | |
Bank of America Corp. | | | 18,761 | | | | 725,863 | |
Wells Fargo & Co. | | | 18,543 | | | | 724,475 | |
Citigroup, Inc. | | | 6,742 | | | | 490,481 | |
Morgan Stanley | | | 6,187 | | | | 480,482 | |
Allstate Corp. | | | 3,930 | | | | 451,557 | |
MetLife, Inc. | | | 7,360 | | | | 447,415 | |
Synovus Financial Corp. | | | 9,053 | | | | 414,175 | |
Hartford Financial Services Group, Inc. | | | 5,741 | | | | 383,441 | |
Principal Financial Group, Inc. | | | 6,393 | | | | 383,324 | |
Prudential Financial, Inc. | | | 4,099 | | | | 373,419 | |
Voya Financial, Inc. | | | 5,629 | | | | 358,230 | |
Charles Schwab Corp. | | | 4,430 | | | | 288,747 | |
Regions Financial Corp. | | | 12,450 | | | | 257,217 | |
Medical Properties Trust, Inc. REIT | | | 11,253 | | | | 239,464 | |
Park Hotels & Resorts, Inc. REIT* | | | 10,682 | | | | 230,518 | |
KeyCorp | | | 10,260 | | | | 204,995 | |
Zions Bancorp North America | | | 3,490 | | | | 191,810 | |
Mastercard, Inc. — Class A | | | 531 | | | | 189,063 | |
Gaming and Leisure Properties, Inc. REIT | | | 4,284 | | | | 181,770 | |
Jones Lang LaSalle, Inc.* | | | 926 | | | | 165,791 | |
BOK Financial Corp. | | | 1,601 | | | | 143,001 | |
American International Group, Inc. | | | 3,078 | | | | 142,234 | |
Total Financial | | | | | | | 9,292,735 | |
| | | | | | | | | |
Consumer, Non-cyclical - 18.9% |
Johnson & Johnson | | | 4,870 | | | | 800,385 | |
Tyson Foods, Inc. — Class A | | | 10,678 | | | | 793,375 | |
Humana, Inc. | | | 1,615 | | | | 677,089 | |
HCA Healthcare, Inc. | | | 3,443 | | | | 648,455 | |
McKesson Corp. | | | 2,560 | | | | 499,302 | |
Archer-Daniels-Midland Co. | | | 8,690 | | | | 495,330 | |
Quest Diagnostics, Inc. | | | 3,627 | | | | 465,489 | |
Medtronic plc | | | 3,632 | | | | 429,048 | |
J M Smucker Co. | | | 2,979 | | | | 376,933 | |
Encompass Health Corp. | | | 4,310 | | | | 352,989 | |
Bunge Ltd. | | | 4,271 | | | | 338,562 | |
Zimmer Biomet Holdings, Inc. | | | 2,098 | | | | 335,848 | |
Amgen, Inc. | | | 1,160 | | | | 288,620 | |
Merck & Company, Inc. | | | 3,733 | | | | 287,777 | |
Procter & Gamble Co. | | | 1,438 | | | | 194,748 | |
Ingredion, Inc. | | | 2,163 | | | | 194,497 | |
Pfizer, Inc. | | | 4,927 | | | | 178,505 | |
Total Consumer, Non-cyclical | | | | | | | 7,356,952 | |
| | | | | | | | | |
Consumer, Cyclical - 10.7% |
Walmart, Inc. | | | 4,354 | | | | 591,404 | |
Kohl’s Corp. | | | 8,436 | | | | 502,870 | |
Southwest Airlines Co.* | | | 8,084 | | | | 493,609 | |
LKQ Corp.* | | | 9,048 | | | | 383,002 | |
DR Horton, Inc. | | | 4,246 | | | | 378,404 | |
Lear Corp. | | | 2,052 | | | | 371,925 | |
Penske Automotive Group, Inc. | | | 4,232 | | | | 339,575 | |
PACCAR, Inc. | | | 3,462 | | | | 321,689 | |
Home Depot, Inc. | | | 996 | | | | 304,029 | |
PVH Corp.* | | | 2,358 | | | | 249,241 | |
Ralph Lauren Corp. — Class A* | | | 1,925 | | | | 237,083 | |
Total Consumer, Cyclical | | | | | | | 4,172,831 | |
| | | | | | | | | |
Industrial - 8.0% |
Honeywell International, Inc. | | | 2,769 | | | | 601,067 | |
Johnson Controls International plc | | | 7,830 | | | | 467,216 | |
Knight-Swift Transportation Holdings, Inc. | | | 7,758 | | | | 373,082 | |
Valmont Industries, Inc. | | | 1,520 | | | | 361,258 | |
L3Harris Technologies, Inc. | | | 1,448 | | | | 293,481 | |
FedEx Corp. | | | 990 | | | | 281,200 | |
Curtiss-Wright Corp. | | | 2,333 | | | | 276,694 | |
Owens Corning | | | 2,852 | | | | 262,641 | |
General Electric Co. | | | 16,349 | | | | 214,662 | |
Total Industrial | | | | | | | 3,131,301 | |
| | | | | | | | | |
Communications - 7.9% |
Verizon Communications, Inc. | | | 16,953 | | | | 985,817 | |
Comcast Corp. — Class A | | | 13,991 | | | | 757,053 | |
Cisco Systems, Inc. | | | 7,671 | | | | 396,667 | |
Alphabet, Inc. — Class A* | | | 144 | | | | 297,003 | |
Walt Disney Co.* | | | 1,396 | | | | 257,590 | |
T-Mobile US, Inc.* | | | 1,634 | | | | 204,724 | |
Juniper Networks, Inc. | | | 7,162 | | | | 181,413 | |
Total Communications | | | | | | | 3,080,267 | |
| | | | | | | | | |
Technology - 7.6% |
Micron Technology, Inc.* | | | 10,697 | | | | 943,582 | |
Skyworks Solutions, Inc. | | | 3,268 | | | | 599,613 | |
Qorvo, Inc.* | | | 2,268 | | | | 414,363 | |
Apple, Inc. | | | 2,661 | | | | 325,041 | |
Intel Corp. | | | 3,836 | | | | 245,504 | |
Amdocs Ltd. | | | 2,777 | | | | 194,807 | |
Cerner Corp. | | | 2,157 | | | | 155,045 | |
DXC Technology Co.* | | | 3,146 | | | | 98,344 | |
Total Technology | | | | | | | 2,976,299 | |
| | | | | | | | | |
Energy - 7.1% |
Chevron Corp. | | | 6,513 | | | | 682,497 | |
ConocoPhillips | | | 9,454 | | | | 500,778 | |
Cabot Oil & Gas Corp. — Class A | | | 15,688 | | | | 294,621 | |
Marathon Oil Corp. | | | 27,332 | | | | 291,906 | |
Range Resources Corp.* | | | 26,545 | | | | 274,210 | |
Pioneer Natural Resources Co. | | | 1,695 | | | | 269,200 | |
Exxon Mobil Corp. | | | 4,271 | | | | 238,450 | |
Patterson-UTI Energy, Inc. | | | 29,265 | | | | 208,659 | |
Total Energy | | | | | | | 2,760,321 | |
| | | | | | | | | |
SEE NOTES TO FINANCIAL STATEMENTS. | THE GUGGENHEIM FUNDS SEMI-ANNUAL REPORT | 31 |
SCHEDULE OF INVESTMENTS (Unaudited)(concluded) | March 31, 2021 |
LARGE CAP VALUE FUND | |
| | Shares | | | Value | |
Utilities - 6.8% |
Exelon Corp. | | | 13,360 | | | $ | 584,366 | |
Public Service Enterprise Group, Inc. | | | 8,648 | | | | 520,696 | |
Edison International | | | 7,992 | | | | 468,331 | |
Duke Energy Corp. | | | 3,801 | | | | 366,911 | |
Pinnacle West Capital Corp. | | | 4,002 | | | | 325,563 | |
NiSource, Inc. | | | 8,523 | | | | 205,489 | |
PPL Corp. | | | 5,782 | | | | 166,753 | |
Total Utilities | | | | | | | 2,638,109 | |
| | | | | | | | | |
Basic Materials - 5.9% |
Huntsman Corp. | | | 20,447 | | | | 589,487 | |
Nucor Corp. | | | 6,947 | | | | 557,636 | |
Westlake Chemical Corp. | | | 5,207 | | | | 462,329 | |
Reliance Steel & Aluminum Co. | | | 1,872 | | | | 285,087 | |
International Flavors & Fragrances, Inc. | | | 1,105 | | | | 154,269 | |
Dow, Inc. | | | 2,118 | | | | 135,425 | |
DuPont de Nemours, Inc. | | | 1,392 | | | | 107,574 | |
Total Basic Materials | | | | | | | 2,291,807 | |
| | | | | | | | | |
Total Common Stocks | | | | |
(Cost $28,009,989) | | | | | | | 37,700,622 | |
| | | | | | | | | |
MONEY MARKET FUND† - 3.4% |
Dreyfus Treasury Securities Cash Management Fund — Institutional Shares, 0.01%1 | | | 1,341,375 | | | $ | 1,341,375 | |
Total Money Market Fund | | | | |
(Cost $1,341,375) | | | | | | | 1,341,375 | |
| | | | | | | | | |
Total Investments - 100.1% | | | | |
(Cost $29,351,364) | | $ | 39,041,997 | |
Other Assets & Liabilities, net - (0.1)% | | | (31,792 | ) |
Total Net Assets - 100.0% | | $ | 39,010,205 | |
* | Non-income producing security. |
† | Value determined based on Level 1 inputs — See Note 4. |
1 | Rate indicated is the 7-day yield as of March 31, 2021. |
| | plc — Public Limited Company |
| | REIT — Real Estate Investment Trust |
| | |
| | See Sector Classification in Other Information section. |
The following table summarizes the inputs used to value the Fund’s investments at March 31, 2021 (See Note 4 in the Notes to Financial Statements):
Investments in Securities (Assets) | | Level 1
Quoted
Prices | | | Level 2
Significant
Observable
Inputs | | | Level 3
Significant
Unobservable
Inputs | | | Total | |
Common Stocks | | $ | 37,700,622 | | | $ | — | | | $ | — | | | $ | 37,700,622 | |
Money Market Fund | | | 1,341,375 | | | | — | | | | — | | | | 1,341,375 | |
Total Assets | | $ | 39,041,997 | | | $ | — | | | $ | — | | | $ | 39,041,997 | |
32 | THE GUGGENHEIM FUNDS SEMI-ANNUAL REPORT | SEE NOTES TO FINANCIAL STATEMENTS. |
STATEMENT OF ASSETS AND LIABILITIES (Unaudited) |
March 31, 2021 |
Assets: |
Investments, at value (cost $29,351,364) | | $ | 39,041,997 | |
Prepaid expenses | | | 34,469 | |
Receivables: |
Securities sold | | | 292,307 | |
Fund shares sold | | | 106,907 | |
Dividends | | | 43,615 | |
Interest | | | 9 | |
Total assets | | | 39,519,304 | |
| | | | | |
Liabilities: |
Payable for: |
Securities purchased | | | 392,181 | |
Fund shares redeemed | | | 47,610 | |
Management fees | | | 16,054 | |
Distribution and service fees | | | 8,671 | |
Fund accounting/administration fees | | | 5,181 | |
Transfer agent/maintenance fees | | | 2,479 | |
Trustees’ fees* | | | 660 | |
Miscellaneous | | | 36,263 | |
Total liabilities | | | 509,099 | |
Net assets | | $ | 39,010,205 | |
| | | | | |
Net assets consist of: |
Paid in capital | | $ | 28,360,272 | |
Total distributable earnings (loss) | | | 10,649,933 | |
Net assets | | $ | 39,010,205 | |
| | | | | |
A-Class: |
Net assets | | $ | 36,807,090 | |
Capital shares outstanding | | | 762,337 | |
Net asset value per share | | $ | 48.28 | |
Maximum offering price per share (Net asset value divided by 95.25%) | | $ | 50.69 | |
| | | | | |
C-Class: |
Net assets | | $ | 1,248,838 | |
Capital shares outstanding | | | 28,406 | |
Net asset value per share | | $ | 43.96 | |
| | | | | |
P-Class: |
Net assets | | $ | 162,358 | |
Capital shares outstanding | | | 3,374 | |
Net asset value per share | | $ | 48.12 | |
| | | | | |
Institutional Class: |
Net assets | | $ | 791,919 | |
Capital shares outstanding | | | 16,652 | |
Net asset value per share | | $ | 47.56 | |
STATEMENT OF OPERATIONS (Unaudited) |
Six Months Ended March 31, 2021 |
Investment Income: |
Dividends | | $ | 375,636 | |
Interest | | | 30 | |
Total investment income | | | 375,666 | |
| | | | | |
Expenses: |
Management fees | | | 111,997 | |
Distribution and service fees: |
A-Class | | | 40,903 | |
C-Class | | | 4,958 | |
P-Class | | | 193 | |
Transfer agent/maintenance fees: |
A-Class | | | 15,207 | |
C-Class | | | 1,208 | |
P-Class | | | 256 | |
Institutional Class | | | 565 | |
Registration fees | | | 44,468 | |
Professional fees | | | 20,946 | |
Fund accounting/administration fees | | | 16,998 | |
Trustees’ fees* | | | 9,200 | |
Custodian fees | | | 2,151 | |
Line of credit fees | | | 520 | |
Miscellaneous | | | 5,824 | |
Total expenses | | | 275,394 | |
Less: |
Expenses reimbursed by Adviser: |
A-Class | | | (15,275 | ) |
C-Class | | | (1,216 | ) |
P-Class | | | (257 | ) |
Institutional Class | | | (566 | ) |
Expenses waived by Adviser | | | (56,795 | ) |
Total waived/reimbursed expenses | | | (74,109 | ) |
Net expenses | | | 201,285 | |
Net investment income | | | 174,381 | |
| | | | | |
Net Realized and Unrealized Gain (Loss): |
Net realized gain (loss) on: |
Investments | | | 883,840 | |
Net realized gain | | | 883,840 | |
Net change in unrealized appreciation (depreciation) on: |
Investments | | | 9,321,528 | |
Net change in unrealized appreciation (depreciation) | | | 9,321,528 | |
Net realized and unrealized gain | | | 10,205,368 | |
Net increase in net assets resulting from operations | | $ | 10,379,749 | |
* | Relates to Trustees not deemed “interested persons” within the meaning of Section 2(a)(19) of the 1940 Act. |
SEE NOTES TO FINANCIAL STATEMENTS. | THE GUGGENHEIM FUNDS SEMI-ANNUAL REPORT | 33 |
STATEMENTS OF CHANGES IN NET ASSETS |
| | Six Months Ended
March 31, 2021
(Unaudited) | | | Year Ended
September 30,
2020 | |
Increase (Decrease) in Net Assets from Operations: | | | | | | | | |
Net investment income | | $ | 174,381 | | | $ | 994,120 | |
Net realized gain on investments | | | 883,840 | | | | 3,048,366 | |
Net change in unrealized appreciation (depreciation) on investments | | | 9,321,528 | | | | (5,202,366 | ) |
Net increase (decrease) in net assets resulting from operations | | | 10,379,749 | | | | (1,159,880 | ) |
| | | | | | | | | |
Distributions to shareholders: | | | | | | | | |
A-Class | | | (2,193,216 | ) | | | (4,000,303 | ) |
C-Class | | | (62,032 | ) | | | (91,548 | ) |
P-Class | | | (10,031 | ) | | | (12,859 | ) |
Institutional Class | | | (41,693 | ) | | | (62,549 | ) |
Total distributions to shareholders | | | (2,306,972 | ) | | | (4,167,259 | ) |
| | | | | | | | | |
Capital share transactions: | | | | | | | | |
Proceeds from sale of shares | | | | | | | | |
A-Class | | | 687,591 | | | | 3,084,388 | |
C-Class | | | 491,262 | | | | 504,377 | |
P-Class | | | 24,001 | | | | 82,267 | |
Institutional Class | | | 155,481 | | | | 118,986 | |
Distributions reinvested | | | | | | | | |
A-Class | | | 2,145,743 | | | | 3,948,727 | |
C-Class | | | 62,032 | | | | 89,872 | |
P-Class | | | 10,031 | | | | 12,859 | |
Institutional Class | | | 41,693 | | | | 62,549 | |
Cost of shares redeemed | | | | | | | | |
A-Class | | | (2,240,734 | ) | | | (26,723,359 | ) |
C-Class | | | (451,327 | ) | | | (1,000,958 | ) |
P-Class | | | (75,702 | ) | | | (62,200 | ) |
Institutional Class | | | (18,041 | ) | | | (419,568 | ) |
Net increase (decrease) from capital share transactions | | | 832,030 | | | | (20,302,060 | ) |
Net increase (decrease) in net assets | | | 8,904,807 | | | | (25,629,199 | ) |
| | | | | | | | | |
Net assets: | | | | | | | | |
Beginning of period | | | 30,105,398 | | | | 55,734,597 | |
End of period | | $ | 39,010,205 | | | $ | 30,105,398 | |
| | | | | | | | | |
Capital share activity: | | | | | | | | |
Shares sold | | | | | | | | |
A-Class | | | 15,339 | | | | 78,228 | |
C-Class | | | 11,589 | | | | 12,605 | |
P-Class | | | 569 | | | | 2,222 | |
Institutional Class | | | 3,427 | | | | 3,414 | |
Shares issued from reinvestment of distributions | | | | | | | | |
A-Class | | | 51,016 | | | | 90,195 | |
C-Class | | | 1,616 | | | | 2,239 | |
P-Class | | | 239 | | | | 295 | |
Institutional Class | | | 1,007 | | | | 1,449 | |
Shares redeemed | | | | | | | | |
A-Class | | | (51,933 | ) | | | (642,844 | ) |
C-Class | | | (10,985 | ) | | | (27,210 | ) |
P-Class | | | (1,889 | ) | | | (1,632 | ) |
Institutional Class | | | (420 | ) | | | (10,755 | ) |
Net increase (decrease) in shares | | | 19,575 | | | | (491,794 | ) |
34 | THE GUGGENHEIM FUNDS SEMI-ANNUAL REPORT | SEE NOTES TO FINANCIAL STATEMENTS. |
This table is presented to show selected data for a share outstanding throughout each period and to assist shareholders in evaluating a Fund’s performance for the periods presented.
A-Class | | Six Months Ended
March 31, 2021a | | | Year Ended
September 30,
2020 | | | Year Ended
September 30,
2019 | | | Year Ended
September 30,
2018 | | | Year Ended
September 30,
2017 | | | Year Ended
September 30,
2016 | |
Per Share Data |
Net asset value, beginning of period | | $ | 38.17 | | | $ | 43.56 | | | $ | 48.08 | | | $ | 46.96 | | | $ | 41.78 | | | $ | 39.11 | |
Income (loss) from investment operations: |
Net investment income (loss)b | | | .22 | | | | .97 | | | | .62 | | | | .48 | | | | .37 | | | | .58 | |
Net gain (loss) on investments (realized and unrealized) | | | 12.90 | | | | (2.97 | ) | | | (2.66 | ) | | | 4.46 | | | | 6.80 | | | | 5.23 | |
Total from investment operations | | | 13.12 | | | | (2.00 | ) | | | (2.04 | ) | | | 4.94 | | | | 7.17 | | | | 5.81 | |
Less distributions from: |
Net investment income | | | (1.30 | ) | | | (.70 | ) | | | (.36 | ) | | | (.51 | ) | | | (.58 | ) | | | (.37 | ) |
Net realized gains | | | (1.71 | ) | | | (2.69 | ) | | | (2.12 | ) | | | (3.31 | ) | | | (1.41 | ) | | | (2.77 | ) |
Total distributions | | | (3.01 | ) | | | (3.39 | ) | | | (2.48 | ) | | | (3.82 | ) | | | (1.99 | ) | | | (3.14 | ) |
Net asset value, end of period | | $ | 48.28 | | | $ | 38.17 | | | $ | 43.56 | | | $ | 48.08 | | | $ | 46.96 | | | $ | 41.78 | |
|
Total Returnc | | | 35.54 | % | | | (5.58 | %) | | | (3.59 | %) | | | 10.82 | % | | | 17.68 | % | | | 15.69 | % |
Ratios/Supplemental Data |
Net assets, end of period (in thousands) | | $ | 36,807 | | | $ | 28,548 | | | $ | 53,248 | | | $ | 56,369 | | | $ | 60,157 | | | $ | 55,325 | |
Ratios to average net assets: |
Net investment income (loss) | | | 1.03 | % | | | 2.40 | % | | | 1.42 | % | | | 1.03 | % | | | 0.83 | % | | | 1.48 | % |
Total expensesd | | | 1.57 | % | | | 1.46 | % | | | 1.31 | % | | | 1.31 | % | | | 1.30 | % | | | 1.34 | % |
Net expensese,f,g | | | 1.15 | % | | | 1.15 | % | | | 1.15 | % | | | 1.15 | % | | | 1.17 | % | | | 1.17 | % |
Portfolio turnover rate | | | 9 | % | | | 25 | % | | | 37 | % | | | 24 | % | | | 40 | % | | | 56 | % |
C-Class | | Six Months Ended
March 31, 2021a | | | Year Ended
September 30,
2020 | | | Year Ended
September 30,
2019 | | | Year Ended
September 30,
2018 | | | Year Ended
September 30,
2017 | | | Year Ended
September 30,
2016 | |
Per Share Data |
Net asset value, beginning of period | | $ | 34.79 | | | $ | 39.77 | | | $ | 44.03 | | | $ | 43.29 | | | $ | 38.68 | | | $ | 36.38 | |
Income (loss) from investment operations: |
Net investment income (loss)b | | | .06 | | | | .62 | | | | .26 | | | | .12 | | | | .03 | | | | .27 | |
Net gain (loss) on investments (realized and unrealized) | | | 11.74 | | | | (2.74 | ) | | | (2.40 | ) | | | 4.09 | | | | 6.28 | | | | 4.87 | |
Total from investment operations | | | 11.80 | | | | (2.12 | ) | | | (2.14 | ) | | | 4.21 | | | | 6.31 | | | | 5.14 | |
Less distributions from: |
Net investment income | | | (.92 | ) | | | (.17 | ) | | | — | | | | (.16 | ) | | | (.29 | ) | | | (.07 | ) |
Net realized gains | | | (1.71 | ) | | | (2.69 | ) | | | (2.12 | ) | | | (3.31 | ) | | | (1.41 | ) | | | (2.77 | ) |
Total distributions | | | (2.63 | ) | | | (2.86 | ) | | | (2.12 | ) | | | (3.47 | ) | | | (1.70 | ) | | | (2.84 | ) |
Net asset value, end of period | | $ | 43.96 | | | $ | 34.79 | | | $ | 39.77 | | | $ | 44.03 | | | $ | 43.29 | | | $ | 38.68 | |
|
Total Returnc | | | 35.03 | % | | | (6.30 | %) | | | (4.28 | %) | | | 9.97 | % | | | 16.74 | % | | | 14.87 | % |
Ratios/Supplemental Data |
Net assets, end of period (in thousands) | | $ | 1,249 | | | $ | 911 | | | $ | 1,533 | | | $ | 2,632 | | | $ | 3,461 | | | $ | 3,075 | |
Ratios to average net assets: |
Net investment income (loss) | | | 0.29 | % | | | 1.69 | % | | | 0.66 | % | | | 0.28 | % | | | 0.08 | % | | | 0.75 | % |
Total expensesd | | | 2.48 | % | | | 2.43 | % | | | 2.18 | % | | | 2.10 | % | | | 2.09 | % | | | 2.18 | % |
Net expensese,f,g | | | 1.90 | % | | | 1.90 | % | | | 1.90 | % | | | 1.90 | % | | | 1.92 | % | | | 1.92 | % |
Portfolio turnover rate | | | 9 | % | | | 25 | % | | | 37 | % | | | 24 | % | | | 40 | % | | | 56 | % |
SEE NOTES TO FINANCIAL STATEMENTS. | THE GUGGENHEIM FUNDS SEMI-ANNUAL REPORT | 35 |
FINANCIAL HIGHLIGHTS (continued) |
This table is presented to show selected data for a share outstanding throughout each period and to assist shareholders in evaluating a Fund’s performance for the periods presented.
P-Class | | Six Months Ended
March 31, 2021a | | | Year Ended
September 30,
2020 | | | Year Ended
September 30,
2019 | | | Year Ended
September 30,
2018 | | | Year Ended
September 30,
2017 | | | Year Ended
September 30,
2016 | |
Per Share Data |
Net asset value, beginning of period | | $ | 38.06 | | | $ | 43.46 | | | $ | 48.00 | | | $ | 46.91 | | | $ | 41.74 | | | $ | 39.13 | |
Income (loss) from investment operations: |
Net investment income (loss)b | | | .22 | | | | .83 | | | | .61 | | | | .49 | | | | .37 | | | | 1.40 | |
Net gain (loss) on investments (realized and unrealized) | | | 12.86 | | | | (2.82 | ) | | | (2.64 | ) | | | 4.44 | | | | 6.78 | | | | 4.44 | |
Total from investment operations | | | 13.08 | | | | (1.99 | ) | | | (2.03 | ) | | | 4.93 | | | | 7.15 | | | | 5.84 | |
Less distributions from: |
Net investment income | | | (1.31 | ) | | | (.72 | ) | | | (.39 | ) | | | (.53 | ) | | | (.57 | ) | | | (.46 | ) |
Net realized gains | | | (1.71 | ) | | | (2.69 | ) | | | (2.12 | ) | | | (3.31 | ) | | | (1.41 | ) | | | (2.77 | ) |
Total distributions | | | (3.02 | ) | | | (3.41 | ) | | | (2.51 | ) | | | (3.84 | ) | | | (1.98 | ) | | | (3.23 | ) |
Net asset value, end of period | | $ | 48.12 | | | $ | 38.06 | | | $ | 43.46 | | | $ | 48.00 | | | $ | 46.91 | | | $ | 41.74 | |
|
Total Return | | | 35.53 | % | | | (5.58 | %) | | | (3.58 | %) | | | 10.80 | % | | | 17.63 | % | | | 15.83 | % |
Ratios/Supplemental Data |
Net assets, end of period (in thousands) | | $ | 162 | | | $ | 170 | | | $ | 155 | | | $ | 147 | | | $ | 158 | | | $ | 123 | |
Ratios to average net assets: |
Net investment income (loss) | | | 1.00 | % | | | 2.12 | % | | | 1.41 | % | | | 1.03 | % | | | 0.83 | % | | | 3.61 | % |
Total expensesd | | | 1.83 | % | | | 1.72 | % | | | 1.60 | % | | | 1.59 | % | | | 1.69 | % | | | 1.41 | % |
Net expensese,f,g | | | 1.15 | % | | | 1.15 | % | | | 1.15 | % | | | 1.15 | % | | | 1.17 | % | | | 1.17 | % |
Portfolio turnover rate | | | 9 | % | | | 25 | % | | | 37 | % | | | 24 | % | | | 40 | % | | | 56 | % |
36 | THE GUGGENHEIM FUNDS SEMI-ANNUAL REPORT | SEE NOTES TO FINANCIAL STATEMENTS. |
FINANCIAL HIGHLIGHTS (concluded) |
This table is presented to show selected data for a share outstanding throughout each period and to assist shareholders in evaluating a Fund’s performance for the periods presented.
Institutional Class | | Six Months Ended
March 31, 2021a | | | Year Ended
September 30,
2020 | | | Year Ended
September 30,
2019 | | | Year Ended
September 30,
2018 | | | Year Ended
September 30,
2017 | | | Year Ended
September 30,
2016 | |
Per Share Data |
Net asset value, beginning of period | | $ | 37.71 | | | $ | 43.08 | | | $ | 47.60 | | | $ | 46.56 | | | $ | 41.84 | | | $ | 39.17 | |
Income (loss) from investment operations: |
Net investment income (loss)b | | | .27 | | | | .98 | | | | .71 | | | | .64 | | | | .51 | | | | .83 | |
Net gain (loss) on investments (realized and unrealized) | | | 12.73 | | | | (2.84 | ) | | | (2.63 | ) | | | 4.35 | | | | 6.72 | | | | 5.10 | |
Total from investment operations | | | 13.00 | | | | (1.86 | ) | | | (1.92 | ) | | | 4.99 | | | | 7.23 | | | | 5.93 | |
Less distributions from: |
Net investment income | | | (1.44 | ) | | | (.82 | ) | | | (.48 | ) | | | (.64 | ) | | | (1.10 | ) | | | (.49 | ) |
Net realized gains | | | (1.71 | ) | | | (2.69 | ) | | | (2.12 | ) | | | (3.31 | ) | | | (1.41 | ) | | | (2.77 | ) |
Total distributions | | | (3.15 | ) | | | (3.51 | ) | | | (2.60 | ) | | | (3.95 | ) | | | (2.51 | ) | | | (3.26 | ) |
Net asset value, end of period | | $ | 47.56 | | | $ | 37.71 | | | $ | 43.08 | | | $ | 47.60 | | | $ | 46.56 | | | $ | 41.84 | |
|
Total Return | | | 35.71 | % | | | (5.35 | %) | | | (3.33 | %) | | | 11.04 | % | | | 17.96 | % | | | 15.98 | % |
Ratios/Supplemental Data |
Net assets, end of period (in thousands) | | $ | 792 | | | $ | 477 | | | $ | 798 | | | $ | 5,946 | | | $ | 1,681 | | | $ | 40 | |
Ratios to average net assets: |
Net investment income (loss) | | | 1.28 | % | | | 2.50 | % | | | 1.65 | % | | | 1.39 | % | | | 1.13 | % | | | 2.13 | % |
Total expensesd | | | 1.42 | % | | | 1.35 | % | | | 1.14 | % | | | 1.00 | % | | | 1.07 | % | | | 1.04 | % |
Net expensese,f,g | | | 0.90 | % | | | 0.90 | % | | | 0.90 | % | | | 0.90 | % | | | 0.92 | % | | | 0.92 | % |
Portfolio turnover rate | | | 9 | % | | | 25 | % | | | 37 | % | | | 24 | % | | | 40 | % | | | 56 | % |
a | Unaudited figures for the period ended March 31, 2021. Percentage amounts for the period, except total return and portfolio turnover rate, have been annualized. |
b | Net investment income (loss) per share was computed using average shares outstanding throughout the period. |
c | Total return does not reflect the impact of any applicable sales charges. |
d | Does not include expenses of the underlying funds in which the Fund invests. |
e | Net expense information reflects the expense ratios after expense waivers and reimbursements, as applicable. |
f | The portion of the ratios of net expenses to average net assets attributable to recoupments of prior fee reductions or expense reimbursements for the periods presented was as follows: |
| | | 03/31/21a | 09/30/20 | 09/30/19 | 09/30/18 | 09/30/17 |
| | A-Class | — | 0.00%* | 0.00%* | 0.00%* | 0.01% |
| | C-Class | — | 0.00%* | — | 0.00%* | 0.01% |
| | P-Class | — | — | — | — | 0.00%* |
| | Institutional Class | — | — | — | — | 0.02% |
g | Net expenses may include expenses that are excluded from the expense limitation agreement. Excluding these expenses, the net expense ratios for the periods presented would be: |
| | | 03/31/21a | 09/30/20 | 09/30/19 | 09/30/18 | 09/30/17 | 09/30/16 |
| | A-Class | 1.15% | 1.15% | 1.15% | 1.15% | 1.15% | 1.15% |
| | C-Class | 1.90% | 1.90% | 1.90% | 1.90% | 1.90% | 1.90% |
| | P-Class | 1.15% | 1.15% | 1.15% | 1.15% | 1.15% | 1.15% |
| | Institutional Class | 0.90% | 0.90% | 0.90% | 0.90% | 0.90% | 0.90% |
SEE NOTES TO FINANCIAL STATEMENTS. | THE GUGGENHEIM FUNDS SEMI-ANNUAL REPORT | 37 |
PERFORMANCE REPORT AND FUND PROFILE (Unaudited) | March 31, 2021 |
MARKET NEUTRAL REAL ESTATE FUND
OBJECTIVE: Seeks to provide capital appreciation, while limiting exposure to general stock market risk.
Holdings Diversification (Market Exposure as % of Net Assets)
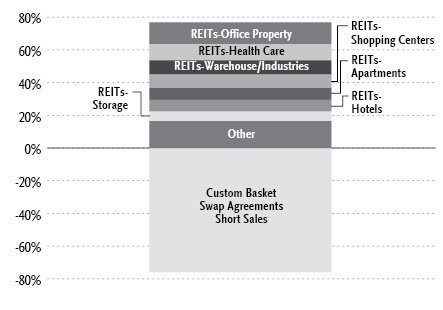
“Holdings Diversification (Market Exposure as % of Net Assets)” excludes any temporary cash investments.
Inception Dates: |
A-Class | February 26, 2016 |
C-Class | February 26, 2016 |
P-Class | February 26, 2016 |
Institutional Class | February 26, 2016 |
Ten Largest Holdings (% of Total Net Assets) |
Regency Centers Corp. | 3.9% |
AvalonBay Communities, Inc. | 3.5% |
Extra Space Storage, Inc. | 3.4% |
Hudson Pacific Properties, Inc. | 3.1% |
Equity Residential | 2.9% |
Weingarten Realty Investors | 2.9% |
Sun Communities, Inc. | 2.8% |
Ventas, Inc. | 2.5% |
Public Storage | 2.4% |
Gaming and Leisure Properties, Inc. | 2.4% |
Top Ten Total | 29.8% |
| | |
“Ten Largest Holdings” excludes any temporary cash or derivative investments. |
38 | THE GUGGENHEIM FUNDS SEMI-ANNUAL REPORT | |
PERFORMANCE REPORT AND FUND PROFILE (Unaudited)(concluded) | March 31, 2021 |
Average Annual Returns*
Periods Ended March 31, 2021
| 6 Month† | 1 Year | 5 Year | Since
Inception
(02/26/16) |
A-Class Shares | (1.39%) | (3.82%) | 4.58% | 4.17% |
A-Class Shares with sales charge‡ | (6.09%) | (8.38%) | 3.57% | 3.18% |
C-Class Shares | (1.74%) | (4.54%) | 3.79% | 3.37% |
C-Class Shares with CDSC§ | (2.72%) | (5.50%) | 3.79% | 3.37% |
P-Class Shares | (1.43%) | (3.86%) | 4.50% | 4.08% |
Institutional Class Shares | (1.27%) | (3.59%) | 4.80% | 4.38% |
ICE BofA Merrill Lynch 3-Month U.S. Treasury Bill Index | 0.06% | 0.12% | 1.19% | 1.18% |
* | The performance data above represents past performance that is not predictive of future results. The investment return and principal value of an investment in the Fund will fluctuate so that an investor’s shares, when redeemed, may be worth more or less than their original cost. Returns are historical and include changes in principal and reinvested dividends and capital gains and do not reflect the effect of taxes. The ICE BofA Merrill Lynch 3-Month U.S. Treasury Bill Index is an unmanaged index and, unlike the Fund, has no management fees or operating expenses to reduce its reported return. |
† | 6 month returns are not annualized. |
‡ | Fund returns are calculated using the maximum sales charge of 4.75%. |
§ | Fund returns include a CDSC of 1% if redeemed within 12 months of purchase. |
| | THE GUGGENHEIM FUNDS SEMI-ANNUAL REPORT | 39 |
SCHEDULE OF INVESTMENTS (Unaudited) | March 31, 2021 |
MARKET NEUTRAL REAL ESTATE FUND | |
| | Shares | | | Value | |
COMMON STOCKS† - 76.9% |
| | | | | | | | | |
REITs - 72.8% |
REITs-Office Property - 13.4% |
Hudson Pacific Properties, Inc. | | | 74,000 | | | $ | 2,007,620 | |
Highwoods Properties, Inc.1 | | | 33,937 | | | | 1,457,255 | |
Boston Properties, Inc. | | | 13,429 | | | | 1,359,821 | |
Alexandria Real Estate Equities, Inc.1 | | | 7,806 | | | | 1,282,526 | |
Empire State Realty Trust, Inc. — Class A | | | 114,879 | | | | 1,278,603 | |
American Assets Trust, Inc.1 | | | 39,374 | | | | 1,277,293 | |
Total REITs-Office Property | | | | | | | 8,663,118 | |
| | | | | | | | | |
REITs-Health Care - 9.9% |
Ventas, Inc.1 | | | 30,369 | | | | 1,619,882 | |
Healthpeak Properties, Inc.1 | | | 43,523 | | | | 1,381,420 | |
Welltower, Inc.1 | | | 17,794 | | | | 1,274,584 | |
CareTrust REIT, Inc. | | | 48,606 | | | | 1,131,791 | |
Medical Properties Trust, Inc. | | | 48,095 | | | | 1,023,462 | |
Total REITs-Health Care | | | | | | | 6,431,139 | |
| | | | | | | | | |
REITs-Warehouse/Industries - 8.7% |
Prologis, Inc. | | | 12,161 | | | | 1,289,066 | |
Americold Realty Trust1 | | | 29,975 | | | | 1,153,138 | |
CyrusOne, Inc. | | | 16,369 | | | | 1,108,509 | |
Innovative Industrial Properties, Inc.1 | | | 5,997 | | | | 1,080,420 | |
Terreno Realty Corp.1 | | | 17,086 | | | | 987,058 | |
Total REITs-Warehouse/Industries | | | | | | | 5,618,191 | |
| | | | | | | | | |
REITs-Shopping Centers - 8.2% |
Regency Centers Corp.1 | | | 44,683 | | | | 2,533,973 | |
Weingarten Realty Investors1 | | | 68,819 | | | | 1,851,919 | |
Brixmor Property Group, Inc. | | | 47,131 | | | | 953,460 | |
Total REITs-Shopping Centers | | | | | | | 5,339,352 | |
| | | | | | | | | |
REITs-Apartments - 7.3% |
AvalonBay Communities, Inc.1 | | | 12,161 | | | | 2,243,826 | |
Equity Residential | | | 26,751 | | | | 1,916,174 | |
Invitation Homes, Inc. | | | 18,551 | | | | 593,447 | |
Total REITs-Apartments | | | | | | | 4,753,447 | |
| | | | | | | | | |
REITs-Hotels - 7.2% |
Ryman Hospitality Properties, Inc.* | | | 16,487 | | | | 1,277,907 | |
Xenia Hotels & Resorts, Inc.* | | | 65,378 | | | | 1,274,871 | |
Host Hotels & Resorts, Inc.* | | | 66,253 | | | | 1,116,363 | |
MGM Growth Properties LLC — Class A | | | 29,985 | | | | 978,111 | |
Total REITs-Hotels | | | | | | | 4,647,252 | |
REITs-Storage - 5.8% |
Extra Space Storage, Inc. | | | 16,575 | | | | 2,197,016 | |
Public Storage | | | 6,410 | | | | 1,581,732 | |
Total REITs-Storage | | | | | | | 3,778,748 | |
| | | | | | | | | |
REITs-Diversified - 5.3% |
Gaming and Leisure Properties, Inc.1 | | | 37,260 | | | | 1,580,942 | |
VICI Properties, Inc.1 | | | 44,889 | | | | 1,267,665 | |
Safehold, Inc.1 | | | 8,464 | | | | 593,326 | |
Total REITs-Diversified | | | | | | | 3,441,933 | |
| | | | | | | | | |
REITs-Single Tenant - 4.2% |
Agree Realty Corp.1 | | | 18,620 | | | | 1,253,312 | |
Realty Income Corp. | | | 17,686 | | | | 1,123,061 | |
NETSTREIT Corp. | | | 19,270 | | | | 356,302 | |
Total REITs-Single Tenant | | | | | | | 2,732,675 | |
| | | | | | | | | |
REITs-Manufactured Homes - 2.8% |
Sun Communities, Inc.1 | | | 11,984 | | | | 1,798,079 | |
Total REITs | | | | | | | 47,203,934 | |
| | | | | | | | | |
Real Estate - 1.4% |
Real Estate Management/Services - 1.4% |
Jones Lang LaSalle, Inc.* | | | 5,357 | | | | 959,117 | |
| | | | | | | | | |
Lodging - 1.4% |
Hotels&Motels - 1.4% |
Hilton Grand Vacations, Inc.* | | | 24,558 | | | | 920,680 | |
| | | | | | | | | |
Entertainment - 1.3% |
Resorts/Theme Parks - 1.3% |
Marriott Vacations Worldwide Corp.* | | | 4,768 | | | | 830,490 | |
| | | | | | | | | |
Total Common Stocks | | | | |
(Cost $46,028,959) | | | | | | | 49,914,221 | |
| | | | | | | | | |
MONEY MARKET FUND† - 31.2% |
Goldman Sachs Financial Square Treasury Instruments Fund — Institutional Shares, 0.01%2 | | | 20,216,915 | | | | 20,216,915 | |
Total Money Market Fund | | | | |
(Cost $20,216,915) | | | | | | | 20,216,915 | |
| | | | | | | | | |
Total Investments - 108.1% | | | | |
(Cost $66,245,874) | | $ | 70,131,136 | |
Other Assets & Liabilities, net - (8.1)% | | | (5,274,393 | ) |
Total Net Assets - 100.0% | | $ | 64,856,743 | |
40 | THE GUGGENHEIM FUNDS SEMI-ANNUAL REPORT | SEE NOTES TO FINANCIAL STATEMENTS. |
SCHEDULE OF INVESTMENTS (Unaudited)(continued) | March 31, 2021 |
MARKET NEUTRAL REAL ESTATE FUND | |
Custom Basket Swap Agreements |
Counterparty | Reference Obligation | Financing
Rate Pay | Payment
Frequency | | Maturity
Date | | | Notional
Amount | | | Value and
Unrealized
Depreciation | |
OTC Custom Basket Swap Agreements Sold Short †† |
Goldman Sachs International | GS Equity Custom Basket | 0.13% (Federal Funds Rate - 0.20%) | At Maturity | | | 05/06/24 | | | $ | 24,625,437 | | | $ | (1,629,963 | ) |
Morgan Stanley Capital Services LLC | MS Equity Custom Basket | 0.26% (Federal Funds Rate - 0.30%) | At Maturity | | | 07/22/24 | | | | 24,622,615 | | | | (1,638,204 | ) |
| | | | | | | | | | $ | 49,248,052 | | | $ | (3,268,167 | ) |
| | Shares | | | Percentage
Notional
Amount | | | Value and
Unrealized
Appreciation
(Depreciation) | |
MS EQUITY SHORT CUSTOM BASKET | | | | | | | | |
Financial | | | | | | | | | | | | |
Essential Properties Realty Trust, Inc. | | | 34,931 | | | | (3.24 | )% | | $ | 22,319 | |
Easterly Government Properties, Inc. | | | 18,567 | | | | (1.56 | )% | | | 21,504 | |
Equity Commonwealth | | | 18,621 | | | | (2.10 | )% | | | 14,388 | |
Office Properties Income Trust | | | 9,135 | | | | (1.02 | )% | | | 11,488 | |
Federal Realty Investment Trust | | | 7,851 | | | | (3.23 | )% | | | 10,010 | |
Cousins Properties, Inc. | | | 13,533 | | | | (1.94 | )% | | | 9,362 | |
Healthcare Trust of America, Inc. — Class A | | | 19,953 | | | | (2.23 | )% | | | 3,234 | |
Apple Hospitality REIT, Inc. | | | 39,670 | | | | (2.35 | )% | | | 944 | |
Physicians Realty Trust | | | 10,255 | | | | (0.74 | )% | | | 738 | |
RLJ Lodging Trust | | | 35,295 | | | | (2.22 | )% | | | 267 | |
Sunstone Hotel Investors, Inc. | | | 43,907 | | | | (2.22 | )% | | | (785 | ) |
American Finance Trust, Inc. | | | 17,638 | | | | (0.70 | )% | | | (3,456 | ) |
Corporate Office Properties Trust | | | 22,583 | | | | (2.41 | )% | | | (4,308 | ) |
LTC Properties, Inc. | | | 19,108 | | | | (3.24 | )% | | | (6,247 | ) |
Healthcare Realty Trust, Inc. | | | 17,525 | | | | (2.16 | )% | | | (9,677 | ) |
SITE Centers Corp. | | | 27,145 | | | | (1.49 | )% | | | (19,987 | ) |
Digital Realty Trust, Inc. | | | 4,095 | | | | (2.34 | )% | | | (23,427 | ) |
Industrial Logistics Properties Trust | | | 13,401 | | | | (1.26 | )% | | | (23,488 | ) |
STAG Industrial, Inc. | | | 17,505 | | | | (2.39 | )% | | | (31,947 | ) |
Independence Realty Trust, Inc. | | | 31,249 | | | | (1.93 | )% | | | (40,222 | ) |
PS Business Parks, Inc. | | | 2,306 | | | | (1.45 | )% | | | (40,749 | ) |
Retail Opportunity Investments Corp. | | | 49,713 | | | | (3.20 | )% | | | (57,333 | ) |
VEREIT, Inc. | | | 21,015 | | | | (3.30 | )% | | | (62,208 | ) |
Life Storage, Inc. | | | 9,213 | | | | (3.22 | )% | | | (67,850 | ) |
National Health Investors, Inc. | | | 11,105 | | | | (3.26 | )% | | | (70,603 | ) |
American Homes 4 Rent — Class A | | | 23,012 | | | | (3.12 | )% | | | (71,560 | ) |
Washington Real Estate Investment Trust | | | 29,657 | | | | (2.66 | )% | | | (81,265 | ) |
SL Green Realty Corp. | | | 16,473 | | | | (4.68 | )% | | | (103,809 | ) |
STORE Capital Corp. | | | 33,629 | | | | (4.58 | )% | | | (105,075 | ) |
Mid-America Apartment Communities, Inc. | | | 8,097 | | | | (4.75 | )% | | | (112,897 | ) |
CubeSmart | | | 27,548 | | | | (4.23 | )% | | | (115,616 | ) |
Monmouth Real Estate Investment Corp. | | | 62,788 | | | | (4.51 | )% | | | (211,413 | ) |
Retail Properties of America, Inc. — Class A | | | 73,657 | | | | (3.15 | )% | | | (323,351 | ) |
Total Financial | | | | | | | | | | | (1,493,019 | ) |
| | | | | | | | | | | | | |
Consumer, Cyclical | | | | | | | | | | | | |
Hyatt Hotels Corp. — Class A | | | 9,896 | | | | (3.32 | )% | | | (91,031 | ) |
| | | | | | | | | | | | | |
Exchange Traded Funds | | | | | | | | | | | | |
Vanguard Real Estate ETF | | | 26,270 | | | | (9.80 | )% | | | (54,154 | ) |
Total MS Equity Short Custom Basket | | | | | | $ | (1,638,204 | ) |
SEE NOTES TO FINANCIAL STATEMENTS. | THE GUGGENHEIM FUNDS SEMI-ANNUAL REPORT | 41 |
SCHEDULE OF INVESTMENTS (Unaudited)(continued) | March 31, 2021 |
MARKET NEUTRAL REAL ESTATE FUND | |
| | Shares | | | Percentage
Notional
Amount | | | Value and
Unrealized
Appreciation
(Depreciation) | |
GS EQUITY SHORT CUSTOM BASKET | | | | | | | | |
Financial | | | | | | | | | | | | |
Essential Properties Realty Trust, Inc. | | | 34,931 | | | | (3.24 | )% | | $ | 22,389 | |
Easterly Government Properties, Inc. | | | 18,567 | | | | (1.56 | )% | | | 21,563 | |
Equity Commonwealth | | | 18,621 | | | | (2.10 | )% | | | 14,696 | |
Office Properties Income Trust | | | 9,135 | | | | (1.02 | )% | | | 11,267 | |
Cousins Properties, Inc. | | | 13,533 | | | | (1.94 | )% | | | 9,297 | |
Federal Realty Investment Trust | | | 7,851 | | | | (3.23 | )% | | | 9,238 | |
Healthcare Trust of America, Inc. — Class A | | | 19,953 | | | | (2.23 | )% | | | 3,426 | |
Apple Hospitality REIT, Inc. | | | 39,670 | | | | (2.35 | )% | | | 1,015 | |
Physicians Realty Trust | | | 10,255 | | | | (0.74 | )% | | | 778 | |
RLJ Lodging Trust | | | 35,295 | | | | (2.22 | )% | | | 328 | |
Apartment Income REIT Corp. | | | 66 | | | | (0.01 | )% | | | 28 | |
Sunstone Hotel Investors, Inc. | | | 43,907 | | | | (2.22 | )% | | | (975 | ) |
American Finance Trust, Inc. | | | 17,638 | | | | (0.70 | )% | | | (2,927 | ) |
Corporate Office Properties Trust | | | 22,583 | | | | (2.41 | )% | | | (4,387 | ) |
LTC Properties, Inc. | | | 19,108 | | | | (3.24 | )% | | | (5,586 | ) |
Healthcare Realty Trust, Inc. | | | 17,525 | | | | (2.16 | )% | | | (9,868 | ) |
SITE Centers Corp. | | | 27,145 | | | | (1.49 | )% | | | (19,775 | ) |
Industrial Logistics Properties Trust | | | 13,401 | | | | (1.26 | )% | | | (23,343 | ) |
Digital Realty Trust, Inc. | | | 4,095 | | | | (2.34 | )% | | | (23,411 | ) |
STAG Industrial, Inc. | | | 17,505 | | | | (2.39 | )% | | | (31,434 | ) |
Independence Realty Trust, Inc. | | | 31,249 | | | | (1.93 | )% | | | (40,256 | ) |
PS Business Parks, Inc. | | | 2,306 | | | | (1.45 | )% | | | (41,076 | ) |
Retail Opportunity Investments Corp. | | | 49,713 | | | | (3.20 | )% | | | (53,634 | ) |
VEREIT, Inc. | | | 21,015 | | | | (3.30 | )% | | | (61,960 | ) |
Life Storage, Inc. | | | 9,213 | | | | (3.22 | )% | | | (67,708 | ) |
National Health Investors, Inc. | | | 11,105 | | | | (3.26 | )% | | | (70,915 | ) |
American Homes 4 Rent — Class A | | | 23,012 | | | | (3.12 | )% | | | (71,359 | ) |
Washington Real Estate Investment Trust | | | 29,657 | | | | (2.66 | )% | | | (80,791 | ) |
STORE Capital Corp. | | | 33,629 | | | | (4.57 | )% | | | (103,889 | ) |
SL Green Realty Corp. | | | 16,473 | | | | (4.68 | )% | | | (104,045 | ) |
Mid-America Apartment Communities, Inc. | | | 8,097 | | | | (4.75 | )% | | | (112,636 | ) |
CubeSmart | | | 27,548 | | | | (4.23 | )% | | | (115,412 | ) |
Monmouth Real Estate Investment Corp. | | | 62,788 | | | | (4.51 | )% | | | (210,810 | ) |
Retail Properties of America, Inc. — Class A | | | 73,657 | | | | (3.15 | )% | | | (322,760 | ) |
Total Financial | | | | | | | | | | | (1,484,932 | ) |
| | | | | | | | | | | | | |
Consumer, Cyclical | | | | | | | | | | | | |
Hyatt Hotels Corp. — Class A | | | 9,896 | | | | (3.32 | )% | | | (90,936 | ) |
| | | | | | | | | | | | | |
Exchange Traded Funds | | | | | | | | | | | | |
Vanguard Real Estate ETF | | | 26,270 | | | | (9.80 | )% | | | (54,095 | ) |
Total GS Equity Short Custom Basket | | | | | | $ | (1,629,963 | ) |
* | Non-income producing security. |
† | Value determined based on Level 1 inputs — See Note 4. |
†† | Value determined based on Level 2 inputs — See Note 4. |
1 | All or a portion of this security is pledged as equity index swap collateral at March 31, 2021. |
2 | Rate indicated is the 7-day yield as of March 31, 2021. |
| | GS — Goldman Sachs International |
| | MS — Morgan Stanley Capital Services LLC |
| | REIT — Real Estate Investment Trust |
| | |
| | See Sector Classification in Other Information section. |
42 | THE GUGGENHEIM FUNDS SEMI-ANNUAL REPORT | SEE NOTES TO FINANCIAL STATEMENTS. |
SCHEDULE OF INVESTMENTS (Unaudited)(concluded) | March 31, 2021 |
MARKET NEUTRAL REAL ESTATE FUND | |
The following table summarizes the inputs used to value the Fund’s investments at March 31, 2021 (See Note 4 in the Notes to Financial Statements):
Investments in Securities (Assets) | | Level 1
Quoted
Prices | | | Level 2
Significant
Observable
Inputs | | | Level 3
Significant
Unobservable
Inputs | | | Total | |
Common Stocks | | $ | 49,914,221 | | | $ | — | | | $ | — | | | $ | 49,914,221 | |
Money Market Fund | | | 20,216,915 | | | | — | | | | — | | | | 20,216,915 | |
Total Assets | | $ | 70,131,136 | | | $ | — | | | $ | — | | | $ | 70,131,136 | |
Investments in Securities (Liabilities) | | Level 1
Quoted
Prices | | | Level 2
Significant
Observable
Inputs | | | Level 3
Significant
Unobservable
Inputs | | | Total | |
Equity Custom Basket Swap Agreements** | | $ | — | | | $ | 3,268,167 | | | $ | — | | | $ | 3,268,167 | |
** | This derivative is reported as unrealized appreciation/depreciation at period end. |
SEE NOTES TO FINANCIAL STATEMENTS. | THE GUGGENHEIM FUNDS SEMI-ANNUAL REPORT | 43 |
MARKET NEUTRAL REAL ESTATE FUND | |
STATEMENT OF ASSETS AND LIABILITIES (Unaudited) |
March 31, 2021 |
Assets: |
Investments, at value (cost $66,245,874) | | $ | 70,131,136 | |
Prepaid expenses | | | 61,369 | |
Receivables: |
Securities sold | | | 3,441,307 | |
Dividends | | | 184,649 | |
Fund shares sold | | | 109,161 | |
Interest | | | 142 | |
Total assets | | | 73,927,764 | |
| | | | | |
Liabilities: |
Unrealized depreciation on OTC swap agreements | | | 3,268,167 | |
Payable for: |
Securities purchased | | | 3,981,191 | |
Swap settlement | | | 1,329,308 | |
Fund shares redeemed | | | 404,964 | |
Management fees | | | 43,408 | |
Fund accounting/administration fees | | | 7,035 | |
Transfer agent/maintenance fees | | | 3,353 | |
Distribution and service fees | | | 2,999 | |
Trustees’ fees* | | | 1,824 | |
Miscellaneous | | | 28,772 | |
Total liabilities | | | 9,071,021 | |
Net assets | | $ | 64,856,743 | |
| | | | | |
Net assets consist of: |
Paid in capital | | $ | 64,873,330 | |
Total distributable earnings (loss) | | | (16,587 | ) |
Net assets | | $ | 64,856,743 | |
| | | | | |
A-Class: |
Net assets | | $ | 4,617,577 | |
Capital shares outstanding | | | 166,547 | |
Net asset value per share | | $ | 27.73 | |
Maximum offering price per share (Net asset value divided by 95.25%) | | $ | 29.11 | |
| | | | | |
C-Class: |
Net assets | | $ | 270,532 | |
Capital shares outstanding | | | 10,146 | |
Net asset value per share | | $ | 26.66 | |
| | | | | |
P-Class: |
Net assets | | $ | 3,334,060 | |
Capital shares outstanding | | | 124,491 | |
Net asset value per share | | $ | 26.78 | |
| | | | | |
Institutional Class: |
Net assets | | $ | 56,634,574 | |
Capital shares outstanding | | | 2,060,787 | |
Net asset value per share | | $ | 27.48 | |
STATEMENT OF OPERATIONS (Unaudited) |
Six Months Ended March 31, 2021 |
Investment Income: |
Dividends | | $ | 515,280 | |
Interest | | | 1,009 | |
Total investment income | | | 516,289 | |
| | | | | |
Expenses: |
Management fees | | | 373,675 | |
Distribution and service fees: |
A-Class | | | 8,834 | |
C-Class | | | 1,538 | |
P-Class | | | 10,848 | |
Transfer agent/maintenance fees: |
A-Class | | | 11,027 | |
C-Class | | | 381 | |
P-Class | | | 6,721 | |
Institutional Class | | | 19,946 | |
Registration fees | | | 38,472 | |
Fund accounting/administration fees | | | 27,417 | |
Professional fees | | | 26,531 | |
Trustees’ fees* | | | 10,858 | |
Custodian fees | | | 6,847 | |
Line of credit fees | | | 1,178 | |
Miscellaneous | | | 10,097 | |
Total expenses | | | 554,370 | |
Less: |
Expenses reimbursed by Adviser: |
A Class | | | (11,213 | ) |
C Class | | | (394 | ) |
P Class | | | (6,857 | ) |
Institutional Class | | | (22,047 | ) |
Expenses waived by Adviser | | | (21,081 | ) |
Earnings credits applied | | | (13 | ) |
Total waived/reimbursed expenses | | | (61,605 | ) |
Net expenses | | | 492,765 | |
Net investment income | | | 23,524 | |
| | | | | |
Net Realized and Unrealized Gain (Loss): |
Net realized gain (loss) on: |
Investments | | | 5,971,301 | |
Swap agreements | | | (6,416,893 | ) |
Net realized loss | | | (445,592 | ) |
Net change in unrealized appreciation (depreciation) on: |
Investments | | | 2,989,658 | |
Swap agreements | | | (3,288,153 | ) |
Net change in unrealized appreciation (depreciation) | | | (298,495 | ) |
Net realized and unrealized loss | | | (744,087 | ) |
Net decrease in net assets resulting from operations | | $ | (720,563 | ) |
* | Relates to Trustees not deemed “interested persons” within the meaning of Section 2(a)(19) of the 1940 Act. |
44 | THE GUGGENHEIM FUNDS SEMI-ANNUAL REPORT | SEE NOTES TO FINANCIAL STATEMENTS. |
MARKET NEUTRAL REAL ESTATE FUND | |
STATEMENTS OF CHANGES IN NET ASSETS |
| | Six Months Ended
March 31, 2021
(Unaudited) | | | Year Ended
September 30,
2020 | |
Increase (Decrease) in Net Assets from Operations: | | | | | | | | |
Net investment income | | $ | 23,524 | | | $ | 50,393 | |
Net realized gain (loss) on investments | | | (445,592 | ) | | | 346,499 | |
Net change in unrealized appreciation (depreciation) on investments | | | (298,495 | ) | | | 195,936 | |
Net increase (decrease) in net assets resulting from operations | | | (720,563 | ) | | | 592,828 | |
| | | | | | | | | |
Distributions to shareholders: | | | | | | | | |
A-Class | | | (13,489 | ) | | | (137,475 | ) |
C-Class | | | (654 | ) | | | (4,629 | ) |
P-Class | | | (20,444 | ) | | | (13,269 | ) |
Institutional Class | | | (153,777 | ) | | | (232,931 | ) |
Total distributions to shareholders | | | (188,364 | ) | | | (388,304 | ) |
| | | | | | | | | |
Capital share transactions: | | | | | | | | |
Proceeds from sale of shares | | | | | | | | |
A-Class | | | 975,860 | | | | 15,384,801 | |
C-Class | | | 7,807 | | | | 305,070 | |
P-Class | | | 2,215,863 | | | | 9,192,551 | |
Institutional Class | | | 31,443,629 | | | | 34,862,781 | |
Distributions reinvested | | | | | | | | |
A-Class | | | 9,981 | | | | 133,439 | |
C-Class | | | 654 | | | | 4,629 | |
P-Class | | | 19,996 | | | | 13,147 | |
Institutional Class | | | 153,777 | | | | 232,932 | |
Cost of shares redeemed | | | | | | | | |
A-Class | | | (8,033,427 | ) | | | (6,481,122 | ) |
C-Class | | | (63,926 | ) | | | (119,128 | ) |
P-Class | | | (7,092,999 | ) | | | (1,198,642 | ) |
Institutional Class | | | (11,686,036 | ) | | | (3,432,966 | ) |
Net increase from capital share transactions | | | 7,951,179 | | | | 48,897,492 | |
Net increase in net assets | | | 7,042,252 | | | | 49,102,016 | |
| | | | | | | | | |
Net assets: | | | | | | | | |
Beginning of period | | | 57,814,491 | | | | 8,712,475 | |
End of period | | $ | 64,856,743 | | | $ | 57,814,491 | |
| | | | | | | | | |
Capital share activity: | | | | | | | | |
Shares sold | | | | | | | | |
A-Class | | | 35,199 | | | | 537,993 | |
C-Class | | | 287 | | | | 11,172 | |
P-Class | | | 82,546 | | | | 338,094 | |
Institutional Class | | | 1,142,901 | | | | 1,249,909 | |
Shares issued from reinvestment of distributions | | | | | | | | |
A-Class | | | 362 | | | | 5,172 | |
C-Class | | | 25 | | | | 185 | |
P-Class | | | 751 | | | | 527 | |
Institutional Class | | | 5,633 | | | | 9,127 | |
Shares redeemed | | | | | | | | |
A-Class | | | (285,069 | ) | | | (229,755 | ) |
C-Class | | | (2,410 | ) | | | (4,292 | ) |
P-Class | | | (265,861 | ) | | | (44,287 | ) |
Institutional Class | | | (427,122 | ) | | | (124,553 | ) |
Net increase in shares | | | 287,242 | | | | 1,749,292 | |
SEE NOTES TO FINANCIAL STATEMENTS. | THE GUGGENHEIM FUNDS SEMI-ANNUAL REPORT | 45 |
MARKET NEUTRAL REAL ESTATE FUND | |
This table is presented to show selected data for a share outstanding throughout each period and to assist shareholders in evaluating a Fund’s performance for the periods presented.
A-Class | | Six Months Ended
March 31, 2021a | | | Year Ended
September 30,
2020 | | | Year Ended
September 30,
2019 | | | Year Ended
September 30,
2018 | | | Year Ended
September 30,
2017 | | | Period Ended
September 30,
2016b | |
Per Share Data |
Net asset value, beginning of period | | $ | 28.18 | | | $ | 26.95 | | | $ | 25.16 | | | $ | 26.47 | | | $ | 24.45 | | | $ | 25.00 | |
Income (loss) from investment operations: |
Net investment income (loss)c | | | (.04 | ) | | | (.02 | ) | | | .25 | | | | .50 | | | | .08 | | | | .24 | |
Net gain (loss) on investments (realized and unrealized) | | | (.35 | ) | | | 2.30 | | | | 1.78 | | | | (.41 | ) | | | 1.94 | | | | (.79 | ) |
Total from investment operations | | | (.39 | ) | | | 2.28 | | | | 2.03 | | | | .09 | | | | 2.02 | | | | (.55 | ) |
Less distributions from: |
Net investment income | | | — | | | | (.25 | ) | | | (.01 | ) | | | — | | | | — | | | | — | |
Net realized gains | | | (.06 | ) | | | (.80 | ) | | | (.23 | ) | | | (1.40 | ) | | | — | | | | — | |
Total distributions | | | (.06 | ) | | | (1.05 | ) | | | (.24 | ) | | | (1.40 | ) | | | — | | | | — | |
Net asset value, end of period | | $ | 27.73 | | | $ | 28.18 | | | $ | 26.95 | | | $ | 25.16 | | | $ | 26.47 | | | $ | 24.45 | |
|
Total Returnd | | | (1.39 | %) | | | 8.81 | % | | | 8.12 | % | | | 0.13 | % | | | 8.38 | % | | | (2.20 | %) |
Ratios/Supplemental Data |
Net assets, end of period (in thousands) | | $ | 4,618 | | | $ | 11,723 | | | $ | 2,766 | | | $ | 2,482 | | | $ | 109 | | | $ | 100 | |
Ratios to average net assets: |
Net investment income (loss) | | | (0.31 | %) | | | (0.06 | %) | | | 0.96 | % | | | 2.00 | % | | | 0.31 | % | | | 1.66 | % |
Total expensese | | | 2.02 | % | | | 2.38 | % | | | 3.99 | % | | | 5.01 | % | | | 4.88 | % | | | 3.74 | % |
Net expensesf,g,h | | | 1.64 | % | | | 1.65 | % | | | 1.62 | % | | | 1.65 | % | | | 1.65 | % | | | 1.64 | % |
Portfolio turnover rate | | | 240 | % | | | 355 | % | | | 180 | % | | | 216 | % | | | 145 | % | | | 135 | % |
C-Class | | Six Months Ended
March 31, 2021a | | | Year Ended
September 30,
2020 | | | Year Ended
September 30,
2019 | | | Year Ended
September 30,
2018 | | | Year Ended
September 30,
2017 | | | Period Ended
September 30,
2016b | |
Per Share Data |
Net asset value, beginning of period | | $ | 27.20 | | | $ | 26.07 | | | $ | 24.67 | | | $ | 26.16 | | | $ | 24.35 | | | $ | 25.00 | |
Income (loss) from investment operations: |
Net investment income (loss)c | | | (.13 | ) | | | (.15 | ) | | | .05 | | | | .12 | | | | (.11 | ) | | | .12 | |
Net gain (loss) on investments (realized and unrealized) | | | (.35 | ) | | | 2.16 | | | | 1.70 | | | | (.21 | ) | | | 1.92 | | | | (.77 | ) |
Total from investment operations | | | (.48 | ) | | | 2.01 | | | | 1.75 | | | | (.09 | ) | | | 1.81 | | | | (.65 | ) |
Less distributions from: |
Net investment income | | | — | | | | (.08 | ) | | | (.12 | ) | | | — | | | | — | | | | — | |
Net realized gains | | | (.06 | ) | | | (.80 | ) | | | (.23 | ) | | | (1.40 | ) | | | — | | | | — | |
Total distributions | | | (.06 | ) | | | (.88 | ) | | | (.35 | ) | | | (1.40 | ) | | | — | | | | — | |
Net asset value, end of period | | $ | 26.66 | | | $ | 27.20 | | | $ | 26.07 | | | $ | 24.67 | | | $ | 26.16 | | | $ | 24.35 | |
|
Total Returnd | | | (1.74 | %) | | | 7.99 | % | | | 7.15 | % | | | (0.59 | %) | | | 7.56 | % | | | (2.60 | %) |
Ratios/Supplemental Data |
Net assets, end of period (in thousands) | | $ | 271 | | | $ | 333 | | | $ | 135 | | | $ | 134 | | | $ | 143 | | | $ | 97 | |
Ratios to average net assets: |
Net investment income (loss) | | | (0.95 | %) | | | (0.56 | %) | | | 0.18 | % | | | 0.47 | % | | | (0.52 | %) | | | 0.93 | % |
Total expensese | | | 2.71 | % | | | 3.17 | % | | | 4.66 | % | | | 5.72 | % | | | 5.70 | % | | | 4.47 | % |
Net expensesf,g,h | | | 2.39 | % | | | 2.40 | % | | | 2.40 | % | | | 2.38 | % | | | 2.40 | % | | | 2.38 | % |
Portfolio turnover rate | | | 240 | % | | | 355 | % | | | 180 | % | | | 216 | % | | | 145 | % | | | 135 | % |
46 | THE GUGGENHEIM FUNDS SEMI-ANNUAL REPORT | SEE NOTES TO FINANCIAL STATEMENTS. |
MARKET NEUTRAL REAL ESTATE FUND | |
FINANCIAL HIGHLIGHTS (continued) |
This table is presented to show selected data for a share outstanding throughout each period and to assist shareholders in evaluating a Fund’s performance for the periods presented.
P-Class | | Six Months Ended
March 31, 2021a | | | Year Ended
September 30,
2020 | | | Year Ended
September 30,
2019 | | | Year Ended
September 30,
2018 | | | Year Ended
September 30,
2017 | | | Period Ended
September 30,
2016b | |
Per Share Data |
Net asset value, beginning of period | | $ | 27.23 | | | $ | 26.10 | | | $ | 25.14 | | | $ | 26.48 | | | $ | 24.45 | | | $ | 25.00 | |
Income (loss) from investment operations: |
Net investment income (loss)c | | | (.04 | ) | | | — | | | | .20 | | | | .33 | | | | .16 | | | | .26 | |
Net gain (loss) on investments (realized and unrealized) | | | (.35 | ) | | | 2.20 | | | | 1.71 | | | | (.27 | ) | | | 1.87 | | | | (.81 | ) |
Total from investment operations | | | (.39 | ) | | | 2.20 | | | | 1.91 | | | | .06 | | | | 2.03 | | | | (.55 | ) |
Less distributions from: |
Net investment income | | | — | | | | (.27 | ) | | | (.72 | ) | | | — | | | | — | | | | — | |
Net realized gains | | | (.06 | ) | | | (.80 | ) | | | (.23 | ) | | | (1.40 | ) | | | — | | | | — | |
Total distributions | | | (.06 | ) | | | (1.07 | ) | | | (.95 | ) | | | (1.40 | ) | | | — | | | | — | |
Net asset value, end of period | | $ | 26.78 | | | $ | 27.23 | | | $ | 26.10 | | | $ | 25.14 | | | $ | 26.48 | | | $ | 24.45 | |
|
Total Return | | | (1.43 | %) | | | 8.79 | % | | | 7.80 | % | | | 0.09 | % | | | 8.34 | % | | | (2.20 | %) |
Ratios/Supplemental Data |
Net assets, end of period (in thousands) | | $ | 3,334 | | | $ | 8,360 | | | $ | 332 | | | $ | 488 | | | $ | 324 | | | $ | 124 | |
Ratios to average net assets: |
Net investment income (loss) | | | (0.27 | %) | | | 0.00 | % | | | 0.77 | % | | | 1.26 | % | | | 0.52 | % | | | 1.64 | % |
Total expensese | | | 1.85 | % | | | 2.00 | % | | | 4.05 | % | | | 4.93 | % | | | 5.18 | % | | | 3.65 | % |
Net expensesf,g,h | | | 1.64 | % | | | 1.65 | % | | | 1.65 | % | | | 1.65 | % | | | 1.65 | % | | | 1.66 | % |
Portfolio turnover rate | | | 240 | % | | | 355 | % | | | 180 | % | | | 216 | % | | | 145 | % | | | 135 | % |
SEE NOTES TO FINANCIAL STATEMENTS. | THE GUGGENHEIM FUNDS SEMI-ANNUAL REPORT | 47 |
MARKET NEUTRAL REAL ESTATE FUND | |
FINANCIAL HIGHLIGHTS (concluded) |
This table is presented to show selected data for a share outstanding throughout each period and to assist shareholders in evaluating a Fund’s performance for the periods presented.
Institutional Class | | Six Months Ended
March 31, 2021a | | | Year Ended
September 30,
2020 | | | Year Ended
September 30,
2019 | | | Year Ended
September 30,
2018 | | | Year Ended
September 30,
2017 | | | Period Ended
September 30,
2016b | |
Per Share Data |
Net asset value, beginning of period | | $ | 27.92 | | | $ | 26.74 | | | $ | 25.32 | | | $ | 26.57 | | | $ | 24.49 | | | $ | 25.00 | |
Income (loss) from investment operations: |
Net investment income (loss)c | | | .03 | | | | .09 | | | | .31 | | | | .36 | | | | .14 | | | | .28 | |
Net gain (loss) on investments (realized and unrealized) | | | (.39 | ) | | | 2.23 | | | | 1.73 | | | | (.21 | ) | | | 1.94 | | | | (.79 | ) |
Total from investment operations | | | (.36 | ) | | | 2.32 | | | | 2.04 | | | | .15 | | | | 2.08 | | | | (.51 | ) |
Less distributions from: |
Net investment income | | | (.02 | ) | | | (.34 | ) | | | (.39 | ) | | | — | | | | — | | | | — | |
Net realized gains | | | (.06 | ) | | | (.80 | ) | | | (.23 | ) | | | (1.40 | ) | | | — | | | | — | |
Total distributions | | | (.08 | ) | | | (1.14 | ) | | | (.62 | ) | | | (1.40 | ) | | | — | | | | — | |
Net asset value, end of period | | $ | 27.48 | | | $ | 27.92 | | | $ | 26.74 | | | $ | 25.32 | | | $ | 26.57 | | | $ | 24.49 | |
|
Total Return | | | (1.27 | %) | | | 9.06 | % | | | 8.19 | % | | | 0.36 | % | | | 8.62 | % | | | (2.04 | %) |
Ratios/Supplemental Data |
Net assets, end of period (in thousands) | | $ | 56,635 | | | $ | 37,399 | | | $ | 5,479 | | | $ | 5,083 | | | $ | 4,995 | | | $ | 4,604 | |
Ratios to average net assets: |
Net investment income (loss) | | | 0.18 | % | | | 0.32 | % | | | 1.18 | % | | | 1.39 | % | | | 0.55 | % | | | 1.92 | % |
Total expensese | | | 1.54 | % | | | 1.85 | % | | | 3.57 | % | | | 4.59 | % | | | 4.52 | % | | | 3.41 | % |
Net expensesf,g,h | | | 1.39 | % | | | 1.40 | % | | | 1.40 | % | | | 1.40 | % | | | 1.40 | % | | | 1.39 | % |
Portfolio turnover rate | | | 240 | % | | | 355 | % | | | 180 | % | | | 216 | % | | | 145 | % | | | 135 | % |
a | Unaudited figures for the period ended March 31, 2021. Percentage amounts for the period, except total return and portfolio turnover rate, have been annualized. |
b | Since commencement of operations: February 26, 2016. Percentage amounts for the period, except total return and portfolio turnover rate, have been annualized. |
c | Net investment income (loss) per share was computed using average shares outstanding throughout the period. |
d | Total return does not reflect the impact of any applicable sales charges. |
e | Does not include expenses of the underlying funds in which the Fund invests. |
f | Net expense information reflects the expense ratios after expense waivers and reimbursements, as applicable. |
g | The portion of the ratios of net expenses to average net assets attributable to recoupments of prior fee reductions or expense reimbursements for the periods presented was as follows: |
| | | 03/31/21 | 09/30/20 | 09/30/19 | 09/30/18 | 09/30/17 |
| | A-Class | — | 0.00%* | 0.00%* | — | 0.22% |
| | C-Class | — | 0.00%* | 0.02% | — | 0.22% |
| | P-Class | — | 0.00%* | 0.01% | — | 0.16% |
| | Institutional Class | — | 0.00%* | 0.03% | — | 0.18% |
h | Net expenses may include expenses that are excluded from the expense limitation agreement. Excluding these expenses, the net expense ratios for the periods presented would be: |
| | | 03/31/21 | 09/30/20 | 09/30/19 | 09/30/18 | 09/30/17 | 9/30/16 |
| | A-Class | 1.63% | 1.65% | 1.62% | 1.65% | 1.63% | 1.63% |
| | C-Class | 2.38% | 2.40% | 2.40% | 2.37% | 2.37% | 2.37% |
| | P-Class | 1.63% | 1.64% | 1.65% | 1.65% | 1.63% | 1.65% |
| | Institutional Class | 1.38% | 1.40% | 1.40% | 1.40% | 1.38% | 1.38% |
48 | THE GUGGENHEIM FUNDS SEMI-ANNUAL REPORT | SEE NOTES TO FINANCIAL STATEMENTS. |
PERFORMANCE REPORT AND FUND PROFILE (Unaudited) | March 31, 2021 |
RISK MANAGED REAL ESTATE FUND
OBJECTIVE: Seeks to provide total return, comprised of capital appreciation and current income.
Holdings Diversification (Market Exposure as % of Net Assets)
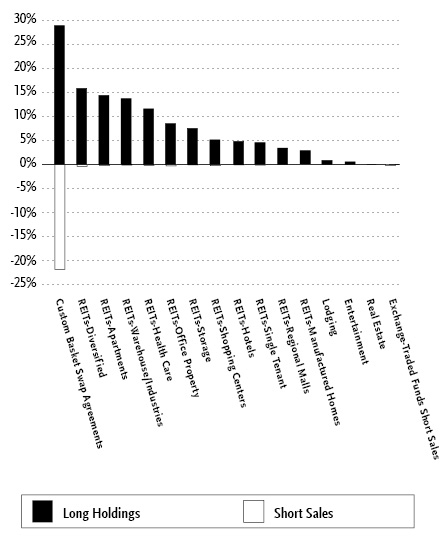
“Holdings Diversification (Market Exposure as % of Net Assets)” excludes any temporary cash investments.
Inception Dates: |
A-Class | March 28, 2014 |
C-Class | March 28, 2014 |
P-Class | May 1, 2015 |
Institutional Class | March 28, 2014 |
Ten Largest Holdings (% of Total Net Assets) |
Prologis, Inc. | 7.3% |
Equinix, Inc. | 6.1% |
Public Storage | 3.7% |
Welltower, Inc. | 3.5% |
Equity Residential | 3.4% |
Simon Property Group, Inc. | 3.4% |
AvalonBay Communities, Inc. | 3.1% |
Digital Realty Trust, Inc. | 3.0% |
Ventas, Inc. | 2.7% |
Invitation Homes, Inc. | 2.7% |
Top Ten Total | 38.9% |
| | |
“Ten Largest Holdings” excludes any temporary cash or derivative investments. |
| | THE GUGGENHEIM FUNDS SEMI-ANNUAL REPORT | 49 |
PERFORMANCE REPORT AND FUND PROFILE (Unaudited)(concluded) | March 31, 2021 |
Average Annual Returns*
Periods Ended March 31, 2021
| 6 Month† | 1 Year | 5 Year | Since
Inception
(03/28/14) |
A-Class Shares | 17.64% | 27.07% | 8.91% | 10.61% |
A-Class Shares with sales charge‡ | 12.07% | 21.02% | 7.85% | 9.84% |
C-Class Shares | 17.17% | 26.04% | 8.07% | 9.76% |
C-Class Shares with CDSC§ | 16.17% | 25.04% | 8.07% | 9.76% |
Institutional Class Shares | 17.81% | 27.41% | 9.21% | 10.92% |
FTSE NAREIT Equity REITs Total Return Index | 21.47% | 37.78% | 5.33% | 7.79% |
| 6 Month† | 1 Year | 5 Year | Since
Inception
(05/01/15) |
P-Class Shares | 17.60% | 26.97% | 8.87% | 8.52% |
FTSE NAREIT Equity REITs Total Return Index | 21.47% | 37.78% | 5.33% | 6.12% |
* | The performance data above represents past performance that is not predictive of future results. The investment return and principal value of an investment in the Fund will fluctuate so that an investor’s shares, when redeemed, may be worth more or less than their original cost. Returns are historical and include changes in principal and reinvested dividends and capital gains and do not reflect the effect of taxes. The FTSE NAREIT Equity REITs Total Return Index is an unmanaged index and, unlike the Fund, has no management fees or operating expenses to reduce its reported return. |
† | 6 month returns are not annualized. |
‡ | Fund returns are calculated using the maximum sales charge of 4.75%. |
§ | Fund returns include a CDSC of 1% if redeemed within 12 months of purchase. |
50 | THE GUGGENHEIM FUNDS SEMI-ANNUAL REPORT | |
SCHEDULE OF INVESTMENTS (Unaudited) | March 31, 2021 |
RISK MANAGED REAL ESTATE FUND | |
| | Shares | | | Value | |
COMMON STOCKS† - 93.4% |
| | | | | | | | | |
REITs - 92.1% |
REITs-Diversified - 15.8% |
Equinix, Inc.1,2 | | | 36,961 | | | $ | 25,118,326 | |
Digital Realty Trust, Inc. | | | 87,296 | | | | 12,294,769 | |
Gaming and Leisure Properties, Inc.2 | | | 176,779 | | | | 7,500,733 | |
VICI Properties, Inc.1 | | | 208,407 | | | | 5,885,414 | |
Duke Realty Corp.2 | | | 103,728 | | | | 4,349,315 | |
Colony Capital, Inc.* | | | 600,225 | | | | 3,889,458 | |
WP Carey, Inc.2 | | | 40,076 | | | | 2,835,778 | |
Safehold, Inc. | | | 40,172 | | | | 2,816,057 | |
EPR Properties | | | 16,249 | | | | 757,041 | |
Total REITs-Diversified | | | | | | | 65,446,891 | |
| | | | | | | | | |
REITs-Apartments - 14.4% |
Equity Residential | | | 197,424 | | | | 14,141,481 | |
AvalonBay Communities, Inc.2 | | | 70,281 | | | | 12,967,547 | |
Invitation Homes, Inc.2 | | | 344,204 | | | | 11,011,086 | |
Essex Property Trust, Inc. | | | 25,174 | | | | 6,843,300 | |
UDR, Inc. | | | 119,640 | | | | 5,247,411 | |
Mid-America Apartment Communities, Inc. | | | 23,490 | | | | 3,391,016 | |
American Homes 4 Rent — Class A2 | | | 75,172 | | | | 2,506,235 | |
Apartment Income REIT Corp.2 | | | 57,766 | | | | 2,470,074 | |
Camden Property Trust2 | | | 10,187 | | | | 1,119,653 | |
Total REITs-Apartments | | | | | | | 59,697,803 | |
| | | | | | | | | |
REITs-Warehouse/Industries - 13.7% |
Prologis, Inc. | | | 285,062 | | | | 30,216,572 | |
CyrusOne, Inc.2 | | | 88,175 | | | | 5,971,211 | |
Americold Realty Trust2 | | | 135,268 | | | | 5,203,760 | |
Terreno Realty Corp.2 | | | 72,623 | | | | 4,195,431 | |
Rexford Industrial Realty, Inc. | | | 83,016 | | | | 4,184,006 | |
Innovative Industrial Properties, Inc. | | | 20,015 | | | | 3,605,902 | |
QTS Realty Trust, Inc. — Class A | | | 52,874 | | | | 3,280,303 | |
Total REITs-Warehouse/Industries | | | | | | | 56,657,185 | |
| | | | | | | | | |
REITs-Health Care - 11.6% |
Welltower, Inc. | | | 200,453 | | | | 14,358,448 | |
Ventas, Inc.2 | | | 212,786 | | | | 11,350,005 | |
Healthpeak Properties, Inc.2 | | | 334,662 | | | | 10,622,172 | |
Medical Properties Trust, Inc. | | | 215,204 | | | | 4,579,541 | |
Omega Healthcare Investors, Inc. | | | 105,367 | | | | 3,859,593 | |
CareTrust REIT, Inc. | | | 148,644 | | | | 3,461,176 | |
Total REITs-Health Care | | | | | | | 48,230,935 | |
| | | | | | | | | |
REITs-Office Property - 8.5% |
Alexandria Real Estate Equities, Inc.1,2 | | | 66,678 | | | | 10,955,195 | |
Boston Properties, Inc.2 | | | 79,060 | | | | 8,005,616 | |
Hudson Pacific Properties, Inc. | | | 130,280 | | | | 3,534,496 | |
SL Green Realty Corp. | | | 45,717 | | | | 3,199,713 | |
Kilroy Realty Corp. | | | 45,128 | | | | 2,961,751 | |
Highwoods Properties, Inc.2 | | | 61,571 | | | | 2,643,859 | |
Empire State Realty Trust, Inc. — Class A | | | 194,605 | | | | 2,165,954 | |
JBG SMITH Properties | | | 47,317 | | | | 1,504,207 | |
American Assets Trust, Inc. | | | 5,930 | | | | 192,369 | |
Total REITs-Office Property | | | | | | | 35,163,160 | |
| | | | | | | | | |
REITs-Storage - 7.5% |
Public Storage | | | 61,416 | | | | 15,155,012 | |
Extra Space Storage, Inc.2 | | | 64,631 | | | | 8,566,839 | |
Iron Mountain, Inc. | | | 99,013 | | | | 3,664,471 | |
CubeSmart2 | | | 53,884 | | | | 2,038,432 | |
Life Storage, Inc. | | | 19,449 | | | | 1,671,642 | |
Total REITs-Storage | | | | | | | 31,096,396 | |
| | | | | | | | | |
REITs-Shopping Centers - 5.1% |
Regency Centers Corp. | | | 114,077 | | | | 6,469,307 | |
Brixmor Property Group, Inc.2 | | | 232,319 | | | | 4,699,813 | |
Weingarten Realty Investors | | | 141,119 | | | | 3,797,512 | |
Kimco Realty Corp. | | | 162,664 | | | | 3,049,950 | |
SITE Centers Corp. | | | 132,943 | | | | 1,802,707 | |
Urban Edge Properties | | | 100,865 | | | | 1,666,290 | |
Total REITs-Shopping Centers | | | | | | | 21,485,579 | |
| | | | | | | | | |
REITs-Hotels - 4.8% |
MGM Growth Properties LLC — Class A | | | 125,588 | | | | 4,096,681 | |
Ryman Hospitality Properties, Inc.* | | | 46,769 | | | | 3,625,065 | |
Xenia Hotels & Resorts, Inc.* | | | 167,376 | | | | 3,263,832 | |
Pebblebrook Hotel Trust | | | 124,187 | | | | 3,016,502 | |
DiamondRock Hospitality Co.* | | | 292,240 | | | | 3,010,072 | |
Host Hotels & Resorts, Inc.* | | | 99,561 | | | | 1,677,603 | |
Park Hotels & Resorts, Inc.* | | | 63,347 | | | | 1,367,028 | |
Total REITs-Hotels | | | | | | | 20,056,783 | |
| | | | | | | | | |
REITs-Single Tenant - 4.5% |
Realty Income Corp.2 | | | 140,742 | | | | 8,937,117 | |
National Retail Properties, Inc. | | | 112,063 | | | | 4,938,616 | |
Agree Realty Corp.2 | | | 71,759 | | | | 4,830,098 | |
NETSTREIT Corp. | | | 2,728 | | | | 50,441 | |
Total REITs-Single Tenant | | | | | | | 18,756,272 | |
| | | | | | | | | |
REITs-Regional Malls - 3.4% |
Simon Property Group, Inc. | | | 123,092 | | | | 14,004,177 | |
| | | | | | | | | |
REITs-Manufactured Homes - 2.8% |
Sun Communities, Inc.2 | | | 49,543 | | | | 7,433,432 | |
Equity LifeStyle Properties, Inc. | | | 67,187 | | | | 4,275,780 | |
Total REITs-Manufactured Homes | | | | | | | 11,709,212 | |
| | | | | | | | | |
Total REITs | | | | | | | 382,304,393 | |
| | | | | | | | | |
Lodging - 0.8% |
Hotels & Motels - 0.8% |
Hilton Grand Vacations, Inc.* | | | 81,999 | | | | 3,074,143 | |
| | | | | | | | | |
Entertainment - 0.5% |
Resorts/Theme Parks - 0.5% |
Marriott Vacations Worldwide Corp.* | | | 11,915 | | | | 2,075,355 | |
| | | | | | | | | |
Real Estate - 0.0% |
Real Estate Management/Services - 0.0% |
Jones Lang LaSalle, Inc.* | | | 806 | | | | 144,306 | |
| | | | | | | | | |
Total Common Stocks | | | | |
(Cost $343,039,909) | | | | | | | 387,598,197 | |
| | | | | | | | | |
SEE NOTES TO FINANCIAL STATEMENTS. | THE GUGGENHEIM FUNDS SEMI-ANNUAL REPORT | 51 |
SCHEDULE OF INVESTMENTS (Unaudited)(continued) | March 31, 2021 |
RISK MANAGED REAL ESTATE FUND | |
| | Shares | | | Value | |
MONEY MARKET FUND† - 7.2% |
Dreyfus Treasury Securities Cash Management Fund — Institutional Shares, 0.01%3 | | | 30,052,050 | | | $ | 30,052,050 | |
Total Money Market Fund | | | | |
(Cost $30,052,050) | | | | | | | 30,052,050 | |
| | | | | | | | | |
Total Investments - 100.6% | | | | |
(Cost $373,091,959) | | $ | 417,650,247 | |
| | | | | | | | | |
COMMON STOCKS SOLD SHORT† - (1.8)% |
Lodging - (0.0)% |
Hotels & Motels - (0.0)% |
Hyatt Hotels Corp. — Class A* | | | 2,981 | | | | (246,529 | ) |
| | | | | | | | | |
REITs - (1.8)% |
REITs-Hotels - (0.1)% |
RLJ Lodging Trust | | | 10,632 | | | | (164,583 | ) |
Sunstone Hotel Investors, Inc.* | | | 13,226 | | | | (164,796 | ) |
Apple Hospitality REIT, Inc. | | | 11,950 | | | | (174,112 | ) |
Total REITs-Hotels | | | | | | | (503,491 | ) |
| | | | | | | | | |
REITs-Storage - (0.1)% |
Life Storage, Inc. | | | 2,776 | | | | (238,554 | ) |
CubeSmart | | | 8,299 | | | | (313,951 | ) |
Total REITs-Storage | | | | | | | (552,505 | ) |
| | | | | | | | | |
REITs-Single Tenant - (0.1)% |
Essential Properties Realty Trust, Inc. | | | 10,523 | | | | (240,240 | ) |
STORE Capital Corp. | | | 10,130 | | | | (339,355 | ) |
Total REITs-Single Tenant | | | | | | | (579,595 | ) |
| | | | | | | | | |
REITs-Warehouse/Industries - (0.2)% |
Industrial Logistics Properties Trust | | | 4,037 | | | | (93,376 | ) |
STAG Industrial, Inc. | | | 5,273 | | | | (177,226 | ) |
Monmouth Real Estate Investment Corp. | | | 18,914 | | | | (334,589 | ) |
Total REITs-Warehouse/Industries | | | | | | | (605,191 | ) |
| | | | | | | | | |
REITs-Apartments - (0.2)% |
American Homes 4 Rent — Class A | | | 2,678 | | | | (89,285 | ) |
Apartment Income REIT Corp. | | | 3,320 | | | | (141,963 | ) |
Independence Realty Trust, Inc. | | | 9,414 | | | | (143,093 | ) |
Mid-America Apartment Communities, Inc. | | | 2,439 | | | | (352,094 | ) |
Total REITs-Apartments | | | | | | | (726,435 | ) |
| | | | | | | | | |
REITs-Shopping Centers - (0.2)% |
SITE Centers Corp. | | | 8,177 | | | | (110,880 | ) |
Retail Properties of America, Inc. — Class A | | | 22,188 | | | | (232,530 | ) |
Retail Opportunity Investments Corp. | | | 14,975 | | | | (237,653 | ) |
Federal Realty Investment Trust | | | 2,365 | | | | (239,929 | ) |
Total REITs-Shopping Centers | | | | | | | (820,992 | ) |
| | | | | | | | | |
REITs-Health Care - (0.2)% |
Physicians Realty Trust | | | 3,089 | | | | (54,583 | ) |
Healthcare Realty Trust, Inc. | | | 5,279 | | | | (160,059 | ) |
Healthcare Trust of America, Inc. — Class A | | | 6,011 | | | | (165,783 | ) |
LTC Properties, Inc. | | | 5,756 | | | | (240,140 | ) |
National Health Investors, Inc. | | | 3,345 | | | | (241,777 | ) |
Total REITs-Health Care | | | | | | | (862,342 | ) |
| | | | | | | | | |
REITs-Office Property - (0.3)% |
Office Properties Income Trust | | | 3,409 | | | | (93,816 | ) |
Easterly Government Properties, Inc. | | | 5,593 | | | | (115,943 | ) |
Cousins Properties, Inc. | | | 4,077 | | | | (144,122 | ) |
Equity Commonwealth | | | 5,610 | | | | (155,958 | ) |
Corporate Office Properties Trust | | | 6,803 | | | | (179,123 | ) |
VEREIT, Inc. | | | 6,331 | | | | (244,503 | ) |
SL Green Realty Corp. | | | 4,962 | | | | (347,290 | ) |
Total REITs-Office Property | | | | | | | (1,280,755 | ) |
| | | | | | | | | |
REITs-Diversified - (0.4)% |
American Finance Trust, Inc. | | | 4,996 | | | | (49,061 | ) |
PS Business Parks, Inc. | | | 695 | | | | (107,433 | ) |
Washington Real Estate Investment Trust | | | 8,934 | | | | (197,441 | ) |
Digital Realty Trust, Inc. | | | 7,956 | | | | (1,120,523 | ) |
Total REITs-Diversified | | | | | | | (1,474,458 | ) |
| | | | | | | | | |
Total REITs | | | | | | | (7,405,764 | ) |
| | | | | | | | | |
Total Common Stocks Sold Short | | | | |
(Proceeds $7,208,381) | | | | | | | (7,652,293 | ) |
| | | | | | | | | |
EXCHANGE-TRADED FUNDS SOLD SHORT† - (0.2)% |
Vanguard Real Estate ETF | | | 7,913 | | | | (726,888 | ) |
Total Exchange-Traded Funds Sold Short | | | | |
(Proceeds $693,439) | | | | | | | (726,888 | ) |
| | | | | | | | | |
Total Securities Sold Short - (2.0)% | | | | |
(Proceeds $7,901,820) | | $ | (8,379,181 | ) |
Other Assets & Liabilities, net - 1.4% | | | 5,639,320 | |
Total Net Assets - 100.0% | | $ | 414,910,386 | |
52 | THE GUGGENHEIM FUNDS SEMI-ANNUAL REPORT | SEE NOTES TO FINANCIAL STATEMENTS. |
SCHEDULE OF INVESTMENTS (Unaudited)(continued) | March 31, 2021 |
RISK MANAGED REAL ESTATE FUND | |
Custom Basket Swap Agreements |
Counterparty | Reference Obligation | Financing Rate
Pay (Receive) | Payment
Frequency | | Maturity
Date | | | Notional
Amount | | | Value and
Unrealized
Appreciation
(Depreciation) | |
OTC Custom Basket Swap Agreements†† |
Morgan Stanley Capital Services LLC | MS Equity Custom Basket | 0.47% (Federal Funds Rate + 0.40%) | At Maturity | | | 06/12/24 | | | $ | 45,989,271 | | | $ | 3,330,016 | |
Goldman Sachs International | GS Equity Custom Basket | 0.52% (Federal Funds Rate + 0.45%) | At Maturity | | | 05/06/24 | | | | 45,989,280 | | | | 3,324,239 | |
Morgan Stanley Capital Services LLC | MS Equity Custom Basket | 0.47% (Federal Funds Rate + 0.40%) | At Maturity | | | 10/22/25 | | | | 13,865,823 | | | | 300,669 | |
Goldman Sachs International | GS Equity Custom Basket | 0.52% (Federal Funds Rate + 0.45%) | At Maturity | | | 05/06/24 | | | | 13,850,616 | | | | 295,151 | |
| | | | | | | | | | $ | 119,694,990 | | | $ | 7,250,075 | |
OTC Custom Basket Swap Agreements Sold Short†† |
Goldman Sachs International | GS Equity Custom Basket | (0.13)% (Federal Funds Rate - 0.20%) | At Maturity | | | 05/06/24 | | | $ | 45,420,864 | | | $ | (2,306,936 | ) |
Morgan Stanley Capital Services LLC | MS Equity Custom Basket | (0.23)% (Federal Funds Rate - 0.30%) | At Maturity | | | 06/12/24 | | | | 45,415,604 | | | | (2,311,386 | ) |
| | | | | | | | | | $ | 90,836,468 | | | $ | (4,618,322 | ) |
| | Shares | | | Percentage
Notional
Amount | | |
Value and
Unrealized
Appreciation
(Depreciation)
| |
MS EQUITY LONG CUSTOM BASKET | | | | | | | | |
Financial | | | | | | | | | | | | |
Innovative Industrial Properties, Inc. | | | 5,550 | | | | 2.17 | % | | $ | 463,831 | |
Weingarten Realty Investors | | | 63,699 | | | | 3.73 | % | | | 437,901 | |
Safehold, Inc. | | | 7,835 | | | | 1.19 | % | | | 286,754 | |
Extra Space Storage, Inc. | | | 15,342 | | | | 4.42 | % | | | 261,147 | |
Ventas, Inc. | | | 28,109 | | | | 3.26 | % | | | 255,598 | |
Regency Centers Corp. | | | 41,359 | | | | 5.10 | % | | | 248,583 | |
Equity Residential | | | 24,761 | | | | 3.86 | % | | | 170,909 | |
VICI Properties, Inc. | | | 41,550 | | | | 2.55 | % | | | 145,912 | |
Jones Lang LaSalle, Inc. | | | 4,958 | | | | 1.93 | % | | | 138,938 | |
Gaming and Leisure Properties, Inc. | | | 34,488 | | | | 3.18 | % | | | 128,181 | |
AvalonBay Communities, Inc. | | | 11,256 | | | | 4.52 | % | | | 122,966 | |
Sun Communities, Inc. | | | 11,092 | | | | 3.62 | % | | | 121,325 | |
Terreno Realty Corp. | | | 15,815 | | | | 1.99 | % | | | 110,077 | |
Public Storage | | | 5,933 | | | | 3.18 | % | | | 93,701 | |
Healthpeak Properties, Inc. | | | 40,285 | | | | 2.78 | % | | | 92,401 | |
Hudson Pacific Properties, Inc. | | | 68,495 | | | | 4.04 | % | | | 83,058 | |
American Assets Trust, Inc. | | | 36,445 | | | | 2.57 | % | | | 61,968 | |
Welltower, Inc. | | | 16,470 | | | | 2.57 | % | | | 61,172 | |
Americold Realty Trust | | | 27,745 | | | | 2.32 | % | | | 53,258 | |
Highwoods Properties, Inc. | | | 31,413 | | | | 2.93 | % | | | 46,724 | |
Invitation Homes, Inc. | | | 17,171 | | | | 1.19 | % | | | 45,432 | |
Alexandria Real Estate Equities, Inc. | | | 6,060 | | | | 2.16 | % | | | 30,247 | |
Agree Realty Corp. | | | 17,235 | | | | 2.52 | % | | | 25,914 | |
Prologis, Inc. | | | 11,256 | | | | 2.59 | % | | | 24,223 | |
Boston Properties, Inc. | | | 12,430 | | | | 2.74 | % | | | 17,284 | |
CyrusOne, Inc. | | | 15,151 | | | | 2.23 | % | | | 15,360 | |
Realty Income Corp. | | | 16,370 | | | | 2.26 | % | | | 12,028 | |
NETSTREIT Corp. | | | 16,771 | | | | 0.67 | % | | | 7,849 | |
Xenia Hotels & Resorts, Inc. | | | 60,514 | | | | 2.57 | % | | | 2,043 | |
Host Hotels & Resorts, Inc. | | | 61,324 | | | | 2.25 | % | | | (2,819 | ) |
MGM Growth Properties LLC — Class A | | | 27,754 | | | | 1.97 | % | | | (4,819 | ) |
Brixmor Property Group, Inc. | | | 43,625 | | | | 1.92 | % | | | (11,663 | ) |
Medical Properties Trust, Inc. | | | 44,517 | | | | 2.06 | % | | | (29,189 | ) |
Ryman Hospitality Properties, Inc. | | | 15,260 | | | | 2.57 | % | | | (32,812 | ) |
CareTrust REIT, Inc. | | | 44,990 | | | | 2.28 | % | | | (33,647 | ) |
Empire State Realty Trust, Inc. — Class A | | | 106,333 | | | | 2.57 | % | | | (42,230 | ) |
Total Financial | | | | | | | | | | | 3,407,605 | |
| | | | | | | | | | | | | |
SEE NOTES TO FINANCIAL STATEMENTS. | THE GUGGENHEIM FUNDS SEMI-ANNUAL REPORT | 53 |
SCHEDULE OF INVESTMENTS (Unaudited)(continued) | March 31, 2021 |
RISK MANAGED REAL ESTATE FUND | |
| | Shares | | | Percentage
Notional
Amount | | | Value and
Unrealized
Appreciation
(Depreciation) | |
Consumer, Cyclical | | | | | | | | | | | | |
Marriott Vacations Worldwide Corp. | | | 4,413 | | | | 1.67 | % | | $ | (18,851 | ) |
Hilton Grand Vacations, Inc. | | | 22,731 | | | | 1.87 | % | | | (58,738 | ) |
Total Consumer, Cyclical | | | | | | | | | | | (77,589 | ) |
Total MS Equity Long Custom Basket | | | | | | $ | 3,330,016 | |
| | | | | | | | | |
MS EQUITY SHORT CUSTOM BASKET | | | | | | | | |
Financial | | | | | | | | | | | | |
Essential Properties Realty Trust, Inc. | | | 64,665 | | | | (3.25 | )% | | $ | 43,965 | |
Easterly Government Properties, Inc. | | | 34,371 | | | | (1.57 | )% | | | 38,215 | |
Equity Commonwealth | | | 34,471 | | | | (2.11 | )% | | | 24,616 | |
Federal Realty Investment Trust | | | 14,533 | | | | (3.25 | )% | | | 21,214 | |
Office Properties Income Trust | | | 15,626 | | | | (0.95 | )% | | | 19,651 | |
Cousins Properties, Inc. | | | 25,053 | | | | (1.95 | )% | | | 16,522 | |
Apple Hospitality REIT, Inc. | | | 73,437 | | | | (2.36 | )% | | | 11,659 | |
RLJ Lodging Trust | | | 65,338 | | | | (2.23 | )% | | | 10,666 | |
Healthcare Trust of America, Inc. — Class A | | | 36,937 | | | | (2.24 | )% | | | 6,687 | |
Sunstone Hotel Investors, Inc. | | | 81,282 | | | | (2.23 | )% | | | 6,439 | |
Corporate Office Properties Trust | | | 41,806 | | | | (2.42 | )% | | | 2,677 | |
Physicians Realty Trust | | | 18,983 | | | | (0.74 | )% | | | 2,520 | |
LTC Properties, Inc. | | | 35,372 | | | | (3.25 | )% | | | (4,074 | ) |
American Finance Trust, Inc. | | | 30,700 | | | | (0.66 | )% | | | (6,016 | ) |
Healthcare Realty Trust, Inc. | | | 32,442 | | | | (2.17 | )% | | | (13,646 | ) |
Industrial Logistics Properties Trust | | | 24,807 | | | | (1.26 | )% | | | (21,822 | ) |
SITE Centers Corp. | | | 50,251 | | | | (1.50 | )% | | | (31,558 | ) |
Digital Realty Trust, Inc. | | | 7,581 | | | | (2.35 | )% | | | (39,227 | ) |
STAG Industrial, Inc. | | | 32,406 | | | | (2.40 | )% | | | (45,469 | ) |
Independence Realty Trust, Inc. | | | 57,849 | | | | (1.94 | )% | | | (61,629 | ) |
PS Business Parks, Inc. | | | 4,268 | | | | (1.45 | )% | | | (63,895 | ) |
Retail Opportunity Investments Corp. | | | 92,029 | | | | (3.22 | )% | | | (82,918 | ) |
Life Storage, Inc. | | | 17,054 | | | | (3.23 | )% | | | (97,947 | ) |
VEREIT, Inc. | | | 38,903 | | | | (3.31 | )% | | | (98,846 | ) |
National Health Investors, Inc. | | | 20,557 | | | | (3.27 | )% | | | (100,300 | ) |
Washington Real Estate Investment Trust | | | 54,901 | | | | (2.67 | )% | | | (108,085 | ) |
American Homes 4 Rent — Class A | | | 39,276 | | | | (2.88 | )% | | | (114,995 | ) |
SL Green Realty Corp. | | | 30,495 | | | | (4.70 | )% | | | (149,102 | ) |
CubeSmart | | | 50,997 | | | | (4.25 | )% | | | (168,176 | ) |
Mid-America Apartment Communities, Inc. | | | 14,988 | | | | (4.76 | )% | | | (173,715 | ) |
STORE Capital Corp. | | | 62,254 | | | | (4.59 | )% | | | (218,729 | ) |
Monmouth Real Estate Investment Corp. | | | 116,235 | | | | (4.53 | )% | | | (262,222 | ) |
Retail Properties of America, Inc. — Class A | | | 136,355 | | | | (3.13 | )% | | | (478,779 | ) |
Total Financial | | | | | | | | | | | (2,136,319 | ) |
| | | | | | | | | | | | | |
Exchange-Traded Funds | | | | | | | | | | | | |
Vanguard Real Estate ETF | | | 48,630 | | | | (9.84 | )% | | | (40,020 | ) |
| | | | | | | | | | | | | |
Consumer, Cyclical | | | | | | | | | | | | |
Hyatt Hotels Corp. — Class A | | | 18,319 | | | | (3.34 | )% | | | (135,047 | ) |
Total MS Equity Short Custom Basket | | | | | | $ | (2,311,386 | ) |
| | | | | | | | | |
MS EQUITY LONG CUSTOM BASKET | | | | | | | | |
Financial | | | | | | | | | | | | |
Prologis, Inc. | | | 10,340 | | | | 7.90 | % | | $ | 64,960 | |
Public Storage | | | 2,206 | | | | 3.93 | % | | | 23,052 | |
Digital Realty Trust, Inc. | | | 2,941 | | | | 2.99 | % | | | 20,358 | |
Simon Property Group, Inc. | | | 4,493 | | | | 3.69 | % | | | 18,537 | |
Equity Residential | | | 7,060 | | | | 3.65 | % | | | 17,002 | |
Extra Space Storage, Inc. | | | 2,268 | | | | 2.17 | % | | | 16,826 | |
Invitation Homes, Inc. | | | 12,464 | | | | 2.88 | % | | | 16,143 | |
Equinix, Inc. | | | 1,349 | | | | 6.61 | % | | | 11,566 | |
Americold Realty Trust | | | 4,773 | | | | 1.32 | % | | | 11,278 | |
Healthpeak Properties, Inc. | | | 11,978 | | | | 2.74 | % | | | 11,105 | |
Iron Mountain, Inc. | | | 3,614 | | | | 0.96 | % | | | 9,018 | |
VICI Properties, Inc. | | | 7,361 | | | | 1.50 | % | | | 8,944 | |
Weingarten Realty Investors | | | 4,773 | | | | 0.93 | % | | | 8,789 | |
AvalonBay Communities, Inc. | | | 2,498 | | | | 3.32 | % | | | 8,746 | |
Realty Income Corp. | | | 5,040 | | | | 2.31 | % | | | 8,658 | |
UDR, Inc. | | | 4,367 | | | | 1.38 | % | | | 7,848 | |
Mid-America Apartment Communities, Inc. | | | 857 | | | | 0.89 | % | | | 6,374 | |
Regency Centers Corp. | | | 3,919 | | | | 1.60 | % | | | 6,161 | |
Duke Realty Corp. | | | 3,786 | | | | 1.14 | % | | | 5,970 | |
Rexford Industrial Realty, Inc. | | | 3,030 | | | | 1.10 | % | | | 5,738 | |
Pebblebrook Hotel Trust | | | 4,533 | | | | 0.79 | % | | | 5,707 | |
National Retail Properties, Inc. | | | 4,091 | | | | 1.30 | % | | | 5,073 | |
Equity LifeStyle Properties, Inc. | | | 2,452 | | | | 1.13 | % | | | 4,777 | |
American Homes 4 Rent — Class A | | | 3,817 | | | | 0.92 | % | | | 4,703 | |
Welltower, Inc. | | | 7,220 | | | | 3.73 | % | | | 4,408 | |
CyrusOne, Inc. | | | 3,129 | | | | 1.53 | % | | | 3,203 | |
WP Carey, Inc. | | | 1,463 | | | | 0.75 | % | | | 3,177 | |
54 | THE GUGGENHEIM FUNDS SEMI-ANNUAL REPORT | SEE NOTES TO FINANCIAL STATEMENTS. |
SCHEDULE OF INVESTMENTS (Unaudited)(continued) | March 31, 2021 |
RISK MANAGED REAL ESTATE FUND | |
| | Shares | | | Percentage
Notional
Amount | | | Value and
Unrealized
Appreciation
(Depreciation) | |
Highwoods Properties, Inc. | | | 1,957 | | | | 0.61 | % | | $ | 2,877 | |
Park Hotels & Resorts, Inc. | | �� | 2,333 | | | | 0.36 | % | | | 2,796 | |
CubeSmart | | | 1,967 | | | | 0.54 | % | | | 2,444 | |
Camden Property Trust | | | 371 | | | | 0.29 | % | | | 2,262 | |
SITE Centers Corp. | | | 4,853 | | | | 0.47 | % | | | 2,170 | |
Terreno Realty Corp. | | | 2,557 | | | | 1.07 | % | | | 2,159 | |
Agree Realty Corp. | | | 2,517 | | | | 1.22 | % | | | 1,946 | |
Kimco Realty Corp. | | | 5,938 | | | | 0.80 | % | | | 1,891 | |
Apartment Income REIT Corp. | | | 1,334 | | | | 0.41 | % | | | 1,805 | |
Sun Communities, Inc. | | | 1,742 | | | | 1.88 | % | | | 1,780 | |
Life Storage, Inc. | | | 710 | | | | 0.44 | % | | | 1,229 | |
Essex Property Trust, Inc. | | | 919 | | | | 1.80 | % | | | 1,204 | |
DiamondRock Hospitality Co. | | | 10,669 | | | | 0.79 | % | | | 1,061 | |
Host Hotels & Resorts, Inc. | | | 3,270 | | | | 0.40 | % | | | 1,044 | |
Alexandria Real Estate Equities, Inc. | | | 2,391 | | | | 2.83 | % | | | 920 | |
Colony Capital, Inc. | | | 21,912 | | | | 1.02 | % | | | 857 | |
Kilroy Realty Corp. | | | 1,647 | | | | 0.78 | % | | | 434 | |
Hudson Pacific Properties, Inc. | | | 4,349 | | | | 0.85 | % | | | 244 | |
Omega Healthcare Investors, Inc. | | | 2,658 | | | | 0.70 | % | | | 135 | |
Innovative Industrial Properties, Inc. | | | 697 | | | | 0.91 | % | | | 124 | |
MGM Growth Properties LLC — Class A | | | 4,420 | | | | 1.04 | % | | | 16 | |
QTS Realty Trust, Inc. — Class A | | | 1,930 | | | | 0.86 | % | | | (647 | ) |
Xenia Hotels & Resorts, Inc. | | | 6,715 | | | | 0.94 | % | | | (817 | ) |
EPR Properties | | | 593 | | | | 0.20 | % | | | (858 | ) |
Brixmor Property Group, Inc. | | | 8,222 | | | | 1.20 | % | | | (973 | ) |
Urban Edge Properties | | | 3,682 | | | | 0.44 | % | | | (1,052 | ) |
Gaming and Leisure Properties, Inc. | | | 6,248 | | | | 1.91 | % | | | (1,106 | ) |
JBG SMITH Properties | | | 1,727 | | | | 0.40 | % | | | (1,701 | ) |
Medical Properties Trust, Inc. | | | 7,592 | | | | 1.17 | % | | | (1,916 | ) |
Empire State Realty Trust, Inc. — Class A | | | 6,872 | | | | 0.55 | % | | | (1,933 | ) |
Safehold, Inc. | | | 1,420 | | | | 0.72 | % | | | (2,524 | ) |
Ryman Hospitality Properties, Inc. | | | 1,616 | | | | 0.90 | % | | | (3,506 | ) |
CareTrust REIT, Inc. | | | 7,235 | | | | 1.21 | % | | | (4,226 | ) |
Ventas, Inc. | | | 7,601 | | | | 2.92 | % | | | (4,429 | ) |
Boston Properties, Inc. | | | 2,812 | | | | 2.05 | % | | | (5,852 | ) |
SL Green Realty Corp. | | | 1,670 | | | | 0.88 | % | | | (6,531 | ) |
Total Financial | | | | | | | | | | | 309,448 | |
| | | | | | | | | | | | | |
Consumer, Cyclical | | | | | | | | | | | | |
Hilton Grand Vacations, Inc. | | | 2,858 | | | | 0.77 | % | | | (4,022 | ) |
Marriott Vacations Worldwide Corp. | | | 408 | | | | 0.51 | % | | | (4,757 | ) |
Total Consumer, Cyclical | | | | | | | | | | | (8,779 | ) |
Total MS Equity Long Custom Basket | | | | | | $ | 300,669 | |
| | | | | | | | | | | | | |
GS EQUITY LONG CUSTOM BASKET | | | | | | | | |
Financial | | | | | | | | | | | | |
Innovative Industrial Properties, Inc. | | | 5,550 | | | | 2.17 | % | | $ | 469,242 | |
Weingarten Realty Investors | | | 63,699 | | | | 3.73 | % | | | 435,371 | |
Safehold, Inc. | | | 7,835 | | | | 1.19 | % | | | 286,418 | |
Extra Space Storage, Inc. | | | 15,342 | | | | 4.42 | % | | | 261,192 | |
Ventas, Inc. | | | 28,109 | | | | 3.26 | % | | | 255,257 | |
Regency Centers Corp. | | | 41,359 | | | | 5.10 | % | | | 247,885 | |
Equity Residential | | | 24,761 | | | | 3.86 | % | | | 167,346 | |
VICI Properties, Inc. | | | 41,550 | | | | 2.55 | % | | | 144,735 | |
Jones Lang LaSalle, Inc. | | | 4,958 | | | | 1.93 | % | | | 139,246 | |
Gaming and Leisure Properties, Inc. | | | 34,488 | | | | 3.18 | % | | | 128,824 | |
Sun Communities, Inc. | | | 11,092 | | | | 3.62 | % | | | 122,438 | |
AvalonBay Communities, Inc. | | | 11,256 | | | | 4.52 | % | | | 120,994 | |
Terreno Realty Corp. | | | 15,815 | | | | 1.99 | % | | | 111,829 | |
Public Storage | | | 5,933 | | | | 3.18 | % | | | 93,949 | |
Healthpeak Properties, Inc. | | | 40,285 | | | | 2.78 | % | | | 93,365 | |
Hudson Pacific Properties, Inc. | | | 68,495 | | | | 4.04 | % | | | 82,672 | |
American Assets Trust, Inc. | | | 36,445 | | | | 2.57 | % | | | 70,600 | |
Welltower, Inc. | | | 16,470 | | | | 2.57 | % | | | 60,780 | |
Americold Realty Trust | | | 27,745 | | | | 2.32 | % | | | 52,304 | |
Highwoods Properties, Inc. | | | 31,413 | | | | 2.93 | % | | | 46,205 | |
Invitation Homes, Inc. | | | 17,171 | | | | 1.19 | % | | | 45,682 | |
Alexandria Real Estate Equities, Inc. | | | 6,060 | | | | 2.16 | % | | | 30,237 | |
Prologis, Inc. | | | 11,256 | | | | 2.59 | % | | | 23,664 | |
Agree Realty Corp. | | | 17,235 | | | | 2.52 | % | | | 19,545 | |
Boston Properties, Inc. | | | 12,430 | | | | 2.74 | % | | | 16,700 | |
CyrusOne, Inc. | | | 15,151 | | | | 2.23 | % | | | 15,835 | |
Realty Income Corp. | | | 16,370 | | | | 2.26 | % | | | 11,336 | |
NETSTREIT Corp. | | | 16,771 | | | | 0.67 | % | | | 6,526 | |
Xenia Hotels & Resorts, Inc. | | | 60,514 | | | | 2.57 | % | | | 1,796 | |
Host Hotels & Resorts, Inc. | | | 61,324 | | | | 2.25 | % | | | (2,247 | ) |
MGM Growth Properties LLC — Class A | | | 27,754 | | | | 1.97 | % | | | (4,907 | ) |
Brixmor Property Group, Inc. | | | 43,625 | | | | 1.92 | % | | | (11,347 | ) |
SEE NOTES TO FINANCIAL STATEMENTS. | THE GUGGENHEIM FUNDS SEMI-ANNUAL REPORT | 55 |
SCHEDULE OF INVESTMENTS (Unaudited)(continued) | March 31, 2021 |
RISK MANAGED REAL ESTATE FUND | |
| | Shares | | | Percentage
Notional
Amount | | | Value and
Unrealized
Appreciation
(Depreciation) | |
Medical Properties Trust, Inc. | | | 44,517 | | | | 2.06 | % | | $ | (29,186 | ) |
Ryman Hospitality Properties, Inc. | | | 15,260 | | | | 2.57 | % | | | (33,577 | ) |
CareTrust REIT, Inc. | | | 44,990 | | | | 2.28 | % | | | (34,292 | ) |
Empire State Realty Trust, Inc. — Class A | | | 106,333 | | | | 2.59 | % | | | (41,910 | ) |
Total Financial | | | | | | | | | | | 3,404,507 | |
| | | | | | | | | | | | | |
Consumer, Cyclical | | | | | | | | | | | | |
Marriott Vacations Worldwide Corp. | | | 4,413 | | | | 1.67 | % | | | (20,957 | ) |
Hilton Grand Vacations, Inc. | | | 22,731 | | | | 1.85 | % | | | (59,311 | ) |
Total Consumer, Cyclical | | | | | | | | | | | (80,268 | ) |
Total GS Equity Long Custom Basket | | | | | | $ | 3,324,239 | |
| | | | | | | | | |
GS EQUITY SHORT CUSTOM BASKET | | | | | | | | |
Financial | | | | | | | | | | | | |
Essential Properties Realty Trust, Inc. | | | 64,665 | | | | (3.25 | )% | | $ | 44,581 | |
Easterly Government Properties, Inc. | | | 34,371 | | | | (1.57 | )% | | | 38,230 | |
Equity Commonwealth | | | 34,471 | | | | (2.11 | )% | | | 25,121 | |
Federal Realty Investment Trust | | | 14,533 | | | | (3.25 | )% | | | 19,991 | |
Office Properties Income Trust | | | 15,626 | | | | (0.95 | )% | | | 19,273 | |
Cousins Properties, Inc. | | | 25,053 | | | | (1.95 | )% | | | 16,411 | |
Apple Hospitality REIT, Inc. | | | 73,437 | | | | (2.36 | )% | | | 11,906 | |
RLJ Lodging Trust | | | 65,338 | | | | (2.23 | )% | | | 10,822 | |
Healthcare Trust of America, Inc. — Class A | | | 36,937 | | | | (2.24 | )% | | | 6,996 | |
Sunstone Hotel Investors, Inc. | | | 81,282 | | | | (2.23 | )% | | | 6,218 | |
Corporate Office Properties Trust | | | 41,806 | | | | (2.42 | )% | | | 2,649 | |
Physicians Realty Trust | | | 18,983 | | | | (0.74 | )% | | | 2,613 | |
Apartment Income REIT Corp. | | | 123 | | | | (0.01 | )% | | | 52 | |
LTC Properties, Inc. | | | 35,372 | | | | (3.25 | )% | | | (2,967 | ) |
American Finance Trust, Inc. | | | 30,700 | | | | (0.66 | )% | | | (5,094 | ) |
Healthcare Realty Trust, Inc. | | | 32,442 | | | | (2.17 | )% | | | (13,893 | ) |
Industrial Logistics Properties Trust | | | 24,807 | | | | (1.26 | )% | | | (21,815 | ) |
SITE Centers Corp. | | | 50,251 | | | | (1.50 | )% | | | (31,111 | ) |
Digital Realty Trust, Inc. | | | 7,581 | | | | (2.35 | )% | | | (38,955 | ) |
STAG Industrial, Inc. | | | 32,406 | | | | (2.40 | )% | | | (44,751 | ) |
Independence Realty Trust, Inc. | | | 57,849 | | | | (1.94 | )% | | | (61,648 | ) |
PS Business Parks, Inc. | | | 4,268 | | | | (1.45 | )% | | | (64,345 | ) |
Retail Opportunity Investments Corp. | | | 92,029 | | | | (3.22 | )% | | | (85,567 | ) |
Life Storage, Inc. | | | 17,054 | | | | (3.23 | )% | | | (97,809 | ) |
VEREIT, Inc. | | | 38,903 | | | | (3.31 | )% | | | (98,521 | ) |
National Health Investors, Inc. | | | 20,557 | | | | (3.27 | )% | | | (100,736 | ) |
Washington Real Estate Investment Trust | | | 54,901 | | | | (2.67 | )% | | | (107,335 | ) |
American Homes 4 Rent — Class A | | | 39,276 | | | | (2.88 | )% | | | (114,755 | ) |
SL Green Realty Corp. | | | 30,495 | | | | (4.70 | )% | | | (149,516 | ) |
CubeSmart | | | 50,997 | | | | (4.25 | )% | | | (167,903 | ) |
Mid-America Apartment Communities, Inc. | | | 14,988 | | | | (4.76 | )% | | | (173,482 | ) |
STORE Capital Corp. | | | 62,254 | | | | (4.59 | )% | | | (216,465 | ) |
Monmouth Real Estate Investment Corp. | | | 116,235 | | | | (4.53 | )% | | | (261,982 | ) |
Retail Properties of America, Inc. — Class A | | | 136,355 | | | | (3.12 | )% | | | (477,847 | ) |
Total Financial | | | | | | | | | | | (2,131,634 | ) |
| | | | | | | | | | | | | |
Consumer, Cyclical | | | | | | | | | | | | |
Hyatt Hotels Corp. — Class A | | | 18,319 | | | | (3.34 | )% | | | (135,169 | ) |
| | | | | | | | | | | | | |
Exchange-Traded Funds | | | | | | | | | | | | |
Vanguard Real Estate ETF | | | 48,630 | | | | (9.84 | )% | | | (40,133 | ) |
Total GS Equity Short Custom Basket | | | | | | $ | (2,306,936 | ) |
| | | | | | | | | | | | | |
GS EQUITY LONG CUSTOM BASKET | | | | | | | | |
Financial | | | | | | | | | | | | |
Prologis, Inc. | | | 10,340 | | | | 7.91 | % | | $ | 64,680 | |
Public Storage | | | 2,206 | | | | 3.93 | % | | | 22,901 | |
Digital Realty Trust, Inc. | | | 2,941 | | | | 2.99 | % | | | 20,326 | |
Simon Property Group, Inc. | | | 4,493 | | | | 3.69 | % | | | 18,435 | |
Equity Residential | | | 7,060 | | | | 3.65 | % | | | 16,942 | |
Extra Space Storage, Inc. | | | 2,268 | | | | 2.17 | % | | | 16,788 | |
Invitation Homes, Inc. | | | 12,464 | | | | 2.88 | % | | | 16,077 | |
Americold Realty Trust | | | 4,773 | | | | 1.33 | % | | | 11,333 | |
Healthpeak Properties, Inc. | | | 11,978 | | | | 2.74 | % | | | 11,086 | |
Equinix, Inc. | | | 1,349 | | | | 6.62 | % | | | 10,879 | |
Iron Mountain, Inc. | | | 3,614 | | | | 0.97 | % | | | 9,015 | |
VICI Properties, Inc. | | | 7,361 | | | | 1.50 | % | | | 8,968 | |
Weingarten Realty Investors | | | 4,773 | | | | 0.93 | % | | | 8,782 | |
AvalonBay Communities, Inc. | | | 2,498 | | | | 3.33 | % | | | 8,701 | |
Realty Income Corp. | | | 5,040 | | | | 2.31 | % | | | 8,683 | |
UDR, Inc. | | | 4,367 | | | | 1.38 | % | | | 7,832 | |
Mid-America Apartment Communities, Inc. | | | 857 | | | | 0.89 | % | | | 6,421 | |
Regency Centers Corp. | | | 3,919 | | | | 1.60 | % | | | 6,148 | |
Duke Realty Corp. | | | 3,786 | | | | 1.15 | % | | | 5,919 | |
56 | THE GUGGENHEIM FUNDS SEMI-ANNUAL REPORT | SEE NOTES TO FINANCIAL STATEMENTS. |
SCHEDULE OF INVESTMENTS (Unaudited)(continued) | March 31, 2021 |
RISK MANAGED REAL ESTATE FUND | |
| | Shares | | | Percentage
Notional
Amount | | |
Value and
Unrealized
Appreciation
(Depreciation)
| |
Rexford Industrial Realty, Inc. | | | 3,030 | | | | 1.10 | % | | $ | 5,705 | |
Pebblebrook Hotel Trust | | | 4,533 | | | | 0.79 | % | | | 5,677 | |
National Retail Properties, Inc. | | | 4,091 | | | | 1.30 | % | | | 4,819 | |
Equity LifeStyle Properties, Inc. | | | 2,452 | | | | 1.13 | % | | | 4,805 | |
American Homes 4 Rent — Class A | | | 3,817 | | | | 0.92 | % | | | 4,727 | |
Welltower, Inc. | | | 7,220 | | | | 3.73 | % | | | 4,249 | |
CyrusOne, Inc. | | | 3,129 | | | | 1.53 | % | | | 3,254 | |
WP Carey, Inc. | | | 1,463 | | | | 0.75 | % | | | 3,120 | |
Highwoods Properties, Inc. | | | 1,957 | | | | 0.61 | % | | | 2,836 | |
CubeSmart | | | 1,967 | | | | 0.54 | % | | | 2,439 | |
Camden Property Trust | | | 371 | | | | 0.29 | % | | | 2,244 | |
SITE Centers Corp. | | | 4,853 | | | | 0.48 | % | | | 2,203 | |
Terreno Realty Corp. | | | 2,557 | | | | 1.07 | % | | | 2,169 | |
Agree Realty Corp. | | | 2,517 | | | | 1.22 | % | | | 1,943 | |
Kimco Realty Corp. | | | 5,938 | | | | 0.80 | % | | | 1,859 | |
Apartment Income REIT Corp. | | | 1,334 | | | | 0.41 | % | | | 1,834 | |
Sun Communities, Inc. | | | 1,742 | | | | 1.89 | % | | | 1,628 | |
Life Storage, Inc. | | | 710 | | | | 0.44 | % | | | 1,253 | |
Essex Property Trust, Inc. | | | 919 | | | | 1.80 | % | | | 1,231 | |
Host Hotels & Resorts, Inc. | | | 3,270 | | | | 0.40 | % | | | 1,042 | |
DiamondRock Hospitality Co. | | | 10,669 | | | | 0.79 | % | | | 1,033 | |
Colony Capital, Inc. | | | 21,912 | | | | 1.03 | % | | | 888 | |
Alexandria Real Estate Equities, Inc. | | | 2,391 | | | | 2.84 | % | | | 752 | |
Kilroy Realty Corp. | | | 1,647 | | | | 0.78 | % | | | 407 | |
Hudson Pacific Properties, Inc. | | | 4,349 | | | | 0.85 | % | | | 222 | |
Omega Healthcare Investors, Inc. | | | 2,658 | | | | 0.70 | % | | | 112 | |
Innovative Industrial Properties, Inc. | | | 697 | | | | 0.91 | % | | | 103 | |
MGM Growth Properties LLC — Class A | | | 4,420 | | | | 1.04 | % | | | (35 | ) |
Xenia Hotels & Resorts, Inc. | | | 8,517 | | | | 1.20 | % | | | (585 | ) |
QTS Realty Trust, Inc. — Class A | | | 1,930 | | | | 0.86 | % | | | (693 | ) |
Brixmor Property Group, Inc. | | | 8,222 | | | | 1.20 | % | | | (840 | ) |
EPR Properties | | | 593 | | | | 0.20 | % | | | (855 | ) |
Urban Edge Properties | | | 3,682 | | | | 0.44 | % | | | (1,095 | ) |
Gaming and Leisure Properties, Inc. | | | 6,248 | | | | 1.91 | % | | | (1,236 | ) |
JBG SMITH Properties | | | 1,727 | | | | 0.40 | % | | | (1,720 | ) |
Medical Properties Trust, Inc. | | | 7,592 | | | | 1.17 | % | | | (1,920 | ) |
Empire State Realty Trust, Inc. — Class A | | | 6,872 | | | | 0.55 | % | | | (1,935 | ) |
Safehold, Inc. | | | 1,420 | | | | 0.72 | % | | | (2,640 | ) |
Ryman Hospitality Properties, Inc. | | | 1,616 | | | | 0.90 | % | | | (3,552 | ) |
CareTrust REIT, Inc. | | | 7,235 | | | | 1.22 | % | | | (4,294 | ) |
Ventas, Inc. | | | 7,601 | | | | 2.93 | % | | | (4,559 | ) |
Boston Properties, Inc. | | | 2,812 | | | | 2.06 | % | | | (5,915 | ) |
SL Green Realty Corp. | | | 1,670 | | | | 0.85 | % | | | (6,531 | ) |
Total Financial | | | | | | | | | | | 304,065 | |
| | | | | | | | | | | | | |
Consumer, Cyclical | | | | | | | | | | | | |
Hilton Grand Vacations, Inc. | | | 2,858 | | | | 0.77 | % | | | (4,062 | ) |
Marriott Vacations Worldwide Corp. | | | 408 | | | | 0.51 | % | | | (4,852 | ) |
Total Consumer, Cyclical | | | | | | | | | | | (8,914 | ) |
Total GS Equity Long Custom Basket | | | | | | $ | 295,151 | |
* | Non-income producing security. |
† | Value determined based on Level 1 inputs — See Note 4. |
†† | Value determined based on Level 2 inputs — See Note 4. |
1 | All or a portion of this security is pledged as short security collateral at March 31, 2021. |
2 | All or a portion of this security is pledged as custom basket swap collateral at March 31, 2021. |
3 | Rate indicated is the 7-day yield as of March 31, 2021. |
| | GS — Goldman Sachs International |
| | MS — Morgan Stanley Capital Services LLC |
| | REIT — Real Estate Investment Trust |
| | |
| | See Sector Classification in Other Information section. |
SEE NOTES TO FINANCIAL STATEMENTS. | THE GUGGENHEIM FUNDS SEMI-ANNUAL REPORT | 57 |
SCHEDULE OF INVESTMENTS (Unaudited)(concluded) | March 31, 2021 |
RISK MANAGED REAL ESTATE FUND | |
The following table summarizes the inputs used to value the Fund’s investments at March 31, 2021 (See Note 4 in the Notes to Financial Statements):
Investments in Securities (Assets) | | Level 1
Quoted
Prices | | | Level 2
Significant
Observable
Inputs | | | Level 3
Significant
Unobservable
Inputs | | | Total | |
Common Stocks | | $ | 387,598,197 | | | $ | — | | | $ | — | | | $ | 387,598,197 | |
Money Market Fund | | | 30,052,050 | | | | — | | | | — | | | | 30,052,050 | |
Equity Custom Basket Swap Agreements** | | | — | | | | 7,250,075 | | | | — | | | | 7,250,075 | |
Total Assets | | $ | 417,650,247 | | | $ | 7,250,075 | | | $ | — | | | $ | 424,900,322 | |
Investments in Securities (Liabilities) | | Level 1
Quoted
Prices | | | Level 2
Significant
Observable
Inputs | | | Level 3
Significant
Unobservable
Inputs | | | Total | |
Common Stocks Sold Short | | $ | 7,652,293 | | | $ | — | | | $ | — | | | $ | 7,652,293 | |
Exchange-Traded Funds Sold Short | | | 726,888 | | | | — | | | | — | | | | 726,888 | |
Equity Custom Basket Swap Agreements** | | | — | | | | 4,618,322 | | | | — | | | | 4,618,322 | |
Total Liabilities | | $ | 8,379,181 | | | $ | 4,618,322 | | | $ | — | | | $ | 12,997,503 | |
** | This derivative is reported as unrealized appreciation/depreciation at period end. |
58 | THE GUGGENHEIM FUNDS SEMI-ANNUAL REPORT | SEE NOTES TO FINANCIAL STATEMENTS. |
RISK MANAGED REAL ESTATE FUND | |
STATEMENT OF ASSETS AND LIABILITIES (Unaudited) |
March 31, 2021 |
Assets: |
Investments, at value (cost $373,091,959) | | $ | 417,650,247 | |
Cash | | | 5,311,245 | |
Unrealized appreciation on OTC swap agreements | | | 7,250,075 | |
Prepaid expenses | | | 64,024 | |
Receivables: |
Securities sold | | | 10,686,954 | |
Dividends | | | 1,283,487 | |
Fund shares sold | | | 330,625 | |
Swap settlement | | | 269,209 | |
Interest | | | 157 | |
Other assets | | | 25,208 | |
Total assets | | | 442,871,231 | |
| | | | | |
Liabilities: |
Securities sold short, at value (proceeds $7,901,820) | | | 8,379,181 | |
Segregated cash due to broker | | | 1,478,030 | |
Unrealized depreciation on OTC swap agreements | | | 4,618,322 | |
Payable for: |
Securities purchased | | | 12,312,068 | |
Fund shares redeemed | | | 651,133 | |
Management fees | | | 245,381 | |
Distributions to shareholders | | | 199,600 | |
Fund accounting/administration fees | | | 26,064 | |
Transfer agent/maintenance fees | | | 8,295 | |
Distribution and service fees | | | 7,077 | |
Trustees’ fees* | | | 1,245 | |
Due to Investment Adviser | | | 686 | |
Miscellaneous | | | 33,763 | |
Total liabilities | | | 27,960,845 | |
Net assets | | $ | 414,910,386 | |
| | | | | |
Net assets consist of: |
Paid in capital | | $ | 367,271,996 | |
Total distributable earnings (loss) | | | 47,638,390 | |
Net assets | | $ | 414,910,386 | |
| | | | | |
A-Class: |
Net assets | | $ | 6,995,405 | |
Capital shares outstanding | | | 211,814 | |
Net asset value per share | | $ | 33.03 | |
Maximum offering price per share (Net asset value divided by 95.25%) | | $ | 34.68 | |
| | | | | |
C-Class: |
Net assets | | $ | 3,105,631 | |
Capital shares outstanding | | | 94,794 | |
Net asset value per share | | $ | 32.76 | |
| | | | | |
P-Class: |
Net assets | | $ | 14,043,241 | |
Capital shares outstanding | | | 423,146 | |
Net asset value per share | | $ | 33.19 | |
| | | | | |
Institutional Class: |
Net assets | | $ | 390,766,109 | |
Capital shares outstanding | | | 11,680,262 | |
Net asset value per share | | $ | 33.46 | |
* | Relates to Trustees not deemed “interested persons” within the meaning of Section 2(a)(19) of the 1940 Act. |
SEE NOTES TO FINANCIAL STATEMENTS. | THE GUGGENHEIM FUNDS SEMI-ANNUAL REPORT | 59 |
RISK MANAGED REAL ESTATE FUND | |
STATEMENT OF OPERATIONS (Unaudited) |
Six Months Ended March 31, 2021 |
Investment Income: |
Dividends | | $ | 4,484,327 | |
Interest | | | 670 | |
Total investment income | | | 4,484,997 | |
| | | | | |
Expenses: |
Management fees | | | 1,343,402 | |
Distribution and service fees: |
A-Class | | | 13,686 | |
C-Class | | | 14,152 | |
P-Class | | | 16,154 | |
Transfer agent/maintenance fees: |
A-Class | | | 4,077 | |
C-Class | | | 1,649 | |
P-Class | | | 6,506 | |
Institutional Class | | | 96,405 | |
Short sales dividend expense | | | 150,846 | |
Fund accounting/administration fees | | | 125,378 | |
Professional fees | | | 32,917 | |
Trustees’ fees* | | | 12,305 | |
Custodian fees | | | 11,587 | |
Line of credit fees | | | 6,083 | |
Interest expense | | | 865 | |
Miscellaneous | | | 75,936 | |
Recoupment of previously waived fees: |
A-Class | | | 632 | |
C-Class | | | 663 | |
P-Class | | | 4,137 | |
Institutional Class | | | 11,818 | |
Total expenses | | | 1,929,198 | |
Less: |
Expenses reimbursed by Adviser: |
A-Class | | | (638 | ) |
C-Class | | | (292 | ) |
P-Class | | | (1,361 | ) |
Institutional Class | | | (8,816 | ) |
Expenses waived by Adviser | | | (3,885 | ) |
Earnings credits applied | | | (22 | ) |
Total waived/reimbursed expenses | | | (15,014 | ) |
Net expenses | | | 1,914,184 | |
Net investment income | | | 2,570,813 | |
| | | | | |
Net Realized and Unrealized Gain (Loss): |
Net realized gain (loss) on: |
Investments | | $ | 22,669,686 | |
Investments sold short | | | (1,697,945 | ) |
Swap agreements | | | 135,818 | |
Net realized gain | | | 21,107,559 | |
Net change in unrealized appreciation (depreciation) on: |
Investments | | | 35,894,036 | |
Investments sold short | | | (299,234 | ) |
Swap agreements | | | 413,080 | |
Net change in unrealized appreciation (depreciation) | | | 36,007,882 | |
Net realized and unrealized gain | | | 57,115,441 | |
Net increase in net assets resulting from operations | | $ | 59,686,254 | |
* | Relates to Trustees not deemed “interested persons” within the meaning of Section 2(a)(19) of the 1940 Act. |
60 | THE GUGGENHEIM FUNDS SEMI-ANNUAL REPORT | SEE NOTES TO FINANCIAL STATEMENTS. |
RISK MANAGED REAL ESTATE FUND | |
STATEMENTS OF CHANGES IN NET ASSETS |
| | Six Months Ended
March 31, 2021
(Unaudited) | | | Year Ended
September 30,
2020 | |
Increase (Decrease) in Net Assets from Operations: | | | | | | | | |
Net investment income | | $ | 2,570,813 | | | $ | 3,220,961 | |
Net realized gain on investments | | | 21,107,559 | | | | 12,964,702 | |
Net change in unrealized appreciation (depreciation) on investments | | | 36,007,882 | | | | (28,257,366 | ) |
Net increase (decrease) in net assets resulting from operations | | | 59,686,254 | | | | (12,071,703 | ) |
| | | | | | | | | |
Distributions to shareholders: | | | | | | | | |
A-Class | | | (873,217 | ) | | | (957,148 | ) |
C-Class | | | (178,952 | ) | | | (113,526 | ) |
P-Class | | | (780,953 | ) | | | (877,436 | ) |
Institutional Class | | | (20,556,936 | ) | | | (12,530,172 | ) |
Total distributions to shareholders | | | (22,390,058 | ) | | | (14,478,282 | ) |
| | | | | | | | | |
Capital share transactions: | | | | | | | | |
Proceeds from sale of shares | | | | | | | | |
A-Class | | | 2,452,243 | | | | 5,640,634 | |
C-Class | | | 708,778 | | | | 2,155,146 | |
P-Class | | | 4,396,006 | | | | 11,549,513 | |
Institutional Class | | | 108,930,724 | | | | 154,929,010 | |
Distributions reinvested | | | | | | | | |
A-Class | | | 858,530 | | | | 944,537 | |
C-Class | | | 167,316 | | | | 104,891 | |
P-Class | | | 780,953 | | | | 877,436 | |
Institutional Class | | | 16,807,077 | | | | 10,433,798 | |
Cost of shares redeemed | | | | | | | | |
A-Class | | | (12,791,941 | ) | | | (5,310,772 | ) |
C-Class | | | (486,096 | ) | | | (1,173,851 | ) |
P-Class | | | (4,633,517 | ) | | | (31,799,723 | ) |
Institutional Class | | | (60,582,621 | ) | | | (53,391,937 | ) |
Net increase from capital share transactions | | | 56,607,452 | | | | 94,958,682 | |
Net increase in net assets | | | 93,903,648 | | | | 68,408,697 | |
| | | | | | | | | |
Net assets: | | | | | | | | |
Beginning of period | | | 321,006,738 | | | | 252,598,041 | |
End of period | | $ | 414,910,386 | | | $ | 321,006,738 | |
| | | | | | | | | |
Capital share activity: | | | | | | | | |
Shares sold | | | | | | | | |
A-Class | | | 77,808 | | | | 181,753 | |
C-Class | | | 22,793 | | | | 67,526 | |
P-Class | | | 140,090 | | | | 354,802 | |
Institutional Class | | | 3,473,478 | | | | 5,166,648 | |
Shares issued from reinvestment of distributions | | | | | | | | |
A-Class | | | 28,206 | | | | 29,970 | |
C-Class | | | 5,535 | | | | 3,334 | |
P-Class | | | 25,434 | | | | 27,630 | |
Institutional Class | | | 542,338 | | | | 329,330 | |
Shares redeemed | | | | | | | | |
A-Class | | | (423,267 | ) | | | (171,692 | ) |
C-Class | | | (15,747 | ) | | | (39,458 | ) |
P-Class | | | (145,828 | ) | | | (967,278 | ) |
Institutional Class | | | (1,910,663 | ) | | | (1,724,186 | ) |
Net increase in shares | | | 1,820,177 | | | | 3,258,379 | |
SEE NOTES TO FINANCIAL STATEMENTS. | THE GUGGENHEIM FUNDS SEMI-ANNUAL REPORT | 61 |
RISK MANAGED REAL ESTATE FUND | |
This table is presented to show selected data for a share outstanding throughout each period and to assist shareholders in evaluating a Fund’s performance for the periods presented.
A-Class | | Six Months Ended
March 31, 2021a | | | Year Ended
September 30,
2020 | | | Year Ended
September 30,
2019 | | | Year Ended
September 30,
2018 | | | Year Ended
September 30,
2017 | | | Year Ended
September 30,
2016 | |
Per Share Data |
Net asset value, beginning of period | | $ | 29.97 | | | $ | 34.11 | | | $ | 28.93 | | | $ | 29.70 | | | $ | 28.87 | | | $ | 29.77 | |
Income (loss) from investment operations: |
Net investment income (loss)b | | | .17 | | | | .31 | | | | .34 | | | | .41 | | | | .03 | | | | .19 | |
Net gain (loss) on investments (realized and unrealized) | | | 4.94 | | | | (2.53 | ) | | | 5.65 | | | | .38 | | | | 2.08 | | | | 3.84 | |
Total from investment operations | | | 5.11 | | | | (2.22 | ) | | | 5.99 | | | | .79 | | | | 2.11 | | | | 4.03 | |
Less distributions from: |
Net investment income | | | (.31 | ) | | | (.63 | ) | | | (.55 | ) | | | (.52 | ) | | | (.57 | ) | | | (1.12 | ) |
Net realized gains | | | (1.74 | ) | | | (1.29 | ) | | | (.26 | ) | | | (1.04 | ) | | | (.71 | ) | | | (3.81 | ) |
Total distributions | | | (2.05 | ) | | | (1.92 | ) | | | (.81 | ) | | | (1.56 | ) | | | (1.28 | ) | | | (4.93 | ) |
Net asset value, end of period | | $ | 33.03 | | | $ | 29.97 | | | $ | 34.11 | | | $ | 28.93 | | | $ | 29.70 | | | $ | 28.87 | |
|
Total Returnc | | | 17.64 | % | | | (6.73 | %) | | | 21.12 | % | | | 2.70 | % | | | 7.54 | % | | | 14.88 | % |
Ratios/Supplemental Data |
Net assets, end of period (in thousands) | | $ | 6,995 | | | $ | 15,857 | | | $ | 16,682 | | | $ | 13,772 | | | $ | 2,196 | | | $ | 743 | |
Ratios to average net assets: |
Net investment income (loss) | | | 1.11 | % | | | 0.99 | % | | | 1.09 | % | | | 1.42 | % | | | 0.09 | % | | | 0.66 | % |
Total expensesd | | | 1.32 | % | | | 1.71 | % | | | 1.89 | % | | | 1.78 | % | | | 1.45 | % | | | 1.93 | % |
Net expensese,f,g | | | 1.31 | % | | | 1.70 | % | | | 1.88 | % | | | 1.76 | % | | | 1.33 | % | | | 1.78 | % |
Portfolio turnover rate | | | 59 | % | | | 180 | % | | | 122 | % | | | 107 | % | | | 85 | % | | | 133 | % |
C-Class | | Six Months Ended
March 31, 2021a | | | Year Ended
September 30,
2020 | | | Year Ended
September 30,
2019 | | | Year Ended
September 30,
2018 | | | Year Ended
September 30,
2017 | | | Year Ended
September 30,
2016 | |
Per Share Data |
Net asset value, beginning of period | | $ | 29.76 | | | $ | 33.88 | | | $ | 28.75 | | | $ | 29.54 | | | $ | 28.77 | | | $ | 29.56 | |
Income (loss) from investment operations: |
Net investment income (loss)b | | | .06 | | | | .08 | | | | .11 | | | | .15 | | | | (.19 | ) | | | .02 | |
Net gain (loss) on investments (realized and unrealized) | | | 4.87 | | | | (2.53 | ) | | | 5.60 | | | | .42 | | | | 2.06 | | | | 3.77 | |
Total from investment operations | | | 4.93 | | | | (2.45 | ) | | | 5.71 | | | | .57 | | | | 1.87 | | | | 3.79 | |
Less distributions from: |
Net investment income | | | (.19 | ) | | | (.38 | ) | | | (.32 | ) | | | (.32 | ) | | | (.39 | ) | | | (.77 | ) |
Net realized gains | | | (1.74 | ) | | | (1.29 | ) | | | (.26 | ) | | | (1.04 | ) | | | (.71 | ) | | | (3.81 | ) |
Total distributions | | | (1.93 | ) | | | (1.67 | ) | | | (.58 | ) | | | (1.36 | ) | | | (1.10 | ) | | | (4.58 | ) |
Net asset value, end of period | | $ | 32.76 | | | $ | 29.76 | | | $ | 33.88 | | | $ | 28.75 | | | $ | 29.54 | | | $ | 28.77 | |
|
Total Returnc | | | 17.17 | % | | | (7.48 | %) | | | 20.23 | % | | | 1.93 | % | | | 6.71 | % | | | 14.00 | % |
Ratios/Supplemental Data |
Net assets, end of period (in thousands) | | $ | 3,106 | | | $ | 2,446 | | | $ | 1,721 | | | $ | 867 | | | $ | 725 | | | $ | 518 | |
Ratios to average net assets: |
Net investment income (loss) | | | 0.42 | % | | | 0.26 | % | | | 0.35 | % | | | 0.53 | % | | | (0.66 | %) | | | 0.08 | % |
Total expensesd | | | 2.15 | % | | | 2.54 | % | | | 2.73 | % | | | 2.71 | % | | | 2.27 | % | | | 3.32 | % |
Net expensese,f,g | | | 2.12 | % | | | 2.51 | % | | | 2.65 | % | | | 2.53 | % | | | 2.08 | % | | | 2.53 | % |
Portfolio turnover rate | | | 59 | % | | | 180 | % | | | 122 | % | | | 107 | % | | | 85 | % | | | 133 | % |
62 | THE GUGGENHEIM FUNDS SEMI-ANNUAL REPORT | SEE NOTES TO FINANCIAL STATEMENTS. |
RISK MANAGED REAL ESTATE FUND | |
FINANCIAL HIGHLIGHTS (continued) |
This table is presented to show selected data for a share outstanding throughout each period and to assist shareholders in evaluating a Fund’s performance for the periods presented.
P-Class | | Six Months Ended
March 31, 2021a | | | Year Ended
September 30,
2020 | | | Year Ended
September 30,
2019 | | | Year Ended
September 30,
2018 | | | Year Ended
September 30,
2017 | | | Year Ended
September 30,
2016 | |
Per Share Data |
Net asset value, beginning of period | | $ | 30.12 | | | $ | 34.30 | | | $ | 29.09 | | | $ | 29.85 | | | $ | 29.01 | | | $ | 29.77 | |
Income (loss) from investment operations: |
Net investment income (loss)b | | | .17 | | | | .22 | | | | .60 | | | | .37 | | | | .13 | | | | .16 | |
Net gain (loss) on investments (realized and unrealized) | | | 4.95 | | | | (2.48 | ) | | | 5.42 | | | | .43 | | | | 1.98 | | | | 3.88 | |
Total from investment operations | | | 5.12 | | | | (2.26 | ) | | | 6.02 | | | | .80 | | | | 2.11 | | | | 4.04 | |
Less distributions from: |
Net investment income | | | (.31 | ) | | | (.63 | ) | | | (.55 | ) | | | (.52 | ) | | | (.56 | ) | | | (.99 | ) |
Net realized gains | | | (1.74 | ) | | | (1.29 | ) | | | (.26 | ) | | | (1.04 | ) | | | (.71 | ) | | | (3.81 | ) |
Total distributions | | | (2.05 | ) | | | (1.92 | ) | | | (.81 | ) | | | (1.56 | ) | | | (1.27 | ) | | | (4.80 | ) |
Net asset value, end of period | | $ | 33.19 | | | $ | 30.12 | | | $ | 34.30 | | | $ | 29.09 | | | $ | 29.85 | | | $ | 29.01 | |
|
Total Return | | | 17.60 | % | | | (6.81 | %) | | | 21.12 | % | | | 2.68 | % | | | 7.53 | % | | | 14.87 | % |
Ratios/Supplemental Data |
Net assets, end of period (in thousands) | | $ | 14,043 | | | $ | 12,152 | | | $ | 33,894 | | | $ | 4,217 | | | $ | 2,564 | | | $ | 82 | |
Ratios to average net assets: |
Net investment income (loss) | | | 1.08 | % | | | 0.70 | % | | | 1.87 | % | | | 1.29 | % | | | 0.42 | % | | | 0.56 | % |
Total expensesd | | | 1.40 | % | | | 1.84 | % | | | 1.93 | % | | | 1.88 | % | | | 1.51 | % | | | 1.88 | % |
Net expensese,f,g | | | 1.37 | % | | | 1.78 | % | | | 1.89 | % | | | 1.78 | % | | | 1.30 | % | | | 1.78 | % |
Portfolio turnover rate | | | 59 | % | | | 180 | % | | | 122 | % | | | 107 | % | | | 85 | % | | | 133 | % |
SEE NOTES TO FINANCIAL STATEMENTS. | THE GUGGENHEIM FUNDS SEMI-ANNUAL REPORT | 63 |
RISK MANAGED REAL ESTATE FUND | |
FINANCIAL HIGHLIGHTS (concluded) |
This table is presented to show selected data for a share outstanding throughout each period and to assist shareholders in evaluating a Fund’s performance for the periods presented.
Institutional Class | | Six Months Ended
March 31, 2021a | | | Year Ended
September 30,
2020 | | | Year Ended
September 30,
2019 | | | Year Ended
September 30,
2018 | | | Year Ended
September 30,
2017 | | | Year Ended
September 30,
2016 | |
Per Share Data |
Net asset value, beginning of period | | $ | 30.34 | | | $ | 34.51 | | | $ | 29.27 | | | $ | 30.04 | | | $ | 29.18 | | | $ | 29.90 | |
Income (loss) from investment operations: |
Net investment income (loss)b | | | .23 | | | | .41 | | | | .43 | | | | .46 | | | | .11 | | | | .26 | |
Net gain (loss) on investments (realized and unrealized) | | | 5.00 | | | | (2.58 | ) | | | 5.71 | | | | .43 | | | | 2.10 | | | | 3.89 | |
Total from investment operations | | | 5.23 | | | | (2.17 | ) | | | 6.14 | | | | .89 | | | | 2.21 | | | | 4.15 | |
Less distributions from: |
Net investment income | | | (.37 | ) | | | (.71 | ) | | | (.64 | ) | | | (.62 | ) | | | (.64 | ) | | | (1.06 | ) |
Net realized gains | | | (1.74 | ) | | | (1.29 | ) | | | (.26 | ) | | | (1.04 | ) | | | (.71 | ) | | | (3.81 | ) |
Total distributions | | | (2.11 | ) | | | (2.00 | ) | | | (.90 | ) | | | (1.66 | ) | | | (1.35 | ) | | | (4.87 | ) |
Net asset value, end of period | | $ | 33.46 | | | $ | 30.34 | | | $ | 34.51 | | | $ | 29.27 | | | $ | 30.04 | | | $ | 29.18 | |
|
Total Return | | | 17.81 | % | | | (6.48 | %) | | | 21.46 | % | | | 2.98 | % | | | 7.87 | % | | | 15.20 | % |
Ratios/Supplemental Data |
Net assets, end of period (in thousands) | | $ | 390,766 | | | $ | 290,551 | | | $ | 200,301 | | | $ | 154,245 | | | $ | 123,037 | | | $ | 111,823 | |
Ratios to average net assets: |
Net investment income (loss) | | | 1.47 | % | | | 1.31 | % | | | 1.38 | % | | | 1.56 | % | | | 0.38 | % | | | 0.91 | % |
Total expensesd | | | 1.05 | % | | | 1.43 | % | | | 1.61 | % | | | 1.51 | % | | | 1.02 | % | | | 1.50 | % |
Net expensese,f,g | | | 1.04 | % | | | 1.43 | % | | | 1.60 | % | | | 1.50 | % | | | 1.01 | % | | | 1.50 | % |
Portfolio turnover rate | | | 59 | % | | | 180 | % | | | 122 | % | | | 107 | % | | | 85 | % | | | 133 | % |
a | Unaudited figures for the period ended March 31, 2021. Percentage amounts for the period, except total return and portfolio turnover rate, have been annualized. |
b | Net investment income (loss) per share was computed using average shares outstanding throughout the period. |
c | Total return does not reflect the impact of any applicable sales charges. |
d | Does not include expenses of the underlying funds in which the Fund invests. |
e | Net expense information reflects the expense ratios after expense waivers and reimbursements, as applicable. |
f | The portion of the ratios of net expenses to average net assets attributable to recoupments of prior fee reductions or expense reimbursements for the periods presented was as follows: |
| | | 03/31/21a | 09/30/20 | 09/30/19 | 09/30/18 | 09/30/17 |
| | A-Class | 0.01% | 0.02% | 0.03% | 0.03% | 0.02% |
| | C-Class | 0.05% | 0.04% | 0.01% | 0.01% | 0.00%* |
| | P-Class | 0.06% | 0.02% | 0.02% | 0.01% | 0.00%* |
| | Institutional Class | 0.01% | 0.01% | 0.01% | 0.02% | — |
g | Net expenses may include expenses that are excluded from the expense limitation agreement. Excluding these expenses, the net expense ratios for the periods presented would be: |
| | | 03/31/21a | 09/30/20 | 09/30/19 | 09/30/18 | 09/30/17 | 09/30/16 |
| | A-Class | 1.22% | 1.23% | 1.27% | 1.29% | 1.30% | 1.29% |
| | C-Class | 2.03% | 2.05% | 2.05% | 2.05% | 2.04% | 2.03% |
| | P-Class | 1.29% | 1.30% | 1.30% | 1.30% | 1.29% | 1.28% |
| | Institutional Class | 0.95% | 0.96% | 1.00% | 1.03% | 0.97% | 1.00% |
64 | THE GUGGENHEIM FUNDS SEMI-ANNUAL REPORT | SEE NOTES TO FINANCIAL STATEMENTS. |
PERFORMANCE REPORT AND FUND PROFILE (Unaudited) | March 31, 2021 |
SMALL CAP VALUE FUND
OBJECTIVE: Seeks long-term capital appreciation.
Holdings Diversification (Market Exposure as % of Net Assets)
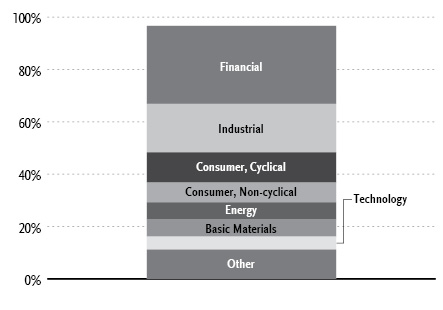
“Holdings Diversification (Market Exposure as % of Net Assets)” excludes any temporary cash investments.
Inception Dates: |
A-Class | July 11, 2008 |
C-Class | July 11, 2008 |
P-Class | May 1, 2015 |
Institutional Class | July 11, 2008 |
Ten Largest Holdings (% of Total Net Assets) |
Pioneer Natural Resources Co. | 2.4% |
Pinnacle Financial Partners, Inc. | 2.2% |
iShares Russell 2000 Value ETF | 2.2% |
Range Resources Corp. | 1.9% |
First Horizon Corp. | 1.9% |
Synovus Financial Corp. | 1.9% |
Evolent Health, Inc. — Class A | 1.7% |
MDU Resources Group, Inc. | 1.6% |
Abercrombie & Fitch Co. — Class A | 1.5% |
Encompass Health Corp. | 1.5% |
Top Ten Total | 18.8% |
| | |
“Ten Largest Holdings” excludes any temporary cash investments. |
| | THE GUGGENHEIM FUNDS SEMI-ANNUAL REPORT | 65 |
PERFORMANCE REPORT AND FUND PROFILE (Unaudited)(concluded) | March 31, 2021 |
Average Annual Returns*
Periods Ended March 31, 2021
| 6 Month† | 1 Year | 5 Year | 10 Year |
A-Class Shares | 50.91% | 78.10% | 9.82% | 7.69% |
A-Class Shares with sales charge‡ | 43.73% | 69.61% | 8.76% | 7.16% |
C-Class Shares | 50.36% | 76.82% | 8.98% | 6.88% |
C-Class Shares with CDSC§ | 49.36% | 75.82% | 8.98% | 6.88% |
Institutional Class Shares | 51.04% | 78.55% | 10.09% | 7.95% |
Russell 2000 Value Index | 61.59% | 97.05% | 13.56% | 10.06% |
| 6 Month† | 1 Year | 5 Year | Since
Inception
(05/01/15) |
P-Class Shares | 50.89% | 78.05% | 9.82% | 7.46% |
Russell 2000 Value Index | 61.59% | 97.05% | 13.56% | 10.18% |
* | The performance data above represents past performance that is not predictive of future results. The investment return and principal value of an investment in the Fund will fluctuate so that an investor’s shares, when redeemed, may be worth more or less than their original cost. Returns are historical and include changes in principal and reinvested dividends and capital gains and do not reflect the effect of taxes. The Russell 2000 Value Index is an unmanaged index and, unlike the Fund, has no management fees or operating expenses to reduce its reported return. |
† | 6 month returns are not annualized. |
‡ | Fund returns are calculated using the maximum sales charge of 4.75%. |
§ | Fund returns include a CDSC of 1% if redeemed within 12 months of purchase. |
66 | THE GUGGENHEIM FUNDS SEMI-ANNUAL REPORT | |
SCHEDULE OF INVESTMENTS (Unaudited) | March 31, 2021 |
SMALL CAP VALUE FUND | |
| | Shares | | | Value | |
COMMON STOCKS† - 94.3% |
| | | | | | | | | |
Financial - 29.8% |
Pinnacle Financial Partners, Inc. | | | 1,877 | | | $ | 166,415 | |
First Horizon Corp. | | | 8,381 | | | | 141,723 | |
Synovus Financial Corp. | | | 3,046 | | | | 139,354 | |
Physicians Realty Trust REIT | | | 6,281 | | | | 110,985 | |
Investors Bancorp, Inc. | | | 7,289 | | | | 107,075 | |
CNO Financial Group, Inc. | | | 4,045 | | | | 98,253 | |
Hilltop Holdings, Inc. | | | 2,806 | | | | 95,769 | |
Lexington Realty Trust REIT | | | 8,172 | | | | 90,791 | |
Axis Capital Holdings Ltd. | | | 1,793 | | | | 88,879 | |
Cathay General Bancorp | | | 2,146 | | | | 87,514 | |
Simmons First National Corp. — Class A | | | 2,938 | | | | 87,170 | |
BOK Financial Corp. | | | 958 | | | | 85,568 | |
Radian Group, Inc. | | | 3,075 | | | | 71,494 | |
Hanmi Financial Corp. | | | 3,541 | | | | 69,864 | |
MGIC Investment Corp. | | | 4,838 | | | | 67,006 | |
Heritage Insurance Holdings, Inc. | | | 5,840 | | | | 64,707 | |
Stifel Financial Corp. | | | 984 | | | | 63,035 | |
Hancock Whitney Corp. | | | 1,406 | | | | 59,066 | |
Flagstar Bancorp, Inc. | | | 1,277 | | | | 57,593 | |
Zions Bancorp North America | | | 1,019 | | | | 56,004 | |
Independent Bank Group, Inc. | | | 658 | | | | 47,534 | |
Kennedy-Wilson Holdings, Inc. | | | 2,301 | | | | 46,503 | |
Berkshire Hills Bancorp, Inc. | | | 2,052 | | | | 45,801 | |
Apple Hospitality REIT, Inc. | | | 2,954 | | | | 43,040 | |
Sunstone Hotel Investors, Inc. REIT* | | | 3,446 | | | | 42,937 | |
Park Hotels & Resorts, Inc. REIT* | | | 1,923 | | | | 41,499 | |
Piedmont Office Realty Trust, Inc. — Class A REIT | | | 2,297 | | | | 39,899 | |
Heartland Financial USA, Inc. | | | 764 | | | | 38,399 | |
Old Republic International Corp. | | | 1,688 | | | | 36,866 | |
RMR Group, Inc. — Class A | | | 797 | | | | 32,526 | |
UMB Financial Corp. | | | 182 | | | | 16,804 | |
Total Financial | | | | | | | 2,240,073 | |
| | | | | | | | | |
Industrial - 18.6% |
MDU Resources Group, Inc. | | | 3,802 | | | | 120,181 | |
Knight-Swift Transportation Holdings, Inc. | | | 2,136 | | | | 102,720 | |
Owens Corning | | | 1,036 | | | | 95,405 | |
Sanmina Corp.* | | | 2,233 | | | | 92,402 | |
GATX Corp. | | | 917 | | | | 85,043 | |
Graphic Packaging Holding Co. | | | 4,476 | | | | 81,284 | |
PGT Innovations, Inc.* | | | 3,162 | | | | 79,841 | |
Plexus Corp.* | | | 862 | | | | 79,166 | |
Valmont Industries, Inc. | | | 316 | | | | 75,104 | |
Rexnord Corp. | | | 1,594 | | | | 75,061 | |
Altra Industrial Motion Corp. | | | 1,281 | | | | 70,865 | |
Colfax Corp.* | | | 1,552 | | | | 67,993 | |
EnerSys | | | 695 | | | | 63,106 | |
Curtiss-Wright Corp. | | | 394 | | | | 46,728 | |
Kirby Corp.* | | | 748 | | | | 45,090 | |
Kennametal, Inc. | | | 1,077 | | | | 43,048 | |
Terex Corp. | | | 905 | | | | 41,693 | |
Energizer Holdings, Inc. | | | 751 | | | | 35,642 | |
Encore Wire Corp. | | | 431 | | | | 28,933 | |
Park Aerospace Corp. | | | 2,051 | | | | 27,114 | |
Schneider National, Inc. — Class B | | | 1,006 | | | | 25,120 | |
Howmet Aerospace, Inc.* | | | 627 | | | | 20,146 | |
Total Industrial | | | | | | | 1,401,685 | |
| | | | | | | | | |
Consumer, Cyclical - 11.5% |
Abercrombie & Fitch Co. — Class A* | | | 3,302 | | | | 113,292 | |
Alaska Air Group, Inc.* | | | 1,224 | | | | 84,713 | |
Hawaiian Holdings, Inc.* | | | 3,153 | | | | 84,090 | |
MSC Industrial Direct Company, Inc. — Class A | | | 834 | | | | 75,218 | |
Penske Automotive Group, Inc. | | | 717 | | | | 57,532 | |
Meritage Homes Corp.* | | | 592 | | | | 54,417 | |
Dick’s Sporting Goods, Inc. | | | 567 | | | | 43,177 | |
Wabash National Corp. | | | 2,262 | | | | 42,526 | |
Urban Outfitters, Inc.* | | | 1,130 | | | | 42,025 | |
Methode Electronics, Inc. | | | 975 | | | | 40,931 | |
Big Lots, Inc. | | | 590 | | | | 40,297 | |
Dana, Inc. | | | 1,551 | | | | 37,736 | |
Avient Corp. | | | 797 | | | | 37,674 | |
International Game Technology plc* | | | 2,275 | | | | 36,514 | |
Movado Group, Inc. | | | 1,265 | | | | 35,989 | |
Lakeland Industries, Inc.* | | | 667 | | | | 18,582 | |
Tenneco, Inc. — Class A* | | | 1,556 | | | | 16,680 | |
Total Consumer, Cyclical | | | | | | | 861,393 | |
| | | | | | | | | |
Consumer, Non-cyclical - 7.6% |
Encompass Health Corp. | | | 1,366 | | | | 111,875 | |
Central Garden & Pet Co. — Class A* | | | 1,632 | | | | 84,685 | |
Sabre Corp.* | | | 5,711 | | | | 84,580 | |
Ingredion, Inc. | | | 834 | | | | 74,993 | |
Emergent BioSolutions, Inc.* | | | 699 | | | | 64,944 | |
US Foods Holding Corp.* | | | 1,618 | | | | 61,678 | |
Integer Holdings Corp.* | | | 637 | | | | 58,668 | |
Perdoceo Education Corp.* | | | 2,215 | | | | 26,491 | |
Total Consumer, Non-cyclical | | | | | | | 567,914 | |
| | | | | | | | | |
Energy - 6.6% |
Pioneer Natural Resources Co. | | | 1,159 | | | | 184,073 | |
Range Resources Corp.* | | | 13,806 | | | | 142,616 | |
Patterson-UTI Energy, Inc. | | | 11,049 | | | | 78,779 | |
CNX Resources Corp.* | | | 5,066 | | | | 74,470 | |
Oil States International, Inc.* | | | 3,362 | | | | 20,273 | |
Total Energy | | | | | | | 500,211 | |
| | | | | | | | | |
Basic Materials - 6.5% |
Huntsman Corp. | | | 3,448 | | | | 99,406 | |
Ashland Global Holdings, Inc. | | | 1,048 | | | | 93,031 | |
Commercial Metals Co. | | | 2,201 | | | | 67,879 | |
Reliance Steel & Aluminum Co. | | | 412 | | | | 62,743 | |
Olin Corp. | | | 1,349 | | | | 51,221 | |
Element Solutions, Inc. | | | 2,441 | | | | 44,646 | |
Kraton Corp.* | | | 1,088 | | | | 39,810 | |
Verso Corp. — Class A | | | 2,106 | | | | 30,727 | |
Total Basic Materials | | | | | | | 489,463 | |
SEE NOTES TO FINANCIAL STATEMENTS. | THE GUGGENHEIM FUNDS SEMI-ANNUAL REPORT | 67 |
SCHEDULE OF INVESTMENTS (Unaudited)(concluded) | March 31, 2021 |
SMALL CAP VALUE FUND | |
| | Shares | | | Value | |
Technology - 4.9% |
Evolent Health, Inc. — Class A* | | | 6,240 | | | $ | 126,048 | |
Conduent, Inc.* | | | 10,862 | | | | 72,341 | |
Parsons Corp.* | | | 1,503 | | | | 60,781 | |
Axcelis Technologies, Inc.* | | | 1,202 | | | | 49,390 | |
Science Applications International Corp. | | | 493 | | | | 41,210 | |
DXC Technology Co.* | | | 606 | | | | 18,944 | |
Total Technology | | | | | | | 368,714 | |
| | | | | | | | | |
Utilities - 4.4% |
Black Hills Corp. | | | 1,334 | | | | 89,071 | |
Avista Corp. | | | 1,751 | | | | 83,610 | |
Southwest Gas Holdings, Inc. | | | 856 | | | | 58,816 | |
Spire, Inc. | | | 714 | | | | 52,757 | |
ALLETE, Inc. | | | 710 | | | | 47,705 | |
Total Utilities | | | | | | | 331,959 | |
| | | | | | | | | |
Communications - 4.4% |
Infinera Corp.* | | | 9,868 | | | | 95,029 | |
Viavi Solutions, Inc.* | | | 5,482 | | | | 86,067 | |
Gray Television, Inc. | | | 2,644 | | | | 48,650 | |
Ciena Corp.* | | | 701 | | | | 38,359 | |
Tribune Publishing Co.* | | | 1,946 | | | | 35,009 | |
Entercom Communications Corp. — Class A* | | | 5,002 | | | | 26,260 | |
Total Communications | | | | | | | 329,374 | |
| | | | | | | | | |
Total Common Stocks | | | | |
(Cost $5,410,687) | | | | | | | 7,090,786 | |
CONVERTIBLE PREFERRED STOCKS††† - 0.0% |
Industrial - 0.0% |
Thermoenergy Corp.*,1 | | | 6,250 | | | | 9 | |
Total Convertible Preferred Stocks | | | | |
(Cost $5,968) | | | | | | | 9 | |
| | | | | | | | | |
RIGHTS† - 0.2% |
Basic Materials - 0.2% |
Pan American Silver Corp.* | | | 17,705 | | | | 15,403 | |
Total Rights | | | | |
(Cost $—) | | | | | | | 15,403 | |
| | | | | | | | | |
EXCHANGE-TRADED FUNDS† - 2.2% |
iShares Russell 2000 Value ETF | | | 1,026 | | | | 163,616 | |
Total Exchange-Traded Funds | | | | |
(Cost $111,453) | | | | | | | 163,616 | |
| | | | | | | | | |
MONEY MARKET FUND† - 2.6% |
Dreyfus Treasury Securities Cash Management Fund — Institutional Shares, 0.01%2 | | | 194,447 | | | | 194,447 | |
Total Money Market Fund | | | | |
(Cost $194,447) | | | | | | | 194,447 | |
| | | | | | | | | |
Total Investments - 99.3% | | | | |
(Cost $5,722,555) | | $ | 7,464,261 | |
Other Assets & Liabilities, net - 0.7% | | | 52,432 | |
Total Net Assets - 100.0% | | $ | 7,516,693 | |
* | Non-income producing security. |
† | Value determined based on Level 1 inputs — See Note 4. |
††† | Value determined based on Level 3 inputs — See Note 4. |
1 | PIPE (Private Investment in Public Equity) — Stock issued by a company in the secondary market as a means of raising capital more quickly and less expensively than through registration of a secondary public offering. |
2 | Rate indicated is the 7-day yield as of March 31, 2021. |
| | plc — Public Limited Company |
| | REIT — Real Estate Investment Trust |
| | |
| | See Sector Classification in Other Information section. |
The following table summarizes the inputs used to value the Fund’s investments at March 31, 2021 (See Note 4 in the Notes to Financial Statements):
Investments in Securities (Assets) | | Level 1
Quoted
Prices | | | Level 2
Significant
Observable
Inputs | | | Level 3
Significant
Unobservable
Inputs | | | Total | |
Common Stocks | | $ | 7,090,786 | | | $ | — | | | $ | — | | | $ | 7,090,786 | |
Convertible Preferred Stocks | | | — | | | | — | | | | 9 | | | | 9 | |
Rights | | | 15,403 | | | | — | | | | — | | | | 15,403 | |
Exchange-Traded Funds | | | 163,616 | | | | — | | | | — | | | | 163,616 | |
Money Market Fund | | | 194,447 | | | | — | | | | — | | | | 194,447 | |
Total Assets | | $ | 7,464,252 | | | $ | — | | | $ | 9 | | | $ | 7,464,261 | |
68 | THE GUGGENHEIM FUNDS SEMI-ANNUAL REPORT | SEE NOTES TO FINANCIAL STATEMENTS. |
STATEMENT OF ASSETS AND LIABILITIES (Unaudited) |
March 31, 2021 |
Assets: |
Investments, at value (cost $5,722,555) | | $ | 7,464,261 | |
Prepaid expenses | | | 28,393 | |
Receivables: |
Securities sold | | | 61,317 | |
Dividends | | | 11,283 | |
Investment Adviser | | | 10,183 | |
Fund shares sold | | | 88 | |
Total assets | | | 7,575,525 | |
| | | | | |
Liabilities: |
Payable for: |
Securities purchased | | | 19,274 | |
Professional fees | | | 11,883 | |
Printing fees | | | 10,819 | |
Fund shares redeemed | | | 5,159 | |
Fund accounting/administration fees | | | 4,727 | |
Transfer agent/maintenance fees | | | 2,830 | |
Distribution and service fees | | | 1,777 | |
Trustees’ fees* | | | 434 | |
Miscellaneous | | | 1,929 | |
Total liabilities | | | 58,832 | |
Net assets | | $ | 7,516,693 | |
| | | | | |
Net assets consist of: |
Paid in capital | | $ | 6,495,787 | |
Total distributable earnings (loss) | | | 1,020,906 | |
Net assets | | $ | 7,516,693 | |
| | | | | |
A-Class: |
Net assets | | $ | 4,996,110 | |
Capital shares outstanding | | | 314,815 | |
Net asset value per share | | $ | 15.87 | |
Maximum offering price per share (Net asset value divided by 95.25%) | | $ | 16.66 | |
| | | | | |
C-Class: |
Net assets | | $ | 781,251 | |
Capital shares outstanding | | | 53,608 | |
Net asset value per share | | $ | 14.57 | |
| | | | | |
P-Class: |
Net assets | | $ | 46,437 | |
Capital shares outstanding | | | 2,903 | |
Net asset value per share | | $ | 16.00 | |
| | | | | |
Institutional Class: |
Net assets | | $ | 1,692,895 | |
Capital shares outstanding | | | 118,677 | |
Net asset value per share | | $ | 14.26 | |
STATEMENT OF OPERATIONS (Unaudited) |
Six Months Ended March 31, 2021 |
Investment Income: |
Dividends | | $ | 63,827 | |
Interest | | | 9 | |
Total investment income | | | 63,836 | |
| | | | | |
Expenses: |
Management fees | | | 24,089 | |
Distribution and service fees: |
A-Class | | | 5,238 | |
C-Class | | | 4,455 | |
P-Class | | | 43 | |
Transfer agent/maintenance fees: |
A-Class | | | 9,325 | |
C-Class | | | 2,641 | |
P-Class | | | 141 | |
Institutional Class | | | 2,823 | |
Registration fees | | | 43,150 | |
Professional fees | | | 17,508 | |
Fund accounting/administration fees | | | 16,953 | |
Trustees’ fees* | | | 9,091 | |
Custodian fees | | | 2,359 | |
Line of credit fees | | | 80 | |
Miscellaneous | | | 5,005 | |
Total expenses | | | 142,901 | |
Less: |
Expenses reimbursed by Adviser: |
A Class | | | (48,765 | ) |
C Class | | | (11,205 | ) |
P Class | | | (459 | ) |
Institutional Class | | | (14,910 | ) |
Expenses waived by Adviser | | | (24,083 | ) |
Total waived/reimbursed expenses | | | (99,422 | ) |
Net expenses | | | 43,479 | |
Net investment income | | | 20,357 | |
| | | | | |
Net Realized and Unrealized Gain (Loss): |
Net realized gain (loss) on: |
Investments | | | 211,332 | |
Net realized gain | | | 211,332 | |
Net change in unrealized appreciation (depreciation) on: |
Investments | | | 2,339,736 | |
Net change in unrealized appreciation (depreciation) | | | 2,339,736 | |
Net realized and unrealized gain | | | 2,551,068 | |
Net increase in net assets resulting from operations | | $ | 2,571,425 | |
* | Relates to Trustees not deemed “interested persons” within the meaning of Section 2(a)(19) of the 1940 Act. |
SEE NOTES TO FINANCIAL STATEMENTS. | THE GUGGENHEIM FUNDS SEMI-ANNUAL REPORT | 69 |
STATEMENTS OF CHANGES IN NET ASSETS |
| | Six Months Ended
March 31, 2021
(Unaudited) | | | Year Ended
September 30,
2020 | |
Increase (Decrease) in Net Assets from Operations: | | | | | | | | |
Net investment income | | $ | 20,357 | | | $ | 47,572 | |
Net realized gain (loss) on investments | | | 211,332 | | | | (714,273 | ) |
Net change in unrealized appreciation (depreciation) on investments | | | 2,339,736 | | | | (649,963 | ) |
Net increase (decrease) in net assets resulting from operations | | | 2,571,425 | | | | (1,316,664 | ) |
| | | | | | | | | |
Distributions to shareholders: | | | | | | | | |
A-Class | | | (36,090 | ) | | | (326,187 | ) |
C-Class | | | — | | | | (40,256 | ) |
P-Class | | | (472 | ) | | | (1,606 | ) |
Institutional Class | | | (13,445 | ) | | | (136,363 | ) |
Total distributions to shareholders | | | (50,007 | ) | | | (504,412 | ) |
| | | | | | | | | |
Capital share transactions: | | | | | | | | |
Proceeds from sale of shares | | | | | | | | |
A-Class | | | 453,356 | | | | 860,701 | |
C-Class | | | 67,783 | | | | 239,864 | |
P-Class | | | 7,223 | | | | 58,142 | |
Institutional Class | | | 392,161 | | | | 1,275,902 | |
Distributions reinvested | | | | | | | | |
A-Class | | | 35,259 | | | | 322,155 | |
C-Class | | | — | | | | 39,690 | |
P-Class | | | 472 | | | | 1,606 | |
Institutional Class | | | 13,445 | | | | 136,363 | |
Cost of shares redeemed | | | | | | | | |
A-Class | | | (516,951 | ) | | | (6,879,457 | ) |
C-Class | | | (421,264 | ) | | | (853,611 | ) |
P-Class | | | (387 | ) | | | (88,984 | ) |
Institutional Class | | | (109,125 | ) | | | (2,752,189 | ) |
Net decrease from capital share transactions | | | (78,028 | ) | | | (7,639,818 | ) |
Net increase (decrease) in net assets | | | 2,443,390 | | | | (9,460,894 | ) |
| | | | | | | | | |
Net assets: | | | | | | | | |
Beginning of period | | | 5,073,303 | | | | 14,534,197 | |
End of period | | $ | 7,516,693 | | | $ | 5,073,303 | |
| | | | | | | | | |
Capital share activity: | | | | | | | | |
Shares sold | | | | | | | | |
A-Class | | | 30,655 | | | | 78,870 | |
C-Class | | | 5,698 | | | | 22,403 | |
P-Class | | | 464 | | | | 6,309 | |
Institutional Class | | | 32,508 | | | | 127,977 | |
Shares issued from reinvestment of distributions | | | | | | | | |
A-Class | | | 2,669 | | | | 23,970 | |
C-Class | | | — | | | | 3,214 | |
P-Class | | | 35 | | | | 118 | |
Institutional Class | | | 1,133 | | | | 11,307 | |
Shares redeemed | | | | | | | | |
A-Class | | | (38,034 | ) | | | (541,851 | ) |
C-Class | | | (31,003 | ) | | | (82,317 | ) |
P-Class | | | (29 | ) | | | (7,591 | ) |
Institutional Class | | | (8,451 | ) | | | (316,698 | ) |
Net decrease in shares | | | (4,355 | ) | | | (674,289 | ) |
70 | THE GUGGENHEIM FUNDS SEMI-ANNUAL REPORT | SEE NOTES TO FINANCIAL STATEMENTS. |
This table is presented to show selected data for a share outstanding throughout each period and to assist shareholders in evaluating a Fund’s performance for the periods presented.
A-Class | | Six Months Ended
March 31, 2021a | | | Year Ended
September 30,
2020 | | | Year Ended
September 30,
2019 | | | Year Ended
September 30,
2018 | | | Year Ended
September 30,
2017 | | | Year Ended
September 30,
2016 | |
Per Share Data |
Net asset value, beginning of period | | $ | 10.61 | | | $ | 12.86 | | | $ | 15.56 | | | $ | 15.74 | | | $ | 13.61 | | | $ | 12.78 | |
Income (loss) from investment operations: |
Net investment income (loss)b | | | .05 | | | | .06 | | | | .10 | | | | .04 | | | | .02 | | | | .01 | |
Net gain (loss) on investments (realized and unrealized) | | | 5.33 | | | | (1.87 | ) | | | (1.28 | ) | | | .91 | | | | 2.20 | | | | 1.81 | |
Total from investment operations | | | 5.38 | | | | (1.81 | ) | | | (1.18 | ) | | | .95 | | | | 2.22 | | | | 1.82 | |
Less distributions from: |
Net investment income | | | (.12 | ) | | | (.18 | ) | | | (.19 | ) | | | (.15 | ) | | | (.09 | ) | | | — | |
Net realized gains | | | — | | | | (.26 | ) | | | (1.33 | ) | | | (.98 | ) | | | — | | | | (.99 | ) |
Total distributions | | | (.12 | ) | | | (.44 | ) | | | (1.52 | ) | | | (1.13 | ) | | | (.09 | ) | | | (.99 | ) |
Net asset value, end of period | | $ | 15.87 | | | $ | 10.61 | | | $ | 12.86 | | | $ | 15.56 | | | $ | 15.74 | | | $ | 13.61 | |
|
Total Returnc | | | 50.91 | % | | | (14.79 | %) | | | (6.14 | %) | | | 6.32 | % | | | 16.41 | % | | | 14.81 | % |
Ratios/Supplemental Data |
Net assets, end of period (in thousands) | | $ | 4,996 | | | $ | 3,390 | | | $ | 9,751 | | | $ | 11,931 | | | $ | 11,943 | | | $ | 13,283 | |
Ratios to average net assets: |
Net investment income (loss) | | | 0.68 | % | | | 0.54 | % | | | 0.75 | % | | | 0.29 | % | | | 0.15 | % | | | 0.12 | % |
Total expensesd | | | 4.38 | % | | | 3.23 | % | | | 2.27 | % | | | 2.09 | % | | | 1.87 | % | | | 2.29 | % |
Net expensese,f,g | | | 1.30 | % | | | 1.30 | % | | | 1.30 | % | | | 1.30 | % | | | 1.32 | % | | | 1.32 | % |
Portfolio turnover rate | | | 12 | % | | | 40 | % | | | 78 | % | | | 18 | % | | | 48 | % | | | 64 | % |
C-Class | | Six Months Ended
March 31, 2021a | | | Year Ended
September 30,
2020 | | | Year Ended
September 30,
2019 | | | Year Ended
September 30,
2018 | | | Year Ended
September 30,
2017 | | | Year Ended
September 30,
2016 | |
Per Share Data |
Net asset value, beginning of period | | $ | 9.69 | | | $ | 11.75 | | | $ | 14.30 | | | $ | 14.51 | | | $ | 12.57 | | | $ | 11.95 | |
Income (loss) from investment operations: |
Net investment income (loss)b | | | (.01 | ) | | | (.02 | ) | | | — | h | | | (.07 | ) | | | (.08 | ) | | | (.08 | ) |
Net gain (loss) on investments (realized and unrealized) | | | 4.89 | | | | (1.73 | ) | | | (1.18 | ) | | | .84 | | | | 2.02 | | | | 1.69 | |
Total from investment operations | | | 4.88 | | | | (1.75 | ) | | | (1.18 | ) | | | .77 | | | | 1.94 | | | | 1.61 | |
Less distributions from: |
Net investment income | | | — | | | | (.05 | ) | | | (.04 | ) | | | — | | | | — | | | | — | |
Net realized gains | | | — | | | | (.26 | ) | | | (1.33 | ) | | | (.98 | ) | | | — | | | | (.99 | ) |
Total distributions | | | — | | | | (.31 | ) | | | (1.37 | ) | | | (.98 | ) | | | — | | | | (.99 | ) |
Net asset value, end of period | | $ | 14.57 | | | $ | 9.69 | | | $ | 11.75 | | | $ | 14.30 | | | $ | 14.51 | | | $ | 12.57 | |
|
Total Returnc | | | 50.36 | % | | | (15.43 | %) | | | (6.89 | %) | | | 5.57 | % | | | 15.53 | % | | | 14.02 | % |
Ratios/Supplemental Data |
Net assets, end of period (in thousands) | | $ | 781 | | | $ | 765 | | | $ | 1,593 | | | $ | 2,884 | | | $ | 4,281 | | | $ | 4,762 | |
Ratios to average net assets: |
Net investment income (loss) | | | (0.10 | %) | | | (0.14 | %) | | | 0.01 | % | | | (0.50 | %) | | | (0.60 | %) | | | (0.64 | %) |
Total expensesd | | | 5.31 | % | | | 4.33 | % | | | 3.09 | % | | | 2.94 | % | | | 2.71 | % | | | 3.04 | % |
Net expensese,f,g | | | 2.05 | % | | | 2.06 | % | | | 2.05 | % | | | 2.05 | % | | | 2.07 | % | | | 2.07 | % |
Portfolio turnover rate | | | 12 | % | | | 40 | % | | | 78 | % | | | 18 | % | | | 48 | % | | | 64 | % |
SEE NOTES TO FINANCIAL STATEMENTS. | THE GUGGENHEIM FUNDS SEMI-ANNUAL REPORT | 71 |
FINANCIAL HIGHLIGHTS (continued) |
This table is presented to show selected data for a share outstanding throughout each period and to assist shareholders in evaluating a Fund’s performance for the periods presented.
P-Class | | Six Months Ended
March 31, 2021a | | | Year Ended
September 30,
2020 | | | Year Ended
September 30,
2019 | | | Year Ended
September 30,
2018 | | | Year Ended
September 30,
2017 | | | Year Ended
September 30,
2016 | |
Per Share Data |
Net asset value, beginning of period | | $ | 10.75 | | | $ | 13.01 | | | $ | 15.73 | | | $ | 15.76 | | | $ | 13.60 | | | $ | 12.77 | |
Income (loss) from investment operations: |
Net investment income (loss)b | | | .05 | | | | .05 | | | | .09 | | | | .05 | | | | .01 | | | | .02 | |
Net gain (loss) on investments (realized and unrealized) | | | 5.39 | | | | (1.86 | ) | | | (1.29 | ) | | | .90 | | | | 2.22 | | | | 1.80 | |
Total from investment operations | | | 5.44 | | | | (1.81 | ) | | | (1.20 | ) | | | .95 | | | | 2.23 | | | | 1.82 | |
Less distributions from: |
Net investment income | | | (.19 | ) | | | (.19 | ) | | | (.19 | ) | | | — | | | | (.07 | ) | | | — | |
Net realized gains | | | — | | | | (.26 | ) | | | (1.33 | ) | | | (.98 | ) | | | — | | | | (.99 | ) |
Total distributions | | | (.19 | ) | | | (.45 | ) | | | (1.52 | ) | | | (.98 | ) | | | (.07 | ) | | | (.99 | ) |
Net asset value, end of period | | $ | 16.00 | | | $ | 10.75 | | | $ | 13.01 | | | $ | 15.73 | | | $ | 15.76 | | | $ | 13.60 | |
|
Total Return | | | 50.89 | % | | | (14.66 | %) | | | (6.18 | %) | | | 6.30 | % | | | 16.35 | % | | | 14.88 | % |
Ratios/Supplemental Data |
Net assets, end of period (in thousands) | | $ | 46 | | | $ | 26 | | | $ | 47 | | | $ | 15 | | | $ | 14 | | | $ | 11 | |
Ratios to average net assets: |
Net investment income (loss) | | | 0.70 | % | | | 0.46 | % | | | 0.72 | % | | | 0.30 | % | | | 0.09 | % | | | 0.13 | % |
Total expensesd | | | 4.75 | % | | | 4.07 | % | | | 2.73 | % | | | 2.79 | % | | | 3.60 | % | | | 2.50 | % |
Net expensese,f,g | | | 1.30 | % | | | 1.30 | % | | | 1.28 | % | | | 1.30 | % | | | 1.32 | % | | | 1.32 | % |
Portfolio turnover rate | | | 12 | % | | | 40 | % | | | 78 | % | | | 18 | % | | | 48 | % | | | 64 | % |
72 | THE GUGGENHEIM FUNDS SEMI-ANNUAL REPORT | SEE NOTES TO FINANCIAL STATEMENTS. |
FINANCIAL HIGHLIGHTS (concluded) |
This table is presented to show selected data for a share outstanding throughout each period and to assist shareholders in evaluating a Fund’s performance for the periods presented.
Institutional Class | | Six Months Ended
March 31, 2021a | | | Year Ended
September 30,
2020 | | | Year Ended
September 30,
2019 | | | Year Ended
September 30,
2018 | | | Year Ended
September 30,
2017 | | | Year Ended
September 30,
2016 | |
Per Share Data |
Net asset value, beginning of period | | $ | 9.54 | | | $ | 11.60 | | | $ | 14.24 | | | $ | 14.50 | | | $ | 12.54 | | | $ | 11.82 | |
Income (loss) from investment operations: |
Net investment income (loss)b | | | .06 | | | | .09 | | | | .12 | | | | .07 | | | | .04 | | | | .04 | |
Net gain (loss) on investments (realized and unrealized) | | | 4.78 | | | | (1.68 | ) | | | (1.20 | ) | | | .84 | | | | 2.04 | | | | 1.67 | |
Total from investment operations | | | 4.84 | | | | (1.59 | ) | | | (1.08 | ) | | | .91 | | | | 2.08 | | | | 1.71 | |
Less distributions from: |
Net investment income | | | (.12 | ) | | | (.21 | ) | | | (.23 | ) | | | (.19 | ) | | | (.12 | ) | | | — | |
Net realized gains | | | — | | | | (.26 | ) | | | (1.33 | ) | | | (.98 | ) | | | — | | | | (.99 | ) |
Total distributions | | | (.12 | ) | | | (.47 | ) | | | (1.56 | ) | | | (1.17 | ) | | | (.12 | ) | | | (.99 | ) |
Net asset value, end of period | | $ | 14.26 | | | $ | 9.54 | | | $ | 11.60 | | | $ | 14.24 | | | $ | 14.50 | | | $ | 12.54 | |
|
Total Return | | | 51.04 | % | | | (14.54 | %) | | | (5.96 | %) | | | 6.64 | % | | | 16.65 | % | | | 15.18 | % |
Ratios/Supplemental Data |
Net assets, end of period (in thousands) | | $ | 1,693 | | | $ | 892 | | | $ | 3,143 | | | $ | 3,798 | | | $ | 4,790 | | | $ | 281 | |
Ratios to average net assets: |
Net investment income (loss) | | | 0.97 | % | | | 0.82 | % | | | 0.99 | % | | | 0.50 | % | | | 0.30 | % | | | 0.30 | % |
Total expensesd | | | 4.08 | % | | | 2.86 | % | | | 2.09 | % | | | 1.91 | % | | | 1.56 | % | | | 2.09 | % |
Net expensese,f,g | | | 1.05 | % | | | 1.05 | % | | | 1.05 | % | | | 1.05 | % | | | 1.07 | % | | | 1.07 | % |
Portfolio turnover rate | | | 12 | % | | | 40 | % | | | 78 | % | | | 18 | % | | | 48 | % | | | 64 | % |
a | Unaudited figures for the period ended March 31, 2021. Percentage amounts for the period, except total return and portfolio turnover rate, have been annualized. |
b | Net investment income (loss) per share was computed using average shares outstanding throughout the period. |
c | Total return does not reflect the impact of any applicable sales charges. |
d | Does not include expenses of the underlying funds in which the Fund invests. |
e | Net expense information reflects the expense ratios after expense waivers and reimbursements, as applicable. |
f | The portion of the ratios of net expenses to average net assets attributable to recoupments of prior fee reductions or expense reimbursements for the years presented was as follows: |
| | | 03/31/21 | 09/30/20 | 09/30/19 | 09/30/18 | 09/30/17 |
| | A-Class | — | — | — | — | 0.00%* |
| | C-Class | — | — | — | — | 0.01% |
| | P-Class | — | — | — | — | 0.74% |
| | Institutional Class | — | — | — | — | 0.00%* |
g | Net expenses may include expenses that are excluded from the expense limitation agreement. Excluding these expenses, the net expense ratios for the years presented would be: |
| | | 03/31/21 | 09/30/20 | 09/30/19 | 09/30/18 | 09/30/17 | 09/30/16 |
| | A-Class | 1.30% | 1.30% | 1.30% | 1.30% | 1.30% | 1.30% |
| | C-Class | 2.05% | 2.05% | 2.05% | 2.05% | 2.05% | 2.05% |
| | P-Class | 1.30% | 1.30% | 1.28% | 1.30% | 1.30% | 1.30% |
| | Institutional Class | 1.05% | 1.05% | 1.05% | 1.05% | 1.05% | 1.05% |
h | Net investment income is less than $0.01 per share. |
SEE NOTES TO FINANCIAL STATEMENTS. | THE GUGGENHEIM FUNDS SEMI-ANNUAL REPORT | 73 |
PERFORMANCE REPORT AND FUND PROFILE (Unaudited) | March 31, 2021 |
STYLEPLUS—LARGE CORE FUND
OBJECTIVE: Seeks long-term growth of capital.
Holdings Diversification (Market Exposure as % of Net Assets)
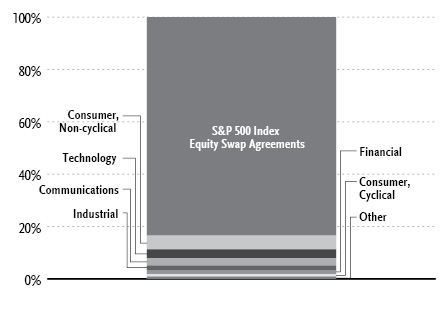
“Holdings Diversification (Market Exposure as % of Net Assets)” excludes any temporary cash investments, investments in Guggenheim Strategy Funds Trust mutual funds, or investments in Guggenheim Ultra Short Duration Fund.
Inception Dates: |
A-Class | September 10, 1962 |
C-Class | January 29, 1999 |
P-Class | May 1, 2015 |
Institutional Class | March 1, 2012 |
Ten Largest Holdings (% of Total Net Assets) |
Guggenheim Strategy Fund II | 29.5% |
Guggenheim Ultra Short Duration Fund — Institutional Class | 24.9% |
Guggenheim Strategy Fund III | 23.9% |
Apple, Inc. | 0.9% |
Microsoft Corp. | 0.8% |
Amazon.com, Inc. | 0.6% |
Alphabet, Inc. — Class C | 0.5% |
Facebook, Inc. — Class A | 0.4% |
Johnson & Johnson | 0.3% |
Verizon Communications, Inc. | 0.3% |
Top Ten Total | 82.1% |
| | |
“Ten Largest Holdings” excludes any temporary cash or derivative investments. |
74 | THE GUGGENHEIM FUNDS SEMI-ANNUAL REPORT | |
PERFORMANCE REPORT AND FUND PROFILE (Unaudited)(concluded) | March 31, 2021 |
Average Annual Returns*
Periods Ended March 31, 2021
| 6 Month† | 1 Year | 5 Year | 10 Year |
A-Class Shares | 19.60% | 60.56% | 15.59% | 12.06% |
A-Class Shares with sales charge‡ | 13.91% | 52.97% | 14.48% | 11.52% |
C-Class Shares | 19.05% | 59.17% | 14.56% | 11.04% |
C-Class Shares with CDSC§ | 18.05% | 58.17% | 14.56% | 11.04% |
S&P 500 Index | 19.07% | 56.35% | 16.29% | 13.91% |
| 6 Month† | 1 Year | 5 Year | Since
Inception
(05/01/15) |
P-Class Shares | 19.58% | 60.35% | 15.45% | 12.59% |
S&P 500 Index | 19.07% | 56.35% | 16.29% | 13.55% |
| 6 Month† | 1 Year | 5 Year | Since
Inception
(03/01/12) |
Institutional Class Shares | 19.70% | 60.85% | 15.91% | 13.69% |
S&P 500 Index | 19.07% | 56.35% | 16.29% | 14.72% |
* | The performance data above represents past performance that is not predictive of future results. The investment return and principal value of an investment in the Fund will fluctuate so that an investor’s shares, when redeemed, may be worth more or less than their original cost. Returns are historical and include changes in principal and reinvested dividends and capital gains and do not reflect the effect of taxes. The S&P 500 Index is an unmanaged index and, unlike the Fund, has no management fees or operating expenses to reduce its reported return. |
† | 6 month returns are not annualized. |
‡ | Fund returns are calculated using the maximum sales charge of 4.75%. |
§ | Fund returns include a CDSC of 1% if redeemed within 12 months of purchase. |
| | THE GUGGENHEIM FUNDS SEMI-ANNUAL REPORT | 75 |
SCHEDULE OF INVESTMENTS (Unaudited) | March 31, 2021 |
STYLEPLUS—LARGE CORE FUND | |
| | Shares | | | Value | |
COMMON STOCKS† - 16.1% |
| | | | | | | | | |
Consumer, Non-cyclical - 5.2% |
Johnson & Johnson | | | 4,961 | | | $ | 815,340 | |
Merck & Company, Inc. | | | 7,317 | | | | 564,068 | |
Amgen, Inc. | | | 2,094 | | | | 521,008 | |
Bristol-Myers Squibb Co. | | | 8,050 | | | | 508,197 | |
Pfizer, Inc. | | | 12,740 | | | | 461,570 | |
AbbVie, Inc. | | | 4,133 | | | | 447,273 | |
McKesson Corp. | | | 2,149 | | | | 419,141 | |
Altria Group, Inc. | | | 8,174 | | | | 418,182 | |
Humana, Inc. | | | 965 | | | | 404,576 | |
Molson Coors Beverage Co. — Class B* | | | 7,884 | | | | 403,266 | |
Gilead Sciences, Inc. | | | 5,460 | | | | 352,880 | |
Procter & Gamble Co. | | | 2,527 | | | | 342,231 | |
J M Smucker Co. | | | 2,294 | | | | 290,260 | |
United Rentals, Inc.* | | | 881 | | | | 290,122 | |
Philip Morris International, Inc. | | | 3,239 | | | | 287,429 | |
CVS Health Corp. | | | 3,609 | | | | 271,505 | |
Anthem, Inc. | | | 740 | | | | 265,623 | |
Abbott Laboratories | | | 2,155 | | | | 258,255 | |
Cigna Corp. | | | 1,013 | | | | 244,883 | |
General Mills, Inc. | | | 3,945 | | | | 241,907 | |
Medtronic plc | | | 1,960 | | | | 231,535 | |
Regeneron Pharmaceuticals, Inc.* | | | 484 | | | | 229,000 | |
Thermo Fisher Scientific, Inc. | | | 500 | | | | 228,190 | |
UnitedHealth Group, Inc. | | | 608 | | | | 226,219 | |
Kraft Heinz Co. | | | 5,627 | | | | 225,080 | |
Becton Dickinson and Co. | | | 921 | | | | 223,941 | |
Eli Lilly & Co. | | | 1,181 | | | | 220,634 | |
Campbell Soup Co. | | | 3,998 | | | | 200,980 | |
Quest Diagnostics, Inc. | | | 1,480 | | | | 189,943 | |
Conagra Brands, Inc. | | | 4,999 | | | | 187,962 | |
PayPal Holdings, Inc.* | | | 760 | | | | 184,558 | |
Hologic, Inc.* | | | 2,417 | | | | 179,777 | |
Laboratory Corporation of America Holdings* | | | 700 | | | | 178,521 | |
Cardinal Health, Inc. | | | 2,851 | | | | 173,198 | |
Quanta Services, Inc. | | | 1,950 | | | | 171,561 | |
Tyson Foods, Inc. — Class A | | | 2,283 | | | | 169,627 | |
DaVita, Inc.* | | | 1,556 | | | | 167,690 | |
Kroger Co. | | | 4,642 | | | | 167,066 | |
Perrigo Company plc | | | 3,922 | | | | 158,723 | |
Coca-Cola Co. | | | 2,935 | | | | 154,704 | |
HCA Healthcare, Inc. | | | 779 | | | | 146,717 | |
Biogen, Inc.* | | | 516 | | | | 144,351 | |
Vertex Pharmaceuticals, Inc.* | | | 622 | | | | 133,661 | |
Centene Corp.* | | | 2,072 | | | | 132,422 | |
Colgate-Palmolive Co. | | | 1,472 | | | | 116,038 | |
FleetCor Technologies, Inc.* | | | 409 | | | | 109,870 | |
Viatris, Inc.* | | | 1 | | | | 14 | |
Total Consumer, Non-cyclical | | | | | | | 12,459,698 | |
| | | | | | | | | |
Technology - 3.5% |
Apple, Inc. | | | 17,074 | | | | 2,085,589 | |
Microsoft Corp. | | | 7,828 | | | | 1,845,607 | |
International Business Machines Corp. | | | 3,963 | | | | 528,109 | |
Intel Corp. | | | 7,519 | | | | 481,216 | |
Broadcom, Inc. | | | 812 | | | | 376,492 | |
Oracle Corp. | | | 4,168 | | | | 292,469 | |
Seagate Technology plc | | | 3,805 | | | | 292,034 | |
HP, Inc. | | | 7,881 | | | | 250,222 | |
Cerner Corp. | | | 3,407 | | | | 244,895 | |
QUALCOMM, Inc. | | | 1,746 | | | | 231,502 | |
Fiserv, Inc.* | | | 1,917 | | | | 228,200 | |
Cognizant Technology Solutions Corp. — Class A | | | 2,815 | | | | 219,908 | |
Accenture plc — Class A | | | 784 | | | | 216,580 | |
NetApp, Inc. | | | 2,771 | | | | 201,368 | |
Micron Technology, Inc.* | | | 2,277 | | | | 200,854 | |
Hewlett Packard Enterprise Co. | | | 10,882 | | | | 171,283 | |
Qorvo, Inc.* | | | 896 | | | | 163,699 | |
KLA Corp. | | | 403 | | | | 133,151 | |
NVIDIA Corp. | | | 220 | | | | 117,465 | |
Adobe, Inc.* | | | 241 | | | | 114,564 | |
Advanced Micro Devices, Inc.* | | | 1,411 | | | | 110,764 | |
Total Technology | | | | | | | 8,505,971 | |
| | | | | | | | | |
Communications - 2.8% |
Amazon.com, Inc.* | | | 449 | | | | 1,389,242 | |
Alphabet, Inc. — Class C* | | | 596 | | | | 1,232,903 | |
Facebook, Inc. — Class A* | | | 2,973 | | | | 875,638 | |
Verizon Communications, Inc. | | | 11,195 | | | | 650,989 | |
Cisco Systems, Inc. | | | 12,221 | | | | 631,948 | |
Comcast Corp. — Class A | | | 6,269 | | | | 339,216 | |
AT&T, Inc. | | | 10,231 | | | | 309,692 | |
Charter Communications, Inc. — Class A* | | | 472 | | | | 291,233 | |
Juniper Networks, Inc. | | | 11,001 | | | | 278,655 | |
Walt Disney Co.* | | | 1,305 | | | | 240,799 | |
Motorola Solutions, Inc. | | | 911 | | | | 171,314 | |
Omnicom Group, Inc. | | | 1,836 | | | | 136,139 | |
eBay, Inc. | | | 2,174 | | | | 133,136 | |
Total Communications | | | | | | | 6,680,904 | |
| | | | | | | | | |
Industrial - 1.7% |
General Dynamics Corp. | | | 2,443 | | | | 443,551 | |
Lockheed Martin Corp. | | | 1,043 | | | | 385,389 | |
3M Co. | | | 1,878 | | | | 361,853 | |
CSX Corp. | | | 3,419 | | | | 329,660 | |
Union Pacific Corp. | | | 1,406 | | | | 309,896 | |
Parker-Hannifin Corp. | | | 789 | | | | 248,874 | |
Northrop Grumman Corp. | | | 738 | | | | 238,846 | |
TE Connectivity Ltd. | | | 1,647 | | | | 212,644 | |
Caterpillar, Inc. | | | 879 | | | | 203,814 | |
Deere & Co. | | | 470 | | | | 175,846 | |
United Parcel Service, Inc. — Class B | | | 1,009 | | | | 171,520 | |
Snap-on, Inc. | | | 722 | | | | 166,594 | |
Masco Corp. | | | 2,601 | | | | 155,800 | |
Textron, Inc. | | | 2,737 | | | | 153,491 | |
Fortive Corp. | | | 2,116 | | | | 149,474 | |
Norfolk Southern Corp. | | | 542 | | | | 145,538 | |
Huntington Ingalls Industries, Inc. | | | 699 | | | | 143,889 | |
Westinghouse Air Brake Technologies Corp. | | | 1,673 | | | | 132,435 | |
Total Industrial | | | | | | | 4,129,114 | |
76 | THE GUGGENHEIM FUNDS SEMI-ANNUAL REPORT | SEE NOTES TO FINANCIAL STATEMENTS. |
SCHEDULE OF INVESTMENTS (Unaudited)(continued) | March 31, 2021 |
STYLEPLUS—LARGE CORE FUND | |
| | Shares | | | Value | |
Financial - 1.5% |
Berkshire Hathaway, Inc. — Class B* | | | 2,066 | | | $ | 527,801 | |
MetLife, Inc. | | | 6,580 | | | | 399,998 | |
Bank of America Corp. | | | 9,391 | | | | 363,338 | |
JPMorgan Chase & Co. | | | 2,289 | | | | 348,455 | |
Visa, Inc. — Class A | | | 1,396 | | | | 295,575 | |
Travelers Companies, Inc. | | | 1,389 | | | | 208,905 | |
Prudential Financial, Inc. | | | 2,247 | | | | 204,702 | |
Allstate Corp. | | | 1,753 | | | | 201,420 | |
Western Union Co. | | | 6,783 | | | | 167,269 | |
Aflac, Inc. | | | 2,971 | | | | 152,056 | |
Hartford Financial Services Group, Inc. | | | 2,033 | | | | 135,784 | |
Mastercard, Inc. — Class A | | | 372 | | | | 132,450 | |
Charles Schwab Corp. | | | 1,732 | | | | 112,892 | |
Synchrony Financial | | | 2,747 | | | | 111,693 | |
PNC Financial Services Group, Inc. | | | 635 | | | | 111,385 | |
Total Financial | | | | | | | 3,473,723 | |
| | | | | | | | | |
Consumer, Cyclical - 1.0% |
Lowe’s Companies, Inc. | | | 1,720 | | | | 327,110 | |
Tesla, Inc.* | | | 459 | | | | 306,580 | |
AutoZone, Inc.* | | | 196 | | | | 275,243 | |
Best Buy Company, Inc. | | | 2,333 | | | | 267,852 | |
Walmart, Inc. | | | 1,869 | | | | 253,866 | |
Cummins, Inc. | | | 761 | | | | 197,182 | |
Lennar Corp. — Class A | | | 1,777 | | | | 179,886 | |
Genuine Parts Co. | | | 1,505 | | | | 173,963 | |
PulteGroup, Inc. | | | 3,040 | | | | 159,417 | |
Whirlpool Corp. | | | 555 | | | | 122,294 | |
LKQ Corp.* | | | 2,580 | | | | 109,212 | |
General Motors Co.* | | | 1,682 | | | | 96,648 | |
Total Consumer, Cyclical | | | | | | | 2,469,253 | |
| | | | | | | | | |
Utilities - 0.3% |
Evergy, Inc. | | | 3,924 | | | | 233,596 | |
Exelon Corp. | | | 3,792 | | | | 165,862 | |
Public Service Enterprise Group, Inc. | | | 2,422 | | | | 145,828 | |
PPL Corp. | | | 4,951 | | | | 142,787 | |
Total Utilities | | | | | | | 688,073 | |
| | | | | | | | | |
Energy - 0.1% |
Chevron Corp. | | | 1,007 | | | | 105,524 | |
Exxon Mobil Corp. | | | 1,534 | | | | 85,643 | |
Total Energy | | | | | | | 191,167 | |
| | | | | | | | | |
Total Common Stocks | | | | |
(Cost $31,685,889) | | | | | | | 38,597,903 | |
| | | | | | | | | |
MUTUAL FUNDS† - 78.3% |
Guggenheim Strategy Fund II1 | | | 2,829,659 | | | | 70,684,872 | |
Guggenheim Ultra Short Duration Fund — Institutional Class1 | | | 5,987,006 | | | | 59,630,578 | |
Guggenheim Strategy Fund III1 | | | 2,285,075 | | | | 57,446,787 | |
Total Mutual Funds | | | | |
(Cost $186,564,768) | | | | | | | 187,762,237 | |
| | | | | | | | | |
MONEY MARKET FUND† - 5.3% |
Dreyfus Treasury Securities Cash Management Fund — Institutional Shares, 0.01%2 | | | 12,778,855 | | | | 12,778,855 | |
Total Money Market Fund | | | | |
(Cost $12,778,855) | | | | | | | 12,778,855 | |
| | | | | | | | | |
Total Investments - 99.7% | | | | |
(Cost $231,029,512) | | $ | 239,138,995 | |
Other Assets & Liabilities, net - 0.3% | | | 651,377 | |
Total Net Assets - 100.0% | | $ | 239,790,372 | |
Futures Contracts |
Description | | Number of
Contracts | | | Expiration
Date | | | Notional
Amount | | | Value and
Unrealized
Appreciation** | |
Equity Futures Contracts Purchased† |
S&P 500 Index Mini Futures Contracts | | | 5 | | | | Jun 2021 | | | $ | 992,125 | | | $ | 4,033 | |
Total Return Swap Agreements |
Counterparty | Index | Financing
Rate Pay | Payment
Frequency | | Maturity
Date | | Units | | Notional
Amount | | Value and
Unrealized
Appreciation | |
OTC Equity Index Swap Agreements†† |
Wells Fargo Bank, N.A. | S&P 500 Total Return Index | 0.36% (1 Month USD LIBOR + 0.24%) | At Maturity | | | 12/02/21 | | 24,306 | | $ | 200,224,321 | | $ | 36,527,373 | |
SEE NOTES TO FINANCIAL STATEMENTS. | THE GUGGENHEIM FUNDS SEMI-ANNUAL REPORT | 77 |
SCHEDULE OF INVESTMENTS (Unaudited)(continued) | March 31, 2021 |
STYLEPLUS—LARGE CORE FUND | |
* | Non-income producing security. |
** | Includes cumulative appreciation (depreciation). Variation margin is reported within the Statement of Assets and Liabilities. |
† | Value determined based on Level 1 inputs — See Note 4. |
†† | Value determined based on Level 2 inputs — See Note 4. |
1 | Affiliated issuer. |
2 | Rate indicated is the 7-day yield as of March 31, 2021. |
| | LIBOR — London Interbank Offered Rate |
| | plc — Public Limited Company |
| | |
| | See Sector Classification in Other Information section. |
The following table summarizes the inputs used to value the Fund’s investments at March 31, 2021 (See Note 4 in the Notes to Financial Statements):
Investments in Securities (Assets) | | Level 1
Quoted
Prices | | | Level 2
Significant
Observable
Inputs | | | Level 3
Significant
Unobservable
Inputs | | | Total | |
Common Stocks | | $ | 38,597,903 | | | $ | — | | | $ | — | | | $ | 38,597,903 | |
Mutual Funds | | | 187,762,237 | | | | — | | | | — | | | | 187,762,237 | |
Money Market Fund | | | 12,778,855 | | | | — | | | | — | | | | 12,778,855 | |
Equity Futures Contracts** | | | 4,033 | | | | — | | | | — | | | | 4,033 | |
Equity Index Swap Agreements** | | | — | | | | 36,527,373 | | | | — | | | | 36,527,373 | |
Total Assets | | $ | 239,143,028 | | | $ | 36,527,373 | | | $ | — | | | $ | 275,670,401 | |
** | This derivative is reported as unrealized appreciation/depreciation at period end. |
78 | THE GUGGENHEIM FUNDS SEMI-ANNUAL REPORT | SEE NOTES TO FINANCIAL STATEMENTS. |
SCHEDULE OF INVESTMENTS (Unaudited)(concluded) | March 31, 2021 |
STYLEPLUS—LARGE CORE FUND | |
Affiliated Transactions
Investments representing 5% or more of the outstanding voting shares of a company, or control of or by, or common control under Guggenheim Investments (“GI”), result in that company being considered an affiliated issuer, as defined in the 1940 Act.
The Fund may invest in certain of the underlying series of Guggenheim Strategy Funds Trust, including Guggenheim Strategy Fund II and Guggenheim Strategy Fund III, (collectively, the “Short Term Investment Vehicles”), each of which are open-end management investment companies managed by GI. The Short Term Investment Vehicles, which launched on March 11, 2014, are offered as short term investment options only to mutual funds, trusts, and other accounts managed by GI and/or its affiliates, and are not available to the public. The Short Term Investment Vehicles pay no investment management fees. The Short Term Investment Vehicles’ annual report on Form N-CSR dated September 30, 2020, is available publicly or upon request. This information is available from the EDGAR database on the SEC’s website at https://www.sec.gov/Archives/edgar/data/1601445/000182126820000133/gug81042-ncsr.htm.
Transactions during the period ended March 31, 2021, in which the company is an affiliated issuer, were as follows:
Security Name | | Value
09/30/20 | | | Additions | | | Reductions | | | Realized
Gain (Loss) | | | Change in
Unrealized
Appreciation
(Depreciation) | | | Value
03/31/21 | | | Shares
03/31/21 | | | Investment
Income | |
Mutual Funds | | | | | | | | | | | | | | | | | | | | | | | | | | | | | | | | |
Guggenheim Strategy Fund II | | $ | 70,019,609 | | | $ | 637,030 | | | $ | — | | | $ | — | | | $ | 28,233 | | | $ | 70,684,872 | | | | 2,829,659 | | | $ | 637,026 | |
Guggenheim Strategy Fund III | | | 56,791,001 | | | | 496,786 | | | | — | | | | — | | | | 159,000 | | | | 57,446,787 | | | | 2,285,075 | | | | 496,775 | |
Guggenheim Ultra Short Duration Fund — Institutional Class | | | 42,225,877 | | | | 22,658,997 | | | | (5,136,984 | ) | | | 123,677 | | | | (240,989 | ) | | | 59,630,578 | | | | 5,987,006 | | | | 261,021 | |
| | | $ | 169,036,487 | | | $ | 23,792,813 | | | $ | (5,136,984 | ) | | $ | 123,677 | | | $ | (53,756 | ) | | $ | 187,762,237 | | | | | | | $ | 1,394,822 | |
SEE NOTES TO FINANCIAL STATEMENTS. | THE GUGGENHEIM FUNDS SEMI-ANNUAL REPORT | 79 |
STYLEPLUS—LARGE CORE FUND | |
STATEMENT OF ASSETS AND LIABILITIES (Unaudited) |
March 31, 2021 |
Assets: |
Investments in unaffiliated issuers, at value (cost $44,464,744) | | $ | 51,376,758 | |
Investments in affiliated issuers, at value (cost $186,564,768) | | | 187,762,237 | |
Segregated cash with broker | | | 55,000 | |
Unrealized appreciation on OTC swap agreements | | | 36,527,373 | |
Prepaid expenses | | | 50,826 | |
Receivables: |
Dividends | | | 251,607 | |
Fund shares sold | | | 103,218 | |
Variation margin on futures contracts | | | 5,200 | |
Interest | | | 98 | |
Total assets | | | 276,132,317 | |
| | | | | |
Liabilities: |
Overdraft due to custodian bank | | | 268 | |
Segregated cash due to broker | | | 35,560,000 | |
Payable for: |
Swap settlement | | | 259,357 | |
Securities purchased | | | 207,817 | |
Management fees | | | 137,514 | |
Distribution and service fees | | | 49,664 | |
Fund shares redeemed | | | 24,345 | |
Fund accounting/administration fees | | | 16,305 | |
Transfer agent/maintenance fees | | | 11,088 | |
Trustees’ fees* | | | 715 | |
Miscellaneous | | | 74,872 | |
Total liabilities | | | 36,341,945 | |
Net assets | | $ | 239,790,372 | |
| | | | | |
Net assets consist of: |
Paid in capital | | $ | 191,775,418 | |
Total distributable earnings (loss) | | | 48,014,954 | |
Net assets | | $ | 239,790,372 | |
| | | | | |
A-Class: |
Net assets | | $ | 233,894,184 | |
Capital shares outstanding | | | 9,287,254 | |
Net asset value per share | | $ | 25.18 | |
Maximum offering price per share (Net asset value divided by 95.25%) | | $ | 26.44 | |
| | | | | |
C-Class: |
Net assets | | $ | 994,430 | |
Capital shares outstanding | | | 59,611 | |
Net asset value per share | | $ | 16.68 | |
| | | | | |
P-Class: |
Net assets | | $ | 307,920 | |
Capital shares outstanding | | | 12,411 | |
Net asset value per share | | $ | 24.81 | |
| | | | | |
Institutional Class: |
Net assets | | $ | 4,593,838 | |
Capital shares outstanding | | | 184,259 | |
Net asset value per share | | $ | 24.93 | |
* | Relates to Trustees not deemed “interested persons” within the meaning of Section 2(a)(19) of the 1940 Act. |
80 | THE GUGGENHEIM FUNDS SEMI-ANNUAL REPORT | SEE NOTES TO FINANCIAL STATEMENTS. |
STYLEPLUS—LARGE CORE FUND | |
STATEMENT OF OPERATIONS (Unaudited) |
Six Months Ended March 31, 2021 |
Investment Income: |
Dividends from securities of unaffiliated issuers | | $ | 361,592 | |
Dividends from securities of affiliated issuers | | | 1,394,822 | |
Interest | | | 438 | |
Total investment income | | | 1,756,852 | |
| | | | | |
Expenses: |
Management fees | | | 841,212 | |
Distribution and service fees: |
A-Class | | | 273,865 | |
C-Class | | | 5,318 | |
P-Class | | | 345 | |
Transfer agent/maintenance fees: |
A-Class | | | 78,761 | |
C-Class | | | 1,216 | |
P-Class | | | 268 | |
Institutional Class | | | 3,655 | |
Fund accounting/administration fees | | | 80,220 | |
Professional fees | | | 29,340 | |
Interest expense | | | 12,872 | |
Trustees’ fees* | | | 10,782 | |
Custodian fees | | | 8,784 | |
Line of credit fees | | | 3,902 | |
Miscellaneous | | | 54,200 | |
Total expenses | | | 1,404,740 | |
Less: |
Expenses waived by Adviser | | | (62,558 | ) |
Earnings credits applied | | | (60 | ) |
Total waived expenses | | | (62,618 | ) |
Net expenses | | | 1,342,122 | |
Net investment income | | | 414,730 | |
| | | | | |
Net Realized and Unrealized Gain (Loss): |
Net realized gain (loss) on: |
Investments in unaffiliated issuers | | $ | 3,038,804 | |
Investments in affiliated issuers | | | 123,677 | |
Swap agreements | | | 17,399,606 | |
Futures contracts | | | 787,541 | |
Net realized gain | | | 21,349,628 | |
Net change in unrealized appreciation (depreciation) on: |
Investments in unaffiliated issuers | | | 3,908,178 | |
Investments in affiliated issuers | | | (53,756 | ) |
Swap agreements | | | 14,341,054 | |
Futures contracts | | | 72,035 | |
Net change in unrealized appreciation (depreciation) | | | 18,267,511 | |
Net realized and unrealized gain | | | 39,617,139 | |
Net increase in net assets resulting from operations | | $ | 40,031,869 | |
* | Relates to Trustees not deemed “interested persons” within the meaning of Section 2(a)(19) of the 1940 Act. |
SEE NOTES TO FINANCIAL STATEMENTS. | THE GUGGENHEIM FUNDS SEMI-ANNUAL REPORT | 81 |
STYLEPLUS—LARGE CORE FUND | |
STATEMENTS OF CHANGES IN NET ASSETS |
| | Six Months Ended
March 31, 2021
(Unaudited) | | | Year Ended
September 30,
2020 | |
Increase (Decrease) in Net Assets from Operations: | | | | | | | | |
Net investment income | | $ | 414,730 | | | $ | 1,573,000 | |
Net realized gain (loss) on investments | | | 21,349,628 | | | | (381,266 | ) |
Net change in unrealized appreciation (depreciation) on investments | | | 18,267,511 | | | | 25,364,647 | |
Net increase in net assets resulting from operations | | | 40,031,869 | | | | 26,556,381 | |
| | | | | | | | | |
Distributions to shareholders: | | | | | | | | |
A-Class | | | (18,893,195 | ) | | | (3,244,843 | ) |
C-Class | | | (129,625 | ) | | | (12,363 | ) |
P-Class | | | (24,513 | ) | | | (3,753 | ) |
Institutional Class | | | (345,692 | ) | | | (66,049 | ) |
Total distributions to shareholders | | | (19,393,025 | ) | | | (3,327,008 | ) |
| | | | | | | | | |
Capital share transactions: | | | | | | | | |
Proceeds from sale of shares | | | | | | | | |
A-Class | | | 5,875,142 | | | | 4,196,689 | |
C-Class | | | 76,084 | | | | 227,320 | |
P-Class | | | 37,026 | | | | 18,348 | |
Institutional Class | | | 1,229,709 | | | | 1,427,785 | |
Distributions reinvested | | | | | | | | |
A-Class | | | 17,748,487 | | | | 3,042,509 | |
C-Class | | | 129,475 | | | | 11,771 | |
P-Class | | | 24,513 | | | | 3,753 | |
Institutional Class | | | 310,274 | | | | 59,852 | |
Cost of shares redeemed | | | | | | | | |
A-Class | | | (14,361,583 | ) | | | (22,034,120 | ) |
C-Class | | | (288,471 | ) | | | (301,053 | ) |
P-Class | | | (1,484 | ) | | | (53,627 | ) |
Institutional Class | | | (642,468 | ) | | | (2,331,110 | ) |
Net increase (decrease) from capital share transactions | | | 10,136,704 | | | | (15,731,883 | ) |
Net increase in net assets | | | 30,775,548 | | | | 7,497,490 | |
| | | | | | | | | |
Net assets: | | | | | | | | |
Beginning of period | | | 209,014,824 | | | | 201,517,334 | |
End of period | | $ | 239,790,372 | | | $ | 209,014,824 | |
| | | | | | | | | |
Capital share activity: | | | | | | | | |
Shares sold | | | | | | | | |
A-Class | | | 240,163 | | | | 195,983 | |
C-Class | | | 4,642 | | | | 15,762 | |
P-Class | | | 1,530 | | | | 844 | |
Institutional Class | | | 51,367 | | | | 72,157 | |
Shares issued from reinvestment of distributions | | | | | | | | |
A-Class | | | 757,188 | | | | 139,629 | |
C-Class | | | 8,316 | | | | 777 | |
P-Class | | | 1,061 | | | | 174 | |
Institutional Class | | | 13,374 | | | | 2,773 | |
Shares redeemed | | | | | | | | |
A-Class | | | (594,895 | ) | | | (1,050,623 | ) |
C-Class | | | (17,558 | ) | | | (20,724 | ) |
P-Class | | | (63 | ) | | | (2,792 | ) |
Institutional Class | | | (26,964 | ) | | | (112,891 | ) |
Net increase (decrease) in shares | | | 438,161 | | | | (758,931 | ) |
82 | THE GUGGENHEIM FUNDS SEMI-ANNUAL REPORT | SEE NOTES TO FINANCIAL STATEMENTS. |
STYLEPLUS—LARGE CORE FUND | |
This table is presented to show selected data for a share outstanding throughout each period and to assist shareholders in evaluating a Fund’s performance for the periods presented.
A-Class | | Six Months Ended
March 31, 2021a | | | Year Ended
September 30,
2020 | | | Year Ended
September 30,
2019 | | | Year Ended
September 30,
2018 | | | Year Ended
September 30,
2017 | | | Year Ended
September 30,
2016 | |
Per Share Data |
Net asset value, beginning of period | | $ | 23.01 | | | $ | 20.48 | | | $ | 24.78 | | | $ | 25.23 | | | $ | 21.86 | | | $ | 21.14 | |
Income (loss) from investment operations: |
Net investment income (loss)b | | | .04 | | | | .17 | | | | .30 | | | | .30 | | | | .24 | | | | .16 | |
Net gain (loss) on investments (realized and unrealized) | | | 4.31 | | | | 2.70 | | | | (.72 | ) | | | 3.52 | | | | 3.72 | | | | 3.04 | |
Total from investment operations | | | 4.35 | | | | 2.87 | | | | (.42 | ) | | | 3.82 | | | | 3.96 | | | | 3.20 | |
Less distributions from: |
Net investment income | | | (.19 | ) | | | (.31 | ) | | | (.30 | ) | | | (.24 | ) | | | (.16 | ) | | | (.13 | ) |
Net realized gains | | | (1.99 | ) | | | (.03 | ) | | | (3.58 | ) | | | (4.03 | ) | | | (.43 | ) | | | (2.35 | ) |
Total distributions | | | (2.18 | ) | | | (.34 | ) | | | (3.88 | ) | | | (4.27 | ) | | | (.59 | ) | | | (2.48 | ) |
Net asset value, end of period | | $ | 25.18 | | | $ | 23.01 | | | $ | 20.48 | | | $ | 24.78 | | | $ | 25.23 | | | $ | 21.86 | |
|
Total Returnc | | | 19.60 | % | | | 14.18 | % | | | 1.50 | % | | | 16.60 | % | | | 18.58 | % | | | 16.13 | % |
Ratios/Supplemental Data |
Net assets, end of period (in thousands) | | $ | 233,894 | | | $ | 204,428 | | | $ | 196,563 | | | $ | 217,697 | | | $ | 206,033 | | | $ | 188,979 | |
Ratios to average net assets: |
Net investment income (loss) | | | 0.37 | % | | | 0.79 | % | | | 1.48 | % | | | 1.27 | % | | | 1.03 | % | | | 0.79 | % |
Total expensesd | | | 1.25 | % | | | 1.32 | % | | | 1.31 | % | | | 1.34 | % | | | 1.38 | % | | | 1.33 | % |
Net expensese | | | 1.19 | % | | | 1.28 | % | | | 1.28 | % | | | 1.31 | % | | | 1.34 | % | | | 1.31 | % |
Portfolio turnover rate | | | 10 | % | | | 69 | % | | | 51 | % | | | 46 | % | | | 30 | % | | | 50 | % |
C-Class | | Six Months Ended
March 31, 2021a | | | Year Ended
September 30,
2020 | | | Year Ended
September 30,
2019 | | | Year Ended
September 30,
2018 | | | Year Ended
September 30,
2017 | | | Year Ended
September 30,
2016 | |
Per Share Data |
Net asset value, beginning of period | | $ | 15.87 | | | $ | 14.22 | | | $ | 18.41 | | | $ | 19.74 | | | $ | 17.22 | | | $ | 17.17 | |
Income (loss) from investment operations: |
Net investment income (loss)b | | | (.04 | ) | | | (.02 | ) | | | .08 | | | | .06 | | | | .03 | | | | (.02 | ) |
Net gain (loss) on investments (realized and unrealized) | | | 2.92 | | | | 1.87 | | | | (.69 | ) | | | 2.69 | | | | 2.92 | | | | 2.42 | |
Total from investment operations | | | 2.88 | | | | 1.85 | | | | (.61 | ) | | | 2.75 | | | | 2.95 | | | | 2.40 | |
Less distributions from: |
Net investment income | | | (.08 | ) | | | (.17 | ) | | | — | | | | (.05 | ) | | | — | | | | — | |
Net realized gains | | | (1.99 | ) | | | (.03 | ) | | | (3.58 | ) | | | (4.03 | ) | | | (.43 | ) | | | (2.35 | ) |
Total distributions | | | (2.07 | ) | | | (.20 | ) | | | (3.58 | ) | | | (4.08 | ) | | | (.43 | ) | | | (2.35 | ) |
Net asset value, end of period | | $ | 16.68 | | | $ | 15.87 | | | $ | 14.22 | | | $ | 18.41 | | | $ | 19.74 | | | $ | 17.22 | |
|
Total Returnc | | | 19.05 | % | | | 13.11 | % | | | 0.60 | % | | | 15.56 | % | | | 17.59 | % | | | 15.00 | % |
Ratios/Supplemental Data |
Net assets, end of period (in thousands) | | $ | 994 | | | $ | 1,019 | | | $ | 973 | | | $ | 1,239 | | | $ | 2,376 | | | $ | 2,650 | |
Ratios to average net assets: |
Net investment income (loss) | | | (0.53 | %) | | | (0.15 | %) | | | 0.58 | % | | | 0.33 | % | | | 0.19 | % | | | (0.14 | %) |
Total expensesd | | | 2.16 | % | | | 2.24 | % | | | 2.23 | % | | | 2.24 | % | | | 2.23 | % | | | 2.27 | % |
Net expensese | | | 2.10 | % | | | 2.20 | % | | | 2.19 | % | | | 2.21 | % | | | 2.20 | % | | | 2.25 | % |
Portfolio turnover rate | | | 10 | % | | | 69 | % | | | 51 | % | | | 46 | % | | | 30 | % | | | 50 | % |
SEE NOTES TO FINANCIAL STATEMENTS. | THE GUGGENHEIM FUNDS SEMI-ANNUAL REPORT | 83 |
STYLEPLUS—LARGE CORE FUND | |
FINANCIAL HIGHLIGHTS (continued) |
This table is presented to show selected data for a share outstanding throughout each period and to assist shareholders in evaluating a Fund’s performance for the periods presented.
P-Class | | Six Months Ended
March 31, 2021a | | | Year Ended
September 30,
2020 | | | Year Ended
September 30,
2019 | | | Year Ended
September 30,
2018 | | | Year Ended
September 30,
2017 | | | Year Ended
September 30,
2016 | |
Per Share Data |
Net asset value, beginning of period | | $ | 22.69 | | | $ | 20.21 | | | $ | 24.49 | | | $ | 25.03 | | | $ | 21.75 | | | $ | 21.11 | |
Income (loss) from investment operations: |
Net investment income (loss)b | | | .03 | | | | .14 | | | | .29 | | | | .26 | | | | .22 | | | | .21 | |
Net gain (loss) on investments (realized and unrealized) | | | 4.25 | | | | 2.67 | | | | (.73 | ) | | | 3.45 | | | | 3.68 | | | | 2.97 | |
Total from investment operations | | | 4.28 | | | | 2.81 | | | | (.44 | ) | | | 3.71 | | | | 3.90 | | | | 3.18 | |
Less distributions from: |
Net investment income | | | (.17 | ) | | | (.30 | ) | | | (.26 | ) | | | (.22 | ) | | | (.19 | ) | | | (.19 | ) |
Net realized gains | | | (1.99 | ) | | | (.03 | ) | | | (3.58 | ) | | | (4.03 | ) | | | (.43 | ) | | | (2.35 | ) |
Total distributions | | | (2.16 | ) | | | (.33 | ) | | | (3.84 | ) | | | (4.25 | ) | | | (.62 | ) | | | (2.54 | ) |
Net asset value, end of period | | $ | 24.81 | | | $ | 22.69 | | | $ | 20.21 | | | $ | 24.49 | | | $ | 25.03 | | | $ | 21.75 | |
|
Total Return | | | 19.58 | % | | | 13.98 | % | | | 1.47 | % | | | 16.23 | % | | | 18.43 | % | | | 16.08 | % |
Ratios/Supplemental Data |
Net assets, end of period (in thousands) | | $ | 308 | | | $ | 224 | | | $ | 236 | | | $ | 319 | | | $ | 508 | | | $ | 405 | |
Ratios to average net assets: |
Net investment income (loss) | | | 0.25 | % | | | 0.67 | % | | | 1.45 | % | | | 1.06 | % | | | 0.93 | % | | | 1.02 | % |
Total expensesd | | | 1.37 | % | | | 1.46 | % | | | 1.36 | % | | | 1.56 | % | | | 1.47 | % | | | 1.22 | % |
Net expensese | | | 1.32 | % | | | 1.42 | % | | | 1.33 | % | | | 1.53 | % | | | 1.44 | % | | | 1.19 | % |
Portfolio turnover rate | | | 10 | % | | | 69 | % | | | 51 | % | | | 46 | % | | | 30 | % | | | 50 | % |
84 | THE GUGGENHEIM FUNDS SEMI-ANNUAL REPORT | SEE NOTES TO FINANCIAL STATEMENTS. |
STYLEPLUS—LARGE CORE FUND | |
FINANCIAL HIGHLIGHTS (concluded) |
This table is presented to show selected data for a share outstanding throughout each period and to assist shareholders in evaluating a Fund’s performance for the periods presented.
Institutional Class | | Six Months Ended
March 31, 2021a | | | Year Ended
September 30,
2020 | | | Year Ended
September 30,
2019 | | | Year Ended
September 30,
2018 | | | Year Ended
September 30,
2017 | | | Year Ended
September 30,
2016 | |
Per Share Data |
Net asset value, beginning of period | | $ | 22.83 | | | $ | 20.31 | | | $ | 24.65 | | | $ | 25.13 | | | $ | 21.78 | | | $ | 21.00 | |
Income (loss) from investment operations: |
Net investment income (loss)b | | | .06 | | | | .21 | | | | .35 | | | | .37 | | | | .32 | | | | .24 | |
Net gain (loss) on investments (realized and unrealized) | | | 4.27 | | | | 2.70 | | | | (.75 | ) | | | 3.51 | | | | 3.69 | | | | 3.10 | |
Total from investment operations | | | 4.33 | | | | 2.91 | | | | (.40 | ) | | | 3.88 | | | | 4.01 | | | | 3.34 | |
Less distributions from: |
Net investment income | | | (.24 | ) | | | (.36 | ) | | | (.36 | ) | | | (.33 | ) | | | (.23 | ) | | | (.21 | ) |
Net realized gains | | | (1.99 | ) | | | (.03 | ) | | | (3.58 | ) | | | (4.03 | ) | | | (.43 | ) | | | (2.35 | ) |
Total distributions | | | (2.23 | ) | | | (.39 | ) | | | (3.94 | ) | | | (4.36 | ) | | | (.66 | ) | | | (2.56 | ) |
Net asset value, end of period | | $ | 24.93 | | | $ | 22.83 | | | $ | 20.31 | | | $ | 24.65 | | | $ | 25.13 | | | $ | 21.78 | |
|
Total Return | | | 19.70 | % | | | 14.44 | % | | | 1.74 | % | | | 16.96 | % | | | 18.96 | % | | | 17.00 | % |
Ratios/Supplemental Data |
Net assets, end of period (in thousands) | | $ | 4,594 | | | $ | 3,344 | | | $ | 3,747 | | | $ | 6,826 | | | $ | 5,631 | | | $ | 4,247 | |
Ratios to average net assets: |
Net investment income (loss) | | | 0.51 | % | | | 1.01 | % | | | 1.73 | % | | | 1.57 | % | | | 1.35 | % | | | 1.11 | % |
Total expensesd | | | 1.12 | % | | | 1.08 | % | | | 1.09 | % | | | 1.06 | % | | | 1.05 | % | | | 0.99 | % |
Net expensese | | | 1.06 | % | | | 1.04 | % | | | 1.06 | % | | | 1.03 | % | | | 1.01 | % | | | 0.97 | % |
Portfolio turnover rate | | | 10 | % | | | 69 | % | | | 51 | % | | | 46 | % | | | 30 | % | | | 50 | % |
a | Unaudited figures for the period ended March 31, 2021. Percentage amounts for the period, except total return and portfolio turnover rate, have been annualized. |
b | Net investment income (loss) per share was computed using average shares outstanding throughout the period. |
c | Total return does not reflect the impact of any applicable sales charges. |
d | Does not include expenses of the underlying funds in which the Fund invests. |
e | Net expense information reflects the expense ratios after expense waivers and reimbursements, as applicable. |
SEE NOTES TO FINANCIAL STATEMENTS. | THE GUGGENHEIM FUNDS SEMI-ANNUAL REPORT | 85 |
PERFORMANCE REPORT AND FUND PROFILE (Unaudited) | March 31, 2021 |
STYLEPLUS—MID GROWTH FUND
OBJECTIVE: Seeks long-term growth of capital.
Holdings Diversification (Market Exposure as % of Net Assets)
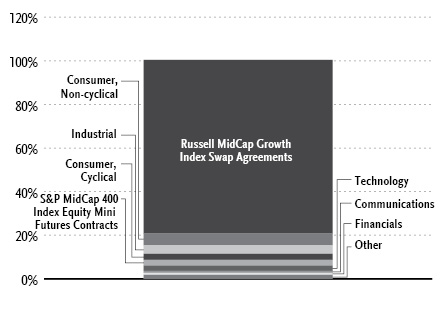
“Holdings Diversification (Market Exposure as % of Net Assets)” excludes any temporary cash investments, investments in Guggenheim Strategy Funds Trust mutual funds, or investments in Guggenheim Ultra Short Duration Fund.
Inception Dates: |
A-Class | September 17, 1969 |
C-Class | January 29, 1999 |
P-Class | May 1, 2015 |
Institutional Class | March 1, 2012 |
Ten Largest Holdings (% of Total Net Assets) |
Guggenheim Strategy Fund II | 33.3% |
Guggenheim Ultra Short Duration Fund — Institutional Class | 23.2% |
Guggenheim Strategy Fund III | 22.5% |
Williams-Sonoma, Inc. | 0.3% |
Gentex Corp. | 0.2% |
Charles River Laboratories International, Inc. | 0.2% |
SolarEdge Technologies, Inc. | 0.2% |
Encompass Health Corp. | 0.2% |
Fair Isaac Corp. | 0.2% |
Cognex Corp. | 0.2% |
Top Ten Total | 80.5% |
| | |
“Ten Largest Holdings” excludes any temporary cash or derivative investments. |
86 | THE GUGGENHEIM FUNDS SEMI-ANNUAL REPORT | |
PERFORMANCE REPORT AND FUND PROFILE (Unaudited)(concluded) | March 31, 2021 |
Average Annual Returns*
Periods Ended March 31, 2021
| 6 Month† | 1 Year | 5 Year | 10 Year |
A-Class Shares | 21.22% | 75.06% | 17.03% | 12.79% |
A-Class Shares with sales charge‡ | 15.47% | 66.73% | 15.89% | 12.25% |
C-Class Shares | 20.68% | 73.50% | 16.01% | 11.81% |
C-Class Shares with CDSC§ | 19.71% | 72.50% | 16.01% | 11.81% |
Russell Midcap Growth Index | 18.35% | 68.61% | 18.39% | 14.11% |
| 6 Month† | 1 Year | 5 Year | Since
Inception
(05/01/15) |
P-Class Shares | 21.17% | 74.92% | 16.87% | 12.85% |
Russell Midcap Growth Index | 18.35% | 68.61% | 18.39% | 14.32% |
| 6 Month† | 1 Year | 5 Year | Since
Inception
(03/01/12) |
Institutional Class Shares | 21.35% | 75.40% | 17.22% | 13.86% |
Russell Midcap Growth Index | 18.35% | 68.61% | 18.39% | 15.26% |
* | The performance data above represents past performance that is not predictive of future results. The investment return and principal value of an investment in the Fund will fluctuate so that an investor’s shares, when redeemed, may be worth more or less than their original cost. Returns are historical and include changes in principal and reinvested dividends and capital gains and do not reflect the effect of taxes. The Russell Midcap Growth Index is an unmanaged index and, unlike the Fund, has no management fees or operating expenses to reduce its reported return. |
† | 6 month returns are not annualized. |
‡ | Fund returns are calculated using the maximum sales charge of 4.75%. |
§ | Fund returns include a CDSC of 1% if redeemed within 12 months of purchase. |
| | THE GUGGENHEIM FUNDS SEMI-ANNUAL REPORT | 87 |
SCHEDULE OF INVESTMENTS (Unaudited) | March 31, 2021 |
STYLEPLUS—MID GROWTH FUND | |
| | Shares | | | Value | |
COMMON STOCKS† - 16.9% |
| | | | | | | | | |
Consumer, Non-cyclical - 5.3% |
Charles River Laboratories International, Inc.* | | | 859 | | | $ | 248,964 | |
Encompass Health Corp. | | | 2,704 | | | | 221,457 | |
Molina Healthcare, Inc.* | | | 898 | | | | 209,916 | |
Bio-Techne Corp. | | | 528 | | | | 201,659 | |
United Therapeutics Corp.* | | | 1,177 | | | | 196,877 | |
Humana, Inc. | | | 427 | | | | 179,020 | |
Masimo Corp.* | | | 760 | | | | 174,542 | |
Exelixis, Inc.* | | | 7,475 | | | | 168,860 | |
Hill-Rom Holdings, Inc. | | | 1,464 | | | | 161,743 | |
Jazz Pharmaceuticals plc* | | | 915 | | | | 150,399 | |
Syneos Health, Inc.* | | | 1,981 | | | | 150,259 | |
United Rentals, Inc.* | | | 436 | | | | 143,579 | |
Darling Ingredients, Inc.* | | | 1,924 | | | | 141,568 | |
Integra LifeSciences Holdings Corp.* | | | 2,048 | | | | 141,496 | |
Repligen Corp.* | | | 700 | | | | 136,087 | |
Chemed Corp. | | | 295 | | | | 135,647 | |
Service Corporation International | | | 2,510 | | | | 128,136 | |
STERIS plc | | | 669 | | | | 127,431 | |
Boston Beer Company, Inc. — Class A* | | | 101 | | | | 121,834 | |
WEX, Inc.* | | | 576 | | | | 120,511 | |
Flowers Foods, Inc. | | | 5,028 | | | | 119,667 | |
DaVita, Inc.* | | | 1,092 | | | | 117,685 | |
Arrowhead Pharmaceuticals, Inc.* | | | 1,753 | | | | 116,241 | |
Hologic, Inc.* | | | 1,494 | | | | 111,124 | |
Quanta Services, Inc. | | | 1,231 | | | | 108,303 | |
Globus Medical, Inc. — Class A* | | | 1,750 | | | | 107,922 | |
Penumbra, Inc.* | | | 385 | | | | 104,173 | |
Regeneron Pharmaceuticals, Inc.* | | | 215 | | | | 101,725 | |
LHC Group, Inc.* | | | 523 | | | | 100,003 | |
HealthEquity, Inc.* | | | 1,396 | | | | 94,928 | |
FTI Consulting, Inc.* | | | 675 | | | | 94,574 | |
McKesson Corp. | | | 481 | | | | 93,814 | |
Emergent BioSolutions, Inc.* | | | 1,000 | | | | 92,910 | |
Amedisys, Inc.* | | | 343 | | | | 90,823 | |
Halozyme Therapeutics, Inc.* | | | 2,159 | | | | 90,009 | |
Incyte Corp.* | | | 1,068 | | | | 86,796 | |
ICU Medical, Inc.* | | | 402 | | | | 82,587 | |
Medpace Holdings, Inc.* | | | 498 | | | | 81,697 | |
Quidel Corp.* | | | 604 | | | | 77,270 | |
PerkinElmer, Inc. | | | 548 | | | | 70,303 | |
Select Medical Holdings Corp.* | | | 1,763 | | | | 60,118 | |
Biogen, Inc.* | | | 210 | | | | 58,748 | |
Kimberly-Clark Corp. | | | 390 | | | | 54,230 | |
Vertex Pharmaceuticals, Inc.* | | | 244 | | | | 52,433 | |
Cardinal Health, Inc. | | | 859 | | | | 52,184 | |
Haemonetics Corp.* | | | 457 | | | | 50,732 | |
FleetCor Technologies, Inc.* | | | 186 | | | | 49,965 | |
Helen of Troy Ltd.* | | | 128 | | | | 26,964 | |
Total Consumer, Non-cyclical | | | | | | | 5,607,913 | |
| | | | | | | | | |
Industrial - 3.9% |
Cognex Corp. | | | 2,617 | | | | 217,185 | |
UFP Industries, Inc. | | | 2,629 | | | | 199,384 | |
Timken Co. | | | 2,388 | | | | 193,834 | |
Hubbell, Inc. | | | 975 | | | | 182,218 | |
Knight-Swift Transportation Holdings, Inc. | | | 3,777 | | | | 181,636 | |
Carlisle Companies, Inc. | | | 1,096 | | | | 180,380 | |
Agilent Technologies, Inc. | | | 1,374 | | | | 174,690 | |
AGCO Corp. | | | 1,186 | | | | 170,369 | |
Lincoln Electric Holdings, Inc. | | | 1,285 | | | | 157,978 | |
Hillenbrand, Inc. | | | 3,095 | | | | 147,662 | |
Curtiss-Wright Corp. | | | 1,178 | | | | 139,711 | |
Energizer Holdings, Inc. | | | 2,681 | | | | 127,240 | |
II-VI, Inc.* | | | 1,839 | | | | 125,733 | |
Lennox International, Inc. | | | 397 | | | | 123,701 | |
TE Connectivity Ltd. | | | 947 | | | | 122,267 | |
TopBuild Corp.* | | | 576 | | | | 120,632 | |
Axon Enterprise, Inc.* | | | 846 | | | | 120,487 | |
Toro Co. | | | 1,099 | | | | 113,351 | |
Woodward, Inc. | | | 930 | | | | 112,186 | |
Graco, Inc. | | | 1,537 | | | | 110,080 | |
Masco Corp. | | | 1,830 | | | | 109,617 | |
Regal Beloit Corp. | | | 767 | | | | 109,435 | |
Trex Company, Inc.* | | | 1,156 | | | | 105,820 | |
Werner Enterprises, Inc. | | | 2,070 | | | | 97,642 | |
Parker-Hannifin Corp. | | | 309 | | | | 97,468 | |
Nordson Corp. | | | 466 | | | | 92,585 | |
XPO Logistics, Inc.* | | | 735 | | | | 90,625 | |
Simpson Manufacturing Company, Inc. | | | 826 | | | | 85,681 | |
Waters Corp.* | | | 289 | | | | 82,125 | |
Middleby Corp.* | | | 454 | | | | 75,250 | |
Builders FirstSource, Inc.* | | | 1,573 | | | | 72,940 | |
Clean Harbors, Inc.* | | | 807 | | | | 67,836 | |
Tetra Tech, Inc. | | | 398 | | | | 54,017 | |
Total Industrial | | | | | | | 4,161,765 | |
| | | | | | | | | |
Consumer, Cyclical - 2.8% |
Williams-Sonoma, Inc. | | | 1,564 | | | | 280,269 | |
Gentex Corp. | | | 7,009 | | | | 250,011 | |
AutoZone, Inc.* | | | 113 | | | | 158,686 | |
Lithia Motors, Inc. — Class A | | | 398 | | | | 155,256 | |
Deckers Outdoor Corp.* | | | 442 | | | | 146,046 | |
MSC Industrial Direct Company, Inc. — Class A | | | 1,596 | | | | 143,943 | |
Brunswick Corp. | | | 1,424 | | | | 135,807 | |
Polaris, Inc. | | | 992 | | | | 132,432 | |
Best Buy Company, Inc. | | | 1,139 | | | | 130,769 | |
Tempur Sealy International, Inc. | | | 3,545 | | | | 129,605 | |
RH* | | | 214 | | | | 127,672 | |
Mattel, Inc.* | | | 6,273 | | | | 124,958 | |
Casey’s General Stores, Inc. | | | 534 | | | | 115,445 | |
Five Below, Inc.* | | | 562 | | | | 107,224 | |
PulteGroup, Inc. | | | 1,856 | | | | 97,329 | |
Visteon Corp.* | | | 767 | | | | 93,536 | |
Churchill Downs, Inc. | | | 368 | | | | 83,691 | |
Cummins, Inc. | | | 295 | | | | 76,437 | |
Toll Brothers, Inc. | | | 1,218 | | | | 69,097 | |
O’Reilly Automotive, Inc.* | | | 135 | | | | 68,479 | |
Ollie’s Bargain Outlet Holdings, Inc.* | | | 781 | | | | 67,947 | |
Scotts Miracle-Gro Co. — Class A | | | 244 | | | | 59,773 | |
88 | THE GUGGENHEIM FUNDS SEMI-ANNUAL REPORT | SEE NOTES TO FINANCIAL STATEMENTS. |
SCHEDULE OF INVESTMENTS (Unaudited)(continued) | March 31, 2021 |
STYLEPLUS—MID GROWTH FUND | |
| | Shares | | | Value | |
IAA, Inc.* | | | 968 | | | $ | 53,375 | |
Texas Roadhouse, Inc. — Class A* | | | 556 | | | | 53,343 | |
YETI Holdings, Inc.* | | | 733 | | | | 52,930 | |
Fox Factory Holding Corp.* | | | 407 | | | | 51,713 | |
Total Consumer, Cyclical | | | | | | | 2,965,773 | |
| | | | | | | | | |
Technology - 2.3% |
Fair Isaac Corp.* | | | 453 | | | | 220,181 | |
PTC, Inc.* | | | 1,553 | | | | 213,770 | |
CDK Global, Inc. | | | 3,358 | | | | 181,534 | |
Cree, Inc.* | | | 1,548 | | | | 167,385 | |
MKS Instruments, Inc. | | | 873 | | | | 161,872 | |
Cerner Corp. | | | 2,197 | | | | 157,920 | |
J2 Global, Inc.* | | | 1,245 | | | | 149,226 | |
Cirrus Logic, Inc.* | | | 1,664 | | | | 141,091 | |
CACI International, Inc. — Class A* | | | 495 | | | | 122,097 | |
MAXIMUS, Inc. | | | 1,288 | | | | 114,683 | |
Lumentum Holdings, Inc.* | | | 1,237 | | | | 113,000 | |
ACI Worldwide, Inc.* | | | 2,716 | | | | 103,344 | |
Science Applications International Corp. | | | 1,122 | | | | 93,788 | |
Cognizant Technology Solutions Corp. — Class A | | | 1,200 | | | | 93,744 | |
Manhattan Associates, Inc.* | | | 780 | | | | 91,556 | |
Qorvo, Inc.* | | | 495 | | | | 90,436 | |
Blackbaud, Inc.* | | | 1,144 | | | | 81,316 | |
Synaptics, Inc.* | | | 594 | | | | 80,439 | |
Silicon Laboratories, Inc.* | | | 440 | | | | 62,071 | |
Total Technology | | | | | | | 2,439,453 | |
| | | | | | | | | |
Communications - 1.0% |
Ciena Corp.* | | | 3,276 | | | | 179,262 | |
Viavi Solutions, Inc.* | | | 10,730 | | | | 168,461 | |
New York Times Co. — Class A | | | 3,063 | | | | 155,049 | |
FactSet Research Systems, Inc. | | | 408 | | | | 125,905 | |
Cable One, Inc. | | | 57 | | | | 104,217 | |
Corning, Inc. | | | 2,041 | | | | 88,804 | |
Motorola Solutions, Inc. | | | 375 | | | | 70,519 | |
TEGNA, Inc. | | | 3,510 | | | | 66,093 | |
F5 Networks, Inc.* | | | 314 | | | | 65,507 | |
eBay, Inc. | | | 919 | | | | 56,279 | |
Total Communications | | | | | | | 1,080,096 | |
| | | | | | | | | |
Financial - 0.9% |
Stifel Financial Corp. | | | 2,561 | | | | 164,058 | |
RenaissanceRe Holdings Ltd. | | | 773 | | | | 123,873 | |
Primerica, Inc. | | | 777 | | | | 114,856 | |
SLM Corp. | | | 5,877 | | | | 105,610 | |
Brown & Brown, Inc. | | | 2,278 | | | | 104,128 | |
PacWest Bancorp | | | 2,511 | | | | 95,794 | |
Interactive Brokers Group, Inc. — Class A | | | 1,182 | | | | 86,333 | |
Brighthouse Financial, Inc.* | | | 1,697 | | | | 75,092 | |
Camden Property Trust REIT | | | 483 | | | | 53,087 | |
CyrusOne, Inc. REIT | | | 778 | | | | 52,686 | |
PROG Holdings, Inc. | | | 1,076 | | | | 46,580 | |
Total Financial | | | | | | | 1,022,097 | |
| | | | | | | | | |
Energy - 0.6% |
SolarEdge Technologies, Inc.* | | | 777 | | | | 223,341 | |
First Solar, Inc.* | | | 2,033 | | | | 177,481 | |
Sunrun, Inc.* | | | 2,671 | | | | 161,542 | |
Antero Midstream Corp. | | | 4,814 | | | | 43,470 | |
Total Energy | | | | | | | 605,834 | |
| | | | | | | | | |
Basic Materials - 0.1% |
Cleveland-Cliffs, Inc.* | | | 4,634 | | | | 93,190 | |
RPM International, Inc. | | | 602 | | | | 55,293 | |
Total Basic Materials | | | | | | | 148,483 | |
| | | | | | | | | |
Total Common Stocks | | | | |
(Cost $15,172,702) | | | | | | | 18,031,414 | |
| | | | | | | | | |
MUTUAL FUNDS† - 79.0% |
Guggenheim Strategy Fund II1 | | | 1,421,671 | | | | 35,513,345 | |
Guggenheim Ultra Short Duration Fund — Institutional Class1 | | | 2,484,042 | | | | 24,741,063 | |
Guggenheim Strategy Fund III1 | | | 951,447 | | | | 23,919,387 | |
Total Mutual Funds | | | | |
(Cost $83,730,215) | | | | | | | 84,173,795 | |
| | | | | | | | | |
MONEY MARKET FUND† - 2.6% |
Dreyfus Treasury Securities Cash Management Fund — Institutional Shares, 0.01%2 | | | 2,775,297 | | | | 2,775,297 | |
Total Money Market Fund | | | | |
(Cost $2,775,297) | | | | | | | 2,775,297 | |
| | | | | | | | | |
Total Investments - 98.5% | | | | |
(Cost $101,678,214) | | $ | 104,980,506 | |
Other Assets & Liabilities, net - 1.5% | | | 1,609,777 | |
Total Net Assets - 100.0% | | $ | 106,590,283 | |
SEE NOTES TO FINANCIAL STATEMENTS. | THE GUGGENHEIM FUNDS SEMI-ANNUAL REPORT | 89 |
SCHEDULE OF INVESTMENTS (Unaudited)(continued) | March 31, 2021 |
STYLEPLUS—MID GROWTH FUND | |
Futures Contracts |
Description | | Number of
Contracts | | | Expiration Date | | | Notional
Amount | | | Value and
Unrealized
Appreciation
(Depreciation)** | |
Equity Futures Contracts Purchased† |
S&P 500 Index Mini Futures Contracts | | | 3 | | | | Jun 2021 | | | $ | 595,275 | | | $ | 2,420 | |
NASDAQ-100 Index Mini Futures Contracts | | | 2 | | | | Jun 2021 | | | | 523,390 | | | | (2,193 | ) |
S&P MidCap 400 Index Mini Futures Contracts | | | 11 | | | | Jun 2021 | | | | 2,867,260 | | | | (40,682 | ) |
| | | | | | | | | | | $ | 3,985,925 | | | $ | (40,455 | ) |
Total Return Swap Agreements |
Counterparty | Index | Financing
Rate Pay | Payment
Frequency | | Maturity
Date | | Units | | Notional
Amount | | Value and
Unrealized
Appreciation | |
OTC Equity Index Swap Agreements†† |
Citibank, N.A. | Russell MidCap Growth Index Total Return | 0.33% (1 Month USD LIBOR + 0.21%) | At Maturity | | 12/02/21 | | 17,229 | | $ | 84,915,883 | | $ | 13,076,122 | |
* | Non-income producing security. |
** | Includes cumulative appreciation (depreciation). Variation margin is reported within the Statement of Assets and Liabilities. |
† | Value determined based on Level 1 inputs — See Note 4. |
†† | Value determined based on Level 2 inputs — See Note 4. |
1 | Affiliated issuer. |
2 | Rate indicated is the 7-day yield as of March 31, 2021. |
| | LIBOR — London Interbank Offered Rate |
| | plc — Public Limited Company |
| | REIT — Real Estate Investment Trust |
| | |
| | See Sector Classification in Other Information section. |
The following table summarizes the inputs used to value the Fund’s investments at March 31, 2021 (See Note 4 in the Notes to Financial Statements):
Investments in Securities (Assets) | | Level 1
Quoted
Prices | | | Level 2
Significant
Observable
Inputs | | | Level 3
Significant
Unobservable
Inputs | | | Total | |
Common Stocks | | $ | 18,031,414 | | | $ | — | | | $ | — | | | $ | 18,031,414 | |
Mutual Funds | | | 84,173,795 | | | | — | | | | — | | | | 84,173,795 | |
Money Market Fund | | | 2,775,297 | | | | — | | | | — | | | | 2,775,297 | |
Equity Futures Contracts** | | | 2,420 | | | | — | | | | — | | | | 2,420 | |
Equity Index Swap Agreements** | | | — | | | | 13,076,122 | | | | — | | | | 13,076,122 | |
Total Assets | | $ | 104,982,926 | | | $ | 13,076,122 | | | $ | — | | | $ | 118,059,048 | |
Investments in Securities (Liabilities) | | Level 1
Quoted
Prices | | | Level 2
Significant
Observable
Inputs | | | Level 3
Significant
Unobservable
Inputs | | | Total | |
Equity Futures Contracts** | | $ | 42,875 | | | $ | — | | | $ | — | | | $ | 42,875 | |
** | This derivative is reported as unrealized appreciation/depreciation at period end. |
90 | THE GUGGENHEIM FUNDS SEMI-ANNUAL REPORT | SEE NOTES TO FINANCIAL STATEMENTS. |
SCHEDULE OF INVESTMENTS (Unaudited)(concluded) | March 31, 2021 |
STYLEPLUS—MID GROWTH FUND | |
Affiliated Transactions
Investments representing 5% or more of the outstanding voting shares of a company, or control of or by, or common control under Guggenheim Investments (“GI”), result in that company being considered an affiliated issuer, as defined in the 1940 Act.
The Fund may invest in certain of the underlying series of Guggenheim Strategy Funds Trust, including Guggenheim Strategy Fund II and Guggenheim Strategy Fund III, (collectively, the “Short Term Investment Vehicles”), each of which are open-end management investment companies managed by GI. The Short Term Investment Vehicles, which launched on March 11, 2014, are offered as short term investment options only to mutual funds, trusts, and other accounts managed by GI and/or its affiliates, and are not available to the public. The Short Term Investment Vehicles pay no investment management fees. The Short Term Investment Vehicles’ annual report on Form N-CSR dated September 30, 2020, is available publicly or upon request. This information is available from the EDGAR database on the SEC’s website at https://www.sec.gov/Archives/edgar/data/1601445/000182126820000133/gug81042-ncsr.htm.
Transactions during the period ended March 31, 2021, in which the company is an affiliated issuer, were as follows:
Security Name | | Value
09/30/20 | | | Additions | | | Reductions | | | Realized
Gain (Loss) | | | Change in
Unrealized
Appreciation
(Depreciation) | | | Value
03/31/21 | | | Shares
03/31/21 | | | Investment
Income | |
Mutual Funds | | | | | | | | | | | | | | | | | | | | | | | | | | | | | | | | |
Guggenheim Strategy Fund II | | $ | 29,104,012 | | | $ | 6,398,693 | | | $ | — | | | $ | — | | | $ | 10,640 | | | $ | 35,513,345 | | | | 1,421,671 | | | $ | 293,736 | |
Guggenheim Strategy Fund III | | | 23,646,335 | | | | 206,849 | | | | — | | | | — | | | | 66,203 | | | | 23,919,387 | | | | 951,447 | | | | 206,849 | |
Guggenheim Ultra Short Duration Fund — Institutional Class | | | 20,960,246 | | | | 11,686,521 | | | | (7,861,991 | ) | | | 202,420 | | | | (246,133 | ) | | | 24,741,063 | | | | 2,484,042 | | | | 141,550 | |
| | | $ | 73,710,593 | | | $ | 18,292,063 | | | $ | (7,861,991 | ) | | $ | 202,420 | | | $ | (169,290 | ) | | $ | 84,173,795 | | | | | | | $ | 642,135 | |
SEE NOTES TO FINANCIAL STATEMENTS. | THE GUGGENHEIM FUNDS SEMI-ANNUAL REPORT | 91 |
STYLEPLUS—MID GROWTH FUND | |
STATEMENT OF ASSETS AND LIABILITIES (Unaudited) |
March 31, 2021 |
Assets: |
Investments in unaffiliated issuers, at value (cost $17,947,999) | | $ | 20,806,711 | |
Investments in affiliated issuers, at value (cost $83,730,215) | | | 84,173,795 | |
Cash | | | 278 | |
Segregated cash with broker | | | 213,500 | |
Unrealized appreciation on OTC swap agreements | | | 13,076,122 | |
Prepaid expenses | | | 41,047 | |
Receivables: |
Dividends | | | 101,215 | |
Variation margin on futures contracts | | | 14,680 | |
Fund shares sold | | | 6,912 | |
Interest | | | 32 | |
Total assets | | | 118,434,292 | |
| | | | | |
Liabilities: |
Segregated cash due to broker | | | 11,470,000 | |
Payable for: |
Swap settlement | | | 104,842 | |
Securities purchased | | | 94,273 | |
Management fees | | | 62,040 | |
Fund shares redeemed | | | 29,731 | |
Distribution and service fees | | | 23,036 | |
Fund accounting/administration fees | | | 8,987 | |
Transfer agent/maintenance fees | | | 5,236 | |
Trustees’ fees* | | | 488 | |
Miscellaneous | | | 45,376 | |
Total liabilities | | | 11,844,009 | |
Net assets | | $ | 106,590,283 | |
| | | | | |
Net assets consist of: |
Paid in capital | | $ | 86,339,525 | |
Total distributable earnings (loss) | | | 20,250,758 | |
Net assets | | $ | 106,590,283 | |
| | | | | |
A-Class: |
Net assets | | $ | 103,111,021 | |
Capital shares outstanding | | | 2,114,187 | |
Net asset value per share | | $ | 48.77 | |
Maximum offering price per share (Net asset value divided by 95.25%) | | $ | 51.20 | |
| | | | | |
C-Class: |
Net assets | | $ | 1,400,189 | |
Capital shares outstanding | | | 48,730 | |
Net asset value per share | | $ | 28.73 | |
| | | | | |
P-Class: |
Net assets | | $ | 217,587 | |
Capital shares outstanding | | | 4,525 | |
Net asset value per share | | $ | 48.09 | |
| | | | | |
Institutional Class: |
Net assets | | $ | 1,861,486 | |
Capital shares outstanding | | | 38,201 | |
Net asset value per share | | $ | 48.73 | |
* | Relates to Trustees not deemed “interested persons” within the meaning of Section 2(a)(19) of the 1940 Act. |
92 | THE GUGGENHEIM FUNDS SEMI-ANNUAL REPORT | SEE NOTES TO FINANCIAL STATEMENTS. |
STYLEPLUS—MID GROWTH FUND | |
STATEMENT OF OPERATIONS (Unaudited) |
Six Months Ended March 31, 2021 |
Investment Income: |
Dividends from securities of unaffiliated issuers | | $ | 67,177 | |
Dividends from securities of affiliated issuers | | | 642,135 | |
Interest | | | 249 | |
Total investment income | | | 709,561 | |
| | | | | |
Expenses: |
Management fees | | | 393,127 | |
Distribution and service fees: |
A-Class | | | 126,588 | |
C-Class | | | 8,176 | |
P-Class | | | 238 | |
Transfer agent/maintenance fees: |
A-Class | | | 41,492 | |
C-Class | | | 1,751 | |
P-Class | | | 168 | |
Institutional Class | | | 1,250 | |
Registration fees | | | 43,083 | |
Fund accounting/administration fees | | | 39,876 | |
Professional fees | | | 23,075 | |
Interest expense | | | 10,739 | |
Trustees’ fees* | | | 9,742 | |
Custodian fees | | | 8,637 | |
Line of credit fees | | | 1,731 | |
Miscellaneous | | | 9,455 | |
Total expenses | | | 719,128 | |
Less: |
Expenses waived by Adviser | | | (34,217 | ) |
Earnings credits applied | | | (25 | ) |
Total waived expenses | | | (34,242 | ) |
Net expenses | | | 684,886 | |
Net investment income | | | 24,675 | |
| | | | | |
Net Realized and Unrealized Gain (Loss): |
Net realized gain (loss) on: |
Investments in unaffiliated issuers | | $ | 2,296,104 | |
Investments in affiliated issuers | | | 202,420 | |
Swap agreements | | | 15,473,393 | |
Futures contracts | | | 565,139 | |
Net realized gain | | | 18,537,056 | |
Net change in unrealized appreciation (depreciation) on: |
Investments in unaffiliated issuers | | | 2,265,986 | |
Investments in affiliated issuers | | | (169,290 | ) |
Swap agreements | | | (1,176,976 | ) |
Futures contracts | | | (7,077 | ) |
Net change in unrealized appreciation (depreciation) | | | 912,643 | |
Net realized and unrealized gain | | | 19,449,699 | |
Net increase in net assets resulting from operations | | $ | 19,474,374 | |
* | Relates to Trustees not deemed “interested persons” within the meaning of Section 2(a)(19) of the 1940 Act. |
SEE NOTES TO FINANCIAL STATEMENTS. | THE GUGGENHEIM FUNDS SEMI-ANNUAL REPORT | 93 |
STYLEPLUS—MID GROWTH FUND | |
STATEMENTS OF CHANGES IN NET ASSETS |
| | Six Months Ended
March 31, 2021
(Unaudited) | | | Year Ended
September 30,
2020 | |
Increase (Decrease) in Net Assets from Operations: | | | | | | | | |
Net investment income | | $ | 24,675 | | | $ | 382,685 | |
Net realized gain (loss) on investments | | | 18,537,056 | | | | (1,198,558 | ) |
Net change in unrealized appreciation (depreciation) on investments | | | 912,643 | | | | 15,041,235 | |
Net increase in net assets resulting from operations | | | 19,474,374 | | | | 14,225,362 | |
| | | | | | | | | |
Distributions to shareholders: | | | | | | | | |
A-Class | | | (13,186,487 | ) | | | (1,858,325 | ) |
C-Class | | | (336,310 | ) | | | (39,450 | ) |
P-Class | | | (24,991 | ) | | | (2,046 | ) |
Institutional Class | | | (238,403 | ) | | | (23,966 | ) |
Total distributions to shareholders | | | (13,786,191 | ) | | | (1,923,787 | ) |
| | | | | | | | | |
Capital share transactions: | | | | | | | | |
Proceeds from sale of shares | | | | | | | | |
A-Class | | | 1,226,453 | | | | 2,245,934 | |
C-Class | | | 108,658 | | | | 1,004,377 | |
P-Class | | | 77,420 | | | | 56,872 | |
Institutional Class | | | 498,393 | | | | 703,244 | |
Distributions reinvested | | | | | | | | |
A-Class | | | 12,584,970 | | | | 1,767,121 | |
C-Class | | | 278,491 | | | | 31,434 | |
P-Class | | | 24,991 | | | | 2,046 | |
Institutional Class | | | 228,045 | | | | 23,138 | |
Cost of shares redeemed | | | | | | | | |
A-Class | | | (5,812,297 | ) | | | (9,742,564 | ) |
C-Class | | | (464,919 | ) | | | (1,153,519 | ) |
P-Class | | | (6,692 | ) | | | (51,906 | ) |
Institutional Class | | | (246,786 | ) | | | (556,301 | ) |
Net increase (decrease) from capital share transactions | | | 8,496,727 | | | | (5,670,124 | ) |
Net increase in net assets | | | 14,184,910 | | | | 6,631,451 | |
| | | | | | | | | |
Net assets: | | | | | | | | |
Beginning of period | | | 92,405,373 | | | | 85,773,922 | |
End of period | | $ | 106,590,283 | | | $ | 92,405,373 | |
| | | | | | | | | |
Capital share activity: | | | | | | | | |
Shares sold | | | | | | | | |
A-Class | | | 24,963 | | | | 54,683 | |
C-Class | | | 3,598 | | | | 35,895 | |
P-Class | | | 1,593 | | | | 1,434 | |
Institutional Class | | | 9,947 | | | | 16,806 | |
Shares issued from reinvestment of distributions | | | | | | | | |
A-Class | | | 260,504 | | | | 42,510 | |
C-Class | | | 9,761 | | | | 1,175 | |
P-Class | | | 525 | | | | 50 | |
Institutional Class | | | 4,727 | | | | 557 | |
Shares redeemed | | | | | | | | |
A-Class | | | (116,933 | ) | | | (246,314 | ) |
C-Class | | | (15,973 | ) | | | (51,299 | ) |
P-Class | | | (141 | ) | | | (1,299 | ) |
Institutional Class | | | (4,986 | ) | | | (13,361 | ) |
Net increase (decrease) in shares | | | 177,585 | | | | (159,163 | ) |
94 | THE GUGGENHEIM FUNDS SEMI-ANNUAL REPORT | SEE NOTES TO FINANCIAL STATEMENTS. |
STYLEPLUS—MID GROWTH FUND | |
This table is presented to show selected data for a share outstanding throughout each period and to assist shareholders in evaluating a Fund’s performance for the periods presented.
A-Class | | Six Months Ended
March 31, 2021a | | | Year Ended
September 30,
2020 | | | Year Ended
September 30,
2019 | | | Year Ended
September 30,
2018 | | | Year Ended
September 30,
2017 | | | Year Ended
September 30,
2016 | |
Per Share Data |
Net asset value, beginning of period | | $ | 45.98 | | | $ | 39.64 | | | $ | 49.70 | | | $ | 47.34 | | | $ | 40.52 | | | $ | 41.49 | |
Income (loss) from investment operations: |
Net investment income (loss)b | | | .01 | | | | .19 | | | | .45 | | | | .41 | | | | .34 | | | | .19 | |
Net gain (loss) on investments (realized and unrealized) | | | 9.68 | | | | 7.06 | | | | (1.58 | ) | | | 7.70 | | | | 6.72 | | | | 4.25 | |
Total from investment operations | | | 9.69 | | | | 7.25 | | | | (1.13 | ) | | | 8.11 | | | | 7.06 | | | | 4.44 | |
Less distributions from: |
Net investment income | | | (.20 | ) | | | (.45 | ) | | | (.41 | ) | | | (.24 | ) | | | (.24 | ) | | | (.05 | ) |
Net realized gains | | | (6.70 | ) | | | (.46 | ) | | | (8.52 | ) | | | (5.51 | ) | | | — | | | | (5.36 | ) |
Total distributions | | | (6.90 | ) | | | (.91 | ) | | | (8.93 | ) | | | (5.75 | ) | | | (.24 | ) | | | (5.41 | ) |
Net asset value, end of period | | $ | 48.77 | | | $ | 45.98 | | | $ | 39.64 | | | $ | 49.70 | | | $ | 47.34 | | | $ | 40.52 | |
|
Total Returnc | | | 21.22 | % | | | 18.57 | % | | | 2.34 | % | | | 18.51 | % | | | 17.54 | % | | | 11.55 | % |
Ratios/Supplemental Data |
Net assets, end of period (in thousands) | | $ | 103,111 | | | $ | 89,469 | | | $ | 83,027 | | | $ | 87,509 | | | $ | 77,049 | | | $ | 72,179 | |
Ratios to average net assets: |
Net investment income (loss) | | | 0.06 | % | | | 0.46 | % | | | 1.13 | % | | | 0.87 | % | | | 0.78 | % | | | 0.48 | % |
Total expensesd | | | 1.36 | % | | | 1.45 | % | | | 1.44 | % | | | 1.55 | % | | | 1.45 | % | | | 1.45 | % |
Net expensese | | | 1.30 | % | | | 1.40 | % | | | 1.41 | % | | | 1.52 | % | | | 1.42 | % | | | 1.43 | % |
Portfolio turnover rate | | | 20 | % | | | 82 | % | | | 73 | % | | | 52 | % | | | 43 | % | | | 61 | % |
C-Class | | Six Months Ended
March 31, 2021a | | | Year Ended
September 30,
2020 | | | Year Ended
September 30,
2019 | | | Year Ended
September 30,
2018 | | | Year Ended
September 30,
2017 | | | Year Ended
September 30,
2016 | |
Per Share Data |
Net asset value, beginning of period | | $ | 29.40 | | | $ | 25.66 | | | $ | 35.78 | | | $ | 35.64 | | | $ | 30.58 | | | $ | 32.78 | |
Income (loss) from investment operations: |
Net investment income (loss)b | | | (.12 | ) | | | (.10 | ) | | | .08 | | | | .02 | | | | (.03 | ) | | | (.12 | ) |
Net gain (loss) on investments (realized and unrealized) | | | 6.15 | | | | 4.53 | | | | (1.68 | ) | | | 5.63 | | | | 5.09 | | | | 3.28 | |
Total from investment operations | | | 6.03 | | | | 4.43 | | | | (1.60 | ) | | | 5.65 | | | | 5.06 | | | | 3.16 | |
Less distributions from: |
Net investment income | | | — | | | | (.23 | ) | | | — | | | | — | | | | — | | | | — | |
Net realized gains | | | (6.70 | ) | | | (.46 | ) | | | (8.52 | ) | | | (5.51 | ) | | | — | | | | (5.36 | ) |
Total distributions | | | (6.70 | ) | | | (.69 | ) | | | (8.52 | ) | | | (5.51 | ) | | | — | | | | (5.36 | ) |
Net asset value, end of period | | $ | 28.73 | | | $ | 29.40 | | | $ | 25.66 | | | $ | 35.78 | | | $ | 35.64 | | | $ | 30.58 | |
|
Total Returnc | | | 20.68 | % | | | 17.53 | % | | | 1.46 | % | | | 17.51 | % | | | 16.55 | % | | | 10.55 | % |
Ratios/Supplemental Data |
Net assets, end of period (in thousands) | | $ | 1,400 | | | $ | 1,510 | | | $ | 1,683 | | | $ | 1,849 | | | $ | 3,984 | | | $ | 3,760 | |
Ratios to average net assets: |
Net investment income (loss) | | | (0.82 | %) | | | (0.39 | %) | | | 0.30 | % | | | 0.05 | % | | | (0.08 | %) | | | (0.42 | %) |
Total expensesd | | | 2.24 | % | | | 2.32 | % | | | 2.27 | % | | | 2.33 | % | | | 2.31 | % | | | 2.34 | % |
Net expensese | | | 2.18 | % | | | 2.28 | % | | | 2.24 | % | | | 2.30 | % | | | 2.27 | % | | | 2.32 | % |
Portfolio turnover rate | | | 20 | % | | | 82 | % | | | 73 | % | | | 52 | % | | | 43 | % | | | 61 | % |
SEE NOTES TO FINANCIAL STATEMENTS. | THE GUGGENHEIM FUNDS SEMI-ANNUAL REPORT | 95 |
STYLEPLUS—MID GROWTH FUND | |
FINANCIAL HIGHLIGHTS (continued) |
This table is presented to show selected data for a share outstanding throughout each period and to assist shareholders in evaluating a Fund’s performance for the periods presented.
P-Class | | Six Months Ended
March 31, 2021a | | | Year Ended
September 30,
2020 | | | Year Ended
September 30,
2019 | | | Year Ended
September 30,
2018 | | | Year Ended
September 30,
2017 | | | Year Ended
September 30,
2016 | |
Per Share Data |
Net asset value, beginning of period | | $ | 45.45 | | | $ | 39.17 | | | $ | 49.12 | | | $ | 46.83 | | | $ | 40.27 | | | $ | 41.48 | |
Income (loss) from investment operations: |
Net investment income (loss)b | | | (.01 | ) | | | .15 | | | | .41 | | | | .32 | | | | .24 | | | | .26 | |
Net gain (loss) on investments (realized and unrealized) | | | 9.58 | | | | 6.99 | | | | (1.58 | ) | | | 7.61 | | | | 6.65 | | | | 4.09 | |
Total from investment operations | | | 9.57 | | | | 7.14 | | | | (1.17 | ) | | | 7.93 | | | | 6.89 | | | | 4.35 | |
Less distributions from: |
Net investment income | | | (.23 | ) | | | (.40 | ) | | | (.26 | ) | | | (.13 | ) | | | (.33 | ) | | | (.20 | ) |
Net realized gains | | | (6.70 | ) | | | (.46 | ) | | | (8.52 | ) | | | (5.51 | ) | | | — | | | | (5.36 | ) |
Total distributions | | | (6.93 | ) | | | (.86 | ) | | | (8.78 | ) | | | (5.64 | ) | | | (.33 | ) | | | (5.56 | ) |
Net asset value, end of period | | $ | 48.09 | | | $ | 45.45 | | | $ | 39.17 | | | $ | 49.12 | | | $ | 46.83 | | | $ | 40.27 | |
|
Total Return | | | 21.17 | % | | | 18.48 | % | | | 2.22 | % | | | 18.26 | % | | | 17.27 | % | | | 11.36 | % |
Ratios/Supplemental Data |
Net assets, end of period (in thousands) | | $ | 218 | | | $ | 116 | | | $ | 93 | | | $ | 125 | | | $ | 121 | | | $ | 102 | |
Ratios to average net assets: |
Net investment income (loss) | | | (0.04 | %) | | | 0.36 | % | | | 1.04 | % | | | 0.67 | % | | | 0.55 | % | | | 0.69 | % |
Total expensesd | | | 1.45 | % | | | 1.54 | % | | | 1.55 | % | | | 1.68 | % | | | 1.66 | % | | | 1.39 | % |
Net expensese | | | 1.39 | % | | | 1.50 | % | | | 1.51 | % | | | 1.64 | % | | | 1.63 | % | | | 1.35 | % |
Portfolio turnover rate | | | 20 | % | | | 82 | % | | | 73 | % | | | 52 | % | | | 43 | % | | | 61 | % |
96 | THE GUGGENHEIM FUNDS SEMI-ANNUAL REPORT | SEE NOTES TO FINANCIAL STATEMENTS. |
STYLEPLUS—MID GROWTH FUND | |
FINANCIAL HIGHLIGHTS (concluded) |
This table is presented to show selected data for a share outstanding throughout each period and to assist shareholders in evaluating a Fund’s performance for the periods presented.
Institutional Class | | Six Months Ended
March 31, 2021a | | | Year Ended
September 30,
2020 | | | Year Ended
September 30,
2019 | | | Year Ended
September 30,
2018 | | | Year Ended
September 30,
2017 | | | Year Ended
September 30,
2016 | |
Per Share Data |
Net asset value, beginning of period | | $ | 45.98 | | | $ | 39.64 | | | $ | 49.80 | | | $ | 47.48 | | | $ | 40.59 | | | $ | 41.64 | |
Income (loss) from investment operations: |
Net investment income (loss)b | | | .06 | | | | .24 | | | | .51 | | | | .53 | | | | .42 | | | | .19 | |
Net gain (loss) on investments (realized and unrealized) | | | 9.68 | | | | 7.09 | | | | (1.63 | ) | | | 7.71 | | | | 6.78 | | | | 4.25 | |
Total from investment operations | | | 9.74 | | | | 7.33 | | | | (1.12 | ) | | | 8.24 | | | | 7.20 | | | | 4.44 | |
Less distributions from: |
Net investment income | | | (.29 | ) | | | (.53 | ) | | | (.52 | ) | | | (.41 | ) | | | (.31 | ) | | | (.13 | ) |
Net realized gains | | | (6.70 | ) | | | (.46 | ) | | | (8.52 | ) | | | (5.51 | ) | | | — | | | | (5.36 | ) |
Total distributions | | | (6.99 | ) | | | (.99 | ) | | | (9.04 | ) | | | (5.92 | ) | | | (.31 | ) | | | (5.49 | ) |
Net asset value, end of period | | $ | 48.73 | | | $ | 45.98 | | | $ | 39.64 | | | $ | 49.80 | | | $ | 47.48 | | | $ | 40.59 | |
|
Total Return | | | 21.35 | % | | | 18.79 | % | | | 2.42 | % | | | 18.77 | % | | | 17.88 | % | | | 11.50 | % |
Ratios/Supplemental Data |
Net assets, end of period (in thousands) | | $ | 1,861 | | | $ | 1,311 | | | $ | 972 | | | $ | 875 | | | $ | 1,743 | | | $ | 113 | |
Ratios to average net assets: |
Net investment income (loss) | | | 0.25 | % | | | 0.58 | % | | | 1.28 | % | | | 1.11 | % | | | 0.95 | % | | | 0.48 | % |
Total expensesd | | | 1.17 | % | | | 1.26 | % | | | 1.31 | % | | | 1.26 | % | | | 1.26 | % | | | 1.46 | % |
Net expensese | | | 1.10 | % | | | 1.22 | % | | | 1.28 | % | | | 1.23 | % | | | 1.22 | % | | | 1.44 | % |
Portfolio turnover rate | | | 20 | % | | | 82 | % | | | 73 | % | | | 52 | % | | | 43 | % | | | 61 | % |
a | Unaudited figures for the period ended March 31, 2021. Percentage amounts for the period, except total return and portfolio turnover rate, have been annualized. |
b | Net investment income (loss) per share was computed using average shares outstanding throughout the period. |
c | Total return does not reflect the impact of any applicable sales charges. |
d | Does not include expenses of the underlying funds in which the Fund invests. |
e | Net expense information reflects the expense ratios after expense waivers and reimbursements, as applicable. |
SEE NOTES TO FINANCIAL STATEMENTS. | THE GUGGENHEIM FUNDS SEMI-ANNUAL REPORT | 97 |
PERFORMANCE REPORT AND FUND PROFILE (Unaudited) | March 31, 2021 |
WORLD EQUITY INCOME FUND
OBJECTIVE: Seeks to provide total return, comprised of capital appreciation and income.
Holdings Diversification (Market Exposure as % of Net Assets)
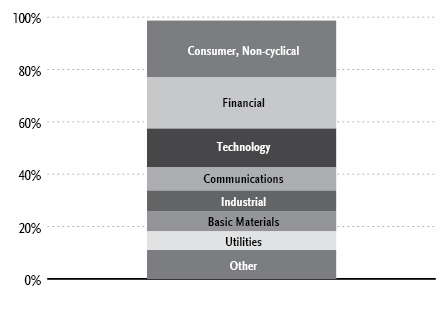
“Holdings Diversification (Market Exposure as % of Net Assets)” excludes any temporary cash investments.
COUNTRY DIVERSIFICATION
Country | | % of Long-Term
Investments | |
United States | | | 62.7 | % |
Germany | | | 6.3 | % |
Japan | | | 5.8 | % |
Singapore | | | 3.3 | % |
Netherlands | | | 3.1 | % |
Ireland | | | 3.0 | % |
United Kingdom | | | 2.9 | % |
Other | | | 12.9 | % |
Total Long-Term Investments | | | 100.0 | % |
Inception Dates: |
A-Class | October 1, 1993 |
C-Class | January 29, 1999 |
P-Class | May 1, 2015 |
Institutional Class | May 2, 2011 |
Ten Largest Holdings (% of Total Net Assets) |
Apple, Inc. | 2.8% |
Amazon.com, Inc. | 2.4% |
Microsoft Corp. | 2.4% |
Alphabet, Inc. — Class C | 1.7% |
Volkswagen AG | 1.1% |
Pfizer, Inc. | 1.1% |
Citigroup, Inc. | 1.1% |
ASML Holding N.V. | 1.1% |
Accenture plc — Class A | 1.0% |
AbbVie, Inc. | 1.0% |
Top Ten Total | 15.7% |
| | |
“Ten Largest Holdings” excludes any temporary cash or derivative investments. |
98 | THE GUGGENHEIM FUNDS SEMI-ANNUAL REPORT | |
PERFORMANCE REPORT AND FUND PROFILE (Unaudited)(concluded) | March 31, 2021 |
Average Annual Returns*
Periods Ended March 31, 2021
| 6 Month† | 1 Year | 5 Year | 10 Year |
A-Class Shares | 24.11% | 53.40% | 9.62% | 6.71% |
A-Class Shares with sales charge‡ | 18.21% | 46.13% | 8.55% | 6.19% |
C-Class Shares | 23.58% | 52.18% | 8.78% | 5.92% |
C-Class Shares with CDSC§ | 22.58% | 51.18% | 8.78% | 5.92% |
MSCI World Index | 19.57% | 54.03% | 13.36% | 9.88% |
| 6 Month† | 1 Year | 5 Year | Since
Inception
(05/01/15) |
P-Class Shares | 24.06% | 53.36% | 9.76% | 7.98% |
MSCI World Index | 19.57% | 54.03% | 13.36% | 9.99% |
| 6 Month† | 1 Year | 5 Year | Since
Inception
(05/02/11) |
Institutional Class Shares | 24.19% | 53.80% | 9.91% | 6.58% |
MSCI World Index | 19.57% | 54.03% | 13.36% | 9.48% |
* | The performance data above represents past performance that is not predictive of future results. The investment return and principal value of an investment in the Fund will fluctuate so that an investor’s shares, when redeemed, may be worth more or less than their original cost. Returns are historical and include changes in principal and reinvested dividends and capital gains and do not reflect the effect of taxes. The MSCI World Index is an unmanaged index and, unlike the Fund, has no management fees or operating expenses to reduce its reported return. |
† | 6 month returns are not annualized. |
‡ | Fund returns are calculated using the maximum sales charge of 4.75%. |
§ | Fund returns include a CDSC of 1% if redeemed within 12 months of purchase. |
| | THE GUGGENHEIM FUNDS SEMI-ANNUAL REPORT | 99 |
SCHEDULE OF INVESTMENTS (Unaudited) | March 31, 2021 |
WORLD EQUITY INCOME FUND | |
| | Shares | | | Value | |
COMMON STOCKS† - 96.0% |
| | | | | | | | | |
Consumer, Non-cyclical - 21.7% |
Pfizer, Inc. | | | 16,000 | | | $ | 579,680 | |
AbbVie, Inc. | | | 4,800 | | | | 519,456 | |
Philip Morris International, Inc. | | | 5,800 | | | | 514,692 | |
PepsiCo, Inc. | | | 3,505 | | | | 495,782 | |
Merck & Company, Inc. | | | 6,300 | | | | 485,667 | |
CVS Health Corp. | | | 5,800 | | | | 436,334 | |
Colgate-Palmolive Co. | | | 5,482 | | | | 432,146 | |
Anthem, Inc. | | | 1,200 | | | | 430,740 | |
Boston Scientific Corp.* | | | 11,100 | | | | 429,015 | |
Gilead Sciences, Inc. | | | 6,400 | | | | 413,632 | |
Square, Inc. — Class A* | | | 1,800 | | | | 408,690 | |
Vertex Pharmaceuticals, Inc.* | | | 1,900 | | | | 408,291 | |
Kimberly-Clark Corp. | | | 2,891 | | | | 401,994 | |
Humana, Inc. | | | 900 | | | | 377,325 | |
Kroger Co. | | | 10,000 | | | | 359,900 | |
Tyson Foods, Inc. — Class A | | | 4,700 | | | | 349,210 | |
Kellogg Co. | | | 5,456 | | | | 345,365 | |
Bunge Ltd. | | | 3,900 | | | | 309,153 | |
Sysco Corp. | | | 3,900 | | | | 307,086 | |
Molson Coors Beverage Co. — Class B* | | | 6,000 | | | | 306,900 | |
Centene Corp.* | | | 4,800 | | | | 306,768 | |
Viatris, Inc.* | | | 19,000 | | | | 265,430 | |
Archer-Daniels-Midland Co. | | | 4,400 | | | | 250,800 | |
WH Group Ltd.1 | | | 294,500 | | | | 238,676 | |
Cardinal Health, Inc. | | | 3,400 | | | | 206,550 | |
Cigna Corp. | | | 800 | | | | 193,392 | |
Mondelez International, Inc. — Class A | | | 3,000 | | | | 175,590 | |
J M Smucker Co. | | | 1,300 | | | | 164,489 | |
Ionis Pharmaceuticals, Inc.* | | | 3,600 | | | | 161,856 | |
Fresenius Medical Care AG & Co. KGaA | | | 2,100 | | | | 154,446 | |
Japan Tobacco, Inc. | | | 7,100 | | | | 136,259 | |
Quest Diagnostics, Inc. | | | 1,000 | | | | 128,340 | |
Koninklijke Ahold Delhaize N.V. | | | 4,000 | | | | 111,397 | |
Campbell Soup Co. | | | 2,000 | | | | 100,540 | |
Johnson & Johnson | | | 600 | | | | 98,610 | |
ABIOMED, Inc.* | | | 300 | | | | 95,619 | |
Becton Dickinson and Co. | | | 300 | | | | 72,945 | |
Total Consumer, Non-cyclical | | | | | | | 11,172,765 | |
| | | | | | | | | |
Financial - 19.6% |
Citigroup, Inc. | | | 7,900 | | | | 574,725 | |
Wells Fargo & Co. | | | 12,900 | | | | 504,003 | |
Simon Property Group, Inc. REIT | | | 4,200 | | | | 477,834 | |
Oversea-Chinese Banking Corporation Ltd. | | | 53,500 | | | | 467,473 | |
Equity Residential REIT | | | 6,200 | | | | 444,106 | |
Allianz AG | | | 1,700 | | | | 432,675 | |
Mitsubishi UFJ Financial Group, Inc. | | | 80,300 | | | | 429,105 | |
AvalonBay Communities, Inc. REIT | | | 2,300 | | | | 424,373 | |
DBS Group Holdings Ltd. | | | 19,200 | | | | 411,062 | |
United Overseas Bank Ltd. | | | 20,300 | | | | 389,929 | |
Hang Seng Bank Ltd. | | | 18,100 | | | | 350,427 | |
BOC Hong Kong Holdings Ltd. | | | 98,800 | | | | 345,072 | |
Boston Properties, Inc. REIT | | | 3,400 | | | | 344,284 | |
NN Group N.V. | | | 7,000 | | | | 342,202 | |
KeyCorp | | | 16,200 | | | | 323,676 | |
Annaly Capital Management, Inc. REIT | | | 37,415 | | | | 321,769 | |
Admiral Group plc | | | 7,000 | | | | 299,141 | |
Sumitomo Mitsui Financial Group, Inc. | | | 8,100 | | | | 293,124 | |
Power Corporation of Canada | | | 11,000 | | | | 289,179 | |
Synchrony Financial | | | 7,100 | | | | 288,686 | |
Zurich Insurance Group AG | | | 673 | | | | 287,325 | |
Vornado Realty Trust REIT | | | 6,100 | | | | 276,879 | |
VEREIT, Inc. | | | 7,100 | | | | 274,202 | |
Medical Properties Trust, Inc. REIT | | | 11,128 | | | | 236,804 | |
Legal & General Group plc | | | 51,000 | | | | 196,151 | |
Prudential Financial, Inc. | | | 2,100 | | | | 191,310 | |
U.S. Bancorp | | | 3,000 | | | | 165,930 | |
Mizuho Financial Group, Inc. | | | 10,000 | | | | 144,409 | |
Citizens Financial Group, Inc. | | | 3,100 | | | | 136,865 | |
Toronto-Dominion Bank | | | 1,900 | | | | 123,943 | |
Western Union Co. | | | 5,000 | | | | 123,300 | |
Kinnevik AB — Class B* | | | 1,900 | | | | 92,399 | |
MetLife, Inc. | | | 1,500 | | | | 91,185 | |
Total Financial | | | | | | | 10,093,547 | |
| | | | | | | | | |
Technology - 14.7% |
Apple, Inc. | | | 11,936 | | | | 1,457,983 | |
Microsoft Corp. | | | 5,142 | | | | 1,212,330 | |
ASML Holding N.V. | | | 900 | | | | 545,614 | |
Accenture plc — Class A | | | 1,900 | | | | 524,875 | |
Micron Technology, Inc.* | | | 5,300 | | | | 467,513 | |
International Business Machines Corp. | | | 3,300 | | | | 439,758 | |
Cognizant Technology Solutions Corp. — Class A | | | 5,300 | | | | 414,036 | |
Twilio, Inc. — Class A* | | | 1,100 | | | | 374,836 | |
Intel Corp. | | | 5,800 | | | | 371,200 | |
salesforce.com, Inc.* | | | 1,700 | | | | 360,179 | |
Advanced Micro Devices, Inc.* | | | 4,300 | | | | 337,550 | |
Seagate Technology plc | | | 3,823 | | | | 293,415 | |
NVIDIA Corp. | | | 400 | | | | 213,572 | |
Bechtle AG | | | 1,100 | | | | 206,250 | |
NetApp, Inc. | | | 2,500 | | | | 181,675 | |
SAP AG | | | 1,400 | | | | 171,421 | |
Total Technology | | | | | | | 7,572,207 | |
| | | | | | | | | |
Communications - 9.1% |
Amazon.com, Inc.* | | | 401 | | | | 1,240,726 | |
Alphabet, Inc. — Class C* | | | 424 | | | | 877,099 | |
Facebook, Inc. — Class A* | | | 1,650 | | | | 485,975 | |
KDDI Corp. | | | 13,000 | | | | 398,593 | |
Nippon Telegraph & Telephone Corp. | | | 14,000 | | | | 359,334 | |
Lumen Technologies, Inc. | | | 22,200 | | | | 296,370 | |
HKT Trust & HKT Ltd. | | | 186,048 | | | | 265,184 | |
Juniper Networks, Inc. | | | 10,000 | | | | 253,300 | |
Cisco Systems, Inc. | | | 4,000 | | | | 206,840 | |
Twitter, Inc.* | | | 2,700 | | | | 171,801 | |
Verizon Communications, Inc. | | | 2,000 | | | | 116,300 | |
Total Communications | | | | | | | 4,671,522 | |
| | | | | | | | | |
100 | THE GUGGENHEIM FUNDS SEMI-ANNUAL REPORT | SEE NOTES TO FINANCIAL STATEMENTS. |
SCHEDULE OF INVESTMENTS (Unaudited)(continued) | March 31, 2021 |
WORLD EQUITY INCOME FUND | |
| | Shares | | | Value | |
Industrial - 7.9% |
3M Co. | | | 2,647 | | | $ | 510,024 | |
Deutsche Post AG | | | 7,300 | | | | 399,925 | |
Lockheed Martin Corp. | | | 1,000 | | | | 369,500 | |
CRH plc ADR | | | 7,100 | | | | 332,771 | |
Northrop Grumman Corp. | | | 1,000 | | | | 323,640 | |
Boeing Co.* | | | 1,200 | | | | 305,664 | |
Husqvarna AB — Class B | | | 21,200 | | | | 305,456 | |
ACS Actividades de Construccion y Servicios S.A. | | | 8,000 | | | | 265,103 | |
Singapore Technologies Engineering Ltd. | | | 79,900 | | | | 231,133 | |
Skanska AB — Class B | | | 8,000 | | | | 200,663 | |
Venture Corporation Ltd. | | | 13,200 | | | | 196,911 | |
Huntington Ingalls Industries, Inc. | | | 900 | | | | 185,265 | |
FedEx Corp. | | | 600 | | | | 170,424 | |
DSV PANALPINA A/S | | | 700 | | | | 137,339 | |
Siemens AG | | | 800 | | | | 131,332 | |
Total Industrial | | | | | | | 4,065,150 | |
| | | | | | | | | |
Basic Materials - 7.6% |
Rio Tinto plc | | | 5,400 | | | | 413,071 | |
Nucor Corp. | | | 4,500 | | | | 361,215 | |
Steel Dynamics, Inc. | | | 7,000 | | | | 355,320 | |
Koninklijke DSM N.V. | | | 2,000 | | | | 338,415 | |
UPM-Kymmene Oyj | | | 8,900 | | | | 319,661 | |
Boliden AB | | | 8,000 | | | | 296,871 | |
BASF SE | | | 3,200 | | | | 265,816 | |
Yara International ASA | | | 5,000 | | | | 260,017 | |
Arkema S.A. | | | 2,100 | | | | 254,497 | |
Voestalpine AG | | | 6,000 | | | | 248,570 | |
Akzo Nobel N.V. | | | 2,100 | | | | 234,625 | |
Lanxess AG | | | 3,100 | | | | 228,501 | |
Smurfit Kappa Group plc | | | 4,000 | | | | 188,368 | |
Symrise AG | | | 1,400 | | | | 169,747 | |
Total Basic Materials | | | | | | | 3,934,694 | |
| | | | | | | | | |
Utilities - 7.1% |
Southern Co. | | | 6,500 | | | | 404,040 | |
Exelon Corp. | | | 8,800 | | | | 384,912 | |
FirstEnergy Corp. | | | 10,530 | | | | 365,286 | |
PPL Corp. | | | 12,200 | | | | 351,848 | |
CLP Holdings Ltd. | | | 35,800 | | | | 347,706 | |
CenterPoint Energy, Inc. | | | 15,000 | | | | 339,750 | |
Fortum Oyj | | | 9,900 | | | | 264,217 | |
Duke Energy Corp. | | | 2,500 | | | | 241,325 | |
NRG Energy, Inc. | | | 6,100 | | | | 230,153 | |
Vistra Corp. | | | 12,900 | | | | 228,072 | |
Power Assets Holdings Ltd. | | | 22,400 | | | | 132,265 | |
Pinnacle West Capital Corp. | | | 1,600 | | | | 130,160 | |
Edison International | | | 2,200 | | | | 128,920 | |
UGI Corp. | | | 3,100 | | | | 127,131 | |
Total Utilities | | | | | | | 3,675,785 | |
| | | | | | | | | |
Consumer, Cyclical - 4.9% |
Walgreens Boots Alliance, Inc. | | | 7,800 | | | | 428,220 | |
Subaru Corp. | | | 18,300 | | | | 364,258 | |
Costco Wholesale Corp. | | | 1,000 | | | | 352,480 | |
Persimmon plc | | | 8,000 | | | | 324,230 | |
Berkeley Group Holdings plc | | | 4,100 | | | | 250,835 | |
Honda Motor Co., Ltd. | | | 8,000 | | | | 239,797 | |
Electrolux AB | | | 8,100 | | | | 224,694 | |
Tesla, Inc.* | | | 300 | | | | 200,379 | |
Wesfarmers Ltd. | | | 4,000 | | | | 160,055 | |
Total Consumer, Cyclical | | | | | | | 2,544,948 | |
| | | | | | | | | |
Energy - 2.6% |
ENEOS Holdings, Inc. | | | 70,200 | | | | 318,010 | |
Idemitsu Kosan Company Ltd. | | | 11,000 | | | | 283,526 | |
TC Energy Corp. | | | 5,000 | | | | 229,263 | |
DCC plc | | | 2,400 | | | | 208,103 | |
Pembina Pipeline Corp. | | | 5,000 | | | | 144,458 | |
SolarEdge Technologies, Inc.* | | | 500 | | | | 143,720 | |
Total Energy | | | | | | | 1,327,080 | |
| | | | | | | | | |
Diversified - 0.8% |
CK Hutchison Holdings Ltd. | | | 49,501 | | | | 394,492 | |
| | | | | | | | | |
Total Common Stocks | | | | |
(Cost $41,623,500) | | | | | | | 49,452,190 | |
| | | | | | | | | |
PREFERRED STOCKS† - 2.0% |
Consumer, Cyclical - 2.0% |
Volkswagen AG | | | 2,100 | | | | 587,547 | |
Porsche Automobil Holding SE | | | 4,400 | | | | 466,520 | |
Total Consumer, Cyclical | | | | | | | 1,054,067 | |
| | | | | | | | | |
Total Preferred Stocks | | | | |
(Cost $668,156) | | | | | | | 1,054,067 | |
| | | | | | | | | |
EXCHANGE-TRADED FUNDS† - 0.7% |
iShares MSCI EAFE ETF | | | 2,284 | | | | 173,287 | |
SPDR S&P 500 ETF Trust | | | 431 | | | | 170,818 | |
Total Exchange-Traded Funds | | | | |
(Cost $341,356) | | | | | | | 344,105 | |
| | | | | | | | | |
MONEY MARKET FUND† - 0.8% |
Goldman Sachs Financial Square Treasury Instruments Fund — Institutional Shares, 0.01%2 | | | 401,098 | | | | 401,098 | |
Total Money Market Fund | | | | |
(Cost $401,098) | | | | | | | 401,098 | |
| | | | | | | | | |
Total Investments - 99.5% | | | | |
(Cost $43,034,110) | | $ | 51,251,460 | |
Other Assets & Liabilities, net - 0.5% | | | 249,515 | |
Total Net Assets - 100.0% | | $ | 51,500,975 | |
SEE NOTES TO FINANCIAL STATEMENTS. | THE GUGGENHEIM FUNDS SEMI-ANNUAL REPORT | 101 |
SCHEDULE OF INVESTMENTS (Unaudited)(concluded) | March 31, 2021 |
WORLD EQUITY INCOME FUND | |
Futures Contracts |
Description | | Number of
Contracts | | | Expiration
Date | | | Notional
Amount | | | Value and
Unrealized
Appreciation** | |
Currency Futures Contracts Sold Short† |
Euro FX Futures Contracts | | | 44 | | | | Jun 2021 | | | $ | 6,458,650 | | | $ | 97,809 | |
Japanese Yen Futures Contracts | | | 26 | | | | Jun 2021 | | | | 2,937,025 | | | | 61,710 | |
Australian Dollar Futures Contracts | | | 1 | | | | Jun 2021 | | | | 75,980 | | | | 102 | |
| | | | | | | | | | | $ | 9,471,655 | | | $ | 159,621 | |
* | Non-income producing security. |
** | Includes cumulative appreciation (depreciation). Variation margin is reported within the Statement of Assets and Liabilities. |
† | Value determined based on Level 1 inputs — See Note 4. |
1 | Security is a 144A or Section 4(a)(2) security. These securities have been determined to be liquid under guidelines established by the Board of Trustees. The total market value of 144A or Section 4(a)(2) securities is $238,676 (cost $259,981), or 0.5% of total net assets. |
2 | Rate indicated is the 7-day yield as of March 31, 2021. |
| | ADR — American Depositary Receipt |
| | plc — Public Limited Company |
| | REIT — Real Estate Investment Trust |
| | |
| | See Sector Classification in Other Information section. |
The following table summarizes the inputs used to value the Fund’s investments at March 31, 2021 (See Note 4 in the Notes to Financial Statements):
Investments in Securities (Assets) | | Level 1
Quoted
Prices | | | Level 2
Significant
Observable
Inputs | | | Level 3
Significant
Unobservable
Inputs | | | Total | |
Common Stocks | | $ | 49,452,190 | | | $ | — | | | $ | — | | | $ | 49,452,190 | |
Preferred Stocks | | | 1,054,067 | | | | — | | | | — | | | | 1,054,067 | |
Exchange-Traded Funds | | | 344,105 | | | | — | | | | — | | | | 344,105 | |
Money Market Fund | | | 401,098 | | | | — | | | | — | | | | 401,098 | |
Currency Futures Contracts** | | | 159,621 | | | | — | | | | — | | | | 159,621 | |
Total Assets | | $ | 51,411,081 | | | $ | — | | | $ | — | | | $ | 51,411,081 | |
** | This derivative is reported as unrealized appreciation/depreciation at period end. |
102 | THE GUGGENHEIM FUNDS SEMI-ANNUAL REPORT | SEE NOTES TO FINANCIAL STATEMENTS. |
STATEMENT OF ASSETS AND LIABILITIES (Unaudited) |
March 31, 2021 |
Assets: |
Investments, at value (cost $43,034,110) | | $ | 51,251,460 | |
Foreign currency, at value (cost $664) | | | 661 | |
Cash | | | 42,279 | |
Segregated cash with broker | | | 153,000 | |
Prepaid expenses | | | 35,084 | |
Receivables: |
Dividends | | | 160,455 | |
Foreign tax reclaims | | | 83,635 | |
Variation margin on futures contracts | | | 6,332 | |
Fund shares sold | | | 1,073 | |
Total assets | | | 51,733,979 | |
| | | | | |
Liabilities: |
Payable for: |
Fund shares redeemed | | | 66,289 | |
Securities purchased | | | 58,382 | |
Professional fees | | | 22,474 | |
Management fees | | | 20,899 | |
Pricing fees | | | 12,426 | |
Distribution and service fees | | | 12,199 | |
Printing fees | | | 11,899 | |
Transfer agent/maintenance fees | | | 10,433 | |
Fund accounting/administration fees | | | 5,870 | |
Distributions to shareholders | | | 5,697 | |
Trustees’ fees* | | | 1,400 | |
Due to Investment Adviser | | | 455 | |
Miscellaneous | | | 4,581 | |
Total liabilities | | | 233,004 | |
Net assets | | $ | 51,500,975 | |
| | | | | |
Net assets consist of: |
Paid in capital | | $ | 37,109,578 | |
Total distributable earnings (loss) | | | 14,391,397 | |
Net assets | | $ | 51,500,975 | |
| | | | | |
A-Class: |
Net assets | | $ | 45,001,134 | |
Capital shares outstanding | | | 2,434,321 | |
Net asset value per share | | $ | 18.49 | |
Maximum offering price per share (Net asset value divided by 95.25%) | | $ | 19.41 | |
| | | | | |
C-Class: |
Net assets | | $ | 3,331,904 | |
Capital shares outstanding | | | 210,685 | |
Net asset value per share | | $ | 15.81 | |
| | | | | |
P-Class: |
Net assets | | $ | 111,398 | |
Capital shares outstanding | | | 5,971 | |
Net asset value per share | | $ | 18.66 | |
| | | | | |
Institutional Class: |
Net assets | | $ | 3,056,539 | |
Capital shares outstanding | | | 166,404 | |
Net asset value per share | | $ | 18.37 | |
* | Relates to Trustees not deemed “interested persons” within the meaning of Section 2(a)(19) of the 1940 Act. |
SEE NOTES TO FINANCIAL STATEMENTS. | THE GUGGENHEIM FUNDS SEMI-ANNUAL REPORT | 103 |
STATEMENT OF OPERATIONS (Unaudited) |
Six Months Ended March 31, 2021 |
Investment Income: |
Dividends (net of foreign withholding tax of $24,602) | | $ | 531,120 | |
Total investment income | | | 531,120 | |
| | | | | |
Expenses: |
Management fees | | | 164,818 | |
Distribution and service fees: |
A-Class | | | 51,514 | |
C-Class | | | 15,233 | |
P-Class | | | 109 | |
Transfer agent/maintenance fees: |
A-Class | | | 13,882 | |
C-Class | | | 2,313 | |
P-Class | | | 78 | |
Institutional Class | | | 619 | |
Registration fees | | | 45,425 | |
Professional fees | | | 24,953 | |
Fund accounting/administration fees | | | 20,384 | |
Trustees’ fees* | | | 9,428 | |
Custodian fees | | | 6,987 | |
Line of credit fees | | | 780 | |
Interest expense | | | 6 | |
Miscellaneous | | | 5,909 | |
Recoupment of previously waived fees: |
Institutional Class | | | 455 | |
Total expenses | | | 362,893 | |
Less: |
Expenses reimbursed by Adviser: |
A-Class | | | (14,138 | ) |
C-Class | | | (2,349 | ) |
P-Class | | | (79 | ) |
Institutional Class | | | (1,086 | ) |
Expenses waived by Adviser | | | (52,529 | ) |
Total waived/reimbursed expenses | | | (70,181 | ) |
Net expenses | | | 292,712 | |
Net investment income | | | 238,408 | |
| | | | | |
Net Realized and Unrealized Gain (Loss): |
Net realized gain (loss) on: |
Investments | | $ | 6,483,358 | |
Futures contracts | | | (36,003 | ) |
Foreign currency transactions | | | 994 | |
Net realized gain | | | 6,448,349 | |
Net change in unrealized appreciation (depreciation) on: |
Investments | | | 3,341,133 | |
Futures contracts | | | 159,621 | |
Foreign currency translations | | | (3,156 | ) |
Net change in unrealized appreciation (depreciation) | | | 3,497,598 | |
Net realized and unrealized gain | | | 9,945,947 | |
Net increase in net assets resulting from operations | | $ | 10,184,355 | |
* | Relates to Trustees not deemed “interested persons” within the meaning of Section 2(a)(19) of the 1940 Act. |
104 | THE GUGGENHEIM FUNDS SEMI-ANNUAL REPORT | SEE NOTES TO FINANCIAL STATEMENTS. |
STATEMENTS OF CHANGES IN NET ASSETS |
| | Six Months Ended
March 31, 2021
(Unaudited) | | | Year Ended
September 30,
2020 | |
Increase (Decrease) in Net Assets from Operations: | | | | | | | | |
Net investment income | | $ | 238,408 | | | $ | 703,779 | |
Net realized gain on investments | | | 6,448,349 | | | | 80,940 | |
Net change in unrealized appreciation (depreciation) on investments | | | 3,497,598 | | | | 790,841 | |
Net increase in net assets resulting from operations | | | 10,184,355 | | | | 1,575,560 | |
| | | | | | | | | |
Distributions to shareholders: | | | | | | | | |
A-Class | | | (376,291 | ) | | | (951,321 | ) |
C-Class | | | (18,476 | ) | | | (41,581 | ) |
P-Class | | | (789 | ) | | | (2,112 | ) |
Institutional Class | | | (28,731 | ) | | | (69,164 | ) |
Total distributions to shareholders | | | (424,287 | ) | | | (1,064,178 | ) |
| | | | | | | | | |
Capital share transactions: | | | | | | | | |
Proceeds from sale of shares | | | | | | | | |
A-Class | | | 1,045,037 | | | | 1,840,975 | |
C-Class | | | 434,634 | | | | 262,757 | |
P-Class | | | 18,071 | | | | 19,559 | |
Institutional Class | | | 279,588 | | | | 722,745 | |
Distributions reinvested | | | | | | | | |
A-Class | | | 366,799 | | | | 941,400 | |
C-Class | | | 18,307 | | | | 40,533 | |
P-Class | | | 789 | | | | 2,112 | |
Institutional Class | | | 28,519 | | | | 68,744 | |
Cost of shares redeemed | | | | | | | | |
A-Class | | | (2,862,341 | ) | | | (26,256,691 | ) |
C-Class | | | (647,795 | ) | | | (701,424 | ) |
P-Class | | | (19,074 | ) | | | (56,772 | ) |
Institutional Class | | | (332,567 | ) | | | (1,575,677 | ) |
Net decrease from capital share transactions | | | (1,670,033 | ) | | | (24,691,739 | ) |
Net increase (decrease) in net assets | | | 8,090,035 | | | | (24,180,357 | ) |
| | | | | | | | | |
Net assets: | | | | | | | | |
Beginning of period | | | 43,410,940 | | | | 67,591,297 | |
End of period | | $ | 51,500,975 | | | $ | 43,410,940 | |
| | | | | | | | | |
Capital share activity: | | | | | | | | |
Shares sold | | | | | | | | |
A-Class | | | 61,666 | | | | 123,067 | |
C-Class | | | 28,636 | | | | 19,865 | |
P-Class | | | 976 | | | | 1,224 | |
Institutional Class | | | 16,964 | | | | 49,008 | |
Shares issued from reinvestment of distributions | | | | | | | | |
A-Class | | | 21,184 | | | | 63,949 | |
C-Class | | | 1,250 | | | | 3,191 | |
P-Class | | | 45 | | | | 142 | |
Institutional Class | | | 1,652 | | | | 4,753 | |
Shares redeemed | | | | | | | | |
A-Class | | | (170,552 | ) | | | (1,639,516 | ) |
C-Class | | | (44,003 | ) | | | (55,988 | ) |
P-Class | | | (1,231 | ) | | | (3,569 | ) |
Institutional Class | | | (20,453 | ) | | | (113,599 | ) |
Net decrease in shares | | | (103,866 | ) | | | (1,547,473 | ) |
SEE NOTES TO FINANCIAL STATEMENTS. | THE GUGGENHEIM FUNDS SEMI-ANNUAL REPORT | 105 |
This table is presented to show selected data for a share outstanding throughout each period and to assist shareholders in evaluating a Fund’s performance for the periods presented.
A-Class | | Six Months Ended
March 31, 2021a | | | Year Ended
September 30,
2020 | | | Year Ended
September 30,
2019 | | | Year Ended
September 30,
2018 | | | Year Ended
September 30,
2017 | | | Year Ended
September 30,
2016 | |
Per Share Data |
Net asset value, beginning of period | | $ | 15.03 | | | $ | 15.26 | | | $ | 15.77 | | | $ | 14.84 | | | $ | 13.54 | | | $ | 12.28 | |
Income (loss) from investment operations: |
Net investment income (loss)b | | | .09 | | | | .20 | | | | .35 | | | | .23 | | | | .31 | | | | .31 | |
Net gain (loss) on investments (realized and unrealized) | | | 3.52 | | | | (.12 | )h | | | (.36 | ) | | | .95 | | | | 1.34 | | | | 1.26 | |
Total from investment operations | | | 3.61 | | | | .08 | | | | (.01 | ) | | | 1.18 | | | | 1.65 | | | | 1.57 | |
Less distributions from: |
Net investment income | | | (.12 | ) | | | (.27 | ) | | | (.37 | ) | | | (.25 | ) | | | (.35 | ) | | | (.31 | ) |
Net realized gains | | | (.03 | ) | | | (.04 | ) | | | (.13 | ) | | | — | | | | — | | | | — | |
Total distributions | | | (.15 | ) | | | (.31 | ) | | | (.50 | ) | | | (.25 | ) | | | (.35 | ) | | | (.31 | ) |
Net asset value, end of period | | $ | 18.49 | | | $ | 15.03 | | | $ | 15.26 | | | $ | 15.77 | | | $ | 14.84 | | | $ | 13.54 | |
|
Total Returnc | | | 24.11 | % | | | 0.60 | % | | | 0.14 | % | | | 8.01 | % | | | 12.31 | % | | | 12.85 | % |
Ratios/Supplemental Data |
Net assets, end of period (in thousands) | | $ | 45,001 | | | $ | 37,911 | | | $ | 60,639 | | | $ | 67,679 | | | $ | 80,598 | | | $ | 80,575 | |
Ratios to average net assets: |
Net investment income (loss) | | | 1.04 | % | | | 1.36 | % | | | 2.39 | % | | | 1.48 | % | | | 2.23 | % | | | 2.36 | % |
Total expensesd | | | 1.50 | % | | | 1.48 | % | | | 1.37 | % | | | 1.37 | % | | | 1.34 | % | | | 1.48 | % |
Net expensese,f,g | | | 1.21 | % | | | 1.22 | % | | | 1.22 | % | | | 1.22 | % | | | 1.24 | % | | | 1.48 | % |
Portfolio turnover rate | | | 107 | % | | | 192 | % | | | 127 | % | | | 125 | % | | | 94 | % | | | 51 | % |
C-Class | | Six Months Ended
March 31, 2021a | | | Year Ended
September 30,
2020 | | | Year Ended
September 30,
2019 | | | Year Ended
September 30,
2018 | | | Year Ended
September 30,
2017 | | | Year Ended
September 30,
2016 | |
Per Share Data |
Net asset value, beginning of period | | $ | 12.87 | | | $ | 13.06 | | | $ | 13.53 | | | $ | 12.72 | | | $ | 11.63 | | | $ | 10.55 | |
Income (loss) from investment operations: |
Net investment income (loss)b | | | .02 | | | | .08 | | | | .21 | | | | .09 | | | | .19 | | | | .18 | |
Net gain (loss) on investments (realized and unrealized) | | | 3.01 | | | | (.10 | )h | | | (.33 | ) | | | .83 | | | | 1.13 | | | | 1.09 | |
Total from investment operations | | | 3.03 | | | | (.02 | ) | | | (.12 | ) | | | .92 | | | | 1.32 | | | | 1.27 | |
Less distributions from: |
Net investment income | | | (.06 | ) | | | (.13 | ) | | | (.22 | ) | | | (.11 | ) | | | (.23 | ) | | | (.19 | ) |
Net realized gains | | | (.03 | ) | | | (.04 | ) | | | (.13 | ) | | | — | | | | — | | | | — | |
Total distributions | | | (.09 | ) | | | (.17 | ) | | | (.35 | ) | | | (.11 | ) | | | (.23 | ) | | | (.19 | ) |
Net asset value, end of period | | $ | 15.81 | | | $ | 12.87 | | | $ | 13.06 | | | $ | 13.53 | | | $ | 12.72 | | | $ | 11.63 | |
|
Total Returnc | | | 23.58 | % | | | (0.13 | %) | | | (0.69 | %) | | | 7.27 | % | | | 11.46 | % | | | 12.05 | % |
Ratios/Supplemental Data |
Net assets, end of period (in thousands) | | $ | 3,332 | | | $ | 2,893 | | | $ | 3,366 | | | $ | 4,215 | | | $ | 6,449 | | | $ | 5,455 | |
Ratios to average net assets: |
Net investment income (loss) | | | 0.31 | % | | | 0.67 | % | | | 1.64 | % | | | 0.71 | % | | | 1.53 | % | | | 1.59 | % |
Total expensesd | | | 2.34 | % | | | 2.40 | % | | | 2.28 | % | | | 2.18 | % | | | 2.19 | % | | | 2.35 | % |
Net expensese,f,g | | | 1.96 | % | | | 1.97 | % | | | 1.97 | % | | | 1.97 | % | | | 1.99 | % | | | 2.23 | % |
Portfolio turnover rate | | | 107 | % | | | 192 | % | | | 127 | % | | | 125 | % | | | 94 | % | | | 51 | % |
106 | THE GUGGENHEIM FUNDS SEMI-ANNUAL REPORT | SEE NOTES TO FINANCIAL STATEMENTS. |
FINANCIAL HIGHLIGHTS (continued) |
This table is presented to show selected data for a share outstanding throughout each period and to assist shareholders in evaluating a Fund’s performance for the periods presented.
P-Class | | Six Months Ended
March 31, 2021a | | | Year Ended
September 30,
2020 | | | Year Ended
September 30,
2019 | | | Year Ended
September 30,
2018 | | | Year Ended
September 30,
2017 | | | Year Ended
September 30,
2016 | |
Per Share Data |
Net asset value, beginning of period | | $ | 15.17 | | | $ | 15.38 | | | $ | 15.92 | | | $ | 15.08 | | | $ | 13.73 | | | $ | 12.33 | |
Income (loss) from investment operations: |
Net investment income (loss)b | | | .09 | | | | .20 | | | | .36 | | | | .24 | | | | .33 | | | | .33 | |
Net gain (loss) on investments (realized and unrealized) | | | 3.55 | | | | (.11 | )h | | | (.39 | ) | | | .95 | | | | 1.35 | | | | 1.35 | |
Total from investment operations | | | 3.64 | | | | .09 | | | | (.03 | ) | | | 1.19 | | | | 1.68 | | | | 1.68 | |
Less distributions from: |
Net investment income | | | (.12 | ) | | | (.26 | ) | | | (.38 | ) | | | (.35 | ) | | | (.33 | ) | | | (.28 | ) |
Net realized gains | | | (.03 | ) | | | (.04 | ) | | | (.13 | ) | | | — | | | | — | | | | — | |
Total distributions | | | (.15 | ) | | | (.30 | ) | | | (.51 | ) | | | (.35 | ) | | | (.33 | ) | | | (.28 | ) |
Net asset value, end of period | | $ | 18.66 | | | $ | 15.17 | | | $ | 15.38 | | | $ | 15.92 | | | $ | 15.08 | | | $ | 13.73 | |
|
Total Return | | | 24.06 | % | | | 0.66 | % | | | 0.06 | % | | | 7.99 | % | | | 12.32 | % | | | 13.73 | % |
Ratios/Supplemental Data |
Net assets, end of period (in thousands) | | $ | 111 | | | $ | 94 | | | $ | 129 | | | $ | 195 | | | $ | 355 | | | $ | 133 | |
Ratios to average net assets: |
Net investment income (loss) | | | 1.08 | % | | | 1.36 | % | | | 2.38 | % | | | 1.50 | % | | | 2.28 | % | | | 2.58 | % |
Total expensesd | | | 1.62 | % | | | 1.56 | % | | | 1.44 | % | | | 1.40 | % | | | 1.76 | % | | | 1.33 | % |
Net expensese,f,g | | | 1.21 | % | | | 1.22 | % | | | 1.22 | % | | | 1.22 | % | | | 1.24 | % | | | 1.33 | % |
Portfolio turnover rate | | | 107 | % | | | 192 | % | | | 127 | % | | | 125 | % | | | 94 | % | | | 51 | % |
SEE NOTES TO FINANCIAL STATEMENTS. | THE GUGGENHEIM FUNDS SEMI-ANNUAL REPORT | 107 |
FINANCIAL HIGHLIGHTS (concluded) |
This table is presented to show selected data for a share outstanding throughout each period and to assist shareholders in evaluating a Fund’s performance for the periods presented.
Institutional Class | | Six Months Ended
March 31, 2021a | | | Year Ended
September 30,
2020 | | | Year Ended
September 30,
2019 | | | Year Ended
September 30,
2018 | | | Year Ended
September 30,
2017 | | | Year Ended
September 30,
2016 | |
Per Share Data |
Net asset value, beginning of period | | $ | 14.94 | | | $ | 15.16 | | | $ | 15.71 | | | $ | 14.74 | | | $ | 13.44 | | | $ | 12.23 | |
Income (loss) from investment operations: |
Net investment income (loss)b | | | .11 | | | | .25 | | | | .39 | | | | .29 | | | | .35 | | | | .31 | |
Net gain (loss) on investments (realized and unrealized) | | | 3.49 | | | | (.13 | )h | | | (.37 | ) | | | .93 | | | | 1.33 | | | | 1.28 | |
Total from investment operations | | | 3.60 | | | | .12 | | | | .02 | | | | 1.22 | | | | 1.68 | | | | 1.59 | |
Less distributions from: |
Net investment income | | | (.14 | ) | | | (.30 | ) | | | (.44 | ) | | | (.25 | ) | | | (.38 | ) | | | (.38 | ) |
Net realized gains | | | (.03 | ) | | | (.04 | ) | | | (.13 | ) | | | — | | | | — | | | | — | |
Total distributions | | | (.17 | ) | | | (.34 | ) | | | (.57 | ) | | | (.25 | ) | | | (.38 | ) | | | (.38 | ) |
Net asset value, end of period | | $ | 18.37 | | | $ | 14.94 | | | $ | 15.16 | | | $ | 15.71 | | | $ | 14.74 | | | $ | 13.44 | |
|
Total Return | | | 24.19 | % | | | 0.92 | % | | | 0.40 | % | | | 8.34 | % | | | 12.61 | % | | | 13.11 | % |
Ratios/Supplemental Data |
Net assets, end of period (in thousands) | | $ | 3,057 | | | $ | 2,513 | | | $ | 3,458 | | | $ | 19,589 | | | $ | 3,734 | | | $ | 2,824 | |
Ratios to average net assets: |
Net investment income (loss) | | | 1.31 | % | | | 1.66 | % | | | 2.67 | % | | | 1.85 | % | | | 2.50 | % | | | 2.42 | % |
Total expensesd | | | 1.26 | % | | | 1.50 | % | | | 1.17 | % | | | 1.02 | % | | | 1.09 | % | | | 1.30 | % |
Net expensese,f,g | | | 0.96 | % | | | 0.97 | % | | | 0.97 | % | | | 0.97 | % | | | 0.98 | % | | | 1.22 | % |
Portfolio turnover rate | | | 107 | % | | | 192 | % | | | 127 | % | | | 125 | % | | | 94 | % | | | 51 | % |
a | Unaudited figures for the period ended March 31, 2021. Percentage amounts for the period, except total return and portfolio turnover rate, have been annualized. |
b | Net investment income (loss) per share was computed using average shares outstanding throughout the period. |
c | Total return does not reflect the impact of any applicable sales charges. |
d | Does not include expenses of the underlying funds in which the Fund invests. |
e | Net expense information reflects the expense ratios after expense waivers and reimbursements, as applicable. |
f | The portion of the ratios of net expenses to average net assets attributable to recoupments of prior fee reductions or expense reimbursements for the periods presented was as follows: |
| | | 03/31/21a | 09/30/20 | 09/30/19 | 09/30/18 | 09/30/17 |
| | A-Class | — | — | 0.00%* | 0.00%* | 0.01% |
| | C-Class | — | — | — | 0.00%* | 0.01% |
| | P-Class | — | — | — | — | — |
| | Institutional Class | 0.03% | — | — | 0.02% | 0.03% |
g | Net expenses may include expenses that are excluded from the expense limitation agreement. Excluding these expenses, the net expense ratios for the periods presented would be: |
| | | 03/31/21a | 09/30/20 | 09/30/19 | 09/30/18 | 09/30/17 | 09/30/16 |
| | A-Class | 1.21% | 1.22% | 1.22% | 1.22% | 1.22% | 1.46% |
| | C-Class | 1.95% | 1.97% | 1.97% | 1.97% | 1.97% | 2.21% |
| | P-Class | 1.21% | 1.22% | 1.22% | 1.22% | 1.22% | 1.32% |
| | Institutional Class | 0.96% | 0.97% | 0.97% | 0.97% | 0.96% | 1.21% |
h | The amount shown for a share outstanding throughout the year does not agree with the aggregate net gain on investments for the year because of the sales and repurchases of fund shares in relation to fluctuating market value of the investments of the Fund. |
108 | THE GUGGENHEIM FUNDS SEMI-ANNUAL REPORT | SEE NOTES TO FINANCIAL STATEMENTS. |
NOTES TO FINANCIAL STATEMENTS (Unaudited) |
Note 1 – Organization and Significant Accounting Policies
Organization
Guggenheim Funds Trust (the “Trust”), a Delaware statutory trust, is registered with the SEC under the Investment Company Act of 1940 (“1940 Act”), as an open-ended investment company of the series type. Each series, in effect, is representing a separate fund (each, a “Fund”). The Trust may issue an unlimited number of authorized shares. The Trust accounts for the assets of each Fund separately.
The Trust offers a combination of five separate classes of shares: A-Class shares, C-Class shares, P-Class shares, R6-Class shares and Institutional Class shares. Sales of shares of each Class are made without a front-end sales charge at the net asset value per share (“NAV”), with the exception of A-Class shares. A-Class shares are sold at the NAV, plus the applicable front-end sales charge. The sales charge varies depending on the amount purchased. A-Class share purchases of $1 million or more are exempt from the front-end sales charge but have a 1% contingent deferred sales charge (“CDSC”), if shares are redeemed within 12 months of purchase. C-Class shares have a 1% CDSC if shares are redeemed within 12 months of purchase. C-Class shares of each Fund automatically convert to A-Class shares of the same Fund on or about the 10th day of the month following the 10-year anniversary of the purchase of the C-Class shares. This conversion will be executed without any sales charge, fee or other charge. After the conversion is completed, the shares will be subject to all features and expenses of A-Class shares. Institutional Class shares are offered primarily for direct investment by institutions such as pension and profit sharing plans, endowments, foundations and corporations. Institutional Class shares require a minimum initial investment of $2 million and a minimum account balance of $1 million. R6-Class shares are offered primarily through qualified retirement and benefit plans. R6-Class shares are also offered through certain other plans and platforms sponsored by financial intermediaries. Certain institutional investors and others deemed appropriate by Guggenheim Investments (“GI”) may also be eligible to purchase R6-Class shares subject to a $2 million minimum initial investment. At March 31, 2021, the Trust consisted of nineteen funds.
This report covers the following funds (collectively, the “Funds”):
Fund Name | Investment
Company Type |
Alpha Opportunity Fund | Diversified |
Large Cap Value Fund | Diversified |
Market Neutral Real Estate Fund | Non-diversified |
Risk Managed Real Estate Fund | Diversified |
Small Cap Value Fund | Diversified |
StylePlus—Large Core Fund | Diversified |
StylePlus—Mid Growth Fund | Diversified |
World Equity Income Fund | Diversified |
At March 31, 2021, only A-Class, C-Class, P-Class and Institutional Class shares have been issued by the Funds.
Security Investors, LLC and Guggenheim Partners Investment Management, LLC (“GPIM”), which operate under the name Guggenheim Investments, provides advisory services. Guggenheim Funds Distributors, LLC (“GFD”) acts as principal underwriter for the Trust. GI and GFD are affiliated entities.
Significant Accounting Policies
The Funds operate as investment companies and, accordingly, follow the investment company accounting and reporting guidance of the Financial Accounting Standards Board (“FASB”) Accounting Standards Codification Topic 946 Financial Services – Investment Companies.
The following significant accounting policies are in conformity with U.S. generally accepted accounting principles (“U.S. GAAP”) and are consistently followed by the Trust. This requires management to make estimates and assumptions that affect the reported amount of assets and liabilities, contingent assets and liabilities at the date of the financial statements, and the reported amounts of revenues and expenses during the reporting period. Actual results could differ from these estimates. All time references are based on Eastern Time.
The NAV of each Class of a fund is calculated by dividing the market value of a fund’s securities and other assets, less all liabilities, attributable to the Class by the number of outstanding shares of the Class.
(a) Valuation of Investments
The Board of Trustees of the Funds (the “Board”) has adopted policies and procedures for the valuation of the Funds’ investments (the “Valuation Procedures”). Pursuant to the Valuation Procedures, the Board has delegated to a valuation committee, consisting of representatives from Guggenheim’s investment management, fund administration, legal and compliance departments (the “Valuation Committee”), the day-to-day responsibility for implementing the Valuation Procedures, including, under most circumstances, the responsibility for determining the fair value of the Funds’ securities and/or other assets.
Valuations of the Funds’ securities and other assets are supplied primarily by pricing services appointed pursuant to the processes set forth in the Valuation Procedures. The Valuation Committee convenes monthly, or more frequently as needed, to review the valuation of all assets which have been fair valued for reasonableness. The Funds’ officers, through the Valuation Committee and consistent with the monitoring and review
| | THE GUGGENHEIM FUNDS SEMI-ANNUAL REPORT | 109 |
NOTES TO FINANCIAL STATEMENTS (Unaudited)(continued) |
responsibilities set forth in the Valuation Procedures, regularly review procedures used and valuations provided by the pricing services.
If the pricing service cannot or does not provide a valuation for a particular investment or such valuation is deemed unreliable, such investment is fair valued by the Valuation Committee.
Equity securities listed or traded on a recognized U.S. securities exchange or the National Association of Securities Dealers Automated Quotations (“NASDAQ”) National Market System shall generally be valued on the basis of the last sale price on the primary U.S. exchange or market on which the security is listed or traded; provided, however, that securities listed on NASDAQ will be valued at the NASDAQ Official Closing Price, which may not necessarily represent the last sale price. If there is no sale on the valuation date, exchange-traded U.S. equity securities will be valued on the basis of the last bid price.
Generally, trading in foreign securities markets is substantially completed each day at various times prior to the close of the New York Stock Exchange (“NYSE”). The values of foreign securities are determined as of the close of such foreign markets or the close of the NYSE, if earlier. All investments quoted in foreign currencies are valued in U.S. dollars on the basis of the foreign currency exchange rates prevailing at the close of U.S. business at 4:00 p.m. Investments in foreign securities may involve risks not present in domestic investments. The Valuation Committee will determine the current value of such foreign securities by taking into consideration certain factors which may include those discussed above, as well as the following factors, among others: the value of the securities traded on other foreign markets, ADR trading, closed-end fund trading, foreign currency exchange activity, and the trading prices of financial products that are tied to foreign securities. In addition, under the Valuation Procedures, the Valuation Committee and GI are authorized to use prices and other information supplied by a third party pricing vendor in valuing foreign securities.
Open-end investment companies are valued at their NAV as of the close of business, on the valuation date. Exchange-traded funds and closed-end investment companies are valued at the last quoted sale price.
The value of futures contracts is accounted for using the unrealized appreciation or depreciation on the contracts that is determined by marking the contracts to their current realized settlement prices. Financial futures contracts are valued at the 4:00 p.m. price on the valuation date. In the event that the exchange for a specific futures contract closes earlier than 4:00 p.m., the futures contract is valued at the official settlement price of the exchange. However, the underlying securities from which the futures contract value is derived are monitored until 4:00 p.m. to determine if fair valuation would provide a more accurate valuation.
The values of swap agreements entered into by a fund are accounted for using the unrealized appreciation or depreciation on the agreements that are determined by marking the agreements to the last quoted value of the index or other underlying position that the swaps pertain to at the close of the New York Stock Exchange (“NYSE”).
Investments for which market quotations are not readily available are fair-valued as determined in good faith by GI, subject to review and approval by the Valuation Committee, pursuant to methods established or ratified by the Board. Valuations in accordance with these methods are intended to reflect each security’s (or asset’s or liability’s) “fair value”. Each such determination is based on a consideration of all relevant factors, which are likely to vary from one pricing context to another. Examples of such factors may include, but are not limited to market prices; sale prices; broker quotes; and models which derive prices based on inputs such as prices of securities with comparable maturities and characteristics, or based on inputs such as anticipated cash flows or collateral, spread over U.S. Treasury securities, and other information analysis. In connection with futures contracts and other derivative investments, such factors may include obtaining information as to how (a) these contracts and other derivative investments trade in the futures or other derivative markets, respectively, and (b) the securities underlying these contracts and other derivative investments trade in the cash market.
(b) Short Sales
When a Fund engages in a short sale of a security, an amount equal to the proceeds is reflected as an asset and an equivalent liability. The amount of the liability is subsequently marked-to-market to reflect the market value of the short sale. The Fund maintains a segregated account of cash and/or securities as collateral for short sales.
Fees, if any, paid to brokers to borrow securities in connection with short sales are recorded as interest expense. In addition, the Fund must pay out the dividend rate of the equity or coupon rate of the obligation to the lender and record this as an expense. Short dividend or interest expense is a cost associated with the investment objective of short sales transactions, rather than an operational cost associated with the day-to-day management of any mutual fund. The Fund may also receive rebate income from the broker resulting from the investment of the proceeds from securities sold short.
(c) Futures Contracts
Upon entering into a futures contract, a Fund deposits and maintains as collateral such initial margin as required by the exchange on which the transaction is affected. Pursuant to the contract, the Fund agrees to receive from or pay to the broker an amount of cash equal to the daily fluctuation in value of the
110 | THE GUGGENHEIM FUNDS SEMI-ANNUAL REPORT | |
NOTES TO FINANCIAL STATEMENTS (Unaudited)(continued) |
contract. Such receipts or payments are known as variation margin and are recorded by the Fund as unrealized appreciation or depreciation. When the contract is closed, the Fund records a realized gain or loss equal to the difference between the value of the contract at the time it was opened and the value at the time it was closed.
(d) Swap Agreements
Swap agreements are marked-to-market daily and the change, if any, is recorded as unrealized appreciation or depreciation. Payments received or made as a result of an agreement or termination of an agreement are recognized as realized gains or losses.
(e) Currency Translations
The accounting records of the Funds are maintained in U.S. dollars. All assets and liabilities initially expressed in foreign currencies are converted into U.S. dollars at prevailing exchange rates. Purchases and sales of investment securities, dividend and interest income, and certain expenses are translated at the rates of exchange prevailing on the respective dates of such transactions. Changes in the relationship of these foreign currencies to the U.S. dollar can significantly affect the value of the investments and earnings of the Funds. Foreign investments may also subject the Funds to foreign government exchange restrictions, expropriation, taxation, or other political, social or economic developments, all of which could affect the market and/or credit risk of the investments.
The Funds do not isolate that portion of the results of operations resulting from changes in the foreign exchange rates on investments from the fluctuations arising from changes in the market prices of securities held. Such fluctuations are included with the net realized gain or loss and unrealized appreciation or depreciation on investments.
Reported net realized foreign exchange gains and losses arise from sales of foreign currencies and currency gains or losses realized between the trade and settlement dates on investment transactions. Net unrealized appreciation and depreciation arise from changes in the fair values of assets and liabilities other than investments in securities at the fiscal period end, resulting from changes in exchange rates.
(f) Foreign Taxes
The Funds may be subject to foreign taxes (a portion of which may be reclaimable) on income, stock dividends, capital gains on investments or certain foreign currency transactions. All foreign taxes are recorded in accordance with the applicable foreign tax regulations and rates that exist in the foreign jurisdictions in which the Funds invest. These foreign taxes, if any, are paid by the Funds and reflected in their Statements of Operations as follows: foreign taxes withheld at source are presented as a reduction of income and foreign taxes on capital gains from sales of investments are included with the net realized gain (loss) on investments. Foreign taxes payable or deferred as of March 31, 2021, if any, are disclosed in the Funds’ Statements of Assets and Liabilities.
(g) Security Transactions
Security transactions are recorded on the trade date for financial reporting purposes. Realized gains and losses from securities transactions are recorded using the identified cost basis. Proceeds from lawsuits related to investment holdings are recorded as a reduction to cost if the securities are still held and as realized gains if no longer held in the respective Fund. Taxable non-cash dividends are recorded as dividend income. Interest income, including amortization of premiums and accretion of discounts, is accrued on a daily basis. Amendment fees are earned as compensation for evaluating and accepting changes to the original loan agreement and are recognized when received. Dividend income from Real Estate Investment Trusts (“REITs”) is recorded based on the income included in the distributions received from the REIT investments using published REIT classifications, including some management estimates when actual amounts are not available. Distributions received in excess of this estimated amount are recorded as a reduction of the cost of investments or reclassified to realized gains. The actual amounts of income, return of capital, and realized gains are only determined by each REIT after its fiscal year-end, and may differ from the estimated amounts.
(h) Distributions
Dividends from net investment income are declared quarterly in the World Equity Income Fund and Risk Managed Real Estate Fund. Dividends are reinvested in additional shares, unless shareholders request payment in cash. Distributions of net investment income in the remaining Funds and distributions of net realized gains, if any, in all Funds are declared at least annually and recorded on the ex-dividend date and are determined in accordance with U.S. federal income tax regulations which may differ from U.S. GAAP.
(i) Class Allocations
Interest and dividend income, most expenses, all realized gains and losses, and all unrealized appreciation and depreciation are allocated to the classes based upon the value of the outstanding shares in each Class. Certain costs, such as distribution and service fees are charged directly to specific classes. In addition, certain expenses have been allocated to the individual Funds in the Trust based on the respective net assets of each Fund included in the Trust.
| | THE GUGGENHEIM FUNDS SEMI-ANNUAL REPORT | 111 |
NOTES TO FINANCIAL STATEMENTS (Unaudited)(continued) |
(j) Earnings Credits
Under the fee arrangement with the custodian, the Funds may earn credits based on overnight custody cash balances. These credits are utilized to reduce related custodial expenses. The custodian fees disclosed in the Statements of Operations are before the reduction in expense from the related earnings credits, if any. Earnings credits for the period ended March 31, 2021, are disclosed in the Statements of Operations.
(k) Cash
The Funds may leave cash overnight in their cash account with the custodian. Periodically, a Fund may have cash due to the custodian bank as an overdraft balance. A fee is incurred on this overdraft, calculated by multiplying the overdraft by a rate based on the federal funds rate, which was 0.06% at March 31, 2021.
(l) Indemnifications
Under the Funds’ organizational documents, the Trustees and Officers are indemnified against certain liabilities arising out of the performance of their duties to the Trust. In addition, throughout the normal course of business, the Funds enter into contracts that contain a variety of representations and warranties which provide general indemnifications. The Funds’ maximum exposure under these arrangements is unknown, as this would involve future claims that may be made against the Funds and/or their affiliates that have not yet occurred. However, based on experience, the Funds expect the risk of loss to be remote.
Note 2 – Financial Instruments and Derivatives
As part of their investment strategy, the Funds may utilize short sales and a variety of derivative instruments. These investments involve, to varying degrees, elements of market risk and risks in excess of amounts recognized on the Statements of Assets and Liabilities. Valuation and accounting treatment of these instruments can be found under Significant Accounting Policies in Note 1 of these Notes to Financial Statements.
Short Sales
A short sale is a transaction in which a Fund sells a security it does not own. If the security sold short decreases in price between the time the Fund sells the security and closes its short position, the Fund will realize a gain on the transaction. Conversely, if the security increases in price during the period, the Fund will realize a loss on the transaction. The risk of such price increases is the principal risk of engaging in short sales.
Derivatives
Derivatives are instruments whose values depend on, or are derived from, in whole or in part, the value of one or more other assets, such as securities, currencies, commodities or indices. Derivative instruments may be used to increase investment flexibility (including to maintain cash reserves while maintaining exposure to certain other assets), for risk management (hedging) purposes, to facilitate trading, to reduce transaction costs and to pursue higher investment returns. Derivative instruments may also be used to mitigate certain investment risks, such as foreign currency exchange rate risk, interest rate risk and credit risk. U.S. GAAP requires disclosures to enable investors to better understand how and why a Fund uses derivative instruments, how these derivative instruments are accounted for and their effects on the Fund’s financial position and results of operations.
The Funds may utilize derivatives for the following purposes:
Hedge: an investment made in order to reduce the risk of adverse price movements in a security, by taking an offsetting position to protect against broad market moves.
Index Exposure: the use of an instrument to obtain exposure to a listed or other type of index.
Leverage: gaining total exposure to equities or other assets on the long and short sides at greater than 100% of invested capital.
For any Fund whose investment strategy consistently involves applying leverage, the value of the Fund’s shares will tend to increase or decrease more than the value of any increase or decrease in the underlying index or other asset. In addition, because an investment in derivative instruments generally requires a small investment relative to the amount of investment exposure assumed, an opportunity for increased net income is created; but, at the same time, leverage risk will increase. The Fund’s use of leverage, through borrowings or instruments such as derivatives, may cause the Fund to be more volatile and riskier than if they had not been leveraged.
Futures Contracts
A futures contract is an agreement to purchase (long) or sell (short) an agreed amount of securities or other instruments at a set price for delivery at a future date. There are significant risks associated with a Fund’s use of futures contracts, including (i) there may be an imperfect or no correlation between the changes in market value of the underlying asset and the prices of futures contracts; (ii) there may not be a liquid secondary market for a futures contract; (iii) trading restrictions or limitations may be imposed by an exchange; and (iv) government regulations may restrict trading in futures contracts. When investing in futures, there is minimal counterparty credit risk to a Fund because futures
112 | THE GUGGENHEIM FUNDS SEMI-ANNUAL REPORT | |
NOTES TO FINANCIAL STATEMENTS (Unaudited)(continued) |
are exchange-traded and the exchange’s clearinghouse, as counterparty to all exchange-traded futures, guarantees against default. Cash deposits are shown as segregated cash with broker on the Statements of Assets and Liabilities; securities held as collateral are noted on the Schedules of Investments.
The following table represents the Funds’ use and volume of futures on a monthly basis:
| | | | Average Notional Amount | |
Fund | Use | | Long | | | Short | |
StylePlus—Large Core Fund | Index exposure | | $ | 3,714,144 | | | $ | — | |
StylePlus—Mid Growth Fund | Index exposure | | | 2,647,696 | | | | — | |
World Equity Income Fund | Hedge | | | — | | | | 2,036,004 | |
Swap Agreements
A swap is an agreement that obligates two parties to exchange a series of cash flows at specified intervals based upon or calculated by reference to changes in specified prices or rates for a specified amount of an underlying asset. When utilizing over-the-counter (“OTC”) swaps, a fund bears the risk of loss of the amount expected to be received under a swap agreement in the event of the default or bankruptcy of a swap agreement counterparty or if the underlying asset declines in value. Certain standardized swaps are subject to mandatory central clearing and are executed on a multi-lateral or other trade facility platform, such as a registered exchange. There is limited counterparty credit risk with respect to centrally-cleared swaps as the transaction is facilitated through a central clearinghouse, much like exchange-traded futures contracts. For a fund utilizing centrally-cleared swaps, the exchange bears the risk of loss resulting from a counterparty not being able to pay. There is no guarantee that a fund or an underlying fund could eliminate its exposure under an outstanding swap agreement by entering into an offsetting swap agreement with the same or another party.
Total return and custom basket swaps involve commitments where single or multiple cash flows are exchanged based on the price of an underlying reference asset (such as an index or custom basket of securities) for a fixed or variable interest rate. Total return and custom basket swaps will usually be computed based on the current value of the reference asset as of the close of regular trading on the NYSE or other exchange, with the swap value being adjusted to include dividends accrued, financing charges and/or interest associated with the swap agreement. When utilizing total return or custom basket swaps, a fund bears the risk of loss of the amount expected to be received under a swap agreement in the event of the default or bankruptcy of a swap agreement counterparty or if the underlying reference asset declines in value.
The following table represents the Funds’ use and volume of total return swaps on a monthly basis:
| | | | Average Notional Amount | |
Fund | Use | | Long | | | Short | |
StylePlus—Large Core Fund | Index exposure | | $ | 185,499,771 | | | $ | — | |
StylePlus—Mid Growth Fund | Index exposure | | | 85,983,541 | | | | — | |
The following table represents the Funds’ use and volume of custom basket swaps on a monthly basis:
| | | | Average Notional Amount | |
Fund | Use | | Long | | | Short | |
Alpha Opportunity Fund | Hedge, Leverage | | $ | 5,252,718 | | | $ | 26,870,883 | |
Market Neutral Real Estate Fund | Hedge | | | — | | | | 37,134,825 | |
Risk Managed Real Estate Fund | Hedge, Leverage | | | 68,589,776 | | | | 58,071,921 | |
Derivative Investment Holdings Categorized by Risk Exposure
The following is a summary of the location of derivative investments on the Funds’ Statements of Assets and Liabilities as of March 31, 2021:
Derivative Investment Type | Asset Derivatives | Liability Derivatives |
Equity/Currency contracts | Variation margin on futures contracts | |
Equity contracts | Unrealized appreciation on OTC swap agreements | Unrealized depreciation on OTC swap agreements |
| | THE GUGGENHEIM FUNDS SEMI-ANNUAL REPORT | 113 |
NOTES TO FINANCIAL STATEMENTS (Unaudited)(continued) |
The following tables set forth the fair value of the Funds’ derivative investments categorized by primary risk exposure at March 31, 2021:
Asset Derivative Investments Value |
Fund | | Futures
Equity
Risk* | | | Swaps
Equity
Risk | | | Futures
Foreign
Currency
Exchange
Risk* | | | Total Value at
March 31,
2021 | |
Alpha Opportunity Fund | | $ | — | | | $ | 679,482 | | | $ | — | | | $ | 679,482 | |
Risk Managed Real Estate Fund | | | — | | | | 7,250,075 | | | | — | | | | 7,250,075 | |
StylePlus—Large Core Fund | | | 4,033 | | | | 36,527,373 | | | | — | | | | 36,531,406 | |
StylePlus—Mid Growth Fund | | | 2,420 | | | | 13,076,122 | | | | — | | | | 13,078,542 | |
World Equity Income Fund | | | — | | | | — | | | | 159,621 | | | | 159,621 | |
Liability Derivative Investments Value |
Fund | | Futures
Equity
Risk* | | | Swaps
Equity
Risk | | | Futures
Foreign
Currency
Exchange
Risk* | | | Total Value at
March 31,
2021 | |
Alpha Opportunity Fund | | $ | — | | | $ | 3,153,034 | | | $ | — | | | $ | 3,153,034 | |
Market Neutral Real Estate Fund | | | — | | | | 3,268,167 | | | | — | | | | 3,268,167 | |
Risk Managed Real Estate Fund | | | — | | | | 4,618,322 | | | | — | | | | 4,618,322 | |
StylePlus—Mid Growth Fund | | | 42,875 | | | | — | | | | — | | | | 42,875 | |
* | Includes cumulative appreciation (depreciation) of exchange-traded, OTC and centrally-cleared derivatives contracts as reported on the Schedules of Investments. For exchange-traded and centrally-cleared derivatives, variation margin is reported within the Statements of Assets and Liabilities. |
The following is a summary of the location of derivative investments on the Funds’ Statements of Operations for the period ended March 31, 2021:
Derivative Investment Type | Location of Gain (Loss) on Derivatives |
Equity/Currency contracts | Net realized gain (loss) on futures contracts |
| Net change in unrealized appreciation (depreciation) on futures contracts |
Equity contracts | Net realized gain (loss) on swap agreements |
| Net change in unrealized appreciation (depreciation) on swap agreements |
The following is a summary of the Funds’ realized gain (loss) and change in unrealized appreciation (depreciation) on derivative investments recognized on the Statements of Operations categorized by primary risk exposure for the period ended March 31, 2021:
Realized Gain (Loss) on Derivative Investments Recognized on the Statements of Operations |
Fund | | Futures
Equity
Risk | | | Swaps
Equity
Risk | | | Futures
Foreign
Currency
Exchange
Risk | | | Total | |
Alpha Opportunity Fund | | $ | — | | | $ | (4,057,635 | ) | | $ | — | | | $ | (4,057,635 | ) |
Market Neutral Real Estate Fund | | | — | | | | (6,416,893 | ) | | | — | | | | (6,416,893 | ) |
Risk Managed Real Estate Fund | | | — | | | | 135,818 | | | | — | | | | 135,818 | |
StylePlus—Large Core Fund | | | 787,541 | | | | 17,399,606 | | | | — | | | | 18,187,147 | |
StylePlus—Mid Growth Fund | | | 565,139 | | | | 15,473,393 | | | | — | | | | 16,038,532 | |
World Equity Income Fund | | | — | | | | — | | | | (36,003 | ) | | | (36,003 | ) |
114 | THE GUGGENHEIM FUNDS SEMI-ANNUAL REPORT | |
NOTES TO FINANCIAL STATEMENTS (Unaudited)(continued) |
Change in Unrealized Appreciation (Depreciation) on Derivative Investments Recognized on the Statements of Operations |
Fund | | Futures
Equity
Risk | | | Swaps
Equity
Risk | | | Futures
Foreign
Currency
Exchange
Risk | | | Total | |
Alpha Opportunity Fund | | $ | — | | | $ | (1,467,379 | ) | | $ | — | | | $ | (1,467,379 | ) |
Market Neutral Real Estate Fund | | | — | | | | (3,288,153 | ) | | | — | | | | (3,288,153 | ) |
Risk Managed Real Estate Fund | | | — | | | | 413,080 | | | | — | | | | 413,080 | |
StylePlus—Large Core Fund | | | 72,035 | | | | 14,341,054 | | | | — | | | | 14,413,089 | |
StylePlus—Mid Growth Fund | | | (7,077 | ) | | | (1,176,976 | ) | | | — | | | | (1,184,053 | ) |
World Equity Income Fund | | | — | | | | — | | | | 159,621 | | | | 159,621 | |
In conjunction with short sales and the use of derivative instruments, the Funds are required to maintain collateral in various forms. Depending on the financial instrument utilized and the broker involved, the Funds use margin deposits at the broker, cash and/or securities segregated at the custodian bank, discount notes or repurchase agreements allocated to the Funds as collateral.
Foreign Investments
There are several risks associated with exposure to foreign currencies, foreign issuers and emerging markets.A fund’s indirect and direct exposure to foreign currencies subjects the Fund to the risk that those currencies will decline in value relative to the U.S. dollar, or in the case of short positions, that the U.S. dollar will decline in value relative to the currency being hedged. Currency rates in foreign countries may fluctuate significantly over short periods of time for a number of reasons, including changes in interest rates and the imposition of currency controls or other political developments in the U.S. or abroad. In addition, the Funds may incur transaction costs in connection with conversions between various currencies. The Funds may, but is not obligated to, engage in currency hedging transactions, which generally involve buying currency forward, options or futures contracts. However, not all currency risks may be effectively hedged, and in some cases the costs of hedging techniques may outweigh expected benefits. In such instances, the value of securities denominated in foreign currencies can change significantly when foreign currencies strengthen or weaken relative to the U.S. dollar.
The Funds may invest in securities of foreign companies directly, or in financial instruments, such as ADRs and exchange-traded funds, which are indirectly linked to the performance of foreign issuers. Foreign markets can be more volatile than the U.S. market due to increased risks of adverse issuer, political, regulatory, market, or economic developments and can perform differently from the U.S. market. Investing in securities of foreign companies directly, or in financial instruments that are indirectly linked to the performance of foreign issuers, may involve risks not typically associated with investing in U.S. issuers. The value of securities denominated in foreign currencies, and of dividends from such securities, can change significantly when foreign currencies strengthen or weaken relative to the U.S. dollar. Foreign securities markets generally have less trading volume and less liquidity than U.S. markets, and prices in some foreign markets may fluctuate more than those of securities traded on U.S. markets. Many foreign countries lack accounting and disclosure standards comparable to those that apply to U.S. companies, and it may be more difficult to obtain reliable information regarding a foreign issuer’s financial condition and operations. Transaction costs and costs associated with custody services are generally higher for foreign securities than they are for U.S. securities. Some foreign governments levy withholding taxes against dividend and interest income. Although in some countries portions of these taxes are recoverable, the non-recovered portion will reduce the income received by the Funds.
The Trust has established counterparty credit guidelines and enters into transactions only with financial institutions of investment grade or better. The Trust monitors the counterparty credit risk.
Note 3 – Offsetting
In the normal course of business, the Funds enter into transactions subject to enforceable master netting arrangements or other similar arrangements. Generally, the right to offset in those agreements allows the Funds to counteract the exposure to a specific counterparty with collateral received from or delivered to that counterparty based on the terms of the arrangements. These arrangements provide for the right to liquidate upon the occurrence of an event of default, credit event upon merger or additional termination event.
| | THE GUGGENHEIM FUNDS SEMI-ANNUAL REPORT | 115 |
NOTES TO FINANCIAL STATEMENTS (Unaudited)(continued) |
In order to better define their contractual rights and to secure rights that will help the Funds mitigate their counterparty risk, the Funds may enter into an International Swaps and Derivatives Association, Inc. Master Agreement (“ISDA Master Agreement”) or similar agreement with their derivative contract counterparties. An ISDA Master Agreement is a bilateral agreement between a fund and a counterparty that governs OTC derivatives, including foreign exchange contracts, and typically contains, among other things, collateral posting terms and netting provisions in the event of a default and/or termination event. The provisions of the ISDA Master Agreement typically permit a single net payment in the event of a default (close-out netting) or similar event, including the bankruptcy or insolvency of the counterparty.
For derivatives traded under an ISDA Master Agreement, the collateral requirements are typically calculated by netting the mark-to-market amount for each transaction under such agreement and comparing that amount to the value of any collateral currently pledged by the Funds and the counterparty. For financial reporting purposes, cash collateral that has been pledged to cover obligations of the Funds and cash collateral received from the counterparty, if any, are reported separately on the Statements of Assets and Liabilities as segregated cash with broker/receivable for variation margin, or payable for swap settlement/variation margin. Cash and/or securities pledged or received as collateral by the Funds in connection with an OTC derivative subject to an ISDA Master Agreement generally may not be invested, sold or rehypothecated by the counterparty or the Funds, as applicable, absent an event of default under such agreement, in which case such collateral generally may be applied towards obligations due to and payable by such counterparty or the Funds, as applicable. Generally, the amount of collateral due from or to a counterparty must exceed a minimum transfer amount threshold (e.g., $300,000) before a transfer is required to be made. To the extent amounts due to the Funds from their counterparties are not fully collateralized, contractually or otherwise, the Funds bear the risk of loss from counterparty nonperformance. The Funds attempt to mitigate counterparty risk by only entering into agreements with counterparties that they believe to be of good standing and by monitoring the financial stability of those counterparties.
For financial reporting purposes, the Funds do not offset derivative assets and derivative liabilities that are subject to netting arrangements in the Statements of Assets and Liabilities.
The following tables present derivative financial instruments and secured financing transactions that are subject to enforceable netting arrangements:
| | | | | | | | | | | | | | | | Gross Amounts Not Offset
in the Statements of
Assets and Liabilities | | | | | |
Fund | Instrument | | Gross
Amounts of
Recognized
Assets1 | | | Gross
Amounts
Offset in the
Statements
of Assets and
Liabilities | | | Net Amount
of Assets
Presented on
the Statements
of Assets and
Liabilities | | | Financial
Instruments | | | Cash
Collateral
Received | | | Net
Amount | |
Alpha Opportunity Fund | Custom basket swap agreements | | $ | 679,482 | | | $ | — | | | $ | 679,482 | | | $ | (679,482 | ) | | $ | — | | | $ | — | |
Risk Managed Real Estate Fund | Custom basket swap agreements | | | 7,250,075 | | | | — | | | | 7,250,075 | | | | (4,618,322 | ) | | | (1,319,299 | ) | | | 1,312,454 | |
StylePlus—Large Core Fund | Swap equity contracts | | | 36,527,373 | | | | — | | | | 36,527,373 | | | | — | | | | (35,560,000 | ) | | | 967,373 | |
StylePlus—Mid Growth Fund | Swap equity contracts | | | 13,076,122 | | | | — | | | | 13,076,122 | | | | — | | | | (11,470,000 | ) | | | 1,606,122 | |
116 | THE GUGGENHEIM FUNDS SEMI-ANNUAL REPORT | |
NOTES TO FINANCIAL STATEMENTS (Unaudited)(continued) |
| | | | | | | | | | | | | | | | Gross Amounts Not Offset
in the Statements of
Assets and Liabilities | | | | | |
Fund | Instrument | | Gross
Amounts of
Recognized
Liabilities1 | | | Gross
Amounts
Offset in the
Statements
of Assets and
Liabilities | | | Net Amount
of Liabilities
Presented on
the Statements
of Assets and
Liabilities | | | Financial
Instruments | | | Cash
Collateral
Pledged | | | Net
Amount | |
Alpha Opportunity Fund | Custom basket swap agreements | | $ | 3,153,034 | | | $ | — | | | $ | 3,153,034 | | | $ | (3,153,034 | ) | | $ | — | | | $ | — | |
Market Neutral Real Estate Fund | Custom basket swap agreements | | | 3,268,167 | | | | — | | | | 3,268,167 | | | | (3,268,167 | ) | | | — | | | | — | |
Risk Managed Real Estate Fund | Custom basket swap agreements | | | 4,618,322 | | | | — | | | | 4,618,322 | | | | (4,618,322 | ) | | | — | | | | — | |
1 | Exchange-traded or centrally-cleared derivatives are excluded from these reported amounts. |
The Funds have the right to offset deposits against any related derivative liabilities outstanding with each counterparty with the exception of exchange-traded or centrally-cleared derivatives. The following table presents deposits held by others in connection with derivative investments as of March 31, 2021.
Fund | Counterparty | Asset Type | | Cash Pledged | | | Cash Received | |
Risk Managed Real Estate Fund | Morgan Stanley Capital Services LLC | Custom basket swap agreements | | $ | — | | | $ | 1,478,030 | |
StylePlus—Large Core Fund | Morgan Stanley Capital Services LLC | Futures contracts | | | 55,000 | | | | — | |
| Wells Fargo Bank, N.A. | Total return swap agreements | | | — | | | | 35,560,000 | |
| | | | | 55,000 | | | | 35,560,000 | |
StylePlus—Mid Growth Fund | Citibank N.A., New York | Total return swap agreements | | | — | | | | 11,470,000 | |
| Morgan Stanley Capital Services LLC | Futures contracts | | | 213,500 | | | | — | |
| | | | | 213,500 | | | | 11,470,000 | |
World Equity Income Fund | BofA Securities, Inc. | Futures contracts | | | 153,000 | | | | — | |
Note 4 – Fair Value Measurement
In accordance with U.S. GAAP, fair value is defined as the price that the Funds would receive to sell an investment or pay to transfer a liability in an orderly transaction with an independent buyer in the principal market, or in the absence of a principal market, the most advantageous market for the investment or liability. U.S. GAAP establishes a three-tier fair value hierarchy based on the types of inputs used to value assets and liabilities and requires corresponding disclosure. The hierarchy and the corresponding inputs are summarized below:
Level 1 — | quoted prices in active markets for identical assets or liabilities. |
Level 2 — | significant other observable inputs (for example quoted prices for securities that are similar based on characteristics such as interest rates, prepayment speeds, credit risk, etc.). |
Level 3 — | significant unobservable inputs based on the best information available under the circumstances, to the extent observable inputs are not available, which may include assumptions. |
The types of inputs available depend on a variety of factors, such as the type of security and the characteristics of the markets in which it trades, if any. Fair valuation determinations that rely on fewer or no observable inputs require greater judgment. Accordingly, fair value determinations for Level 3 securities require the greatest amount of judgment.
| | THE GUGGENHEIM FUNDS SEMI-ANNUAL REPORT | 117 |
NOTES TO FINANCIAL STATEMENTS (Unaudited)(continued) |
The inputs or methodologies used for valuing securities are not necessarily an indication of the risk associated with investing in those securities. The suitability of the techniques and sources employed to determine fair valuation are regularly monitored and subject to change.
Note 5 – Investment Advisory Agreement and Other Agreements
Under the terms of an investment advisory contract, the Funds pay GI investment advisory fees calculated at the annualized rates below, based on the average daily net assets of the Funds:
Fund | | Management Fees
(as a % of Net Assets) | |
Alpha Opportunity Fund | | | 0.90 | % |
Large Cap Value Fund | | | 0.65 | % |
Market Neutral Real Estate Fund | | | 1.10 | % |
Risk Managed Real Estate Fund | | | 0.75 | % |
Small Cap Value Fund | | | 0.75 | % |
StylePlus—Large Core Fund | | | 0.75 | % |
StylePlus—Mid Growth Fund | | | 0.75 | % |
World Equity Income Fund | | | 0.70 | % |
GI pays operating expenses on behalf of the Trust, such as audit and accounting related services, legal services, custody, printing and mailing, among others, on a pass-through basis. Such expenses are allocated to various Funds within the complex based on relative net assets.
The Board has adopted Distribution Plans related to the offering of A-Class, C-Class and P-Class shares pursuant to Rule 12b-1 under the 1940 Act. The plans provide for payments at an annual rate of 0.25% of the average daily net assets of the Fund’s A-Class and P-Class shares, and 1.00% of the average daily net assets of the Fund’s C-Class shares.
Contractual expense limitation agreements for the following Funds provide that the total expenses be limited to a percentage of average net assets for each class of shares, exclusive of brokerage costs, dividends or interest on securities sold short, expenses of other investment companies in which a Fund invests, interest, taxes, litigation, indemnification and extraordinary expenses. The limits are listed below:
| | Limit | | | Effective
Date | | | Contract
End Date | |
Alpha Opportunity Fund – A-Class | | | 1.76 | % | | | 05/31/17 | | | | 02/01/22 | |
Alpha Opportunity Fund – C-Class | | | 2.51 | % | | | 05/31/17 | | | | 02/01/22 | |
Alpha Opportunity - P-Class | | | 1.76 | % | | | 05/31/17 | | | | 02/01/22 | |
Alpha Opportunity Fund – Institutional Class | | | 1.51 | % | | | 05/31/17 | | | | 02/01/22 | |
Large Cap Value Fund – A-Class | | | 1.15 | % | | | 11/30/12 | | | | 02/01/22 | |
Large Cap Value Fund – C-Class | | | 1.90 | % | | | 11/30/12 | | | | 02/01/22 | |
Large Cap Value Fund – P-Class | | | 1.15 | % | | | 05/01/15 | | | | 02/01/22 | |
Large Cap Value Fund – Institutional Class | | | 0.90 | % | | | 06/05/13 | | | | 02/01/22 | |
Market Neutral Real Estate Fund – A-Class | | | 1.65 | % | | | 02/26/16 | | | | 02/01/22 | |
Market Neutral Real Estate Fund – C-Class | | | 2.40 | % | | | 02/26/16 | | | | 02/01/22 | |
Market Neutral Real Estate Fund – P-Class | | | 1.65 | % | | | 02/26/16 | | | | 02/01/22 | |
Market Neutral Real Estate Fund – Institutional Class | | | 1.40 | % | | | 02/26/16 | | | | 02/01/22 | |
Risk Managed Real Estate Fund – A-Class | | | 1.30 | % | | | 03/26/14 | | | | 02/01/22 | |
Risk Managed Real Estate Fund – C-Class | | | 2.05 | % | | | 03/26/14 | | | | 02/01/22 | |
Risk Managed Real Estate Fund – P-Class | | | 1.30 | % | | | 05/01/15 | | | | 02/01/22 | |
Risk Managed Real Estate Fund – Institutional Class | | | 1.10 | % | | | 03/26/14 | | | | 02/01/22 | |
Small Cap Value Fund – A-Class | | | 1.30 | % | | | 11/30/12 | | | | 02/01/22 | |
Small Cap Value Fund – C-Class | | | 2.05 | % | | | 11/30/12 | | | | 02/01/22 | |
Small Cap Value Fund – P-Class | | | 1.30 | % | | | 05/01/15 | | | | 02/01/22 | |
Small Cap Value Fund – Institutional Class | | | 1.05 | % | | | 11/30/12 | | | | 02/01/22 | |
World Equity Income Fund – A-Class | | | 1.22 | % | | | 08/15/13 | | | | 02/01/22 | |
World Equity Income Fund – C-Class | | | 1.97 | % | | | 08/15/13 | | | | 02/01/22 | |
World Equity Income Fund – P-Class | | | 1.22 | % | | | 05/01/15 | | | | 02/01/22 | |
World Equity Income Fund – Institutional Class | | | 0.97 | % | | | 08/15/13 | | | | 02/01/22 | |
118 | THE GUGGENHEIM FUNDS SEMI-ANNUAL REPORT | |
NOTES TO FINANCIAL STATEMENTS (Unaudited)(continued) |
GI and GPIM are entitled to reimbursement by the Funds for fees waived or expenses reimbursed during any of the previous 36 months, beginning on the date of the expense limitation agreement, if on any day the estimated operating expenses are less than the indicated percentages. For purposes of this arrangement, GI and GPIM are entitled to recoupment of previously waived fees or reimbursed expenses for 36 months from the date of the waiver or reimbursement by GI or GPIM. At March 31, 2021, the amount of fees waived or expenses reimbursed that are subject to recoupment and will expire dureing the years ended September 30, are presented in the following table:
Fund | | 2021 | | | 2022 | | | 2023 | | | 2024 | | | Total | |
Alpha Opportunity Fund | | | | | | | | | | | | | | | | | | | | |
A-Class | | $ | — | | | $ | — | | | $ | 1,631 | | | $ | 2,325 | | | $ | 3,956 | |
C-Class | | | 574 | | | | 594 | | | | 949 | | | | 387 | | | | 2,504 | |
P-Class | | | — | | | | 32 | | | | 546 | | | | 1,721 | | | | 2,299 | |
Institutional Class | | | — | | | | — | | | | — | | | | 7,162 | | | | 7,162 | |
Large Cap Value Fund | | | | | | | | | | | | | | | | | | | | |
A-Class | | | 41,638 | | | | 86,271 | | | | 123,000 | | | | 69,198 | | | | 320,107 | |
C-Class | | | 3,867 | | | | 5,745 | | | | 6,365 | | | | 2,856 | | | | 18,833 | |
P-Class | | | 435 | | | | 654 | | | | 1,005 | | | | 522 | | | | 2,616 | |
Institutional Class | | | 2,032 | | | | 9,093 | | | | 2,945 | | | | 1,533 | | | | 15,603 | |
Market Neutral Real Estate Fund | | | | | | | | | | | | | | | | | | | | |
A-Class | | | 13,250 | | | | 61,944 | | | | 55,287 | | | | 13,649 | | | | 144,130 | |
C-Class | | | — | | | | 2,911 | | | | 1,909 | | | | 491 | | | | 5,311 | |
P-Class | | | 14,497 | | | | 6,884 | | | | 8,658 | | | | 9,343 | | | | 39,382 | |
Institutional Class | | | 136,635 | | | | 115,010 | | | | 79,024 | | | | 38,109 | | | | 368,778 | |
Risk Managed Real Estate Fund | | | | | | | | | | | | | | | | | | | | |
A-Class | | | — | | | | — | | | | — | | | | 89 | | | | 89 | |
C-Class | | | 850 | | | | 741 | | | | 611 | | | | 321 | | | | 2,523 | |
P-Class | | | — | | | | — | | | | 9,087 | | | | 1,493 | | | | 10,580 | |
Institutional Class | | | — | | | | — | | | | — | | | | 655 | | | | 655 | |
Small Cap Value Fund | | | | | | | | | | | | | | | | | | | | |
A-Class | | | 63,311 | | | | 101,617 | | | | 118,318 | | | | 64,475 | | | | 347,721 | |
C-Class | | | 22,114 | | | | 21,993 | | | | 25,348 | | | | 14,545 | | | | 84,000 | |
P-Class | | | 180 | | | | 491 | | | | 1,268 | | | | 586 | | | | 2,525 | |
Institutional Class | | | 23,564 | | | | 35,461 | | | | 35,467 | | | | 19,816 | | | | 114,308 | |
World Equity Income Fund | | | | | | | | | | | | | | | | | | | | |
A-Class | | | 54,399 | | | | 89,463 | | | | 120,308 | | | | 60,107 | | | | 324,277 | |
C-Class | | | 7,811 | | | | 11,022 | | | | 13,263 | | | | 5,764 | | | | 37,860 | |
P-Class | | | 285 | | | | 318 | | | | 359 | | | | 178 | | | | 1,140 | |
Institutional Class | | | 3,036 | | | | 27,702 | | | | 16,027 | | | | 4,132 | | | | 50,897 | |
For the period ended March 31, 2021, GI recouped amounts from the Funds as follows:
Alpha Opportunity Fund | | $ | 1,833 | |
Risk Managed Real Estate Fund | | | 17,250 | |
World Equity Income Fund | | | 455 | |
If a Fund invests in a fund that is advised by the same adviser or an affiliated adviser, the investing Fund’s adviser has agreed to waive fees at the investing fund level to the extent necessary to offset the proportionate share of any management fee paid by each Fund with respect to its investment in such affiliated fund. Fee waivers will be calculated at the investing Fund level without regard to any expense cap in effect for the investing Fund. Fees waived under this arrangement are not subject to reimbursement to GI. For the period ended March 31, 2021, the following Funds waived fees related to investments in affiliated funds:
Fund | | Amount Waived | |
StylePlus—Large Core Fund | | $ | 62,558 | |
StylePlus—Mid Growth Fund | | | 34,217 | |
For the period ended March 31, 2021, GFD retained sales charges of $192,037 relating to sales of A-Class shares of the Trust.
| | THE GUGGENHEIM FUNDS SEMI-ANNUAL REPORT | 119 |
NOTES TO FINANCIAL STATEMENTS (Unaudited)(continued) |
Certain trustees and officers of the Trust are also officers of GI and/or GFD. The Trust does not compensate its officers or trustees who are officers, directors and/or employees of GI or GFD.
MUFG Investor Services (US), LLC (“MUIS”) acts as the Funds’ administrator, transfer agent and accounting agent. As administrator, transfer agent and accounting agent, MUIS maintains the books and records of the Funds’ securities and cash. The Bank of New York Mellon Corp. (“BNY”) acts as the Funds’ custodian. As custodian, BNY is responsible for the custody of the Funds’ assets. For providing the aforementioned administrative and accounting services, MUIS is entitled to receive a monthly fee equal to a percentage of the Funds’ average daily net assets and out of pocket expenses. For providing the aforementioned transfer agent and custodian services, MUIS and BNY are entitled to receive a monthly fee based on the number of transactions during the month and the number of accounts under management, subject to certain minimum monthly fees, and out of pocket expenses.
At March 31, 2021, GI and its affiliates owned over twenty percent of the outstanding shares of the Funds, as follows
Fund | | Percent of Outstanding
Shares Owned | |
Alpha Opportunity Fund | | | 71 | % |
Note 6 – Federal Income Tax Information
The Funds intend to comply with the provisions of Subchapter M of the Internal Revenue Code applicable to regulated investment companies and will distribute substantially all taxable net investment income and capital gains sufficient to relieve the Funds from all, or substantially all, federal income, excise and state income taxes. Therefore, no provision for federal or state income tax or federal excise tax is required.
Tax positions taken or expected to be taken in the course of preparing the Funds’ tax returns are evaluated to determine whether the tax positions are “more-likely-than-not” of being sustained by the applicable tax authority. Tax positions not deemed to meet the more-likely-than-not threshold would be recorded as a tax benefit or expense in the current year. Management has analyzed the Funds’ tax positions taken, or to be taken, on U.S. federal income tax returns for all open tax years, and has concluded that no provision for income tax is required in the Funds’ financial statements. The Funds’ U.S. federal income tax returns are subject to examination by the Internal Revenue Service (“IRS”) for a period of three years after they are filed.
At March 31, 2021, the cost of investments for U.S. federal income tax purposes, the aggregate gross unrealized appreciation for all investments for which there was an excess of value over tax cost, and the aggregate gross unrealized depreciation for all investments for which there was an excess of tax cost over value, were as follows:
Fund | | Tax
Cost | | | Tax
Unrealized
Appreciation | | | Tax
Unrealized
Depreciation | | | Net
Unrealized
Appreciation | |
Alpha Opportunity Fund | | $ | 35,025,903 | | | $ | 5,555,766 | | | $ | (3,349,166 | ) | | $ | 2,206,600 | |
Large Cap Value Fund | | | 29,417,013 | | | | 10,470,965 | | | | (845,981 | ) | | | 9,624,984 | |
Market Neutral Real Estate Fund | | | 66,335,798 | | | | 4,084,316 | | | | (3,557,145 | ) | | | 527,171 | |
Risk Managed Real Estate Fund | | | 375,983,636 | | | | 42,291,496 | | | | (6,372,313 | ) | | | 35,919,183 | |
Small Cap Value Fund | | | 5,745,055 | | | | 1,993,139 | | | | (273,933 | ) | | | 1,719,206 | |
StylePlus—Large Core Fund | | | 231,385,403 | | | | 44,561,496 | | | | (276,498 | ) | | | 44,284,998 | |
StylePlus—Mid Growth Fund | | | 101,878,462 | | | | 16,415,367 | | | | (277,656 | ) | | | 16,137,711 | |
World Equity Income Fund | | | 43,134,409 | | | | 8,668,367 | | | | (391,695 | ) | | | 8,276,672 | |
120 | THE GUGGENHEIM FUNDS SEMI-ANNUAL REPORT | |
NOTES TO FINANCIAL STATEMENTS (Unaudited)(concluded) |
Note 7 – Securities Transactions
For the period ended March 31, 2021, the cost of purchases and proceeds from sales of investment securities, excluding government securities, short-term investments and derivatives, were as follows:
Fund | | Purchases | | | Sales | |
Alpha Opportunity Fund | | $ | 21,639,835 | | | $ | 30,639,144 | |
Large Cap Value Fund | | | 3,016,857 | | | | 4,939,154 | |
Market Neutral Real Estate Fund | | | 103,016,775 | | | | 90,925,967 | |
Risk Managed Real Estate Fund | | | 237,354,674 | | | | 206,466,594 | |
Small Cap Value Fund | | | 736,185 | | | | 927,926 | |
StylePlus—Large Core Fund | | | 39,806,025 | | | | 20,928,093 | |
StylePlus—Mid Growth Fund | | | 30,610,809 | | | | 20,125,500 | |
World Equity Income Fund | | | 49,306,935 | | | | 51,393,557 | |
Note 8 – Line of Credit
The Trust, along with other affiliated trusts, secured a 364-day committed, $1,230,000,000 line of credit from Citibank, N.A., which was in place through October 2, 2020, at which time the line of credit was renewed. A Fund may draw (borrow) from the line of credit as a temporary measure for emergency purposes, to facilitate redemption requests, or for other short-term liquidity purposes consistent with the Fund’s investment objective and program. For example, it may be advantageous for the Fund to borrow money rather than sell existing portfolio positions to meet redemption requests. Fees related to borrowings, if any, vary under this arrangement between the greater of Citibank’s “base rate”, LIBOR plus 1%, or the federal funds rate plus 1/2 of 1%.
The commitment fee that may be paid by the Funds is at an annualized rate of 0.15% of the average daily amount of their allocated unused commitment amount. The commitment fee amount is allocated to the individual Funds based on the respective net assets of each participating Fund and is referenced in the Statement of Operations under “Line of credit fees”. The Funds did not have any borrowings under this agreement as of and for the period ended March 31, 2021.
Note 9 – Large Shareholder Risk
As of March 31, 2021, 70.7% of the Alpha Opportunity Fund (the “Fund”) was held by Guggenheim Macro Opportunities Fund. The Fund may experience adverse effects if a large number of shares of the Fund are held by a single shareholder (e.g., an institutional investor, financial intermediary or another GI Fund). The Fund is subject to the risk that a redemption by those shareholders of all or a large portion of the Fund could cause the Fund to liquidate its assets at inopportune times, or at a loss or depressed value, which could adversely impact the Fund’s performance and cause the value of a shareholder’s investment to decline. Redemptions of a large number of shares also may increase transaction costs or, by necessitating a sale of portfolio securities, have adverse tax consequences for shareholders. They also potentially limit the use of any capital loss carryforwards and certain other losses to offset future realized capital gains (if any) and may limit or prevent a Fund’s use of tax equalization.
Note 10 – COVID-19
The global ongoing crisis caused by the outbreak of COVID-19 and the current recovery underway is causing disruption to consumer demand and economic output and supply chains. There are still travel restrictions and quarantines, and adverse impacts on local and global economies. Investors should be aware that in light of the current uncertainty, volatility and distress in economies, the financial markets, and labor and public health conditions around the world, the Funds’ investments and shareholder’s investment in a Fund are subject to sudden and substantial losses, increased volatility and other adverse events. Firms through which investors invest with the Funds, the Funds, their service providers, the markets in which they invest and market intermediaries are also impacted by quarantines and similar measures intended to respond to and contain the ongoing pandemic, which can obstruct their functioning and subject them to heightened operational and other risks.
Note 11 – Subsequent Events
The Funds evaluated subsequent events through the date the financial statements were available for issue and determined there were no material events that would require adjustment to or disclosure in the Funds’ financial statements.
| | THE GUGGENHEIM FUNDS SEMI-ANNUAL REPORT | 121 |
OTHER INFORMATION (Unaudited) |
Delivery of Shareholder Reports
Paper copies of the Funds’ annual and semi-annual shareholder reports are not sent by mail, unless you specifically request paper copies of the reports from a fund or from your financial intermediary. Instead, the reports are made available on a website, and you are notified by mail each time a report is posted and provided with a website link to access the report.
You may elect to receive all future shareholder reports in paper free of charge. If you hold shares of a fund directly, you can inform the Fund that you wish to receive paper copies of reports by calling 800.820.0888. If you hold shares of a fund through a financial intermediary, please contact the financial intermediary to make this election. Your election to receive reports in paper may apply to all Guggenheim Funds in which you are invested and may apply to all Guggenheim funds held with your financial intermediary.
Proxy Voting Information
A description of the policies and procedures that the Trust uses to determine how to vote proxies relating to securities held in the Funds’ portfolios is available, without charge and upon request, by calling 800.820.0888. This information is also available from the EDGAR database on the SEC’s website at https://www.sec.gov.
Information regarding how the Funds’ voted proxies relating to portfolio securities during the most recent 12-month period ended June 30 is available without charge, upon request, by calling 800.820.0888. This information is also available from the EDGAR database on the SEC’s website at https://www.sec.gov.
Sector Classification
Information in the “Schedule of Investments” is categorized by sectors using sector-level Classifications defined by the Bloomberg Industry Classification System, a widely recognized industry classification system provider. Each Fund’s registration statement has investment policies relating to concentration in specific sectors/industries. For purposes of these investment policies, the Funds usually classify sectors/industries based on industry-level Classifications used by widely recognized industry classification system providers such as Bloomberg Industry Classification System, Global Industry Classification Standards and Barclays Global Classification Scheme.
Quarterly Portfolio Schedules Information
The Trust files its complete schedule of portfolio holdings with the SEC for the first and third quarters of each fiscal year as an exhibit to its reports on Form N-PORT, and for reporting periods ended prior to March 31, 2019, filed such information on Form N-Q. The Funds’ Forms N-PORT and N-Q are available on the SEC’s website at https://www.sec.gov. Copies of the portfolio holdings are also available to shareholders, without charge and upon request, by calling 800.820.0888.
122 | THE GUGGENHEIM FUNDS SEMI-ANNUAL REPORT | |
INFORMATION ON BOARD OF TRUSTEES AND OFFICERS (Unaudited) |
A Board of Trustees oversees the Trust, as well as other trusts of GI, in which its members have no stated term of service, and continue to serve after election until resignation. The Statement of Additional Information includes further information about Fund Trustees and Officers, and can be obtained without charge by visiting guggenheiminvestments.com or by calling 800.820.0888.
Name, Address*
and Year of Birth | Position(s)
Held with
Trust | Term of Office
and Length of
Time Served** | Principal Occupation(s)
During Past Five Years | Number of
Portfolios
in Fund
Complex
Overseen | Other
Directorships Held
by Trustees*** |
INDEPENDENT TRUSTEES | | | |
Randall C. Barnes (1951) | Trustee and Chair of the Valuation Oversight Committee | Since 2014 (Trustee) Since 2020 (Chair of the Valuation Oversight Committee) | Current: Private Investor (2001-present). Former: Senior Vice President and Treasurer, PepsiCo, Inc. (1993-1997); President, Pizza Hut International (1991-1993); Senior Vice President, Strategic Planning and New Business Development, PepsiCo, Inc. (1987-1990). | 157 | Current: Purpose Investments Funds (2013-present). Former: Managed Duration Investment Grade Municipal Fund (2006-2016). |
Angela Brock-Kyle (1959) | Trustee | Since 2019 | Current: Founder and Chief Executive Officer, B.O.A.R.D.S. (2013-present). Former: Senior Leader, TIAA (1987-2012). | 156 | Current: Bowhead Insurance GP, LLC (2020-present); Hunt Companies, Inc. (2019-present). Former: Infinity Property & Casualty Corp. (2014-2018). |
Thomas F. Lydon, Jr. (1960) | Trustee and Chair of the Contracts Review Committee | Since 2019 (Trustee) Since 2020 (Chair of the Contracts Review Committee) | Current: President, Global Trends Investments (1996-present); Co-Chief Executive Officer, ETF Flows, LLC (2019-present); Chief Executive Officer, Lydon Media (2016-present). | 156 | Current: US Global Investors (GROW) (1995-present). Former: Harvest Volatility Edge Trust (3) (2017-2019). |
Ronald A. Nyberg (1953) | Trustee and Chair of the Nominating and Governance Committee | Since 2014 | Current: Of Counsel, Momkus LLP (2016-present). Former: Partner, Nyberg & Cassioppi, LLC (2000-2016); Executive Vice President, General Counsel, and Corporate Secretary, Van Kampen Investments (1982-1999). | 157 | Current: PPM Funds (2) (2018-present); Edward-Elmhurst Healthcare System (2012-present). Former: Western Asset Inflation-Linked Opportunities & Income Fund (2004-2020); Western Asset Inflation-Linked Income Fund (2003-2020); Managed Duration Investment Grade Municipal Fund (2003-2016). |
| | THE GUGGENHEIM FUNDS SEMI-ANNUAL REPORT | 123 |
INFORMATION ON BOARD OF TRUSTEES AND OFFICERS (Unaudited)(continued) |
Name, Address*
and Year of Birth | Position(s)
Held with
Trust | Term of Office
and Length of
Time Served** | Principal Occupation(s)
During Past Five Years | Number of
Portfolios
in Fund
Complex
Overseen | Other
Directorships Held
by Trustees*** |
INDEPENDENT TRUSTEES - concluded | | |
Sandra G. Sponem (1958) | Trustee and Chair of the Audit Committee | Since 2019 (Trustee) Since 2020 (Chair of the Audit Committee) | Current: Retired. Former: Senior Vice President and Chief Financial Officer, M.A. Mortenson-Companies, Inc. (2007-2017). | 156 | Current: SPDR Series Trust (81) (2018-present); SPDR Index Shares Funds (30) (2018-present); SSGA Active Trust (14) (2018-present). Former: SSGA Master Trust (1) (2018-2020). |
Ronald E. Toupin, Jr. (1958) | Trustee, Chair of the Board and Chair of the Executive Committee | Since 2014 | Current: Portfolio Consultant (2010-present); Member, Governing Council, Independent Directors Council (2013-present); Governor, Board of Governors, Investment Company Institute (2018-present). Former: Member, Executive Committee, Independent Directors Council (2016-2018); Vice President, Manager and Portfolio Manager, Nuveen Asset Management (1998-1999); Vice President, Nuveen Investment Advisory Corp. (1992-1999); Vice President and Manager, Nuveen Unit Investment Trusts (1991-1999); and Assistant Vice President and Portfolio Manager, Nuveen Unit Investment Trusts (1988-1999), each of John Nuveen & Co., Inc. (1982-1999). | 156 | Former: Western Asset Inflation-Linked Opportunities & Income Fund (2004-2020); Western Asset Inflation-Linked Income Fund (2003-2020); Managed Duration Investment Grade Municipal Fund (2003-2016). |
124 | THE GUGGENHEIM FUNDS SEMI-ANNUAL REPORT | |
INFORMATION ON BOARD OF TRUSTEES AND OFFICERS (Unaudited)(continued) |
Name, Address*
and Year of Birth | Position(s)
Held with
Trust | Term of Office
and Length of
Time Served** | Principal Occupation(s)
During Past Five Years | Number of
Portfolios
in Fund
Complex
Overseen | Other
Directorships Held
by Trustees*** |
INTERESTED TRUSTEE | | | | |
Amy J. Lee**** (1961) | Trustee, Vice President and Chief Legal Officer | Since 2018 (Trustee) Since 2014
(Chief Legal Officer) Since 2007
(Vice President) | Current: Interested Trustee, certain other funds in the Fund Complex (2018-present); Chief Legal Officer, certain other funds in the Fund Complex (2014-present); Vice President, certain other funds in the Fund Complex (2007-present); Senior Managing Director, Guggenheim Investments (2012-present). Former: President and Chief Executive Officer, certain other funds in the Fund Complex (2017-2019); Vice President, Associate General Counsel and Assistant Secretary, Security Benefit Life Insurance Company and Security Benefit Corporation (2004-2012). | 156 | None. |
* | The business address of each Trustee is c/o Guggenheim Investments, 227 West Monroe Street, Chicago, Illinois 60606. |
** | Each Trustee serves an indefinite term, until his or her successor is elected and qualified. Time served includes time served in the respective position for the Predecessor Corporation. |
*** | Each Trustee also serves on the Boards of Trustees of Guggenheim Funds Trust, Guggenheim Variable Funds Trust, Guggenheim Strategy Funds Trust, Fiduciary/Claymore Energy Infrastructure Fund, Guggenheim Taxable Municipal Bond & Investment Grade Debt Trust, Guggenheim Strategic Opportunities Fund, Guggenheim Enhanced Equity Income Fund, Guggenheim Energy & Income Fund, Guggenheim Credit Allocation Fund, Rydex Series Funds, Rydex Dynamic Funds, Rydex Variable Trust and Transparent Value Trust. Messrs. Barnes and Nyberg also serve on the Board of Trustees of Advent Convertible & Income Fund. |
**** | This Trustee is deemed to be an “interested person” of the Funds under the 1940 Act by reason of her position with the Funds’ Investment Manager and/or the parent of the Investment Manager. |
| | THE GUGGENHEIM FUNDS SEMI-ANNUAL REPORT | 125 |
INFORMATION ON BOARD OF TRUSTEES AND OFFICERS (Unaudited)(continued) |
Name, Address*
and Year of Birth | Position(s)
Held with
Trust | Term of Office
and Length of
Time Served** | Principal Occupation(s)
During Past Five Years |
OFFICERS | | | |
Brian E. Binder (1972) | President and Chief Executive Officer | Since 2018 | Current: President and Chief Executive Officer, certain other funds in the Fund Complex (2018-present); President, Chief Executive Officer and Chairman of the Board of Managers, Guggenheim Funds Investment Advisors, LLC (2018-present); President and Chief Executive Officer, Security Investors, LLC (2018-present); Board Member of Guggenheim Partners Fund Management (Europe) Limited (2018-present); Senior Managing Director and Chief Administrative Officer, Guggenheim Investments (2018-present). Former: Managing Director and President, Deutsche Funds, and Head of US Product, Trading and Fund Administration, Deutsche Asset Management (2013-2018); Managing Director, Head of Business Management and Consulting, Invesco Ltd. (2010-2012). |
James M. Howley (1972) | Assistant Treasurer | Since 2014 | Current: Managing Director, Guggenheim Investments (2004-present); Assistant Treasurer, certain other funds in the Fund Complex (2006-present). Former: Manager, Mutual Fund Administration of Van Kampen Investments, Inc. (1996-2004). |
Mark E. Mathiasen (1978) | Secretary | Since 2014 | Current: Secretary, certain other funds in the Fund Complex (2007-present); Managing Director, Guggenheim Investments (2007-present). |
Glenn McWhinnie (1969) | Assistant Treasurer | Since 2016 | Current: Vice President, Guggenheim Investments (2009-present); Assistant Treasurer, certain other funds in the Fund Complex (2016-present). |
Michael P. Megaris (1984) | Assistant Secretary | Since 2014 | Current: Assistant Secretary, certain other funds in the Fund Complex (2014-present); Director, Guggenheim Investments (2012-present). |
Elisabeth Miller (1968) | Chief Compliance Officer | Since 2012 | Current: Chief Compliance Officer, certain other funds in the Fund Complex (2012-present); Senior Managing Director, Guggenheim Investments (2012-present). Vice President, Guggenheim Funds Distributors, LLC (2014-present). Former: Chief Compliance Officer, Security Investors, LLC and Guggenheim Funds Investment Advisors, LLC (2012-2018); Chief Compliance Officer, Guggenheim Distributors, LLC (2009-2014); Senior Manager, Security Investors, LLC (2004-2014); Senior Manager, Guggenheim Distributors, LLC (2004-2014). |
Margaux Misantone (1978) | AML Officer | Since 2017 | Current: Chief Compliance Officer, Security Investors, LLC and Guggenheim Funds Investment Advisors, LLC (2018-present); AML Officer, Security Investors, LLC and certain other funds in the Fund Complex (2017-present); Managing Director, Guggenheim Investments (2015-present). Former: Assistant Chief Compliance Officer, Security Investors, LLC and Guggenheim Funds Investments Advisors, LLC (2015-2018). |
126 | THE GUGGENHEIM FUNDS SEMI-ANNUAL REPORT | |
INFORMATION ON BOARD OF TRUSTEES AND OFFICERS (Unaudited)(concluded) |
Name, Address*
and Year of Birth | Position(s)
Held with
Trust | Term of Office
and Length of
Time Served** | Principal Occupation(s)
During Past Five Years |
OFFICERS - concluded | |
Kimberly J. Scott (1974) | Assistant Treasurer | Since 2014 | Current: Director, Guggenheim Investments (2012-present); Assistant Treasurer, certain other funds in the Fund Complex (2012-present). Former: Financial Reporting Manager, Invesco, Ltd. (2010-2011); Vice President/Assistant Treasurer, Mutual Fund Administration for Van Kampen Investments, Inc./Morgan Stanley Investment Management (2009-2010); Manager of Mutual Fund Administration, Van Kampen Investments, Inc./Morgan Stanley Investment Management (2005-2009). |
Bryan Stone (1979) | Vice President | Since 2014 | Current: Vice President, certain other funds in the Fund Complex (2014-present); Managing Director, Guggenheim Investments (2013-present). Former: Senior Vice President, Neuberger Berman Group LLC (2009-2013); Vice President, Morgan Stanley (2002-2009). |
John L. Sullivan (1955) | Chief Financial Officer, Chief Accounting Officer and Treasurer | Since 2014 | Current: Chief Financial Officer, Chief Accounting Officer and Treasurer, certain other funds in the Fund Complex (2010-present); Senior Managing Director, Guggenheim Investments (2010-present). Former: Managing Director and Chief Compliance Officer, each of the funds in the Van Kampen Investments fund complex (2004-2010); Managing Director and Head of Fund Accounting and Administration, Morgan Stanley Investment Management (2002-2004); Chief Financial Officer and Treasurer, Van Kampen Funds (1996-2004). |
Jon Szafran (1989) | Assistant Treasurer | Since 2017 | Current: Vice President, Guggenheim Investments (2017-present); Assistant Treasurer, certain other funds in the Fund Complex (2017-present). Former: Assistant Treasurer of Henderson Global Funds and Manager of US Fund Administration, Henderson Global Investors (North America) Inc. (“HGINA”), (2017); Senior Analyst of US Fund Administration, HGINA (2014–2017); Senior Associate of Fund Administration, Cortland Capital Market Services, LLC (2013-2014); Experienced Associate, PricewaterhouseCoopers LLP (2012-2013). |
* | The business address of each officer is c/o Guggenheim Investments, 227 West Monroe Street, Chicago, Illinois 60606. |
** | Each officer serves an indefinite term, until his or her successor is duly elected and qualified. |
| | THE GUGGENHEIM FUNDS SEMI-ANNUAL REPORT | 127 |
GUGGENHEIM INVESTMENTS PRIVACY NOTICE (Unaudited) |
Who We Are
This Privacy Notice describes the data protection practices of Guggenheim Investments. Guggenheim Investments as used herein refers to the affiliated investment management businesses of Guggenheim Partners, LLC: Guggenheim Funds Investment Advisors, LLC, Guggenheim Partners Investment Management, LLC, Guggenheim Funds Distributors, LLC, Security Investors, LLC, Guggenheim Investment Advisors (Europe) Limited, Guggenheim Real Estate, LLC, GS Gamma Advisors, LLC, Guggenheim Partners India Management, LLC, Guggenheim Partners Europe Limited, as well as the funds in the Guggenheim Funds complex (the “Funds”) (“Guggenheim Investments,” “we,” “us,” or “our”).
Guggenheim Partners Investment Management Holdings, LLC, located at 330 Madison Avenue, New York, New York 10017 is the data controller for your information. The affiliates who are also controllers of certain of your information are: Guggenheim Investment Advisors (Europe) Limited, Guggenheim Partners Europe Limited, Guggenheim Partners, LLC, Guggenheim Funds Investment Advisors, LLC, Guggenheim Partners Investment Management, LLC, Guggenheim Funds Distributors, LLC and Security Investors, LLC, as well as the Funds.
Our Commitment to You
Guggenheim Investments considers your privacy our utmost concern. When you become our client or investor, you entrust us with not only your hard-earned money but also with your personal and financial information. Because we have access to your private information, we hold ourselves to the highest standards in its safekeeping and use. We strictly limit how we share your information with others, whether you are a current or former Guggenheim Investments client or investor.
The Information We Collect About You
We collect certain nonpublic personal information about you from information you provide on applications, other forms, our website, and/or from third parties including investment advisors. This information includes Social Security or other tax identification number, assets, income, tax information, retirement and estate plan information, transaction history, account balance, payment history, bank account information, marital status, family relationships, information that we collect on our website through the use of “cookies,” and other personal information that you or others provide to us. We may also collect such information through your inquiries by mail, e-mail or telephone. We may also collect customer due diligence information, as required by applicable law and regulation, through third party service providers.
How We Handle Your Personal Information
The legal basis for using your information as set out in this Privacy Notice is as follows: (a) use of your personal data is necessary to perform our obligations under any contract with you (such as a contract for us to provide financial services to you); or (b) where use of your personal data is not necessary for performance of a contract, use of your personal data is necessary for our legitimate interests or the legitimate interests of others (for example, to enforce the legal terms governing our services, operate and market our website and other services we offer, ensure safe environments for our personnel and others, make and receive payments, prevent fraud and to know the customer to whom we are providing the services). Some processing is done to comply with applicable law.
In addition to the specific uses described above, we also use your information in the following manner:
| | ● | We use your information in connection with servicing your accounts. |
| | ● | We use information to respond to your requests or questions. For example, we might use your information to respond to your customer feedback. |
| | ● | We use information to improve our products and services. We may use your information to make our website and products better. We may use your information to customize your experience with us. |
| | ● | We use information for security purposes. We may use your information to protect our company and our customers. |
| | ● | We use information to communicate with you. For example, we will communicate with you about your account or our relationship. We may contact you about your feedback. We might also contact you about this Privacy Notice. We may also enroll you in our email newsletter. |
128 | THE GUGGENHEIM FUNDS SEMI-ANNUAL REPORT | |
GUGGENHEIM INVESTMENTS PRIVACY NOTICE (Unaudited)(continued) |
| | ● | We use information as otherwise permitted by law, as we may notify you. |
| | ● | Aggregate/Anonymous Data. We may aggregate and/or anonymize any information collected through the website so that such information can no longer be linked to you or your device (“Aggregate/Anonymous Information”). We may use Aggregate/Anonymous Information for any purpose, including without limitation for research and marketing purposes, and may also share such data with any third parties, including advertisers, promotional partners, and sponsors. |
We do not sell information about current or former clients or their accounts to third parties. Nor do we share this information, except when necessary to complete transactions at your request, to make you aware of investment products and services that we or our affiliates offer, or as permitted or required by law.
We provide information about you to companies and individuals not affiliated with Guggenheim Investments to complete certain transactions or account changes, or to perform services for us related to your account. For example, if you ask to transfer assets from another financial institution to Guggenheim Investments, we must provide certain information about you to that company to complete the transaction. We provide the third party with only the information necessary to carry out its responsibilities and only for that purpose. And we require these third parties to treat your private information with the same high degree of confidentiality that we do. To alert you to other Guggenheim Investments products and services, we share your information within our family of affiliated companies. You may limit our sharing with affiliated companies as set out below. We may also share information with any successor to all or part of our business, or in connection with steps leading up to a merger or acquisition. For example, if part of our business was sold we may give customer information as part of that transaction. We may also share information about you with your consent.
We will release information about you if you direct us to do so, if we are compelled by law to do so, or in other circumstances as permitted by law (for example, to protect your account from fraud).
If you close your account(s) or become an inactive client or investor, we will continue to adhere to the privacy policies and practices described in this notice.
Opt-Out Provisions and Your Data Choices
The law allows you to “opt out” of certain kinds of information sharing with third parties. We do not share personal information about you with any third parties that triggers this opt-out right. This means YOU ARE ALREADY OPTED OUT.
When you are no longer our client or investor, we continue to share your information as described in this notice, and you may contact us at any time to limit our sharing by sending an email to CorporateDataPrivacy@GuggenheimPartners.com.
European Union Data Subjects and certain others: In addition to the choices set forth above, residents of the European Union and certain other jurisdictions have certain rights to (1) request access to or rectification or deletion of information we collect about them, (2) request a restriction on the processing of their information, (3) object to the processing of their information, or (4) request the portability of certain information. To exercise these or other rights, please contact us using the contact information below. We will consider all requests and provide our response within the time period stated by applicable law. Please note, however, that certain information may be exempt from such requests in some circumstances, which may include if we need to keep processing your information for our legitimate interests or to comply with a legal obligation. We may request you provide us with information necessary to confirm your identity before responding to your request.
Residents of France and certain other jurisdictions may also provide us with instructions regarding the manner in which we may continue to store, erase and share your information after your death, and where applicable, the person you have designated to exercise these rights after your death.
How We Protect Privacy Online
We take steps to protect your privacy when you use our web site – www.guggenheiminvestments.com – by using secure forms of online communication, including encryption technology, Secure Socket Layer (SSL) protocol, firewalls and user names and passwords. These safeguards vary based on the sensitivity of the information that we collect and store. However, we cannot and do not guarantee that these measures will prevent every unauthorized attempt to access, use, or disclose your information since despite our efforts, no Internet and/or other
| | THE GUGGENHEIM FUNDS SEMI-ANNUAL REPORT | 129 |
GUGGENHEIM INVESTMENTS PRIVACY NOTICE (Unaudited)(concluded) |
electronic transmissions can be completely secure. Our web site uses “http cookies”—tiny pieces of information that we ask your browser to store. We use cookies for session management and security features on the Guggenheim Investments web site. We do not use them to pull data from your hard drive, to learn your e-mail address, or to view data in cookies created by other web sites. We will not share the information in our cookies or give others access to it. See the legal information area on our web site for more details about web site security and privacy features.
How We Safeguard Your Personal Information and Data Retention
We restrict access to nonpublic personal information about you to our employees and in some cases to third parties (for example, the service providers described above) as permitted by law. We maintain strict physical, electronic and procedural safeguards that comply with federal standards to guard your nonpublic personal information.
We keep your information for no longer than necessary for the purposes for which it is processed. The length of time for which we retain information depends on the purposes for which we collected and use it and/or as required to comply with applicable laws. Information may persist in copies made for backup and business continuity purposes for additional time.
International Visitors
If you are not a resident of the United States, please be aware that your information may be transferred to, stored and processed in the United States where our servers are located and our databases are operated. The data protection and other laws of the United States and other countries might not be as comprehensive as those in your country.
In such cases, we ensure that a legal basis for such a transfer exists and that adequate protection is provided as required by applicable law, for example, by using standard contractual clauses or by transferring your data to a jurisdiction that has obtained an adequacy finding. Individuals whose data may be transferred on the basis of standard contractual clauses may contact us as described below.
We’ll Keep You Informed
If you have any questions or concerns about how we treat your personal data, we encourage you to consult with us first. You may also contact the relevant supervisory authority.
We reserve the right to modify this policy at any time and will inform you promptly of material changes. You may access our privacy policy from our web site at www.guggenheiminvestments.com. Should you have any questions regarding our privacy policy, contact us by email at CorporateDataPrivacy@GuggenheimPartners.com.
130 | THE GUGGENHEIM FUNDS SEMI-ANNUAL REPORT | |
This page intentionally left blank.
This page intentionally left blank.
This page intentionally left blank.
3.31.2021
Guggenheim Funds Semi-Annual Report
| |
Guggenheim Diversified Income Fund | | |
Guggenheim High Yield Fund | | |
Guggenheim Core Bond Fund (formerly,
Guggenheim Investment Grade Bond Fund) | | |
Guggenheim Municipal Income Fund | | |
GuggenheimInvestments.com | SBINC-SEMI-0321x0921 |
| | |
DEAR SHAREHOLDER | 2 |
ECONOMIC AND MARKET OVERVIEW | 4 |
ABOUT SHAREHOLDERS’ FUND EXPENSES | 6 |
DIVERSIFIED INCOME FUND | 9 |
HIGH YIELD FUND | 18 |
CORE BOND FUND | 38 |
MUNICIPAL INCOME FUND | 65 |
NOTES TO FINANCIAL STATEMENTS | 80 |
OTHER INFORMATION | 98 |
INFORMATION ON BOARD OF TRUSTEES AND OFFICERS | 99 |
GUGGENHEIM INVESTMENTS PRIVACY NOTICE | 104 |
| | THE GUGGENHEIM FUNDS SEMI-ANNUAL REPORT | 1 |
Dear Shareholder:
Security Investors, LLC and Guggenheim Partners Investment Management, LLC (the “Investment Advisers”) are pleased to present the shareholder report for a selection of our Funds (the “Funds”) for the semi-annual period ended March 31, 2021.
On April 23, 2021, the name of Guggenheim Investment Grade Bond Fund changed to Guggenheim Core Bond Fund. This name change did not result in changes to the Fund’s investment objective, principal investment strategies or principal risks.
The Investment Advisers are part of Guggenheim Investments, which represents the investment management businesses of Guggenheim Partners, LLC (“Guggenheim”), a global, diversified financial services firm.
Guggenheim Funds Distributors, LLC is the distributor of the Funds. Guggenheim Funds Distributors, LLC is affiliated with Guggenheim and the Investment Advisers.
We encourage you to read the Economic and Market Overview section of the report, which follows this letter.
We are committed to providing innovative investment solutions and appreciate the trust you place in us.
Sincerely,
Security Investors, LLC,
Guggenheim Partners Investment Management, LLC,
April 30, 2021
Read a prospectus and summary prospectus (if available) carefully before investing. It contains the investment objectives, risks, charges, expenses and other information, which should be considered carefully before investing. Obtain a prospectus and summary prospectus (if available) at guggenheiminvestments.com or call 800.820.0888.
This material is not intended as a recommendation or as investment advice of any kind, including in connection with rollovers, transfers, and distributions. Such material is not provided in a fiduciary capacity, may not be relied upon for or in connection with the making of investment decisions, and does not constitute a solicitation of an offer to buy or sell securities. All content has been provided for informational or educational purposes only and is not intended to be and should not be construed as legal or tax advice and/or a legal opinion. Always consult a financial, tax and/or legal professional regarding your specific situation.
COVID-19. The global ongoing crisis caused by the outbreak of COVID-19 and the current recovery underway is causing disruption to consumer demand and economic output and supply chains. There are still travel restrictions and quarantines, and adverse impacts on local and global economies. Investors should be aware that in light of the current uncertainty, volatility and distress in economies, financial markets, and labor and public health conditions around the world, the Funds’ investments and a shareholder’s investment in a Fund are subject to investment risk, including the possible loss of the entire principal amount invested. Firms through which investors invest with the Funds, the Funds, their service providers, the markets in which they invest and market intermediaries are also impacted by quarantines and similar measures intended to respond to and contain the ongoing pandemic, which can obstruct their functioning and subject them to heightened operational and other risks.
Diversified Income Fund may not be suitable for all investors. ● The Fund’s market value will change in response to interest rate changes and market conditions among other factors. In general, bond prices rise when interest rates fall and vice versa. ● The Fund’s exposure to high yield securities may subject the fund to greater volatility. ● Derivatives may pose risks in addition to and greater than those associated with investing directly in securities or other investments, including risks relating to leverage, imperfect correlations with underlying investments or the Fund’s other portfolio holdings, high price volatility, lack of availability, counterparty credit, liquidity, valuation and legal restrictions. ● Stock prices, especially stock prices of smaller companies, can be volatile as they reflect changes in the issuing company’s financial conditions and changes in the overall market ● Some asset-backed securities, including mortgage-backed securities, may have structures that make their reaction to interest rates and other factors difficult to predict, making their prices very volatile and they are subject to liquidity risk.● The Fund’s investments in other investment vehicles subject the Fund to those risks and expenses affecting the investment vehicle. ● The Fund’s investments in foreign securities carry additional risks when compared to U.S. securities, due to the impact of diplomatic, political or economic developments in the country in question (investments in emerging markets securities are generally subject to an even greater level of risk). ● Investments in syndicated bank loans generally offer a floating interest rate and involve special types of risks. ● Master limited partnerships (“MLPs”) are subject to certain risks inherent in the structure of MLPs, including tax risks, limited control and voting rights and potential conflicts of interest. MLPs that concentrate in a particular industry or a particular geographic region are subject to risks associated with such industry or region. ● The Fund’s investments in real estate securities subject the Fund to the same risks as direct investments in real estate, which is particularly sensitive to economic downturns. ● The Fund’s investments and investment strategies, including investments in MLPs and certain investment vehicles, may be subject to special and complex federal income tax provisions that may adversely affect the Fund and its distributions to shareholders. ● Leveraging will exaggerate the effect on NAV of any increase or decrease in the market value of the Fund’s portfolio. ● Please read the prospectus for more detailed information regarding these and other risks.
2 | THE GUGGENHEIM FUNDS SEMI-ANNUAL REPORT | |
High Yield Fund may not be suitable for all investors. ● The Fund’s market value will change in response to interest rate changes and market conditions among other factors. In general, bond prices rise when interest rates fall and vice versa. ● The Fund’s exposure to high yield securities may subject the Fund to greater volatility. ● The Fund may invest in derivative instruments, which may be more volatile and less liquid, increasing the risk of loss when compared to traditional securities. Certain of the derivative instruments are also subject to the risks of counterparty default and adverse tax treatment. ●The Fund’s use of leverage, through borrowings or instruments such as derivatives, may cause the Fund to be more volatile than if it had not been leveraged. ● Instruments and strategies (such as borrowing transactions and reverse repurchase agreements) may provide leveraged exposure to a particular investment, which will magnify any gains or losses on those investments. ● The Fund may invest in foreign securities which carry additional risks when compared to U.S. securities, due to the impact of diplomatic, political, or economic developments in the country in question (investments in emerging markets securities are generally subject to an even greater level of risk). ● Investments in syndicated bank loans generally offer a floating interest rate and involve special types of risks. ● The Fund’s investments in other investment vehicles subject the Fund to those risks and expenses affecting the investment vehicle. ● The Fund’s investments in restricted securities may involve financial and liquidity risk. ● You may have a gain or loss when you sell your shares. ● It is important to note that the Fund is not guaranteed by the U.S. government. ● Please read the prospectus for more detailed information regarding these and other risks.
Core Bond Fund may not be suitable for all investors. ● The Fund’s market value will change in response to interest rate changes and market conditions among other factors. In general, bond prices rise when interest rates fall and vice versa. ● The Fund’s exposure to high yield securities may subject the Fund to greater volatility. ● When market conditions are deemed appropriate, the Fund may use leverage to the full extent permitted by its investment policies and restrictions and applicable law. Leveraging will exaggerate the effect on net asset value of any increase or decrease in the market value of the Fund’s portfolio. ● The Fund may invest in derivative instruments, which may be more volatile and less liquid, increasing the risk of loss when compared to traditional securities. Certain of the derivative instruments are also subject to the risks of counterparty default and adverse tax treatment. ● Instruments and strategies (such as borrowing transactions and reverse repurchase agreements) may provide leveraged exposure to a particular investment, which will magnify any gains or losses on those investments. ● Investments in reverse repurchase agreements expose the Fund to the many of the same risks as investments in derivatives. ● The Fund’s investments in other investment vehicles subject the Fund to those risks and expenses affecting the investment vehicle. ● The Fund’s investments in foreign securities carry additional risks when compared to U.S. securities, due to the impact of diplomatic, political or economic developments in the country in question (investments in emerging markets securities are generally subject to an even greater level of risk). ● Investments in syndicated bank loans generally offer a floating interest rate and involve special types of risks. ● The Fund’s investments in municipal securities can be affected by events that affect the municipal bond market. ● The Fund’s investments in real estate securities subject the Fund to the same risks as direct investments in real estate, which is particularly sensitive to economic downturns. ● The Fund’s investments in restricted securities may involve financial and liquidity risk. ● You may have a gain or loss when you sell your shares. ● It is important to note that the Fund is not guaranteed by the U.S. government. ● Please read the prospectus for more detailed information regarding these and other risks.
Municipal Income Fund may not be suitable for all investors. ● The Fund will be significantly affected by events that affect the municipal bond market, which could include unfavorable legislative or political developments and adverse changes in the financial conditions of state and municipal issuers or the federal government in case it provides financial support to the municipality. Income from municipal bonds held by the Fund could be declared taxable because of changes in tax laws. The Fund may invest in securities that generate taxable income. A portion of the Fund’s otherwise tax-exempt dividends may be taxable to those shareholders subject to the alternative minimum tax. ● Certain sectors of the municipal bond market have special risks that can affect them more significantly than the market as a whole. Because many municipal instruments are issued to finance similar projects, conditions in these industries can significantly affect the Fund and the overall municipal market. ● Municipalities currently experience budget shortfalls, which could cause them to default on their debt and thus subject the Fund to unforeseen losses. ● Like other funds that hold bonds and other fixed-income investments, the Fund’s market value will change in response to interest rate changes and market conditions, among other factors. In general, bond prices rise when interest rates fall and vice versa. ● The Fund’s exposure to high-yield securities may subject the Fund to greater volatility. ● When market conditions are deemed appropriate, the Fund will leverage to the full extent permitted by its investment policies and restrictions and applicable law. Leveraging will exaggerate the effect on net asset value of any increase or decrease in the market value of the Fund’s portfolio. ● The Fund may invest in derivative instruments, which may be more volatile and less liquid, increasing the risk of loss when compared to traditional securities. Certain of the derivative instruments are also subject to the risks of counterparty default and adverse tax treatment. ●Instruments and strategies (such as reverse repurchase agreements, unfunded commitments, tender option bonds, and borrowings) may expose the Fund to many of the same risks as investments in derivatives and may provide leveraged exposure to a particular investment, which will magnify any gains or losses on those investments. ● The Fund’s investments in other investment vehicles subject the Fund to those risks and expenses affecting the investment vehicle. ● The Fund’s investments in foreign securities carry additional risks when compared to U.S. securities, due to the impact of diplomatic, political, or economic developments in the country in question (investments in emerging markets securities are generally subject to an even greater level of risk). ● Investments in syndicated bank loans generally offer a floating interest rate and involve special types of risks. ● The Fund is subject to active trading risks that may increase volatility and impact its ability to achieve its investment objective. ● You may have a gain or loss when you sell your shares. ● It is important to note that the Fund is not guaranteed by the U.S. government. ● Please read the prospectus for more detailed information regarding these and other risks.
| | THE GUGGENHEIM FUNDS SEMI-ANNUAL REPORT | 3 |
ECONOMIC AND MARKET OVERVIEW (Unaudited) | March 31, 2021 |
For the six-month period ended March 31, 2021, the yield on the two-year U.S. Treasury Note rose 3 basis points1 to 0.16% from 0.13%, and the 10-year U.S. Treasury Note climbed 105 basis points to 1.74% from 0.69%. The spread between the two-year U.S. Treasury Note and 10-year U.S. Treasury Note widened from 56 basis points to 158 basis points as investors repositioned in response to fears of inflationary pressure, which the Federal Reserve (the “Fed”) regards as a transitory, short-term phenomenon. Easy financial conditions and low rates will likely support credit over the next few years. With market optimism pulling forward rate hike expectations and causing bond yields to rise, we view this as an opportunity to add incremental yield to portfolios.
Our 2021 U.S. economic growth forecast increased during the first quarter of 2021 from an annualized 5.5% to over 7%, factoring in more fiscal stimulus than previously anticipated. This forecast captures the effect of stimulus representing roughly 11% of 2020–2021 gross domestic product (“GDP”), versus the previous calculation of about 8%. We see strength in the consumer sector and in housing activity. In addition, U.S. vaccinations for COVID-19 continue to accelerate, nearing 3 million doses per day by the end of the first quarter. More than 213 million doses have been administered in the U.S. so far, and about 35% of the U.S. population has been fully vaccinated. The U.S. is seeing the best-case scenario unfold in its vaccine rollout, but other countries have not been as fortunate.
Europe’s vaccine rollout hit a major speedbump during the first quarter when questions surrounding the safety of the AstraZeneca vaccine led several major European countries to temporarily suspend distribution. Safety concerns, coupled with supply constraints, meant that less than 10% of the populations of Germany, France, and Italy had been vaccinated by the end of the first quarter, well under the pace needed to reach 70% inoculated by summer. Any delay in ending the pandemic on a global scale has implications for other countries too, including the U.S., where travel and hospitality workers represent a large share of the unemployed.
Despite vaccination delays in Europe and its implications abroad, we saw meaningful improvement in the domestic labor market during the first quarter as states moved forward with business re-openings. Seasonally adjusted initial jobless claims fell by 97,000 to 684,000 in the week ending March 20, 2021, the lowest level since the pandemic began, before seeing an uptick the following week to 719,000. We saw more positive news across the board in the March payroll report with 916,000 jobs added, and with 156,000 more from revisions. Standing in the way of additional labor market gains are local government restrictions on certain sectors, although easing of these restrictions is expected by summer.
Economic developments drove a sharp increase in U.S. Treasury yields. The market pulled forward expectations of the next Fed rate hike from December 2023 to December 2022, while repricing the long-run terminal Fed funds rate estimate to 2.25% from just 0.55% last August. We do not expect the Fed to raise interest rates as early as the market is anticipating, even though we expect strong GDP growth in coming years.
Year-over-year inflation measures will rise over the next several months due to base effects, which may be compounded by supply chain disruptions in the goods sector and potential capacity constraints for certain services. However, these factors could prove to be short-lived, with base effects set to dampen inflation starting in the summer months. Moreover, the Fed is focused on generating sustainably higher inflation. Even if core inflation rises above the Fed’s 2% target in 2021, the Fed’s focus is on a long-term average of 2%. With years of shortfalls to make up, and the Fed now targeting labor market disparities as part of an expanded definition of full employment, we expect policymakers to remain resolutely patient. Any tapering of asset purchases will likely be deferred until later in 2022, with the first rate hike likely to come sometime after that.
For the six-month period ended March 31, 2021, the Standard & Poor’s® (“S&P 500® ”) Index* returned 19.07%. The MSCI Europe-Australasia-Far East (“EAFE”) Index* returned 20.08%. The return of the MSCI Emerging Markets Index* was 22.43%.
In the bond market, the Bloomberg Barclays U.S. Aggregate Bond Index* posted a -2.73% return for the six-month period, while the Bloomberg Barclays U.S. Corporate High Yield Index* returned 7.36%. The return of the ICE Bank of America (“BofA”) Merrill Lynch 3-Month U.S. Treasury Bill Index* was 0.06% for the six-month period.
The opinions and forecasts expressed may not actually come to pass. This information is subject to change at any time, based on market and other conditions, and should not be construed as a recommendation of any specific security or strategy.
1 | Basis point — one basis point is equal to 0.01%. |
4 | THE GUGGENHEIM FUNDS SEMI-ANNUAL REPORT | |
ECONOMIC AND MARKET OVERVIEW (Unaudited)(concluded) | March 31, 2021 |
*Index Definitions:
The following indices are referenced throughout this report. Indices are unmanaged and not available for direct investment. Index performance does not reflect transaction costs, fees, or expenses.
Bloomberg Barclays Municipal Bond Index is a broad market performance benchmark for the tax-exempt bond market. The bonds included in this index must have a minimum credit rating of at least Baa.
Bloomberg Barclays U.S. Aggregate Bond Index is a broad-based flagship benchmark that measures the investment grade, U.S. dollar-denominated, fixed-rate taxable bond market, including U.S. Treasuries, government-related and corporate securities, mortgage-backed securities or “MBS” (agency fixed-rate and hybrid adjustable-rate mortgage, or “ARM”, pass-throughs), asset-backed securities (“ABS”), and commercial mortgage-backed securities (“CMBS”) (agency and non-agency).
Bloomberg Barclays U.S. Corporate High Yield Index measures the U.S. dollar-denominated, high yield, fixed-rate corporate bond market. Securities are classified as high yield if the middle rating of Moody’s, Fitch, and S&P is Ba1/BB +/BB + or below.
ICE BofA Merrill Lynch 3-Month U.S. Treasury Bill Index is an unmanaged market index of U.S. Treasury securities maturing in 90 days that assumes reinvestment of all income.
MSCI EAFE Index is a free float-adjusted market capitalization index that is designed to measure the equity market performance of developed markets, excluding the U.S. & Canada.
MSCI Emerging Markets Index is a free float-adjusted market capitalization weighted index that is designed to measure equity market performance in the global emerging markets.
S&P 500® is a broad-based index, the performance of which is based on the performance of 500 widely held common stocks chosen for market size, liquidity, and industry group representation.
| | THE GUGGENHEIM FUNDS SEMI-ANNUAL REPORT | 5 |
ABOUT SHAREHOLDERS’ FUND EXPENSES (Unaudited) | |
All mutual funds have operating expenses, and it is important for our shareholders to understand the impact of costs on their investments. Shareholders of a fund incur two types of costs: (i) transaction costs, including sales charges (loads) on purchase payments, reinvested dividends, other distributions, and exchange fees, and (ii) ongoing costs, including management fees, administrative services, and shareholder reports, among others. These ongoing costs, or operating expenses, are deducted from a fund’s gross income and reduce the investment return of the fund.
A fund’s expenses are expressed as a percentage of its average net assets, which is known as the expense ratio. The following examples are intended to help investors understand the ongoing costs (in dollars) of investing in a fund and to compare these costs with the ongoing costs of investing in other mutual funds.
The examples are based on an investment of $1,000 made at the beginning of the period and held for the entire six-month period beginning September 30, 2020 and ending March 31, 2021.
The following tables illustrate the Funds’ costs in two ways:
Table 1. Based on actual Fund return: This section helps investors estimate the actual expenses paid over the period. The “Ending Account Value” shown is derived from the Fund’s actual return, and the fifth column shows the dollar amount that would have been paid by an investor who started with $1,000 in the Fund. Investors may use the information here, together with the amount invested, to estimate the expenses paid over the period. Simply divide the Fund’s account value by $1,000 (for example, an $8,600 account value divided by $1,000 = 8.6), then multiply the result by the number provided under the heading “Expenses Paid During Period.”
Table 2. Based on hypothetical 5% return: This section is intended to help investors compare a fund’s cost with those of other mutual funds. The table provides information about hypothetical account values and hypothetical expenses based on the Fund’s actual expense ratio and an assumed rate of return of 5% per year before expenses, which is not the Fund’s actual return. The hypothetical account values and expenses may not be used to estimate the actual ending account balance or expenses paid during the period. The example is useful in making comparisons because the U.S. Securities and Exchange Commission (the “SEC”) requires all mutual funds to calculate expenses based on the 5% return. Investors can assess a fund’s costs by comparing this hypothetical example with the hypothetical examples that appear in shareholder reports of other funds.
The calculations illustrated above assume no shares were bought or sold during the period. Actual costs may have been higher or lower, depending on the amount of investment and the timing of any purchases or redemptions.
Please note that the expenses shown in the table are meant to highlight your ongoing costs only and do not reflect any transactional costs, such as sales charges (loads) on purchase payments, and contingent deferred sales charges (“CDSC”) on redemptions, if any. Therefore, the second table is useful in comparing ongoing costs only, and will not help you determine the relative total costs of owning different funds. In addition, if these transactional costs were included, your costs would have been higher.
More information about the Funds’ expenses, including annual expense ratios for periods up to five years (subject to the Fund’s inception date), can be found in the Financial Highlights section of this report. For additional information on operating expenses and other shareholder costs, please refer to the appropriate Fund prospectus.
6 | THE GUGGENHEIM FUNDS SEMI-ANNUAL REPORT | |
ABOUT SHAREHOLDERS’ FUND EXPENSES (Unaudited)(continued) | |
| Expense
Ratio1 | Fund
Return | Beginning
Account Value
September 30, 2020 | Ending
Account Value
March 31, 2021 | Expenses
Paid During
Period2 |
Table 1. Based on actual Fund return3 | | | | | |
Diversified Income Fund | | | | | |
A-Class | 0.81% | 11.19% | $ 1,000.00 | $ 1,111.90 | $ 4.26 |
C-Class | 1.54% | 10.80% | 1,000.00 | 1,108.00 | 8.09 |
P-Class | 0.80% | 11.17% | 1,000.00 | 1,111.70 | 4.21 |
Institutional Class | 0.55% | 11.35% | 1,000.00 | 1,113.50 | 2.90 |
High Yield Fund | | | | | |
A-Class | 1.06% | 6.54% | 1,000.00 | 1,065.40 | 5.46 |
C-Class | 1.91% | 6.08% | 1,000.00 | 1,060.80 | 9.81 |
P-Class | 1.17% | 6.41% | 1,000.00 | 1,064.10 | 6.02 |
Institutional Class | 0.87% | 6.60% | 1,000.00 | 1,066.00 | 4.48 |
R6-Class | 0.77% | 6.62% | 1,000.00 | 1,066.20 | 3.97 |
Core Bond Fund | | | | | |
A-Class | 0.79% | (0.99%) | 1,000.00 | 990.10 | 3.92 |
C-Class | 1.54% | (1.36%) | 1,000.00 | 986.40 | 7.63 |
P-Class | 0.79% | (1.04%) | 1,000.00 | 989.60 | 3.92 |
Institutional Class | 0.50% | (0.89%) | 1,000.00 | 991.10 | 2.48 |
Municipal Income Fund | | | | | |
A-Class | 0.80% | 2.65% | 1,000.00 | 1,026.50 | 4.04 |
C-Class | 1.55% | 2.28% | 1,000.00 | 1,022.80 | 7.82 |
P-Class | 0.80% | 2.73% | 1,000.00 | 1,027.30 | 4.04 |
Institutional Class | 0.55% | 2.78% | 1,000.00 | 1,027.80 | 2.78 |
| | THE GUGGENHEIM FUNDS SEMI-ANNUAL REPORT | 7 |
ABOUT SHAREHOLDERS’ FUND EXPENSES (Unaudited)(concluded) | |
| Expense
Ratio1 | Fund
Return | Beginning
Account Value
September 30, 2020 | Ending
Account Value
March 31, 2021 | Expenses
Paid During
Period2 |
Table 2. Based on hypothetical 5% return (before expenses) | | | | |
Diversified Income Fund | | | | | |
A-Class | 0.81% | 5.00% | $ 1,000.00 | $ 1,020.89 | $ 4.08 |
C-Class | 1.54% | 5.00% | 1,000.00 | 1,017.25 | 7.75 |
P-Class | 0.80% | 5.00% | 1,000.00 | 1,020.94 | 4.03 |
Institutional Class | 0.55% | 5.00% | 1,000.00 | 1,022.19 | 2.77 |
High Yield Fund | | | | | |
A-Class | 1.06% | 5.00% | 1,000.00 | 1,019.65 | 5.34 |
C-Class | 1.91% | 5.00% | 1,000.00 | 1,015.41 | 9.60 |
P-Class | 1.17% | 5.00% | 1,000.00 | 1,019.10 | 5.89 |
Institutional Class | 0.87% | 5.00% | 1,000.00 | 1,020.59 | 4.38 |
R6-Class | 0.77% | 5.00% | 1,000.00 | 1,021.09 | 3.88 |
Core Bond Fund | | | | | |
A-Class | 0.79% | 5.00% | 1,000.00 | 1,020.99 | 3.98 |
C-Class | 1.54% | 5.00% | 1,000.00 | 1,017.25 | 7.75 |
P-Class | 0.79% | 5.00% | 1,000.00 | 1,020.99 | 3.98 |
Institutional Class | 0.50% | 5.00% | 1,000.00 | 1,022.44 | 2.52 |
Municipal Income Fund | | | | | |
A-Class | 0.80% | 5.00% | 1,000.00 | 1,020.94 | 4.03 |
C-Class | 1.55% | 5.00% | 1,000.00 | 1,017.20 | 7.80 |
P-Class | 0.80% | 5.00% | 1,000.00 | 1,020.94 | 4.03 |
Institutional Class | 0.55% | 5.00% | 1,000.00 | 1,022.19 | 2.77 |
1 | Annualized and excludes expenses of the underlying funds in which the Funds invest, if any. This ratio represents net expenses, which may include expenses that are excluded from the expense limitation agreement. Excluding these expenses, the net expense ratios for the period would be: |
| | | A-Class | C-Class | P-Class | Institutional
Class | R-6 Class |
| | Diversified Income Fund | 0.77% | 1.51% | 0.77% | 0.52% | N/A |
| | High Yield Fund | 1.06% | 1.88% | 1.14% | 0.84% | 0.74% |
| | Core Bond Fund | 0.78% | 1.52% | 0.77% | 0.49% | N/A |
| | Municipal Income Fund | 0.80% | 1.55% | 0.80% | 0.55% | N/A |
2 | Expenses are equal to the Fund’s annualized expense ratio, net of any applicable fee waivers, multiplied by the average account value over the period, multiplied by 182/365 (to reflect the one-half year period). |
3 | Actual cumulative return at net asset value for the period September 30, 2020 to March 31, 2021. |
8 | THE GUGGENHEIM FUNDS SEMI-ANNUAL REPORT | |
PERFORMANCE REPORT AND FUND PROFILE (Unaudited) | March 31, 2021 |
DIVERSIFIED INCOME FUND
OBJECTIVE: Seeks to achieve high current income with consideration for capital appreciation.
Holdings Diversification (Market Exposure as % of Net Assets)
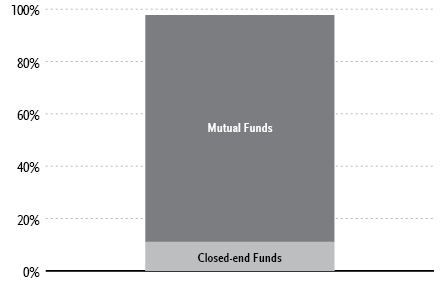
“Holdings Diversification (Market Exposure as % of Net Assets)” excludes any temporary cash investments or investments in Guggenheim Ultra Short Duration Fund.
Inception Dates: |
A-Class | January 29, 2016 |
C-Class | January 29, 2016 |
P-Class | January 29, 2016 |
Institutional Class | January 29, 2016 |
Ten Largest Holdings (% of Total Net Assets) |
Guggenheim High Yield Fund — R6-Class | 22.7% |
Guggenheim Floating Rate Strategies Fund — R6-Class | 18.2% |
Guggenheim RBP Dividend Fund — Institutional Class | 15.9% |
Guggenheim Investment Grade Bond Fund — Institutional Class | 13.6% |
Guggenheim Risk Managed Real Estate Fund — Institutional Class | 10.2% |
Guggenheim World Equity Income Fund — Institutional Class | 5.0% |
Guggenheim Ultra Short Duration Fund — Institutional Class | 1.0% |
Virtus AllianzGI Diversified Income & Convertible Fund | 0.4% |
First Trust Energy Income and Growth Fund | 0.4% |
Calamos Convertible Opportunities and Income Fund | 0.4% |
Top Ten Total | 87.8% |
| | |
“Ten Largest Holdings” excludes any temporary cash or derivative investments. |
| | THE GUGGENHEIM FUNDS SEMI-ANNUAL REPORT | 9 |
PERFORMANCE REPORT AND FUND PROFILE (Unaudited)(concluded) | March 31, 2021 |
Average Annual Returns*
Periods Ended March 31, 2021
| 6 Month† | 1 Year | 5 Year | Since
Inception
(01/29/16) |
A-Class Shares | 11.19% | 21.01% | 5.83% | 6.16% |
A-Class Shares with sales charge‡ | 6.76% | 16.18% | 4.97% | 5.33% |
C-Class Shares | 10.80% | 20.10% | 5.05% | 5.38% |
C-Class Shares with CDSC§ | 9.80% | 19.10% | 5.05% | 5.38% |
P-Class Shares | 11.17% | 21.00% | 5.82% | 6.15% |
Institutional Class Shares | 11.35% | 21.28% | 6.08% | 6.42% |
Bloomberg Barclays U.S. Aggregate Bond Index | (2.73%) | 0.71% | 3.10% | 3.32% |
* | The performance data above represents past performance that is not predictive of future results. The investment return and principal value of an investment in the Fund will fluctuate so that an investor’s shares, when redeemed, may be worth more or less than their original cost. Returns are historical and include changes in principal and reinvested dividends and capital gains and do not reflect the effect of taxes. The Bloomberg Barclays U.S. Aggregate Bond Index is an unmanaged index and, unlike the Fund, has no management fees or operating expenses to reduce its reported return. |
† | 6 month returns are not annualized. |
‡ | Fund returns are calculated using the maximum sales charge of 4.00%. |
§ | Fund returns include a CDSC of 1% if redeemed within 12 months of purchase. |
10 | THE GUGGENHEIM FUNDS SEMI-ANNUAL REPORT | |
SCHEDULE OF INVESTMENTS (Unaudited) | March 31, 2021 |
DIVERSIFIED INCOME FUND | |
| | Shares | | | Value | |
MUTUAL FUNDS† - 86.6% |
Guggenheim High Yield Fund — R6-Class1 | | | 154,259 | | | $ | 1,661,370 | |
Guggenheim Floating Rate Strategies Fund — R6-Class1 | | | 53,521 | | | | 1,333,203 | |
Guggenheim RBP Dividend Fund — Institutional Class1 | | | 82,486 | | | | 1,162,222 | |
Guggenheim Investment Grade Bond Fund — Institutional Class1 | | | 50,687 | | | | 994,977 | |
Guggenheim Risk Managed Real Estate Fund — Institutional Class1 | | | 22,267 | | | | 745,067 | |
Guggenheim World Equity Income Fund — Institutional Class1 | | | 20,169 | | | | 370,505 | |
Guggenheim Ultra Short Duration Fund — Institutional Class1 | | | 7,191 | | | | 71,618 | |
Total Mutual Funds | | | | |
(Cost $5,692,710) | | | | | | | 6,338,962 | |
| | | | | | | | | |
CLOSED-END FUNDS† - 11.1% |
Virtus AllianzGI Diversified Income & Convertible Fund | | | 904 | | | | 28,413 | |
First Trust Energy Income and Growth Fund | | | 2,100 | | | | 28,119 | |
Calamos Convertible Opportunities and Income Fund | | | 1,944 | | | | 27,644 | |
Neuberger Berman High Yield Strategies Fund, Inc. | | | 2,113 | | | | 27,237 | |
Royce Value Trust, Inc. | | | 1,500 | | | | 27,165 | |
John Hancock Premium Dividend Fund | | | 1,750 | | | | 26,127 | |
Eaton Vance Tax-Advantaged Dividend Income Fund | | | 962 | | | | 25,272 | |
Western Asset High Income Fund II, Inc. | | | 3,448 | | | | 23,791 | |
BlackRock Enhanced Equity Dividend Trust | | | 2,500 | | | | 23,650 | |
PIMCO High Income Fund | | | 3,500 | | | | 23,590 | |
John Hancock Investors Trust | | | 1,278 | | | | 22,991 | |
Invesco High Income Trust II | | | 1,650 | | | | 22,968 | |
Cohen & Steers REIT and Preferred and Income Fund, Inc. | | | 940 | | | | 22,927 | |
John Hancock Preferred Income Fund II | | | 1,100 | | | | 22,880 | |
Eaton Vance Enhanced Equity Income Fund II | | | 1,058 | | | | 22,863 | |
Eaton Vance Tax-Managed Buy-Write Opportunities Fund | | | 1,470 | | | | 22,770 | |
Ares Dynamic Credit Allocation Fund, Inc. | | | 1,500 | | | | 22,545 | |
Eaton Vance Tax-Managed Buy-Write Income Fund | | | 1,400 | | | | 22,036 | |
Brookfield Real Assets Income Fund, Inc. | | | 1,040 | | | | 21,528 | |
Western Asset Premier Bond Fund | | | 1,529 | | | | 21,482 | |
Pioneer High Income Trust | | | 2,284 | | | | 21,401 | |
Tekla Life Sciences Investors | | | 1,050 | | | | 20,695 | |
DoubleLine Income Solutions Fund | | | 1,123 | | | | 20,394 | |
Reaves Utility Income Fund | | | 600 | | | | 20,100 | |
BlackRock Limited Duration Income Trust | | | 1,200 | | | | 20,100 | |
KKR Income Opportunities Fund | | | 1,266 | | | | 20,028 | |
PIMCO Dynamic Income Fund | | | 695 | | | | 19,564 | |
John Hancock Income Securities Trust | | | 1,250 | | | | 19,513 | |
PGIM High Yield Bond Fund, Inc. | | | 1,242 | | | | 19,450 | |
Eaton Vance Limited Duration Income Fund | | | 1,500 | | | | 18,945 | |
Blackstone Strategic Credit Fund | | | 1,419 | | | | 18,915 | |
Voya Infrastructure Industrials and Materials Fund | | | 1,500 | | | | 18,570 | |
Ivy High Income Opportunities Fund | | | 1,308 | | | | 17,841 | |
BlackRock Credit Allocation Income Trust | | | 1,205 | | | | 17,689 | |
Western Asset Emerging Markets Debt Fund, Inc. | | | 1,330 | | | | 17,583 | |
Western Asset Global Corporate Defined Opportunity Fund, Inc. | | | 983 | | | | 17,311 | |
Apollo Senior Floating Rate Fund, Inc. | | | 1,074 | | | | 15,960 | |
Total Closed-End Funds | | | | |
(Cost $677,137) | | | | | | | 810,057 | |
| | | | | | | | | |
MONEY MARKET FUND† - 1.9% |
Goldman Sachs Financial Square Treasury Instruments Fund — Institutional Shares, 0.01%2 | | | 140,699 | | | | 140,699 | |
Total Money Market Fund | | | | |
(Cost $140,699) | | | | | | | 140,699 | |
| | | | | | | | | |
Total Investments - 99.6% | | | | |
(Cost $6,510,546) | | $ | 7,289,718 | |
Other Assets & Liabilities, net - 0.4% | | | 29,993 | |
Total Net Assets - 100.0% | | $ | 7,319,711 | |
† | Value determined based on Level 1 inputs — See Note 4. |
1 | Affiliated issuer. |
2 | Rate indicated is the 7-day yield as of March 31, 2021. |
| | REIT — Real Estate Investment Trust |
| | |
| | See Sector Classification in Other Information section. |
SEE NOTES TO FINANCIAL STATEMENTS. | THE GUGGENHEIM FUNDS SEMI-ANNUAL REPORT | 11 |
SCHEDULE OF INVESTMENTS (Unaudited)(concluded) | March 31, 2021 |
DIVERSIFIED INCOME FUND | |
The following table summarizes the inputs used to value the Fund’s investments at March 31, 2021 (See Note 4 in the Notes to Financial Statements):
Investments in Securities (Assets) | | Level 1
Quoted
Prices | | | Level 2
Significant
Observable
Inputs | | | Level 3
Significant
Unobservable
Inputs | | | Total | |
Mutual Funds | | $ | 6,338,962 | | | $ | — | | | $ | — | | | $ | 6,338,962 | |
Closed-End Funds | | | 810,057 | | | | — | | | | — | | | | 810,057 | |
Money Market Fund | | | 140,699 | | | | — | | | | — | | | | 140,699 | |
Total Assets | | $ | 7,289,718 | | | $ | — | | | $ | — | | | $ | 7,289,718 | |
Affiliated Transactions
Investments representing 5% or more of the outstanding voting shares of a company, or control of or by, or common control under Guggenheim Investments (“GI”), result in that company being considered an affiliated issuer, as defined in the 1940 Act.
Transactions during the period ended March 31, 2021, in which the company is an affiliated issuer, were as follows:
Security Name | | Value
09/30/20 | | | Additions | | | Reductions | | | Realized
Gain (Loss) | | | Change in
Unrealized
Appreciation
(Depreciation) | | | Value
03/31/21 | | | Shares
03/31/21 | | | Investment
Income | | | Capital Gain
Distributions | |
Mutual Funds | | | | | | | | | | | | | | | | | | | | | | | | | | | | | | | | | | | | |
Guggenheim Floating Rate Strategies Fund — R6-Class | | $ | 1,051,568 | | | $ | 253,129 | | | $ | (15,280 | ) | | $ | (583 | ) | | $ | 44,369 | | | $ | 1,333,203 | | | | 53,521 | | | $ | 23,158 | | | $ | — | |
Guggenheim High Yield Fund — R6-Class | | | 1,501,803 | | | | 341,134 | | | | (239,993 | ) | | | (4,411 | ) | | | 62,837 | | | | 1,661,370 | | | | 154,259 | | | | 40,342 | | | | — | |
Guggenheim Investment Grade Bond Fund — Institutional Class | | | 1,312,112 | | | | 419,911 | | | | (686,964 | ) | | | 20,550 | | | | (70,632 | ) | | | 994,977 | | | | 50,687 | | | | 17,807 | | | | 27,120 | |
Guggenheim RBP Dividend Fund — Institutional Class | | | 614,550 | | | | 299,788 | | | | — | | | | — | | | | 247,884 | | | | 1,162,222 | | | | 82,486 | | | | 19,799 | | | | — | |
Guggenheim Risk Managed Real Estate Fund — Institutional Class | | | 625,585 | | | | 51,133 | | | | — | | | | — | | | | 68,349 | | | | 745,067 | | | | 22,267 | | | | 7,779 | | | | 35,865 | |
Guggenheim Ultra Short Duration Fund — Institutional Class | | | 343,979 | | | | 774 | | | | (272,995 | ) | | | 4,955 | | | | (5,095 | ) | | | 71,618 | | | | 7,191 | | | | 774 | | | | — | |
Guggenheim World Equity Income Fund — Institutional Class | | | 307,075 | | | | 3,525 | | | | (9,886 | ) | | | 1,762 | | | | 68,029 | | | | 370,505 | | | | 20,169 | | | | 3,524 | | | | — | |
| | | $ | 5,756,672 | | | $ | 1,369,394 | | | $ | (1,225,118 | ) | | $ | 22,273 | | | $ | 415,741 | | | $ | 6,338,962 | | | | | | | $ | 113,183 | | | $ | 62,985 | |
12 | THE GUGGENHEIM FUNDS SEMI-ANNUAL REPORT | SEE NOTES TO FINANCIAL STATEMENTS. |
STATEMENT OF ASSETS AND LIABILITIES (Unaudited) |
March 31, 2021 |
Assets: |
Investments in unaffiliated issuers, at value (cost $817,836) | | $ | 950,756 | |
Investments in affiliated issuers, at value (cost $5,692,710) | | | 6,338,962 | |
Cash | | | 451 | |
Prepaid expenses | | | 44,044 | |
Receivables: |
Dividends | | | 29,525 | |
Investment Adviser | | | 12,521 | |
Total assets | | | 7,376,259 | |
| | | | | |
Liabilities: |
Payable for: |
Securities purchased | | | 28,573 | |
Professional fees | | | 17,093 | |
Fund accounting/administration fees | | | 5,137 | |
Transfer agent/maintenance fees | | | 2,479 | |
Trustees’ fees* | | | 755 | |
Distribution and service fees | | | 278 | |
Fund shares redeemed | | | 37 | |
Miscellaneous | | | 2,196 | |
Total liabilities | | | 56,548 | |
Net assets | | $ | 7,319,711 | |
| | | | | |
Net assets consist of: |
Paid in capital | | $ | 6,771,780 | |
Total distributable earnings (loss) | | | 547,931 | |
Net assets | | $ | 7,319,711 | |
| | | | | |
A-Class: |
Net assets | | $ | 325,996 | |
Capital shares outstanding | | | 11,800 | |
Net asset value per share | | $ | 27.63 | |
Maximum offering price per share (Net asset value divided by 96.00%) | | $ | 28.78 | |
| | | | | |
C-Class: |
Net assets | | $ | 217,866 | |
Capital shares outstanding | | | 7,911 | |
Net asset value per share | | $ | 27.54 | |
| | | | | |
P-Class: |
Net assets | | $ | 141,868 | |
Capital shares outstanding | | | 5,139 | |
Net asset value per share | | $ | 27.61 | |
| | | | | |
Institutional Class: |
Net assets | | $ | 6,633,981 | |
Capital shares outstanding | | | 240,205 | |
Net asset value per share | | $ | 27.62 | |
STATEMENT OF OPERATIONS (Unaudited) |
Six Months Ended March 31, 2021 |
Investment Income: |
Dividends from securities of unaffiliated issuers | | $ | 31,067 | |
Dividends from securities of affiliated issuers | | | 113,183 | |
Total investment income | | | 144,250 | |
| | | | | |
Expenses: |
Management fees | | | 26,062 | |
Distribution and service fees: |
A-Class | | | 352 | |
C-Class | | | 1,040 | |
P-Class | | | 169 | |
Transfer agent/maintenance fees: |
A-Class | | | 699 | |
C-Class | | | 529 | |
P-Class | | | 319 | |
Institutional Class | | | 11,224 | |
Registration fees | | | 43,519 | |
Professional fees | | | 20,801 | |
Fund accounting/administration fees | | | 16,953 | |
Trustees’ fees* | | | 8,567 | |
Custodian fees | | | 3,369 | |
Tax expense | | | 921 | |
Line of credit fees | | | 123 | |
Miscellaneous | | | 2,851 | |
Total expenses | | | 137,498 | |
Less: |
Expenses reimbursed by Adviser: |
A-Class | | | (3,114 | ) |
C-Class | | | (2,325 | ) |
P-Class | | | (1,482 | ) |
Institutional Class | | | (65,484 | ) |
Expenses waived by Adviser | | | (44,318 | ) |
Total waived/reimbursed expenses | | | (116,723 | ) |
Net expenses | | | 20,775 | |
Net investment income | | | 123,475 | |
| | | | | |
Net Realized and Unrealized Gain (Loss): |
Net realized gain (loss) on: |
Investments in unaffiliated issuers | | | 7,062 | |
Investments in affiliated issuers | | | 22,273 | |
Distributions received from affiliated investment companies | | | 62,985 | |
Net realized gain | | | 92,320 | |
Net change in unrealized appreciation (depreciation) on: |
Investments in unaffiliated issuers | | | 112,195 | |
Investments in affiliated issuers | | | 415,741 | |
Net change in unrealized appreciation (depreciation) | | | 527,936 | |
Net realized and unrealized gain | | | 620,256 | |
Net increase in net assets resulting from operations | | $ | 743,731 | |
* | Relates to Trustees not deemed “interested persons” within the meaning of Section 2(a)(19) of the 1940 Act. |
SEE NOTES TO FINANCIAL STATEMENTS. | THE GUGGENHEIM FUNDS SEMI-ANNUAL REPORT | 13 |
STATEMENTS OF CHANGES IN NET ASSETS |
| | Six Months Ended
March 31, 2021
(Unaudited) | | | Year Ended
September 30,
2020 | |
Increase (Decrease) in Net Assets from Operations: | | | | | | | | |
Net investment income | | $ | 123,475 | | | $ | 225,886 | |
Net realized gain (loss) on investments | | | 92,320 | | | | (347,868 | ) |
Net change in unrealized appreciation (depreciation) on investments | | | 527,936 | | | | (129,464 | ) |
Net increase (decrease) in net assets resulting from operations | | | 743,731 | | | | (251,446 | ) |
| | | | | | | | | |
Distributions to shareholders: | | | | | | | | |
A-Class | | | (4,855 | ) | | | (9,360 | ) |
C-Class | | | (2,853 | ) | | | (14,474 | ) |
P-Class | | | (2,349 | ) | | | (4,452 | ) |
Institutional Class | | | (117,412 | ) | | | (223,499 | ) |
Total distributions to shareholders | | | (127,469 | ) | | | (251,785 | ) |
| | | | | | | | | |
Capital share transactions: | | | | | | | | |
Proceeds from sale of shares | | | | | | | | |
A-Class | | | 33,999 | | | | 8,040 | |
C-Class | | | 100 | | | | 93,138 | |
P-Class | | | 880 | | | | 1,813 | |
Institutional Class | | | — | | | | 44,460 | |
Distributions reinvested | | | | | | | | |
A-Class | | | 4,855 | | | | 9,360 | |
C-Class | | | 2,853 | | | | 14,474 | |
P-Class | | | 2,349 | | | | 4,452 | |
Institutional Class | | | 117,412 | | | | 223,499 | |
Cost of shares redeemed | | | | | | | | |
A-Class | | | (4,865 | ) | | | (10,391 | ) |
C-Class | | | (274 | ) | | | (648,757 | ) |
P-Class | | | (1,163 | ) | | | (1,269 | ) |
Institutional Class | | | (9,500 | ) | | | (69,589 | ) |
Net increase (decrease) from capital share transactions | | | 146,646 | | | | (330,770 | ) |
Net increase (decrease) in net assets | | | 762,908 | | | | (834,001 | ) |
| | | | | | | | | |
Net assets: | | | | | | | | |
Beginning of period | | | 6,556,803 | | | | 7,390,804 | |
End of period | | $ | 7,319,711 | | | $ | 6,556,803 | |
| | | | | | | | | |
Capital share activity: | | | | | | | | |
Shares sold | | | | | | | | |
A-Class | | | 1,236 | | | | 299 | |
C-Class | | | 4 | | | | 3,804 | |
P-Class | | | 33 | | | | 72 | |
Institutional Class | | | — | | | | 1,735 | |
Shares issued from reinvestment of distributions | | | | | | | | |
A-Class | | | 182 | | | | 362 | |
C-Class | | | 108 | | | | 547 | |
P-Class | | | 88 | | | | 173 | |
Institutional Class | | | 4,412 | | | | 8,661 | |
Shares redeemed | | | | | | | | |
A-Class | | | (183 | ) | | | (387 | ) |
C-Class | | | (11 | ) | | | (26,782 | ) |
P-Class | | | (44 | ) | | | (51 | ) |
Institutional Class | | | (354 | ) | | | (2,776 | ) |
Net increase (decrease) in shares | | | 5,471 | | | | (14,343 | ) |
14 | THE GUGGENHEIM FUNDS SEMI-ANNUAL REPORT | SEE NOTES TO FINANCIAL STATEMENTS. |
This table is presented to show selected data for a share outstanding throughout each period and to assist shareholders in evaluating a Fund’s performance for the periods presented.
A-Class | | Six Months Ended
March 31, 2021a | | | Year Ended
September 30,
2020 | | | Year Ended
September 30,
2019 | | | Year Ended
September 30,
2018 | | | Year Ended
September 30,
2017 | | | Period Ended
September 30,
2016b | |
Per Share Data |
Net asset value, beginning of period | | $ | 25.27 | | | $ | 26.99 | | | $ | 26.70 | | | $ | 27.58 | | | $ | 27.12 | | | $ | 25.00 | |
Income (loss) from investment operations: |
Net investment income (loss)c | | | .45 | | | | .81 | | | | .86 | | | | .91 | | | | .96 | | | | .76 | |
Net gain (loss) on investments (realized and unrealized) | | | 2.37 | | | | (1.63 | ) | | | .50 | | | | (.70 | ) | | | .89 | | | | 2.03 | |
Total from investment operations | | | 2.82 | | | | (.82 | ) | | | 1.36 | | | | .21 | | | | 1.85 | | | | 2.79 | |
Less distributions from: |
Net investment income | | | (.46 | ) | | | (.81 | ) | | | (.77 | ) | | | (.90 | ) | | | (.95 | ) | | | (.67 | ) |
Net realized gains | | | — | | | | (.09 | ) | | | (.30 | ) | | | (.19 | ) | | | (.44 | ) | | | — | |
Total distributions | | | (.46 | ) | | | (.90 | ) | | | (1.07 | ) | | | (1.09 | ) | | | (1.39 | ) | | | (.67 | ) |
Net asset value, end of period | | $ | 27.63 | | | $ | 25.27 | | | $ | 26.99 | | | $ | 26.70 | | | $ | 27.58 | | | $ | 27.12 | |
|
Total Returnd | | | 11.19 | % | | | (3.06 | %) | | | 5.31 | % | | | 0.78 | % | | | 7.00 | % | | | 11.29 | % |
Ratios/Supplemental Data |
Net assets, end of period (in thousands) | | $ | 326 | | | $ | 267 | | | $ | 278 | | | $ | 141 | | | $ | 138 | | | $ | 132 | |
Ratios to average net assets: |
Net investment income (loss) | | | 3.38 | % | | | 3.14 | % | | | 3.26 | % | | | 3.37 | % | | | 3.53 | % | | | 4.35 | % |
Total expensese | | | 4.29 | % | | | 4.24 | % | | | 4.03 | % | | | 4.83 | % | | | 4.16 | % | | | 3.31 | % |
Net expensesf,g,h | | | 0.81 | % | | | 0.83 | % | | | 0.85 | % | | | 0.84 | % | | | 0.85 | % | | | 0.77 | % |
Portfolio turnover rate | | | 19 | % | | | 66 | % | | | 58 | % | | | 37 | % | | | 44 | % | | | 83 | % |
C-Class | | Six Months Ended
March 31, 2021a | | | Year Ended
September 30,
2020 | | | Year Ended
September 30,
2019 | | | Year Ended
September 30,
2018 | | | Year Ended
September 30,
2017 | | | Period Ended
September 30,
2016b | |
Per Share Data |
Net asset value, beginning of period | | $ | 25.19 | | | $ | 27.00 | | | $ | 26.69 | | | $ | 27.56 | | | $ | 27.11 | | | $ | 25.00 | |
Income (loss) from investment operations: |
Net investment income (loss)c | | | .35 | | | | .60 | | | | .69 | | | | .71 | | | | .76 | | | | .63 | |
Net gain (loss) on investments (realized and unrealized) | | | 2.36 | | | | (1.62 | ) | | | .46 | | | | (.69 | ) | | | .87 | | | | 2.03 | |
Total from investment operations | | | 2.71 | | | | (1.02 | ) | | | 1.15 | | | | .02 | | | | 1.63 | | | | 2.66 | |
Less distributions from: |
Net investment income | | | (.36 | ) | | | (.70 | ) | | | (.54 | ) | | | (.70 | ) | | | (.74 | ) | | | (.55 | ) |
Net realized gains | | | — | | | | (.09 | ) | | | (.30 | ) | | | (.19 | ) | | | (.44 | ) | | | — | |
Total distributions | | | (.36 | ) | | | (.79 | ) | | | (.84 | ) | | | (.89 | ) | | | (1.18 | ) | | | (.55 | ) |
Net asset value, end of period | | $ | 27.54 | | | $ | 25.19 | | | $ | 27.00 | | | $ | 26.69 | | | $ | 27.56 | | | $ | 27.11 | |
|
Total Returnd | | | 10.80 | % | | | (3.77 | %) | | | 4.50 | % | | | 0.08 | % | | | 6.17 | % | | | 10.74 | % |
Ratios/Supplemental Data |
Net assets, end of period (in thousands) | | $ | 218 | | | $ | 197 | | | $ | 816 | | | $ | 145 | | | $ | 137 | | | $ | 118 | |
Ratios to average net assets: |
Net investment income (loss) | | | 2.61 | % | | | 2.26 | % | | | 2.59 | % | | | 2.63 | % | | | 2.78 | % | | | 3.58 | % |
Total expensese | | | 5.05 | % | | | 4.86 | % | | | 4.74 | % | | | 5.65 | % | | | 5.13 | % | | | 4.05 | % |
Net expensesf,g,h | | | 1.54 | % | | | 1.58 | % | | | 1.59 | % | | | 1.59 | % | | | 1.60 | % | | | 1.52 | % |
Portfolio turnover rate | | | 19 | % | | | 66 | % | | | 58 | % | | | 37 | % | | | 44 | % | | | 83 | % |
SEE NOTES TO FINANCIAL STATEMENTS. | THE GUGGENHEIM FUNDS SEMI-ANNUAL REPORT | 15 |
FINANCIAL HIGHLIGHTS (continued) |
This table is presented to show selected data for a share outstanding throughout each period and to assist shareholders in evaluating a Fund’s performance for the periods presented.
P-Class | | Six Months Ended
March 31, 2021a | | | Year Ended
September 30,
2020 | | | Year Ended
September 30,
2019 | | | Year Ended
September 30,
2018 | | | Year Ended
September 30,
2017 | | | Period Ended
September 30,
2016b | |
Per Share Data |
Net asset value, beginning of period | | $ | 25.25 | | | $ | 26.97 | | | $ | 26.70 | | | $ | 27.58 | | | $ | 27.11 | | | $ | 25.00 | |
Income (loss) from investment operations: |
Net investment income (loss)c | | | .44 | | | | .81 | | | | .85 | | | | .91 | | | | .95 | | | | .74 | |
Net gain (loss) on investments (realized and unrealized) | | | 2.38 | | | | (1.63 | ) | | | .51 | | | | (.70 | ) | | | .89 | | | | 2.05 | |
Total from investment operations | | | 2.82 | | | | (.82 | ) | | | 1.36 | | | | .21 | | | | 1.84 | | | | 2.79 | |
Less distributions from: |
Net investment income | | | (.46 | ) | | | (.81 | ) | | | (.79 | ) | | | (.90 | ) | | | (.93 | ) | | | (.68 | ) |
Net realized gains | | | — | | | | (.09 | ) | | | (.30 | ) | | | (.19 | ) | | | (.44 | ) | | | — | |
Total distributions | | | (.46 | ) | | | (.90 | ) | | | (1.09 | ) | | | (1.09 | ) | | | (1.37 | ) | | | (.68 | ) |
Net asset value, end of period | | $ | 27.61 | | | $ | 25.25 | | | $ | 26.97 | | | $ | 26.70 | | | $ | 27.58 | | | $ | 27.11 | |
|
Total Return | | | 11.17 | % | | | (3.03 | %) | | | 5.23 | % | | | 0.82 | % | | | 7.00 | % | | | 11.27 | % |
Ratios/Supplemental Data |
Net assets, end of period (in thousands) | | $ | 142 | | | $ | 128 | | | $ | 131 | | | $ | 125 | | | $ | 123 | | | $ | 111 | |
Ratios to average net assets: |
Net investment income (loss) | | | 3.35 | % | | | 3.14 | % | | | 3.22 | % | | | 3.37 | % | | | 3.51 | % | | | 4.32 | % |
Total expensese | | | 4.27 | % | | | 4.19 | % | | | 3.97 | % | | | 4.82 | % | | | 4.23 | % | | | 3.21 | % |
Net expensesf,g,h | | | 0.80 | % | | | 0.83 | % | | | 0.85 | % | | | 0.84 | % | | | 0.85 | % | | | 0.80 | % |
Portfolio turnover rate | | | 19 | % | | | 66 | % | | | 58 | % | | | 37 | % | | | 44 | % | | | 83 | % |
16 | THE GUGGENHEIM FUNDS SEMI-ANNUAL REPORT | SEE NOTES TO FINANCIAL STATEMENTS. |
FINANCIAL HIGHLIGHTS (concluded) |
This table is presented to show selected data for a share outstanding throughout each period and to assist shareholders in evaluating a Fund’s performance for the periods presented.
Institutional Class | | Six Months Ended
March 31, 2021a | | | Year Ended
September 30,
2020 | | | Year Ended
September 30,
2019 | | | Year Ended
September 30,
2018 | | | Year Ended
September 30,
2017 | | | Period Ended
September 30,
2016b | |
Per Share Data |
Net asset value, beginning of period | | $ | 25.26 | | | $ | 26.98 | | | $ | 26.72 | | | $ | 27.59 | | | $ | 27.11 | | | $ | 25.00 | |
Income (loss) from investment operations: |
Net investment income (loss)c | | | .48 | | | | .87 | | | | .92 | | | | .98 | | | | 1.03 | | | | .79 | |
Net gain (loss) on investments (realized and unrealized) | | | 2.37 | | | | (1.63 | ) | | | .49 | | | | (.70 | ) | | | .89 | | | | 2.04 | |
Total from investment operations | | | 2.85 | | | | (.76 | ) | | | 1.41 | | | | .28 | | | | 1.92 | | | | 2.83 | |
Less distributions from: |
Net investment income | | | (.49 | ) | | | (.87 | ) | | | (.85 | ) | | | (.96 | ) | | | (1.00 | ) | | | (.72 | ) |
Net realized gains | | | — | | | | (.09 | ) | | | (.30 | ) | | | (.19 | ) | | | (.44 | ) | | | — | |
Total distributions | | | (.49 | ) | | | (.96 | ) | | | (1.15 | ) | | | (1.15 | ) | | | (1.44 | ) | | | (.72 | ) |
Net asset value, end of period | | $ | 27.62 | | | $ | 25.26 | | | $ | 26.98 | | | $ | 26.72 | | | $ | 27.59 | | | $ | 27.11 | |
|
Total Return | | | 11.35 | % | | | (2.82 | %) | | | 5.52 | % | | | 1.06 | % | | | 7.30 | % | | | 11.44 | % |
Ratios/Supplemental Data |
Net assets, end of period (in thousands) | | $ | 6,634 | | | $ | 5,965 | | | $ | 6,165 | | | $ | 5,757 | | | $ | 5,619 | | | $ | 5,239 | |
Ratios to average net assets: |
Net investment income (loss) | | | 3.60 | % | | | 3.39 | % | | | 3.47 | % | | | 3.62 | % | | | 3.78 | % | | | 4.57 | % |
Total expensese | | | 3.90 | % | | | 3.78 | % | | | 3.58 | % | | | 4.42 | % | | | 3.83 | % | | | 2.93 | % |
Net expensesf,g,h | | | 0.55 | % | | | 0.58 | % | | | 0.60 | % | | | 0.60 | % | | | 0.59 | % | | | 0.54 | % |
Portfolio turnover rate | | | 19 | % | | | 66 | % | | | 58 | % | | | 37 | % | | | 44 | % | | | 83 | % |
a | Unaudited figures for the period ended March 31, 2021. Percentage amounts for the period, except total return and portfolio turnover rate, have been annualized. |
b | Since commencement of operations: January 29, 2016. Percentage amounts for the period, except total return and portfolio turnover rate, have been annualized. |
c | Net investment income (loss) per share was computed using average shares outstanding throughout the period. |
d | Total return does not reflect the impact of any applicable sales charges. |
e | Does not include expenses of the underlying funds in which the Fund invests. |
f | Net expense information reflects the expense ratios after expense waivers and reimbursements, as applicable. |
g | The portion of the ratios of net expenses to average net assets attributable to recoupments of prior fee reductions or expense reimbursements for the years presented was as follows: |
| | | 03/31/21 | 09/30/20 | 09/30/19 | 09/30/18 | 09/30/17 |
| | A-Class | — | — | — | — | 0.19% |
| | C-Class | — | 0.00%* | — | — | 0.19% |
| | P-Class | — | 0.00%* | — | — | 0.16% |
| | Institutional Class | — | 0.00%* | — | — | 0.16% |
h | Net expenses may include expenses that are excluded from the expense limitation agreement. Excluding these expenses, the net expense ratios for the years presented would be: |
| | | 03/31/21 | 09/30/20 | 09/30/19 | 09/30/18 | 09/30/17 | 09/30/16 |
| | A-Class | 0.77% | 0.82% | 0.85% | 0.84% | 0.82% | 0.76% |
| | C-Class | 1.51% | 1.57% | 1.59% | 1.58% | 1.57% | 1.52% |
| | P-Class | 0.77% | 0.82% | 0.85% | 0.84% | 0.82% | 0.79% |
| | Institutional Class | 0.52% | 0.57% | 0.60% | 0.59% | 0.57% | 0.54% |
SEE NOTES TO FINANCIAL STATEMENTS. | THE GUGGENHEIM FUNDS SEMI-ANNUAL REPORT | 17 |
PERFORMANCE REPORT AND FUND PROFILE (Unaudited) | March 31, 2021 |
HIGH YIELD FUND
OBJECTIVE: Seeks high current income. Capital appreciation is a secondary objective.
Holdings Diversification (Market Exposure as % of Net Assets)
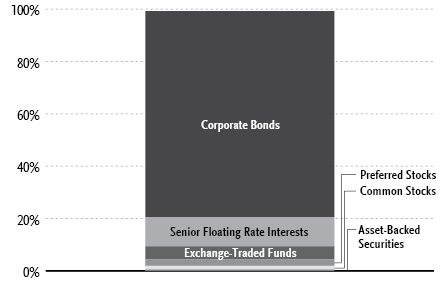
“Holdings Diversification (Market Exposure as % of Net Assets)” excludes any temporary cash investments.
Portfolio Composition by Quality Rating1 |
Rating | % of Total
Investments |
Fixed Income Instruments | |
AAA | 0.4% |
AA | 0.2% |
BBB | 8.0% |
BB | 47.4% |
B | 25.2% |
CCC | 6.2% |
NR2 | 1.1% |
Other Instruments | 11.5% |
Total Investments | 100.0% |
Inception Dates: |
A-Class | August 5, 1996 |
C-Class | May 1, 2000 |
P-Class | May 1, 2015 |
Institutional Class | July 11, 2008 |
R6-Class | May 15, 2017 |
Ten Largest Holdings (% of Total Net Assets) |
SPDR Bloomberg Barclays High Yield Bond ETF | 4.9% |
Hunt Companies, Inc., 5.25% | 1.2% |
CCO Holdings LLC / CCO Holdings Capital Corp., 4.50% | 1.0% |
Kraft Heinz Foods Co., 5.00% | 0.9% |
Hunt Companies, Inc., 6.25% | 0.9% |
Howmet Aerospace, Inc., 5.95% | 0.8% |
LPL Holdings, Inc., 4.00% | 0.8% |
Virgin Media Secured Finance plc, 4.50% | 0.8% |
LBC Tank Terminals Holding Netherlands BV, 6.88% | 0.8% |
PowerTeam Services LLC, 9.03% | 0.8% |
Top Ten Total | 12.9% |
| | |
“Ten Largest Holdings” excludes any temporary cash or derivative investments. |
1 | Source: BlackRock Solutions. Credit quality ratings are measured on a scale that generally ranges from AAA (highest) to D (lowest). All securities except for those labeled “NR” have been rated by Moody’s, Standard & Poor’s (“S&P”), or Fitch, each of which is a Nationally Recognized Statistical Rating Organization (“NRSRO”). For purposes of this presentation, when ratings are available from more than one agency, the highest rating is used. Guggenheim Investments has converted ratings to the equivalent S&P rating. Security ratings are determined at the time of purchase and may change thereafter. |
2 | NR (not rated) securities do not necessarily indicate low credit quality. |
18 | THE GUGGENHEIM FUNDS SEMI-ANNUAL REPORT | |
PERFORMANCE REPORT AND FUND PROFILE (Unaudited)(concluded) | March 31, 2021 |
Average Annual Returns*
Periods Ended March 31, 2021
| 6 Month† | 1 Year | 5 Year | 10 Year |
A-Class Shares | 6.54% | 22.44% | 6.91% | 5.46% |
A-Class Shares with sales charge‡ | 2.29% | 17.50% | 6.05% | 4.95% |
C-Class Shares | 6.08% | 21.43% | 6.11% | 4.66% |
C-Class Shares with CDSC§ | 5.08% | 20.43% | 6.11% | 4.66% |
Institutional Class Shares | 6.60% | 22.55% | 7.21% | 5.72% |
Bloomberg Barclays U.S. Corporate High Yield Index | 7.36% | 23.72% | 8.06% | 6.48% |
��
| 6 Month† | 1 Year | 5 Year | Since
Inception
(05/01/15) |
P-Class Shares | 6.41% | 22.23% | 6.91% | 4.97% |
Bloomberg Barclays U.S. Corporate High Yield Index | 7.36% | 23.72% | 8.06% | 5.87% |
| 6 Month† | 1 Year | Since
Inception
(05/15/17) |
R6-Class Shares | 6.62% | 22.74% | 4.65% |
Bloomberg Barclays U.S. Corporate High Yield Index | 7.36% | 23.72% | 5.86% |
* | The performance data above represents past performance that is not predictive of future results. The investment return and principal value of an investment in the Fund will fluctuate so that an investor’s shares, when redeemed, may be worth more or less than their original cost. Returns are historical and include changes in principal and reinvested dividends and capital gains and do not reflect the effect of taxes. The Bloomberg Barclays U.S. Corporate High Yield Index is an unmanaged index and, unlike the Fund, has no management fees or operating expenses to reduce its reported return. |
† | 6 month returns are not annualized. |
‡ | Effective October 1, 2015, the maximum sales charge decreased from 4.75% to 4.00%. A 4.75% maximum sales charge is used in the calculation of the Average Annual Returns based on subscriptions made prior to October 1, 2015, and a 4.00% maximum sales charge is used to calculate performance for periods based on subscriptions made on or after October 5, 2015. |
§ | Fund returns include a CDSC of 1% if redeemed within 12 months of purchase. |
| | THE GUGGENHEIM FUNDS SEMI-ANNUAL REPORT | 19 |
SCHEDULE OF INVESTMENTS (Unaudited) | March 31, 2021 |
HIGH YIELD FUND | |
| | Shares | | | Value | |
COMMON STOCKS† - 1.4% |
| | | | | | | | | |
Financial - 0.4% |
KKR Acquisition Holdings I Corp.* | | | 142,310 | | | $ | 1,424,523 | |
MSD Acquisition Corp.* | | | 721 | | | | 7,318 | |
Jefferies Financial Group, Inc. | | | 81 | | | | 2,438 | |
Colicity, Inc.* | | | 239 | | | | 2,414 | |
RXR Acquisition Corp.* | | | 194 | | | | 1,911 | |
Soaring Eagle Acquisition Corp.* | | | 25 | | | | 253 | |
Total Financial | | | | | | | 1,438,857 | |
| | | | | | | | | |
Utilities - 0.3% |
TexGen Power LLC*,†† | | | 26,665 | | | | 1,075,480 | |
| | | | | | | | | |
Energy - 0.3% |
Unit Corp.* | | | 80,852 | | | | 988,011 | |
Legacy Reserves, Inc.*,††† | | | 3,452 | | | | 6,041 | |
SandRidge Energy, Inc.* | | | 20 | | | | 78 | |
Permian Production Partners LLC*,††† | | | 57,028 | | | | 6 | |
Total Energy | | | | | | | 994,136 | |
| | | | | | | | | |
Consumer, Non-cyclical - 0.2% |
ATD New Holdings, Inc.*,††† | | | 21,488 | | | | 719,848 | |
Save-A-Lot*,††† | | | 17,185 | | | | 81,631 | |
Cengage Learning Holdings II, Inc.*,†† | | | 2,107 | | | | 29,498 | |
Targus Group International Equity, Inc.*,†††,1 | | | 12,825 | | | | 27,448 | |
Chef Holdings, Inc.*,††† | | | 49 | | | | 3,091 | |
Spectrum Brands Holdings, Inc. | | | 2 | | | | 170 | |
Crimson Wine Group Ltd.* | | | 8 | | | | 53 | |
Total Consumer, Non-cyclical | | | | | | | 861,739 | |
| | | | | | | | | |
Consumer, Cyclical - 0.2% |
Metro-Goldwyn-Mayer, Inc.*,†† | | | 7,040 | | | | 718,080 | |
| | | | | | | | | |
Information Technology - 0.0% |
Bruin E&P Partnership Units*,††† | | | 44,023 | | | | 42,111 | |
| | | | | | | | | |
Industrial - 0.0% |
BP Holdco LLC*,†††,1 | | | 23,711 | | | | 8,360 | |
Vector Phoenix Holdings, LP*,††† | | | 23,711 | | | | 2,684 | |
Total Industrial | | | | | | | 11,044 | |
| | | | | | | | | |
Consumer Products - 0.0% |
Fashion Holdings Intermediate Inc.* | | | 35 | | | | 875 | |
| | | | | | | | | |
Total Common Stocks | | | | |
(Cost $4,542,691) | | | | | | | 5,142,322 | |
| | | | | | | | | |
PREFERRED STOCKS†† - 2.5% |
Financial - 2.5% |
Wells Fargo & Co., 4.38% | | | 74,000 | | | | 1,845,560 | |
JPMorgan Chase & Co., 4.55%* | | | 72,000 | | | | 1,843,200 | |
Bank of America Corp., 4.38% | | | 57,000 | | | | 1,425,000 | |
American Equity Investment Life Holding Co., 5.95%2 | | | 54,000 | | | | 1,417,500 | |
First Republic Bank, 4.13% | | | 53,000 | | | | 1,325,000 | |
Bank of America Corp., 4.13% | | | 40,000 | | | | 991,200 | |
Assurant, Inc., 5.25% due 01/15/61 | | | 30,000 | | | | 771,600 | |
Total Financial | | | | | | | 9,619,060 | |
| | | | | | | | | |
Industrial - 0.0% |
U.S. Shipping Corp.*,††† | | | 14,718 | | | | 2 | |
Total Preferred Stocks | | | | |
(Cost $9,875,000) | | | | | | | 9,619,062 | |
| | | | | | | | | |
WARRANTS††† - 0.0% |
SandRidge Energy, Inc. | | | | | | | | |
$41.34, Expiring 10/04/22††† | | | 505 | | | | 6 | |
$42.03, Expiring 10/04/22††† | | | 212 | | | | 3 | |
Total Warrants | | | | |
(Cost $43,811) | | | | | | | 9 | |
| | | | | | | | | |
EXCHANGE-TRADED FUNDS† - 4.9% |
SPDR Bloomberg Barclays High Yield Bond ETF | | | 173,000 | | | | 18,822,400 | |
Total Exchange-Traded Funds | | | | |
(Cost $18,840,947) | | | | | | | 18,822,400 | |
| | | | | | | | | |
MONEY MARKET FUND† - 2.3% |
Dreyfus Treasury Securities Cash Management Fund — Institutional Shares, 0.01%3 | | | 8,883,252 | | | | 8,883,252 | |
Total Money Market Fund | | | | |
(Cost $8,883,252) | | | | | | | 8,883,252 | |
| | | | | | | | | |
| | | Face
Amount~ | | | | | |
CORPORATE BONDS†† - 78.8% |
Consumer, Non-cyclical - 15.3% | | | | | | | | |
Kraft Heinz Foods Co. | | | | | | | | |
5.00% due 06/04/42 | | | 2,998,000 | | | | 3,366,026 | |
4.88% due 10/01/49 | | | 1,750,000 | | | | 1,957,382 | |
4.38% due 06/01/46 | | | 1,200,000 | | | | 1,251,119 | |
5.20% due 07/15/45 | | | 325,000 | | | | 374,943 | |
US Foods, Inc. | | | | | | | | |
6.25% due 04/15/254 | | | 2,748,000 | | | | 2,945,856 | |
4.75% due 02/15/294 | | | 1,350,000 | | | | 1,350,000 | |
DaVita, Inc. | | | | | | | | |
3.75% due 02/15/314 | | | 3,075,000 | | | | 2,946,465 | |
4.63% due 06/01/304 | | | 850,000 | | | | 864,578 | |
Sabre GLBL, Inc. | | | | | | | | |
9.25% due 04/15/254 | | | 1,500,000 | | | | 1,788,750 | |
7.38% due 09/01/254 | | | 1,450,000 | | | | 1,580,137 | |
Post Holdings, Inc. | | | | | | | | |
4.50% due 09/15/314 | | | 2,925,000 | | | | 2,892,825 | |
CPI CG, Inc. | | | | | | | | |
8.63% due 03/15/264 | | | 2,750,000 | | | | 2,881,422 | |
FAGE International S.A. / FAGE USA Dairy Industry, Inc. | | | | | | | | |
5.63% due 08/15/264 | | | 2,540,000 | | | | 2,622,550 | |
Kronos Acquisition Holdings, Inc. / KIK Custom Products, Inc. | | | | | | | | |
7.00% due 12/31/274 | | | 2,225,000 | | | | 2,132,373 | |
20 | THE GUGGENHEIM FUNDS SEMI-ANNUAL REPORT | SEE NOTES TO FINANCIAL STATEMENTS. |
SCHEDULE OF INVESTMENTS (Unaudited)(continued) | March 31, 2021 |
HIGH YIELD FUND | |
| | Face
Amount~ | | | Value | |
5.00% due 12/31/264 | | | 350,000 | | | $ | 350,000 | |
Prime Security Services Borrower LLC / Prime Finance, Inc. | | | | | | | | |
5.75% due 04/15/264 | | | 1,075,000 | | | | 1,160,167 | |
3.38% due 08/31/274 | | | 1,150,000 | | | | 1,115,500 | |
Tenet Healthcare Corp. | | | | | | | | |
7.50% due 04/01/254 | | | 1,700,000 | | | | 1,835,439 | |
5.13% due 11/01/274 | | | 400,000 | | | | 418,280 | |
Nielsen Finance LLC / Nielsen Finance Co. | | | | | | | | |
5.88% due 10/01/304 | | | 1,675,000 | | | | 1,809,000 | |
5.00% due 04/15/224 | | | 417,000 | | | | 417,086 | |
Molina Healthcare, Inc. | | | | | | | | |
4.38% due 06/15/284 | | | 1,100,000 | | | | 1,131,856 | |
5.38% due 11/15/22 | | | 900,000 | | | | 943,686 | |
Cheplapharm Arzneimittel GmbH | | | | | | | | |
5.50% due 01/15/284 | | | 1,950,000 | | | | 2,025,601 | |
AMN Healthcare, Inc. | | | | | | | | |
4.63% due 10/01/274 | | | 1,150,000 | | | | 1,175,875 | |
4.00% due 04/15/294 | | | 675,000 | | | | 671,625 | |
Centene Corp. | | | | | | | | |
3.00% due 10/15/30 | | | 1,100,000 | | | | 1,098,174 | |
4.25% due 12/15/27 | | | 675,000 | | | | 709,729 | |
Rent-A-Center, Inc. | | | | | | | | |
6.38% due 02/15/294 | | | 1,700,000 | | | | 1,802,000 | |
Carriage Services, Inc. | | | | | | | | |
6.63% due 06/01/264 | | | 1,670,000 | | | | 1,753,500 | |
KeHE Distributors LLC / KeHE Finance Corp. | | | | | | | | |
8.63% due 10/15/264 | | | 1,076,000 | | | | 1,197,050 | |
Par Pharmaceutical, Inc. | | | | | | | | |
7.50% due 04/01/274 | | | 1,010,000 | | | | 1,073,832 | |
Sotheby’s | | | | | | | | |
7.38% due 10/15/274 | | | 975,000 | | | | 1,054,326 | |
Nathan’s Famous, Inc. | | | | | | | | |
6.63% due 11/01/254 | | | 1,000,000 | | | | 1,025,000 | |
Endo Luxembourg Finance Company I SARL / Endo US, Inc. | | | | | | | | |
6.13% due 04/01/294 | | | 950,000 | | | | 959,709 | |
Spectrum Brands, Inc. | | | | | | | | |
3.88% due 03/15/314 | | | 900,000 | | | | 879,750 | |
Legends Hospitality Holding Company LLC / Legends Hospitality Co-Issuer, Inc. | | | | | | | | |
5.00% due 02/01/264 | | | 850,000 | | | | 864,875 | |
Charles River Laboratories International, Inc. | | | | | | | | |
4.00% due 03/15/314 | | | 775,000 | | | | 787,826 | |
Central Garden & Pet Co. | | | | | | | | |
4.13% due 10/15/30 | | | 725,000 | | | | 732,250 | |
Syneos Health, Inc. | | | | | | | | |
3.63% due 01/15/294 | | | 750,000 | | | | 729,375 | |
Bausch Health Companies, Inc. | | | | | | | | |
7.00% due 03/15/244 | | | 651,000 | | | | 665,973 | |
Prestige Brands, Inc. | | | | | | | | |
3.75% due 04/01/314 | | | 425,000 | | | | 405,344 | |
Gartner, Inc. | | | | | | | | |
4.50% due 07/01/284 | | | 375,000 | | | | 386,719 | |
Endo Dac / Endo Finance LLC / Endo Finco, Inc. | | | | | | | | |
6.00% due 06/30/284 | | | 242,000 | | | | 196,020 | |
9.50% due 07/31/274 | | | 171,000 | | | | 185,749 | |
Acadia Healthcare Company, Inc. | | | | | | | | |
5.00% due 04/15/294 | | | 150,000 | | | | 155,658 | |
Total Consumer, Non-cyclical | | | | | | | 58,671,400 | |
| | | | | | | | | |
Consumer, Cyclical - 13.7% | | | | | | | | |
Hilton Domestic Operating Company, Inc. | | | | | | | | |
3.63% due 02/15/324 | | | 2,100,000 | | | | 2,038,260 | |
4.00% due 05/01/314 | | | 1,475,000 | | | | 1,475,000 | |
5.75% due 05/01/284 | | | 400,000 | | | | 430,508 | |
LBC Tank Terminals Holding Netherlands BV | | | | | | | | |
6.88% due 05/15/234 | | | 3,090,000 | | | | 3,090,000 | |
Yum! Brands, Inc. | | | | | | | | |
4.63% due 01/31/32 | | | 1,975,000 | | | | 2,017,788 | |
3.63% due 03/15/31 | | | 925,000 | | | | 889,378 | |
Suburban Propane Partners Limited Partnership/Suburban Energy Finance Corp. | | | | | | | | |
5.88% due 03/01/27 | | | 1,460,000 | | | | 1,518,400 | |
5.75% due 03/01/25 | | | 1,325,000 | | | | 1,346,531 | |
1011778 BC ULC / New Red Finance, Inc. | | | | | | | | |
4.00% due 10/15/304 | | | 1,475,000 | | | | 1,423,375 | |
3.50% due 02/15/294 | | | 850,000 | | | | 827,688 | |
JB Poindexter & Company, Inc. | | | | | | | | |
7.13% due 04/15/264 | | | 2,000,000 | | | | 2,112,500 | |
Wolverine World Wide, Inc. | | | | | | | | |
6.38% due 05/15/254 | | | 1,950,000 | | | | 2,076,750 | |
Live Nation Entertainment, Inc. | | | | | | | | |
6.50% due 05/15/274 | | | 1,000,000 | | | | 1,108,770 | |
3.75% due 01/15/284 | | | 925,000 | | | | 912,281 | |
Titan International, Inc. | | | | | | | | |
6.50% due 11/30/23 | | | 1,985,000 | | | | 1,975,075 | |
PetSmart Incorporated / PetSmart Finance Corp. | | | | | | | | |
4.75% due 02/15/284 | | | 1,725,000 | | | | 1,767,797 | |
Tempur Sealy International, Inc. | | | | | | | | |
4.00% due 04/15/294 | | | 1,675,000 | | | | 1,666,625 | |
Clarios Global, LP | | | | | | | | |
6.75% due 05/15/254 | | | 1,475,000 | | | | 1,577,808 | |
Boyd Gaming Corp. | | | | | | | | |
8.63% due 06/01/254 | | | 1,375,000 | | | | 1,529,000 | |
Williams Scotsman International, Inc. | | | | | | | | |
4.63% due 08/15/284 | | | 1,500,000 | | | | 1,526,250 | |
Superior Plus Limited Partnership / Superior General Partner, Inc. | | | | | | | | |
4.50% due 03/15/294 | | | 1,500,000 | | | | 1,515,300 | |
Wabash National Corp. | | | | | | | | |
5.50% due 10/01/254 | | | 1,435,000 | | | | 1,467,287 | |
Boyne USA, Inc. | | | | | | | | |
7.25% due 05/01/254 | | | 1,407,000 | | | | 1,462,576 | |
Aramark Services, Inc. | | | | | | | | |
6.38% due 05/01/254 | | | 1,350,000 | | | | 1,431,000 | |
SEE NOTES TO FINANCIAL STATEMENTS. | THE GUGGENHEIM FUNDS SEMI-ANNUAL REPORT | 21 |
SCHEDULE OF INVESTMENTS (Unaudited)(continued) | March 31, 2021 |
HIGH YIELD FUND | |
| | Face
Amount~ | | | Value | |
Allison Transmission, Inc. | | | | | | | | |
3.75% due 01/30/314 | | | 1,150,000 | | | $ | 1,114,063 | |
4.75% due 10/01/274 | | | 200,000 | | | | 212,560 | |
Scotts Miracle-Gro Co. | | | | | | | | |
4.00% due 04/01/314 | | | 1,300,000 | | | | 1,281,800 | |
Murphy Oil USA, Inc. | | | | | | | | |
3.75% due 02/15/314 | | | 1,300,000 | | | | 1,277,803 | |
Crocs, Inc. | | | | | | | | |
4.25% due 03/15/294 | | | 1,300,000 | | | | 1,271,413 | |
Performance Food Group, Inc. | | | | | | | | |
6.88% due 05/01/254 | | | 1,100,000 | | | | 1,174,250 | |
Cedar Fair, LP / Canada’s Wonderland Co. / Magnum Management Corp. / Millennium Operations LLC | | | | | | | | |
5.50% due 05/01/254 | | | 1,000,000 | | | | 1,050,900 | |
Hawaiian Brand Intellectual Property Ltd. / HawaiianMiles Loyalty Ltd. | | | | | | | | |
5.75% due 01/20/264 | | | 925,000 | | | | 983,090 | |
Picasso Finance Sub, Inc. | | | | | | | | |
6.13% due 06/15/254 | | | 787,000 | | | | 836,188 | |
Powdr Corp. | | | | | | | | |
6.00% due 08/01/254 | | | 675,000 | | | | 711,349 | |
CD&R Smokey Buyer, Inc. | | | | | | | | |
6.75% due 07/15/254 | | | 650,000 | | | | 697,125 | |
Hanesbrands, Inc. | | | | | | | | |
5.38% due 05/15/254 | | | 650,000 | | | | 687,781 | |
Mileage Plus Holdings LLC / Mileage Plus Intellectual Property Assets Ltd. | | | | | | | | |
6.50% due 06/20/274 | | | 600,000 | | | | 657,000 | |
Burlington Coat Factory Warehouse Corp. | | | | | | | | |
6.25% due 04/15/254 | | | 600,000 | | | | 636,000 | |
Levi Strauss & Co. | | | | | | | | |
3.50% due 03/01/314 | | | 625,000 | | | | 603,125 | |
Vail Resorts, Inc. | | | | | | | | |
6.25% due 05/15/254 | | | 525,000 | | | | 559,781 | |
Six Flags Theme Parks, Inc. | | | | | | | | |
7.00% due 07/01/254 | | | 425,000 | | | | 459,944 | |
WMG Acquisition Corp. | | | | | | | | |
3.00% due 02/15/314 | | | 475,000 | | | | 451,393 | |
Wyndham Hotels & Resorts, Inc. | | | | | | | | |
4.38% due 08/15/284 | | | 425,000 | | | | 429,887 | |
Clarios Global, LP / Clarios US Finance Co. | | | | | | | | |
8.50% due 05/15/274 | | | 375,000 | | | | 403,785 | |
Total Consumer, Cyclical | | | | | | | 52,685,184 | |
| | | | | | | | | |
Financial - 12.7% | | | | | | | | |
Hunt Companies, Inc. | | | | | | | | |
5.25% due 04/15/294 | | | 4,650,000 | | | | 4,650,000 | |
6.25% due 02/15/264 | | | 3,165,000 | | | | 3,265,963 | |
United Wholesale Mortgage LLC | | | | | | | | |
5.50% due 11/15/254 | | | 2,575,000 | | | | 2,684,438 | |
5.50% due 04/15/294 | | | 1,475,000 | | | | 1,473,156 | |
Iron Mountain, Inc. | | | | | | | | |
5.63% due 07/15/324 | | | 2,525,000 | | | | 2,638,625 | |
4.88% due 09/15/294 | | | 530,000 | | | | 536,598 | |
5.25% due 07/15/304 | | | 475,000 | | | | 490,105 | |
LPL Holdings, Inc. | | | | | | | | |
4.00% due 03/15/294 | | | 3,114,000 | | | | 3,137,355 | |
NFP Corp. | | | | | | | | |
6.88% due 08/15/284 | | | 2,925,000 | | | | 3,037,905 | |
SBA Communications Corp. | | | | | | | | |
3.13% due 02/01/294 | | | 2,400,000 | | | | 2,306,760 | |
Quicken Loans LLC / Quicken Loans Company-Issuer, Inc. | | | | | | | | |
3.88% due 03/01/314 | | | 2,375,000 | | | | 2,291,875 | |
OneMain Finance Corp. | | | | | | | | |
7.13% due 03/15/26 | | | 700,000 | | | | 807,345 | |
4.00% due 09/15/30 | | | 750,000 | | | | 729,375 | |
6.63% due 01/15/28 | | | 300,000 | | | | 339,993 | |
8.88% due 06/01/25 | | | 275,000 | | | | 304,645 | |
Newmark Group, Inc. | | | | | | | | |
6.13% due 11/15/23 | | | 1,950,000 | | | | 2,140,374 | |
AmWINS Group, Inc. | | | | | | | | |
7.75% due 07/01/264 | | | 1,825,000 | | | | 1,952,750 | |
Jefferies Finance LLC / JFIN Company-Issuer Corp. | | | | | | | | |
6.25% due 06/03/264 | | | 1,775,000 | | | | 1,863,750 | |
Cushman & Wakefield US Borrower LLC | | | | | | | | |
6.75% due 05/15/284 | | | 1,650,000 | | | | 1,784,062 | |
Kennedy-Wilson, Inc. | | | | | | | | |
5.00% due 03/01/31 | | | 1,225,000 | | | | 1,240,619 | |
4.75% due 03/01/29 | | | 525,000 | | | | 531,563 | |
Greystar Real Estate Partners LLC | | | | | | | | |
5.75% due 12/01/254 | | | 1,400,000 | | | | 1,438,500 | |
Home Point Capital, Inc. | | | | | | | | |
5.00% due 02/01/264 | | | 1,375,000 | | | | 1,361,250 | |
Charles Schwab Corp. | | | | | | | | |
4.00% 2,5 | | | 1,325,000 | | | | 1,300,686 | |
Assurant, Inc. | | | | | | | | |
7.00% due 03/27/482 | | | 950,000 | | | | 1,083,000 | |
Goldman Sachs Group, Inc. | | | | | | | | |
5.30% 2,5 | | | 950,000 | | | | 1,047,375 | |
American Equity Investment Life Holding Co. | | | | | | | | |
5.00% due 06/15/27 | | | 822,000 | | | | 912,924 | |
USI, Inc. | | | | | | | | |
6.88% due 05/01/254 | | | 775,000 | | | | 788,563 | |
Wilton Re Finance LLC | | | | | | | | |
5.88% due 03/30/332,4 | | | 650,000 | | | | 675,621 | |
Liberty Mutual Group, Inc. | | | | | | | | |
4.30% due 02/01/614 | | | 750,000 | | | | 674,052 | |
HUB International Ltd. | | | | | | | | |
7.00% due 05/01/264 | | | 575,000 | | | | 597,086 | |
Alliant Holdings Intermediate LLC / Alliant Holdings Company-Issuer | | | | | | | | |
4.25% due 10/15/274 | | | 425,000 | | | | 428,867 | |
Quicken Loans LLC | | | | | | | | |
5.25% due 01/15/284 | | | 400,000 | | | | 421,000 | |
Total Financial | | | | | | | 48,936,180 | |
| | | | | | | | | |
22 | THE GUGGENHEIM FUNDS SEMI-ANNUAL REPORT | SEE NOTES TO FINANCIAL STATEMENTS. |
SCHEDULE OF INVESTMENTS (Unaudited)(continued) | March 31, 2021 |
HIGH YIELD FUND | |
| | Face
Amount~ | | | Value | |
Communications - 12.0% | | | | | | | | |
CCO Holdings LLC / CCO Holdings Capital Corp. | | | | | | | | |
4.50% due 05/01/324 | | | 3,875,000 | | | $ | 3,923,437 | |
4.25% due 02/01/314 | | | 475,000 | | | | 476,055 | |
Level 3 Financing, Inc. | | | | | | | | |
3.63% due 01/15/294 | | | 1,825,000 | | | | 1,767,969 | |
4.25% due 07/01/284 | | | 1,650,000 | | | | 1,668,662 | |
3.75% due 07/15/294 | | | 975,000 | | | | 954,184 | |
CSC Holdings LLC | | | | | | | | |
6.50% due 02/01/294 | | | 1,225,000 | | | | 1,353,625 | |
4.13% due 12/01/304 | | | 1,150,000 | | | | 1,142,272 | |
4.63% due 12/01/304 | | | 950,000 | | | | 934,434 | |
3.38% due 02/15/314 | | | 850,000 | | | | 801,125 | |
Virgin Media Secured Finance plc | | | | | | | | |
4.50% due 08/15/304 | | | 3,075,000 | | | | 3,101,906 | |
5.50% due 05/15/294 | | | 900,000 | | | | 955,125 | |
Altice France S.A. | | | | | | | | |
5.13% due 01/15/294 | | | 975,000 | | | | 987,187 | |
8.13% due 02/01/274 | | | 900,000 | | | | 986,490 | |
7.38% due 05/01/264 | | | 875,000 | | | | 910,000 | |
Cengage Learning, Inc. | | | | | | | | |
9.50% due 06/15/244 | | | 2,389,000 | | | | 2,433,794 | |
McGraw Hill LLC / McGraw-Hill Global Education Finance, Inc. | | | | | | | | |
8.00% due 11/30/244 | | | 2,349,000 | | | | 2,369,671 | |
LCPR Senior Secured Financing DAC | | | | | | | | |
6.75% due 10/15/274 | | | 1,075,000 | | | | 1,146,111 | |
5.13% due 07/15/294 | | | 950,000 | | | | 966,739 | |
Virgin Media Finance plc | | | | | | | | |
5.00% due 07/15/304 | | | 1,950,000 | | | | 1,947,563 | |
Go Daddy Operating Company LLC / GD Finance Co., Inc. | | | | | | | | |
3.50% due 03/01/294 | | | 1,975,000 | | | | 1,943,795 | |
Lamar Media Corp. | | | | | | | | |
4.88% due 01/15/29 | | | 900,000 | | | | 941,625 | |
3.63% due 01/15/314 | | | 600,000 | | | | 576,006 | |
3.75% due 02/15/28 | | | 375,000 | | | | 374,531 | |
Sirius XM Radio, Inc. | | | | | | | | |
4.13% due 07/01/304 | | | 1,100,000 | | | | 1,101,265 | |
5.50% due 07/01/294 | | | 700,000 | | | | 756,875 | |
Ziggo BV | | | | | | | | |
4.88% due 01/15/304 | | | 1,575,000 | | | | 1,609,863 | |
Vmed O2 UK Financing I plc | | | | | | | | |
4.25% due 01/31/314 | | | 1,525,000 | | | | 1,482,452 | |
Telenet Finance Luxembourg Note | | | | | | | | |
5.50% due 03/01/28 | | | 1,400,000 | | | | 1,470,000 | |
AMC Networks, Inc. | | | | | | | | |
4.25% due 02/15/29 | | | 1,175,000 | | | | 1,142,688 | |
T-Mobile USA, Inc. | | | | | | | | |
3.30% due 02/15/514 | | | 1,200,000 | | | | 1,121,484 | |
Houghton Mifflin Harcourt Publishers, Inc. | | | | | | | | |
9.00% due 02/15/254 | | | 1,000,000 | | | | 1,070,000 | |
Qualitytech, LP / QTS Finance Corp. | | | | | | | | |
3.88% due 10/01/284 | | | 975,000 | | | | 970,125 | |
Radiate Holdco LLC / Radiate Finance, Inc. | | | | | | | | |
4.50% due 09/15/264 | | | 950,000 | | | | 960,687 | |
Zayo Group Holdings, Inc. | | | | | | | | |
4.00% due 03/01/274 | | | 900,000 | | | | 885,600 | |
Match Group Holdings II LLC | | | | | | | | |
4.63% due 06/01/284 | | | 600,000 | | | | 613,056 | |
TripAdvisor, Inc. | | | | | | | | |
7.00% due 07/15/254 | | | 275,000 | | | | 297,412 | |
Total Communications | | | | | | | 46,143,813 | |
| | | | | | | | | |
Industrial - 11.2% | | | | | | | | |
TransDigm, Inc. | | | | | | | | |
6.25% due 03/15/264 | | | 2,350,000 | | | | 2,490,765 | |
8.00% due 12/15/254 | | | 950,000 | | | | 1,034,550 | |
Howmet Aerospace, Inc. | | | | | | | | |
5.95% due 02/01/37 | | | 2,700,000 | | | | 3,264,435 | |
New Enterprise Stone & Lime Company, Inc. | | | | | | | | |
9.75% due 07/15/284 | | | 1,575,000 | | | | 1,764,000 | |
6.25% due 03/15/264 | | | 1,275,000 | | | | 1,306,875 | |
PowerTeam Services LLC | | | | | | | | |
9.03% due 12/04/254 | | | 2,750,000 | | | | 3,053,325 | |
Harsco Corp. | | | | | | | | |
5.75% due 07/31/274 | | | 2,925,000 | | | | 2,994,469 | |
Great Lakes Dredge & Dock Corp. | | | | | | | | |
8.00% due 05/15/22 | | | 2,925,000 | | | | 2,950,594 | |
Grinding Media, Inc. / MC Grinding Media Canada, Inc. | | | | | | | | |
7.38% due 12/15/234 | | | 2,625,000 | | | | 2,664,375 | |
Cleaver-Brooks, Inc. | | | | | | | | |
7.88% due 03/01/234,6 | | | 2,250,000 | | | | 2,205,000 | |
Standard Industries, Inc. | | | | | | | | |
3.38% due 01/15/314 | | | 1,100,000 | | | | 1,042,250 | |
4.38% due 07/15/304 | | | 575,000 | | | | 580,175 | |
5.00% due 02/15/274 | | | 350,000 | | | | 364,875 | |
GrafTech Finance, Inc. | | | | | | | | |
4.63% due 12/15/284 | | | 1,975,000 | | | | 1,986,120 | |
Masonite International Corp. | | | | | | | | |
5.75% due 09/15/264 | | | 950,000 | | | | 988,000 | |
5.38% due 02/01/284 | | | 875,000 | | | | 928,594 | |
Trinity Industries, Inc. | | | | | | | | |
4.55% due 10/01/24 | | | 1,290,000 | | | | 1,340,994 | |
EnerSys | | | | | | | | |
4.38% due 12/15/274 | | | 1,250,000 | | | | 1,278,125 | |
Signature Aviation US Holdings, Inc. | | | | | | | | |
4.00% due 03/01/284 | | | 1,225,000 | | | | 1,245,727 | |
JELD-WEN, Inc. | | | | | | | | |
6.25% due 05/15/254 | | | 1,050,000 | | | | 1,115,625 | |
Amsted Industries, Inc. | | | | | | | | |
4.63% due 05/15/304 | | | 1,075,000 | | | | 1,088,437 | |
Summit Materials LLC / Summit Materials Finance Corp. | | | | | | | | |
5.25% due 01/15/294 | | | 625,000 | | | | 653,744 | |
6.50% due 03/15/274 | | | 350,000 | | | | 367,937 | |
American Woodmark Corp. | | | | | | | | |
4.88% due 03/15/264 | | | 850,000 | | | | 871,675 | |
SEE NOTES TO FINANCIAL STATEMENTS. | THE GUGGENHEIM FUNDS SEMI-ANNUAL REPORT | 23 |
SCHEDULE OF INVESTMENTS (Unaudited)(continued) | March 31, 2021 |
HIGH YIELD FUND | |
| | Face
Amount~ | | | Value | |
Ardagh Packaging Finance plc / Ardagh Holdings USA, Inc. | | | | | | | | |
4.13% due 08/15/264 | | | 725,000 | | | $ | 744,248 | |
Arcosa, Inc. | | | | | | | | |
4.38% due 04/15/294 | | | 700,000 | | | | 700,000 | |
EnPro Industries, Inc. | | | | | | | | |
5.75% due 10/15/26 | | | 650,000 | | | | 688,025 | |
Moog, Inc. | | | | | | | | |
4.25% due 12/15/274 | | | 625,000 | | | | 637,500 | |
Vertical US Newco, Inc. | | | | | | | | |
5.25% due 07/15/274 | | | 550,000 | | | | 575,781 | |
TopBuild Corp. | | | | | | | | |
3.63% due 03/15/294 | | | 500,000 | | | | 493,750 | |
Ardagh Metal Packaging Finance USA LLC / Ardagh Metal Packaging Finance plc | | | | | | | | |
4.00% due 09/01/294 | | | 450,000 | | | | 448,875 | |
Hillenbrand, Inc. | | | | | | | | |
3.75% due 03/01/31 | | | 400,000 | | | | 391,616 | |
Brundage-Bone Concrete Pumping Holdings, Inc. | | | | | | | | |
6.00% due 02/01/264 | | | 326,000 | | | | 339,855 | |
PGT Innovations, Inc. | | | | | | | | |
6.75% due 08/01/264 | | | 255,000 | | | | 270,937 | |
Ball Corp. | | | | | | | | |
2.88% due 08/15/30 | | | 275,000 | | | | 264,894 | |
Total Industrial | | | | | | | 43,136,147 | |
| | | | | | | | | |
Energy - 5.5% | | | | | | | | |
NuStar Logistics, LP | | | | | | | | |
5.63% due 04/28/27 | | | 1,585,000 | | | | 1,658,060 | |
6.38% due 10/01/30 | | | 1,025,000 | | | | 1,107,000 | |
6.00% due 06/01/26 | | | 525,000 | | | | 565,995 | |
Parkland Corp. | | | | | | | | |
4.50% due 10/01/294 | | | 1,750,000 | | | | 1,756,038 | |
6.00% due 04/01/264 | | | 1,075,000 | | | | 1,124,235 | |
Exterran Energy Solutions Limited Partnership / EES Finance Corp. | | | | | | | | |
8.13% due 05/01/25 | | | 3,092,000 | | | | 2,844,640 | |
PDC Energy, Inc. | | | | | | | | |
6.13% due 09/15/24 | | | 2,750,000 | | | | 2,821,844 | |
Indigo Natural Resources LLC | | | | | | | | |
5.38% due 02/01/294 | | | 2,200,000 | | | | 2,167,462 | |
Global Partners Limited Partnership / GLP Finance Corp. | | | | | | | | |
7.00% due 08/01/27 | | | 1,000,000 | | | | 1,055,000 | |
6.88% due 01/15/29 | | | 625,000 | | | | 670,781 | |
Crestwood Midstream Partners Limited Partnership / Crestwood Midstream Finance Corp. | | | | | | | | |
5.63% due 05/01/274 | | | 1,250,000 | | | | 1,228,125 | |
Occidental Petroleum Corp. | | | | | | | | |
4.63% due 06/15/45 | | | 1,100,000 | | | | 959,266 | |
Range Resources Corp. | | | | | | | | |
5.00% due 03/15/23 | | | 905,000 | | | | 919,706 | |
CVR Energy, Inc. | | | | | | | | |
5.75% due 02/15/284 | | | 925,000 | | | | 899,562 | |
Rattler Midstream, LP | | | | | | | | |
5.63% due 07/15/254 | | | 575,000 | | | | 600,369 | |
TransMontaigne Partners Limited Partnership / TLP Finance Corp. | | | | | | | | |
6.13% due 02/15/26 | | | 425,000 | | | | 427,125 | |
Basic Energy Services, Inc. | | | | | | | | |
10.75% due 10/15/237 | | | 1,225,000 | | | | 245,000 | |
Total Energy | | | | | | | 21,050,208 | |
| | | | | | | | | |
Basic Materials - 4.4% | | | | | | | | |
Alcoa Nederland Holding BV | | | | | | | | |
6.75% due 09/30/244 | | | 1,475,000 | | | | 1,524,412 | |
4.13% due 03/31/294 | | | 1,400,000 | | | | 1,411,956 | |
6.13% due 05/15/284 | | | 425,000 | | | | 462,910 | |
7.00% due 09/30/264 | | | 375,000 | | | | 395,625 | |
Carpenter Technology Corp. | | | | | | | | |
6.38% due 07/15/28 | | | 2,150,000 | | | | 2,310,561 | |
4.45% due 03/01/23 | | | 400,000 | | | | 414,493 | |
Valvoline, Inc. | | | | | | | | |
3.63% due 06/15/314 | | | 2,100,000 | | | | 2,031,750 | |
4.25% due 02/15/304 | | | 375,000 | | | | 382,500 | |
Minerals Technologies, Inc. | | | | | | | | |
5.00% due 07/01/284 | | | 1,722,000 | | | | 1,775,813 | |
Kaiser Aluminum Corp. | | | | | | | | |
4.63% due 03/01/284 | | | 1,215,000 | | | | 1,243,613 | |
6.50% due 05/01/254 | | | 475,000 | | | | 503,358 | |
Arconic Corp. | | | | | | | | |
6.00% due 05/15/254 | | | 1,175,000 | | | | 1,266,397 | |
Ingevity Corp. | | | | | | | | |
3.88% due 11/01/284 | | | 675,000 | | | | 654,750 | |
4.50% due 02/01/264 | | | 500,000 | | | | 508,960 | |
WR Grace & Company-Conn | | | | | | | | |
4.88% due 06/15/274 | | | 700,000 | | | | 724,640 | |
Compass Minerals International, Inc. | | | | | | | | |
6.75% due 12/01/274 | | | 650,000 | | | | 695,500 | |
Yamana Gold, Inc. | | | | | | | | |
4.63% due 12/15/27 | | | 256,000 | | | | 279,965 | |
Clearwater Paper Corp. | | | | | | | | |
4.75% due 08/15/284 | | | 275,000 | | | | 277,062 | |
Mirabela Nickel Ltd. | | | | | | | | |
due 06/24/197,8 | | | 278,115 | | | | 11,125 | |
Total Basic Materials | | | | | | | 16,875,390 | |
| | | | | | | | | |
Technology - 3.1% | | | | | | | | |
NCR Corp. | | | | | | | | |
8.13% due 04/15/254 | | | 1,975,000 | | | | 2,165,094 | |
5.25% due 10/01/304 | | | 1,050,000 | | | | 1,063,256 | |
6.13% due 09/01/294 | | | 800,000 | | | | 847,000 | |
5.13% due 04/15/294 | | | 700,000 | | | | 707,931 | |
Crowdstrike Holdings, Inc. | | | | | | | | |
3.00% due 02/15/29 | | | 1,300,000 | | | | 1,271,010 | |
MSCI, Inc. | | | | | | | | |
3.88% due 02/15/314 | | | 1,025,000 | | | | 1,047,345 | |
Twilio, Inc. | | | | | | | | |
3.63% due 03/15/29 | | | 525,000 | | | | 531,473 | |
3.88% due 03/15/31 | | | 450,000 | | | | 459,612 | |
24 | THE GUGGENHEIM FUNDS SEMI-ANNUAL REPORT | SEE NOTES TO FINANCIAL STATEMENTS. |
SCHEDULE OF INVESTMENTS (Unaudited)(continued) | March 31, 2021 |
HIGH YIELD FUND | |
| | Face
Amount~ | | | Value | |
Boxer Parent Company, Inc. | | | | | | | | |
7.13% due 10/02/254 | | | 875,000 | | | $ | 938,437 | |
Playtika Holding Corp. | | | | | | | | |
4.25% due 03/15/294 | | | 700,000 | | | | 689,640 | |
Qorvo, Inc. | | | | | | | | |
3.38% due 04/01/314 | | | 600,000 | | | | 587,934 | |
TeamSystem SpA | | | | | | | | |
3.75% (3 Month EURIBOR + 3.75%, Rate Floor: 3.75%) due 02/15/284,9 | | EUR | 460,000 | | | | 539,130 | |
Open Text Holdings, Inc. | | | | | | | | |
4.13% due 02/15/304 | | | 475,000 | | | | 481,503 | |
CDK Global, Inc. | | | | | | | | |
5.25% due 05/15/294 | | | 325,000 | | | | 348,667 | |
PTC, Inc. | | | | | | | | |
4.00% due 02/15/284 | | | 250,000 | | | | 253,750 | |
Total Technology | | | | | | | 11,931,782 | |
| | | | | | | | | |
Utilities - 0.9% | | | | | | | | |
Terraform Global Operating LLC | | | | | | | | |
6.13% due 03/01/264 | | | 2,880,000 | | | | 2,952,000 | |
AmeriGas Partners Limited Partnership / AmeriGas Finance Corp. | | | | | | | | |
5.75% due 05/20/27 | | | 375,000 | | | | 408,750 | |
Total Utilities | | | | | | | 3,360,750 | |
| | | | | | | | | |
Total Corporate Bonds | | | | |
(Cost $297,361,585) | | | 302,790,854 | |
| | | | | | | | | |
SENIOR FLOATING RATE INTERESTS†† - 11.2% |
Consumer, Cyclical - 3.4% | | | | | | | | |
American Tire Distributors, Inc. | | | | | | | | |
8.50% (1 Month USD LIBOR + 7.50% and 3 Month USD LIBOR + 7.50%, Rate Floor: 8.50%) due 09/02/24 | | | 1,310,093 | | | | 1,277,891 | |
7.00% (3 Month USD LIBOR + 6.00%, Rate Floor: 7.00%) due 09/01/23 | | | 330,924 | | | | 325,341 | |
Alexander Mann | | | | | | | | |
5.36% (6 Month GBP LIBOR + 5.25%, Rate Floor: 5.25%) due 06/16/25 | | GBP | 1,100,000 | | | | 1,427,933 | |
PetSmart LLC | | | | | | | | |
4.25% (3 Month USD LIBOR + 3.50%, Rate Floor: 4.25%) due 02/11/28 | | | 1,350,000 | | | | 1,346,895 | |
BBB Industries, LLC | | | | | | | | |
4.61% (1 Month USD LIBOR + 4.50%, Rate Floor: 4.50%) due 08/01/25 | | | 1,238,421 | | | | 1,220,464 | |
First Brands Group LLC | | | | | | | | |
due 03/19/27 | | | 1,000,000 | | | | 998,750 | |
NES Global Talent | | | | | | | | |
6.50% (3 Month USD LIBOR + 5.50%, Rate Floor: 6.50%) due 05/11/23††† | | | 875,455 | | | | 818,551 | |
ScribeAmerica Intermediate Holdco LLC (Healthchannels) | | | | | | | | |
4.61% (1 Month USD LIBOR + 4.50%, Rate Floor: 4.50%) due 04/03/25 | | | 783,498 | | | | 748,241 | |
PT Intermediate Holdings III LLC | | | | | | | | |
6.50% (3 Month USD LIBOR + 5.50%, Rate Floor: 6.50%) due 10/15/25 | | | 742,500 | | | | 729,506 | |
Accuride Corp. | | | | | | | | |
6.25% (3 Month USD LIBOR + 5.25%, Rate Floor: 6.25%) due 11/17/23 | | | 643,527 | | | | 606,982 | |
CCRR Parent, Inc. | | | | | | | | |
5.00% (3 Month USD LIBOR + 4.25%, Rate Floor: 5.00%) due 03/06/28 | | | 600,000 | | | | 600,750 | |
Playtika Holding Corp. | | | | | | | | |
due 03/13/28 | | | 600,000 | | | | 596,250 | |
Wabash National Corporation | | | | | | | | |
4.00% (1 Month USD LIBOR + 3.25%, Rate Floor: 4.00%) due 09/28/27 | | | 590,051 | | | | 588,576 | |
EnTrans International, LLC | | | | | | | | |
6.11% (1 Month USD LIBOR + 6.00%, Rate Floor: 6.00%) due 11/01/24 | | | 517,500 | | | | 501,975 | |
BidFair MergeRight, Inc. | | | | | | | | |
5.50% (3 Month USD LIBOR + 4.75%, Rate Floor: 5.50%) due 01/15/27 | | | 417,218 | | | | 418,783 | |
Blue Nile, Inc. | | | | | | | | |
7.50% (3 Month USD LIBOR + 6.50%, Rate Floor: 7.50%) due 02/17/23 | | | 423,848 | | | | 381,463 | |
Apro LLC | | | | | | | | |
5.00% (3 Month USD LIBOR + 4.00%, Rate Floor: 5.00%) due 11/14/26 | | | 208,942 | | | | 208,290 | |
Belk, Inc. | | | | | | | | |
8.50% (3 Month USD LIBOR +7.50%, Rate Floor: 8.50%) due 07/31/25††† | | | 62,837 | | | | 62,680 | |
Total Consumer, Cyclical | | | | | | | 12,859,321 | |
| | | | | | | | | |
Industrial - 2.7% | | | | | | | | |
Bhi Investments LLC | | | | | | | | |
5.50% (3 Month USD LIBOR + 4.50%, Rate Floor: 5.50%) due 08/28/24 | | | 1,846,510 | | | | 1,826,512 | |
9.75% (3 Month USD LIBOR + 8.75%, Rate Floor: 9.75%) due 02/28/25††† | | | 1,500,000 | | | | 1,473,750 | |
Diversitech Holdings, Inc. | | | | | | | | |
8.50% (3 Month USD LIBOR + 7.50%, Rate Floor: 8.50%) due 06/02/25††† | | | 1,783,737 | | | | 1,783,737 | |
American Residential Services LLC | | | | | | | | |
4.25% (1 Month USD LIBOR + 3.50%, Rate Floor: 4.25%) due 10/15/27 | | | 1,175,000 | | | | 1,170,594 | |
JetBlue Airways Corp. | | | | | | | | |
6.25% (3 Month USD LIBOR + 5.25%, Rate Floor: 6.25%) due 06/17/24 | | | 1,072,500 | | | | 1,096,631 | |
Dispatch Terra Acquisition LLC | | | | | | | | |
5.00% (3 Month USD LIBOR + 4.25%, Rate Floor: 5.00%) due 03/17/28 | | | 950,000 | | | | 945,250 | |
SkyMiles IP Limited | | | | | | | | |
4.75% (3 Month USD LIBOR + 3.75%, Rate Floor: 4.75%) due 10/20/27 | | | 805,565 | | | | 845,038 | |
YAK MAT (YAK ACCESS LLC) | | | | | | | | |
10.19% (3 Month USD LIBOR + 10.00%, Rate Floor: 10.00%) due 07/10/26 | | | 1,025,000 | | | | 830,680 | |
Avison Young (Canada), Inc. | | | | | | | | |
5.20% (3 Month USD LIBOR + 5.00%, Rate Floor: 5.00%) due 01/30/26 | | | 539,000 | | | | 537,653 | |
Total Industrial | | | | | | | 10,509,845 | |
| | | | | | | | | |
SEE NOTES TO FINANCIAL STATEMENTS. | THE GUGGENHEIM FUNDS SEMI-ANNUAL REPORT | 25 |
SCHEDULE OF INVESTMENTS (Unaudited)(continued) | March 31, 2021 |
HIGH YIELD FUND | |
| | Face
Amount~ | | | Value | |
Communications - 2.3% | | | | | | | | |
Cengage Learning Acquisitions, Inc. | | | | | | | | |
5.25% (3 Month USD LIBOR + 4.25%, Rate Floor: 5.25%) due 06/07/23 | | | 2,358,804 | | | $ | 2,330,805 | |
Resource Label Group LLC | | | | | | | | |
5.50% (3 Month USD LIBOR + 4.50%, Rate Floor: 5.50%) due 05/26/23 | | | 1,217,243 | | | | 1,130,515 | |
9.50% (3 Month USD LIBOR + 8.50%, Rate Floor: 9.50%) due 11/27/23††† | | | 1,009,662 | | | | 896,075 | |
McGraw Hill LLC | | | | | | | | |
5.75% (3 Month USD LIBOR + 4.75%, Rate Floor: 5.75%) due 11/01/24 | | | 1,583,506 | | | | 1,580,212 | |
Market Track LLC | | | | | | | | |
5.25% (3 Month USD LIBOR + 4.25%, Rate Floor: 5.25%) due 06/05/24 | | | 1,623,874 | | | | 1,550,800 | |
GTT Communications, Inc. | | | | | | | | |
2.86% (3 Month USD LIBOR + 2.75%, Rate Floor: 2.75%) due 05/30/25 | | | 1,410,125 | | | | 1,182,446 | |
GTT Communications BV | | | | | | | | |
8.50% (1 Month USD LIBOR + 5.00%, Rate Floor: 6.00%) (in-kind rate was 2.50%) due 12/28/2110 | | | 360,347 | | | | 365,302 | |
Total Communications | | | | | | | 9,036,155 | |
| | | | | | | | | |
Consumer, Non-cyclical - 1.7% | | | | | | | | |
HAH Group Holding Co. LLC | | | | | | | | |
6.00% (3 Month USD LIBOR + 5.00%, Rate Floor: 6.00%) due 10/29/27 | | | 1,180,000 | | | | 1,182,950 | |
SCP Eye Care Services LLC | | | | | | | | |
5.25% (3 Month USD LIBOR + 4.50%, Rate Floor: 5.25%) due 03/11/28††† | | | 1,086,648 | | | | 1,085,289 | |
Quirch Foods Holdings LLC | | | | | | | | |
6.25% (6 Month USD LIBOR + 5.25%, Rate Floor: 6.25%) due 10/27/27 | | | 975,000 | | | | 980,489 | |
National Mentor Holdings, Inc. | | | | | | | | |
4.50% (1 Month USD LIBOR + 3.75%, Rate Floor: 4.50%) due 03/02/28 | | | 770,000 | | | | 764,803 | |
Springs Window Fashions | | | | | | | | |
8.61% (1 Month USD LIBOR + 8.50%, Rate Floor: 8.50%) due 06/15/26 | | | 689,936 | | | | 686,486 | |
Women’s Care Holdings, Inc. | | | | | | | | |
5.25% (3 Month USD LIBOR + 4.50%, Rate Floor: 5.25%) due 01/15/28 | | | 675,000 | | | | 675,000 | |
Moran Foods LLC | | | | | | | | |
11.75% (3 Month USD LIBOR + 1.00%, Rate Floor: 1.00%) (in-kind rate was 10.75%) due 10/01/24†††,10 | | | 366,148 | | | | 318,549 | |
8.00% (3 Month USD LIBOR + 1.00%, Rate Floor: 1.00%) (in-kind rate was 7.00%) due 04/01/24†††,10 | | | 298,611 | | | | 310,556 | |
Kronos Acquisition Holdings, Inc. | | | | | | | | |
4.25% (3 Month USD LIBOR + 3.75%, Rate Floor: 4.25%) due 12/22/26 | | | 498,750 | | | | 491,089 | |
Total Consumer, Non-cyclical | | | | | | | 6,495,211 | |
| | | | | | | | | |
Financial - 0.5% | | | | | | | | |
Franchise Group, Inc. | | | | | | | | |
5.50% (3 Month USD LIBOR + 4.75%, Rate Floor: 5.50%) due 03/10/26 | | | 1,175,000 | | | | 1,175,740 | |
Jefferies Finance LLC | | | | | | | | |
4.50% (1 Month USD LIBOR + 3.75%, Rate Floor: 4.50%) due 09/30/27††† | | | 771,125 | | | | 764,378 | |
Total Financial | | | | | | | 1,940,118 | |
| | | | | | | | | |
Technology - 0.3% | | | | | | | | |
Planview Parent, Inc. | | | | | | | | |
4.75% (3 Month USD LIBOR + 4.00%, Rate Floor: 4.75%) due 12/17/27 | | | 430,000 | | | | 429,286 | |
due 12/17/27††† | | | 95,000 | | | | 95,396 | |
Peraton Corp. | | | | | | | | |
4.50% (3 Month USD LIBOR + 3.75%, Rate Floor: 4.50%) due 02/01/28 | | | 471,030 | | | | 470,639 | |
Total Technology | | | | | | | 995,321 | |
| | | | | | | | | |
Utilities - 0.2% | | | | | | | | |
RS Ivy Holdco, Inc. | | | | | | | | |
6.50% (1 Month USD LIBOR + 5.50%, Rate Floor: 6.50%) due 12/23/27††† | | | 748,125 | | | | 748,125 | |
| | | | | | | | | |
Basic Materials - 0.1% | | | | | | | | |
NIC Acquisition Corp. | | | | | | | | |
4.50% (3 Month USD LIBOR + 3.75%, Rate Floor: 4.50%) due 12/29/27 | | | 350,000 | | | | 349,710 | |
| | | | | | | | | |
Energy - 0.0% | | | | | | | | |
Permian Production Partners LLC | | | | | | | | |
9.00% (1 Month USD LIBOR + 6.00%, Rate Floor: 7.00%) (in-kind rate was 2.00%) due 11/23/25†††,10 | | | 377,548 | | | | 45,306 | |
Total Senior Floating Rate Interests | | | | |
(Cost $43,362,136) | | | 42,979,112 | |
| | | | | | | | | |
U.S. TREASURY BILLS†† - 0.8% |
U.S. Treasury Bills |
0.04% due 05/27/2111 | | | 2,920,000 | | | | 2,919,932 | |
Total U.S. Treasury Bills | | | | |
(Cost $2,919,830) | | | | | | | 2,919,932 | |
| | | | | | | | | |
26 | THE GUGGENHEIM FUNDS SEMI-ANNUAL REPORT | SEE NOTES TO FINANCIAL STATEMENTS. |
SCHEDULE OF INVESTMENTS (Unaudited)(continued) | March 31, 2021 |
HIGH YIELD FUND | |
| | Face
Amount~ | | | Value | |
ASSET-BACKED SECURITIES†† - 0.5% |
Collateralized Loan Obligations - 0.5% |
Barings Middle Market CLO Ltd. | | | | | | | | |
2019-IA, 1.99% (3 Month USD LIBOR + 1.75%, Rate Floor: 1.75%) due 10/15/314,9 | | | 1,500,000 | | | $ | 1,491,397 | |
WhiteHorse X Ltd. | | | | | | | | |
2015-10A, 5.52% (3 Month USD LIBOR + 5.30%, Rate Floor: 5.30%) due 04/17/274,9 | | | 750,000 | | | | 611,767 | |
Total Collateralized Loan Obligations | | | | | | | 2,103,164 | |
| | | | | | | | | |
Total Asset-Backed Securities | | | | |
(Cost $2,143,912) | | | 2,103,164 | |
| | | | | | | | | |
SENIOR FIXED RATE INTERESTS†† - 0.0% | | | | | | | | |
CONSUMER, CYCLICAL - 0.0% | | | | | | | | |
Belk, Inc. | | | | | | | | |
13.00% (in-kind rate was 8.00%) due 07/31/2510 | | | 256,695 | | | | 164,285 | |
Total Senior Fixed Rate Interests | | | | | | | | |
(Cost $257,979) | | | | | | | 164,285 | |
| | | | | | | | | |
Total Investments - 102.4% | | | | |
(Cost $388,231,143) | | $ | 393,424,392 | |
Other Assets & Liabilities, net - (2.4)% | | | (9,272,300 | ) |
Total Net Assets - 100.0% | | $ | 384,152,092 | |
Total Return Swap Agreements |
Counterparty | Reference
Obligation | Financing
Rate Pay | Payment
Frequency | | Maturity
Date | | | Units | | | Notional
Amount | | | Value and
Unrealized
Depreciation | |
OTC Credit Index Swap Agreements†† |
BNP Paribas | VanEck Vectors Fallen Angel High Yield Bond ETF | 0.21% (1 Month USD LIBOR + 0.10%) | Monthly | | | 05/19/21 | | | | 190,700 | | | $ | 6,089,051 | | | $ | (110,606 | ) |
BNP Paribas | VanEck Vectors Fallen Angel High Yield Bond ETF | 0.21% (1 Month USD LIBOR + 0.10%) | Monthly | | | 05/20/21 | | | | 191,200 | | | | 6,105,016 | | | | (116,632 | ) |
BNP Paribas | VanEck Vectors Fallen Angel High Yield Bond ETF | 0.16% (1 Month USD LIBOR + 0.05%) | Monthly | | | 05/14/21 | | | | 192,800 | | | | 6,156,104 | | | | (133,032 | ) |
| | | | | | | | | | | | | | $ | 18,350,171 | | | $ | (360,270 | ) |
Forward Foreign Currency Exchange Contracts†† |
Counterparty | | Contracts
to Sell | | | Currency | | | Settlement
Date | | | Settlement
Value | | | Value at
March 31,
2021 | | | Unrealized
Appreciation
(Depreciation) | |
Barclays Bank plc | | | 1,151,000 | | | | EUR | | | | 04/16/21 | | | $ | 1,380,493 | | | $ | 1,349,982 | | | $ | 30,511 | |
Goldman Sachs International | | | 1,086,000 | | | | GBP | | | | 04/16/21 | | | | 1,518,701 | | | | 1,497,143 | | | | 21,558 | |
JPMorgan Chase Bank, N.A. | | | 59,000 | | | | GBP | | | | 04/16/21 | | | | 81,435 | | | | 81,336 | | | | 99 | |
| | | | | | | | | | | | | | | | | | | | | | | $ | 52,168 | |
| | | | | | | | | | | | | | | | | | | | | | | | | |
Counterparty | | Contracts
to Buy | | | Currency | | | Settlement
Date | | | Settlement
Value | | | Value at
March 31,
2021 | | | Unrealized
Appreciation
(Depreciation) | |
JPMorgan Chase Bank, N.A. | | | 66,000 | | | | GBP | | | | 04/16/21 | | | $ | 90,943 | | | $ | 90,986 | | | $ | 43 | |
JPMorgan Chase Bank, N.A. | | | 695,000 | | | | EUR | | | | 04/16/21 | | | | 818,781 | | | | 815,150 | | | | (3,631 | ) |
| | | | | | | | | | | | | | | | | | | | | | | $ | (3,588 | ) |
SEE NOTES TO FINANCIAL STATEMENTS. | THE GUGGENHEIM FUNDS SEMI-ANNUAL REPORT | 27 |
SCHEDULE OF INVESTMENTS (Unaudited)(continued) | March 31, 2021 |
HIGH YIELD FUND | |
~ | The face amount is denominated in U.S. dollars unless otherwise indicated. |
* | Non-income producing security. |
† | Value determined based on Level 1 inputs, unless otherwise noted — See Note 4. |
†† | Value determined based on Level 2 inputs, unless otherwise noted — See Note 4. |
††† | Value determined based on Level 3 inputs — See Note 4. |
1 | Affiliated issuer. |
2 | Security has a fixed rate coupon which will convert to a floating or variable rate coupon on a future date. |
3 | Rate indicated is the 7-day yield as of March 31, 2021. |
4 | Security is a 144A or Section 4(a)(2) security. These securities have been determined to be liquid under guidelines established by the Board of Trustees. The total market value of 144A or Section 4(a)(2) securities is $244,484,832 (cost $239,745,417), or 63.6% of total net assets. |
5 | Perpetual maturity. |
6 | All or a portion of this security has been physically segregated or earmarked in connection with reverse repurchase agreements. At March 31, 2021, the total market value of segregated or earmarked securities was $2,205,000 — See Note 6. |
7 | Security is a 144A or Section 4(a)(2) security. These securities have been determined to be illiquid and restricted under guidelines established by the Board of Trustees. The total market value of 144A or Section 4(a)(2) illiquid and restricted securities is $256,125 (cost $1,469,336), or 0.1% of total net assets — See Note 10. |
8 | Security is in default of interest and/or principal obligations. |
9 | Variable rate security. Rate indicated is the rate effective at March 31, 2021. In some instances, the effective rate is limited by a minimum rate floor or a maximum rate cap established by the issuer. The settlement status of a position may also impact the effective rate indicated. In some cases, a position may be unsettled at period end and may not have a stated effective rate. In instances where multiple underlying reference rates and spread amounts are shown, the effective rate is based on a weighted average. |
10 | Payment-in-kind security. |
11 | Rate indicated is the effective yield at the time of purchase. |
| | EUR — Euro |
| | GBP — British Pound |
| | LIBOR — London Interbank Offered Rate |
| | plc — Public Limited Company |
| | SARL — Société à Responsabilité Limitée |
| | |
| | See Sector Classification in Other Information section. |
The following table summarizes the inputs used to value the Fund’s investments at March 31, 2021 (See Note 4 in the Notes to Financial Statements):
Investments in Securities (Assets) | | Level 1
Quoted
Prices | | | Level 2
Significant
Observable
Inputs | | | Level 3
Significant
Unobservable
Inputs | | | Total | |
Common Stocks | | $ | 2,428,044 | | | $ | 1,823,058 | | | $ | 891,220 | | | $ | 5,142,322 | |
Preferred Stocks | | | — | | | | 9,619,060 | | | | 2 | | | | 9,619,062 | |
Warrants | | | — | | | | — | | | | 9 | | | | 9 | |
Exchange-Traded Funds | | | 18,822,400 | | | | — | | | | — | | | | 18,822,400 | |
Money Market Fund | | | 8,883,252 | | | | — | | | | — | | | | 8,883,252 | |
Corporate Bonds | | | — | | | | 302,790,854 | | | | — | | | | 302,790,854 | |
Senior Floating Rate Interests | | | — | | | | 34,576,720 | | | | 8,402,392 | | | | 42,979,112 | |
U.S. Treasury Bills | | | — | | | | 2,919,932 | | | | — | | | | 2,919,932 | |
Asset-Backed Securities | | | — | | | | 2,103,164 | | | | — | | | | 2,103,164 | |
Senior Fixed Rate Interests | | | — | | | | 164,285 | | | | — | | | | 164,285 | |
Forward Foreign Currency Exchange Contracts** | | | — | | | | 52,211 | | | | — | | | | 52,211 | |
Total Assets | | $ | 30,133,696 | | | $ | 354,049,284 | | | $ | 9,293,623 | | | $ | 393,476,603 | |
Investments in Securities (Liabilities) | | Level 1
Quoted
Prices | | | Level 2
Significant
Observable
Inputs | | | Level 3
Significant
Unobservable
Inputs | | | Total | |
Forward Foreign Currency Exchange Contracts** | | $ | — | | | $ | 3,631 | | | $ | — | | | $ | 3,631 | |
Credit Index Swap Agreements** | | | — | | | | 360,270 | | | | — | | | | 360,270 | |
Unfunded Loan Commitments (Note 9) | | | — | | | | — | | | | 8,533 | | | | 8,533 | |
Total Liabilities | | $ | — | | | $ | 363,901 | | | $ | 8,533 | | | $ | 372,434 | |
** | This derivative is reported as unrealized appreciation/depreciation at period end. |
28 | THE GUGGENHEIM FUNDS SEMI-ANNUAL REPORT | SEE NOTES TO FINANCIAL STATEMENTS. |
SCHEDULE OF INVESTMENTS (Unaudited)(continued) | March 31, 2021 |
HIGH YIELD FUND | |
The Fund may hold assets and/or liabilities in which the fair value approximates the carrying amount for financial statement purposes. As of the period end, reverse repurchase agreements of $627,198 are categorized as Level 2 within the disclosure hierarchy — See Note 6.
The following is a summary of significant unobservable inputs used in the fair valuation of assets and liabilities categorized within level 3 of the fair value hierarchy:
Category | | Ending Balance at
March 31, 2021 | | | Valuation Technique | | | Unobservable Inputs | | | Input Range | | | Weighted Average* | |
Assets: | | | | | | | | | | | | | | | | | | | | |
Common Stocks | | $ | 801,479 | | Third Party Pricing | Broker Quote | | | — | | | | — | |
Common Stocks | | | 47,624 | | Enterprise Value | Valuation Multiple | | | 2.9x-10.4x | | | | 5.5x | |
Common Stocks | | | 42,117 | | Model Price | Liquidation Value | | | — | | | | — | |
Preferred Stocks | | | 2 | | Model Price | Liquidation Value | | | — | | | | — | |
Senior Floating Rate Interests | | | 6,833,246 | | Third Party Pricing | Broker Quote | | | — | | | | — | |
Senior Floating Rate Interests | | | 1,473,750 | | Model Price | Market Comparable Yields | | | 10.3 | % | | | — | |
Senior Floating Rate Interests | | | 95,396 | | Third Party Pricing | Vendor Price | | | — | | | | — | |
Warrants | | | 9 | | Third Party Pricing | Vendor Price | | | — | | | | — | |
Total Assets | | $ | 9,293,623 | | | | | | | | | | | |
Liabilities: | | | | | | | | | | | | | | | | | | | | |
Unfunded Loan Commitments | | $ | 8,533 | | Model Price | | | Purchase Price | | | | — | | | | — | |
* | Inputs are weighted by the fair value of the instruments. |
Significant changes in a quote, yield, market comparable yields, liquidation value or valuation multiples would generally result in significant changes in the fair value of the security.
The Fund’s fair valuation leveling guidelines classify a single daily broker quote, or a vendor price based on a single daily or monthly broker quote, as Level 3, if such a quote or price cannot be supported with other available market information.
Transfers between Level 2 and Level 3 may occur as markets fluctuate and/or the availability of data used in an investment’s valuation changes. For the period ended March 31, 2021, the Fund had securities with a total value of $3,313,963 transfer into Level 3 from Level 2 due to lack of observable inputs and had securities with a total value of $1,075,480 transfer into Level 2 from Level 3 due to the availability of current and reliable market-based data provided by a third-party pricing service which utilizes significant observable inputs.
SEE NOTES TO FINANCIAL STATEMENTS. | THE GUGGENHEIM FUNDS SEMI-ANNUAL REPORT | 29 |
SCHEDULE OF INVESTMENTS (Unaudited)(concluded) | March 31, 2021 |
HIGH YIELD FUND | |
Summary of Fair Value Level 3 Activity
Following is a reconciliation of Level 3 assets for which significant unobservable inputs were used to determine fair value for the period ended March 31, 2021:
| | | Assets | | | | | | | Liabilities | |
| | Senior
Floating Rate
Interests | | | Warrants | | | Common
Stocks | | | Preferred
Stocks | | | Total
Assets | | | Unfunded
Loan
Commitments | |
Beginning Balance | | $ | 7,980,655 | | | $ | — | | | $ | 2,790,320 | | | $ | — | | | $ | 10,770,975 | | | $ | (61,765 | ) |
Purchases/(Receipts) | | | 2,205,376 | | | | — | | | | 25,200 | | | | — | | | | 2,230,576 | | | | (53,344 | ) |
(Sales, maturities and paydowns)/Fundings | | | (4,445,004 | ) | | | — | | | | (1,076,463 | ) | | | — | | | | (5,521,467 | ) | | | 5,769 | |
Amortization of premiums/discounts | | | 35,633 | | | | — | | | | — | | | | — | | | | 35,633 | | | | 471 | |
Total realized gains (losses) included in earnings | | | (1,230,299 | ) | | | — | | | | (21,994 | ) | | | — | | | | (1,252,293 | ) | | | 390,625 | |
Total change in unrealized appreciation (depreciation) included in earnings | | | 1,261,925 | | | | — | | | | (470,211 | ) | | | 2 | | | | 791,716 | | | | (290,289 | ) |
Transfers into Level 3 | | | 2,594,106 | | | | 9 | | | | 719,848 | | | | — | | | | 3,313,963 | | | | — | |
Transfers out of Level 3 | | | — | | | | — | | | | (1,075,480 | ) | | | — | | | | (1,075,480 | ) | | | — | |
Ending Balance | | $ | 8,402,392 | | | $ | 9 | | | $ | 891,220 | | | $ | 2 | | | $ | 9,293,623 | | | $ | (8,533 | ) |
Net change in unrealized appreciation (depreciation) for investments in Level 3 securities still held at March 31, 2021 | | $ | 71,075 | | | $ | — | | | $ | 400,466 | | | $ | 2 | | | $ | 471,543 | | | $ | 5,451 | |
Affiliated Transactions
Investments representing 5% or more of the outstanding voting shares of a company, or control of or by, or common control under Guggenheim Investments, result in that company being considered an affiliated issuer, as defined in the 1940 Act.
Transactions during the period ended March 31, 2021, in which the company is an affiliated issuer, were as follows:
Security Name | | Value
09/30/20 | | | Additions | | | Reductions | | | Realized
Gain (Loss) | | | Change in
Unrealized
Appreciation
(Depreciation) | | | Value
03/31/21 | | | Shares
03/31/21 | |
Common Stocks | | | | | | | | | | | | | | | | | | | | | | | | | | | | |
BP Holdco LLC * | | $ | 8,360 | | | $ | — | | | $ | — | | | $ | — | | | $ | — | | | $ | 8,360 | | | | 23,711 | |
Targus Group International Equity, Inc. * | | | 26,349 | | | | — | | | | — | | | | — | | | | 1,099 | | | | 27,448 | | | | 12,825 | |
| | | $ | 34,709 | | | $ | — | | | $ | — | | | $ | — | | | $ | 1,099 | | | $ | 35,808 | | | | | |
* | Non-income producing security. |
30 | THE GUGGENHEIM FUNDS SEMI-ANNUAL REPORT | SEE NOTES TO FINANCIAL STATEMENTS. |
STATEMENT OF ASSETS AND LIABILITIES (Unaudited) |
March 31, 2021 |
Assets: |
Investments in unaffiliated issuers, at value (cost $388,218,414) | | $ | 393,388,584 | |
Investments in affiliated issuers, at value (cost $12,729) | | | 35,808 | |
Foreign currency, at value (cost $2,032) | | | 2,032 | |
Cash | | | 86,894 | |
Segregated cash with broker | | | 480,000 | |
Unrealized appreciation on forward foreign currency exchange contracts | | | 52,211 | |
Prepaid expenses | | | 56,451 | |
Receivables: |
Interest | | | 4,346,106 | |
Securities sold | | | 3,327,112 | |
Swap settlement | | | 452,836 | |
Fund shares sold | | | 297,573 | |
Investment Adviser | | | 19,683 | |
Dividends | | | 578 | |
Total assets | | | 402,545,868 | |
| | | | | |
Liabilities: |
Unfunded loan commitments, at value (Note 9) (commitment fees received $101,837) | | | 8,533 | |
Reverse repurchase agreements (Note 6) | | | 627,198 | |
Segregated cash due to broker | | | 447,953 | |
Unrealized depreciation on OTC swap agreements | | | 360,270 | |
Unrealized depreciation on forward foreign currency exchange contracts | | | 3,631 | |
Payable for: |
Securities purchased | | | 12,770,499 | |
Fund shares redeemed | | | 3,592,697 | |
Distributions to shareholders | | | 251,476 | |
Management fees | | | 181,191 | |
Distribution and service fees | | | 26,716 | |
Fund accounting/administration fees | | | 25,454 | |
Transfer agent/maintenance fees | | | 11,615 | |
Trustees’ fees* | | | 1,269 | |
Miscellaneous | | | 85,274 | |
Total liabilities | | | 18,393,776 | |
Net assets | | $ | 384,152,092 | |
| | | | | |
Net assets consist of: |
Paid in capital | | $ | 408,644,808 | |
Total distributable earnings (loss) | | | (24,492,716 | ) |
Net assets | | $ | 384,152,092 | |
| | | | | |
A-Class: |
Net assets | | $ | 55,483,624 | |
Capital shares outstanding | | | 5,146,477 | |
Net asset value per share | | $ | 10.78 | |
Maximum offering price per share (Net asset value divided by 96.00%) | | $ | 11.23 | |
| | | | | |
C-Class: |
Net assets | | $ | 16,027,378 | |
Capital shares outstanding | | | 1,474,599 | |
Net asset value per share | | $ | 10.87 | |
| | | | | |
P-Class: |
Net assets | | $ | 5,440,856 | |
Capital shares outstanding | | | 504,524 | |
Net asset value per share | | $ | 10.78 | |
| | | | | |
Institutional Class: |
Net assets | | $ | 182,072,000 | |
Capital shares outstanding | | | 20,734,521 | |
Net asset value per share | | $ | 8.78 | |
| | | | | |
R6-Class: |
Net assets | | $ | 125,128,234 | |
Capital shares outstanding | | | 11,622,269 | |
Net asset value per share | | $ | 10.77 | |
* | Relates to Trustees not deemed “interested persons” within the meaning of Section 2(a)(19) of the 1940 Act. |
SEE NOTES TO FINANCIAL STATEMENTS. | THE GUGGENHEIM FUNDS SEMI-ANNUAL REPORT | 31 |
STATEMENT OF OPERATIONS (Unaudited) |
Six Months Ended March 31, 2021 |
Investment Income: |
Dividends from securities of unaffiliated issuers | | $ | 368,772 | |
Interest from securities of unaffiliated issuers | | | 10,664,299 | |
Total investment income | | | 11,033,071 | |
| | | | | |
Expenses: |
Management fees | | | 1,157,554 | |
Distribution and service fees: |
A-Class | | | 69,278 | |
C-Class | | | 82,769 | |
P-Class | | | 7,617 | |
Transfer agent/maintenance fees: |
A-Class | | | 10,679 | |
C-Class | | | 11,310 | |
P-Class | | | 3,176 | |
Institutional Class | | | 91,268 | |
R6-Class | | | 379 | |
Fund accounting/administration fees | | | 134,804 | |
Professional fees | | | 50,470 | |
Interest expense | | | 35,675 | |
Line of credit fees | | | 18,095 | |
Trustees’ fees* | | | 13,038 | |
Custodian fees | | | 8,994 | |
Miscellaneous | | | 82,226 | |
Recoupment of previously waived fees: |
A-Class | | | 1,550 | |
C-Class | | | 1,036 | |
P-Class | | | 1,286 | |
Institutional Class | | | 11,493 | |
Total expenses | | | 1,792,697 | |
Less: |
Expenses reimbursed by Adviser: |
A-Class | | | (1,552 | ) |
C-Class | | | (1,036 | ) |
P-Class | | | (26 | ) |
Institutional Class | | | (11,493 | ) |
Expenses waived by Adviser | | | (14,168 | ) |
Earnings credits applied | | | (219 | ) |
Total waived/reimbursed expenses | | | (28,494 | ) |
Net expenses | | | 1,764,203 | |
Net investment income | | | 9,268,868 | |
| | | | | |
Net Realized and Unrealized Gain (Loss): |
Net realized gain (loss) on: |
Investments in unaffiliated issuers | | $ | 512,554 | |
Swap agreements | | | 1,863,488 | |
Forward foreign currency exchange contracts | | | (101,315 | ) |
Foreign currency transactions | | | 74,665 | |
Net realized gain | | | 2,349,392 | |
Net change in unrealized appreciation (depreciation) on: |
Investments in unaffiliated issuers | | | 13,370,779 | |
Investments in affiliated issuers | | | 1,099 | |
Swap agreements | | | (420,124 | ) |
Forward foreign currency exchange contracts | | | 51,050 | |
Foreign currency translations | | | (211 | ) |
Net change in unrealized appreciation (depreciation) | | | 13,002,593 | |
Net realized and unrealized gain | | | 15,351,985 | |
Net increase in net assets resulting from operations | | $ | 24,620,853 | |
* | Relates to Trustees not deemed “interested persons” within the meaning of Section 2(a)(19) of the 1940 Act. |
32 | THE GUGGENHEIM FUNDS SEMI-ANNUAL REPORT | SEE NOTES TO FINANCIAL STATEMENTS. |
STATEMENTS OF CHANGES IN NET ASSETS |
| | Six Months Ended
March 31, 2021
(Unaudited) | | | Year Ended
September 30,
2020 | |
Increase (Decrease) in Net Assets from Operations: | | | | | | | | |
Net investment income | | $ | 9,268,868 | | | $ | 21,668,717 | |
Net realized gain (loss) on investments | | | 2,349,392 | | | | (18,325,259 | ) |
Net change in unrealized appreciation (depreciation) on investments | | | 13,002,593 | | | | 360,465 | |
Net increase in net assets resulting from operations | | | 24,620,853 | | | | 3,703,923 | |
| | | | | | | | | |
Distributions to shareholders: | | | | | | | | |
A-Class | | | (1,365,884 | ) | | | (3,450,578 | ) |
C-Class | | | (342,483 | ) | | | (971,742 | ) |
P-Class | | | (148,776 | ) | | | (404,265 | ) |
Institutional Class | | | (4,628,319 | ) | | | (10,045,586 | ) |
R6-Class | | | (3,368,173 | ) | | | (8,460,132 | ) |
Total distributions to shareholders | | | (9,853,635 | ) | | | (23,332,303 | ) |
| | | | | | | | | |
Capital share transactions: | | | | | | | | |
Proceeds from sale of shares | | | | | | | | |
A-Class | | | 4,098,594 | | | | 10,674,768 | |
C-Class | | | 1,059,803 | | | | 4,404,185 | |
P-Class | | | 1,206,370 | | | | 1,606,617 | |
Institutional Class | | | 31,919,405 | | | | 115,479,278 | |
R6-Class | | | 4,828,000 | | | | 4,945,592 | |
Redemption fees collected | | | | | | | | |
A-Class | | | 350 | | | | 14,618 | |
C-Class | | | 104 | | | | 4,701 | |
P-Class | | | 39 | | | | 1,654 | |
Institutional Class | | | 1,141 | | | | 39,668 | |
R6-Class | | | 801 | | | | 34,156 | |
Distributions reinvested | | | | | | | | |
A-Class | | | 1,233,517 | | | | 3,103,401 | |
C-Class | | | 320,357 | | | | 888,143 | |
P-Class | | | 148,776 | | | | 404,240 | |
Institutional Class | | | 3,237,399 | | | | 7,451,076 | |
R6-Class | | | 3,368,173 | | | | 8,460,132 | |
Cost of shares redeemed | | | | | | | | |
A-Class | | | (5,971,766 | ) | | | (24,211,963 | ) |
C-Class | | | (2,427,810 | ) | | | (9,558,871 | ) |
P-Class | | | (1,989,659 | ) | | | (3,870,858 | ) |
Institutional Class | | | (31,541,491 | ) | | | (125,810,891 | ) |
R6-Class | | | (15,055,891 | ) | | | (29,504,021 | ) |
Net decrease from capital share transactions | | | (5,563,788 | ) | | | (35,444,375 | ) |
Net increase (decrease) in net assets | | | 9,203,430 | | | | (55,072,755 | ) |
| | | | | | | | | |
Net assets: | | | | | | | | |
Beginning of period | | | 374,948,662 | | | | 430,021,417 | |
End of period | | $ | 384,152,092 | | | $ | 374,948,662 | |
SEE NOTES TO FINANCIAL STATEMENTS. | THE GUGGENHEIM FUNDS SEMI-ANNUAL REPORT | 33 |
STATEMENTS OF CHANGES IN NET ASSETS (concluded) |
| | Six Months Ended
March 31, 2021
(Unaudited) | | | Year Ended
September 30,
2020 | |
Capital share activity: | | | | | | | | |
Shares sold | | | | | | | | |
A-Class | | | 380,540 | | | | 1,065,945 | |
C-Class | | | 97,916 | | | | 411,041 | |
P-Class | | | 113,727 | | | | 155,836 | |
Institutional Class | | | 3,646,674 | | | | 14,086,570 | |
R6-Class | | | 449,022 | | | | 474,234 | |
Shares issued from reinvestment of distributions | | | | | | | | |
A-Class | | | 114,972 | | | | 298,678 | |
C-Class | | | 29,603 | | | | 84,701 | |
P-Class | | | 13,854 | | | | 38,806 | |
Institutional Class | | | 370,429 | | | | 878,483 | |
R6-Class | | | 314,331 | | | | 815,772 | |
Shares redeemed | | | | | | | | |
A-Class | | | (555,672 | ) | | | (2,389,845 | ) |
C-Class | | | (224,556 | ) | | | (920,036 | ) |
P-Class | | | (185,519 | ) | | | (381,340 | ) |
Institutional Class | | | (3,598,812 | ) | | | (14,964,588 | ) |
R6-Class | | | (1,404,521 | ) | | | (2,949,027 | ) |
Net decrease in shares | | | (438,012 | ) | | | (3,294,770 | ) |
34 | THE GUGGENHEIM FUNDS SEMI-ANNUAL REPORT | SEE NOTES TO FINANCIAL STATEMENTS. |
This table is presented to show selected data for a share outstanding throughout each period and to assist shareholders in evaluating a Fund’s performance for the periods presented.
A-Class | | Six Months Ended
March 31, 2021a | | | Year Ended
September 30,
2020 | | | Year Ended
September 30,
2019 | | | Year Ended
September 30,
2018 | | | Year Ended
September 30,
2017 | | | Year Ended
September 30,
2016 | |
Per Share Data |
Net asset value, beginning of period | | $ | 10.37 | | | $ | 10.90 | | | $ | 11.04 | | | $ | 11.50 | | | $ | 11.16 | | | $ | 10.79 | |
Income (loss) from investment operations: |
Net investment income (loss)b | | | .25 | | | | .57 | | | | .64 | | | | .68 | | | | .64 | | | | .67 | |
Net gain (loss) on investments (realized and unrealized) | | | .42 | | | | (.50 | ) | | | (.12 | ) | | | (.46 | ) | | | .35 | | | | .41 | |
Total from investment operations | | | .67 | | | | .07 | | | | .52 | | | | .22 | | | | .99 | | | | 1.08 | |
Less distributions from: |
Net investment income | | | (.26 | ) | | | (.60 | ) | | | (.66 | ) | | | (.68 | ) | | | (.65 | ) | | | (.72 | ) |
Total distributions | | | (.26 | ) | | | (.60 | ) | | | (.66 | ) | | | (.68 | ) | | | (.65 | ) | | | (.72 | ) |
Redemption fees collected | | | — | c | | | — | c | | | — | c | | | — | c | | | — | c | | | .01 | |
Net asset value, end of period | | $ | 10.78 | | | $ | 10.37 | | | $ | 10.90 | | | $ | 11.04 | | | $ | 11.50 | | | $ | 11.16 | |
|
Total Returnd | | | 6.54 | % | | | 0.84 | % | | | 4.99 | % | | | 2.00 | % | | | 9.11 | % | | | 10.71 | % |
Ratios/Supplemental Data |
Net assets, end of period (in thousands) | | $ | 55,484 | | | $ | 53,997 | | | $ | 67,916 | | | $ | 75,028 | | | $ | 126,097 | | | $ | 87,045 | |
Ratios to average net assets: |
Net investment income (loss) | | | 4.66 | % | | | 5.44 | % | | | 5.94 | % | | | 6.05 | % | | | 5.63 | % | | | 6.32 | % |
Total expensese | | | 1.07 | % | | | 1.21 | % | | | 1.27 | % | | | 1.35 | % | | | 1.31 | % | | | 1.25 | % |
Net expensesf,g,h | | | 1.06 | % | | | 1.20 | % | | | 1.26 | % | | | 1.33 | % | | | 1.29 | % | | | 1.23 | % |
Portfolio turnover rate | | | 48 | % | | | 81 | % | | | 61 | % | | | 61 | % | | | 62 | % | | | 55 | % |
C-Class | | Six Months Ended
March 31, 2021a | | | Year Ended
September 30,
2020 | | | Year Ended
September 30,
2019 | | | Year Ended
September 30,
2018 | | | Year Ended
September 30,
2017 | | | Year Ended
September 30,
2016 | |
Per Share Data |
Net asset value, beginning of period | | $ | 10.46 | | | $ | 10.99 | | | $ | 11.14 | | | $ | 11.60 | | | $ | 11.26 | | | $ | 10.88 | |
Income (loss) from investment operations: |
Net investment income (loss)b | | | .21 | | | | .49 | | | | .56 | | | | .60 | | | | .56 | | | | .60 | |
Net gain (loss) on investments (realized and unrealized) | | | .42 | | | | (.49 | ) | | | (.12 | ) | | | (.46 | ) | | | .35 | | | | .41 | |
Total from investment operations | | | .63 | | | | — | | | | .44 | | | | .14 | | | | .91 | | | | 1.01 | |
Less distributions from: |
Net investment income | | | (.22 | ) | | | (.53 | ) | | | (.59 | ) | | | (.60 | ) | | | (.57 | ) | | | (.64 | ) |
Total distributions | | | (.22 | ) | | | (.53 | ) | | | (.59 | ) | | | (.60 | ) | | | (.57 | ) | | | (.64 | ) |
Redemption fees collected | | | — | c | | | — | c | | | — | c | | | — | c | | | — | c | | | .01 | |
Net asset value, end of period | | $ | 10.87 | | | $ | 10.46 | | | $ | 10.99 | | | $ | 11.14 | | | $ | 11.60 | | | $ | 11.26 | |
|
Total Returnd | | | 6.08 | % | | | 0.09 | % | | | 4.12 | % | | | 1.27 | % | | | 8.38 | % | | | 9.81 | % |
Ratios/Supplemental Data |
Net assets, end of period (in thousands) | | $ | 16,027 | | | $ | 16,437 | | | $ | 21,935 | | | $ | 22,350 | | | $ | 30,461 | | | $ | 26,941 | |
Ratios to average net assets: |
Net investment income (loss) | | | 3.82 | % | | | 4.68 | % | | | 5.17 | % | | | 5.31 | % | | | 4.92 | % | | | 5.52 | % |
Total expensese | | | 1.93 | % | | | 2.00 | % | | | 2.03 | % | | | 2.11 | % | | | 2.05 | % | | | 2.01 | % |
Net expensesf,g,h | | | 1.91 | % | | | 1.99 | % | | | 2.02 | % | | | 2.09 | % | | | 2.03 | % | | | 1.98 | % |
Portfolio turnover rate | | | 48 | % | | | 81 | % | | | 61 | % | | | 61 | % | | | 62 | % | | | 55 | % |
SEE NOTES TO FINANCIAL STATEMENTS. | THE GUGGENHEIM FUNDS SEMI-ANNUAL REPORT | 35 |
FINANCIAL HIGHLIGHTS (continued) |
This table is presented to show selected data for a share outstanding throughout each period and to assist shareholders in evaluating a Fund’s performance for the periods presented.
P-Class | | Six Months Ended
March 31, 2021a | | | Year Ended
September 30,
2020 | | | Year Ended
September 30,
2019 | | | Year Ended
September 30,
2018 | | | Year Ended
September 30,
2017 | | | Year Ended
September 30,
2016 | |
Per Share Data |
Net asset value, beginning of period | | $ | 10.38 | | | $ | 10.91 | | | $ | 11.05 | | | $ | 11.51 | | | $ | 11.17 | | | $ | 10.80 | |
Income (loss) from investment operations: |
Net investment income (loss)b | | | .24 | | | | .57 | | | | .64 | | | | .68 | | | | .64 | | | | .67 | |
Net gain (loss) on investments (realized and unrealized) | | | .42 | | | | (.50 | ) | | | (.12 | ) | | | (.46 | ) | | | .37 | | | | .42 | |
Total from investment operations | | | .66 | | | | .07 | | | | .52 | | | | .22 | | | | 1.01 | | | | 1.09 | |
Less distributions from: |
Net investment income | | | (.26 | ) | | | (.60 | ) | | | (.66 | ) | | | (.68 | ) | | | (.67 | ) | | | (.72 | ) |
Total distributions | | | (.26 | ) | | | (.60 | ) | | | (.66 | ) | | | (.68 | ) | | | (.67 | ) | | | (.72 | ) |
Redemption fees collected | | | — | c | | | — | c | | | — | c | | | — | c | | | — | c | | | — | c |
Net asset value, end of period | | $ | 10.78 | | | $ | 10.38 | | | $ | 10.91 | | | $ | 11.05 | | | $ | 11.51 | | | $ | 11.17 | |
|
Total Return | | | 6.41 | % | | | 0.80 | % | | | 4.98 | % | | | 1.95 | % | | | 9.24 | % | | | 10.74 | % |
Ratios/Supplemental Data |
Net assets, end of period (in thousands) | | $ | 5,441 | | | $ | 5,837 | | | $ | 8,170 | | | $ | 12,124 | | | $ | 16,883 | | | $ | 3,178 | |
Ratios to average net assets: |
Net investment income (loss) | | | 4.56 | % | | | 5.42 | % | | | 5.93 | % | | | 6.00 | % | | | 5.58 | % | | | 6.20 | % |
Total expensese | | | 1.17 | % | | | 1.26 | % | | | 1.30 | % | | | 1.45 | % | | | 1.29 | % | | | 1.17 | % |
Net expensesf,g,h | | | 1.17 | % | | | 1.25 | % | | | 1.28 | % | | | 1.39 | % | | | 1.22 | % | | | 1.17 | % |
Portfolio turnover rate | | | 48 | % | | | 81 | % | | | 61 | % | | | 61 | % | | | 62 | % | | | 55 | % |
Institutional Class | | Six Months Ended
March 31, 2021a | | | Year Ended
September 30,
2020 | | | Year Ended
September 30,
2019 | | | Year Ended
September 30,
2018 | | | Year Ended
September 30,
2017 | | | Year Ended
September 30,
2016 | |
Per Share Data |
Net asset value, beginning of period | | $ | 8.45 | | | $ | 8.88 | | | $ | 9.01 | | | $ | 9.38 | | | $ | 9.11 | | | $ | 8.81 | |
Income (loss) from investment operations: |
Net investment income (loss)b | | | .21 | | | | .48 | | | | .54 | | | | .58 | | | | .56 | | | | .58 | |
Net gain (loss) on investments (realized and unrealized) | | | .34 | | | | (.39 | ) | | | (.10 | ) | | | (.38 | ) | | | .28 | | | | .34 | |
Total from investment operations | | | .55 | | | | .09 | | | | .44 | | | | .20 | | | | .84 | | | | .92 | |
Less distributions from: |
Net investment income | | | (.22 | ) | | | (.52 | ) | | | (.57 | ) | | | (.57 | ) | | | (.57 | ) | | | (.62 | ) |
Total distributions | | | (.22 | ) | | | (.52 | ) | | | (.57 | ) | | | (.57 | ) | | | (.57 | ) | | | (.62 | ) |
Redemption fees collected | | | — | c | | | — | c | | | — | c | | | — | c | | | — | c | | | — | c |
Net asset value, end of period | | $ | 8.78 | | | $ | 8.45 | | | $ | 8.88 | | | $ | 9.01 | | | $ | 9.38 | | | $ | 9.11 | |
|
Total Return | | | 6.60 | % | | | 1.14 | % | | | 5.15 | % | | | 2.27 | % | | | 9.56 | % | | | 10.95 | % |
Ratios/Supplemental Data |
Net assets, end of period (in thousands) | | $ | 182,072 | | | $ | 171,641 | | | $ | 180,442 | | | $ | 125,945 | | | $ | 194,280 | | | $ | 141,833 | |
Ratios to average net assets: |
Net investment income (loss) | | | 4.84 | % | | | 5.67 | % | | | 6.17 | % | | | 6.28 | % | | | 6.00 | % | | | 6.58 | % |
Total expensese | | | 0.89 | % | | | 0.98 | % | | | 0.99 | % | | | 1.14 | % | | | 0.94 | % | | | 0.95 | % |
Net expensesf,g,h | | | 0.87 | % | | | 0.96 | % | | | 0.97 | % | | | 1.11 | % | | | 0.93 | % | | | 0.94 | % |
Portfolio turnover rate | | | 48 | % | | | 81 | % | | | 61 | % | | | 61 | % | | | 62 | % | | | 55 | % |
36 | THE GUGGENHEIM FUNDS SEMI-ANNUAL REPORT | SEE NOTES TO FINANCIAL STATEMENTS. |
FINANCIAL HIGHLIGHTS (concluded) |
This table is presented to show selected data for a share outstanding throughout each period and to assist shareholders in evaluating a Fund’s performance for the periods presented.
R6-Class | | Six Months Ended
March 31, 2021a | | | Year Ended
September 30,
2020 | | | Year Ended
September 30,
2019 | | | Year Ended
September 30,
2018 | | | Period Ended
September 30,
2017i | |
Per Share Data |
Net asset value, beginning of period | | $ | 10.36 | | | $ | 10.89 | | | $ | 11.03 | | | $ | 11.49 | | | $ | 11.45 | |
Income (loss) from investment operations: |
Net investment income (loss)b | | | .26 | | | | .60 | | | | .68 | | | | .72 | | | | .24 | |
Net gain (loss) on investments (realized and unrealized) | | | .43 | | | | (.49 | ) | | | (.12 | ) | | | (.46 | ) | | | .04 | |
Total from investment operations | | | .69 | | | | .11 | | | | .56 | | | | .26 | | | | .28 | |
Less distributions from: |
Net investment income | | | (.28 | ) | | | (.64 | ) | | | (.70 | ) | | | (.72 | ) | | | (.24 | ) |
Total distributions | | | (.28 | ) | | | (.64 | ) | | | (.70 | ) | | | (.72 | ) | | | (.24 | ) |
Redemption fees collected | | | — | c | | | — | c | | | — | c | | | — | c | | | — | c |
Net asset value, end of period | | $ | 10.77 | | | $ | 10.36 | | | $ | 10.89 | | | $ | 11.03 | | | $ | 11.49 | |
|
Total Return | | | 6.62 | % | | | 1.19 | % | | | 5.39 | % | | | 2.34 | % | | | 2.49 | % |
Ratios/Supplemental Data |
Net assets, end of period (in thousands) | | $ | 125,128 | | | $ | 127,037 | | | $ | 151,558 | | | $ | 190,421 | | | $ | 200,099 | |
Ratios to average net assets: |
Net investment income (loss) | | | 4.95 | % | | | 5.79 | % | | | 6.31 | % | | | 6.41 | % | | | 5.41 | % |
Total expensese | | | 0.78 | % | | | 0.85 | % | | | 0.89 | % | | | 1.00 | % | | | 0.82 | % |
Net expensesf,g,h | | | 0.77 | % | | | 0.85 | % | | | 0.88 | % | | | 1.00 | % | | | 0.82 | % |
Portfolio turnover rate | | | 48 | % | | | 81 | % | | | 61 | % | | | 61 | % | | | 62 | % |
a | Unaudited figures for the period ended March 31, 2021. Percentage amounts for the period, except total return and portfolio turnover rate, have been annualized. |
b | Net investment income (loss) per share was computed using average shares outstanding throughout the period. |
c | Redemption fees collected are less than $0.01 per share. |
d | Total return does not reflect the impact of any applicable sales charges. |
e | Does not include expenses of the underlying funds in which the Fund invests. |
f | Net expense information reflects the expense ratios after expense waivers and reimbursements, as applicable. |
g | The portion of the ratios of net expenses to average net assets attributable to recoupments of prior fee reductions or expense reimbursements for the periods presented was as follows: |
| | | 03/31/21a | 09/30/20 | 09/30/19 | 09/30/18 | 09/30/17 |
| | A-Class | 0.01% | 0.05% | 0.05% | — | 0.09% |
| | C-Class | 0.01% | 0.04% | 0.05% | — | 0.06% |
| | P-Class | 0.04% | 0.02% | 0.01% | 0.03% | 0.00%* |
| | Institutional Class | 0.01% | 0.02% | 0.02% | 0.04% | 0.00%* |
| | R6-Class | 0.00%* | 0.00%* | 0.00%* | — | — |
h | Net expenses may include expenses that are excluded from the expense limitation agreement. Excluding these expenses, the net expense ratios for the periods presented would be: |
| | | 03/31/21a | 09/30/20 | 09/30/19 | 09/30/18 | 09/30/17 | 09/30/16 |
| | A-Class | 1.06% | 1.12% | 1.15% | 1.10% | 1.15% | 1.16% |
| | C-Class | 1.88% | 1.90% | 1.91% | 1.86% | 1.89% | 1.91% |
| | P-Class | 1.14% | 1.16% | 1.16% | 1.16% | 1.08% | 1.09% |
| | Institutional Class | 0.84% | 0.87% | 0.88% | 0.88% | 0.79% | 0.87% |
| | R6-Class | 0.74% | 0.77% | 0.77% | 0.77% | 0.79% | — |
i | Since commencement of operations: May 15, 2017. Percentage amounts for the period, except total return and portfolio turnover rate, have been annualized. |
SEE NOTES TO FINANCIAL STATEMENTS. | THE GUGGENHEIM FUNDS SEMI-ANNUAL REPORT | 37 |
PERFORMANCE REPORT AND FUND PROFILE (Unaudited) | March 31, 2021 |
CORE BOND FUND
OBJECTIVE: Seeks to provide current income.
Holdings Diversification (Market Exposure as % of Net Assets)
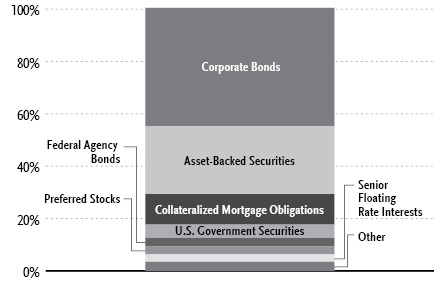
“Holdings Diversification (Market Exposure as % of Net Assets)” excludes any temporary cash investments.
Portfolio Composition by Quality Rating1 |
Rating | % of Total
Investments |
Fixed Income Instruments | |
AAA | 25.5% |
AA | 11.9% |
A | 19.1% |
BBB | 30.7% |
BB | 1.8% |
B | 1.3% |
CC | 0.1% |
C | 0.1% |
NR2 | 0.9% |
Other Instruments | 8.6% |
Total Investments | 100.0% |
Inception Dates: |
A-Class | August 15, 1985 |
C-Class | May 1, 2000 |
P-Class | May 1, 2015 |
Institutional Class | January 29, 2013 |
Ten Largest Holdings (% of Total Net Assets) |
U.S. Treasury Notes, 1.13% | 4.4% |
Pershing Square Tontine Holdings, Ltd. — Class A | 1.0% |
Cerberus Loan Funding XXX, LP, 2.08% | 0.9% |
Woodmont Trust, 2.05% | 0.8% |
U.S. Treasury Strips | 0.8% |
Station Place Securitization Trust, 1.11% | 0.7% |
Delta Air Lines, Inc., 7.00% | 0.7% |
First Republic Bank | 0.6% |
SBA Tower Trust, 2.33% | 0.6% |
Boeing Co., 5.15% | 0.6% |
Top Ten Total | 11.1% |
| | |
“Ten Largest Holdings” excludes any temporary cash or derivative investments. |
1 | Source: BlackRock Solutions. Credit quality ratings are measured on a scale that generally ranges from AAA (highest) to D (lowest). All securities except for those labeled “NR” have been rated by Moody’s, Standard & Poor’s (“S&P”), or Fitch, each of which is a Nationally Recognized Statistical Rating Organization (“NRSRO”). For purposes of this presentation, when ratings are available from more than one agency, the highest rating is used. Guggenheim Investments has converted ratings to the equivalent S&P rating. Security ratings are determined at the time of purchase and may change thereafter. |
2 | NR (not rated) securities do not necessarily indicate low credit quality. |
38 | THE GUGGENHEIM FUNDS SEMI-ANNUAL REPORT | |
PERFORMANCE REPORT AND FUND PROFILE (Unaudited)(concluded) | March 31, 2021 |
Average Annual Returns*
Periods Ended March 31, 2021
| 6 Month† | 1 Year | 5 Year | 10 Year |
A-Class Shares | (0.99%) | 7.05% | 5.03% | 5.04% |
A-Class Shares with sales charge‡ | (4.97%) | 2.77% | 4.17% | 4.53% |
C-Class Shares | (1.36%) | 6.24% | 4.26% | 4.29% |
C-Class Shares with CDSC§ | (2.32%) | 5.24% | 4.26% | 4.29% |
Bloomberg Barclays U.S. Aggregate Bond Index | (2.73%) | 0.71% | 3.10% | 3.44% |
| 6 Month† | 1 Year | 5 Year | Since
Inception
(05/01/15) |
P-Class Shares | (1.04%) | 6.99% | 5.03% | 4.42% |
Bloomberg Barclays U.S. Aggregate Bond Index | (2.73%) | 0.71% | 3.10% | 3.07% |
| 6 Month† | 1 Year | 5 Year | Since
Inception
(01/29/13) |
Institutional Class Shares | (0.89%) | 7.32% | 5.33% | 4.94% |
Bloomberg Barclays U.S. Aggregate Bond Index | (2.73%) | 0.71% | 3.10% | 2.89% |
* | The performance data above represents past performance that is not predictive of future results. The investment return and principal value of an investment in the Fund will fluctuate so that an investor’s shares, when redeemed, may be worth more or less than their original cost. Returns are historical and include changes in principal and reinvested dividends and capital gains and do not reflect the effect of taxes. The Bloomberg Barclays U.S. Aggregate Bond Index is an unmanaged index and, unlike the Fund, has no management fees or operating expenses to reduce its reported return. |
† | 6 month returns are not annualized. |
‡ | Effective October 1, 2015, the maximum sales charge decreased from 4.75% to 4.00%. A 4.75% maximum sales charge is used in the calculation of the Average Annual Returns based on subscriptions made prior to October 1, 2015, and a 4.00% maximum sales charge is used to calculate performance for periods based on subscriptions made on or after October 1, 2015. |
§ | Fund returns include a CDSC of 1% if redeemed within 12 months of purchase. |
| | THE GUGGENHEIM FUNDS SEMI-ANNUAL REPORT | 39 |
SCHEDULE OF INVESTMENTS (Unaudited) | March 31, 2021 |
CORE BOND FUND | |
| | Shares | | | Value | |
COMMON STOCKS† - 1.2% |
| | | | | | | | | |
Financial - 1.2% |
Pershing Square Tontine Holdings, Ltd. — Class A* | | | 622,890 | | | $ | 14,955,589 | |
KKR Acquisition Holdings I Corp.* | | | 299,316 | | | | 2,996,153 | |
RXR Acquisition Corp.* | | | 55,149 | | | | 543,218 | |
MSD Acquisition Corp.* | | | 46,697 | | | | 473,974 | |
Soaring Eagle Acquisition Corp.* | | | 32,556 | | | | 329,467 | |
Colicity, Inc.* | | | 12,785 | | | | 129,128 | |
Total Financial | | | | | | | 19,427,529 | |
| | | | | | | | | |
Industrial - 0.0% |
Constar International Holdings LLC*,††† | | | 68 | | | | — | |
| | | | | | | | | |
Total Common Stocks | | | | |
(Cost $16,528,647) | | | | | | | 19,427,529 | |
| | | | | | | | | |
PREFERRED STOCKS† - 3.0% |
Financial - 3.0% |
First Republic Bank 4.25%*,†† | | | 372,000 | | | | 9,549,240 | |
W R Berkley Corp., 4.13% due 03/30/61†† | | | 300,000 | | | | 7,503,000 | |
Wells Fargo & Co., 4.38%†† | | | 210,000 | | | | 5,237,400 | |
Wells Fargo & Co., 4.70%†† | | | 148,000 | | | | 3,766,600 | |
PartnerRe Ltd., 4.88%* | | | 140,000 | | | | 3,694,600 | |
Bank of America Corp., 4.13%†† | | | 148,000 | | | | 3,667,440 | |
Public Storage, 4.63%†† | | | 118,400 | | | | 3,180,224 | |
Bank of America Corp., 4.38%†† | | | 106,000 | | | | 2,650,000 | |
American Financial Group, Inc., 4.50% due 09/15/60†† | | | 86,800 | | | | 2,301,068 | |
First Republic Bank, 4.13% | | | 53,200 | | | | 1,330,000 | |
CNO Financial Group, Inc., 5.13% due 11/25/60†† | | | 48,000 | | | | 1,209,600 | |
Assurant, Inc., 5.25% due 01/15/61†† | | | 38,000 | | | | 977,360 | |
Public Storage, 4.13%†† | | | 30,400 | | | | 784,624 | |
W R Berkley Corp., 4.25% due 09/30/60†† | | | 25,600 | | | | 652,032 | |
Total Financial | | | | | | | 46,503,188 | |
| | | | | | | | | |
Industrial - 0.0% |
Constar International Holdings LLC*,††† | | | 7 | | | | — | |
Total Preferred Stocks | | | | |
(Cost $45,610,000) | | | | | | | 46,503,188 | |
| | | | | | | | | |
WARRANTS† - 0.0% |
Pershing Square Tontine Holdings, Ltd. | | | | | | | | |
Expiring 07/24/25 | | | 69,210 | | | | 564,062 | |
Total Warrants | | | | |
(Cost $393,044) | | | | | | | 564,062 | |
| | | | | | | | | |
CLOSED-END FUNDS† - 0.2% |
BlackRock MuniHoldings California Quality Fund, Inc. | | | 115,612 | | | | 1,739,961 | |
BlackRock MuniYield California Quality Fund, Inc. | | | 99,320 | | | | 1,462,983 | |
Total Closed-End Funds | | | | |
(Cost $3,178,538) | | | | | | | 3,202,944 | |
| | | | | | | | | |
MONEY MARKET FUND† - 4.2% |
Dreyfus Treasury Securities Cash Management Fund — Institutional Shares, 0.01%1 | | | 65,627,736 | | | | 65,627,736 | |
Total Money Market Fund | | | | |
(Cost $65,627,736) | | | | | | | 65,627,736 | |
| | | | | | | | | |
| | | Face
Amount~ | | | | | |
CORPORATE BONDS†† - 45.3% |
Financial - 19.6% | | | | | | | | |
Wells Fargo & Co. | | | | | | | | |
3.07% due 04/30/412 | | | 8,550,000 | | | | 8,361,002 | |
3.90%2,3 | | | 3,250,000 | | | | 3,282,175 | |
2.57% due 02/11/312 | | | 1,180,000 | | | | 1,188,992 | |
Charles Schwab Corp. | | | | | | | | |
4.00%2,3 | | | 8,000,000 | | | | 7,853,200 | |
5.38%2,3 | | | 3,050,000 | | | | 3,380,925 | |
American International Group, Inc. | | | | | | | | |
3.40% due 06/30/30 | | | 5,120,000 | | | | 5,438,584 | |
4.38% due 06/30/50 | | | 4,280,000 | | | | 4,871,055 | |
JPMorgan Chase & Co. | | | | | | | | |
3.11% due 04/22/412 | | | 3,530,000 | | | | 3,503,341 | |
2.52% due 04/22/312 | | | 2,210,000 | | | | 2,195,950 | |
2.96% due 05/13/312 | | | 1,870,000 | | | | 1,901,888 | |
4.49% due 03/24/312 | | | 1,600,000 | | | | 1,842,244 | |
Bank of America Corp. | | | | | | | | |
2.59% due 04/29/312 | | | 6,900,000 | | | | 6,877,113 | |
2.68% due 06/19/412 | | | 2,650,000 | | | | 2,475,744 | |
Citizens Financial Group, Inc. | | | | | | | | |
3.25% due 04/30/30 | | | 8,070,000 | | | | 8,518,315 | |
2.50% due 02/06/30 | | | 607,000 | | | | 601,087 | |
BPCE S.A. | | | | | | | | |
2.28% due 01/20/322,4 | | | 8,200,000 | | | | 7,922,111 | |
Nationwide Mutual Insurance Co. | | | | | | | | |
4.35% due 04/30/504 | | | 7,410,000 | | | | 7,755,677 | |
Nippon Life Insurance Co. | | | | | | | | |
2.75% due 01/21/512,4 | | | 8,150,000 | | | | 7,732,312 | |
Macquarie Bank Ltd. | | | | | | | | |
3.62% due 06/03/304 | | | 7,470,000 | | | | 7,631,419 | |
Teachers Insurance & Annuity Association of America | | | | | | | | |
3.30% due 05/15/504 | | | 7,750,000 | | | | 7,516,554 | |
Five Corners Funding Trust II | | | | | | | | |
2.85% due 05/15/304 | | | 6,540,000 | | | | 6,735,475 | |
Reliance Standard Life Global Funding II | | | | | | | | |
2.75% due 05/07/254 | | | 6,170,000 | | | | 6,475,169 | |
Wilton RE Ltd. | | | | | | | | |
6.00% †††,2,3,4 | | | 6,350,000 | | | | 6,240,335 | |
GLP Capital Limited Partnership / GLP Financing II, Inc. | | | | | | | | |
4.00% due 01/15/31 | | | 3,600,000 | | | | 3,720,510 | |
5.30% due 01/15/29 | | | 1,900,000 | | | | 2,129,805 | |
Markel Corp. | | | | | | | | |
6.00%2,3 | | | 5,210,000 | | | | 5,665,875 | |
40 | THE GUGGENHEIM FUNDS SEMI-ANNUAL REPORT | SEE NOTES TO FINANCIAL STATEMENTS. |
SCHEDULE OF INVESTMENTS (Unaudited)(continued) | March 31, 2021 |
CORE BOND FUND | |
| | Face
Amount~ | | | Value | |
Reinsurance Group of America, Inc. | | | | | | | | |
3.15% due 06/15/30 | | | 5,350,000 | | | $ | 5,529,924 | |
GA Global Funding Trust | | | | | | | | |
1.63% due 01/15/264 | | | 5,450,000 | | | | 5,440,601 | |
Fidelity National Financial, Inc. | | | | | | | | |
3.40% due 06/15/30 | | | 3,630,000 | | | | 3,786,120 | |
2.45% due 03/15/31 | | | 1,210,000 | | | | 1,169,205 | |
Lincoln National Corp. | | | | | | | | |
3.40% due 01/15/31 | | | 3,170,000 | | | | 3,373,593 | |
4.38% due 06/15/50 | | | 1,200,000 | | | | 1,340,431 | |
Citigroup, Inc. | | | | | | | | |
2.57% due 06/03/312 | | | 4,690,000 | | | | 4,682,942 | |
Prudential plc | | | | | | | | |
3.13% due 04/14/30 | | | 4,365,000 | | | | 4,601,042 | |
Intercontinental Exchange, Inc. | | | | | | | | |
3.00% due 06/15/50 | | | 2,430,000 | | | | 2,248,034 | |
2.65% due 09/15/40 | | | 2,400,000 | | | | 2,209,342 | |
Pershing Square Holdings, Ltd. | | | | | | | | |
3.25% due 11/15/304 | | | 4,500,000 | | | | 4,394,016 | |
Iron Mountain, Inc. | | | | | | | | |
5.25% due 07/15/304 | | | 2,350,000 | | | | 2,424,730 | |
5.63% due 07/15/324 | | | 1,000,000 | | | | 1,045,000 | |
4.50% due 02/15/314 | | | 850,000 | | | | 840,310 | |
Fairfax Financial Holdings Ltd. | | | | | | | | |
3.38% due 03/03/314 | | | 4,300,000 | | | | 4,280,613 | |
BlackRock, Inc. | | | | | | | | |
1.90% due 01/28/31 | | | 4,400,000 | | | | 4,252,423 | |
PartnerRe Finance B LLC | | | | | | | | |
4.50% due 10/01/502 | | | 4,040,000 | | | | 4,116,732 | |
Standard Chartered plc | | | | | | | | |
4.64% due 04/01/312,4 | | | 3,550,000 | | | | 4,026,536 | |
Crown Castle International Corp. | | | | | | | | |
2.90% due 04/01/41 | | | 2,800,000 | | | | 2,564,721 | |
3.30% due 07/01/30 | | | 1,149,000 | | | | 1,199,609 | |
Ares Finance Company II LLC | | | | | | | | |
3.25% due 06/15/304 | | | 3,660,000 | | | | 3,705,517 | |
Host Hotels & Resorts, LP | | | | | | | | |
3.50% due 09/15/30 | | | 3,685,000 | | | | 3,686,986 | |
Aflac, Inc. | | | | | | | | |
3.60% due 04/01/30 | | | 3,350,000 | | | | 3,662,028 | |
MetLife, Inc. | | | | | | | | |
3.85%2,3 | | | 3,520,000 | | | | 3,634,400 | |
KKR Group Finance Company VI LLC | | | | | | | | |
3.75% due 07/01/294 | | | 3,230,000 | | | | 3,567,674 | |
OneAmerica Financial Partners, Inc. | | | | | | | | |
4.25% due 10/15/504 | | | 3,620,000 | | | | 3,482,200 | |
Bank of New York Mellon Corp. | | | | | | | | |
3.70%2,3 | | | 2,250,000 | | | | 2,314,800 | |
4.70%2,3 | | | 1,060,000 | | | | 1,148,457 | |
First American Financial Corp. | | | | | | | | |
4.00% due 05/15/30 | | | 3,180,000 | | | | 3,435,294 | |
Brookfield Finance, Inc. | | | | | | | | |
3.50% due 03/30/51 | | | 2,550,000 | | | | 2,422,463 | |
4.70% due 09/20/47 | | | 650,000 | | | | 739,218 | |
Alleghany Corp. | | | | | | | | |
3.63% due 05/15/30 | | | 2,850,000 | | | | 3,070,930 | |
Quicken Loans LLC / Quicken Loans Company-Issuer, Inc. | | | | | | | | |
3.88% due 03/01/314 | | | 3,150,000 | | | | 3,039,750 | |
Loews Corp. | | | | | | | | |
3.20% due 05/15/30 | | | 2,870,000 | | | | 3,033,436 | |
Arch Capital Group Ltd. | | | | | | | | |
3.64% due 06/30/50 | | | 2,900,000 | | | | 2,899,545 | |
UBS Group AG | | | | | | | | |
2.10% due 02/11/322,4 | | | 2,950,000 | | | | 2,788,940 | |
Belrose Funding Trust | | | | | | | | |
2.33% due 08/15/304 | | | 2,780,000 | | | | 2,675,514 | |
Jefferies Group LLC | | | | | | | | |
2.75% due 10/15/32 | | | 2,720,000 | | | | 2,657,670 | |
KKR Group Finance Company VIII LLC | | | | | | | | |
3.50% due 08/25/504 | | | 2,660,000 | | | | 2,625,469 | |
Everest Reinsurance Holdings, Inc. | | | | | | | | |
3.50% due 10/15/50 | | | 2,560,000 | | | | 2,461,910 | |
Goldman Sachs Group, Inc. | | | | | | | | |
3.50% due 04/01/25 | | | 2,250,000 | | | | 2,436,813 | |
Visa, Inc. | | | | | | | | |
2.00% due 08/15/50 | | | 3,000,000 | | | | 2,420,427 | |
Massachusetts Mutual Life Insurance Co. | | | | | | | | |
3.38% due 04/15/504 | | | 2,450,000 | | | | 2,388,710 | |
Cushman & Wakefield US Borrower LLC | | | | | | | | |
6.75% due 05/15/284 | | | 2,075,000 | | | | 2,243,594 | |
Liberty Mutual Group, Inc. | | | | | | | | |
3.95% due 05/15/604 | | | 2,150,000 | | | | 2,165,651 | |
Pershing Square Holdings Ltd. | | | | | | | | |
5.50% due 07/15/224 | | | 2,000,000 | | | | 2,097,968 | |
Aon Corp. | | | | | | | | |
2.80% due 05/15/30 | | | 1,840,000 | | | | 1,878,967 | |
HS Wildcat LLC | | | | | | | | |
3.83% due 12/31/50††† | | | 2,000,000 | | | | 1,878,471 | |
Manulife Financial Corp. | | | | | | | | |
2.48% due 05/19/27 | | | 1,800,000 | | | | 1,865,680 | |
Fifth Third Bancorp | | | | | | | | |
2.55% due 05/05/27 | | | 1,750,000 | | | | 1,819,597 | |
Dyal Capital Partners III | | | | | | | | |
4.40% due 06/15/40††† | | | 1,750,000 | | | | 1,768,161 | |
AmFam Holdings, Inc. | | | | | | | | |
2.81% due 03/11/314 | | | 1,750,000 | | | | 1,734,874 | |
Australia & New Zealand Banking Group Ltd. | | | | | | | | |
2.57% due 11/25/352,4 | | | 1,800,000 | | | | 1,690,380 | |
Credit Suisse Group AG | | | | | | | | |
4.19% due 04/01/312,4 | | | 1,500,000 | | | | 1,630,640 | |
Kemper Corp. | | | | | | | | |
2.40% due 09/30/30 | | | 1,510,000 | | | | 1,449,548 | |
Allianz SE | | | | | | | | |
3.50%2,3,4 | | | 1,400,000 | | | | 1,421,000 | |
National Australia Bank Ltd. | | | | | | | | |
2.33% due 08/21/304 | | | 1,500,000 | | | | 1,415,909 | |
Raymond James Financial, Inc. | | | | | | | | |
3.75% due 04/01/51 | | | 1,300,000 | | | | 1,341,490 | |
Alexandria Real Estate Equities, Inc. | | | | | | | | |
4.90% due 12/15/30 | | | 1,050,000 | | | | 1,239,480 | |
SEE NOTES TO FINANCIAL STATEMENTS. | THE GUGGENHEIM FUNDS SEMI-ANNUAL REPORT | 41 |
SCHEDULE OF INVESTMENTS (Unaudited)(continued) | March 31, 2021 |
CORE BOND FUND | |
| | Face
Amount~ | | | Value | |
CNA Financial Corp. | | | | | | | | |
2.05% due 08/15/30 | | | 1,250,000 | | | $ | 1,187,262 | |
Prudential Financial, Inc. | | | | | | | | |
3.70% due 10/01/502 | | | 1,160,000 | | | | 1,172,992 | |
Camden Property Trust | | | | | | | | |
2.80% due 05/15/30 | | | 1,100,000 | | | | 1,127,613 | |
QBE Insurance Group Ltd. | | | | | | | | |
5.88%2,3,4 | | | 1,000,000 | | | | 1,076,250 | |
Central Storage Safety Project Trust | | | | | | | | |
4.82% due 02/01/385 | | | 1,000,000 | | | | 1,063,698 | |
Westpac Banking Corp. | | | | | | | | |
2.96% due 11/16/40 | | | 1,100,000 | | | | 1,020,722 | |
Kuvare US Holdings, Inc. | | | | | | | | |
7.00% due 02/17/512,4 | | | 1,000,000 | | | | 1,020,206 | |
Weyerhaeuser Co. | | | | | | | | |
4.00% due 04/15/30 | | | 911,000 | | | | 1,006,338 | |
Apollo Management Holdings, LP | | | | | | | | |
2.65% due 06/05/304 | | | 930,000 | | | | 913,188 | |
W R Berkley Corp. | | | | | | | | |
4.00% due 05/12/50 | | | 850,000 | | | | 901,022 | |
CNO Financial Group, Inc. | | | | | | | | |
5.25% due 05/30/29 | | | 700,000 | | | | 806,223 | |
Nasdaq, Inc. | | | | | | | | |
3.25% due 04/28/50 | | | 850,000 | | | | 796,493 | |
Protective Life Corp. | | | | | | | | |
3.40% due 01/15/304 | | | 740,000 | | | | 769,003 | |
Brown & Brown, Inc. | | | | | | | | |
2.38% due 03/15/31 | | | 800,000 | | | | 768,535 | |
Ameriprise Financial, Inc. | | | | | | | | |
3.00% due 04/02/25 | | | 690,000 | | | | 733,863 | |
Aviation Capital Group LLC | | | | | | | | |
2.88% due 01/20/224 | | | 700,000 | | | | 710,133 | |
New York Life Insurance Co. | | | | | | | | |
3.75% due 05/15/504 | | | 600,000 | | | | 629,731 | |
American Equity Investment Life Holding Co. | | | | | | | | |
5.00% due 06/15/27 | | | 486,000 | | | | 539,758 | |
Hanover Insurance Group, Inc. | | | | | | | | |
2.50% due 09/01/30 | | | 480,000 | | | | 469,012 | |
Fidelity & Guaranty Life Holdings, Inc. | | | | | | | | |
5.50% due 05/01/254 | | | 400,000 | | | | 457,056 | |
Brookfield Finance LLC | | | | | | | | |
3.45% due 04/15/50 | | | 470,000 | | | | 443,497 | |
KKR Group Finance Company III LLC | | | | | | | | |
5.13% due 06/01/444 | | | 100,000 | | | | 121,578 | |
Total Financial | | | | | | | 305,016,515 | |
| | | | | | | | | |
Consumer, Non-cyclical - 5.9% | | | | | | | | |
Altria Group, Inc. | | | | | | | | |
3.70% due 02/04/51 | | | 4,650,000 | | | | 4,226,275 | |
3.40% due 05/06/30 | | | 3,110,000 | | | | 3,243,809 | |
2.35% due 05/06/25 | | | 1,180,000 | | | | 1,222,780 | |
4.45% due 05/06/50 | | | 390,000 | | | | 402,658 | |
Sysco Corp. | | | | | | | | |
5.95% due 04/01/30 | | | 6,860,000 | | | | 8,576,095 | |
CoStar Group, Inc. | | | | | | | | |
2.80% due 07/15/304 | | | 5,810,000 | | | | 5,676,325 | |
Quanta Services, Inc. | | | | | | | | |
2.90% due 10/01/30 | | | 4,740,000 | | | | 4,806,625 | |
BAT Capital Corp. | | | | | | | | |
3.98% due 09/25/50 | | | 2,800,000 | | | | 2,621,986 | |
4.70% due 04/02/27 | | | 1,410,000 | | | | 1,586,372 | |
Zimmer Biomet Holdings, Inc. | | | | | | | | |
3.55% due 03/20/30 | | | 3,850,000 | | | | 4,113,291 | |
Royalty Pharma plc | | | | | | | | |
3.55% due 09/02/504 | | | 2,690,000 | | | | 2,555,476 | |
2.20% due 09/02/304 | | | 1,410,000 | | | | 1,344,541 | |
Constellation Brands, Inc. | | | | | | | | |
2.88% due 05/01/30 | | | 2,680,000 | | | | 2,736,459 | |
3.75% due 05/01/50 | | | 950,000 | | | | 985,659 | |
Alcon Finance Corp. | | | | | | | | |
2.60% due 05/27/304 | | | 3,290,000 | | | | 3,296,759 | |
RELX Capital, Inc. | | | | | | | | |
3.00% due 05/22/30 | | | 2,930,000 | | | | 3,036,739 | |
Keurig Dr Pepper, Inc. | | | | | | | | |
3.20% due 05/01/30 | | | 2,361,000 | | | | 2,496,522 | |
Anheuser-Busch InBev Worldwide, Inc. | | | | | | | | |
3.50% due 06/01/30 | | | 2,225,000 | | | | 2,404,209 | |
McCormick & Company, Inc. | | | | | | | | |
2.50% due 04/15/30 | | | 2,350,000 | | | | 2,342,325 | |
Boston Scientific Corp. | | | | | | | | |
2.65% due 06/01/30 | | | 2,070,000 | | | | 2,086,080 | |
Emory University | | | | | | | | |
2.97% due 09/01/50 | | | 2,000,000 | | | | 1,972,261 | |
Yale-New Haven Health Services Corp. | | | | | | | | |
2.50% due 07/01/50 | | | 2,250,000 | | | | 1,960,561 | |
Becton Dickinson and Co. | | | | | | | | |
2.82% due 05/20/30 | | | 1,890,000 | | | | 1,936,199 | |
Global Payments, Inc. | | | | | | | | |
2.90% due 05/15/30 | | | 1,620,000 | | | | 1,646,105 | |
California Institute of Technology | | | | | | | | |
3.65% due 09/01/19 | | | 1,600,000 | | | | 1,612,702 | |
Universal Health Services, Inc. | | | | | | | | |
2.65% due 10/15/304 | | | 1,320,000 | | | | 1,274,480 | |
5.00% due 06/01/264 | | | 300,000 | | | | 307,500 | |
Quest Diagnostics, Inc. | | | | | | | | |
2.80% due 06/30/31 | | | 1,510,000 | | | | 1,534,281 | |
Kimberly-Clark de Mexico SAB de CV | | | | | | | | |
2.43% due 07/01/314 | | | 1,500,000 | | | | 1,462,215 | |
Duke University | | | | | | | | |
2.83% due 10/01/55 | | | 1,500,000 | | | | 1,447,563 | |
Health Care Service Corporation A Mutual Legal Reserve Co. | | | | | | | | |
3.20% due 06/01/504 | | | 1,480,000 | | | | 1,395,679 | |
Johnson & Johnson | | | | | | | | |
2.45% due 09/01/60 | | | 1,500,000 | | | | 1,323,529 | |
Transurban Finance Company Pty Ltd. | | | | | | | | |
2.45% due 03/16/314 | | | 1,300,000 | | | | 1,261,789 | |
Cheplapharm Arzneimittel GmbH | | | | | | | | |
4.38% due 01/15/28 | | | EUR 1,000,000 | | | | 1,226,642 | |
University of Chicago | | | | | | | | |
3.00% due 10/01/52 | | | 1,250,000 | | | | 1,225,112 | |
42 | THE GUGGENHEIM FUNDS SEMI-ANNUAL REPORT | SEE NOTES TO FINANCIAL STATEMENTS. |
SCHEDULE OF INVESTMENTS (Unaudited)(continued) | March 31, 2021 |
CORE BOND FUND | |
| | Face
Amount~ | | | Value | |
Thermo Fisher Scientific, Inc. | | | | | | | | |
4.50% due 03/25/30 | | | 1,000,000 | | | $ | 1,163,471 | |
Wisconsin Alumni Research Foundation | | | | | | | | |
3.56% due 10/01/49 | | | 1,000,000 | | | | 1,012,672 | |
OhioHealth Corp. | | | | | | | | |
3.04% due 11/15/50 | | | 1,000,000 | | | | 988,872 | |
Smithfield Foods, Inc. | | | | | | | | |
3.00% due 10/15/304 | | | 970,000 | | | | 964,655 | |
Memorial Sloan-Kettering Cancer Center | | | | | | | | |
2.96% due 01/01/50 | | | 1,000,000 | | | | 954,669 | |
Johns Hopkins University | | | | | | | | |
2.81% due 01/01/60 | | | 1,000,000 | | | | 930,421 | |
California Endowment | | | | | | | | |
2.50% due 04/01/51 | | | 1,000,000 | | | | 916,692 | |
Children’s Hospital Corp. | | | | | | | | |
2.59% due 02/01/50 | | | 1,000,000 | | | | 897,278 | |
Prime Security Services Borrower LLC / Prime Finance, Inc. | | | | | | | | |
3.38% due 08/31/274 | | | 925,000 | | | | 897,250 | |
Children’s Health System of Texas | | | | | | | | |
2.51% due 08/15/50 | | | 1,000,000 | | | | 876,611 | |
Moody’s Corp. | | | | | | | | |
3.25% due 05/20/50 | | | 700,000 | | | | 677,259 | |
Total Consumer, Non-cyclical | | | | | | | 91,627,453 | |
| | | | | | | | | |
Industrial - 5.8% | | | | | | | | |
Boeing Co. | | | | | | | | |
5.15% due 05/01/30 | | | 8,000,000 | | | | 9,201,037 | |
5.71% due 05/01/40 | | | 4,380,000 | | | | 5,348,582 | |
5.81% due 05/01/50 | | | 3,440,000 | | | | 4,337,866 | |
5.04% due 05/01/27 | | | 2,150,000 | | | | 2,449,920 | |
3.63% due 02/01/31 | | | 1,450,000 | | | | 1,515,903 | |
2.20% due 02/04/26 | | | 1,000,000 | | | | 996,480 | |
FedEx Corp. | | | | | | | | |
4.25% due 05/15/30 | | | 5,415,000 | | | | 6,144,615 | |
WRKCo, Inc. | | | | | | | | |
3.00% due 06/15/33 | | | 5,370,000 | | | | 5,435,950 | |
Sonoco Products Co. | | | | | | | | |
3.13% due 05/01/30 | | | 4,808,000 | | | | 4,961,518 | |
5.75% due 11/01/40 | | | 150,000 | | | | 184,609 | |
Textron, Inc. | | | | | | | | |
2.45% due 03/15/31 | | | 3,600,000 | | | | 3,483,563 | |
3.00% due 06/01/30 | | | 1,355,000 | | | | 1,375,357 | |
FLNG Liquefaction 3 LLC | | | | | | | | |
3.08% due 06/30/39††† | | | 4,550,000 | | | | 4,363,435 | |
National Basketball Association | | | | | | | | |
2.51% due 12/16/24††† | | | 4,000,000 | | | | 4,091,898 | |
Berry Global, Inc. | | | | | | | | |
1.57% due 01/15/264 | | | 4,100,000 | | | | 4,036,614 | |
Snap-on, Inc. | | | | | | | | |
3.10% due 05/01/506 | | | 3,860,000 | | | | 3,843,109 | |
Vontier Corp. | | | | | | | | |
2.95% due 04/01/314 | | | 3,450,000 | | | | 3,365,820 | |
Acuity Brands Lighting, Inc. | | | | | | | | |
2.15% due 12/15/30 | | | 3,000,000 | | | | 2,838,518 | |
BAE Systems plc | | | | | | | | |
3.40% due 04/15/304 | | | 2,659,000 | | | | 2,820,509 | |
Owens Corning | | | | | | | | |
3.88% due 06/01/30 | | | 2,380,000 | | | | 2,593,473 | |
GATX Corp. | | | | | | | | |
4.00% due 06/30/30 | | | 2,110,000 | | | | 2,322,166 | |
Carrier Global Corp. | | | | | | | | |
2.70% due 02/15/31 | | | 2,210,000 | | | | 2,207,643 | |
CNH Industrial Capital LLC | | | | | | | | |
1.88% due 01/15/26 | | | 1,880,000 | | | | 1,902,283 | |
Flowserve Corp. | | | | | | | | |
3.50% due 10/01/30 | | | 1,810,000 | | | | 1,840,438 | |
Vulcan Materials Co. | | | | | | | | |
3.50% due 06/01/30 | | | 1,510,000 | | | | 1,617,990 | |
Ryder System, Inc. | | | | | | | | |
3.35% due 09/01/25 | | | 1,470,000 | | | | 1,586,987 | |
IDEX Corp. | | | | | | | | |
3.00% due 05/01/30 | | | 1,450,000 | | | | 1,493,546 | |
FLIR Systems, Inc. | | | | | | | | |
2.50% due 08/01/30 | | | 1,340,000 | | | | 1,310,937 | |
Amcor Flexibles North America, Inc. | | | | | | | | |
2.63% due 06/19/30 | | | 1,230,000 | | | | 1,221,605 | |
Xylem, Inc. | | | | | | | | |
2.25% due 01/30/31 | | | 1,100,000 | | | | 1,078,487 | |
Oshkosh Corp. | | | | | | | | |
3.10% due 03/01/30 | | | 240,000 | | | | 246,925 | |
Total Industrial | | | | | | | 90,217,783 | |
| | | | | | | | | |
Consumer, Cyclical - 5.2% | | | | | | | | |
Marriott International, Inc. | | | | | | | | |
3.50% due 10/15/32 | | | 3,300,000 | | | | 3,409,346 | |
4.63% due 06/15/30 | | | 2,830,000 | | | | 3,163,817 | |
2.85% due 04/15/31 | | | 2,320,000 | | | | 2,279,804 | |
5.75% due 05/01/25 | | | 1,900,000 | | | | 2,179,474 | |
Delta Air Lines, Inc. | | | | | | | | |
7.00% due 05/01/254 | | | 8,800,000 | | | | 10,133,701 | |
Hyatt Hotels Corp. | | | | | | | | |
5.38% due 04/23/25 | | | 3,950,000 | | | | 4,427,744 | |
5.75% due 04/23/30 | | | 3,010,000 | | | | 3,513,521 | |
Choice Hotels International, Inc. | | | | | | | | |
3.70% due 01/15/31 | | | 7,340,000 | | | | 7,717,570 | |
Walgreens Boots Alliance, Inc. | | | | | | | | |
4.10% due 04/15/50 | | | 4,510,000 | | | | 4,558,045 | |
3.20% due 04/15/30 | | | 2,254,000 | | | | 2,339,082 | |
Starbucks Corp. | | | | | | | | |
2.55% due 11/15/30 | | | 4,600,000 | | | | 4,605,719 | |
British Airways Class A Pass Through Trust | | | | | | | | |
4.25% due 11/15/324 | | | 3,853,165 | | | | 4,034,907 | |
Smithsonian Institution | | | | | | | | |
2.70% due 09/01/44 | | | 4,000,000 | | | | 3,708,800 | |
VF Corp. | | | | | | | | |
2.95% due 04/23/30 | | | 3,306,000 | | | | 3,421,609 | |
Delta Air Lines Inc. / SkyMiles IP Ltd. | | | | | | | | |
4.50% due 10/20/254 | | | 3,150,000 | | | | 3,354,299 | |
Ferguson Finance plc | | | | | | | | |
3.25% due 06/02/304 | | | 2,840,000 | | | | 2,987,595 | |
Mileage Plus Holdings LLC / Mileage Plus Intellectual Property Assets Ltd. | | | | | | | | |
6.50% due 06/20/274 | | | 2,550,000 | | | | 2,792,250 | |
SEE NOTES TO FINANCIAL STATEMENTS. | THE GUGGENHEIM FUNDS SEMI-ANNUAL REPORT | 43 |
SCHEDULE OF INVESTMENTS (Unaudited)(continued) | March 31, 2021 |
CORE BOND FUND | |
| | Face
Amount~ | | | Value | |
Steelcase, Inc. | | | | | | | | |
5.13% due 01/18/29 | | | 2,224,000 | | | $ | 2,592,325 | |
BorgWarner, Inc. | | | | | | | | |
2.65% due 07/01/27 | | | 2,310,000 | | | | 2,397,265 | |
Lowe’s Companies, Inc. | | | | | | | | |
4.50% due 04/15/30 | | | 1,850,000 | | | | 2,132,564 | |
Whirlpool Corp. | | | | | | | | |
4.60% due 05/15/50 | | | 1,430,000 | | | | 1,639,257 | |
Northern Group Housing LLC | | | | | | | | |
6.80% due 08/15/534 | | | 1,100,000 | | | | 1,486,722 | |
American Airlines Class AA Pass Through Trust | | | | | | | | |
3.20% due 06/15/28 | | | 809,500 | | | | 805,853 | |
Dollar General Corp. | | | | | | | | |
3.50% due 04/03/30 | | | 700,000 | | | | 753,326 | |
JB Poindexter & Company, Inc. | | | | | | | | |
7.13% due 04/15/264 | | | 200,000 | | | | 211,250 | |
Total Consumer, Cyclical | | | | | | | 80,645,845 | |
| | | | | | | | | |
Communications - 3.0% | | | | | | | | |
ViacomCBS, Inc. | | | | | | | | |
4.95% due 01/15/31 | | | 4,478,000 | | | | 5,293,230 | |
4.95% due 05/19/50 | | | 2,490,000 | | | | 2,910,402 | |
4.75% due 05/15/25 | | | 2,260,000 | | | | 2,555,026 | |
2.90% due 01/15/27 | | | 450,000 | | | | 472,438 | |
Charter Communications Operating LLC / Charter Communications Operating Capital | | | | | | | | |
2.80% due 04/01/31 | | | 4,525,000 | | | | 4,473,838 | |
3.90% due 06/01/52 | | | 3,350,000 | | | | 3,208,007 | |
T-Mobile USA, Inc. | | | | | | | | |
3.88% due 04/15/304 | | | 4,750,000 | | | | 5,176,218 | |
Walt Disney Co. | | | | | | | | |
2.65% due 01/13/31 | | | 2,490,000 | | | | 2,531,575 | |
3.80% due 05/13/60 | | | 2,000,000 | | | | 2,193,198 | |
Level 3 Financing, Inc. | | | | | | | | |
4.25% due 07/01/284 | | | 2,650,000 | | | | 2,679,971 | |
3.88% due 11/15/294 | | | 1,150,000 | | | | 1,211,813 | |
Booking Holdings, Inc. | | | | | | | | |
4.63% due 04/13/30 | | | 2,370,000 | | | | 2,758,901 | |
4.50% due 04/13/27 | | | 390,000 | | | | 452,300 | |
AT&T, Inc. | | | | | | | | |
2.75% due 06/01/31 | | | 3,200,000 | | | | 3,184,359 | |
Virgin Media Secured Finance plc | | | | | | | | |
4.50% due 08/15/304 | | | 2,350,000 | | | | 2,370,562 | |
Fox Corp. | | | | | | | | |
3.50% due 04/08/30 | | | 931,000 | | | | 989,822 | |
3.05% due 04/07/25 | | | 450,000 | | | | 478,456 | |
Amazon.com, Inc. | | | | | | | | |
2.70% due 06/03/60 | | | 1,610,000 | | | | 1,422,303 | |
Verizon Communications, Inc. | | | | | | | | |
3.15% due 03/22/30 | | | 1,000,000 | | | | 1,053,825 | |
CSC Holdings LLC | | | | | | | | |
4.13% due 12/01/304 | | | 600,000 | | | | 595,968 | |
Altice France S.A. | | | | | | | | |
5.13% due 01/15/294 | | | 450,000 | | | | 455,625 | |
Telenet Finance Luxembourg Note | | | | | | | | |
5.50% due 03/01/28 | | | 400,000 | | | | 420,000 | |
Total Communications | | | | | | | 46,887,837 | |
| | | | | | | | | |
Energy - 2.2% | | | | | | | | |
Galaxy Pipeline Assets Bidco Ltd. | | | | | | | | |
3.25% due 09/30/404 | | | 6,250,000 | | | | 5,969,132 | |
2.94% due 09/30/404 | | | 4,000,000 | | | | 3,856,489 | |
BP Capital Markets plc | | | | | | | | |
4.88%2,3 | | | 7,530,000 | | | | 8,066,513 | |
Sabine Pass Liquefaction LLC | | | | | | | | |
4.50% due 05/15/30 | | | 4,190,000 | | | | 4,698,940 | |
Magellan Midstream Partners, LP | | | | | | | | |
3.95% due 03/01/50 | | | 2,000,000 | | | | 1,964,449 | |
3.25% due 06/01/30 | | | 1,500,000 | | | | 1,569,274 | |
Valero Energy Corp. | | | | | | | | |
2.15% due 09/15/27 | | | 950,000 | | | | 930,302 | |
2.85% due 04/15/25 | | | 750,000 | | | | 783,665 | |
4.00% due 04/01/29 | | | 500,000 | | | | 538,464 | |
Chevron USA, Inc. | | | | | | | | |
2.34% due 08/12/50 | | | 1,850,000 | | | | 1,532,420 | |
Equinor ASA | | | | | | | | |
2.38% due 05/22/30 | | | 1,210,000 | | | | 1,206,165 | |
Florida Gas Transmission Company LLC | | | | | | | | |
2.55% due 07/01/304 | | | 1,000,000 | | | | 986,074 | |
NuStar Logistics, LP | | | | | | | | |
6.38% due 10/01/30 | | | 700,000 | | | | 756,000 | |
6.00% due 06/01/26 | | | 200,000 | | | | 215,617 | |
Midwest Connector Capital Company LLC | | | | | | | | |
4.63% due 04/01/294 | | | 910,000 | | | | 922,240 | |
Baker Hughes a GE Company LLC / Baker Hughes Co-Obligor, Inc. | | | | | | | | |
4.49% due 05/01/30 | | | 410,000 | | | | 466,759 | |
Phillips 66 | | | | | | | | |
3.70% due 04/06/23 | | | 250,000 | | | | 264,880 | |
Total Energy | | | | | | | 34,727,383 | |
| | | | | | | | | |
Technology - 1.5% | | | | | | | | |
Broadcom, Inc. | | | | | | | | |
4.15% due 11/15/30 | | | 4,230,000 | | | | 4,570,531 | |
2.45% due 02/15/314 | | | 3,700,000 | | | | 3,496,232 | |
NetApp, Inc. | | | | | | | | |
2.70% due 06/22/30 | | | 8,100,000 | | | | 8,036,021 | |
Leidos, Inc. | | | | | | | | |
2.30% due 02/15/314 | | | 2,350,000 | | | | 2,216,896 | |
3.63% due 05/15/254 | | | 600,000 | | | | 650,999 | |
4.38% due 05/15/304 | | | 200,000 | | | | 222,328 | |
Oracle Corp. | | | | | | | | |
3.95% due 03/25/51 | | | 2,450,000 | | | | 2,512,252 | |
Apple, Inc. | | | | | | | | |
2.55% due 08/20/60 | | | 1,550,000 | | | | 1,328,266 | |
Analog Devices, Inc. | | | | | | | | |
2.95% due 04/01/25 | | | 400,000 | | | | 424,946 | |
Total Technology | | | | | | | 23,458,471 | |
| | | | | | | | | |
44 | THE GUGGENHEIM FUNDS SEMI-ANNUAL REPORT | SEE NOTES TO FINANCIAL STATEMENTS. |
SCHEDULE OF INVESTMENTS (Unaudited)(continued) | March 31, 2021 |
CORE BOND FUND | |
| | Face
Amount~ | | | Value | |
Basic Materials - 1.1% | | | | | | | | |
Newcrest Finance Pty Ltd. | | | | | | | | |
3.25% due 05/13/304 | | | 3,600,000 | | | $ | 3,764,365 | |
4.20% due 05/13/504 | | | 1,700,000 | | | | 1,835,022 | |
Anglo American Capital plc | | | | | | | | |
5.63% due 04/01/304 | | | 3,400,000 | | | | 4,057,115 | |
3.95% due 09/10/504 | | | 970,000 | | | | 982,983 | |
2.63% due 09/10/304 | | | 250,000 | | | | 244,868 | |
Nucor Corp. | | | | | | | | |
2.70% due 06/01/30 | | | 3,000,000 | | | | 3,062,302 | |
WR Grace & Company-Conn | | | | | | | | |
4.88% due 06/15/274 | | | 1,241,000 | | | | 1,284,683 | |
Reliance Steel & Aluminum Co. | | | | | | | | |
2.15% due 08/15/30 | | | 810,000 | | | | 776,718 | |
Corporation Nacional del Cobre de Chile | | | | | | | | |
3.75% due 01/15/314 | | | 680,000 | | | | 733,509 | |
Steel Dynamics, Inc. | | | | | | | | |
3.25% due 01/15/31 | | | 490,000 | | | | 518,203 | |
Total Basic Materials | | | | | | | 17,259,768 | |
| | | | | | | | | |
Utilities - 1.0% | | | | | | | | |
Cheniere Corpus Christi Holdings LLC | | | | | | | | |
3.52% due 12/31/39††† | | | 6,700,000 | | | | 6,377,221 | |
Puget Energy, Inc. | | | | | | | | |
6.00% due 09/01/21 | | | 2,180,000 | | | | 2,228,044 | |
AES Corp. | | | | | | | | |
3.95% due 07/15/304 | | | 1,760,000 | | | | 1,876,565 | |
NRG Energy, Inc. | | | | | | | | |
2.45% due 12/02/274 | | | 1,750,000 | | | | 1,735,086 | |
Arizona Public Service Co. | | | | | | | | |
3.35% due 05/15/50 | | | 1,300,000 | | | | 1,284,155 | |
Alexander Funding Trust | | | | | | | | |
1.84% due 11/15/234 | | | 950,000 | | | | 964,497 | |
Black Hills Corp. | | | | | | | | |
2.50% due 06/15/30 | | | 940,000 | | | | 922,825 | |
Total Utilities | | | | | | | 15,388,393 | |
| | | | | | | | | |
Total Corporate Bonds | | | | |
(Cost $692,989,508) | | | 705,229,448 | |
| | | | | | | | | |
ASSET-BACKED SECURITIES†† - 25.9% |
Collateralized Loan Obligations - 16.4% |
Octagon Investment Partners 49 Ltd. | | | | | | | | |
2021-5A, 1.76% (3 Month USD LIBOR + 1.55%, Rate Floor: 1.55%) due 01/15/334,7 | | | 8,500,000 | | | | 8,528,398 | |
2021-5A, 2.26% (3 Month USD LIBOR + 2.05%, Rate Floor: 2.05%) due 01/15/334,7 | | | 7,450,000 | | | | 7,476,471 | |
Woodmont Trust | | | | | | | | |
2020-7A, 2.05% (3 Month USD LIBOR + 1.90%, Rate Floor: 1.90%) due 01/15/324,7 | | | 12,000,000 | | | | 11,986,201 | |
2020-7A, 2.75% (3 Month USD LIBOR + 2.60%, Rate Floor: 2.60%) due 01/15/324,7 | | | 3,750,000 | | | | 3,736,446 | |
Cerberus Loan Funding XXX, LP | | | | | | | | |
2020-3A, 2.08% (3 Month USD LIBOR + 1.85%, Rate Floor: 1.85%) due 01/15/334,7 | | | 13,500,000 | | | | 13,485,113 | |
2020-3A, 2.73% (3 Month USD LIBOR + 2.50%, Rate Floor: 2.50%) due 01/15/334,7 | | | 2,000,000 | | | | 2,001,824 | |
Dryden 33 Senior Loan Fund | | | | | | | | |
2020-33A, 2.24% (3 Month USD LIBOR + 2.00%, Rate Floor: 2.00%) due 04/15/294,7 | | | 8,000,000 | | | | 8,032,775 | |
2020-33A, 1.24% (3 Month USD LIBOR + 1.00%, Rate Floor: 1.00%) due 04/15/294,7 | | | 4,250,000 | | | | 4,245,531 | |
2020-33A, 1.64% (3 Month USD LIBOR + 1.40%, Rate Floor: 1.40%) due 04/15/294,7 | | | 3,000,000 | | | | 2,985,143 | |
Ares LVIII CLO Ltd. | | | | | | | | |
2020-58A, 1.79% (3 Month USD LIBOR + 1.55%, Rate Floor: 1.55%) due 01/15/334,7 | | | 7,600,000 | | | | 7,618,731 | |
2020-58A, 2.39% (3 Month USD LIBOR + 2.15%, Rate Floor: 2.15%) due 01/15/334,7 | | | 3,750,000 | | | | 3,780,538 | |
Benefit Street Partners Clo XXII Ltd. | | | | | | | | |
2020-22A, 1.69% (3 Month USD LIBOR + 1.55%, Rate Floor: 1.55%) due 01/20/324,7 | | | 8,700,000 | | | | 8,631,142 | |
2020-22A, 2.29% (3 Month USD LIBOR + 2.15%, Rate Floor: 2.15%) due 01/20/324,7 | | | 1,000,000 | | | | 1,006,226 | |
Palmer Square Loan Funding Ltd. | | | | | | | | |
2018-4A, 1.09% (3 Month USD LIBOR + 0.90%, Rate Floor: 0.00%) due 11/15/264,7 | | | 2,474,859 | | | | 2,475,495 | |
2021-1A, 1.96% (3 Month USD LIBOR + 1.80%, Rate Floor: 1.80%) due 04/20/294,7 | | | 2,000,000 | | | | 2,001,927 | |
2021-1A, 1.41% (3 Month USD LIBOR + 1.25%, Rate Floor: 1.25%) due 04/20/294,7 | | | 2,000,000 | | | | 1,995,754 | |
2018-4A, 1.64% (3 Month USD LIBOR + 1.45%, Rate Floor: 0.00%) due 11/15/264,7 | | | 1,000,000 | | | | 1,000,874 | |
2021-2A, due 05/20/294 | | | 1,000,000 | | | | 999,800 | |
2019-3A, 1.03% (3 Month USD LIBOR + 0.85%, Rate Floor: 0.85%) due 08/20/274,7 | | | 916,267 | | | | 916,344 | |
Dryden 36 Senior Loan Fund | | | | | | | | |
2020-36A, 2.29% (3 Month USD LIBOR + 2.05%, Rate Floor: 2.05%) due 04/15/294,7 | | | 8,000,000 | | | | 8,033,344 | |
SEE NOTES TO FINANCIAL STATEMENTS. | THE GUGGENHEIM FUNDS SEMI-ANNUAL REPORT | 45 |
SCHEDULE OF INVESTMENTS (Unaudited)(continued) | March 31, 2021 |
CORE BOND FUND | |
| | Face
Amount~ | | | Value | |
AMMC CLO XIV Ltd. | | | | | | | | |
2021-14A, 1.62% (3 Month USD LIBOR + 1.40%, Rate Floor: 1.40%) due 07/25/294,7 | | | 8,000,000 | | | $ | 7,990,212 | |
Madison Park Funding XLVIII Ltd. | | | | | | | | |
2021-48A, 2.14% (3 Month USD LIBOR + 2.00%, Rate Floor: 2.00%) due 04/19/334,7 | | | 4,000,000 | | | | 3,996,595 | |
2021-48A, 1.59% (3 Month USD LIBOR + 1.45%, Rate Floor: 1.45%) due 04/19/334,7 | | | 4,000,000 | | | | 3,992,739 | |
KREF Funding V LLC | | | | | | | | |
1.86% (1 Month USD LIBOR + 1.75%, Rate Floor: 1.75%) due 06/25/26†††,7 | | | 8,000,000 | | | | 7,939,546 | |
0.15% due 06/25/26†††,10 | | | 21,818,182 | | | | 10,691 | |
GoldenTree Loan Management US CLO 1 Ltd. | | | | | | | | |
2020-1A, 1.17% (3 Month USD LIBOR + 0.95%, Rate Floor: 0.95%) due 04/20/294,7 | | | 3,000,000 | | | | 2,999,946 | |
2021-9A, 1.93% (3 Month USD LIBOR + 1.80%, Rate Floor: 1.80%) due 01/20/334,7 | | | 3,000,000 | | | | 2,987,995 | |
2020-1A, 1.67% (3 Month USD LIBOR + 1.45%, Rate Floor: 1.45%) due 04/20/294,7 | | | 1,000,000 | | | | 999,894 | |
ABPCI Direct Lending Fund IX LLC | | | | | | | | |
2020-9A, 2.19% (3 Month USD LIBOR + 1.95%, Rate Floor: 1.95%) due 11/18/314,7 | | | 5,000,000 | | | | 5,004,296 | |
2020-9A, 2.84% (3 Month USD LIBOR + 2.60%, Rate Floor: 2.60%) due 11/18/314,7 | | | 1,000,000 | | | | 1,004,037 | |
MidOcean Credit CLO VII | | | | | | | | |
2020-7A, 1.28% (3 Month USD LIBOR + 1.04%, Rate Floor: 0.00%) due 07/15/294,7 | | | 3,000,000 | | | | 2,996,472 | |
2020-7A, 1.84% (3 Month USD LIBOR + 1.60%, Rate Floor: 0.00%) due 07/15/294,7 | | | 2,000,000 | | | | 1,975,864 | |
2020-7A, 1.69% (3 Month USD LIBOR + 1.45%, Rate Floor: 0.00%) due 07/15/294,7 | | | 1,000,000 | | | | 1,000,322 | |
ABPCI Direct Lending Fund CLO I LLC | | | | | | | | |
2021-1A, 1.79% (3 Month USD LIBOR + 1.60%, Rate Floor: 1.60%) due 04/20/324,7 | | | 5,500,000 | | | | 5,500,000 | |
Cerberus Loan Funding XXXII, LP | | | | | | | | |
2021-2A, due 04/22/334 | | | 5,500,000 | | | | 5,498,900 | |
Parliament Funding II Ltd. | | | | | | | | |
2020-1A, 2.67% (3 Month USD LIBOR + 2.45%, Rate Floor: 2.45%) due 08/12/304,7 | | | 4,000,000 | | | | 4,003,575 | |
2020-1A, 3.42% (3 Month USD LIBOR + 3.20%, Rate Floor: 3.20%) due 08/12/304,7 | | | 1,000,000 | | | | 1,000,512 | |
Cerberus Loan Funding XXXI, LP | | | | | | | | |
2021-1A, 1.69% (3 Month USD LIBOR + 1.50%, Rate Floor: 1.50%) due 04/15/324,7 | | | 4,500,000 | | | | 4,500,000 | |
BXMT Ltd. | | | | | | | | |
2020-FL2, 1.01% (1 Month USD LIBOR + 0.90%, Rate Floor: 0.90%) due 02/16/374,7 | | | 4,250,000 | | | | 4,249,268 | |
Venture XIV CLO Ltd. | | | | | | | | |
2020-14A, 1.22% (3 Month USD LIBOR + 1.03%, Rate Floor: 1.03%) due 08/28/294,7 | | | 4,250,000 | | | | 4,244,513 | |
Golub Capital Partners CLO Ltd. | | | | | | | | |
2018-36A, 1.50% (3 Month USD LIBOR + 1.30%, Rate Floor: 0.00%) due 02/05/314,7 | | | 4,100,000 | | | | 4,074,733 | |
Wellfleet CLO Ltd. | | | | | | | | |
2020-2A, 1.28% (3 Month USD LIBOR + 1.06%, Rate Floor: 0.00%) due 10/20/294,7 | | | 3,250,000 | | | | 3,250,876 | |
Whitebox CLO II Ltd. | | | | | | | | |
2020-2A, 1.99% (3 Month USD LIBOR + 1.75%, Rate Floor: 1.75%) due 10/24/314,7 | | | 2,000,000 | | | | 2,003,857 | |
2020-2A, 2.49% (3 Month USD LIBOR + 2.25%, Rate Floor: 2.25%) due 10/24/314,7 | | | 1,000,000 | | | | 1,003,886 | |
NXT Capital CLO LLC | | | | | | | | |
2017-1A, 1.92% (3 Month USD LIBOR + 1.70%, Rate Floor: 0.00%) due 04/20/294,7 | | | 1,800,000 | | | | 1,802,909 | |
2018-1A, 1.82% (3 Month USD LIBOR + 1.60%, Rate Floor: 0.00%) due 04/21/274,7 | | | 1,000,000 | | | | 999,961 | |
Denali Capital CLO XI Ltd. | | | | | | | | |
2018-1A, 1.35% (3 Month USD LIBOR + 1.13%, Rate Floor: 0.00%) due 10/20/284,7 | | | 2,795,306 | | | | 2,795,641 | |
Lake Shore MM CLO III LLC | | | | | | | | |
2020-1A, 2.53% (3 Month USD LIBOR + 2.30%, Rate Floor: 2.30%) due 10/15/294,7 | | | 2,750,000 | | | | 2,752,788 | |
Diamond CLO Ltd. | | | | | | | | |
2021-1A, 1.65% (3 Month USD LIBOR + 1.45%, Rate Floor: 1.45%) due 04/25/294,7 | | | 1,500,000 | | | | 1,499,700 | |
2018-1A, 1.72% (3 Month USD LIBOR + 1.50%, Rate Floor: 1.50%) due 07/22/304,7 | | | 1,000,000 | | | | 997,959 | |
KREF Ltd. | | | | | | | | |
2018-FL1, 1.21% (1 Month USD LIBOR + 1.10%, Rate Floor: 1.10%) due 06/15/364,7 | | | 2,486,175 | | | | 2,486,507 | |
46 | THE GUGGENHEIM FUNDS SEMI-ANNUAL REPORT | SEE NOTES TO FINANCIAL STATEMENTS. |
SCHEDULE OF INVESTMENTS (Unaudited)(continued) | March 31, 2021 |
CORE BOND FUND | |
| | Face
Amount~ | | | Value | |
Crown Point CLO III Ltd. | | | | | | | | |
2017-3A, 1.69% (3 Month USD LIBOR + 1.45%, Rate Floor: 0.00%) due 12/31/274,7 | | | 2,000,000 | | | $ | 1,999,996 | |
2017-3A, 1.15% (3 Month USD LIBOR + 0.91%, Rate Floor: 0.00%) due 12/31/274,7 | | | 280,250 | | | | 280,231 | |
Ares LVII CLO Ltd. | | | | | | | | |
2020-57A, 1.99% (3 Month USD LIBOR + 1.75%, Rate Floor: 1.75%) due 10/25/314,7 | | | 2,000,000 | | | | 2,011,559 | |
Marathon CLO V Ltd. | | | | | | | | |
2017-5A, 1.05% (3 Month USD LIBOR + 0.87%, Rate Floor: 0.00%) due 11/21/274,7 | | | 1,019,788 | | | | 1,018,801 | |
2017-5A, 1.63% (3 Month USD LIBOR + 1.45%, Rate Floor: 0.00%) due 11/21/274,7 | | | 1,000,000 | | | | 990,403 | |
Apres Static CLO Ltd. | | | | | | | | |
2020-1A, 1.94% (3 Month USD LIBOR + 1.70%, Rate Floor: 0.00%) due 10/15/284,7 | | | 2,000,000 | | | | 2,003,133 | |
GPMT Ltd. | | | | | | | | |
2019-FL2, 1.41% (1 Month USD LIBOR + 1.30%, Rate Floor: 1.30%) due 02/22/364,7 | | | 2,000,000 | | | | 2,002,943 | |
Magnetite Xxix Ltd. | | | | | | | | |
2021-29A, 1.75% (3 Month USD LIBOR + 1.65%, Rate Floor: 1.65%) due 01/15/344,7 | | | 2,000,000 | | | | 2,000,000 | |
Golub Capital Partners CLO 16 Ltd. | | | | | | | | |
2017-16A, 2.07% (3 Month USD LIBOR + 1.85%, Rate Floor: 0.00%) due 07/25/294,7 | | | 2,000,000 | | | | 1,995,334 | |
Avery Point VI CLO Ltd. | | | | | | | | |
2021-6A, 1.96% (3 Month USD LIBOR + 1.80%, Rate Floor: 1.80%) due 08/05/274,7 | | | 2,000,000 | | | | 1,995,074 | |
Neuberger Berman Loan Advisers CLO 40 Ltd. | | | | | | | | |
2021-40A, 1.94% (3 Month USD LIBOR + 1.75%, Rate Floor: 1.75%) due 04/16/334,7 | | | 2,000,000 | | | | 1,992,012 | |
TCW CLO Ltd. | | | | | | | | |
2020-1A, 1.87% (3 Month USD LIBOR + 1.65%, Rate Floor: 1.65%) due 10/20/314,7 | | | 2,000,000 | | | | 1,990,004 | |
Fortress Credit Opportunities XI CLO Ltd. | | | | | | | | |
2018-11A, 1.54% (3 Month USD LIBOR + 1.30%, Rate Floor: 0.00%) due 04/15/314,7 | | | 2,000,000 | | | | 1,981,387 | |
Shackleton CLO Ltd. | | | | | | | | |
2018-6RA, 1.24% (3 Month USD LIBOR + 1.02%, Rate Floor: 1.02%) due 07/17/284,7 | | | 1,923,917 | | | | 1,923,100 | |
Canyon Capital CLO Ltd. | | | | | | | | |
2018-1A, 1.71% (3 Month USD LIBOR + 1.50%, Rate Floor: 1.50%) due 01/30/314,7 | | | 1,900,000 | | | | 1,895,046 | |
Hunt CRE Ltd. | | | | | | | | |
2018-FL2, 1.19% (1 Month USD LIBOR + 1.08%, Rate Floor: 1.08%) due 08/15/284,7 | | | 1,750,000 | | | | 1,745,410 | |
MP CLO VIII Ltd. | | | | | | | | |
2018-2A, 1.13% (3 Month USD LIBOR + 0.91%, Rate Floor: 0.00%) due 10/28/274,7 | | | 1,726,265 | | | | 1,725,716 | |
Wind River CLO Ltd. | | | | | | | | |
2017-2A, 1.11% (3 Month USD LIBOR + 0.87%, Rate Floor: 0.00%) due 10/15/274,7 | | | 1,577,627 | | | | 1,576,246 | |
Allegro CLO IX Ltd. | | | | | | | | |
2018-3A, 1.39% (3 Month USD LIBOR + 1.17%, Rate Floor: 1.17%) due 10/16/314,7 | | | 1,500,000 | | | | 1,504,387 | |
Canyon CLO Ltd. | | | | | | | | |
2020-1A, 2.99% (3 Month USD LIBOR + 2.75%, Rate Floor: 2.75%) due 07/15/284,7 | | | 1,500,000 | | | | 1,503,957 | |
OCP CLO Ltd. | | | | | | | | |
2020-4A, 1.67% (3 Month USD LIBOR + 1.45%, Rate Floor: 1.45%) due 04/24/294,7 | | | 1,500,000 | | | | 1,476,214 | |
Newfleet CLO Ltd. | | | | | | | | |
2018-1A, 1.17% (3 Month USD LIBOR + 0.95%, Rate Floor: 0.00%) due 04/20/284,7 | | | 1,467,774 | | | | 1,466,752 | |
KVK CLO Ltd. | | | | | | | | |
2018-1A, 1.11% (3 Month USD LIBOR + 0.93%, Rate Floor: 0.00%) due 05/20/294,7 | | | 745,951 | | | | 745,583 | |
2017-1A, 1.13% (3 Month USD LIBOR + 0.90%, Rate Floor: 0.00%) due 01/14/284,7 | | | 713,633 | | | | 712,953 | |
Carlyle Global Market Strategies CLO Ltd. | | | | | | | | |
2018-2A, 0.99% (3 Month USD LIBOR + 0.78%, Rate Floor: 0.00%) due 04/27/274,7 | | | 1,285,520 | | | | 1,284,881 | |
Voya CLO Ltd. | | | | | | | | |
2020-1A, 1.30% (3 Month USD LIBOR + 1.06%, Rate Floor: 1.06%) due 04/15/314,7 | | | 1,250,000 | | | | 1,253,733 | |
Owl Rock CLO IV Ltd. | | | | | | | | |
2020-4A, 2.80% (3 Month USD LIBOR + 2.62%, Rate Floor: 2.62%) due 05/20/294,7 | | | 1,250,000 | | | | 1,253,537 | |
610 Funding CLO 3 Ltd. | | | | | | | | |
2018-3A, 1.47% (3 Month USD LIBOR + 1.25%, Rate Floor: 0.00%) due 07/17/284,7 | | | 1,232,130 | | | | 1,232,110 | |
SEE NOTES TO FINANCIAL STATEMENTS. | THE GUGGENHEIM FUNDS SEMI-ANNUAL REPORT | 47 |
SCHEDULE OF INVESTMENTS (Unaudited)(continued) | March 31, 2021 |
CORE BOND FUND | |
| | Face
Amount~ | | | Value | |
FDF II Ltd. | | | | | | | | |
2016-2A, 4.29% due 05/12/314 | | | 1,000,000 | | | $ | 1,008,464 | |
Owl Rock CLO I Ltd. | | | | | | | | |
2019-1A, 1.98% (3Month USD LIBOR + 1.80%, Rate Floor: 1.80%) due 05/20/314,7 | | | 1,000,000 | | | | 1,001,050 | |
Monroe Capital BSL CLO Ltd. | | | | | | | | |
2017-1A, 1.93% (3 Month USD LIBOR + 1.75%, Rate Floor: 0.00%) due 05/22/274,7 | | | 1,000,000 | | | | 1,000,804 | |
Apres Static CLO 2 Ltd. | | | | | | | | |
2020-1A, 3.99% (3 Month USD LIBOR + 3.75%, Rate Floor: 3.75%) due 04/15/284,7 | | | 1,000,000 | | | | 1,000,023 | |
Owl Rock CLO II Ltd. | | | | | | | | |
2021-2A, due 04/20/334 | | | 1,000,000 | | | | 999,750 | |
THL Credit Lake Shore MM CLO I Ltd. | | | | | | | | |
2019-1A, 1.94% (3 Month USD LIBOR + 1.70%, Rate Floor: 1.70%) due 04/15/304,7 | | | 1,000,000 | | | | 996,623 | |
Northwoods Capital XII-B Ltd. | | | | | | | | |
2018-12BA, 2.03% (3 Month USD LIBOR + 1.85%, Rate Floor: 1.85%) due 06/15/314,7 | | | 1,000,000 | | | | 989,317 | |
NewStar Fairfield Fund CLO Ltd. | | | | | | | | |
2018-2A, 1.49% (3 Month USD LIBOR + 1.27%, Rate Floor: 1.27%) due 04/20/304,7 | | | 989,329 | | | | 979,339 | |
Halcyon Loan Advisors Funding Ltd. | | | | | | | | |
2017-3A, 1.12% (3 Month USD LIBOR + 0.90%, Rate Floor: 0.00%) due 10/18/274,7 | | | 935,824 | | | | 936,032 | |
Dryden 37 Senior Loan Fund | | | | | | | | |
2015-37A, due 01/15/314,8 | | | 1,000,000 | | | | 855,586 | |
Golub Capital Partners CLO 17 Ltd. | | | | | | | | |
2017-17A, 1.87% (3 Month USD LIBOR + 1.65%, Rate Floor: 0.00%) due 10/25/304,7 | | | 750,000 | | | | 748,661 | |
Cerberus Loan Funding XXVI, LP | | | | | | | | |
2019-1A, 1.99% (3 Month USD LIBOR + 1.75%, Rate Floor: 1.75%) due 04/15/314,7 | | | 750,000 | | | | 746,604 | |
TCP Waterman CLO Ltd. | | | | | | | | |
2016-1A, 2.23% (3 Month USD LIBOR + 2.05%, Rate Floor: 0.00%) due 12/15/284,7 | | | 723,210 | | | | 723,713 | |
NewStar Clarendon Fund CLO LLC | | | | | | | | |
2019-1A, 1.52% (3 Month USD LIBOR + 1.30%, Rate Floor: 0.00%) due 01/25/274,7 | | | 705,752 | | | | 705,255 | |
LoanCore Issuer Ltd. | | | | | | | | |
2018-CRE1, 1.24% (1 Month USD LIBOR + 1.13%, Rate Floor: 1.13%) due 05/15/284,7 | | | 697,188 | | | | 697,192 | |
Fortress Credit Opportunities IX CLO Ltd. | | | | | | | | |
2017-9A, 1.74% (3 Month USD LIBOR + 1.55%, Rate Floor: 0.00%) due 11/15/294,7 | | | 636,000 | | | | 634,381 | |
Mountain View CLO Ltd. | | | | | | | | |
2018-1A, 1.04% (3 Month USD LIBOR + 0.80%, Rate Floor: 0.80%) due 10/15/264,7 | | | 514,796 | | | | 514,320 | |
Treman Park CLO Ltd. | | | | | | | | |
2015-1A, due 10/20/284,8 | | | 500,000 | | | | 395,720 | |
BSPRT Issuer Ltd. | | | | | | | | |
2018-FL3, 1.16% (1 Month USD LIBOR + 1.05%, Rate Floor: 1.05%) due 03/15/284,7 | | | 362,177 | | | | 362,177 | |
Avery Point V CLO Ltd. | | | | | | | | |
2017-5A, 1.20% (3 Month USD LIBOR + 0.98%, Rate Floor: 0.00%) due 07/17/264,7 | | | 184,300 | | | | 184,309 | |
Babson CLO Ltd. | | | | | | | | |
2014-IA, due 07/20/254,8 | | | 650,000 | | | | 62,725 | |
Copper River CLO Ltd. | | | | | | | | |
2007-1A, due 01/20/215,8 | | | 700,000 | | | | 20,622 | |
Monroe Capital CLO Ltd. | | | | | | | | |
2017-1A, 1.57% (3 Month USD LIBOR + 1.35%, Rate Floor: 0.00%) due 10/22/264,7 | | | 5,204 | | | | 5,203 | |
Total Collateralized Loan Obligations | | | | | | | 255,630,643 | |
| | | | | | | | | |
Financial - 2.7% | | | | | | | | |
Station Place Securitization Trust | | | | | | | | |
2020-16, 1.11% (1 Month USD LIBOR + 1.00%, Rate Floor: 1.00%) due 12/22/21†††,4,7 | | | 11,500,000 | | | | 11,500,000 | |
2021-3, 1.01% (1 Month USD LIBOR + 0.90%, Rate Floor: 0.90%) due 02/16/22†††,4,7 | | | 7,000,000 | | | | 7,000,000 | |
2020-12, 1.61% (1 Month USD LIBOR + 1.50%, Rate Floor: 0.00%) due 06/09/21†††,4,7 | | | 2,250,000 | | | | 2,250,000 | |
2021-SP1, 1.86% (1 Month USD LIBOR + 1.75%, Rate Floor: 1.75%) due 08/17/22†††,4,7 | | | 2,000,000 | | | | 2,000,000 | |
2021-WL1, 2.61% (1 Month USD LIBOR + 2.50%, Rate Floor: 2.50%) due 01/26/544,7 | | | 1,400,000 | | | | 1,399,562 | |
2020-WL1, 2.86% (1 Month USD LIBOR + 2.75%, Rate Floor: 0.00%) due 06/25/51†††,5,7 | | | 1,000,000 | | | | 1,000,000 | |
2021-WL1, 1.36% (1 Month USD LIBOR + 1.25%, Rate Floor: 1.25%) due 01/26/544,7 | | | 1,000,000 | | | | 999,683 | |
2021-WL1, 1.16% (1 Month USD LIBOR + 1.05%, Rate Floor: 1.05%) due 01/26/544,7 | | | 1,000,000 | | | | 999,682 | |
48 | THE GUGGENHEIM FUNDS SEMI-ANNUAL REPORT | SEE NOTES TO FINANCIAL STATEMENTS. |
SCHEDULE OF INVESTMENTS (Unaudited)(continued) | March 31, 2021 |
CORE BOND FUND | |
| | Face
Amount~ | | | Value | |
2021-WL1, 0.96% (1 Month USD LIBOR + 0.85%, Rate Floor: 0.85%) due 01/26/544,7 | | | 1,000,000 | | | $ | 999,681 | |
Aesf Vi Verdi LP | | | | | | | | |
2.15% due 11/25/24††† | | EUR | 4,998,730 | | | | 5,859,956 | |
Strategic Partners Fund VIII LP | | | | | | | | |
3.11% due 03/10/25††† | | | 3,500,000 | | | | 3,565,802 | |
Madison Avenue Secured Funding Trust Series | | | | | | | | |
2020-1, 1.73% (1 Month USD LIBOR + 1.63%, Rate Floor: 0.00%) due 12/13/21†††,4,7 | | | 3,000,000 | | | | 3,000,000 | |
Nassau LLC | | | | | | | | |
2019-1, 3.98% due 08/15/344 | | | 1,017,433 | | | | 1,030,915 | |
Total Financial | | | | | | | 41,605,281 | |
| | | | | | | | | |
Whole Business - 1.8% | | | | | | | | |
Domino’s Pizza Master Issuer LLC | | | | | | | | |
2017-1A, 4.12% due 07/25/474 | | | 6,790,000 | | | | 7,309,978 | |
2017-1A, 1.47% (3 Month USD LIBOR + 1.25%, Rate Floor: 0.00%) due 07/25/474,7 | | | 970,000 | | | | 969,942 | |
Arbys Funding LLC | | | | | | | | |
2020-1A, 3.24% due 07/30/504 | | | 6,716,250 | | | | 6,847,821 | |
ServiceMaster Funding LLC | | | | | | | | |
2020-1, 2.84% due 01/30/514 | | | 4,000,000 | | | | 4,085,080 | |
Taco Bell Funding LLC | | | | | | | | |
2016-1A, 4.97% due 05/25/464 | | | 3,609,375 | | | | 3,911,119 | |
SERVPRO Master Issuer LLC | | | | | | | | |
2021-1A, 2.39% due 04/25/514 | | | 2,000,000 | | | | 1,981,812 | |
Wendy’s Funding LLC | | | | | | | | |
2019-1A, 3.78% due 06/15/494 | | | 1,401,780 | | | | 1,483,518 | |
2015-1A, 4.50% due 06/15/454 | | | 425,250 | | | | 428,065 | |
Applebee’s Funding LLC / IHOP Funding LLC | | | | | | | | |
2019-1A, 4.72% due 06/07/494 | | | 995,000 | | | | 1,046,700 | |
Total Whole Business | | | | | | | 28,064,035 | |
| | | | | | | | | |
Transport-Aircraft - 1.7% | | | | | | | | |
Castlelake Aircraft Structured Trust | | | | | | | | |
2021-1A, 3.47% due 01/15/464 | | | 5,436,817 | | | | 5,520,545 | |
AASET US Ltd. | | | | | | | | |
2018-2A, 4.45% due 11/18/384 | | | 3,652,235 | | | | 3,681,698 | |
Castlelake Aircraft Securitization Trust | | | | | | | | |
2018-1, 4.13% due 06/15/434 | | | 1,288,007 | | | | 1,290,599 | |
2017-1, 3.97% due 07/15/42 | | | 1,263,495 | | | | 1,264,305 | |
AASET Trust | | | | | | | | |
2020-1A, 3.35% due 01/16/404 | | | 1,886,374 | | | | 1,883,075 | |
2017-1A, 3.97% due 05/16/424 | | | 375,275 | | | | 375,996 | |
Falcon Aerospace Ltd. | | | | | | | | |
2019-1, 3.60% due 09/15/394 | | | 1,749,160 | | | | 1,762,929 | |
2017-1, 4.58% due 02/15/424 | | | 477,343 | | | | 481,974 | |
Sapphire Aviation Finance II Ltd. | | | | | | | | |
2020-1A, 3.23% due 03/15/404 | | | 2,086,587 | | | | 2,070,100 | |
MAPS Ltd. | | | | | | | | |
2018-1A, 4.21% due 05/15/434 | | | 1,939,000 | | | | 1,957,227 | |
Sapphire Aviation Finance I Ltd. | | | | | | | | |
2018-1A, 4.25% due 03/15/404 | | | 1,788,509 | | | | 1,779,449 | |
MACH 1 Cayman Ltd. | | | | | | | | |
2019-1, 3.47% due 10/15/394 | | | 1,464,393 | | | | 1,473,098 | |
WAVE LLC | | | | | | | | |
2019-1, 3.60% due 09/15/444 | | | 922,586 | | | | 922,799 | |
AIM Aviation Finance Ltd. | | | | | | | | |
2015-1A, 4.21% due 02/15/404 | | | 761,682 | | | | 604,019 | |
Raspro Trust | | | | | | | | |
2005-1A, 1.15% (3 Month USD LIBOR + 0.93%, Rate Floor: 0.93%) due 03/23/244,7 | | | 373,311 | | | | 370,385 | |
Turbine Engines Securitization Ltd. | | | | | | | | |
2013-1A, 5.13% due 12/13/485 | | | 416,439 | | | | 333,151 | |
Total Transport-Aircraft | | | | | | | 25,771,349 | |
| | | | | | | | | |
Net Lease - 1.0% | | | | | | | | |
Capital Automotive REIT | | | | | | | | |
2020-1A, 3.81% due 02/15/504 | | | 2,247,656 | | | | 2,267,692 | |
2020-1A, 3.48% due 02/15/504 | | | 1,248,698 | | | | 1,276,712 | |
Capital Automotive LLC | | | | | | | | |
2017-1A, 3.87% due 04/15/474 | | | 2,751,066 | | | | 2,755,579 | |
Store Master Funding I-VII | | | | | | | | |
2016-1A, 3.96% due 10/20/464 | | | 2,658,219 | | | | 2,720,938 | |
Oak Street Investment Grade Net Lease Fund Series | | | | | | | | |
2020-1A, 2.26% due 11/20/504 | | | 2,500,000 | | | | 2,458,120 | |
CF Hippolyta LLC | | | | | | | | |
2020-1, 2.60% due 07/15/604 | | | 875,165 | | | | 871,657 | |
2020-1, 2.28% due 07/15/604 | | | 715,784 | | | | 727,570 | |
STORE Master Funding LLC | | | | | | | | |
2014-1A, 5.00% due 04/20/444 | | | 1,448,750 | | | | 1,504,882 | |
Total Net Lease | | | | | | | 14,583,150 | |
| | | | | | | | | |
Collateralized Debt Obligations - 0.8% |
Anchorage Credit Funding 4 Ltd. | | | | | | | | |
2021-4A, 2.72% due 04/27/394 | | | 7,250,000 | | | | 7,195,820 | |
2021-4A, 3.12% due 04/27/394 | | | 2,000,000 | | | | 1,982,243 | |
Anchorage Credit Funding 3 Ltd. | | | | | | | | |
2021-3A, 2.87% due 01/28/394 | | | 3,750,000 | | | | 3,728,264 | |
Putnam Structured Product Funding Ltd. | | | | | | | | |
2003-1A, 1.18% (1 Month USD LIBOR + 1.00%, Rate Floor: 0.00%) due 10/15/385,7 | | | 38,986 | | | | 38,799 | |
Total Collateralized Debt Obligations | | | | | | | 12,945,126 | |
| | | | | | | | | |
Transport-Container - 0.7% | | | | | | | | |
Textainer Marine Containers VII Ltd. | | | | | | | | |
2020-1A, 2.73% due 08/21/454 | | | 4,367,320 | | | | 4,443,779 | |
CLI Funding VI LLC | | | | | | | | |
2020-3A, 2.07% due 10/18/454 | | | 1,888,333 | | | | 1,888,429 | |
2020-1A, 2.08% due 09/18/454 | | | 1,880,000 | | | | 1,873,765 | |
CAL Funding IV Ltd. | | | | | | | | |
2020-1A, 2.22% due 09/25/454 | | | 1,915,000 | | | | 1,917,784 | |
Textainer Marine Containers VIII Ltd. | | | | | | | | |
2020-2A, 2.10% due 09/20/454 | | | 953,212 | | | | 955,042 | |
Total Transport-Container | | | | | | | 11,078,799 | |
| | | | | | | | | |
SEE NOTES TO FINANCIAL STATEMENTS. | THE GUGGENHEIM FUNDS SEMI-ANNUAL REPORT | 49 |
SCHEDULE OF INVESTMENTS (Unaudited)(continued) | March 31, 2021 |
CORE BOND FUND | |
| | Face
Amount~ | | | Value | |
Infrastructure - 0.6% | | | | | | | | |
SBA Tower Trust | | | | | | | | |
2.33% due 01/15/284 | | | 9,250,000 | | | $ | 9,395,041 | |
Vantage Data Centers LLC | | | | | | | | |
2020-2A, 1.99% due 09/15/454 | | | 400,000 | | | | 392,867 | |
Total Infrastructure | | | | | | | 9,787,908 | |
| | | | | | | | | |
Insurance - 0.1% | | | | | | | | |
JGWPT XXV LLC | | | | | | | | |
2012-1A, 4.21% due 02/16/654 | | | 1,356,804 | | | | 1,508,159 | |
Chesterfield Financial Holdings LLC | | | | | | | | |
2014-1A, 4.50% due 12/15/344 | | | 297,000 | | | | 304,602 | |
Total Insurance | | | | | | | 1,812,761 | |
| | | | | | | | | |
Diversified Payment Rights - 0.1% | | | | | | | | |
Bib Merchant Voucher Receivables Ltd. | | | | | | | | |
4.18% due 04/07/28††† | | | 1,000,000 | | | | 1,068,903 | |
Total Asset-Backed Securities | | | | |
(Cost $400,898,773) | | | 402,347,955 | |
| | | | | | | | | |
COLLATERALIZED MORTGAGE OBLIGATIONS†† - 11.6% |
Government Agency - 5.8% | | | | | | | | |
Fannie Mae | | | | | | | | |
2.81% due 05/01/51 | | | 8,250,000 | | | | 8,363,175 | |
2.17% due 03/01/51 | | | 8,347,000 | | | | 7,682,268 | |
2.24% due 01/01/51 | | | 5,979,905 | | | | 5,582,277 | |
2.00% due 09/01/50 | | | 5,102,534 | | | | 4,729,887 | |
2.43% due 01/01/30 | | | 4,500,000 | | | | 4,688,756 | |
2.36% due 08/01/50 | | | 4,500,000 | | | | 4,272,775 | |
2.20% due 11/01/27 | | | 2,586,467 | | | | 2,683,639 | |
4.17% due 02/01/49 | | | 2,000,000 | | | | 2,233,415 | |
3.09% due 10/01/29 | | | 2,000,000 | | | | 2,168,019 | |
2.46% due 01/01/30 | | | 2,000,000 | | | | 2,097,596 | |
2.30% due 11/01/29 | | | 2,000,000 | | | | 2,070,798 | |
2.81% due 09/01/39 | | | 2,000,000 | | | | 2,018,486 | |
2.32% due 02/01/51 | | | 2,096,623 | | | | 1,979,356 | |
2.40% due 03/01/40 | | | 2,000,000 | | | | 1,954,792 | |
2.11% due 10/01/50 | | | 1,885,546 | | | | 1,745,134 | |
2.27% due 02/01/51 | | | 1,747,159 | | | | 1,637,939 | |
2.39% due 02/01/51 | | | 1,454,635 | | | | 1,416,518 | |
due 12/25/439 | | | 1,392,706 | | | | 1,241,038 | |
1.88% due 01/01/36 | | | 1,310,000 | | | | 1,237,946 | |
3.74% due 02/01/30 | | | 1,000,000 | | | | 1,125,433 | |
4.24% due 08/01/48 | | | 1,000,000 | | | | 1,113,870 | |
3.83% due 05/01/49 | | | 1,000,000 | | | | 1,107,860 | |
4.27% due 12/01/33 | | | 966,253 | | | | 1,079,317 | |
3.46% due 08/01/49 | | | 975,151 | | | | 1,045,687 | |
3.61% due 04/01/39 | | | 1,000,000 | | | | 1,041,270 | |
3.11% due 04/01/30 | | | 947,473 | | | | 1,028,227 | |
2.79% due 01/01/32 | | | 981,539 | | | | 1,028,007 | |
2.99% due 01/01/40 | | | 1,000,000 | | | | 1,021,211 | |
2.69% due 10/01/34 | | | 973,690 | | | | 995,044 | |
2.68% due 04/01/50 | | | 982,798 | | | | 979,557 | |
1.68% due 09/01/37 | | | 978,019 | | | | 951,215 | |
1.83% due 08/01/40 | | | 980,556 | | | | 918,104 | |
2.10% due 07/01/50 | | | 987,578 | | | | 914,284 | |
1.76% due 08/01/40 | | | 1,000,000 | | | | 897,240 | |
4.07% due 05/01/49 | | | 780,241 | | | | 846,388 | |
4.37% due 10/01/48 | | | 727,089 | | | | 816,160 | |
4.25% due 05/01/48 | | | 643,429 | | | | 671,133 | |
3.94% due 10/01/36 | | | 337,678 | | | | 377,971 | |
Freddie Mac Seasoned Credit Risk Transfer Trust | | | | | | | | |
2020-3, 2.00% due 05/25/60 | | | 4,651,789 | | | | 4,650,143 | |
2020-2, 2.00% due 11/25/59 | | | 1,793,296 | | | | 1,793,881 | |
Fannie Mae-Aces | | | | | | | | |
2020-M23, 1.50% (WAC) due 03/25/357,10 | | | 25,939,270 | | | | 3,354,910 | |
Freddie Mac | | | | | | | | |
#WA2518, 1.98% due 05/01/50 | | | 1,393,522 | | | | 1,265,436 | |
2018-4762, 4.00% due 01/15/46 | | | 1,000,000 | | | | 1,037,952 | |
Total Government Agency | | | | | | | 89,864,114 | |
| | | | | | | | | |
Commercial Mortgage Backed Securities - 2.6% |
GS Mortgage Securities Trust | | | | | | | | |
2020-GSA2, 2.34% due 12/12/53 | | | 8,000,000 | | | | 7,619,210 | |
2020-GC45, 0.67% (WAC) due 02/13/537,10 | | | 18,973,518 | | | | 912,746 | |
2019-GC42, 0.81% (WAC) due 09/01/527,10 | | | 14,944,012 | | | | 837,220 | |
DBGS Mortgage Trust | | | | | | | | |
2018-C1, 4.64% (WAC) due 10/15/517 | | | 7,000,000 | | | | 7,927,375 | |
CD Mortgage Trust | | | | | | | | |
2017-CD4, 3.95% (WAC) due 05/10/507 | | | 4,750,000 | | | | 5,125,849 | |
2016-CD1, 1.41% (WAC) due 08/10/497,10 | | | 2,291,324 | | | | 136,001 | |
KKR Industrial Portfolio Trust | | | | | | | | |
2021-KDIP, 1.36% (1 Month USD LIBOR + 1.25%, Rate Floor: 1.25%) due 12/15/374,7 | | | 4,600,000 | | | | 4,599,999 | |
GB Trust | | | | | | | | |
2020-FLIX, 1.71% (1 Month USD LIBOR + 1.60%, Rate Floor: 1.60%) due 08/15/374,7 | | | 2,000,000 | | | | 2,005,078 | |
Life Mortgage Trust | | | | | | | | |
2021-BMR, 1.51% (1 Month USD LIBOR + 1.40%, Rate Floor: 1.40%) due 03/15/384,7 | | | 2,000,000 | | | | 2,003,199 | |
GS Mortgage Securities Corporation Trust | | | | | | | | |
2020-UPTN, 3.25% (WAC) due 02/10/374,7 | | | 1,000,000 | | | | 977,478 | |
2020-DUNE, 1.46% (1 Month USD LIBOR + 1.35%, Rate Floor: 1.35%) due 12/15/364,7 | | | 1,000,000 | | | | 974,520 | |
BENCHMARK Mortgage Trust | | | | | | | | |
2019-B14, 0.79% (WAC) due 12/15/627,10 | | | 19,901,961 | | | | 945,128 | |
2018-B6, 0.44% (WAC) due 10/10/517,10 | | | 31,216,284 | | | | 700,668 | |
COMM Mortgage Trust | | | | | | | | |
2015-CR24, 0.76% (WAC) due 08/10/487,10 | | | 44,472,676 | | | | 1,242,807 | |
2015-CR26, 0.93% (WAC) due 10/10/487,10 | | | 9,079,547 | | | | 311,318 | |
Citigroup Commercial Mortgage Trust | | | | | | | | |
2019-GC43, 0.63% (WAC) due 11/10/527,10 | | | 19,956,777 | | | | 878,525 | |
2016-GC37, 1.70% (WAC) due 04/10/497,10 | | | 3,377,132 | | | | 231,747 | |
2016-C2, 1.74% (WAC) due 08/10/497,10 | | | 2,399,325 | | | | 172,092 | |
2016-P5, 1.50% (WAC) due 10/10/497,10 | | | 1,906,852 | | | | 105,163 | |
CSAIL Commercial Mortgage Trust | | | | | | | | |
2019-C15, 1.05% (WAC) due 03/15/527,10 | | | 12,437,592 | | | | 775,956 | |
50 | THE GUGGENHEIM FUNDS SEMI-ANNUAL REPORT | SEE NOTES TO FINANCIAL STATEMENTS. |
SCHEDULE OF INVESTMENTS (Unaudited)(continued) | March 31, 2021 |
CORE BOND FUND | |
| | Face
Amount~ | | | Value | |
SG Commercial Mortgage Securities Trust | | | | | | | | |
2016-C5, 1.95% (WAC) due 10/10/487,10 | | | 9,481,671 | | | $ | 620,787 | |
UBS Commercial Mortgage Trust | | | | | | | | |
2017-C2, 1.06% (WAC) due 08/15/507,10 | | | 10,382,016 | | | | 520,975 | |
JPMDB Commercial Mortgage Securities Trust | | | | | | | | |
2016-C2, 1.57% (WAC) due 06/15/497,10 | | | 7,566,095 | | | | 421,366 | |
Morgan Stanley Capital I Trust | | | | | | | | |
2016-UB11, 1.51% (WAC) due 08/15/497,10 | | | 6,849,681 | | | | 391,955 | |
Wells Fargo Commercial Mortgage Trust | | | | | | | | |
2016-NXS5, 1.44% (WAC) due 01/15/597,10 | | | 3,822,963 | | | | 211,417 | |
2016-C37, 0.93% (WAC) due 12/15/497,10 | | | 3,603,502 | | | | 106,460 | |
CFCRE Commercial Mortgage Trust | | | | | | | | |
2016-C3, 0.99% (WAC) due 01/10/487,10 | | | 5,653,383 | | | | 230,734 | |
Total Commercial Mortgage Backed Securities | | | | | | | 40,985,773 | |
| | | | | | | | | |
Residential Mortgage Backed Securities - 2.1% |
Mill City Mortgage Loan Trust | | | | | | | | |
2021-NMR1, 2.50% (WAC) due 11/25/604,7 | | | 4,800,000 | | | | 4,679,482 | |
Verus Securitization Trust | | | | | | | | |
2019-4, 2.85% due 11/25/594,11 | | | 1,540,170 | | | | 1,565,888 | |
2020-1, 2.42% due 01/25/604,11 | | | 1,537,230 | | | | 1,553,633 | |
2019-4, 2.64% due 11/25/594,11 | | | 1,199,274 | | | | 1,220,547 | |
BRAVO Residential Funding Trust | | | | | | | | |
2019-NQM1, 2.67% (WAC) due 07/25/594,7 | | | 1,299,039 | | | | 1,313,802 | |
2019-NQM2, 2.75% (WAC) due 11/25/594,7 | | | 1,150,277 | | | | 1,186,223 | |
2021-HE1, 1.52% (30 Day Average U.S. Secured Overnight Financing Rate + 1.50%, Rate Floor: 0.00%) due 01/25/704,7 | | | 1,000,000 | | | | 997,528 | |
Starwood Mortgage Residential Trust | | | | | | | | |
2020-1, 2.41% (WAC) due 02/25/504,7 | | | 924,890 | | | | 939,962 | |
2020-1, 2.56% (WAC) due 02/25/504,7 | | | 924,890 | | | | 935,037 | |
2020-1, 2.28% (WAC) due 02/25/504,7 | | | 626,520 | | | | 638,049 | |
2019-1, 2.94% (WAC) due 06/25/494,7 | | | 72,218 | | | | 72,642 | |
CSMC Trust | | | | | | | | |
2018-RPL9, 3.85% (WAC) due 09/25/574,7 | | | 1,699,039 | | | | 1,801,548 | |
2020-NQM1, 1.72% due 05/25/654,11 | | | 781,050 | | | | 781,498 | |
New Residential Mortgage Loan Trust | | | | | | | | |
2018-2A, 3.50% (WAC) due 02/25/584,7 | | | 1,074,981 | | | | 1,121,975 | |
2019-6A, 3.50% (WAC) due 09/25/594,7 | | | 769,776 | | | | 811,291 | |
2018-1A, 4.00% (WAC) due 12/25/574,7 | | | 535,257 | | | | 571,353 | |
Homeward Opportunities Fund I Trust | | | | | | | | |
2019-3, 2.68% (WAC) due 11/25/594,7 | | | 944,447 | | | | 955,953 | |
2019-2, 2.70% (WAC) due 09/25/594,7 | | | 591,837 | | | | 595,281 | |
Residential Mortgage Loan Trust | | | | | | | | |
2020-1, 2.38% (WAC) due 02/25/244,7 | | | 726,109 | | | | 734,635 | |
2020-1, 2.68% (WAC) due 02/25/244,7 | | | 726,109 | | | | 731,593 | |
Angel Oak Mortgage Trust | | | | | | | | |
2020-1, 2.77% (WAC) due 12/25/594,7 | | | 1,348,353 | | | | 1,360,989 | |
SPS Servicer Advance Receivables Trust | | | | | | | | |
2020-T2, 1.83% due 11/15/554 | | | 1,250,000 | | | | 1,226,036 | |
American Home Mortgage Investment Trust | | | | | | | | |
2007-1, 2.08% due 05/25/4710 | | | 7,671,735 | | | | 1,213,513 | |
SG Residential Mortgage Trust | | | | | | | | |
2019-3, 2.70% (WAC) due 09/25/594,7 | | | 997,053 | | | | 1,011,272 | |
Securitized Asset Backed Receivables LLC Trust | | | | | | | | |
2006-HE2, 0.41% (1 Month USD LIBOR + 0.30%, Rate Floor: 0.30%) due 07/25/367 | | | 1,628,219 | | | | 912,163 | |
Citigroup Mortgage Loan Trust | | | | | | | | |
2019-IMC1, 2.72% (WAC) due 07/25/494,7 | | | 739,573 | | | | 753,118 | |
GS Mortgage-Backed Securities Trust | | | | | | | | |
2020-NQM1, 1.79% (WAC) due 09/27/604,7 | | | 691,170 | | | | 696,346 | |
MFRA Trust | | | | | | | | |
2021-INV1, 2.29% (WAC) due 01/25/564,7 | | | 700,000 | | | | 676,406 | |
RALI Series Trust | | | | | | | | |
2006-QO2, 0.55% (1 Month USD LIBOR + 0.44%, Rate Floor: 0.44%) due 02/25/467 | | | 1,641,676 | | | | 503,156 | |
Nationstar HECM Loan Trust | | | | | | | | |
2019-2A, 2.27% (WAC) due 11/25/294,7 | | | 500,635 | | | | 501,548 | |
Deephaven Residential Mortgage Trust | | | | | | | | |
2019-3A, 2.96% (WAC) due 07/25/594,7 | | | 416,988 | | | | 419,980 | |
Washington Mutual Mortgage Pass-Through Certificates WMALT Series Trust | | | | | | | | |
2006-AR9, 1.10% (1 Year CMT Rate + 0.84%, Rate Floor: 0.84%) due 11/25/467 | | | 326,419 | | | | 280,394 | |
MASTR Adjustable Rate Mortgages Trust | | | | | | | | |
2003-5, 2.17% (WAC) due 11/25/337 | | | 268,735 | | | | 254,654 | |
UCFC Manufactured Housing Contract | | | | | | | | |
1997-2, 7.38% due 10/15/28 | | | 79,504 | | | | 81,058 | |
Total Residential Mortgage Backed Securities | | | | | | | 33,098,553 | |
| | | | | | | | | |
Military Housing - 1.1% | | | | | | | | |
Freddie Mac Military Housing Bonds Resecuritization Trust Certificates | | | | | | | | |
2015-R1, 3.48% (WAC) due 11/25/554,7 | | | 7,105,700 | | | | 7,969,681 | |
2015-R1, 4.11% (WAC) due 11/25/524,7 | | | 2,933,486 | | | | 3,224,010 | |
2015-R1, 0.52% (WAC) due 11/25/554,7,10 | | | 10,399,733 | | | | 679,705 | |
Capmark Military Housing Trust | | | | | | | | |
2006-RILY, 6.15% due 07/10/514 | | | 2,306,417 | | | | 2,345,065 | |
2007-ROBS, 6.06% due 10/10/524 | | | 463,942 | | | | 483,031 | |
2007-AETC, 5.75% due 02/10/524 | | | 273,850 | | | | 281,915 | |
GMAC Commercial Mortgage Asset Corp. | | | | | | | | |
2007-HCKM, 6.11% due 08/10/524 | | | 1,459,217 | | | | 1,609,281 | |
Total Military Housing | | | | | | | 16,592,688 | |
| | | | | | | | | |
Total Collateralized Mortgage Obligations | | | | |
(Cost $184,537,753) | | | 180,541,128 | |
| | | | | | | | | |
U.S. GOVERNMENT SECURITIES†† - 5.2% |
U.S. Treasury Notes |
1.13% due 02/15/3112 | | | 73,097,000 | | | | 69,008,137 | |
U.S. Treasury Strips |
due 02/15/509,13 | | | 23,802,000 | | | | 11,619,286 | |
Total U.S. Government Securities | | | | |
(Cost $84,837,817) | | | | | | | 80,627,423 | |
| | | | | | | | | |
SEE NOTES TO FINANCIAL STATEMENTS. | THE GUGGENHEIM FUNDS SEMI-ANNUAL REPORT | 51 |
SCHEDULE OF INVESTMENTS (Unaudited)(continued) | March 31, 2021 |
CORE BOND FUND | |
| | Face
Amount~ | | | Value | |
FEDERAL AGENCY BONDS†† - 3.2% |
Fannie Mae Principal Strips |
due 07/15/379,13 | | | 13,000,000 | | | $ | 8,682,700 | |
due 08/06/3813 | | | 250,000 | | | | 161,266 | |
Freddie Mac Principal Strips |
due 07/15/3213 | | | 10,550,000 | | | | 8,300,350 | |
Federal Farm Credit Bank |
3.51% due 06/11/40 | | | 3,300,000 | | | | 3,814,724 | |
2.43% due 01/29/37 | | | 3,000,000 | | | | 3,058,146 | |
2.70% due 01/30/45 | | | 1,053,000 | | | | 1,045,044 | |
2.88% due 10/01/40 | | | 350,000 | | | | 370,533 | |
Tennessee Valley Authority Principal Strips |
due 06/15/389,13 | | | 9,400,000 | | | | 5,842,344 | |
due 01/15/489,13 | | | 9,700,000 | | | | 4,251,093 | |
due 01/15/3813 | | | 4,000,000 | | | | 2,531,616 | |
due 06/15/359,13 | | | 1,583,000 | | | | 1,125,868 | |
due 12/15/429,13 | | | 1,600,000 | | | | 839,549 | |
United States International Development Finance Corp. |
1.63% due 11/20/37 | | | 4,000,000 | | | | 3,842,682 | |
Tennessee Valley Authority |
4.25% due 09/15/65 | | | 1,300,000 | | | | 1,677,038 | |
5.38% due 04/01/56 | | | 600,000 | | | | 906,907 | |
Freddie Mac |
due 01/02/3413 | | | 1,850,000 | | | | 1,386,244 | |
due 09/15/3613 | | | 300,000 | | | | 204,863 | |
due 01/15/2813 | | | 150,000 | | | | 135,202 | |
U.S. International Development Finance Corp. |
due 01/17/2613 | | | 800,000 | | | | 854,548 | |
1.79% due 10/15/29 | | | 588,138 | | | | 618,515 | |
Total Federal Agency Bonds | | | | |
(Cost $48,126,543) | | | | | | | 49,649,232 | |
| | | | | | | | | |
SENIOR FLOATING RATE INTERESTS††,7 - 2.9% |
Consumer, Cyclical - 1.0% | | | | | | | | |
Murphy Oil USA, Inc. | | | | | | | | |
2.25% (1 Month USD LIBOR + 1.75%, Rate Floor: 2.25%) due 01/31/28††† | | | 8,000,000 | | | | 8,030,000 | |
CHG Healthcare Services, Inc. | | | | | | | | |
4.00% (3 Month USD LIBOR + 3.00%, Rate Floor: 4.00%) due 06/07/23 | | | 3,022,214 | | | | 3,010,337 | |
Samsonite IP Holdings SARL | | | | | | | | |
5.50% (1 Month USD LIBOR + 4.50%, Rate Floor: 5.50%) due 04/25/25 | | | 2,431,625 | | | | 2,446,823 | |
BGIS (BIFM CA Buyer, Inc.) | | | | | | | | |
3.61% (1 Month USD LIBOR + 3.50%, Rate Floor: 3.50%) due 06/01/26 | | | 2,129,587 | | | | 2,113,615 | |
Total Consumer, Cyclical | | | | | | | 15,600,775 | |
| | | | | | | | | |
Technology - 0.4% | | | | | | | | |
Ascend Learning LLC | | | | | | | | |
4.75% (1 Month USD LIBOR + 3.75%, Rate Floor: 4.75%) due 07/12/24 | | | 3,681,500 | | | | 3,679,217 | |
Valkyr Purchaser, LLC | | | | | | | | |
4.75% (3 Month USD LIBOR + 4.00%, Rate Floor: 4.75%) due 11/05/27 | | | 1,600,000 | | | | 1,599,328 | |
RP Crown Parent LLC (Blue Yonder) | | | | | | | | |
4.00% (1 Month USD LIBOR + 3.00%, Rate Floor: 4.00%) due 02/02/26 | | | 796,000 | | | | 795,252 | |
Cologix Holdings, Inc. | | | | | | | | |
4.75% (1 Month USD LIBOR + 3.75%, Rate Floor: 4.75%) due 03/20/24 | | | 150,000 | | | | 149,652 | |
Total Technology | | | | | | | 6,223,449 | |
| | | | | | | | | |
Industrial - 0.4% | | | | | | | | |
Mileage Plus Holdings LLC | | | | | | | | |
6.25% (3 Month USD LIBOR + 5.25%, Rate Floor: 6.25%) due 06/21/27 | | | 1,950,000 | | | | 2,069,750 | |
Berry Global, Inc. | | | | | | | | |
due 07/01/26 | | | 1,600,000 | | | | 1,585,744 | |
Pelican Products, Inc. | | | | | | | | |
4.50% (3 Month USD LIBOR + 3.50%, Rate Floor: 4.50%) due 05/01/25 | | | 1,047,315 | | | | 1,034,883 | |
Service Logic Acquisition, Inc. | | | | | | | | |
4.75% (2 Month USD LIBOR + 4.00% and 3 Month USD LIBOR + 4.00%, Rate Floor: 4.75%) due 10/29/27 | | | 682,537 | | | | 681,684 | |
Diversitech Holdings, Inc. | | | | | | | | |
4.25% (3 Month USD LIBOR + 3.25%, Rate Floor: 4.25%) due 06/03/24††† | | | 497,810 | | | | 496,255 | |
Berlin Packaging LLC | | | | | | | | |
3.12% (1 Month USD LIBOR + 3.00% and 3 Month USD LIBOR + 3.00%, Rate Floor: 3.00%) due 11/07/25 | | | 297,325 | | | | 291,643 | |
Total Industrial | | | | | | | 6,159,959 | |
| | | | | | | | | |
Consumer, Non-cyclical - 0.4% | | | | | | | | |
Packaging Coordinators Midco, Inc. | | | | | | | | |
4.50% (6 Month USD LIBOR + 3.75%, Rate Floor: 4.50%) due 11/30/27 | | | 2,250,000 | | | | 2,247,187 | |
Southern Veterinary Partners LLC | | | | | | | | |
5.00% (3 Month USD LIBOR + 4.00%, Rate Floor: 5.00%) due 10/05/27 | | | 1,314,886 | | | | 1,318,174 | |
HAH Group Holding Co. LLC | | | | | | | | |
6.00% (3 Month USD LIBOR + 5.00%, Rate Floor: 6.00%) due 10/29/27 | | | 1,020,000 | | | | 1,022,550 | |
Dole Food Company, Inc. | | | | | | | | |
3.75% (1 Month USD LIBOR + 2.75%, Rate Floor: 3.75%) due 04/05/24 | | | 661,409 | | | | 660,768 | |
Elanco Animal Health, Inc. | | | | | | | | |
1.87% (1 Month USD LIBOR + 1.75%, Rate Floor: 1.75%) due 08/02/27 | | | 388,360 | | | | 382,950 | |
Callaway Golf Company | | | | | | | | |
4.61% (1 Month USD LIBOR + 4.50%, Rate Floor: 4.50%) due 01/02/26 | | | 198,919 | | | | 199,665 | |
Total Consumer, Non-cyclical | | | | | | | 5,831,294 | |
| | | | | | | | | |
Financial - 0.2% | | | | | | | | |
Jefferies Finance LLC | | | | | | | | |
4.50% (1 Month USD LIBOR + 3.75%, Rate Floor: 4.50%) due 09/30/27††† | | | 1,393,000 | | | | 1,380,811 | |
52 | THE GUGGENHEIM FUNDS SEMI-ANNUAL REPORT | SEE NOTES TO FINANCIAL STATEMENTS. |
SCHEDULE OF INVESTMENTS (Unaudited)(continued) | March 31, 2021 |
CORE BOND FUND | |
| | Face
Amount~ | | | Value | |
Nexus Buyer LLC | | | | | | | | |
3.86% (1 Month USD LIBOR + 3.75%, Rate Floor: 3.75%) due 11/09/26 | | | 897,733 | | | $ | 892,688 | |
Cross Financial Corp. | | | | | | | | |
5.50% (1 Month USD LIBOR + 4.50%, Rate Floor: 5.50%) due 09/15/27 | | | 798,000 | | | | 800,498 | |
Alliant Holdings Intermediate LLC | | | | | | | | |
3.36% (1 Month USD LIBOR + 3.25%, Rate Floor: 3.25%) due 05/09/25 | | | 496,173 | | | | 489,678 | |
Total Financial | | | | | | | 3,563,675 | |
| | | | | | | | | |
Basic Materials - 0.2% | | | | | | | | |
W.R. Grace & Co.-Conn | | | | | | | | |
due 03/30/28 | | | 3,500,000 | | | | 3,473,750 | |
| | | | | | | | | |
Utilities - 0.2% | | | | | | | | |
Hamilton Projects Acquiror LLC | | | | | | | | |
5.75% (3 Month USD LIBOR + 4.75%, Rate Floor: 5.75%) due 06/17/27 | | | 3,084,461 | | | | 3,093,468 | |
| | | | | | | | | |
Energy - 0.1% | | | | | | | | |
Venture Global Calcasieu Pass LLC | | | | | | | | |
2.48% (1 Month USD LIBOR + 2.38% and 3 Month USD LIBOR + 2.38%, Rate Floor: 2.38%) due 08/19/26††† | | | 1,122,784 | | | | 1,061,031 | |
| | | | | | | | | |
Communications - 0.0% | | | | | | | | |
Radiate Holdco, LLC | | | | | | | | |
4.25% (1 Month USD LIBOR + 3.50%, Rate Floor: 4.25%) due 09/25/26 | | | 149,625 | | | | 149,472 | |
Total Senior Floating Rate Interests | | | | |
(Cost $44,587,368) | | | 45,156,873 | |
| | | | | | | | | |
MUNICIPAL BONDS†† - 1.9% |
California - 0.7% | | | | | | | | |
State of California General Obligation Unlimited | | | | | | | | |
7.55% due 04/01/39 | | | 700,000 | | | | 1,130,815 | |
7.35% due 11/01/39 | | | 650,000 | | | | 997,926 | |
Newport Mesa Unified School District General Obligation Unlimited | | | | | | | | |
due 08/01/4413 | | | 2,000,000 | | | | 900,634 | |
due 08/01/4113 | | | 1,540,000 | | | | 791,204 | |
due 08/01/4613 | | | 750,000 | | | | 310,080 | |
California Statewide Communities Development Authority Revenue Bonds | | | | | | | | |
2.68% due 02/01/39 | | | 1,200,000 | | | | 1,124,831 | |
Santa Monica Community College District General Obligation Unlimited | | | | | | | | |
2.70% due 08/01/40 | | | 1,100,000 | | | | 1,073,664 | |
San Dieguito Union High School District General Obligation Unlimited | | | | | | | | |
2.68% due 08/01/36 | | | 1,000,000 | | | | 1,017,559 | |
William S Hart Union High School District General Obligation Unlimited | | | | | | | | |
2.36% due 08/01/37 | | | 1,000,000 | | | | 969,329 | |
Beverly Hills Unified School District California General Obligation Unlimited | | | | | | | | |
due 08/01/3913 | | | 1,410,000 | | | | 760,423 | |
Hillsborough City School District General Obligation Unlimited | | | | | | | | |
due 09/01/3613 | | | 1,000,000 | | | | 625,710 | |
Cypress School District General Obligation Unlimited | | | | | | | | |
due 08/01/4813 | | | 1,000,000 | | | | 387,472 | |
Hanford Joint Union High School District General Obligation Unlimited | | | | | | | | |
due 08/01/3913 | | | 500,000 | | | | 255,772 | |
Total California | | | | | | | 10,345,419 | |
| | | | | | | | | |
Texas - 0.6% | | | | | | | | |
Tarrant County Cultural Education Facilities Finance Corp. Revenue Bonds | | | | | | | | |
3.29% due 09/01/40 | | | 2,100,000 | | | | 2,107,832 | |
2.78% due 09/01/34 | | | 700,000 | | | | 694,416 | |
2.69% due 09/01/33 | | | 500,000 | | | | 496,632 | |
2.57% due 09/01/32 | | | 475,000 | | | | 471,155 | |
2.41% due 09/01/31 | | | 450,000 | | | | 444,403 | |
2.08% due 09/01/28 | | | 300,000 | | | | 298,681 | |
City of Dallas Texas Waterworks & Sewer System Revenue Revenue Bonds | | | | | | | | |
2.77% due 10/01/40 | | | 2,300,000 | | | | 2,306,457 | |
Grand Parkway Transportation Corp. Revenue Bonds | | | | | | | | |
3.31% due 10/01/49 | | | 1,500,000 | | | | 1,510,554 | |
North Texas Tollway Authority Revenue Bonds | | | | | | | | |
3.03% due 01/01/40 | | | 1,000,000 | | | | 983,499 | |
Dallas/Fort Worth International Airport Revenue Bonds | | | | | | | | |
2.92% due 11/01/50 | | | 1,000,000 | | | | 950,259 | |
Total Texas | | | | | | | 10,263,888 | |
| | | | | | | | | |
New York - 0.2% | | | | | | | | |
Westchester County Local Development Corp. Revenue Bonds | | | | | | | | |
3.85% due 11/01/50 | | | 2,700,000 | | | | 2,765,150 | |
New York Power Authority Revenue Bonds | | | | | | | | |
2.82% due 11/15/39 | | | 1,000,000 | | | | 969,500 | |
Total New York | | | | | | | 3,734,650 | |
| | | | | | | | | |
Idaho - 0.1% | | | | | | | | |
Boise State University Revenue Bonds | | | | | | | | |
3.06% due 04/01/40 | | | 1,150,000 | | | | 1,092,738 | |
| | | | | | | | | |
Mississippi - 0.1% | | | | | | | | |
Medical Center Educational Building Corp. Revenue Bonds | | | | | | | | |
2.92% due 06/01/41 | | | 1,000,000 | | | | 934,855 | |
| | | | | | | | | |
Ohio - 0.1% | | | | | | | | |
County of Franklin Ohio Revenue Bonds | | | | | | | | |
2.88% due 11/01/50 | | | 1,000,000 | | | | 921,164 | |
SEE NOTES TO FINANCIAL STATEMENTS. | THE GUGGENHEIM FUNDS SEMI-ANNUAL REPORT | 53 |
SCHEDULE OF INVESTMENTS (Unaudited)(continued) | March 31, 2021 |
CORE BOND FUND | |
| | Face
Amount~ | | | Value | |
Alabama - 0.1% | | | | | | | | |
Auburn University Revenue Bonds | | | | | | | | |
2.68% due 06/01/50 | | | 1,000,000 | | | $ | 916,939 | |
| | | | | | | | | |
Illinois - 0.0% | | | | | | | | |
State of Illinois General Obligation Unlimited | | | | | | | | |
5.65% due 12/01/38 | | | 500,000 | | | | 591,863 | |
Cook County School District No. 155 Calumet City General Obligation Unlimited | | | | | | | | |
5.30% due 12/01/22 | | | 5,000 | | | | 5,361 | |
Total Illinois | | | | | | | 597,224 | |
| | | | | | | | | |
Total Municipal Bonds | | | | |
(Cost $28,845,541) | | | 28,806,877 | |
| | | | | | | | | |
SENIOR FIXED RATE INTERESTS†† - 0.2% |
Industrial - 0.2% | | | | | | | | |
CTL Logistics | | | | | | | | |
2.65% due 10/10/42††† | | | 3,642,781 | | | | 3,379,857 | |
Total Senior Fixed Rate Interests | | | | |
(Cost $3,642,781) | | | 3,379,857 | |
| | | | | | | | | |
U.S. TREASURY BILLS†† - 0.1% |
U.S. Treasury Bills |
0.04% due 05/27/2114 | | | 1,000,000 | | | | 999,977 | |
Total U.S. Treasury Bills | | | | |
(Cost $999,938) | | | | | | | 999,977 | |
| | | | | | | | | |
FOREIGN GOVERNMENT DEBT†† - 0.0% |
Bermuda Government International Bond |
3.38% due 08/20/50 | | | 500,000 | | | | 483,600 | |
Total Foreign Government Debt | | | | |
(Cost $498,612) | | | | | | | 483,600 | |
| | Notional
Value | | | | |
OTC OPTIONS PURCHASED†† - 0.4% |
Call options on: | | | | | | | | |
Bank of America, N.A. 2Y-10 CMS CAP Expiring July 2022 with strike price of $0.40 | | $ | 455,200,000 | | | | 4,224,256 | |
Goldman Sachs International 2Y-10 CMS CAP Expiring July 2022 with strike price of $0.61 | | | 120,600,000 | | | | 890,028 | |
Morgan Stanley Capital Services LLC 2Y-10 CMS CAP Expiring July 2022 with strike price of $0.40 | | | 55,700,000 | | | | 516,896 | |
Bank of America, N.A. 2Y-10 CMS CAP Expiring July 2022 with strike price of $0.61 | | | 47,400,000 | | | | 349,812 | |
Total OTC Options Purchased | | | | |
(Cost $1,600,463) | | | | | | | 5,980,992 | |
| | | | | | | | | |
Total Investments - 105.3% | | | | |
(Cost $1,622,903,062) | | $ | 1,638,528,821 | |
Other Assets & Liabilities, net - (5.3)% | | | (82,693,934 | ) |
Total Net Assets - 100.0% | | $ | 1,555,834,887 | |
Centrally Cleared Interest Rate Swap Agreements†† |
| |
Counterparty | Exchange | Floating
Rate
Type | Floating
Rate Index | | Fixed
Rate | | Payment
Frequency | | Maturity
Date | | | Notional
Amount | | | Value | | | Upfront
Premiums
Paid | | | Unrealized
Appreciation
(Depreciation)** | |
BofA Securities, Inc. | CME | Receive | 3-Month USD LIBOR | 0.99% | Quarterly | 08/25/50 | | $ | 10,000,000 | | | $ | 2,792,085 | | | $ | 465 | | | $ | 2,791,620 | |
BofA Securities, Inc. | CME | Receive | 3-Month USD LIBOR | 0.99% | Quarterly | 08/20/50 | | | 8,200,000 | | | | 2,275,931 | | | | 434 | | | | 2,275,497 | |
BofA Securities, Inc. | CME | Pay | Federal Funds Rate | 0.82% | Annually | 04/01/26 | | | 50,000,000 | | | | (105,681 | ) | | | 525 | | | | (106,206 | ) |
BofA Securities, Inc. | CME | Pay | Federal Funds Rate | 0.52% | Annually | 10/02/30 | | | 3,000,000 | | | | (280,539 | ) | | | 308 | | | | (280,847 | ) |
BofA Securities, Inc. | CME | Pay | Federal Funds Rate | 0.71% | Annually | 11/18/30 | | | 20,000,000 | | | | (1,567,707 | ) | | | 443 | | | | (1,568,150 | ) |
| | | | | | | | | | | | | | | | | | | $ | 3,114,089 | | | $ | 2,175 | | | $ | 3,111,914 | |
54 | THE GUGGENHEIM FUNDS SEMI-ANNUAL REPORT | SEE NOTES TO FINANCIAL STATEMENTS. |
SCHEDULE OF INVESTMENTS (Unaudited)(continued) | March 31, 2021 |
CORE BOND FUND | |
Forward Foreign Currency Exchange Contracts†† |
Counterparty | | Contracts
to Sell | | | Currency | | | Settlement
Date | | | Settlement
Value | | | Value at
March 31,
2021 | | | Unrealized
Appreciation | |
Bank of America, N.A. | | | 4,989,000 | | | | EUR | | | | 06/30/21 | | | $ | 5,892,019 | | | $ | 5,861,064 | | | $ | 30,955 | |
Barclays Bank plc | | | 1,077,000 | | | | EUR | | | | 04/16/21 | | | | 1,291,738 | | | | 1,263,189 | | | | 28,549 | |
| | | | | | | | | | | | | | | | | | | | | | | $ | 59,504 | |
~ | The face amount is denominated in U.S. dollars unless otherwise indicated. |
* | Non-income producing security. |
** | Includes cumulative appreciation (depreciation). Variation margin is reported within the Statement of Assets and Liabilities. |
† | Value determined based on Level 1 inputs, unless otherwise noted — See Note 4. |
†† | Value determined based on Level 2 inputs, unless otherwise noted — See Note 4. |
††† | Value determined based on Level 3 inputs — See Note 4. |
1 | Rate indicated is the 7-day yield as of March 31, 2021. |
2 | Security has a fixed rate coupon which will convert to a floating or variable rate coupon on a future date. |
3 | Perpetual maturity. |
4 | Security is a 144A or Section 4(a)(2) security. These securities have been determined to be liquid under guidelines established by the Board of Trustees. The total market value of 144A or Section 4(a)(2) securities is $666,550,876 (cost $665,684,768), or 42.8% of total net assets. |
5 | Security is a 144A or Section 4(a)(2) security. These securities have been determined to be illiquid and restricted under guidelines established by the Board of Trustees. The total market value of 144A or Section 4(a)(2) illiquid and restricted securities is $2,456,270 (cost $2,494,866), or 0.2% of total net assets — See Note 10. |
6 | All or a portion of this security is pledged as interest rate swap collateral at March 31, 2021. |
7 | Variable rate security. Rate indicated is the rate effective at March 31, 2021. In some instances, the effective rate is limited by a minimum rate floor or a maximum rate cap established by the issuer. The settlement status of a position may also impact the effective rate indicated. In some cases, a position may be unsettled at period end and may not have a stated effective rate. In instances where multiple underlying reference rates and spread amounts are shown, the effective rate is based on a weighted average. |
8 | Security has no stated coupon. However, it is expected to receive residual cash flow payments on defined deal dates. |
9 | Security is a principal-only strip. |
10 | Security is an interest-only strip. |
11 | Security is a step up/down bond. The coupon increases or decreases at regular intervals until the bond reaches full maturity. Rate indicated is the rate at March 31, 2021. See table below for additional step information for each security. |
12 | All or a portion of this security has been physically segregated or earmarked in connection with reverse repurchase agreements. At March 31, 2021, the total market value of segregated or earmarked securities was $69,008,137 — See Note 6. |
13 | Zero coupon rate security. |
14 | Rate indicated is the effective yield at the time of purchase. |
| | BofA — Bank of America |
| | CME — Chicago Mercantile Exchange |
| | CMS — Constant Maturity Swap |
| | CMT — Constant Maturity Treasury |
| | EUR — Euro |
| | LIBOR — London Interbank Offered Rate |
| | plc — Public Limited Company |
| | REIT — Real Estate Investment Trust |
| | SARL — Société à Responsabilité Limitée |
| | WAC — Weighted Average Coupon |
| | |
| | See Sector Classification in Other Information section. |
SEE NOTES TO FINANCIAL STATEMENTS. | THE GUGGENHEIM FUNDS SEMI-ANNUAL REPORT | 55 |
SCHEDULE OF INVESTMENTS (Unaudited)(continued) | March 31, 2021 |
CORE BOND FUND | |
The following table summarizes the inputs used to value the Fund’s investments at March 31, 2021 (See Note 4 in the Notes to Financial Statements):
Investments in Securities (Assets) | | Level 1
Quoted
Prices | | | Level 2
Significant
Observable
Inputs | | | Level 3
Significant
Unobservable
Inputs | | | Total | |
Common Stocks | | $ | 19,427,529 | | | $ | — | | | $ | — | * | | $ | 19,427,529 | |
Preferred Stocks | | | 3,694,600 | | | | 42,808,588 | | | | — | * | | | 46,503,188 | |
Warrants | | | 564,062 | | | | — | | | | — | | | | 564,062 | |
Closed-End Funds | | | 3,202,944 | | | | — | | | | — | | | | 3,202,944 | |
Money Market Fund | | | 65,627,736 | | | | — | | | | — | | | | 65,627,736 | |
Corporate Bonds | | | — | | | | 680,509,927 | | | | 24,719,521 | | | | 705,229,448 | |
Asset-Backed Securities | | | — | | | | 357,153,057 | | | | 45,194,898 | | | | 402,347,955 | |
Collateralized Mortgage Obligations | | | — | | | | 180,646,839 | | | | — | | | | 180,646,839 | |
U.S. Government Securities | | | — | | | | 80,627,423 | | | | — | | | | 80,627,423 | |
Federal Agency Bonds | | | — | | | | 49,649,232 | | | | — | | | | 49,649,232 | |
Senior Floating Rate Interests | | | — | | | | 34,188,776 | | | | 10,968,097 | | | | 45,156,873 | |
Municipal Bonds | | | — | | | | 28,806,877 | | | | — | | | | 28,806,877 | |
Senior Fixed Rate Interests | | | — | | | | — | | | | 3,379,857 | | | | 3,379,857 | |
U.S. Treasury Bills | | | — | | | | 999,977 | | | | — | | | | 999,977 | |
Foreign Government Debt | | | — | | | | 483,600 | | | | — | | | | 483,600 | |
Options Purchased | | | — | | | | 5,980,992 | | | | — | | | | 5,980,992 | |
Interest Rate Swap Agreements** | | | — | | | | 5,067,117 | | | | — | | | | 5,067,117 | |
Forward Foreign Currency Exchange Contracts** | | | — | | | | 59,504 | | | | — | | | | 59,504 | |
Total Assets | | $ | 92,516,871 | | | $ | 1,466,981,909 | | | $ | 84,262,373 | | | $ | 1,643,761,153 | |
Investments in Securities (Liabilities) | | Level 1
Quoted
Prices | | | Level 2
Significant
Observable
Inputs | | | Level 3
Significant
Unobservable
Inputs | | | Total | |
Interest Rate Swap Agreements** | | $ | — | | | $ | 1,955,203 | | | $ | — | | | $ | 1,955,203 | |
Unfunded Loan Commitments (Note 9) | | | — | | | | — | | | | 79,121 | | | | 79,121 | |
Total Liabilities | | $ | — | | | $ | 1,955,203 | | | $ | 79,121 | | | $ | 2,034,324 | |
* | Security has a market value of $0. |
** | This derivative is reported as unrealized appreciation/depreciation at period end. |
The Fund may hold assets and/or liabilities in which the fair value approximates the carrying amount for financial statement purposes. As of the period end, reverse repurchase agreements of $14,964,175 are categorized as Level 2 within the disclosure hierarchy — See Note 6.
56 | THE GUGGENHEIM FUNDS SEMI-ANNUAL REPORT | SEE NOTES TO FINANCIAL STATEMENTS. |
SCHEDULE OF INVESTMENTS (Unaudited)(continued) | March 31, 2021 |
CORE BOND FUND | |
The following is a summary of significant unobservable inputs used in the fair valuation of assets and liabilities categorized within level 3 of the fair value hierarchy:
Category | | Ending Balance at
March 31, 2021 | | | Valuation Technique | | | Unobservable Inputs | | | Input Range | | | Weighted Average* | |
Assets: | | | | | | | | | | | | | | | | | | | | |
Asset-Backed Securities | | $ | 25,700,237 | | Option Adjusted Spread off the prior month end broker quote | Broker Quote | | | — | | | | — | |
Asset-Backed Securities | | | 12,565,802 | | Model Price | Purchase Price | | | — | | | | — | |
Asset-Backed Securities | | | 6,928,859 | | Yield Analysis | Yield | | | 2.2%-2.4% | | | | 2.2 | % |
Corporate Bonds | | | 14,115,751 | | Option Adjusted Spread off the prior month end broker quote | Broker Quote | | | — | | | | — | |
Corporate Bonds | | | 6,240,335 | | Third Party Pricing | Vendor Price | | | — | | | | — | |
Corporate Bonds | | | 4,363,435 | | Third Party Pricing | Trade Price | | | — | | | | — | |
Senior Fixed Rate Interests | | | 3,379,857 | | Yield Analysis | Yield | | | 3.4 | % | | | — | |
Senior Floating Rate Interests | | | 10,471,842 | | Third Party Pricing | Broker Quote | | | — | | | | — | |
Senior Floating Rate Interests | | | 496,255 | | Third Party Pricing | | | Vendor Price | | | | — | | | | — | |
Total Assets | | $ | 84,262,373 | | | | | | | | | | | |
Liabilities: | | | | | | | | | | | | | | | | | | | | |
Unfunded Loan Commitments | | $ | 79,121 | | Model Price | | | Purchase Price | | | | — | | | | — | |
* | Inputs are weighted by the fair value of the instruments. |
Significant changes in a quote or yield would generally result in significant changes in the fair value of the security.
The Fund’s fair valuation leveling guidelines classify a single daily broker quote, or a vendor price based on a single daily or monthly broker quote, as Level 3 rather than Level 2, if such a quote or price cannot be supported with other available market information.
Transfers between Level 2 and Level 3 may occur as markets fluctuate and/or the availability of data used in an investment’s valuation changes. For the period ended March 31, 2021, the Fund had securities with a total value of $15,632,414 transfer into Level 3 from Level 2 due to a lack of observable inputs. There were no other securities that transferred between levels.
SEE NOTES TO FINANCIAL STATEMENTS. | THE GUGGENHEIM FUNDS SEMI-ANNUAL REPORT | 57 |
SCHEDULE OF INVESTMENTS (Unaudited)(concluded) | March 31, 2021 |
CORE BOND FUND | |
Summary of Fair Value Level 3 Activity
Following is a reconciliation of Level 3 assets for which significant unobservable inputs were used to determine fair value for the period ended March 31, 2021:
| | | Assets | | | | | | | Liabilities | |
| | Asset-Backed
Securities | | | Collateralized
Mortgage
Obligations | | | Corporate
Bonds | | | Senior
Floating Rate
Interests | | | Senior Fixed
Rate Interests | | | Total
Assets | | | Unfunded
Loan
Commitments | |
Beginning Balance | | $ | 33,401,467 | | | $ | 10,687,442 | | | $ | 14,037,846 | | | $ | — | | | $ | — | | | $ | 58,126,755 | | | $ | (163,932 | ) |
Purchases/(Receipts) | | | 23,500,000 | | | | — | | | | 16,899,999 | | | | 9,010,154 | | | | 3,642,780 | | | | 53,052,933 | | | | (5,671 | ) |
(Sales, maturities and paydowns)/Fundings | | | (25,505,288 | ) | | | (10,592,125 | ) | | | (5,586,008 | ) | | | — | | | | — | | | | (41,683,421 | ) | | | 92,858 | |
Amortization of premiums/discounts | | | — | | | | — | | | | — | | | | 4,820 | | | | — | | | | 4,820 | �� | | | — | |
Total realized gains (losses) included in earnings | | | 3,911 | | | | (7 | ) | | | 186,008 | | | | — | | | | — | | | | 189,912 | | | | — | |
Total change in unrealized appreciation (depreciation) included in earnings | | | 39,460 | | | | (95,310 | ) | | | (818,324 | ) | | | 76,057 | | | | (262,923 | ) | | | (1,061,040 | ) | | | (2,376 | ) |
Transfers into Level 3 | | | 13,755,348 | | | | — | | | | — | | | | 1,877,066 | | | | — | | | | 15,632,414 | | | | — | |
Ending Balance | | $ | 45,194,898 | | | $ | — | | | $ | 24,719,521 | | | $ | 10,968,097 | | | $ | 3,379,857 | | | $ | 84,262,373 | | | $ | (79,121 | ) |
Net change in unrealized appreciation (depreciation) for investments in Level 3 securities still held at March 31, 2021 | | $ | 37,279 | | | $ | — | | | $ | (598,067 | ) | | $ | 76,057 | | | $ | (262,923 | ) | | $ | (747,654 | ) | | $ | (2,376 | ) |
Step Coupon Bonds
The following table discloses additional information related to step coupon bonds held by the Fund. Certain securities are subject to multiple rate changes prior to maturity. For those securities, a range of rates and corresponding dates have been provided. Rates for all step coupon bonds held by the Fund are scheduled to increase, none are scheduled to decrease.
Name | | Coupon Rate at
Next Reset Date | | | Next Rate
Reset Date | | | Future Reset Rate(s) | | | Future Reset Date(s) | |
CSMC Trust 2020-NQM1, 1.72% due 05/25/65 | | | 2.72 | % | | | 09/26/24 | | | | — | | | | — | |
Verus Securitization Trust 2019-4, 2.64% due 11/25/59 | | | 3.64 | % | | | 10/26/23 | | | | — | | | | — | |
Verus Securitization Trust 2020-1, 2.42% due 01/25/60 | | | 3.42 | % | | | 01/26/24 | | | | — | | | | — | |
Verus Securitization Trust 2019-4, 2.85% due 11/25/59 | | | 3.85 | % | | | 10/26/23 | | | | — | | | | — | |
58 | THE GUGGENHEIM FUNDS SEMI-ANNUAL REPORT | SEE NOTES TO FINANCIAL STATEMENTS. |
STATEMENT OF ASSETS AND LIABILITIES (Unaudited) |
March 31, 2021 |
Assets: |
Investments, at value (cost $1,622,903,062) | | $ | 1,638,528,821 | |
Foreign currency, at value (cost $32,994) | | | 32,995 | |
Cash | | | 183,214 | |
Unamortized upfront premiums paid on interest rate swap agreements | | | 2,175 | |
Unrealized appreciation on forward foreign currency exchange contracts | | | 59,504 | |
Prepaid expenses | | | 154,549 | |
Receivables: |
Swap settlement | | | 12,540,446 | |
Interest | | | 9,784,362 | |
Fund shares sold | | | 5,038,475 | |
Securities sold | | | 4,991,820 | |
Dividends | | | 12,354 | |
Variation margin on interest rate swap agreements | | | 12,205 | |
Other assets | | | 8,004 | |
Total assets | | | 1,671,348,924 | |
| | | | | |
Liabilities: |
Unfunded loan commitments, at value (Note 9) (commitment fees received $77,813) | | | 79,121 | |
Reverse repurchase agreements (Note 6) | | | 14,964,175 | |
Segregated cash due to broker | | | 2,190,644 | |
Payable for: |
Securities purchased | | | 94,153,064 | |
Fund shares redeemed | | | 3,128,613 | |
Management fees | | | 304,781 | |
Distributions to shareholders | | | 236,665 | |
Fund accounting/administration fees | | | 91,927 | |
Distribution and service fees | | | 79,921 | |
Transfer agent/maintenance fees | | | 27,394 | |
Trustees’ fees* | | | 3,182 | |
Miscellaneous | | | 254,550 | |
Total liabilities | | | 115,514,037 | |
Net assets | | $ | 1,555,834,887 | |
| | | | | |
Net assets consist of: |
Paid in capital | | $ | 1,526,691,717 | |
Total distributable earnings (loss) | | | 29,143,170 | |
Net assets | | $ | 1,555,834,887 | |
| | | | | |
A-Class: |
Net assets | | $ | 148,424,403 | |
Capital shares outstanding | | | 7,550,453 | |
Net asset value per share | | $ | 19.66 | |
Maximum offering price per share (Net asset value divided by 96.00%) | | $ | 20.48 | |
| | | | | |
C-Class: |
Net assets | | $ | 35,737,553 | |
Capital shares outstanding | | | 1,825,926 | |
Net asset value per share | | $ | 19.57 | |
| | | | | |
P-Class: |
Net assets | | $ | 86,924,585 | |
Capital shares outstanding | | | 4,418,106 | |
Net asset value per share | | $ | 19.67 | |
| | | | | |
Institutional Class: |
Net assets | | $ | 1,284,748,346 | |
Capital shares outstanding | | | 65,445,835 | |
Net asset value per share | | $ | 19.63 | |
* | Relates to Trustees not deemed “interested persons” within the meaning of Section 2(a)(19) of the 1940 Act. |
SEE NOTES TO FINANCIAL STATEMENTS. | THE GUGGENHEIM FUNDS SEMI-ANNUAL REPORT | 59 |
STATEMENT OF OPERATIONS (Unaudited) |
Six Months Ended March 31, 2021 |
Investment Income: |
Dividends | | $ | 1,367,304 | |
Interest (net of foreign withholding tax of $2,650) | | | 22,828,682 | |
Total investment income | | | 24,195,986 | |
| | | | | |
Expenses: |
Management fees | | | 3,058,260 | |
Distribution and service fees: |
A-Class | | | 210,431 | |
C-Class | | | 179,226 | |
P-Class | | | 84,638 | |
Transfer agent/maintenance fees: |
A-Class | | | 97,230 | |
C-Class | | | 17,481 | |
P-Class | | | 42,812 | |
Institutional Class | | | 572,554 | |
Fund accounting/administration fees | | | 534,046 | |
Professional fees | | | 67,287 | |
Line of credit fees | | | 80,969 | |
Custodian fees | | | 28,369 | |
Trustees’ fees* | | | 22,568 | |
Short interest expense | | | 23,020 | |
Miscellaneous | | | 188,103 | |
Recoupment of previously waived fees: |
A-Class | | | 1,781 | |
Total expenses | | | 5,208,775 | |
Less: |
Expenses reimbursed by Adviser: |
A-Class | | | (61,207 | ) |
C-Class | | | (9,966 | ) |
P-Class | | | (27,709 | ) |
Institutional Class | | | (577,843 | ) |
Expenses waived by Adviser | | | (95,334 | ) |
Earnings credits applied | | | (1,710 | ) |
Total waived/reimbursed expenses | | | (773,769 | ) |
Net expenses | | | 4,435,006 | |
Net investment income | | | 19,760,980 | |
| | | | | |
Net Realized and Unrealized Gain (Loss): |
Net realized gain (loss) on: |
Investments | | | 9,067,841 | |
Swap agreements | | | 1,786,224 | |
Options purchased | | | 2,581,841 | |
Forward foreign currency exchange contracts | | | 4,331,554 | |
Foreign currency transactions | | | (6,275 | ) |
Net realized gain | | | 17,761,185 | |
Net change in unrealized appreciation (depreciation) on: |
Investments | | | (52,828,422 | ) |
Swap agreements | | | 929,778 | |
Options purchased | | | 3,189,091 | |
Forward foreign currency exchange contracts | | | (4,286,532 | ) |
Foreign currency translations | | | (469 | ) |
Net change in unrealized appreciation (depreciation) | | | (52,996,554 | ) |
Net realized and unrealized loss | | | (35,235,369 | ) |
Net decrease in net assets resulting from operations | | $ | (15,474,389 | ) |
* | Relates to Trustees not deemed “interested persons” within the meaning of Section 2(a)(19) of the 1940 Act. |
60 | THE GUGGENHEIM FUNDS SEMI-ANNUAL REPORT | SEE NOTES TO FINANCIAL STATEMENTS. |
STATEMENTS OF CHANGES IN NET ASSETS |
| | Six Months Ended
March 31, 2021
(Unaudited) | | | Year Ended
September 30,
2020 | |
Increase (Decrease) in Net Assets from Operations: | | | | | | | | |
Net investment income | | $ | 19,760,980 | | | $ | 21,643,322 | |
Net realized gain on investments | | | 17,761,185 | | | | 38,692,213 | |
Net change in unrealized appreciation (depreciation) on investments | | | (52,996,554 | ) | | | 50,287,078 | |
Net increase (decrease) in net assets resulting from operations | | | (15,474,389 | ) | | | 110,622,613 | |
| | | | | | | | | |
Distributions to shareholders: | | | | | | | | |
A-Class | | | (5,186,481 | ) | | | (3,767,804 | ) |
C-Class | | | (1,063,082 | ) | | | (356,078 | ) |
P-Class | | | (2,191,963 | ) | | | (1,024,712 | ) |
Institutional Class | | | (46,348,814 | ) | | | (19,218,081 | ) |
Total distributions to shareholders | | | (54,790,340 | ) | | | (24,366,675 | ) |
| | | | | | | | | |
Capital share transactions: | | | | | | | | |
Proceeds from sale of shares | | | | | | | | |
A-Class | | | 27,860,974 | | | | 110,819,065 | |
C-Class | | | 8,714,753 | | | | 14,504,419 | |
P-Class | | | 39,779,480 | | | | 22,554,327 | |
Institutional Class | | | 515,596,664 | | | | 714,499,854 | |
Distributions reinvested | | | | | | | | |
A-Class | | | 4,875,091 | | | | 3,613,421 | |
C-Class | | | 936,617 | | | | 305,013 | |
P-Class | | | 2,191,955 | | | | 1,024,707 | |
Institutional Class | | | 42,968,822 | | | | 17,587,263 | |
Cost of shares redeemed | | | | | | | | |
A-Class | | | (97,226,435 | ) | | | (59,704,941 | ) |
C-Class | | | (5,469,511 | ) | | | (6,302,201 | ) |
P-Class | | | (12,363,058 | ) | | | (16,990,731 | ) |
Institutional Class | | | (353,427,350 | ) | | | (272,307,128 | ) |
Net increase from capital share transactions | | | 174,438,002 | | | | 529,603,068 | |
Net increase in net assets | | | 104,173,273 | | | | 615,859,006 | |
| | | | | | | | | |
Net assets: | | | | | | | | |
Beginning of period | | | 1,451,661,614 | | | | 835,802,608 | |
End of period | | $ | 1,555,834,887 | | | $ | 1,451,661,614 | |
| | | | | | | | | |
Capital share activity: | | | | | | | | |
Shares sold | | | | | | | | |
A-Class | | | 1,363,910 | | | | 5,657,259 | |
C-Class | | | 430,074 | | | | 736,544 | |
P-Class | | | 1,974,981 | | | | 1,125,368 | |
Institutional Class | | | 25,248,196 | | | | 36,204,919 | |
Shares issued from reinvestment of distributions | | | | | | | | |
A-Class | | | 239,161 | | | | 183,005 | |
C-Class | | | 46,150 | | | | 15,494 | |
P-Class | | | 107,558 | | | | 51,991 | |
Institutional Class | | | 2,112,450 | | | | 890,192 | |
Shares redeemed | | | | | | | | |
A-Class | | | (4,711,652 | ) | | | (3,072,001 | ) |
C-Class | | | (272,279 | ) | | | (324,755 | ) |
P-Class | | | (609,978 | ) | | | (883,015 | ) |
Institutional Class | | | (17,465,831 | ) | | | (13,983,181 | ) |
Net increase in shares | | | 8,462,740 | | | | 26,601,820 | |
SEE NOTES TO FINANCIAL STATEMENTS. | THE GUGGENHEIM FUNDS SEMI-ANNUAL REPORT | 61 |
This table is presented to show selected data for a share outstanding throughout each period and to assist shareholders in evaluating a Fund’s performance for the periods presented.
A-Class | | Six Months Ended
March 31, 2021a | | | Year Ended
September 30,
2020 | | | Year Ended
September 30,
2019 | | | Year Ended
September 30,
2018 | | | Year Ended
September 30,
2017 | | | Year Ended
September 30,
2016 | |
Per Share Data |
Net asset value, beginning of period | | $ | 20.53 | | | $ | 18.94 | | | $ | 18.33 | | | $ | 18.55 | | | $ | 18.55 | | | $ | 18.10 | |
Income (loss) from investment operations: |
Net investment income (loss)b | | | .23 | | | | .37 | | | | .41 | | | | .49 | | | | .59 | | | | .64 | |
Net gain (loss) on investments (realized and unrealized) | | | (.41 | ) | | | 1.63 | | | | .63 | | | | (.22 | ) | | | .02 | | | | .50 | |
Total from investment operations | | | (.18 | ) | | | 2.00 | | | | 1.04 | | | | .27 | | | | .61 | | | | 1.14 | |
Less distributions from: |
Net investment income | | | (.26 | ) | | | (.41 | ) | | | (.43 | ) | | | (.49 | ) | | | (.61 | ) | | | (.69 | ) |
Net realized gains | | | (.43 | ) | | | — | | | | — | | | | — | | | | — | | | | — | |
Total distributions | | | (.69 | ) | | | (.41 | ) | | | (.43 | ) | | | (.49 | ) | | | (.61 | ) | | | (.69 | ) |
Net asset value, end of period | | $ | 19.66 | | | $ | 20.53 | | | $ | 18.94 | | | $ | 18.33 | | | $ | 18.55 | | | $ | 18.55 | |
|
Total Returnc | | | (0.99 | %) | | | 10.68 | % | | | 5.72 | % | | | 1.46 | % | | | 3.39 | % | | | 6.50 | % |
Ratios/Supplemental Data |
Net assets, end of period (in thousands) | | $ | 148,424 | | | $ | 218,856 | | | $ | 149,442 | | | $ | 119,066 | | | $ | 170,624 | | | $ | 158,932 | |
Ratios to average net assets: |
Net investment income (loss) | | | 2.29 | % | | | 1.87 | % | | | 2.23 | % | | | 2.64 | % | | | 3.19 | % | | | 3.55 | % |
Total expensesd | | | 0.87 | % | | | 0.85 | % | | | 0.89 | % | | | 0.93 | % | | | 1.07 | % | | | 1.08 | % |
Net expensese,f,g | | | 0.79 | % | | | 0.79 | % | | | 0.80 | % | | | 0.83 | % | | | 1.02 | % | | | 1.03 | % |
Portfolio turnover rate | | | 41 | % | | | 126 | % | | | 77 | % | | | 53 | % | | | 81 | % | | | 100 | % |
C-Class | | Six Months Ended
March 31, 2021a | | | Year Ended
September 30,
2020 | | | Year Ended
September 30,
2019 | | | Year Ended
September 30,
2018 | | | Year Ended
September 30,
2017 | | | Year Ended
September 30,
2016 | |
Per Share Data |
Net asset value, beginning of period | | $ | 20.45 | | | $ | 18.86 | | | $ | 18.25 | | | $ | 18.47 | | | $ | 18.48 | | | $ | 18.02 | |
Income (loss) from investment operations: |
Net investment income (loss)b | | | .16 | | | | .22 | | | | .28 | | | | .35 | | | | .45 | | | | .51 | |
Net gain (loss) on investments (realized and unrealized) | | | (.43 | ) | | | 1.64 | | | | .62 | | | | (.22 | ) | | | .02 | | | | .51 | |
Total from investment operations | | | (.27 | ) | | | 1.86 | | | | .90 | | | | .13 | | | | .47 | | | | 1.02 | |
Less distributions from: |
Net investment income | | | (.18 | ) | | | (.27 | ) | | | (.29 | ) | | | (.35 | ) | | | (.48 | ) | | | (.56 | ) |
Net realized gains | | | (.43 | ) | | | — | | | | — | | | | — | | | | — | | | | — | |
Total distributions | | | (.61 | ) | | | (.27 | ) | | | (.29 | ) | | | (.35 | ) | | | (.48 | ) | | | (.56 | ) |
Net asset value, end of period | | $ | 19.57 | | | $ | 20.45 | | | $ | 18.86 | | | $ | 18.25 | | | $ | 18.47 | | | $ | 18.48 | |
|
Total Returnc | | | (1.36 | %) | | | 9.86 | % | | | 4.96 | % | | | 0.71 | % | | | 2.59 | % | | | 5.78 | % |
Ratios/Supplemental Data |
Net assets, end of period (in thousands) | | $ | 35,738 | | | $ | 33,163 | | | $ | 22,531 | | | $ | 18,799 | | | $ | 28,083 | | | $ | 36,040 | |
Ratios to average net assets: |
Net investment income (loss) | | | 1.56 | % | | | 1.13 | % | | | 1.50 | % | | | 1.92 | % | | | 2.47 | % | | | 2.81 | % |
Total expensesd | | | 1.61 | % | | | 1.62 | % | | | 1.67 | % | | | 1.75 | % | | | 1.85 | % | | | 1.90 | % |
Net expensese,f,g | | | 1.54 | % | | | 1.54 | % | | | 1.55 | % | | | 1.57 | % | | | 1.77 | % | | | 1.77 | % |
Portfolio turnover rate | | | 41 | % | | | 126 | % | | | 77 | % | | | 53 | % | | | 81 | % | | | 100 | % |
62 | THE GUGGENHEIM FUNDS SEMI-ANNUAL REPORT | SEE NOTES TO FINANCIAL STATEMENTS. |
FINANCIAL HIGHLIGHTS (continued) |
This table is presented to show selected data for a share outstanding throughout each period and to assist shareholders in evaluating a Fund’s performance for the periods presented.
P-Class | | Six Months Ended
March 31, 2021a | | | Year Ended
September 30,
2020 | | | Year Ended
September 30,
2019 | | | Year Ended
September 30,
2018 | | | Year Ended
September 30,
2017 | | | Year Ended
September 30,
2016 | |
Per Share Data |
Net asset value, beginning of period | | $ | 20.55 | | | $ | 18.96 | | | $ | 18.34 | | | $ | 18.56 | | | $ | 18.57 | | | $ | 18.12 | |
Income (loss) from investment operations: |
Net investment income (loss)b | | | .23 | | | | .36 | | | | .41 | | | | .48 | | | | .56 | | | | .59 | |
Net gain (loss) on investments (realized and unrealized) | | | (.42 | ) | | | 1.64 | | | | .63 | | | | (.21 | ) | | | .05 | | | | .55 | |
Total from investment operations | | | (.19 | ) | | | 2.00 | | | | 1.04 | | | | .27 | | | | .61 | | | | 1.14 | |
Less distributions from: |
Net investment income | | | (.26 | ) | | | (.41 | ) | | | (.42 | ) | | | (.49 | ) | | | (.62 | ) | | | (.69 | ) |
Net realized gains | | | (.43 | ) | | | — | | | | — | | | | — | | | | — | | | | — | |
Total distributions | | | (.69 | ) | | | (.41 | ) | | | (.42 | ) | | | (.49 | ) | | | (.62 | ) | | | (.69 | ) |
Net asset value, end of period | | $ | 19.67 | | | $ | 20.55 | | | $ | 18.96 | | | $ | 18.34 | | | $ | 18.56 | | | $ | 18.57 | |
|
Total Return | | | (1.04 | %) | | | 10.67 | % | | | 5.77 | % | | | 1.45 | % | | | 3.33 | % | | | 6.51 | % |
Ratios/Supplemental Data |
Net assets, end of period (in thousands) | | $ | 86,925 | | | $ | 60,534 | | | $ | 50,258 | | | $ | 48,263 | | | $ | 17,303 | | | $ | 3,087 | |
Ratios to average net assets: |
Net investment income (loss) | | | 2.29 | % | | | 1.86 | % | | | 2.24 | % | | | 2.61 | % | | | 3.06 | % | | | 3.25 | % |
Total expensesd | | | 0.89 | % | | | 0.91 | % | | | 0.93 | % | | | 0.94 | % | | | 1.13 | % | | | 0.98 | % |
Net expensese,f,g | | | 0.79 | % | | | 0.79 | % | | | 0.80 | % | | | 0.80 | % | | | 1.01 | % | | | 0.98 | % |
Portfolio turnover rate | | | 41 | % | | | 126 | % | | | 77 | % | | | 53 | % | | | 81 | % | | | 100 | % |
SEE NOTES TO FINANCIAL STATEMENTS. | THE GUGGENHEIM FUNDS SEMI-ANNUAL REPORT | 63 |
FINANCIAL HIGHLIGHTS (concluded) |
This table is presented to show selected data for a share outstanding throughout each period and to assist shareholders in evaluating a Fund’s performance for the periods presented.
Institutional Class | | Six Months Ended
March 31, 2021a | | | Year Ended
September 30,
2020 | | | Year Ended
September 30,
2019 | | | Year Ended
September 30,
2018 | | | Year Ended
September 30,
2017 | | | Year Ended
September 30,
2016 | |
Per Share Data |
Net asset value, beginning of period | | $ | 20.51 | | | $ | 18.91 | | | $ | 18.30 | | | $ | 18.52 | | | $ | 18.53 | | | $ | 18.07 | |
Income (loss) from investment operations: |
Net investment income (loss)b | | | .26 | | | | .42 | | | | .47 | | | | .54 | | | | .64 | | | | .62 | |
Net gain (loss) on investments (realized and unrealized) | | | (.43 | ) | | | 1.65 | | | | .62 | | | | (.22 | ) | | | .02 | | | | .58 | |
Total from investment operations | | | (.17 | ) | | | 2.07 | | | | 1.09 | | | | .32 | | | | .66 | | | | 1.20 | |
Less distributions from: |
Net investment income | | | (.28 | ) | | | (.47 | ) | | | (.48 | ) | | | (.54 | ) | | | (.67 | ) | | | (.74 | ) |
Net realized gains | | | (.43 | ) | | | — | | | | — | | | | — | | | | — | | | | — | |
Total distributions | | | (.71 | ) | | | (.47 | ) | | | (.48 | ) | | | (.54 | ) | | | (.67 | ) | | | (.74 | ) |
Net asset value, end of period | | $ | 19.63 | | | $ | 20.51 | | | $ | 18.91 | | | $ | 18.30 | | | $ | 18.52 | | | $ | 18.53 | |
|
Total Return | | | (0.89 | %) | | | 11.07 | % | | | 6.03 | % | | | 1.75 | % | | | 3.67 | % | | | 6.83 | % |
Ratios/Supplemental Data |
Net assets, end of period (in thousands) | | $ | 1,284,748 | | | $ | 1,139,109 | | | $ | 613,571 | | | $ | 380,974 | | | $ | 142,014 | | | $ | 83,168 | |
Ratios to average net assets: |
Net investment income (loss) | | | 2.59 | % | | | 2.17 | % | | | 2.52 | % | | | 2.92 | % | | | 3.51 | % | | | 3.41 | % |
Total expensesd | | | 0.60 | % | | | 0.58 | % | | | 0.62 | % | | | 0.60 | % | | | 0.74 | % | | | 0.76 | % |
Net expensese,f,g | | | 0.50 | % | | | 0.50 | % | | | 0.51 | % | | | 0.52 | % | | | 0.70 | % | | | 0.76 | % |
Portfolio turnover rate | | | 41 | % | | | 126 | % | | | 77 | % | | | 53 | % | | | 81 | % | | | 100 | % |
a | Unaudited figures for the period ended March 31, 2021. Percentage amounts for the period, except total return and portfolio turnover rate, have been annualized. |
b | Net investment income (loss) per share was computed using average shares outstanding throughout the period. |
c | Total return does not reflect the impact of any applicable sales charges. |
d | Does not include expenses of the underlying funds in which the Fund invests. |
e | Net expense information reflects the expense ratios after expense waivers and reimbursements, as applicable. |
f | The portion of the ratios of net expenses to average net assets attributable to recoupments of prior fee reductions or expense reimbursements for the periods presented was as follows: |
| | | 03/31/21a | 09/30/20 | 09/30/19 | 09/30/18 | 09/30/17 |
| | A-Class | 0.00%* | 0.00%* | — | 0.00%* | 0.05% |
| | C-Class | — | 0.00%* | — | 0.00%* | 0.03% |
| | P-Class | — | 0.00%* | 0.00%* | 0.00%* | 0.01% |
| | Institutional Class | — | 0.00%* | — | 0.00%* | 0.02% |
g | Net expenses may include expenses that are excluded from the expense limitation agreement. Excluding these expenses, the net expense ratios for the periods presented would be: |
| | | 03/31/21a | 09/30/20 | 09/30/19 | 09/30/18 | 09/30/17 | 09/30/16 |
| | A-Class | 0.78% | 0.78% | 0.79% | 0.82% | 1.00% | 1.00% |
| | C-Class | 1.52% | 1.53% | 1.54% | 1.57% | 1.75% | 1.74% |
| | P-Class | 0.77% | 0.78% | 0.79% | 0.80% | 0.99% | 0.97% |
| | Institutional Class | 0.49% | 0.49% | 0.50% | 0.52% | 0.68% | 0.75% |
64 | THE GUGGENHEIM FUNDS SEMI-ANNUAL REPORT | SEE NOTES TO FINANCIAL STATEMENTS. |
PERFORMANCE REPORT AND FUND PROFILE (Unaudited) | March 31, 2021 |
MUNICIPAL INCOME FUND
OBJECTIVE: Seeks to provide current income with an emphasis on income exempt from federal income tax, while also considering capital appreciation.
Holdings Diversification (Market Exposure as % of Net Assets)
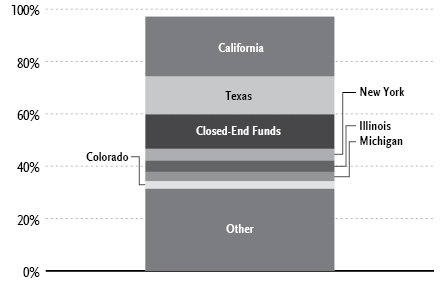
“Holdings Diversification (Market Exposure as % of Net Assets)” excludes any temporary cash investments.
Portfolio Composition by Quality Rating1 |
Rating | % of Total
Investments |
Fixed Income Instruments | |
AAA | 22.1% |
AA | 44.9% |
A | 11.8% |
BBB | 3.1% |
B | 1.0% |
NR2 | 2.2% |
Other Instruments | 14.9% |
Total Investments | 100.0% |
Inception Dates: |
A-Class | April 28, 2004 |
C-Class | January 13, 2012 |
P-Class | May 1, 2015 |
Institutional Class | January 13, 2012 |
Ten Largest Holdings (% of Total Net Assets) |
El Camino Healthcare District General Obligation Unlimited | 2.9% |
Denton County Housing Finance Corp. Revenue Bonds, 2.15% | 2.7% |
Freddie Mac Multifamily, 1.90% | 2.7% |
Ysleta Independent School District General Obligation Unlimited, 4.00% | 2.2% |
Dayton-Montgomery County Port Authority Revenue Bonds, 1.84% | 2.1% |
Stockton Unified School District General Obligation Unlimited | 2.1% |
Illinois Finance Authority Revenue Bonds, 5.00% | 1.9% |
City of Los Angeles Department of Airports Revenue Bonds, 5.00% | 1.7% |
New York City Water & Sewer System Revenue Bonds, 5.00% | 1.7% |
Private Colleges & Universities Authority Revenue Bonds, 5.00% | 1.7% |
Top Ten Total | 21.7% |
| | |
“Ten Largest Holdings” excludes any temporary cash or derivative investments. |
1 | Source: BlackRock Solutions. Credit quality ratings are measured on a scale that generally ranges from AAA (highest) to D (lowest). All securities except for those labeled “NR” have been rated by Moody’s, Standard & Poor’s (“S&P”), or Fitch, each of which is a Nationally Recognized Statistical Rating Organization (“NRSRO”). For purposes of this presentation, when ratings are available from more than one agency, the highest rating is used. Guggenheim Investments has converted ratings to the equivalent S&P rating. Security ratings are determined at the time of purchase and may change thereafter. |
2 | NR (not rated) securities do not necessarily indicate low credit quality. |
| | THE GUGGENHEIM FUNDS SEMI-ANNUAL REPORT | 65 |
PERFORMANCE REPORT AND FUND PROFILE (Unaudited)(concluded) | March 31, 2021 |
Average Annual Returns*
Periods Ended March 31, 2021
| 6 Month† | 1 Year | 5 Year | 10 Year |
A-Class Shares~ | 2.65% | 5.96% | 3.35% | 4.22% |
A-Class Shares with sales charge‡ | (1.44%) | 1.71% | 2.51% | 3.71% |
Bloomberg Barclays Municipal Bond Index | 1.46% | 5.51% | 3.49% | 4.54% |
| 6 Month† | 1 Year | 5 Year | Since
Inception
(01/13/12) |
C-Class Shares | 2.28% | 5.18% | 2.58% | 3.04% |
C-Class Shares with CDSC§ | 1.28% | 4.18% | 2.58% | 3.04% |
Institutional Class Shares | 2.78% | 6.22% | 3.61% | 4.07% |
Bloomberg Barclays Municipal Bond Index | 1.46% | 5.51% | 3.49% | 3.66% |
| 6 Month† | 1 Year | 5 Year | Since
Inception
(05/01/15) |
P-Class Shares | 2.73% | 6.04% | 3.36% | 3.33% |
Bloomberg Barclays Municipal Bond Index | 1.46% | 5.51% | 3.49% | 3.73% |
* | The performance data above represents past performance that is not predictive of future results. The investment return and principal value of an investment in the Fund will fluctuate so that an investor’s shares, when redeemed, may be worth more or less than their original cost. Returns are historical and include changes in principal and reinvested dividends and capital gains and do not reflect the effect of taxes. The Bloomberg Barclays Municipal Bond Index is an unmanaged index and, unlike the Fund, has no management fees or operating expenses to reduce its reported return. |
† | 6 month returns are not annualized. |
‡ | Effective October 1, 2015, the maximum sales charge decreased from 4.75% to 4.00%. A 4.75% maximum sales charge is used in the calculation of the Average Annual Returns based on subscriptions made prior to October 1, 2015, and a 4.00% maximum sales charge is used to calculate performance for periods based on subscriptions made on or after October 1, 2015. |
§ | Fund returns include a CDSC of 1% if redeemed within 12 months of purchase. |
~ | Effective January 13, 2012, the Fund acquired all of the assets and liabilities of the TS&W/Claymore Tax-Advantage Balanced Fund (“TYW”), a registered closed-end management investment company. The A-Class performance prior to that date reflects performance of TYW. |
66 | THE GUGGENHEIM FUNDS SEMI-ANNUAL REPORT | |
SCHEDULE OF INVESTMENTS (Unaudited) | March 31, 2021 |
MUNICIPAL INCOME FUND | |
| | Shares | | | Value | |
CLOSED-END FUNDS† - 13.2% |
BlackRock MuniVest Fund, Inc. | | | 86,286 | | | $ | 802,460 | |
BlackRock Municipal Income Quality Trust | | | 52,731 | | | | 796,765 | |
BlackRock MuniEnhanced Fund, Inc. | | | 66,723 | | | | 788,666 | |
Nuveen California Quality Municipal Income Fund | | | 49,986 | | | | 742,792 | |
DWS Municipal Income Trust | | | 53,020 | | | | 617,683 | |
BlackRock MuniHoldings Investment Quality Fund | | | 39,612 | | | | 566,055 | |
Eaton Vance Municipal Income Trust | | | 40,499 | | | | 557,671 | |
Invesco Trust for Investment Grade Municipals | | | 38,954 | | | | 525,100 | |
Nuveen AMT-Free Municipal Credit Income Fund | | | 29,838 | | | | 504,262 | |
BNY Mellon Strategic Municipals, Inc. | | | 57,718 | | | | 492,912 | |
Invesco Municipal Trust | | | 34,942 | | | | 461,234 | |
Nuveen Quality Municipal Income Fund | | | 30,461 | | | | 461,180 | |
Invesco Advantage Municipal Income Trust II | | | 37,925 | | | | 449,411 | |
Nuveen AMT-Free Quality Municipal Income Fund | | | 29,451 | | | | 436,464 | |
BlackRock MuniYield Quality Fund, Inc. | | | 25,824 | | | | 410,343 | |
BlackRock MuniHoldings California Quality Fund, Inc. | | | 22,912 | | | | 344,826 | |
BlackRock MuniYield California Quality Fund, Inc. | | | 19,796 | | | | 291,595 | |
Nuveen California AMT-Free Quality Municipal Income Fund | | | 18,593 | | | | 287,262 | |
Invesco Municipal Opportunity Trust | | | 14,142 | | | | 186,392 | |
BlackRock Municipal Income Trust | | | 9,687 | | | | 145,305 | |
Total Closed-End Funds | | | | |
(Cost $9,143,179) | | | | | | | 9,868,378 | |
| | | | | | | | | |
MONEY MARKET FUND† - 0.9% |
Dreyfus AMT-Free Tax Exempt Cash Management Fund — Institutional Shares, 0.01%1 | | | 657,140 | | | | 657,140 | |
Total Money Market Fund | | | | |
(Cost $657,140) | | | | | | | 657,140 | |
| | | | | | | | | |
| | | Face
Amount | | | | | |
MUNICIPAL BONDS†† - 84.0% |
California - 23.0% | | | | | | | | |
Stockton Unified School District General Obligation Unlimited | | | | | | | | |
due 08/01/332 | | $ | 2,000,000 | | | | 1,537,602 | |
due 08/01/372 | | | 810,000 | | | | 546,876 | |
due 08/01/422 | | | 250,000 | | | | 141,547 | |
El Camino Healthcare District General Obligation Unlimited | | | | | | | | |
due 08/01/292 | | | 2,500,000 | | | | 2,191,255 | |
City of Los Angeles Department of Airports Revenue Bonds | | | | | | | | |
5.00% due 05/15/39 | | | 1,000,000 | | | | 1,270,633 | |
5.00% due 05/15/44 | | | 100,000 | | | | 122,711 | |
San Bernardino Community College District General Obligation Unlimited | | | | | | | | |
4.00% due 08/01/49 | | | 1,000,000 | | | | 1,135,444 | |
Sierra Joint Community College District School Facilities District No. 1 General Obligation Unlimited | | | | | | | | |
due 08/01/312 | | | 705,000 | | | | 579,789 | |
due 08/01/302 | | | 415,000 | | | | 350,947 | |
College of the Sequoias Tulare Area Improvement District No. 3 General Obligation Unlimited | | | | | | | | |
due 08/01/423,4 | | | 1,000,000 | | | | 915,919 | |
Newport Mesa Unified School District General Obligation Unlimited | | | | | | | | |
due 08/01/392 | | | 1,300,000 | | | | 733,402 | |
Sonoma Valley Unified School District General Obligation Unlimited | | | | | | | | |
4.00% due 08/01/44 | | | 600,000 | | | | 689,651 | |
Compton Unified School District General Obligation Unlimited | | | | | | | | |
due 06/01/402 | | | 1,000,000 | | | | 565,220 | |
Stockton Public Financing Authority Revenue Bonds | | | | | | | | |
6.25% due 10/01/40 | | | 250,000 | | | | 287,600 | |
5.00% due 10/01/33 | | | 200,000 | | | | 247,906 | |
Los Angeles Department of Water & Power System Revenue Bonds | | | | | | | | |
5.00% due 07/01/43 | | | 500,000 | | | | 527,312 | |
Kings Canyon Unified School District General Obligation Unlimited | | | | | | | | |
5.00% due 08/01/28 | | | 445,000 | | | | 525,104 | |
San Diego Unified School District General Obligation Unlimited | | | | | | | | |
due 07/01/392 | | | 1,000,000 | | | | 522,593 | |
Riverside County Public Financing Authority Tax Allocation | | | | | | | | |
5.00% due 10/01/28 | | | 300,000 | | | | 374,077 | |
Sacramento Municipal Utility District Revenue Bonds | | | | | | | | |
5.00% due 08/15/37 | | | 300,000 | | | | 330,743 | |
Oakland Unified School District/Alameda County General Obligation Unlimited | | | | | | | | |
5.00% due 08/01/22 | | | 165,000 | | | | 171,739 | |
5.00% due 08/01/40 | | | 120,000 | | | | 140,204 | |
Delhi Unified School District General Obligation Unlimited | | | | | | | | |
5.00% due 08/01/44 | | | 250,000 | | | | 307,130 | |
Riverside County Redevelopment Successor Agency Tax Allocation | | | | | | | | |
due 10/01/373,4 | | | 250,000 | | | | 280,829 | |
Gustine Unified School District General Obligation Unlimited | | | | | | | | |
5.00% due 08/01/41 | | | 220,000 | | | | 262,553 | |
SEE NOTES TO FINANCIAL STATEMENTS. | THE GUGGENHEIM FUNDS SEMI-ANNUAL REPORT | 67 |
SCHEDULE OF INVESTMENTS (Unaudited)(continued) | March 31, 2021 |
MUNICIPAL INCOME FUND | |
| | Face
Amount | | | Value | |
Freddie Mac Multifamily ML Certificates Revenue Bonds | | | | | | | | |
2.49% due 07/25/35 | | $ | 245,952 | | | $ | 257,443 | |
M-S-R Energy Authority Revenue Bonds | | | | | | | | |
6.13% due 11/01/29 | | | 195,000 | | | | 248,559 | |
Alameda Corridor Transportation Authority Revenue Bonds | | | | | | | | |
5.00% due 10/01/35 | | | 200,000 | | | | 237,954 | |
Upland Unified School District General Obligation Unlimited | | | | | | | | |
due 08/01/382 | | | 400,000 | | | | 232,060 | |
Stanton Redevelopment Agency Successor Agency Tax Allocation | | | | | | | | |
5.00% due 12/01/40 | | | 180,000 | | | | 215,091 | |
Culver Redevelopment Agency Successor Agency Tax Allocation | | | | | | | | |
due 11/01/232 | | | 195,000 | | | | 191,932 | |
Westside Elementary School District General Obligation Unlimited | | | | | | | | |
5.00% due 08/01/48 | | | 155,000 | | | | 184,746 | |
Rio Hondo Community College District General Obligation Unlimited | | | | | | | | |
due 08/01/292 | | | 200,000 | | | | 174,578 | |
Department of Veterans Affairs Veteran’s Farm & Home Purchase Program Revenue Bonds | | | | | | | | |
3.45% due 12/01/39 | | | 150,000 | | | | 160,847 | |
Freddie Mac Multifamily VRD Certificates Revenue Bonds | | | | | | | | |
2.40% due 10/15/29 | | | 150,000 | | | | 157,739 | |
Coast Community College District General Obligation Unlimited | | | | | | | | |
due 08/01/402 | | | 250,000 | | | | 146,894 | |
Buena Park School District General Obligation Unlimited | | | | | | | | |
5.00% due 08/01/47 | | | 100,000 | | | | 122,863 | |
Roseville Joint Union High School District General Obligation Unlimited | | | | | | | | |
due 08/01/302 | | | 100,000 | | | | 85,036 | |
McKinleyville Union School District General Obligation Unlimited | | | | | | | | |
due 08/01/212 | | | 40,000 | | | | 3,727 | |
Total California | | | | | | | 17,178,255 | |
| | | | | | | | | |
Texas - 14.4% | | | | | | | | |
Denton County Housing Finance Corp. Revenue Bonds | | | | | | | | |
2.15% due 11/01/38 | | | 2,000,000 | | | | 2,000,492 | |
Central Texas Regional Mobility Authority Revenue Bonds | | | | | | | | |
5.00% due 01/01/45 | | | 1,250,000 | | | | 1,530,599 | |
5.00% due 01/01/27 | | | 200,000 | | | | 237,295 | |
Ysleta Independent School District General Obligation Unlimited | | | | | | | | |
4.00% due 08/15/52 | | | 1,400,000 | | | | 1,647,232 | |
Cleveland Independent School District General Obligation Unlimited | | | | | | | | |
4.00% due 02/15/52 | | | 1,000,000 | | | | 1,176,039 | |
North Texas Tollway Authority Revenue Bonds | | | | | | | | |
due 01/01/362 | | | 1,000,000 | | | | 726,661 | |
Central Texas Turnpike System Revenue Bonds | | | | | | | | |
5.00% due 08/15/34 | | | 200,000 | | | | 223,956 | |
5.00% due 08/15/22 | | | 35,000 | | | | 37,292 | |
Bexar County Hospital District General Obligation Limited | | | | | | | | |
5.00% due 02/15/32 | | | 200,000 | | | | 248,957 | |
United Independent School District General Obligation Unlimited | | | | | | | | |
5.00% due 08/15/49 | | | 200,000 | | | | 245,489 | |
Lindale Independent School District General Obligation Unlimited | | | | | | | | |
5.00% due 02/15/49 | | | 200,000 | | | | 241,758 | |
Clifton Higher Education Finance Corp. Revenue Bonds | | | | | | | | |
4.00% due 08/15/33 | | | 200,000 | | | | 240,939 | |
Dallas Area Rapid Transit Revenue Bonds | | | | | | | | |
5.00% due 12/01/41 | | | 200,000 | | | | 235,097 | |
Bexar County Health Facilities Development Corp. Revenue Bonds | | | | | | | | |
5.00% due 07/15/22 | | | 225,000 | | | | 232,454 | |
Harris County-Houston Sports Authority Revenue Bonds | | | | | | | | |
due 11/15/532 | | | 1,000,000 | | | | 229,535 | |
Arlington Higher Education Finance Corp. Revenue Bonds | | | | | | | | |
5.00% due 12/01/46 | | | 200,000 | | | | 218,790 | |
Grand Parkway Transportation Corp. Revenue Bonds | | | | | | | | |
5.00% due 10/01/43 | | | 175,000 | | | | 214,542 | |
Texas Tech University System Revenue Bonds | | | | | | | | |
5.00% due 08/15/32 | | | 200,000 | | | | 203,545 | |
Texas Municipal Gas Acquisition and Supply Corporation I Revenue Bonds | | | | | | | | |
6.25% due 12/15/26 | | | 155,000 | | | | 182,112 | |
City of Fort Worth Texas Water & Sewer System Revenue Bonds | | | | | | | | |
5.00% due 02/15/32 | | | 100,000 | | | | 124,553 | |
Hutto Independent School District General Obligation Unlimited | | | | | | | | |
5.00% due 08/01/49 | | | 100,000 | | | | 122,636 | |
Mansfield Independent School District General Obligation Unlimited | | | | | | | | |
5.00% due 02/15/44 | | | 100,000 | | | | 122,039 | |
University of North Texas System Revenue Bonds | | | | | | | | |
5.00% due 04/15/44 | | | 100,000 | | | | 121,247 | |
City of Arlington Texas Special Tax Revenue Special Tax | | | | | | | | |
5.00% due 02/15/48 | | | 100,000 | | | | 119,953 | |
68 | THE GUGGENHEIM FUNDS SEMI-ANNUAL REPORT | SEE NOTES TO FINANCIAL STATEMENTS. |
SCHEDULE OF INVESTMENTS (Unaudited)(continued) | March 31, 2021 |
MUNICIPAL INCOME FUND | |
| | Face
Amount | | | Value | |
Manor Independent School District General Obligation Unlimited | | | | | | | | |
5.00% due 08/01/21 | | $ | 20,000 | | | $ | 20,113 | |
Dallas Independent School District General Obligation Unlimited | | | | | | | | |
5.00% due 02/15/225 | | | 15,000 | | | | 15,477 | |
Tarrant County Health Facilities Development Corp. Revenue Bonds | | | | | | | | |
6.00% due 09/01/24 | | | 10,000 | | | | 10,994 | |
San Antonio Education Facilities Corp. Revenue Bonds | | | | | | | | |
5.00% due 06/01/23 | | | 10,000 | | | | 10,927 | |
City of Austin Texas Water & Wastewater System Revenue Bonds | | | | | | | | |
5.00% due 11/15/21 | | | 10,000 | | | | 10,190 | |
Leander Independent School District General Obligation Unlimited | | | | | | | | |
due 08/15/222 | | | 5,000 | | | | 3,077 | |
due 08/15/242 | | | 5,000 | | | | 2,895 | |
San Antonio Water System Revenue Bonds | | | | | | | | |
5.00% due 05/15/21 | | | 5,000 | | | | 4,977 | |
Total Texas | | | | | | | 10,761,862 | |
| | | | | | | | | |
New York - 4.5% | | | | | | | | |
New York City Water & Sewer System Revenue Bonds | | | | | | | | |
5.00% due 06/15/49 | | | 1,000,000 | | | | 1,244,882 | |
New York State Dormitory Authority Revenue Bonds | | | | | | | | |
5.00% due 10/01/41 | | | 350,000 | | | | 351,125 | |
4.00% due 08/01/43 | | | 250,000 | | | | 284,040 | |
5.00% due 05/01/21 | | | 5,000 | | | | 5,018 | |
New York City Industrial Development Agency Revenue Bonds | | | | | | | | |
4.00% due 03/01/32 | | | 500,000 | | | | 599,748 | |
New York Transportation Development Corp. Revenue Bonds | | | | | | | | |
5.00% due 12/01/22 | | | 250,000 | | | | 267,585 | |
5.00% due 07/01/34 | | | 200,000 | | | | 225,438 | |
New York State Urban Development Corp. Revenue Bonds | | | | | | | | |
5.00% due 03/15/35 | | | 250,000 | | | | 281,861 | |
New York Power Authority Revenue Bonds | | | | | | | | |
4.00% due 11/15/45 | | | 100,000 | | | | 116,082 | |
Total New York | | | | | | | 3,375,779 | |
| | | | | | | | | |
Illinois - 4.3% | | | | | | | | |
Illinois Finance Authority Revenue Bonds | | | | | | | | |
5.00% due 10/01/37 | | | 1,000,000 | | | | 1,409,433 | |
5.00% due 10/01/38 | | | 250,000 | | | | 354,982 | |
City of Chicago Illinois Wastewater Transmission Revenue Bonds | | | | | | | | |
5.25% due 01/01/42 | | | 400,000 | | | | 487,214 | |
Chicago O’Hare International Airport Revenue Bonds | | | | | | | | |
5.00% due 01/01/34 | | | 300,000 | | | | 344,642 | |
Metropolitan Water Reclamation District of Greater Chicago General Obligation Unlimited | | | | | | | | |
5.00% due 12/01/25 | | | 200,000 | | | | 238,911 | |
University of Illinois Revenue Bonds | | | | | | | | |
6.00% due 10/01/29 | | | 200,000 | | | | 223,938 | |
Cook County School District No. 104 Summit General Obligation Unlimited | | | | | | | | |
due 12/01/222 | | | 100,000 | | | | 99,505 | |
County of State Clair Illinois Highway Revenue Bonds | | | | | | | | |
4.25% due 01/01/23 | | | 40,000 | | | | 42,854 | |
Boone McHenry & DeKalb Counties Community Unit School District 100 General Obligation Unlimited | | | | | | | | |
due 12/01/212 | | | 10,000 | | | | 9,881 | |
Total Illinois | | | | | | | 3,211,360 | |
| | | | | | | | | |
Michigan - 3.6% | | | | | | | | |
Detroit Wayne County Stadium Authority Revenue Bonds | | | | | | | | |
5.00% due 10/01/26 | | | 1,000,000 | | | | 1,068,527 | |
Detroit City School District General Obligation Unlimited | | | | | | | | |
5.00% due 05/01/32 | | | 500,000 | | | | 525,134 | |
5.00% due 05/01/30 | | | 300,000 | | | | 315,180 | |
Michigan State Hospital Finance Authority Revenue Bonds | | | | | | | | |
5.00% due 11/15/47 | | | 200,000 | | | | 239,521 | |
Michigan State Housing Development Authority Revenue Bonds | | | | | | | | |
3.35% due 12/01/34 | | | 200,000 | | | | 215,255 | |
City of Detroit Michigan Water Supply System Revenue Bonds | | | | | | | | |
5.00% due 07/01/21 | | | 200,000 | | | | 202,345 | |
Flint Hospital Building Authority Revenue Bonds | | | | | | | | |
5.00% due 07/01/25 | | | 100,000 | | | | 113,042 | |
Total Michigan | | | | | | | 2,679,004 | |
| | | | | | | | | |
Colorado - 2.9% | | | | | | | | |
E-470 Public Highway Authority Revenue Bonds | | | | | | | | |
5.00% due 09/01/36 | | | 650,000 | | | | 837,663 | |
Auraria Higher Education Center Revenue Bonds | | | | | | | | |
5.00% due 04/01/28 | | | 390,000 | | | | 453,739 | |
City & County of Denver Colorado Airport System Revenue Bonds | | | | | | | | |
5.00% due 12/01/28 | | | 200,000 | | | | 253,502 | |
Board of Governors of Colorado State University System Revenue Bonds | | | | | | | | |
5.00% due 03/01/41 | | | 200,000 | | | | 239,019 | |
City & County of Denver Colorado Revenue Bonds | | | | | | | | |
due 08/01/302 | | | 200,000 | | | | 159,790 | |
SEE NOTES TO FINANCIAL STATEMENTS. | THE GUGGENHEIM FUNDS SEMI-ANNUAL REPORT | 69 |
SCHEDULE OF INVESTMENTS (Unaudited)(continued) | March 31, 2021 |
MUNICIPAL INCOME FUND | |
| | Face
Amount | | | Value | |
Colorado Educational & Cultural Facilities Authority Revenue Bonds | | | | | | | | |
5.00% due 03/01/47 | | $ | 110,000 | | | $ | 131,506 | |
Colorado School of Mines Revenue Bonds | | | | | | | | |
5.00% due 12/01/47 | | | 100,000 | | | | 120,518 | |
Total Colorado | | | | | | | 2,195,737 | |
| | | | | | | | | |
Oregon - 2.9% | | | | | | | | |
Clackamas & Washington Counties School District No. 3 General Obligation Unlimited | | | | | | | | |
due 06/15/482 | | | 2,000,000 | | | | 938,446 | |
due 06/15/502 | | | 400,000 | | | | 175,278 | |
due 06/15/492 | | | 350,000 | | | | 158,716 | |
Salem-Keizer School District No. 24J General Obligation Unlimited | | | | | | | | |
due 06/15/402 | | | 1,250,000 | | | | 779,752 | |
University of Oregon Revenue Bonds | | | | | | | | |
5.00% due 04/01/48 | | | 100,000 | | | | 120,730 | |
Total Oregon | | | | | | | 2,172,922 | |
| | | | | | | | | |
Ohio - 2.8% | | | | | | | | |
Dayton-Montgomery County Port Authority Revenue Bonds | | | | | | | | |
1.84% due 09/01/38 | | | 1,600,000 | | | | 1,569,939 | |
County of Miami Ohio Revenue Bonds | | | | | | | | |
5.00% due 08/01/33 | | | 200,000 | | | | 248,441 | |
American Municipal Power, Inc. Revenue Bonds | | | | | | | | |
5.00% due 02/15/41 | | | 200,000 | | | | 235,253 | |
City of Middleburg Heights Ohio Revenue Bonds | | | | | | | | |
5.00% due 08/01/22 | | | 15,000 | | | | 15,819 | |
Ohio Higher Educational Facility Commission Revenue Bonds | | | | | | | | |
5.00% due 01/01/22 | | | 15,000 | | | | 15,394 | |
Total Ohio | | | | | | | 2,084,846 | |
| | | | | | | | | |
Washington - 2.6% | | | | | | | | |
Greater Wenatchee Regional Events Center Public Facilities District Revenue Bonds | | | | | | | | |
5.00% due 09/01/27 | | | 500,000 | | | | 512,884 | |
5.25% due 09/01/32 | | | 500,000 | | | | 511,673 | |
Yakima & Kittitas Counties School District No. 119 Selah General Obligation Unlimited | | | | | | | | |
5.00% due 12/01/42 | | | 200,000 | | | | 243,442 | |
Central Puget Sound Regional Transit Authority Revenue Bonds | | | | | | | | |
5.00% due 11/01/41 | | | 200,000 | | | | 240,674 | |
County of King Washington Sewer Revenue Bonds | | | | | | | | |
5.00% due 07/01/42 | | | 200,000 | | | | 240,310 | |
Washington State Convention Center Public Facilities District Revenue Bonds | | | | | | | | |
5.00% due 07/01/48 | | | 200,000 | | | | 232,465 | |
Total Washington | | | | | | | 1,981,448 | |
| | | | | | | | | |
Arizona - 2.7% | | | | | | | | |
Arizona Industrial Development Authority Revenue Bonds | | | | | | | | |
2.12% due 07/01/37 | | | 1,188,345 | | | | 1,176,503 | |
Maricopa County Industrial Development Authority Revenue Bonds | | | | | | | | |
5.00% due 01/01/41 | | | 250,000 | | | | 300,808 | |
Salt Verde Financial Corp. Revenue Bonds | | | | | | | | |
5.00% due 12/01/32 | | | 200,000 | | | | 263,600 | |
Pinal County Elementary School District No. 4 Casa Grande General Obligation Unlimited | | | | | | | | |
5.00% due 07/01/37 | | | 100,000 | | | | 124,559 | |
Industrial Development Authority of the County of Pima Revenue Bonds | | | | | | | | |
7.13% due 06/01/21 | | | 75,000 | | | | 75,794 | |
Total Arizona | | | | | | | 1,941,264 | |
| | | | | | | | | |
District of Columbia - 2.5% | | | | | | | | |
District of Columbia Revenue Bonds | | | | | | | | |
4.00% due 03/01/39 | | | 1,000,000 | | | | 1,186,052 | |
5.00% due 04/01/21 | | | 25,000 | | | | 25,000 | |
6.25% due 04/01/21 | | | 5,000 | | | | 4,950 | |
District of Columbia General Obligation Unlimited | | | | | | | | |
5.00% due 06/01/41 | | | 285,000 | | | | 338,931 | |
5.00% due 06/01/32 | | | 275,000 | | | | 312,999 | |
Total District of Columbia | | | | | | | 1,867,932 | |
| | | | | | | | | |
Georgia - 2.0% | | | | | | | | |
Private Colleges & Universities Authority Revenue Bonds | | | | | | | | |
5.00% due 09/01/48 | | | 1,000,000 | | | | 1,242,040 | |
Savannah Economic Development Authority Revenue Bonds | | | | | | | | |
5.00% due 12/01/28 | | | 200,000 | | | | 235,151 | |
due 12/01/212 | | | 20,000 | | | | 19,779 | |
Richmond County Development Authority Revenue Bonds | | | | | | | | |
due 12/01/212 | | | 10,000 | | | | 9,891 | |
Total Georgia | | | | | | | 1,506,861 | |
| | | | | | | | | |
Pennsylvania - 1.9% | | | | | | | | |
Pennsylvania Economic Development Financing Authority Revenue Bonds | | | | | | | | |
5.00% due 02/01/27 | | | 500,000 | | | | 571,025 | |
Reading School District General Obligation Unlimited | | | | | | | | |
5.00% due 02/01/27 | | | 300,000 | | | | 349,652 | |
Pittsburgh Water & Sewer Authority Revenue Bonds | | | | | | | | |
5.25% due 09/01/36 | | | 300,000 | | | | 333,369 | |
Allegheny County Hospital Development Authority Revenue Bonds | | | | | | | | |
5.00% due 07/15/32 | | | 100,000 | | | | 128,158 | |
70 | THE GUGGENHEIM FUNDS SEMI-ANNUAL REPORT | SEE NOTES TO FINANCIAL STATEMENTS. |
SCHEDULE OF INVESTMENTS (Unaudited)(continued) | March 31, 2021 |
MUNICIPAL INCOME FUND | |
| | Face
Amount | | | Value | |
Owen J Roberts School District General Obligation Unlimited | | | | | | | | |
5.00% due 05/15/23 | | $ | 25,000 | | | $ | 27,543 | |
Township of Cheltenham Pennsylvania General Obligation Unlimited | | | | | | | | |
3.00% due 07/01/21 | | | 10,000 | | | | 9,967 | |
City of Erie Pennsylvania General Obligation Unlimited | | | | | | | | |
3.10% due 11/15/22 | | | 5,000 | | | | 5,179 | |
Total Pennsylvania | | | | | | | 1,424,893 | |
| | | | | | | | | |
Louisiana - 1.4% | | | | | | | | |
Louisiana Local Government Environmental Facilities & Community Development Authority Revenue Bonds | | | | | | | | |
5.00% due 10/01/37 | | | 500,000 | | | | 585,715 | |
5.00% due 10/01/26 | | | 150,000 | | | | 182,111 | |
City of Shreveport Louisiana Water & Sewer Revenue Bonds | | | | | | | | |
5.00% due 12/01/35 | | | 250,000 | | | | 307,817 | |
Louisiana Public Facilities Authority Revenue Bonds | | | | | | | | |
5.00% due 05/15/26 | | | 5,000 | | | | 5,994 | |
Total Louisiana | | | | | | | 1,081,637 | |
| | | | | | | | | |
North Carolina - 1.2% | | | | | | | | |
North Carolina Turnpike Authority Revenue Bonds | | | | | | | | |
5.00% due 01/01/27 | | | 300,000 | | | | 368,367 | |
North Carolina Central University Revenue Bonds | | | | | | | | |
5.00% due 04/01/44 | | | 300,000 | | | | 360,021 | |
County of New Hanover North Carolina Revenue Bonds | | | | | | | | |
5.00% due 10/01/22 | | | 150,000 | | | | 160,442 | |
North Carolina Eastern Municipal Power Agency Revenue Bonds | | | | | | | | |
4.50% due 01/01/22 | | | 10,000 | | | | 10,226 | |
North Carolina Medical Care Commission Revenue Bonds | | | | | | | | |
6.63% due 07/01/21 | | | 10,000 | | | | 10,054 | |
Total North Carolina | | | | | | | 909,110 | |
| | | | | | | | | |
West Virginia - 1.2% | | | | | | | | |
West Virginia Higher Education Policy Commission Revenue Bonds | | | | | | | | |
5.00% due 04/01/29 | | | 500,000 | | | | 522,949 | |
West Virginia Hospital Finance Authority Revenue Bonds | | | | | | | | |
5.00% due 06/01/42 | | | 300,000 | | | | 350,919 | |
Total West Virginia | | | | | | | 873,868 | |
| | | | | | | | | |
New Jersey - 1.0% | | | | | | | | |
New Jersey Turnpike Authority Revenue Bonds | | | | | | | | |
5.00% due 01/01/31 | | | 300,000 | | | | 369,508 | |
New Jersey Economic Development Authority Revenue Bonds | | | | | | | | |
5.00% due 06/01/28 | | | 250,000 | | | | 305,387 | |
North Hudson Sewerage Authority Revenue Bonds | | | | | | | | |
due 12/15/212 | | | 50,000 | | | | 49,917 | |
New Jersey Health Care Facilities Financing Authority Revenue Bonds | | | | | | | | |
5.25% due 07/01/21 | | | 35,000 | | | | 35,427 | |
New Jersey Transportation Trust Fund Authority Revenue Bonds | | | | | | | | |
5.50% due 06/15/21 | | | 20,000 | | | | 20,008 | |
Total New Jersey | | | | | | | 780,247 | |
| | | | | | | | | |
Virginia - 1.0% | | | | | | | | |
Virginia College Building Authority Revenue Bonds | | | | | | | | |
5.00% due 02/01/25 | | | 250,000 | | | | 293,264 | |
University of Virginia Revenue Bonds | | | | | | | | |
5.00% due 04/01/38 | | | 200,000 | | | | 242,672 | |
Loudoun County Economic Development Authority Revenue Bonds | | | | | | | | |
due 07/01/492 | | | 500,000 | | | | 209,481 | |
City of Norfolk Virginia General Obligation Unlimited | | | | | | | | |
2.50% due 10/01/463 | | | 5,000 | | | | 5,123 | |
Total Virginia | | | | | | | 750,540 | |
| | | | | | | | | |
Mississippi - 1.0% | | | | | | | | |
Mississippi Development Bank Revenue Bonds | | | | | | | | |
6.50% due 10/01/31 | | | 500,000 | | | | 508,329 | |
6.25% due 10/01/26 | | | 230,000 | | | | 233,667 | |
Total Mississippi | | | | | | | 741,996 | |
| | | | | | | | | |
Oklahoma - 0.9% | | | | | | | | |
Oklahoma Development Finance Authority Revenue Bonds | | | | | | | | |
5.00% due 08/15/28 | | | 350,000 | | | | 431,595 | |
Oklahoma City Airport Trust Revenue Bonds | | | | | | | | |
5.00% due 07/01/30 | | | 200,000 | | | | 245,528 | |
Total Oklahoma | | | | | | | 677,123 | |
| | | | | | | | | |
Puerto Rico - 0.8% | | | | | | | | |
Puerto Rico Highway & Transportation Authority Revenue Bonds | | | | | | | | |
5.25% due 07/01/41 | | | 250,000 | | | | 308,518 | |
Puerto Rico Public Buildings Authority Revenue Bonds | | | | | | | | |
6.00% due 07/01/23 | | | 250,000 | | | | 268,280 | |
Commonwealth of Puerto Rico General Obligation Unlimited | | | | | | | | |
5.25% due 07/01/24 | | | 45,000 | | | | 45,785 | |
Total Puerto Rico | | | | | | | 622,583 | |
| | | | | | | | | |
SEE NOTES TO FINANCIAL STATEMENTS. | THE GUGGENHEIM FUNDS SEMI-ANNUAL REPORT | 71 |
SCHEDULE OF INVESTMENTS (Unaudited)(continued) | March 31, 2021 |
MUNICIPAL INCOME FUND | |
| | Face
Amount | | | Value | |
Arkansas - 0.8% | | | | | | | | |
County of Baxter Arkansas Revenue Bonds | | | | | | | | |
5.00% due 09/01/26 | | $ | 330,000 | | | $ | 373,001 | |
University of Arkansas Revenue Bonds | | | | | | | | |
5.00% due 11/01/47 | | | 200,000 | | | | 242,085 | |
Total Arkansas | | | | | | | 615,086 | |
| | | | | | | | | |
Nebraska - 0.5% | | | | | | | | |
Central Plains Energy Project Revenue Bonds | | | | | | | | |
5.00% due 09/01/29 | | | 200,000 | | | | 252,732 | |
Nebraska Investment Finance Authority Revenue Bonds | | | | | | | | |
3.40% due 09/01/39 | | | 85,000 | | | | 90,274 | |
Total Nebraska | | | | | | | 343,006 | |
| | | | | | | | | |
Alaska - 0.4% | | | | | | | | |
University of Alaska Revenue Bonds | | | | | | | | |
5.00% due 10/01/40 | | | 260,000 | | | | 297,801 | |
| | | | | | | | | |
Nevada - 0.4% | | | | | | | | |
Las Vegas Valley Water District General Obligation Ltd. | | | | | | | | |
5.00% due 06/01/27 | | | 230,000 | | | | 271,550 | |
| | | | | | | | | |
Massachusetts - 0.3% | | | | | | | | |
Massachusetts Development Finance Agency Revenue Bonds | | | | | | | | |
5.00% due 10/01/34 | | | 150,000 | | | | 190,845 | |
5.00% due 04/01/21 | | | 55,000 | | | | 54,950 | |
3.00% due 10/01/21 | | | 15,000 | | | | 15,062 | |
Total Massachusetts | | | | | | | 260,857 | |
| | | | | | | | | |
South Carolina - 0.3% | | | | | | | | |
Charleston County Airport District Revenue Bonds | | | | | | | | |
5.00% due 07/01/43 | | | 200,000 | | | | 241,564 | |
| | | | | | | | | |
Vermont - 0.3% | | | | | | | | |
Vermont Educational & Health Buildings Financing Agency Revenue Bonds | | | | | | �� | | |
5.00% due 12/01/46 | | | 200,000 | | | | 231,036 | |
| | | | | | | | | |
Tennessee - 0.3% | | | | | | | | |
Metropolitan Government Nashville & Davidson County Health & Educational Facilities Board Revenue Bonds | | | | | | | | |
2.48% due 12/01/37 | | | 200,000 | | | | 206,700 | |
| | | | | | | | | |
Florida - 0.3% | | | | | | | | |
Greater Orlando Aviation Authority Revenue Bonds | | | | | | | | |
5.00% due 10/01/32 | | | 100,000 | | | | 125,901 | |
City of Tampa Florida Water & Wastewater System Revenue Bonds | | | | | | | | |
3.00% due 10/01/21 | | | 40,000 | | | | 40,565 | |
Tampa-Hillsborough County Expressway Authority Revenue Bonds | | | | | | | | |
5.00% due 07/01/22 | | | 20,000 | | | | 20,998 | |
Florida Higher Educational Facilities Financial Authority Revenue Bonds | | | | | | | | |
3.00% due 12/01/22 | | | 15,000 | | | | 15,544 | |
Total Florida | | | | | | | 203,008 | |
| | | | | | | | | |
South Dakota - 0.2% | | | | | | | | |
South Dakota Board of Regents Housing & Auxiliary Facilities System Revenue Bonds | | | | | | | | |
5.00% due 04/01/34 | | | 150,000 | | | | 181,614 | |
| | | | | | | | | |
Indiana - 0.2% | | | | | | | | |
Indiana Finance Authority Revenue Bonds | | | | | | | | |
5.00% due 10/01/41 | | | 100,000 | | | | 119,920 | |
Jeffersonville Housing, Inc. Revenue Bonds | | | | | | | | |
7.25% due 11/15/21 | | | 50,000 | | | | 52,082 | |
Total Indiana | | | | | | | 172,002 | |
| | | | | | | | | |
Kansas - 0.2% | | | | | | | | |
University of Kansas Hospital Authority Revenue Bonds | | | | | | | | |
5.00% due 09/01/48 | | | 100,000 | | | | 120,101 | |
Riley County Unified School District No. 383 Manhattan-Ogden General Obligation Unlimited | | | | | | | | |
due 09/01/212 | | | 25,000 | | | | 16,408 | |
Total Kansas | | | | | | | 136,509 | |
| | | | | | | | | |
Idaho - 0.2% | | | | | | | | |
Idaho Housing & Finance Association Revenue Bonds | | | | | | | | |
5.00% due 07/15/30 | | | 100,000 | | | | 127,565 | |
| | | | | | | | | |
Rhode Island - 0.2% | | | | | | | | |
Rhode Island Health and Educational Building Corp. Revenue Bonds | | | | | | | | |
5.00% due 05/15/42 | | | 100,000 | | | | 123,715 | |
| | | | | | | | | |
Utah - 0.2% | | | | | | | | |
South Davis Metro Fire Service Area Revenue Bonds | | | | | | | | |
5.00% due 12/01/34 | | | 100,000 | | | | 122,856 | |
| | | | | | | | | |
Montana - 0.2% | | | | | | | | |
Montana State Board of Regents Revenue Bonds | | | | | | | | |
5.00% due 11/15/43 | | | 100,000 | | | | 121,057 | |
| | | | | | | | | |
Iowa - 0.2% | | | | | | | | |
PEFA, Inc. Revenue Bonds | | | | | | | | |
5.00% due 09/01/265 | | | 100,000 | | | | 120,523 | |
| | | | | | | | | |
New Hampshire - 0.1% | | | | | | | | |
New Hampshire Health and Education Facilities Authority Act Revenue Bonds | | | | | | | | |
5.00% due 01/01/23 | | | 60,000 | | | | 65,008 | |
| | | | | | | | | |
72 | THE GUGGENHEIM FUNDS SEMI-ANNUAL REPORT | SEE NOTES TO FINANCIAL STATEMENTS. |
SCHEDULE OF INVESTMENTS (Unaudited)(continued) | March 31, 2021 |
MUNICIPAL INCOME FUND | |
| | Face
Amount | | | Value | |
Maryland - 0.1% | | | | | | | | |
Maryland Health & Higher Educational Facilities Authority Revenue Bonds | | | | | | | | |
5.00% due 07/01/22 | | $ | 15,000 | | | $ | 15,758 | |
4.25% due 07/01/22 | | | 10,000 | | | | 10,387 | |
4.00% due 07/01/22 | | | 10,000 | | | | 10,356 | |
5.00% due 07/01/27 | | | 5,000 | | | | 5,723 | |
Total Maryland | | | | | | | 42,224 | |
| | | | | | | | | |
Alabama - 0.0% | | | | | | | | |
Saraland Public Educational Building Authority Revenue Bonds | | | | | | | | |
4.25% due 06/01/21 | | | 30,000 | | | | 30,187 | |
Phenix City Public Building Authority Revenue Bonds | | | | | | | | |
4.38% due 04/01/21 | | | 5,000 | | | | 4,950 | |
Total Alabama | | | | | | | 35,137 | |
| | | | | | | | | |
New Mexico - 0.0% | | | | | | | | |
City of Albuquerque New Mexico Revenue Bonds | | | | | | | | |
5.00% due 07/01/25 | | | 30,000 | | | | 33,583 | |
Total New Mexico | | | | | | | 33,583 | |
| | | | | | | | | |
Wisconsin - 0.0% | | | | | | | | |
State of Wisconsin General Obligation Unlimited | | | | | | | | |
5.00% due 05/01/22 | | | 25,000 | | | | 26,310 | |
Total Municipal Bonds | | | | |
(Cost $60,159,075) | | | 62,797,978 | |
| | | | | | | | | |
COLLATERALIZED MORTGAGE OBLIGATIONS†† - 2.6% |
Government Agency - 2.6% | | | | | | | | |
Freddie Mac Multifamily | | | | | | | | |
1.90% due 11/25/376 | | | 1,998,578 | | | | 1,986,775 | |
Total Collateralized Mortgage Obligations | | | | |
(Cost $2,057,884) | | | 1,986,775 | |
| | | | | | | | | |
U.S. TREASURY BILLS†† - 1.1% |
U.S. Treasury Bills |
0.07% due 04/15/217,8 | | | 500,000 | | | | 499,997 | |
0.04% due 04/22/217,8 | | | 100,000 | | | | 99,999 | |
0.05% due 08/26/217,8 | | | 100,000 | | | | 99,991 | |
0.03% due 04/08/217,8 | | | 50,000 | | | | 50,000 | |
0.03% due 06/03/217,8 | | | 26,000 | | | | 25,999 | |
0.07% due 04/29/217,8 | | | 25,000 | | | | 25,000 | |
Total U.S. Treasury Bills | | | | |
(Cost $800,958) | | | | | | | 800,986 | |
| | | | | | | | | |
Total Investments - 101.8% | | | | |
(Cost $72,818,236) | | $ | 76,111,257 | |
Other Assets & Liabilities, net - (1.8)% | | | (1,335,407 | ) |
Total Net Assets - 100.0% | | $ | 74,775,850 | |
Centrally Cleared Interest Rate Swap Agreements†† |
| |
Counterparty | Exchange | Floating
Rate
Type | Floating
Rate Index | | Fixed
Rate | | Payment
Frequency | | Maturity
Date | | | Notional
Amount | | | Value | | | Upfront
Premiums
Paid
(Received) | | | Unrealized
Appreciation* | |
BofA Securities, Inc. | CME | Receive | 3-Month USD LIBOR | 1.21% | Quarterly | 11/24/50 | | $ | 1,600,000 | | | $ | 366,722 | | | $ | 324 | | | $ | 366,398 | |
BofA Securities, Inc. | CME | Receive | 3-Month USD LIBOR | 1.28% | Quarterly | 11/04/50 | | | 1,200,000 | | | | 257,208 | | | | 317 | | | | 256,891 | |
BofA Securities, Inc. | CME | Receive | 3-Month USD LIBOR | 1.57% | Quarterly | 01/27/51 | | | 810,000 | | | | 120,710 | | | | 312 | | | | 120,398 | |
BofA Securities, Inc. | CME | Receive | 3-Month USD LIBOR | 1.67% | Quarterly | 02/05/51 | | | 800,000 | | | | 102,277 | | | | 312 | | | | 101,965 | |
BofA Securities, Inc. | CME | Receive | 3-Month USD LIBOR | 1.57% | Quarterly | 01/28/51 | | | 200,000 | | | | 29,741 | | | | 302 | | | | 29,439 | |
BofA Securities, Inc. | CME | Receive | 3-Month USD LIBOR | 2.09% | Quarterly | 03/16/51 | | | 750,000 | | | | 22,087 | | | | 313 | | | | 21,774 | |
BofA Securities, Inc. | CME | Receive | 3-Month USD LIBOR | 2.10% | Quarterly | 03/08/51 | | | 650,000 | | | | 20,193 | | | | 311 | | | | 19,882 | |
| | | | | | | | | | | | | | | | | | | $ | 918,938 | | | $ | 2,191 | | | $ | 916,747 | |
SEE NOTES TO FINANCIAL STATEMENTS. | THE GUGGENHEIM FUNDS SEMI-ANNUAL REPORT | 73 |
SCHEDULE OF INVESTMENTS (Unaudited)(concluded) | March 31, 2021 |
MUNICIPAL INCOME FUND | |
* | Includes cumulative appreciation (depreciation). Variation margin is reported within the Statement of Assets and Liabilities. |
† | Value determined based on Level 1 inputs — See Note 4. |
†† | Value determined based on Level 2 inputs — See Note 4. |
1 | Rate indicated is the 7-day yield as of March 31, 2021. |
2 | Zero coupon rate security. |
3 | Security is a step up/down bond. The coupon increases or decreases at regular intervals until the bond reaches full maturity. Rate indicated is the rate at March 31, 2021. See table below for additional step information for each security. |
4 | Security has no current coupon. However, a coupon rate will come into effect at a future rate reset date. |
5 | The rate is adjusted periodically by the counterparty, allows the holder to tender the security upon a rate reset, and is not based upon a set reference rate and spread. Rate indicated is the rate effective at March 31, 2021. |
6 | Security is a 144A or Section 4(a)(2) security. These securities have been determined to be liquid under guidelines established by the Board of Trustees. The total market value of 144A or Section 4(a)(2) securities is $1,986,775 (cost $2,057,884), or 2.6% of total net assets. |
7 | All or a portion of this security is pledged as interest rate swap collateral at March 31, 2021. |
8 | Rate indicated is the effective yield at the time of purchase. |
| | BofA — Bank of America |
| | CME — Chicago Mercantile Exchange |
| | |
| | See Sector Classification in Other Information section. |
The following table summarizes the inputs used to value the Fund’s investments at March 31, 2021 (See Note 4 in the Notes to Financial Statements):
Investments in Securities (Assets) | | Level 1
Quoted
Prices | | | Level 2
Significant
Observable
Inputs | | | Level 3
Significant
Unobservable
Inputs | | | Total | |
Closed-End Funds | | $ | 9,868,378 | | | $ | — | | | $ | — | | | $ | 9,868,378 | |
Money Market Fund | | | 657,140 | | | | — | | | | — | | | | 657,140 | |
Municipal Bonds | | | — | | | | 62,797,978 | | | | — | | | | 62,797,978 | |
Collateralized Mortgage Obligations | | | — | | | | 1,986,775 | | | | — | | | | 1,986,775 | |
U.S. Treasury Bills | | | — | | | | 800,986 | | | | — | | | | 800,986 | |
Interest Rate Swap Agreements* | | | — | | | | 916,747 | | | | — | | | | 916,747 | |
Total Assets | | $ | 10,525,518 | | | $ | 66,502,486 | | | $ | — | | | $ | 77,028,004 | |
* | This derivative is reported as unrealized appreciation/depreciation at period end. |
Step Coupon Bonds
The following table discloses additional information related to step coupon bonds held by the Fund. Certain securities are subject to multiple rate changes prior to maturity. For those securities, a range of rates and corresponding dates have been provided. Rates for all step coupon bonds held by the Fund are scheduled to increase, none are scheduled to decrease.
Name | | Coupon Rate at
Next Reset Date | | | Next Rate Reset Date | | | Future Reset Rate(s) | | | Future Reset Date(s) | |
City of Norfolk Virginia General Obligation Unlimited, 2.50% due 10/01/46 | | | 3.00 | % | | | 10/01/22 | | | | 3.75% - 5.00% | | 10/01/26 - 10/01/41 |
College of the Sequoias Tulare Area Improvement District No. 3 General Obligation Unlimited, due 08/01/42 | | | 6.85 | % | | | 08/01/32 | | | | — | | | | — | |
Riverside County Redevelopment Successor Agency Tax Allocation, due 10/01/37 | | | 5.00 | % | | | 10/01/21 | | | | — | | | | — | |
74 | THE GUGGENHEIM FUNDS SEMI-ANNUAL REPORT | SEE NOTES TO FINANCIAL STATEMENTS. |
STATEMENT OF ASSETS AND LIABILITIES (Unaudited) |
March 31, 2021 |
Assets: |
Investments, at value (cost $72,818,236) | | $ | 76,111,257 | |
Cash | | | 3,930 | |
Unamortized upfront premiums paid on interest rate swap agreements | | | 2,191 | |
Prepaid expenses | | | 43,860 | |
Receivables: |
Interest | | | 495,369 | |
Securities sold | | | 39,525 | |
Variation margin on interest rate swap agreements | | | 25,985 | |
Dividends | | | 24,795 | |
Fund shares sold | | | 3,213 | |
Total assets | | | 76,750,125 | |
| | | | | |
Liabilities: |
Segregated cash due to broker | | | 41,484 | |
Payable for: |
Securities purchased | | | 1,720,360 | |
Fund shares redeemed | | | 135,061 | |
Distribution and service fees | | | 14,168 | |
Management fees | | | 10,797 | |
Distributions to shareholders | | | 9,422 | |
Fund accounting/administration fees | | | 7,308 | |
Transfer agent/maintenance fees | | | 3,578 | |
Trustees’ fees* | | | 1,177 | |
Miscellaneous | | | 30,920 | |
Total liabilities | | | 1,974,275 | |
Net assets | | $ | 74,775,850 | |
| | | | | |
Net assets consist of: |
Paid in capital | | $ | 70,578,874 | |
Total distributable earnings (loss) | | | 4,196,976 | |
Net assets | | $ | 74,775,850 | |
| | | | | |
A-Class: |
Net assets | | $ | 59,433,768 | |
Capital shares outstanding | | | 4,420,802 | |
Net asset value per share | | $ | 13.44 | |
Maximum offering price per share (Net asset value divided by 96.00%) | | $ | 14.00 | |
| | | | | |
C-Class: |
Net assets | | $ | 1,797,901 | |
Capital shares outstanding | | | 133,838 | |
Net asset value per share | | $ | 13.43 | |
| | | | | |
P-Class: |
Net assets | | $ | 219,089 | |
Capital shares outstanding | | | 16,306 | |
Net asset value per share | | $ | 13.44 | |
| | | | | |
Institutional Class: |
Net assets | | $ | 13,325,092 | |
Capital shares outstanding | | | 991,140 | |
Net asset value per share | | $ | 13.44 | |
STATEMENT OF OPERATIONS (Unaudited) |
Six Months Ended March 31, 2021 |
Investment Income: |
Dividends | | $ | 241,385 | |
Interest | | | 776,652 | |
Total investment income | | | 1,018,037 | |
| | | | | |
Expenses: |
Management fees | | | 192,298 | |
Distribution and service fees: |
A-Class | | | 75,471 | |
C-Class | | | 10,029 | |
P-Class | | | 248 | |
Transfer agent/maintenance fees: |
A-Class | | | 21,307 | |
C-Class | | | 913 | |
P-Class | | | 284 | |
Institutional Class | | | 7,721 | |
Registration fees | | | 52,343 | |
Fund accounting/administration fees | | | 30,474 | |
Professional fees | | | 27,355 | |
Trustees’ fees* | | | 8,929 | |
Line of credit fees | | | 3,958 | |
Custodian fees | | | 3,889 | |
Miscellaneous | | | 23,001 | |
Total expenses | | | 458,220 | |
Less: |
Expenses reimbursed by Adviser: |
A-Class | | | (22,336 | ) |
C-Class | | | (963 | ) |
P-Class | | | (288 | ) |
Institutional Class | | | (7,963 | ) |
Expenses waived by Adviser | | | (130,643 | ) |
Total waived/reimbursed expenses | | | (162,193 | ) |
Net expenses | | | 296,027 | |
Net investment income | | | 722,010 | |
| | | | | |
Net Realized and Unrealized Gain (Loss): |
Net realized gain (loss) on: |
Investments | | | 111,720 | |
Swap agreements | | | (16,636 | ) |
Net realized gain | | | 95,084 | |
Net change in unrealized appreciation (depreciation) on: |
Investments | | | 367,804 | |
Swap agreements | | | 916,747 | |
Net change in unrealized appreciation (depreciation) | | | 1,284,551 | |
Net realized and unrealized gain | | | 1,379,635 | |
Net increase in net assets resulting from operations | | $ | 2,101,645 | |
* | Relates to Trustees not deemed “interested persons” within the meaning of Section 2(a)(19) of the 1940 Act. |
SEE NOTES TO FINANCIAL STATEMENTS. | THE GUGGENHEIM FUNDS SEMI-ANNUAL REPORT | 75 |
STATEMENTS OF CHANGES IN NET ASSETS |
| | Six Months Ended
March 31, 2021
(Unaudited) | | | Year Ended
September 30,
2020 | |
Increase (Decrease) in Net Assets from Operations: | | | | | | | | |
Net investment income | | $ | 722,010 | | | $ | 1,256,299 | |
Net realized gain on investments | | | 95,084 | | | | 115,856 | |
Net change in unrealized appreciation (depreciation) on investments | | | 1,284,551 | | | | 344,828 | |
Net increase in net assets resulting from operations | | | 2,101,645 | | | | 1,716,983 | |
| | | | | | | | | |
Distributions to shareholders: | | | | | | | | |
A-Class | | | (631,686 | ) | | | (938,323 | ) |
C-Class | | | (13,571 | ) | | | (24,954 | ) |
P-Class | | | (2,078 | ) | | | (4,476 | ) |
Institutional Class | | | (169,390 | ) | | | (288,553 | ) |
Total distributions to shareholders | | | (816,725 | ) | | | (1,256,306 | ) |
| | | | | | | | | |
Capital share transactions: | | | | | | | | |
Proceeds from sale of shares | | | | | | | | |
A-Class | | | 1,101,972 | | | | 31,221,279 | |
C-Class | | | 15,336 | | | | 611,241 | |
P-Class | | | 40,689 | | | | 902,089 | |
Institutional Class | | | 4,568,878 | | | | 13,484,207 | |
Distributions reinvested | | | | | | | | |
A-Class | | | 572,951 | | | | 802,587 | |
C-Class | | | 12,776 | | | | 22,789 | |
P-Class | | | 2,078 | | | | 4,476 | |
Institutional Class | | | 167,038 | | | | 283,837 | |
Cost of shares redeemed | | | | | | | | |
A-Class | | | (5,837,513 | ) | | | (12,445,554 | ) |
C-Class | | | (441,478 | ) | | | (439,495 | ) |
P-Class | | | (28,077 | ) | | | (915,765 | ) |
Institutional Class | | | (5,052,017 | ) | | | (14,294,302 | ) |
Net increase (decrease) from capital share transactions | | | (4,877,367 | ) | | | 19,237,389 | |
Net increase (decrease) in net assets | | | (3,592,447 | ) | | | 19,698,066 | |
| | | | | | | | | |
Net assets: | | | | | | | | |
Beginning of period | | | 78,368,297 | | | | 58,670,231 | |
End of period | | $ | 74,775,850 | | | $ | 78,368,297 | |
| | | | | | | | | |
Capital share activity: | | | | | | | | |
Shares sold | | | | | | | | |
A-Class | | | 82,350 | | | | 2,381,376 | |
C-Class | | | 1,140 | | | | 46,635 | |
P-Class | | | 3,003 | | | | 67,519 | |
Institutional Class | | | 342,218 | | | | 1,026,721 | |
Shares issued from reinvestment of distributions | | | | | | | | |
A-Class | | | 42,773 | | | | 61,069 | |
C-Class | | | 954 | | | | 1,738 | |
P-Class | | | 155 | | | | 341 | |
Institutional Class | | | 12,466 | | | | 21,612 | |
Shares redeemed | | | | | | | | |
A-Class | | | (436,239 | ) | | | (949,737 | ) |
C-Class | | | (32,983 | ) | | | (34,716 | ) |
P-Class | | | (2,122 | ) | | | (68,344 | ) |
Institutional Class | | | (377,214 | ) | | | (1,098,996 | ) |
Net increase (decrease) in shares | | | (363,499 | ) | | | 1,455,218 | |
76 | THE GUGGENHEIM FUNDS SEMI-ANNUAL REPORT | SEE NOTES TO FINANCIAL STATEMENTS. |
This table is presented to show selected data for a share outstanding throughout each period and to assist shareholders in evaluating a Fund’s performance for the periods presented.
A-Class | | Six Months Ended
March 31, 2021a | | | Year Ended
September 30,
2020 | | | Year Ended
September 30,
2019 | | | Year Ended
September 30,
2018 | | | Year Ended
September 30,
2017 | | | Year Ended
September 30,
2016 | |
Per Share Data |
Net asset value, beginning of period | | $ | 13.23 | | | $ | 13.12 | | | $ | 12.46 | | | $ | 12.70 | | | $ | 12.86 | | | $ | 12.52 | |
Income (loss) from investment operations: |
Net investment income (loss)b | | | .12 | | | | .26 | | | | .30 | | | | .30 | | | | .27 | | | | .26 | |
Net gain (loss) on investments (realized and unrealized) | | | .23 | | | | .11 | | | | .70 | | | | (.24 | ) | | | (.15 | ) | | | .34 | |
Total from investment operations | | | .35 | | | | .37 | | | | 1.00 | | | | .06 | | | | .12 | | | | .60 | |
Less distributions from: |
Net investment income | | | (.12 | ) | | | (.26 | ) | | | (.30 | ) | | | (.30 | ) | | | (.28 | ) | | | (.26 | ) |
Net realized gains | | | (.02 | ) | | | — | | | | (.04 | ) | | | — | | | | — | | | | — | |
Total distributions | | | (.14 | ) | | | (.26 | ) | | | (.34 | ) | | | (.30 | ) | | | (.28 | ) | | | (.26 | ) |
Net asset value, end of period | | $ | 13.44 | | | $ | 13.23 | | | $ | 13.12 | | | $ | 12.46 | | | $ | 12.70 | | | $ | 12.86 | |
|
Total Returnc | | | 2.65 | % | | | 2.85 | % | | | 8.13 | % | | | 0.44 | % | | | 0.94 | % | | | 4.85 | % |
Ratios/Supplemental Data |
Net assets, end of period (in thousands) | | $ | 59,434 | | | $ | 62,583 | | | $ | 42,512 | | | $ | 25,570 | | | $ | 33,515 | | | $ | 41,283 | |
Ratios to average net assets: |
Net investment income (loss) | | | 1.85 | % | | | 1.95 | % | | | 2.31 | % | | | 2.35 | % | | | 2.19 | % | | | 2.06 | % |
Total expensesd | | | 1.21 | % | | | 1.21 | % | | | 1.34 | % | | | 1.30 | % | | | 1.20 | % | | | 1.18 | % |
Net expensese,f,g | | | 0.80 | % | | | 0.81 | % | | | 0.81 | % | | | 0.80 | % | | | 0.82 | % | | | 0.81 | % |
Portfolio turnover rate | | | 10 | % | | | 58 | % | | | 30 | % | | | 13 | % | | | 31 | % | | | 61 | % |
C-Class | | Six Months Ended
March 31, 2021a | | | Year Ended
September 30,
2020 | | | Year Ended
September 30,
2019 | | | Year Ended
September 30,
2018 | | | Year Ended
September 30,
2017 | | | Year Ended
September 30,
2016 | |
Per Share Data |
Net asset value, beginning of period | | $ | 13.22 | | | $ | 13.11 | | | $ | 12.45 | | | $ | 12.69 | | | $ | 12.86 | | | $ | 12.52 | |
Income (loss) from investment operations: |
Net investment income (loss)b | | | .07 | | | | .16 | | | | .21 | | | | .20 | | | | .18 | | | | .16 | |
Net gain (loss) on investments (realized and unrealized) | | | .23 | | | | .11 | | | | .69 | | | | (.24 | ) | | | (.17 | ) | | | .35 | |
Total from investment operations | | | .30 | | | | .27 | | | | .90 | | | | (.04 | ) | | | .01 | | | | .51 | |
Less distributions from: |
Net investment income | | | (.07 | ) | | | (.16 | ) | | | (.20 | ) | | | (.20 | ) | | | (.18 | ) | | | (.17 | ) |
Net realized gains | | | (.02 | ) | | | — | | | | (.04 | ) | | | — | | | | — | | | | — | |
Total distributions | | | (.09 | ) | | | (.16 | ) | | | (.24 | ) | | | (.20 | ) | | | (.18 | ) | | | (.17 | ) |
Net asset value, end of period | | $ | 13.43 | | | $ | 13.22 | | | $ | 13.11 | | | $ | 12.45 | | | $ | 12.69 | | | $ | 12.86 | |
|
Total Returnc | | | 2.28 | % | | | 2.09 | % | | | 7.33 | % | | | (0.30 | %) | | | 0.12 | % | | | 4.06 | % |
Ratios/Supplemental Data |
Net assets, end of period (in thousands) | | $ | 1,798 | | | $ | 2,177 | | | $ | 1,981 | | | $ | 2,403 | | | $ | 3,768 | | | $ | 5,008 | |
Ratios to average net assets: |
Net investment income (loss) | | | 1.10 | % | | | 1.23 | % | | | 1.63 | % | | | 1.60 | % | | | 1.44 | % | | | 1.26 | % |
Total expensesd | | | 1.98 | % | | | 1.97 | % | | | 2.12 | % | | | 2.11 | % | | | 1.92 | % | | | 1.89 | % |
Net expensese,f,g | | | 1.55 | % | | | 1.56 | % | | | 1.56 | % | | | 1.55 | % | | | 1.57 | % | | | 1.56 | % |
Portfolio turnover rate | | | 10 | % | | | 58 | % | | | 30 | % | | | 13 | % | | | 31 | % | | | 61 | % |
SEE NOTES TO FINANCIAL STATEMENTS. | THE GUGGENHEIM FUNDS SEMI-ANNUAL REPORT | 77 |
FINANCIAL HIGHLIGHTS (continued) |
This table is presented to show selected data for a share outstanding throughout each period and to assist shareholders in evaluating a Fund’s performance for the periods presented.
P-Class | | Six Months Ended
March 31, 2021a | | | Year Ended
September 30,
2020 | | | Year Ended
September 30,
2019 | | | Year Ended
September 30,
2018 | | | Year Ended
September 30,
2017 | | | Year Ended
September 30,
2016 | |
Per Share Data |
Net asset value, beginning of period | | $ | 13.22 | | | $ | 13.13 | | | $ | 12.46 | | | $ | 12.70 | | | $ | 12.86 | | | $ | 12.52 | |
Income (loss) from investment operations: |
Net investment income (loss)b | | | .12 | | | | .26 | | | | .29 | | | | .29 | | | | .25 | | | | .26 | |
Net gain (loss) on investments (realized and unrealized) | | | .24 | | | | .09 | | | | .72 | | | | (.23 | ) | | | (.14 | ) | | | .34 | |
Total from investment operations | | | .36 | | | | .35 | | | | 1.01 | | | | .06 | | | | .11 | | | | .60 | |
Less distributions from: |
Net investment income | | | (.12 | ) | | | (.26 | ) | | | (.30 | ) | | | (.30 | ) | | | (.27 | ) | | | (.26 | ) |
Net realized gains | | | (.02 | ) | | | — | | | | (.04 | ) | | | — | | | | — | | | | — | |
Total distributions | | | (.14 | ) | | | (.26 | ) | | | (.34 | ) | | | (.30 | ) | | | (.27 | ) | | | (.26 | ) |
Net asset value, end of period | | $ | 13.44 | | | $ | 13.22 | | | $ | 13.13 | | | $ | 12.46 | | | $ | 12.70 | | | $ | 12.86 | |
|
Total Return | | | 2.73 | % | | | 2.69 | % | | | 8.20 | % | | | 0.44 | % | | | 0.89 | % | | | 4.86 | % |
Ratios/Supplemental Data |
Net assets, end of period (in thousands) | | $ | 219 | | | $ | 202 | | | $ | 207 | | | $ | 37 | | | $ | 111 | | | $ | 84 | |
Ratios to average net assets: |
Net investment income (loss) | | | 1.86 | % | | | 1.96 | % | | | 2.25 | % | | | 2.32 | % | | | 2.01 | % | | | 2.00 | % |
Total expensesd | | | 1.42 | % | | | 1.40 | % | | | 1.55 | % | | | 1.72 | % | | | 1.27 | % | | | 1.21 | % |
Net expensese,f,g | | | 0.80 | % | | | 0.81 | % | | | 0.81 | % | | | 0.80 | % | | | 0.82 | % | | | 0.79 | % |
Portfolio turnover rate | | | 10 | % | | | 58 | % | | | 30 | % | | | 13 | % | | | 31 | % | | | 61 | % |
78 | THE GUGGENHEIM FUNDS SEMI-ANNUAL REPORT | SEE NOTES TO FINANCIAL STATEMENTS. |
FINANCIAL HIGHLIGHTS (concluded) |
This table is presented to show selected data for a share outstanding throughout each period and to assist shareholders in evaluating a Fund’s performance for the periods presented.
Institutional Class | | Six Months Ended
March 31, 2021a | | | Year Ended
September 30,
2020 | | | Year Ended
September 30,
2019 | | | Year Ended
September 30,
2018 | | | Year Ended
September 30,
2017 | | | Year Ended
September 30,
2016 | |
Per Share Data |
Net asset value, beginning of period | | $ | 13.23 | | | $ | 13.13 | | | $ | 12.46 | | | $ | 12.71 | | | $ | 12.87 | | | $ | 12.53 | |
Income (loss) from investment operations: |
Net investment income (loss)b | | | .14 | | | | .29 | | | | .33 | | | | .33 | | | | .30 | | | | .29 | |
Net gain (loss) on investments (realized and unrealized) | | | .23 | | | | .10 | | | | .71 | | | | (.25 | ) | | | (.15 | ) | | | .34 | |
Total from investment operations | | | .37 | | | | .39 | | | | 1.04 | | | | .08 | | | | .15 | | | | .63 | |
Less distributions from: |
Net investment income | | | (.14 | ) | | | (.29 | ) | | | (.33 | ) | | | (.33 | ) | | | (.31 | ) | | | (.29 | ) |
Net realized gains | | | (.02 | ) | | | — | | | | (.04 | ) | | | — | | | | — | | | | — | |
Total distributions | | | (.16 | ) | | | (.29 | ) | | | (.37 | ) | | | (.33 | ) | | | (.31 | ) | | | (.29 | ) |
Net asset value, end of period | | $ | 13.44 | | | $ | 13.23 | | | $ | 13.13 | | | $ | 12.46 | | | $ | 12.71 | | | $ | 12.87 | |
|
Total Return | | | 2.78 | % | | | 3.03 | % | | | 8.48 | % | | | 0.61 | % | | | 1.19 | % | | | 5.11 | % |
Ratios/Supplemental Data |
Net assets, end of period (in thousands) | | $ | 13,325 | | | $ | 13,406 | | | $ | 13,970 | | | $ | 9,067 | | | $ | 15,914 | | | $ | 24,126 | |
Ratios to average net assets: |
Net investment income (loss) | | | 2.10 | % | | | 2.23 | % | | | 2.59 | % | | | 2.59 | % | | | 2.43 | % | | | 2.24 | % |
Total expensesd | | | 1.00 | % | | | 1.00 | % | | | 1.08 | % | | | 1.09 | % | | | 0.88 | % | | | 0.84 | % |
Net expensese,f,g | | | 0.55 | % | | | 0.56 | % | | | 0.56 | % | | | 0.55 | % | | | 0.57 | % | | | 0.56 | % |
Portfolio turnover rate | | | 10 | % | | | 58 | % | | | 30 | % | | | 13 | % | | | 31 | % | | | 61 | % |
a | Unaudited figures for the period ended March 31, 2021. Percentage amounts for the period, except total return and portfolio turnover rate, have been annualized. |
b | Net investment income (loss) per share was computed using average shares outstanding throughout the period. |
c | Total return does not reflect the impact of any applicable sales charges. |
d | Does not include expenses of the underlying funds in which the Fund invests. |
e | Net expense information reflects the expense ratios after expense waivers and reimbursements, as applicable. |
f | The portion of the ratios of net expenses to average net assets attributable to recoupments of prior fee reductions or expense reimbursements for the years presented was as follows: |
| | | 03/31/21 | 09/30/20 | 09/30/19 | 09/30/18 | 09/30/17 |
| | A-Class | — | 0.00%* | 0.00%* | — | — |
| | C-Class | — | 0.00%* | — | — | — |
| | P-Class | — | 0.00%* | — | — | 0.04% |
| | Institutional Class | — | 0.00%* | — | — | — |
g | Net expenses may include expenses that are excluded from the expense limitation agreement. Excluding these expenses, the net expense ratios for the years presented would be: |
| | | 03/31/21 | 09/30/20 | 09/30/19 | 09/30/18 | 09/30/17 | 09/30/16 |
| | A-Class | 0.80% | 0.80% | 0.80% | 0.80% | 0.80% | 0.80% |
| | C-Class | 1.55% | 1.55% | 1.55% | 1.55% | 1.55% | 1.55% |
| | P-Class | 0.80% | 0.80% | 0.80% | 0.80% | 0.80% | 0.78% |
| | Institutional Class | 0.55% | 0.55% | 0.55% | 0.55% | 0.55% | 0.55% |
SEE NOTES TO FINANCIAL STATEMENTS. | THE GUGGENHEIM FUNDS SEMI-ANNUAL REPORT | 79 |
NOTES TO FINANCIAL STATEMENTS (Unaudited) |
Note 1 – Organization and Significant Accounting Policies
Organization
Guggenheim Funds Trust (the “Trust”), a Delaware statutory trust, is registered with the SEC under the Investment Company Act of 1940 (“1940 Act”), as an open-ended investment company of the series type. Each series, in effect, is representing a separate fund (each, a “Fund”). The Trust may issue an unlimited number of authorized shares. The Trust accounts for the assets of each Fund separately.
The Trust offers a combination of five separate classes of shares: A-Class shares, C-Class shares, P-Class shares, R6-Class shares and Institutional Class shares. Sales of shares of each Class are made without a front-end sales charge at the net asset value per share (“NAV”), with the exception of A-Class shares. A-Class shares are sold at the NAV, plus the applicable front-end sales charge. The sales charge varies depending on the amount purchased. A-Class share purchases of $1 million or more are exempt from the front-end sales charge but have a 1% contingent deferred sales charge (“CDSC”), if shares are redeemed within 12 months of purchase. C-Class shares have a 1% CDSC if shares are redeemed within 12 months of purchase. C-Class shares of each Fund automatically convert to A-Class shares of the same Fund on or about the 10th day of the month following the 10-year anniversary of the purchase of the C-Class shares. This conversion will be executed without any sales charge, fee or other charge. After the conversion is completed, the shares will be subject to all features and expenses of A-Class shares. Institutional Class shares are offered primarily for direct investment by institutions such as pension and profit sharing plans, endowments, foundations and corporations. Institutional Class shares require a minimum initial investment of $2 million and a minimum account balance of $1 million. The High Yield Fund offers R6-Class shares. R6-Class shares are offered primarily through qualified retirement and benefit plans. R6-Class shares are also offered through certain other plans and platforms sponsored by financial intermediaries. Certain institutional investors and others deemed appropriate by Guggenheim Investments (“GI”) may also be eligible to purchase R6-Class shares subject to a $2 million minimum initial investment. At March 31, 2021, the Trust consisted of nineteen funds.
As of January 1, 2012, A-Class, C-Class and Institutional Class shares of High Yield Fund are subject to a 2% redemption fee when shares are redeemed or exchanged within 90 days of purchase.
This report covers the following funds (collectively, the “Funds”):
Fund Name | Investment
Company Type |
Diversified Income Fund | Diversified |
High Yield Fund | Diversified |
Core Bond Fund (formerly, Investment Grade Bond Fund) | Diversified |
Municipal Income Fund | Diversified |
Security Investors, LLC, and Guggenheim Partners Investment Management, LLC (“GPIM”), which operate under the name Guggenheim Investments, provides advisory services. Guggenheim Funds Distributors, LLC (“GFD”) acts as principal underwriter for the Trust. GI and GFD are affiliated entities.
GPIM, an affiliate of GI, serves as investment sub-advisor (the “Sub-Advisor”) to the Municipal Income Fund and is responsible for the day-to-day management of the Fund’s portfolio.
Significant Accounting Policies
The Funds operate as investment companies and, accordingly, follow the investment company accounting and reporting guidance of the Financial Accounting Standards Board (“FASB”) Accounting Standards Codification Topic 946 Financial Services – Investment Companies.
The following significant accounting policies are in conformity with U.S. generally accepted accounting principles (“U.S. GAAP”) and are consistently followed by the Trust. This requires management to make estimates and assumptions that affect the reported amount of assets and liabilities, contingent assets and liabilities at the date of the financial statements, and the reported amounts of revenues and expenses during the reporting period. Actual results could differ from these estimates. All time references are based on Eastern Time.
The NAV of each Class of a fund is calculated by dividing the market value of a fund’s securities and other assets, less all liabilities, attributable to the Class by the number of outstanding shares of the Class.
(a) Valuation of Investments
The Board of Trustees of the Funds (the “Board”) has adopted policies and procedures for the valuation of the Funds’ investments (the “Valuation Procedures”). Pursuant to the Valuation Procedures, the Board has delegated to a valuation committee, consisting of representatives from Guggenheim’s investment management, fund administration, legal and compliance departments (the “Valuation Committee”), the day-to-day responsibility for implementing the Valuation Procedures,
80 | THE GUGGENHEIM FUNDS SEMI-ANNUAL REPORT | |
NOTES TO FINANCIAL STATEMENTS (Unaudited)(continued) |
including, under most circumstances, the responsibility for determining the fair value of the Funds’ securities and/or other assets.
Valuations of the Funds’ securities and other assets are supplied primarily by pricing services appointed pursuant to the processes set forth in the Valuation Procedures. The Valuation Committee convenes monthly, or more frequently as needed, to review the valuation of all assets which have been fair valued for reasonableness. The Funds’ officers, through the Valuation Committee and consistent with the monitoring and review responsibilities set forth in the Valuation Procedures, regularly review procedures used and valuations provided by the pricing services.
If the pricing service cannot or does not provide a valuation for a particular investment or such valuation is deemed unreliable, such investment is fair valued by the Valuation Committee.
Equity securities listed or traded on a recognized U.S. securities exchange or the National Association of Securities Dealers Automated Quotations (“NASDAQ”) National Market System shall generally be valued on the basis of the last sale price on the primary U.S. exchange or market on which the security is listed or traded; provided, however, that securities listed on NASDAQ will be valued at the NASDAQ Official Closing Price, which may not necessarily represent the last sale price. If there is no sale on the valuation date, exchange-traded U.S. equity securities will be valued on the basis of the last bid price.
Generally, trading in foreign securities markets is substantially completed each day at various times prior to the close of the New York Stock Exchange (“NYSE”). The values of foreign securities are determined as of the close of such foreign markets or the close of the NYSE, if earlier. All investments quoted in foreign currencies are valued in U.S. dollars on the basis of the foreign currency exchange rates prevailing at the close of U.S. business at 4:00 p.m. Investments in foreign securities may involve risks not present in domestic investments. The Valuation Committee will determine the current value of such foreign securities by taking into consideration certain factors which may include those discussed above, as well as the following factors, among others: the value of the securities traded on other foreign markets, ADR trading, closed-end fund trading, foreign currency exchange activity, and the trading prices of financial products that are tied to foreign securities. In addition, under the Valuation Procedures, the Valuation Committee and GI are authorized to use prices and other information supplied by a third party pricing vendor in valuing foreign securities.
Open-end investment companies are valued at their NAV as of the close of business, on the valuation date. Exchange-traded funds and closed-end investment companies are valued at the last quoted sale price.
U.S. Government securities are valued by independent pricing services, the last traded fill price, or at the reported bid price at the close of business.
Debt securities with a maturity of greater than 60 days at acquisition are valued at prices that reflect broker-dealer supplied valuations or are obtained from independent pricing services, which may consider the trade activity, treasury spreads, yields or price of bonds of comparable quality, coupon, maturity, and type, as well as prices quoted by dealers who make markets in such securities. Short-term debt securities with a maturity of 60 days or less at acquisition are valued at amortized cost, provided such amount approximates market value.
Typically, loans are valued using information provided by an independent third party pricing service that uses broker quotes, among other inputs. If the pricing service cannot or does not provide a valuation for a particular loan, or such valuation is deemed unreliable, such investment is valued based on a quote from a broker-dealer or is fair valued by the Valuation Committee.
Exchange-traded options are valued at the mean of the bid and ask prices on the principal exchange on which they are traded. Over-the-counter (“OTC”) options are valued using a price provided by a pricing service.
The value of futures contracts is accounted for using the unrealized appreciation or depreciation on the contracts that is determined by marking the contracts to their current realized settlement prices. Financial futures contracts are valued at the 4:00 p.m. price on the valuation date. In the event that the exchange for a specific futures contract closes earlier than 4:00 p.m., the futures contract is valued at the official settlement price of the exchange. However, the underlying securities from which the futures contract value is derived are monitored until 4:00 p.m. to determine if fair valuation would provide a more accurate valuation.
The value of interest rate swap agreements entered into by a fund is accounted for using the unrealized appreciation or depreciation on the agreements that is determined using the previous day’s Chicago Mercantile Exchange close price, adjusted for the current day’s spreads.
The values of other swap agreements entered into by the Fund are accounted for using the unrealized appreciation or depreciation on the agreements that are determined by marking the agreements to the last quoted value of the index or other underlying position that the swaps pertain to at the close of the NYSE.
Forward foreign currency exchange contracts are valued daily based on the applicable exchange rate of the underlying currency.
| | THE GUGGENHEIM FUNDS SEMI-ANNUAL REPORT | 81 |
NOTES TO FINANCIAL STATEMENTS (Unaudited)(continued) |
Investments for which market quotations are not readily available are fair-valued as determined in good faith by GI, subject to review and approval by the Valuation Committee, pursuant to methods established or ratified by the Board. Valuations in accordance with these methods are intended to reflect each security’s (or asset’s or liability’s) “fair value”. Each such determination is based on a consideration of all relevant factors, which are likely to vary from one pricing context to another. Examples of such factors may include, but are not limited to market prices; sale prices; broker quotes; and models which derive prices based on inputs such as prices of securities with comparable maturities and characteristics, or based on inputs such as anticipated cash flows or collateral, spread over U.S. Treasury securities, and other information analysis. In connection with futures contracts and other derivative investments, such factors may include obtaining information as to how (a) these contracts and other derivative investments trade in the futures or other derivative markets, respectively, and (b) the securities underlying these contracts and other derivative investments trade in the cash market.
(b) U.S. Government and Agency Obligations
Certain U.S. Government and Agency Obligations are traded on a discount basis; the interest rates shown on the Schedules of Investments reflect the effective rates paid at the time of purchase by the Funds. Other securities bear interest at the rates shown, payable at fixed dates through maturity.
(c) Senior Floating Rate Interests and Loan Investments
Senior floating rate interests in which the Trust invests generally pay interest rates which are periodically adjusted by reference to a base short-term floating rate, plus a premium. These base lending rates are generally (i) the lending rate offered by one or more major European banks, such as the one-month or three-month London Inter-Bank Offered Rate (“LIBOR”), (ii) the prime rate offered by one or more major United States banks, or (iii) the bank’s certificate of deposit rate. Senior floating rate interests often require prepayments from excess cash flows or permit the borrower to repay at its election. The rate at which the borrower repays cannot be predicted with accuracy. As a result, the actual remaining maturity may be substantially less than the stated maturities disclosed in the Funds’ Schedules of Investments.
The Funds invest in loans and other similar debt obligations (“obligations”). A portion of the Funds’ investments in these obligations is sometimes referred to as “covenant lite” loans or obligations (“covenant lite obligations”), which are obligations that lack covenants or possess fewer or less restrictive covenants or constraints on borrowers than certain other types of obligations. The Funds may also obtain exposure to covenant lite obligations through investment in securitization vehicles and other structured products. In recent market conditions, many new or reissued obligations have not featured traditional covenants, which are intended to protect lenders and investors by (i) imposing certain restrictions or other limitations on a borrower’s operations or assets or (ii) providing certain rights to lenders. The Funds may have fewer rights with respect to covenant lite obligations, including fewer protections against the possibility of default and fewer remedies in the event of default. As a result, investments in (or exposure to) covenant lite obligations are subject to more risk than investments in (or exposure to) certain other types of obligations. The Funds are subject to other risks associated with investments in (or exposure to) obligations, including that obligations may not be considered “securities” and, as a result, the Funds may not be entitled to rely on the anti-fraud protections under the federal securities laws and instead may have to resort to state law and direct claims.
(d) Interest on When-Issued Securities
The Funds may purchase and sell interests in securities on a when-issued and delayed delivery basis, with payment and delivery scheduled for a future date. No income accrues to the Funds on such interests or securities in connection with such transactions prior to the date the Funds actually take delivery of such interests or securities. These transactions are subject to market fluctuations and are subject to the risk that the value at delivery may be more or less than the trade date purchase price. Although the Funds will generally purchase these securities with the intention of acquiring such securities, they may sell such securities before the settlement date.
(e) Options
Upon the purchase of an option, the premium paid is recorded as an investment, the value of which is marked-to-market daily. If a purchased option expires, the Fund realizes a loss in the amount of the cost of the option. When the Fund enters into a closing sale transaction, it realizes a gain or loss depending on whether the proceeds from the closing sale transaction are greater or less than the cost of the option. If the Fund exercises a put option, it realizes a gain or loss from the sale of the underlying security and the proceeds from such sale will be decreased by the premium originally paid. When the Fund exercises a call option, the cost of the security purchased by the Fund upon exercise increases by the premium originally paid.
When the Fund writes (sells) an option, an amount equal to the premium received is entered in that Fund’s accounting records as an asset and equivalent liability. The amount of the liability is subsequently marked-to-market to reflect the current value of the option written. When a written option expires, or if the Fund enters into a closing purchase transaction, it realizes a gain (or loss if the cost of a closing purchase transaction exceeds the premium received when the option was sold).
82 | THE GUGGENHEIM FUNDS SEMI-ANNUAL REPORT | |
NOTES TO FINANCIAL STATEMENTS (Unaudited)(continued) |
(f) Swap Agreements
Swap agreements are marked-to-market daily and the change, if any, is recorded as unrealized appreciation or depreciation. Payments received or made as a result of an agreement or termination of an agreement are recognized as realized gains or losses.
Upon entering into certain centrally-cleared swap transactions, a Fund is required to deposit with its clearing broker an amount of cash or securities as an initial margin. Subsequent variation margin receipts or payments are received or made by the Fund depending on fluctuations in the fair value of the reference entity and are recorded by the Fund as unrealized appreciation or depreciation. When the contract is closed, the Fund records a realized gain or loss equal to the difference between the value of the contract at the time it was opened and the value at the time it was closed.
Upfront payments received or made by a Fund on credit default swap agreements and interest rate swap agreements are amortized over the expected life of the agreement. Periodic payments received or paid by a Fund are recorded as realized gains or losses. Payments received or made as a result of a credit event or termination of the contract are recognized, net of a proportional amount of the upfront payment, as realized gains or losses.
(g) Currency Translations
The accounting records of the Funds are maintained in U.S. dollars. All assets and liabilities initially expressed in foreign currencies are converted into U.S. dollars at prevailing exchange rates. Purchases and sales of investment securities, dividend and interest income, and certain expenses are translated at the rates of exchange prevailing on the respective dates of such transactions. Changes in the relationship of these foreign currencies to the U.S. dollar can significantly affect the value of the investments and earnings of the Funds. Foreign investments may also subject the Funds to foreign government exchange restrictions, expropriation, taxation, or other political, social or economic developments, all of which could affect the market and/or credit risk of the investments.
The Funds do not isolate that portion of the results of operations resulting from changes in the foreign exchange rates on investments from the fluctuations arising from changes in the market prices of securities held. Such fluctuations are included with the net realized gain or loss and unrealized appreciation or depreciation on investments.
Reported net realized foreign exchange gains and losses arise from sales of foreign currencies and currency gains or losses realized between the trade and settlement dates on investment transactions. Net unrealized appreciation and depreciation arise from changes in the fair values of assets and liabilities other than investments in securities at the fiscal period end, resulting from changes in exchange rates.
(h) Forward Foreign Currency Exchange Contracts
The change in value of a forward foreign currency exchange contract is recorded as unrealized appreciation or depreciation until the contract is closed. When the contract is closed, the Funds record a realized gain or loss equal to the difference between the value at the time the contract was opened and the value at the time it was closed.
(i) Foreign Taxes
The Funds may be subject to foreign taxes (a portion of which may be reclaimable) on income, stock dividends, capital gains on investments or certain foreign currency transactions. All foreign taxes are recorded in accordance with the applicable foreign tax regulations and rates that exist in the foreign jurisdictions in which the Funds invest. These foreign taxes, if any, are paid by the Funds and reflected in their Statements of Operations as follows: foreign taxes withheld at source are presented as a reduction of income and foreign taxes on capital gains from sales of investments are included with the net realized gain (loss) on investments. Foreign taxes payable or deferred as of March 31, 2021, if any, are disclosed in the Funds’ Statements of Assets and Liabilities.
(j) Security Transactions
Security transactions are recorded on the trade date for financial reporting purposes. Realized gains and losses from securities transactions are recorded using the identified cost basis. Proceeds from lawsuits related to investment holdings are recorded as a reduction to cost if the securities are still held and as realized gains if no longer held in the respective Fund. Dividend income is recorded on the ex-dividend date, net of applicable taxes withheld by foreign countries, if any. Taxable non-cash dividends are recorded as dividend income. Interest income, including amortization of premiums and accretion of discounts, is accrued on a daily basis. Interest income also includes paydown gains and losses on mortgage-backed and asset-backed securities and senior and subordinated loans. Amendment fees are earned as compensation for evaluating and accepting changes to the original loan agreement and are recognized when received. Dividend income from Real Estate Investment Trusts (“REITs”) is recorded based on the income included in the distributions received from the REIT investments using published REIT classifications, including some management estimates when actual amounts are not available. Distributions received in excess of this estimated amount are recorded as a reduction of the cost of investments or reclassified to realized gains. The actual amounts of income,
| | THE GUGGENHEIM FUNDS SEMI-ANNUAL REPORT | 83 |
NOTES TO FINANCIAL STATEMENTS (Unaudited)(continued) |
return of capital, and realized gains are only determined by each REIT after its fiscal year-end, and may differ from the estimated amounts.
Income from residual collateralized loan obligations is recognized using the effective interest method. At the time of purchase, management estimates the future expected cash flows and determines the effective yield and estimated maturity date based on the estimated cash flows. Subsequent to the purchase, the estimated cash flows are updated periodically and a revised yield is calculated prospectively.
Certain Funds may receive other income from investments in senior loan interests including amendment fees, consent fees and commitment fees. For funded loans, these fees are recorded as income when received by the Funds and included in interest income on the Statements of Operations. For unfunded loans, commitment fees are included in realized gain on investments on the Statement of Operations at the end of the commitment period.
(k) Distributions
The Funds declare dividends from investment income daily, except for Diversified Income Fund, which declares monthly. Each Fund pays its shareholders from its net investment income monthly and distributes any net capital gains that it has realized, at least annually. Distributions to shareholders are recorded on the ex-dividend date. Dividends are reinvested in additional shares, unless shareholders request payment in cash. The character of distributions made during the year from net investment income or net realized gains may differ from their ultimate characterization for U.S. federal income tax purposes.
(l) Class Allocations
Interest and dividend income, most expenses, all realized gains and losses, and all unrealized appreciation and depreciation are allocated to the classes based upon the value of the outstanding shares in each Class. Certain costs, such as distribution and service fees are charged directly to specific classes. In addition, certain expenses have been allocated to the individual Funds in the Trust based on the respective net assets of each Fund included in the Trust.
(m) Earnings Credits
Under the fee arrangement with the custodian, the Funds may earn credits based on overnight custody cash balances. These credits are utilized to reduce related custodial expenses. The custodian fees disclosed in the Statements of Operations are before the reduction in expense from the related earnings credits, if any. Earnings credits for the period ended March 31, 2021, are disclosed in the Statements of Operations.
(n) Cash
The Funds may leave cash overnight in their cash account with the custodian. Periodically, a Fund may have cash due to the custodian bank as an overdraft balance. A fee is incurred on this overdraft, calculated by multiplying the overdraft by a rate based on the federal funds rate, which was 0.06% at March 31, 2021.
(o) Indemnifications
Under the Funds’ organizational documents, the Trustees and Officers are indemnified against certain liabilities arising out of the performance of their duties to the Trust. In addition, throughout the normal course of business, the Funds enter into contracts that contain a variety of representations and warranties which provide general indemnifications. The Funds’ maximum exposure under these arrangements is unknown, as this would involve future claims that may be made against the Funds and/or their affiliates that have not yet occurred. However, based on experience, the Funds expect the risk of loss to be remote.
Note 2 – Derivatives
As part of their investment strategy, the Funds may utilize a variety of derivative instruments. These investments involve, to varying degrees, elements of market risk and risks in excess of amounts recognized on the Statements of Assets and Liabilities. Valuation and accounting treatment of these instruments can be found under Significant Accounting Policies in Note 1 of these Notes to Financial Statements.
Derivatives are instruments whose values depend on, or are derived from, in whole or in part, the value of one or more other assets, such as securities, currencies, commodities or indices. Derivative instruments may be used to increase investment flexibility (including to maintain cash reserves while maintaining exposure to certain other assets), for risk management (hedging) purposes, to facilitate trading, to reduce transaction costs and to pursue higher investment returns. Derivative instruments may also be used to mitigate certain investment risks, such as foreign currency exchange rate risk, interest rate risk and credit risk. U.S. GAAP requires disclosures to enable investors to better understand how and why a Fund uses derivative instruments, how these derivative instruments are accounted for and their effects on the Fund’s financial position and results of operations.
The Funds may utilize derivatives for the following purposes:
Duration: the use of an instrument to manage the interest rate risk of a portfolio.
Hedge: an investment made in order to reduce the risk of adverse price movements in a security, by taking an offsetting position to protect against broad market moves.
84 | THE GUGGENHEIM FUNDS SEMI-ANNUAL REPORT | |
NOTES TO FINANCIAL STATEMENTS (Unaudited)(continued) |
Income: the use of any instrument that distributes cash flows typically based upon some rate of interest.
Index Exposure: the use of an instrument to obtain exposure to a listed or other type of index.
Speculation: the use of an instrument to express macro-economic and other investment views.
Options Purchased and Written
A call option on a security gives the purchaser of the option the right to buy, and the writer of a call option the obligation to sell, the underlying security. The purchaser of a put option has the right to sell, and the writer of the put option the obligation to buy, the underlying security at any time during the option period. The risk associated with purchasing options is limited to the premium originally paid.
The following table represents the Funds’ use and volume of call/put options purchased on a monthly basis:
| | | | Average Notional Amount | |
Fund | Use | | Call | | | Put | |
Core Bond Fund | Hedge | | $ | 991,816,667 | | | $ | — | |
Swap Agreements
A swap is an agreement that obligates two parties to exchange a series of cash flows at specified intervals based upon or calculated by reference to changes in specified prices or rates for a specified amount of an underlying asset. When utilizing OTC swaps, a fund bears the risk of loss of the amount expected to be received under a swap agreement in the event of the default or bankruptcy of a swap agreement counterparty or if the underlying asset declines in value. Certain standardized swaps are subject to mandatory central clearing and are executed on a multi-lateral or other trade facility platform, such as a registered exchange. There is limited counterparty credit risk with respect to centrally-cleared swaps as the transaction is facilitated through a central clearinghouse, much like exchange-traded futures contracts. For a fund utilizing centrally-cleared swaps, the exchange bears the risk of loss resulting from a counterparty not being able to pay. There is no guarantee that a fund or an underlying fund could eliminate its exposure under an outstanding swap agreement by entering into an offsetting swap agreement with the same or another party.
Total return swaps involve commitments where single or multiple cash flows are exchanged based on the price of an underlying reference asset (such as an index) for a fixed or variable interest rate. Total return swaps will usually be computed based on the current value of the reference asset as of the close of regular trading on the NYSE or other exchange, with the swap value being adjusted to include dividends accrued, financing charges and/or interest associated with the swap agreement. When utilizing total return swaps, a fund bears the risk of loss of the amount expected to be received under a swap agreement in the event of the default or bankruptcy of a swap agreement counterparty or if the underlying reference asset declines in value.
The following table represents the Funds’ use and volume of total return swaps on a monthly basis:
| | | | Average Notional Amount | |
Fund | Use | | Long | | | Short | |
High Yield Fund | Income, Index exposure | | $ | 6,130,133 | | | $ | — | |
Core Bond Fund | Income, Index exposure, Speculation | | | 5,782,805 | | | | 1,018,912 | |
Interest rate swaps involve the exchange by the Funds with another party for their respective commitment to pay or receive a fixed or variable interest rate on a notional amount of principal. Interest rate swaps are generally centrally-cleared, but central clearing does not make interest rate swap transactions risk free.
| | THE GUGGENHEIM FUNDS SEMI-ANNUAL REPORT | 85 |
NOTES TO FINANCIAL STATEMENTS (Unaudited)(continued) |
The following table represents the Funds’ use and volume of interest rate swaps on a monthly basis:
| | | | Average Notional Amount | |
Fund | Use | | Pay Floating Rate | | | Receive Floating Rate | |
Municipal Income Fund | Duration, Hedge | | $ | — | | | $ | 3,338,333 | |
Core Bond Fund | Duration, Hedge | | | 40,166,667 | | | | 24,033,333 | |
Credit default swaps are instruments which allow for the full or partial transfer of third party credit risk, with respect to a particular entity or entities, from one counterparty to the other. A fund enters into credit default swaps as a “seller” or “buyer” of protection primarily to gain or reduce exposure to the investment grade and/or high yield bond market. A seller of credit default swaps is selling credit protection or assuming credit risk with respect to the underlying entity or entities. The buyer in a credit default swap is obligated to pay the seller a periodic stream of payments over the term of the contract provided that no event of default on an underlying reference obligation has occurred. If a credit event occurs, as defined under the terms of the swap agreement, the seller will either (i) pay to the buyer of protection an amount equal to the notional amount of the swap and take delivery of the referenced obligation or underlying securities comprising the referenced index or (ii) pay a net settlement amount in the form of cash or securities equal to the notional amount of the swap less the recovery value of the referenced obligation or underlying securities comprising the referenced index. The notional amount reflects the maximum potential amount the seller of credit protection could be required to pay to the buyer if a credit event occurs. The seller of protection receives periodic premium payments from the buyer and may also receive or pay an upfront premium adjustment to the stated periodic payments. In the event a credit default occurs on a credit default swap referencing an index, a factor adjustment will take place and the buyer of protection will receive a payment reflecting the par less the default recovery rate of the defaulted index component based on its weighting in the index. If no default occurs, the counterparty will pay the stream of payments and have no further obligations to the fund selling the credit protection. For a fund utilizing centrally cleared credit default swaps, the exchange bears the risk of loss resulting from a counterparty not being able to pay. For OTC credit default swaps, a fund bears the risk of loss of the amount expected to be received under a swap agreement in the event of the default or bankruptcy of a swap agreement counterparty, or in the case of a credit default swap in which a fund is selling credit protection, the default of a third party issuer.
The quoted market prices and resulting market values for credit default swap agreements on securities and credit indices serve as an indicator of the current status of the payment/performance risk and represent the likelihood of an expected liability (or profit) for the credit derivative had the notional amount of the swap agreement been closed/sold as of the period end. Increasing market values, in absolute terms when compared to the notional amount of the swap, represent a deterioration of the referenced entity’s credit soundness and a greater likelihood or risk of default or other credit event occurring as defined under the terms of the agreement.
The following table represents the Funds’ use and volume of credit default swaps on a monthly basis:
| | | | Average Notional Amount | |
Fund | Use | | Protection Sold | | | Protection Purchased | |
High Yield Fund | Index Exposure | | $ | 20,583,333 | | | $ | — | |
Core Bond Fund | Index Exposure, Speculation | | | 15,778,333 | | | | — | |
Forward Foreign Currency Exchange Contracts
A forward foreign currency exchange contract is an agreement between two parties to exchange two designated currencies at a specific time in the future. Certain types of contracts may be cash settled, in an amount equal to the change in exchange rates during the term of the contract. The contracts can be used to hedge or manage exposure to foreign currency risks with portfolio investments or to gain exposure to foreign currencies.
The market value of a forward foreign currency exchange contract changes with fluctuations in foreign currency exchange rates. Furthermore, the Funds may be exposed to risk if the counterparties cannot meet the contract terms or if the currency value changes unfavorably as compared to the U.S. dollar.
86 | THE GUGGENHEIM FUNDS SEMI-ANNUAL REPORT | |
NOTES TO FINANCIAL STATEMENTS (Unaudited)(continued) |
The following table represents the Funds’ use and volume of forward foreign currency exchange contracts on a monthly basis:
| | | | Average Value | |
Fund | Use | | Purchased | | | Sold | |
High Yield Fund | Hedge | | $ | 151,023 | | | $ | 1,852,298 | |
Core Bond Fund | Hedge, Income | | | 27,027,711 | | | | 34,245,734 | |
Derivative Investment Holdings Categorized by Risk Exposure
The following is a summary of the location of derivative investments on the Funds’ Statements of Assets and Liabilities as of March 31, 2021:
Derivative Investment Type | Asset Derivatives | Liability Derivatives |
Interest Rate contracts | Variation margin on interest rate swap agreements | |
| | Unamortized upfront premiums paid on interest rate swap agreements | |
| | Investments in unaffiliated issuers, at value | |
Currency contracts | Unrealized appreciation on forward foreign currency exchange contracts | Unrealized depreciation on forward foreign currency exchange contracts |
Credit contracts | | Unrealized depreciation on OTC swap agreements |
The following tables set forth the fair value of the Funds’ derivative investments categorized by primary risk exposure at March 31, 2021:
| Asset Derivative Investments Value |
| Fund | | Swaps Interest Rate Risk* | | | Swaps Credit Risk | | | Options Purchased Equity Risk | | | Forward Foreign Currency Exchange Risk | | | Total Value at March 31, 2021 | |
| High Yield Fund | | $ | — | | | $ | — | | | $ | — | | | $ | 52,211 | | | $ | 52,211 | |
| Core Bond Fund | | | 5,067,117 | | | | — | | | | 5,980,992 | | | | 59,504 | | | | 11,107,613 | |
| Municipal Income Fund | | | 916,747 | | | | — | | | | — | | | | — | | | | 916,747 | |
| Liability Derivative Investments Value |
| Fund | | Swaps Interest Rate Risk* | | | Swaps Credit Risk | | | Options Purchased Equity Risk | | | Forward Foreign Currency Exchange Risk | | | Total Value at March 31, 2021 | |
| High Yield Fund | | $ | — | | | $ | 360,270 | | | $ | — | | | $ | 3,631 | | | $ | 363,901 | |
| Core Bond Fund | | | 1,955,203 | | | | — | | | | — | | | | — | | | | 1,955,203 | |
* | Includes cumulative appreciation (depreciation) of OTC and centrally-cleared swap agreements as reported on the Schedules of Investments. For centrally-cleared swap agreements, variation margin is reported within the Statements of Assets and Liabilities. |
| | THE GUGGENHEIM FUNDS SEMI-ANNUAL REPORT | 87 |
NOTES TO FINANCIAL STATEMENTS (Unaudited)(continued) |
The following is a summary of the location of derivative investments on the Funds’ Statements of Operations for the period ended March 31, 2021:
Derivative Investment Type | Location of Gain (Loss) on Derivatives |
Interest Rate/Credit contracts | Net realized gain (loss) on swap agreements |
| Net change in unrealized appreciation (depreciation) on swap agreements |
Currency contracts | Net realized gain (loss) on forward foreign currency exchange contracts |
| | Net change in unrealized appreciation (depreciation) on forward foreign currency exchange contracts |
Interest Rate contracts | Net change in unrealized appreciation (depreciation) on options purchased |
The following is a summary of the Funds’ realized gain (loss) and change in unrealized appreciation (depreciation) on derivative investments recognized on the Statements of Operations categorized by primary risk exposure for the period ended March 31, 2021:
Realized Gain (Loss) on Derivative Investments Recognized on the Statements of Operations |
Fund | | Swaps
Interest
Rate
Risk | | | Swaps
Credit
Risk | | | Options
Purchased
Interest
Rate
Risk | | | Forward
Foreign
Currency
Exchange
Risk | | | Total | |
High Yield Fund | | $ | — | | | $ | 1,863,488 | | | $ | — | | | $ | (101,315 | ) | | $ | 1,762,173 | |
Core Bond Fund | | | (949,063 | ) | | | 2,735,287 | | | | 2,581,841 | | | | 4,331,554 | | | | 8,699,619 | |
Municipal Income Fund | | | (16,636 | ) | | | — | | �� | | — | | | | — | | | | (16,636 | ) |
Change in Unrealized Appreciation (Depreciation) on Derivative Investments Recognized on the Statements of Operations |
Fund | | Swaps
Interest
Rate
Risk | | | Swaps
Credit
Risk | | | Options
Purchased
Interest
Rate
Risk | | | Forward
Foreign
Currency
Exchange
Risk | | | Total | |
High Yield Fund | | $ | — | | | $ | (420,124 | ) | | $ | — | | | $ | 51,050 | | | $ | (369,074 | ) |
Core Bond Fund | | | 2,348,203 | | | | (1,418,425 | ) | | | 3,189,091 | | | | (4,286,532 | ) | | | (167,663 | ) |
Municipal Income Fund | | | 916,747 | | | | — | | | | — | | | | — | | | | 916,747 | |
In conjunction with the use of derivative instruments, the Funds are required to maintain collateral in various forms. Depending on the financial instrument utilized and the broker involved, the Funds use margin deposits at the broker, cash and/or securities segregated at the custodian bank, discount notes or repurchase agreements allocated to the Funds as collateral.
Foreign Investments
There are several risks associated with exposure to foreign currencies, foreign issuers and emerging markets. A fund’s indirect and direct exposure to foreign currencies subjects the Fund to the risk that those currencies will decline in value relative to the U.S. dollar, or in the case of short positions, that the U.S. dollar will decline in value relative to the currency being hedged. Currency rates in foreign countries may fluctuate significantly over short periods of time for a number of reasons, including changes in interest rates and the imposition of currency controls or other political developments in the U.S. or abroad. In addition, the Funds may incur transaction costs in connection with conversions between various currencies. The Fund may, but is not obligated to, engage in currency hedging transactions, which generally involve buying currency forward, options or futures contracts. However, not all currency risks may be effectively hedged, and in some cases the costs of hedging techniques may outweigh expected benefits. In such instances, the value of securities denominated in foreign currencies can change significantly when foreign currencies strengthen or weaken relative to the U.S. dollar.
The Funds may invest in securities of foreign companies directly, or in financial instruments, such as ADRs and exchange-traded funds, which are indirectly linked to the performance of foreign issuers. Foreign markets can be more volatile than the U.S. market due to increased risks of adverse issuer, political, regulatory, market, or economic developments and can perform differently from the U.S. market. Investing in securities
88 | THE GUGGENHEIM FUNDS SEMI-ANNUAL REPORT | |
NOTES TO FINANCIAL STATEMENTS (Unaudited)(continued) |
of foreign companies directly, or in financial instruments that are indirectly linked to the performance of foreign issuers, may involve risks not typically associated with investing in U.S. issuers. The value of securities denominated in foreign currencies, and of dividends from such securities, can change significantly when foreign currencies strengthen or weaken relative to the U.S. dollar. Foreign securities markets generally have less trading volume and less liquidity than U.S. markets, and prices in some foreign markets may fluctuate more than those of securities traded on U.S. markets. Many foreign countries lack accounting and disclosure standards comparable to those that apply to U.S. companies, and it may be more difficult to obtain reliable information regarding a foreign issuer’s financial condition and operations. Transaction costs and costs associated with custody services are generally higher for foreign securities than they are for U.S. securities. Some foreign governments levy withholding taxes against dividend and interest income. Although in some countries portions of these taxes are recoverable, the non-recovered portion will reduce the income received by the Funds.
The Trust has established counterparty credit guidelines and enters into transactions only with financial institutions of investment grade or better. The Trust monitors the counterparty credit risk.
Note 3 – Offsetting
In the normal course of business, the Funds enter into transactions subject to enforceable master netting arrangements or other similar arrangements. Generally, the right to offset in those agreements allows the Funds to counteract the exposure to a specific counterparty with collateral received from or delivered to that counterparty based on the terms of the arrangements. These arrangements provide for the right to liquidate upon the occurrence of an event of default, credit event upon merger or additional termination event.
In order to better define their contractual rights and to secure rights that will help the Funds mitigate their counterparty risk, the Funds may enter into an International Swaps and Derivatives Association, Inc. Master Agreement (“ISDA Master Agreement”) or similar agreement with their derivative contract counterparties. An ISDA Master Agreement is a bilateral agreement between a fund and a counterparty that governs OTC derivatives, including foreign exchange contracts, and typically contains, among other things, collateral posting terms and netting provisions in the event of a default and/or termination event. The provisions of the ISDA Master Agreement typically permit a single net payment in the event of a default (close-out netting) or similar event, including the bankruptcy or insolvency of the counterparty.
For derivatives traded under an ISDA Master Agreement, the collateral requirements are typically calculated by netting the mark-to-market amount for each transaction under such agreement and comparing that amount to the value of any collateral currently pledged by the Funds and the counterparty. For financial reporting purposes, cash collateral that has been pledged to cover obligations of the Funds and cash collateral received from the counterparty, if any, are reported separately on the Statements of Assets and Liabilities as segregated cash with broker/receivable for variation margin, or payable for swap settlement/variation margin. Cash and/or securities pledged or received as collateral by the Funds in connection with an OTC derivative subject to an ISDA Master Agreement generally may not be invested, sold or rehypothecated by the counterparty or the Funds, as applicable, absent an event of default under such agreement, in which case such collateral generally may be applied towards obligations due to and payable by such counterparty or the Funds, as applicable. Generally, the amount of collateral due from or to a counterparty must exceed a minimum transfer amount threshold (e.g., $300,000) before a transfer is required to be made. To the extent amounts due to the Funds from their counterparties are not fully collateralized, contractually or otherwise, the Funds bear the risk of loss from counterparty nonperformance. The Funds attempt to mitigate counterparty risk by only entering into agreements with counterparties that they believe to be of good standing and by monitoring the financial stability of those counterparties.
For financial reporting purposes, the Funds do not offset derivative assets and derivative liabilities that are subject to netting arrangements in the Statements of Assets and Liabilities.
| | THE GUGGENHEIM FUNDS SEMI-ANNUAL REPORT | 89 |
NOTES TO FINANCIAL STATEMENTS (Unaudited)(continued) |
The following tables present derivative financial instruments and secured financing transactions that are subject to enforceable netting arrangements:
| | | | | | | | | | | | | | | | Gross Amounts Not Offset
in the Statements of
Assets and Liabilities | | | | | |
Fund | Instrument | | Gross
Amounts of
Recognized
Assets1 | | | Gross
Amounts
Offset in the
Statements
of Assets and
Liabilities | | | Net Amount
of Assets
Presented on
the Statements
of Assets and
Liabilities | | | Financial
Instruments | | | Cash
Collateral
Received | | | Net
Amount | |
High Yield Fund | Forward foreign currency exchange contracts | | $ | 52,211 | | | $ | — | | | $ | 52,211 | | | $ | (587 | ) | | $ | — | | | $ | 51,624 | |
Core Bond Fund | Forward foreign currency exchange contracts | | | 59,504 | | | | — | | | | 59,504 | | | | — | | | | (30,955 | ) | | | 28,549 | |
Core Bond Fund | Options purchased contracts | | | 5,980,992 | | | | — | | | | 5,980,992 | | | | — | | | | (1,770,180 | ) | | | 4,210,812 | |
| | | | | | | | | | | | | | | | Gross Amounts Not Offset
in the Statements of
Assets and Liabilities | | | | | |
Fund | Instrument | | Gross
Amounts of
Recognized
Liabilities1 | | | Gross
Amounts
Offset in the
Statements
of Assets and
Liabilities | | | Net Amount
of Liabilities
Presented on
the Statements
of Assets and
Liabilities | | | Financial
Instruments | | | Cash
Collateral
Pledged | | | Net
Amount | |
High Yield Fund | Credit Index Swap Agreements | | $ | 360,270 | | | $ | — | | | $ | 360,270 | | | $ | — | | | $ | (360,270 | ) | | $ | — | |
| | Forward foreign currency exchange contracts | | | 3,631 | | | | — | | | | 3,631 | | | | (587 | ) | | | — | | | | 3,044 | |
1 | Centrally-cleared derivatives are excluded from these reported amounts. |
The Funds have the right to offset deposits against any related derivative liabilities outstanding with each counterparty with the exception of exchange-traded or centrally-cleared derivatives. The following table presents deposits held by others in connection with derivative investments as of March 31, 2021.
Fund | Counterparty/Clearing Agent | Asset Type | | Cash Pledged | | | Cash Received | |
High Yield Fund | BNP Paribas | Total return swap agreements | | $ | 480,000 | | | $ | — | |
| BofA Securities, Inc. | Credit default swap agreements | | | — | | | | 447,953 | |
| | | | | 480,000 | | | | 447,953 | |
Core Bond Fund | BNP Paribas | Total return swap agreements | | | — | | | | 300,000 | |
| | BofA Securities, Inc. | Credit default swap agreements, forward foreign currency exchange contracts | | | — | | | | 89,239 | |
| | BofA Securities, Inc. | Futures contracts, Total return swap agreements, Options | | | — | | | | 414,239 | |
| | Goldman Sachs International | Total return swap agreements, Options | | | — | | | | 870,000 | |
| Morgan Stanley Capital Services LLC | Options | | | — | | | | 533,726 | |
| | | | | — | | | | 2,190,644 | |
Municipal Income Fund | BofA Securities, Inc. | Interest rate swap agreements | | | — | | | | 41,484 | |
90 | THE GUGGENHEIM FUNDS SEMI-ANNUAL REPORT | |
NOTES TO FINANCIAL STATEMENTS (Unaudited)(continued) |
Note 4 – Fair Value Measurement
In accordance with U.S. GAAP, fair value is defined as the price that the Funds would receive to sell an investment or pay to transfer a liability in an orderly transaction with an independent buyer in the principal market, or in the absence of a principal market, the most advantageous market for the investment or liability. U.S. GAAP establishes a three-tier fair value hierarchy based on the types of inputs used to value assets and liabilities and requires corresponding disclosure. The hierarchy and the corresponding inputs are summarized below:
Level 1 — | quoted prices in active markets for identical assets or liabilities. |
Level 2 — | significant other observable inputs (for example quoted prices for securities that are similar based on characteristics such as interest rates, prepayment speeds, credit risk, etc.). |
Level 3 — | significant unobservable inputs based on the best information available under the circumstances, to the extent observable inputs are not available, which may include assumptions. |
The types of inputs available depend on a variety of factors, such as the type of security and the characteristics of the markets in which it trades, if any. Fair valuation determinations that rely on fewer or no observable inputs require greater judgment. Accordingly, fair value determinations for Level 3 securities require the greatest amount of judgment.
Independent pricing services are used to value a majority of the Funds’ investments. When values are not available from a pricing service, they will be determined using a variety of sources and techniques, including: market prices; broker quotes; and models which derive prices based on inputs such as prices of securities with comparable maturities and characteristics or based on inputs such as anticipated cash flows or collateral, spread over U.S. Treasury securities, and other information and analysis. A significant portion of the Funds’ assets and liabilities are categorized as Level 2, as indicated in this report.
Quotes from broker-dealers, adjusted for fluctuations in criteria such as credit spreads and interest rates, may also be used to value the Funds’ assets and liabilities, i.e. prices provided by a broker-dealer or other market participant who has not committed to trade at that price. Although quotes are typically received from established market participants, the Funds may not have the transparency to view the underlying inputs which support the market quotations. Significant changes in a quote would generally result in significant changes in the fair value of the security.
Certain fixed income securities are valued by obtaining a monthly quote from a broker-dealer, adjusted for fluctuations in criteria such as credit spreads and interest rates.
Certain loans and other securities are valued using a single daily broker quote or a price from a third party vendor based on a single daily or monthly broker quote.
The inputs or methodologies used for valuing securities are not necessarily an indication of the risk associated with investing in those securities. The suitability of the techniques and sources employed to determine fair valuation are regularly monitored and subject to change.
Note 5 – Investment Advisory Agreement and Other Agreements
Under the terms of an investment advisory contract, the Funds pay GI investment advisory fees calculated at the annualized rates below, based on the average daily net assets of the Funds:
Fund | | Management Fees
(as a % of Net Assets) | |
Diversified Income Fund | | | 0.75 | % |
High Yield Fund | | | 0.60 | % |
Core Bond Fund | | | 0.39 | % |
Municipal Income Fund | | | 0.50 | % |
GI pays operating expenses on behalf of the Trust, such as audit and accounting related services, legal services, custody, printing and mailing, among others, on a pass-through basis. Such expenses are allocated to various Funds within the complex based on relative net assets.
| | THE GUGGENHEIM FUNDS SEMI-ANNUAL REPORT | 91 |
NOTES TO FINANCIAL STATEMENTS (Unaudited)(continued) |
The Board has adopted Distribution Plans related to the offering of A-Class, C-Class and P-Class shares pursuant to Rule 12b-1 under the 1940 Act. The plans provide for payments at an annual rate of 0.25% of the average daily net assets of the Fund’s A-Class and P-Class shares, and 1.00% of the average daily net assets of the Fund’s C-Class shares.
Contractual expense limitation agreements for the following Funds provide that the total expenses be limited to a percentage of average net assets for each class of shares, exclusive of brokerage costs, dividends or interest on securities sold short, expenses of other investment companies in which a Fund invests, interest, taxes, litigation, indemnification and extraordinary expenses. The limits are listed below:
| | Limit | | | Effective
Date | | | Contract
End Date | |
Diversified Income Fund - A-Class | | | 1.30 | % | | | 01/29/16 | | | | 02/01/22 | |
Diversified Income Fund - C-Class | | | 2.05 | % | | | 01/29/16 | | | | 02/01/22 | |
Diversified Income Fund - P-Class | | | 1.30 | % | | | 01/29/16 | | | | 02/01/22 | |
Diversified Income Fund - Institutional Class | | | 1.05 | % | | | 01/29/16 | | | | 02/01/22 | |
High Yield Fund - A-Class | | | 1.16 | % | | | 11/30/12 | | | | 02/01/22 | |
High Yield Fund - C-Class | | | 1.91 | % | | | 11/30/12 | | | | 02/01/22 | |
High Yield Fund - P-Class | | | 1.16 | % | | | 05/01/15 | | | | 02/01/22 | |
High Yield Fund - Institutional Class | | | 0.91 | % | | | 11/30/12 | | | | 02/01/22 | |
High Yield Fund - R6-Class | | | 0.91 | % | | | 05/15/17 | | | | 02/01/22 | |
Core Bond Fund - A-Class | | | 0.79 | % | | | 11/30/12 | | | | 02/01/22 | |
Core Bond Fund - C-Class | | | 1.54 | % | | | 11/30/12 | | | | 02/01/22 | |
Core Bond Fund - P-Class | | | 0.79 | % | | | 05/01/15 | | | | 02/01/22 | |
Core Bond Fund - Institutional Class | | | 0.50 | % | | | 11/30/12 | | | | 02/01/22 | |
Municipal Income Fund - A-Class | | | 0.80 | % | | | 11/30/12 | | | | 02/01/22 | |
Municipal Income Fund - C-Class | | | 1.55 | % | | | 11/30/12 | | | | 02/01/22 | |
Municipal Income Fund - P-Class | | | 0.80 | % | | | 05/01/15 | | | | 02/01/22 | |
Municipal Income Fund - Institutional Class | | | 0.55 | % | | | 11/30/12 | | | | 02/01/22 | |
GI is entitled to reimbursement by the Funds for fees waived or expenses reimbursed during any of the previous 36 months, beginning on the date of the expense limitation agreement, if on any day the estimated operating expenses are less than the indicated percentages. For purposes of this arrangement, GI is entitled to recoupment of previously waived fees or reimbursed expenses for 36 months from the date of the waiver or reimbursement by GI. At March 31, 2021, the amount of fees waived or expenses reimbursed that are subject to recoupment and will expire during the years ended September 30, are presented in the following table:
Fund | | 2021 | | | 2022 | | | 2023 | | | 2024 | | | Total | |
Diversified Income Fund | | | | | | | | | | | | | | | | | | | | |
A-Class | | $ | 4,364 | | | $ | 4,237 | | | $ | 7,853 | | | $ | 4,168 | | | $ | 20,622 | |
C-Class | | | 4,566 | | | | 14,152 | | | | 13,188 | | | | 3,107 | | | | 35,013 | |
P-Class | | | 4,015 | | | | 3,371 | | | | 3,667 | | | | 1,990 | | | | 13,043 | |
Institutional Class | | | 170,720 | | | | 148,929 | | | | 161,912 | | | | 89,198 | | | | 570,759 | |
High Yield Fund | | | | | | | | | | | | | | | | | | | | |
A-Class | | | — | | | | — | | | | — | | | | — | | | | — | |
C-Class | | | — | | | | — | | | | — | | | | — | | | | — | |
P-Class | | | 7,336 | | | | 1,761 | | | | 1,010 | | | | 26 | | | | 10,133 | |
Institutional Class | | | — | | | | — | | | | — | | | | — | | | | — | |
R6-Class | | | — | | | | — | | | | — | | | | — | | | | — | |
Core Bond Fund | | | | | | | | | | | | | | | | | | | | |
A-Class | | | 124,974 | | | | 114,831 | | | | 101,962 | | | | 68,842 | | | | 410,609 | |
C-Class | | | 38,385 | | | | 23,323 | | | | 20,037 | | | | 12,779 | | | | 94,524 | |
P-Class | | | 37,885 | | | | 66,557 | | | | 60,229 | | | | 34,562 | | | | 199,233 | |
Institutional Class | | | 143,695 | | | | 535,891 | | | | 633,157 | | | | 655,876 | | | | 1,968,619 | |
Municipal Income Fund | | | | | | | | | | | | | | | | | | | | |
A-Class | | | 94,684 | | | | 153,746 | | | | 194,998 | | | | 124,843 | | | | 568,271 | |
C-Class | | | 11,544 | | | | 11,587 | | | | 8,471 | | | | 4,388 | | | | 35,990 | |
P-Class | | | 472 | | | | 838 | | | | 1,347 | | | | 621 | | | | 3,278 | |
Institutional Class | | | 42,933 | | | | 58,964 | | | | 57,034 | | | | 32,341 | | | | 191,272 | |
92 | THE GUGGENHEIM FUNDS SEMI-ANNUAL REPORT | |
NOTES TO FINANCIAL STATEMENTS (Unaudited)(continued) |
For the period ended March 31, 2021, GI recouped amounts from the Funds as follows:
High Yield Fund | | $ | 15,365 | |
Core Bond Fund | | | 1,781 | |
If a Fund invests in a fund that is advised by the same adviser or an affiliated adviser, the investing Fund’s adviser has agreed to waive fees at the investing fund level to the extent necessary to offset the proportionate share of any management fee paid by each Fund with respect to its investment in such affiliated fund. Fee waivers will be calculated at the investing Fund level without regard to any expense cap in effect for the investing Fund. Fees waived under this arrangement are not subject to reimbursement to GI. For the period ended March 31, 2021, the following Funds waived fees related to investments in affiliated funds:
Fund | | Amount Waived | |
Diversified Income Fund | | $ | 18,260 | |
High Yield Fund | | | 14,168 | |
For the period ended March 31, 2021, GFD retained sales charges of $192,037 relating to sales of A-Class shares of the Trust.
Certain trustees and officers of the Trust are also officers of GI and/or GFD. The Trust does not compensate its officers or trustees who are officers, directors and/or employees of GI or GFD.
MUFG Investor Services (US), LLC (“MUIS”) acts as the Funds’ administrator, transfer agent and accounting agent. As administrator, transfer agent and accounting agent, MUIS maintains the books and records of the Funds’ securities and cash. The Bank of New York Mellon Corp. (“BNY”) acts as the Funds’ custodian. As custodian, BNY is responsible for the custody of the Funds’ assets. For providing the aforementioned administrative and accounting services, MUIS is entitled to receive a monthly fee equal to a percentage of the Funds’ average daily net assets and out of pocket expenses. For providing the aforementioned transfer agent and custodian services, MUIS and BNY are entitled to receive a monthly fee based on the number of transactions during the month and the number of accounts under management, subject to certain minimum monthly fees, and out of pocket expenses.
At March 31, 2021, GI and its affiliates owned over twenty percent of the outstanding shares of the Funds, as follows
Fund | | Percent of Outstanding
Shares Owned | |
Diversified Income Fund | | | 94 | % |
Note 6 – Reverse Repurchase Agreements
Each of the Funds may enter into reverse repurchase agreements. Under a reverse repurchase agreement, a Fund sells securities and agrees to repurchase them at a particular price at a future date. In the event the buyer of securities under a reverse repurchase agreement files for bankruptcy or becomes insolvent, such buyer or its trustee or receiver may receive an extension of time to determine whether to enforce the Fund’s obligation to repurchase the securities, and the Fund’s use of the proceeds of the reverse repurchase agreement may effectively be restricted pending such decision.
For the period ended March 31, 2021, the following Funds entered into reverse repurchase agreements:
Fund | | Number of Days
Outstanding | | | Balance at
March 31, 2021 | | | Average Balance
Outstanding | | | Average
Interest Rate | |
High Yield Fund | | | 140 | | | | $627,198 | | | | $16,775,026 | | | | 0.45 | % |
Core Bond Fund | | | 175 | | | | 14,964,175 | | | | 29,730,411 | | | | 0.16 | % |
| | THE GUGGENHEIM FUNDS SEMI-ANNUAL REPORT | 93 |
NOTES TO FINANCIAL STATEMENTS (Unaudited)(continued) |
The following table presents reverse repurchase agreements that are subject to netting arrangements and offset in the Statements of Assets and Liabilities in conformity with U.S. GAAP:
| | | | | | | | | | | | | | | | Gross Amounts Not Offset
in the Statements of
Assets and Liabilities | | | | | |
Fund | Instrument | | Gross
Amounts of
Recognized
Liabilities | | | Gross
Amounts
Offset in the
Statements
of Assets and
Liabilities | | | Net Amount
of Liabilities
Presented on
the Statements
of Assets and
Liabilities | | | Financial
Instruments | | | Cash
Collateral
Pledged | | | Net
Amount | |
High Yield Fund | Reverse repurchase agreements | | $ | 627,198 | | | $ | — | | | $ | 627,198 | | | $ | (627,198 | ) | | $ | — | | | $ | — | |
Core Bond Fund | Reverse repurchase agreements | | | 14,964,175 | | | | — | | | | 14,964,175 | | | | (14,964,175 | ) | | | — | | | | — | |
As of March 31, 2021, the High Yield Fund and the Core Bond Fund had $627,198 and $14,964,175, respectively, in reverse repurchase agreements outstanding with various counterparties. Details of the reverse repurchase agreements by counterparty are as follows:
Fund | Counterparty | Interest Rate(s) | | Maturity Date(s) | | | Face Value | |
High Yield Fund | BNP Paribas | (0.10%) | Open Maturity | | $ | 627,198 | |
Core Bond Fund | Barclay’s Capital, Inc. | (0.34%) - (0.35%) | 04/01/21 | | $ | 12,405,940 | |
| BMO Capital Markets Corp. | (0.20%) | 04/01/21 | | | 2,558,235 | |
| | | | | | | | | $ | 14,964,175 | |
The following is a summary of the remaining contractual maturities of the reverse repurchase agreements outstanding as of year-end, aggregated by asset class of the related collateral pledged by the Funds:
Fund | | Asset
Type | | | Overnight and
Continuous | | | Up to
30 days | | | Total | |
High Yield Fund | Corporate Bonds | | $ | 627,198 | | | $ | — | | | $ | 627,198 | |
Gross amount of recoginized liabilities for reverse repurchased agreements | | | $ | 627,198 | | | $ | — | | | $ | 627,198 | |
| | | | | | | | | | | | | | | | | |
Core Bond Fund | Treasury Notes | | $ | — | | | $ | 14,964,175 | | | $ | 14,964,175 | |
Gross amount of recoginized liabilities for reverse repurchased agreements | | | $ | — | | | $ | 14,964,175 | | | $ | 14,964,175 | |
Note 7 – Federal Income Tax Information
The Funds intend to comply with the provisions of Subchapter M of the Internal Revenue Code applicable to regulated investment companies and will distribute substantially all taxable net investment income and capital gains sufficient to relieve the Funds from all, or substantially all, federal income, excise and state income taxes. Therefore, no provision for federal or state income tax or federal excise tax is required.
Tax positions taken or expected to be taken in the course of preparing the Funds’ tax returns are evaluated to determine whether the tax positions are “more-likely-than-not” of being sustained by the applicable tax authority. Tax positions not deemed to meet the more-likely-than-not threshold would be recorded as a tax benefit or expense in the current year. Management has analyzed the Funds’ tax positions taken, or to be taken, on U.S. federal income tax returns for all open tax years, and has concluded that no provision for income tax is required in the Funds’ financial statements. The Funds’ U.S. federal income tax returns are subject to examination by the Internal Revenue Service (“IRS”) for a period of three years after they are filed.
94 | THE GUGGENHEIM FUNDS SEMI-ANNUAL REPORT | |
NOTES TO FINANCIAL STATEMENTS (Unaudited)(continued) |
At March 31, 2021, the cost of investments for U.S. federal income tax purposes, the aggregate gross unrealized appreciation for all investments for which there was an excess of value over tax cost, and the aggregate gross unrealized depreciation for all investments for which there was an excess of tax cost over value, were as follows:
Fund | | Tax
Cost | | | Tax
Unrealized
Appreciation | | | Tax
Unrealized
Depreciation | | | Net Tax
Unrealized
Appreciation
(Depreciation) | |
Diversified Income Fund | | $ | 6,561,122 | | | $ | 730,888 | | | $ | (2,292 | ) | | $ | 728,596 | |
High Yield Fund | | | 388,433,374 | | | | 10,925,136 | | | | (6,245,808 | ) | | | 4,679,328 | |
Core Bond Fund | | | 1,622,903,062 | | | | 46,315,814 | | | | (27,518,637 | ) | | | 18,797,177 | |
Municipal Income Fund | | | 72,818,236 | | | | 4,493,473 | | | | (283,705 | ) | | | 4,209,768 | |
Note 8 – Securities Transactions
For the period ended March 31, 2021, the cost of purchases and proceeds from sales of investment securities, excluding government securities, short-term investments and derivatives, were as follows:
Fund | | Purchases | | | Sales | |
Diversified Income Fund | | $ | 1,463,704 | | | $ | 1,305,506 | |
High Yield Fund | | | 182,406,068 | | | | 198,639,866 | |
Core Bond Fund | | | 552,063,356 | | | | 535,439,994 | |
Municipal Income Fund | | | 8,782,276 | | | | 7,065,301 | |
For the period ended March 31, 2021, the cost of purchases and proceeds from sales of government securities were as follows:
Fund | | Purchases | | | Sales | |
Core Bond Fund | | $ | 76,737,341 | | | $ | 84,097,063 | |
The Funds are permitted to purchase or sell securities from or to certain affiliated funds under specified conditions outlined in procedures adopted by the Board. The procedures have been designed to ensure that any purchase or sale of securities by a Fund from or to another fund or portfolio that is or could be considered an affiliate by virtue of having a common investment adviser (or affiliated investment advisers), common trustees and/or common officers complies with Rule 17a-7 of the 1940 Act. Further, as defined under these procedures, each transaction is effected at the current market price to save costs, where permissible. For the period ended March 31, 2021, the Funds engaged in purchases and sales of securities, pursuant to Rule 17a-7 of the 1940 Act, as follows:
Fund | | Purchases | | | Sales | | | Realized
Gain | |
High Yield Fund | | $ | — | | | $ | 91,275,843 | | | $ | 4,673,485 | |
Core Bond Fund | | | 14,925,542 | | | | 55,154,649 | | | | 3,237,486 | |
Note 9 – Unfunded Loan Commitments
Pursuant to the terms of certain loan agreements, certain Funds held unfunded loan commitments as of March 31, 2021. The Funds are obligated to fund these loan commitments at the borrower’s discretion.
| | THE GUGGENHEIM FUNDS SEMI-ANNUAL REPORT | 95 |
NOTES TO FINANCIAL STATEMENTS (Unaudited)(continued) |
The unfunded loan commitments as of March 31, 2021, were as follows:
Fund | Borrower | | Maturity Date | | | Face Amount | | | Value | |
High Yield Fund | | | | | | | | | | | | |
| | Aspect Software, Inc. | | | 07/15/23 | | | $ | 91,145 | | | $ | 706 | |
| | CCC Information Services, Inc. | | | 04/27/22 | | | | 750,000 | | | | 1,072 | |
| | HAH Group Holding Co. LLC | | | 10/29/27 | | | | 145,000 | | | | 2,039 | |
| | National Mentor Holdings, Inc. | | | 02/18/28 | | | | 80,000 | | | | 394 | |
| | Peraton Corp. | | | 02/22/28 | | | | 828,970 | | | | 4,086 | |
| | SCP Eye Care Services LLC | | | 03/11/28 | | | | 188,352 | | | | 236 | |
| | | | | | | | $ | 2,083,467 | | | $ | 8,533 | |
Core Bond Fund | | | | | | | | | | | | |
| | CTL Logistics | | | 08/10/42 | | | $ | 357,219 | | | $ | 25,783 | |
| | HAH Group Holding Co. LLC | | | 10/29/27 | | | | 130,000 | | | | 1,828 | |
| | Service Logic Acquisition, Inc. | | | 10/22/27 | | | | 167,463 | | | | 1,571 | |
| | Southern Veterinary Partners LLC | | | 10/05/27 | | | | 181,818 | | | | 1,692 | |
| | Venture Global Calcasieu Pass LLC | | | 08/19/26 | | | | 877,216 | | | | 48,247 | |
| | | | | | | | $ | 1,713,716 | | | $ | 79,121 | |
Note 10 – Restricted Securities
The securities below are considered illiquid and restricted under guidelines established by the Board:
Fund | Restricted Securities | | Acquisition Date | | | Cost | | | Value | |
High Yield Fund | | | | | | | | | | | | | |
| | Basic Energy Services, Inc. | | | | | | | | | | | | |
| | 10.75% due 10/15/23 | | | 09/25/18 | | | $ | 1,216,967 | | | $ | 245,000 | |
| | Mirabela Nickel Ltd. | | | | | | | | | | | | |
| | 9.50% due 06/24/191 | | | 12/31/13 | | | | 252,369 | | | | 11,125 | |
| | | | | | | | $ | 1,469,336 | | | $ | 256,125 | |
Core Bond Fund | Central Storage Safety Project Trust | | | | | | | | | | | | |
| | 4.82% due 02/01/38 | | | 03/20/18 | | | $ | 1,024,079 | | | $ | 1,063,698 | |
| | Copper River CLO Ltd. | | | | | | | | | | | | |
| | 2007-1A, due 01/20/212 | | | 05/09/14 | | | | 20,019 | | | | 20,622 | |
| | Putnam Structured Product Funding Ltd. | | | | | | | | | | | | |
| | 2003-1A, 1.18% (1 Month USD LIBOR + 1.00%, Rate Floor: 0.00%) due 10/15/383 | | | 06/01/16 | | | | 36,333 | | | | 38,799 | |
| | Station Place Securitization Trust | | | | | | | | | | | | |
| | 2020-WL1, 2.86% (1 Month USD LIBOR + 2.75%, Rate Floor: 0.00%) due 06/25/513 | | | 07/15/20 | | | | 1,000,000 | | | | 1,000,000 | |
| | Turbine Engines Securitization Ltd. | | | | | | | | | | | | |
| | 2013-1A, 5.13% due 12/13/48 | | | 11/27/13 | | | | 414,435 | | | | 333,151 | |
| | | | | | | | $ | 2,494,866 | | | $ | 2,456,270 | |
1 | Security is in default of interest and/or principal obligations. |
2 | Security has no stated coupon. However, it is expected to receive residual cash flow payments on defined deal dates. |
3 | Variable rate security. Rate indicated is the rate effective at March 31, 2021. In some instances, the effective rate is limited by a minimum rate floor or a maximum rate cap established by the issuer. The settlement status of a position may also impact the effective rate indicated. In some cases, a position may be unsettled at period end and may not have a stated effective rate. In instances where multiple underlying reference rates and spread amounts are shown, the effective rate is based on a weighted average. |
96 | THE GUGGENHEIM FUNDS SEMI-ANNUAL REPORT | |
NOTES TO FINANCIAL STATEMENTS (Unaudited)(concluded) |
Note 11 – Line of Credit
The Trust, along with other affiliated trusts, secured a 364-day committed, $1,230,000,000 line of credit from Citibank, N.A., which was in place through October 2, 2020, at which time the line of credit was renewed. A Fund may draw (borrow) from the line of credit as a temporary measure for emergency purposes, to facilitate redemption requests, or for other short-term liquidity purposes consistent with the Fund’s investment objective and program. For example, it may be advantageous for the Fund to borrow money rather than sell existing portfolio positions to meet redemption requests. Fees related to borrowings, if any, vary under this arrangement between the greater of Citibank’s “base rate”, LIBOR plus 1%, or the federal funds rate plus 1/2 of 1%.
The commitment fee that may be paid by the Funds is at an annualized rate of 0.15% of the average daily amount of their allocated unused commitment amount. The commitment fee amount is allocated to the individual Funds based on the respective net assets of each participating Fund and is referenced in the Statement of Operations under “Line of credit fees”. The Funds did not have any borrowings under this agreement as of and for the period ended March 31, 2021.
Note 12 – COVID-19
The global ongoing crisis caused by the outbreak of COVID-19 and the current recovery underway is causing disruption to consumer demand and economic output and supply chains. There are still travel restrictions and quarantines, and adverse impacts on local and global economies. Investors should be aware that in light of the current uncertainty, volatility and distress in economies, financial markets, and labor and public health conditions around the world, the Funds’ investments and a shareholder’s investment in a Fund are subject to sudden and substantial losses, increased volatility and other adverse events. Firms through which investors invest with the Funds, the Funds, their service providers, the markets in which they invest and market intermediaries are also impacted by quarantines and similar measures intended to respond to and contain the ongoing pandemic, which can obstruct their functioning and subject them to heightened operational and other risks.
Note 13 – Subsequent Events
Investment Grade Bond Fund Name Change
On April 23, 2021, the name of the Fund changed to Guggenheim Core Bond Fund. This name change did not result in changes to the Fund’s investment objective, principal investment strategies or principal risks.
The Funds evaluated subsequent events through the date the financial statements were available for issue and determined there were no material events other than the one disclosed above, that would require adjustment to or disclosure in the Funds’ financial statements.
| | THE GUGGENHEIM FUNDS SEMI-ANNUAL REPORT | 97 |
OTHER INFORMATION (Unaudited) |
Delivery of Shareholder Reports
Paper copies of the Fund’s annual and semi-annual shareholder reports are not sent by mail, unless you specifically request paper copies of the reports from a fund or from your financial intermediary. Instead, the reports are made available on a website, and you are notified by mail each time a report is posted and provided with a website link to access the report.
You may elect to receive all future shareholder reports in paper free of charge. If you hold shares of a fund directly, you can inform the Fund that you wish to receive paper copies of reports by calling 800.820.0888. If you hold shares of a fund through a financial intermediary, please contact the financial intermediary to make this election. Your election to receive reports in paper may apply to all Guggenheim Funds in which you are invested and may apply to all Guggenheim funds held with your financial intermediary.
Proxy Voting Information
A description of the policies and procedures that the Trust uses to determine how to vote proxies relating to securities held in the Fund’s portfolio is available, without charge and upon request, by calling 800.820.0888. This information is also available from the EDGAR database on the SEC’s website at https://www.sec.gov.
Information regarding how the Fund voted proxies relating to portfolio securities during the most recent 12-month period ended June 30 is available without charge, upon request, by calling 800.820.0888. This information is also available from the EDGAR database on the SEC’s website at https://www.sec.gov.
Sector Classification
Information in the Schedule of Investments is categorized by sectors using sector-level Classifications defined by the Bloomberg Industry Classification System, a widely recognized industry classification system provider. The Fund’s registration statement has investment policies relating to concentration in specific sectors/industries. For purposes of these investment policies, the Fund usually classifies sectors/industries based on industry-level Classifications used by widely recognized industry classification system providers such as Bloomberg Industry Classification System, Global Industry Classification Standards and Barclays Global Classification Scheme.
Quarterly Portfolio Schedules Information
The Trust files its complete schedule of portfolio holdings with the SEC for the first and third quarters of each fiscal year as an exhibit to its reports on Form N-PORT, and for reporting periods ended prior to March 31, 2019, filed such information on Form N-Q. The Fund’s Forms N-PORT and N-Q are available on the SEC’s website at https://www.sec.gov. Copies of the portfolio holdings are also available to shareholders, without charge and upon request, by calling 800.820.0888.
98 | THE GUGGENHEIM FUNDS SEMI-ANNUAL REPORT | |
INFORMATION ON BOARD OF TRUSTEES AND OFFICERS (Unaudited) |
A Board of Trustees oversees the Trust, as well as other trusts of GI, in which its members have no stated term of service, and continue to serve after election until resignation. The Statement of Additional Information includes further information about Fund Trustees and Officers, and can be obtained without charge by visiting guggenheiminvestments.com or by calling 800.820.0888.
Name, Address*
and Year of Birth | Position(s)
Held with
Trust | Term of Office
and Length of
Time Served** | Principal Occupation(s)
During Past Five Years | Number of
Portfolios
in Fund
Complex
Overseen | Other
Directorships Held
by Trustees*** |
INDEPENDENT TRUSTEES | | | |
Randall C. Barnes (1951) | Trustee and Chair of the Valuation Oversight Committee | Since 2014 (Trustee) Since 2020 (Chair of the Valuation Oversight Committee) | Current: Private Investor (2001-present). Former: Senior Vice President and Treasurer, PepsiCo, Inc. (1993-1997); President, Pizza Hut International (1991-1993); Senior Vice President, Strategic Planning and New Business Development, PepsiCo, Inc. (1987-1990). | 157 | Current: Purpose Investments Funds (2013-present). Former: Managed Duration Investment Grade Municipal Fund (2006-2016). |
Angela Brock-Kyle (1959) | Trustee | Since 2019 | Current: Founder and Chief Executive Officer, B.O.A.R.D.S. (2013-present). Former: Senior Leader, TIAA (1987-2012). | 156 | Current: Bowhead Insurance GP, LLC (2020-present); Hunt Companies, Inc. (2019-present). Former: Infinity Property & Casualty Corp. (2014-2018). |
Thomas F. Lydon, Jr. (1960) | Trustee and Chair of the Contracts Review Committee | Since 2019 (Trustee) Since 2020 (Chair of the Contracts Review Committee) | Current: President, Global Trends Investments (1996-present); Co-Chief Executive Officer, ETF Flows, LLC (2019-present); Chief Executive Officer, Lydon Media (2016-present). | 156 | Current: US Global Investors (GROW) (1995-present). Former: Harvest Volatility Edge Trust (3) (2017-2019). |
Ronald A. Nyberg (1953) | Trustee and Chair of the Nominating and Governance Committee | Since 2014 | Current: Of Counsel, Momkus LLP (2016-present). Former: Partner, Nyberg & Cassioppi, LLC (2000-2016); Executive Vice President, General Counsel, and Corporate Secretary, Van Kampen Investments (1982-1999). | 157 | Current: PPM Funds (2) (2018-present); Edward-Elmhurst Healthcare System (2012-present). Former: Western Asset Inflation-Linked Opportunities & Income Fund (2004-2020); Western Asset Inflation-Linked Income Fund (2003-2020); Managed Duration Investment Grade Municipal Fund (2003-2016). |
| | THE GUGGENHEIM FUNDS SEMI-ANNUAL REPORT | 99 |
INFORMATION ON BOARD OF TRUSTEES AND OFFICERS (Unaudited)(continued) |
Name, Address*
and Year of Birth | Position(s)
Held with
Trust | Term of Office
and Length of
Time Served** | Principal Occupation(s)
During Past Five Years | Number of
Portfolios
in Fund
Complex
Overseen | Other
Directorships Held
by Trustees*** |
INDEPENDENT TRUSTEES - concluded | | |
Sandra G. Sponem (1958) | Trustee and Chair of the Audit Committee | Since 2019 (Trustee) Since 2020 (Chair of the Audit Committee) | Current: Retired. Former: Senior Vice President and Chief Financial Officer, M.A. Mortenson-Companies, Inc. (2007-2017). | 156 | Current: SPDR Series Trust (81) (2018-present); SPDR Index Shares Funds (30) (2018-present); SSGA Active Trust (14) (2018-present). Former: SSGA Master Trust (1) (2018-2020). |
Ronald E. Toupin, Jr. (1958) | Trustee, Chair of the Board and Chair of the Executive Committee | Since 2014 | Current: Portfolio Consultant (2010-present); Member, Governing Council, Independent Directors Council (2013-present); Governor, Board of Governors, Investment Company Institute (2018-present). Former: Member, Executive Committee, Independent Directors Council (2016-2018); Vice President, Manager and Portfolio Manager, Nuveen Asset Management (1998-1999); Vice President, Nuveen Investment Advisory Corp. (1992-1999); Vice President and Manager, Nuveen Unit Investment Trusts (1991-1999); and Assistant Vice President and Portfolio Manager, Nuveen Unit Investment Trusts (1988-1999), each of John Nuveen & Co., Inc. (1982-1999). | 156 | Former: Western Asset Inflation-Linked Opportunities & Income Fund (2004-2020); Western Asset Inflation-Linked Income Fund (2003-2020); Managed Duration Investment Grade Municipal Fund (2003-2016). |
100 | THE GUGGENHEIM FUNDS SEMI-ANNUAL REPORT | |
INFORMATION ON BOARD OF TRUSTEES AND OFFICERS (Unaudited)(continued) |
Name, Address*
and Year of Birth | Position(s)
Held with
Trust | Term of Office
and Length of
Time Served** | Principal Occupation(s)
During Past Five Years | Number of
Portfolios
in Fund
Complex
Overseen | Other
Directorships Held
by Trustees*** |
INTERESTED TRUSTEE | | | | |
Amy J. Lee**** (1961) | Trustee, Vice President and Chief Legal Officer | Since 2018 (Trustee) Since 2014 (Chief Legal Officer) Since 2007 (Vice President) | Current: Interested Trustee, certain other funds in the Fund Complex (2018-present); Chief Legal Officer, certain other funds in the Fund Complex (2014-present); Vice President, certain other funds in the Fund Complex (2007-present); Senior Managing Director, Guggenheim Investments (2012-present). Former: President and Chief Executive Officer, certain other funds in the Fund Complex (2017-2019); Vice President, Associate General Counsel and Assistant Secretary, Security Benefit Life Insurance Company and Security Benefit Corporation (2004-2012). | 156 | None. |
* | The business address of each Trustee is c/o Guggenheim Investments, 227 West Monroe Street, Chicago, Illinois 60606. |
** | Each Trustee serves an indefinite term, until his or her successor is elected and qualified. Time served includes time served in the respective position for the Predecessor Corporation. |
*** | Each Trustee also serves on the Boards of Trustees of Guggenheim Funds Trust, Guggenheim Variable Funds Trust, Guggenheim Strategy Funds Trust, Fiduciary/Claymore Energy Infrastructure Fund, Guggenheim Taxable Municipal Bond & Investment Grade Debt Trust, Guggenheim Strategic Opportunities Fund, Guggenheim Enhanced Equity Income Fund, Guggenheim Energy & Income Fund, Guggenheim Credit Allocation Fund, Rydex Series Funds, Rydex Dynamic Funds, Rydex Variable Trust and Transparent Value Trust. Messrs. Barnes and Nyberg also serve on the Board of Trustees of Advent Convertible & Income Fund. |
**** | This Trustee is deemed to be an “interested person” of the Fund under the 1940 Act by reason of her position with the Fund’s Investment Manager and/or the parent of the Investment Manager. |
| | THE GUGGENHEIM FUNDS SEMI-ANNUAL REPORT | 101 |
INFORMATION ON BOARD OF TRUSTEES AND OFFICERS (Unaudited)(continued) |
Name, Address*
and Year of Birth | Position(s)
Held with
Trust | Term of Office
and Length of
Time Served** | Principal Occupation(s)
During Past Five Years |
OFFICERS | | | |
Brian E. Binder (1972) | President and Chief Executive Officer | Since 2018 | Current: President and Chief Executive Officer, certain other funds in the Fund Complex (2018-present); President, Chief Executive Officer and Chairman of the Board of Managers, Guggenheim Funds Investment Advisors, LLC (2018-present); President and Chief Executive Officer, Security Investors, LLC (2018-present); Board Member of Guggenheim Partners Fund Management (Europe) Limited (2018-present); Senior Managing Director and Chief Administrative Officer, Guggenheim Investments (2018-present). Former: Managing Director and President, Deutsche Funds, and Head of US Product, Trading and Fund Administration, Deutsche Asset Management (2013-2018); Managing Director, Head of Business Management and Consulting, Invesco Ltd. (2010-2012). |
James M. Howley (1972) | Assistant Treasurer | Since 2014 | Current: Managing Director, Guggenheim Investments (2004-present); Assistant Treasurer, certain other funds in the Fund Complex (2006-present). Former: Manager, Mutual Fund Administration of Van Kampen Investments, Inc. (1996-2004). |
Mark E. Mathiasen (1978) | Secretary | Since 2014 | Current: Secretary, certain other funds in the Fund Complex (2007-present); Managing Director, Guggenheim Investments (2007-present). |
Glenn McWhinnie (1969) | Assistant Treasurer | Since 2016 | Current: Vice President, Guggenheim Investments (2009-present); Assistant Treasurer, certain other funds in the Fund Complex (2016-present). |
Michael P. Megaris (1984) | Assistant Secretary | Since 2014 | Current: Assistant Secretary, certain other funds in the Fund Complex (2014-present); Director, Guggenheim Investments (2012-present). |
Elisabeth Miller (1968) | Chief Compliance Officer | Since 2012 | Current: Chief Compliance Officer, certain other funds in the Fund Complex (2012-present); Senior Managing Director, Guggenheim Investments (2012-present). Vice President, Guggenheim Funds Distributors, LLC (2014-present). Former: Chief Compliance Officer, Security Investors, LLC and Guggenheim Funds Investment Advisors, LLC (2012-2018); Chief Compliance Officer, Guggenheim Distributors, LLC (2009-2014); Senior Manager, Security Investors, LLC (2004-2014); Senior Manager, Guggenheim Distributors, LLC (2004-2014). |
Margaux Misantone (1978) | AML Officer | Since 2017 | Current: Chief Compliance Officer, Security Investors, LLC and Guggenheim Funds Investment Advisors, LLC (2018-present); AML Officer, Security Investors, LLC and certain other funds in the Fund Complex (2017-present); Managing Director, Guggenheim Investments (2015-present). Former: Assistant Chief Compliance Officer, Security Investors, LLC and Guggenheim Funds Investments Advisors, LLC (2015-2018). |
102 | THE GUGGENHEIM FUNDS SEMI-ANNUAL REPORT | |
INFORMATION ON BOARD OF TRUSTEES AND OFFICERS (Unaudited)(concluded) |
Name, Address*
and Year of Birth | Position(s)
Held with
Trust | Term of Office
and Length of
Time Served** | Principal Occupation(s)
During Past Five Years |
OFFICERS - concluded | |
Kimberly J. Scott (1974) | Assistant Treasurer | Since 2014 | Current: Director, Guggenheim Investments (2012-present); Assistant Treasurer, certain other funds in the Fund Complex (2012-present). Former: Financial Reporting Manager, Invesco, Ltd. (2010-2011); Vice President/Assistant Treasurer, Mutual Fund Administration for Van Kampen Investments, Inc./Morgan Stanley Investment Management (2009-2010); Manager of Mutual Fund Administration, Van Kampen Investments, Inc./Morgan Stanley Investment Management (2005-2009). |
Bryan Stone (1979) | Vice President | Since 2014 | Current: Vice President, certain other funds in the Fund Complex (2014-present); Managing Director, Guggenheim Investments (2013-present). Former: Senior Vice President, Neuberger Berman Group LLC (2009-2013); Vice President, Morgan Stanley (2002-2009). |
John L. Sullivan (1955) | Chief Financial Officer, Chief Accounting Officer and Treasurer | Since 2014 | Current: Chief Financial Officer, Chief Accounting Officer and Treasurer, certain other funds in the Fund Complex (2010-present); Senior Managing Director, Guggenheim Investments (2010-present). Former: Managing Director and Chief Compliance Officer, each of the funds in the Van Kampen Investments fund complex (2004-2010); Managing Director and Head of Fund Accounting and Administration, Morgan Stanley Investment Management (2002-2004); Chief Financial Officer and Treasurer, Van Kampen Funds (1996-2004). |
Jon Szafran (1989) | Assistant Treasurer | Since 2017 | Current: Vice President, Guggenheim Investments (2017-present); Assistant Treasurer, certain other funds in the Fund Complex (2017-present). Former: Assistant Treasurer of Henderson Global Funds and Manager of US Fund Administration, Henderson Global Investors (North America) Inc. (“HGINA”), (2017); Senior Analyst of US Fund Administration, HGINA (2014–2017); Senior Associate of Fund Administration, Cortland Capital Market Services, LLC (2013-2014); Experienced Associate, PricewaterhouseCoopers LLP (2012-2013). |
* | The business address of each officer is c/o Guggenheim Investments, 227 West Monroe Street, Chicago, Illinois 60606. |
** | Each officer serves an indefinite term, until his or her successor is duly elected and qualified. |
| | THE GUGGENHEIM FUNDS SEMI-ANNUAL REPORT | 103 |
GUGGENHEIM INVESTMENTS PRIVACY NOTICE (Unaudited) |
Who We Are
This Privacy Notice describes the data protection practices of Guggenheim Investments. Guggenheim Investments as used herein refers to the affiliated investment management businesses of Guggenheim Partners, LLC: Guggenheim Funds Investment Advisors, LLC, Guggenheim Partners Investment Management, LLC, Guggenheim Funds Distributors, LLC, Security Investors, LLC, Guggenheim Investment Advisors (Europe) Limited, Guggenheim Real Estate, LLC, GS Gamma Advisors, LLC, Guggenheim Partners India Management, LLC, Guggenheim Partners Europe Limited, as well as the funds in the Guggenheim Funds complex (the “Funds”) (“Guggenheim Investments,” “we,” “us,” or “our”).
Guggenheim Partners Investment Management Holdings, LLC, located at 330 Madison Avenue, New York, New York 10017 is the data controller for your information. The affiliates who are also controllers of certain of your information are: Guggenheim Investment Advisors (Europe) Limited, Guggenheim Partners Europe Limited, Guggenheim Partners, LLC, Guggenheim Funds Investment Advisors, LLC, Guggenheim Partners Investment Management, LLC, Guggenheim Funds Distributors, LLC and Security Investors, LLC, as well as the Funds.
Our Commitment to You
Guggenheim Investments considers your privacy our utmost concern. When you become our client or investor, you entrust us with not only your hard-earned money but also with your personal and financial information. Because we have access to your private information, we hold ourselves to the highest standards in its safekeeping and use. We strictly limit how we share your information with others, whether you are a current or former Guggenheim Investments client or investor.
The Information We Collect About You
We collect certain nonpublic personal information about you from information you provide on applications, other forms, our website, and/or from third parties including investment advisors. This information includes Social Security or other tax identification number, assets, income, tax information, retirement and estate plan information, transaction history, account balance, payment history, bank account information, marital status, family relationships, information that we collect on our website through the use of “cookies,” and other personal information that you or others provide to us. We may also collect such information through your inquiries by mail, e-mail or telephone. We may also collect customer due diligence information, as required by applicable law and regulation, through third party service providers.
How We Handle Your Personal Information
The legal basis for using your information as set out in this Privacy Notice is as follows: (a) use of your personal data is necessary to perform our obligations under any contract with you (such as a contract for us to provide financial services to you); or (b) where use of your personal data is not necessary for performance of a contract, use of your personal data is necessary for our legitimate interests or the legitimate interests of others (for example, to enforce the legal terms governing our services, operate and market our website and other services we offer, ensure safe environments for our personnel and others, make and receive payments, prevent fraud and to know the customer to whom we are providing the services). Some processing is done to comply with applicable law.
In addition to the specific uses described above, we also use your information in the following manner:
| | ● | We use your information in connection with servicing your accounts. |
| | ● | We use information to respond to your requests or questions. For example, we might use your information to respond to your customer feedback. |
| | ● | We use information to improve our products and services. We may use your information to make our website and products better. We may use your information to customize your experience with us. |
| | ● | We use information for security purposes. We may use your information to protect our company and our customers. |
| | ● | We use information to communicate with you. For example, we will communicate with you about your account or our relationship. We may contact you about your feedback. We might also contact you about this Privacy Notice. We may also enroll you in our email newsletter. |
104 | THE GUGGENHEIM FUNDS SEMI-ANNUAL REPORT | |
GUGGENHEIM INVESTMENTS PRIVACY NOTICE (Unaudited)(continued) |
| | ● | We use information as otherwise permitted by law, as we may notify you. |
| | ● | Aggregate/Anonymous Data. We may aggregate and/or anonymize any information collected through the website so that such information can no longer be linked to you or your device (“Aggregate/Anonymous Information”). We may use Aggregate/Anonymous Information for any purpose, including without limitation for research and marketing purposes, and may also share such data with any third parties, including advertisers, promotional partners, and sponsors. |
We do not sell information about current or former clients or their accounts to third parties. Nor do we share this information, except when necessary to complete transactions at your request, to make you aware of investment products and services that we or our affiliates offer, or as permitted or required by law.
We provide information about you to companies and individuals not affiliated with Guggenheim Investments to complete certain transactions or account changes, or to perform services for us related to your account. For example, if you ask to transfer assets from another financial institution to Guggenheim Investments, we must provide certain information about you to that company to complete the transaction. We provide the third party with only the information necessary to carry out its responsibilities and only for that purpose. And we require these third parties to treat your private information with the same high degree of confidentiality that we do. To alert you to other Guggenheim Investments products and services, we share your information within our family of affiliated companies. You may limit our sharing with affiliated companies as set out below. We may also share information with any successor to all or part of our business, or in connection with steps leading up to a merger or acquisition. For example, if part of our business was sold we may give customer information as part of that transaction. We may also share information about you with your consent.
We will release information about you if you direct us to do so, if we are compelled by law to do so, or in other circumstances as permitted by law (for example, to protect your account from fraud).
If you close your account(s) or become an inactive client or investor, we will continue to adhere to the privacy policies and practices described in this notice.
Opt-Out Provisions and Your Data Choices
The law allows you to “opt out” of certain kinds of information sharing with third parties. We do not share personal information about you with any third parties that triggers this opt-out right. This means YOU ARE ALREADY OPTED OUT.
When you are no longer our client or investor, we continue to share your information as described in this notice, and you may contact us at any time to limit our sharing by sending an email to CorporateDataPrivacy@GuggenheimPartners.com.
European Union Data Subjects and certain others: In addition to the choices set forth above, residents of the European Union and certain other jurisdictions have certain rights to (1) request access to or rectification or deletion of information we collect about them, (2) request a restriction on the processing of their information, (3) object to the processing of their information, or (4) request the portability of certain information. To exercise these or other rights, please contact us using the contact information below. We will consider all requests and provide our response within the time period stated by applicable law. Please note, however, that certain information may be exempt from such requests in some circumstances, which may include if we need to keep processing your information for our legitimate interests or to comply with a legal obligation. We may request you provide us with information necessary to confirm your identity before responding to your request.
Residents of France and certain other jurisdictions may also provide us with instructions regarding the manner in which we may continue to store, erase and share your information after your death, and where applicable, the person you have designated to exercise these rights after your death.
| | THE GUGGENHEIM FUNDS SEMI-ANNUAL REPORT | 105 |
GUGGENHEIM INVESTMENTS PRIVACY NOTICE (Unaudited)(concluded) |
How We Protect Privacy Online
We take steps to protect your privacy when you use our web site – www.guggenheiminvestments.com – by using secure forms of online communication, including encryption technology, Secure Socket Layer (SSL) protocol, firewalls and user names and passwords. These safeguards vary based on the sensitivity of the information that we collect and store. However, we cannot and do not guarantee that these measures will prevent every unauthorized attempt to access, use, or disclose your information since despite our efforts, no Internet and/or other electronic transmissions can be completely secure. Our web site uses “http cookies”—tiny pieces of information that we ask your browser to store. We use cookies for session management and security features on the Guggenheim Investments web site. We do not use them to pull data from your hard drive, to learn your e-mail address, or to view data in cookies created by other web sites. We will not share the information in our cookies or give others access to it. See the legal information area on our web site for more details about web site security and privacy features.
How We Safeguard Your Personal Information and Data Retention
We restrict access to nonpublic personal information about you to our employees and in some cases to third parties (for example, the service providers described above) as permitted by law. We maintain strict physical, electronic and procedural safeguards that comply with federal standards to guard your nonpublic personal information.
We keep your information for no longer than necessary for the purposes for which it is processed. The length of time for which we retain information depends on the purposes for which we collected and use it and/or as required to comply with applicable laws. Information may persist in copies made for backup and business continuity purposes for additional time.
International Visitors
If you are not a resident of the United States, please be aware that your information may be transferred to, stored and processed in the United States where our servers are located and our databases are operated. The data protection and other laws of the United States and other countries might not be as comprehensive as those in your country.
In such cases, we ensure that a legal basis for such a transfer exists and that adequate protection is provided as required by applicable law, for example, by using standard contractual clauses or by transferring your data to a jurisdiction that has obtained an adequacy finding. Individuals whose data may be transferred on the basis of standard contractual clauses may contact us as described below.
We’ll Keep You Informed
If you have any questions or concerns about how we treat your personal data, we encourage you to consult with us first. You may also contact the relevant supervisory authority.
We reserve the right to modify this policy at any time and will inform you promptly of material changes. You may access our privacy policy from our web site at www.guggenheiminvestments.com. Should you have any questions regarding our privacy policy, contact us by email at CorporateDataPrivacy@GuggenheimPartners.com.
106 | THE GUGGENHEIM FUNDS SEMI-ANNUAL REPORT | |
This page intentionally left blank.
This page intentionally left blank.
This page intentionally left blank.
3.31.2021
Guggenheim Funds Semi-Annual Report
Guggenheim SMid Cap Value Fund | | |
GuggenheimInvestments.com | SBMCV-SEMI-0321x0921 |

| | |
DEAR SHAREHOLDER | 2 |
ECONOMIC AND MARKET OVERVIEW | 3 |
ABOUT SHAREHOLDERS’ FUND EXPENSES | 5 |
GUGGENHEIM SMID CAP VALUE FUND | 8 |
NOTES TO FINANCIAL STATEMENTS | 23 |
OTHER INFORMATION | 32 |
INFORMATION ON BOARD OF TRUSTEES AND OFFICERS | 33 |
GUGGENHEIM INVESTMENTS PRIVACY NOTICE | 40 |
| | THE GUGGENHEIM FUNDS SEMI-ANNUAL REPORT | 1 |
Dear Shareholder:
Security Investors, LLC (the “Investment Adviser”) is pleased to present the shareholder report for Guggenheim SMid Cap Value Fund (the “Fund” for the semi-annual period ended March 31, 2021.
The Investment Adviser is part of Guggenheim Investments, which represents the investment management businesses of Guggenheim Partners, LLC (“Guggenheim”), a global, diversified financial services firm.
Guggenheim Funds Distributors, LLC is the distributor of the Funds. Guggenheim Funds Distributors, LLC is affiliated with Guggenheim and the Investment Adviser.
We encourage you to read the Economic and Market Overview section of the report, which follows this letter.
We are committed to providing innovative investment solutions and appreciate the trust you place in us.
Sincerely,
Security Investors, LLC
April 30, 2021
Read a prospectus and summary prospectus (if available) carefully before investing. It contains the investment objectives, risks, charges, expenses and other information, which should be considered carefully before investing. Obtain a prospectus and summary prospectus (if available) at guggenheiminvestments.com or call 800.820.0888.
This material is not intended as a recommendation or as investment advice of any kind, including in connection with rollovers, transfers, and distributions. Such material is not provided in a fiduciary capacity, may not be relied upon for or in connection with the making of investment decisions, and does not constitute a solicitation of an offer to buy or sell securities. All content has been provided for informational or educational purposes only and is not intended to be and should not be construed as legal or tax advice and/or a legal opinion. Always consult a financial, tax and/or legal professional regarding your specific situation.
COVID-19. The global ongoing crisis caused by the outbreak of COVID-19 and the current recovery underway is causing disruption to consumer demand and economic output and supply chains. There are still travel restrictions and quarantines, and adverse impacts on local and global economies. Investors should be aware that in light of the current uncertainty, volatility and distress in economies, financial markets, and labor and public health conditions around the world, the Funds’ investments and a shareholder’s investment in a Fund are subject to investment risk, including the possible loss of the entire principal amount invested. Firms through which investors invest with the Funds, the Funds, their service providers, the markets in which they invest and market intermediaries are also impacted by quarantines and similar measures intended to respond to and contain the ongoing pandemic, which can obstruct their functioning and subject them to heightened operational and other risks.
The SMid Cap Value Fund may not be suitable for all investors. ● An investment in the Fund will fluctuate and is subject to investment risks, which means investors could lose money. ● The intrinsic value of the underlying stocks may never be realized, or the stock may decline in value. ● Investments in small- and/or mid-sized company securities may present additional risks such as less predictable earnings, higher volatility and less liquidity than larger, more established companies. ● Please read the prospectus for more detailed information regarding these and other risks.
2 | THE GUGGENHEIM FUNDS SEMI-ANNUAL REPORT | |
ECONOMIC AND MARKET OVERVIEW (Unaudited) | March 31, 2021 |
For the six-month period ended March 31, 2021, the Standard & Poor’s 500® (“S&P 500®”) Index returned 19.07% as the equity market continued to climb after the sharp selloff following the outbreak of COVID-19 in March 2020. This increase was in spite of ongoing personal and economic hardships imposed by COVID-19, highlighting the crucial role of policy support in the form of monetary and fiscal stimulus, which has succeeded in averting a lengthy recession in the U.S. These policy initiatives, particularly on the monetary side, increased market liquidity and lowered borrowing rates, reassuring equity investors that the Federal Reserve (the “Fed”) would do everything in its power to maintain market stability.
Our 2021 U.S. economic growth forecast increased during the first quarter of 2021 from an annualized 5.5% to over 7%, factoring in more fiscal stimulus than previously anticipated. This forecast captures the effect of stimulus representing roughly 11% of 2020–2021 gross domestic product (“GDP”), versus the previous calculation of about 8%. We see strength in the consumer sector and in housing activity. In addition, U.S. vaccinations for COVID-19 continue to accelerate, nearing 3 million doses per day by the end of the first quarter. More than 213 million doses have been administered in the U.S. so far, and about 35% of the U.S. population has been fully vaccinated. The U.S. is seeing the best-case scenario unfold in its vaccine rollout, but other countries have not been as fortunate.
Europe’s vaccine rollout hit a major speedbump during the first quarter when questions surrounding the safety of the AstraZeneca vaccine led several major European countries to temporarily suspend distribution. Safety concerns, coupled with supply constraints, meant that less than 10% of the populations of Germany, France, and Italy had been vaccinated by the end of the first quarter, well under the pace needed to reach 70% inoculated by summer. Any delay in ending the pandemic on a global scale has implications for other countries too, including the U.S., where travel and hospitality workers represent a large share of the unemployed.
Despite vaccination delays in Europe and its implications abroad, we saw meaningful improvement in the domestic labor market during the first quarter as states moved forward with business re-openings. Seasonally adjusted initial jobless claims fell by 97,000 to 684,000 in the week ending March 20, 2021, the lowest level since the pandemic began, before seeing an uptick the following week to 719,000. We saw more positive news across the board in the March payroll report with 916,000 jobs added, and with 156,000 more from revisions. Standing in the way of additional labor market gains are local government restrictions on certain sectors, although easing of these restrictions is expected by summer.
Economic developments drove a sharp increase in U.S. Treasury yields. The market pulled forward expectations of the next Fed rate hike from December 2023 to December 2022, while repricing the long-run terminal Fed funds rate estimate to 2.25% from just 0.55% last August. We do not expect the Fed to raise interest rates as early as the market is anticipating, even though we expect strong GDP growth in coming years.
Year-over-year inflation measures will rise over the next several months due to base effects, which may be compounded by supply chain disruptions in the goods sector and potential capacity constraints for certain services. However, these factors could prove to be short-lived, with base
| | THE GUGGENHEIM FUNDS SEMI-ANNUAL REPORT | 3 |
ECONOMIC AND MARKET OVERVIEW (Unaudited)(concluded) | March 31, 2021 |
effects set to dampen inflation starting in the summer months. Moreover, the Fed is focused on generating sustainably higher inflation. Even if core inflation rises above the Fed’s 2% target in 2021, the Fed’s focus is on a long-term average of 2%. With years of shortfalls to make up, and the Fed now targeting labor market disparities as part of an expanded definition of full employment, we expect policymakers to remain resolutely patient. Any tapering of asset purchases will likely be deferred until later in 2022, with the first rate hike likely to come sometime after that.
Easy financial conditions and low rates will likely support credit over the next few years. With market optimism pulling forward rate hike expectations and causing bond yields to rise, we view this as an opportunity to add incremental yield to portfolios.
For the six-month period ended March 31, 2021, the S&P 500® Index* returned, as noted, 19.07%. The MSCI Europe-Australasia-Far East (“EAFE”) Index* returned 20.08%. The return of the MSCI Emerging Markets Index* was 22.43%.
In the bond market, the Bloomberg Barclays U.S. Aggregate Bond Index* posted a -2.73% return for the six-month period, while the Bloomberg Barclays U.S. Corporate High Yield Index* returned 7.36%. The return of the ICE Bank of America (“BofA”) Merrill Lynch 3-Month U.S. Treasury Bill Index* was 0.06% for the six-month period.
The opinions and forecasts expressed may not actually come to pass. This information is subject to change at any time, based on market and other conditions, and should not be construed as a recommendation of any specific security or strategy.
*Index Definitions:
The following indices are referenced throughout this report. Indices are unmanaged and not available for direct investment. Index performance does not reflect transaction costs, fees, or expenses.
Bloomberg Barclays U.S. Aggregate Bond Index is a broad-based flagship benchmark that measures the investment grade, U.S. dollar-denominated, fixed-rate taxable bond market, including U.S. Treasuries, government-related and corporate securities, mortgage-backed securities or “MBS” (agency fixed-rate and hybrid adjustable-rate mortgage, or “ARM”, pass-throughs), asset-backed securities (“ABS”), and commercial mortgage-backed securities (“CMBS”) (agency and non-agency).
Bloomberg Barclays U.S. Corporate High Yield Index measures the U.S. dollar-denominated, high yield, fixed-rate corporate bond market. Securities are classified as high yield if the middle rating of Moody’s, Fitch, and S&P is Ba1/BB +/BB + or below.
ICE BofA Merrill Lynch 3-Month U.S. Treasury Bill Index is an unmanaged market Index of U.S. Treasury securities maturing in 90 days that assumes reinvestment of all income.
MSCI EAFE Index is a free float-adjusted market capitalization index that is designed to measure the equity market performance of developed markets, excluding the U.S. & Canada.
MSCI Emerging Markets Index is a free float-adjusted market capitalization weighted index that is designed to measure equity market performance in the global emerging markets.
Russell 2500® Value Index measures the performance of the small-to mid-cap value segment of the U.S. equity universe. It includes those Russell 2500 companies with lower price-to-book ratios and lower forecasted growth values.
S&P 500® is a broad-based index, the performance of which is based on the performance of 500 widely held common stocks chosen for market size, liquidity, and industry group representation.
4 | THE GUGGENHEIM FUNDS SEMI-ANNUAL REPORT | |
ABOUT SHAREHOLDERS’ FUND EXPENSES (Unaudited) |
All mutual funds have operating expenses, and it is important for our shareholders to understand the impact of costs on their investments. Shareholders of a fund incur two types of costs: (i) transaction costs, including sales charges (loads) on purchase payments, reinvested dividends, other distributions, and exchange fees, and (ii) ongoing costs, including management fees, administrative services, and shareholder reports, among others. These ongoing costs, or operating expenses, are deducted from a fund’s gross income and reduce the investment return of the fund.
A fund’s expenses are expressed as a percentage of its average net assets, which is known as the expense ratio. The following examples are intended to help investors understand the ongoing costs (in dollars) of investing in a fund and to compare these costs with the ongoing costs of investing in other mutual funds.
The examples are based on an investment of $1,000 made at the beginning of the period and held for the entire six-month period beginning September 30, 2020 and ending March 31, 2021.
The following tables illustrate the Fund’s costs in two ways:
Table 1. Based on actual Fund return: This section helps investors estimate the actual expenses paid over the period. The “Ending Account Value” shown is derived from the Fund’s actual return, and the fifth column shows the dollar amount that would have been paid by an investor who started with $1,000 in the Fund. Investors may use the information here, together with the amount invested, to estimate the expenses paid over the period. Simply divide the Fund’s account value by $1,000 (for example, an $8,600 account value divided by $1,000 = 8.6), then multiply the result by the number provided under the heading “Expenses Paid During Period.”
Table 2. Based on hypothetical 5% return: This section is intended to help investors compare a fund’s cost with those of other mutual funds. The table provides information about hypothetical account values and hypothetical expenses based on the Fund’s actual expense ratio and an assumed rate of return of 5% per year before expenses, which is not the Fund’s actual return. The hypothetical account values and expenses may not be used to estimate the actual ending account balance or expenses paid during the period. The example is useful in making comparisons because the U.S. Securities and Exchange Commission (the “SEC”) requires all mutual funds to calculate expenses based on the 5% return. Investors can assess a Fund’s costs by comparing this hypothetical example with the hypothetical examples that appear in shareholder reports of other funds.
The calculations illustrated above assume no shares were bought or sold during the period. Actual costs may have been higher or lower, depending on the amount of investment and the timing of any purchases or redemptions.
| | THE GUGGENHEIM FUNDS SEMI-ANNUAL REPORT | 5 |
ABOUT SHAREHOLDERS’ FUND EXPENSES (Unaudited)(continued) |
Please note that the expenses shown in the table are meant to highlight your ongoing costs only and do not reflect any transactional costs, such as sales charges (loads) on purchase payments, and contingent deferred sales charges (“CDSC”) on redemptions, if any. Therefore, the second table is useful in comparing ongoing costs only, and will not help you determine the relative total costs of owning different funds. In addition, if these transactional costs were included, your costs would have been higher.
More information about the Fund’s expenses, including annual expense ratios for periods up to five years (subject to the Fund’s inception date), can be found in the Financial Highlights section of this report. For additional information on operating expenses and other shareholder costs, please refer to the Fund’s prospectus.
6 | THE GUGGENHEIM FUNDS SEMI-ANNUAL REPORT | |
ABOUT SHAREHOLDERS’ FUND EXPENSES (Unaudited)(concluded) |
| Expense
Ratio1 | Fund
Return | Beginning
Account Value
September 30,
2020 | Ending
Account Value
March 31,
2021 | Expenses
Paid During
Period2 |
Table 1. Based on actual Fund return3 |
A-Class | 1.20% | 45.64% | $ 1,000.00 | $ 1,456.40 | $ 7.35 |
C-Class | 2.01% | 45.03% | 1,000.00 | 1,450.30 | 12.28 |
P-Class | 1.29% | 45.63% | 1,000.00 | 1,456.30 | 7.90 |
Institutional Class | 1.03% | 45.74% | 1,000.00 | 1,457.40 | 6.31 |
|
Table 2. Based on hypothetical 5% return (before expenses) |
A-Class | 1.20% | 5.00% | $ 1,000.00 | $ 1,018.95 | $ 6.04 |
C-Class | 2.01% | 5.00% | 1,000.00 | 1,014.91 | 10.10 |
P-Class | 1.29% | 5.00% | 1,000.00 | 1,018.50 | 6.49 |
Institutional Class | 1.03% | 5.00% | 1,000.00 | 1,019.80 | 5.19 |
1 | Annualized and excludes expenses of the underlying funds in which the Fund invests, if any. |
2 | Expenses are equal to the Fund’s annualized expense ratio, net of any applicable fee waivers, multiplied by the average account value over the period, multiplied by 182/365 (to reflect the one-half year period). |
3 | Actual cumulative return at net asset value for the period September 30, 2020 to March 31, 2021. |
| | THE GUGGENHEIM FUNDS SEMI-ANNUAL REPORT | 7 |
PERFORMANCE REPORT AND FUND PROFILE (Unaudited) | March 31, 2021 |
GUGGENHEIM SMID CAP VALUE FUND
OBJECTIVE: Seeks long-term growth of capital.
Holdings Diversification (Market Exposure as % of Net Assets)
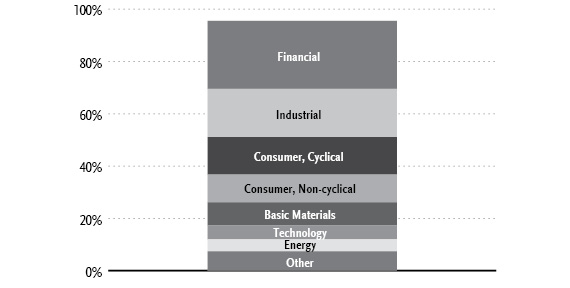
“Holdings Diversification (Market Exposure as % of Net Assets)” excludes any temporary cash investments.
Inception Dates: |
A-Class | May 1, 1997 |
C-Class | January 29, 1999 |
P-Class | May 1, 2015 |
Institutional Class | January 3, 2020 |
Ten Largest Holdings (% of Total Net Assets) |
Pioneer Natural Resources Co. | 2.6% |
Bunge Ltd. | 2.3% |
Voya Financial, Inc. | 2.2% |
First Horizon Corp. | 2.2% |
Pinnacle Financial Partners, Inc. | 2.2% |
Synovus Financial Corp. | 2.0% |
Alleghany Corp. | 1.9% |
Evolent Health, Inc. — Class A | 1.7% |
LKQ Corp. | 1.6% |
MDU Resources Group, Inc. | 1.6% |
Top Ten Total | 20.3% |
| | |
“Ten Largest Holdings” excludes any temporary cash investments. |
8 | THE GUGGENHEIM FUNDS SEMI-ANNUAL REPORT | |
PERFORMANCE REPORT AND FUND PROFILE (Unaudited)(concluded) | March 31, 2021 |
Average Annual Returns*
Periods Ended March 31, 2021
| 6 Month† | 1 Year | 5 Year | 10 Year |
A-Class Shares | 45.64% | 77.46% | 12.90% | 8.97% |
A-Class Shares with sales charge‡ | 38.72% | 68.99% | 11.80% | 8.44% |
C-Class Shares | 45.03% | 76.03% | 11.99% | 8.14% |
C-Class Shares with CDSC§ | 44.03% | 75.03% | 11.99% | 8.14% |
Institutional Class Shares1 | 45.74% | 77.67% | 13.15% | 9.30% |
Russell 2500 Value Index | 50.13% | 87.47% | 12.15% | 10.23% |
| 6 Month† | 1 Year | 5 Year | Since
Inception
(05/01/15) |
P-Class Shares | 45.63% | 77.34% | 12.87% | 10.13% |
Russell 2500 Value Index | 50.13% | 87.47% | 12.15% | 9.35% |
* | The performance data above represents past performance that is not predictive of future results. The investment return and principal value of an investment in the Fund will fluctuate so that an investor’s shares, when redeemed, may be worth more or less than their original cost. Returns are historical and include changes in principal and reinvested dividends and capital gains and do not reflect the effect of taxes. The Russell 2500 Value Index is an unmanaged index and, unlike the Fund, has no management fees or operating expenses to reduce its reported return. |
1 | The Institutional Class shares commenced operations on January 3, 2020 in connection with the reorganization of the SMid Cap Value Institutional Fund. The performance of the Institutional Class shares of the Fund for periods prior to January 3, 2020 reflects the performance of the Guggenheim SMid Cap Value Institutional Fund. The returns for the SMid Cap Value Institutional Fund have not been restated to reflect the fees and expenses applicable to the Institutional Class shares of the Fund. |
† | 6 month returns are not annualized. |
‡ | Fund returns are calculated using the maximum sales charge of 4.75%. |
§ | Fund returns include a CDSC of 1% if redeemed within 12 months of purchase. |
| | THE GUGGENHEIM FUNDS SEMI-ANNUAL REPORT | 9 |
SCHEDULE OF INVESTMENTS (Unaudited) | March 31, 2021 |
SMID CAP VALUE FUND | |
| | Shares | | | Value | |
COMMON STOCKS† - 95.5% |
| | | | | | | | | |
Financial - 26.0% |
Voya Financial, Inc. | | | 156,188 | | | $ | 9,939,804 | |
First Horizon Corp. | | | 574,471 | | | | 9,714,305 | |
Pinnacle Financial Partners, Inc. | | | 108,970 | | | | 9,661,280 | |
Synovus Financial Corp. | | | 196,044 | | | | 8,969,013 | |
Alleghany Corp.* | | | 13,849 | | | | 8,673,490 | |
Physicians Realty Trust REIT | | | 382,791 | | | | 6,763,917 | |
BOK Financial Corp. | | | 61,596 | | | | 5,501,755 | |
Alexandria Real Estate Equities, Inc. REIT | | | 33,157 | | | | 5,447,695 | |
Axis Capital Holdings Ltd. | | | 107,781 | | | | 5,342,704 | |
VICI Properties, Inc. REIT | | | 165,679 | | | | 4,678,775 | |
Radian Group, Inc. | | | 190,807 | | | | 4,436,263 | |
Stifel Financial Corp. | | | 61,030 | | | | 3,909,582 | |
Hilltop Holdings, Inc. | | | 114,190 | | | | 3,897,305 | |
Sun Communities, Inc. REIT | | | 24,554 | | | | 3,684,082 | |
KeyCorp | | | 168,845 | | | | 3,373,523 | |
Zions Bancorp North America | | | 60,843 | | | | 3,343,931 | |
Heritage Insurance Holdings, Inc. | | | 280,423 | | | | 3,107,087 | |
Apple Hospitality REIT, Inc. | | | 191,498 | | | | 2,790,126 | |
Medical Properties Trust, Inc. REIT | | | 124,560 | | | | 2,650,637 | |
Park Hotels & Resorts, Inc. REIT* | | | 119,020 | | | | 2,568,451 | |
Heartland Financial USA, Inc. | | | 48,817 | | | | 2,453,542 | |
Old Republic International Corp. | | | 109,037 | | | | 2,381,368 | |
Gaming and Leisure Properties, Inc. REIT | | | 46,248 | | | | 1,962,303 | |
UMB Financial Corp. | | | 10,797 | | | | 996,887 | |
Total Financial | | | | | | | 116,247,825 | |
| | | | | | | | | |
Industrial - 18.4% |
MDU Resources Group, Inc. | | | 224,339 | | | | 7,091,356 | |
Jacobs Engineering Group, Inc. | | | 45,754 | | | | 5,914,620 | |
Knight-Swift Transportation Holdings, Inc. | | | 113,408 | | | | 5,453,791 | |
Graphic Packaging Holding Co. | | | 279,720 | | | | 5,079,715 | |
Rexnord Corp. | | | 102,246 | | | | 4,814,764 | |
PGT Innovations, Inc.* | | | 186,565 | | | | 4,710,766 | |
Plexus Corp.* | | | 50,906 | | | | 4,675,207 | |
Johnson Controls International plc | | | 76,754 | | | | 4,579,911 | |
Valmont Industries, Inc. | | | 18,655 | | | | 4,433,734 | |
Altra Industrial Motion Corp. | | | 75,605 | | | | 4,182,469 | |
Colfax Corp.* | | | 93,835 | | | | 4,110,911 | |
EnerSys | | | 43,436 | | | | 3,943,989 | |
Owens Corning | | | 32,815 | | | | 3,021,934 | |
Curtiss-Wright Corp. | | | 25,342 | | | | 3,005,561 | |
Kirby Corp.* | | | 47,573 | | | | 2,867,700 | |
Kennametal, Inc. | | | 66,439 | | | | 2,655,567 | |
Terex Corp. | | | 55,895 | | | | 2,575,083 | |
GATX Corp. | | | 27,068 | | | | 2,510,286 | |
Energizer Holdings, Inc. | | | 44,336 | | | | 2,104,186 | |
Park Aerospace Corp. | | | 143,193 | | | | 1,893,011 | |
Schneider National, Inc. — Class B | | | 65,740 | | | | 1,641,528 | |
Howmet Aerospace, Inc.* | | | 37,205 | | | | 1,195,397 | |
Total Industrial | | | | | | | 82,461,486 | |
| | | | | | | | | |
Consumer, Cyclical - 14.4% |
LKQ Corp.* | | | 169,119 | | | | 7,158,807 | |
Kohl’s Corp. | | | 96,304 | | | | 5,740,681 | |
10 | THE GUGGENEHIM FUNDS SEMI-ANNUAL REPORT | SEE NOTES TO FINANCIAL STATEMENTS. |
SCHEDULE OF INVESTMENTS (Unaudited)(continued) | March 31, 2021 |
SMID CAP VALUE FUND | |
| | Shares | | | Value | |
Alaska Air Group, Inc.* | | | 75,819 | | | $ | 5,247,433 | |
MSC Industrial Direct Company, Inc. — Class A | | | 52,550 | | | | 4,739,484 | |
PVH Corp.* | | | 42,818 | | | | 4,525,863 | |
Ralph Lauren Corp. — Class A* | | | 31,603 | | | | 3,892,225 | |
Penske Automotive Group, Inc. | | | 45,617 | | | | 3,660,308 | |
Lear Corp. | | | 17,436 | | | | 3,160,275 | |
Abercrombie & Fitch Co. — Class A* | | | 88,592 | | | | 3,039,592 | |
Dick’s Sporting Goods, Inc. | | | 37,038 | | | | 2,820,444 | |
Urban Outfitters, Inc.* | | | 74,659 | | | | 2,776,568 | |
DR Horton, Inc. | | | 29,990 | | | | 2,672,709 | |
Methode Electronics, Inc. | | | 62,648 | | | | 2,629,963 | |
Big Lots, Inc. | | | 34,877 | | | | 2,382,099 | |
Skechers USA, Inc. — Class A* | | | 55,597 | | | | 2,318,951 | |
Movado Group, Inc. | | | 80,698 | | | | 2,295,858 | |
Avient Corp. | | | 47,702 | | | | 2,254,874 | |
Dana, Inc. | | | 91,572 | | | | 2,227,947 | |
Lakeland Industries, Inc.* | | | 39,658 | | | | 1,104,872 | |
Total Consumer, Cyclical | | | 64,648,953 | |
| | | | | | | | | |
Consumer, Non-cyclical - 10.6% |
Bunge Ltd. | | | 128,258 | | | | 10,167,012 | |
Encompass Health Corp. | | | 72,511 | | | | 5,938,651 | |
Sabre Corp.* | | | 353,636 | | | | 5,237,349 | |
Central Garden & Pet Co. — Class A* | | | 100,456 | | | | 5,212,662 | |
Emergent BioSolutions, Inc.* | | | 53,452 | | | | 4,966,225 | |
US Foods Holding Corp.* | | | 104,944 | | | | 4,000,465 | |
Integer Holdings Corp.* | | | 40,418 | | | | 3,722,498 | |
Ingredion, Inc. | | | 39,597 | | | | 3,560,562 | |
Tyson Foods, Inc. — Class A | | | 31,731 | | | | 2,357,614 | |
J M Smucker Co. | | | 18,610 | | | | 2,354,723 | |
Total Consumer, Non-cyclical | | | 47,517,761 | |
| | | | | | | | | |
Basic Materials - 8.7% |
Huntsman Corp. | | | 221,662 | | | | 6,390,515 | |
Ashland Global Holdings, Inc. | | | 64,211 | | | | 5,700,011 | |
Reliance Steel & Aluminum Co. | | | 36,971 | | | | 5,630,313 | |
Westlake Chemical Corp. | | | 59,218 | | | | 5,257,966 | |
Commercial Metals Co. | | | 139,802 | | | | 4,311,494 | |
Nucor Corp. | | | 39,296 | | | | 3,154,290 | |
Olin Corp. | | | 80,246 | | | | 3,046,941 | |
Element Solutions, Inc. | | | 156,948 | | | | 2,870,579 | |
Kraton Corp.* | | | 69,755 | | | | 2,552,335 | |
Total Basic Materials | | | | | | | 38,914,444 | |
| | | | | | | | | |
Technology - 5.3% |
Evolent Health, Inc. — Class A* | | | 384,621 | | | | 7,769,344 | |
Qorvo, Inc.* | | | 28,398 | | | | 5,188,315 | |
Parsons Corp.* | | | 88,946 | | | | 3,596,976 | |
Skyworks Solutions, Inc. | | | 19,123 | | | | 3,508,688 | |
Science Applications International Corp. | | | 31,711 | | | | 2,650,722 | |
DXC Technology Co.* | | | 36,249 | | | | 1,133,144 | |
Total Technology | | | | | | | 23,847,189 | |
| | | | | | | | | |
Energy - 4.6% |
Pioneer Natural Resources Co. | | | 72,588 | | | | 11,528,426 | |
Patterson-UTI Energy, Inc. | | | 668,139 | | | | 4,763,831 | |
Range Resources Corp.* | | | 418,464 | | | | 4,322,733 | |
SEE NOTES TO FINANCIAL STATEMENTS. | THE GUGGENHEIM FUNDS SEMI-ANNUAL REPORT | 11 |
SCHEDULE OF INVESTMENTS (Unaudited)(continued) | March 31, 2021 |
SMID CAP VALUE FUND | |
| | Shares | | | Value | |
HydroGen Corp.*,†††,1 | | | 1,265,700 | | | $ | 2 | |
Total Energy | | | | | | | 20,614,992 | |
| | | | | | | | | |
Utilities - 4.5% |
Avista Corp. | | | 79,710 | | | | 3,806,153 | |
Black Hills Corp. | | | 54,696 | | | | 3,652,052 | |
Southwest Gas Holdings, Inc. | | | 50,360 | | | | 3,460,235 | |
Pinnacle West Capital Corp. | | | 42,487 | | | | 3,456,317 | |
Spire, Inc. | | | 42,220 | | | | 3,119,636 | |
Edison International | | | 44,188 | | | | 2,589,417 | |
Total Utilities | | | | | | | 20,083,810 | |
| | | | | | | | | |
Communications - 3.0% |
Infinera Corp.* | | | 668,796 | | | | 6,440,506 | |
Viavi Solutions, Inc.* | | | 282,669 | | | | 4,437,903 | |
Ciena Corp.* | | | 43,648 | | | | 2,388,419 | |
Total Communications | | | | | | | 13,266,828 | |
| | | | | | | | | |
Total Common Stocks | | | | |
(Cost $317,411,983) | | | | | | | 427,603,288 | |
| | | | | | | | | |
CONVERTIBLE PREFERRED STOCKS††† - 0.0% |
Industrial - 0.0% |
Thermoenergy Corp.*,2 | | | 1,652,084 | | | | 2,412 | |
Total Convertible Preferred Stocks | | | | |
(Cost $1,577,634) | | | | | | | 2,412 | |
| | | | | | | | | |
RIGHTS† - 0.1% |
Basic Materials - 0.1% |
Pan American Silver Corp. | | | 516,551 | | | | 449,399 | |
Total Rights | | | | |
(Cost $—) | | | | | | | 449,399 | |
| | | | | | | | | |
MONEY MARKET FUND† - 4.0% |
Dreyfus Treasury Securities Cash Management Fund — Institutional Shares, 0.01%3 | | | 18,063,897 | | | | 18,063,897 | |
Total Money Market Fund | | | | |
(Cost $18,063,897) | | | | | | | 18,063,897 | |
| | | | | | | | | |
Total Investments - 99.6% | | | | |
(Cost $337,053,514) | | $ | 446,118,996 | |
Other Assets & Liabilities, net - 0.4% | | | 1,822,804 | |
Total Net Assets - 100.0% | | $ | 447,941,800 | |
* | Non-income producing security. |
† | Value determined based on Level 1 inputs, unless otherwise noted — See Note 4. |
††† | Value determined based on Level 3 inputs — See Note 4. |
1 | Affiliated issuer. |
2 | PIPE (Private Investment in Public Equity) — Stock issued by a company in the secondary market as a means of raising capital more quickly and less expensively than through registration of a secondary public offering. |
3 | Rate indicated is the 7-day yield as of March 31, 2021. |
| | plc — Public Limited Company |
| | REIT — Real Estate Investment Trust |
| | |
| | See Sector Classification in Other Information section. |
12 | THE GUGGENEHIM FUNDS SEMI-ANNUAL REPORT | SEE NOTES TO FINANCIAL STATEMENTS. |
SCHEDULE OF INVESTMENTS (Unaudited)(concluded) | March 31, 2021 |
SMID CAP VALUE FUND | |
The following table summarizes the inputs used to value the Fund’s investments at March 31, 2021 (See Note 4 in the Notes to Financial Statements):
Investments in Securities (Assets) | | Level 1
Quoted
Prices | | | Level 2
Significant
Observable
Inputs | | | Level 3
Significant
Unobservable
Inputs | | | Total | |
Common Stocks | | $ | 427,603,286 | | | $ | — | | | $ | 2 | | | $ | 427,603,288 | |
Convertible Preferred Stocks | | | — | | | | — | | | | 2,412 | | | | 2,412 | |
Rights | | | 449,399 | | | | — | | | | — | | | | 449,399 | |
Money Market Fund | | | 18,063,897 | | | | — | | | | — | | | | 18,063,897 | |
Total Assets | | $ | 446,116,582 | | | $ | — | | | $ | 2,414 | | | $ | 446,118,996 | |
Affiliated Transactions
Investments representing 5% or more of the outstanding voting shares of a company, or control of or by, or common control under Guggenheim Investments (“GI”), result in that company being considered an affiliated issuer, as defined in the 1940 Act.
Transactions during the period ended March 31, 2021, in which the company is an affiliated issuer, were as follows:
Security Name | | Value
09/30/20 | | | Additions | | | Reductions | | | Realized
Gain (Loss) | | | Change in
Unrealized
Appreciation
(Depreciation) | | | Value
03/31/21 | | | Shares
03/31/21 | | | Investment
Income | |
Common Stock | | | | | | | | | | | | | | | | | | | | | | | | | | | | | | | | |
HydroGen Corp.* | | $ | 2 | | | $ | — | | | $ | — | | | $ | — | | | $ | — | | | $ | 2 | | | | 1,265,700 | | | $ | — | |
* | Non-income producing security. |
SEE NOTES TO FINANCIAL STATEMENTS. | THE GUGGENHEIM FUNDS SEMI-ANNUAL REPORT | 13 |
STATEMENT OF ASSETS AND LIABILITIES (Unaudited) |
SMID CAP VALUE FUND |
March 31, 2021
Assets: |
Investments in unaffiliated issuers, at value (cost $337,050,983) | | $ | 446,118,994 | |
Investments in affiliated issuers, at value (cost $2,531) | | | 2 | |
Prepaid expenses | | | 46,068 | |
Receivables: |
Securities sold | | | 3,956,959 | |
Dividends | | | 773,608 | |
Fund shares sold | | | 225,785 | |
Foreign tax reclaims | | | 302 | |
Interest | | | 102 | |
Total assets | | | 451,121,820 | |
| | | | | |
Liabilities: |
Payable for: |
Fund shares redeemed | | | 1,494,473 | |
Securities purchased | | | 1,152,925 | |
Management fees | | | 268,655 | |
Distribution and service fees | | | 83,230 | |
Fund accounting/administration fees | | | 27,778 | |
Transfer agent/maintenance fees | | | 20,245 | |
Trustees’ fees* | | | 1,437 | |
Due to Investment Adviser | | | 733 | |
Miscellaneous | | | 130,544 | |
Total liabilities | | | 3,180,020 | |
Net assets | | $ | 447,941,800 | |
| | | | | |
Net assets consist of: |
Paid in capital | | $ | 320,614,413 | |
Total distributable earnings (loss) | | | 127,327,387 | |
Net assets | | $ | 447,941,800 | |
| | | | | |
A-Class: |
Net assets | | $ | 334,443,895 | |
Capital shares outstanding | | | 8,740,381 | |
Net asset value per share | | $ | 38.26 | |
Maximum offering price per share (Net asset value divided by 95.25%) | | $ | 40.17 | |
| | | | | |
C-Class: |
Net assets | | $ | 12,340,632 | |
Capital shares outstanding | | | 491,188 | |
Net asset value per share | | $ | 25.12 | |
| | | | | |
P-Class: |
Net assets | | $ | 7,517,620 | |
Capital shares outstanding | | | 198,115 | |
Net asset value per share | | $ | 37.95 | |
| | | | | |
Institutional Class: |
Net assets | | $ | 93,639,653 | |
Capital shares outstanding | | | 7,494,810 | |
Net asset value per share | | $ | 12.49 | |
* | Relates to Trustees not deemed “interested persons” within the meaning of Section 2(a)(19) of the 1940 Act. |
14 | THE GUGGENHEIM FUNDS SEMI-ANNUAL REPORT | SEE NOTES TO FINANCIAL STATEMENTS. |
STATEMENT OF OPERATIONS (Unaudited) |
SMID CAP VALUE FUND |
Six Months Ended March 31, 2021
Investment Income: |
Dividends from securities of unaffiliated issuers | | $ | 3,867,834 | |
Interest | | | 216 | |
Total investment income | | | 3,868,050 | |
| | | | | |
Expenses: |
Management fees | | | 1,466,291 | |
Distribution and service fees: |
A-Class | | | 366,699 | |
C-Class | | | 73,276 | |
P-Class | | | 8,921 | |
Transfer agent/maintenance fees: |
A-Class | | | 102,224 | |
C-Class | | | 11,545 | |
P-Class | | | 2,497 | |
Institutional Class | | | 40,172 | |
Fund accounting/administration fees | | | 136,413 | |
Professional fees | | | 35,420 | |
Trustees’ fees* | | | 13,179 | |
Line of credit fees | | | 6,047 | |
Custodian fees | | | 4,950 | |
Miscellaneous | | | 97,295 | |
Recoupment of previously waived fees: |
C-Class | | | 188 | |
P-Class | | | 2,908 | |
Institutional | | | 30 | |
Total expenses | | | 2,368,055 | |
Less: |
Expenses reimbursed by Adviser: |
A-Class | | | (9,671 | ) |
C-Class | | | (2,367 | ) |
P-Class | | | (6 | ) |
Institutional Class | | | (14,930 | ) |
Expenses waived by Adviser | | | (103 | ) |
Earnings credits applied | | | (7 | ) |
Total waived/reimbursed expenses | | | (27,084 | ) |
Net expenses | | | 2,340,971 | |
Net investment income | | | 1,527,079 | |
| | | | | |
Net Realized and Unrealized Gain (Loss): |
Net realized gain (loss) on: |
Investments in unaffiliated issuers | | $ | 24,563,539 | |
Net realized gain | | | 24,563,539 | |
Net change in unrealized appreciation (depreciation) on: |
Investments in unaffiliated issuers | | | 117,846,919 | |
Net change in unrealized appreciation (depreciation) | | | 117,846,919 | |
Net realized and unrealized gain | | | 142,410,458 | |
Net increase in net assets resulting from operations | | $ | 143,937,537 | |
* | Relates to Trustees not deemed “interested persons” within the meaning of Section 2(a)(19) of the 1940 Act. |
SEE NOTES TO FINANCIAL STATEMENTS. | THE GUGGENHEIM FUNDS SEMI-ANNUAL REPORT | 15 |
STATEMENTS OF CHANGES IN NET ASSETS |
SMID CAP VALUE FUND | |
| | Six Months Ended
March 31, 2021
(Unaudited) | | | Year Ended
September 30,
2020 | |
Increase (Decrease) in Net Assets from Operations: | | | | | | | | |
Net investment income | | $ | 1,527,079 | | | $ | 5,810,547 | |
Net realized gain (loss) on investments | | | 24,563,539 | | | | (3,604,141 | ) |
Net change in unrealized appreciation (depreciation) on investments | | | 117,846,919 | | | | (48,873,555 | ) |
Net increase (decrease) in net assets resulting from operations | | | 143,937,537 | | | | (46,667,149 | ) |
| | | | | | | | | |
Distributions to shareholders: | | | | | | | | |
A-Class | | | — | | | | (13,545,510 | ) |
C-Class | | | — | | | | (1,423,333 | ) |
P-Class | | | — | | | | (560,321 | ) |
Return of capital | | | | | | | | |
A-Class | | | — | | | | (423,603 | ) |
C-Class | | | — | | | | (33,103 | ) |
P-Class | | | — | | | | (16,100 | ) |
Total distributions to shareholders | | | — | | | | (16,001,970 | ) |
| | | | | | | | | |
Capital share transactions: | | | | | | | | |
Proceeds from sale of shares | | | | | | | | |
A-Class | | | 12,719,806 | | | | 17,615,688 | |
C-Class | | | 422,874 | | | | 594,137 | |
P-Class | | | 428,981 | | | | 574,319 | |
Institutional Class | | | 17,291,825 | | | | 33,393,908 | * |
Distributions reinvested | | | | | | | | |
A-Class | | | — | | | | 13,561,746 | |
C-Class | | | — | | | | 1,311,431 | |
P-Class | | | — | | | | 576,421 | |
Institutional Class | | | — | | | | — | * |
Net proceeds from the issuance of shares due to mergera | | | — | | | | 66,601,569 | * |
Cost of shares redeemed | | | | | | | | |
A-Class | | | (29,243,290 | ) | | | (80,108,800 | ) |
C-Class | | | (7,959,048 | ) | | | (14,705,656 | ) |
P-Class | | | (3,272,567 | ) | | | (5,966,542 | ) |
Institutional Class | | | (12,176,788 | ) | | | (26,177,847 | )* |
Net increase (decrease) from capital share transactions | | | (21,788,207 | ) | | | 7,270,374 | |
Net increase (decrease) in net assets | | | 122,149,330 | | | | (55,398,745 | ) |
| | | | | | | | | |
Net assets: | | | | | | | | |
Beginning of period | | | 325,792,470 | | | | 381,191,215 | |
End of period | | $ | 447,941,800 | | | $ | 325,792,470 | |
| | | | | | | | | |
16 | THE GUGGENEHIM FUNDS SEMI-ANNUAL REPORT | SEE NOTES TO FINANCIAL STATEMENTS. |
STATEMENTS OF CHANGES IN NET ASSETS (concluded) |
SMID CAP VALUE FUND | |
| | Six Months Ended
March 31, 2021
(Unaudited) | | | Year Ended
September 30,
2020 | |
Capital share activity: | | | | | | | | |
Shares sold | | | | | | | | |
A-Class | | | 363,458 | | | | 668,823 | |
C-Class | | | 18,835 | | | | 30,801 | |
P-Class | | | 12,085 | | | | 21,752 | |
Institutional Class | | | 1,538,147 | | | | 3,796,574 | * |
Shares issued from reinvestment of distributions | | | | | | | | |
A-Class | | | — | | | | 433,009 | |
C-Class | | | — | | | | 63,136 | |
P-Class | | | — | | | | 18,546 | |
Issuance of shares due to mergera | | | — | | | | 6,532,159 | |
Shares redeemed | | | | | | | | |
A-Class | | | (876,305 | ) | | | (2,853,016 | ) |
C-Class | | | (352,014 | ) | | | (793,779 | ) |
P-Class | | | (107,964 | ) | | | (214,531 | ) |
Institutional Class | | | (1,135,761 | ) | | | (3,236,309 | )* |
Net increase (decrease) in shares | | | (539,519 | ) | | | 4,467,165 | |
* | Since commencement of operations, as of the close of business January 3, 2020. |
a | Fund merger — See Note 7. |
SEE NOTES TO FINANCIAL STATEMENTS. | THE GUGGENHEIM FUNDS SEMI-ANNUAL REPORT | 17 |
FINANCIAL HIGHLIGHTS |
SMID CAP VALUE FUND | |
This table is presented to show selected data for a share outstanding throughout each period and to assist shareholders in evaluating a Fund’s performance for the periods presented.
A-Class | | Six Months Ended
March 31, 2021a | | | Year
Ended
Sept. 30,
2020 | | | Year
Ended
Sept. 30,
2019 | | | Year
Ended
Sept. 30,
2018 | | | Year
Ended
Sept. 30,
2017 | | | Year
Ended
Sept. 30,
2016 | |
Per Share Data |
Net asset value, beginning of period | | $ | 26.27 | | | $ | 30.52 | | | $ | 36.20 | | | $ | 35.37 | | | $ | 30.27 | | | $ | 30.86 | |
Income (loss) from investment operations: |
Net investment income (loss)b | | | .13 | | | | .46 | | | | .22 | | | | .06 | | | | .03 | | | | .30 | |
Net gain (loss) on investments (realized and unrealized) | | | 11.86 | | | | (3.37 | ) | | | (1.89 | ) | | | 3.37 | | | | 6.09 | | | | 3.95 | |
Total from investment operations | | | 11.99 | | | | (2.91 | ) | | | (1.67 | ) | | | 3.43 | | | | 6.12 | | | | 4.25 | |
Less distributions from: |
Net investment income | | | — | | | | (.26 | ) | | | (.03 | ) | | | — | | | | (.37 | ) | | | — | |
Net realized gains | | | — | | | | (1.04 | ) | | | (3.98 | ) | | | (2.60 | ) | | | (.65 | ) | | | (4.84 | ) |
Return of capital | | | — | | | | (.04 | ) | | | — | | | | — | | | | — | | | | — | |
Total distributions | | | — | | | | (1.34 | ) | | | (4.01 | ) | | | (2.60 | ) | | | (1.02 | ) | | | (4.84 | ) |
Net asset value, end of period | | $ | 38.26 | | | $ | 26.27 | | | $ | 30.52 | | | $ | 36.20 | | | $ | 35.37 | | | $ | 30.27 | |
|
Total Returnc | | | 45.64 | % | | | (10.25 | %) | | | (2.51 | %) | | | 10.05 | % | | | 20.62 | % | | | 15.51 | % |
Ratios/Supplemental Data |
Net assets, end of period (in thousands) | | $ | 334,444 | | | $ | 243,072 | | | $ | 335,806 | | | $ | 392,495 | | | $ | 396,408 | | | $ | 407,883 | |
Ratios to average net assets: |
Net investment income (loss) | | | 0.78 | % | | | 1.64 | % | | | 0.72 | % | | | 0.17 | % | | | 0.11 | % | | | 1.04 | % |
Total expensesd | | | 1.20 | % | | | 1.25 | % | | | 1.23 | % | | | 1.26 | % | | | 1.27 | % | | | 1.49 | % |
Net expensese,f,g | | | 1.20 | % | | | 1.24 | % | | | 1.23 | % | | | 1.26 | % | | | 1.27 | % | | | 1.49 | % |
Portfolio turnover rate | | | 14 | % | | | 41 | % | | | 45 | % | | | 54 | % | | | 55 | % | | | 52 | % |
18 | THE GUGGENHEIM FUNDS SEMI-ANNUAL REPORT | SEE NOTES TO FINANCIAL STATEMENTS. |
FINANCIAL HIGHLIGHTS (continued) |
SMID CAP VALUE FUND | |
This table is presented to show selected data for a share outstanding throughout each period and to assist shareholders in evaluating a Fund’s performance for the periods presented.
C-Class | | Six Months Ended
March 31, 2021a | | | Year
Ended
Sept. 30,
2020 | | | Year
Ended
Sept. 30,
2019 | | | Year
Ended
Sept. 30,
2018 | | | Year
Ended
Sept. 30,
2017 | | | Year
Ended
Sept. 30,
2016 | |
Per Share Data |
Net asset value, beginning of period | | $ | 17.32 | | | $ | 20.48 | | | $ | 26.05 | | | $ | 26.33 | | | $ | 22.78 | | | $ | 24.54 | |
Income (loss) from investment operations: |
Net investment income (loss)b | | | (.01 | ) | | | .16 | | | | (.02 | ) | | | (.17 | ) | | | (.17 | ) | | | .06 | |
Net gain (loss) on investments (realized and unrealized) | | | 7.81 | | | | (2.22 | ) | | | (1.57 | ) | | | 2.49 | | | | 4.55 | | | | 3.02 | |
Total from investment operations | | | 7.80 | | | | (2.06 | ) | | | (1.59 | ) | | | 2.32 | | | | 4.38 | | | | 3.08 | |
Less distributions from: |
Net investment income | | | — | | | | (.03 | ) | | | — | | | | — | | | | (.18 | ) | | | — | |
Net realized gains | | | — | | | | (1.04 | ) | | | (3.98 | ) | | | (2.60 | ) | | | (.65 | ) | | | (4.84 | ) |
Return of capital | | | — | | | | (.03 | ) | | | — | | | | — | | | | — | | | | — | |
Total distributions | | | — | | | | (1.10 | ) | | | (3.98 | ) | | | (2.60 | ) | | | (.83 | ) | | | (4.84 | ) |
Net asset value, end of period | | $ | 25.12 | | | $ | 17.32 | | | $ | 20.48 | | | $ | 26.05 | | | $ | 26.33 | | | $ | 22.78 | |
|
Total Returnc | | | 45.03 | % | | | (10.95 | %) | | | (3.35 | %) | | | 9.22 | % | | | 19.63 | % | | | 14.64 | % |
Ratios/Supplemental Data |
Net assets, end of period (in thousands) | | $ | 12,341 | | | $ | 14,276 | | | $ | 31,221 | | | $ | 52,996 | | | $ | 87,508 | | | $ | 98,176 | |
Ratios to average net assets: |
Net investment income (loss) | | | (0.09 | %) | | | 0.86 | % | | | (0.11 | %) | | | (0.65 | %) | | | (0.68 | %) | | | 0.27 | % |
Total expensesd | | | 2.04 | % | | | 2.14 | % | | | 2.07 | % | | | 2.03 | % | | | 2.07 | % | | | 2.27 | % |
Net expensese,f,g | | | 2.01 | % | | | 2.07 | % | | | 2.06 | % | | | 2.03 | % | | | 2.06 | % | | | 2.27 | % |
Portfolio turnover rate | | | 14 | % | | | 41 | % | | | 45 | % | | | 54 | % | | | 55 | % | | | 52 | % |
SEE NOTES TO FINANCIAL STATEMENTS. | THE GUGGENHEIM FUNDS SEMI-ANNUAL REPORT | 19 |
FINANCIAL HIGHLIGHTS (continued) |
SMID CAP VALUE FUND |
This table is presented to show selected data for a share outstanding throughout each period and to assist shareholders in evaluating a Fund’s performance for the periods presented.
P-Class | | Six Months Ended
March 31, 2021a | | | Year
Ended
Sept. 30,
2020 | | | Year
Ended
Sept. 30,
2019 | | | Year
Ended
Sept. 30,
2018 | | | Year
Ended
Sept. 30,
2017 | | | Year
Ended
Sept. 30,
2016 | |
Per Share Data |
Net asset value, beginning of period | | $ | 26.06 | | | $ | 30.25 | | | $ | 35.94 | | | $ | 35.15 | | | $ | 30.18 | | | $ | 30.77 | |
Income (loss) from investment operations: |
Net investment income (loss)b | | | .10 | | | | .46 | | | | .19 | | | | .05 | | | | .01 | | | | .14 | |
Net gain (loss) on investments (realized and unrealized) | | | 11.79 | | | | (3.37 | ) | | | (1.88 | ) | | | 3.34 | | | | 6.08 | | | | 4.11 | |
Total from investment operations | | | 11.89 | | | | (2.91 | ) | | | (1.69 | ) | | | 3.39 | | | | 6.09 | | | | 4.25 | |
Less distributions from: |
Net investment income | | | — | | | | (.20 | ) | | | (.02 | ) | | | — | | | | (.47 | ) | | | — | |
Net realized gains | | | — | | | | (1.04 | ) | | | (3.98 | ) | | | (2.60 | ) | | | (.65 | ) | | | (4.84 | ) |
Return of capital | | | — | | | | (.04 | ) | | | — | | | | — | | | | — | | | | — | |
Total distributions | | | — | | | | (1.28 | ) | | | (4.00 | ) | | | (2.60 | ) | | | (1.12 | ) | | | (4.84 | ) |
Net asset value, end of period | | $ | 37.95 | | | $ | 26.06 | | | $ | 30.25 | | | $ | 35.94 | | | $ | 35.15 | | | $ | 30.18 | |
|
Total Return | | | 45.63 | % | | | (10.30 | %) | | | (2.61 | %) | | | 10.03 | % | | | 20.57 | % | | | 15.61 | % |
Ratios/Supplemental Data |
Net assets, end of period (in thousands) | | $ | 7,518 | | | $ | 7,662 | | | $ | 14,165 | | | $ | 19,889 | | | $ | 22,203 | | | $ | 3,423 | |
Ratios to average net assets: |
Net investment income (loss) | | | 0.64 | % | | | 1.64 | % | | | 0.63 | % | | | 0.13 | % | | | 0.02 | % | | | 0.48 | % |
Total expensesd | | | 1.29 | % | | | 1.33 | % | | | 1.35 | % | | | 1.35 | % | | | 1.25 | % | | | 1.32 | % |
Net expensese,f,g | | | 1.29 | % | | | 1.31 | % | | | 1.32 | % | | | 1.28 | % | | | 1.23 | % | | | 1.32 | % |
Portfolio turnover rate | | | 14 | % | | | 41 | % | | | 45 | % | | | 54 | % | | | 55 | % | | | 52 | % |
20 | THE GUGGENHEIM FUNDS SEMI-ANNUAL REPORT | SEE NOTES TO FINANCIAL STATEMENTS. |
FINANCIAL HIGHLIGHTS (continued) |
SMID CAP VALUE FUND |
This table is presented to show selected data for a share outstanding throughout each period and to assist shareholders in evaluating a Fund’s performance for the periods presented.
Institutional Class | | Six Months Ended
March 31, 2021a | | | Year
Ended
Sept. 30,
2020h | |
Per Share Data |
Net asset value, beginning of period | | $ | 8.57 | | | $ | 10.20 | |
Income (loss) from investment operations: |
Net investment income (loss)b | | | .05 | | | | .11 | |
Net gain (loss) on investments (realized and unrealized) | | | 3.87 | | | | (1.74 | ) |
Total from investment operations | | | 3.92 | | | | (1.63 | ) |
Net asset value, end of period | | $ | 12.49 | | | $ | 8.57 | |
|
Total Return | | | 45.74 | % | | | (15.98 | %) |
Ratios/Supplemental Data |
Net assets, end of period (in thousands) | | $ | 93,640 | | | $ | 60,783 | |
Ratios to average net assets: |
Net investment income (loss) | | | 0.97 | % | | | 1.87 | % |
Total expensesd | | | 1.07 | % | | | 1.09 | % |
Net expensese,f,g | | | 1.03 | % | | | 1.03 | % |
Portfolio turnover rate | | | 14 | % | | | 41 | % |
SEE NOTES TO FINANCIAL STATEMENTS. | THE GUGGENHEIM FUNDS SEMI-ANNUAL REPORT | 21 |
FINANCIAL HIGHLIGHTS (concluded) |
SMID CAP VALUE FUND |
a | Unaudited figures for the period ended March 31, 2021. Percentage amounts for the period, except total return and portfolio turnover rate, have been annualized. |
b | Net investment income (loss) per share was computed using average shares outstanding throughout the period. |
c | Total return does not reflect the impact of any applicable sales charges. |
d | Does not include expenses of the underlying funds in which the Fund invests. |
e | Net expense information reflects the expense ratios after expense waivers and reimbursements, as applicable. |
f | Net expenses may include expenses that are excluded from the expense limitation agreement. Excluding these expenses, the net expense ratios for the years presented would be: |
| | | 03/31/21 | 09/30/20 | 09/30/19 | 09/30/18 | 09/30/17 |
| | A-Class | 1.19% | 1.24% | 1.23% | 1.26% | 1.25% |
| | C-Class | 2.01% | 2.07% | 2.06% | 2.03% | 2.04% |
| | P-Class | 1.28% | 1.30% | 1.32% | 1.28% | 1.21% |
| | Institutional Class | 1.03% | 1.03%h | N/A | N/A | N/A |
g | The portion of the ratios of net expenses to average net assets attributable to recoupments of prior fee reductions or expense reimbursements for the years presented was as follows: |
| | | 03/31/21 | 09/30/20 | 09/30/19 | 09/30/18 | 09/30/17 |
| | A-Class | 0.00%* | 0.00%* | 0.00%* | 0.01% | 0.00%* |
| | C-Class | 0.00%* | 0.00%* | 0.01% | 0.01% | 0.00%* |
| | P-Class | 0.08% | 0.01% | 0.04% | 0.04% | 0.00%* |
| | Institutional Class | 0.00%* | 0.00%* | N/A | N/A | N/A |
| | * | Less than 0.01% |
| | h | Since commencement of operations: January 3, 2020. Percentage amounts for the period, except total return and portfolio turnover rate, have been annualized. |
22 | THE GUGGENHEIM FUNDS SEMI-ANNUAL REPORT | SEE NOTES TO FINANCIAL STATEMENTS. |
NOTES TO FINANCIAL STATEMENTS (Unaudited) |
Note 1 – Organization and Significant Accounting Policies
Organization
Guggenheim Funds Trust (the “Trust”), a Delaware statutory trust, is registered with the SEC under the Investment Company Act of 1940 (“1940 Act”), as an open-ended investment company of the series type. Each series, in effect, is representing a separate fund. The Trust may issue an unlimited number of authorized shares. The Trust accounts for the assets of each fund separately.
The Trust offers a combination of five separate classes of shares: A-Class shares, C-Class shares, P-Class shares, R6-Class shares and Institutional Class shares. Sales of shares of each Class are made without a front-end sales charge at the net asset value per share (“NAV”), with the exception of A-Class shares. A-Class shares are sold at the NAV, plus the applicable front-end sales charge. The sales charge varies depending on the amount purchased. A-Class share purchases of $1 million or more are exempt from the front-end sales charge but have a 1% contingent deferred sales charge (“CDSC”), if shares are redeemed within 12 months of purchase. C-Class shares have a 1% CDSC if shares are redeemed within 12 months of purchase. C-Class shares automatically convert to A-Class shares on or about the 10th day of the month following the 10-year anniversary of the purchase of the C-Class shares. This conversion will be executed without any sales charge, fee or other charge. After the conversion is completed, the shares will be subject to all features and expenses of A-Class shares. Institutional Class shares are offered primarily for direct investment by institutions such as pension and profit sharing plans, endowments, foundations and corporations. Institutional Class shares require a minimum initial investment of $2 million and a minimum account balance of $1 million. R6-Class shares are offered primarily through qualified retirement and benefit plans. R6-Class shares are also offered through certain other plans and platforms sponsored by financial intermediaries. Certain institutional investors and others deemed appropriate by Guggenheim Investments (“GI”) may also be eligible to purchase R6-Class shares subject to a $2 million minimum initial investment. At March 31, 2021, the Trust consisted of nineteen funds (the “Funds”).
This report covers the Guggenheim SMid Cap Value Fund (the “Fund”), a diversified investment company. At March 31, 2021, A-Class, C-Class, P-Class and Instiutional Class shares have been issued by the Fund.
Security Investors, LLC which operates under the name Guggenheim Investments, provides advisory services. Guggenheim Funds Distributors, LLC (“GFD or the “Distributor”) acts as principal underwriter for the Trust. GI and GFD are affiliated entities.
Significant Accounting Policies
The Fund operates as an investment company and, accordingly, follows the investment company accounting and reporting guidance of the Financial Accounting Standards Board (“FASB”) Accounting Standards Codification Topic 946 Financial Services – Investment Companies.
| | THE GUGGENHEIM FUNDS SEMI-ANNUAL REPORT | 23 |
NOTES TO FINANCIAL STATEMENTS (Unaudited)(continued) |
The following significant accounting policies are in conformity with U.S. generally accepted accounting principles (“U.S. GAAP”) and are consistently followed by the Trust. This requires management to make estimates and assumptions that affect the reported amount of assets and liabilities, contingent assets and liabilities at the date of the financial statements, and the reported amounts of revenues and expenses during the reporting period. Actual results could differ from these estimates. All time references are based on Eastern Time.
The NAV of each Class of the Fund is calculated by dividing the market value of the Fund’s securities and other assets, less all liabilities, attributable to the Class by the number of outstanding shares of the Class.
(a) Valuation of Investments
The Board of Trustees of the Fund (the “Board”) has adopted policies and procedures for the valuation of the Fund’s investments (the “Valuation Procedures”). Pursuant to the Valuation Procedures, the Board has delegated to a valuation committee, consisting of representatives from Guggenheim’s investment management, fund administration, legal and compliance departments (the “Valuation Committee”), the day-to-day responsibility for implementing the Valuation Procedures, including, under most circumstances, the responsibility for determining the fair value of the Fund’s securities and/or other assets.
Valuations of the Fund’s securities and other assets are supplied primarily by pricing services appointed pursuant to the processes set forth in the Valuation Procedures. The Valuation Committee convenes monthly, or more frequently as needed, to review the valuation of all assets which have been fair valued for reasonableness. The Fund’s officers, through the Valuation Committee and consistent with the monitoring and review responsibilities set forth in the Valuation Procedures, regularly review procedures used and valuations provided by the pricing services.
If the pricing service cannot or does not provide a valuation for a particular investment or such valuation is deemed unreliable, such investment is fair valued by the Valuation Committee.
Equity securities listed or traded on a recognized U.S. securities exchange or the National Association of Securities Dealers Automated Quotations (“NASDAQ”) National Market System shall generally be valued on the basis of the last sale price on the primary U.S. exchange or market on which the security is listed or traded; provided, however, that securities listed on NASDAQ will be valued at the NASDAQ Official Closing Price, which may not necessarily represent the last sale price. If there is no sale on the valuation date, exchange-traded U.S. equity securities will be valued on the basis of the last bid price.
Open-end investment companies are valued at their NAV as of the close of business, on the valuation date. Exchange-traded funds are valued at the last quoted sale price.
24 | THE GUGGENHEIM FUNDS SEMI-ANNUAL REPORT | |
NOTES TO FINANCIAL STATEMENTS (Unaudited)(continued) |
Investments for which market quotations are not readily available are fair-valued as determined in good faith by GI, subject to review and approval by the Valuation Committee, pursuant to methods established or ratified by the Board. Valuations in accordance with these methods are intended to reflect each security’s (or asset’s or liability’s) “fair value”. Each such determination is based on a consideration of all relevant factors, which are likely to vary from one pricing context to another. Examples of such factors may include, but are not limited to market prices; sale prices; broker quotes; and models which derive prices based on inputs such as prices of securities with comparable maturities and characteristics, or based on inputs such as anticipated cash flows or collateral, spread over U.S. Treasury securities, and other information analysis.
(b) Foreign Taxes
The Fund may be subject to foreign taxes (a portion of which may be reclaimable) on income, stock dividends, capital gains on investments or certain foreign currency transactions. All foreign taxes are recorded in accordance with the applicable foreign tax regulations and rates that exist in the foreign jurisdictions in which the Fund invests. These foreign taxes, if any, are paid by the Fund and reflected in its Statement of Operations as follows: foreign taxes withheld at source are presented as a reduction of income and foreign taxes on capital gains from sales of investments are included with the net realized gain (loss) on investments. Foreign taxes payable or deferred as of March 31, 2021, if any, are disclosed in the Fund’s Statement of Assets and Liabilities.
(c) Security Transactions
Security transactions are recorded on the trade date for financial reporting purposes. Realized gains and losses from securities transactions are recorded using the identified cost basis. Proceeds from lawsuits related to investment holdings are recorded as a reduction to cost if the securities are still held and as realized gains if no longer held in the Fund. Dividend income is recorded on the ex-dividend date, net of applicable taxes withheld by foreign countries, if any. Taxable non-cash dividends are recorded as dividend income. Interest income, including amortization of premiums and accretion of discounts, is accrued on a daily basis. Dividend income from Real Estate Investment Trusts (“REITs”) is recorded based on the income included in the distributions received from the REIT investments using published REIT classifications, including some management estimates when actual amounts are not available. Distributions received in excess of this estimated amount are recorded as a reduction of the cost of investments or reclassified to realized gains. The actual amounts of income, return of capital, and realized gains are only determined by each REIT after its fiscal year-end, and may differ from the estimated amounts.
(d) Distributions
Distributions of net investment income and net realized gains, if any, are declared and paid at least annually. Dividends are reinvested in additional shares, unless shareholders request payment in cash. Distributions are recorded on the ex-dividend date and are determined in accordance with U.S. federal income tax regulations which may differ from U.S. GAAP.
| | THE GUGGENHEIM FUNDS SEMI-ANNUAL REPORT | 25 |
NOTES TO FINANCIAL STATEMENTS (Unaudited)(continued) |
(e) Class Allocations
Interest and dividend income, most expenses, all realized gains and losses, and all unrealized appreciation and depreciation are allocated to the classes based upon the value of the outstanding shares in each Class. Certain costs, such as distribution and service fees are charged directly to specific classes. In addition, certain expenses have been allocated to the individual Funds in the Trust based on the respective net assets of each Fund included in the Trust.
(f) Earnings Credits
Under the fee arrangement with the custodian, the Fund may earn credits based on overnight custody cash balances. These credits are utilized to reduce related custodial expenses. The custodian fees disclosed in the Statement of Operations are before the reduction in expense from the related earnings credits, if any. Earnings credits for the period ended March 31, 2021, are disclosed in the Statement of Operations.
(g) Cash
The Fund may leave cash overnight in its cash account with the custodian. Periodically, the Fund may have cash due to the custodian bank as an overdraft balance. A fee is incurred on this overdraft, calculated by multiplying the overdraft by a rate based on the federal funds rate, which was 0.06% at March 31, 2021.
(h) Indemnifications
Under the Fund’s organizational documents, its Trustees and Officers are indemnified against certain liabilities arising out of the performance of their duties to the Trust. In addition, throughout the normal course of business, the Fund enters into contracts that contain a variety of representations and warranties which provide general indemnifications. The Fund’s maximum exposure under these arrangements is unknown, as this would involve future claims that may be made against the Fund and/or its affiliates that have not yet occurred. However, based on experience, the Fund expects the risk of loss to be remote.
Note 2 – Investment Advisory Agreement and Other Agreements
Under the terms of an investment advisory contract, the Fund pays GI investment advisory fees calculated at an annualized rate of 0.75% of the average daily net assets of the Fund.
GI pays operating expenses on behalf of the Trust, such as audit and accounting related services, legal services, custody, printing and mailing, among others, on a pass-through basis. Such expenses are allocated to various Funds within the complex based on relative net assets.
The Board has adopted Distribution Plans related to the offering of A-Class, C-Class and P-Class shares pursuant to Rule 12b-1 under the 1940 Act. The plans provide for payments at an annual rate of 0.25% of the average daily net assets of the Fund’s A-Class and P-Class shares, and 1.00% of the average daily net assets of the Fund’s C-Class shares.
26 | THE GUGGENHEIM FUNDS SEMI-ANNUAL REPORT | |
NOTES TO FINANCIAL STATEMENTS (Unaudited)(continued) |
The investment advisory contract for the Fund provides that the total expenses be limited to a percentage of average net assets for each class of shares, exclusive of brokerage costs, dividends or interest on securities sold short, expenses of other investment companies in which the Fund invests, interest, taxes, litigation, indemnification and extraordinary expenses. The limits are listed below:
| | Limit | | | Effective
Date | | | Contract
End Date | |
A-Class | | | 1.30 | %1 | | | 01/03/20 | | | | 02/01/22 | |
C-Class | | | 2.05 | %1 | | | 01/03/20 | | | | 02/01/22 | |
P-Class | | | 1.30 | %1 | | | 01/03/20 | | | | 02/01/22 | |
Institutional Class | | | 1.05 | %1 | | | 01/03/20 | | | | 02/01/22 | |
1 | Prior to January 3, 2020, the expense limit for A-Class, C-Class and P-Class shares of the Fund was 1.42%, 2.12% and 1.32%, respectively. |
GI is entitled to reimbursement by the Fund for fees waived or expenses reimbursed during any of the previous 36 months, beginning on the date of the expense limitation agreement, if on any day the estimated operating expenses are less than the indicated percentages. For purposes of this arrangement, GI is entitled to recoupment of previously waived fees or reimbursed expenses for 36 months from the date of the waiver or reimbursement by GI. At March 31, 2021, the amount of fees waived or expenses reimbursed that are subject to recoupment are presented in the following table:
Fund | | 2021 | | | 2022 | | | 2023 | | | 2024 | | | Fund
Total | |
A-Class | | $ | — | | | $ | — | | | $ | 19,600 | | | $ | 9,774 | | | $ | 29,374 | |
C-Class | | | — | | | | 1,152 | | | | 15,935 | | | | 2,367 | | | | 19,454 | |
P-Class | | | — | | | | 3,297 | | | | 2,961 | | | | 6 | | | | 6,264 | |
Institutional Class | | | — | | | | — | | | | 26,262 | | | | 14,930 | | | | 41,192 | |
During the period ended March 31, 2021, GI recouped $3,126 from the Fund.
For the period ended March 31, 2021, GFD retained sales charges of $192,037 relating to sales of A-Class shares of the Trust.
Certain trustees and officers of the Trust are also officers of GI and/or GFD. The Trust does not compensate its officers or trustees who are officers, directors and/or employees of GI or GFD.
MUFG Investor Services (US), LLC (“MUIS”) acts as the Fund’s administrator, transfer agent and accounting agent. As administrator, transfer agent and accounting agent, MUIS maintains the books and records of the Fund’s securities and cash. The Bank of New York Mellon Corp. (“BNY”) acts as the Fund’s custodian. As custodian, BNY is responsible for the custody of the Fund’s assets. For providing the aforementioned administrative and accounting services, MUIS is entitled to receive a monthly fee equal to a percentage of the Fund’s average daily net assets and
| | THE GUGGENHEIM FUNDS SEMI-ANNUAL REPORT | 27 |
NOTES TO FINANCIAL STATEMENTS (Unaudited)(continued) |
out of pocket expenses. For providing the aforementioned transfer agent and custodian services, MUIS and BNY are entitled to receive a monthly fee based on the number of transactions during the month and the number of accounts under management, subject to certain minimum monthly fees, and out of pocket expenses.
Note 3 – Federal Income Tax Information
The Fund intends to comply with the provisions of Subchapter M of the Internal Revenue Code applicable to regulated investment companies and will distribute substantially all taxable net investment income and capital gains sufficient to relieve the Fund from all, or substantially all, federal income, excise and state income taxes. Therefore, no provision for federal or state income tax or federal excise tax is required.
Tax positions taken or expected to be taken in the course of preparing the Fund’s tax returns are evaluated to determine whether the tax positions are “more-likely-than-not” of being sustained by the applicable tax authority. Tax positions not deemed to meet the more-likely-than-not threshold would be recorded as a tax benefit or expense in the current year. Management has analyzed the Fund’s tax positions taken, or to be taken, on U.S. federal income tax returns for all open tax years, and has concluded that no provision for income tax is required in the Fund’s financial statements. The Fund’s U.S. federal income tax returns are subject to examination by the Internal Revenue Service (“IRS”) for a period of three years after they are filed.
At March 31, 2021, the cost of investments for U.S. federal income tax purposes, the aggregate gross unrealized appreciation for all investments for which there was an excess of value over tax cost, and the aggregate gross unrealized depreciation for all investments for which there was an excess of tax cost over value, were as follows:
| | Tax
Cost | | | Tax
Unrealized
Appreciation | | | Tax
Unrealized
Depreciation | | | Net Tax
Unrealized
Appreciation | |
| | | $ | 337,327,087 | | | $ | 116,056,420 | | | $ | (7,264,511 | ) | | $ | 108,791,909 | |
Note 4 – Fair Value Measurement
In accordance with U.S. GAAP, fair value is defined as the price that the Fund would receive to sell an investment or pay to transfer a liability in an orderly transaction with an independent buyer in the principal market, or in the absence of a principal market, the most advantageous market for the investment or liability. U.S. GAAP establishes a three-tier fair value hierarchy based on the types of inputs used to value assets and liabilities and requires corresponding disclosure. The hierarchy and the corresponding inputs are summarized below:
Level 1 — | quoted prices in active markets for identical assets or liabilities. |
28 | THE GUGGENHEIM FUNDS SEMI-ANNUAL REPORT | |
NOTES TO FINANCIAL STATEMENTS (Unaudited)(continued) |
Level 2 — | significant other observable inputs (for example quoted prices for securities that are similar based on characteristics such as interest rates, prepayment speeds, credit risk, etc.). |
Level 3 — | significant unobservable inputs based on the best information available under the circumstances, to the extent observable inputs are not available, which may include assumptions. |
The types of inputs available depend on a variety of factors, such as the type of security and the characteristics of the markets in which it trades, if any. Fair valuation determinations that rely on fewer or no observable inputs require greater judgment. Accordingly, fair value determinations for Level 3 securities require the greatest amount of judgment.
The inputs or methodologies used for valuing securities are not necessarily an indication of the risk associated with investing in those securities. The suitability of the techniques and sources employed to determine fair valuation are regularly monitored and subject to change.
Note 5 – Securities Transactions
For the period ended March 31, 2021, the cost of purchases and proceeds from sales of investment securities, excluding government securities, short-term investments and derivatives, were as follows:
| | Purchases | | | Sales | |
| | | $ | 52,090,795 | | | $ | 90,074,437 | |
Note 6 – Line of Credit
The Trust, along with other affiliated trusts, secured a 364-day committed, $1,230,000,000 line of credit from Citibank, N.A., which was in place through October 2, 2020, at which time the line of credit was renewed. A Fund may draw (borrow) from the line of credit as a temporary measure for emergency purposes, to facilitate redemption requests, or for other short-term liquidity purposes consistent with the Fund’s investment objective and program. For example, it may be advantageous for the Fund to borrow money rather than sell existing portfolio positions to meet redemption requests. Fees related to borrowings, if any, vary under this arrangement between the greater of Citibank’s “base rate”, LIBOR plus 1%, or the federal funds rate plus 1/2 of 1%.
The commitment fee that may be paid by the Fund is at an annualized rate of 0.15% of the average daily amount of its allocated unused commitment amount. The commitment fee amount is allocated to the individual Funds based on the respective net assets of each participating Fund and is referenced in the Statement of Operations under “Line of credit fees”. The Fund did not have any borrowings under this agreement as of and for the period ended March 31, 2021.
| | THE GUGGENHEIM FUNDS SEMI-ANNUAL REPORT | 29 |
NOTES TO FINANCIAL STATEMENTS (Unaudited)(continued) |
Note 7 – Merger
Effective on the close of business January 3, 2020, the Guggenheim SMid Cap Value Institutional Fund (the “Acquired Fund”) reorganized with and into newly formed Institutional Class shares of the Fund (the “Acquiring Fund”). The purpose of the reorganization was to combine two funds managed by GI with comparable investment objectives and strategies. The reorganization was treated as a tax-free reorganization for federal income tax purposes and, accordingly, the basis of the assets of the Acquiring Fund reflected the historical basis of the assets of the Acquired Fund as of the date of the Reorganization. For financial reporting purposes, the Acquiring Fund was deemed to be the accounting survivor and assets received and shares issued by the Acquiring Fund were recorded at fair value.
In the merger, shareholders of the Acquired Fund received newly issued shares of the Acquiring Fund’s Institutional Class shares, having a NAV equal to the NAV of their holdings of the Acquired Fund’s shares as determined at the close of business on January 3, 2020, which was $10.20. Accordingly, shareholders received the same number of shares of the newly created Institutional Class of the Acquiring Fund with an equivalent value to shares of the Acquired Fund held immediately prior to the merger. As such, no share ratio conversions were required to effect this merger. Relevant details pertaining to the merger as of January 3, 2020 are as follows:
| | Acquired Fund
Shares prior to
reorganization | | | Institutional Class
Shares issued by
Acquiring Fund | | | Net Assets | |
Acquiring Fund | | | | | | | | | | $ | 381,345,573 | |
Acquired Fund | | | 6,532,159 | | | | 6,532,159 | | | | 66,601,569 | |
| | | | | | | | | | | $ | 447,947,142 | |
Investments
The cost, fair value and net unrealized appreciation (depreciation) of the investments of the Acquired Fund as of the date of the merger, is as follows:
Cost of investments | | $ | 61,009,544 | |
Fair value of investments | | $ | 66,604,886 | |
Net unrealized appreciation (depreciation) on investments | | $ | 5,595,342 | |
Cost and Expenses
The Investment Adviser agreed to cover all costs and expenses associated with the merger (“merger fees”). No merger fees were borne by the Acquired Fund or the Acquiring Fund.
30 | THE GUGGENHEIM FUNDS SEMI-ANNUAL REPORT | |
NOTES TO FINANCIAL STATEMENTS (Unaudited)(concluded) |
Pro Forma Results of Operations
Assuming the acquisition had been completed on October 1, 2019, the beginning of the fiscal reporting period of the Fund, the pro forma results of operations for the year ended September 30, 2020, would be as follows:
SMid Cap Value Fund | | | |
Net investment income (loss) | | $ | 6,013,737 | |
Net realized and unrealized gains (loss) | | $ | (48,729,551 | ) |
Change in net assets resulting from operations | | $ | (42,715,814 | ) |
Because the combined investment portfolios have been managed as a single integrated portfolio since the acquisition was completed, it is not practicable to separate the amounts of revenue and earnings of Guggenheim SMid Cap Value Institutional Fund that have been included in the Fund’s Statement of Operations since January 3, 2020.
Note 8 – COVID-19
The global ongoing crisis caused by the outbreak of COVID-19 and the current recovery underway is causing disruption to consumer demand and economic output and supply chains. There are still travel restrictions and quarantines, and adverse impacts on local and global economies. Investors should be aware that in light of the current uncertainty, volatility and distress in economies, financial markets, and labor and public health conditions around the world, the Funds’ investments and a shareholder’s investment in a Fund are subject to sudden and substantial losses, increased volatility and other adverse events. Firms through which investors invest with the Fund, the Fund, its service providers, the markets in which it invests and market intermediaries are also impacted by quarantines and similar measures intended to respond to and contain the ongoing pandemic, which can obstruct their functioning and subject them to heightened operational and other risks.
Note 9 – Subsequent Events
The Fund evaluated subsequent events through the date the financial statements were available for issue and determined there were no material events that would require adjustment to or disclosure in the Fund’s financial statements.
| | THE GUGGENHEIM FUNDS SEMI-ANNUAL REPORT | 31 |
OTHER INFORMATION (Unaudited) |
Delivery of Shareholder Reports
Paper copies of the Fund’s annual and semi-annual shareholder reports are not sent by mail, unless you specifically request paper copies of the reports from a fund or from your financial intermediary. Instead, the reports are made available on a website, and you are notified by mail each time a report is posted and provided with a website link to access the report.
You may elect to receive all future shareholder reports in paper free of charge. If you hold shares of a fund directly, you can inform the Fund that you wish to receive paper copies of reports by calling 800.820.0888. If you hold shares of a fund through a financial intermediary, please contact the financial intermediary to make this election. Your election to receive reports in paper may apply to all Guggenheim Funds in which you are invested and may apply to all Guggenheim funds held with your financial intermediary.
Proxy Voting Information
A description of the policies and procedures that the Trust uses to determine how to vote proxies relating to securities held in the Fund’s portfolio is available, without charge and upon request, by calling 800.820.0888. This information is also available from the EDGAR database on the SEC’s website at https://www.sec.gov.
Information regarding how the Fund voted proxies relating to portfolio securities during the most recent 12-month period ended June 30 is available without charge, upon request, by calling 800.820.0888. This information is also available from the EDGAR database on the SEC’s website at https://www.sec.gov.
Sector Classification
Information in the Schedule of Investments is categorized by sectors using sector-level Classifications defined by the Bloomberg Industry Classification System, a widely recognized industry classification system provider. The Fund’s registration statement has investment policies relating to concentration in specific sectors/industries. For purposes of these investment policies, the Fund usually classifies sectors/industries based on industry-level Classifications used by widely recognized industry classification system providers such as Bloomberg Industry Classification System, Global Industry Classification Standards and Barclays Global Classification Scheme.
Quarterly Portfolio Schedules Information
The Trust files its complete schedule of portfolio holdings with the SEC for the first and third quarters of each fiscal year as an exhibit to its reports on Form N-PORT, and for reporting periods ended prior to March 31, 2019, filed such information on Form N-Q. The Fund’s Forms N-PORT and N-Q are available on the SEC’s website at https://www.sec.gov. Copies of the portfolio holdings are also available to shareholders, without charge and upon request, by calling 800.820.0888.
32 | THE GUGGENHEIM FUNDS SEMI-ANNUAL REPORT | |
INFORMATION ON BOARD OF TRUSTEES AND OFFICERS (Unaudited) |
A Board of Trustees oversees the Trust, as well as other trusts of GI, in which its members have no stated term of service, and continue to serve after election until resignation. The Statement of Additional Information includes further information about Fund Trustees and Officers, and can be obtained without charge by visiting guggenheiminvestments.com or by calling 800.820.0888.
Name, Address*
and Year of Birth | Position(s)
Held with
Trust | Term of Office
and Length of
Time Served** | Principal Occupation(s)
During Past Five Years | Number of
Portfolios
in Fund
Complex
Overseen | Other
Directorships Held
by Trustees*** |
INDEPENDENT TRUSTEES | | | |
Randall C. Barnes (1951) | Trustee and Chair of the Valuation Oversight Committee | Since 2014 (Trustee) Since 2020 (Chair of the Valuation Oversight Committee) | Current: Private Investor (2001-present). Former: Senior Vice President and Treasurer, PepsiCo, Inc. (1993-1997); President, Pizza Hut International (1991-1993); Senior Vice President, Strategic Planning and New Business Development, PepsiCo, Inc. (1987-1990). | 157 | Current: Purpose Investments Funds (2013-present). Former: Managed Duration Investment Grade Municipal Fund (2006-2016). |
Angela Brock-Kyle (1959) | Trustee | Since 2019 | Current: Founder and Chief Executive Officer, B.O.A.R.D.S. (2013-present). Former: Senior Leader, TIAA (1987-2012). | 156 | Current: Bowhead Insurance GP, LLC (2020-present); Hunt Companies, Inc. (2019-present). Former: Infinity Property & Casualty Corp. (2014-2018). |
Thomas F. Lydon, Jr. (1960) | Trustee and Chair of the Contracts Review Committee | Since 2019 (Trustee) Since 2020 (Chair of the Contracts Review Committee) | Current: President, Global Trends Investments (1996-present); Co-Chief Executive Officer, ETF Flows, LLC (2019-present); Chief Executive Officer, Lydon Media (2016-present). | 156 | Current: US Global Investors (GROW) (1995-present). Former: Harvest Volatility Edge Trust (3) (2017-2019). |
| | THE GUGGENHEIM FUNDS SEMI-ANNUAL REPORT | 33 |
INFORMATION ON BOARD OF TRUSTEES AND OFFICERS (Unaudited)(continued) |
Name, Address*
and Year of Birth | Position(s)
Held with
Trust | Term of Office
and Length of
Time Served** | Principal Occupation(s)
During Past Five Years | Number of
Portfolios
in Fund
Complex
Overseen | Other
Directorships Held
by Trustees*** |
INDEPENDENT TRUSTEES - continued | | |
Ronald A. Nyberg (1953) | Trustee and Chair of the Nominating and Governance Committee | Since 2014 | Current: Of Counsel, Momkus LLP (2016-present). Former: Partner, Nyberg & Cassioppi, LLC (2000-2016); Executive Vice President, General Counsel, and Corporate Secretary, Van Kampen Investments (1982-1999). | 157 | Current: PPM Funds (2) (2018-present); Edward-Elmhurst Healthcare System (2012-present). Former: Western Asset Inflation-Linked Opportunities & Income Fund (2004-2020); Western Asset Inflation-Linked Income Fund (2003-2020); Managed Duration Investment Grade Municipal Fund (2003-2016). |
Sandra G. Sponem (1958) | Trustee and Chair of the Audit Committee | Since 2019 (Trustee) Since 2020 (Chair of the Audit Committee) | Current: Retired. Former: Senior Vice President and Chief Financial Officer, M.A. Mortenson-Companies, Inc. (2007-2017). | 156 | Current: SPDR Series Trust (81) (2018-present); SPDR Index Shares Funds (30) (2018-present); SSGA Active Trust (14) (2018-present). Former: SSGA Master Trust (1) (2018-2020). |
34 | THE GUGGENHEIM FUNDS SEMI-ANNUAL REPORT | |
INFORMATION ON BOARD OF TRUSTEES AND OFFICERS (Unaudited)(continued) |
Name, Address*
and Year of Birth | Position(s)
Held with
Trust | Term of Office
and Length of
Time Served** | Principal Occupation(s)
During Past Five Years | Number of
Portfolios
in Fund
Complex
Overseen | Other
Directorships Held
by Trustees*** |
INDEPENDENT TRUSTEES - concluded | | |
Ronald E.
Toupin, Jr. (1958) | Trustee, Chair of the Board and Chair of the Executive Committee | Since 2014 | Current: Portfolio Consultant (2010-present); Member, Governing Council, Independent Directors Council (2013-present); Governor, Board of Governors, Investment Company Institute (2018-present). Former: Member, Executive Committee, Independent Directors Council (2016-2018); Vice President, Manager and Portfolio Manager, Nuveen Asset Management (1998-1999); Vice President, Nuveen Investment Advisory Corp. (1992-1999); Vice President and Manager, Nuveen Unit Investment Trusts (1991-1999); and Assistant Vice President and Portfolio Manager, Nuveen Unit Investment Trusts (1988-1999), each of John Nuveen & Co., Inc. (1982-1999). | 156 | Former: Western Asset Inflation-Linked Opportunities & Income Fund (2004-2020); Western Asset Inflation-Linked Income Fund (2003-2020); Managed Duration Investment Grade Municipal Fund (2003-2016). |
| | THE GUGGENHEIM FUNDS SEMI-ANNUAL REPORT | 35 |
INFORMATION ON BOARD OF TRUSTEES AND OFFICERS (Unaudited)(continued) |
Name, Address*
and Year of Birth | Position(s)
Held with
Trust | Term of Office
and Length of
Time Served** | Principal Occupation(s)
During Past Five Years | Number of
Portfolios
in Fund
Complex
Overseen | Other
Directorships Held
by Trustees*** |
INTERESTED TRUSTEE | |
Amy J. Lee**** (1961) | Trustee, Vice President and Chief Legal Officer | Since 2018 (Trustee) Since 2014 (Chief Legal Officer) Since 2007 (Vice President) | Current: Interested Trustee, certain other funds in the Fund Complex (2018-present); Chief Legal Officer, certain other funds in the Fund Complex (2014-present); Vice President, certain other funds in the Fund Complex (2007-present); Senior Managing Director, Guggenheim Investments (2012-present). Former: President and Chief Executive Officer, certain other funds in the Fund Complex (2017-2019); Vice President, Associate General Counsel and Assistant Secretary, Security Benefit Life Insurance Company and Security Benefit Corporation (2004-2012). | 156 | None. |
* | The business address of each Trustee is c/o Guggenheim Investments, 227 West Monroe Street, Chicago, Illinois 60606. |
** | Each Trustee serves an indefinite term, until his or her successor is elected and qualified. Time served includes time served in the respective position for the Predecessor Corporation. |
*** | Each Trustee also serves on the Boards of Trustees of Guggenheim Funds Trust, Guggenheim Variable Funds Trust, Guggenheim Strategy Funds Trust, Fiduciary/Claymore Energy Infrastructure Fund, Guggenheim Taxable Municipal Bond & Investment Grade Debt Trust, Guggenheim Strategic Opportunities Fund, Guggenheim Enhanced Equity Income Fund, Guggenheim Energy & Income Fund, Guggenheim Credit Allocation Fund, Rydex Series Funds, Rydex Dynamic Funds, Rydex Variable Trust and Transparent Value Trust. Messrs. Barnes and Nyberg also serve on the Board of Trustees of Advent Convertible & Income Fund. |
**** | This Trustee is deemed to be an “interested person” of the Fund under the 1940 Act by reason of her position with the Fund’s Investment Manager and/or the parent of the Investment Manager. |
36 | THE GUGGENHEIM FUNDS SEMI-ANNUAL REPORT | |
INFORMATION ON BOARD OF TRUSTEES AND OFFICERS (Unaudited)(continued) |
Name, Address*
and Year of Birth | Position(s)
Held with
Trust | Term of Office
and Length of
Time Served** | Principal Occupation(s)
During Past Five Years |
OFFICERS | | | |
Brian E. Binder (1972) | President and Chief Executive Officer | Since 2018 | Current: President and Chief Executive Officer, certain other funds in the Fund Complex (2018-present); President, Chief Executive Officer and Chairman of the Board of Managers, Guggenheim Funds Investment Advisors, LLC (2018-present); President and Chief Executive Officer, Security Investors, LLC (2018-present); Board Member of Guggenheim Partners Fund Management (Europe) Limited (2018-present); Senior Managing Director and Chief Administrative Officer, Guggenheim Investments (2018-present). Former: Managing Director and President, Deutsche Funds, and Head of US Product, Trading and Fund Administration, Deutsche Asset Management (2013-2018); Managing Director, Head of Business Management and Consulting, Invesco Ltd. (2010-2012). |
James M. Howley (1972) | Assistant Treasurer | Since 2014 | Current: Managing Director, Guggenheim Investments (2004-present); Assistant Treasurer, certain other funds in the Fund Complex (2006-present). Former: Manager, Mutual Fund Administration of Van Kampen Investments, Inc. (1996-2004). |
Mark E. Mathiasen (1978) | Secretary | Since 2014 | Current: Secretary, certain other funds in the Fund Complex (2007-present); Managing Director, Guggenheim Investments (2007-present). |
Glenn McWhinnie (1969) | Assistant Treasurer | Since 2016 | Current: Vice President, Guggenheim Investments (2009-present); Assistant Treasurer, certain other funds in the Fund Complex (2016-present). |
Michael P. Megaris (1984) | Assistant Secretary | Since 2014 | Current: Assistant Secretary, certain other funds in the Fund Complex (2014-present); Director, Guggenheim Investments (2012-present). |
| | THE GUGGENHEIM FUNDS SEMI-ANNUAL REPORT | 37 |
INFORMATION ON BOARD OF TRUSTEES AND OFFICERS (Unaudited)(continued) |
Name, Address*
and Year of Birth | Position(s)
Held with
Trust | Term of Office
and Length of
Time Served** | Principal Occupation(s)
During Past Five Years |
OFFICERS - continued | |
Elisabeth Miller (1968) | Chief Compliance Officer | Since 2012 | Current: Chief Compliance Officer, certain other funds in the Fund Complex (2012-present); Senior Managing Director, Guggenheim Investments (2012-present). Vice President, Guggenheim Funds Distributors, LLC (2014-present). Former: Chief Compliance Officer, Security Investors, LLC and Guggenheim Funds Investment Advisors, LLC (2012-2018); Chief Compliance Officer, Guggenheim Distributors, LLC (2009-2014); Senior Manager, Security Investors, LLC (2004-2014); Senior Manager, Guggenheim Distributors, LLC (2004-2014). |
Margaux Misantone (1978) | AML Officer | Since 2017 | Current: Chief Compliance Officer, Security Investors, LLC and Guggenheim Funds Investment Advisors, LLC (2018-present); AML Officer, Security Investors, LLC and certain other funds in the Fund Complex (2017-present); Managing Director, Guggenheim Investments (2015-present). Former: Assistant Chief Compliance Officer, Security Investors, LLC and Guggenheim Funds Investments Advisors, LLC (2015-2018). |
Kimberly J. Scott (1974) | Assistant Treasurer | Since 2014 | Current: Director, Guggenheim Investments (2012-present); Assistant Treasurer, certain other funds in the Fund Complex (2012-present). Former: Financial Reporting Manager, Invesco, Ltd. (2010-2011); Vice President/Assistant Treasurer, Mutual Fund Administration for Van Kampen Investments, Inc./Morgan Stanley Investment Management (2009-2010); Manager of Mutual Fund Administration, Van Kampen Investments, Inc./Morgan Stanley Investment Management (2005-2009). |
Bryan Stone (1979) | Vice President | Since 2014 | Current: Vice President, certain other funds in the Fund Complex (2014-present); Managing Director, Guggenheim Investments (2013-present). Former: Senior Vice President, Neuberger Berman Group LLC (2009-2013); Vice President, Morgan Stanley (2002-2009). |
38 | THE GUGGENHEIM FUNDS SEMI-ANNUAL REPORT | |
INFORMATION ON BOARD OF TRUSTEES AND OFFICERS (Unaudited)(concluded) |
Name, Address*
and Year of Birth | Position(s)
Held with
Trust | Term of Office
and Length of
Time Served** | Principal Occupation(s)
During Past Five Years |
OFFICERS - concluded | |
John L. Sullivan (1955) | Chief Financial Officer, Chief Accounting Officer and Treasurer | Since 2014 | Current: Chief Financial Officer, Chief Accounting Officer and Treasurer, certain other funds in the Fund Complex (2010-present); Senior Managing Director, Guggenheim Investments (2010-present). Former: Managing Director and Chief Compliance Officer, each of the funds in the Van Kampen Investments fund complex (2004-2010); Managing Director and Head of Fund Accounting and Administration, Morgan Stanley Investment Management (2002-2004); Chief Financial Officer and Treasurer, Van Kampen Funds (1996-2004). |
Jon Szafran (1989) | Assistant Treasurer | Since 2017 | Current: Vice President, Guggenheim Investments (2017-present); Assistant Treasurer, certain other funds in the Fund Complex (2017-present). Former: Assistant Treasurer of Henderson Global Funds and Manager of US Fund Administration, Henderson Global Investors (North America) Inc. (“HGINA”), (2017); Senior Analyst of US Fund Administration, HGINA (2014–2017); Senior Associate of Fund Administration, Cortland Capital Market Services, LLC (2013-2014); Experienced Associate, PricewaterhouseCoopers LLP (2012-2013). |
* | The business address of each officer is c/o Guggenheim Investments, 227 West Monroe Street, Chicago, Illinois 60606. |
** | Each officer serves an indefinite term, until his or her successor is duly elected and qualified. |
| | THE GUGGENHEIM FUNDS SEMI-ANNUAL REPORT | 39 |
GUGGENHEIM INVESTMENTS PRIVACY NOTICE (Unaudited) |
Who We Are
This Privacy Notice describes the data protection practices of Guggenheim Investments. Guggenheim Investments as used herein refers to the affiliated investment management businesses of Guggenheim Partners, LLC: Guggenheim Funds Investment Advisors, LLC, Guggenheim Partners Investment Management, LLC, Guggenheim Funds Distributors, LLC, Security Investors, LLC, Guggenheim Investment Advisors (Europe) Limited, Guggenheim Real Estate, LLC, GS Gamma Advisors, LLC, Guggenheim Partners India Management, LLC, Guggenheim Partners Europe Limited, as well as the funds in the Guggenheim Funds complex (the “Funds”) (“Guggenheim Investments,” “we,” “us,” or “our”).
Guggenheim Partners Investment Management Holdings, LLC, located at 330 Madison Avenue, New York, New York 10017 is the data controller for your information. The affiliates who are also controllers of certain of your information are: Guggenheim Investment Advisors (Europe) Limited, Guggenheim Partners Europe Limited, Guggenheim Partners, LLC, Guggenheim Funds Investment Advisors, LLC, Guggenheim Partners Investment Management, LLC, Guggenheim Funds Distributors, LLC and Security Investors, LLC, as well as the Funds.
Our Commitment to You
Guggenheim Investments considers your privacy our utmost concern. When you become our client or investor, you entrust us with not only your hard-earned money but also with your personal and financial information. Because we have access to your private information, we hold ourselves to the highest standards in its safekeeping and use. We strictly limit how we share your information with others, whether you are a current or former Guggenheim Investments client or investor.
The Information We Collect About You
We collect certain nonpublic personal information about you from information you provide on applications, other forms, our website, and/or from third parties including investment advisors. This information includes Social Security or other tax identification number, assets, income, tax information, retirement and estate plan information, transaction history, account balance, payment history, bank account information, marital status, family relationships, information that we collect on our website through the use of “cookies,” and other personal information that you or others provide to us. We may also collect such information through your inquiries by mail, e-mail or telephone. We may also collect customer due diligence information, as required by applicable law and regulation, through third party service providers.
How We Handle Your Personal Information
The legal basis for using your information as set out in this Privacy Notice is as follows: (a) use of your personal data is necessary to perform our obligations under any contract with you (such as a contract for us to provide financial services to you); or (b) where use of your personal data is not necessary for performance of a contract, use of your personal data is necessary for our
40 | THE GUGGENHEIM FUNDS SEMI-ANNUAL REPORT | |
GUGGENHEIM INVESTMENTS PRIVACY NOTICE (Unaudited)(continued) |
legitimate interests or the legitimate interests of others (for example, to enforce the legal terms governing our services, operate and market our website and other services we offer, ensure safe environments for our personnel and others, make and receive payments, prevent fraud and to know the customer to whom we are providing the services). Some processing is done to comply with applicable law.
In addition to the specific uses described above, we also use your information in the following manner:
| | ● | We use your information in connection with servicing your accounts. |
| | ● | We use information to respond to your requests or questions. For example, we might use your information to respond to your customer feedback. |
| | ● | We use information to improve our products and services. We may use your information to make our website and products better. We may use your information to customize your experience with us. |
| | ● | We use information for security purposes. We may use your information to protect our company and our customers. |
| | ● | We use information to communicate with you. For example, we will communicate with you about your account or our relationship. We may contact you about your feedback. We might also contact you about this Privacy Notice. We may also enroll you in our email newsletter. |
| | ● | We use information as otherwise permitted by law, as we may notify you. |
| | ● | Aggregate/Anonymous Data. We may aggregate and/or anonymize any information collected through the website so that such information can no longer be linked to you or your device (“Aggregate/Anonymous Information”). We may use Aggregate/Anonymous Information for any purpose, including without limitation for research and marketing purposes, and may also share such data with any third parties, including advertisers, promotional partners, and sponsors. |
We do not sell information about current or former clients or their accounts to third parties. Nor do we share this information, except when necessary to complete transactions at your request, to make you aware of investment products and services that we or our affiliates offer, or as permitted or required by law.
We provide information about you to companies and individuals not affiliated with Guggenheim Investments to complete certain transactions or account changes, or to perform services for us related to your account. For example, if you ask to transfer assets from another financial institution to Guggenheim Investments, we must provide certain information about you to that company to complete the transaction. We provide the third party with only the information necessary to carry out its responsibilities and only for that purpose. And we require these third
| | THE GUGGENHEIM FUNDS SEMI-ANNUAL REPORT | 41 |
GUGGENHEIM INVESTMENTS PRIVACY NOTICE (Unaudited)(continued) |
parties to treat your private information with the same high degree of confidentiality that we do. To alert you to other Guggenheim Investments products and services, we share your information within our family of affiliated companies. You may limit our sharing with affiliated companies as set out below. We may also share information with any successor to all or part of our business, or in connection with steps leading up to a merger or acquisition. For example, if part of our business was sold we may give customer information as part of that transaction. We may also share information about you with your consent.
We will release information about you if you direct us to do so, if we are compelled by law to do so, or in other circumstances as permitted by law (for example, to protect your account from fraud).
If you close your account(s) or become an inactive client or investor, we will continue to adhere to the privacy policies and practices described in this notice.
Opt-Out Provisions and Your Data Choices
The law allows you to “opt out” of certain kinds of information sharing with third parties. We do not share personal information about you with any third parties that triggers this opt-out right. This means YOU ARE ALREADY OPTED OUT.
When you are no longer our client or investor, we continue to share your information as described in this notice, and you may contact us at any time to limit our sharing by sending an email to CorporateDataPrivacy@GuggenheimPartners.com.
European Union Data Subjects and certain others: In addition to the choices set forth above, residents of the European Union and certain other jurisdictions have certain rights to (1) request access to or rectification or deletion of information we collect about them, (2) request a restriction on the processing of their information, (3) object to the processing of their information, or (4) request the portability of certain information. To exercise these or other rights, please contact us using the contact information below. We will consider all requests and provide our response within the time period stated by applicable law. Please note, however, that certain information may be exempt from such requests in some circumstances, which may include if we need to keep processing your information for our legitimate interests or to comply with a legal obligation. We may request you provide us with information necessary to confirm your identity before responding to your request.
Residents of France and certain other jurisdictions may also provide us with instructions regarding the manner in which we may continue to store, erase and share your information after your death, and where applicable, the person you have designated to exercise these rights after your death.
How We Protect Privacy Online
We take steps to protect your privacy when you use our web site – www.guggenheiminvestments.com – by using secure forms of online communication, including encryption technology, Secure Socket Layer (SSL) protocol, firewalls and user names and
42 | THE GUGGENHEIM FUNDS SEMI-ANNUAL REPORT | |
GUGGENHEIM INVESTMENTS PRIVACY NOTICE (Unaudited)(concluded) |
passwords. These safeguards vary based on the sensitivity of the information that we collect and store. However, we cannot and do not guarantee that these measures will prevent every unauthorized attempt to access, use, or disclose your information since despite our efforts, no Internet and/or other electronic transmissions can be completely secure. Our web site uses “http cookies”—tiny pieces of information that we ask your browser to store. We use cookies for session management and security features on the Guggenheim Investments web site. We do not use them to pull data from your hard drive, to learn your e-mail address, or to view data in cookies created by other web sites. We will not share the information in our cookies or give others access to it. See the legal information area on our web site for more details about web site security and privacy features.
How We Safeguard Your Personal Information and Data Retention
We restrict access to nonpublic personal information about you to our employees and in some cases to third parties (for example, the service providers described above) as permitted by law. We maintain strict physical, electronic and procedural safeguards that comply with federal standards to guard your nonpublic personal information.
We keep your information for no longer than necessary for the purposes for which it is processed. The length of time for which we retain information depends on the purposes for which we collected and use it and/or as required to comply with applicable laws. Information may persist in copies made for backup and business continuity purposes for additional time.
International Visitors
If you are not a resident of the United States, please be aware that your information may be transferred to, stored and processed in the United States where our servers are located and our databases are operated. The data protection and other laws of the United States and other countries might not be as comprehensive as those in your country.
In such cases, we ensure that a legal basis for such a transfer exists and that adequate protection is provided as required by applicable law, for example, by using standard contractual clauses or by transferring your data to a jurisdiction that has obtained an adequacy finding. Individuals whose data may be transferred on the basis of standard contractual clauses may contact us as described below.
We’ll Keep You Informed
If you have any questions or concerns about how we treat your personal data, we encourage you to consult with us first. You may also contact the relevant supervisory authority.
We reserve the right to modify this policy at any time and will inform you promptly of material changes.
You may access our privacy policy from our web site at www.guggenheiminvestments.com. Should you have any questions regarding our privacy policy, contact us by email at CorporateDataPrivacy@GuggenheimPartners.com.
| | THE GUGGENHEIM FUNDS SEMI-ANNUAL REPORT | 43 |
This page intentionally left blank.
This page intentionally left blank.
This page intentionally left blank.
This page intentionally left blank.
This page intentionally left blank.
This page intentionally left blank.
3.31.2021
Guggenheim Funds Semi-Annual Report
|
Guggenheim Capital Stewardship Fund | | |
GuggenheimInvestments.com | CSF-SEMI-0321x0921 |

| | |
DEAR SHAREHOLDER | 2 |
ECONOMIC AND MARKET OVERVIEW | 3 |
ABOUT SHAREHOLDERS’ FUND EXPENSES | 5 |
CAPITAL STEWARDSHIP FUND | 7 |
NOTES TO FINANCIAL STATEMENTS | 14 |
OTHER INFORMATION | 18 |
INFORMATION ON BOARD OF TRUSTEES AND OFFICERS | 19 |
GUGGENHEIM INVESTMENTS PRIVACY NOTICE | 24 |
| | THE GUGGENHEIM FUNDS SEMI-ANNUAL REPORT | 1 |
Dear Shareholder:
Guggenheim Partners Investment Management, LLC (“GPIM” or the “Investment Adviser”), is pleased to present the shareholder report for Guggenheim Capital Stewardship Fund (the “Fund”). The report covers the semi-annual period ended March 31, 2021.
Concinnity Advisors, LP, serves as the Fund’s sub-adviser (the “Sub-Adviser”).
The Investment Adviser is part of Guggenheim Investments, which represents the investment management businesses of Guggenheim Partners, LLC, (“Guggenheim”) a global, diversified financial services firm.
Guggenheim Funds Distributors, LLC is the distributor of the Funds. Guggenheim Funds Distributors, LLC is affiliated with Guggenheim and the Investment Adviser.
We encourage you to read the Economic and Market Overview section of the report, which follows this letter.
We are committed to providing innovative investment solutions and appreciate the trust you place in us.
Sincerely,
Guggenheim Partners Investment Management, LLC
April 30, 2021
Read a prospectus and summary prospectus (if available) carefully before investing. It contains the investment objectives, risks, charges, expenses and other information, which should be considered carefully before investing. Obtain a prospectus and summary prospectus (if available) at guggenheiminvestments.com or call 800.820.0888.
This material is not intended as a recommendation or as investment advice of any kind, including in connection with rollovers, transfers, and distributions. Such material is not provided in a fiduciary capacity, may not be relied upon for or in connection with the making of investment decisions, and does not constitute a solicitation of an offer to buy or sell securities. All content has been provided for informational or educational purposes only and is not intended to be and should not be construed as legal or tax advice and/or a legal opinion. Always consult a financial, tax and/or legal professional regarding your specific situation.
COVID-19. The global ongoing crisis caused by the outbreak of COVID-19 and the current recovery underway is causing disruption to consumer demand and economic output and supply chains. There are still travel restrictions and quarantines, and adverse impacts on local and global economies. Investors should be aware that in light of the current uncertainty, volatility and distress in economies, financial markets, and labor and public health conditions around the world, the Fund’s investments and a shareholder’s investment in the Fund are subject to investment risk, including the possible loss of the entire principal amount invested. Firms through which investors invest with the Fund, the Fund, its service providers, the markets in which it invests and market intermediaries are also impacted by quarantines and similar measures intended to respond to and contain the ongoing pandemic, which can obstruct their functioning and subject them to heightened operational and other risks.
There can be no assurance that any investment product will achieve its investment objective(s). There are risks associated with investing, including the entire loss of principal invested. Investing involves market risks. The investment return and principal value of any investment product will fluctuate with changes in market conditions. Please read the prospectus for more detailed information regarding these and other risks.
2 | THE GUGGENHEIM FUNDS SEMI-ANNUAL REPORT | |
ECONOMIC AND MARKET OVERVIEW (Unaudited) | March 31, 2021 |
For the six-month period ended March 31, 2021, the Standard & Poor’s 500® (“S&P 500®”) Index returned 19.07% as the equity market continued to climb after the sharp selloff following the outbreak of COVID-19 in March 2020. This increase was in spite of ongoing personal and economic hardships imposed by COVID-19, highlighting the crucial role of policy support in the form of monetary and fiscal stimulus, which has succeeded in averting a lengthy recession in the U.S. These policy initiatives, particularly on the monetary side, increased market liquidity and lowered borrowing rates, reassuring equity investors that the Federal Reserve (the “Fed”) would do everything in its power to maintain market stability.
Our 2021 U.S. economic growth forecast increased during the first quarter of 2021 from an annualized 5.5% to over 7%, factoring in more fiscal stimulus than previously anticipated. This forecast captures the effect of stimulus representing roughly 11% of 2020–2021 gross domestic product (“GDP”), versus the previous calculation of about 8%. We see strength in the consumer sector and in housing activity. In addition, U.S. vaccinations for COVID-19 continue to accelerate, nearing 3 million doses per day by the end of the first quarter. More than 213 million doses have been administered in the U.S. so far, and about 35% of the U.S. population has been fully vaccinated. The U.S. is seeing the best-case scenario unfold in its vaccine rollout, but other countries have not been as fortunate.
Europe’s vaccine rollout hit a major speedbump during the first quarter when questions surrounding the safety of the AstraZeneca vaccine led several major European countries to temporarily suspend distribution. Safety concerns, coupled with supply constraints, meant that less than 10% of the populations of Germany, France, and Italy had been vaccinated by the end of the first quarter, well under the pace needed to reach 70% inoculated by summer. Any delay in ending the pandemic on a global scale has implications for other countries too, including the U.S., where travel and hospitality workers represent a large share of the unemployed.
Despite vaccination delays in Europe and its implications abroad, we saw meaningful improvement in the domestic labor market during the first quarter as states moved forward with business re-openings. Seasonally adjusted initial jobless claims fell by 97,000 to 684,000 in the week ending March 20, 2021, the lowest level since the pandemic began, before seeing an uptick the following week to 719,000. We saw more positive news across the board in the March payroll report with 916,000 jobs added, and with 156,000 more from revisions. Standing in the way of additional labor market gains are local government restrictions on certain sectors, although easing of these restrictions is expected by summer.
Economic developments drove a sharp increase in U.S. Treasury yields. The market pulled forward expectations of the next Fed rate hike from December 2023 to December 2022, while repricing the long-run terminal Fed funds rate estimate to 2.25% from just 0.55% last August. We do not expect the Fed to raise interest rates as early as the market is anticipating, even though we expect strong GDP growth in coming years.
Year-over-year inflation measures will rise over the next several months due to base effects, which may be compounded by supply chain disruptions in the goods sector and potential capacity constraints for certain services. However, these factors could prove to be short-lived, with base effects set to dampen inflation starting in the summer months. Moreover, the Fed is focused on generating sustainably higher inflation. Even if core inflation rises above the Fed’s 2% target in 2021, the Fed’s focus is on a long-term average of 2%. With years of shortfalls to make up, and the Fed now targeting labor market disparities as part of an expanded definition of full employment, we expect policymakers to remain resolutely patient. Any tapering of asset purchases will likely be deferred until later in 2022, with the first rate hike likely to come sometime after that.
Easy financial conditions and low rates will likely support credit over the next few years. With market optimism pulling forward rate hike expectations and causing bond yields to rise, we view this as an opportunity to add incremental yield to portfolios.
For the six-month period ended March 31, 2021, the S&P 500® Index* returned, as noted, 19.07%. The MSCI Europe-Australasia-Far East (“EAFE”) Index* returned 20.08%. The return of the MSCI Emerging Markets Index* was 22.43%.
In the bond market, the Bloomberg Barclays U.S. Aggregate Bond Index* posted a -2.73% return for the six-month period, while the Bloomberg Barclays U.S. Corporate High Yield Index* returned 7.36%. The return of the ICE Bank of America (“BofA”) Merrill Lynch 3-Month U.S. Treasury Bill Index* was 0.06% for the six-month period.
The opinions and forecasts expressed may not actually come to pass. This information is subject to change at any time, based on market and other conditions, and should not be construed as a recommendation of any specific security or strategy.
| | THE GUGGENHEIM FUNDS SEMI-ANNUAL REPORT | 3 |
ECONOMIC AND MARKET OVERVIEW (Unaudited)(concluded) | March 31, 2021 |
*Index Definitions:
The following indices are referenced throughout this report. Indices are unmanaged and not available for direct investment. Index performance does not reflect transaction costs, fees, or expenses.
Bloomberg Barclays U.S. Aggregate Bond Index is a broad-based flagship benchmark that measures the investment grade, U.S. dollar-denominated, fixed-rate taxable bond market, including U.S. Treasuries, government-related and corporate securities, mortgage-backed securities or “MBS” (agency fixed-rate and hybrid adjustable-rate mortgage, or “ARM”, pass-throughs), asset-backed securities (“ABS”), and commercial mortgage-backed securities (“CMBS”) (agency and non-agency).
Bloomberg Barclays U.S. Corporate High Yield Index measures the U.S. dollar-denominated, high yield, fixed-rate corporate bond market. Securities are classified as high yield if the middle rating of Moody’s, Fitch, and S&P is Ba1/BB +/BB + or below.
ICE BofA Merrill Lynch 3-Month U.S. Treasury Bill Index is an unmanaged market Index of U.S. Treasury securities maturing in 90 days that assumes reinvestment of all income.
MSCI EAFE Index is a free float-adjusted market capitalization index that is designed to measure the equity market performance of developed markets, excluding the U.S. & Canada.
MSCI Emerging Markets Index is a free float-adjusted market capitalization weighted index that is designed to measure equity market performance in the global emerging markets.
S&P 500® is a broad-based index, the performance of which is based on the performance of 500 widely held common stocks chosen for market size, liquidity, and industry group representation.
4 | THE GUGGENHEIM FUNDS SEMI-ANNUAL REPORT | |
ABOUT SHAREHOLDERS’ FUND EXPENSES (Unaudited) | |
All mutual funds have operating expenses, and it is important for our shareholders to understand the impact of costs on their investments. Shareholders of a fund incur two types of costs: (i) transaction costs, including sales charges (loads) on purchase payments, reinvested dividends, other distributions, and exchange fees, and (ii) ongoing costs, including management fees, administrative services, and shareholder reports, among others. These ongoing costs, or operating expenses, are deducted from a fund’s gross income and reduce the investment return of the fund.
A fund’s expenses are expressed as a percentage of its average net assets, which is known as the expense ratio. The following examples are intended to help investors understand the ongoing costs (in dollars) of investing in a fund and to compare these costs with the ongoing costs of investing in other mutual funds.
The examples are based on an investment of $1,000 made at the beginning of the period and held for the entire six-month period beginning September 30, 2020 and ending March 31, 2021.
The following tables illustrate the Fund’s costs in two ways:
Table 1. Based on actual Fund return: This section helps investors estimate the actual expenses paid over the period. The “Ending Account Value” shown is derived from the Fund’s actual return, and the fifth column shows the dollar amount that would have been paid by an investor who started with $1,000 in the Fund. Investors may use the information here, together with the amount invested, to estimate the expenses paid over the period. Simply divide the Fund’s account value by $1,000 (for example, an $8,600 account value divided by $1,000 = 8.6), then multiply the result by the number provided under the heading “Expenses Paid During Period.”
Table 2. Based on hypothetical 5% return: This section is intended to help investors compare a fund’s cost with those of other mutual funds. The table provides information about hypothetical account values and hypothetical expenses based on the Fund’s actual expense ratio and an assumed rate of return of 5% per year before expenses, which is not the Fund’s actual return. The hypothetical account values and expenses may not be used to estimate the actual ending account balance or expenses paid during the period. The example is useful in making comparisons because the U.S. Securities and Exchange Commission (the “SEC”) requires all mutual funds to calculate expenses based on the 5% return. Investors can assess a Fund’s costs by comparing this hypothetical example with the hypothetical examples that appear in shareholder reports of other funds.
The calculations illustrated above assume no shares were bought or sold during the period. Actual costs may have been higher or lower, depending on the amount of investment and the timing of any purchases or redemptions.
Please note that the expenses shown in the table are meant to highlight your ongoing costs only and do not reflect any transactional costs, such as sales charges (loads) on purchase payments, and contingent deferred sales charges (“CDSC”) on redemptions, if any. Therefore, the second table is useful in comparing ongoing costs only, and will not help you determine the relative total costs of owning different funds. In addition, if these transactional costs were included, your costs would have been higher.
More information about the Fund’s expenses, including annual expense ratios for periods up to five years (subject to the Fund’s inception date), can be found in the Financial Highlights section of this report. For additional information on operating expenses and other shareholder costs, please refer to the Fund’s prospectus.
| | THE GUGGENHEIM FUNDS SEMI-ANNUAL REPORT | 5 |
ABOUT SHAREHOLDERS’ FUND EXPENSES (Unaudited)(concluded) | |
| Expense
Ratio1 | Fund
Return | Beginning
Account Value
September 30, 2020 | Ending
Account Value
March 31, 2021 | Expenses
Paid During
Period2 |
Table 1. Based on actual Fund return3 | | | | | |
Capital Stewardship Fund | 1.02% | 19.82% | $ 1,000.00 | $ 1,198.20 | $ 5.59 |
|
Table 2. Based on hypothetical 5% return (before expenses) | | | | |
Capital Stewardship Fund | 1.02% | 5.00% | $ 1,000.00 | $ 1,019.85 | $ 5.14 |
1 | Annualized and excludes expenses of the underlying funds in which the Fund invests. |
2 | Expenses are equal to the Fund’s annualized expense ratio, net of any applicable fee waivers, multiplied by the average account value over the period, multiplied by 182/365 (to reflect the one-half year period). |
3 | Actual cumulative return at net asset value for the period September 30, 2020 to March 31, 2021. |
6 | THE GUGGENHEIM FUNDS SEMI-ANNUAL REPORT | |
PERFORMANCE REPORT AND FUND PROFILE (Unaudited) | March 31, 2021 |
CAPITAL STEWARDSHIP FUND
OBJECTIVE: Seeks long-term capital appreciation.
Holdings Diversification (Market Exposure as % of Net Assets)
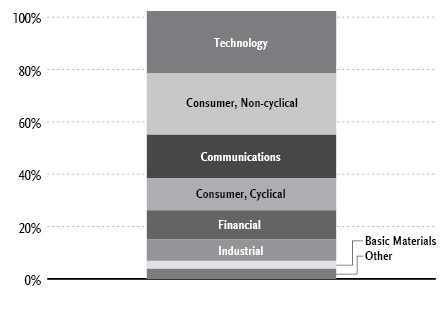
“Holdings Diversification (Market Exposure as % of Net Assets)” excludes any temporary cash investments.
Inception Date: September 26, 2014 |
Ten Largest Holdings (% of Total Net Assets) |
Apple, Inc. | 4.3% |
Amazon.com, Inc. | 4.0% |
Microsoft Corp. | 3.9% |
Alphabet, Inc. — Class A | 2.3% |
Facebook, Inc. — Class A | 2.1% |
Accenture plc — Class A | 1.7% |
Bristol-Myers Squibb Co. | 1.6% |
Cisco Systems, Inc. | 1.4% |
Bank of America Corp. | 1.4% |
MetLife, Inc. | 1.4% |
Top Ten Total | 24.1% |
| | |
“Ten Largest Holdings” excludes any temporary cash investments. |
Average Annual Returns*
Periods Ended March 31, 2021
| 6 Month† | 1 Year | 5 Year | Since
Inception
(09/26/14) |
Capital Stewardship Fund | 19.82% | 54.72% | 14.42% | 11.78% |
S&P 500 Index | 19.07% | 56.35% | 16.29% | 13.51% |
* | The performance data above represents past performance that is not predictive of future results. The investment return and principal value of an investment in the Fund will fluctuate so that an investor’s shares, when redeemed, may be worth more or less than their original cost. Returns are historical and include changes in principal and reinvested dividends and capital gains and do not reflect the effect of taxes. The S&P 500 Index is an unmanaged index and, unlike the Fund, has no management fees or operating expenses to reduce its reported return. |
† | 6 month returns are not annualized. |
| | THE GUGGENHEIM FUNDS SEMI-ANNUAL REPORT | 7 |
SCHEDULE OF INVESTMENTS (Unaudited) | March 31, 2021 |
CAPITAL STEWARDSHIP FUND | |
| | Shares | | | Value | |
COMMON STOCKS† - 101.5% |
| | | | | | | | | |
Technology - 23.7% |
Apple, Inc. | | | 83,676 | | | $ | 10,221,024 | |
Microsoft Corp. | | | 39,226 | | | | 9,248,314 | |
Accenture plc — Class A | | | 14,704 | | | | 4,061,980 | |
International Business Machines Corp. | | | 24,205 | | | | 3,225,558 | |
NVIDIA Corp. | | | 5,991 | | | | 3,198,775 | |
salesforce.com, Inc.* | | | 14,364 | | | | 3,043,301 | |
Intel Corp. | | | 40,767 | | | | 2,609,088 | |
Micron Technology, Inc.* | | | 28,382 | | | | 2,503,576 | |
Advanced Micro Devices, Inc.* | | | 26,501 | | | | 2,080,328 | |
Cognizant Technology Solutions Corp. — Class A | | | 26,553 | | | | 2,074,320 | |
Dell Technologies, Inc. — Class C* | | | 17,860 | | | | 1,574,359 | |
ON Semiconductor Corp.* | | | 33,026 | | | | 1,374,212 | |
HP, Inc. | | | 39,720 | | | | 1,261,110 | |
Oracle Corp. | | | 16,710 | | | | 1,172,541 | |
Twilio, Inc. — Class A* | | | 3,307 | | | | 1,126,893 | |
Citrix Systems, Inc. | | | 6,761 | | | | 948,974 | |
Fiserv, Inc.* | | | 7,845 | | | | 933,869 | |
Texas Instruments, Inc. | | | 4,809 | | | | 908,853 | |
Take-Two Interactive Software, Inc.* | | | 4,119 | | | | 727,827 | |
QUALCOMM, Inc. | | | 5,269 | | | | 698,617 | |
Science Applications International Corp. | | | 7,822 | | | | 653,841 | |
Applied Materials, Inc. | | | 4,346 | | | | 580,625 | |
Leidos Holdings, Inc. | | | 5,867 | | | | 564,875 | |
RingCentral, Inc. — Class A* | | | 1,589 | | | | 473,331 | |
Akamai Technologies, Inc.* | | | 3,911 | | | | 398,531 | |
RealPage, Inc.* | | | 2,933 | | | | 255,758 | |
Adobe, Inc.* | | | 484 | | | | 230,079 | |
Total Technology | | | | | | | 56,150,559 | |
| | | | | | | | | |
Consumer, Non-cyclical - 23.6% |
Bristol-Myers Squibb Co. | | | 59,219 | | | | 3,738,496 | |
CVS Health Corp. | | | 39,153 | | | | 2,945,480 | |
Johnson & Johnson | | | 17,635 | | | | 2,898,313 | |
Gilead Sciences, Inc. | | | 43,737 | | | | 2,826,722 | |
AbbVie, Inc. | | | 24,160 | | | | 2,614,595 | |
Molson Coors Beverage Co. — Class B* | | | 49,493 | | | | 2,531,567 | |
Pfizer, Inc. | | | 67,853 | | | | 2,458,314 | |
Merck & Company, Inc. | | | 29,347 | | | | 2,262,360 | |
Amgen, Inc. | | | 8,565 | | | | 2,131,058 | |
Humana, Inc. | | | 5,048 | | | | 2,116,374 | |
Kroger Co. | | | 51,589 | | | | 1,856,688 | |
Square, Inc. — Class A* | | | 7,441 | | | | 1,689,479 | |
Vertex Pharmaceuticals, Inc.* | | | 7,672 | | | | 1,648,636 | |
Procter & Gamble Co. | | | 11,350 | | | | 1,537,130 | |
Anthem, Inc. | | | 4,121 | | | | 1,479,233 | |
McKesson Corp. | | | 7,555 | | | | 1,473,527 | |
UnitedHealth Group, Inc. | | | 3,536 | | | | 1,315,639 | |
Quest Diagnostics, Inc. | | | 9,579 | | | | 1,229,369 | |
Viatris, Inc.* | | | 80,193 | | | | 1,120,296 | |
United Rentals, Inc.* | | | 3,352 | | | | 1,103,847 | |
Boston Scientific Corp.* | | | 26,694 | | | | 1,031,723 | |
J M Smucker Co. | | | 7,696 | | | | 973,775 | |
Cigna Corp. | | | 3,884 | | | | 938,918 | |
Biogen, Inc.* | | | 3,354 | | | | 938,281 | |
Medtronic plc | | | 7,820 | | | | 923,777 | |
Abbott Laboratories | | | 7,260 | | | | 870,038 | |
Kraft Heinz Co. | | | 21,589 | | | | 863,560 | |
Campbell Soup Co. | | | 15,292 | | | | 768,729 | |
Becton Dickinson and Co. | | | 3,085 | | | | 750,118 | |
Thermo Fisher Scientific, Inc. | | | 1,621 | | | | 739,792 | |
Colgate-Palmolive Co. | | | 9,166 | | | | 722,556 | |
Regeneron Pharmaceuticals, Inc.* | | | 1,527 | | | | 722,485 | |
Coca-Cola Co. | | | 11,633 | | | | 613,175 | |
Laboratory Corporation of America Holdings* | | | 2,259 | | | | 576,113 | |
Eli Lilly & Co. | | | 3,080 | | | | 575,406 | |
General Mills, Inc. | | | 9,165 | | | | 561,998 | |
Kellogg Co. | | | 8,230 | | | | 520,959 | |
PayPal Holdings, Inc.* | | | 2,075 | | | | 503,893 | |
Bio-Rad Laboratories, Inc. — Class A* | | | 786 | | | | 448,940 | |
Mondelez International, Inc. — Class A | | | 7,575 | | | | 443,365 | |
Kimberly-Clark Corp. | | | 2,958 | | | | 411,310 | |
Illumina, Inc.* | | | 638 | | | | 245,030 | |
Total Consumer, Non-cyclical | | | | | | | 56,121,064 | |
| | | | | | | | | |
Communications - 16.6% |
Amazon.com, Inc.* | | | 3,082 | | | | 9,535,955 | |
Alphabet, Inc. — Class A* | | | 2,689 | | | | 5,546,116 | |
Facebook, Inc. — Class A* | | | 16,940 | | | | 4,989,338 | |
Cisco Systems, Inc. | | | 66,025 | | | | 3,414,153 | |
Netflix, Inc.* | | | 6,033 | | | | 3,147,175 | |
Verizon Communications, Inc. | | | 31,081 | | | | 1,807,360 | |
eBay, Inc. | | | 28,955 | | | | 1,773,204 | |
Comcast Corp. — Class A | | | 28,552 | | | | 1,544,949 | |
AT&T, Inc. | | | 47,192 | | | | 1,428,502 | |
Arista Networks, Inc.* | | | 3,929 | | | | 1,186,126 | |
Okta, Inc.* | | | 4,572 | | | | 1,007,806 | |
F5 Networks, Inc.* | | | 4,761 | | | | 993,240 | |
Discovery, Inc. — Class C* | | | 24,354 | | | | 898,419 | |
Omnicom Group, Inc. | | | 9,232 | | | | 684,553 | |
Motorola Solutions, Inc. | | | 3,230 | | | | 607,401 | |
Discovery, Inc. — Class A* | | | 10,325 | | | | 448,724 | |
Walt Disney Co.* | | | 2,329 | | | | 429,747 | |
Total Communications | | | | | | | 39,442,768 | |
| | | | | | | | | |
Consumer, Cyclical - 12.2% |
Best Buy Company, Inc. | | | 24,471 | | | | 2,809,515 | |
Lowe’s Companies, Inc. | | | 13,205 | | | | 2,511,327 | |
Home Depot, Inc. | | | 7,304 | | | | 2,229,546 | |
Cummins, Inc. | | | 6,724 | | | | 1,742,256 | |
Whirlpool Corp. | | | 7,573 | | | | 1,668,711 | |
Kohl’s Corp. | | | 27,566 | | | | 1,643,209 | |
Lear Corp. | | | 8,388 | | | | 1,520,325 | |
AutoZone, Inc.* | | | 1,022 | | | | 1,435,195 | |
General Motors Co.* | | | 22,793 | | | | 1,309,686 | |
NIKE, Inc. — Class B | | | 9,722 | | | | 1,291,956 | |
Walgreens Boots Alliance, Inc. | | | 21,836 | | | | 1,198,796 | |
PACCAR, Inc. | | | 12,610 | | | | 1,171,721 | |
Southwest Airlines Co.* | | | 18,784 | | | | 1,146,951 | |
Domino’s Pizza, Inc. | | | 3,083 | | | | 1,133,897 | |
8 | THE GUGGENHEIM FUNDS SEMI-ANNUAL REPORT | SEE NOTES TO FINANCIAL STATEMENTS. |
SCHEDULE OF INVESTMENTS (Unaudited)(continued) | March 31, 2021 |
CAPITAL STEWARDSHIP FUND | |
| | Shares | | | Value | |
BorgWarner, Inc. | | | 24,211 | | | $ | 1,122,422 | |
Tesla, Inc.* | | | 1,470 | | | | 981,857 | |
WW Grainger, Inc. | | | 2,370 | | | | 950,204 | |
Ulta Beauty, Inc.* | | | 2,637 | | | | 815,281 | |
Walmart, Inc. | | | 5,938 | | | | 806,559 | |
VF Corp. | | | 7,755 | | | | 619,780 | |
Tractor Supply Co. | | | 2,653 | | | | 469,793 | |
Pool Corp. | | | 983 | | | | 339,371 | |
Total Consumer, Cyclical | | | | | | | 28,918,358 | |
| | | | | | | | | |
Financial - 11.1% |
Bank of America Corp. | | | 87,705 | | | | 3,393,306 | |
MetLife, Inc. | | | 54,179 | | | | 3,293,541 | |
Citigroup, Inc. | | | 38,346 | | | | 2,789,672 | |
Prudential Financial, Inc. | | | 25,660 | | | | 2,337,626 | |
Allstate Corp. | | | 18,939 | | | | 2,176,091 | |
Hartford Financial Services Group, Inc. | | | 30,813 | | | | 2,058,000 | |
Progressive Corp. | | | 17,247 | | | | 1,648,986 | |
Bank of New York Mellon Corp. | | | 27,784 | | | | 1,313,905 | |
U.S. Bancorp | | | 22,573 | | | | 1,248,513 | |
Mastercard, Inc. — Class A | | | 3,488 | | | | 1,241,903 | |
Visa, Inc. — Class A | | | 4,958 | | | | 1,049,757 | |
JPMorgan Chase & Co. | | | 5,658 | | | | 861,317 | |
Aflac, Inc. | | | 13,723 | | | | 702,343 | |
Jones Lang LaSalle, Inc.* | | | 2,947 | | | | 527,631 | |
State Street Corp. | | | 4,889 | | | | 410,725 | |
PNC Financial Services Group, Inc. | | | 2,291 | | | | 401,864 | |
Morgan Stanley | | | 4,303 | | | | 334,171 | |
Northern Trust Corp. | | | 2,933 | | | | 308,288 | |
CyrusOne, Inc. REIT | | | 2,933 | | | | 198,623 | |
Total Financial | | | | | | | 26,296,262 | |
| | | | | | | | | |
Industrial - 8.2% |
3M Co. | | | 16,593 | | | | 3,197,139 | |
Oshkosh Corp. | | | 22,178 | | | | 2,631,641 | |
Expeditors International of Washington, Inc. | | | 12,730 | | | | 1,370,894 | |
FedEx Corp. | | | 4,726 | | | | 1,342,373 | |
Ryder System, Inc. | | | 17,407 | | | | 1,316,839 | |
Union Pacific Corp. | | | 5,600 | | | | 1,234,296 | |
Raytheon Technologies Corp. | | | 15,852 | | | | 1,224,884 | |
Caterpillar, Inc. | | | 5,201 | | | | 1,205,956 | |
CH Robinson Worldwide, Inc. | | | 9,825 | | | | 937,600 | |
Parker-Hannifin Corp. | | | 2,927 | | | | 923,264 | |
Owens Corning | | | 9,666 | | | | 890,142 | |
Norfolk Southern Corp. | | | 2,931 | | | | 787,032 | |
Stanley Black & Decker, Inc. | | | 3,447 | | | | 688,262 | |
Avnet, Inc. | | | 15,668 | | | | 650,379 | |
United Parcel Service, Inc. — Class B | | | 3,696 | | | | 628,283 | |
Emerson Electric Co. | | | 5,591 | | | | 504,420 | |
Total Industrial | | | | | | | 19,533,404 | |
| | | | | | | | | |
Basic Materials - 3.1% |
Steel Dynamics, Inc. | | | 30,550 | | | | 1,550,718 | |
FMC Corp. | | | 10,857 | | | | 1,200,893 | |
Celanese Corp. — Class A | | | 7,908 | | | | 1,184,697 | |
Axalta Coating Systems Ltd.* | | | 37,800 | | | | 1,118,124 | |
International Flavors & Fragrances, Inc. | | | 6,719 | | | | 938,040 | |
Newmont Corp. | | | 13,394 | | | | 807,256 | |
Eastman Chemical Co. | | | 5,335 | | | | 587,490 | |
Total Basic Materials | | | | | | | 7,387,218 | |
| | | | | | | | | |
Energy - 2.2% |
ONEOK, Inc. | | | 23,797 | | | | 1,205,556 | |
Chevron Corp. | | | 11,277 | | | | 1,181,717 | |
SolarEdge Technologies, Inc.* | | | 3,774 | | | | 1,084,799 | |
First Solar, Inc.* | | | 11,747 | | | | 1,025,513 | |
Equities Corp.* | | | 39,111 | | | | 726,682 | |
Total Energy | | | | | | | 5,224,267 | |
| | | | | | | | | |
Utilities - 0.8% |
Exelon Corp. | | | 26,159 | | | | 1,144,195 | |
Consolidated Edison, Inc. | | | 11,050 | | | | 826,540 | |
Total Utilities | | | | | | | 1,970,735 | |
| | | | | | | | | |
Total Common Stocks | | | | |
(Cost $198,957,983) | | | | | | | 241,044,635 | |
| | | | | | | | | |
EXCHANGE-TRADED FUNDS† - 0.8% |
SPDR S&P 500 ETF Trust | | | 4,956 | | | | 1,964,212 | |
Total Exchange-Traded Funds | | | | |
(Cost $1,888,425) | | | | | | | 1,964,212 | |
| | | | | | | | | |
MONEY MARKET FUND† - 0.3% |
Dreyfus Treasury Securities Cash Management Fund — Institutional Shares, 0.01%1 | | | 828,605 | | | | 828,605 | |
Total Money Market Fund | | | | |
(Cost $828,605) | | | | | | | 828,605 | |
| | | | | | | | | |
Total Investments - 102.6% | | | | |
(Cost $201,675,013) | | $ | 243,837,452 | |
Other Assets & Liabilities, net - (2.6)% | | | (6,224,881 | ) |
Total Net Assets - 100.0% | | $ | 237,612,571 | |
* | Non-income producing security. |
† | Value determined based on Level 1 inputs — See Note 4. |
1 | Rate indicated is the 7-day yield as of March 31, 2021. |
| | plc — Public Limited Company |
| | REIT — Real Estate Investment Trust |
| | |
| | See Sector Classification in Other Information section. |
SEE NOTES TO FINANCIAL STATEMENTS. | THE GUGGENHEIM FUNDS SEMI-ANNUAL REPORT | 9 |
SCHEDULE OF INVESTMENTS (Unaudited)(concluded) | March 31, 2021 |
CAPITAL STEWARDSHIP FUND | |
The following table summarizes the inputs used to value the Fund’s investments at March 31, 2021 (See Note 4 in the Notes to Financial Statements):
Investments in Securities (Assets) | | Level 1
Quoted
Prices | | | Level 2
Significant
Observable
Inputs | | | Level 3
Significant
Unobservable
Inputs | | | Total | |
Common Stocks | | $ | 241,044,635 | | | $ | — | | | $ | — | | | $ | 241,044,635 | |
Exchange-Traded Funds | | | 1,964,212 | | | | — | | | | — | | | | 1,964,212 | |
Money Market Fund | | | 828,605 | | | | — | | | | — | | | | 828,605 | |
Total Assets | | $ | 243,837,452 | | | $ | — | | | $ | — | | | $ | 243,837,452 | |
10 | THE GUGGENHEIM FUNDS SEMI-ANNUAL REPORT | SEE NOTES TO FINANCIAL STATEMENTS. |
STATEMENT OF ASSETS AND LIABILITIES (Unaudited) |
March 31, 2021 |
Assets: |
Investments, at value (cost $201,675,013) | | $ | 243,837,452 | |
Prepaid expenses | | | 4,890 | |
Receivables: |
Dividends | | | 188,817 | |
Interest | | | 7 | |
Total assets | | | 244,031,166 | |
| | | | | |
Liabilities: |
Overdraft due to custodian bank | | | 6,854 | |
Payable for: |
Fund shares redeemed | | | 6,184,107 | |
Management fees | | | 181,919 | |
Fund accounting/administration fees | | | 16,462 | |
Transfer agent/maintenance fees | | | 2,470 | |
Trustees’ fees* | | | 700 | |
Miscellaneous | | | 26,083 | |
Total liabilities | | | 6,418,595 | |
Net assets | | $ | 237,612,571 | |
| | | | | |
Net assets consist of: |
Paid in capital | | $ | 172,622,096 | |
Total distributable earnings (loss) | | | 64,990,475 | |
Net assets | | $ | 237,612,571 | |
Capital shares outstanding | | | 6,761,471 | |
Net asset value per share | | $ | 35.14 | |
STATEMENT OF OPERATIONS (Unaudited) |
Six Months Ended March 31, 2021 |
Investment Income: |
Dividends | | $ | 2,127,743 | |
Interest | | | 55 | |
Total investment income | | | 2,127,798 | |
| | | | | |
Expenses: |
Management fees | | | 1,029,516 | |
Transfer agent/maintenance fees | | | 12,602 | |
Fund accounting/administration fees | | | 81,731 | |
Professional fees | | | 25,727 | |
Trustees’ fees* | | | 11,273 | |
Custodian fees | | | 3,968 | |
Miscellaneous | | | 5,537 | |
Total expenses | | | 1,170,354 | |
Less: |
Earnings credits applied | | | (18 | ) |
Net expenses | | | 1,170,336 | |
Net investment income | | | 957,462 | |
| | | | | |
Net Realized and Unrealized Gain (Loss): |
Net realized gain (loss) on: |
Investments | | | 26,347,614 | |
Net realized gain | | | 26,347,614 | |
Net change in unrealized appreciation (depreciation) on: |
Investments | | | 13,891,377 | |
Net change in unrealized appreciation (depreciation) | | | 13,891,377 | |
Net realized and unrealized gain | | | 40,238,991 | |
Net increase in net assets resulting from operations | | $ | 41,196,453 | |
* | Relates to Trustees not deemed “interested persons” within the meaning of Section 2(a)(19) of the 1940 Act. |
SEE NOTES TO FINANCIAL STATEMENTS. | THE GUGGENHEIM FUNDS SEMI-ANNUAL REPORT | 11 |
STATEMENTS OF CHANGES IN NET ASSETS |
| | Six Months Ended
March 31, 2021
(Unaudited) | | | Year Ended
September 30,
2020 | |
Increase (Decrease) in Net Assets from Operations: | | | | | | | | |
Net investment income | | $ | 957,462 | | | $ | 1,987,550 | |
Net realized gain on investments | | | 26,347,614 | | | | 10,490,126 | |
Net change in unrealized appreciation (depreciation) on investments | | | 13,891,377 | | | | 12,587,690 | |
Net increase in net assets resulting from operations | | | 41,196,453 | | | | 25,065,366 | |
| | | | | | | | | |
Distributions to shareholders | | | (13,020,049 | ) | | | (6,304,168 | ) |
| | | | | | | | | |
Capital share transactions: | | | | | | | | |
Proceeds from sale of shares | | | 8,500,000 | | | | — | |
Distributions reinvested | | | 12,936,786 | | | | 6,179,931 | |
Cost of shares redeemed | | | (18,751,450 | ) | | | (28,243,155 | ) |
Net increase (decrease) from capital share transactions | | | 2,685,336 | | | | (22,063,224 | ) |
Net increase (decrease) in net assets | | | 30,861,740 | | | | (3,302,026 | ) |
| | | | | | | | | |
Net assets: | | | | | | | | |
Beginning of period | | | 206,750,831 | | | | 210,052,857 | |
End of period | | $ | 237,612,571 | | | $ | 206,750,831 | |
| | | | | | | | | |
Capital share activity: | | | | | | | | |
Shares sold | | | 271,840 | | | | — | |
Shares issued from reinvestment of distributions | | | 402,138 | | | | 210,847 | |
Shares redeemed | | | (565,592 | ) | | | (998,019 | ) |
Net increase (decrease) in shares | | | 108,386 | | | | (787,172 | ) |
12 | THE GUGGENHEIM FUNDS SEMI-ANNUAL REPORT | SEE NOTES TO FINANCIAL STATEMENTS. |
This table is presented to show selected data for a share outstanding throughout each period and to assist shareholders in evaluating a Fund’s performance for the periods presented.
Institutional Class | | Six Months Ended
March 31, 2021a | | | Year Ended
September 30,
2020 | | | Year Ended
September 30,
2019 | | | Year Ended
September 30,
2018 | | | Year Ended
September 30,
2017 | | | Year Ended
September 30,
2016 | |
Per Share Data |
Net asset value, beginning of period | | $ | 31.08 | | | $ | 28.23 | | | $ | 31.23 | | | $ | 29.11 | | | $ | 26.55 | | | $ | 23.69 | |
Income (loss) from investment operations: |
Net investment income (loss)b | | | .14 | | | | .28 | | | | .33 | | | | .28 | | | | .34 | | | | .35 | |
Net gain (loss) on investments (realized and unrealized) | | | 5.84 | | | | 3.43 | | | | .05 | | | | 4.34 | | | | 3.51 | | | | 3.22 | |
Total from investment operations | | | 5.98 | | | | 3.71 | | | | .38 | | | | 4.62 | | | | 3.85 | | | | 3.57 | |
Less distributions from: |
Net investment income | | | (.28 | ) | | | (.39 | ) | | | (.32 | ) | | | (.34 | ) | | | (.37 | ) | | | (.32 | ) |
Net realized gains | | | (1.64 | ) | | | (.47 | ) | | | (3.06 | ) | | | (2.16 | ) | | | (.92 | ) | | | (.39 | ) |
Total distributions | | | (1.92 | ) | | | (.86 | ) | | | (3.38 | ) | | | (2.50 | ) | | | (1.29 | ) | | | (.71 | ) |
Net asset value, end of period | | $ | 35.14 | | | $ | 31.08 | | | $ | 28.23 | | | $ | 31.23 | | | $ | 29.11 | | | $ | 26.55 | |
|
Total Return | | | 19.82 | % | | | 13.31 | % | | | 3.56 | % | | | 16.50 | % | | | 15.01 | % | | | 15.30 | % |
Ratios/Supplemental Data |
Net assets, end of period (in thousands) | | $ | 237,613 | | | $ | 206,751 | | | $ | 210,053 | | | $ | 220,587 | | | $ | 216,008 | | | $ | 208,867 | |
Ratios to average net assets: |
Net investment income (loss) | | | 0.84 | % | | | 0.96 | % | | | 1.23 | % | | | 0.93 | % | | | 1.23 | % | | | 1.38 | % |
Total expensesc | | | 1.02 | % | | | 1.04 | % | | | 1.05 | % | | | 1.05 | % | | | 1.03 | % | | | 1.07 | % |
Portfolio turnover rate | | | 78 | % | | | 147 | % | | | 131 | % | | | 164 | % | | | 156 | % | | | 209 | % |
a | Unaudited figures for the period ended March 31, 2021. Percentage amounts for the period, except total return and portfolio turnover rate, have been annualized. |
b | Net investment income (loss) per share was computed using average shares outstanding throughout the period. |
c | Does not include expenses of the underlying funds in which the Fund invests. |
SEE NOTES TO FINANCIAL STATEMENTS. | THE GUGGENHEIM FUNDS SEMI-ANNUAL REPORT | 13 |
NOTES TO FINANCIAL STATEMENTS (Unaudited) |
Note 1 – Organization and Significant Accounting Policies
Organization
Guggenheim Funds Trust (the “Trust”), a Delaware statutory trust, is registered with the SEC under the Investment Company Act of 1940 (“1940 Act”), as an open-ended investment company of the series type. Each series, in effect, is representing a separate fund. The Trust may issue an unlimited number of authorized shares. The Trust accounts for the assets of each fund separately.
The Trust offers a combination of five separate classes of shares: A-Class shares, C-Class shares, P-Class shares, R6-Class shares and Institutional Class shares. Sales of shares of each Class are made without a front-end sales charge at the net asset value per share (“NAV”), with the exception of A-Class shares. A-Class shares are sold at the NAV, plus the applicable front-end sales charge. The sales charge varies depending on the amount purchased. A-Class share purchases of $1 million or more are exempt from the front-end sales charge but have a 1% contingent deferred sales charge (“CDSC”), if shares are redeemed within 12 months of purchase. C-Class shares have a 1% CDSC if shares are redeemed within 12 months of purchase. C-Class shares automatically convert to A-Class shares on or about the 10th day of the month following the 10-year anniversary of the purchase of the C-Class shares. This conversion will be executed without any sales charge, fee or other charge. After the conversion is completed, the shares will be subject to all features and expenses of A-Class shares. Institutional Class shares are offered primarily for direct investment by institutions such as pension and profit sharing plans, endowments, foundations and corporations. Institutional Class shares require a minimum initial investment of $2 million and a minimum account balance of $1 million. R6-Class shares are offered primarily through qualified retirement and benefit plans. R6-Class shares are also offered through certain other plans and platforms sponsored by financial intermediaries. Certain institutional investors and others deemed appropriate by Guggenheim Investments (“GI”) may also be eligible to purchase R6-Class shares subject to a $2 million minimum initial investment. At March 31, 2021, the Trust consisted of nineteen funds (the “Funds”).
This report covers the Capital Stewardship Fund (the “Fund”), a diversified investment company. At March 31, 2021, Institutional Class shares have been issued by the Fund.
Guggenheim Partner Investment Management, LLC (“GPIM”), which operates under the name Guggenheim Investments, provides advisory services. Guggenheim Funds Distributors, LLC (“GFD”) acts as principal underwriter for the Trust. GI and GFD are affiliated entities.
Concinnity Advisors, LP (the “Sub-Adviser”) serves as the subadviser to the Fund.
Significant Accounting Policies
The Fund operates as an investment company and, accordingly, follows the investment company accounting and reporting guidance of the Financial Accounting Standards Board (“FASB”) Accounting Standards Codification Topic 946 Financial Services – Investment Companies.
The following significant accounting policies are in conformity with U.S. generally accepted accounting principles (“U.S. GAAP”) and are consistently followed by the Trust. This requires management to make estimates and assumptions that affect the reported amount of assets and liabilities, contingent assets and liabilities at the date of the financial statements, and the reported amounts of revenues and expenses during the reporting period. Actual results could differ from these estimates. All time references are based on Eastern Time.
The NAV of the Fund is calculated by dividing the market value of the Fund’s securities and other assets, less all liabilities, by the number of outstanding shares of the Fund.
(a) Valuation of Investments
The Board of Trustees of the Fund (the “Board”) has adopted policies and procedures for the valuation of the Fund’s investments (the “Valuation Procedures”). Pursuant to the Valuation Procedures, the Board has delegated to a valuation committee, consisting of representatives from Guggenheim’s investment management, fund administration, legal and compliance departments (the “Valuation Committee”), the day-to-day responsibility for implementing the Valuation Procedures, including, under most circumstances, the responsibility for determining the fair value of the Fund’s securities and/or other assets.
Valuations of the Fund’s securities and other assets are supplied primarily by pricing services appointed pursuant to the processes set forth in the Valuation Procedures. The Valuation Committee convenes monthly, or more frequently as needed, to review the valuation of all assets which have been fair valued for reasonableness. The Fund’s officers, through the Valuation Committee and consistent with the monitoring and review responsibilities set forth in the Valuation Procedures, regularly review procedures used and valuations provided by the pricing services.
If the pricing service cannot or does not provide a valuation for a particular investment or such valuation is deemed unreliable, such investment is fair valued by the Valuation Committee.
Equity securities listed or traded on a recognized U.S. securities exchange or the National Association of Securities Dealers Automated Quotations (“NASDAQ”) National Market System
14 | THE GUGGENHEIM FUNDS SEMI-ANNUAL REPORT | |
NOTES TO FINANCIAL STATEMENTS (Unaudited)(continued) |
shall generally be valued on the basis of the last sale price on the primary U.S. exchange or market on which the security is listed or traded; provided, however, that securities listed on NASDAQ will be valued at the NASDAQ Official Closing Price, which may not necessarily represent the last sale price. If there is no sale on the valuation date, exchange-traded U.S. equity securities will be valued on the basis of the last bid price.
Open-end investment companies are valued at their NAV as of the close of business, on the valuation date. Exchange-traded funds are valued at the last quoted sale price.
Investments for which market quotations are not readily available are fair-valued as determined in good faith by GI, subject to review and approval by the Valuation Committee, pursuant to methods established or ratified by the Board. Valuations in accordance with these methods are intended to reflect each security’s (or asset’s or liability’s) “fair value”. Each such determination is based on a consideration of all relevant factors, which are likely to vary from one pricing context to another. Examples of such factors may include, but are not limited to market prices; sale prices; broker quotes; and models which derive prices based on inputs such as prices of securities with comparable maturities and characteristics, or based on inputs such as anticipated cash flows or collateral, spread over U.S. Treasury securities, and other information analysis.
(b) Security Transactions
Security transactions are recorded on the trade date for financial reporting purposes. Realized gains and losses from securities transactions are recorded using the identified cost basis. Proceeds from lawsuits related to investment holdings are recorded as a reduction to cost if the securities are still held and as realized gains if no longer held in the Fund. Taxable non-cash dividends are recorded as dividend income. Interest income, including amortization of premiums and accretion of discounts, is accrued on a daily basis. Amendment fees are earned as compensation for evaluating and accepting changes to the original loan agreement and are recognized when received. Dividend income from Real Estate Investment Trusts (“REITs”) is recorded based on the income included in the distributions received from the REIT investments using published REIT classifications, including some management estimates when actual amounts are not available. Distributions received in excess of this estimated amount are recorded as a reduction of the cost of investments or reclassified to realized gains. The actual amounts of income, return of capital, and realized gains are only determined by each REIT after its fiscal year-end, and may differ from the estimated amounts.
(c) Distributions
Distributions of net investment income and net realized gains, if any, are declared and paid at least annually. Dividends are reinvested in additional shares, unless shareholders request payment in cash. Distributions are recorded on the ex-dividend date and are determined in accordance with U.S. federal income tax regulations which may differ from U.S. GAAP.
(d) Expenses
Certain expenses have been allocated to the individual Funds in the Trust based on the respective net assets of each Fund included in the Trust.
(e) Earnings Credits
Under the fee arrangement with the custodian, the Fund may earn credits based on overnight custody cash balances. These credits are utilized to reduce related custodial expenses. The custodian fees disclosed in the Statement of Operations are before the reduction in expense from the related earnings credits, if any. Earnings credits for the period ended March 31, 2021, are disclosed in the Statement of Operations.
(f) Cash
The Fund may leave cash overnight in its cash account with the custodian. Periodically, the Fund may have cash due to the custodian bank as an overdraft balance. A fee is incurred on this overdraft, calculated by multiplying the overdraft by a rate based on the federal funds rate, which was 0.06% at March 31, 2021.
(g) Indemnifications
Under the Fund’s organizational documents, its Trustees and Officers are indemnified against certain liabilities arising out of the performance of their duties to the Trust. In addition, throughout the normal course of business, the Fund enters into contracts that contain a variety of representations and warranties which provide general indemnifications. The Fund’s maximum exposure under these arrangements is unknown, as this would involve future claims that may be made against the Fund and/or its affiliates that have not yet occurred. However, based on experience, the Fund expects the risk of loss to be remote.
Note 2 – Investment Advisory Agreement and Other Agreements
Under the terms of an investment advisory contract, the Fund pays GI investment advisory fees calculated at an annualized rate of 0.90% of the average daily net assets of the Fund.
| | THE GUGGENHEIM FUNDS SEMI-ANNUAL REPORT | 15 |
NOTES TO FINANCIAL STATEMENTS (Unaudited)(continued) |
GI pays operating expenses on behalf of the Trust, such as audit and accounting related services, legal services, custody, printing and mailing, among others, on a pass-through basis. Such expenses are allocated to various Funds within the complex based on relative net assets.
Certain trustees and officers of the Trust are also officers of GI and/or GFD. The Trust does not compensate its officers or trustees who are officers, directors and/or employees of GI or GFD.
MUFG Investor Services (US), LLC (“MUIS”) acts as the Fund’s administrator, transfer agent and accounting agent. As administrator, transfer agent and accounting agent, MUIS maintains the books and records of the Fund’s securities and cash. The Bank of New York Mellon Corp. (“BNY”) acts as the Fund’s custodian. As custodian, BNY is responsible for the custody of the Fund’s assets. For providing the aforementioned administrative and accounting services, MUIS is entitled to receive a monthly fee equal to a percentage of the Fund’s average daily net assets and out of pocket expenses. For providing the aforementioned transfer agent and custodian services, MUIS and BNY are entitled to receive a monthly fee based on the number of transactions during the month and the number of accounts under management, subject to certain minimum monthly fees, and out of pocket expenses.
Note 3 – Federal Income Tax Information
The Fund intends to comply with the provisions of Subchapter M of the Internal Revenue Code applicable to regulated investment companies and will distribute substantially all taxable net investment income and capital gains sufficient to relieve the Fund from all, or substantially all, federal income, excise and state income taxes. Therefore, no provision for federal or state income tax or federal excise tax is required.
Tax positions taken or expected to be taken in the course of preparing the Fund’s tax returns are evaluated to determine whether the tax positions are “more-likely-than-not” of being sustained by the applicable tax authority. Tax positions not deemed to meet the more-likely-than-not threshold would be recorded as a tax benefit or expense in the current year. Management has analyzed the Fund’s tax positions taken, or to be taken, on U.S. federal income tax returns for all open tax years, and has concluded that no provision for income tax is required in the Fund’s financial statements. The Fund’s U.S. federal income tax returns are subject to examination by the Internal Revenue Service (“IRS”) for a period of three years after they are filed.
At March 31, 2021, the cost of investments for U.S. federal income tax purposes, the aggregate gross unrealized appreciation for all investments for which there was an excess of value over tax cost, and the aggregate gross unrealized depreciation for all investments for which there was an excess of tax cost over value, were as follows:
| | Tax
Cost | | | Tax
Unrealized
Appreciation | | | Tax
Unrealized
Depreciation | | | Net Tax
Unrealized
Appreciation
(Depreciation) | |
| | | $ | 203,887,622 | | | $ | 41,663,047 | | | $ | (1,713,217 | ) | | $ | 39,949,830 | |
Note 4 – Fair Value Measurement
In accordance with U.S. GAAP, fair value is defined as the price that the Fund would receive to sell an investment or pay to transfer a liability in an orderly transaction with an independent buyer in the principal market, or in the absence of a principal market, the most advantageous market for the investment or liability. U.S. GAAP establishes a three-tier fair value hierarchy based on the types of inputs used to value assets and liabilities and requires corresponding disclosure. The hierarchy and the corresponding inputs are summarized below:
Level 1 — | quoted prices in active markets for identical assets or liabilities. |
Level 2 — | significant other observable inputs (for example quoted prices for securities that are similar based on characteristics such as interest rates, prepayment speeds, credit risk, etc.). |
Level 3 — | significant unobservable inputs based on the best information available under the circumstances, to the extent observable inputs are not available, which may include assumptions. |
16 | THE GUGGENHEIM FUNDS SEMI-ANNUAL REPORT | |
NOTES TO FINANCIAL STATEMENTS (Unaudited)(concluded) |
The types of inputs available depend on a variety of factors, such as the type of security and the characteristics of the markets in which it trades, if any. Fair valuation determinations that rely on fewer or no observable inputs require greater judgment. Accordingly, fair value determinations for Level 3 securities require the greatest amount of judgment.
The inputs or methodologies used for valuing securities are not necessarily an indication of the risk associated with investing in those securities. The suitability of the techniques and sources employed to determine fair valuation are regularly monitored and subject to change.
Note 5 – Securities Transactions
For the period ended March 31, 2021, the cost of purchases and proceeds from sales of investment securities, excluding government securities, short-term investments and derivatives, were as follows:
| | Purchases | | | Sales | |
| | | $ | 175,522,812 | | | $ | 188,423,356 | |
Note 6 – COVID-19
The global ongoing crisis caused by the outbreak of COVID-19 and the current recovery underway is causing disruption to consumer demand and economic output and supply chains. There are still travel restrictions and quarantines, and adverse impacts on local and global economies. Investors should be aware that in light of the current uncertainty, volatility and distress in economies, financial markets, and labor and public health conditions around the world, the Fund’s investments and a shareholder’s investment in the Fund are subject to sudden and substantial losses, increased volatility and other adverse events. Firms through which investors invest with the Fund, the Fund, its service providers, the markets in which it invests and market intermediaries are also impacted by quarantines and similar measures intended to respond to and contain the ongoing pandemic, which can obstruct their functioning and subject them to heightened operational and other risks.
Note 7 – Subsequent Events
The Fund evaluated subsequent events through the date the financial statements were available for issue and determined there were no material events that would require adjustment to or disclosure in the Fund’s financial statements.
| | THE GUGGENHEIM FUNDS SEMI-ANNUAL REPORT | 17 |
OTHER INFORMATION (Unaudited) |
Delivery of Shareholder Reports
Paper copies of the Fund’s annual and semi-annual shareholder reports are not sent by mail, unless you specifically request paper copies of the reports from a fund or from your financial intermediary. Instead, the reports are made available on a website, and you are notified by mail each time a report is posted and provided with a website link to access the report.
You may elect to receive all future shareholder reports in paper free of charge. If you hold shares of a fund directly, you can inform the Fund that you wish to receive paper copies of reports by calling 800.820.0888. If you hold shares of a fund through a financial intermediary, please contact the financial intermediary to make this election. Your election to receive reports in paper may apply to all Guggenheim Funds in which you are invested and may apply to all Guggenheim funds held with your financial intermediary.
Proxy Voting Information
A description of the policies and procedures that the Trust uses to determine how to vote proxies relating to securities held in the Fund’s portfolio is available, without charge and upon request, by calling 800.820.0888. This information is also available from the EDGAR database on the SEC’s website at https://www.sec.gov.
Information regarding how the Fund voted proxies relating to portfolio securities during the most recent 12-month period ended June 30 is available without charge, upon request, by calling 800.820.0888. This information is also available from the EDGAR database on the SEC’s website at https://www.sec.gov.
Sector Classification
Information in the Schedule of Investments is categorized by sectors using sector-level Classifications defined by the Bloomberg Industry Classification System, a widely recognized industry classification system provider. The Fund’s registration statement has investment policies relating to concentration in specific sectors/industries. For purposes of these investment policies, the Fund usually classifies sectors/industries based on industry-level Classifications used by widely recognized industry classification system providers such as Bloomberg Industry Classification System, Global Industry Classification Standards and Barclays Global Classification Scheme.
Quarterly Portfolio Schedules Information
The Trust files its complete schedule of portfolio holdings with the SEC for the first and third quarters of each fiscal year as an exhibit to its reports on Form N-PORT, and for reporting periods ended prior to March 31, 2019, filed such information on Form N-Q. The Fund’s Forms N-PORT and N-Q are available on the SEC’s website at https://www.sec.gov. Copies of the portfolio holdings are also available to shareholders, without charge and upon request, by calling 800.820.0888.
18 | THE GUGGENHEIM FUNDS SEMI-ANNUAL REPORT | |
INFORMATION ON BOARD OF TRUSTEES AND OFFICERS (Unaudited) |
A Board of Trustees oversees the Trust, as well as other trusts of GI, in which its members have no stated term of service, and continue to serve after election until resignation. The Statement of Additional Information includes further information about Fund Trustees and Officers, and can be obtained without charge by visiting guggenheiminvestments.com or by calling 800.820.0888.
Name, Address*
and Year of Birth | Position(s)
Held with
Trust | Term of Office
and Length of
Time Served** | Principal Occupation(s)
During Past Five Years | Number of
Portfolios
in Fund
Complex
Overseen | Other
Directorships Held
by Trustees*** |
INDEPENDENT TRUSTEES | | | |
Randall C. Barnes (1951) | Trustee and Chair of the Valuation Oversight Committee | Since 2014 (Trustee) Since 2020 (Chair of the Valuation Oversight Committee) | Current: Private Investor (2001-present). Former: Senior Vice President and Treasurer, PepsiCo, Inc. (1993-1997); President, Pizza Hut International (1991-1993); Senior Vice President, Strategic Planning and New Business Development, PepsiCo, Inc. (1987-1990). | 157 | Current: Purpose Investments Funds (2013-present). Former: Managed Duration Investment Grade Municipal Fund (2006-2016). |
Angela Brock-Kyle (1959) | Trustee | Since 2019 | Current: Founder and Chief Executive Officer, B.O.A.R.D.S. (2013-present). Former: Senior Leader, TIAA (1987-2012). | 156 | Current: Bowhead Insurance GP, LLC (2020-present); Hunt Companies, Inc. (2019-present). Former: Infinity Property & Casualty Corp. (2014-2018). |
Thomas F. Lydon, Jr. (1960) | Trustee and Chair of the Contracts Review Committee | Since 2019 (Trustee) Since 2020 (Chair of the Contracts Review Committee) | Current: President, Global Trends Investments (1996-present); Co-Chief Executive Officer, ETF Flows, LLC (2019-present); Chief Executive Officer, Lydon Media (2016-present). | 156 | Current: US Global Investors (GROW) (1995-present). Former: Harvest Volatility Edge Trust (3) (2017-2019). |
Ronald A. Nyberg (1953) | Trustee and Chair of the Nominating and Governance Committee | Since 2014 | Current: Of Counsel, Momkus LLP (2016-present). Former: Partner, Nyberg & Cassioppi, LLC (2000-2016); Executive Vice President, General Counsel, and Corporate Secretary, Van Kampen Investments (1982-1999). | 157 | Current: PPM Funds (2) (2018-present); Edward-Elmhurst Healthcare System (2012-present). Former: Western Asset Inflation-Linked Opportunities & Income Fund (2004-2020); Western Asset Inflation-Linked Income Fund (2003-2020); Managed Duration Investment Grade Municipal Fund (2003-2016). |
| | THE GUGGENHEIM FUNDS SEMI-ANNUAL REPORT | 19 |
INFORMATION ON BOARD OF TRUSTEES AND OFFICERS (Unaudited)(continued) |
Name, Address*
and Year of Birth | Position(s)
Held with
Trust | Term of Office
and Length of
Time Served** | Principal Occupation(s)
During Past Five Years | Number of
Portfolios
in Fund
Complex
Overseen | Other
Directorships Held
by Trustees*** |
INDEPENDENT TRUSTEES - concluded | | |
Sandra G. Sponem (1958) | Trustee and Chair of the Audit Committee | Since 2019 (Trustee) Since 2020 (Chair of the Audit Committee) | Current: Retired. Former: Senior Vice President and Chief Financial Officer, M.A. Mortenson-Companies, Inc. (2007-2017). | 156 | Current: SPDR Series Trust (81) (2018-present); SPDR Index Shares Funds (30) (2018-present); SSGA Active Trust (14) (2018-present). Former: SSGA Master Trust (1) (2018-2020). |
Ronald E. Toupin, Jr. (1958) | Trustee, Chair of the Board and Chair of the Executive Committee | Since 2014 | Current: Portfolio Consultant (2010-present); Member, Governing Council, Independent Directors Council (2013-present); Governor, Board of Governors, Investment Company Institute (2018-present). Former: Member, Executive Committee, Independent Directors Council (2016-2018); Vice President, Manager and Portfolio Manager, Nuveen Asset Management (1998-1999); Vice President, Nuveen Investment Advisory Corp. (1992-1999); Vice President and Manager, Nuveen Unit Investment Trusts (1991-1999); and Assistant Vice President and Portfolio Manager, Nuveen Unit Investment Trusts (1988-1999), each of John Nuveen & Co., Inc. (1982-1999). | 156 | Former: Western Asset Inflation-Linked Opportunities & Income Fund (2004-2020); Western Asset Inflation-Linked Income Fund (2003-2020); Managed Duration Investment Grade Municipal Fund (2003-2016). |
20 | THE GUGGENHEIM FUNDS SEMI-ANNUAL REPORT | |
INFORMATION ON BOARD OF TRUSTEES AND OFFICERS (Unaudited)(continued) |
Name, Address*
and Year of Birth | Position(s)
Held with
Trust | Term of Office
and Length of
Time Served** | Principal Occupation(s)
During Past Five Years | Number of
Portfolios
in Fund
Complex
Overseen | Other
Directorships Held
by Trustees*** |
INTERESTED TRUSTEE | | | | |
Amy J. Lee**** (1961) | Trustee, Vice President and Chief Legal Officer | Since 2018 (Trustee) Since 2014 (Chief Legal Officer) Since 2007 (Vice President) | Current: Interested Trustee, certain other funds in the Fund Complex (2018-present); Chief Legal Officer, certain other funds in the Fund Complex (2014-present); Vice President, certain other funds in the Fund Complex (2007-present); Senior Managing Director, Guggenheim Investments (2012-present). Former: President and Chief Executive Officer, certain other funds in the Fund Complex (2017-2019); Vice President, Associate General Counsel and Assistant Secretary, Security Benefit Life Insurance Company and Security Benefit Corporation (2004-2012). | 156 | None. |
* | The business address of each Trustee is c/o Guggenheim Investments, 227 West Monroe Street, Chicago, Illinois 60606. |
** | Each Trustee serves an indefinite term, until his or her successor is elected and qualified. Time served includes time served in the respective position for the Predecessor Corporation. |
*** | Each Trustee also serves on the Boards of Trustees of Guggenheim Funds Trust, Guggenheim Variable Funds Trust, Guggenheim Strategy Funds Trust, Fiduciary/Claymore Energy Infrastructure Fund, Guggenheim Taxable Municipal Bond & Investment Grade Debt Trust, Guggenheim Strategic Opportunities Fund, Guggenheim Enhanced Equity Income Fund, Guggenheim Energy & Income Fund, Guggenheim Credit Allocation Fund, Rydex Series Funds, Rydex Dynamic Funds, Rydex Variable Trust and Transparent Value Trust. Messrs. Barnes and Nyberg also serve on the Board of Trustees of Advent Convertible & Income Fund. |
**** | This Trustee is deemed to be an “interested person” of the Fund under the 1940 Act by reason of her position with the Fund’s Investment Manager and/or the parent of the Investment Manager. |
| | THE GUGGENHEIM FUNDS SEMI-ANNUAL REPORT | 21 |
INFORMATION ON BOARD OF TRUSTEES AND OFFICERS (Unaudited)(continued) |
Name, Address*
and Year of Birth | Position(s)
Held with
Trust | Term of Office
and Length of
Time Served** | Principal Occupation(s)
During Past Five Years |
OFFICERS | | | |
Brian E. Binder (1972) | President and Chief Executive Officer | Since 2018 | Current: President and Chief Executive Officer, certain other funds in the Fund Complex (2018-present); President, Chief Executive Officer and Chairman of the Board of Managers, Guggenheim Funds Investment Advisors, LLC (2018-present); President and Chief Executive Officer, Security Investors, LLC (2018-present); Board Member of Guggenheim Partners Fund Management (Europe) Limited (2018-present); Senior Managing Director and Chief Administrative Officer, Guggenheim Investments (2018-present). Former: Managing Director and President, Deutsche Funds, and Head of US Product, Trading and Fund Administration, Deutsche Asset Management (2013-2018); Managing Director, Head of Business Management and Consulting, Invesco Ltd. (2010-2012). |
James M. Howley (1972) | Assistant Treasurer | Since 2014 | Current: Managing Director, Guggenheim Investments (2004-present); Assistant Treasurer, certain other funds in the Fund Complex (2006-present). Former: Manager, Mutual Fund Administration of Van Kampen Investments, Inc. (1996-2004). |
Mark E. Mathiasen (1978) | Secretary | Since 2014 | Current: Secretary, certain other funds in the Fund Complex (2007-present); Managing Director, Guggenheim Investments (2007-present). |
Glenn McWhinnie (1969) | Assistant Treasurer | Since 2016 | Current: Vice President, Guggenheim Investments (2009-present); Assistant Treasurer, certain other funds in the Fund Complex (2016-present). |
Michael P. Megaris (1984) | Assistant Secretary | Since 2014 | Current: Assistant Secretary, certain other funds in the Fund Complex (2014-present); Director, Guggenheim Investments (2012-present). |
Elisabeth Miller (1968) | Chief Compliance Officer | Since 2012 | Current: Chief Compliance Officer, certain other funds in the Fund Complex (2012-present); Senior Managing Director, Guggenheim Investments (2012-present). Vice President, Guggenheim Funds Distributors, LLC (2014-present). Former: Chief Compliance Officer, Security Investors, LLC and Guggenheim Funds Investment Advisors, LLC (2012-2018); Chief Compliance Officer, Guggenheim Distributors, LLC (2009-2014); Senior Manager, Security Investors, LLC (2004-2014); Senior Manager, Guggenheim Distributors, LLC (2004-2014). |
Margaux Misantone (1978) | AML Officer | Since 2017 | Current: Chief Compliance Officer, Security Investors, LLC and Guggenheim Funds Investment Advisors, LLC (2018-present); AML Officer, Security Investors, LLC and certain other funds in the Fund Complex (2017-present); Managing Director, Guggenheim Investments (2015-present). Former: Assistant Chief Compliance Officer, Security Investors, LLC and Guggenheim Funds Investments Advisors, LLC (2015-2018). |
22 | THE GUGGENHEIM FUNDS SEMI-ANNUAL REPORT | |
INFORMATION ON BOARD OF TRUSTEES AND OFFICERS (Unaudited)(concluded) |
Name, Address*
and Year of Birth | Position(s)
Held with
Trust | Term of Office
and Length of
Time Served** | Principal Occupation(s)
During Past Five Years |
OFFICERS - concluded | |
Kimberly J. Scott (1974) | Assistant Treasurer | Since 2014 | Current: Director, Guggenheim Investments (2012-present); Assistant Treasurer, certain other funds in the Fund Complex (2012-present). Former: Financial Reporting Manager, Invesco, Ltd. (2010-2011); Vice President/Assistant Treasurer, Mutual Fund Administration for Van Kampen Investments, Inc./Morgan Stanley Investment Management (2009-2010); Manager of Mutual Fund Administration, Van Kampen Investments, Inc./Morgan Stanley Investment Management (2005-2009). |
Bryan Stone (1979) | Vice President | Since 2014 | Current: Vice President, certain other funds in the Fund Complex (2014-present); Managing Director, Guggenheim Investments (2013-present). Former: Senior Vice President, Neuberger Berman Group LLC (2009-2013); Vice President, Morgan Stanley (2002-2009). |
John L. Sullivan (1955) | Chief Financial Officer, Chief Accounting Officer and Treasurer | Since 2014 | Current: Chief Financial Officer, Chief Accounting Officer and Treasurer, certain other funds in the Fund Complex (2010-present); Senior Managing Director, Guggenheim Investments (2010-present). Former: Managing Director and Chief Compliance Officer, each of the funds in the Van Kampen Investments fund complex (2004-2010); Managing Director and Head of Fund Accounting and Administration, Morgan Stanley Investment Management (2002-2004); Chief Financial Officer and Treasurer, Van Kampen Funds (1996-2004). |
Jon Szafran (1989) | Assistant Treasurer | Since 2017 | Current: Vice President, Guggenheim Investments (2017-present); Assistant Treasurer, certain other funds in the Fund Complex (2017-present). Former: Assistant Treasurer of Henderson Global Funds and Manager of US Fund Administration, Henderson Global Investors (North America) Inc. (“HGINA”), (2017); Senior Analyst of US Fund Administration, HGINA (2014–2017); Senior Associate of Fund Administration, Cortland Capital Market Services, LLC (2013-2014); Experienced Associate, PricewaterhouseCoopers LLP (2012-2013). |
* | The business address of each officer is c/o Guggenheim Investments, 227 West Monroe Street, Chicago, Illinois 60606. |
** | Each officer serves an indefinite term, until his or her successor is duly elected and qualified. |
| | THE GUGGENHEIM FUNDS SEMI-ANNUAL REPORT | 23 |
GUGGENHEIM INVESTMENTS PRIVACY NOTICE (Unaudited) |
Who We Are
This Privacy Notice describes the data protection practices of Guggenheim Investments. Guggenheim Investments as used herein refers to the affiliated investment management businesses of Guggenheim Partners, LLC: Guggenheim Funds Investment Advisors, LLC, Guggenheim Partners Investment Management, LLC, Guggenheim Funds Distributors, LLC, Security Investors, LLC, Guggenheim Investment Advisors (Europe) Limited, Guggenheim Real Estate, LLC, GS Gamma Advisors, LLC, Guggenheim Partners India Management, LLC, Guggenheim Partners Europe Limited, as well as the funds in the Guggenheim Funds complex (the “Funds”) (“Guggenheim Investments,” “we,” “us,” or “our”).
Guggenheim Partners Investment Management Holdings, LLC, located at 330 Madison Avenue, New York, New York 10017 is the data controller for your information. The affiliates who are also controllers of certain of your information are: Guggenheim Investment Advisors (Europe) Limited, Guggenheim Partners Europe Limited, Guggenheim Partners, LLC, Guggenheim Funds Investment Advisors, LLC, Guggenheim Partners Investment Management, LLC, Guggenheim Funds Distributors, LLC and Security Investors, LLC, as well as the Funds.
Our Commitment to You
Guggenheim Investments considers your privacy our utmost concern. When you become our client or investor, you entrust us with not only your hard-earned money but also with your personal and financial information. Because we have access to your private information, we hold ourselves to the highest standards in its safekeeping and use. We strictly limit how we share your information with others, whether you are a current or former Guggenheim Investments client or investor.
The Information We Collect About You
We collect certain nonpublic personal information about you from information you provide on applications, other forms, our website, and/or from third parties including investment advisors. This information includes Social Security or other tax identification number, assets, income, tax information, retirement and estate plan information, transaction history, account balance, payment history, bank account information, marital status, family relationships, information that we collect on our website through the use of “cookies,” and other personal information that you or others provide to us. We may also collect such information through your inquiries by mail, e-mail or telephone. We may also collect customer due diligence information, as required by applicable law and regulation, through third party service providers.
How We Handle Your Personal Information
The legal basis for using your information as set out in this Privacy Notice is as follows: (a) use of your personal data is necessary to perform our obligations under any contract with you (such as a contract for us to provide financial services to you); or (b) where use of your personal data is not necessary for performance of a contract, use of your personal data is necessary for our legitimate interests or the legitimate interests of others (for example, to enforce the legal terms governing our services, operate and market our website and other services we offer, ensure safe environments for our personnel and others, make and receive payments, prevent fraud and to know the customer to whom we are providing the services). Some processing is done to comply with applicable law.
In addition to the specific uses described above, we also use your information in the following manner:
| | ● | We use your information in connection with servicing your accounts. |
| | ● | We use information to respond to your requests or questions. For example, we might use your information to respond to your customer feedback. |
| | ● | We use information to improve our products and services. We may use your information to make our website and products better. We may use your information to customize your experience with us. |
| | ● | We use information for security purposes. We may use your information to protect our company and our customers. |
| | ● | We use information to communicate with you. For example, we will communicate with you about your account or our relationship. We may contact you about your feedback. We might also contact you about this Privacy Notice. We may also enroll you in our email newsletter. |
24 | THE GUGGENHEIM FUNDS SEMI-ANNUAL REPORT | |
GUGGENHEIM INVESTMENTS PRIVACY NOTICE (Unaudited)(continued) |
| | ● | We use information as otherwise permitted by law, as we may notify you. |
| | ● | Aggregate/Anonymous Data. We may aggregate and/or anonymize any information collected through the website so that such information can no longer be linked to you or your device (“Aggregate/Anonymous Information”). We may use Aggregate/Anonymous Information for any purpose, including without limitation for research and marketing purposes, and may also share such data with any third parties, including advertisers, promotional partners, and sponsors. |
We do not sell information about current or former clients or their accounts to third parties. Nor do we share this information, except when necessary to complete transactions at your request, to make you aware of investment products and services that we or our affiliates offer, or as permitted or required by law.
We provide information about you to companies and individuals not affiliated with Guggenheim Investments to complete certain transactions or account changes, or to perform services for us related to your account. For example, if you ask to transfer assets from another financial institution to Guggenheim Investments, we must provide certain information about you to that company to complete the transaction. We provide the third party with only the information necessary to carry out its responsibilities and only for that purpose. And we require these third parties to treat your private information with the same high degree of confidentiality that we do. To alert you to other Guggenheim Investments products and services, we share your information within our family of affiliated companies. You may limit our sharing with affiliated companies as set out below. We may also share information with any successor to all or part of our business, or in connection with steps leading up to a merger or acquisition. For example, if part of our business was sold we may give customer information as part of that transaction. We may also share information about you with your consent.
We will release information about you if you direct us to do so, if we are compelled by law to do so, or in other circumstances as permitted by law (for example, to protect your account from fraud).
If you close your account(s) or become an inactive client or investor, we will continue to adhere to the privacy policies and practices described in this notice.
Opt-Out Provisions and Your Data Choices
The law allows you to “opt out” of certain kinds of information sharing with third parties. We do not share personal information about you with any third parties that triggers this opt-out right. This means YOU ARE ALREADY OPTED OUT.
When you are no longer our client or investor, we continue to share your information as described in this notice, and you may contact us at any time to limit our sharing by sending an email to CorporateDataPrivacy@GuggenheimPartners.com.
European Union Data Subjects and certain others: In addition to the choices set forth above, residents of the European Union and certain other jurisdictions have certain rights to (1) request access to or rectification or deletion of information we collect about them, (2) request a restriction on the processing of their information, (3) object to the processing of their information, or (4) request the portability of certain information. To exercise these or other rights, please contact us using the contact information below. We will consider all requests and provide our response within the time period stated by applicable law. Please note, however, that certain information may be exempt from such requests in some circumstances, which may include if we need to keep processing your information for our legitimate interests or to comply with a legal obligation. We may request you provide us with information necessary to confirm your identity before responding to your request.
Residents of France and certain other jurisdictions may also provide us with instructions regarding the manner in which we may continue to store, erase and share your information after your death, and where applicable, the person you have designated to exercise these rights after your death.
How We Protect Privacy Online
We take steps to protect your privacy when you use our web site – www.guggenheiminvestments.com – by using secure forms of online communication, including encryption technology, Secure Socket Layer (SSL) protocol, firewalls and user names and passwords. These safeguards vary based on the sensitivity of the information that we collect and store. However, we cannot and do not guarantee that these measures will prevent every unauthorized attempt to access, use, or disclose your information since despite our efforts, no Internet and/or other
| | THE GUGGENHEIM FUNDS SEMI-ANNUAL REPORT | 25 |
GUGGENHEIM INVESTMENTS PRIVACY NOTICE (Unaudited)(concluded) |
electronic transmissions can be completely secure. Our web site uses “http cookies”—tiny pieces of information that we ask your browser to store. We use cookies for session management and security features on the Guggenheim Investments web site. We do not use them to pull data from your hard drive, to learn your e-mail address, or to view data in cookies created by other web sites. We will not share the information in our cookies or give others access to it. See the legal information area on our web site for more details about web site security and privacy features.
How We Safeguard Your Personal Information and Data Retention
We restrict access to nonpublic personal information about you to our employees and in some cases to third parties (for example, the service providers described above) as permitted by law. We maintain strict physical, electronic and procedural safeguards that comply with federal standards to guard your nonpublic personal information.
We keep your information for no longer than necessary for the purposes for which it is processed. The length of time for which we retain information depends on the purposes for which we collected and use it and/or as required to comply with applicable laws. Information may persist in copies made for backup and business continuity purposes for additional time.
International Visitors
If you are not a resident of the United States, please be aware that your information may be transferred to, stored and processed in the United States where our servers are located and our databases are operated. The data protection and other laws of the United States and other countries might not be as comprehensive as those in your country.
In such cases, we ensure that a legal basis for such a transfer exists and that adequate protection is provided as required by applicable law, for example, by using standard contractual clauses or by transferring your data to a jurisdiction that has obtained an adequacy finding. Individuals whose data may be transferred on the basis of standard contractual clauses may contact us as described below.
We’ll Keep You Informed
If you have any questions or concerns about how we treat your personal data, we encourage you to consult with us first. You may also contact the relevant supervisory authority.
We reserve the right to modify this policy at any time and will inform you promptly of material changes. You may access our privacy policy from our web site at www.guggenheiminvestments.com. Should you have any questions regarding our privacy policy, contact us by email at CorporateDataPrivacy@GuggenheimPartners.com.
26 | THE GUGGENHEIM FUNDS SEMI-ANNUAL REPORT | |
This page intentionally left blank.
This page intentionally left blank.
This page intentionally left blank.
3.31.2021
Guggenheim Funds Semi-Annual Report
| |
Guggenheim Macro Opportunities Fund | | |
GuggenheimInvestments.com | MO-SEMI-0321x0921 |

| | |
DEAR SHAREHOLDER | 2 |
ECONOMIC AND MARKET OVERVIEW | 4 |
ABOUT SHAREHOLDERS’ FUND EXPENSES | 6 |
MACRO OPPORTUNITIES FUND | 9 |
NOTES TO CONSOLIDATED FINANCIAL STATEMENTS | 74 |
OTHER INFORMATION | 103 |
INFORMATION ON BOARD OF TRUSTEES AND OFFICERS | 104 |
GUGGENHEIM INVESTMENTS PRIVACY NOTICE | 111 |
| | THE GUGGENHEIM FUNDS SEMI-ANNUAL REPORT | 1 |
Dear Shareholder:
Guggenheim Partners Investment Management, LLC (“GPIM” or the “Investment Adviser”), is pleased to present the shareholder report for Guggenheim Macro Opportunities Fund (the “Fund”) for the semi-annual period ended March 31, 2021.
The Investment Adviser is part of Guggenheim Investments, which represents the investment management businesses of Guggenheim Partners, LLC (“Guggenheim”), a global, diversified financial services firm.
Guggenheim Funds Distributors, LLC is the distributor of the Fund. Guggenheim Funds Distributors, LLC is affiliated with Guggenheim and the Investment Adviser.
We encourage you to read the Economic and Market Overview section of the report, which follows this letter.
We are committed to providing innovative investment solutions and appreciate the trust you place in us.
Sincerely,
Guggenheim Partners Investment Management, LLC
April 30, 2021
Read a prospectus and summary prospectus (if available) carefully before investing. It contains the investment objectives, risks, charges, expenses and other information, which should be considered carefully before investing. Obtain a prospectus and summary prospectus (if available) at guggenheiminvestments.com or call 800.820.0888.
This material is not intended as a recommendation or as investment advice of any kind, including in connection with rollovers, transfers, and distributions. Such material is not provided in a fiduciary capacity, may not be relied upon for or in connection with the making of investment decisions, and does not constitute a solicitation of an offer to buy or sell securities. All content has been provided for informational or educational purposes only and is not intended to be and should not be construed as legal or tax advice and/or a legal opinion. Always consult a financial, tax and/or legal professional regarding your specific situation.
COVID-19. The global ongoing crisis caused by the outbreak of COVID-19 and the current recovery underway is causing disruption to consumer demand and economic output and supply chains. There are still travel restrictions and quarantines, and adverse impacts on local and global economies. Investors should be aware that in light of the current uncertainty, volatility and distress in economies, financial markets, and labor and public health conditions around the world, the Fund’s investments and a shareholder’s investment in the Fund are subject investment risk, including the possible loss of the entire principal amount invested. Firms through which investors invest with the Fund, the Fund, its service providers, the markets in which it invests and market intermediaries are also impacted by quarantines and similar measures intended to respond to and contain the ongoing pandemic, which can obstruct their functioning and subject them to heightened operational and other risks.
2 | THE GUGGENHEIM FUNDS SEMI-ANNUAL REPORT | |
Macro Opportunities Fund may not be suitable for all investors. ● The Fund’s market value will change in response to interest rate changes and market conditions among other factors. In general, bond prices rise when interest rates fall and vice versa. ● The Fund’s exposure to high yield securities may subject the Fund to greater volatility. ● The intrinsic value of the underlying stocks in which the Fund invests may never be realized or the stock may decline in value. ● When market conditions are deemed appropriate, the Fund may use leverage to the full extent permitted by its investment policies and restrictions and applicable law. Leveraging will exaggerate the effect on net asset value of any increase or decrease in the market value of the Fund’s portfolio. ● The use of short selling involves increased risks and costs. You risk paying more for a security than you received from its sale. Theoretically, stocks sold short have the risk of unlimited losses. ● The Fund may invest in derivative instruments, which may be more volatile and less liquid, increasing the risk of loss when compared to traditional securities. Certain of the derivative instruments are also subject to the risks of counterparty default and adverse tax treatment. ● Instruments and strategies (such as borrowing transactions and reverse repurchase agreements) may provide leveraged exposure to a particular investment, which will magnify any gains or losses on those investments. ● Investments in reverse repurchase agreements expose the Fund to the many of the same risks as investments in derivatives. ● The Fund’s investments in other investment vehicles subject the Fund to those risks and expenses affecting the investment vehicle. ● The Fund’s investments in foreign securities carry additional risks when compared to U.S. securities, due to the impact of diplomatic, political or economic developments in the country in question (investments in emerging markets securities are generally subject to an even greater level of risks). ● Investments in syndicated bank loans generally offer a floating interest rate and involve special types of risks. ● A highly liquid secondary market may not exist for the commodity-linked structured notes the Fund invests in, and there can be no assurance that a highly liquid secondary market will develop. ● The Fund’s exposure to the commodity markets may subject the Fund to greater volatility as commodity-linked investments may be affected by changes in overall market movements, commodity index volatility, changes in interest rates or factors affecting a particular industry or commodity such as droughts, floods, weather, embargos, tariffs and international economic, political and regulatory developments. ● The Fund’s investments in municipal securities can be affected by events that affect the municipal bond market. ● The Fund’s investments in real estate securities subject the Fund to the same risks as direct investments in real estate, which is particularly sensitive to economic downturns. ● The Fund’s investments in restricted securities may involve financial and liquidity risk. ● You may have a gain or loss when you sell your shares. ● It is important to note that the Fund is not guaranteed by the U.S. government. ● Please read the prospectus for more detailed information regarding these and other risks.
| | THE GUGGENHEIM FUNDS SEMI-ANNUAL REPORT | 3 |
ECONOMIC AND MARKET OVERVIEW (Unaudited) | March 31, 2021 |
For the six-month period ended March 31, 2021, the yield on the two-year U.S. Treasury Note rose 3 basis points1 to 0.16% from 0.13%, and the 10-year U.S. Treasury Note climbed 105 basis points to 1.74% from 0.69%. The spread between the two-year U.S. Treasury Note and 10-year U.S. Treasury Note widened from 56 basis points to 158 basis points as investors repositioned in response to fears of inflationary pressure, which the Federal Reserve (the “Fed”) regards as a transitory, short-term phenomenon. Easy financial conditions and low rates will likely support credit over the next few years. With market optimism pulling forward rate hike expectations and causing bond yields to rise, we view this as an opportunity to add incremental yield to portfolios.
Our 2021 U.S. economic growth forecast increased during the first quarter of 2021 from an annualized 5.5% to over 7%, factoring in more fiscal stimulus than previously anticipated. This forecast captures the effect of stimulus representing roughly 11% of 2020–2021 gross domestic product (“GDP”), versus the previous calculation of about 8%. We see strength in the consumer sector and in housing activity. In addition, U.S. vaccinations for COVID-19 continue to accelerate, nearing 3 million doses per day by the end of the first quarter. More than 213 million doses have been administered in the U.S. so far, and about 35% of the U.S. population has been fully vaccinated. The U.S. is seeing the best-case scenario unfold in its vaccine rollout, but other countries have not been as fortunate.
Europe’s vaccine rollout hit a major speedbump during the first quarter when questions surrounding the safety of the AstraZeneca vaccine led several major European countries to temporarily suspend distribution. Safety concerns, coupled with supply constraints, meant that less than 10% of the populations of Germany, France, and Italy had been vaccinated by the end of the first quarter, well under the pace needed to reach 70% inoculated by summer. Any delay in ending the pandemic on a global scale has implications for other countries too, including the U.S., where travel and hospitality workers represent a large share of the unemployed.
Despite vaccination delays in Europe and its implications abroad, we saw meaningful improvement in the domestic labor market during the first quarter as states moved forward with business re-openings. Seasonally adjusted initial jobless claims fell by 97,000 to 684,000 in the week ending March 20, 2021, the lowest level since the pandemic began, before seeing an uptick the following week to 719,000. We saw more positive news across the board in the March payroll report with 916,000 jobs added, and with 156,000 more from revisions. Standing in the way of additional labor market gains are local government restrictions on certain sectors, although easing of these restrictions is expected by summer.
Economic developments drove a sharp increase in U.S. Treasury yields. The market pulled forward expectations of the next Fed rate hike from December 2023 to December 2022, while repricing the long-run terminal Fed funds rate estimate to 2.25% from just 0.55% last August. We do not expect the Fed to raise interest rates as early as the market is anticipating, even though we expect strong GDP growth in coming years.
4 | THE GUGGENHEIM FUNDS SEMI-ANNUAL REPORT | |
ECONOMIC AND MARKET OVERVIEW (Unaudited)(concluded) | March 31, 2021 |
Year-over-year inflation measures will rise over the next several months due to base effects, which may be compounded by supply chain disruptions in the goods sector and potential capacity constraints for certain services. However, these factors could prove to be short-lived, with base effects set to dampen inflation starting in the summer months. Moreover, the Fed is focused on generating sustainably higher inflation. Even if core inflation rises above the Fed’s 2% target in 2021, the Fed’s focus is on a long-term average of 2%. With years of shortfalls to make up, and the Fed now targeting labor market disparities as part of an expanded definition of full employment, we expect policymakers to remain resolutely patient. Any tapering of asset purchases will likely be deferred until later in 2022, with the first rate hike likely to come sometime after that.
For the six-month period ended March 31, 2021, the Standard & Poor’s® (“S&P 500®”) Index* returned 19.07%. The MSCI Europe-Australasia-Far East (“EAFE”) Index* returned 20.08%. The return of the MSCI Emerging Markets Index* was 22.43%.
In the bond market, the Bloomberg Barclays U.S. Aggregate Bond Index* posted a -2.73% return for the six-month period, while the Bloomberg Barclays U.S. Corporate High Yield Index* returned 7.36%. The return of the ICE Bank of America (“BofA”) Merrill Lynch 3-Month U.S. Treasury Bill Index* was 0.06% for the six-month period.
The opinions and forecasts expressed may not actually come to pass. This information is subject to change at any time, based on market and other conditions, and should not be construed as a recommendation of any specific security or strategy.
1 | Basis point — one basis point is equal to 0.01%. |
*Index Definitions:
The following indices are referenced throughout this report. Indices are unmanaged and not available for direct investment. Index performance does not reflect transaction costs, fees, or expenses.
Bloomberg Barclays U.S. Aggregate Bond Index is a broad-based flagship benchmark that measures the investment grade, U.S. dollar-denominated, fixed-rate taxable bond market, including U.S. Treasuries, government-related and corporate securities, mortgage-backed securities or “MBS” (agency fixed-rate and hybrid adjustable-rate mortgage, or “ARM”, pass-throughs), asset-backed securities (“ABS”), and commercial mortgage-backed securities (“CMBS”) (agency and non-agency).
Bloomberg Barclays U.S. Corporate High Yield Index measures the U.S. dollar-denominated, high yield, fixed-rate corporate bond market. Securities are classified as high yield if the middle rating of Moody’s, Fitch, and S&P is Ba1/BB +/BB + or below.
ICE BofA Merrill Lynch 3-Month U.S. Treasury Bill Index is an unmanaged market Index of U.S. Treasury securities maturing in 90 days that assumes reinvestment of all income.
MSCI EAFE Index is a free float-adjusted market capitalization index that is designed to measure the equity market performance of developed markets, excluding the U.S. & Canada.
MSCI Emerging Markets Index is a free float-adjusted market capitalization weighted index that is designed to measure equity market performance in the global emerging markets.
S&P 500® is a broad-based index, the performance of which is based on the performance of 500 widely held common stocks chosen for market size, liquidity, and industry group representation.
| | THE GUGGENHEIM FUNDS SEMI-ANNUAL REPORT | 5 |
ABOUT SHAREHOLDERS’ FUND EXPENSES (Unaudited) |
All mutual funds have operating expenses, and it is important for our shareholders to understand the impact of costs on their investments. Shareholders of a fund incur two types of costs: (i) transaction costs, including sales charges (loads) on purchase payments, reinvested dividends, other distributions, and exchange fees, and (ii) ongoing costs, including management fees, administrative services, and shareholder reports, among others. These ongoing costs, or operating expenses, are deducted from a fund’s gross income and reduce the investment return of the fund.
A fund’s expenses are expressed as a percentage of its average net assets, which is known as the expense ratio. The following examples are intended to help investors understand the ongoing costs (in dollars) of investing in a fund and to compare these costs with the ongoing costs of investing in other mutual funds.
The examples are based on an investment of $1,000 made at the beginning of the period and held for the entire six-month period beginning September 30, 2020 and ending March 31, 2021.
The following tables illustrate the Fund’s costs in two ways:
Table 1. Based on actual Fund return: This section helps investors estimate the actual expenses paid over the period. The “Ending Account Value” shown is derived from the Fund’s actual return, and the fifth column shows the dollar amount that would have been paid by an investor who started with $1,000 in the Fund. Investors may use the information here, together with the amount invested, to estimate the expenses paid over the period. Simply divide the Fund’s account value by $1,000 (for example, an $8,600 account value divided by $1,000 = 8.6), then multiply the result by the number provided under the heading “Expenses Paid During Period.”
Table 2. Based on hypothetical 5% return: This section is intended to help investors compare a fund’s cost with those of other mutual funds. The table provides information about hypothetical account values and hypothetical expenses based on the Fund’s actual expense ratio and an assumed rate of return of 5% per year before expenses, which is not the Fund’s actual return. The hypothetical account values and expenses may not be used to estimate the actual ending account balance or expenses paid during the period. The example is useful in making comparisons because the U.S. Securities and Exchange Commission (the “SEC”) requires all mutual funds to calculate expenses based on the 5% return. Investors can assess a Fund’s costs by comparing this hypothetical example with the hypothetical examples that appear in shareholder reports of other funds.
The calculations illustrated above assume no shares were bought or sold during the period. Actual costs may have been higher or lower, depending on the amount of investment and the timing of any purchases or redemptions.
6 | THE GUGGENHEIM FUNDS SEMI-ANNUAL REPORT | |
ABOUT SHAREHOLDERS’ FUND EXPENSES (Unaudited)(continued) |
Please note that the expenses shown in the table are meant to highlight your ongoing costs only and do not reflect any transactional costs, such as sales charges (loads) on purchase payments, and contingent deferred sales charges (“CDSC”) on redemptions, if any. Therefore, the second table is useful in comparing ongoing costs only, and will not help you determine the relative total costs of owning different funds. In addition, if these transactional costs were included, your costs would have been higher.
More information about the Fund’s expenses, including annual expense ratios for periods up to five years (subject to the Fund’s inception date), can be found in the Financial Highlights section of this report. For additional information on operating expenses and other shareholder costs, please refer to the Fund’s prospectus.
| | THE GUGGENHEIM FUNDS SEMI-ANNUAL REPORT | 7 |
ABOUT SHAREHOLDERS’ FUND EXPENSES (Unaudited)(concluded) |
| Expense
Ratio1 | Fund
Return | Beginning
Account Value
September 30,
2020 | Ending
Account Value
March 31,
2021 | Expenses
Paid During
Period2 |
Table 1. Based on actual Fund return3 |
A-Class | 1.36% | 5.84% | $ 1,000.00 | $ 1,058.40 | $ 6.98 |
C-Class | 2.11% | 5.46% | 1,000.00 | 1,054.60 | 10.81 |
P-Class | 1.36% | 5.84% | 1,000.00 | 1,058.40 | 6.98 |
Institutional Class | 0.95% | 6.05% | 1,000.00 | 1,060.50 | 4.88 |
R6-Class | 0.95% | 6.05% | 1,000.00 | 1,060.50 | 4.88 |
|
Table 2. Based on hypothetical 5% return (before expenses) |
A-Class | 1.36% | 5.00% | $ 1,000.00 | $ 1,018.15 | $ 6.84 |
C-Class | 2.11% | 5.00% | 1,000.00 | 1,014.41 | 10.60 |
P-Class | 1.36% | 5.00% | 1,000.00 | 1,018.15 | 6.84 |
Institutional Class | 0.95% | 5.00% | 1,000.00 | 1,020.19 | 4.78 |
R6-Class | 0.95% | 5.00% | 1,000.00 | 1,020.19 | 4.78 |
1 | This ratio represents annualized net expenses, which may include short interest expense. Excluding these expenses, the operating expense ratios for the Fund would be 1.33%, 2.08%, 1.33%, 0.92% and 0.92% for the A-Class, C-Class, P-Class, Institutional Class and R6-Class, respectively. Excludes expenses of the underlying funds in which the Fund invests. |
2 | Expenses are equal to the Fund’s annualized expense ratio, net of any applicable fee waivers, multiplied by the average account value over the period, multiplied by 182/365 (to reflect the one-half year period). |
3 | Actual cumulative return at net asset value for the period September 30, 2020 to March 31, 2021. |
8 | THE GUGGENHEIM FUNDS SEMI-ANNUAL REPORT | |
PERFORMANCE REPORT AND FUND PROFILE (Unaudited) | March 31, 2021 |
MACRO OPPORTUNITIES FUND
OBJECTIVE: Seeks to provide total return, comprised of current income and capital appreciation.
Holdings Diversification (Market Exposure as % of Net Assets)

“Holdings Diversification (Market Exposure as % of Net Assets)” excludes any temporary cash investments.
Inception Dates: |
A-Class | November 30, 2011 |
C-Class | November 30, 2011 |
P-Class | May 1, 2015 |
Institutional Class | November 30, 2011 |
R6-Class | March 13, 2019 |
Ten Largest Holdings (% of Total Net Assets) |
Pershing Square Tontine Holdings, Ltd. — Class A | 2.5% |
Guggenheim Risk Managed Real Estate Fund — Institutional Class | 1.0% |
KKR Acquisition Holdings I Corp. | 0.8% |
KDAC Aviation Finance Ltd., 4.21% | 0.7% |
Delta Air Lines, Inc., 7.00% | 0.7% |
TSGE, 6.25% | 0.7% |
BP Capital Markets plc, 4.88% | 0.6% |
Boeing Co., 5.15% | 0.6% |
Markel Corp., 6.00% | 0.5% |
Liberty Mutual Group, Inc., 4.30% | 0.5% |
Top Ten Total | 8.6% |
| | |
“Ten Largest Holdings” excludes any temporary cash or derivative investments. |
| | THE GUGGENHEIM FUNDS SEMI-ANNUAL REPORT | 9 |
PERFORMANCE REPORT AND FUND PROFILE (Unaudited)(continued) | March 31, 2021 |
Portfolio Composition by Quality Rating1 |
Rating | % of Total
Investments |
Fixed Income Instruments | |
AAA | 1.4% |
AA | 2.3% |
A | 7.9% |
BBB | 19.1% |
BB | 20.3% |
B | 23.4% |
CCC | 2.9% |
CC | 3.9% |
C | 0.2% |
NR2 | 4.7% |
Other Instruments | 13.9% |
Total Investments | 100.0% |
1 | Source: BlackRock Solutions. Credit quality ratings are measured on a scale that generally ranges from AAA (highest) to D (lowest). All securities except for those labeled “NR” have been rated by Moody’s, Standard & Poor’s (“S&P”), or Fitch, each of which is a Nationally Recognized Statistical Rating Organization (“NRSRO”). For purposes of this presentation, when ratings are available from more than one agency, the highest rating is used. Guggenheim Investments has converted ratings to the equivalent S&P rating. Security ratings are determined at the time of purchase and may change thereafter. |
2 | NR (not rated) securities do not necessarily indicate low credit quality. |
10 | THE GUGGENHEIM FUNDS SEMI-ANNUAL REPORT | |
PERFORMANCE REPORT AND FUND PROFILE (Unaudited)(concluded) | March 31, 2021 |
Average Annual Returns*
Periods Ended March 31, 2021
| 6 Month† | 1 Year | 5 Year | Since
Inception
(11/30/11) |
A-Class Shares | 5.84% | 18.48% | 5.55% | 5.29% |
A-Class Shares with sales charge‡ | 1.60% | 13.74% | 4.69% | 4.74% |
C-Class Shares | 5.46% | 17.58% | 4.77% | 4.52% |
C-Class Shares with CDSC§ | 4.46% | 16.58% | 4.77% | 4.52% |
Institutional Class Shares | 6.05% | 18.92% | 5.96% | 5.68% |
ICE BofA Merrill Lynch 3-Month U.S. Treasury Bill Index | 0.06% | 0.12% | 1.19% | 0.67% |
| 6 Month† | 1 Year | 5 Year | Since
Inception
(05/01/15) |
P-Class Shares | 5.84% | 18.46% | 5.57% | 4.22% |
ICE BofA Merrill Lynch 3-Month U.S. Treasury Bill Index | 0.06% | 0.12% | 1.19% | 1.02% |
| 6 Month† | 1 Year | Since
Inception
(03/13/19) |
R6-Class Shares | 6.05% | 18.96% | 6.45% |
ICE BofA Merrill Lynch 3-Month U.S. Treasury Bill Index | 0.06% | 0.12% | 1.22% |
* | The performance data above represents past performance that is not predictive of future results. The investment return and principal value of an investment in the Fund will fluctuate so that an investor’s shares, when redeemed, may be worth more or less than their original cost. Returns are historical and include changes in principal and reinvested dividends and capital gains and do not reflect the effect of taxes. The ICE BofA Merrill Lynch 3-Month U.S. Treasury Bill Index is an unmanaged index and, unlike the Fund, has no management fees or operating expenses to reduce its reported return. |
† | 6 month returns are not annualized. |
‡ | Effective October 1, 2015, the maximum sales charge decreased from 4.75% to 4.00%. A 4.75% maximum sales charge is used in the calculation of the Average Annual Returns based on subscriptions made prior to October 1, 2015, and a 4.00% maximum sales charge will be used to calculate performance for periods based on subscriptions made on or after October 1, 2015. |
§ | Fund returns include a CDSC of 1% if redeemed within 12 months of purchase. |
| | THE GUGGENHEIM FUNDS SEMI-ANNUAL REPORT | 11 |
CONSOLIDATED SCHEDULE OF INVESTMENTS (Unaudited) | March 31, 2021 |
MACRO OPPORTUNITIES FUND | |
| | Shares | | | Value | |
COMMON STOCKS† - 4.1% |
| | | | | | | | | |
Financial - 4.0% |
Pershing Square Tontine Holdings, Ltd. — Class A* | | | 6,864,930 | | | $ | 164,826,970 | |
KKR Acquisition Holdings I Corp.* | | | 5,062,315 | | | | 50,673,773 | |
Gores Holdings VI, Inc. — Class A* | | | 898,206 | | | | 12,305,422 | |
RXR Acquisition Corp.* | | | 1,080,492 | | | | 10,642,846 | |
Aequi Acquisition Corp. — Class A* | | | 999,157 | | | | 9,641,865 | |
MSD Acquisition Corp.* | | | 833,026 | | | | 8,455,214 | |
Soaring Eagle Acquisition Corp.* | | | 640,025 | | | | 6,477,053 | |
Colicity, Inc.* | | | 206,136 | | | | 2,081,974 | |
Total Financial | | | 265,105,117 | |
| | | | | | | | | |
Utilities - 0.1% |
TexGen Power LLC*,†† | | | 180,169 | | | | 7,266,756 | |
| | | | | | | | | |
Consumer, Non-cyclical - 0.0% |
ATD New Holdings, Inc.*,††† | | | 42,478 | | | | 1,423,013 | |
Cengage Learning Holdings II, Inc.*,†† | | | 21,660 | | | | 303,240 | |
Save-A-Lot*,††† | | | 22,703 | | | | 107,840 | |
Targus Group International Equity, Inc.*,†††,1 | | | 12,773 | | | | 27,336 | |
Chef Holdings, Inc.*,††† | | | 59 | | | | 3,722 | |
Total Consumer, Non-cyclical | | | 1,865,151 | |
| | | | | | | | | |
Energy - 0.0% |
Maverick Natural Resources, LLC*,††† | | | 7,168 | | | | 927,932 | |
Permian Production Partners LLC*,††† | | | 563,442 | | | | 56 | |
Total Energy | | | 927,988 | |
Technology - 0.0% |
Qlik Technologies, Inc. - Class A*,††† | | | 177 | | | | 225,465 | |
Qlik Technologies, Inc. - Class B*,††† | | | 43,738 | | | | 4 | |
Total Technology | | | 225,469 | |
| | | | | | | | | |
Industrial - 0.0% |
BP Holdco LLC*,†††,1 | | | 37,539 | | | | 13,236 | |
Vector Phoenix Holdings, LP*,††† | | | 37,539 | | | | 4,249 | |
API Heat Transfer Parent LLC*,††† | | | 1,024,936 | | | | 102 | |
Total Industrial | | | 17,587 | |
| | | | | | | | | |
Consumer Products - 0.0% |
Fashion Holdings Intermediate Inc.* | | | 263 | | | | 6,575 | |
| | | | | | | | | |
Total Common Stocks |
(Cost $241,809,884) | | | | | | | 275,414,643 | |
| | | | | | | | | |
PREFERRED STOCKS† - 3.8% |
Financial - 3.7% |
Bank of America Corp. | | | | | | | | |
4.13%†† | | | 1,002,000 | | | | 24,829,560 | |
4.38%†† | | | 736,000 | | | | 18,400,000 | |
First Republic Bank | | | | | | | | |
4.25%*,†† | | | 1,168,000 | | | | 29,982,560 | |
4.13%†† | | | 369,600 | | | | 9,240,000 | |
Public Storage | | | | | | | | |
4.63%†† | | | 966,000 | | | | 25,946,760 | |
4.13%†† | | | 365,600 | | | | 9,436,136 | |
W R Berkley Corp. | | | | | | | | |
4.13% due 03/30/61†† | | | 934,000 | | | | 23,359,340 | |
4.25% due 09/30/60†† | | | 249,200 | | | | 6,347,124 | |
Wells Fargo & Co., 4.70%†† | | | 982,000 | | | | 24,991,900 | |
Prudential Financial, Inc., 4.13% due 09/01/60†† | | | 686,800 | | | | 17,396,644 | |
Equitable Holdings, Inc., 4.30%†† | | | 616,000 | | | | 15,344,560 | |
12 | THE GUGGENHEIM FUNDS SEMI-ANNUAL REPORT | SEE NOTES TO CONSOLIDATED FINANCIAL STATEMENTS. |
CONSOLIDATED SCHEDULE OF INVESTMENTS (Unaudited)(continued) | March 31, 2021 |
MACRO OPPORTUNITIES FUND | |
| | Shares | | | Value | |
PartnerRe Ltd. 4.88%* | | | 372,000 | | | $ | 9,817,080 | |
CNO Financial Group, Inc., 5.13% due 11/25/60†† | | | 324,000 | | | | 8,164,800 | |
American Financial Group, Inc. 4.50% due 09/15/60†† | | | 300,800 | | | | 7,974,208 | |
Assurant, Inc. 5.25% due 01/15/61†† | | | 258,000 | | | | 6,635,760 | |
Selective Insurance Group, Inc. 4.60%†† | | | 246,000 | | | | 6,137,700 | |
Total Financial | | | 244,004,132 | |
| | | | | | | | | |
Government - 0.1% |
Farmer Mac 5.75%†† | | | 378,000 | | | | 10,249,848 | |
| | | | | | | | | |
Industrial - 0.0% |
API Heat Transfer Intermediate*,††† | | | 218 | | | | — | |
Total Preferred Stocks |
(Cost $249,024,412) | | | | | | | 254,253,980 | |
| | | | | | | | | |
WARRANTS† - 0.1% |
Pershing Square Tontine Holdings, Ltd. | | | | | | | | |
Expiring 07/24/25 | | | 762,770 | | | | 6,216,575 | |
Gores Holdings VI, Inc. | | | | | | | | |
Expiring 08/24/27 | | | 269,461 | | | | 1,064,371 | |
Aequi Acquisition Corp. | | | | | | | | |
Expiring 11/30/27 | | | 333,052 | | | | 316,400 | |
Total Warrants |
(Cost $6,708,342) | | | | | | | 7,597,346 | |
| | | | | | | | | |
MUTUAL FUNDS† - 1.4% |
Guggenheim Risk Managed Real Estate Fund — Institutional Class1 | | | 1,892,836 | | | | 63,334,291 | |
Guggenheim Alpha Opportunity Fund — Institutional Class1 | | | 1,003,137 | | | | 27,556,186 | |
Total Mutual Funds |
(Cost $85,351,099) | | | | | | | 90,890,477 | |
| | | | | | | | | |
CLOSED-END FUNDS† - 1.3% |
BlackRock Corporate High Yield Fund, Inc. | | | 2,543,550 | | | | 29,861,277 | |
Blackstone Strategic Credit Fund | | | 923,879 | | | | 12,315,307 | |
BlackRock Credit Allocation Income Trust | | | 818,356 | | | | 12,013,466 | |
Guggenheim Strategic Opportunities Fund1 | | | 527,233 | | | | 11,066,621 | |
Eaton Vance Limited Duration Income Fund | | | 632,955 | | | | 7,994,222 | |
Ares Dynamic Credit Allocation Fund, Inc. | | | 460,168 | | | | 6,916,325 | |
BlackRock Debt Strategies Fund, Inc. | | | 348,016 | | | | 3,828,176 | |
Western Asset High Income Opportunity Fund, Inc. | | | 358,091 | | | | 1,819,102 | |
Total Closed-End Funds |
(Cost $62,529,962) | | | | | | | 85,814,496 | |
| | | | | | | | | |
SEE NOTES TO CONSOLIDATED FINANCIAL STATEMENTS. | THE GUGGENHEIM FUNDS SEMI-ANNUAL REPORT | 13 |
CONSOLIDATED SCHEDULE OF INVESTMENTS (Unaudited)(continued) | March 31, 2021 |
MACRO OPPORTUNITIES FUND | |
| | Shares | | | Value | |
MONEY MARKET FUND† - 3.2% |
Federated Hermes U.S. Treasury Cash Reserves Fund — Institutional Shares, 0.01%2 | | | 211,058,636 | | | $ | 211,058,636 | |
Western Asset Institutional U.S. Treasury Reserves Institutional Shares, 0.01%2 | | | 5,445,461 | | | | 5,445,461 | |
Total Money Market Fund |
(Cost $216,504,097) | | | | | | | 216,504,097 | |
| | | | | | | | | |
| | | Face
Amount~ | | | | | |
CORPORATE BONDS†† - 40.1% |
Financial - 11.0% |
Citigroup, Inc. | | | | | | | | |
3.88%3,4 | | | 29,500,000 | | | | 29,362,235 | |
4.00%3,4 | | | 12,000,000 | | | | 12,117,000 | |
NFP Corp. | | | | | | | | |
7.00% due 05/15/255 | | | 21,300,000 | | | | 22,844,250 | |
6.88% due 08/15/285 | | | 17,500,000 | | | | 18,175,500 | |
Markel Corp. | | | | | | | | |
6.00%3,4 | | | 32,370,000 | | | | 35,202,375 | |
Liberty Mutual Group, Inc. | | | | | | | | |
4.30% due 02/01/615 | | | 36,940,000 | | | | 33,199,300 | |
Home Point Capital, Inc. | | | | | | | | |
5.00% due 02/01/265 | | | 32,910,000 | | | | 32,580,900 | |
GLP Capital Limited Partnership / GLP Financing II, Inc. | | | | | | | | |
4.00% due 01/15/31 | | | 22,640,000 | | | | 23,397,874 | |
5.30% due 01/15/29 | | | 6,950,000 | | | | 7,790,602 | |
Wilton RE Ltd. | | | | | | | | |
6.00%†††,3,4,5 | | | 31,350,000 | | | | 30,808,586 | |
Charles Schwab Corp. | | | | | | | | |
4.00%3,4 | | | 16,400,000 | | | | 16,099,060 | |
5.38%3,4 | | | 12,950,000 | | | | 14,355,075 | |
Iron Mountain, Inc. | | | | | | | | |
5.63% due 07/15/325 | | | 25,025,000 | | | | 26,151,125 | |
4.50% due 02/15/315 | | | 2,025,000 | | | | 2,001,915 | |
Equitable Holdings, Inc. | | | | | | | | |
4.95%3,4 | | | 24,550,000 | | | | 25,961,625 | |
Host Hotels & Resorts, LP | | | | | | | | |
3.50% due 09/15/30 | | | 24,000,000 | | | | 24,012,936 | |
LPL Holdings, Inc. | | | | | | | | |
4.00% due 03/15/295 | | | 23,300,000 | | | | 23,474,750 | |
Cushman & Wakefield US Borrower LLC | | | | | | | | |
6.75% due 05/15/285 | | | 21,450,000 | | | | 23,192,813 | |
Nationwide Mutual Insurance Co. | | | | | | | | |
4.35% due 04/30/505 | | | 21,150,000 | | | | 22,136,649 | |
United Wholesale Mortgage LLC | | | | | | | | |
5.50% due 11/15/255 | | | 12,600,000 | | | | 13,135,500 | |
5.50% due 04/15/295 | | | 8,350,000 | | | | 8,339,562 | |
Quicken Loans LLC / Quicken Loans Company-Issuer, Inc. | | | | | | | | |
3.88% due 03/01/315 | | | 21,650,000 | | | | 20,892,250 | |
American International Group, Inc. | | | | | | | | |
4.38% due 06/30/50 | | | 18,150,000 | | | | 20,656,461 | |
Kuvare US Holdings, Inc. | | | | | | | | |
7.00% due 02/17/514,5 | | | 19,150,000 | | | | 19,536,949 | |
Wells Fargo & Co. | | | | | | | | |
3.90%3,4 | | | 18,000,000 | | | | 18,178,200 | |
Hampton Roads PPV LLC | | | | | | | | |
6.62% due 06/15/535 | | | 16,900,000 | | | | 18,111,101 | |
Hunt Companies, Inc. | | | | | | | | |
5.25% due 04/15/295 | | | 17,200,000 | | | | 17,200,000 | |
Kennedy-Wilson, Inc. | | | | | | | | |
5.00% due 03/01/31 | | | 16,000,000 | | | | 16,204,000 | |
Pershing Square Holdings, Ltd. | | | | | | | | |
3.25% due 11/15/305 | | | 15,100,000 | | | | 14,766,027 | |
14 | THE GUGGENHEIM FUNDS SEMI-ANNUAL REPORT | SEE NOTES TO CONSOLIDATED FINANCIAL STATEMENTS. |
CONSOLIDATED SCHEDULE OF INVESTMENTS (Unaudited)(continued) | March 31, 2021 |
MACRO OPPORTUNITIES FUND | |
| | Face
Amount~ | | | Value | |
First American Financial Corp. | | | | | | | | |
4.00% due 05/15/306 | | | 11,760,000 | | | $ | 12,704,104 | |
MetLife, Inc. | | | | | | | | |
3.85%3,4 | | | 12,200,000 | | | | 12,596,500 | |
Fidelity National Financial, Inc. | | | | | | | | |
3.40% due 06/15/30 | | | 11,450,000 | | | | 11,942,445 | |
OneMain Finance Corp. | | | | | | | | |
4.00% due 09/15/30 | | | 11,650,000 | | | | 11,329,625 | |
Ares Finance Company II LLC | | | | | | | | |
3.25% due 06/15/305,6 | | | 11,000,000 | | | | 11,136,798 | |
OneAmerica Financial Partners, Inc. | | | | | | | | |
4.25% due 10/15/505 | | | 11,550,000 | | | | 11,110,334 | |
Allianz SE | | | | | | | | |
3.50%3,4,5 | | | 9,500,000 | | | | 9,642,500 | |
QBE Insurance Group Ltd. | | | | | | | | |
5.88%3,4,5 | | | 7,550,000 | | | | 8,125,688 | |
SBA Communications Corp. | | | | | | | | |
3.13% due 02/01/295 | | | 4,200,000 | | | | 4,036,830 | |
3.88% due 02/15/27 | | | 3,650,000 | | | | 3,731,030 | |
CIT Group, Inc. | | | | | | | | |
3.93% due 06/19/244 | | | 7,150,000 | | | | 7,561,125 | |
Atlas Mara Ltd. | | | | | | | | |
8.00% due 03/20/21†††,7 | | | 14,400,000 | | | | 6,981,120 | |
PartnerRe Finance B LLC | | | | | | | | |
4.50% due 10/01/504 | | | 6,460,000 | | | | 6,582,695 | |
Lincoln National Corp. | | | | | | | | |
4.38% due 06/15/50 | | | 5,080,000 | | | | 5,674,492 | |
American Equity Investment Life Holding Co. | | | | | | | | |
5.00% due 06/15/27 | | | 4,813,000 | | | | 5,345,382 | |
Bank of New York Mellon Corp. | | | | | | | | |
4.70%3,4 | | | 4,500,000 | | | | 4,875,525 | |
Alliant Holdings Intermediate LLC / Alliant Holdings Company-Issuer | | | | | | | | |
4.25% due 10/15/275 | | | 3,900,000 | | | | 3,935,490 | |
AmWINS Group, Inc. | | | | | | | | |
7.75% due 07/01/265 | | | 3,400,000 | | | | 3,638,000 | |
Univest Financial Corp. | | | | | | | | |
3.74% (3 Month USD LIBOR + 3.54%) due 03/30/258 | | | 1,997,000 | | | | 1,988,467 | |
HUB International Ltd. | | | | | | | | |
7.00% due 05/01/265 | | | 500,000 | | | | 519,205 | |
Total Financial | | | 733,341,975 | |
| | | | | | | | | |
Consumer, Cyclical - 7.9% |
Delta Air Lines, Inc. | | | | | | | | |
7.00% due 05/01/255 | | | 41,320,000 | | | | 47,582,332 | |
Marriott International, Inc. | | | | | | | | |
2.85% due 04/15/31 | | | 14,730,000 | | | | 14,474,791 | |
4.63% due 06/15/306 | | | 10,900,000 | | | | 12,185,727 | |
5.75% due 05/01/25 | | | 8,440,000 | | | | 9,681,454 | |
3.50% due 10/15/32 | | | 8,150,000 | | | | 8,420,052 | |
Hilton Domestic Operating Company, Inc. | | | | | | | | |
4.00% due 05/01/315 | | | 23,200,000 | | | | 23,200,000 | |
3.63% due 02/15/325 | | | 4,150,000 | | | | 4,027,990 | |
5.75% due 05/01/285 | | | 525,000 | | | | 565,042 | |
Live Nation Entertainment, Inc. | | | | | | | | |
6.50% due 05/15/275 | | | 17,785,000 | | | | 19,719,474 | |
3.75% due 01/15/285 | | | 7,500,000 | | | | 7,396,875 | |
Delta Air Lines, Inc. / SkyMiles IP Ltd. | | | | | | | | |
4.75% due 10/20/285 | | | 24,150,000 | | | | 26,248,027 | |
Walgreens Boots Alliance, Inc. | | | | | | | | |
3.20% due 04/15/30 | | | 12,750,000 | | | | 13,231,275 | |
4.10% due 04/15/50 | | | 9,957,000 | | | | 10,063,071 | |
SEE NOTES TO CONSOLIDATED FINANCIAL STATEMENTS. | THE GUGGENHEIM FUNDS SEMI-ANNUAL REPORT | 15 |
CONSOLIDATED SCHEDULE OF INVESTMENTS (Unaudited)(continued) | March 31, 2021 |
MACRO OPPORTUNITIES FUND | |
| | Face
Amount~ | | | Value | |
Mileage Plus Holdings LLC / Mileage Plus Intellectual Property Assets Ltd. | | | | | | | | |
6.50% due 06/20/275 | | | 19,700,000 | | | $ | 21,571,500 | |
1011778 BC ULC / New Red Finance, Inc. | | | | | | | | |
4.00% due 10/15/305 | | | 22,200,000 | | | | 21,423,000 | |
Yum! Brands, Inc. | | | | | | | | |
4.63% due 01/31/32 | | | 16,350,000 | | | | 16,704,223 | |
Hyatt Hotels Corp. | | | | | | | | |
5.38% due 04/23/25 | | | 7,350,000 | | | | 8,238,967 | |
5.75% due 04/23/30 | | | 6,530,000 | | | | 7,622,355 | |
Wolverine World Wide, Inc. | | | | | | | | |
6.38% due 05/15/255 | | | 14,100,000 | | | | 15,016,500 | |
British Airways Class A Pass Through Trust | | | | | | | | |
4.25% due 11/15/325 | | | 13,772,066 | | | | 14,421,654 | |
Picasso Finance Sub, Inc. | | | | | | | | |
6.13% due 06/15/255 | | | 13,476,000 | | | | 14,318,250 | |
VF Corp. | | | | | | | | |
2.95% due 04/23/309 | | | 13,230,000 | | | | 13,692,648 | |
Aramark Services, Inc. | | | | | | | | |
6.38% due 05/01/255 | | | 11,950,000 | | | | 12,667,000 | |
5.00% due 02/01/285 | | | 795,000 | | | | 825,011 | |
JB Poindexter & Company, Inc. | | | | | | | | |
7.13% due 04/15/265 | | | 11,725,000 | | | | 12,384,531 | |
JetBlue Class A Pass Through Trust | | | | | | | | |
4.00% due 11/15/326 | | | 11,320,000 | | | | 12,203,974 | |
Six Flags Theme Parks, Inc. | | | | | | | | |
7.00% due 07/01/255 | | | 10,475,000 | | | | 11,336,254 | |
Wyndham Hotels & Resorts, Inc. | | | | | | | | |
4.38% due 08/15/285 | | | 10,700,000 | | | | 10,823,050 | |
Cedar Fair, LP / Canada’s Wonderland Co. / Magnum Management Corp. / Millennium Operations LLC | | | | | | | | |
5.50% due 05/01/255 | | | 10,213,000 | | | | 10,732,842 | |
Scotts Miracle-Gro Co. | | | | | | | | |
4.00% due 04/01/315 | | | 9,900,000 | | | | 9,761,400 | |
Boyne USA, Inc. | | | | | | | | |
7.25% due 05/01/255 | | | 8,690,000 | | | | 9,033,255 | |
PetSmart Incorporated / PetSmart Finance Corp. | | | | | | | | |
4.75% due 02/15/285 | | | 7,500,000 | | | | 7,686,075 | |
Clarios Global, LP | | | | | | | | |
6.75% due 05/15/255 | | | 7,150,000 | | | | 7,648,355 | |
Tempur Sealy International, Inc. | | | | | | | | |
4.00% due 04/15/295 | | | 7,600,000 | | | | 7,562,000 | |
Williams Scotsman International, Inc. | | | | | | | | |
4.63% due 08/15/285 | | | 7,376,000 | | | | 7,505,080 | |
Crocs, Inc. | | | | | | | | |
4.25% due 03/15/295 | | | 7,500,000 | | | | 7,335,075 | |
Hawaiian Brand Intellectual Property Ltd. / HawaiianMiles Loyalty Ltd. | | | | | | | | |
5.75% due 01/20/265 | | | 5,950,000 | | | | 6,323,660 | |
American Airlines Class AA Pass Through Trust | | | | | | | | |
3.58% due 01/15/28 | | | 2,558,765 | | | | 2,589,717 | |
3.35% due 10/15/29 | | | 1,383,511 | | | | 1,396,501 | |
3.65% due 02/15/29 | | | 1,193,010 | | | | 1,201,946 | |
3.15% due 02/15/32 | | | 1,135,032 | | | | 1,129,011 | |
Whirlpool Corp. | | | | | | | | |
4.60% due 05/15/50 | | | 5,440,000 | | | | 6,236,056 | |
WMG Acquisition Corp. | | | | | | | | |
3.88% due 07/15/305 | | | 3,900,000 | | | | 3,937,616 | |
3.00% due 02/15/315 | | | 1,875,000 | | | | 1,781,813 | |
16 | THE GUGGENHEIM FUNDS SEMI-ANNUAL REPORT | SEE NOTES TO CONSOLIDATED FINANCIAL STATEMENTS. |
CONSOLIDATED SCHEDULE OF INVESTMENTS (Unaudited)(continued) | March 31, 2021 |
MACRO OPPORTUNITIES FUND | |
| | Face
Amount~ | | | Value | |
Suburban Propane Partners Limited Partnership/Suburban Energy Finance Corp. | | | | | | | | |
5.50% due 06/01/24 | | | 5,010,000 | | | $ | 5,086,904 | |
Murphy Oil USA, Inc. | | | | | | | | |
3.75% due 02/15/315 | | | 5,025,000 | | | | 4,939,198 | |
Superior Plus Limited Partnership / Superior General Partner, Inc. | | | | | | | | |
4.50% due 03/15/295 | | | 4,800,000 | | | | 4,848,960 | |
Powdr Corp. | | | | | | | | |
6.00% due 08/01/255 | | | 4,300,000 | | | | 4,531,555 | |
Hanesbrands, Inc. | | | | | | | | |
5.38% due 05/15/255 | | | 3,810,000 | | | | 4,031,456 | |
Air Canada 2020-2 Class A Pass Through Trust | | | | | | | | |
5.25% due 04/01/295 | | | 3,735,000 | | | | 4,012,817 | |
CD&R Smokey Buyer, Inc. | | | | | | | | |
6.75% due 07/15/255 | | | 3,725,000 | | | | 3,995,063 | |
Lithia Motors, Inc. | | | | | | | | |
4.38% due 01/15/315 | | | 3,175,000 | | | | 3,295,475 | |
Performance Food Group, Inc. | | | | | | | | |
6.88% due 05/01/255 | | | 2,900,000 | | | | 3,095,750 | |
Allison Transmission, Inc. | | | | | | | | |
3.75% due 01/30/315 | | | 2,925,000 | | | | 2,833,594 | |
Boyd Gaming Corp. | | | | | | | | |
8.63% due 06/01/255 | | | 1,700,000 | | | | 1,890,400 | |
Clarios Global, LP / Clarios US Finance Co. | | | | | | | | |
8.50% due 05/15/275 | | | 1,730,000 | | | | 1,862,795 | |
United Airlines Class AA Pass Through Trust | | | | | | | | |
4.15% due 08/25/31 | | | 1,095,356 | | | | 1,167,625 | |
Vail Resorts, Inc. | | | | | | | | |
6.25% due 05/15/255 | | | 1,075,000 | | | | 1,146,219 | |
Total Consumer, Cyclical | | | 528,643,240 | |
Consumer, Non-cyclical - 5.2% |
DaVita, Inc. | | | | | | | | |
4.63% due 06/01/305 | | | 29,810,000 | | | | 30,321,241 | |
Kraft Heinz Foods Co. | | | | | | | | |
5.20% due 07/15/45 | | | 5,725,000 | | | | 6,604,763 | |
4.38% due 06/01/46 | | | 6,320,000 | | | | 6,589,225 | |
4.25% due 03/01/31 | | | 5,850,000 | | | | 6,442,525 | |
5.50% due 06/01/50 | | | 2,800,000 | | | | 3,438,856 | |
5.00% due 06/04/42 | | | 2,490,000 | | | | 2,795,665 | |
4.88% due 10/01/49 | | | 2,025,000 | | | | 2,264,971 | |
US Foods, Inc. | | | | | | | | |
6.25% due 04/15/255 | | | 13,300,000 | | | | 14,257,600 | |
4.75% due 02/15/295 | | | 8,950,000 | | | | 8,950,000 | |
Nielsen Finance LLC / Nielsen Finance Co. | | | | | | | | |
5.63% due 10/01/285 | | | 20,700,000 | | | | 21,760,875 | |
5.00% due 04/15/225 | | | 959,000 | | | | 959,197 | |
Post Holdings, Inc. | | | | | | | | |
4.63% due 04/15/305 | | | 11,525,000 | | | | 11,546,898 | |
4.50% due 09/15/315 | | | 4,100,000 | | | | 4,054,900 | |
Sotheby’s | | | | | | | | |
7.38% due 10/15/275 | | | 14,305,000 | | | | 15,468,855 | |
Kronos Acquisition Holdings, Inc. / KIK Custom Products, Inc. | | | | | | | | |
7.00% due 12/31/275 | | | 10,350,000 | | | | 9,919,130 | |
5.00% due 12/31/265 | | | 5,500,000 | | | | 5,500,000 | |
CPI CG, Inc. | | | | | | | | |
8.63% due 03/15/265 | | | 14,450,000 | | | | 15,140,566 | |
Molina Healthcare, Inc. | | | | | | | | |
3.88% due 11/15/305 | | | 11,900,000 | | | | 12,212,375 | |
4.38% due 06/15/285 | | | 2,750,000 | | | | 2,829,640 | |
Gartner, Inc. | | | | | | | | |
4.50% due 07/01/285 | | | 11,625,000 | | | | 11,988,281 | |
3.75% due 10/01/305 | | | 2,400,000 | | | | 2,376,000 | |
AMN Healthcare, Inc. | | | | | | | | |
4.63% due 10/01/275 | | | 7,925,000 | | | | 8,103,312 | |
4.00% due 04/15/295 | | | 4,050,000 | | | | 4,029,750 | |
Avantor Funding, Inc. | | | | | | | | |
4.63% due 07/15/285 | | | 11,275,000 | | | | 11,775,159 | |
Jaguar Holding Company II / PPD Development, LP | | | | | | | | |
4.63% due 06/15/255 | | | 8,645,000 | | | | 8,990,800 | |
SEE NOTES TO CONSOLIDATED FINANCIAL STATEMENTS. | THE GUGGENHEIM FUNDS SEMI-ANNUAL REPORT | 17 |
CONSOLIDATED SCHEDULE OF INVESTMENTS (Unaudited)(continued) | March 31, 2021 |
MACRO OPPORTUNITIES FUND | |
| | Face
Amount~ | | | Value | |
5.00% due 06/15/285 | | | 2,460,000 | | | $ | 2,562,090 | |
Acadia Healthcare Company, Inc. | | | | | | | | |
5.50% due 07/01/285 | | | 5,850,000 | | | | 6,158,588 | |
5.00% due 04/15/295 | | | 4,190,000 | | | | 4,348,047 | |
Sabre GLBL, Inc. | | | | | | | | |
7.38% due 09/01/255 | | | 7,300,000 | | | | 7,955,175 | |
9.25% due 04/15/255 | | | 1,680,000 | | | | 2,003,400 | |
Tenet Healthcare Corp. | | | | | | | | |
4.63% due 06/15/285 | | | 8,375,000 | | | | 8,584,207 | |
Cheplapharm Arzneimittel GmbH | | | | | | | | |
5.50% due 01/15/285 | | | 8,035,000 | | | | 8,346,517 | |
Centene Corp. | | | | | | | | |
2.50% due 03/01/31 | | | 8,650,000 | | | | 8,239,125 | |
TreeHouse Foods, Inc. | | | | | | | | |
4.00% due 09/01/28 | | | 7,575,000 | | | | 7,628,555 | |
Smithfield Foods, Inc. | | | | | | | | |
3.00% due 10/15/305 | | | 7,000,000 | | | | 6,961,430 | |
Prestige Brands, Inc. | | | | | | | | |
3.75% due 04/01/315 | | | 6,650,000 | | | | 6,342,438 | |
Spectrum Brands, Inc. | | | | | | | | |
5.50% due 07/15/305 | | | 5,600,000 | | | | 5,992,000 | |
Service Corporation International | | | | | | | | |
3.38% due 08/15/30 | | | 5,275,000 | | | | 5,148,664 | |
Prime Security Services Borrower LLC / Prime Finance, Inc. | | | | | | | | |
3.38% due 08/31/275 | | | 2,650,000 | | | | 2,570,500 | |
5.25% due 04/15/245 | | | 1,900,000 | | | | 2,026,920 | |
Endo Luxembourg Finance Company I SARL / Endo US, Inc. | | | | | | | | |
6.13% due 04/01/295 | | | 4,400,000 | | | | 4,444,968 | |
Hologic, Inc. | | | | | | | | |
3.25% due 02/15/295 | | | 4,350,000 | | | | 4,295,625 | |
Carriage Services, Inc. | | | | | | | | |
6.63% due 06/01/265 | | | 4,011,000 | | | | 4,211,550 | |
Rent-A-Center, Inc. | | | | | | | | |
6.38% due 02/15/295 | | | 3,950,000 | | | | 4,187,000 | |
Central Garden & Pet Co. | | | | | | | | |
4.13% due 10/15/30 | | | 4,000,000 | | | | 4,040,000 | |
FAGE International S.A. / FAGE USA Dairy Industry, Inc. | | | | | | | | |
5.63% due 08/15/265 | | | 2,903,000 | | | | 2,997,348 | |
Charles River Laboratories International, Inc. | | | | | | | | |
4.00% due 03/15/315 | | | 2,500,000 | | | | 2,541,375 | |
Legends Hospitality Holding Company LLC / Legends Hospitality Co-Issuer, Inc. | | | | | | | | |
5.00% due 02/01/265 | | | 2,300,000 | | | | 2,340,250 | |
Altria Group, Inc. | | | | | | | | |
4.45% due 05/06/50 | | | 1,670,000 | | | | 1,724,204 | |
KeHE Distributors LLC / KeHE Finance Corp. | | | | | | | | |
8.63% due 10/15/265 | | | 1,422,000 | | | | 1,581,975 | |
Syneos Health, Inc. | | | | | | | | |
3.63% due 01/15/295 | | | 1,600,000 | | | | 1,556,000 | |
Par Pharmaceutical, Inc. | | | | | | | | |
7.50% due 04/01/275 | | | 1,000,000 | | | | 1,063,200 | |
Total Consumer, Non-cyclical | | | 348,171,735 | |
| | | | | | | | | |
Communications - 4.5% |
Level 3 Financing, Inc. | | | | | | | | |
4.25% due 07/01/285 | | | 29,350,000 | | | | 29,681,949 | |
3.75% due 07/15/295 | | | 7,600,000 | | | | 7,437,740 | |
3.88% due 11/15/295 | | | 2,600,000 | | | | 2,739,750 | |
CSC Holdings LLC | | | | | | | | |
4.13% due 12/01/305 | | | 21,250,000 | | | | 21,107,200 | |
4.63% due 12/01/305 | | | 5,215,000 | | | | 5,129,552 | |
3.38% due 02/15/315 | | | 2,975,000 | | | | 2,803,937 | |
Virgin Media Finance plc | | | | | | | | |
5.00% due 07/15/305 | | | 21,150,000 | | | | 21,123,563 | |
Altice France S.A. | | | | | | | | |
7.38% due 05/01/265 | | | 11,076,000 | | | | 11,519,040 | |
5.13% due 01/15/295 | | | 6,250,000 | | | | 6,328,125 | |
T-Mobile USA, Inc. | | | | | | | | |
3.50% due 04/15/31 | | | 14,750,000 | | | | 14,883,487 | |
2.88% due 02/15/31 | | | 1,750,000 | | | | 1,691,375 | |
18 | THE GUGGENHEIM FUNDS SEMI-ANNUAL REPORT | SEE NOTES TO CONSOLIDATED FINANCIAL STATEMENTS. |
CONSOLIDATED SCHEDULE OF INVESTMENTS (Unaudited)(continued) | March 31, 2021 |
MACRO OPPORTUNITIES FUND | |
| | Face
Amount~ | | | Value | |
LCPR Senior Secured Financing DAC | | | | | | | | |
5.13% due 07/15/295 | | | 16,250,000 | | | $ | 16,536,325 | |
Booking Holdings, Inc. | | | | | | | | |
3.55% due 03/15/289 | | | 10,000,000 | | | | 10,915,371 | |
4.63% due 04/13/309 | | | 3,500,000 | | | | 4,074,326 | |
CCO Holdings LLC / CCO Holdings Capital Corp. | | | | | | | | |
4.25% due 02/01/315 | | | 13,910,000 | | | | 13,940,880 | |
Cable One, Inc. | | | | | | | | |
4.00% due 11/15/305 | | | 12,575,000 | | | | 12,439,190 | |
Radiate Holdco LLC / Radiate Finance, Inc. | | | | | | | | |
4.50% due 09/15/265 | | | 12,100,000 | | | | 12,236,125 | |
ViacomCBS, Inc. | | | | | | | | |
4.95% due 05/19/50 | | | 10,340,000 | | | | 12,085,766 | |
Switch Ltd. | | | | | | | | |
3.75% due 09/15/285 | | | 12,100,000 | | | | 11,915,112 | |
Lamar Media Corp. | | | | | | | | |
4.00% due 02/15/30 | | | 8,600,000 | | | | 8,576,092 | |
4.88% due 01/15/29 | | | 3,070,000 | | | | 3,211,987 | |
Sirius XM Radio, Inc. | | | | | | | | |
4.13% due 07/01/305 | | | 11,500,000 | | | | 11,513,225 | |
Virgin Media Secured Finance plc | | | | | | | | |
4.50% due 08/15/305 | | | 10,150,000 | | | | 10,238,813 | |
AMC Networks, Inc. | | | | | | | | |
4.25% due 02/15/29 | | | 9,600,000 | | | | 9,336,000 | |
Match Group Holdings II LLC | | | | | | | | |
4.63% due 06/01/285 | | | 7,700,000 | | | | 7,867,552 | |
Qualitytech, LP / QTS Finance Corp. | | | | | | | | |
3.88% due 10/01/285 | | | 7,750,000 | | | | 7,711,250 | |
McGraw Hill LLC / McGraw-Hill Global Education Finance, Inc. | | | | | | | | |
8.00% due 11/30/245 | | | 6,156,000 | | | | 6,210,173 | |
Virgin Media Vendor Financing Notes IV DAC | | | | | | | | |
5.00% due 07/15/285 | | | 5,650,000 | | | | 5,755,259 | |
Cengage Learning, Inc. | | | | | | | | |
9.50% due 06/15/245 | | | 5,039,000 | | | | 5,133,481 | |
Ziggo BV | | | | | | | | |
4.88% due 01/15/305 | | | 4,850,000 | | | | 4,957,355 | |
TripAdvisor, Inc. | | | | | | | | |
7.00% due 07/15/255 | | | 1,800,000 | | | | 1,946,700 | |
Telenet Finance Lux Note | | | | | | | | |
5.50% due 03/01/28 | | | 1,000,000 | | | | 1,050,000 | |
Total Communications | | | 302,096,700 | |
| | | | | | | | | |
Industrial - 4.4% |
Boeing Co. | | | | | | | | |
5.15% due 05/01/306 | | | 32,030,000 | | | | 36,838,652 | |
5.81% due 05/01/50 | | | 16,010,000 | | | | 20,188,729 | |
5.71% due 05/01/406 | | | 16,010,000 | | | | 19,550,411 | |
Ardagh Packaging Finance plc / Ardagh Holdings USA, Inc. | | | | | | | | |
4.13% due 08/15/265 | | | 16,680,000 | | | | 17,122,854 | |
Standard Industries, Inc. | | | | | | | | |
4.38% due 07/15/305 | | | 7,125,000 | | | | 7,189,125 | |
3.38% due 01/15/315 | | | 6,400,000 | | | | 6,064,000 | |
5.00% due 02/15/275 | | | 3,525,000 | | | | 3,674,812 | |
PowerTeam Services LLC | | | | | | | | |
9.03% due 12/04/255 | | | 14,385,000 | | | | 15,971,666 | |
BWX Technologies, Inc. | | | | | | | | |
4.13% due 06/30/285 | | | 14,400,000 | | | | 14,546,232 | |
Adevinta ASA | | | | | | | | |
3.00% due 11/15/27 | | | EUR 10,550,000 | | | | 12,797,566 | |
New Enterprise Stone & Lime Company, Inc. | | | | | | | | |
9.75% due 07/15/285 | | | 10,175,000 | | | | 11,396,000 | |
6.25% due 03/15/265 | | | 850,000 | | | | 871,250 | |
Boxer Parent Co., Inc. | | | | | | | | |
6.50% due 10/02/25 | | | EUR 8,500,000 | | | | 10,607,059 | |
Flowserve Corp. | | | | | | | | |
3.50% due 10/01/30 | | | 10,270,000 | | | | 10,442,709 | |
Dyal Capital Partners IV | | | | | | | | |
3.65% due 02/22/41††† | | | 10,950,000 | | | | 10,432,110 | |
SEE NOTES TO CONSOLIDATED FINANCIAL STATEMENTS. | THE GUGGENHEIM FUNDS SEMI-ANNUAL REPORT | 19 |
CONSOLIDATED SCHEDULE OF INVESTMENTS (Unaudited)(continued) | March 31, 2021 |
MACRO OPPORTUNITIES FUND | |
| | Face
Amount~ | | | Value | |
Howmet Aerospace, Inc. | | | | | | | | |
5.95% due 02/01/37 | | | 2,925,000 | | | $ | 3,536,471 | |
6.88% due 05/01/25 | | | 2,875,000 | | | | 3,331,406 | |
5.90% due 02/01/27 | | | 2,100,000 | | | | 2,383,500 | |
6.75% due 01/15/28 | | | 900,000 | | | | 1,062,000 | |
GrafTech Finance, Inc. | | | | | | | | |
4.63% due 12/15/285 | | | 9,875,000 | | | | 9,930,596 | |
Reynolds Group Issuer Incorporated / Reynolds Group Issuer LLC / Reynolds Group Issuer Lu | | | | | | | | |
4.00% due 10/15/275 | | | 9,650,000 | | | | 9,457,000 | |
Arcosa, Inc. | | | | | | | | |
4.38% due 04/15/295 | | | 9,400,000 | | | | 9,400,000 | |
Cleaver-Brooks, Inc. | | | | | | | | |
7.88% due 03/01/235,6 | | | 7,752,000 | | | | 7,596,960 | |
Vertical US Newco, Inc. | | | | | | | | |
5.25% due 07/15/275 | | | 6,850,000 | | | | 7,171,094 | |
Mauser Packaging Solutions Holding Co. | | | | | | | | |
8.50% due 04/15/245 | | | 6,550,000 | | | | 6,779,250 | |
TopBuild Corp. | | | | | | | | |
3.63% due 03/15/295 | | | 5,550,000 | | | | 5,480,625 | |
Summit Materials LLC / Summit Materials Finance Corp. | | | | | | | | |
5.25% due 01/15/295 | | | 4,825,000 | | | | 5,046,902 | |
Harsco Corp. | | | | | | | | |
5.75% due 07/31/275 | | | 3,850,000 | | | | 3,941,438 | |
Graphic Packaging International LLC | | | | | | | | |
3.50% due 03/01/295 | | | 3,950,000 | | | | 3,841,375 | |
Grinding Media, Inc. / MC Grinding Media Canada, Inc. | | | | | | | | |
7.38% due 12/15/235 | | | 3,050,000 | | | | 3,095,750 | |
Hillenbrand, Inc. | | | | | | | | |
5.75% due 06/15/25 | | | 2,525,000 | | | | 2,695,437 | |
Crown Americas LLC / Crown Americas Capital Corporation VI | | | | | | | | |
4.75% due 02/01/26 | | | 1,923,000 | | | | 1,994,151 | |
EnerSys | | | | | | | | |
5.00% due 04/30/235 | | | 1,325,000 | | | | 1,387,938 | |
Princess Juliana International Airport Operating Company N.V. | | | | | | | | |
5.50% due 12/20/277 | | | 1,185,457 | | | | 1,061,209 | |
Ardagh Metal Packaging Finance USA LLC / Ardagh Metal Packaging Finance plc | | | | | | | | |
4.00% due 09/01/295 | | | 950,000 | | | | 947,625 | |
EnPro Industries, Inc. | | | | | | | | |
5.75% due 10/15/26 | | | 790,000 | | | | 836,215 | |
Waste Pro USA, Inc. | | | | | | | | |
5.50% due 02/15/265 | | | 600,000 | | | | 614,250 | |
Hillman Group, Inc. | | | | | | | | |
6.38% due 07/15/225 | | | 340,000 | | | | 340,425 | |
Intertape Polymer Group, Inc. | | | | | | | | |
7.00% due 10/15/265 | | | 150,000 | | | | 157,781 | |
Yamana Gold, Inc. | | | | | | | | |
4.78% due 06/10/23††† | | | 99,699 | | | | 106,286 | |
JELD-WEN, Inc. | | | | | | | | |
6.25% due 05/15/255 | | | 100,000 | | | | 106,250 | |
Total Industrial | | | 289,995,109 | |
| | | | | | | | | |
Technology - 2.0% |
NCR Corp. | | | | | | | | |
5.25% due 10/01/305 | | | 11,425,000 | | | | 11,569,241 | |
8.13% due 04/15/255 | | | 6,189,000 | | | | 6,784,691 | |
5.13% due 04/15/295 | | | 6,350,000 | | | | 6,421,945 | |
MSCI, Inc. | | | | | | | | |
3.88% due 02/15/315 | | | 15,900,000 | | | | 16,246,620 | |
Twilio, Inc. | | | | | | | | |
3.88% due 03/15/31 | | | 15,100,000 | | | | 15,422,536 | |
Qorvo, Inc. | | | | | | | | |
4.38% due 10/15/29 | | | 11,220,000 | | | | 11,977,462 | |
20 | THE GUGGENHEIM FUNDS SEMI-ANNUAL REPORT | SEE NOTES TO CONSOLIDATED FINANCIAL STATEMENTS. |
CONSOLIDATED SCHEDULE OF INVESTMENTS (Unaudited)(continued) | March 31, 2021 |
MACRO OPPORTUNITIES FUND | |
| | Face
Amount~ | | | Value | |
3.38% due 04/01/315 | | | 1,900,000 | | | $ | 1,861,791 | |
TeamSystem SpA | | | | | | | | |
3.75% (3 Month EURIBOR + 3.75%, Rate Floor: 3.75%) due 02/15/285,8 | | | EUR 11,750,000 | | | | 13,771,254 | |
Booz Allen Hamilton, Inc. | | | | | | | | |
3.88% due 09/01/285 | | | 11,800,000 | | | | 11,861,950 | |
Black Knight InfoServ LLC | | | | | | | | |
3.63% due 09/01/285 | | | 12,000,000 | | | | 11,791,320 | |
Playtika Holding Corp. | | | | | | | | |
4.25% due 03/15/295 | | | 8,750,000 | | | | 8,620,500 | |
BY Crown Parent LLC / BY Bond Finance, Inc. | | | | | | | | |
4.25% due 01/31/265 | | | 7,875,000 | | | | 8,140,781 | |
CDW LLC / CDW Finance Corp. | | | | | | | | |
3.25% due 02/15/29 | | | 5,640,000 | | | | 5,569,500 | |
Crowdstrike Holdings, Inc. | | | | | | | | |
3.00% due 02/15/29 | | | 3,400,000 | | | | 3,324,180 | |
Change Healthcare Holdings LLC / Change Healthcare Finance, Inc. | | | | | | | | |
5.75% due 03/01/255 | | | 2,750,000 | | | | 2,803,213 | |
Total Technology | | | 136,166,984 | |
| | | | | | | | | |
Energy - 1.9% |
BP Capital Markets plc | | | | | | | | |
4.88%3,4 | | | 39,360,000 | | | | 42,164,400 | |
Occidental Petroleum Corp. | | | | | | | | |
7.95% due 06/15/39 | | | 4,700,000 | | | | 5,546,000 | |
6.63% due 09/01/30 | | | 3,600,000 | | | | 4,045,680 | |
3.00% due 02/15/27 | | | 3,830,000 | | | | 3,600,200 | |
6.13% due 01/01/31 | | | 2,250,000 | | | | 2,484,450 | |
4.50% due 07/15/44 | | | 2,850,000 | | | | 2,422,500 | |
4.10% due 02/15/47 | | | 2,250,000 | | | | 1,800,000 | |
4.63% due 06/15/45 | | | 1,700,000 | | | | 1,482,502 | |
4.40% due 04/15/46 | | | 900,000 | | | | 762,750 | |
NuStar Logistics, LP | | | | | | | | |
6.38% due 10/01/30 | | | 18,750,000 | | | | 20,250,000 | |
5.63% due 04/28/27 | | | 450,000 | | | | 470,743 | |
Sabine Pass Liquefaction LLC | | | | | | | | |
4.50% due 05/15/30 | | | 16,150,000 | | | | 18,111,668 | |
Midwest Connector Capital Company LLC | | | | | | | | |
4.63% due 04/01/295 | | | 11,943,000 | | | | 12,103,642 | |
Rattler Midstream, LP | | | | | | | | |
5.63% due 07/15/255 | | | 4,125,000 | | | | 4,306,995 | |
Global Partners Limited Partnership / GLP Finance Corp. | | | | | | | | |
6.88% due 01/15/29 | | | 3,900,000 | | | | 4,185,675 | |
Baker Hughes a GE Company LLC / Baker Hughes Co-Obligor, Inc. | | | | | | | | |
4.49% due 05/01/309 | | | 1,730,000 | | | | 1,969,497 | |
Basic Energy Services, Inc. | | | | | | | | |
10.75% due 10/15/237 | | | 1,500,000 | | | | 300,000 | |
Total Energy | | | 126,006,702 | |
| | | | | | | | | |
Basic Materials - 1.9% |
Alcoa Nederland Holding BV | | | | | | | | |
5.50% due 12/15/275 | | | 15,125,000 | | | | 16,280,550 | |
6.13% due 05/15/285 | | | 7,450,000 | | | | 8,114,540 | |
4.13% due 03/31/295 | | | 7,600,000 | | | | 7,664,904 | |
WR Grace & Company-Conn | | | | | | | | |
4.88% due 06/15/275 | | | 13,225,000 | | | | 13,690,520 | |
Carpenter Technology Corp. | | | | | | | | |
6.38% due 07/15/28 | | | 12,005,000 | | | | 12,901,528 | |
Minerals Technologies, Inc. | | | | | | | | |
5.00% due 07/01/285 | | | 11,575,000 | | | | 11,936,719 | |
Ingevity Corp. | | | | | | | | |
3.88% due 11/01/285 | | | 9,625,000 | | | | 9,336,250 | |
SEE NOTES TO CONSOLIDATED FINANCIAL STATEMENTS. | THE GUGGENHEIM FUNDS SEMI-ANNUAL REPORT | 21 |
CONSOLIDATED SCHEDULE OF INVESTMENTS (Unaudited)(continued) | March 31, 2021 |
MACRO OPPORTUNITIES FUND | |
| | Face
Amount~ | | | Value | |
HB Fuller Co. | | | | | | | | |
4.25% due 10/15/28 | | | 7,750,000 | | | $ | 7,874,465 | |
Newcrest Finance Pty Ltd. | | | | | | | | |
4.20% due 05/13/505 | | | 7,210,000 | | | | 7,782,653 | |
Kaiser Aluminum Corp. | | | | | | | | |
6.50% due 05/01/255 | | | 6,050,000 | | | | 6,411,185 | |
4.63% due 03/01/285 | | | 375,000 | | | | 383,831 | |
Clearwater Paper Corp. | | | | | | | | |
4.75% due 08/15/285 | | | 6,575,000 | | | | 6,624,313 | |
Novelis Sheet Ingot GmbH | | | | | | | | |
3.38% due 04/15/29 | | | EUR 4,500,000 | | | | 5,449,284 | |
Illuminate Buyer LLC / Illuminate Holdings IV, Inc. | | | | | | | | |
9.00% due 07/01/285 | | | 2,925,000 | | | | 3,291,502 | |
ArcelorMittal S.A. | | | | | | | | |
4.55% due 03/11/26 | | | 2,450,000 | | | | 2,716,323 | |
Arconic Corp. | | | | | | | | |
6.00% due 05/15/255 | | | 2,225,000 | | | | 2,398,072 | |
Mirabela Nickel Ltd. | | | | | | | | |
due 06/24/197,10 | | | 1,885,418 | | | | 75,417 | |
Total Basic Materials | | | 122,932,056 | |
| | | | | | | | | |
Utilities - 1.3% |
Midcap Funding XLVI Trust | | | | | | | | |
5.60% due 10/29/24††† | | | 32,750,000 | | | | 32,773,153 | |
Cheniere Corpus Christi Holdings LLC | | | | | | | | |
3.52% due 12/31/39††† | | | 21,800,000 | | | | 20,749,765 | |
Clearway Energy Operating LLC | | | | | | | | |
3.75% due 02/15/315 | | | 13,450,000 | | | | 12,899,775 | |
4.75% due 03/15/285 | | | 2,250,000 | | | | 2,340,878 | |
AES Corp. | | | | | | | | |
3.95% due 07/15/305 | | | 9,760,000 | | | | 10,406,405 | |
Terraform Global Operating LLC | | | | | | | | |
6.13% due 03/01/265 | | | 5,435,000 | | | | 5,570,875 | |
Total Utilities | | | 84,740,851 | |
| | | | | | | | | |
Total Corporate Bonds |
(Cost $2,602,138,179) | | | 2,672,095,352 | |
| | | | | | | | | |
SENIOR FLOATING RATE INTERESTS††,8 - 24.7% |
Consumer, Cyclical - 5.1% |
Mavis Tire Express Services Corp. | | | | | | | | |
5.00% (1 Month USD LIBOR + 4.00%, Rate Floor: 5.00%) due 03/20/25 | | | 15,758,505 | | | | 15,729,037 | |
3.36% (1 Month USD LIBOR + 3.25%, Rate Floor: 3.25%) due 03/20/25 | | | 7,465,603 | | | | 7,430,962 | |
MB2 Dental Solutions LLC | | | | | | | | |
6.00% (3 Month USD LIBOR + 6.00%, Rate Floor: 6.00%) due 01/29/27††† | | | 20,874,963 | | | | 20,469,288 | |
6.19% (3 Month USD LIBOR + 6.00%, Rate Floor: 6.00%) due 01/29/27 | | | 789,941 | | | | 774,590 | |
Samsonite IP Holdings SARL | | | | | | | | |
5.50% (1 Month USD LIBOR + 4.50%, Rate Floor: 5.50%) due 04/25/25 | | | 20,792,875 | | | | 20,922,830 | |
Packers Holdings LLC | | | | | | | | |
4.00% (3 Month USD LIBOR + 3.25%, Rate Floor: 4.00%) due 03/09/28 | | | 21,150,136 | | | | 20,894,643 | |
22 | THE GUGGENHEIM FUNDS SEMI-ANNUAL REPORT | SEE NOTES TO CONSOLIDATED FINANCIAL STATEMENTS. |
CONSOLIDATED SCHEDULE OF INVESTMENTS (Unaudited)(continued) | March 31, 2021 |
MACRO OPPORTUNITIES FUND | |
| | Face
Amount~ | | | Value | |
BGIS (BIFM CA Buyer, Inc.) | | | | | | | | |
3.61% (1 Month USD LIBOR + 3.50%, Rate Floor: 3.50%) due 06/01/26 | | | 18,131,129 | | | $ | 17,995,145 | |
Alterra Mountain Co. | | | | | | | | |
5.50% (1 Month USD LIBOR + 4.50%, Rate Floor: 5.50%) due 07/31/26 | | | 17,439,690 | | | | 17,483,289 | |
CHG Healthcare Services, Inc. | | | | | | | | |
4.00% (3 Month USD LIBOR + 3.00%, Rate Floor: 4.00%) due 06/07/23 | | | 15,515,813 | | | | 15,454,836 | |
Truck Hero, Inc. | | | | | | | | |
4.50% (1 Month USD LIBOR + 3.75%, Rate Floor: 4.50%) due 01/31/28 | | | 14,900,000 | | | | 14,852,469 | |
SP PF Buyer LLC | | | | | | | | |
4.61% (1 Month USD LIBOR + 4.50%, Rate Floor: 4.50%) due 12/22/25 | | | 15,358,079 | | | | 14,794,898 | |
BCPE Empire Holdings, Inc. | | | | | | | | |
5.00% (1 Month USD LIBOR + 4.25%, Rate Floor: 5.00%) due 06/11/26 | | | 13,450,000 | | | | 13,416,375 | |
4.11% (1 Month USD LIBOR + 4.00%, Rate Floor: 4.00%) due 06/11/26 | | | 224,431 | | | | 222,889 | |
CNT Holdings I Corp. | | | | | | | | |
4.50% (6 Month USD LIBOR + 3.75%, Rate Floor: 4.50%) due 11/08/27 | | | 12,200,000 | | | | 12,165,718 | |
Flamingo | | | | | | | | |
due 03/18/28 | | | EUR 10,000,000 | | | | 11,601,548 | |
CD&R Firefly Bidco Ltd. | | | | | | | | |
3.25% (6 Month EURIBOR + 3.25%, Rate Floor: 3.25%) due 06/23/25 | | | EUR 6,000,000 | | | | 6,993,152 | |
4.25% (6 Month USD LIBOR + 4.25%, Rate Floor: 4.25%) due 06/23/25 | | | GBP 3,350,000 | | | | 4,590,277 | |
Cast & Crew Payroll LLC | | | | | | | | |
3.86% (1 Month USD LIBOR + 3.75%, Rate Floor: 3.75%) due 02/09/26 | | | 11,628,241 | | | | 11,435,677 | |
EnTrans International, LLC | | | | | | | | |
6.11% (1 Month USD LIBOR + 6.00%, Rate Floor: 6.00%) due 11/01/24 | | | 11,603,890 | | | | 11,255,773 | |
Verisure Holding AB | | | | | | | | |
3.50% (6 Month EURIBOR + 3.50%, Rate Floor: 3.50%) due 07/20/26 | | | EUR 7,651,053 | | | | 8,938,041 | |
due 01/14/28 | | | EUR 1,770,000 | | | | 2,065,886 | |
American Trailer World Corp. | | | | | | | | |
4.50% (1 Month USD LIBOR + 3.75%, Rate Floor: 4.50%) due 03/03/28 | | | 8,950,000 | | | | 8,877,326 | |
SEE NOTES TO CONSOLIDATED FINANCIAL STATEMENTS. | THE GUGGENHEIM FUNDS SEMI-ANNUAL REPORT | 23 |
CONSOLIDATED SCHEDULE OF INVESTMENTS (Unaudited)(continued) | March 31, 2021 |
MACRO OPPORTUNITIES FUND | |
| | Face
Amount~ | | | Value | |
United Petfood | | | | | | | | |
due 03/19/28 | | | EUR 7,000,000 | | | $ | 8,172,385 | |
PetSmart LLC | | | | | | | | |
4.25% (3 Month USD LIBOR + 3.50%, Rate Floor: 4.25%) due 02/11/28 | | | 7,500,000 | | | | 7,482,750 | |
Accuride Corp. | | | | | | | | |
6.25% (3 Month USD LIBOR + 5.25%, Rate Floor: 6.25%) due 11/17/23 | | | 7,730,703 | | | | 7,291,677 | |
Rent-A-Center, Inc. | | | | | | | | |
4.75% (1 Month USD LIBOR + 4.00%, Rate Floor: 4.75%) due 02/17/28 | | | 7,250,000 | | | | 7,280,233 | |
First Brands Group LLC | | | | | | | | |
due 03/19/27 | | | 5,050,000 | | | | 5,043,688 | |
ScribeAmerica Intermediate Holdco LLC (Healthchannels) | | | | | | | | |
4.61% (1 Month USD LIBOR + 4.50%, Rate Floor: 4.50%) due 04/03/25 | | | 4,920,542 | | | | 4,699,118 | |
Galls LLC | | | | | | | | |
7.25% (3 Month USD LIBOR + 6.25%, Rate Floor: 7.25%) due 01/31/25††† | | | 3,676,657 | | | | 3,641,379 | |
7.25% (1 Month USD LIBOR + 6.25% and 3 Month USD LIBOR + 6.25%, Rate Floor: 7.25%) due 01/31/24††† | | | 412,214 | | | | 386,840 | |
Alexander Mann | | | | | | | | |
5.36% (6 Month GBP LIBOR + 5.25%, Rate Floor: 5.25%) due 06/16/25 | | | GBP 3,000,000 | | | | 3,894,363 | |
Intrawest Resorts Holdings, Inc. | | | | | | | | |
2.86% (1 Month USD LIBOR + 2.75%, Rate Floor: 2.75%) due 07/31/24 | | | 3,748,413 | | | | 3,680,492 | |
SHO Holding I Corp. | | | | | | | | |
6.25% (3 Month USD LIBOR + 5.25%, Rate Floor: 6.25%) due 04/29/24††† | | | 3,661,946 | | | | 3,259,132 | |
6.23% (3 Month USD LIBOR + 5.23%, Rate Floor: 6.23%) due 04/29/24††† | | | 60,373 | | | | 53,732 | |
Checkers Drive-In Restaurants, Inc. | | | | | | | | |
5.25% (3 Month USD LIBOR + 4.25%, Rate Floor: 5.25%) due 04/25/24 | | | 3,322,072 | | | | 3,101,155 | |
Adevinta ASA | | | | | | | | |
due 10/22/27 | | | EUR 2,600,000 | | | | 3,051,311 | |
Blue Nile, Inc. | | | | | | | | |
7.50% (3 Month USD LIBOR + 6.50%, Rate Floor: 7.50%) due 02/17/23 | | | 2,843,750 | | | | 2,559,375 | |
WESCO | | | | | | | | |
5.25% (3 Month USD LIBOR + 4.25%, Rate Floor: 5.25%) due 06/14/24††† | | | 2,334,000 | | | | 2,327,806 | |
Eyemart Express | | | | | | | | |
4.00% (1 Month USD LIBOR + 3.00%, Rate Floor: 4.00%) due 08/05/24 | | | 2,287,709 | | | | 2,272,518 | |
24 | THE GUGGENHEIM FUNDS SEMI-ANNUAL REPORT | SEE NOTES TO CONSOLIDATED FINANCIAL STATEMENTS. |
CONSOLIDATED SCHEDULE OF INVESTMENTS (Unaudited)(continued) | March 31, 2021 |
MACRO OPPORTUNITIES FUND | |
| | Face
Amount~ | | | Value | |
Zephyr Bidco Ltd. | | | | | | | | |
7.55% (1 Month GBP LIBOR + 7.50%, Rate Floor: 7.50%) due 07/23/26 | | | GBP 1,540,417 | | | $ | 2,065,115 | |
Situs AMC Holdings Corp. | | | | | | | | |
5.75% (1 Month USD LIBOR + 4.75%, Rate Floor: 5.75%) due 06/30/25 | | | 2,000,000 | | | | 1,957,500 | |
CCRR Parent, Inc. | | | | | | | | |
5.00% (3 Month USD LIBOR + 4.25%, Rate Floor: 5.00%) due 03/06/28 | | | 1,900,000 | | | | 1,902,375 | |
TTF Holdings Intermediate LLC | | | | | | | | |
due 03/25/28 | | | 1,850,000 | | | | 1,840,750 | |
EG Finco Ltd. | | | | | | | | |
4.84% (3 Month GBP LIBOR + 4.75%, Rate Floor: 4.75%) due 02/07/25 | | | GBP 970,000 | | | | 1,306,259 | |
K & N Parent, Inc. | | | | | | | | |
5.75% (3 Month USD LIBOR + 4.75%, Rate Floor: 5.75%) due 10/20/23 | | | 954,023 | | | | 909,498 | |
Apro LLC | | | | | | | | |
5.00% (3 Month USD LIBOR + 4.00%, Rate Floor: 5.00%) due 11/14/26 | | | 693,980 | | | | 691,815 | |
Navistar Inc. | | | | | | | | |
3.62% (1 Month USD LIBOR + 3.50%, Rate Floor: 3.50%) due 11/06/24 | | | 494,898 | | | | 494,774 | |
Belk, Inc. | | | | | | | | |
8.50% (3 Month USD LIBOR + 7.50%, Rate Floor: 8.50%) due 07/31/25††† | | | 467,074 | | | | 465,906 | |
American Tire Distributors, Inc. | | | | | | | | |
7.00% (3 Month USD LIBOR + 6.00%, Rate Floor: 7.00%) due 09/01/23 | | | 249,634 | | | | 245,423 | |
8.50% (1 Month USD LIBOR + 7.50% and 3 Month USD LIBOR + 7.50%, Rate Floor: 8.50%) due 09/02/24 | | | 162,694 | | | | 158,695 | |
BBB Industries, LLC | | | | | | | | |
4.61% (1 Month USD LIBOR + 4.50%, Rate Floor: 4.50%) due 08/01/25 | | | 266,109 | | | | 262,250 | |
Total Consumer, Cyclical | | | 338,862,963 | |
| | | | | | | | | |
Industrial - 5.0% |
CapStone Acquisition Holdings, Inc. | | | | | | | | |
5.75% (1 Month USD LIBOR + 4.75%, Rate Floor: 5.75%) due 11/12/27 | | | 21,189,294 | | | | 21,176,157 | |
Diversitech Holdings, Inc. | | | | | | | | |
4.25% (3 Month USD LIBOR + 3.25%, Rate Floor: 4.25%) due 06/03/24††† | | | 17,049,450 | | | | 16,996,170 | |
8.50% (3 Month USD LIBOR + 7.50%, Rate Floor: 8.50%) due 06/02/25††† | | | 1,000,000 | | | | 1,000,000 | |
SEE NOTES TO CONSOLIDATED FINANCIAL STATEMENTS. | THE GUGGENHEIM FUNDS SEMI-ANNUAL REPORT | 25 |
CONSOLIDATED SCHEDULE OF INVESTMENTS (Unaudited)(continued) | March 31, 2021 |
MACRO OPPORTUNITIES FUND | |
| | Face
Amount~ | | | Value | |
Dispatch Terra Acquisition LLC | | | | | | | | |
5.00% (3 Month USD LIBOR + 4.25%, Rate Floor: 5.00%) due 03/17/28 | | | 16,550,000 | | | $ | 16,467,250 | |
Mileage Plus Holdings LLC | | | | | | | | |
6.25% (3 Month USD LIBOR + 5.25%, Rate Floor: 6.25%) due 06/21/27 | | | 15,250,000 | | | | 16,186,502 | |
American Bath Group LLC | | | | | | | | |
4.25% (3 Month USD LIBOR + 3.75%, Rate Floor: 4.25%) due 11/23/27 | | | 15,775,000 | | | | 15,659,211 | |
Vertical (TK Elevator) | | | | | | | | |
4.25% (6 Month EURIBOR + 4.25%, Rate Floor: 4.25%) due 07/29/27 | | | EUR 7,000,000 | | | | 8,231,567 | |
4.48% (6 Month USD LIBOR + 4.25%, Rate Floor: 4.25%) due 07/30/27 | | | 6,517,291 | | | | 6,527,067 | |
Fugue Finance BV | | | | | | | | |
3.25% (3 Month EURIBOR + 3.25%, Rate Floor: 3.25%) due 08/30/24 | | | EUR 12,545,690 | | | | 14,578,333 | |
NA Rail Hold Co. LLC | | | | | | | | |
4.70% (3 Month USD LIBOR + 4.50%, Rate Floor: 4.50%) due 10/19/26 | | | 13,917,369 | | | | 13,986,956 | |
TransDigm, Inc. | | | | | | | | |
2.36% (1 Month USD LIBOR + 2.25%, Rate Floor: 2.25%) due 05/30/25 | | | 14,223,179 | | | | 13,919,514 | |
FCG Acquisitions, Inc | | | | | | | | |
due 03/16/28 | | | 13,660,000 | | | | 13,574,625 | |
AI Convoy Luxembourg SARL | | | | | | | | |
3.50% (3 Month EURIBOR + 3.50%, Rate Floor: 3.50%) due 01/18/27 | | | EUR 11,402,143 | | | | 13,326,522 | |
DXP Enterprises, Inc. | | | | | | | | |
5.75% (1 Month USD LIBOR + 4.75%, Rate Floor: 5.75%) due 12/23/27 | | | 13,216,875 | | | | 13,183,833 | |
Charter Nex US Holdings, Inc. | | | | | | | | |
5.00% (1 Month USD LIBOR + 4.25%, Rate Floor: 5.00%) due 12/01/27 | | | 13,150,000 | | | | 13,166,437 | |
Galileo Global Education Finance SARL | | | | | | | | |
3.25% (3 Month EURIBOR + 3.25%, Rate Floor: 3.25%) due 11/12/26 | | | EUR 10,800,000 | | | | 12,573,490 | |
Pelican Products, Inc. | | | | | | | | |
4.50% (3 Month USD LIBOR + 3.50%, Rate Floor: 4.50%) due 05/01/25 | | | 12,658,596 | | | | 12,508,338 | |
Gardner Denver, Inc. | | | | | | | | |
2.95% (1 Month USD LIBOR + 2.75%, Rate Floor: 2.75%) due 03/01/27 | | | 10,795,750 | | | | 10,764,226 | |
26 | THE GUGGENHEIM FUNDS SEMI-ANNUAL REPORT | SEE NOTES TO CONSOLIDATED FINANCIAL STATEMENTS. |
CONSOLIDATED SCHEDULE OF INVESTMENTS (Unaudited)(continued) | March 31, 2021 |
MACRO OPPORTUNITIES FUND | |
| | Face
Amount~ | | | Value | |
Service Logic Acquisition, Inc. | | | | | | | | |
4.75% (2 Month USD LIBOR + 4.00% and 3 Month USD LIBOR + 4.00%, Rate Floor: 4.75%) due 10/29/27 | | | 9,957,015 | | | $ | 9,944,569 | |
Filtration Group Corp. | | | | | | | | |
4.50% (1 Month USD LIBOR + 3.75%, Rate Floor: 4.50%) due 03/31/25 | | | 5,653,566 | | | | 5,643,672 | |
3.50% (3 Month EURIBOR + 3.50%, Rate Floor: 3.50%) due 03/31/25 | | | EUR 3,600,000 | | | | 4,199,395 | |
YAK MAT (YAK ACCESS LLC) | | | | | | | | |
10.19% (3 Month USD LIBOR + 10.00%, Rate Floor: 10.00%) due 07/10/26 | | | 12,020,199 | | | | 9,741,410 | |
DG Investment Intermediate Holdings 2, Inc. | | | | | | | | |
due 03/17/28 | | | 8,720,000 | | | | 8,670,994 | |
3.75% (1 Month USD LIBOR + 3.00%, Rate Floor: 3.75%) due 02/03/25 | | | 300,000 | | | | 298,875 | |
Berlin Packaging LLC | | | | | | | | |
3.21% (3 Month USD LIBOR + 3.00%, Rate Floor: 3.00%) due 11/07/25 | | | 4,486,105 | | | | 4,400,375 | |
3.12% (1 Month USD LIBOR + 3.00% and 3 Month USD LIBOR + 3.00%, Rate Floor: 3.00%) due 11/07/25 | | | 1,630,567 | | | | 1,599,407 | |
Park River Holdings, Inc. | | | | | | | | |
4.00% (2 Month USD LIBOR + 3.25%, Rate Floor: 4.00%) due 12/28/27 | | | 5,800,000 | | | | 5,760,154 | |
BWAY Holding Co. | | | | | | | | |
3.44% (3 Month USD LIBOR + 3.25%, Rate Floor: 3.25%) due 04/03/24 | | | 4,850,125 | | | | 4,740,997 | |
Pro Mach Group, Inc. | | | | | | | | |
4.50% (3 Month USD LIBOR + 3.50%, Rate Floor: 4.50%) due 03/07/25 | | | 3,518,167 | | | | 3,500,576 | |
4.50% (3 Month USD LIBOR + 3.50%, Rate Floor: 4.50%) due 03/07/25††† | | | 1,164,154 | | | | 1,216,541 | |
JetBlue Airways Corp. | | | | | | | | |
6.25% (3 Month USD LIBOR + 5.25%, Rate Floor: 6.25%) due 06/17/24 | | | 4,553,250 | | | | 4,655,698 | |
MI Windows And Doors LLC | | | | | | | | |
4.50% (1 Month USD LIBOR + 3.75%, Rate Floor: 4.50%) due 12/18/27 | | | 3,990,000 | | | | 4,002,489 | |
STS Operating, Inc. (SunSource) | | | | | | | | |
5.25% (1 Month USD LIBOR + 4.25%, Rate Floor: 5.25%) due 12/11/24 | | | 3,857,527 | | | | 3,747,433 | |
SEE NOTES TO CONSOLIDATED FINANCIAL STATEMENTS. | THE GUGGENHEIM FUNDS SEMI-ANNUAL REPORT | 27 |
CONSOLIDATED SCHEDULE OF INVESTMENTS (Unaudited)(continued) | March 31, 2021 |
MACRO OPPORTUNITIES FUND | |
| | Face
Amount~ | | | Value | |
Fortis Solutions Group LLC | | | | | | | | |
6.00% (1 Month USD LIBOR + 5.00%, Rate Floor: 6.00%) due 12/15/23††† | | | 2,355,075 | | | $ | 2,339,767 | |
due 12/15/23 | | | 718,141 | | | | 703,778 | |
Alliance Laundry Systems LLC | | | | | | | | |
4.25% (3 Month USD LIBOR + 3.50%, Rate Floor: 4.25%) due 10/08/27 | | | 2,992,500 | | | | 2,985,318 | |
Titan Acquisition Ltd. (Husky) | | | | | | | | |
3.27% (3 Month USD LIBOR + 3.00%, Rate Floor: 3.00%) due 03/28/25 | | | 2,995,738 | | | | 2,930,820 | |
Zephyr German Bidco GmbH | | | | | | | | |
3.75% (1 Month EURIBOR + 3.75%, Rate Floor: 3.75%) due 01/21/28 | | | EUR 2,400,000 | | | | 2,827,627 | |
Protective Industrial Products, Inc. | | | | | | | | |
4.75% (1 Month USD LIBOR + 4.00%, Rate Floor: 4.75%) due 12/29/27 | | | 1,800,000 | | | | 1,795,878 | |
Douglas Dynamics LLC | | | | | | | | |
4.75% (1 Month USD LIBOR + 3.75%, Rate Floor: 4.75%) due 06/08/26 | | | 1,599,136 | | | | 1,590,149 | |
Tosca Services LLC | | | | | | | | |
4.25% (1 Month USD LIBOR + 3.50%, Rate Floor: 4.25%) due 08/18/27 | | | 1,584,000 | | | | 1,584,000 | |
Bhi Investments LLC | | | | | | | | |
5.50% (3 Month USD LIBOR + 4.50%, Rate Floor: 5.50%) due 08/28/24 | | | 1,600,046 | | | | 1,582,717 | |
SLR Consulting Ltd. | | | | | | | | |
4.20% (3 Month USD LIBOR + 4.00%, Rate Floor: 4.00%) due 06/23/25††† | | | 1,249,650 | | | | 1,247,221 | |
6.48% (1 Month USD LIBOR + 4.00%, Rate Floor: 4.00%) due 06/23/25††† | | | 311,616 | | | | 305,579 | |
LTI Holdings, Inc. | | | | | | | | |
3.61% (1 Month USD LIBOR + 3.50%, Rate Floor: 3.50%) due 09/08/25 | | | 1,462,500 | | | | 1,438,427 | |
ILPEA Parent, Inc. | | | | | | | | |
5.75% (1 Month USD LIBOR + 4.75%, Rate Floor: 5.75%) due 03/02/23 | | | 1,196,814 | | | | 1,192,326 | |
Safety Bidco Ltd. | | | | | | | | |
4.55% (1 Month GBP LIBOR + 4.50%, Rate Floor: 0.00%) due 10/25/24††† | | | GBP 850,000 | | | | 1,165,562 | |
Reynolds Group Holdings, Inc. | | | | | | | | |
2.86% (1 Month USD LIBOR + 2.75%, Rate Floor: 2.75%) due 02/06/23 | | | 660,894 | | | | 657,695 | |
Duran Group Holding GMBH | | | | | | | | |
4.25% (6 Month EURIBOR + 4.25%, Rate Floor: 4.25%) due 03/29/24 | | | EUR 430,207 | | | | 493,745 | |
28 | THE GUGGENHEIM FUNDS SEMI-ANNUAL REPORT | SEE NOTES TO CONSOLIDATED FINANCIAL STATEMENTS. |
CONSOLIDATED SCHEDULE OF INVESTMENTS (Unaudited)(continued) | March 31, 2021 |
MACRO OPPORTUNITIES FUND | |
| | Face
Amount~ | | | Value | |
4.25% (6 Month EURIBOR + 4.25%, Rate Floor: 4.25%) due 12/20/24††† | | | EUR 141,858 | | | $ | 162,809 | |
API Heat Transfer | | | | | | | | |
12.00% (3 Month USD LIBOR, Rate Floor: 1.00%) (in-kind rate was 11.00%) due 01/01/24†††,11 | | | 1,076,191 | | | | 457,381 | |
12.00% (3 Month USD LIBOR, Rate Floor: 1.00%) (in-kind rate was 11.00%) due 10/02/23†††,11 | | | 197,764 | | | | 148,323 | |
Hillman Group, Inc. | | | | | | | | |
4.11% (1 Month USD LIBOR + 4.00%, Rate Floor: 4.00%) due 05/30/25 | | | 597,708 | | | | 596,680 | |
Transcendia Holdings, Inc. | | | | | | | | |
4.50% (1 Month USD LIBOR + 3.50%, Rate Floor: 4.50%) due 05/30/24 | | | 568,653 | | | | 469,707 | |
Gates Global LLC | | | | | | | | |
3.50% (1 Month USD LIBOR + 2.75%, Rate Floor: 3.50%) due 03/31/27 | | | 122,225 | | | | 121,818 | |
Total Industrial | | | 332,746,110 | |
| | | | | | | | | |
Consumer, Non-cyclical - 4.6% |
Women’s Care Holdings, Inc. | | | | | | | | |
5.25% (3 Month USD LIBOR + 4.50%, Rate Floor: 5.25%) due 01/15/28 | | | 31,900,000 | | | | 31,900,000 | |
Valeo F1 Company Ltd. | | | | | | | | |
due 08/27/27 | | | GBP 22,100,000 | | | | 30,370,477 | |
Packaging Coordinators Midco, Inc. | | | | | | | | |
4.50% (6 Month USD LIBOR + 3.75%, Rate Floor: 4.50%) due 11/30/27 | | | 17,050,000 | | | | 17,028,688 | |
Triton Water Holdings, Inc. | | | | | | | | |
due 03/16/28 | | | 16,250,000 | | | | 16,173,788 | |
National Mentor Holdings, Inc. | | | | | | | | |
4.50% (1 Month USD LIBOR + 3.75%, Rate Floor: 4.50%) due 03/02/28 | | | 14,050,000 | | | | 13,955,163 | |
SCP Eye Care Services LLC | | | | | | | | |
5.25% (3 Month USD LIBOR + 4.50%, Rate Floor: 5.25%) due 03/11/28††† | | | 13,892,045 | | | | 13,874,680 | |
Sigma Holding BV (Flora Food) | | | | | | | | |
3.50% (1 Month EURIBOR + 3.50% and 6 Month EURIBOR + 3.50%, Rate Floor: 3.50%) due 07/02/25 | | | EUR 12,019,549 | | | | 13,815,858 | |
Nidda Healthcare Holding GmbH | | | | | | | | |
3.50% (3 Month EURIBOR + 3.50%, Rate Floor: 3.50%) due 08/21/26 | | | EUR 11,387,239 | | | | 13,243,140 | |
SEE NOTES TO CONSOLIDATED FINANCIAL STATEMENTS. | THE GUGGENHEIM FUNDS SEMI-ANNUAL REPORT | 29 |
CONSOLIDATED SCHEDULE OF INVESTMENTS (Unaudited)(continued) | March 31, 2021 |
MACRO OPPORTUNITIES FUND | |
| | Face
Amount~ | | | Value | |
Kronos Acquisition Holdings, Inc. | | | | | | | | |
4.25% (3 Month USD LIBOR + 3.75%, Rate Floor: 4.25%) due 12/22/26 | | | 12,568,500 | | | $ | 12,375,448 | |
Quirch Foods Holdings LLC | | | | | | | | |
6.25% (6 Month USD LIBOR + 5.25%, Rate Floor: 6.25%) due 10/27/27 | | | 12,250,000 | | | | 12,318,968 | |
Sunshine Investments BV | | | | | | | | |
3.25% (3 Month EURIBOR + 3.25%, Rate Floor: 3.25%) due 03/28/25 | | | EUR 9,450,000 | | | | 11,055,436 | |
HAH Group Holding Co. LLC | | | | | | | | |
6.00% (3 Month USD LIBOR + 5.00%, Rate Floor: 6.00%) due 10/29/27 | | | 10,970,000 | | | | 10,997,425 | |
Southern Veterinary Partners LLC | | | | | | | | |
5.00% (3 Month USD LIBOR + 4.00%, Rate Floor: 5.00%) due 10/05/27 | | | 10,694,409 | | | | 10,721,145 | |
Cambrex Corporation | | | | | | | | |
4.25% (1 Month USD LIBOR + 3.50%, Rate Floor: 4.25%) due 12/04/26 | | | 10,444,793 | | | | 10,431,737 | |
AI Aqua Zip Bidco Pty Ltd. | | | | | | | | |
4.25% (1 Month USD LIBOR + 3.25%, Rate Floor: 4.25%) due 12/13/23 | | | 4,207,345 | | | | 4,199,477 | |
due 12/13/23 | | | 3,500,000 | | | | 3,501,470 | |
4.25% (1 Month USD LIBOR + 3.25%, Rate Floor: 4.25%) due 12/13/23††† | | | 1,930,827 | | | | 1,921,172 | |
6.25% (1 Month USD LIBOR + 5.25%, Rate Floor: 6.25%) due 12/13/23 | | | 398,995 | | | | 399,163 | |
Springs Window Fashions | | | | | | | | |
8.61% (1 Month USD LIBOR + 8.50%, Rate Floor: 8.50%) due 06/15/26 | | | 5,500,000 | | | | 5,472,500 | |
4.36% (1 Month USD LIBOR + 4.25%, Rate Floor: 4.25%) due 06/16/25 | | | 3,137,939 | | | | 3,120,931 | |
Zep, Inc. | | | | | | | | |
5.00% (3 Month USD LIBOR + 4.00%, Rate Floor: 5.00%) due 08/12/24 | | | 7,881,218 | | | | 7,782,703 | |
Endo Luxembourg Finance Company I SARL | | | | | | | | |
due 03/11/28 | | | 7,750,000 | | | | 7,662,813 | |
CAB (Biogroup) | | | | | | | | |
3.50% (3 Month EURIBOR + 3.50%, Rate Floor: 3.50%) due 02/09/28 | | | EUR 6,500,000 | | | | 7,571,570 | |
Option Care Health, Inc. | | | | | | | | |
3.86% (1 Month USD LIBOR + 3.75%, Rate Floor: 3.75%) due 08/06/26 | | | 7,181,818 | | | | 7,150,434 | |
Diamond (BC) BV | | | | | | | | |
3.11% (1 Month USD LIBOR + 3.00%, Rate Floor: 3.00%) due 09/06/24 | | | 6,680,800 | | | | 6,642,519 | |
30 | THE GUGGENHEIM FUNDS SEMI-ANNUAL REPORT | SEE NOTES TO CONSOLIDATED FINANCIAL STATEMENTS. |
CONSOLIDATED SCHEDULE OF INVESTMENTS (Unaudited)(continued) | March 31, 2021 |
MACRO OPPORTUNITIES FUND | |
| | Face
Amount~ | | | Value | |
3.25% (1 Month EURIBOR + 3.25%, Rate Floor: 3.25%) due 09/06/24 | | | EUR 219,043 | | | $ | 256,371 | |
Hearthside Group Holdings LLC | | | | | | | | |
3.80% (1 Month USD LIBOR + 3.69%, Rate Floor: 3.69%) due 05/23/25 | | | 5,386,487 | | | | 5,329,282 | |
4.11% (1 Month USD LIBOR + 4.00%, Rate Floor: 4.00%) due 05/23/25 | | | 1,113,608 | | | | 1,107,694 | |
Pearl Intermediate Parent LLC | | | | | | | | |
3.50% (1 Month USD LIBOR + 3.50%, Rate Floor: 3.50%) due 02/14/25 | | | 5,785,316 | | | | 5,762,175 | |
Taxware Holdings (Sovos Compliance LLC) | | | | | | | | |
5.75% (1 Month USD LIBOR + 4.75%, Rate Floor: 5.75%) due 04/29/24 | | | 5,289,831 | | | | 5,184,035 | |
MDVIP LLC | | | | | | | | |
5.25% (1 Month USD LIBOR + 4.25%, Rate Floor: 5.25%) due 11/14/24 | | | 4,574,411 | | | | 4,551,539 | |
BCPE Eagle Buyer LLC | | | | | | | | |
5.25% (3 Month USD LIBOR + 4.25%, Rate Floor: 5.25%) due 03/18/24 | | | 2,789,789 | | | | 2,775,840 | |
Certara, Inc. | | | | | | | | |
3.70% (3 Month USD LIBOR + 3.50%, Rate Floor: 3.50%) due 08/15/24 | | | 1,628,481 | | | | 1,622,374 | |
EyeCare Partners LLC | | | | | | | | |
3.86% (1 Month USD LIBOR + 3.75%, Rate Floor: 3.75%) due 02/18/27 | | | 1,090,578 | | | | 1,078,461 | |
Recess Holdings, Inc. | | | | | | | | |
4.75% (3 Month USD LIBOR + 3.75%, Rate Floor: 4.75%) due 09/30/24 | | | 1,071,227 | | | | 1,058,372 | |
Moran Foods LLC | | | | | | | | |
11.75% (3 Month USD LIBOR, Rate Floor: 1.00%) (in-kind rate was 10.75%) due 10/01/24†††,11 | | | 483,707 | | | | 420,825 | |
8.00% (3 Month USD LIBOR, Rate Floor: 1.00%) (in-kind rate was 7.00%) due 04/01/24†††,11 | | | 394,487 | | | | 410,266 | |
Blue Ribbon LLC | | | | | | | | |
5.14% (3 Month USD LIBOR + 4.00% and Commercial Prime Lending Rate + 4.00%, Rate Floor: 5.00%) due 11/15/21 | | | 550,000 | | | | 536,838 | |
Total Consumer, Non-cyclical | | | 303,780,777 | |
| | | | | | | | | |
Technology - 3.7% |
Planview Parent, Inc. | | | | | | | | |
4.75% (3 Month USD LIBOR + 4.00%, Rate Floor: 4.75%) due 12/17/27 | | | 20,930,000 | | | | 20,895,256 | |
4.75% (3 Month USD LIBOR + 4.00%, Rate Floor: 4.75%) due 12/17/27††† | | | 2,570,000 | | | | 2,580,704 | |
SEE NOTES TO CONSOLIDATED FINANCIAL STATEMENTS. | THE GUGGENHEIM FUNDS SEMI-ANNUAL REPORT | 31 |
CONSOLIDATED SCHEDULE OF INVESTMENTS (Unaudited)(continued) | March 31, 2021 |
MACRO OPPORTUNITIES FUND | |
| | Face
Amount~ | | | Value | |
Project Ruby Ultimate Parent Corp. | | | | | | | | |
4.00% (3 Month USD LIBOR + 3.25%, Rate Floor: 4.00%) due 03/10/28 | | | 17,600,000 | | | $ | 17,519,392 | |
RealPage, Inc. | | | | | | | | |
due 02/18/28 | | | 15,550,000 | | | | 15,470,073 | |
Team.Blue Finco SARL | | | | | | | | |
due 03/18/28 | | | EUR 13,243,243 | | | | 15,463,133 | |
Transact Holdings, Inc. | | | | | | | | |
4.86% (1 Month USD LIBOR + 4.75%, Rate Floor: 4.75%) due 04/30/26 | | | 14,765,324 | | | | 14,617,670 | |
Sitecore Holding III A/S | | | | | | | | |
6.75% (3 Month USD LIBOR + 6.25%, Rate Floor: 6.75%) due 03/12/26 | | | 5,676,667 | | | | 5,591,516 | |
7.00% (3 Month EURIBOR + 6.25%, Rate Floor: 6.25%) due 03/12/26 | | | EUR 4,333,333 | | | | 5,005,081 | |
due 03/12/26 | | | EUR 3,466,667 | | | | 4,004,065 | |
Provation Software Group, Inc. | | | | | | | | |
5.50% (6 Month USD LIBOR + 4.75%, Rate Floor: 5.50%) due 12/16/27 | | | 13,700,000 | | | | 13,528,750 | |
Valkyr Purchaser, LLC | | | | | | | | |
4.75% (3 Month USD LIBOR + 4.00%, Rate Floor: 4.75%) due 11/05/27 | | | 12,500,000 | | | | 12,494,750 | |
Sportradar Capital SARL | | | | | | | | |
4.25% (3 Month EURIBOR + 4.25%, Rate Floor: 4.25%) due 11/22/27 | | | EUR 10,600,000 | | | | 12,419,327 | |
Project Boost Purchaser LLC | | | | | | | | |
5.00% (1 Month USD LIBOR + 4.25%, Rate Floor: 5.00%) due 06/01/26 | | | 9,651,500 | | | | 9,639,436 | |
Ascend Learning LLC | | | | | | | | |
4.75% (1 Month USD LIBOR + 3.75%, Rate Floor: 4.75%) due 07/12/24 | | | 9,601,750 | | | | 9,595,797 | |
Datix Bidco Ltd. | | | | | | | | |
4.74% (6 Month USD LIBOR + 4.50%, Rate Floor: 4.50%) due 04/28/25††† | | | 9,112,505 | | | | 9,059,797 | |
7.99% (6 Month USD LIBOR + 7.75%, Rate Floor: 7.75%) due 04/27/26††† | | | 461,709 | | | | 458,542 | |
ThoughtWorks, Inc. | | | | | | | | |
3.75% (1 Month USD LIBOR + 3.25%, Rate Floor: 3.75%) due 03/19/28 | | | 9,200,000 | | | | 9,169,364 | |
E2open LLC | | | | | | | | |
4.00% (3 Month USD LIBOR + 3.50%, Rate Floor: 4.00%) due 02/04/28 | | | 8,000,000 | | | | 7,985,040 | |
Imprivata, Inc. | | | | | | | | |
4.25% (1 Month USD LIBOR + 3.75%, Rate Floor: 4.25%) due 12/01/27 | | | 7,900,000 | | | | 7,876,537 | |
Wrench Group LLC | | | | | | | | |
5.50% (3 Month USD LIBOR + 4.50%, Rate Floor: 5.50%) due 04/30/26††† | | | 6,733,125 | | | | 6,749,958 | |
32 | THE GUGGENHEIM FUNDS SEMI-ANNUAL REPORT | SEE NOTES TO CONSOLIDATED FINANCIAL STATEMENTS. |
CONSOLIDATED SCHEDULE OF INVESTMENTS (Unaudited)(continued) | March 31, 2021 |
MACRO OPPORTUNITIES FUND | |
| | Face
Amount~ | | | Value | |
Peraton Corp. | | | | | | | | |
4.50% (3 Month USD LIBOR + 3.75%, Rate Floor: 4.50%) due 02/01/28 | | | 6,213,978 | | | $ | 6,208,820 | |
Sabre GLBL, Inc. | | | | | | | | |
4.75% (1 Month USD LIBOR + 4.00%, Rate Floor: 4.75%) due 12/10/27 | | | 5,536,125 | | | | 5,588,054 | |
Epicor Software | | | | | | | | |
4.00% (1 Month USD LIBOR + 3.25%, Rate Floor: 4.00%) due 07/30/27 | | | 5,422,750 | | | | 5,402,903 | |
AVS Group GmbH | | | | | | | | |
3.75% (6 Month EURIBOR + 3.75%, Rate Floor: 3.75%) due 09/10/26 | | | EUR 3,750,000 | | | | 4,379,207 | |
1A Smart Start LLC | | | | | | | | |
5.75% (3 Month USD LIBOR + 4.75%, Rate Floor: 5.75%) due 08/19/27 | | | 4,278,500 | | | | 4,290,523 | |
Concorde Lux | | | | | | | | |
4.00% (3 Month EURIBOR + 4.00%, Rate Floor: 4.00%) due 02/18/28 | | | EUR 3,100,000 | | | | 3,632,831 | |
Greenway Health LLC | | | | | | | | |
4.75% (3 Month USD LIBOR + 3.75%, Rate Floor: 4.75%) due 02/16/24 | | | 3,491,184 | | | | 3,316,625 | |
Ministry Brands LLC | | | | | | | | |
5.00% (1 Month USD LIBOR + 4.00%, Rate Floor: 5.00%) due 12/02/22††† | | | 2,634,962 | | | | 2,602,117 | |
Verscend Holding Corp. | | | | | | | | |
due 08/27/25 | | | 2,400,000 | | | | 2,397,288 | |
Aspect Software, Inc. | | | | | | | | |
6.00% (3 Month USD LIBOR + 5.00%, Rate Floor: 6.00%) due 01/15/24 | | | 2,054,761 | | | | 2,047,570 | |
Misys Ltd. | | | | | | | | |
4.50% (3 Month USD LIBOR + 3.50%, Rate Floor: 4.50%) due 06/13/24 | | | 1,705,889 | | | | 1,670,133 | |
Boxer Parent Co., Inc. | | | | | | | | |
3.86% (1 Month USD LIBOR + 3.75%, Rate Floor: 3.75%) due 10/02/25 | | | 1,589,342 | | | | 1,581,396 | |
Cologix Holdings, Inc. | | | | | | | | |
4.75% (1 Month USD LIBOR + 3.75%, Rate Floor: 4.75%) due 03/20/24 | | | 1,200,000 | | | | 1,197,216 | |
Kar Finland Bidco Oy | | | | | | | | |
4.50% (6 Month EURIBOR + 4.50%, Rate Floor: 4.50%) due 11/27/23††† | | | EUR 1,000,000 | | | | 1,152,087 | |
24-7 Intouch, Inc. | | | | | | | | |
4.86% (1 Month USD LIBOR + 4.75%, Rate Floor: 4.75%) due 08/25/25††† | | | 1,150,303 | | | | 1,104,291 | |
Brave Parent Holdings, Inc. | | | | | | | | |
4.11% (1 Month USD LIBOR + 4.00%, Rate Floor: 4.00%) due 04/18/25 | | | 321,692 | | | | 321,425 | |
SEE NOTES TO CONSOLIDATED FINANCIAL STATEMENTS. | THE GUGGENHEIM FUNDS SEMI-ANNUAL REPORT | 33 |
CONSOLIDATED SCHEDULE OF INVESTMENTS (Unaudited)(continued) | March 31, 2021 |
MACRO OPPORTUNITIES FUND | |
| | Face
Amount~ | | | Value | |
Evergood 4 ApS (Nets) | | | | | | | | |
3.25% (3 Month EURIBOR + 3.25%, Rate Floor: 3.25%) due 02/06/25 | | | EUR 225,000 | | | $ | 263,365 | |
Total Technology | | | 247,280,039 | |
| |
Financial - 2.9% |
Jones Deslauriers Insurance Management, Inc. | | | | | | | | |
due 03/12/28††† | | | CAD 23,341,000 | | | | 18,623,830 | |
due 03/12/29††† | | | CAD 10,612,000 | | | | 8,467,336 | |
Jefferies Finance LLC | | | | | | | | |
4.50% (1 Month USD LIBOR + 3.75%, Rate Floor: 4.50%) due 09/30/27††† | | | 24,427,250 | | | | 24,213,511 | |
Camelia Bidco Banc Civica | | | | | | | | |
4.84% (3 Month GBP LIBOR + 4.75%, Rate Floor: 4.75%) due 10/14/24 | | | GBP 12,975,000 | | | | 17,785,915 | |
Franchise Group, Inc. | | | | | | | | |
5.50% (3 Month USD LIBOR + 4.75%, Rate Floor: 5.50%) due 03/10/26 | | | 15,800,000 | | | | 15,809,954 | |
Teneo Holdings LLC | | | | | | | | |
6.25% (1 Month USD LIBOR + 5.25%, Rate Floor: 6.25%) due 07/11/25 | | | 13,374,849 | | | | 13,338,068 | |
Duff & Phelps | | | | | | | | |
4.75% (1 Month USD LIBOR + 3.75%, Rate Floor: 4.75%) due 04/09/27 | | | 13,134,000 | | | | 13,131,898 | |
PAI Holdco, Inc. | | | | | | | | |
5.00% (3 Month USD LIBOR + 4.00%, Rate Floor: 5.00%) due 10/22/27 | | | 12,600,000 | | | | 12,631,500 | |
GT Polaris, Inc. | | | | | | | | |
5.00% (3 Month USD LIBOR + 4.00%, Rate Floor: 5.00%) due 09/24/27 | | | 11,521,125 | | | | 11,506,724 | |
Alter Domus | | | | | | | | |
4.50% (2 Month USD LIBOR + 3.75%, Rate Floor: 4.50%) due 02/11/28 | | | 10,500,000 | | | | 10,451,910 | |
USI, Inc. | | | | | | | | |
3.45% (3 Month USD LIBOR + 3.25%, Rate Floor: 3.25%) due 12/02/26 | | | 10,248,347 | | | | 10,140,329 | |
Orion Advisor Solutions, Inc. | | | | | | | | |
due 09/24/27 | | | 10,100,000 | | | | 10,087,375 | |
Higginbotham | | | | | | | | |
6.50% (1 Month USD LIBOR + 5.75%, Rate Floor: 6.50%) due 11/25/26††† | | | 10,105,491 | | | | 9,963,081 | |
AlixPartners, LLP | | | | | | | | |
3.25% (3 Month EURIBOR + 3.25%, Rate Floor: 3.25%) due 02/04/28 | | | EUR 6,000,000 | | | | 7,009,264 | |
HUB International Ltd. | | | | | | | | |
3.22% (3 Month USD LIBOR + 3.00%, Rate Floor: 3.00%) due 04/25/25 | | | 5,173,105 | | | | 5,096,698 | |
34 | THE GUGGENHEIM FUNDS SEMI-ANNUAL REPORT | SEE NOTES TO CONSOLIDATED FINANCIAL STATEMENTS. |
CONSOLIDATED SCHEDULE OF INVESTMENTS (Unaudited)(continued) | March 31, 2021 |
MACRO OPPORTUNITIES FUND | |
| | Face
Amount~ | | | Value | |
Cross Financial Corp. | | | | | | | | |
due 09/15/27 | | | 3,750,000 | | | $ | 3,761,737 | |
5.50% (1 Month USD LIBOR + 4.50%, Rate Floor: 5.50%) due 09/15/27 | | | 997,500 | | | | 1,000,622 | |
Aretec Group, Inc. | | | | | | | | |
4.36% (1 Month USD LIBOR + 4.25%, Rate Floor: 4.25%) due 10/01/25 | | | 3,812,250 | | | | 3,803,901 | |
AmeriLife Holdings LLC | | | | | | | | |
4.11% (3 Month USD LIBOR + 4.00%, Rate Floor: 4.00%) due 03/18/27 | | | 223,315 | | | | 222,851 | |
Total Financial | | | 197,046,504 | |
| | | | | | | | | |
Communications - 1.5% |
Syndigo LLC | | | | | | | | |
5.25% (6 Month USD LIBOR + 4.50%, Rate Floor: 5.25%) due 12/15/27††† | | | 27,550,000 | | | | 27,550,000 | |
Xplornet Communications, Inc. | | | | | | | | |
4.86% (1 Month USD LIBOR + 4.75%, Rate Floor: 4.75%) due 06/10/27 | | | 21,805,225 | | | | 21,788,217 | |
Trader Interactive | | | | | | | | |
7.25% (3 Month USD LIBOR + 6.25%, Rate Floor: 7.25%) due 06/17/24††† | | | 10,706,614 | | | | 10,438,949 | |
7.25% (1 Month USD LIBOR + 6.25%, Rate Floor: 7.25%) due 06/15/23††† | | | 30,769 | | | | 29,071 | |
McGraw Hill LLC | | | | | | | | |
5.75% (3 Month USD LIBOR + 4.75%, Rate Floor: 5.75%) due 11/01/24 | | | 8,886,382 | | | | 8,867,898 | |
Cengage Learning Acquisitions, Inc. | | | | | | | | |
5.25% (3 Month USD LIBOR + 4.25%, Rate Floor: 5.25%) due 06/07/23 | | | 8,297,750 | | | | 8,199,255 | |
Zayo Group Holdings, Inc. | | | | | | | | |
3.11% (1 Month USD LIBOR + 3.00%, Rate Floor: 3.00%) due 03/09/27 | | | 6,146,447 | | | | 6,092,543 | |
LCPR Loan Financing LLC | | | | | | | | |
due 10/15/28 | | | 5,300,000 | | | | 5,306,625 | |
Recorded Books, Inc. | | | | | | | | |
4.00% (3 Month USD LIBOR + 4.00%, Rate Floor: 4.00%) due 08/29/25 | | | 4,143,341 | | | | 4,124,075 | |
Market Track LLC | | | | | | | | |
5.25% (3 Month USD LIBOR + 4.25%, Rate Floor: 5.25%) due 06/05/24 | | | 4,101,250 | | | | 3,916,694 | |
Resource Label Group LLC | | | | | | | | |
5.50% (3 Month USD LIBOR + 4.50%, Rate Floor: 5.50%) due 05/26/23 | | | 1,901,940 | | | | 1,766,427 | |
9.50% (3 Month USD LIBOR + 8.50%, Rate Floor: 9.50%) due 11/27/23††† | | | 1,500,000 | | | | 1,331,250 | |
SEE NOTES TO CONSOLIDATED FINANCIAL STATEMENTS. | THE GUGGENHEIM FUNDS SEMI-ANNUAL REPORT | 35 |
CONSOLIDATED SCHEDULE OF INVESTMENTS (Unaudited)(continued) | March 31, 2021 |
MACRO OPPORTUNITIES FUND | |
| | Face
Amount~ | | | Value | |
Flight Bidco, Inc. | | | | | | | | |
7.61% (1 Month USD LIBOR + 7.50%, Rate Floor: 7.50%) due 07/23/26 | | | 1,000,000 | | | $ | 902,500 | |
Nielsen Finance LLC | | | | | | | | |
4.75% (1 Month USD LIBOR + 3.75%, Rate Floor: 4.75%) due 06/04/25 | | | 586,902 | | | | 587,912 | |
Total Communications | | | 100,901,416 | |
| | | | | | | | | |
Basic Materials - 1.1% |
Illuminate Buyer LLC | | | | | | | | |
3.61% (1 Month USD LIBOR + 3.50%, Rate Floor: 3.50%) due 06/30/27 | | | 12,725,731 | | | | 12,656,758 | |
LSF11 Skyscraper HoldCo SARL | | | | | | | | |
due 09/29/27 | | | 12,050,000 | | | | 12,019,875 | |
NIC Acquisition Corp. | | | | | | | | |
4.50% (3 Month USD LIBOR + 3.75%, Rate Floor: 4.50%) due 12/29/27 | | | 8,600,000 | | | | 8,592,862 | |
GrafTech Finance, Inc. | | | | | | | | |
4.00% (1 Month USD LIBOR + 3.00%, Rate Floor: 4.00%) due 02/12/25 | | | 8,515,282 | | | | 8,504,638 | |
TricorBraun Holdings, Inc. | | | | | | | | |
3.75% (6 Month USD LIBOR + 3.25%, Rate Floor: 3.75%) due 03/03/28 | | | 7,731,446 | | | | 7,650,885 | |
Barentz Midco BV | | | | | | | | |
4.00% (3 Month EURIBOR + 4.00%, Rate Floor: 4.00%) due 11/30/27 | | | EUR 2,400,000 | | | | 2,814,259 | |
5.25% (3 Month USD LIBOR + 4.50%, Rate Floor: 5.25%) due 11/30/27 | | | 1,995,000 | | | | 1,990,013 | |
Patriot Container Corp. (Wastequip) | | | | | | | | |
4.50% (1 Month USD LIBOR + 3.50%, Rate Floor: 4.50%) due 03/20/25 | | | 4,741,683 | | | | 4,691,326 | |
Pregis TopCo LLC | | | | | | | | |
5.00% (1 Month USD LIBOR + 4.25%, Rate Floor: 5.00%) due 07/31/26††† | | | 4,150,000 | | | | 4,150,000 | |
PQ Corp. | | | | | | | | |
4.00% (3 Month USD LIBOR + 3.00%, Rate Floor: 4.00%) due 02/08/27 | | | 3,670,492 | | | | 3,668,951 | |
Invictus MD Strategies Corp. | | | | | | | | |
3.11% (1 Month USD LIBOR + 3.00%, Rate Floor: 3.00%) due 03/28/25 | | | 1,997,195 | | | | 1,973,648 | |
Vectra Co. | | | | | | | | |
3.36% (1 Month USD LIBOR + 3.25%, Rate Floor: 3.25%) due 03/10/25 | | | 1,936,039 | | | | 1,898,286 | |
DCG Acquisition Corp. | | | | | | | | |
4.61% (1 Month USD LIBOR + 4.50%, Rate Floor: 4.50%) due 09/30/26 | | | 943,340 | | | | 938,623 | |
36 | THE GUGGENHEIM FUNDS SEMI-ANNUAL REPORT | SEE NOTES TO CONSOLIDATED FINANCIAL STATEMENTS. |
CONSOLIDATED SCHEDULE OF INVESTMENTS (Unaudited)(continued) | March 31, 2021 |
MACRO OPPORTUNITIES FUND | |
| | Face
Amount~ | | | Value | |
Ascend Performance Materials Operations LLC | | | | | | | | |
5.50% (3 Month USD LIBOR + 4.75%, Rate Floor: 5.50%) due 08/27/26 | | | 395,992 | | | $ | 400,859 | |
American Rock Salt Company LLC | | | | | | | | |
4.50% (1 Month USD LIBOR + 3.50%, Rate Floor: 4.50%) due 03/21/25 | | | 223,826 | | | | 223,714 | |
Total Basic Materials | | | 72,174,697 | |
| | | | | | | | | |
Utilities - 0.6% |
Hamilton Projects Acquiror LLC | | | | | | | | |
5.75% (3 Month USD LIBOR + 4.75%, Rate Floor: 5.75%) due 06/17/27 | | | 24,516,466 | | | | 24,588,054 | |
RS Ivy Holdco, Inc. | | | | | | | | |
6.50% (1 Month USD LIBOR + 5.50%, Rate Floor: 6.50%) due 12/23/27††† | | | 13,895,175 | | | | 13,895,175 | |
Panda Hummel | | | | | | | | |
7.00% (1 Month USD LIBOR + 6.00%, Rate Floor: 7.00%) due 10/27/22 | | | 1,213,776 | | | | 1,158,015 | |
Panda Stonewall | | | | | | | | |
6.50% (3 Month USD LIBOR + 5.50%, Rate Floor: 6.50%) due 11/12/21 | | | 723,131 | | | | 673,872 | |
Granite Generation LLC | | | | | | | | |
4.75% (1 Month USD LIBOR + 3.75% and 3 Month USD LIBOR + 3.75%, Rate Floor: 4.75%) due 11/09/26 | | | 518,603 | | | | 517,416 | |
Total Utilities | | | 40,832,532 | |
| | | | | | | | | |
Energy - 0.2% |
Venture Global Calcasieu Pass LLC | | | | | | | | |
2.48% (1 Month USD LIBOR + 2.38% and 3 Month USD LIBOR + 2.38%, Rate Floor: 2.38%) due 08/19/26††† | | | 7,298,099 | | | | 6,896,704 | |
SeaPort Financing LLC | | | | | | | | |
5.61% (1 Month USD LIBOR + 5.50%, Rate Floor: 5.50%) due 10/31/25††† | | | 3,077,227 | | | | 3,031,068 | |
Buckeye Partners LP | | | | | | | | |
2.36% (1 Month USD LIBOR + 2.25%, Rate Floor: 2.25%) due 11/01/26 | | | 594,011 | | | | 590,916 | |
Permian Production Partners LLC | | | | | | | | |
9.00% (1 Month USD LIBOR + 6.00%, Rate Floor: 7.00%) (in-kind rate was 2.00%) due 11/23/25†††,11 | | | 3,730,175 | | | | 447,621 | |
Total Energy | | | 10,966,309 | |
| | | | | | | | | |
Total Senior Floating Rate Interests |
(Cost $1,633,173,270) | | | 1,644,591,347 | |
| | | | | | | | | |
SEE NOTES TO CONSOLIDATED FINANCIAL STATEMENTS. | THE GUGGENHEIM FUNDS SEMI-ANNUAL REPORT | 37 |
CONSOLIDATED SCHEDULE OF INVESTMENTS (Unaudited)(continued) | March 31, 2021 |
MACRO OPPORTUNITIES FUND | |
| | Face
Amount~ | | | Value | |
ASSET-BACKED SECURITIES†† - 17.5% |
Collateralized Loan Obligations - 9.8% |
Diamond CLO Ltd. | | | | | | | | |
2018-1A, 2.82% (3 Month USD LIBOR + 2.60%, Rate Floor: 2.60%) due 07/22/305,8 | | | 13,500,000 | | | $ | 13,477,910 | |
2018-1A, 2.02% (3 Month USD LIBOR + 1.80%, Rate Floor: 1.80%) due 07/22/305,8 | | | 11,000,000 | | | | 10,926,534 | |
2021-1A, 3.60% (3 Month USD LIBOR + 3.40%, Rate Floor: 3.40%) due 04/25/295,8 | | | 5,500,000 | | | | 5,498,900 | |
2018-1A, 3.92% (3 Month USD LIBOR + 3.70%, Rate Floor: 3.70%) due 07/22/305,8 | | | 5,000,000 | | | | 4,987,663 | |
2021-1A, 2.60% (3 Month USD LIBOR + 2.40%, Rate Floor: 2.40%) due 04/25/295,8 | | | 1,322,000 | | | | 1,321,736 | |
BXMT Ltd. | | | | | | | | |
2020-FL2, 1.76% (1 Month USD LIBOR + 1.65%, Rate Floor: 1.65%) due 02/16/375,8 | | | 15,640,000 | | | | 15,634,604 | |
2020-FL2, 2.06% (1 Month USD LIBOR + 1.95%, Rate Floor: 1.95%) due 02/16/375,8 | | | 8,000,000 | | | | 7,962,560 | |
2020-FL3, 2.91% (1 Month USD LIBOR + 2.80%, Rate Floor: 2.80%) due 03/15/375,8 | | | 7,350,000 | | | | 7,344,775 | |
Tralee CLO III Ltd. | | | | | | | | |
2017-3A, 1.67% (3 Month USD LIBOR + 1.45%, Rate Floor: 0.00%) due 10/20/275,8 | | | 31,000,000 | | | | 30,875,988 | |
GoldenTree Loan Management US CLO 1 Ltd. | | | | | | | | |
2020-1A, 2.07% (3 Month USD LIBOR + 1.85%, Rate Floor: 1.85%) due 04/20/295,8 | | | 19,500,000 | | | | 19,499,663 | |
2021-9A, 3.03% (3 Month USD LIBOR + 2.90%, Rate Floor: 2.90%) due 01/20/335,8 | | | 9,950,000 | | | | 9,949,791 | |
KREF Funding V LLC | | | | | | | | |
1.86% (1 Month USD LIBOR + 1.75%, Rate Floor: 1.75%) due 06/25/26†††,8 | | | 27,000,000 | | | | 26,795,967 | |
0.15% due 06/25/26†††,14 | | | 73,636,363 | | | | 36,082 | |
LoanCore Issuer Ltd. | | | | | | | | |
2021-CRE4, 2.61% (1 Month USD LIBOR + 2.50%, Rate Floor: 2.50%) due 07/15/355,8 | | | 13,500,000 | | | | 13,475,630 | |
2019-CRE2, 1.61% (1 Month USD LIBOR + 1.50%, Rate Floor: 1.50%) due 05/15/365,8 | | | 12,850,000 | | | | 12,837,173 | |
Voya CLO Ltd. | | | | | | | | |
2021-2A, due 06/07/305,8 | | | 16,500,000 | | | | 16,496,700 | |
2013-1A, due 10/15/305,12 | | | 28,970,307 | | | | 9,636,712 | |
38 | THE GUGGENHEIM FUNDS SEMI-ANNUAL REPORT | SEE NOTES TO CONSOLIDATED FINANCIAL STATEMENTS. |
CONSOLIDATED SCHEDULE OF INVESTMENTS (Unaudited)(continued) | March 31, 2021 |
MACRO OPPORTUNITIES FUND | |
| | Face
Amount~ | | | Value | |
Golub Capital Partners CLO Ltd. | | | | | | | | |
2018-36A, 2.30% (3 Month USD LIBOR + 2.10%, Rate Floor: 0.00%) due 02/05/315,8 | | | 20,000,000 | | | $ | 19,525,238 | |
2018-39A, 2.42% (3 Month USD LIBOR + 2.20%, Rate Floor: 2.20%) due 10/20/285,8 | | | 5,000,000 | | | | 4,980,091 | |
NewStar Clarendon Fund CLO LLC | | | | | | | | |
2019-1A, 2.27% (3 Month USD LIBOR + 2.05%, Rate Floor: 0.00%) due 01/25/275,8 | | | 14,050,000 | | | | 14,019,280 | |
2019-1A, 3.27% (3 Month USD LIBOR + 3.05%, Rate Floor: 0.00%) due 01/25/275,8 | | | 4,500,000 | | | | 4,479,169 | |
2019-1A, 1.52% (3 Month USD LIBOR + 1.30%, Rate Floor: 0.00%) due 01/25/275,8 | | | 2,989,065 | | | | 2,986,961 | |
2015-1A, 4.57% (3 Month USD LIBOR + 4.35%, Rate Floor: 0.00%) due 01/25/275,8 | | | 1,300,000 | | | | 1,299,798 | |
MidOcean Credit CLO VII | | | | | | | | |
2020-7A, 2.44% (3 Month USD LIBOR + 2.20%, Rate Floor: 0.00%) due 07/15/295,8 | | | 21,000,000 | | | | 20,875,268 | |
Treman Park CLO Ltd. | | | | | | | | |
2015-1A, due 10/20/285,12 | | | 32,400,000 | | | | 20,093,521 | |
BSPRT Issuer Ltd. | | | | | | | | |
2021-FL6, 3.10% (1 Month USD LIBOR + 3.00%, Rate Floor: 3.00%) due 03/15/365,8 | | | 18,425,000 | | | | 18,399,297 | |
BDS Ltd. | | | | | | | | |
2019-FL3, 2.41% (1 Month USD LIBOR + 2.30%, Rate Floor: 2.30%) due 12/15/355,8 | | | 18,300,000 | | | | 18,277,077 | |
Crown Point CLO III Ltd. | | | | | | | | |
2017-3A, 1.69% (3 Month USD LIBOR + 1.45%, Rate Floor: 0.00%) due 12/31/275,8 | | | 15,000,000 | | | | 14,999,971 | |
Cerberus Loan Funding XXX, LP | | | | | | | | |
2020-3A, 3.88% (3 Month USD LIBOR + 3.65%, Rate Floor: 3.65%) due 01/15/335,8 | | | 14,500,000 | | | | 14,524,203 | |
OZLM XIII Ltd. | | | | | | | | |
2018-13A, 2.31% (3 Month USD LIBOR + 2.10%, Rate Floor: 0.00%) due 07/30/275,8 | | | 12,650,000 | | | | 12,631,516 | |
Lake Shore MM CLO III LLC | | | | | | | | |
2020-1A, 3.43% (3 Month USD LIBOR + 3.20%, Rate Floor: 3.20%) due 10/15/295,8 | | | 12,200,000 | | | | 12,176,792 | |
SEE NOTES TO CONSOLIDATED FINANCIAL STATEMENTS. | THE GUGGENHEIM FUNDS SEMI-ANNUAL REPORT | 39 |
CONSOLIDATED SCHEDULE OF INVESTMENTS (Unaudited)(continued) | March 31, 2021 |
MACRO OPPORTUNITIES FUND | |
| | Face
Amount~ | | | Value | |
Palmer Square Loan Funding Ltd. | | | | | | | | |
2018-4A, 2.09% (3 Month USD LIBOR + 1.90%, Rate Floor: 0.00%) due 11/15/265,8 | | | 9,050,000 | | | $ | 9,055,140 | |
2018-5A, 2.12% (3 Month USD LIBOR + 1.90%, Rate Floor: 1.90%) due 01/20/275,8 | | | 3,000,000 | | | | 3,001,707 | |
MP CLO VIII Ltd. | | | | | | | | |
2018-2A, 2.12% (3 Month USD LIBOR + 1.90%, Rate Floor: 0.00%) due 10/28/275,8 | | | 11,950,000 | | | | 11,897,393 | |
Neuberger Berman Loan Advisers CLO 32 Ltd. | | | | | | | | |
2021-32A, 2.89% (3 Month USD LIBOR + 2.70%, Rate Floor: 2.70%) due 01/20/325,8 | | | 11,500,000 | | | | 11,498,475 | |
Atlas Senior Loan Fund IX Ltd. | | | | | | | | |
2018-9A, 2.02% (3 Month USD LIBOR + 1.80%, Rate Floor: 1.80%) due 04/20/285,8 | | | 10,250,000 | | | | 10,125,491 | |
2018-9A, due 04/20/285,12 | | | 9,600,000 | | | | 1,154,650 | |
Mountain Hawk II CLO Ltd. | | | | | | | | |
2018-2A, 2.57% (3 Month USD LIBOR + 2.35%, Rate Floor: 0.00%) due 07/20/245,8 | | | 8,250,000 | | | | 8,250,393 | |
2013-2A, 3.37% (3 Month USD LIBOR + 3.15%, Rate Floor: 0.00%) due 07/22/245,8 | | | 2,750,000 | | | | 2,749,740 | |
TCP Waterman CLO Ltd. | | | | | | | | |
2016-1A, 3.18% (3 Month USD LIBOR + 3.00%, Rate Floor: 0.00%) due 12/15/285,8 | | | 11,000,000 | | | | 10,985,355 | |
Telos CLO Ltd. | | | | | | | | |
2017-6A, 2.82% (3 Month USD LIBOR + 2.60%, Rate Floor: 0.00%) due 01/17/275,8 | | | 7,500,000 | | | | 7,488,223 | |
2017-6A, 1.49% (3 Month USD LIBOR + 1.27%, Rate Floor: 0.00%) due 01/17/275,8 | | | 1,626,515 | | | | 1,626,565 | |
Magnetite Xxix Ltd. | | | | | | | | |
2021-29A, 2.70% (3 Month USD LIBOR + 2.60%, Rate Floor: 2.60%) due 01/15/345,8 | | | 8,800,000 | | | | 8,913,138 | |
Carlyle Global Market Strategies CLO Ltd. | | | | | | | | |
2017-2A, 1.87% (3 Month USD LIBOR + 1.65%, Rate Floor: 0.00%) due 01/18/295,8 | | | 3,500,000 | | | | 3,474,476 | |
2012-3A, due 01/14/325,12 | | | 6,400,000 | | | | 2,672,934 | |
2013-3X SUB, due 10/15/3012 | | | 4,938,326 | | | | 1,478,718 | |
2018-1A, 2.07% (3 Month USD LIBOR + 1.85%, Rate Floor: 1.85%) due 04/20/275,8 | | | 1,150,000 | | | | 1,148,865 | |
40 | THE GUGGENHEIM FUNDS SEMI-ANNUAL REPORT | SEE NOTES TO CONSOLIDATED FINANCIAL STATEMENTS. |
CONSOLIDATED SCHEDULE OF INVESTMENTS (Unaudited)(continued) | March 31, 2021 |
MACRO OPPORTUNITIES FUND | |
| | Face
Amount~ | | | Value | |
Marathon CLO V Ltd. | | | | | | | | |
2017-5A, 1.63% (3 Month USD LIBOR + 1.45%, Rate Floor: 0.00%) due 11/21/275,8 | | | 7,920,233 | | | $ | 7,844,224 | |
2013-5A, due 11/21/275,12 | | | 5,500,000 | | | | 334,400 | |
Dryden 37 Senior Loan Fund | | | | | | | | |
2015-37A, due 01/15/315,12 | | | 9,500,000 | | | | 8,128,068 | |
Flagship CLO VIII Ltd. | | | | | | | | |
2018-8A, 2.02% (3 Month USD LIBOR + 1.80%, Rate Floor: 0.00%) due 01/16/265,8 | | | 8,025,000 | | | | 8,010,908 | |
Venture XIV CLO Ltd. | | | | | | | | |
2020-14A, 2.44% (3 Month USD LIBOR + 2.25%, Rate Floor: 2.25%) due 08/28/295,8 | | | 8,000,000 | | | | 7,985,888 | |
Avery Point II CLO Ltd. | | | | | | | | |
2013-3X COM, due 01/18/2512 | | | 13,084,609 | | | | 7,714,939 | |
Madison Park Funding XLVIII Ltd. | | | | | | | | |
2021-48A, 3.14% (3 Month USD LIBOR + 3.00%, Rate Floor: 3.00%) due 04/19/335,8 | | | 7,500,000 | | | | 7,507,690 | |
Newstar Commercial Loan Funding LLC | | | | | | | | |
2017-1A, 3.69% (3 Month USD LIBOR + 3.50%, Rate Floor: 0.00%) due 03/20/275,8 | | | 7,500,000 | | | | 7,487,459 | |
ACRE Commercial Mortgage Ltd. | | | | | | | | |
2021-FL4, 2.71% (1 Month USD LIBOR + 2.60%, Rate Floor: 2.60%) due 12/18/375,8 | | | 7,350,000 | | | | 7,347,132 | |
Octagon Loan Funding Ltd. | | | | | | | | |
2014-1A, due 11/18/315,12 | | | 19,435,737 | | | | 7,207,821 | |
ACIS CLO Ltd. | | | | | | | | |
2014-4A, 2.76% (3 Month USD LIBOR + 2.55%, Rate Floor: 0.00%) due 05/01/265,8 | | | 3,600,000 | | | | 3,600,309 | |
2015-6A, 3.58% (3 Month USD LIBOR + 3.37%, Rate Floor: 0.00%) due 05/01/275,8 | | | 3,250,000 | | | | 3,258,082 | |
Marathon CRE Ltd. | | | | | | | | |
2018-FL1, 3.11% (1 Month USD LIBOR + 3.00%, Rate Floor: 3.00%) due 06/15/285,8 | | | 6,000,000 | | | | 5,967,980 | |
2018-FL1, 2.71% (1 Month USD LIBOR + 2.60%, Rate Floor: 2.60%) due 06/15/285,8 | | | 650,000 | | | | 644,960 | |
Dryden 41 Senior Loan Fund | | | | | | | | |
2015-41A, due 04/15/315,12 | | | 11,700,000 | | | | 6,285,404 | |
Dryden 50 Senior Loan Fund | | | | | | | | |
2017-50A, due 07/15/305,12 | | | 7,895,000 | | | | 5,507,749 | |
SEE NOTES TO CONSOLIDATED FINANCIAL STATEMENTS. | THE GUGGENHEIM FUNDS SEMI-ANNUAL REPORT | 41 |
CONSOLIDATED SCHEDULE OF INVESTMENTS (Unaudited)(continued) | March 31, 2021 |
MACRO OPPORTUNITIES FUND | |
| | Face
Amount~ | | | Value | |
CHCP Ltd. | | | | | | | | |
2021-FL1, 3.11% (1 Month USD LIBOR + 3.00%, Rate Floor: 3.00%) due 02/15/385,8 | | | 5,500,000 | | | $ | 5,502,352 | |
Silvermore CLO Ltd. | | | | | | | | |
2014-1A, 3.19% (3 Month USD LIBOR + 3.00%, Rate Floor: 0.00%) due 05/15/265,8 | | | 5,500,000 | | | | 5,498,987 | |
Hull Street CLO Ltd. | | | | | | | | |
2014-1A, 3.83% (3 Month USD LIBOR + 3.60%, Rate Floor: 0.00%) due 10/18/265,8 | | | 5,785,000 | | | | 5,474,080 | |
FDF II Ltd. | | | | | | | | |
2016-2A, 6.29% due 05/12/315 | | | 5,250,000 | | | | 5,233,340 | |
Sudbury Mill CLO Ltd. | | | | | | | | |
2017-1A, 2.67% (3 Month USD LIBOR + 2.45%, Rate Floor: 0.00%) due 01/17/265,8 | | | 5,000,000 | | | | 4,975,819 | |
Venture XIII CLO Ltd. | | | | | | | | |
2013-13A, due 09/10/295,12 | | | 13,790,000 | | | | 4,307,927 | |
Jackson Mill CLO Ltd. | | | | | | | | |
2018-1A, 2.09% (3 Month USD LIBOR + 1.85%, Rate Floor: 1.85%) due 04/15/275,8 | | | 4,150,000 | | | | 4,120,712 | |
WhiteHorse X Ltd. | | | | | | | | |
2015-10A, 5.52% (3 Month USD LIBOR + 5.30%, Rate Floor: 5.30%) due 04/17/275,8 | | | 4,980,000 | | | | 4,062,131 | |
Madison Park Funding XVI Ltd. | | | | | | | | |
2016-16A, 2.87% (3 Month USD LIBOR + 2.65%, Rate Floor: 0.00%) due 04/20/265,8 | | | 4,000,000 | | | | 3,996,012 | |
Neuberger Berman Loan Advisers CLO 40 Ltd. | | | | | | | | |
2021-40A, 2.94% (3 Month USD LIBOR + 2.75%, Rate Floor: 2.75%) due 04/16/335,8 | | | 4,050,000 | | | | 3,991,883 | |
Adams Mill CLO Ltd. | | | | | | | | |
2014-1A, 5.24% (3 Month USD LIBOR + 5.00%, Rate Floor: 0.00%) due 07/15/265,8 | | | 4,000,000 | | | | 3,524,927 | |
Monroe Capital CLO Ltd. | | | | | | | | |
2017-1A, 3.82% (3 Month USD LIBOR + 3.60%, Rate Floor: 0.00%) due 10/22/265,8 | | | 3,000,000 | | | | 2,974,401 | |
2017-1A, 1.57% (3 Month USD LIBOR + 1.35%, Rate Floor: 0.00%) due 10/22/265,8 | | | 96,272 | | | | 96,255 | |
BNPP IP CLO Ltd. | | | | | | | | |
2014-2A, 5.46% (3 Month USD LIBOR + 5.25%, Rate Floor: 0.00%) due 10/30/255,8 | | | 5,844,992 | | | | 3,039,396 | |
Mountain Hawk III CLO Ltd. | | | | | | | | |
2014-3A, 3.02% (3 Month USD LIBOR + 2.80%, Rate Floor: 0.00%) due 04/18/255,8 | | | 3,000,000 | | | | 2,996,707 | |
42 | THE GUGGENHEIM FUNDS SEMI-ANNUAL REPORT | SEE NOTES TO CONSOLIDATED FINANCIAL STATEMENTS. |
CONSOLIDATED SCHEDULE OF INVESTMENTS (Unaudited)(continued) | March 31, 2021 |
MACRO OPPORTUNITIES FUND | |
| | Face
Amount~ | | | Value | |
KVK CLO Ltd. | | | | | | | | |
2013-1A, due 01/14/285,12 | | | 11,900,000 | | | $ | 2,878,943 | |
AMMC CLO XI Ltd. | | | | | | | | |
2012-11A, due 04/30/315,12 | | | 5,650,000 | | | | 2,483,147 | |
Denali Capital CLO XI Ltd. | | | | | | | | |
2018-1A, 2.37% (3 Month USD LIBOR + 2.15%, Rate Floor: 0.00%) due 10/20/285,8 | | | 2,500,000 | | | | 2,481,950 | |
Exantas Capital Corporation Ltd. | | | | | | | | |
2019-RSO7, 1.61% (1 Month USD LIBOR + 1.50%, Rate Floor: 1.50%) due 04/15/365,8 | | | 1,500,000 | | | | 1,505,706 | |
KKR CLO 19 Ltd. | | | | | | | | |
2017-19, 1.99% (3 Month USD LIBOR + 1.75%, Rate Floor: 0.00%) due 10/15/305,8 | | | 1,350,000 | | | | 1,333,169 | |
Babson CLO Ltd. | | | | | | | | |
2014-IA, due 07/20/255,12 | | | 11,900,000 | | | | 1,148,350 | |
Dryden Senior Loan Fund | | | | | | | | |
due 01/15/3112 | | | 1,897,598 | | | | 945,167 | |
Great Lakes CLO Ltd. | | | | | | | | |
2014-1A, due 10/15/295,12 | | | 1,500,000 | | | | 657,213 | |
Copper River CLO Ltd. | | | | | | | | |
2007-1A, due 01/20/217,12 | | | 8,150,000 | | | | 240,099 | |
TICP CLO III-2 Ltd. | | | | | | | | |
2018-3R, 1.06% (3 Month USD LIBOR + 0.84%, Rate Floor: 0.84%) due 04/20/285,8 | | | 218,855 | | | | 218,948 | |
West CLO Ltd. | | | | | | | | |
2013-1A, due 11/07/255,12 | | | 5,300,000 | | | | 192,390 | |
Halcyon Loan Advisors Funding Ltd. | | | | | | | | |
2012-1A, 3.19% (3 Month USD LIBOR + 3.00%, Rate Floor: 0.00%) due 08/15/235,8 | | | 60,420 | | | | 60,475 | |
OHA Credit Partners IX Ltd. | | | | | | | | |
2013-9A, due 10/20/255,12 | | | 4,219,178 | | | | 4,894 | |
Total Collateralized Loan Obligations | | | 650,326,226 | |
| | | | | | | | | |
Transport-Aircraft - 4.3% |
Castlelake Aircraft Securitization Trust | | | | | | | | |
2018-1, 4.13% due 06/15/435 | | | 22,253,906 | | | | 22,298,690 | |
2017-1, 3.97% due 07/15/42 | | | 21,220,977 | | | | 21,234,575 | |
2016-1, 4.45% due 08/15/41 | | | 9,057,599 | | | | 9,064,163 | |
2019-1A, 3.97% due 04/15/395 | | | 7,531,795 | | | | 7,515,787 | |
KDAC Aviation Finance Ltd. | | | | | | | | |
2017-1A, 4.21% due 12/15/425 | | | 49,823,614 | | | | 48,210,226 | |
Falcon Aerospace Ltd. | | | | | | | | |
2017-1, 4.58% due 02/15/425 | | | 22,695,461 | | | | 22,915,671 | |
2019-1, 3.60% due 09/15/395 | | | 7,159,894 | | | | 7,216,254 | |
2017-1, 6.30% due 02/15/425 | | | 5,395,449 | | | | 5,247,789 | |
AASET Trust | | | | | | | | |
2017-1A, 3.97% due 05/16/425 | | | 27,582,741 | | | | 27,635,689 | |
2020-1A, 4.34% due 01/16/405 | | | 6,611,667 | | | | 6,220,755 | |
SEE NOTES TO CONSOLIDATED FINANCIAL STATEMENTS. | THE GUGGENHEIM FUNDS SEMI-ANNUAL REPORT | 43 |
CONSOLIDATED SCHEDULE OF INVESTMENTS (Unaudited)(continued) | March 31, 2021 |
MACRO OPPORTUNITIES FUND | |
| | Face
Amount~ | | | Value | |
Raspro Trust | | | | | | | | |
2005-1A, 1.15% (3 Month USD LIBOR + 0.93%, Rate Floor: 0.93%) due 03/23/245,8 | | | 26,934,410 | | | $ | 26,723,272 | |
Sapphire Aviation Finance I Ltd. | | | | | | | | |
2018-1A, 4.25% due 03/15/405 | | | 22,242,551 | | | | 22,129,868 | |
AASET US Ltd. | | | | | | | | |
2018-2A, 4.45% due 11/18/385 | | | 19,110,530 | | | | 19,264,696 | |
Sapphire Aviation Finance II Ltd. | | | | | | | | |
2020-1A, 4.34% due 03/15/405 | | | 9,117,555 | | | | 8,237,377 | |
2020-1A, 3.23% due 03/15/405 | | | 665,932 | | | | 660,670 | |
JOL Air Ltd. | | | | | | | | |
2019-1, 3.97% due 04/15/445 | | | 6,948,195 | | | | 6,990,223 | |
MAPS Ltd. | | | | | | | | |
2018-1A, 4.21% due 05/15/435 | | | 6,166,796 | | | | 6,224,764 | |
GAIA Aviation Ltd. | | | | | | | | |
2019-1, 3.97% due 12/15/445,13 | | | 4,391,727 | | | | 4,379,687 | |
WAVE LLC | | | | | | | | |
2019-1, 3.60% due 09/15/445 | | | 4,142,411 | | | | 4,143,369 | |
Castlelake Aircraft Structured Trust | | | | | | | | |
2021-1A, 6.66% due 01/15/465 | | | 3,158,451 | | | | 3,248,883 | |
Stripes Aircraft Ltd. | | | | | | | | |
2013-1 A1, 3.61% due 03/20/23††† | | | 3,037,079 | | | | 2,993,114 | |
Turbine Engines Securitization Ltd. | | | | | | | | |
2013-1A, 5.13% due 12/13/487 | | | 1,943,752 | | | | 1,555,001 | |
2013-1A, 6.38% due 12/13/487 | | | 1,467,369 | | | | 1,013,301 | |
Airplanes Pass Through Trust | | | | | | | | |
2001-1A, due 03/15/19†††,7,10 | | | 2,097,481 | | | | 210 | |
Total Transport-Aircraft | | | 285,124,034 | |
| | | | | | | | | |
Financial - 1.2% |
HV Eight LLC | | | | | | | | |
2.75% (3 Month EURIBOR + 2.75%, Rate Floor: 2.75%) due 12/28/258 | | | EUR 28,000,000 | | | | 32,833,021 | |
Aesf Vi Verdi LP | | | | | | | | |
2.15% due 11/25/24††† | | | EUR 20,994,666 | | | | 24,611,815 | |
Nassau LLC | | | | | | | | |
2019-1, 3.98% due 08/15/345 | | | 16,889,389 | | | | 17,113,183 | |
Ceamer Finance LLC | | | | | | | | |
3.69% due 03/22/31 | | | 6,000,000 | | | | 5,880,000 | |
Station Place Securitization Trust Series | | | | | | | | |
2020-WL1, 3.36% (1 Month USD LIBOR + 3.25%, Rate Floor: 0.00%) due 06/25/51†††,7,8 | | | 2,600,000 | | | | 2,600,000 | |
Total Financial | | | 83,038,019 | |
| | | | | | | | | |
Whole Business - 0.8% |
TSGE | | | | | | | | |
2017-1, 6.25% due 09/25/31††† | | | 42,550,000 | | | | 44,384,520 | |
Applebee’s Funding LLC / IHOP Funding LLC | | | | | | | | |
2019-1A, 4.72% due 06/07/495 | | | 4,527,250 | | | | 4,762,486 | |
2019-1A, 4.19% due 06/07/495 | | | 2,089,500 | | | | 2,145,708 | |
Taco Bell Funding LLC | | | | | | | | |
2016-1A, 4.97% due 05/25/465 | | | 2,719,063 | | | | 2,946,376 | |
44 | THE GUGGENHEIM FUNDS SEMI-ANNUAL REPORT | SEE NOTES TO CONSOLIDATED FINANCIAL STATEMENTS. |
CONSOLIDATED SCHEDULE OF INVESTMENTS (Unaudited)(continued) | March 31, 2021 |
MACRO OPPORTUNITIES FUND | |
| | Face
Amount~ | | | Value | |
Wendy’s Funding LLC | | | | | | | | |
2018-1A, 3.88% due 03/15/485 | | | 387,000 | | | $ | 407,863 | |
2015-1A, 4.50% due 06/15/455 | | | 47,250 | | | | 47,563 | |
Drug Royalty III Limited Partnership 1 | | | | | | | | |
2017-1A, 2.74% (3 Month USD LIBOR + 2.50%, Rate Floor: 2.50%) due 04/15/275,8 | | | 357,091 | | | | 357,088 | |
Total Whole Business | | | 55,051,604 | |
| | | | | | | | | |
Infrastructure - 0.6% |
VB-S1 Issuer LLC | | | | | | | | |
2020-1A, 6.66% due 06/15/505 | | | 23,700,000 | | | | 25,519,164 | |
2020-1A, 4.09% due 06/15/505 | | | 5,183,000 | | | | 5,401,879 | |
Secured Tenant Site Contract Revenue Notes Series | | | | | | | | |
2018-1A, 4.70% due 06/15/487 | | | 6,793,748 | | | | 6,999,198 | |
Total Infrastructure | | | 37,920,241 | |
| | | | | | | | | |
Collateralized Debt Obligations - 0.4% |
Anchorage Credit Funding 3 Ltd. | | | | | | | | |
2021-3A, 3.47% due 01/28/395 | | | 14,250,000 | | | | 14,125,937 | |
Anchorage Credit Funding 4 Ltd. | | | | | | | | |
2021-4A, 3.12% due 04/27/395 | | | 9,200,000 | | | | 9,118,318 | |
2021-4A, 3.52% due 04/27/395 | | | 4,250,000 | | | | 4,207,428 | |
Putnam Structured Product Funding Ltd. | | | | | | | | |
2003-1A, 1.18% (1 Month USD LIBOR + 1.00%, Rate Floor: 0.00%) due 10/15/387,8 | | | 1,064,313 | | | | 1,059,215 | |
Total Collateralized Debt Obligations | | | 28,510,898 | |
| | | | | | | | | |
Diversified Payment Rights - 0.2% |
Bib Merchant Voucher Receivables Ltd. | | | | | | | | |
4.18% due 04/07/28††† | | | 15,300,000 | | | | 16,354,218 | |
| | | | | | | | | |
Net Lease - 0.2% |
CARS-DB4, LP | | | | | | | | |
2020-1A, 4.95% due 02/15/505 | | | 10,550,000 | | | | 10,434,281 | |
| | | | | | | | | |
Insurance - 0.0% |
J.G. Wentworth XLI LLC | | | | | | | | |
2018-1A, 4.70% due 10/15/745 | | | 400,000 | | | | 410,683 | |
Total Asset-Backed Securities |
(Cost $1,152,706,713) | | | 1,167,170,204 | |
| |
COLLATERALIZED MORTGAGE OBLIGATIONS†† - 8.3% |
Residential Mortgage Backed Securities - 7.3% |
JP Morgan Mortgage Acquisition Trust | | | | | | | | |
2006-WMC4, 0.26% (1 Month USD LIBOR + 0.15%, Rate Floor: 0.15%) due 12/25/368 | | | 25,026,559 | | | | 16,151,288 | |
2006-WMC3, 0.26% (1 Month USD LIBOR + 0.15%, Rate Floor: 0.15%) due 08/25/368 | | | 10,854,760 | | | | 8,529,229 | |
2006-HE3, 0.27% (1 Month USD LIBOR + 0.16%, Rate Floor: 0.16%) due 11/25/368 | | | 6,879,153 | | | | 6,328,936 | |
2006-WMC4, 0.23% (1 Month USD LIBOR + 0.12%, Rate Floor: 0.12%) due 12/25/368 | | | 8,614,362 | | | | 5,534,613 | |
2006-WMC4, 0.19% (1 Month USD LIBOR + 0.08%, Rate Floor: 0.08%) due 12/25/368 | | | 3,642,454 | | | | 2,326,245 | |
SEE NOTES TO CONSOLIDATED FINANCIAL STATEMENTS. | THE GUGGENHEIM FUNDS SEMI-ANNUAL REPORT | 45 |
CONSOLIDATED SCHEDULE OF INVESTMENTS (Unaudited)(continued) | March 31, 2021 |
MACRO OPPORTUNITIES FUND | |
| | Face
Amount~ | | | Value | |
Lehman XS Trust Series | | | | | | | | |
2006-16N, 0.32% (1 Month USD LIBOR + 0.21%, Rate Floor: 0.21%) due 11/25/468 | | | 17,751,602 | | | $ | 17,659,951 | |
2006-18N, 0.29% (1 Month USD LIBOR + 0.18%, Rate Floor: 0.18%) due 12/25/368 | | | 13,949,003 | | | | 14,334,805 | |
2006-10N, 0.53% (1 Month USD LIBOR + 0.42%, Rate Floor: 0.42%) due 07/25/468 | | | 3,702,581 | | | | 3,752,123 | |
RALI Series Trust | | | | | | | | |
2006-QO6, 0.47% (1 Month USD LIBOR + 0.36%, Rate Floor: 0.36%) due 06/25/468 | | | 33,518,432 | | | | 11,245,759 | |
2007-QO2, 0.26% (1 Month USD LIBOR + 0.15%, Rate Floor: 0.15%) due 02/25/478 | | | 15,635,221 | | | | 8,226,054 | |
2006-QO8, 0.51% (1 Month USD LIBOR + 0.40%, Rate Floor: 0.40%) due 10/25/468 | | | 6,040,061 | | | | 5,891,798 | |
2006-QO6, 0.57% (1 Month USD LIBOR + 0.46%, Rate Floor: 0.46%) due 06/25/468 | | | 8,721,039 | | | | 2,978,392 | |
2006-QO2, 0.65% (1 Month USD LIBOR + 0.54%, Rate Floor: 0.54%) due 02/25/468 | | | 6,565,645 | | | | 2,091,953 | |
2006-QO6, 0.63% (1 Month USD LIBOR + 0.52%, Rate Floor: 0.52%) due 06/25/468 | | | 5,502,233 | | | | 1,904,706 | |
2006-QO2, 0.79% (1 Month USD LIBOR + 0.68%, Rate Floor: 0.68%) due 02/25/468 | | | 3,513,177 | | | | 1,164,342 | |
2006-QO2, 0.55% (1 Month USD LIBOR + 0.44%, Rate Floor: 0.44%) due 02/25/468 | | | 235,489 | | | | 72,175 | |
WaMu Asset-Backed Certificates WaMu Series | | | | | | | | |
2007-HE2, 0.47% (1 Month USD LIBOR + 0.36%, Rate Floor: 0.36%) due 04/25/378 | | | 26,792,184 | | | | 13,529,086 | |
2007-HE2, 0.30% (1 Month USD LIBOR + 0.19%, Rate Floor: 0.19%) due 04/25/378 | | | 20,415,407 | | | | 10,108,750 | |
2007-HE4, 0.28% (1 Month USD LIBOR + 0.17%, Rate Floor: 0.17%) due 07/25/478 | | | 7,853,270 | | | | 6,580,830 | |
2007-HE4, 0.36% (1 Month USD LIBOR + 0.25%, Rate Floor: 0.25%) due 07/25/478 | | | 2,496,103 | | | | 1,884,246 | |
Long Beach Mortgage Loan Trust | | | | | | | | |
2006-6, 0.36% (1 Month USD LIBOR + 0.25%, Rate Floor: 0.25%) due 07/25/368 | | | 15,548,412 | | | | 8,213,699 | |
46 | THE GUGGENHEIM FUNDS SEMI-ANNUAL REPORT | SEE NOTES TO CONSOLIDATED FINANCIAL STATEMENTS. |
CONSOLIDATED SCHEDULE OF INVESTMENTS (Unaudited)(continued) | March 31, 2021 |
MACRO OPPORTUNITIES FUND | |
| | Face
Amount~ | | | Value | |
2006-8, 0.27% (1 Month USD LIBOR + 0.16%, Rate Floor: 0.16%) due 09/25/368 | | | 18,552,114 | | | $ | 7,301,160 | |
2006-4, 0.43% (1 Month USD LIBOR + 0.32%, Rate Floor: 0.32%) due 05/25/368 | | | 11,340,689 | | | | 4,939,896 | |
2006-1, 0.49% (1 Month USD LIBOR + 0.38%, Rate Floor: 0.38%) due 02/25/368 | | | 4,363,663 | | | | 3,891,297 | |
2006-6, 0.26% (1 Month USD LIBOR + 0.15%, Rate Floor: 0.15%) due 07/25/368 | | | 4,841,587 | | | | 2,511,826 | |
2006-8, 0.20% (1 Month USD LIBOR + 0.09%, Rate Floor: 0.09%) due 09/25/368 | | | 5,027,274 | | | | 1,943,980 | |
2006-6, 0.21% (1 Month USD LIBOR + 0.10%, Rate Floor: 0.10%) due 07/25/368 | | | 2,802,692 | | | | 1,440,539 | |
Structured Asset Securities Corporation Mortgage Loan Trust | | | | | | | | |
2008-BC4, 0.74% (1 Month USD LIBOR + 0.63%, Rate Floor: 0.63%) due 11/25/378 | | | 28,841,912 | | | | 28,392,289 | |
FKRT | | | | | | | | |
2020-C2A, 3.25% due 12/30/23†††,7 | | | 26,181,733 | | | | 26,213,150 | |
American Home Mortgage Assets Trust | | | | | | | | |
2006-1, 0.49% (1 Month USD LIBOR + 0.38%, Rate Floor: 0.38%) due 05/25/468 | | | 10,154,572 | | | | 9,713,617 | |
2006-6, 0.32% (1 Month USD LIBOR + 0.21%, Rate Floor: 0.21%) due 12/25/468 | | | 11,128,179 | | | | 9,519,903 | |
2006-3, 1.20% (1 Year CMT Rate + 0.94%, Rate Floor: 0.94%) due 10/25/468 | | | 6,392,158 | | | | 5,271,973 | |
Ameriquest Mortgage Securities Trust | | | | | | | | |
2006-M3, 0.28% (1 Month USD LIBOR + 0.18%, Rate Floor: 0.18%) due 10/25/368 | | | 23,443,274 | | | | 15,765,276 | |
2006-M3, 0.21% (1 Month USD LIBOR + 0.10%, Rate Floor: 0.10%) due 10/25/368 | | | 14,995,456 | | | | 6,341,938 | |
2006-M3, 0.35% (1 Month USD LIBOR + 0.24%, Rate Floor: 0.24%) due 10/25/368 | | | 3,591,196 | | | | 1,542,386 | |
CIM Trust | | | | | | | | |
2018-R2, 3.69% (WAC) due 08/25/575,8 | | | 22,886,697 | | | | 22,926,133 | |
SEE NOTES TO CONSOLIDATED FINANCIAL STATEMENTS. | THE GUGGENHEIM FUNDS SEMI-ANNUAL REPORT | 47 |
CONSOLIDATED SCHEDULE OF INVESTMENTS (Unaudited)(continued) | March 31, 2021 |
MACRO OPPORTUNITIES FUND | |
| | Face
Amount~ | | | Value | |
Morgan Stanley IXIS Real Estate Capital Trust | | | | | | | | |
2006-2, 0.33% (1 Month USD LIBOR + 0.22%, Rate Floor: 0.22%) due 11/25/368 | | | 24,461,233 | | | $ | 11,336,546 | |
2006-2, 0.26% (1 Month USD LIBOR + 0.15%, Rate Floor: 0.15%) due 11/25/368 | | | 18,660,860 | | | | 8,570,618 | |
Morgan Stanley ABS Capital I Incorporated Trust | | | | | | | | |
2006-HE8, 0.33% (1 Month USD LIBOR + 0.22%, Rate Floor: 0.22%) due 10/25/368 | | | 22,693,635 | | | | 13,294,950 | |
2006-HE6, 0.21% (1 Month USD LIBOR + 0.10%, Rate Floor: 0.10%) due 09/25/368 | | | 4,782,354 | | | | 2,268,827 | |
2007-HE4, 0.34% (1 Month USD LIBOR + 0.23%, Rate Floor: 0.23%) due 02/25/378 | | | 4,175,447 | | | | 1,770,424 | |
IXIS Real Estate Capital Trust | | | | | | | | |
2007-HE1, 0.27% (1 Month USD LIBOR + 0.16%, Rate Floor: 0.16%) due 05/25/378 | | | 25,654,200 | | | | 8,821,448 | |
2007-HE1, 0.34% (1 Month USD LIBOR + 0.23%, Rate Floor: 0.23%) due 05/25/378 | | | 18,175,640 | | | | 6,316,980 | |
GSAMP Trust | | | | | | | | |
2007-NC1, 0.24% (1 Month USD LIBOR + 0.13%, Rate Floor: 0.13%) due 12/25/468 | | | 22,015,637 | | | | 14,648,463 | |
GSAA Home Equity Trust | | | | | | | | |
2006-3, 0.71% (1 Month USD LIBOR + 0.60%, Rate Floor: 0.60%) due 03/25/368 | | | 13,263,695 | | | | 8,987,542 | |
2006-9, 0.59% (1 Month USD LIBOR + 0.48%, Rate Floor: 0.48%) due 06/25/368 | | | 8,772,930 | | | | 3,764,723 | |
2007-7, 0.65% (1 Month USD LIBOR + 0.54%, Rate Floor: 0.54%) due 07/25/378 | | | 955,317 | | | | 941,154 | |
Master Asset Backed Securities Trust | | | | | | | | |
2006-WMC3, 0.27% (1 Month USD LIBOR + 0.16%, Rate Floor: 0.16%) due 08/25/368 | | | 11,558,435 | | | | 5,348,415 | |
2006-HE3, 0.31% (1 Month USD LIBOR + 0.20%, Rate Floor: 0.20%) due 08/25/368 | | | 10,330,354 | | | | 4,185,386 | |
2006-HE3, 0.41% (1 Month USD LIBOR + 0.30%, Rate Floor: 0.30%) due 08/25/368 | | | 8,685,361 | | | | 3,555,352 | |
48 | THE GUGGENHEIM FUNDS SEMI-ANNUAL REPORT | SEE NOTES TO CONSOLIDATED FINANCIAL STATEMENTS. |
CONSOLIDATED SCHEDULE OF INVESTMENTS (Unaudited)(continued) | March 31, 2021 |
MACRO OPPORTUNITIES FUND | |
| | Face
Amount~ | | | Value | |
Citigroup Mortgage Loan Trust, Inc. | | | | | | | | |
2007-AMC3, 0.36% (1 Month USD LIBOR + 0.25%, Rate Floor: 0.25%) due 03/25/378 | | | 13,215,850 | | | $ | 12,129,080 | |
Nationstar Home Equity Loan Trust | | | | | | | | |
2007-C, 0.28% (1 Month USD LIBOR + 0.18%, Rate Floor: 0.18%) due 06/25/378 | | | 11,170,569 | | | | 10,864,128 | |
Home Equity Loan Trust | | | | | | | | |
2007-FRE1, 0.30% (1 Month USD LIBOR + 0.19%, Rate Floor: 0.19%) due 04/25/378 | | | 10,082,956 | | | | 9,501,244 | |
First NLC Trust | | | | | | | | |
2007-1, 0.39% (1 Month USD LIBOR + 0.28%, Rate Floor: 0.28%) due 08/25/375,8 | | | 7,809,050 | | | | 5,076,340 | |
2007-1, 0.18% (1 Month USD LIBOR + 0.07%, Rate Floor: 0.07%) due 08/25/375,8 | | | 5,921,853 | | | | 3,748,706 | |
Alternative Loan Trust | | | | | | | | |
2007-OA7, 0.29% (1 Month USD LIBOR + 0.18%, Rate Floor: 0.18%) due 05/25/478 | | | 9,248,111 | | | | 8,804,964 | |
Argent Securities Trust | | | | | | | | |
2006-W5, 0.41% (1 Month USD LIBOR + 0.30%, Rate Floor: 0.30%) due 06/25/368 | | | 10,949,708 | | | | 8,463,022 | |
WaMu Asset-Backed Certificates WaMu Series Trust | | | | | | | | |
2007-HE1, 0.34% (1 Month USD LIBOR + 0.23%, Rate Floor: 0.23%) due 01/25/378 | | | 8,762,821 | | | | 5,580,993 | |
2007-HE4, 0.28% (1 Month USD LIBOR + 0.17%, Rate Floor: 0.17%) due 07/25/478 | | | 3,495,943 | | | | 2,616,534 | |
ACE Securities Corporation Home Equity Loan Trust Series | | | | | | | | |
2007-ASP1, 0.49% (1 Month USD LIBOR + 0.38%, Rate Floor: 0.38%) due 03/25/378 | | | 12,522,451 | | | | 7,498,724 | |
HSI Asset Securitization Corporation Trust | | | | | | | | |
2007-HE1, 0.30% (1 Month USD LIBOR + 0.19%, Rate Floor: 0.19%) due 01/25/378 | | | 7,176,512 | | | | 6,087,028 | |
Washington Mutual Mortgage Pass-Through Certificates WMALT Series Trust | | | | | | | | |
2006-AR9, 1.10% (1 Year CMT Rate + 0.84%, Rate Floor: 0.84%) due 11/25/468 | | | 5,124,780 | | | | 4,402,189 | |
SEE NOTES TO CONSOLIDATED FINANCIAL STATEMENTS. | THE GUGGENHEIM FUNDS SEMI-ANNUAL REPORT | 49 |
CONSOLIDATED SCHEDULE OF INVESTMENTS (Unaudited)(continued) | March 31, 2021 |
MACRO OPPORTUNITIES FUND | |
| | Face
Amount~ | | | Value | |
Morgan Stanley Mortgage Loan Trust | | | | | | | | |
2006-9AR, 0.41% (1 Month USD LIBOR + 0.30%, Rate Floor: 0.30%) due 08/25/368 | | | 9,713,599 | | | $ | 3,966,253 | |
Nomura Resecuritization Trust | | | | | | | | |
2015-4R, 1.81% (1 Month USD LIBOR + 0.43%, Rate Floor: 0.43%) due 03/26/365,8 | | | 3,025,614 | | | | 3,011,112 | |
Alliance Bancorp Trust | | | | | | | | |
2007-OA1, 0.35% (1 Month USD LIBOR + 0.24%, Rate Floor: 0.24%) due 07/25/378 | | | 2,812,283 | | | | 2,611,863 | |
Wachovia Asset Securitization Issuance II LLC Trust | | | | | | | | |
2007-HE1, 0.26% (1 Month USD LIBOR + 0.14%, Rate Floor: 0.14%) due 07/25/375,8 | | | 1,052,880 | | | | 1,004,235 | |
Morgan Stanley Re-REMIC Trust | | | | | | | | |
2010-R5, 1.55% due 06/26/365 | | | 808,134 | | | | 742,903 | |
Asset Backed Securities Corporation Home Equity Loan Trust | | | | | | | | |
2006-HE5, 0.25% (1 Month USD LIBOR + 0.14%, Rate Floor: 0.14%) due 07/25/368 | | | 544,308 | | | | 535,311 | |
Total Residential Mortgage Backed Securities | | | 486,679,800 | |
| | | | | | | | | |
Commercial Mortgage Backed Securities - 0.5% |
GS Mortgage Securities Corporation Trust | | | | | | | | |
2017-STAY, 2.51% (1 Month USD LIBOR + 2.40%, Rate Floor: 2.15%) due 07/15/325,8 | | | 16,531,000 | | | | 16,488,582 | |
2020-UPTN, 3.25% (WAC) due 02/10/375,8 | | | 8,256,000 | | | | 7,788,606 | |
2020-DUNE, 2.61% (1 Month USD LIBOR + 2.50%, Rate Floor: 2.50%) due 12/15/365,8 | | | 7,340,000 | | | | 6,846,541 | |
2020-DUNE, 2.01% (1 Month USD LIBOR + 1.90%, Rate Floor: 1.90%) due 12/15/365,8 | | | 2,750,000 | | | | 2,600,092 | |
BX Commercial Mortgage Trust | | | | | | | | |
2019-XL, 2.41% (1 Month USD LIBOR + 2.30%, Rate Floor: 2.30%) due 10/15/365,8 | | | 2,200,796 | | | | 2,199,290 | |
Wells Fargo Commercial Mortgage Trust | | | | | | | | |
2015-NXS1, 2.63% due 05/15/48 | | | 1,019,831 | | | | 1,019,484 | |
Total Commercial Mortgage Backed Securities | | | 36,942,595 | |
| | | | | | | | | |
Military Housing - 0.5% |
Freddie Mac Military Housing Bonds Resecuritization Trust Certificates | | | | | | | | |
2015-R1, 0.65% (WAC) due 11/25/525,8,14 | | | 162,469,970 | | | | 9,141,324 | |
50 | THE GUGGENHEIM FUNDS SEMI-ANNUAL REPORT | SEE NOTES TO CONSOLIDATED FINANCIAL STATEMENTS. |
CONSOLIDATED SCHEDULE OF INVESTMENTS (Unaudited)(continued) | March 31, 2021 |
MACRO OPPORTUNITIES FUND | |
| | Face
Amount~ | | | Value | |
2015-R1, 0.52% (WAC) due 11/25/555,8,14 | | | 66,210,064 | | | $ | 4,327,351 | |
GMAC Commercial Mortgage Asset Corp. | | | | | | | | |
2004-POKA, 6.36% due 09/10/44†††,5 | | | 9,000,000 | | | | 11,058,983 | |
Capmark Military Housing Trust | | | | | | | | |
2007-AET2, 6.06% due 10/10/525 | | | 5,626,602 | | | | 5,805,641 | |
Total Military Housing | | | 30,333,299 | |
| | | | | | | | | |
Total Collateralized Mortgage Obligations |
(Cost $594,217,449) | | | 553,955,694 | |
| | | | | | | | | |
U.S. TREASURY BILLS†† - 0.3% |
U.S. Treasury Bills |
0.02% due 06/03/219,15 | | | 15,050,000 | | | | 15,049,539 | |
0.04% due 06/03/219,15 | | | 2,700,000 | | | | 2,699,917 | |
Total U.S. Treasury Bills |
(Cost $17,749,208) | | | | | | | 17,749,456 | |
| | | | | | | | | |
SENIOR FIXED RATE INTERESTS†† - 0.1% |
Consumer, Cyclical - 0.1% |
WESCO | | | | | | | | |
5.25% due 06/14/24††† | | | CAD 3,920,000 | | | | 3,111,695 | |
Belk, Inc. | | | | | | | | |
13.00% (in-kind rate was 8.00%) due 07/31/2511 | | | 1,908,043 | | | | 1,221,147 | |
Total Consumer, Cyclical | | | 4,332,842 | |
| |
Total Senior Fixed Rate Interests |
(Cost $4,902,411) | | | 4,332,842 | |
| | Notional
Value | | | | |
OTC OPTIONS PURCHASED†† - 0.4% |
Call options on: | | | | | | | | |
Morgan Stanley Capital Services LLC 2Y-10 CMS CAP Expiring July 2022 with strike price of $0.40 | | | 1,424,100,000 | | | | 13,215,648 | |
Bank of America, N.A. 2Y-10 CMS CAP Expiring July 2022 with strike price of $0.40 | | | 709,900,000 | | | | 6,587,872 | |
Goldman Sachs International 2Y-10 CMS CAP Expiring July 2022 with strike price of $0.61 | | | 661,700,000 | | | | 4,883,346 | |
Goldman Sachs International 2Y-10 CMS CAP Expiring July 2022 with strike price of $0.40 | | | 126,600,000 | | | | 1,174,848 | |
Bank of America, N.A. 2Y-10 CMS CAP Expiring July 2022 with strike price of $0.61 | | | 82,200,000 | | | | 606,636 | |
Total OTC Options Purchased |
(Cost $6,442,615) | | | | | | | 26,468,350 | |
| | | | | | | | | |
Total Investments - 105.3% |
(Cost $6,873,257,641) | | $ | 7,016,838,284 | |
SEE NOTES TO CONSOLIDATED FINANCIAL STATEMENTS. | THE GUGGENHEIM FUNDS SEMI-ANNUAL REPORT | 51 |
CONSOLIDATED SCHEDULE OF INVESTMENTS (Unaudited)(continued) | March 31, 2021 |
MACRO OPPORTUNITIES FUND | |
| |
Contracts
| | | Value | |
OTC OPTIONS WRITTEN† - 0.0% |
Call options on: | | | | | | | | |
Citibank, N.A. Pershing Square Tontine Holdings Ltd. Expiring June 2021 with strike price of $35.00 (Notional Value $2,401) | | | 1 | | | $ | (80 | ) |
Citibank, N.A. Pershing Square Tontine Holdings Ltd. Expiring December 2021 with strike price of $35.00 (Notional Value $36,015) | | | 15 | | | | (4,162 | ) |
Citibank, N.A. Pershing Square Tontine Holdings Ltd. Expiring December 2021 with strike price of $30.00 (Notional Value $436,982) | | | 182 | | | | (60,970 | ) |
Citibank, N.A. Pershing Square Tontine Holdings Ltd. Expiring December 2021 with strike price of $40.00 (Notional Value $657,874) | | | 274 | | | | (64,390 | ) |
Total OTC Options Written |
(Premiums received $283,563) | | | | | | | (129,602 | ) |
Other Assets & Liabilities, net - (5.3)% | | | (354,529,302 | ) |
Total Net Assets - 100.0% | | $ | 6,662,179,380 | |
Futures Contracts |
Description | | Number of
Contracts | | | Expiration
Date | | | Notional
Amount | | | Value and
Unrealized
Appreciation** | |
Commodity Futures Contracts Purchased† |
Gold 100 oz. Futures Contracts | | | 239 | | | | Jun 2021 | | | $ | 40,840,320 | | | $ | 599,750 | |
Commodity Futures Contracts Sold Short† |
WTI Crude Futures Contracts | | | 909 | | | | Apr 2021 | | | | 53,921,880 | | | | 5,033,751 | |
52 | THE GUGGENHEIM FUNDS SEMI-ANNUAL REPORT | SEE NOTES TO CONSOLIDATED FINANCIAL STATEMENTS. |
CONSOLIDATED SCHEDULE OF INVESTMENTS (Unaudited)(continued) | March 31, 2021 |
MACRO OPPORTUNITIES FUND | |
Centrally Cleared Interest Rate Swap Agreements†† |
| |
Counterparty | Exchange | Floating
Rate Type | Floating
Rate Index | | Fixed
Rate | | | Payment
Frequency | | | Maturity
Date | |
J.P. Morgan Securities LLC | CME | Receive | 3-Month USD LIBOR | | | 1.65 | % | | | Quarterly | | | | 03/17/31 | |
J.P. Morgan Securities LLC | LCH | Pay | Sterling Overnight Interbank Average Rate | | | 0.02 | % | | | At Maturity | | | | 05/06/21 | |
J.P. Morgan Securities LLC | LCH | Pay | Sterling Overnight Interbank Average Rate | | | 0.02 | % | | | At Maturity | | | | 05/06/21 | |
J.P. Morgan Securities LLC | LCH | Pay | Sterling Overnight Interbank Average Rate | | | 0.03 | % | | | At Maturity | | | | 05/06/21 | |
J.P. Morgan Securities LLC | LCH | Pay | 3-Month ILS TELBOR | | | 1.01 | % | | | Quarterly | | | | 01/25/28 | |
J.P. Morgan Securities LLC | LCH | Pay | 3-Month ILS TELBOR | | | 0.92 | % | | | Quarterly | | | | 11/15/27 | |
Counterparty | | Notional
Amount | | | Value | | | Upfront
Premiums
Paid
(Received) | | | Unrealized
Appreciation
(Depreciation)** | |
J.P. Morgan Securities LLC | | $ | 180,000,000 | | | $ | 2,522,322 | | | $ | 1,683 | | | $ | 2,520,639 | |
J.P. Morgan Securities LLC | | | GBP 2,503,488,000 | | | | (85,002 | ) | | | — | | | | (85,002 | ) |
J.P. Morgan Securities LLC | | | GBP 2,558,712,000 | | | | (111,245 | ) | | | 1,080 | | | | (112,325 | ) |
J.P. Morgan Securities LLC | | | GBP 5,006,976,000 | | | | (149,572 | ) | | | — | | | | (149,572 | ) |
J.P. Morgan Securities LLC | | | ILS 156,832,000 | | | | (625,445 | ) | | | 496 | | | | (625,941 | ) |
J.P. Morgan Securities LLC | | | ILS 159,859,000 | | | | (684,551 | ) | | | — | | | | (684,551 | ) |
| | | | | | | $ | 866,507 | | | $ | 3,259 | | | $ | 863,248 | |
Total Return Swap Agreements |
Counterparty | Reference
Obligation | Financing
Rate Pay | Payment
Frequency | | Maturity
Date | | | Units | | | Notional
Amount | | | Value and
Unrealized
Depreciation | |
OTC Equity Index Swap Agreements†† |
BNP Paribas | VanEck Vectors Gold Miners ETF | 0.36% (1 Month USD LIBOR + 0.25%) | Monthly | | | 04/16/21 | | | | 1,053,640 | | | $ | 34,243,300 | | | $ | (8,913,794 | ) |
SEE NOTES TO CONSOLIDATED FINANCIAL STATEMENTS. | THE GUGGENHEIM FUNDS SEMI-ANNUAL REPORT | 53 |
CONSOLIDATED SCHEDULE OF INVESTMENTS (Unaudited)(continued) | March 31, 2021 |
MACRO OPPORTUNITIES FUND | |
Forward Foreign Currency Exchange Contracts†† |
Counterparty | | Contracts
to Sell | | | Currency | | | Settlement
Date | | | Settlement
Value | | | Value at
March 31,
2021 | | | Unrealized
Appreciation
(Depreciation) | |
JPMorgan Chase Bank, N.A. | | | 178,600,000 | | | | BRL | | | | 07/01/21 | | | $ | 42,785,007 | | | $ | 31,556,573 | | | $ | 11,228,434 | |
Citibank, N.A. | | | 122,150,000 | | | | BRL | | | | 07/01/21 | | | | 29,677,306 | | | | 21,582,504 | | | | 8,094,802 | |
Citibank, N.A. | | | 6,320,158,500 | | | | JPY | | | | 07/01/21 | | | | 62,232,010 | | | | 57,127,729 | | | | 5,104,281 | |
Barclays Bank plc | | | 6,018,007,500 | | | | JPY | | | | 07/01/21 | | | | 59,168,297 | | | | 54,396,595 | | | | 4,771,702 | |
Barclays Bank plc | | | 143,090,000 | | | | EUR | | | | 04/16/21 | | | | 171,620,114 | | | | 167,827,081 | | | | 3,793,033 | |
Goldman Sachs International | | | 8,850,000 | | | | BRL | | | | 07/01/21 | | | | 2,073,328 | | | | 1,563,694 | | | | 509,634 | |
Goldman Sachs International | | | 8,973,000 | | | | GBP | | | | 04/16/21 | | | | 12,548,157 | | | | 12,370,038 | | | | 178,119 | |
Bank of America, N.A. | | | 20,947,000 | | | | EUR | | | | 06/30/21 | | | | 24,738,448 | | | | 24,608,480 | | | | 129,968 | |
JPMorgan Chase Bank, N.A. | | | 14,074,000 | | | | EUR | | | | 04/16/21 | | | | 16,625,114 | | | | 16,507,082 | | | | 118,032 | |
Barclays Bank plc | | | 92,228,427 | | | | ILS | | | | 08/01/22 | | | | 27,935,310 | | | | 27,899,121 | | | | 36,189 | |
Citibank, N.A. | | | 1,970,000 | | | | GBP | | | | 04/16/21 | | | | 2,738,205 | | | | 2,715,811 | | | | 22,394 | |
Morgan Stanley Capital Services LLC | | | 205,000 | | | | GBP | | | | 04/16/21 | | | | 283,548 | | | | 282,610 | | | | 938 | |
Citibank, N.A. | | | 305,100 | | | | ILS | | | | 04/26/21 | | | | 91,623 | | | | 91,371 | | | | 252 | |
Citibank, N.A. | | | 4,789,000 | | | | CAD | | | | 04/16/21 | | | | 3,811,655 | | | | 3,811,726 | | | | (71 | ) |
Barclays Bank plc | | | 684,673 | | | | ILS | | | | 08/02/21 | | | | 204,027 | | | | 205,520 | | | | (1,493 | ) |
UBS AG | | | 7,975,000 | | | | GBP | | | | 04/16/21 | | | | 10,992,525 | | | | 10,994,211 | | | | (1,686 | ) |
UBS AG | | | 28,000,000 | | | | EUR | | | | 04/16/21 | | | | 32,814,628 | | | | 32,840,578 | | | | (25,950 | ) |
Bank of America, N.A. | | | 7,363,900 | | | | ILS | | | | 01/31/22 | | | | 2,183,190 | | | | 2,219,673 | | | | (36,483 | ) |
Bank of America, N.A. | | | 79,971,800 | | | | ILS | | | | 04/30/21 | | | | 23,698,472 | | | | 23,950,866 | | | | (252,394 | ) |
Goldman Sachs International | | | 38,713,300 | | | | ILS | | | | 04/30/21 | | | | 11,336,277 | | | | 11,594,300 | | | | (258,023 | ) |
Goldman Sachs International | | | 57,434,200 | | | | ILS | | | | 01/31/22 | | | | 17,016,598 | | | | 17,312,178 | | | | (295,580 | ) |
Goldman Sachs International | | | 32,149,325 | | | | EUR | | | | 07/30/21 | | | | 37,345,460 | | | | 37,794,569 | | | | (449,109 | ) |
JPMorgan Chase Bank, N.A. | | | 29,016,000 | | | | EUR | | | | 07/30/21 | | | | 33,489,397 | | | | 34,111,049 | | | | (621,652 | ) |
Citibank, N.A. | | | 193,819,000 | | | | ILS | | | | 04/30/21 | | | | 56,980,496 | | | | 58,047,123 | | | | (1,066,627 | ) |
| | | | | | | | | | | | | | | | | | | | | | | $ | 30,978,710 | |
Counterparty | | Contracts
to Buy | | | Currency | | | Settlement
Date | | | Settlement
Value | | | Value at
March 31,
2021 | | | Unrealized
Appreciation | |
Goldman Sachs International | | | 312,504,100 | | | | ILS | | | | 04/30/21 | | | $ | 87,609,812 | | | $ | 93,592,288 | | | $ | 5,982,476 | |
Goldman Sachs International | | | 92,228,427 | | | | ILS | | | | 08/01/22 | | | | 24,775,937 | | | | 27,899,121 | | | | 3,123,184 | |
54 | THE GUGGENHEIM FUNDS SEMI-ANNUAL REPORT | SEE NOTES TO CONSOLIDATED FINANCIAL STATEMENTS. |
CONSOLIDATED SCHEDULE OF INVESTMENTS (Unaudited)(continued) | March 31, 2021 |
MACRO OPPORTUNITIES FUND | |
Counterparty | | Contracts
to Buy | | | Currency | | | Settlement
Date | | | Settlement
Value | | | Value at
March 31,
2021 | | | Unrealized
Appreciation
(Depreciation) | |
Goldman Sachs International | | | 64,798,100 | | | | ILS | | | | 01/31/22 | | | $ | 17,651,728 | | | $ | 19,531,852 | | | $ | 1,880,124 | |
Goldman Sachs International | | | 61,165,325 | | | | EUR | | | | 07/30/21 | | | | 70,187,211 | | | | 71,905,618 | | | | 1,718,407 | |
Goldman Sachs International | | | 684,673 | | | | ILS | | | | 08/02/21 | | | | 183,706 | | | | 205,520 | | | | 21,814 | |
JPMorgan Chase Bank, N.A. | | | 186,000 | | | | GBP | | | | 04/16/21 | | | | 254,971 | | | | 256,417 | | | | 1,446 | |
Citibank, N.A. | | | 578,000 | | | | ILS | | | | 04/26/21 | | | | 173,350 | | | | 173,099 | | | | (251 | ) |
UBS AG | | | 3,907,590 | | | | ILS | | | | 04/26/21 | | | | 1,180,998 | | | | 1,170,244 | | | | (10,754 | ) |
Citibank, N.A. | | | 309,600,000 | | | | BRL | | | | 07/01/21 | | | | 59,488,074 | | | | 54,702,770 | | | | (4,785,304 | ) |
JPMorgan Chase Bank, N.A. | | | 12,338,166,000 | | | | JPY | | | | 07/01/21 | | | | 120,472,255 | | | | 111,524,325 | | | | (8,947,930 | ) |
| | | | | | | | | | | | | | | | | | | | | | | $ | (1,016,788 | ) |
~ | The face amount is denominated in U.S. dollars unless otherwise indicated. |
* | Non-income producing security. |
** | Includes cumulative appreciation (depreciation). Variation margin is reported within the Consolidated Statement of Assets and Liabilities. |
† | Value determined based on Level 1 inputs, unless otherwise noted — See Note 4. |
†† | Value determined based on Level 2 inputs, unless otherwise noted — See Note 4. |
††† | Value determined based on Level 3 inputs — See Note 4. |
1 | Affiliated issuer. |
2 | Rate indicated is the 7-day yield as of March 31, 2021. |
3 | Perpetual maturity. |
4 | Security has a fixed rate coupon which will convert to a floating or variable rate coupon on a future date. |
5 | Security is a 144A or Section 4(a)(2) security. These securities have been determined to be liquid under guidelines established by the Board of Trustees. The total market value of 144A or Section 4(a)(2) securities is $2,748,480,314 (cost $2,706,017,002), or 41.3% of total net assets. |
6 | All or a portion of this security has been physically segregated or earmarked in connection with reverse repurchase agreements. At September 30, 2020, the total market value of segregated or earmarked securities was $112,216,626 — See Note 6. |
7 | Security is a 144A or Section 4(a)(2) security. These securities have been determined to be illiquid and restricted under guidelines established by the Board of Trustees. The total market value of 144A or Section 4(a)(2) illiquid and restricted securities is $48,097,920 (cost $60,666,278), or 0.7% of total net assets — See Note 10. |
SEE NOTES TO CONSOLIDATED FINANCIAL STATEMENTS. | THE GUGGENHEIM FUNDS SEMI-ANNUAL REPORT | 55 |
CONSOLIDATED SCHEDULE OF INVESTMENTS (Unaudited)(continued) | March 31, 2021 |
MACRO OPPORTUNITIES FUND | |
8 | Variable rate security. Rate indicated is the rate effective at March 31, 2021. In some instances, the effective rate is limited by a minimum rate floor or a maximum rate cap established by the issuer. The settlement status of a position may also impact the effective rate indicated. In some cases, a position may be unsettled at period end and may not have a stated effective rate. In instances where multiple underlying reference rates and spread amounts are shown, the effective rate is based on a weighted average. |
9 | All or a portion of this security is pledged as interest rate swap collateral at March 31, 2021. |
10 | Security is in default of interest and/or principal obligations. |
11 | Payment-in-kind security. |
12 | Security has no stated coupon. However, it is expected to receive residual cash flow payments on defined deal dates. |
13 | Security is a step up/down bond. The coupon increases or decreases at regular intervals until the bond reaches full maturity. Rate indicated is the rate at March 31, 2021. See table below for additional step information for each security. |
14 | Security is an interest-only strip. |
15 | Rate indicated is the effective yield at the time of purchase. |
| | BRL — Brazilian Real |
| | CAD — Canadian Dollar |
| | CME — Chicago Mercantile Exchange |
| | CMS — Constant Maturity Swap |
| | CMT — Constant Maturity Treasury |
| | EUR — Euro |
| | EURIBOR — European Interbank Offered Rate |
| | GBP — British Pound |
| | ILS — Israeli New Shekel |
| | JPY — Japanese Yen |
| | LCH — London Clearing House |
| | LIBOR — London Interbank Offered Rate |
| | plc — Public Limited Company |
| | PPV — Public-Private Venture |
| | REMIC — Real Estate Mortgage Investment Conduit |
| | SARL — Société à Responsabilité Limitée |
| | TELBOR — Tel Aviv Interbank Offered Rate |
| | WAC — Weighted Average Coupon |
| | |
| | See Sector Classification in Other Information section. |
56 | THE GUGGENHEIM FUNDS SEMI-ANNUAL REPORT | SEE NOTES TO CONSOLIDATED FINANCIAL STATEMENTS. |
CONSOLIDATED SCHEDULE OF INVESTMENTS (Unaudited)(continued) | March 31, 2021 |
MACRO OPPORTUNITIES FUND | |
The following table summarizes the inputs used to value the Fund’s investments at March 31, 2021 (See Note 4 in the Notes to Financial Statements):
Investments in Securities (Assets) | | Level 1
Quoted
Prices | | | Level 2
Significant
Observable
Inputs | | | Level 3
Significant
Unobservable
Inputs | | | Total | |
Common Stocks | | $ | 265,111,692 | | | $ | 7,569,996 | | | $ | 2,732,955 | | | $ | 275,414,643 | |
Preferred Stocks | | | 9,817,080 | | | | 244,436,900 | | | | — | * | | | 254,253,980 | |
Warrants | | | 7,597,346 | | | | — | | | | — | | | | 7,597,346 | |
Mutual Funds | | | 90,890,477 | | | | — | | | | — | | | | 90,890,477 | |
Closed-End Funds | | | 85,814,496 | | | | — | | | | — | | | | 85,814,496 | |
Money Market Fund | | | 216,504,097 | | | | — | | | | — | | | | 216,504,097 | |
Corporate Bonds | | | — | | | | 2,570,244,332 | | | | 101,851,020 | | | | 2,672,095,352 | |
Senior Floating Rate Interests | | | — | | | | 1,419,575,876 | | | | 225,015,471 | | | | 1,644,591,347 | |
Asset-Backed Securities | | | — | | | | 1,049,394,278 | | | | 117,775,926 | | | | 1,167,170,204 | |
Collateralized Mortgage Obligations | | | — | | | | 516,683,561 | | | | 37,272,133 | | | | 553,955,694 | |
U.S. Treasury Bills | | | — | | | | 17,749,456 | | | | — | | | | 17,749,456 | |
Senior Fixed Rate Interests | | | — | | | | 1,221,147 | | | | 3,111,695 | | | | 4,332,842 | |
Options Purchased | | | — | | | | 26,468,350 | | | | — | | | | 26,468,350 | |
Commodity Futures Contracts** | | | 5,633,501 | | | | — | | | | — | | | | 5,633,501 | |
Interest Rate Swap Agreements** | | | — | | | | 2,520,639 | | | | — | | | | 2,520,639 | |
Forward Foreign Currency Exchange Contracts** | | | — | | | | 46,715,229 | | | | — | | | | 46,715,229 | |
Total Assets | | $ | 681,368,689 | | | $ | 5,902,579,764 | | | $ | 487,759,200 | | | $ | 7,071,707,653 | |
Investments in Securities (Liabilities) | | Level 1
Quoted
Prices | | | Level 2
Significant
Observable
Inputs | | | Level 3
Significant
Unobservable
Inputs | | | Total | |
Options Written | | $ | 129,602 | | | $ | — | | | $ | — | | | $ | 129,602 | |
Interest Rate Swap Agreements** | | | — | | | | 1,657,391 | | | | — | | | | 1,657,391 | |
Equity Index Swap Agreements** | | | — | | | | 8,913,794 | | | | — | | | | 8,913,794 | |
Forward Foreign Currency Exchange Contracts** | | | — | | | | 16,753,307 | | | | — | | | | 16,753,307 | |
Unfunded Loan Commitments (Note 9) | | | — | | | | — | | | | 2,222,482 | | | | 2,222,482 | |
Total Liabilities | | $ | 129,602 | | | $ | 27,324,492 | | | $ | 2,222,482 | | | $ | 29,676,576 | |
* | Security has a market value of $0. |
** | This derivative is reported as unrealized appreciation/depreciation at period end. |
The Fund may hold assets and/or liabilities in which the fair value approximates the carrying amount for financial statement purposes. As of the period end, reverse repurchase agreements of $72,259,339 are categorized as Level 2 within the disclosure hierarchy — See Note 6.
SEE NOTES TO CONSOLIDATED FINANCIAL STATEMENTS. | THE GUGGENHEIM FUNDS SEMI-ANNUAL REPORT | 57 |
CONSOLIDATED SCHEDULE OF INVESTMENTS (Unaudited)(continued) | March 31, 2021 |
MACRO OPPORTUNITIES FUND | |
The following is a summary of significant unobservable inputs used in the fair valuation of assets and liabilities categorized within Level 3 of the fair value hierarchy:
Category | | Ending
Balance at
March 31, 2021 | | Valuation
Technique | Unobservable
Inputs | | Input Range | | | Weighted
Average* | |
Assets: | | | | | | | | | | | | | | |
Asset-Backed Securities | | $ | 85,350,553 | | Yield Analysis | Yield | | | 2.2%-4.0% | | | | 3.2% | |
Asset-Backed Securities | | | 32,425,373 | | Option Adjusted Spread off the prior month end broker quote | Broker Quote | | | — | | | | — | |
Collateralized Mortgage Obligations | | | 26,213,150 | | Model Price | Purchase Price | | | — | | | | — | |
Collateralized Mortgage Obligations | | | 11,058,983 | | Option Adjusted Spread off the prior month end broker quote | Broker Quote | | | — | | | | — | |
Common Stocks | | | 1,530,853 | | Third Party Pricing | Broker Quote | | | — | | | | — | |
Common Stocks | | | 1,201,940 | | Enterprise Value | Valuation Multiple | | | 2.9x-15.7x | | | | 6.4x | |
Common Stocks | | | 162 | | Model Price | Liquidation Value | | | — | | | | — | |
Corporate Bonds | | | 64,061,314 | | Option Adjusted Spread off the prior month end broker quote | Broker Quote | | | — | | | | — | |
Corporate Bonds | | | 30,808,586 | | Third Party Pricing | Vendor Price | | | — | | | | — | |
Corporate Bonds | | | 6,981,120 | | Model Price | Purchase Price | | | — | | | | — | |
Senior Fixed Rate Interests | | | 3,111,695 | | Yield Analysis | Yield | | | 5.3% | | | | — | |
Senior Floating Rate Interests | | | 138,634,970 | | Third Party Pricing | Broker Quote | | | — | | | | — | |
Senior Floating Rate Interests | | | 40,044,471 | | Yield Analysis | Yield | | | 4.8%-8.4% | | | | 6.6% | |
Senior Floating Rate Interests | | | 21,621,375 | | Option Adjusted Spread off the prior month end broker quote | Broker Quote | | | — | | | | — | |
Senior Floating Rate Interests | | | 20,793,415 | | Third Party Pricing | Vendor Price | | | — | | | | — | |
Senior Floating Rate Interests | | | 2,339,767 | | Model Price | Market Comparable Yields | | | 6.4% | | | | — | |
Senior Floating Rate Interests | | | 1,165,562 | | Model Price | Liquidation Value | | | — | | | | — | |
Senior Floating Rate Interests | | | 415,911 | | Model Price | Purchase Price | | | — | | | | — | |
Total Assets | | $ | 487,759,200 | | | | | | | | | | | |
58 | THE GUGGENHEIM FUNDS SEMI-ANNUAL REPORT | SEE NOTES TO CONSOLIDATED FINANCIAL STATEMENTS. |
CONSOLIDATED SCHEDULE OF INVESTMENTS (Unaudited)(continued) | March 31, 2021 |
MACRO OPPORTUNITIES FUND | |
Category | | Ending
Balance at
March 31, 2021 | | Valuation
Technique | Unobservable
Inputs | | Input Range | | | Weighted
Average* | |
Liabilities: | | | | | | | | | | | | | | |
Unfunded Loan Commitments | | $ | 2,222,482 | | Model Price | Purchase Price | | | — | | | | — | |
* | Inputs are weighted by the fair value of the instruments. |
Significant changes in a quote, yield, market comparable yields, liquidation value or valuation multiples would generally result in significant changes in the fair value of the security.
The Fund’s fair valuation leveling guidelines classify a single daily broker quote, or a vendor price based on a single daily or monthly broker quote, as Level 3, if such a quote or price cannot be supported with other available market information.
Transfers between Level 2 and Level 3 may occur as markets fluctuate and/or the availability of data used in an investment’s valuation changes. For the period ended March 31, 2021, the Fund had securities with a total value of $118,852,692 transfer into Level 3 from Level 2 due to lack of observable inputs and had securities with a total value of $32,443,976 transfer into Level 2 from Level 3 due to the availability of current and reliable market-based data provided by a third-party pricing service which utilizes significant observable inputs.
Summary of Fair Value Level 3 Activity
Following is a reconciliation of Level 3 assets for which significant unobservable inputs were used to determine fair value for the period ended March 31, 2021:
| | | Assets | |
| | Asset-
Backed
Securities | | | Collateralized
Mortgage
Obligations | | | Corporate
Bonds | | | Senior
Floating Rate
Interests | | | Common
Stocks | |
Beginning Balance | | $ | 136,219,530 | | | $ | 54,252,847 | | | $ | 22,823,465 | | | $ | 74,589,734 | | | $ | 8,060,143 | |
Purchases/(Receipts) | | | — | | | | 26,226,561 | | | | 42,300,000 | | | | 134,758,660 | | | | — | |
(Sales, maturities and paydowns)/Fundings | | | (35,936,392 | ) | | | (41,567,366 | ) | | | (71,634 | ) | | | (28,945,231 | ) | | | (765,169 | ) |
Amortization of premiums/discounts | | | 3,612 | | | | (11,556 | ) | | | 411 | | | | 185,642 | | | | — | |
Total realized gains (losses) included in earnings | | | 677 | | | | (92 | ) | | | — | | | | (11,862,932 | ) | | | (367,642 | ) |
Total change in unrealized appreciation (depreciation) included in earnings | | | 1,126,813 | | | | (1,628,261 | ) | | | (1,894,286 | ) | | | 14,111,516 | | | | 1,649,366 | |
Transfers into Level 3 | | | 26,795,967 | | | | — | | | | 39,754,273 | | | | 49,649,639 | | | | 1,423,013 | |
Transfers out of Level 3 | | | (10,434,281 | ) | | | — | | | | (1,061,209 | ) | | | (7,471,557 | ) | | | (7,266,756 | ) |
Ending Balance | | $ | 117,775,926 | | | $ | 37,272,133 | | | $ | 101,851,020 | | | $ | 225,015,471 | | | $ | 2,732,955 | |
Net change in unrealized appreciation (depreciation) for investments in Level 3 securities still held at March 31, 2021 | | $ | 1,606,179 | | | $ | (1,254,459 | ) | | $ | (1,891,908 | ) | | $ | 129,619 | | | $ | 418,272 | |
SEE NOTES TO CONSOLIDATED FINANCIAL STATEMENTS. | THE GUGGENHEIM FUNDS SEMI-ANNUAL REPORT | 59 |
CONSOLIDATED SCHEDULE OF INVESTMENTS (Unaudited)(continued) | March 31, 2021 |
MACRO OPPORTUNITIES FUND | |
| | | Assets | | | | | | | Liabilities | |
| | Preferred
Stocks | | | Senior
Fixed Rate
Interests | | | Total Assets | | | Unfunded
Loan
Commitments | |
Beginning Balance | | $ | 110,798 | | | $ | 6,285,245 | | | $ | 302,341,762 | | | $ | (1,311,693 | ) |
Purchases/(Receipts) | | | — | | | | 476,625 | | | | 203,761,846 | | | | (2,031,353 | ) |
(Sales, maturities and paydowns)/Fundings | | | — | | | | (1,323,485 | ) | | | (108,609,277 | ) | | | 757,567 | |
Amortization of premiums/discounts | | | — | | | | (249 | ) | | | 177,860 | | | | (15,187 | ) |
Total realized gains (losses) included in earnings | | | — | | | | 139 | | | | (12,229,850 | ) | | | 56,956 | |
Total change in unrealized appreciation (depreciation) included in earnings | | | (110,798 | ) | | | 2,653,793 | | | | 15,908,143 | | | | 321,228 | |
Transfers into Level 3 | | | — | | | | 1,229,800 | | | | 118,852,692 | | | | — | |
Transfers out of Level 3 | | | — | | | | (6,210,173 | ) | | | (32,443,976 | ) | | | — | |
Ending Balance | | $ | — | * | | $ | 3,111,695 | | | $ | 487,759,200 | | | $ | (2,222,482 | ) |
Net change in unrealized appreciation (depreciation) for investments in Level 3 securities still held at March 31, 2021 | | $ | (110,798 | ) | | $ | 175,021 | | | $ | (928,074 | ) | | $ | 392,573 | |
* | Security has a market value of $0. |
Step Coupon Bonds
The following table discloses additional information related to step coupon bonds held by the Fund. Certain securities are subject to multiple rate changes prior to maturity. For those securities, a range of rates and corresponding dates have been provided.
Name | | Coupon Rate at
Next Reset Date | | | Next Rate
Reset Date | |
GAIA Aviation Ltd. 2019-1, 3.97% due 12/15/44 | | | 2.00 | % | | | 11/15/26 | |
60 | THE GUGGENHEIM FUNDS SEMI-ANNUAL REPORT | SEE NOTES TO CONSOLIDATED FINANCIAL STATEMENTS. |
CONSOLIDATED SCHEDULE OF INVESTMENTS (Unaudited)(concluded) | March 31, 2021 |
MACRO OPPORTUNITIES FUND | |
Affiliated Transactions
Investments representing 5% or more of the outstanding voting shares of a company, or control of or by, or common control under Guggenheim Investments (“GI”), result in that company being considered an affiliated issuer, as defined in the 1940 Act.
Transactions during the period ended March 31, 2021, in which the company is an affiliated issuer, were as follows:
Security Name | | Value
09/30/20 | | | Additions | | | Reductions | | | Realized
Gain (Loss) | |
Common Stocks | | | | | | | | | | | | | | | | |
BP Holdco LLC* | | $ | 13,236 | | | $ | — | | | $ | — | | | $ | — | |
Targus Group International Equity, Inc.* | | | 26,242 | | | | — | | | | — | | | | — | |
Mutual Funds | | | | | | | | | | | | | | | | |
Guggenheim Alpha Opportunity Fund — Institutional Class | | | 24,454,689 | | | | 280,945 | | | | — | | | | — | |
Guggenheim Risk Managed Real Estate Fund — Institutional Class | | | 17,551,325 | | | | 40,568,935 | | | | — | | | | — | |
Closed-End Funds | | | | | | | | | | | | | | | | |
Guggenheim Strategic Opportunities Fund | | | 9,279,301 | | | | — | | | | — | | | | — | |
| | | $ | 51,324,793 | | | $ | 40,849,880 | | | $ | — | | | $ | — | |
Security Name | | Change in
Unrealized
Appreciation
(Depreciation) | | | Value
03/31/21 | | | Shares
03/31/21 | | | Investment
Income | | | Capital
Gain
Distributions | |
Common Stocks | | | | | | | | | | | | | | | | | | | | |
BP Holdco LLC* | | $ | — | | | $ | 13,236 | | | | 37,539 | | | $ | — | | | $ | — | |
Targus Group International Equity, Inc.* | | | 1,094 | | | | 27,336 | | | | 12,773 | | | | — | | | | — | |
Mutual Funds | | | | | | | | | | | | | | | | | | | | |
Guggenheim Alpha Opportunity Fund — Institutional Class | | | 2,820,552 | | | | 27,556,186 | | | | 1,003,137 | | | | 280,945 | | | | — | |
Guggenheim Risk Managed Real Estate Fund — Institutional Class | | | 5,214,031 | | | | 63,334,291 | | | | 1,892,836 | | | | 412,835 | | | | 1,006,240 | |
Closed-End Funds | | | | | | | | | | | | | | | | | | | | |
Guggenheim Strategic Opportunities Fund | | | 1,787,320 | | | | 11,066,621 | | | | 527,233 | | | | 576,055 | | | | — | |
| | | $ | 9,822,997 | | | $ | 101,997,670 | | | | | | | $ | 1,269,835 | | | $ | 1,006,240 | |
* | Non-income producing security. |
SEE NOTES TO CONSOLIDATED FINANCIAL STATEMENTS. | THE GUGGENHEIM FUNDS SEMI-ANNUAL REPORT | 61 |
CONSOLIDATED STATEMENT OF ASSETS AND LIABILITIES (Unaudited) |
MACRO OPPORTUNITIES FUND |
March 31, 2021
Assets: |
Investments in unaffiliated issuers, at value (cost $6,780,281,000) | | $ | 6,914,840,614 | |
Investments in affiliated issuers, at value (cost $92,976,641) | | | 101,997,670 | |
Foreign currency, at value (cost $11,442,392) | | | 11,442,392 | |
Cash | | | 3,258,906 | |
Segregated cash with broker | | | 13,896,054 | |
Unamortized upfront premiums paid on interest rate swap agreements | | | 3,259 | |
Unrealized appreciation on forward foreign currency exchange contracts | | | 46,715,229 | |
Prepaid expenses | | | 354,744 | |
Receivables: |
Securities sold | | | 84,935,756 | |
Interest | | | 43,683,361 | |
Fund shares sold | | | 17,179,841 | |
Swap settlement | | | 6,231,710 | |
Variation margin on futures contracts | | | 1,662,990 | |
Dividends | | | 442,000 | |
Variation margin on interest rate swap agreements | | | 214,198 | |
Total assets | | | 7,246,858,724 | |
| | | | | |
Liabilities: |
Unfunded loan commitments, at value (Note 9) (commitment fees received $3,613,312) | | | 2,222,482 | |
Reverse repurchase agreements (Note 6) | | | 72,259,339 | |
Options written, at value (premiums received $283,563) | | | 129,602 | |
Segregated cash due to broker | | | 53,537,604 | |
Unrealized depreciation on OTC swap agreements | | | 8,913,794 | |
Unrealized depreciation on forward foreign currency exchange contracts | | | 16,753,307 | |
Payable for: |
Securities purchased | | | 406,912,762 | |
Fund shares redeemed | | | 15,483,834 | |
Management fees | | | 4,162,360 | |
Distributions to shareholders | | | 3,013,069 | |
Fund accounting/administration fees | | | 371,340 | |
Distribution and service fees | | | 293,918 | |
Transfer agent/maintenance fees | | | 174,926 | |
Trustees’ fees* | | | 79,723 | |
Due to Investment Adviser | | | 63,350 | |
Miscellaneous | | | 307,934 | |
Total liabilities | | | 584,679,344 | |
Net assets | | $ | 6,662,179,380 | |
| | | | | |
* | Relates to Trustees not deemed “interested persons” within the meaning of Section 2(a)(19) of the 1940 Act. |
62 | THE GUGGENHEIM FUNDS SEMI-ANNUAL REPORT | SEE NOTES TO CONSOLIDATED FINANCIAL STATEMENTS. |
CONSOLIDATED STATEMENT OF ASSETS AND LIABILITIES (Unaudited)(concluded) |
MACRO OPPORTUNITIES FUND |
March 31, 2021
Net assets consist of: |
Paid in capital | | $ | 6,723,989,175 | |
Total distributable earnings (loss) | | | (61,809,795 | ) |
Net assets | | $ | 6,662,179,380 | |
| | | | | |
A-Class: |
Net assets | | $ | 389,757,525 | |
Capital shares outstanding | | | 14,318,729 | |
Net asset value per share | | $ | 27.22 | |
Maximum offering price per share (Net asset value divided by 96.00%) | | $ | 28.35 | |
| | | | | |
C-Class: |
Net assets | | $ | 213,634,806 | |
Capital shares outstanding | | | 7,853,640 | |
Net asset value per share | | $ | 27.20 | |
| | | | | |
P-Class: |
Net assets | | $ | 131,236,110 | |
Capital shares outstanding | | | 4,819,406 | |
Net asset value per share | | $ | 27.23 | |
| | | | | |
Institutional Class: |
Net assets | | $ | 5,779,983,769 | |
Capital shares outstanding | | | 212,038,650 | |
Net asset value per share | | $ | 27.26 | |
| | | | | |
R6-Class: |
Net assets | | $ | 147,567,170 | |
Capital shares outstanding | | | 5,415,587 | |
Net asset value per share | | $ | 27.25 | |
SEE NOTES TO CONSOLIDATED FINANCIAL STATEMENTS. | THE GUGGENHEIM FUNDS SEMI-ANNUAL REPORT | 63 |
CONSOLIDATED STATEMENT OF OPERATIONS (Unaudited) |
MACRO OPPORTUNITIES FUND |
Six Months Ended March 31, 2021
Investment Income: |
Dividends from securities of unaffiliated issuers | | $ | 7,760,182 | |
Dividends from securities of affiliated issuers | | | 1,269,835 | |
Interest from securities of unaffiliated issuers | | | 85,812,736 | |
Total investment income | | | 94,842,753 | |
| | | | | |
Expenses: |
Management fees | | | 25,044,944 | |
Distribution and service fees: |
A-Class | | | 429,652 | |
C-Class | | | 1,112,478 | |
P-Class | | | 132,108 | |
Transfer agent/maintenance fees: |
A-Class | | | 101,527 | |
C-Class | | | 77,843 | |
P-Class | | | 46,168 | |
Institutional Class | | | 1,733,166 | |
R6-Class | | | 2,798 | |
Fund accounting/administration fees | | | 1,905,229 | |
Professional fees | | | 396,926 | |
Interest expense | | | 375,147 | |
Line of credit fees | | | 232,546 | |
Short sales interest expense | | | 148,690 | |
Trustees’ fees* | | | 84,145 | |
Custodian fees | | | 76,726 | |
Miscellaneous | | | 118,566 | |
Recoupment of previously waived fees: |
A-Class | | | 175,804 | |
C-Class | | | 96,409 | |
P-Class | | | 40,152 | |
R6-Class | | | 35 | |
Total expenses | | | 32,331,059 | |
Less: |
Expenses reimbursed by Adviser: |
A-Class | | | (4,882 | ) |
P-Class | | | (1,884 | ) |
Institutional Class | | | (1,706,265 | ) |
R6-Class | | | (2,765 | ) |
Expenses waived by Adviser | | | (1,624,162 | ) |
Earnings credits applied | | | (5,361 | ) |
Total waived/reimbursed expenses | | | (3,345,319 | ) |
Net expenses | | | 28,985,740 | |
Net investment income | | | 65,857,013 | |
| | | | | |
* | Relates to Trustees not deemed “interested persons” within the meaning of Section 2(a)(19) of the 1940 Act. |
64 | THE GUGGENHEIM FUNDS SEMI-ANNUAL REPORT | SEE NOTES TO CONSOLIDATED FINANCIAL STATEMENTS. |
CONSOLIDATED STATEMENT OF OPERATIONS (Unaudited)(concluded) |
MACRO OPPORTUNITIES FUND |
Six Months Ended March 31, 2021
Net Realized and Unrealized Gain (Loss): |
Net realized gain (loss) on: |
Investments in unaffiliated issuers | | $ | 60,224,105 | |
Distributions received from affiliated investment companies | | | 1,006,240 | |
Investments sold short | | | 102,131 | |
Swap agreements | | | 67,138,500 | |
Futures contracts | | | (31,440,332 | ) |
Options purchased | | | 11,427,910 | |
Forward foreign currency exchange contracts | | | 20,894,331 | |
Foreign currency transactions | | | (1,176,580 | ) |
Net realized gain | | | 128,176,305 | |
Net change in unrealized appreciation (depreciation) on: |
Investments in unaffiliated issuers | | | 100,934,910 | |
Investments in affiliated issuers | | | 9,822,997 | |
Swap agreements | | | (13,773,522 | ) |
Futures contracts | | | 10,678,575 | |
Options purchased | | | 14,117,707 | |
Options written | | | 153,961 | |
Forward foreign currency exchange contracts | | | (17,979,550 | ) |
Foreign currency translations | | | 1,895,323 | |
Net change in unrealized appreciation (depreciation) | | | 105,850,401 | |
Net realized and unrealized gain | | | 234,026,706 | |
Net increase in net assets resulting from operations | | $ | 299,883,719 | |
SEE NOTES TO CONSOLIDATED FINANCIAL STATEMENTS. | THE GUGGENHEIM FUNDS SEMI-ANNUAL REPORT | 65 |
CONSOLIDATED STATEMENTS OF CHANGES IN NET ASSETS |
MACRO OPPORTUNITIES FUND |
| | Six Months Ended
March 31, 2021
(Unaudited) | | | Year Ended
September 30,
2020 | |
Increase (Decrease) in Net Assets from Operations: | | | | | | | | |
Net investment income | | $ | 65,857,013 | | | $ | 160,220,601 | |
Net realized gain (loss) on investments | | | 128,176,305 | | | | (84,989,272 | ) |
Net change in unrealized appreciation (depreciation) on investments | | | 105,850,401 | | | | 175,183,745 | |
Net increase in net assets resulting from operations | | | 299,883,719 | | | | 250,415,074 | |
| | | | | | | | | |
Distributions to shareholders: | | | | | | | | |
A-Class | | | (7,854,823 | ) | | | (11,564,799 | ) |
C-Class | | | (4,273,481 | ) | | | (6,528,648 | ) |
P-Class | | | (2,407,347 | ) | | | (3,427,318 | ) |
Institutional Class | | | (119,528,218 | ) | | | (155,990,784 | ) |
R6-Class | | | (3,528,439 | ) | | | (2,567,315 | ) |
Total distributions to shareholders | | | (137,592,308 | ) | | | (180,078,864 | ) |
| | | | | | | | | |
Capital share transactions: | | | | | | | | |
Proceeds from sale of shares | | | | | | | | |
A-Class | | | 116,859,813 | | | | 109,769,140 | |
C-Class | | | 23,201,268 | | | | 15,768,558 | |
P-Class | | | 52,987,942 | | | | 39,513,794 | |
Institutional Class | | | 2,237,779,947 | | | | 1,756,127,971 | |
R6-Class | | | 18,054,715 | | | | 177,460,010 | |
Distributions reinvested | | | | | | | | |
A-Class | | | 6,404,369 | | | | 9,309,460 | |
C-Class | | | 3,754,829 | | | | 5,582,109 | |
P-Class | | | 2,405,753 | | | | 3,425,490 | |
Institutional Class | | | 104,189,671 | | | | 135,153,093 | |
R6-Class | | | 3,526,263 | | | | 2,566,997 | |
Cost of shares redeemed | | | | | | | | |
A-Class | | | (56,739,693 | ) | | | (270,489,422 | ) |
C-Class | | | (40,816,126 | ) | | | (125,607,632 | ) |
P-Class | | | (26,506,020 | ) | | | (71,527,362 | ) |
Institutional Class | | | (796,336,556 | ) | | | (3,253,519,833 | ) |
R6-Class | | | (15,277,964 | ) | | | (44,704,950 | ) |
Net increase (decrease) from capital share transactions | | | 1,633,488,211 | | | | (1,511,172,577 | ) |
Net increase (decrease) in net assets | | | 1,795,779,622 | | | | (1,440,836,367 | ) |
| | | | | | | | | |
Net assets: | | | | | | | | |
Beginning of period | | | 4,866,399,758 | | | | 6,307,236,125 | |
End of period | | $ | 6,662,179,380 | | | $ | 4,866,399,758 | |
| | | | | | | | | |
66 | THE GUGGENHEIM FUNDS SEMI-ANNUAL REPORT | SEE NOTES TO CONSOLIDATED FINANCIAL STATEMENTS. |
CONSOLIDATED STATEMENTS OF CHANGES IN NET ASSETS (concluded) |
MACRO OPPORTUNITIES FUND |
| | Six Months Ended
March 31, 2021
(Unaudited) | | | Year Ended
September 30,
2020 | |
Capital share activity: | | | | | | | | |
Shares sold | | | | | | | | |
A-Class | | | 4,274,533 | | | | 4,307,718 | |
C-Class | | | 851,336 | | | | 619,207 | |
P-Class | | | 1,934,084 | | | | 1,570,044 | |
Institutional Class | | | 82,004,836 | | | | 69,459,364 | |
R6-Class | | | 661,336 | | | | 6,828,040 | |
Shares issued from reinvestment of distributions | | | | | | | | |
A-Class | | | 235,909 | | | | 364,891 | |
C-Class | | | 138,470 | | | | 218,971 | |
P-Class | | | 88,546 | | | | 134,225 | |
Institutional Class | | | 3,830,241 | | | | 5,288,587 | |
R6-Class | | | 129,791 | | | | 100,256 | |
Shares redeemed | | | | | | | | |
A-Class | | | (2,088,743 | ) | | | (10,663,377 | ) |
C-Class | | | (1,498,784 | ) | | | (4,940,194 | ) |
P-Class | | | (986,893 | ) | | | (2,812,895 | ) |
Institutional Class | | | (29,323,112 | ) | | | (128,005,044 | ) |
R6-Class | | | (565,078 | ) | | | (1,764,938 | ) |
Net increase (decrease) in shares | | | 59,686,472 | | | | (59,295,145 | ) |
SEE NOTES TO CONSOLIDATED FINANCIAL STATEMENTS. | THE GUGGENHEIM FUNDS SEMI-ANNUAL REPORT | 67 |
CONSOLIDATED FINANCIAL HIGHLIGHTS |
MACRO OPPORTUNITIES FUND |
This table is presented to show selected data for a share outstanding throughout each period and to assist shareholders in evaluating a Fund’s performance for the periods presented.
A-Class | | Six Months Ended
March 31, 2021a | | | Year
Ended
Sept. 30,
2020 | | | Year
Ended
Sept. 30,
2019 | | | Year
Ended
Sept. 30,
2018 | | | Year
Ended
Sept. 30,
2017 | | | Year
Ended
Sept. 30,
2016 | |
Per Share Data |
Net asset value, beginning of period | | $ | 26.31 | | | $ | 25.82 | | | $ | 26.53 | | | $ | 26.67 | | | $ | 26.01 | | | $ | 26.07 | |
Income (loss) from investment operations: |
Net investment income (loss)b | | | .27 | | | | .74 | | | | .72 | | | | .72 | | | | .95 | | | | 1.16 | |
Net gain (loss) on investments (realized and unrealized) | | | 1.26 | | | | .61 | | | | (.62 | ) | | | (.08 | ) | | | .68 | | | | .21 | |
Total from investment operations | | | 1.53 | | | | 1.35 | | | | .10 | | | | .64 | | | | 1.63 | | | | 1.37 | |
Less distributions from: |
Net investment income | | | (.62 | ) | | | (.86 | ) | | | (.79 | ) | | | (.78 | ) | | | (.97 | ) | | | (1.43 | ) |
Net realized gains | | | — | | | | — | | | | (.02 | ) | | | — | | | | — | | | | — | |
Total distributions | | | (.62 | ) | | | (.86 | ) | | | (.81 | ) | | | (.78 | ) | | | (.97 | ) | | | (1.43 | ) |
Net asset value, end of period | | $ | 27.22 | | | $ | 26.31 | | | $ | 25.82 | | | $ | 26.53 | | | $ | 26.67 | | | $ | 26.01 | |
|
Total Returnc | | | 5.84 | % | | | 5.39 | % | | | 0.41 | % | | | 2.42 | % | | | 6.33 | % | | | 5.57 | % |
Ratios/Supplemental Data |
Net assets, end of period (in thousands) | | $ | 389,758 | | | $ | 312,986 | | | $ | 461,781 | | | $ | 714,630 | | | $ | 893,104 | | | $ | 727,602 | |
Ratios to average net assets: |
Net investment income (loss) | | | 2.02 | % | | | 2.90 | % | | | 2.76 | % | | | 2.72 | % | | | 3.58 | % | | | 4.59 | % |
Total expensesd | | | 1.42 | % | | | 1.51 | % | | | 1.47 | % | | | 1.43 | % | | | 1.42 | % | | | 1.65 | % |
Net expensese,f,g | | | 1.36 | % | | | 1.39 | % | | | 1.39 | % | | | 1.33 | % | | | 1.27 | % | | | 1.46 | % |
Portfolio turnover rate | | | 22 | % | | | 130 | % | | | 46 | % | | | 66 | % | | | 61 | % | | | 61 | % |
68 | THE GUGGENHEIM FUNDS SEMI-ANNUAL REPORT | SEE NOTES TO CONSOLIDATED FINANCIAL STATEMENTS. |
CONSOLIDATED FINANCIAL HIGHLIGHTS (continued) |
MACRO OPPORTUNITIES FUND |
This table is presented to show selected data for a share outstanding throughout each period and to assist shareholders in evaluating a Fund’s performance for the periods presented.
C-Class | | Six Months Ended
March 31, 2021a | | | Year
Ended
Sept. 30,
2020 | | | Year
Ended
Sept. 30,
2019 | | | Year
Ended
Sept. 30,
2018 | | | Year
Ended
Sept. 30,
2017 | | | Year
Ended
Sept. 30,
2016 | |
Per Share Data |
Net asset value, beginning of period | | $ | 26.29 | | | $ | 25.80 | | | $ | 26.52 | | | $ | 26.65 | | | $ | 25.99 | | | $ | 26.05 | |
Income (loss) from investment operations: |
Net investment income (loss)b | | | .17 | | | | .55 | | | | .52 | | | | .53 | | | | .75 | | | | .98 | |
Net gain (loss) on investments (realized and unrealized) | | | 1.26 | | | | .61 | | | | (.62 | ) | | | (.08 | ) | | | .68 | | | | .20 | |
Total from investment operations | | | 1.43 | | | | 1.16 | | | | (.10 | ) | | | .45 | | | | 1.43 | | | | 1.18 | |
Less distributions from: |
Net investment income | | | (.52 | ) | | | (.67 | ) | | | (.60 | ) | | | (.58 | ) | | | (.77 | ) | | | (1.24 | ) |
Net realized gains | | | — | | | | — | | | | (.02 | ) | | | — | | | | — | | | | — | |
Total distributions | | | (.52 | ) | | | (.67 | ) | | | (.62 | ) | | | (.58 | ) | | | (.77 | ) | | | (1.24 | ) |
Net asset value, end of period | | $ | 27.20 | | | $ | 26.29 | | | $ | 25.80 | | | $ | 26.52 | | | $ | 26.65 | | | $ | 25.99 | |
|
Total Returnc | | | 5.46 | % | | | 4.60 | % | | | (0.37 | %) | | | 1.69 | % | | | 5.55 | % | | | 4.79 | % |
Ratios/Supplemental Data |
Net assets, end of period (in thousands) | | $ | 213,635 | | | $ | 219,866 | | | $ | 321,576 | | | $ | 433,121 | | | $ | 434,634 | | | $ | 337,075 | |
Ratios to average net assets: |
Net investment income (loss) | | | 1.27 | % | | | 2.15 | % | | | 2.00 | % | | | 1.98 | % | | | 2.83 | % | | | 3.87 | % |
Total expensesd | | | 2.17 | % | | | 2.25 | % | | | 2.20 | % | | | 2.18 | % | | | 2.14 | % | | | 2.36 | % |
Net expensese,f,g | | | 2.11 | % | | | 2.15 | % | | | 2.13 | % | | | 2.09 | % | | | 2.03 | % | | | 2.20 | % |
Portfolio turnover rate | | | 22 | % | | | 130 | % | | | 46 | % | | | 66 | % | | | 61 | % | | | 61 | % |
SEE NOTES TO CONSOLIDATED FINANCIAL STATEMENTS. | THE GUGGENHEIM FUNDS SEMI-ANNUAL REPORT | 69 |
CONSOLIDATED FINANCIAL HIGHLIGHTS (continued) |
MACRO OPPORTUNITIES FUND |
This table is presented to show selected data for a share outstanding throughout each period and to assist shareholders in evaluating a Fund’s performance for the periods presented.
P-Class | | Six Months Ended
March 31, 2021a | | | Year
Ended
Sept. 30,
2020 | | | Year
Ended
Sept. 30,
2019 | | | Year
Ended
Sept. 30,
2018 | | | Year
Ended
Sept. 30,
2017 | | | Year
Ended
Sept. 30,
2016 | |
Per Share Data |
Net asset value, beginning of period | | $ | 26.32 | | | $ | 25.82 | | | $ | 26.54 | | | $ | 26.68 | | | $ | 26.02 | | | $ | 26.07 | |
Income (loss) from investment operations: |
Net investment income (loss)b | | | .27 | | | | .74 | | | | .71 | | | | .73 | | | | .92 | | | | 1.20 | |
Net gain (loss) on investments (realized and unrealized) | | | 1.26 | | | | .62 | | | | (.62 | ) | | | (.09 | ) | | | .71 | | | | .21 | |
Total from investment operations | | | 1.53 | | | | 1.36 | | | | .09 | | | | .64 | | | | 1.63 | | | | 1.41 | |
Less distributions from: |
Net investment income | | | (.62 | ) | | | (.86 | ) | | | (.79 | ) | | | (.78 | ) | | | (.97 | ) | | | (1.46 | ) |
Net realized gains | | | — | | | | — | | | | (.02 | ) | | | — | | | | — | | | | — | |
Total distributions | | | (.62 | ) | | | (.86 | ) | | | (.81 | ) | | | (.78 | ) | | | (.97 | ) | | | (1.46 | ) |
Net asset value, end of period | | $ | 27.23 | | | $ | 26.32 | | | $ | 25.82 | | | $ | 26.54 | | | $ | 26.68 | | | $ | 26.02 | |
|
Total Return | | | 5.84 | % | | | 5.42 | % | | | 0.37 | % | | | 2.42 | % | | | 6.33 | % | | | 5.74 | % |
Ratios/Supplemental Data |
Net assets, end of period (in thousands) | | $ | 131,236 | | | $ | 99,575 | | | $ | 126,334 | | | $ | 160,578 | | | $ | 188,980 | | | $ | 63,665 | |
Ratios to average net assets: |
Net investment income (loss) | | | 2.01 | % | | | 2.91 | % | | | 2.73 | % | | | 2.73 | % | | | 3.48 | % | | | 4.73 | % |
Total expensesd | | | 1.42 | % | | | 1.50 | % | | | 1.46 | % | | | 1.46 | % | | | 1.44 | % | | | 1.49 | % |
Net expensese,f,g | | | 1.36 | % | | | 1.40 | % | | | 1.39 | % | | | 1.33 | % | | | 1.26 | % | | | 1.33 | % |
Portfolio turnover rate | | | 22 | % | | | 130 | % | | | 46 | % | | | 66 | % | | | 61 | % | | | 61 | % |
70 | THE GUGGENHEIM FUNDS SEMI-ANNUAL REPORT | SEE NOTES TO CONSOLIDATED FINANCIAL STATEMENTS. |
CONSOLIDATED FINANCIAL HIGHLIGHTS (continued) |
MACRO OPPORTUNITIES FUND |
This table is presented to show selected data for a share outstanding throughout each period and to assist shareholders in evaluating a Fund’s performance for the periods presented.
Institutional Class | | Six Months Ended
March 31, 2021a | | | Year
Ended
Sept. 30,
2020 | | | Year
Ended
Sept. 30,
2019 | | | Year
Ended
Sept. 30,
2018 | | | Year
Ended
Sept. 30,
2017 | | | Year
Ended
Sept. 30,
2016 | |
Per Share Data |
Net asset value, beginning of period | | $ | 26.34 | | | $ | 25.85 | | | $ | 26.57 | | | $ | 26.71 | | | $ | 26.04 | | | $ | 26.10 | |
Income (loss) from investment operations: |
Net investment income (loss)b | | | .33 | | | | .85 | | | | .81 | | | | .84 | | | | 1.02 | | | | 1.26 | |
Net gain (loss) on investments (realized and unrealized) | | | 1.26 | | | | .60 | | | | (.61 | ) | | | (.09 | ) | | | .71 | | | | .21 | |
Total from investment operations | | | 1.59 | | | | 1.45 | | | | .20 | | | | .75 | | | | 1.73 | | | | 1.47 | |
Less distributions from: |
Net investment income | | | (.67 | ) | | | (.96 | ) | | | (.90 | ) | | | (.89 | ) | | | (1.06 | ) | | | (1.53 | ) |
Net realized gains | | | — | | | | — | | | | (.02 | ) | | | — | | | | — | | | | — | |
Total distributions | | | (.67 | ) | | | (.96 | ) | | | (.92 | ) | | | (.89 | ) | | | (1.06 | ) | | | (1.53 | ) |
Net asset value, end of period | | $ | 27.26 | | | $ | 26.34 | | | $ | 25.85 | | | $ | 26.57 | | | $ | 26.71 | | | $ | 26.04 | |
|
Total Return | | | 6.05 | % | | | 5.84 | % | | | 0.77 | % | | | 2.83 | % | | | 6.73 | % | | | 5.97 | % |
Ratios/Supplemental Data |
Net assets, end of period (in thousands) | | $ | 5,779,984 | | | $ | 4,097,303 | | | $ | 5,396,868 | | | $ | 6,065,678 | | | $ | 4,591,424 | | | $ | 2,204,079 | |
Ratios to average net assets: |
Net investment income (loss) | | | 2.41 | % | | | 3.32 | % | | | 3.12 | % | | | 3.15 | % | | | 3.86 | % | | | 4.96 | % |
Total expensesd | | | 1.08 | % | | | 1.17 | % | | | 1.13 | % | | | 1.08 | % | | | 1.06 | % | | | 1.29 | % |
Net expensese,f,g | | | 0.95 | % | | | 0.99 | % | | | 0.98 | % | | | 0.93 | % | | | 0.91 | % | | | 1.08 | % |
Portfolio turnover rate | | | 22 | % | | | 130 | % | | | 46 | % | | | 66 | % | | | 61 | % | | | 61 | % |
SEE NOTES TO CONSOLIDATED FINANCIAL STATEMENTS. | THE GUGGENHEIM FUNDS SEMI-ANNUAL REPORT | 71 |
CONSOLIDATED FINANCIAL HIGHLIGHTS (continued) |
MACRO OPPORTUNITIES FUND | |
This table is presented to show selected data for a share outstanding throughout each period and to assist shareholders in evaluating a Fund’s performance for the periods presented.
R6-Class | | Six Months Ended
March 31, 2021a | | | Year
Ended
Sept. 30,
2020 | | | Period
Ended
Sept. 30,
2019h | |
Per Share Data |
Net asset value, beginning of period | | $ | 26.34 | | | $ | 25.84 | | | $ | 25.98 | |
Income (loss) from investment operations: |
Net investment income (loss)b | | | .33 | | | | .87 | | | | .36 | |
Net gain (loss) on investments (realized and unrealized) | | | 1.26 | | | | .58 | | | | (.03 | ) |
Total from investment operations | | | 1.59 | | | | 1.45 | | | | .33 | |
Less distributions from: |
Net investment income | | | (.68 | ) | | | (.95 | ) | | | (.47 | ) |
Total distributions | | | (.68 | ) | | | (.95 | ) | | | (.47 | ) |
Net asset value, end of period | | $ | 27.25 | | | $ | 26.34 | | | $ | 25.84 | |
|
Total Return | | | 6.05 | % | | | 5.81 | % | | | 1.30 | % |
Ratios/Supplemental Data |
Net assets, end of period (in thousands) | | $ | 147,567 | | | $ | 136,669 | | | $ | 676 | |
Ratios to average net assets: |
Net investment income (loss) | | | 2.42 | % | | | 3.41 | % | | | 2.79 | % |
Total expensesd | | | 1.01 | % | | | 1.09 | % | | | 1.11 | % |
Net expensese,f,g | | | 0.95 | % | | | 0.99 | % | | | 1.03 | % |
Portfolio turnover rate | | | 22 | % | | | 130 | % | | | 46 | % |
72 | THE GUGGENHEIM FUNDS SEMI-ANNUAL REPORT | SEE NOTES TO CONSOLIDATED FINANCIAL STATEMENTS. |
CONSOLIDATED FINANCIAL HIGHLIGHTS (concluded) |
MACRO OPPORTUNITIES FUND | |
a | Unaudited figures for the period ended March 31, 2021. Percentage amounts for the period, except total return and portfolio turnover rate, have been annualized. |
b | Net investment income (loss) per share was computed using average shares outstanding throughout the period. |
c | Total return does not reflect the impact of any applicable sales charges. |
d | Does not include expenses of the underlying funds in which the Fund invests. |
e | Net expense information reflects the expense ratios after expense waivers and reimbursements, as applicable. |
f | The portion of the ratios of net expenses to average net assets attributable to recoupments of prior fee reductions or expense reimbursements for the periods presented was as follows: |
| | | 03/31/21a | 09/30/20 | 09/30/19 | 09/30/18 | 09/30/17 |
| | A-Class | 0.10% | 0.03% | 0.02% | 0.04% | 0.02% |
| | C-Class | 0.09% | 0.05% | 0.05% | 0.11% | 0.04% |
| | P-Class | 0.08% | 0.03% | 0.04% | 0.04% | 0.02% |
| | Institutional Class | — | 0.00%* | 0.00%* | — | — |
| | R6-Class | 0.00%* | 0.00%* | 0.00%* | N/A | N/A |
| | * | Less than 0.01% |
g | Net expenses may include expenses that are excluded from the expense limitation agreement. Excluding these expenses, the net expense ratios for the periods presented would be: |
| | | 03/31/21a | 09/30/20 | 09/30/19 | 09/30/18 | 09/30/17 | 09/30/16 |
| | A-Class | 1.33% | 1.33% | 1.33% | 1.31% | 1.25% | 1.28% |
| | C-Class | 2.08% | 2.08% | 2.07% | 2.06% | 2.00% | 2.02% |
| | P-Class | 1.33% | 1.33% | 1.33% | 1.31% | 1.24% | 1.15% |
| | Institutional Class | 0.92% | 0.92% | 0.92% | 0.90% | 0.88% | 0.90% |
| | R6-Class | 0.92% | 0.92% | 0.92% | N/A | N/A | N/A |
h | Since commencement of operations: March 13, 2019. Percentage amounts for the period, except total return and portfolio turnover rate, have been annualized. |
SEE NOTES TO CONSOLIDATED FINANCIAL STATEMENTS. | THE GUGGENHEIM FUNDS SEMI-ANNUAL REPORT | 73 |
NOTES TO CONSOLIDATED FINANCIAL STATEMENTS (Unaudited) |
Note 1 – Organization, Consolidation of Subsidiary and Significant Accounting Policies
Organization
Guggenheim Funds Trust (the “Trust”), a Delaware statutory trust, is registered with the SEC under the Investment Company Act of 1940 (“1940 Act”), as an open-ended investment company of the series type. Each series, in effect, is representing a separate fund. The Trust may issue an unlimited number of authorized shares. The Trust accounts for the assets of each fund separately.
The Trust offers a combination of five separate classes of shares: A-Class shares, C-Class shares, P-Class shares, R6-Class shares and Institutional Class shares. Sales of shares of each Class are made without a front-end sales charge at the net asset value per share (“NAV”), with the exception of A-Class shares. A-Class shares are sold at the NAV, plus the applicable front-end sales charge. The sales charge varies depending on the amount purchased. A-Class share purchases of $1 million or more are exempt from the front-end sales charge but have a 1% contingent deferred sales charge (“CDSC”), if shares are redeemed within 12 months of purchase. C-Class shares have a 1% CDSC if shares are redeemed within 12 months of purchase. C-Class shares automatically convert to A-Class shares on or about the 10th day of the month following the 10-year anniversary of the purchase of the C-Class shares. This conversion will be executed without any sales charge, fee or other charge. After the conversion is completed, the shares will be subject to all features and expenses of A-Class shares. Institutional Class shares are offered primarily for direct investment by institutions such as pension and profit sharing plans, endowments, foundations and corporations. Institutional Class shares require a minimum initial investment of $2 million and a minimum account balance of $1 million. R6-Class shares are offered primarily through qualified retirement and benefit plans. R6-Class shares are also offered through certain other plans and platforms sponsored by financial intermediaries. Certain institutional investors and others deemed appropriate by Guggenheim Investments (“GI”) may also be eligible to purchase R6-Class shares subject to a $2 million minimum initial investment. At March 31, 2021, the Trust consisted of nineteen funds (the “Funds”).
This report covers the Macro Opportunities Fund (the “Fund”), a diversified investment company. At March 31, 2021, A-Class, C-Class, P-Class, Institutional Class and R6-Class shares have been issued by the Fund.
Guggenheim Partners Investment Management, LLC (“GPIM”) which operates under the name Guggenheim Investments, provides advisory services. Guggenheim Funds Distributors, LLC (“GFD”) acts as principal underwriter for the Trust. GI and GFD are affiliated entities.
Consolidation of Subsidiary
The consolidated financial statements of the Fund include the accounts of a wholly-owned and controlled Cayman Islands subsidiary (the “Subsidiary”). Significant inter-company accounts and transactions have been eliminated in consolidation for the Fund.
74 | THE GUGGENHEIM FUNDS SEMI-ANNUAL REPORT | |
NOTES TO CONSOLIDATED FINANCIAL STATEMENTS (Unaudited)(continued) |
The Fund may invest up to 25% of its total assets in its Subsidiary which acts as an investment vehicle in order to effect certain investments consistent with the Fund’s investment objectives and policies.
A summary of the Fund’s investment in its Subsidiary is as follows:
| | Inception Date
of Subsidiary | | | Subsidiary
Net Assets at
March 31,
2021 | | | % of Net Assets of
the Fund at
March 31,
2021 | |
| | | | 01/08/15 | | | $ | 19,131,139 | | | | 0.29 | % |
Significant Accounting Policies
The Fund operates as an investment company and, accordingly, follows the investment company accounting and reporting guidance of the Financial Accounting Standards Board (“FASB”) Accounting Standards Codification Topic 946 Financial Services – Investment Companies.
The following significant accounting policies are in conformity with U.S. generally accepted accounting principles (“U.S. GAAP”) and are consistently followed by the Trust. This requires management to make estimates and assumptions that affect the reported amount of assets and liabilities, contingent assets and liabilities at the date of the consolidated financial statements, and the reported amounts of revenues and expenses during the reporting period. Actual results could differ from these estimates. All time references are based on Eastern Time.
The NAV of each Class of the Fund is calculated by dividing the market value of the Fund’s securities and other assets, less all liabilities, attributable to the Class by the number of outstanding shares of the Class.
(a) Valuation of Investments
The Board of Trustees of the Fund (the “Board”) has adopted policies and procedures for the valuation of the Fund’s investments (the “Valuation Procedures”). Pursuant to the Valuation Procedures, the Board has delegated to a valuation committee, consisting of representatives from Guggenheim’s investment management, fund administration, legal and compliance departments (the “Valuation Committee”), the day-to-day responsibility for implementing the Valuation Procedures, including, under most circumstances, the responsibility for determining the fair value of the Fund’s securities and/or other assets.
Valuations of the Fund’s securities and other assets are supplied primarily by pricing services appointed pursuant to the processes set forth in the Valuation Procedures. The Valuation Committee convenes monthly, or more frequently as needed, to review the valuation of all assets which have been fair valued for reasonableness. The Fund’s officers, through the Valuation
| | THE GUGGENHEIM FUNDS SEMI-ANNUAL REPORT | 75 |
NOTES TO CONSOLIDATED FINANCIAL STATEMENTS (Unaudited)(continued) |
Committee and consistent with the monitoring and review responsibilities set forth in the Valuation Procedures, regularly review procedures used and valuations provided by the pricing services.
If the pricing service cannot or does not provide a valuation for a particular investment or such valuation is deemed unreliable, such investment is fair valued by the Valuation Committee.
Equity securities listed or traded on a recognized U.S. securities exchange or the National Association of Securities Dealers Automated Quotations (“NASDAQ”) National Market System shall generally be valued on the basis of the last sale price on the primary U.S. exchange or market on which the security is listed or traded; provided, however, that securities listed on NASDAQ will be valued at the NASDAQ Official Closing Price, which may not necessarily represent the last sale price. If there is no sale on the valuation date, exchange-traded U.S. equity securities will be valued on the basis of the last bid price.
Generally, trading in foreign securities markets is substantially completed each day at various times prior to the close of the New York Stock Exchange (“NYSE”). The values of foreign securities are determined as of the close of such foreign markets or the close of the NYSE, if earlier. All investments quoted in foreign currencies are valued in U.S. dollars on the basis of the foreign currency exchange rates prevailing at the close of U.S. business at 4:00 p.m. Investments in foreign securities may involve risks not present in domestic investments. The Valuation Committee will determine the current value of such foreign securities by taking into consideration certain factors which may include those discussed above, as well as the following factors, among others: the value of the securities traded on other foreign markets, ADR trading, closed-end fund trading, foreign currency exchange activity, and the trading prices of financial products that are tied to foreign securities. In addition, under the Valuation Procedures, the Valuation Committee and GI are authorized to use prices and other information supplied by a third party pricing vendor in valuing foreign securities.
Open-end investment companies are valued at their NAV as of the close of business, on the valuation date. Exchange-traded funds and closed-end investment companies are valued at the last quoted sale price.
U.S. Government securities are valued by independent pricing services, the last traded fill price, or at the reported bid price at the close of business.
Repurchase agreements are generally valued at amortized cost, provided such amounts approximate market value.
Debt securities with a maturity of greater than 60 days at acquisition are valued at prices that reflect broker-dealer supplied valuations or are obtained from independent pricing services, which may consider the trade activity, treasury spreads, yields or price of bonds of comparable
76 | THE GUGGENHEIM FUNDS SEMI-ANNUAL REPORT | |
NOTES TO CONSOLIDATED FINANCIAL STATEMENTS (Unaudited)(continued) |
quality, coupon, maturity, and type, as well as prices quoted by dealers who make markets in such securities. Short-term debt securities with a maturity of 60 days or less at acquisition are valued at amortized cost, provided such amount approximates market value.
Typically, loans are valued using information provided by an independent third party pricing service that uses broker quotes, among other inputs. If the pricing service cannot or does not provide a valuation for a particular loan, or such valuation is deemed unreliable, such investment is valued based on a quote from a broker-dealer or is fair valued by the Valuation Committee.
Exchange-traded options are valued at the mean of the bid and ask prices on the principal exchange on which they are traded. Over-the-counter (“OTC”) options are valued using a price provided by a pricing service.
The value of futures contracts is accounted for using the unrealized appreciation or depreciation on the contracts that is determined by marking the contracts to their current realized settlement prices. Financial futures contracts are valued at the 4:00 p.m. price on the valuation date. In the event that the exchange for a specific futures contract closes earlier than 4:00 p.m., the futures contract is valued at the official settlement price of the exchange. However, the underlying securities from which the futures contract value is derived are monitored until 4:00 p.m. to determine if fair valuation would provide a more accurate valuation.
The value of interest rate swap agreements entered into by the Fund is accounted for using the unrealized appreciation or depreciation on the agreements that is determined using the previous day’s Chicago Mercantile Exchange close price, adjusted for the current day’s spreads.
The values of other swap agreements entered into by the Fund are accounted for using the unrealized appreciation or depreciation on the agreements that are determined by marking the agreements to the last quoted value of the index or other underlying position that the swaps pertain to at the close of the NYSE.
Forward foreign currency exchange contracts are valued daily based on the applicable exchange rate of the underlying currency.
Investments for which market quotations are not readily available are fair-valued as determined in good faith by GI, subject to review and approval by the Valuation Committee, pursuant to methods established or ratified by the Board. Valuations in accordance with these methods are intended to reflect each security’s (or asset’s or liability’s) “fair value”. Each such determination is based on a consideration of all relevant factors, which are likely to vary from one pricing context to another. Examples of such factors may include, but are not limited to market prices; sale prices; broker quotes; and models which derive prices based on inputs such as prices of securities with comparable maturities and characteristics, or based on inputs such as anticipated cash flows or collateral, spread over U.S. Treasury securities, and other information analysis. In connection with futures contracts and other derivative investments, such factors may include obtaining
| | THE GUGGENHEIM FUNDS SEMI-ANNUAL REPORT | 77 |
NOTES TO CONSOLIDATED FINANCIAL STATEMENTS (Unaudited)(continued) |
information as to how (a) these contracts and other derivative investments trade in the futures or other derivative markets, respectively, and (b) the securities underlying these contracts and other derivative investments trade in the cash market.
(b) U.S. Government and Agency Obligations
Certain U.S. Government and Agency Obligations are traded on a discount basis; the interest rates shown on the Consolidated Schedule of Investments reflect the effective rates paid at the time of purchase by the Fund. Other securities bear interest at the rates shown, payable at fixed dates through maturity.
(c) Senior Floating Rate Interests and Loan Investments
Senior floating rate interests in which the Fund invests generally pay interest rates which are periodically adjusted by reference to a base short-term floating rate, plus a premium. These base lending rates are generally (i) the lending rate offered by one or more major European banks, such as the one-month or three-month London Inter-Bank Offered Rate (“LIBOR”), (ii) the prime rate offered by one or more major United States banks, or (iii) the bank’s certificate of deposit rate. Senior floating rate interests often require prepayments from excess cash flows or permit the borrower to repay at its election. The rate at which the borrower repays cannot be predicted with accuracy. As a result, the actual remaining maturity may be substantially less than the stated maturities disclosed in the Fund’s Consolidated Schedule of Investments.
The Fund invests in loans and other similar debt obligations (“obligations”). A portion of the Fund’s investments in these obligations is sometimes referred to as “covenant lite” loans or obligations (“covenant lite obligations”), which are obligations that lack covenants or possess fewer or less restrictive covenants or constraints on borrowers than certain other types of obligations. The Fund may also obtain exposure to covenant lite obligations through investment in securitization vehicles and other structured products. In recent market conditions, many new or reissued obligations have not featured traditional covenants, which are intended to protect lenders and investors by (i) imposing certain restrictions or other limitations on a borrower’s operations or assets or (ii) providing certain rights to lenders. The Fund may have fewer rights with respect to covenant lite obligations, including fewer protections against the possibility of default and fewer remedies in the event of default. As a result, investments in (or exposure to) covenant lite obligations are subject to more risk than investments in (or exposure to) certain other types of obligations. The Fund is subject to other risks associated with investments in (or exposure to) obligations, including that obligations may not be considered “securities” and, as a result, the Fund may not be entitled to rely on the anti-fraud protections under the federal securities laws and instead may have to resort to state law and direct claims.
78 | THE GUGGENHEIM FUNDS SEMI-ANNUAL REPORT | |
NOTES TO CONSOLIDATED FINANCIAL STATEMENTS (Unaudited)(continued) |
(d) Interest on When-Issued Securities
The Fund may purchase and sell interests in securities on a when-issued and delayed delivery basis, with payment and delivery scheduled for a future date. No income accrues to the Fund on such interests or securities in connection with such transactions prior to the date the Fund actually takes delivery of such interests or securities. These transactions are subject to market fluctuations and are subject to the risk that the value at delivery may be more or less than the trade date purchase price. Although the Fund will generally purchase these securities with the intention of acquiring such securities, it may sell such securities before the settlement date.
(e) Short Sales
When the Fund engages in a short sale of a security, an amount equal to the proceeds is reflected as an asset and an equivalent liability. The amount of the liability is subsequently marked-to-market to reflect the market value of the short sale. The Fund maintains a segregated account of cash and/or securities as collateral for short sales.
Fees, if any, paid to brokers to borrow securities in connection with short sales are recorded as interest expense. In addition, the Fund must pay out the dividend rate of the equity or coupon rate of the obligation to the lender and record this as an expense. Short dividend or interest expense is a cost associated with the investment objective of short sales transactions, rather than an operational cost associated with the day-to-day management of any mutual fund. The Fund may also receive rebate income from the broker resulting from the investment of the proceeds from securities sold short.
(f) Options
Upon the purchase of an option, the premium paid is recorded as an investment, the value of which is marked-to-market daily. If a purchased option expires, the Fund realizes a loss in the amount of the cost of the option. When the Fund enters into a closing sale transaction, it realizes a gain or loss depending on whether the proceeds from the closing sale transaction are greater or less than the cost of the option. If the Fund exercises a put option, it realizes a gain or loss from the sale of the underlying security and the proceeds from such sale will be decreased by the premium originally paid. When the Fund exercises a call option, the cost of the security purchased by the Fund upon exercise increases by the premium originally paid.
When the Fund writes (sells) an option, an amount equal to the premium received is entered in that Fund’s accounting records as an asset and equivalent liability. The amount of the liability is subsequently marked-to-market to reflect the current value of the option written. When a written option expires, or if the Fund enters into a closing purchase transaction, it realizes a gain (or loss if the cost of a closing purchase transaction exceeds the premium received when the option was sold).
| | THE GUGGENHEIM FUNDS SEMI-ANNUAL REPORT | 79 |
NOTES TO CONSOLIDATED FINANCIAL STATEMENTS (Unaudited)(continued) |
(g) Futures Contracts
Upon entering into a futures contract, the Fund deposits and maintains as collateral such initial margin as required by the exchange on which the transaction is affected. Pursuant to the contract, the Fund agrees to receive from or pay to the broker an amount of cash equal to the daily fluctuation in value of the contract. Such receipts or payments are known as variation margin and are recorded by the Fund as unrealized appreciation or depreciation. When the contract is closed, the Fund records a realized gain or loss equal to the difference between the value of the contract at the time it was opened and the value at the time it was closed.
(h) Swap Agreements
Swap agreements are marked-to-market daily and the change, if any, is recorded as unrealized appreciation or depreciation. Payments received or made as a result of an agreement or termination of an agreement are recognized as realized gains or losses.
Upon entering into certain centrally-cleared swap transactions, a Fund is required to deposit with its clearing broker an amount of cash or securities as an initial margin. Subsequent variation margin receipts or payments are received or made by the Fund depending on fluctuations in the fair value of the reference entity and are recorded by the Fund as unrealized appreciation or depreciation. When the contract is closed, the Fund records a realized gain or loss equal to the difference between the value of the contract at the time it was opened and the value at the time it was closed.
Upfront payments received or made by a Fund on credit default swap agreements and interest rate swap agreements are amortized over the expected life of the agreement. Periodic payments received or paid by a Fund are recorded as realized gains or losses. Payments received or made as a result of a credit event or termination of the contract are recognized, net of a proportional amount of the upfront payment, as realized gains or losses.
(i) Currency Translations
The accounting records of the Fund are maintained in U.S. dollars. All assets and liabilities initially expressed in foreign currencies are converted into U.S. dollars at prevailing exchange rates. Purchases and sales of investment securities, dividend and interest income, and certain expenses are translated at the rates of exchange prevailing on the respective dates of such transactions. Changes in the relationship of these foreign currencies to the U.S. dollar can significantly affect the value of the investments and earnings of the Fund. Foreign investments may also subject the Fund to foreign government exchange restrictions, expropriation, taxation, or other political, social or economic developments, all of which could affect the market and/or credit risk of the investments.
80 | THE GUGGENHEIM FUNDS SEMI-ANNUAL REPORT | |
NOTES TO CONSOLIDATED FINANCIAL STATEMENTS (Unaudited)(continued) |
The Fund does not isolate that portion of the results of operations resulting from changes in the foreign exchange rates on investments from the fluctuations arising from changes in the market prices of securities held. Such fluctuations are included with the net realized gain or loss and unrealized appreciation or depreciation on investments.
Reported net realized foreign exchange gains and losses arise from sales of foreign currencies and currency gains or losses realized between the trade and settlement dates on investment transactions. Net unrealized appreciation and depreciation arise from changes in the fair values of assets and liabilities other than investments in securities at the fiscal period end, resulting from changes in exchange rates.
(j) Forward Foreign Currency Exchange Contracts
The change in value of a forward foreign currency exchange contract is recorded as unrealized appreciation or depreciation until the contract is closed. When the contract is closed, the Fund records a realized gain or loss equal to the difference between the value at the time the contract was opened and the value at the time it was closed.
(k) Foreign Taxes
The Fund may be subject to foreign taxes (a portion of which may be reclaimable) on income, stock dividends, capital gains on investments or certain foreign currency transactions. All foreign taxes are recorded in accordance with the applicable foreign tax regulations and rates that exist in the foreign jurisdictions in which the Fund invests. These foreign taxes, if any, are paid by the Fund and reflected in its Consolidated Statement of Operations as follows: foreign taxes withheld at source are presented as a reduction of income and foreign taxes on capital gains from sales of investments are included with the net realized gain (loss) on investments. Foreign taxes payable or deferred as of March 31, 2021, if any, are disclosed in the Fund’s Consolidated Statement of Assets and Liabilities.
(l) Security Transactions
Security transactions are recorded on the trade date for financial reporting purposes. Realized gains and losses from securities transactions are recorded using the identified cost basis. Proceeds from lawsuits related to investment holdings are recorded as a reduction to cost if the securities are still held and as realized gains if no longer held in the Fund. Dividend income is recorded on the ex-dividend date, net of applicable taxes withheld by foreign countries, if any. Taxable non-cash dividends are recorded as dividend income. Interest income, including amortization of premiums and accretion of discounts, is accrued on a daily basis. Interest income also includes paydown gains and losses on mortgage-backed and asset-backed securities and senior and subordinated loans. Amendment fees are earned as compensation for evaluating and accepting changes to the original loan agreement and are recognized when received. Dividend income from Real Estate Investment Trusts (“REITs”) is recorded based on the income included in the distributions received from the REIT investments using published REIT classifications,
| | THE GUGGENHEIM FUNDS SEMI-ANNUAL REPORT | 81 |
NOTES TO CONSOLIDATED FINANCIAL STATEMENTS (Unaudited)(continued) |
including some management estimates when actual amounts are not available. Distributions received in excess of this estimated amount are recorded as a reduction of the cost of investments or reclassified to realized gains. The actual amounts of income, return of capital, and realized gains are only determined by each REIT after its fiscal year-end, and may differ from the estimated amounts.
Income from residual collateralized loan obligations is recognized using the effective interest method. At the time of purchase, management estimates the future expected cash flows and determines the effective yield and estimated maturity date based on the estimated cash flows. Subsequent to the purchase, the estimated cash flows are updated periodically and a revised yield is calculated prospectively.
The Fund may receive other income from investments in senior loan interests including amendment fees, consent fees and commitment fees. For funded loans, these fees are recorded as income when received by the Fund and included in interest income on the Consolidated Statement of Operations. For unfunded loans, commitment fees are included in realized gain on investments on the Consolidated Statement of Operations at the end of the commitment period.
(m) Distributions
The Fund declares dividends from investment income daily. The Fund pays its shareholders from its net investment income monthly and distributes any net capital gains that it has realized, at least annually. Distributions to shareholders are recorded on the ex-dividend date. Dividends are reinvested in additional shares, unless shareholders request payment in cash. The character of distributions made during the year from net investment income or net realized gains may differ from their ultimate characterization for U.S. federal income tax purposes.
(n) Class Allocations
Interest and dividend income, most expenses, all realized gains and losses, and all unrealized appreciation and depreciation are allocated to the classes based upon the value of the outstanding shares in each Class. Certain costs, such as distribution and service fees are charged directly to specific classes. In addition, certain expenses have been allocated to the individual Funds in the Trust based on the respective net assets of each Fund included in the Trust.
(o) Earnings Credits
Under the fee arrangement with the custodian, the Fund may earn credits based on overnight custody cash balances. These credits are utilized to reduce related custodial expenses. The custodian fees disclosed in the Consolidated Statement of Operations are before the reduction in expense from the related earnings credits, if any. Earnings credits for the period ended March 31, 2021, are disclosed in the Consolidated Statement of Operations.
82 | THE GUGGENHEIM FUNDS SEMI-ANNUAL REPORT | |
NOTES TO CONSOLIDATED FINANCIAL STATEMENTS (Unaudited)(continued) |
(p) Cash
The Fund may leave cash overnight in its cash account with the custodian. Periodically, the Fund may have cash due to the custodian bank as an overdraft balance. A fee is incurred on this overdraft, calculated by multiplying the overdraft by a rate based on the federal funds rate, which was 0.06% at March 31, 2021.
(q) Indemnifications
Under the Fund’s organizational documents, its Trustees and Officers are indemnified against certain liabilities arising out of the performance of their duties to the Trust. In addition, throughout the normal course of business, the Fund enters into contracts that contain a variety of representations and warranties which provide general indemnifications. The Fund’s maximum exposure under these arrangements is unknown, as this would involve future claims that may be made against the Fund and/or its affiliates that have not yet occurred. However, based on experience, the Fund expects the risk of loss to be remote.
Note 2 – Financial Instruments and Derivatives
As part of its investment strategy, the Fund utilizes short sales and a variety of derivative instruments. These investments involve, to varying degrees, elements of market risk and risks in excess of amounts recognized on the Consolidated Statement of Assets and Liabilities. Valuation and accounting treatment of these instruments can be found under Significant Accounting Policies in Note 1 of these Notes to Consolidated Financial Statements.
Short Sales
A short sale is a transaction in which the Fund sells a security it does not own. If the security sold short decreases in price between the time the Fund sells the security and closes its short position, the Fund will realize a gain on the transaction. Conversely, if the security increases in price during the period, the Fund will realize a loss on the transaction. The risk of such price increases is the principal risk of engaging in short sales.
Derivatives
Derivatives are instruments whose values depend on, or are derived from, in whole or in part, the value of one or more other assets, such as securities, currencies, commodities or indices. Derivative instruments may be used to increase investment flexibility (including to maintain cash reserves while maintaining exposure to certain other assets), for risk management (hedging) purposes, to facilitate trading, to reduce transaction costs and to pursue higher investment returns. Derivative instruments may also be used to mitigate certain investment risks, such as foreign currency exchange rate risk, interest rate risk and credit risk. U.S. GAAP requires disclosures to enable investors to better understand how and why a Fund uses derivative instruments, how these derivative instruments are accounted for and their effects on the Fund’s financial position and results of operations.
| | THE GUGGENHEIM FUNDS SEMI-ANNUAL REPORT | 83 |
NOTES TO CONSOLIDATED FINANCIAL STATEMENTS (Unaudited)(continued) |
The Fund utilized derivatives for the following purposes:
Duration: the use of an instrument to manage the interest rate risk of a portfolio.
Hedge: an investment made in order to reduce the risk of adverse price movements in a security, by taking an offsetting position to protect against broad market moves.
Income: the use of any instrument that distributes cash flows typically based upon some rate of interest.
Index Exposure: the use of an instrument to obtain exposure to a listed or other type of index.
Speculation: the use of an instrument to express macro-economic and other investment views.
Options Purchased and Written
A call option on a security gives the purchaser of the option the right to buy, and the writer of a call option the obligation to sell, the underlying security. The purchaser of a put option has the right to sell, and the writer of the put option the obligation to buy, the underlying security at any time during the option period. The risk associated with purchasing options is limited to the premium originally paid.
The following table represents the Fund’s use and volume of call/put options purchased on a monthly basis:
| | | Average Notional Amount | |
Use | | Call | | | Put | |
Duration, Hedge, Speculation | | $ | 4,390,300,000 | | | $ | — | |
The risk in writing a call option is that a Fund may incur a loss if the market price of the underlying security increases and the option is exercised. The risk in writing a put option is that a Fund may incur a loss if the market price of the underlying security decreases and the option is exercised. In addition, there may be an imperfect correlation between the movement in prices of options and the underlying securities where a Fund may not be able to enter into a closing transaction because of an illiquid secondary market; or, for OTC options, a Fund may be at risk because of the counterparty’s inability to perform.
The following table represents the Fund’s use and volume of call/put options written on a monthly basis:
| | | Average Notional Amount | |
Use | | Call | | | Put | |
Duration, Hedge, Speculation | | $ | 854,713 | | | $ | — | |
84 | THE GUGGENHEIM FUNDS SEMI-ANNUAL REPORT | |
NOTES TO CONSOLIDATED FINANCIAL STATEMENTS (Unaudited)(continued) |
Futures Contracts
A futures contract is an agreement to purchase (long) or sell (short) an agreed amount of securities or other instruments at a set price for delivery at a future date. There are significant risks associated with a Fund’s use of futures contracts, including (i) there may be an imperfect or no correlation between the changes in market value of the underlying asset and the prices of futures contracts; (ii) there may not be a liquid secondary market for a futures contract; (iii) trading restrictions or limitations may be imposed by an exchange; and (iv) government regulations may restrict trading in futures contracts. When investing in futures, there is minimal counterparty credit risk to a Fund because futures are exchange-traded and the exchange’s clearinghouse, as counterparty to all exchange-traded futures, guarantees against default. Cash deposits are shown as segregated cash with broker on the Consolidated Statement of Assets and Liabilities; securities held as collateral are noted on the Consolidated Schedule of Investments.
The following table represents the Fund’s use and volume of futures on a monthly basis:
| | | Average Notional Amount | |
Use | | Long | | | Short | |
Hedge, Income, Speculation | | $ | 43,176,943 | | | $ | 55,128,391 | |
Swap Agreements
A swap is an agreement that obligates two parties to exchange a series of cash flows at specified intervals based upon or calculated by reference to changes in specified prices or rates for a specified amount of an underlying asset. When utilizing OTC swaps, the Fund bears the risk of loss of the amount expected to be received under a swap agreement in the event of the default or bankruptcy of a swap agreement counterparty or if the underlying asset declines in value. Certain standardized swaps are subject to mandatory central clearing and are executed on a multi-lateral or other trade facility platform, such as a registered exchange. There is limited counterparty credit risk with respect to centrally-cleared swaps as the transaction is facilitated through a central clearinghouse, much like exchange-traded futures contracts. For a Fund utilizing centrally-cleared swaps, the exchange bears the risk of loss resulting from a counterparty not being able to pay. There is no guarantee that a fund or an underlying fund could eliminate its exposure under an outstanding swap agreement by entering into an offsetting swap agreement with the same or another party.
Total return swaps involve commitments where single or multiple cash flows are exchanged based on the price of an underlying reference asset (such as an index) for a fixed or variable interest rate. Total return swaps will usually be computed based on the current value of the reference asset as of the close of regular trading on the NYSE or other exchange, with the swap value being adjusted to include dividends accrued, financing charges and/or interest associated with the swap agreement. When utilizing total return swaps, the Fund bears the risk of loss of the amount expected to be received under a swap agreement in the event of the default or bankruptcy of a swap agreement counterparty or if the underlying reference asset declines in value.
| | THE GUGGENHEIM FUNDS SEMI-ANNUAL REPORT | 85 |
NOTES TO CONSOLIDATED FINANCIAL STATEMENTS (Unaudited)(continued) |
The following table represents the Fund’s use and volume of total return swaps on a monthly basis:
| | | Average Notional Amount | |
Use | | Long | | | Short | |
Income, Index exposure, Speculation | | $ | 430,177,776 | | | $ | 3,645,247 | |
Interest rate swaps involve the exchange by the Fund with another party for its respective commitment to pay or receive a fixed or variable interest rate on a notional amount of principal. Interest rate swaps are generally centrally-cleared, but central clearing does not make interest rate swap transactions risk free.
The following table represents the Fund’s use and volume of interest rate swaps on a monthly basis:
| | | Average Notional Amount | |
Use | | Pay Floating Rate | | | Receive Floating Rate | |
Duration, Hedge | | $ | 9,169,223,000 | | | $ | 30,000,000 | |
Credit default swaps are instruments which allow for the full or partial transfer of third party credit risk, with respect to a particular entity or entities, from one counterparty to the other. The Fund enters into credit default swaps as a “seller” or “buyer” of protection primarily to gain or reduce exposure to the investment grade and/or high yield bond market. A seller of credit default swaps is selling credit protection or assuming credit risk with respect to the underlying entity or entities. The buyer in a credit default swap is obligated to pay the seller a periodic stream of payments over the term of the contract provided that no event of default on an underlying reference obligation has occurred. If a credit event occurs, as defined under the terms of the swap agreement, the seller will either (i) pay to the buyer of protection an amount equal to the notional amount of the swap and take delivery of the referenced obligation or underlying securities comprising the referenced index or (ii) pay a net settlement amount in the form of cash or securities equal to the notional amount of the swap less the recovery value of the referenced obligation or underlying securities comprising the referenced index. The notional amount reflects the maximum potential amount the seller of credit protection could be required to pay to the buyer if a credit event occurs. The seller of protection receives periodic premium payments from the buyer and may also receive or pay an upfront premium adjustment to the stated periodic payments. In the event a credit default occurs on a credit default swap referencing an index, a factor adjustment will take place and the buyer of protection will receive a payment reflecting the par less the default recovery rate of the defaulted index component based on its weighting in the index. If no default occurs, the counterparty will pay the stream of payments and have no further obligations to the fund selling the credit protection. For a fund utilizing centrally cleared credit default swaps, the exchange bears the risk of loss resulting from a counterparty not being able to pay. For OTC credit default swaps, a fund bears the risk of loss of the amount expected to be received under a swap
86 | THE GUGGENHEIM FUNDS SEMI-ANNUAL REPORT | |
NOTES TO CONSOLIDATED FINANCIAL STATEMENTS (Unaudited)(continued) |
agreement in the event of the default or bankruptcy of a swap agreement counterparty, or in the case of a credit default swap in which a fund is selling credit protection, the default of a third party issuer.
The quoted market prices and resulting market values for credit default swap agreements on securities and credit indices serve as an indicator of the current status of the payment/performance risk and represent the likelihood of an expected liability (or profit) for the credit derivative had the notional amount of the swap agreement been closed/sold as of the period end. Increasing market values, in absolute terms when compared to the notional amount of the swap, represent a deterioration of the referenced entity’s credit soundness and a greater likelihood or risk of default or other credit event occurring as defined under the terms of the agreement.
The following table represents the Fund’s use and volume of credit default swaps on a monthly basis:
| | | Average Notional Amount | |
Use | | Protection Sold | | | Protection Purchased | |
Index exposure | | $ | 384,100,000 | | | $ | — | |
Forward Foreign Currency Exchange Contracts
A forward foreign currency exchange contract is an agreement between two parties to exchange two designated currencies at a specific time in the future. Certain types of contracts may be cash settled, in an amount equal to the change in exchange rates during the term of the contract. The contracts can be used to hedge or manage exposure to foreign currency risks with portfolio investments or to gain exposure to foreign currencies.
The market value of a forward foreign currency exchange contract changes with fluctuations in foreign currency exchange rates. Furthermore, the Fund may be exposed to risk if the counterparties cannot meet the contract terms or if the currency value changes unfavorably as compared to the U.S. dollar.
The following table represents the Fund’s use and volume of forward foreign currency exchange contracts on a monthly basis:
| | | Average Value | |
Use | | Purchased | | | Sold | |
Hedge, Income | | $ | 494,210,129 | | | $ | 650,730,855 | |
| | THE GUGGENHEIM FUNDS SEMI-ANNUAL REPORT | 87 |
NOTES TO CONSOLIDATED FINANCIAL STATEMENTS (Unaudited)(continued) |
Derivative Investment Holdings Categorized by Risk Exposure
The following is a summary of the location of derivative investments on the Fund’s Consolidated Statement of Assets and Liabilities as of March 31, 2021:
Derivative Investment Type | Asset Derivatives | Liability Derivatives |
Commodity contracts | Variation margin on futures contracts | |
Interest Rate contracts | Investments in unaffiliated issuers, at value | |
| | Unamortized upfront premiums paid on interest rate swap agreements | |
| Variation margin on interest rate swap agreements | |
Equity contracts | | Unrealized depreciation on OTC swap agreements |
| | Options written, at value |
Currency contracts | Unrealized appreciation on forward foreign currency exchange contracts | Unrealized depreciation on forward foreign currency exchange contracts |
The following tables set forth the fair value of the Fund’s derivative investments categorized by primary risk exposure at March 31, 2021:
Asset Derivative Investments Value |
| | Swaps
Equity Risk | | | Swaps
Interest
Rate Risk* | | | Futures
Commodity
Risk* | | | Options
Written
Equity Risk | | | Options
Purchased
Interest
Rate Risk | | | Forward
Foreign
Currency
Exchange
Risk | | | Total Value
at March 31,
2021 | |
| | | $ | — | | | $ | 2,520,639 | | | $ | 5,633,501 | | | $ | — | | | $ | 26,468,350 | | | $ | 46,715,229 | | | $ | 81,337,719 | |
Liability Derivative Investments Value |
| | Swaps
Equity Risk | | | Swaps
Interest
Rate Risk* | | | Futures
Commodity
Risk* | | | Options
Written
Equity Risk | | | Options
Purchased
Interest
Rate Risk | | | Forward
Foreign
Currency
Exchange
Risk | | | Total Value
at March 31,
2021 | |
| | | $ | 8,913,794 | | | $ | 1,657,391 | | | $ | — | | | $ | 129,602 | | | $ | — | | | $ | 16,753,307 | | | $ | 27,454,094 | |
* | Includes cumulative appreciation (depreciation) of exchange-traded, OTC and centrally-cleared derivatives contracts as reported on the Consolidated Schedule of Investments. For exchange-traded and centrally-cleared derivatives, variation margin is reported within the Consolidated Statement of Assets and Liabilities. |
88 | THE GUGGENHEIM FUNDS SEMI-ANNUAL REPORT | |
NOTES TO CONSOLIDATED FINANCIAL STATEMENTS (Unaudited)(continued) |
The following is a summary of the location of derivative investments on the Fund’s Consolidated Statement of Operations for the period ended March 31, 2021:
Derivative Investment Type | Location of Gain (Loss) on Derivatives |
Interest Rate/Commodity contracts | Net realized gain (loss) on futures contracts |
| Net change in unrealized appreciation (depreciation) on futures contracts |
Equity/Credit/Interest Rate contracts | Net realized gain (loss) on swap agreements |
| Net change in unrealized appreciation (depreciation) on swap agreements |
Equity/Interest Rate contracts | Net realized gain (loss) on options purchased |
| | Net change in unrealized appreciation (depreciation) on options purchased |
| Net change in unrealized appreciation (depreciation) on options written |
Currency contracts | Net realized gain (loss) on forward foreign currency exchange contracts |
| Net change in unrealized appreciation (depreciation) on forward foreign currency exchange contracts |
The following is a summary of the Fund’s realized gain (loss) and change in unrealized appreciation (depreciation) on derivative investments recognized on the Consolidated Statement of Operations categorized by primary risk exposure for the period ended March 31, 2021:
Realized Gain (Loss) on Derivative Investments Recognized on the Consolidated Statement of Operations |
| | Futures
Commodity
Risk | | | Futures
Interest
Rate Risk | | | Swaps
Equity
Risk | | | Swaps
Interest
Rate Risk | | | Swaps
Credit
Risk | |
| | | $ | (31,531,045 | ) | | $ | 90,713 | | | $ | 133,439 | | | $ | 24,013,591 | | | $ | 42,991,470 | |
| | Options
Purchased
Interest
Rate Risk | | | Options
Written
Equity Risk | | | Forward
Foreign
Currency
Exchange Risk | | | Total | |
| | | $ | 11,427,910 | | | $ | — | | | $ | 20,894,331 | | | $ | 68,020,409 | |
Change in Unrealized Appreciation (Depreciation) on Derivative Investments
Recognized on the Consolidated Statement of Operations |
| | Futures
Commodity
Risk | | | Futures
Interest
Rate Risk | | | Swaps
Equity
Risk | | | Swaps
Interest
Rate Risk | | | Swaps
Credit
Risk | |
| | | $ | 10,678,575 | | | $ | — | | | $ | (6,595,786 | ) | | $ | 264,921 | | | $ | (7,442,657 | ) |
| | THE GUGGENHEIM FUNDS SEMI-ANNUAL REPORT | 89 |
NOTES TO CONSOLIDATED FINANCIAL STATEMENTS (Unaudited)(continued) |
Change in Unrealized Appreciation (Depreciation) on Derivative Investments
Recognized on the Consolidated Statement of Operations (continued) |
| | Options
Purchased
Interest
Rate Risk | | | Options
Written
Equity Risk | | | Forward
Foreign
Currency
Exchange Risk | | | Total | |
| | | $ | 14,117,707 | | | $ | 153,961 | | | $ | (17,979,550 | ) | | $ | (6,802,829 | ) |
In conjunction with short sales and the use of derivative instruments, the Fund is required to maintain collateral in various forms. Depending on the financial instrument utilized and the broker involved, the Fund uses margin deposits at the broker, cash and/or securities segregated at the custodian bank, discount notes or repurchase agreements allocated to the Fund as collateral.
Foreign Investments
There are several risks associated with exposure to foreign currencies, foreign issuers and emerging markets. The Fund’s indirect and direct exposure to foreign currencies subjects the Fund to the risk that those currencies will decline in value relative to the U.S. dollar, or in the case of short positions, that the U.S. dollar will decline in value relative to the currency being hedged. Currency rates in foreign countries may fluctuate significantly over short periods of time for a number of reasons, including changes in interest rates and the imposition of currency controls or other political developments in the U.S. or abroad. In addition, the Fund may incur transaction costs in connection with conversions between various currencies. The Fund may, but is not obligated to, engage in currency hedging transactions, which generally involve buying currency forward, options or futures contracts. However, not all currency risks may be effectively hedged, and in some cases the costs of hedging techniques may outweigh expected benefits. In such instances, the value of securities denominated in foreign currencies can change significantly when foreign currencies strengthen or weaken relative to the U.S. dollar.
The Fund may invest in securities of foreign companies directly, or in financial instruments, such as ADRs and exchange-traded funds, which are indirectly linked to the performance of foreign issuers. Foreign markets can be more volatile than the U.S. market due to increased risks of adverse issuer, political, regulatory, market, or economic developments and can perform differently from the U.S. market. Investing in securities of foreign companies directly, or in financial instruments that are indirectly linked to the performance of foreign issuers, may involve risks not typically associated with investing in U.S. issuers. The value of securities denominated in foreign currencies, and of dividends from such securities, can change significantly when foreign currencies strengthen or weaken relative to the U.S. dollar. Foreign securities markets generally have less trading volume and less liquidity than U.S. markets, and prices in some foreign markets may fluctuate more than those of securities traded on U.S. markets. Many foreign countries lack accounting and disclosure standards comparable to those that apply to U.S. companies, and it may be more difficult to obtain reliable information regarding a foreign issuer’s financial condition and operations. Transaction costs and costs associated with custody services are
90 | THE GUGGENHEIM FUNDS SEMI-ANNUAL REPORT | |
NOTES TO CONSOLIDATED FINANCIAL STATEMENTS (Unaudited)(continued) |
generally higher for foreign securities than they are for U.S. securities. Some foreign governments levy withholding taxes against dividend and interest income. Although in some countries portions of these taxes are recoverable, the non-recovered portion will reduce the income received by the Fund.
The Trust has established counterparty credit guidelines and enters into transactions only with financial institutions of investment grade or better. The Trust monitors the counterparty credit risk.
Note 3 – Offsetting
In the normal course of business, the Fund enters into transactions subject to enforceable master netting arrangements or other similar arrangements. Generally, the right to offset in those agreements allows the Fund to counteract the exposure to a specific counterparty with collateral received from or delivered to that counterparty based on the terms of the arrangements. These arrangements provide for the right to liquidate upon the occurrence of an event of default, credit event upon merger or additional termination event.
In order to better define its contractual rights and to secure rights that will help the Fund mitigate its counterparty risk, the Fund may enter into an International Swaps and Derivatives Association, Inc. Master Agreement (“ISDA Master Agreement”) or similar agreement with its derivative contract counterparties. An ISDA Master Agreement is a bilateral agreement between a fund and a counterparty that governs OTC derivatives, including foreign exchange contracts, and typically contains, among other things, collateral posting terms and netting provisions in the event of a default and/or termination event. The provisions of the ISDA Master Agreement typically permit a single net payment in the event of a default (close-out netting) or similar event, including the bankruptcy or insolvency of the counterparty.
For derivatives traded under an ISDA Master Agreement, the collateral requirements are typically calculated by netting the mark-to-market amount for each transaction under such agreement and comparing that amount to the value of any collateral currently pledged by the Fund and the counterparty. For financial reporting purposes, cash collateral that has been pledged to cover obligations of the Fund and cash collateral received from the counterparty, if any, are reported separately on the Consolidated Statement of Assets and Liabilities as segregated cash with broker/receivable for variation margin, or payable for swap settlement/variation margin. Cash and/or securities pledged or received as collateral by the Fund in connection with an OTC derivative subject to an ISDA Master Agreement generally may not be invested, sold or rehypothecated by the counterparty or the Fund, as applicable, absent an event of default under such agreement, in which case such collateral generally may be applied towards obligations due to and payable by such counterparty or the Fund, as applicable. Generally, the amount of collateral due from or to a counterparty must exceed a minimum transfer amount threshold (e.g., $300,000) before a transfer is required to be made. To the extent amounts due to the Fund from its counterparties are not fully collateralized, contractually or otherwise, the Fund bears the risk of loss from
| | THE GUGGENHEIM FUNDS SEMI-ANNUAL REPORT | 91 |
NOTES TO CONSOLIDATED FINANCIAL STATEMENTS (Unaudited)(continued) |
counterparty nonperformance. The Fund attempts to mitigate counterparty risk by only entering into agreements with counterparties that it believes to be of good standing and by monitoring the financial stability of those counterparties.
For financial reporting purposes, the Fund does not offset derivative assets and derivative liabilities that are subject to netting arrangements in the Consolidated Statement of Assets and Liabilities.
The following tables present derivative financial instruments and secured financing transactions that are subject to enforceable netting arrangements:
| | | | | | | | | | | | | | | Gross Amounts Not Offset in
the Consolidated Statement
of Assets and Liabilities | | | | | |
Instrument | | Gross
Amounts of
Recognized
Assets1 | | | Gross
Amounts
Offset in the
Consolidated
Statement of
Assets and
Liabilities | | | Net Amount
of Assets
Presented
on the
Consolidated
Statement of
Assets and
Liabilities | | | Financial
Instruments | | | Cash
Collateral
Received | | | Net Amount | |
Forward foreign currency exchange contracts | | $ | 46,715,229 | | | $ | — | | | $ | 46,715,229 | | | $ | (16,556,008 | ) | | $ | (28,989,648 | ) | | $ | 1,169,573 | |
Options purchased | | | 26,468,350 | | | | — | | | | 26,468,350 | | | | — | | | | (19,273,842 | ) | | | 7,194,508 | |
| | | | | | | | | | | | | | | Gross Amounts Not Offset
in the Consolidated Statement
of Assets and Liabilities | | | | | |
Instrument | | Gross
Amounts of
Recognized
Liabilities1 | | | Gross
Amounts
Offset in the
Consolidated
Statement of
Assets and
Liabilities | | | Net Amount
of Liabilities
Presented
on the
Consolidated
Statement of
Assets and
Liabilities | | | Financial
Instruments | | | Cash
Collateral
Pledged | | | Net Amount | |
Forward foreign currency exchange contracts | | $ | 16,753,307 | | | $ | — | | | $ | 16,753,307 | | | $ | (16,556,008 | ) | | $ | — | | | $ | 197,299 | |
Equity index swap agreements | | | 8,913,794 | | | | — | | | | 8,913,794 | | | | — | | | | (8,913,794 | ) | | | — | |
Options written | | | 129,602 | | | | — | | | | 129,602 | | | | — | | | | — | | | | 129,602 | |
1 | Exchange-traded or centrally-cleared derivatives are excluded from these reported amounts. |
92 | THE GUGGENHEIM FUNDS SEMI-ANNUAL REPORT | |
NOTES TO CONSOLIDATED FINANCIAL STATEMENTS (Unaudited)(continued) |
The Fund has the right to offset deposits against any related derivative liabilities outstanding with each counterparty with the exception of exchange-traded or centrally-cleared derivatives. The following table presents deposits held by others in connection with derivative investments as of March 31, 2021.
Counterparty | Asset Type | | Cash Pledged | | | Cash Received | |
Barclays Bank plc | Forward foreign currency exchange contracts, Total return swap agreements | | $ | — | | | $ | 9,699,000 | |
BNP Paribas | Total return swap agreements | | | 11,552,000 | | | | — | |
Citibank N.A. | Forward foreign currency exchange contracts | | | — | | | | 6,199,903 | |
Goldman Sachs International | Futures contracts, Total return swap agreements, Options purchased | | | — | | | | 18,770,000 | |
J.P. Morgan Securities LLC | Credit default swap agreements | | | — | | | | 188,636 | |
J.P. Morgan Securities LLC | Interest rate swap agreements | | | 2,344,054 | | | | 1,980,065 | |
JPMorgan Chase Bank, N.A. | Forward foreign currency exchange contracts | | | — | | | | 3,250,000 | |
Morgan Stanley Capital Services LLC | Forward foreign currency exchange contracts, Options purchased | | | — | | | | 13,450,000 | |
| | | | $ | 13,896,054 | | | $ | 53,537,604 | |
Note 4 – Fair Value Measurement
In accordance with U.S. GAAP, fair value is defined as the price that the Fund would receive to sell an investment or pay to transfer a liability in an orderly transaction with an independent buyer in the principal market, or in the absence of a principal market, the most advantageous market for the investment or liability. U.S. GAAP establishes a three-tier fair value hierarchy based on the types of inputs used to value assets and liabilities and requires corresponding disclosure. The hierarchy and the corresponding inputs are summarized below:
Level 1 — | quoted prices in active markets for identical assets or liabilities. |
Level 2 — | significant other observable inputs (for example quoted prices for securities that are similar based on characteristics such as interest rates, prepayment speeds, credit risk, etc.). |
Level 3 — | significant unobservable inputs based on the best information available under the circumstances, to the extent observable inputs are not available, which may include assumptions. |
The types of inputs available depend on a variety of factors, such as the type of security and the characteristics of the markets in which it trades, if any. Fair valuation determinations that rely on fewer or no observable inputs require greater judgment. Accordingly, fair value determinations for Level 3 securities require the greatest amount of judgment.
| | THE GUGGENHEIM FUNDS SEMI-ANNUAL REPORT | 93 |
NOTES TO CONSOLIDATED FINANCIAL STATEMENTS (Unaudited)(continued) |
Independent pricing services are used to value a majority of the Fund’s investments. When values are not available from a pricing service, they will be determined using a variety of sources and techniques, including: market prices; broker quotes; and models which derive prices based on inputs such as prices of securities with comparable maturities and characteristics or based on inputs such as anticipated cash flows or collateral, spread over U.S. Treasury securities, and other information and analysis. A significant portion of the Fund’s assets and liabilities are categorized as Level 2, as indicated in this report.
Quotes from broker-dealers, adjusted for fluctuations in criteria such as credit spreads and interest rates, may also be used to value the Fund’s assets and liabilities, i.e. prices provided by a broker-dealer or other market participant who has not committed to trade at that price. Although quotes are typically received from established market participants, the Fund may not have the transparency to view the underlying inputs which support the market quotations. Significant changes in a quote would generally result in significant changes in the fair value of the security.
Certain fixed income securities are valued by obtaining a monthly quote from a broker-dealer, adjusted for fluctuations in criteria such as credit spreads and interest rates.
Certain loans and other securities are valued using a single daily broker quote or a price from a third party vendor based on a single daily or monthly broker quote.
The inputs or methodologies used for valuing securities are not necessarily an indication of the risk associated with investing in those securities. The suitability of the techniques and sources employed to determine fair valuation are regularly monitored and subject to change.
Note 5 – Investment Advisory Agreement and Other Agreements
Under the terms of an investment advisory contract, the Fund pays GI investment advisory fees calculated at an annualized rate of 0.89% of the average daily net assets of the Fund. A breakpoint of 5 basis points (0.05%) on average daily net assets above $5 billion will apply to the Fund’s advisory fees.
GI has contractually agreed to waive the management fee it receives from the Subsidiary in an amount equal to the management fee paid to GI by the Subsidiary. This undertaking will continue in effect for so long as the Fund invests in the Subsidiary, and may not be terminated by GI unless GI obtains the prior approval of the Fund’s Board for such termination. Fees waived under this arrangement are not subject to reimbursement to GI. For the period ended March 31, 2021, the Fund waived $138,182 related to advisory fees in the Subsidiary.
GI pays operating expenses on behalf of the Trust, such as audit and accounting related services, legal services, custody, printing and mailing, among others, on a pass-through basis. Such expenses are allocated to various Funds within the complex based on relative net assets.
94 | THE GUGGENHEIM FUNDS SEMI-ANNUAL REPORT | |
NOTES TO CONSOLIDATED FINANCIAL STATEMENTS (Unaudited)(continued) |
The Board has adopted Distribution Plans related to the offering of A-Class, C-Class and P-Class shares pursuant to Rule 12b-1 under the 1940 Act. The plans provide for payments at an annual rate of 0.25% of the average daily net assets of the Fund’s A-Class and P-Class shares, and 1.00% of the average daily net assets of the Fund’s C-Class shares.
The investment advisory contract for the Fund provides that the total expenses be limited to a percentage of average net assets for each class of shares, exclusive of brokerage costs, dividends or interest on securities sold short, expenses of other investment companies in which the Fund invests, interest, taxes, litigation, indemnification and extraordinary expenses. The limits are listed below:
| | Limit | | | Effective
Date | | | Contract
End Date | |
Macro Opportunities Fund - A-Class | | | 1.36 | % | | | 11/30/12 | | | | 02/01/22 | |
Macro Opportunities Fund - C-Class | | | 2.11 | % | | | 11/30/12 | | | | 02/01/22 | |
Macro Opportunities Fund - P-Class | | | 1.36 | % | | | 05/01/15 | | | | 02/01/22 | |
Macro Opportunities Fund - Institutional Class | | | 0.95 | % | | | 11/30/12 | | | | 02/01/22 | |
Macro Opportunities Fund - R6-Class | | | 0.95 | % | | | 03/13/19 | | | | 02/01/22 | |
GI is entitled to reimbursement by the Fund for fees waived or expenses reimbursed during any of the previous 36 months, beginning on the date of the expense limitation agreement, if on any day the estimated operating expenses are less than the indicated percentages. For purposes of this arrangement, GI is entitled to recoupment of previously waived fees or reimbursed expenses for 36 months from the date of the waiver or reimbursement by GI. At March 31, 2021, the amount of fees waived or expenses reimbursed that are subject to recoupment and will expire during the years ended September 30, are presented in the following table:
Fund | | 2021 | | | 2022 | | | 2023 | | | 2024 | | | Total | |
A-Class | | $ | 193,875 | | | $ | 254,243 | | | $ | 249,814 | | | $ | 74,267 | | | $ | 772,199 | |
C-Class | | | 65,119 | | | | 126,349 | | | | 150,071 | | | | 45,489 | | | | 387,028 | |
P-Class | | | 83,132 | | | | 49,360 | | | | 65,030 | | | | 23,051 | | | | 220,573 | |
Institutional Class | | | 4,361,330 | | | | 6,566,140 | | | | 5,879,352 | | | | 2,675,687 | | | | 19,482,509 | |
R6-Class | | | — | | | | 3,990 | | | | 41,632 | | | | 31,632 | | | | 77,254 | |
For the period ended March 31, 2021, GI recouped $312,400 from the Fund.
If the Fund invests in a fund that is advised by the same adviser or an affiliated adviser, the investing Fund’s adviser has agreed to waive fees at the investing fund level to the extent necessary to offset the proportionate share of any management fee paid by the Fund with respect to its investment in such affiliated fund. Fee waivers will be calculated at the investing Fund level without regard to any expense cap, if any, in effect for the investing Fund. Fees waived under this arrangement are not subject to reimbursement to GI. For the period ended March 31, 2021, the Fund waived $351,650 related to investments in affiliated funds.
| | THE GUGGENHEIM FUNDS SEMI-ANNUAL REPORT | 95 |
NOTES TO CONSOLIDATED FINANCIAL STATEMENTS (Unaudited)(continued) |
For the period ended March 31, 2021, GFD retained sales charges of $192,037 relating to sales of A-Class shares of the Trust.
Certain trustees and officers of the Trust are also officers of GI and/or GFD. The Trust does not compensate its officers or trustees who are officers, directors and/or employees of GI or GFD.
MUFG Investor Services (US), LLC (“MUIS”) acts as the Fund’s administrator, transfer agent and accounting agent. As administrator, transfer agent and accounting agent, MUIS maintains the books and records of the Fund’s securities and cash. The Bank of New York Mellon Corp. (“BNY”) acts as the Fund’s custodian. As custodian, BNY is responsible for the custody of the Fund’s assets. For providing the aforementioned administrative and accounting services, MUIS is entitled to receive a monthly fee equal to a percentage of the Fund’s average daily net assets and out of pocket expenses. For providing the aforementioned transfer agent and custodian services, MUIS and BNY are entitled to receive a monthly fee based on the number of transactions during the month and the number of accounts under management, subject to certain minimum monthly fees, and out of pocket expenses.
Note 6 – Reverse Repurchase Agreements
The Fund may enter into reverse repurchase agreements. Under a reverse repurchase agreement, the Fund sells securities and agrees to repurchase them at a particular price at a future date. In the event the buyer of securities under a reverse repurchase agreement files for bankruptcy or becomes insolvent, such buyer or its trustee or receiver may receive an extension of time to determine whether to enforce the Fund’s obligation to repurchase the securities, and the Fund’s use of the proceeds of the reverse repurchase agreement may effectively be restricted pending such decision.
For the period ended March 31, 2021, the Fund entered into reverse repurchase agreements:
| | Number of Days
Outstanding | | | Balance at
March 31, 2021 | | | Average Balance
Outstanding | | | Average
Interest Rate | |
| | | | 182 | | | $ | 72,259,339 | | | $ | 160,462,181 | | | | 0.47 | % |
96 | THE GUGGENHEIM FUNDS SEMI-ANNUAL REPORT | |
NOTES TO CONSOLIDATED FINANCIAL STATEMENTS (Unaudited)(continued) |
The following table presents reverse repurchase agreements that are subject to netting arrangements and offset in the Consolidated Statement of Assets and Liabilities in conformity with U.S. GAAP:
| | | | | | | | | | | | | | | Gross Amounts Not Offset in
the Consolidated Statement
of Assets and Liabilities | | | | | |
Instrument | | Gross
Amounts of
Recognized
Liabilities | | | Gross
Amounts
Offset in the
Consolidated
Statement of
Assets and
Liabilities | | | Net Amount
of Liabilities
Presented
on the
Consolidated
Statement of
Assets and
Liabilities | | | Financial
Instruments | | | Cash
Collateral
Pledged | | | Net Amount | |
Reverse Repurchase Agreements | | $ | 72,259,339 | | | $ | — | | | $ | 72,259,339 | | | $ | (72,259,339 | ) | | $ | — | | | $ | — | |
As of March 31, 2021, there was $72,259,339 in reverse repurchase agreements outstanding. The Fund had outstanding reverse repurchase agreements with various counterparties. Details of the reverse repurchase agreements by counterparty are as follows:
Counterparty | | Range of
Interest
Rates | | | Maturity
Dates | | | Repurchase
Price | |
BMO Capital Markets Corp., New York Branch | | | 0.45 | % | | | 05/03/21 | | | $ | 71,335,559 | |
BNP Paribas | | | (0.10 | %) | | | Open Maturity | | | | 923,780 | |
The following is a summary of the remaining contractual maturities of the reverse repurchase agreements outstanding as of period-end, aggregated by asset class of the related collateral pledged by the Fund:
| | | | | Up to 30 days | | | Overnight and
continuous | | | Total | |
Corporate Bonds | | | $ | 71,335,559 | | | $ | 923,780 | | | $ | 72,259,339 | |
Gross amount of recognized liabilities for reverse repurchase agreements | | | $ | 71,335,559 | | | $ | 923,780 | | | $ | 72,259,339 | |
Note 7 – Federal Income Tax Information
The Fund intends to comply with the provisions of Subchapter M of the Internal Revenue Code applicable to regulated investment companies and will distribute substantially all taxable net investment income and capital gains sufficient to relieve the Fund from all, or substantially all, federal income, excise and state income taxes. Therefore, no provision for federal or state income tax or federal excise tax is required.
| | THE GUGGENHEIM FUNDS SEMI-ANNUAL REPORT | 97 |
NOTES TO CONSOLIDATED FINANCIAL STATEMENTS (Unaudited)(continued) |
Tax positions taken or expected to be taken in the course of preparing the Fund’s tax returns are evaluated to determine whether the tax positions are “more-likely-than-not” of being sustained by the applicable tax authority. Tax positions not deemed to meet the more-likely-than-not threshold would be recorded as a tax benefit or expense in the current year. Management has analyzed the Fund’s tax positions taken, or to be taken, on U.S. federal income tax returns for all open tax years, and has concluded that no provision for income tax is required in the Fund’s financial statements. The Fund’s U.S. federal income tax returns are subject to examination by the Internal Revenue Service (“IRS”) for a period of three years after they are filed.
The Fund intends to invest up to 25% of its assets in the Subsidiary which is expected to provide the Fund with exposure to the commodities markets within the limitations of the U.S. federal income tax requirements under Subchapter M of the Internal Revenue Code. The Fund has received a private letter ruling from the IRS that concludes that the income the Fund receives from the Subsidiary will constitute qualifying income for purposes of Subchapter M of the Internal Revenue Code. The Subsidiary will be classified as a corporation for U.S. federal income tax purposes. A foreign corporation, such as the Subsidiary, will generally not be subject to U.S. federal income taxation unless it is deemed to be engaged in a U.S. trade or business. If, during a taxable year, the Subsidiary’s taxable losses (and other deductible items) exceed its income and gains, the net loss will not pass through to the Fund as a deductible amount for U.S. federal income tax purposes and cannot be carried forward to reduce future income from the Subsidiary in subsequent years.
At March 31, 2021, the cost of investments for U.S. federal income tax purposes, the aggregate gross unrealized appreciation for all investments for which there was an excess of value over tax cost, and the aggregate gross unrealized depreciation for all investments for which there was an excess of tax cost over value, were as follows:
| | Tax
Cost | | | Tax
Unrealized
Appreciation | | | Tax
Unrealized
Depreciation | | | Net Tax Unrealized
Appreciation
(Depreciation) | |
| | $ | 6,873,011,910 | | | $ | 308,976,177 | | | $ | (137,734,528 | ) | | $ | 171,241,649 | |
Note 8 – Securities Transactions
For the period ended March 31, 2021, the cost of purchases and proceeds from sales of investment securities, excluding government securities, short-term investments and derivatives, were as follows:
| | Purchases | | | Sales | |
| | $ | 2,494,489,345 | | | $ | 1,242,730,602 | |
98 | THE GUGGENHEIM FUNDS SEMI-ANNUAL REPORT | |
NOTES TO CONSOLIDATED FINANCIAL STATEMENTS (Unaudited)(continued) |
For the period ended March 31, 2021, the cost of purchases and proceeds from the sales of government securities were as follows:
| | Purchases | | | Sales | |
| | $ | 9,925,575 | | | $ | 9,807,034 | |
The Fund is permitted to purchase or sell securities from or to certain affiliated funds under specified conditions outlined in procedures adopted by the Board. The procedures have been designed to ensure that any purchase or sale of securities by the Fund from or to another fund or portfolio that is or could be considered an affiliate by virtue of having a common investment adviser (or affiliated investment advisers), common trustees and/or common officers complies with Rule 17a-7 of the 1940 Act. Further, as defined under these procedures, each transaction is effected at the current market price to save costs, where permissible. For the period ended March 31, 2021, the Fund engaged in purchases and sales of securities, pursuant to Rule 17a-7 of the 1940 Act, as follows:
| | Purchases | | | Sales | | | Realized
Gain | |
| | $ | 13,481,353 | | | $ | 41,534,527 | | | $ | 4,709,489 | |
Note 9 – Unfunded Loan Commitments
Pursuant to the terms of certain loan agreements, the Fund held unfunded loan commitments as of March 31, 2021. The Fund is obligated to fund these loan commitments at the borrower’s discretion.
The unfunded loan commitments as of March 31, 2021, were as follows:
Borrower | | Maturity
Date | | | Face
Amount* | | | Value | |
AI Aqua Zip Bidco Pty Ltd. | | | 12/13/23 | | | | 3,650,000 | | | $ | 4,558 | |
Aspect Software, Inc. | | | 07/15/23 | | | | 144,301 | | | | 1,118 | |
CapStone Acquisition Holdings, Inc. | | | 10/29/27 | | | | 3,807,600 | | | | 35,853 | |
DG Investment Intermediate Holdings 2, Inc. | | | 03/17/28 | | | | 1,830,000 | | | | 10,285 | |
FCG Acquisitions, Inc | | | 03/16/28 | | | | 2,590,000 | | | | 16,187 | |
Fortis Solutions Group LLC | | | 12/15/23 | | | | 503,680 | | | | 3,274 | |
Galls LLC | | | 01/31/24 | | | | 111,351 | | | | 6,854 | |
HAH Group Holding Co. LLC | | | 10/29/27 | | | | 1,380,000 | | | | 19,404 | |
Higginbotham | | | 11/25/22 | | | | 2,844,509 | | | | 17,508 | |
Jones Deslauriers Insurance Management, Inc. | | | 03/12/28 | | | CAD | 6,370,000 | | | | — | |
MB2 Dental Solutions LLC | | | 01/29/27 | | | | 6,635,096 | | | | 64,501 | |
National Mentor Holdings, Inc. | | | 02/18/28 | | | | 1,500,000 | | | | 7,380 | |
Peraton Corp. | | | 02/22/28 | | | | 10,936,022 | | | | 53,909 | |
SCP Eye Care Services LLC | | | 03/11/28 | | | | 2,407,955 | | | | 3,010 | |
Service Logic Acquisition, Inc. | | | 10/22/27 | | | | 2,442,985 | | | | 22,914 | |
| | THE GUGGENHEIM FUNDS SEMI-ANNUAL REPORT | 99 |
NOTES TO CONSOLIDATED FINANCIAL STATEMENTS (Unaudited)(continued) |
Borrower | | Maturity
Date | | | Face
Amount* | | | Value | |
Sitecore Holding III A/S | | | 03/12/26 | | | | 615,333 | | | $ | 9,230 | |
Solera LLC | | | 12/02/22 | | | | 7,940,287 | | | | 51,056 | |
Southern Veterinary Partners LLC | | | 10/05/27 | | | | 1,478,788 | | | | 13,764 | |
Team.Blue Finco SARL | | | 03/18/28 | | | EUR | 756,757 | | | | 3,771 | |
Trader Interactive | | | 06/15/23 | | | | 430,769 | | | | 7,653 | |
TricorBraun Holdings, Inc. | | | 03/03/28 | | | | 1,668,554 | | | | 17,386 | |
Venture Global Calcasieu Pass LLC | | | 08/19/26 | | | | 5,701,901 | | | | 313,605 | |
Vertical (TK Elevator) | | | 01/30/27 | | | EUR | 13,250,000 | | | | 1,539,259 | |
Zephyr Bidco Ltd. | | | 04/08/22 | | | GBP | 20,850,000 | | | | 3 | |
| | | | | | | | | | | $ | 2,222,482 | |
* | The face amount is denominated in U.S. dollars unless otherwise indicated. |
Note 10 – Restricted Securities
The securities below are considered illiquid and restricted under guidelines established by the Board:
Restricted
Securities | | Acquisition
Date | | | Cost | | | Value | |
Airplanes Pass Through Trust | | | | | | | | | | | | |
2001-1A, due 03/15/191 | | | 01/18/12 | | | $ | 1,691,716 | | | $ | 210 | |
Atlas Mara Ltd. | | | | | | | | | | | | |
8.00% due 03/20/21 | | | 10/01/15 | | | | 14,373,834 | | | | 6,981,120 | |
Basic Energy Services, Inc. | | | | | | | | | | | | |
10.75% due 10/15/23 | | | 09/25/18 | | | | 1,490,164 | | | | 300,000 | |
Copper River CLO Ltd. | | | | | | | | | | | | |
2007-1A, due 01/20/212 | | | 05/09/14 | | | | 233,090 | | | | 240,099 | |
FKRT | | | | | | | | | | | | |
2020-C2A, 3.25% due 12/30/23 | | | 12/03/20 | | | | 26,196,642 | | | | 26,213,150 | |
Mirabela Nickel Ltd. | | | | | | | | | | | | |
due 06/24/191 | | | 12/31/13 | | | | 1,710,484 | | | | 75,417 | |
Princess Juliana International Airport Operating Company N.V. | | | | | | | | | | | | |
5.50% due 12/20/27 | | | 12/17/12 | | | | 1,182,198 | | | | 1,061,209 | |
Putnam Structured Product Funding Ltd. | | | | | | | | | | | | |
2003-1A, 1.18% (1 Month USD LIBOR + 1.00%, Rate Floor: 0.00%) due 10/15/383 | | | 06/01/16 | | | | 1,004,356 | | | | 1,059,215 | |
Secured Tenant Site Contract Revenue Notes Series | | | | | | | | | | | | |
2018-1A, 4.70% due 06/15/48 | | | 05/25/18 | | | | 6,794,676 | | | | 6,999,198 | |
Station Place Securitization Trust Series | | | | | | | | | | | | |
2020-WL1, 3.36% (1 Month USD LIBOR + 3.25%, Rate Floor: 0.00%) due 06/25/513 | | | 07/15/20 | | | | 2,600,000 | | | | 2,600,000 | |
100 | THE GUGGENHEIM FUNDS SEMI-ANNUAL REPORT | |
NOTES TO CONSOLIDATED FINANCIAL STATEMENTS (Unaudited)(continued) |
Restricted
Securities | | Acquisition
Date | | | Cost | | | Value | |
Turbine Engines Securitization Ltd. | | | | | | | | | | | | |
2013-1A, 5.13% due 12/13/48 | | | 11/27/13 | | | $ | 1,934,397 | | | $ | 1,555,001 | |
2013-1A, 6.38% due 12/13/48 | | | 11/27/13 | | | | 1,454,721 | | | | 1,013,301 | |
| | | | | | | $ | 60,666,278 | | | $ | 48,097,920 | |
1 | Security is in default of interest and/or principal obligations. |
2 | Security has no stated coupon. However, it is expected to receive residual cash flow payments on defined deal dates. |
3 | Variable rate security. Rate indicated is the rate effective at March 31, 2021. In some instances, the effective rate is limited by a minimum rate floor or a maximum rate cap established by the issuer. The settlement status of a position may also impact the effective rate indicated. In some cases, a position may be unsettled at period end and may not have a stated effective rate. In instances where multiple underlying reference rates and spread amounts are shown, the effective rate is based on a weighted average. |
Note 11 – Line of Credit
The Trust, along with other affiliated trusts, secured a 364-day committed, $1,230,000,000 line of credit from Citibank, N.A., which was in place through October 2, 2020, at which time the line of credit was renewed. A Fund may draw (borrow) from the line of credit as a temporary measure for emergency purposes, to facilitate redemption requests, or for other short-term liquidity purposes consistent with the Fund’s investment objective and program. For example, it may be advantageous for the Fund to borrow money rather than sell existing portfolio positions to meet redemption requests. Fees related to borrowings, if any, vary under this arrangement between the greater of Citibank’s “base rate”, LIBOR plus 1%, or the federal funds rate plus 1/2 of 1%.
The commitment fee that may be paid by the Fund is at an annualized rate of 0.15% of the average daily amount of its allocated unused commitment amount. The allocated commitment fee amount for the Fund is referenced in the Consolidated Statement of Operations under “Line of credit fees”. The Fund did not have any borrowings under this agreement as of and for the period ended March 31, 2021.
Note 12 – COVID-19
The global ongoing crisis caused by the outbreak of COVID-19 and the current recovery underway is causing disruption to consumer demand and economic output and supply chains. There are still travel restrictions and quarantines, and adverse impacts on local and global economies. Investors should be aware that in light of the current uncertainty, volatility and distress in economies, financial markets, and labor and public health conditions around the world, the Fund’s investments and a shareholder’s investment in the Fund are subject to sudden and substantial losses, increased volatility and other adverse events. Firms through which investors invest with the Fund, the Fund, its service providers, the markets in which it invests and market intermediaries are also impacted by quarantines and similar measures intended to respond to and contain the ongoing pandemic, which can obstruct their functioning and subject them to heightened operational and other risks.
| | THE GUGGENHEIM FUNDS SEMI-ANNUAL REPORT | 101 |
NOTES TO CONSOLIDATED FINANCIAL STATEMENTS (Unaudited)(concluded) |
Note 13 – Subsequent Events
The Fund evaluated subsequent events through the date the consolidated financial statements were available for issue and determined there were no material events that would require adjustment to or disclosure in the Fund’s consolidated financial statements.
102 | THE GUGGENHEIM FUNDS SEMI-ANNUAL REPORT | |
OTHER INFORMATION (Unaudited) |
Delivery of Shareholder Reports
Paper copies of the Fund’s annual and semi-annual shareholder reports are not sent by mail, unless you specifically request paper copies of the reports from a fund or from your financial intermediary. Instead, the reports are made available on a website, and you are notified by mail each time a report is posted and provided with a website link to access the report.
You may elect to receive all future shareholder reports in paper free of charge. If you hold shares of a fund directly, you can inform the Fund that you wish to receive paper copies of reports by calling 800.820.0888. If you hold shares of a fund through a financial intermediary, please contact the financial intermediary to make this election. Your election to receive reports in paper may apply to all Guggenheim Funds in which you are invested and may apply to all Guggenheim funds held with your financial intermediary.
Proxy Voting Information
A description of the policies and procedures that the Trust uses to determine how to vote proxies relating to securities held in the Fund’s portfolio is available, without charge and upon request, by calling 800.820.0888. This information is also available from the EDGAR database on the SEC’s website at https://www.sec.gov.
Information regarding how the Fund voted proxies relating to portfolio securities during the most recent 12-month period ended June 30 is available without charge, upon request, by calling 800.820.0888. This information is also available from the EDGAR database on the SEC’s website at https://www.sec.gov.
Sector Classification
Information in the Schedule of Investments is categorized by sectors using sector-level Classifications defined by the Bloomberg Industry Classification System, a widely recognized industry classification system provider. The Fund’s registration statement has investment policies relating to concentration in specific sectors/industries. For purposes of these investment policies, the Fund usually classifies sectors/industries based on industry-level Classifications used by widely recognized industry classification system providers such as Bloomberg Industry Classification System, Global Industry Classification Standards and Barclays Global Classification Scheme.
Quarterly Portfolio Schedules Information
The Trust files its complete schedule of portfolio holdings with the SEC for the first and third quarters of each fiscal year as an exhibit to its reports on Form N-PORT, and for reporting periods ended prior to March 31, 2019, filed such information on Form N-Q. The Fund’s Forms N-PORT and N-Q are available on the SEC’s website at https://www.sec.gov. Copies of the portfolio holdings are also available to shareholders, without charge and upon request, by calling 800.820.0888.
| | THE GUGGENHEIM FUNDS SEMI-ANNUAL REPORT | 103 |
INFORMATION ON BOARD OF TRUSTEES AND OFFICERS (Unaudited) |
A Board of Trustees oversees the Trust, as well as other trusts of GI, in which its members have no stated term of service, and continue to serve after election until resignation. The Statement of Additional Information includes further information about Fund Trustees and Officers, and can be obtained without charge by visiting guggenheiminvestments.com or by calling 800.820.0888.
Name, Address*
and Year of Birth | Position(s)
Held with
Trust | Term of Office
and Length of
Time Served** | Principal Occupation(s)
During Past Five Years | Number of
Portfolios
in Fund
Complex
Overseen | Other Directorships
Held by Trustees*** |
INDEPENDENT TRUSTEES | | | |
Randall C. Barnes (1951) | Trustee and Chair of the Valuation Oversight Committee | Since 2014 (Trustee) Since 2020 (Chair of the Valuation Oversight Committee) | Current: Private Investor (2001-present). Former: Senior Vice President and Treasurer, PepsiCo, Inc. (1993-1997); President, Pizza Hut International (1991-1993); Senior Vice President, Strategic Planning and New Business Development, PepsiCo, Inc. (1987-1990). | 157 | Current: Purpose Investments Funds (2013-present). Former: Managed Duration Investment Grade Municipal Fund (2006-2016). |
Angela Brock-Kyle (1959) | Trustee | Since 2019 | Current: Founder and Chief Executive Officer, B.O.A.R.D.S. (2013-present).
Former: Senior Leader, TIAA (1987-2012). | 156 | Current: Bowhead Insurance GP, LLC (2020-present); Hunt Companies, Inc. (2019-present). Former: Infinity Property & Casualty Corp. (2014-2018). |
Thomas F.
Lydon, Jr. (1960) | Trustee and Chair of the Contracts Review Committee | Since 2019 (Trustee) Since 2020 (Chair of the Contracts Review Committee) | Current: President, Global Trends Investments (1996-present); Co-Chief Executive Officer, ETF Flows, LLC (2019-present); Chief Executive Officer, Lydon Media (2016-present). | 156 | Current: US Global Investors (GROW) (1995-present). Former: Harvest Volatility Edge Trust (3) (2017-2019). |
104 | THE GUGGENHEIM FUNDS SEMI-ANNUAL REPORT | |
INFORMATION ON BOARD OF TRUSTEES AND OFFICERS (Unaudited)(continued) |
Name, Address*
and Year of Birth | Position(s)
Held with
Trust | Term of Office
and Length of
Time Served** | Principal Occupation(s)
During Past Five Years | Number of
Portfolios
in Fund
Complex
Overseen | Other Directorships
Held by Trustees*** |
INDEPENDENT TRUSTEES - continued | | |
Ronald A. Nyberg (1953) | Trustee and Chair of the Nominating and Governance Committee | Since 2014 | Current: Of Counsel, Momkus LLP (2016-present). Former: Partner, Nyberg & Cassioppi, LLC (2000-2016); Executive Vice President, General Counsel, and Corporate Secretary, Van Kampen Investments (1982-1999). | 157 | Current: PPM Funds (2) (2018-present); Edward-Elmhurst Healthcare System (2012-present). Former: Western Asset Inflation-Linked Opportunities & Income Fund (2004-2020); Western Asset Inflation-Linked Income Fund (2003-2020); Managed Duration Investment Grade Municipal Fund (2003-2016). |
Sandra G. Sponem (1958) | Trustee and Chair of the Audit Committee | Since 2019 (Trustee) Since 2020 (Chair of the Audit Committee) | Current: Retired.
Former: Senior Vice President and Chief Financial Officer, M.A. Mortenson-Companies, Inc. (2007-2017). | 156 | Current: SPDR Series Trust (81) (2018-present); SPDR Index Shares Funds (30) (2018-present); SSGA Active Trust (14) (2018-present). Former: SSGA Master Trust (1) (2018-2020). |
| | THE GUGGENHEIM FUNDS SEMI-ANNUAL REPORT | 105 |
INFORMATION ON BOARD OF TRUSTEES AND OFFICERS (Unaudited)(continued) |
Name, Address*
and Year of Birth | Position(s)
Held with
Trust | Term of Office
and Length of
Time Served** | Principal Occupation(s)
During Past Five Years | Number of
Portfolios
in Fund
Complex
Overseen | Other Directorships
Held by Trustees*** |
INDEPENDENT TRUSTEES - concluded | | |
Ronald E.
Toupin, Jr. (1958) | Trustee, Chair of the Board and Chair of the Executive Committee | Since 2014 | Current: Portfolio Consultant (2010-present); Member, Governing Council, Independent Directors Council (2013-present); Governor, Board of Governors, Investment Company Institute (2018-present). Former: Member, Executive Committee, Independent Directors Council (2016-2018); Vice President, Manager and Portfolio Manager, Nuveen Asset Management (1998-1999); Vice President, Nuveen Investment Advisory Corp. (1992-1999); Vice President and Manager, Nuveen Unit Investment Trusts (1991-1999); and Assistant Vice President and Portfolio Manager, Nuveen Unit Investment Trusts (1988-1999), each of John Nuveen & Co., Inc. (1982-1999). | 156 | Former: Western Asset Inflation-Linked Opportunities & Income Fund (2004-2020); Western Asset Inflation-Linked Income Fund (2003-2020); Managed Duration Investment Grade Municipal Fund (2003-2016). |
106 | THE GUGGENHEIM FUNDS SEMI-ANNUAL REPORT | |
INFORMATION ON BOARD OF TRUSTEES AND OFFICERS (Unaudited)(continued) |
Name, Address*
and Year of Birth | Position(s)
Held with
Trust | Term of Office
and Length of
Time Served** | Principal Occupation(s)
During Past Five Years | Number of
Portfolios
in Fund
Complex
Overseen | Other Directorships
Held by Trustees*** |
INTERESTED TRUSTEE | |
Amy J. Lee**** (1961) | Trustee, Vice President and Chief Legal Officer | Since 2018 (Trustee) Since 2014 (Chief Legal Officer) Since 2007
(Vice President) | Current: Interested Trustee, certain other funds in the Fund Complex (2018-present); Chief Legal Officer, certain other funds in the Fund Complex (2014-present); Vice President, certain other funds in the Fund Complex (2007-present); Senior Managing Director, Guggenheim Investments (2012-present). Former: President and Chief Executive Officer, certain other funds in the Fund Complex (2017-2019); Vice President, Associate General Counsel and Assistant Secretary, Security Benefit Life Insurance Company and Security Benefit Corporation (2004-2012). | 156 | None. |
* | The business address of each Trustee is c/o Guggenheim Investments, 227 West Monroe Street, Chicago, Illinois 60606. |
** | Each Trustee serves an indefinite term, until his or her successor is elected and qualified. Time served includes time served in the respective position for the Predecessor Corporation. |
*** | Each Trustee also serves on the Boards of Trustees of Guggenheim Funds Trust, Guggenheim Variable Funds Trust, Guggenheim Strategy Funds Trust, Fiduciary/Claymore Energy Infrastructure Fund, Guggenheim Taxable Municipal Bond & Investment Grade Debt Trust, Guggenheim Strategic Opportunities Fund, Guggenheim Enhanced Equity Income Fund, Guggenheim Energy & Income Fund, Guggenheim Credit Allocation Fund, Rydex Series Funds, Rydex Dynamic Funds, Rydex Variable Trust and Transparent Value Trust. Messrs. Barnes and Nyberg also serve on the Board of Trustees of Advent Convertible & Income Fund. |
**** | This Trustee is deemed to be an “interested person” of the Fund under the 1940 Act by reason of her position with the Fund’s Investment Manager and/or the parent of the Investment Manager. |
| | THE GUGGENHEIM FUNDS SEMI-ANNUAL REPORT | 107 |
INFORMATION ON BOARD OF TRUSTEES AND OFFICERS (Unaudited)(continued) |
Name, Address*
and Year of Birth | Position(s)
Held with
Trust | Term of Office
and Length of
Time Served** | Principal Occupation(s)
During Past Five Years |
OFFICERS | | | |
Brian E. Binder (1972) | President and Chief Executive Officer | Since 2018 | Current: President and Chief Executive Officer, certain other funds in the Fund Complex (2018-present); President, Chief Executive Officer and Chairman of the Board of Managers, Guggenheim Funds Investment Advisors, LLC (2018-present); President and Chief Executive Officer, Security Investors, LLC (2018-present); Board Member of Guggenheim Partners Fund Management (Europe) Limited (2018-present); Senior Managing Director and Chief Administrative Officer, Guggenheim Investments (2018-present). Former: Managing Director and President, Deutsche Funds, and Head of US Product, Trading and Fund Administration, Deutsche Asset Management (2013-2018); Managing Director, Head of Business Management and Consulting, Invesco Ltd. (2010-2012). |
James M. Howley (1972) | Assistant Treasurer | Since 2014 | Current: Managing Director, Guggenheim Investments (2004-present); Assistant Treasurer, certain other funds in the Fund Complex (2006-present). Former: Manager, Mutual Fund Administration of Van Kampen Investments, Inc. (1996-2004). |
Mark E. Mathiasen (1978) | Secretary | Since 2014 | Current: Secretary, certain other funds in the Fund Complex (2007-present); Managing Director, Guggenheim Investments (2007-present). |
Glenn McWhinnie (1969) | Assistant Treasurer | Since 2016 | Current: Vice President, Guggenheim Investments (2009-present); Assistant Treasurer, certain other funds in the Fund Complex (2016-present). |
Michael P. Megaris (1984) | Assistant Secretary | Since 2014 | Current: Assistant Secretary, certain other funds in the Fund Complex (2014-present); Director, Guggenheim Investments (2012-present). |
108 | THE GUGGENHEIM FUNDS SEMI-ANNUAL REPORT | |
INFORMATION ON BOARD OF TRUSTEES AND OFFICERS (Unaudited)(continued) |
Name, Address*
and Year of Birth | Position(s)
Held with
Trust | Term of Office
and Length of
Time Served** | Principal Occupation(s)
During Past Five Years |
OFFICERS - continued | |
Elisabeth Miller (1968) | Chief Compliance Officer | Since 2012 | Current: Chief Compliance Officer, certain other funds in the Fund Complex (2012-present); Senior Managing Director, Guggenheim Investments (2012-present). Vice President, Guggenheim Funds Distributors, LLC (2014-present). Former: Chief Compliance Officer, Security Investors, LLC and Guggenheim Funds Investment Advisors, LLC (2012-2018); Chief Compliance Officer, Guggenheim Distributors, LLC (2009-2014); Senior Manager, Security Investors, LLC (2004-2014); Senior Manager, Guggenheim Distributors, LLC (2004-2014). |
Margaux Misantone (1978) | AML Officer | Since 2017 | Current: Chief Compliance Officer, Security Investors, LLC and Guggenheim Funds Investment Advisors, LLC (2018-present); AML Officer, Security Investors, LLC and certain other funds in the Fund Complex (2017-present); Managing Director, Guggenheim Investments (2015-present). Former: Assistant Chief Compliance Officer, Security Investors, LLC and Guggenheim Funds Investments Advisors, LLC (2015-2018). |
Kimberly J. Scott (1974) | Assistant Treasurer | Since 2014 | Current: Director, Guggenheim Investments (2012-present); Assistant Treasurer, certain other funds in the Fund Complex (2012-present). Former: Financial Reporting Manager, Invesco, Ltd. (2010-2011); Vice President/Assistant Treasurer, Mutual Fund Administration for Van Kampen Investments, Inc./Morgan Stanley Investment Management (2009-2010); Manager of Mutual Fund Administration, Van Kampen Investments, Inc./Morgan Stanley Investment Management (2005-2009). |
Bryan Stone (1979) | Vice President | Since 2014 | Current: Vice President, certain other funds in the Fund Complex (2014-present); Managing Director, Guggenheim Investments (2013-present). Former: Senior Vice President, Neuberger Berman Group LLC (2009-2013); Vice President, Morgan Stanley (2002-2009). |
| | THE GUGGENHEIM FUNDS SEMI-ANNUAL REPORT | 109 |
INFORMATION ON BOARD OF TRUSTEES AND OFFICERS (Unaudited)(concluded) |
Name, Address*
and Year of Birth | Position(s)
Held with
Trust | Term of Office
and Length of
Time Served** | Principal Occupation(s)
During Past Five Years |
OFFICERS - concluded | |
John L. Sullivan (1955) | Chief Financial Officer, Chief Accounting Officer and Treasurer | Since 2014 | Current: Chief Financial Officer, Chief Accounting Officer and Treasurer, certain other funds in the Fund Complex (2010-present); Senior Managing Director, Guggenheim Investments (2010-present). Former: Managing Director and Chief Compliance Officer, each of the funds in the Van Kampen Investments fund complex (2004-2010); Managing Director and Head of Fund Accounting and Administration, Morgan Stanley Investment Management (2002-2004); Chief Financial Officer and Treasurer, Van Kampen Funds (1996-2004). |
Jon Szafran (1989) | Assistant Treasurer | Since 2017 | Current: Vice President, Guggenheim Investments (2017-present); Assistant Treasurer, certain other funds in the Fund Complex (2017-present). Former: Assistant Treasurer of Henderson Global Funds and Manager of US Fund Administration, Henderson Global Investors (North America) Inc. (“HGINA”), (2017); Senior Analyst of US Fund Administration, HGINA (2014–2017); Senior Associate of Fund Administration, Cortland Capital Market Services, LLC (2013-2014); Experienced Associate, PricewaterhouseCoopers LLP (2012-2013). |
* | The business address of each officer is c/o Guggenheim Investments, 227 West Monroe Street, Chicago, Illinois 60606. |
** | Each officer serves an indefinite term, until his or her successor is duly elected and qualified. |
110 | THE GUGGENHEIM FUNDS SEMI-ANNUAL REPORT | |
GUGGENHEIM INVESTMENTS PRIVACY NOTICE (Unaudited) |
Who We Are
This Privacy Notice describes the data protection practices of Guggenheim Investments. Guggenheim Investments as used herein refers to the affiliated investment management businesses of Guggenheim Partners, LLC: Guggenheim Funds Investment Advisors, LLC, Guggenheim Partners Investment Management, LLC, Guggenheim Funds Distributors, LLC, Security Investors, LLC, Guggenheim Investment Advisors (Europe) Limited, Guggenheim Real Estate, LLC, GS Gamma Advisors, LLC, Guggenheim Partners India Management, LLC, Guggenheim Partners Europe Limited, as well as the funds in the Guggenheim Funds complex (the “Funds”) (“Guggenheim Investments,” “we,” “us,” or “our”).
Guggenheim Partners Investment Management Holdings, LLC, located at 330 Madison Avenue, New York, New York 10017 is the data controller for your information. The affiliates who are also controllers of certain of your information are: Guggenheim Investment Advisors (Europe) Limited, Guggenheim Partners Europe Limited, Guggenheim Partners, LLC, Guggenheim Funds Investment Advisors, LLC, Guggenheim Partners Investment Management, LLC, Guggenheim Funds Distributors, LLC and Security Investors, LLC, as well as the Funds.
Our Commitment to You
Guggenheim Investments considers your privacy our utmost concern. When you become our client or investor, you entrust us with not only your hard-earned money but also with your personal and financial information. Because we have access to your private information, we hold ourselves to the highest standards in its safekeeping and use. We strictly limit how we share your information with others, whether you are a current or former Guggenheim Investments client or investor.
The Information We Collect About You
We collect certain nonpublic personal information about you from information you provide on applications, other forms, our website, and/or from third parties including investment advisors. This information includes Social Security or other tax identification number, assets, income, tax information, retirement and estate plan information, transaction history, account balance, payment history, bank account information, marital status, family relationships, information that we collect on our website through the use of “cookies,” and other personal information that you or others provide to us. We may also collect such information through your inquiries by mail, e-mail or telephone. We may also collect customer due diligence information, as required by applicable law and regulation, through third party service providers.
How We Handle Your Personal Information
The legal basis for using your information as set out in this Privacy Notice is as follows: (a) use of your personal data is necessary to perform our obligations under any contract with you (such as a contract for us to provide financial services to you); or (b) where use of your personal data is not necessary for performance of a contract, use of your personal data is necessary for our
| | THE GUGGENHEIM FUNDS SEMI-ANNUAL REPORT | 111 |
GUGGENHEIM INVESTMENTS PRIVACY NOTICE (Unaudited)(continued) |
legitimate interests or the legitimate interests of others (for example, to enforce the legal terms governing our services, operate and market our website and other services we offer, ensure safe environments for our personnel and others, make and receive payments, prevent fraud and to know the customer to whom we are providing the services). Some processing is done to comply with applicable law.
In addition to the specific uses described above, we also use your information in the following manner:
| | ● | We use your information in connection with servicing your accounts. |
| | ● | We use information to respond to your requests or questions. For example, we might use your information to respond to your customer feedback. |
| | ● | We use information to improve our products and services. We may use your information to make our website and products better. We may use your information to customize your experience with us. |
| | ● | We use information for security purposes. We may use your information to protect our company and our customers. |
| | ● | We use information to communicate with you. For example, we will communicate with you about your account or our relationship. We may contact you about your feedback. We might also contact you about this Privacy Notice. We may also enroll you in our email newsletter. |
| | ● | We use information as otherwise permitted by law, as we may notify you. |
| | ● | Aggregate/Anonymous Data. We may aggregate and/or anonymize any information collected through the website so that such information can no longer be linked to you or your device (“Aggregate/Anonymous Information”). We may use Aggregate/Anonymous Information for any purpose, including without limitation for research and marketing purposes, and may also share such data with any third parties, including advertisers, promotional partners, and sponsors. |
We do not sell information about current or former clients or their accounts to third parties. Nor do we share this information, except when necessary to complete transactions at your request, to make you aware of investment products and services that we or our affiliates offer, or as permitted or required by law.
We provide information about you to companies and individuals not affiliated with Guggenheim Investments to complete certain transactions or account changes, or to perform services for us related to your account. For example, if you ask to transfer assets from another financial institution to Guggenheim Investments, we must provide certain information about you to that company to complete the transaction. We provide the third party with only the information necessary to carry out its responsibilities and only for that purpose. And we require these third
112 | THE GUGGENHEIM FUNDS SEMI-ANNUAL REPORT | |
GUGGENHEIM INVESTMENTS PRIVACY NOTICE (Unaudited)(continued) |
parties to treat your private information with the same high degree of confidentiality that we do. To alert you to other Guggenheim Investments products and services, we share your information within our family of affiliated companies. You may limit our sharing with affiliated companies as set out below. We may also share information with any successor to all or part of our business, or in connection with steps leading up to a merger or acquisition. For example, if part of our business was sold we may give customer information as part of that transaction. We may also share information about you with your consent.
We will release information about you if you direct us to do so, if we are compelled by law to do so, or in other circumstances as permitted by law (for example, to protect your account from fraud).
If you close your account(s) or become an inactive client or investor, we will continue to adhere to the privacy policies and practices described in this notice.
Opt-Out Provisions and Your Data Choices
The law allows you to “opt out” of certain kinds of information sharing with third parties. We do not share personal information about you with any third parties that triggers this opt-out right. This means YOU ARE ALREADY OPTED OUT.
When you are no longer our client or investor, we continue to share your information as described in this notice, and you may contact us at any time to limit our sharing by sending an email to CorporateDataPrivacy@GuggenheimPartners.com.
European Union Data Subjects and certain others: In addition to the choices set forth above, residents of the European Union and certain other jurisdictions have certain rights to (1) request access to or rectification or deletion of information we collect about them, (2) request a restriction on the processing of their information, (3) object to the processing of their information, or (4) request the portability of certain information. To exercise these or other rights, please contact us using the contact information below. We will consider all requests and provide our response within the time period stated by applicable law. Please note, however, that certain information may be exempt from such requests in some circumstances, which may include if we need to keep processing your information for our legitimate interests or to comply with a legal obligation. We may request you provide us with information necessary to confirm your identity before responding to your request.
Residents of France and certain other jurisdictions may also provide us with instructions regarding the manner in which we may continue to store, erase and share your information after your death, and where applicable, the person you have designated to exercise these rights after your death.
How We Protect Privacy Online
We take steps to protect your privacy when you use our web site – www.guggenheiminvestments.com – by using secure forms of online communication, including encryption technology, Secure Socket Layer (SSL) protocol, firewalls and user names and passwords. These safeguards vary
| | THE GUGGENHEIM FUNDS SEMI-ANNUAL REPORT | 113 |
GUGGENHEIM INVESTMENTS PRIVACY NOTICE (Unaudited)(concluded) |
based on the sensitivity of the information that we collect and store. However, we cannot and do not guarantee that these measures will prevent every unauthorized attempt to access, use, or disclose your information since despite our efforts, no Internet and/or other electronic transmissions can be completely secure. Our web site uses “http cookies”—tiny pieces of information that we ask your browser to store. We use cookies for session management and security features on the Guggenheim Investments web site. We do not use them to pull data from your hard drive, to learn your e-mail address, or to view data in cookies created by other web sites. We will not share the information in our cookies or give others access to it. See the legal information area on our web site for more details about web site security and privacy features.
How We Safeguard Your Personal Information and Data Retention
We restrict access to nonpublic personal information about you to our employees and in some cases to third parties (for example, the service providers described above) as permitted by law. We maintain strict physical, electronic and procedural safeguards that comply with federal standards to guard your nonpublic personal information.
We keep your information for no longer than necessary for the purposes for which it is processed. The length of time for which we retain information depends on the purposes for which we collected and use it and/or as required to comply with applicable laws. Information may persist in copies made for backup and business continuity purposes for additional time.
International Visitors
If you are not a resident of the United States, please be aware that your information may be transferred to, stored and processed in the United States where our servers are located and our databases are operated. The data protection and other laws of the United States and other countries might not be as comprehensive as those in your country.
In such cases, we ensure that a legal basis for such a transfer exists and that adequate protection is provided as required by applicable law, for example, by using standard contractual clauses or by transferring your data to a jurisdiction that has obtained an adequacy finding. Individuals whose data may be transferred on the basis of standard contractual clauses may contact us as described below.
We’ll Keep You Informed
If you have any questions or concerns about how we treat your personal data, we encourage you to consult with us first. You may also contact the relevant supervisory authority.
We reserve the right to modify this policy at any time and will inform you promptly of material changes. You may access our privacy policy from our web site at www.guggenheiminvestments.com. Should you have any questions regarding our privacy policy, contact us by email at CorporateDataPrivacy@GuggenheimPartners.com.
114 | THE GUGGENHEIM FUNDS SEMI-ANNUAL REPORT | |
This page intentionally left blank.
This page intentionally left blank.
This page intentionally left blank.
This page intentionally left blank.
This page intentionally left blank.
This page intentionally left blank.
This page intentionally left blank.
3.31.2021
Guggenheim Funds Semi-Annual Report
| |
Guggenheim Floating Rate Strategies Fund | | |
GuggenheimInvestments.com | FR-SEMI-0321x0921 |

| | |
DEAR SHAREHOLDER | 2 |
ECONOMIC AND MARKET OVERVIEW | 4 |
ABOUT SHAREHOLDERS’ FUND EXPENSES | 7 |
FLOATING RATE STRATEGIES FUND | 10 |
NOTES TO FINANCIAL STATEMENTS | 41 |
OTHER INFORMATION | 58 |
INFORMATION ON BOARD OF TRUSTEES AND OFFICERS | 59 |
GUGGENHEIM INVESTMENTS PRIVACY NOTICE | 66 |
| | THE GUGGENHEIM FUNDS SEMI-ANNUAL REPORT | 1 |
Dear Shareholder:
Guggenheim Partners Investment Management, LLC (“GPIM” or the “Investment Adviser”), is pleased to present the shareholder report for Guggenheim Floating Rate Strategies Fund (the “Fund”) for the semi-annual period ended March 31, 2021.
The Investment Adviser is part of Guggenheim Investments, which represents the investment management businesses of Guggenheim Partners, LLC (“Guggenheim”), a global, diversified financial services firm.
Guggenheim Funds Distributors, LLC is the distributor of the Funds. Guggenheim Funds Distributors, LLC is affiliated with Guggenheim and the Investment Adviser.
We encourage you to read the Economic and Market Overview section of the report, which follows this letter.
We are committed to providing innovative investment solutions and appreciate the trust you place in us.
Sincerely,
Guggenheim Partners Investment Management, LLC
April 30, 2021
Read a prospectus and summary prospectus (if available) carefully before investing. It contains the investment objectives, risks, charges, expenses and other information, which should be considered carefully before investing. Obtain a prospectus and summary prospectus (if available) at guggenheiminvestments.com or call 800.820.0888.
This material is not intended as a recommendation or as investment advice of any kind, including in connection with rollovers, transfers, and distributions. Such material is not provided in a fiduciary capacity, may not be relied upon for or in connection with the making of investment decisions, and does not constitute a solicitation of an offer to buy or sell securities. All content has been provided for informational or educational purposes only and is not intended to be and should not be construed as legal or tax advice and/or a legal opinion. Always consult a financial, tax and/or legal professional regarding your specific situation.
2 | THE GUGGENHEIM FUNDS SEMI-ANNUAL REPORT | |
COVID-19. The global ongoing crisis caused by the outbreak of COVID-19 and the current recovery underway is causing disruption to consumer demand and economic output and supply chains. There are still travel restrictions and quarantines, and adverse impacts on local and global economies. Investors should be aware that in light of the current uncertainty, volatility and distress in economies, the financial markets, and labor and public health conditions around the world, the Fund’s investments and a shareholder’s investment in the Fund are subject to investment risk, including the possible loss of the entire principal amount invested. Firms through which investors invest with the Fund, the Fund, its service providers, the markets in which it invests and market intermediaries are also impacted by quarantines and similar measures intended to respond to and contain the ongoing pandemic, which can obstruct their functioning and subject them to heightened operational and other risks.
Floating Rate Strategies Fund may not be suitable for all investors. ● Investments in floating rate senior secured syndicated bank loans and other floating rate securities involve special types of risks, including credit rate risk, interest rate risk, liquidity risk and prepayment risk. ● The Fund’s market value will change in response to interest rate changes and market conditions among other factors. In general, bond prices rise when interest rates fall and vice versa. ● The Fund’s exposure to high yield securities may subject the Fund to greater volatility. ● When market conditions are deemed appropriate, the Fund may use leverage to the full extent permitted by its investment policies and restrictions and applicable law. Leveraging will exaggerate the effect on net asset value of any increase or decrease in the market value of the Fund’s portfolio. ● The Fund may invest in derivative instruments, which may be more volatile and less liquid, increasing the risk of loss when compared to traditional securities. Certain of the derivative instruments are also subject to the risks of counterparty default and adverse tax treatment. ● Instruments and strategies (such as borrowing transactions and reverse repurchase agreements) may provide leveraged exposure to a particular investment, which will magnify any gains or losses on those investments. ● Investments in reverse repurchase agreements and synthetic instruments (such as synthetic collateralized debt obligations) expose the Fund to the many of the same risks as investments in derivatives. ● The Fund’s investments in other investment vehicles subject the Fund to those risks and expenses affecting the investment vehicle. ● The Fund’s investments in foreign securities carry additional risks when compared to U.S. securities, due to the impact of diplomatic, political or economic developments in the country in question (investments in emerging markets securities are generally subject to an even greater level of risk). ● The Fund’s investments in real estate securities subject the Fund to the same risks as direct investments in real estate, which is particularly sensitive to economic downturns. ● The Fund’s investments in restricted securities may involve financial and liquidity risk. ● The Fund is subject to active trading risks that may increase volatility and impact its ability to achieve its investment objective. ● You may have a gain or loss when you sell your shares. ● It is important to note that the Fund is not guaranteed by the U.S. government. ● Please read the prospectus for more detailed information regarding these and other risks.
| | THE GUGGENHEIM FUNDS SEMI-ANNUAL REPORT | 3 |
ECONOMIC AND MARKET OVERVIEW (Unaudited) | March 31, 2021 |
For the six-month period ended March 31, 2021, the yield on the two-year U.S. Treasury Note rose 3 basis points1 to 0.16% from 0.13%, and the 10-year U.S. Treasury Note climbed 105 basis points to 1.74% from 0.69%. The spread between the two-year U.S. Treasury Note and 10-year U.S. Treasury Note widened from 56 basis points to 158 basis points as investors repositioned in response to fears of inflationary pressure, which the Federal Reserve (the “Fed”) regards as a transitory, short-term phenomenon. Easy financial conditions and low rates will likely support credit over the next few years. With market optimism pulling forward rate hike expectations and causing bond yields to rise, we view this as an opportunity to add incremental yield to portfolios.
Our 2021 U.S. economic growth forecast increased during the first quarter of 2021 from an annualized 5.5% to over 7%, factoring in more fiscal stimulus than previously anticipated. This forecast captures the effect of stimulus representing roughly 11% of 2020–2021 gross domestic product (“GDP”), versus the previous calculation of about 8%. We see strength in the consumer sector and in housing activity. In addition, U.S. vaccinations for COVID-19 continue to accelerate, nearing 3 million doses per day by the end of the first quarter. More than 213 million doses have been administered in the U.S. so far, and about 35% of the U.S. population has been fully vaccinated. The U.S. is seeing the best-case scenario unfold in its vaccine rollout, but other countries have not been as fortunate.
Europe’s vaccine rollout hit a major speedbump during the first quarter when questions surrounding the safety of the AstraZeneca vaccine led several major European countries to temporarily suspend distribution. Safety concerns, coupled with supply constraints, meant that less than 10% of the populations of Germany, France, and Italy had been vaccinated by the end of the first quarter, well under the pace needed to reach 70% inoculated by summer. Any delay in ending the pandemic on a global scale has implications for other countries too, including the U.S., where travel and hospitality workers represent a large share of the unemployed.
Despite vaccination delays in Europe and its implications abroad, we saw meaningful improvement in the domestic labor market during the first quarter as states moved forward with business re-openings. Seasonally adjusted initial jobless claims fell by 97,000 to 684,000 in the week ending March 20, the lowest level since the pandemic began, before seeing an uptick the following week to 719,000. We saw more positive news across the board in the March payroll report with 916,000 jobs added, and with 156,000 more from revisions. Standing in the way of additional labor market gains are local government restrictions on certain sectors, although easing of these restrictions is expected by summer.
Economic developments drove a sharp increase in U.S. Treasury yields. The market pulled forward expectations of the next Fed rate hike from December 2023 to December 2022, while repricing the long-run terminal Fed funds rate estimate to 2.25% from just 0.55% last August. We do not expect the Fed to raise interest rates as early as the market is anticipating, even though we expect strong GDP growth in coming years.
4 | THE GUGGENHEIM FUNDS SEMI-ANNUAL REPORT | |
ECONOMIC AND MARKET OVERVIEW (Unaudited)(continued) | March 31, 2021 |
Year-over-year inflation measures will rise over the next several months due to base effects, which may be compounded by supply chain disruptions in the goods sector and potential capacity constraints for certain services. However, these factors could prove to be short-lived, with base effects set to dampen inflation starting in the summer months. Moreover, the Fed is focused on generating sustainably higher inflation. Even if core inflation rises above the Fed’s 2% target in 2021, the Fed’s focus is on a long-term average of 2%. With years of shortfalls to make up, and the Fed now targeting labor market disparities as part of an expanded definition of full employment, we expect policymakers to remain resolutely patient. Any tapering of asset purchases will likely be deferred until later in 2022, with the first rate hike likely to come sometime after that.
For the six-month period ended March 31, 2021, the Standard & Poor’s 500® (“S&P 500®”) Index* returned 19.07%. The MSCI Europe-Australasia-Far East (“EAFE”) Index* returned 20.08%. The return of the MSCI Emerging Markets Index* was 22.43%.
In the bond market, the Bloomberg Barclays U.S. Aggregate Bond Index* posted a -2.73% return for the six-month period, while the Bloomberg Barclays U.S. Corporate High Yield Index* returned 7.36%. The return of the ICE Bank of America (“BofA”) Merrill Lynch 3-Month U.S. Treasury Bill Index* was 0.06% for the six-month period.
The opinions and forecasts expressed may not actually come to pass. This information is subject to change at any time, based on market and other conditions, and should not be construed as a recommendation of any specific security or strategy.
1 | Basis point – one basis point is equal to 0.01%. |
*Index Definitions:
The following indices are referenced throughout this report. Indices are unmanaged and not available for direct investment. Index performance does not reflect transaction costs, fees, or expenses.
Bloomberg Barclays U.S. Aggregate Bond Index is a broad-based flagship benchmark that measures the investment grade, U.S. dollar-denominated, fixed-rate taxable bond market, including U.S. Treasuries, government-related and corporate securities, mortgage-backed securities or “MBS” (agency fixed-rate and hybrid adjustable-rate mortgage, or “ARM”, pass-throughs), asset-backed securities (“ABS”), and commercial mortgage-backed securities (“CMBS”) (agency and non-agency).
Bloomberg Barclays U.S. Corporate High Yield Index measures the U.S. dollar-denominated, high yield, fixed-rate corporate bond market. Securities are classified as high yield if the middle rating of Moody’s, Fitch, and S&P is Ba1/BB +/BB + or below.
Credit Suisse Leveraged Loan Index tracks the investable market of the U.S. dollar denominated leveraged loan market. It consists of issues rated “5B” or lower, meaning that the highest rated issues included in this index are Moody’s/S&P ratings of Baa1/BB+ or Ba1/BBB+. All loans are funded term loans with a tenor of at least one year and are made by issuers domiciled in developed countries.
ICE BofA Merrill Lynch 3-Month U.S. Treasury Bill Index is an unmanaged market index of U.S. Treasury securities maturing in 90 days that assumes reinvestment of all income.
| | THE GUGGENHEIM FUNDS SEMI-ANNUAL REPORT | 5 |
ECONOMIC AND MARKET OVERVIEW (Unaudited)(concluded) | March 31, 2021 |
MSCI EAFE Index is a free float-adjusted market capitalization index that is designed to measure the equity market performance of developed markets, excluding the U.S. & Canada.
MSCI Emerging Markets Index is a free float-adjusted market capitalization weighted index that is designed to measure equity market performance in the global emerging markets.
S&P 500® is a broad-based index, the performance of which is based on the performance of 500 widely held common stocks chosen for market size, liquidity, and industry group representation.
6 | THE GUGGENHEIM FUNDS SEMI-ANNUAL REPORT | |
ABOUT SHAREHOLDERS’ FUND EXPENSES (Unaudited) |
All mutual funds have operating expenses, and it is important for our shareholders to understand the impact of costs on their investments. Shareholders of a fund incur two types of costs: (i) transaction costs, including sales charges (loads) on purchase payments, reinvested dividends, other distributions, and exchange fees, and (ii) ongoing costs, including management fees, administrative services, and shareholder reports, among others. These ongoing costs, or operating expenses, are deducted from a fund’s gross income and reduce the investment return of the fund.
A fund’s expenses are expressed as a percentage of its average net assets, which is known as the expense ratio. The following examples are intended to help investors understand the ongoing costs (in dollars) of investing in a fund and to compare these costs with the ongoing costs of investing in other mutual funds.
The examples are based on an investment of $1,000 made at the beginning of the period and held for the entire six-month period beginning September 30, 2020 and ending March 31, 2021.
The following tables illustrate the Fund’s costs in two ways:
Table 1. Based on actual Fund return: This section helps investors estimate the actual expenses paid over the period. The “Ending Account Value” shown is derived from the Fund’s actual return, and the fifth column shows the dollar amount that would have been paid by an investor who started with $1,000 in the Fund. Investors may use the information here, together with the amount invested, to estimate the expenses paid over the period. Simply divide the Fund’s account value by $1,000 (for example, an $8,600 account value divided by $1,000 = 8.6), then multiply the result by the number provided under the heading “Expenses Paid During Period.”
Table 2. Based on hypothetical 5% return: This section is intended to help investors compare a fund’s cost with those of other mutual funds. The table provides information about hypothetical account values and hypothetical expenses based on the Fund’s actual expense ratio and an assumed rate of return of 5% per year before expenses, which is not the Fund’s actual return. The hypothetical account values and expenses may not be used to estimate the actual ending account balance or expenses paid during the period. The example is useful in making comparisons because the U.S. Securities and Exchange Commission (the “SEC”) requires all mutual funds to calculate expenses based on the 5% return. Investors can assess a Fund’s costs by comparing this hypothetical example with the hypothetical examples that appear in shareholder reports of other funds.
The calculations illustrated above assume no shares were bought or sold during the period. Actual costs may have been higher or lower, depending on the amount of investment and the timing of any purchases or redemptions.
| | THE GUGGENHEIM FUNDS SEMI-ANNUAL REPORT | 7 |
ABOUT SHAREHOLDERS’ FUND EXPENSES (Unaudited)(continued) |
Please note that the expenses shown in the table are meant to highlight your ongoing costs only and do not reflect any transactional costs, such as sales charges (loads) on purchase payments, and contingent deferred sales charges (“CDSC”) on redemptions, if any. Therefore, the second table is useful in comparing ongoing costs only, and will not help you determine the relative total costs of owning different funds. In addition, if these transactional costs were included, your costs would have been higher.
More information about the Fund’s expenses, including annual expense ratios for periods up to five years (subject to the Fund’s inception date), can be found in the Financial Highlights section of this report. For additional information on operating expenses and other shareholder costs, please refer to the Fund’s prospectus.
8 | THE GUGGENHEIM FUNDS SEMI-ANNUAL REPORT | |
ABOUT SHAREHOLDERS’ FUND EXPENSES (Unaudited)(concluded) |
| Expense
Ratio1 | Fund
Return | Beginning
Account Value
September 30,
2020 | Ending
Account Value
March 31,
2021 | Expenses
Paid During
Period2 |
Table 1. Based on actual Fund return3 |
A-Class | 1.08% | 5.10% | $ 1,000.00 | $ 1,051.00 | $ 5.52 |
C-Class | 1.83% | 4.71% | 1,000.00 | 1,047.10 | 9.34 |
P-Class | 1.08% | 5.09% | 1,000.00 | 1,050.90 | 5.52 |
Institutional Class | 0.84% | 5.22% | 1,000.00 | 1,052.20 | 4.30 |
R6-Class | 0.84% | 5.17% | 1,000.00 | 1,051.70 | 4.30 |
|
Table 2. Based on hypothetical 5% return (before expenses) |
A-Class | 1.08% | 5.00% | $ 1,000.00 | $ 1,019.55 | $ 5.44 |
C-Class | 1.83% | 5.00% | 1,000.00 | 1,015.81 | 9.20 |
P-Class | 1.08% | 5.00% | 1,000.00 | 1,019.55 | 5.44 |
Institutional Class | 0.84% | 5.00% | 1,000.00 | 1,020.74 | 4.23 |
R6-Class | 0.84% | 5.00% | 1,000.00 | 1,020.74 | 4.23 |
1 | Annualized and excludes expenses of the underlying funds in which the Fund invests, if any. |
2 | Expenses are equal to the Fund’s annualized expense ratio, net of any applicable fee waivers, multiplied by the average account value over the period, multiplied by 182/365 (to reflect the one-half year period). |
3 | Actual cumulative return at net asset value for the period September 30, 2020 to March 31, 2021. |
| | THE GUGGENHEIM FUNDS SEMI-ANNUAL REPORT | 9 |
PERFORMANCE REPORT AND FUND PROFILE (Unaudited) | March 31, 2021 |
FLOATING RATE STRATEGIES FUND
OBJECTIVE: Seeks to provide a high level of current income while maximizing total return.
Holdings Diversification (Market Exposure as % of Net Assets)
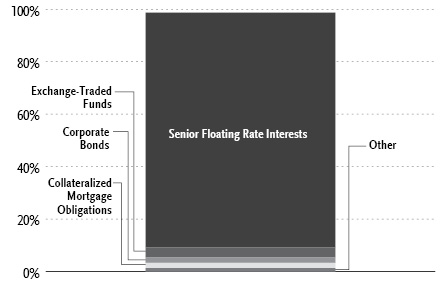
“Holdings Diversification (Market Exposure as % of Net Assets)” excludes any temporary cash investments.
Inception Dates: |
A-Class | November 30, 2011 |
C-Class | November 30, 2011 |
P-Class | May 1, 2015 |
Institutional Class | November 30, 2011 |
R6-Class | March 13, 2019 |
Ten Largest Holdings (% of Total Net Assets) |
Invesco Senior Loan ETF | 3.8% |
American Tire Distributors, Inc., 8.50% | 2.3% |
GTT Communications BV, 3.25% | 1.4% |
McGraw Hill LLC, 5.75% | 1.1% |
AI Aqua Zip Bidco Pty Ltd., 4.25% | 1.0% |
USI, Inc., 3.20% | 1.0% |
First Brands Group LLC | 1.0% |
Berry Global, Inc., 1.90% | 1.0% |
Power Solutions (Panther), 3.61% | 1.0% |
Cengage Learning Acquisitions, Inc., 5.25% | 1.0% |
Top Ten Total | 14.6% |
| | |
“Ten Largest Holdings” excludes any temporary cash or derivative investments. |
10 | THE GUGGENHEIM FUNDS SEMI-ANNUAL REPORT | |
PERFORMANCE REPORT AND FUND PROFILE (Unaudited)(continued) | March 31, 2021 |
Portfolio Composition by Quality Rating1 |
Rating | % of Total
Investments |
Fixed Income Instruments | |
AAA | 0.0%** |
AA | 0.6% |
A | 0.1% |
BBB | 5.6% |
BB | 29.6% |
B | 45.3% |
CCC | 7.0% |
CC | 1.0% |
NR2 | 1.5% |
Other Instruments | 9.3% |
Total Investments | 100.0% |
1 | Source: BlackRock Solutions. Credit quality ratings are measured on a scale that generally ranges from AAA (highest) to D (lowest). All securities except for those labeled “NR” have been rated by Moody’s, Standard & Poor’s (“S&P”), or Fitch, each of which is a Nationally Recognized Statistical Rating Organization (“NRSRO”). For purposes of this presentation, when ratings are available from more than one agency, the highest rating is used. Guggenheim Investments has converted ratings to the equivalent S&P rating. Security ratings are determined at the time of purchase and may change thereafter. |
2 | NR (not rated) securities do not necessarily indicate low credit quality. |
** | Less than 0.1%. |
| | THE GUGGENHEIM FUNDS SEMI-ANNUAL REPORT | 11 |
PERFORMANCE REPORT AND FUND PROFILE (Unaudited)(concluded) | March 31, 2021 |
Average Annual Returns*
Periods Ended March 31, 2021
| 6 Month† | 1 Year | 5 Year | Since
Inception
(11/30/11) |
A-Class Shares | 5.10% | 19.36% | 3.80% | 4.44% |
A-Class Shares with sales charge‡ | 1.96% | 15.77% | 3.17% | 3.89% |
C-Class Shares | 4.71% | 18.49% | 3.04% | 3.66% |
C-Class Shares with CDSC§ | 3.71% | 17.49% | 3.04% | 3.66% |
Institutional Class Shares | 5.22% | 19.63% | 4.04% | 4.69% |
Credit Suisse Leveraged Loan Index | 5.72% | 20.77% | 5.33% | 4.88% |
| 6 Month† | 1 Year | 5 Year | Since
Inception
(05/01/15) |
P-Class Shares | 5.09% | 19.36% | 3.80% | 3.13% |
Credit Suisse Leveraged Loan Index | 5.72% | 20.77% | 5.33% | 4.13% |
| 6 Month† | 1 Year | Since
Inception
(03/13/19) |
R6-Class Shares | 5.17% | 19.63% | 3.48% |
Credit Suisse Leveraged Loan Index | 5.72% | 20.77% | 4.36% |
* | The performance data above represents past performance that is not predictive of future results. The investment return and principal value of an investment in the Fund will fluctuate so that an investor’s shares, when redeemed, may be worth more or less than their original cost. Returns are historical and include changes in principal and reinvested dividends and capital gains and do not reflect the effect of taxes. The Credit Suisse Leveraged Loan Index is an unmanaged index and, unlike the Fund, has no management fees or operating expenses to reduce its reported return. |
† | 6 month returns are not annualized. |
‡ | Effective October 1, 2015, the maximum sales charge decreased from 4.75% to 3.00%. A 4.75% maximum sales charge is used in the calculation of the Average Annual Returns based on subscriptions made prior to October 1, 2015, and a 3.00% maximum sales charge is used to calculate performance for periods based on subscriptions made on or after October 1, 2015. |
§ | Fund returns include a CDSC of 1% if redeemed within 12 months of purchase. |
12 | THE GUGGENHEIM FUNDS SEMI-ANNUAL REPORT | |
SCHEDULE OF INVESTMENTS (Unaudited) | March 31, 2021 |
FLOATING RATE STRATEGIES FUND | |
| | Shares | | | Value | |
COMMON STOCKS† - 0.1% |
| | | | | | | | | |
Energy - 0.1% |
Unit Corp.* | | | 51,278 | | | $ | 626,617 | |
Permian Production Partners LLC*,††† | | | 401,481 | | | | 40 | |
Total Energy | | | 626,657 | |
| | | | | | | | | |
Industrial - 0.0% |
BP Holdco LLC*,†††,1 | | | 244,278 | | | | 86,130 | |
Vector Phoenix Holdings, LP*,††† | | | 244,278 | | | | 27,648 | |
API Heat Transfer Parent LLC*,††† | | | 2,902,566 | | | | 290 | |
Total Industrial | | | 114,068 | |
| | | | | | | | | |
Consumer, Non-cyclical - 0.0% |
Targus Group International, Inc.*,†††,1 | | | 12,773 | | | | 27,336 | |
Chef Holdings, Inc.*,††† | | | 94 | | | | 5,930 | |
Total Consumer, Non-cyclical | | | 33,266 | |
| | | | | | | | | |
Consumer Products - 0.0% |
Fashion Holdings Intermediate Inc.* | | | 291 | | | | 7,275 | |
| | | | | | | | | |
Total Common Stocks |
(Cost $2,031,630) | | | | | | | 781,266 | |
| | | | | | | | | |
PREFERRED STOCKS††† - 0.0% |
Industrial - 0.0% |
API Heat Transfer Intermediate* | | | 618 | | | | — | |
Total Preferred Stocks |
(Cost $493,920) | | | | | | | — | |
| | | | | | | | | |
EXCHANGE-TRADED FUNDS† - 3.8% |
Invesco Senior Loan ETF | | | 1,370,000 | | | | 30,318,100 | |
Total Exchange-Traded Funds |
(Cost $29,146,173) | | | | | | | 30,318,100 | |
| | | | | | | | | |
MONEY MARKET FUND† - 5.8% |
Federated Hermes U.S. Treasury Cash Reserves Fund — Institutional Shares, 0.01%2 | | | 45,829,390 | | | | 45,829,390 | |
Total Money Market Fund |
(Cost $45,829,390) | | | | | | | 45,829,390 | |
| | | | | | | | | |
| | | Face
Amount~ | | | | | |
SENIOR FLOATING RATE INTERESTS††,5 - 89.3% |
Industrial - 18.5% |
Hillman Group, Inc. | | | | | | | | |
4.11% (1 Month USD LIBOR + 4.00%, Rate Floor: 4.00%) due 05/30/25 | | | 4,819,242 | | | | 4,810,953 | |
due 02/24/28 | | | 4,280,802 | | | | 4,255,845 | |
Berry Global, Inc. | | | | | | | | |
1.90% (3 Month USD LIBOR + 1.75%, Rate Floor: 1.75%) due 07/01/26 | | | 7,910,911 | | | | 7,840,424 | |
BWAY Holding Co. | | | | | | | | |
3.44% (3 Month USD LIBOR + 3.25%, Rate Floor: 3.25%) due 04/03/24 | | | 7,754,995 | | | | 7,580,508 | |
Genesee & Wyoming, Inc. | | | | | | | | |
2.20% (3 Month USD LIBOR + 2.00%, Rate Floor: 2.00%) due 12/30/26 | | | 7,462,312 | | | | 7,432,015 | |
Alliance Laundry Systems LLC | | | | | | | | |
4.25% (3 Month USD LIBOR + 3.50%, Rate Floor: 4.25%) due 10/08/27 | | | 7,331,625 | | | | 7,314,029 | |
SEE NOTES TO FINANCIAL STATEMENTS. | THE GUGGENHEIM FUNDS SEMI-ANNUAL REPORT | 13 |
SCHEDULE OF INVESTMENTS (Unaudited)(continued) | March 31, 2021 |
FLOATING RATE STRATEGIES FUND | |
| | Face
Amount~ | | | Value | |
STS Operating, Inc. (SunSource) | | | | | | | | |
5.25% (1 Month USD LIBOR + 4.25%, Rate Floor: 5.25%) due 12/11/24 | | | 7,504,637 | | | $ | 7,290,454 | |
USIC Holding, Inc. | | | | | | | | |
4.00% (1 Month USD LIBOR + 3.00%, Rate Floor: 4.00%) due 12/08/23 | | | 6,867,250 | | | | 6,824,329 | |
LTI Holdings, Inc. | | | | | | | | |
3.61% (1 Month USD LIBOR + 3.50%, Rate Floor: 3.50%) due 09/08/25 | | | 6,936,517 | | | | 6,822,342 | |
Titan Acquisition Ltd. (Husky) | | | | | | | | |
3.27% (3 Month USD LIBOR + 3.00%, Rate Floor: 3.00%) due 03/28/25 | | | 6,923,736 | | | | 6,773,698 | |
TransDigm, Inc. | | | | | | | | |
2.36% (1 Month USD LIBOR + 2.25%, Rate Floor: 2.25%) due 12/09/25 | | �� | 3,572,864 | | | | 3,495,440 | |
2.36% (1 Month USD LIBOR + 2.25%, Rate Floor: 2.25%) due 05/30/25 | | | 2,937,437 | | | | 2,874,722 | |
Cushman & Wakefield US Borrower LLC | | | | | | | | |
2.86% (1 Month USD LIBOR + 2.75%, Rate Floor: 2.75%) due 08/21/25 | | | 6,293,216 | | | | 6,158,164 | |
Mileage Plus Holdings LLC | | | | | | | | |
6.25% (3 Month USD LIBOR + 5.25%, Rate Floor: 6.25%) due 06/21/27 | | | 5,700,000 | | | | 6,050,037 | |
Duran Group Holding GMBH | | | | | | | | |
4.25% (6 Month EURIBOR + 4.25%, Rate Floor: 4.25%) due 03/29/24 | | EUR | 3,919,666 | | | | 4,498,562 | |
4.25% (6 Month EURIBOR + 4.25%, Rate Floor: 4.25%) due 12/20/24††† | | EUR | 1,276,721 | | | | 1,465,280 | |
Altra Industrial Motion Corp. | | | | | | | | |
2.11% (1 Month USD LIBOR + 2.00%, Rate Floor: 2.00%) due 10/01/25 | | | 5,987,320 | | | | 5,937,924 | |
Park River Holdings, Inc. | | | | | | | | |
4.00% (2 Month USD LIBOR + 3.25%, Rate Floor: 4.00%) due 12/28/27 | | | 5,850,000 | | | | 5,809,810 | |
VC GB Holdings, Inc. | | | | | | | | |
4.00% (1 Month USD LIBOR + 3.00%, Rate Floor: 4.00%) due 02/28/24††† | | | 5,539,054 | | | | 5,504,435 | |
Gardner Denver, Inc. | | | | | | | | |
1.86% (1 Month USD LIBOR + 1.75%, Rate Floor: 1.75%) due 03/01/27 | | | 5,000,000 | | | | 4,931,250 | |
Reynolds Group Holdings, Inc. | | | | | | | | |
3.36% (1 Month USD LIBOR + 3.25%, Rate Floor: 3.25%) due 02/05/26 | | | 4,942,613 | | | | 4,883,301 | |
14 | THE GUGGENHEIM FUNDS SEMI-ANNUAL REPORT | SEE NOTES TO FINANCIAL STATEMENTS. |
SCHEDULE OF INVESTMENTS (Unaudited)(continued) | March 31, 2021 |
FLOATING RATE STRATEGIES FUND | |
| | Face
Amount~ | | | Value | |
Charter Nex US Holdings, Inc. | | | | | | | | |
5.00% (1 Month USD LIBOR + 4.25%, Rate Floor: 5.00%) due 12/01/27 | | | 4,700,000 | | | $ | 4,705,875 | |
Pelican Products, Inc. | | | | | | | | |
4.50% (3 Month USD LIBOR + 3.50%, Rate Floor: 4.50%) due 05/01/25 | | | 4,650,750 | | | | 4,595,546 | |
American Bath Group LLC | | | | | | | | |
4.25% (3 Month USD LIBOR + 3.75%, Rate Floor: 4.25%) due 11/23/27 | | | 4,000,000 | | | | 3,970,640 | |
DG Investment Intermediate Holdings 2, Inc. | | | | | | | | |
due 03/17/28 | | | 3,220,000 | | | | 3,201,904 | |
Ravago Holdings America, Inc. | | | | | | | | |
2.61% (3 Month USD LIBOR + 2.50%, Rate Floor: 2.50%) due 03/04/28 | | | 2,850,000 | | | | 2,835,750 | |
YAK MAT (YAK ACCESS LLC) | | | | | | | | |
10.19% (3 Month USD LIBOR + 10.00%, Rate Floor: 10.00%) due 07/10/26 | | | 2,550,000 | | | | 2,066,571 | |
Vertical (TK Elevator) | | | | | | | | |
4.48% (6 Month USD LIBOR + 4.25%, Rate Floor: 4.25%) due 07/30/27 | | | 1,890,512 | | | | 1,893,348 | |
SkyMiles IP Limited | | | | | | | | |
4.75% (3 Month USD LIBOR + 3.75%, Rate Floor: 4.75%) due 10/20/27 | | | 1,664,359 | | | | 1,745,913 | |
API Heat Transfer | | | | | | | | |
12.00% (3 Month USD LIBOR, Rate Floor: 1.00%) (in-kind rate was 11.00%) due 01/01/24†††,3 | | | 3,047,720 | | | | 1,295,281 | |
12.00% (3 Month USD LIBOR, Rate Floor: 1.00%) (in-kind rate was 11.00%) due 10/02/23†††,3 | | | 560,058 | | | | 420,044 | |
TAMKO Building Products, Inc. | | | | | | | | |
due 05/29/26 | | | 1,200,000 | | | | 1,193,256 | |
Total Industrial | | | 146,477,650 | |
| | | | | | | | | |
Consumer, Non-cyclical - 16.2% |
AI Aqua Zip Bidco Pty Ltd. | | | | | | | | |
4.25% (1 Month USD LIBOR + 3.25%, Rate Floor: 4.25%) due 12/13/23 | | | 8,088,457 | | | | 8,073,332 | |
Triton Water Holdings, Inc. | | | | | | | | |
due 03/16/28 | | | 7,800,000 | | | | 7,763,418 | |
Bombardier Recreational Products, Inc. | | | | | | | | |
2.11% (1 Month USD LIBOR + 2.00%, Rate Floor: 2.00%) due 05/24/27 | | | 7,495,466 | | | | 7,402,972 | |
SEE NOTES TO FINANCIAL STATEMENTS. | THE GUGGENHEIM FUNDS SEMI-ANNUAL REPORT | 15 |
SCHEDULE OF INVESTMENTS (Unaudited)(continued) | March 31, 2021 |
FLOATING RATE STRATEGIES FUND | |
| | Face
Amount~ | | | Value | |
Kronos Acquisition Holdings, Inc. | | | | | | | | |
4.25% (3 Month USD LIBOR + 3.75%, Rate Floor: 4.25%) due 12/22/26 | | | 7,431,375 | | | $ | 7,317,229 | |
Dole Food Company, Inc. | | | | | | | | |
3.75% (1 Month USD LIBOR + 2.75%, Rate Floor: 3.75%) due 04/05/24 | | | 6,801,987 | | | | 6,795,389 | |
Froneri US, Inc. | | | | | | | | |
2.36% (1 Month USD LIBOR + 2.25%, Rate Floor: 2.25%) due 01/29/27 | | | 6,848,250 | | | | 6,749,293 | |
Aramark Services, Inc. | | | | | | | | |
1.86% (1 Month USD LIBOR + 1.75%, Rate Floor: 1.75%) due 03/11/25 | | | 6,400,000 | | | | 6,324,032 | |
US Foods, Inc. | | | | | | | | |
1.86% (1 Month USD LIBOR + 1.75%, Rate Floor: 1.75%) due 06/27/23 | | | 5,922,280 | | | | 5,838,361 | |
Diamond (BC) BV | | | | | | | | |
3.11% (1 Month USD LIBOR + 3.00%, Rate Floor: 3.00%) due 09/06/24 | | | 3,948,980 | | | | 3,926,352 | |
3.25% (1 Month EURIBOR + 3.25%, Rate Floor: 3.25%) due 09/06/24 | | | EUR 1,578,591 | | | | 1,847,607 | |
Springs Window Fashions | | | | | | | | |
4.36% (1 Month USD LIBOR + 4.25%, Rate Floor: 4.25%) due 06/16/25 | | | 4,324,645 | | | | 4,301,205 | |
8.61% (1 Month USD LIBOR + 8.50%, Rate Floor: 8.50%) due 06/15/26 | | | 1,350,000 | | | | 1,343,250 | |
Recess Holdings, Inc. | | | | | | | | |
4.75% (3 Month USD LIBOR + 3.75%, Rate Floor: 4.75%) due 09/30/24 | | | 5,608,126 | | | | 5,540,829 | |
Weber-Stephen Products LLC | | | | | | | | |
4.00% (1 Month USD LIBOR + 3.25%, Rate Floor: 4.00%) due 10/29/27 | | | 5,037,375 | | | | 5,031,078 | |
DaVita, Inc. | | | | | | | | |
1.86% (1 Month USD LIBOR + 1.75%, Rate Floor: 1.75%) due 08/12/26 | | | 4,974,811 | | | | 4,942,674 | |
Hayward Industries, Inc. | | | | | | | | |
3.61% (1 Month USD LIBOR + 3.50%, Rate Floor: 3.50%) due 08/05/24 | | | 4,883,186 | | | | 4,874,054 | |
IQVIA Holdings, Inc. | | | | | | | | |
1.95% (3 Month USD LIBOR + 1.75%, Rate Floor: 1.75%) due 06/11/25 | | | 4,854,480 | | | | 4,822,100 | |
Cidron New Bidco Ltd. | | | | | | | | |
3.00% (3 Month EURIBOR + 3.00%, Rate Floor: 3.00%) due 04/16/25 | | | EUR 4,125,000 | | | | 4,788,637 | |
Grifols Worldwide Operations USA, Inc. | | | | | | | | |
2.08% (1 Week USD LIBOR + 2.00%, Rate Floor: 2.00%) due 11/15/27 | | | 3,519,133 | | | | 3,477,959 | |
16 | THE GUGGENHEIM FUNDS SEMI-ANNUAL REPORT | SEE NOTES TO FINANCIAL STATEMENTS. |
SCHEDULE OF INVESTMENTS (Unaudited)(continued) | March 31, 2021 |
FLOATING RATE STRATEGIES FUND | |
| | Face
Amount~ | | | Value | |
Sigma Holding BV (Flora Food) | | | | | | | | |
3.50% (1 Month EURIBOR + 3.50% and 6 Month EURIBOR + 3.50%, Rate Floor: 3.50%) due 07/02/25 | | | EUR 3,000,000 | | | $ | 3,448,347 | |
National Mentor Holdings, Inc. | | | | | | | | |
4.50% (1 Month USD LIBOR + 3.75%, Rate Floor: 4.50%) due 03/02/28 | | | 3,250,000 | | | | 3,228,063 | |
Option Care Health, Inc. | | | | | | | | |
3.86% (1 Month USD LIBOR + 3.75%, Rate Floor: 3.75%) due 08/06/26 | | | 3,191,919 | | | | 3,177,971 | |
Energizer Holdings, Inc. | | | | | | | | |
2.75% (1 Month USD LIBOR + 2.25%, Rate Floor: 2.75%) due 12/22/27 | | | 2,850,000 | | | | 2,834,553 | |
Elanco Animal Health, Inc. | | | | | | | | |
1.87% (1 Month USD LIBOR + 1.75%, Rate Floor: 1.75%) due 08/02/27 | | | 2,281,613 | | | | 2,249,830 | |
Arctic Glacier Group Holdings, Inc. | | | | | | | | |
4.50% (3 Month USD LIBOR + 3.50%, Rate Floor: 4.50%) due 03/20/24 | | | 2,272,564 | | | | 2,140,483 | |
BCPE Eagle Buyer LLC | | | | | | | | |
5.25% (3 Month USD LIBOR + 4.25%, Rate Floor: 5.25%) due 03/18/24 | | | 2,074,372 | | | | 2,064,000 | |
Endo Luxembourg Finance Company I SARL | | | | | | | | |
due 03/11/28 | | | 1,920,000 | | | | 1,898,400 | |
Cambrex Corp. | | | | | | | | |
4.25% (1 Month USD LIBOR + 3.50%, Rate Floor: 4.25%) due 12/04/26 | | | 1,893,741 | | | | 1,891,374 | |
Valeant Pharmaceuticals International, Inc. | | | | | | | | |
3.11% (1 Month USD LIBOR + 3.00%, Rate Floor: 3.00%) due 06/02/25 | | | 1,643,039 | | | | 1,636,811 | |
PPD, Inc. | | | | | | | | |
2.75% (1 Month USD LIBOR + 2.25%, Rate Floor: 2.75%) due 01/13/28 | | | 1,500,000 | | | | 1,491,165 | |
Southern Veterinary Partners LLC | | | | | | | | |
5.00% (3 Month USD LIBOR + 4.00%, Rate Floor: 5.00%) due 10/05/27 | | | 876,591 | | | | 878,782 | |
Total Consumer, Non-cyclical | | | 128,099,550 | |
| | | | | | | | | |
Communications - 15.4% |
GTT Communications BV | | | | | | | | |
3.25% (3 Month EURIBOR + 3.25%, Rate Floor: 3.25%) due 05/30/25 | | | EUR 10,770,315 | | | | 11,240,127 | |
SEE NOTES TO FINANCIAL STATEMENTS. | THE GUGGENHEIM FUNDS SEMI-ANNUAL REPORT | 17 |
SCHEDULE OF INVESTMENTS (Unaudited)(continued) | March 31, 2021 |
FLOATING RATE STRATEGIES FUND | |
| | Face
Amount~ | | | Value | |
8.50% (1 Month USD LIBOR + 5.00%, Rate Floor: 6.00%) (in-kind rate was 2.50%) due 12/28/213 | | | 1,566,875 | | | $ | 1,588,419 | |
McGraw Hill LLC | | | | | | | | |
5.75% (3 Month USD LIBOR + 4.75%, Rate Floor: 5.75%) due 11/01/24 | | | 8,869,099 | | | | 8,850,651 | |
Cengage Learning Acquisitions, Inc. | | | | | | | | |
5.25% (3 Month USD LIBOR + 4.25%, Rate Floor: 5.25%) due 06/07/23 | | | 7,883,258 | | | | 7,789,684 | |
WMG Acquisition Corp. | | | | | | | | |
2.23% (1 Month USD LIBOR + 2.13%, Rate Floor: 2.13%) due 01/12/28 | | | 7,250,000 | | | | 7,215,997 | |
UPC Financing Partnership | | | | | | | | |
3.61% (1 Month USD LIBOR + 3.50%, Rate Floor: 3.50%) due 01/31/29 | | | 7,000,000 | | | | 6,977,530 | |
ProQuest, LLC | | | | | | | | |
3.36% (1 Month USD LIBOR + 3.25%, Rate Floor: 3.25%) due 10/23/26 | | | 6,982,711 | | | | 6,933,832 | |
CSC Holdings, LLC | | | | | | | | |
2.36% (1 Month USD LIBOR + 2.25%, Rate Floor: 2.25%) due 07/17/25 | | | 6,887,299 | | | | 6,785,436 | |
Ziggo Financing Partnership | | | | | | | | |
2.61% (1 Month USD LIBOR + 2.50%, Rate Floor: 2.50%) due 04/28/28 | | | 6,685,000 | | | | 6,612,067 | |
Zayo Group Holdings, Inc. | | | | | | | | |
3.11% (1 Month USD LIBOR + 3.00%, Rate Floor: 3.00%) due 03/09/27 | | | 6,648,468 | | | | 6,590,161 | |
Market Track LLC | | | | | | | | |
5.25% (3 Month USD LIBOR + 4.25%, Rate Floor: 5.25%) due 06/05/24 | | | 6,891,086 | | | | 6,580,987 | |
Virgin Media Bristol LLC | | | | | | | | |
2.61% (1 Month USD LIBOR + 2.50%, Rate Floor: 2.50%) due 01/31/28 | | | 6,116,233 | | | | 6,056,477 | |
Authentic Brands | | | | | | | | |
4.00% (3 Month USD LIBOR + 3.25%, Rate Floor: 4.00%) due 09/27/24 | | | 5,606,376 | | | | 5,587,371 | |
GTT Communications, Inc. | | | | | | | | |
2.86% (3 Month USD LIBOR + 2.75%, Rate Floor: 2.75%) due 05/30/25 | | | 6,126,750 | | | | 5,137,525 | |
Nielsen Finance LLC | | | | | | | | |
2.10% (1 Month USD LIBOR + 2.00%, Rate Floor: 2.00%) due 10/04/23 | | | 5,018,381 | | | | 5,008,194 | |
SFR Group S.A. | | | | | | | | |
3.79% (1 Month USD LIBOR + 3.69%, Rate Floor: 3.69%) due 02/02/26 | | | 3,388,639 | | | | 3,354,041 | |
2.86% (1 Month USD LIBOR + 2.75%, Rate Floor: 2.75%) due 07/31/25 | | | 1,658,206 | | | | 1,624,147 | |
18 | THE GUGGENHEIM FUNDS SEMI-ANNUAL REPORT | SEE NOTES TO FINANCIAL STATEMENTS. |
SCHEDULE OF INVESTMENTS (Unaudited)(continued) | March 31, 2021 |
FLOATING RATE STRATEGIES FUND | |
| | Face
Amount~ | | | Value | |
Titan US Finco LLC | | | | | | | | |
4.20% (3 Month USD LIBOR + 4.00%, Rate Floor: 4.00%) due 05/01/26 | | | 4,430,511 | | | $ | 4,419,435 | |
Xplornet Communications, Inc. | | | | | | | | |
4.86% (1 Month USD LIBOR + 4.75%, Rate Floor: 4.75%) due 06/10/27 | | | 3,970,000 | | | | 3,966,903 | |
Telenet Financing USD LLC | | | | | | | | |
2.11% (1 Month USD LIBOR + 2.00%, Rate Floor: 2.00%) due 04/28/28 | | | 4,000,000 | | | | 3,946,000 | |
Level 3 Financing, Inc. | | | | | | | | |
1.86% (1 Month USD LIBOR + 1.75%, Rate Floor: 1.75%) due 03/01/27 | | | 3,339,546 | | | | 3,293,627 | |
Radiate Holdco, LLC | | | | | | | | |
4.25% (1 Month USD LIBOR + 3.50%, Rate Floor: 4.25%) due 09/25/26 | | | 1,795,500 | | | | 1,793,669 | |
Total Communications | | | 121,352,280 | |
| | | | | | | | | |
Consumer, Cyclical - 14.4% |
American Tire Distributors, Inc. | | | | | | | | |
8.50% (1 Month USD LIBOR + 7.50% and 3 Month USD LIBOR + 7.50%, Rate Floor: 8.50%) due 09/02/24 | | | 18,840,233 | | | | 18,377,140 | |
7.00% (3 Month USD LIBOR + 6.00%, Rate Floor: 7.00%) due 09/01/23 | | | 2,017,146 | | | | 1,983,116 | |
First Brands Group LLC | | | | | | | | |
due 03/19/27 | | | 7,900,000 | | | | 7,890,125 | |
Power Solutions (Panther) | | | | | | | | |
3.61% (3 Month USD LIBOR + 3.50%, Rate Floor: 3.50%) due 04/30/26 | | | 7,878,348 | | | | 7,789,717 | |
Zephyr Bidco Ltd. | | | | | | | | |
4.80% (1 Month GBP LIBOR + 4.75%, Rate Floor: 4.75%) due 07/23/25 | | GBP | 5,265,000 | | | | 7,152,361 | |
IBC Capital Ltd. | | | | | | | | |
3.94% (3 Month USD LIBOR + 3.75%, Rate Floor: 3.75%) due 09/11/23 | | | 7,182,880 | | | | 7,114,643 | |
CHG Healthcare Services, Inc. | | | | | | | | |
4.00% (3 Month USD LIBOR + 3.00%, Rate Floor: 4.00%) due 06/07/23 | | | 6,988,897 | | | | 6,961,431 | |
Navistar Inc. | | | | | | | | |
3.62% (1 Month USD LIBOR + 3.50%, Rate Floor: 3.50%) due 11/06/24 | | | 6,920,977 | | | | 6,919,247 | |
Intrawest Resorts Holdings, Inc. | | | | | | | | |
2.86% (1 Month USD LIBOR + 2.75%, Rate Floor: 2.75%) due 07/31/24 | | | 6,707,949 | | | | 6,586,401 | |
Whatabrands, LLC | | | | | | | | |
2.86% (1 Month USD LIBOR + 2.75%, Rate Floor: 2.75%) due 07/31/26 | | | 6,493,682 | | | | 6,446,798 | |
SEE NOTES TO FINANCIAL STATEMENTS. | THE GUGGENHEIM FUNDS SEMI-ANNUAL REPORT | 19 |
SCHEDULE OF INVESTMENTS (Unaudited)(continued) | March 31, 2021 |
FLOATING RATE STRATEGIES FUND | |
| | Face
Amount~ | | | Value | |
PetSmart LLC | | | | | | | | |
4.25% (3 Month USD LIBOR + 3.50%, Rate Floor: 4.25%) due 02/11/28 | | | 6,350,000 | | | $ | 6,335,395 | |
EG Finco Ltd. | | | | | | | | |
4.00% (3 Month EURIBOR + 4.00%, Rate Floor: 4.00%) due 02/07/25 | | EUR | 3,350,120 | | | | 3,841,874 | |
4.20% (3 Month USD LIBOR + 4.00%, Rate Floor: 4.00%) due 02/07/25 | | | 775,588 | | | | 762,155 | |
Packers Holdings LLC | | | | | | | | |
4.00% (3 Month USD LIBOR + 3.25%, Rate Floor: 4.00%) due 03/09/28 | | | 4,495,003 | | | | 4,440,703 | |
Mavis Tire Express Services Corp. | | | | | | | | |
3.36% (1 Month USD LIBOR + 3.25%, Rate Floor: 3.25%) due 03/20/25 | | | 4,232,147 | | | | 4,212,510 | |
CNT Holdings I Corp. | | | | | | | | |
4.50% (6 Month USD LIBOR + 3.75%, Rate Floor: 4.50%) due 11/08/27 | | | 3,800,000 | | | | 3,789,322 | |
Truck Hero, Inc. | | | | | | | | |
4.50% (1 Month USD LIBOR + 3.75%, Rate Floor: 4.50%) due 01/31/28 | | | 2,850,000 | | | | 2,840,909 | |
Alexander Mann | | | | | | | | |
5.36% (6 Month GBP LIBOR + 5.25%, Rate Floor: 5.25%) due 06/16/25 | | GBP | 1,540,000 | | | | 1,999,106 | |
Playtika Holding Corp. | | | | | | | | |
due 03/13/28 | | | 2,000,000 | | | | 1,987,500 | |
Burlington Stores, Inc. | | | | | | | | |
1.86% (1 Month USD LIBOR + 1.75%, Rate Floor: 1.75%) due 11/18/24 | | | 2,000,000 | | | | 1,981,660 | |
American Trailer World Corp. | | | | | | | | |
4.50% (1 Month USD LIBOR + 3.75%, Rate Floor: 4.50%) due 03/03/28 | | | 1,600,000 | | | | 1,587,008 | |
Rent-A-Center, Inc. | | | | | | | | |
4.75% (1 Month USD LIBOR + 4.00%, Rate Floor: 4.75%) due 02/17/28 | | | 1,400,000 | | | | 1,405,838 | |
Belk, Inc. | | | | | | | | |
8.50% (3 Month USD LIBOR + 7.50%, Rate Floor: 8.50%) due 07/31/25††† | | | 516,492 | | | | 515,201 | |
SHO Holding I Corp. | | | | | | | | |
6.25% (3 Month USD LIBOR + 5.25%, Rate Floor: 6.25%) due 04/29/24††† | | | 567,571 | | | | 505,138 | |
6.23% (3 Month USD LIBOR + 5.23%, Rate Floor: 6.23%) due 04/29/24††† | | | 9,357 | | | | 8,328 | |
Total Consumer, Cyclical | | | 113,433,626 | |
| | | | | | | | | |
Financial - 10.8% |
USI, Inc. | | | | | | | | |
3.20% (3 Month USD LIBOR + 3.00%, Rate Floor: 3.00%) due 05/16/24 | | | 8,030,260 | | | | 7,934,218 | |
Aretec Group, Inc. | | | | | | | | |
20 | THE GUGGENHEIM FUNDS SEMI-ANNUAL REPORT | SEE NOTES TO FINANCIAL STATEMENTS. |
SCHEDULE OF INVESTMENTS (Unaudited)(continued) | March 31, 2021 |
FLOATING RATE STRATEGIES FUND | |
| | Face
Amount~ | | | Value | |
4.36% (1 Month USD LIBOR + 4.25%, Rate Floor: 4.25%) due 10/01/25 | | | 7,673,375 | | | $ | 7,656,570 | |
AmWINS Group, Inc. | | | | | | | | |
3.00% (1 Month USD LIBOR + 2.25% and 3 Month USD LIBOR + 2.25%, Rate Floor: 3.00%) due 02/19/28 | | | 7,481,250 | | | | 7,420,502 | |
Jane Street Group LLC | | | | | | | | |
2.86% (1 Month USD LIBOR + 2.75%, Rate Floor: 2.75%) due 01/26/28 | | | 7,381,500 | | | | 7,296,170 | |
Alliant Holdings Intermediate LLC | | | | | | | | |
3.36% (1 Month USD LIBOR + 3.25%, Rate Floor: 3.25%) due 05/09/25 | | | 7,300,807 | | | | 7,205,240 | |
Focus Financial Partners LLC | | | | | | | | |
2.11% (1 Month USD LIBOR + 2.00%, Rate Floor: 2.00%) due 07/03/24 | | | 6,776,187 | | | | 6,697,922 | |
HarbourVest Partners LP | | | | | | | | |
2.36% (1 Month USD LIBOR + 2.25%, Rate Floor: 2.25%) due 03/03/25 | | | 6,372,346 | | | | 6,320,602 | |
NFP Corp. | | | | | | | | |
3.36% (1 Month USD LIBOR + 3.25%, Rate Floor: 3.25%) due 02/15/27 | | | 5,091,929 | | | | 5,010,763 | |
Franchise Group, Inc. | | | | | | | | |
5.50% (3 Month USD LIBOR + 4.75%, Rate Floor: 5.50%) due 03/10/26 | | | 4,950,000 | | | | 4,953,119 | |
Jefferies Finance LLC | | | | | | | | |
3.13% (1 Month USD LIBOR + 3.00%, Rate Floor: 3.00%) due 06/03/26 | | | 4,617,750 | | | | 4,572,727 | |
Citadel Securities, LP | | | | | | | | |
2.61% (1 Month USD LIBOR + 2.50%, Rate Floor: 2.50%) due 02/02/28 | | | 4,500,000 | | | | 4,447,485 | |
Virtu Financial, Inc. | | | | | | | | |
3.11% (1 Month USD LIBOR + 3.00%, Rate Floor: 3.00%) due 03/01/26 | | | 4,320,000 | | | | 4,304,750 | |
Ryan Specialty Group LLC | | | | | | | | |
4.00% (1 Month USD LIBOR + 3.25%, Rate Floor: 4.00%) due 09/01/27 | | | 3,582,000 | | | | 3,576,018 | |
Duff & Phelps | | | | | | | | |
4.75% (1 Month USD LIBOR + 3.75%, Rate Floor: 4.75%) due 04/09/27 | | | 2,586,967 | | | | 2,586,554 | |
Nexus Buyer LLC | | | | | | | | |
3.86% (1 Month USD LIBOR + 3.75%, Rate Floor: 3.75%) due 11/09/26 | | | 2,600,000 | | | | 2,585,388 | |
AlixPartners, LLP | | | | | | | | |
3.25% (1 Month USD LIBOR + 2.75%, Rate Floor: 3.25%) due 02/04/28 | | | 2,400,000 | | | | 2,389,656 | |
Total Financial | | | 84,957,684 | |
| | | | | | | | | |
SEE NOTES TO FINANCIAL STATEMENTS. | THE GUGGENHEIM FUNDS SEMI-ANNUAL REPORT | 21 |
SCHEDULE OF INVESTMENTS (Unaudited)(continued) | March 31, 2021 |
FLOATING RATE STRATEGIES FUND | |
| | Face
Amount~ | | | Value | |
Technology - 8.3% |
WEX, Inc. | | | | | | | | |
due 03/19/28 | | | 7,800,000 | | | $ | 7,770,750 | |
2.36% (1 Month USD LIBOR + 2.25%, Rate Floor: 2.25%) due 05/15/26 | | | 4,604,771 | | | | 4,582,254 | |
Informatica LLC | | | | | | | | |
3.36% (1 Month USD LIBOR + 3.25%, Rate Floor: 3.25%) due 02/25/27 | | | 7,128,671 | | | | 7,068,077 | |
Cologix Holdings, Inc. | | | | | | | | |
4.00% (1 Month USD LIBOR + 3.00%, Rate Floor: 4.00%) due 03/20/24 | | | 5,039,389 | | | | 5,027,697 | |
Misys Ltd. | | | | | | | | |
4.50% (3 Month USD LIBOR + 3.50%, Rate Floor: 4.50%) due 06/13/24 | | | 4,708,988 | | | | 4,610,288 | |
Emerald TopCo, Inc. (Press Ganey) | | | | | | | | |
3.71% (3 Month USD LIBOR + 3.50%, Rate Floor: 3.50%) due 07/24/26 | | | 4,477,273 | | | | 4,434,739 | |
Aspect Software, Inc. | | | | | | | | |
6.00% (3 Month USD LIBOR + 5.00%, Rate Floor: 6.00%) due 01/15/24 | | | 4,445,131 | | | | 4,429,573 | |
Verscend Holding Corp. | | | | | | | | |
due 08/27/25 | | | 4,390,000 | | | | 4,385,039 | |
Project Ruby Ultimate Parent Corp. | | | | | | | | |
4.00% (3 Month USD LIBOR + 3.25%, Rate Floor: 4.00%) due 03/10/28 | | | 3,500,000 | | | | 3,483,970 | |
Brave Parent Holdings, Inc. | | | | | | | | |
4.11% (1 Month USD LIBOR + 4.00%, Rate Floor: 4.00%) due 04/18/25 | | | 3,168,546 | | | | 3,165,916 | |
ThoughtWorks, Inc. | | | | | | | | |
3.75% (1 Month USD LIBOR + 3.25%, Rate Floor: 3.75%) due 03/19/28 | | | 3,000,000 | | | | 2,990,010 | |
Boxer Parent Co., Inc. | | | | | | | | |
3.86% (1 Month USD LIBOR + 3.75%, Rate Floor: 3.75%) due 10/02/25 | | | 2,985,896 | | | | 2,970,967 | |
RealPage, Inc. | | | | | | | | |
due 02/18/28 | | | 2,400,000 | | | | 2,387,664 | |
Sabre GLBL, Inc. | | | | | | | | |
2.11% (1 Month USD LIBOR + 2.00%, Rate Floor: 2.00%) due 02/22/24 | | | 2,292,162 | | | | 2,260,187 | |
Peraton Corp. | | | | | | | | |
4.50% (3 Month USD LIBOR + 3.75%, Rate Floor: 4.50%) due 02/01/28 | | | 2,173,986 | | | | 2,172,182 | |
EXC Holdings III Corp. | | | | | | | | |
4.50% (3 Month USD LIBOR + 3.50%, Rate Floor: 4.50%) due 12/02/24 | | | 1,959,188 | | | | 1,954,172 | |
22 | THE GUGGENHEIM FUNDS SEMI-ANNUAL REPORT | SEE NOTES TO FINANCIAL STATEMENTS. |
SCHEDULE OF INVESTMENTS (Unaudited)(continued) | March 31, 2021 |
FLOATING RATE STRATEGIES FUND | |
| | Face
Amount~ | | | Value | |
TIBCO Software, Inc. | | | | | | | | |
3.86% (1 Month USD LIBOR + 3.75%, Rate Floor: 3.75%) due 06/30/26 | | | 1,790,977 | | | $ | 1,765,796 | |
Total Technology | | | 65,459,281 | |
| | | | | | | | | |
Basic Materials - 4.7% |
Messer Industries USA, Inc. | | | | | | | | |
2.70% (3 Month USD LIBOR + 2.50%, Rate Floor: 2.50%) due 03/02/26 | | | 7,025,591 | | | | 6,963,274 | |
Arch Coal, Inc. | | | | | | | | |
3.75% (1 Month USD LIBOR + 2.75%, Rate Floor: 3.75%) due 03/07/24 | | | 6,595,516 | | | | 6,133,830 | |
PQ Corp. | | | | | | | | |
2.46% (3 Month USD LIBOR + 2.25%, Rate Floor: 2.25%) due 02/08/27 | | | 4,601,166 | | | | 4,562,838 | |
Illuminate Buyer LLC | | | | | | | | |
3.61% (1 Month USD LIBOR + 3.50%, Rate Floor: 3.50%) due 06/30/27 | | | 3,591,000 | | | | 3,571,537 | |
GrafTech Finance, Inc. | | | | | | | | |
4.00% (1 Month USD LIBOR + 3.00%, Rate Floor: 4.00%) due 02/12/25 | | | 3,516,849 | | | | 3,512,453 | |
TricorBraun Holdings, Inc. | | | | | | | | |
3.75% (6 Month USD LIBOR + 3.25%, Rate Floor: 3.75%) due 03/03/28 | | | 2,755,356 | | | | 2,726,645 | |
INEOS Ltd. | | | | | | | | |
3.25% (3 Month USD LIBOR + 2.75%, Rate Floor: 3.25%) due 01/29/26 | | | 2,600,000 | | | | 2,590,250 | |
HB Fuller Co. | | | | | | | | |
2.11% (1 Month USD LIBOR + 2.00%, Rate Floor: 2.00%) due 10/21/24 | | | 2,438,212 | | | | 2,426,631 | |
Alpha 3 BV (Atotech) | | | | | | | | |
3.00% (3 Month USD LIBOR + 2.50%, Rate Floor: 3.00%) due 03/05/28 | | | 1,800,000 | | | | 1,793,250 | |
NIC Acquisition Corp. | | | | | | | | |
4.50% (3 Month USD LIBOR + 3.75%, Rate Floor: 4.50%) due 12/29/27 | | | 1,650,000 | | | | 1,648,631 | |
Trinseo Materials Operating S.C.A. | | | | | | | | |
due 03/17/28 | | | 1,600,000 | | | | 1,582,000 | |
Total Basic Materials | | | 37,511,339 | |
| | | | | | | | | |
Energy - 0.5% |
Penn Virginia Holding Corp. | | | | | | | | |
9.25% (1 Month USD LIBOR + 8.25%, Rate Floor: 9.25%) due 09/30/24††† | | | 4,098,800 | | | | 3,945,095 | |
Permian Production Partners LLC | | | | | | | | |
9.00% (1 Month USD LIBOR + 6.00%, Rate Floor: 7.00%) (in-kind rate was 2.00%) due 11/23/25†††,3 | | | 2,657,939 | | | | 318,953 | |
Total Energy | | | 4,264,048 | |
| | | | | | | | | |
SEE NOTES TO FINANCIAL STATEMENTS. | THE GUGGENHEIM FUNDS SEMI-ANNUAL REPORT | 23 |
SCHEDULE OF INVESTMENTS (Unaudited)(continued) | March 31, 2021 |
FLOATING RATE STRATEGIES FUND | |
| | Face
Amount~ | | | Value | |
Utilities - 0.5% |
Hamilton Projects Acquiror LLC | | | | | | | | |
5.75% (3 Month USD LIBOR + 4.75%, Rate Floor: 5.75%) due 06/17/27 | | | 3,960,075 | | | $ | 3,971,638 | |
Total Senior Floating Rate Interests |
(Cost $714,355,424) | | | 705,527,096 | |
| | | | | | | | | |
CORPORATE BONDS†† - 2.1% |
Consumer, Non-cyclical - 0.8% |
Nathan’s Famous, Inc. | | | | | | | | |
6.63% due 11/01/254 | | | 4,275,000 | | | | 4,381,875 | |
HCA, Inc. | | | | | | | | |
4.50% due 02/15/27 | | | 1,500,000 | | | | 1,681,657 | |
Total Consumer, Non-cyclical | | | 6,063,532 | |
| | | | | | | | | |
Energy - 0.6% |
Sabine Pass Liquefaction LLC | | | | | | | | |
5.63% due 04/15/23 | | | 4,200,000 | | | | 4,554,464 | |
| | | | | | | | | |
Communications - 0.5% |
Ziggo BV | | | | | | | | |
5.50% due 01/15/274 | | | 3,950,000 | | | | 4,112,937 | |
| | | | | | | | | |
Industrial - 0.1% |
Grinding Media, Inc. / MC Grinding Media Canada, Inc. | | | | | | | | |
7.38% due 12/15/234 | | | 750,000 | | | | 761,250 | |
| | | | | | | | | |
Consumer, Cyclical - 0.1% |
LBC Tank Terminals Holding Netherlands BV | | | | | | | | |
6.88% due 05/15/234 | | | 630,000 | | | | 630,000 | |
| | | | | | | | | |
Financial - 0.0% |
Lincoln Financing SARL | | | | | | | | |
3.88% (3 Month EURIBOR + 3.88%, Rate Floor: 3.88%) due 04/01/244,5 | | EUR | 350,000 | | | | 409,530 | |
| | | | | | | | | |
Basic Materials - 0.0% |
Mirabela Nickel Ltd. | | | | | | | | |
due 06/24/196,7 | | | 1,279,819 | | | | 51,193 | |
Total Corporate Bonds |
(Cost $16,827,789) | | | 16,582,906 | |
| | | | | | | | | |
COLLATERALIZED MORTGAGE OBLIGATIONS†† - 2.0% |
Residential Mortgage Backed Securities - 2.0% |
RALI Series Trust | | | | | | | | |
2006-QO6, 0.47% (1 Month USD LIBOR + 0.36%, Rate Floor: 0.36%) due 06/25/465 | | | 11,443,339 | | | | 3,839,351 | |
2006-QO2, 0.55% (1 Month USD LIBOR + 0.44%, Rate Floor: 0.44%) due 02/25/465 | | | 460,034 | | | | 140,995 | |
Washington Mutual Mortgage Pass-Through Certificates Trust | | | | | | | | |
2007-OA6, 1.07% (1 Year CMT Rate + 0.81%, Rate Floor: 0.81%) due 07/25/475 | | | 3,102,785 | | | | 2,589,762 | |
American Home Mortgage Assets Trust | | | | | | | | |
2006-4, 0.32% (1 Month USD LIBOR + 0.21%, Rate Floor: 0.21%) due 10/25/465 | | | 2,920,026 | | | | 1,972,388 | |
Washington Mutual Mortgage Pass-Through Certificates WMALT Series Trust | | | | | | | | |
2006-AR9, 1.10% (1 Year CMT Rate + 0.84%, Rate Floor: 0.84%) due 11/25/465 | | | 2,105,403 | | | | 1,808,543 | |
24 | THE GUGGENHEIM FUNDS SEMI-ANNUAL REPORT | SEE NOTES TO FINANCIAL STATEMENTS. |
SCHEDULE OF INVESTMENTS (Unaudited)(continued) | March 31, 2021 |
FLOATING RATE STRATEGIES FUND | |
| | Face
Amount~ | | | Value | |
Lehman XS Trust Series | | | | | | | | |
2006-16N, 0.30% (1 Month USD LIBOR + 0.19%, Rate Floor: 0.19%) due 11/25/465 | | | 1,706,058 | | | $ | 1,605,377 | |
Wachovia Asset Securitization Issuance II LLC Trust | | | | | | | | |
2007-HE1, 0.26% (1 Month USD LIBOR + 0.14%, Rate Floor: 0.14%) due 07/25/374,5 | | | 1,366,079 | | | | 1,302,964 | |
Nomura Resecuritization Trust | | | | | | | | |
2015-4R, 1.81% (1 Month USD LIBOR + 0.43%, Rate Floor: 0.43%) due 03/26/364,5 | | | 1,175,203 | | | | 1,169,570 | |
Alliance Bancorp Trust | | | | | | | | |
2007-OA1, 0.35% (1 Month USD LIBOR + 0.24%, Rate Floor: 0.24%) due 07/25/375 | | | 511,324 | | | | 474,884 | |
Morgan Stanley Re-REMIC Trust | | | | | | | | |
2010-R5, 1.55% due 06/26/364 | | | 418,000 | | | | 384,260 | |
GSAA Home Equity Trust | | | | | | | | |
2007-7, 0.65% (1 Month USD LIBOR + 0.54%, Rate Floor: 0.54%) due 07/25/375 | | | 253,064 | | | | 249,312 | |
New Century Home Equity Loan Trust | | | | | | | | |
2004-4, 0.90% (1 Month USD LIBOR + 0.80%, Rate Cap/Floor: 12.50%/0.80%) due 02/25/355 | | | 199,849 | | | | 196,391 | |
Total Residential Mortgage Backed Securities | | | 15,733,797 | |
| | | | | | | | | |
Total Collateralized Mortgage Obligations |
(Cost $16,677,226) | | | 15,733,797 | |
| | | | | | | | | |
ASSET-BACKED SECURITIES†† - 1.3% |
Collateralized Loan Obligations - 1.3% |
Jamestown CLO V Ltd. | | | | | | | | |
2014-5A, 5.32% (3 Month USD LIBOR + 5.10%, Rate Floor: 0.00%) due 01/17/274,5 | | | 4,000,000 | | | | 3,363,284 | |
Treman Park CLO Ltd. | | | | | | | | |
2015-1A, due 10/20/284,8 | | | 3,000,000 | | | | 2,374,322 | |
Avery Point II CLO Ltd. | | | | | | | | |
2013-3X COM, due 01/18/258 | | | 2,841,620 | | | | 1,675,474 | |
ACIS CLO Ltd. | | | | | | | | |
2015-6A, 3.58% (3 Month USD LIBOR + 3.37%, Rate Floor: 0.00%) due 05/01/274,5 | | | 1,000,000 | | | | 1,002,487 | |
Newstar Commercial Loan Funding LLC | | | | | | | | |
2017-1A, 3.69% (3 Month USD LIBOR + 3.50%, Rate Floor: 0.00%) due 03/20/274,5 | | | 1,000,000 | | | | 998,328 | |
Octagon Loan Funding Ltd. | | | | | | | | |
2014-1A, due 11/18/314,8 | | | 2,071,948 | | | | 768,390 | |
SEE NOTES TO FINANCIAL STATEMENTS. | THE GUGGENHEIM FUNDS SEMI-ANNUAL REPORT | 25 |
SCHEDULE OF INVESTMENTS (Unaudited)(continued) | March 31, 2021 |
FLOATING RATE STRATEGIES FUND | |
| | Face
Amount~ | | | Value | |
Halcyon Loan Advisors Funding Ltd. | | | | | | | | |
2012-1A, 3.19% (3 Month USD LIBOR + 3.00%, Rate Floor: 0.00%) due 08/15/234,5 | | | 157,093 | | | $ | 157,235 | |
OHA Credit Partners IX Ltd. | | | | | | | | |
2013-9A, due 10/20/254,8 | | | 1,808,219 | | | | 2,098 | |
Total Collateralized Loan Obligations | | | 10,341,618 | |
| | | | | | | | | |
Transport-Aircraft - 0.0% |
Airplanes Pass Through Trust | | | | | | | | |
2001-1A, due 03/15/19†††,6,7 | | | 896,492 | | | | 90 | |
Total Asset-Backed Securities |
(Cost $12,530,562) | | | 10,341,708 | |
| | | | | | | | | |
SENIOR FIXED RATE INTERESTS - 0.2% |
CONSUMER, CYCLICAL - 0.2% |
Belk, Inc. | | | | | | | | |
13.00% (in-kind rate was 8.00%) due 07/31/25 | | | 2,109,920 | | | | 1,350,349 | |
Total Senior Fixed Rate Interests |
(Cost $2,136,592) | | | | | | | 1,350,349 | |
Total Investments - 104.6% |
(Cost $840,028,706) | | $ | 826,464,612 | |
Other Assets & Liabilities, net - (4.6)% | | | (36,272,405 | ) |
Total Net Assets - 100.0% | | $ | 790,192,207 | |
Forward Foreign Currency Exchange Contracts†† |
Counterparty | | Contracts
to Sell | | | Currency | | | Settlement
Date | | | Settlement
Value | | | Value at
March 31,
2021 | | | Unrealized
Appreciation | |
Barclays Bank plc | | | 28,175,000 | | | | EUR | | | | 04/16/21 | | | $ | 33,792,695 | | | $ | 33,045,831 | | | $ | 746,864 | |
Goldman Sachs International | | | 6,746,000 | | | | GBP | | | | 04/16/21 | | | | 9,433,843 | | | | 9,299,931 | | | | 133,912 | |
UBS AG | | | 308,000 | | | | EUR | | | | 04/16/21 | | | | 362,805 | | | | 361,246 | | | | 1,559 | |
| | | | | | | | | | | | | | | | | | | | | | | $ | 882,335 | |
| | | | | | | | | | | | | | | | | | | | | | | | | |
Counterparty | | Contracts
to Buy | | | Currency | | | Settlement
Date | | | Settlement
Value | | | Value at
March 31,
2021 | | | Unrealized
Appreciation
(Depreciation) | |
Morgan Stanley Capital Services LLC | | | 1,290,000 | | | | EUR | | | | 04/16/21 | | | $ | 1,512,095 | | | $ | 1,513,012 | | | $ | 917 | |
Barclays Bank plc | | | 43,000 | | | | GBP | | | | 04/16/21 | | | | 59,364 | | | | 59,279 | | | | (85 | ) |
| | | | | | | | | | | | | | | | | | | | | | | $ | 832 | |
26 | THE GUGGENHEIM FUNDS SEMI-ANNUAL REPORT | SEE NOTES TO FINANCIAL STATEMENTS. |
SCHEDULE OF INVESTMENTS (Unaudited)(continued) | March 31, 2021 |
FLOATING RATE STRATEGIES FUND | |
~ | The face amount is denominated in U.S. dollars unless otherwise indicated. |
* | Non-income producing security. |
† | Value determined based on Level 1 inputs, unless otherwise noted — See Note 4. |
†† | Value determined based on Level 2 inputs, unless otherwise noted — See Note 4. |
††† | Value determined based on Level 3 inputs — See Note 4. |
1 | Affiliated issuer. |
2 | Rate indicated is the 7-day yield as of March 31, 2021. |
3 | Payment-in-kind security. |
4 | Security is a 144A or Section 4(a)(2) security. These securities have been determined to be liquid under guidelines established by the Board of Trustees. The total market value of 144A or Section 4(a)(2) securities is $21,818,530 (cost $22,812,841), or 2.8% of total net assets. |
5 | Variable rate security. Rate indicated is the rate effective at March 31, 2021. In some instances, the effective rate is limited by a minimum rate floor or a maximum rate cap established by the issuer. The settlement status of a position may also impact the effective rate indicated. In some cases, a position may be unsettled at period end and may not have a stated effective rate. In instances where multiple underlying reference rates and spread amounts are shown, the effective rate is based on a weighted average. |
6 | Security is in default of interest and/or principal obligations. |
7 | Security is a 144A or Section 4(a)(2) security. These securities have been determined to be illiquid and restricted under guidelines established by the Board of Trustees. The total market value of 144A or Section 4(a)(2) illiquid and restricted securities is $51,283 (cost $1,883,995), or less than 0.1% of total net assets — See Note 9. |
8 | Security has no stated coupon. However, it is expected to receive residual cash flow payments on defined deal dates. |
| | CMT — Constant Maturity Treasury |
| | EUR — Euro |
| | EURIBOR — European Interbank Offered Rate |
| | GBP — British Pound |
| | LIBOR — London Interbank Offered Rate |
| | plc — Public Limited Company |
| | REMIC — Real Estate Mortgage Investment Conduit |
| | SARL — Société à Responsabilité Limitée |
| | |
| | See Sector Classification in Other Information section. |
SEE NOTES TO FINANCIAL STATEMENTS. | THE GUGGENHEIM FUNDS SEMI-ANNUAL REPORT | 27 |
SCHEDULE OF INVESTMENTS (Unaudited)(continued) | March 31, 2021 |
FLOATING RATE STRATEGIES FUND | |
The following table summarizes the inputs used to value the Fund’s investments at March 31, 2021 (See Note 4 in the Notes to Financial Statements):
Investments in Securities (Assets) | | Level 1
Quoted
Prices | | | Level 2
Significant
Observable
Inputs | | | Level 3
Significant
Unobservable
Inputs | | | Total | |
Common Stocks | | $ | 633,892 | | | $ | — | | | $ | 147,374 | | | $ | 781,266 | |
Preferred Stocks | | | — | | | | — | | | | — | * | | | — | |
Exchange-Traded Funds | | | 30,318,100 | | | | — | | | | — | | | | 30,318,100 | |
Money Market Fund | | | 45,829,390 | | | | — | | | | — | | | | 45,829,390 | |
Senior Floating Rate Interests | | | — | | | | 691,549,341 | | | | 13,977,755 | | | | 705,527,096 | |
Corporate Bonds | | | — | | | | 16,582,906 | | | | — | | | | 16,582,906 | |
Collateralized Mortgage Obligations | | | — | | | | 15,733,797 | | | | — | | | | 15,733,797 | |
Asset-Backed Securities | | | — | | | | 10,341,618 | | | | 90 | | | | 10,341,708 | |
Senior Fixed Rate Interests | | | — | | | | 1,350,349 | | | | — | | | | 1,350,349 | |
Forward Foreign Currency Exchange Contracts** | | | — | | | | 883,252 | | | | — | | | | 883,252 | |
Total Assets | | $ | 76,781,382 | | | $ | 736,441,263 | | | $ | 14,125,219 | | | $ | 827,347,864 | |
Investments in Securities (Liabilities) | | Level 1
Quoted
Prices | | | Level 2
Significant
Observable
Inputs | | | Level 3
Significant
Unobservable
Inputs | | | Total | |
Forward Foreign Currency Exchange Contracts** | | $ | — | | | $ | 85 | | | $ | — | | | $ | 85 | |
Unfunded Loan Commitments (Note 8) | | | — | | | | — | | | | 41,149 | | | | 41,149 | |
Total Liabilities | | $ | — | | | $ | 85 | | | $ | 41,149 | | | $ | 41,234 | |
* | Security has a market value of $0. |
** | This derivative is reported as unrealized appreciation/depreciation at period end. |
28 | THE GUGGENHEIM FUNDS SEMI-ANNUAL REPORT | SEE NOTES TO FINANCIAL STATEMENTS. |
SCHEDULE OF INVESTMENTS (Unaudited)(continued) | March 31, 2021 |
FLOATING RATE STRATEGIES FUND | |
The following is summary of significant unobservable inputs used in the fair valuation of assets and liabilities categorized within the Level 3 of the fair value hierarchy:
Category | | Ending
Balance at
March 31, 2021 | | Valuation
Technique | Unobservable Inputs | | Input Range | | | Weighted
Average* | |
Assets: | | | | | | | | | | | | | | |
Asset-Backed Securities | | $ | 90 | | Option Adjusted Spread off the prior month end broker quote | Broker Quote | — | — |
Common Stocks | | | 147,044 | | Enterprise Value | Valuation Multiple | 2.9x-10.4x | 5.1x |
Common Stocks | | | 330 | | Model Price | Liquidation Value | — | — |
Senior Floating Rate Interests | | | 10,032,660 | | Third Party Pricing | Broker Quote | — | — |
Senior Floating Rate Interests | | | 3,945,095 | | Option Adjusted Spread off the prior month end broker quote | Broker Quote | — | — |
Total Assets | | $ | 14,125,219 | | | | | |
Liabilities: | | | | | | | | | | | | | | |
Unfunded Loan Commitments | | $ | 41,149 | | Model Price | Purchase Price | — | — |
* | Inputs are weighted by the fair value of the instruments. |
Significant changes in a quote, liquidation value or valuation multiple would generally result in significant changes in the fair value of the security. Any remaining Level 3 securities held by the Fund and excluded from the table above, were not considered material to the Fund.
The Fund’s fair valuation leveling guidelines classify a single daily broker quote, or a vendor price based on a single daily or monthly broker quote, as Level 3, if such a quote or price cannot be supported with other available market information.
Transfers between Level 2 and Level 3 may occur as markets fluctuate and/or the availability of data used in an investment’s valuation changes. For the period ended March 31, 2021, the Fund had securities with a total value of $897,158 transfer from Level 2 to Level 3 due to lack of observable inputs and had securities with a total market value of $10,819,164 transfer out of Level 3 to Level 2 due to the availability of current and reliable market-based data provided by a third-party pricing service which utilizes significant observable inputs.
SEE NOTES TO FINANCIAL STATEMENTS. | THE GUGGENHEIM FUNDS SEMI-ANNUAL REPORT | 29 |
SCHEDULE OF INVESTMENTS (Unaudited)(concluded) | March 31, 2021 |
FLOATING RATE STRATEGIES FUND | |
Summary of Fair Value Level 3 Activity
Following is a reconciliation of Level 3 assets for which significant unobservable inputs were used to determine fair value for the period ended March 31, 2021:
| | | Assets | | | | | | | Liabilities | |
| | | Common
Stocks | | | Senior
Floating Rate
Interests | | | Asset-Backed
Securities | | | Preferred
Stocks | | | Total
Assets | | | Unfunded
Loan
Commitments | |
Beginning Balance | | $ | 1,611,492 | | | $ | 50,579,979 | | | $ | 90 | | | $ | 313,772 | | | $ | 52,505,333 | | | $ | (8,851 | ) |
Purchases/(Receipts) | | | — | | | | 1,736,797 | | | | — | | | | — | | | | 1,736,797 | | | | (34,378 | ) |
(Sales, maturities and paydowns)/Fundings | | | (1,210,400 | ) | | | (29,782,949 | ) | | | — | | | | — | | | | (30,993,349 | ) | | | 1,739 | |
Amortization of premiums/discounts | | | — | | | | (20,141 | ) | | | — | | | | — | | | | (20,141 | ) | | | 3,636 | |
Total realized gains (losses) included in earnings | | | (581,562 | ) | | | (7,732,677 | ) | | | — | | | | — | | | | (8,314,239 | ) | | | (1,636 | ) |
Total change in unrealized appreciation (depreciation) included in earnings | | | 327,844 | | | | 9,118,752 | | | | — | | | | (313,772 | ) | | | 9,132,824 | | | | (1,659 | ) |
Transfers into Level 3 | | | — | | | | 897,158 | | | | — | | | | — | | | | 897,158 | | | | — | |
Transfers out of Level 3 | | | — | | | | (10,819,164 | ) | | | — | | | | — | | | | (10,819,164 | ) | | | — | |
Ending Balance | | $ | 147,374 | | | $ | 13,977,755 | | | $ | 90 | | | $ | — | | | $ | 14,125,219 | | | $ | (41,149 | ) |
Net change in unrealized appreciation (depreciation) for investments in Level 3 securities still held at March 31, 2021 | | $ | 327,844 | | | $ | 736,245 | | | $ | — | | | $ | (313,772 | ) | | $ | 750,317 | | | $ | (1,659 | ) |
Affiliated Transactions
Investments representing 5% or more of the outstanding voting shares of a company, or control of or by, or common control under Guggenheim Investments, result in that company being considered an affiliated issuer, as defined in the 1940 Act.
Transactions during the period ended March 31, 2021, in which the company is an affiliated issuer, were as follows:
Security Name | | Value
09/30/20 | | | Additions | | | Reductions | | | Realized
Gain (Loss) | | | Change in
Unrealized
Appreciation
(Depreciation) | | | Value
03/31/21 | | | Shares
03/31/21 | |
Common Stocks | | | | | | | | | | | | | | | | | | | | | | | | | | | | |
BP Holdco LLC* | | $ | 86,130 | | | $ | — | | | $ | — | | | $ | — | | | $ | — | | | $ | 86,130 | | | | 244,278 | |
Targus Group International, Inc.* | | | 26,242 | | | | — | | | | — | | | | — | | | | 1,094 | | | | 27,336 | | | | 12,773 | |
| | | $ | 112,372 | | | $ | — | | | $ | — | | | $ | — | | | $ | 1,094 | | | $ | 113,466 | | | | | |
* | Non-income producing security. |
30 | THE GUGGENHEIM FUNDS SEMI-ANNUAL REPORT | SEE NOTES TO FINANCIAL STATEMENTS. |
STATEMENT OF ASSETS AND LIABILITIES (Unaudited) |
FLOATING RATE STRATEGIES FUND |
March 31, 2021
Assets: |
Investments in unaffiliated issuers, at value (cost $839,937,425) | | $ | 826,351,146 | |
Investments in affiliated issuers, at value (cost $91,281) | | | 113,466 | |
Foreign currency, at value (cost $157,485) | | | 157,490 | |
Cash | | | 1,302,894 | |
Unrealized appreciation on forward foreign currency exchange contracts | | | 883,252 | |
Prepaid expenses | | | 171,941 | |
Receivables: |
Fund shares sold | | | 1,676,226 | |
Interest | | | 1,606,716 | |
Securities sold | | | 1,271,911 | |
Total assets | | | 833,535,042 | |
| | | | | |
Liabilities: |
Unfunded loan commitments, at value (Note 8) (commitment fees received $44,724) | | | 41,149 | |
Segregated cash due to broker | | | 600,000 | |
Unrealized depreciation on forward foreign currency exchange contracts | | | 85 | |
Payable for: |
Securities purchased | | | 39,709,550 | |
Fund shares redeemed | | | 1,284,726 | |
Distributions to shareholders | | | 442,435 | |
Management fees | | | 419,550 | |
Transfer agent/maintenance fees | | | 245,734 | |
Distribution and service fees | | | 85,269 | |
Fund accounting/administration fees | | | 47,051 | |
Trustees’ fees* | | | 29,243 | |
Due to Investment Adviser | | | 554 | |
Miscellaneous | | | 437,489 | |
Total liabilities | | | 43,342,835 | |
Net assets | | $ | 790,192,207 | |
| | | | | |
Net assets consist of: |
Paid in capital | | $ | 966,693,453 | |
Total distributable earnings (loss) | | | (176,501,246 | ) |
Net assets | | $ | 790,192,207 | |
| | | | | |
A-Class: |
Net assets | | $ | 142,284,587 | |
Capital shares outstanding | | | 5,718,024 | |
Net asset value per share | | $ | 24.88 | |
Maximum offering price per share (Net asset value divided by 97.00%) | | $ | 25.65 | |
| | | | | |
C-Class: |
Net assets | | $ | 56,593,252 | |
Capital shares outstanding | | | 2,275,100 | |
Net asset value per share | | $ | 24.88 | |
| | | | | |
P-Class: |
Net assets | | $ | 31,134,623 | |
Capital shares outstanding | | | 1,250,655 | |
Net asset value per share | | $ | 24.89 | |
| | | | | |
Institutional Class: |
Net assets | | $ | 558,491,795 | |
Capital shares outstanding | | | 22,424,793 | |
Net asset value per share | | $ | 24.91 | |
| | | | | |
R6-Class: |
Net assets | | $ | 1,687,950 | |
Capital shares outstanding | | | 67,765 | |
Net asset value per share | | $ | 24.91 | |
* | Relates to Trustees not deemed “interested persons” within the meaning of Section 2(a)(19) of the 1940 Act. |
SEE NOTES TO FINANCIAL STATEMENTS. | THE GUGGENHEIM FUNDS SEMI-ANNUAL REPORT | 31 |
STATEMENT OF OPERATIONS (Unaudited) |
FLOATING RATE STRATEGIES FUND |
Six Months Ended March 31, 2021
Investment Income: |
Dividends from securities of unaffiliated issuers | | $ | 636,448 | |
Interest from securities of unaffiliated issuers (net of foreign withholding tax of $466) | | | 13,901,878 | |
Total investment income | | | 14,538,326 | |
| | | | | |
Expenses: |
Management fees | | | 2,413,019 | |
Distribution and service fees: |
A-Class | | | 173,560 | |
C-Class | | | 300,086 | |
P-Class | | | 40,589 | |
Transfer agent/maintenance fees: |
A-Class | | | 31,736 | |
C-Class | | | 10,017 | |
P-Class | | | 2,064 | |
Institutional Class | | | 35,244 | |
R6-Class | | | 262 | |
Line of credit fees | | | 270,836 | |
Fund accounting/administration fees | | | 255,247 | |
Professional fees | | | 57,498 | |
Custodian fees | | | 9,848 | |
Trustees’ fees* | | | 910 | |
Miscellaneous | | | 102,304 | |
Recoupment of previously waived fees: |
Institutional Class | | | 1,483 | |
R6-Class | | | 18 | |
Total expenses | | | 3,704,721 | |
Less: |
Expenses reimbursed by Adviser: |
A-Class | | | (35,401 | ) |
C-Class | | | (11,983 | ) |
P-Class | | | (2,821 | ) |
Institutional Class | | | (20,530 | ) |
R6-Class | | | (223 | ) |
Expenses waived by Adviser | | | (14,266 | ) |
Earnings credits applied | | | (600 | ) |
Total waived/reimbursed expenses | | | (85,824 | ) |
Net expenses | | | 3,618,897 | |
Net investment income | | | 10,919,429 | |
| | | | | |
Net Realized and Unrealized Gain (Loss): |
Net realized gain (loss) on: |
Investments | | $ | (11,310,965 | ) |
Forward foreign currency exchange contracts | | | (1,241,233 | ) |
Foreign currency transactions | | | 218,443 | |
Net realized loss | | | (12,333,755 | ) |
Net change in unrealized appreciation (depreciation) on: |
Investments in unaffiliated issuers | | | 37,995,072 | |
Investments in affiliated issuers | | | 1,094 | |
Forward foreign currency exchange contracts | | | 503,011 | |
Foreign currency translations | | | (98,908 | ) |
Net change in unrealized appreciation (depreciation) | | | 38,400,269 | |
Net realized and unrealized gain | | | 26,066,514 | |
Net increase in net assets resulting from operations | | $ | 36,985,943 | |
* | Relates to Trustees not deemed “interested persons” within the meaning of Section 2(a)(19) of the 1940 Act. |
32 | THE GUGGENHEIM FUNDS SEMI-ANNUAL REPORT | SEE NOTES TO FINANCIAL STATEMENTS. |
STATEMENTS OF CHANGES IN NET ASSETS |
FLOATING RATE STRATEGIES FUND |
| | Six Months Ended
March 31, 2021
(Unaudited) | | | Year Ended
September 30,
2020 | |
Increase (Decrease) in Net Assets from Operations: | | | | | | | | |
Net investment income | | $ | 10,919,429 | | | $ | 45,965,099 | |
Net realized loss on investments | | | (12,333,755 | ) | | | (104,503,058 | ) |
Net change in unrealized appreciation (depreciation) on investments | | | 38,400,269 | | | | 18,077,576 | |
Net increase (decrease) in net assets resulting from operations | | | 36,985,943 | | | | (40,460,383 | ) |
| | | | | | | | | |
Distributions: | | | | | | | | |
Distributions to shareholders | | | | | | | | |
A-Class | | | (2,373,133 | ) | | | (6,169,321 | ) |
C-Class | | | (802,851 | ) | | | (2,453,764 | ) |
P-Class | | | (554,710 | ) | | | (2,596,495 | ) |
Institutional Class | | | (9,295,094 | ) | | | (26,336,056 | ) |
R6-Class | | | (31,816 | ) | | | (172,212 | ) |
Return of capital | | | | | | | | |
A-Class | | | — | | | | (1,369,063 | ) |
C-Class | | | — | | | | (544,527 | ) |
P-Class | | | — | | | | (576,200 | ) |
Institutional Class | | | — | | | | (5,844,358 | ) |
R6-Class | | | — | | | | (38,216 | ) |
Total distributions to shareholders | | | (13,057,604 | ) | | | (46,100,212 | ) |
| | | | | | | | | |
Capital share transactions: | | | | | | | | |
Proceeds from sale of shares | | | | | | | | |
A-Class | | | 16,539,899 | | | | 59,076,348 | |
C-Class | | | 5,460,937 | | | | 5,882,260 | |
P-Class | | | 4,105,521 | | | | 14,359,269 | |
Institutional Class | | | 145,777,277 | | | | 359,733,415 | |
R6-Class | | | 229,971 | | | | 7,014,197 | |
Distributions reinvested | | | | | | | | |
A-Class | | | 1,700,554 | | | | 5,748,291 | |
C-Class | | | 663,027 | | | | 2,302,265 | |
P-Class | | | 553,560 | | | | 3,170,610 | |
Institutional Class | | | 7,396,763 | | | | 25,268,085 | |
R6-Class | | | 31,639 | | | | 210,428 | |
Cost of shares redeemed | | | | | | | | |
A-Class | | | (20,380,932 | ) | | | (145,876,744 | ) |
C-Class | | | (15,427,490 | ) | | | (50,806,686 | ) |
P-Class | | | (7,853,072 | ) | | | (113,381,867 | ) |
Institutional Class | | | (115,346,592 | ) | | | (887,071,891 | ) |
R6-Class | | | (260,190 | ) | | | (76,762,784 | ) |
Net increase (decrease) from capital share transactions | | | 23,190,872 | | | | (791,134,804 | ) |
Net increase (decrease) in net assets | | | 47,119,211 | | | | (877,695,399 | ) |
| | | | | | | | | |
Net assets: | | | | | | | | |
Beginning of period | | | 743,072,996 | | | | 1,620,768,395 | |
End of period | | $ | 790,192,207 | | | $ | 743,072,996 | |
SEE NOTES TO FINANCIAL STATEMENTS. | THE GUGGENHEIM FUNDS SEMI-ANNUAL REPORT | 33 |
STATEMENTS OF CHANGES IN NET ASSETS (concluded) |
FLOATING RATE STRATEGIES FUND |
| | Six Months Ended
March 31, 2021
(Unaudited) | | | Year Ended
September 30,
2020 | |
Capital share activity: | | | | | | | | |
Shares sold | | | | | | | | |
A-Class | | | 668,218 | | | | 2,408,149 | |
C-Class | | | 220,517 | | | | 239,412 | |
P-Class | | | 166,244 | | | | 585,090 | |
Institutional Class | | | 5,895,285 | | | | 14,856,298 | |
R6-Class | | | 9,562 | | | | 280,578 | |
Shares issued from reinvestment of distributions | | | | | | �� | | |
A-Class | | | 69,149 | | | | 238,481 | |
C-Class | | | 26,983 | | | | 95,750 | |
P-Class | | | 22,503 | | | | 130,742 | |
Institutional Class | | | 300,452 | | | | 1,046,088 | |
R6-Class | | | 1,285 | | | | 8,507 | |
Shares redeemed | | | | | | | | |
A-Class | | | (827,458 | ) | | | (6,183,851 | ) |
C-Class | | | (626,619 | ) | | | (2,141,265 | ) |
P-Class | | | (318,371 | ) | | | (4,686,345 | ) |
Institutional Class | | | (4,702,232 | ) | | | (37,182,772 | ) |
R6-Class | | | (10,512 | ) | | | (3,060,616 | ) |
Net increase (decrease) in shares | | | 895,006 | | | | (33,365,754 | ) |
34 | THE GUGGENHEIM FUNDS SEMI-ANNUAL REPORT | SEE NOTES TO FINANCIAL STATEMENTS. |
FINANCIAL HIGHLIGHTS |
FLOATING RATE STRATEGIES FUND |
This table is presented to show selected data for a share outstanding throughout each period and to assist shareholders in evaluating a Fund’s performance for the periods presented.
A-Class | | Six Months Ended
March 31, 2021a | | | Year
Ended
Sept. 30,
2020 | | | Year
Ended
Sept. 30,
2019 | | | Year
Ended
Sept. 30,
2018 | | | Year
Ended
Sept. 30,
2017 | | | Year
Ended
Sept. 30,
2016 | |
Per Share Data |
Net asset value, beginning of period | | $ | 24.08 | | | $ | 25.23 | | | $ | 25.92 | | | $ | 26.01 | | | $ | 25.92 | | | $ | 25.88 | |
Income (loss) from investment operations: |
Net investment income (loss)b | | | .35 | | | | 1.02 | | | | 1.17 | | | | 1.04 | | | | .93 | | | | .99 | |
Net gain (loss) on investments (realized and unrealized) | | | .87 | | | | (1.16 | ) | | | (.67 | ) | | | (.07 | ) | | | .10 | | | | .12 | |
Total from investment operations | | | 1.22 | | | | (.14 | ) | | | .50 | | | | .97 | | | | 1.03 | | | | 1.11 | |
Less distributions from: |
Net investment income | | | (.42 | ) | | | (.83 | ) | | | (1.19 | ) | | | (1.06 | ) | | | (.94 | ) | | | (1.07 | ) |
Return of capital | | | — | | | | (.18 | ) | | | — | | | | — | | | | — | | | | — | |
Total distributions | | | (.42 | ) | | | (1.01 | ) | | | (1.19 | ) | | | (1.06 | ) | | | (.94 | ) | | | (1.07 | ) |
Net asset value, end of period | | $ | 24.88 | | | $ | 24.08 | | | $ | 25.23 | | | $ | 25.92 | | | $ | 26.01 | | | $ | 25.92 | |
|
Total Returnc | | | 5.10 | % | | | (0.50 | %) | | | 2.01 | % | | | 3.80 | % | | | 4.03 | % | | | 4.47 | % |
Ratios/Supplemental Data |
Net assets, end of period (in thousands) | | $ | 142,285 | | | $ | 139,857 | | | $ | 235,752 | | | $ | 431,562 | | | $ | 534,911 | | | $ | 452,611 | |
Ratios to average net assets: |
Net investment income (loss) | | | 2.84 | % | | | 4.23 | % | | | 4.60 | % | | | 4.02 | % | | | 3.58 | % | | | 3.88 | % |
Total expensesd | | | 1.13 | % | | | 1.25 | % | | | 1.23 | % | | | 1.15 | % | | | 1.13 | % | | | 1.20 | % |
Net expensese,f,g | | | 1.08 | % | | | 1.10 | % | | | 1.07 | % | | | 1.03 | % | | | 1.04 | % | | | 1.03 | % |
Portfolio turnover rate | | | 29 | % | | | 20 | % | | | 10 | % | | | 33 | % | | | 44 | % | | | 35 | % |
SEE NOTES TO FINANCIAL STATEMENTS. | THE GUGGENHEIM FUNDS SEMI-ANNUAL REPORT | 35 |
FINANCIAL HIGHLIGHTS (continued) |
FLOATING RATE STRATEGIES FUND |
This table is presented to show selected data for a share outstanding throughout each period and to assist shareholders in evaluating a Fund’s performance for the periods presented.
C-Class | | Six Months Ended
March 31, 2021a | | | Year
Ended
Sept. 30,
2020 | | | Year
Ended
Sept. 30,
2019 | | | Year
Ended
Sept. 30,
2018 | | | Year
Ended
Sept. 30,
2017 | | | Year
Ended
Sept. 30,
2016 | |
Per Share Data |
Net asset value, beginning of period | | $ | 24.07 | | | $ | 25.22 | | | $ | 25.91 | | | $ | 26.00 | | | $ | 25.91 | | | $ | 25.87 | |
Income (loss) from investment operations: |
Net investment income (loss)b | | | .26 | | | | .84 | | | | .98 | | | | .85 | | | | .74 | | | | .80 | |
Net gain (loss) on investments (realized and unrealized) | | | .88 | | | | (1.16 | ) | | | (.67 | ) | | | (.07 | ) | | | .10 | | | | .12 | |
Total from investment operations | | | 1.14 | | | | (.32 | ) | | | .31 | | | | .78 | | | | .84 | | | | .92 | |
Less distributions from: |
Net investment income | | | (.33 | ) | | | (.68 | ) | | | (1.00 | ) | | | (.87 | ) | | | (.75 | ) | | | (.88 | ) |
Return of capital | | | — | | | | (.15 | ) | | | — | | | | — | | | | — | | | | — | |
Total distributions | | | (.33 | ) | | | (.83 | ) | | | (1.00 | ) | | | (.87 | ) | | | (.75 | ) | | | (.88 | ) |
Net asset value, end of period | | $ | 24.88 | | | $ | 24.07 | | | $ | 25.22 | | | $ | 25.91 | | | $ | 26.00 | | | $ | 25.91 | |
|
Total Returnc | | | 4.71 | % | | | (1.24 | %) | | | 1.26 | % | | | 3.03 | % | | | 3.26 | % | | | 3.68 | % |
Ratios/Supplemental Data |
Net assets, end of period (in thousands) | | $ | 56,593 | | | $ | 63,891 | | | $ | 112,481 | | | $ | 172,906 | | | $ | 204,008 | | | $ | 197,296 | |
Ratios to average net assets: |
Net investment income (loss) | | | 2.10 | % | | | 3.47 | % | | | 3.86 | % | | | 3.29 | % | | | 2.83 | % | | | 3.13 | % |
Total expensesd | | | 1.87 | % | | | 1.96 | % | | | 1.93 | % | | | 1.87 | % | | | 1.83 | % | | | 1.93 | % |
Net expensese,f,g | | | 1.83 | % | | | 1.85 | % | | | 1.82 | % | | | 1.78 | % | | | 1.79 | % | | | 1.78 | % |
Portfolio turnover rate | | | 29 | % | | | 20 | % | | | 10 | % | | | 33 | % | | | 44 | % | | | 35 | % |
36 | THE GUGGENHEIM FUNDS SEMI-ANNUAL REPORT | SEE NOTES TO FINANCIAL STATEMENTS. |
FINANCIAL HIGHLIGHTS (continued) |
FLOATING RATE STRATEGIES FUND |
This table is presented to show selected data for a share outstanding throughout each period and to assist shareholders in evaluating a Fund’s performance for the periods presented.
P-Class | | Six Months Ended
March 31, 2021a | | | Year
Ended
Sept. 30,
2020 | | | Year
Ended
Sept. 30,
2019 | | | Year
Ended
Sept. 30,
2018 | | | Year
Ended
Sept. 30,
2017 | | | Year
Ended
Sept. 30,
2016 | |
Per Share Data |
Net asset value, beginning of period | | $ | 24.09 | | | $ | 25.24 | | | $ | 25.93 | | | $ | 26.02 | | | $ | 25.93 | | | $ | 25.89 | |
Income (loss) from investment operations: |
Net investment income (loss)b | | | .35 | | | | 1.04 | | | | 1.17 | | | | 1.05 | | | | .94 | | | | .99 | |
Net gain (loss) on investments (realized and unrealized) | | | .87 | | | | (1.18 | ) | | | (.67 | ) | | | (.08 | ) | | | .09 | | | | .12 | |
Total from investment operations | | | 1.22 | | | | (.14 | ) | | | .50 | | | | .97 | | | | 1.03 | | | | 1.11 | |
Less distributions from: |
Net investment income | | | (.42 | ) | | | (.83 | ) | | | (1.19 | ) | | | (1.06 | ) | | | (.94 | ) | | | (1.07 | ) |
Return of capital | | | — | | | | (.18 | ) | | | — | | | | — | | | | — | | | | — | |
Total distributions | | | (.42 | ) | | | (1.01 | ) | | | (1.19 | ) | | | (1.06 | ) | | | (.94 | ) | | | (1.07 | ) |
Net asset value, end of period | | $ | 24.89 | | | $ | 24.09 | | | $ | 25.24 | | | $ | 25.93 | | | $ | 26.02 | | | $ | 25.93 | |
|
Total Return | | | 5.09 | % | | | (0.50 | %) | | | 2.01 | % | | | 3.80 | % | | | 4.03 | % | | | 4.46 | % |
Ratios/Supplemental Data |
Net assets, end of period (in thousands) | | $ | 31,135 | | | $ | 33,251 | | | $ | 135,036 | | | $ | 385,306 | | | $ | 360,829 | | | $ | 124,974 | |
Ratios to average net assets: |
Net investment income (loss) | | | 2.85 | % | | | 4.26 | % | | | 4.59 | % | | | 4.05 | % | | | 3.59 | % | | | 3.86 | % |
Total expensesd | | | 1.10 | % | | | 1.37 | % | | | 1.22 | % | | | 1.15 | % | | | 1.16 | % | | | 1.06 | % |
Net expensese,f,g | | | 1.08 | % | | | 1.10 | % | | | 1.07 | % | | | 1.03 | % | | | 1.03 | % | | | 1.03 | % |
Portfolio turnover rate | | | 29 | % | | | 20 | % | | | 10 | % | | | 33 | % | | | 44 | % | | | 35 | % |
SEE NOTES TO FINANCIAL STATEMENTS. | THE GUGGENHEIM FUNDS SEMI-ANNUAL REPORT | 37 |
FINANCIAL HIGHLIGHTS (continued) |
FLOATING RATE STRATEGIES FUND |
This table is presented to show selected data for a share outstanding throughout each period and to assist shareholders in evaluating a Fund’s performance for the periods presented.
Institutional Class | | Six Months Ended
March 31, 2021a | | | Year
Ended
Sept. 30,
2020 | | | Year
Ended
Sept. 30,
2019 | | | Year
Ended
Sept. 30,
2018 | | | Year
Ended
Sept. 30,
2017 | | | Year
Ended
Sept. 30,
2016 | |
Per Share Data |
Net asset value, beginning of period | | $ | 24.10 | | | $ | 25.25 | | | $ | 25.95 | | | $ | 26.03 | | | $ | 25.94 | | | $ | 25.90 | |
Income (loss) from investment operations: |
Net investment income (loss)b | | | .38 | | | | 1.09 | | | | 1.23 | | | | 1.11 | | | | 1.00 | | | | 1.05 | |
Net gain (loss) on investments (realized and unrealized) | | | .88 | | | | (1.17 | ) | | | (.68 | ) | | | (.07 | ) | | | .10 | | | | .12 | |
Total from investment operations | | | 1.26 | | | | (.08 | ) | | | .55 | | | | 1.04 | | | | 1.10 | | | | 1.17 | |
Less distributions from: |
Net investment income | | | (.45 | ) | | | (.88 | ) | | | (1.25 | ) | | | (1.12 | ) | | | (1.01 | ) | | | (1.13 | ) |
Return of capital | | | — | | | | (.19 | ) | | | — | | | | — | | | | — | | | | — | |
Total distributions | | | (.45 | ) | | | (1.07 | ) | | | (1.25 | ) | | | (1.12 | ) | | | (1.01 | ) | | | (1.13 | ) |
Net asset value, end of period | | $ | 24.91 | | | $ | 24.10 | | | $ | 25.25 | | | $ | 25.95 | | | $ | 26.03 | | | $ | 25.94 | |
|
Total Return | | | 5.22 | % | | | (0.26 | %) | | | 2.21 | % | | | 4.08 | % | | | 4.28 | % | | | 4.71 | % |
Ratios/Supplemental Data |
Net assets, end of period (in thousands) | | $ | 558,492 | | | $ | 504,449 | | | $ | 1,065,820 | | | $ | 2,227,970 | | | $ | 2,590,393 | | | $ | 1,643,932 | |
Ratios to average net assets: |
Net investment income (loss) | | | 3.07 | % | | | 4.48 | % | | | 4.83 | % | | | 4.28 | % | | | 3.83 | % | | | 4.11 | % |
Total expensesd | | | 0.85 | % | | | 0.97 | % | | | 0.92 | % | | | 0.84 | % | | | 0.82 | % | | | 0.87 | % |
Net expensese,f,g | | | 0.84 | % | | | 0.85 | % | | | 0.83 | % | | | 0.79 | % | | | 0.79 | % | | | 0.79 | % |
Portfolio turnover rate | | | 29 | % | | | 20 | % | | | 10 | % | | | 33 | % | | | 44 | % | | | 35 | % |
38 | THE GUGGENHEIM FUNDS SEMI-ANNUAL REPORT | SEE NOTES TO FINANCIAL STATEMENTS. |
FINANCIAL HIGHLIGHTS (continued) |
FLOATING RATE STRATEGIES FUND |
This table is presented to show selected data for a share outstanding throughout each period and to assist shareholders in evaluating a Fund’s performance for the periods presented.
R6-Class | | Six Months Ended
March 31, 2021a | | | Year
Ended
Sept. 30,
2020 | | | Period
Ended
Sept. 30,
2019h | |
Per Share Data |
Net asset value, beginning of period | | $ | 24.10 | | | $ | 25.25 | | | $ | 25.38 | |
Income (loss) from investment operations: |
Net investment income (loss)b | | | .38 | | | | 1.13 | | | | .69 | |
Net gain (loss) on investments (realized and unrealized) | | | .88 | | | | (1.21 | ) | | | (.14 | ) |
Total from investment operations | | | 1.26 | | | | (.08 | ) | | | .55 | |
Less distributions from: |
Net investment income | | | (.45 | ) | | | (.88 | ) | | | (.68 | ) |
Return of capital | | | — | | | | (.19 | ) | | | — | |
Total distributions | | | (.45 | ) | | | (1.07 | ) | | | (.68 | ) |
Net asset value, end of period | | $ | 24.91 | | | $ | 24.10 | | | $ | 25.25 | |
|
Total Return | | | 5.17 | % | | | (0.22 | %) | | | 2.20 | % |
Ratios/Supplemental Data |
Net assets, end of period (in thousands) | | $ | 1,688 | | | $ | 1,625 | | | $ | 71,680 | |
Ratios to average net assets: |
Net investment income (loss) | | | 3.12 | % | | | 4.56 | % | | | 4.89 | % |
Total expensesd | | | 0.87 | % | | | 0.86 | % | | | 0.85 | % |
Net expensese,f,g | | | 0.84 | % | | | 0.84 | % | | | 0.84 | % |
Portfolio turnover rate | | | 29 | % | | | 20 | % | | | 10 | % |
SEE NOTES TO FINANCIAL STATEMENTS. | THE GUGGENHEIM FUNDS SEMI-ANNUAL REPORT | 39 |
FINANCIAL HIGHLIGHTS (concluded) |
FLOATING RATE STRATEGIES FUND | |
a | Unaudited figures for the period ended March 31, 2021. Percentage amounts for the period, except total return and portfolio turnover rate, have been annualized. |
b | Net investment income (loss) per share was computed using average shares outstanding throughout the period. |
c | Total return does not reflect the impact of any applicable sales charges. |
d | Does not include expenses of the underlying funds in which the Fund invests. |
e | Net expense information reflects the expense ratios after expense waivers and reimbursements, as applicable. |
f | The portion of the ratios of net expenses to average net assets attributable to recoupments of prior fee reductions or expense reimbursements for the periods presented was as follows: |
| | | 03/31/21a | 09/30/20 | 09/30/19 | 09/30/18 | 09/30/17 |
| | A-Class | — | 0.00%* | — | — | — |
| | C-Class | — | 0.00%* | — | 0.01% | — |
| | P-Class | — | 0.00%* | — | — | — |
| | Institutional Class | 0.00%* | 0.00%* | — | — | 0.01% |
| | R6-Class | 0.00%* | 0.00%* | 0.00%* | N/A | N/A |
g | Net expenses may include expenses that are excluded from the expense limitation agreement. Excluding these expenses, the net expense ratios for the periods presented would be: |
| | | 03/31/21a | 09/30/20 | 09/30/19 | 09/30/18 | 09/30/17 | 09/30/16 |
| | A-Class | 1.01% | 1.02% | 1.02% | 1.02% | 1.02% | 1.02% |
| | C-Class | 1.76% | 1.77% | 1.77% | 1.77% | 1.77% | 1.77% |
| | P-Class | 1.01% | 1.02% | 1.02% | 1.02% | 1.02% | 1.02% |
| | Institutional Class | 0.77% | 0.78% | 0.78% | 0.78% | 0.78% | 0.78% |
| | R6-Classh | 0.77% | 0.78% | 0.78% | N/A | N/A | N/A |
h | Since commencement of operations: March 13, 2019. Percentage amounts for the period, except total return and portfolio turnover rate, have been annualized. |
40 | THE GUGGENHEIM FUNDS SEMI-ANNUAL REPORT | SEE NOTES TO FINANCIAL STATEMENTS. |
NOTES TO FINANCIAL STATEMENTS (Unaudited) |
Note 1 – Organization and Significant Accounting Policies
Organization
Guggenheim Funds Trust (the “Trust”), a Delaware statutory trust, is registered with the SEC under the Investment Company Act of 1940 (“1940 Act”), as an open-ended investment company of the series type. Each series, in effect, is representing a separate fund. The Trust may issue an unlimited number of authorized shares. The Trust accounts for the assets of each fund separately.
The Trust offers a combination of five separate classes of shares: A-Class shares, C-Class shares, P-Class shares, R6-Class shares and Institutional Class shares. Sales of shares of each Class are made without a front-end sales charge at the net asset value per share (“NAV”), with the exception of A-Class shares. A-Class shares are sold at the NAV, plus the applicable front-end sales charge. The sales charge varies depending on the amount purchased. A-Class share purchases of $1 million or more are exempt from the front-end sales charge but have a 1% contingent deferred sales charge (“CDSC”), if shares are redeemed within 12 months of purchase. C-Class shares have a 1% CDSC if shares are redeemed within 12 months of purchase. C-Class shares automatically convert to A-Class shares on or about the 10th day of the month following the 10-year anniversary of the purchase of the C-Class shares. This conversion will be executed without any sales charge, fee or other charge. After the conversion is completed, the shares will be subject to all features and expenses of A-Class shares. Institutional Class shares are offered primarily for direct investment by institutions such as pension and profit sharing plans, endowments, foundations and corporations. Institutional Class shares require a minimum initial investment of $2 million and a minimum account balance of $1 million. R6-Class shares are offered primarily through qualified retirement and benefit plans. R6-Class shares are also offered through certain other plans and platforms sponsored by financial intermediaries. Certain institutional investors and others deemed appropriate by Guggenheim Investments (“GI”) may also be eligible to purchase R6-Class shares subject to a $2 million minimum initial investment. At March 31, 2021, the Trust consisted of nineteen funds (the “Funds”).
This report covers the Floating Rate Strategies Fund (the “Fund”), a diversified investment company. At March 31, 2021, A-Class, C-Class, P-Class, Institutional Class and R6-Class shares have been issued by the Fund.
Guggenheim Partners Investment Management, LLC (“GPIM”), which operates under the name Guggenheim Investments, provides advisory services. Guggenheim Funds Distributors, LLC (“GFD”) acts as principal underwriter for the Trust. GI and GFD are affiliated entities.
Significant Accounting Policies
The Fund operates as an investment company and, accordingly, follows the investment company accounting and reporting guidance of the Financial Accounting Standards Board (“FASB”) Accounting Standards Codification Topic 946 Financial Services – Investment Companies.
| | THE GUGGENHEIM FUNDS SEMI-ANNUAL REPORT | 41 |
NOTES TO FINANCIAL STATEMENTS (Unaudited)(continued) |
The following significant accounting policies are in conformity with U.S. generally accepted accounting principles (“U.S. GAAP”) and are consistently followed by the Trust. This requires management to make estimates and assumptions that affect the reported amount of assets and liabilities, contingent assets and liabilities at the date of the financial statements, and the reported amounts of revenues and expenses during the reporting period. Actual results could differ from these estimates. All time references are based on Eastern Time.
The NAV of each Class of the Fund is calculated by dividing the market value of the Fund’s securities and other assets, less all liabilities, attributable to the Class by the number of outstanding shares of the Class.
(a) Valuation of Investments
The Board of Trustees of the Fund (the “Board”) has adopted policies and procedures for the valuation of the Fund’s investments (the “Valuation Procedures”). Pursuant to the Valuation Procedures, the Board has delegated to a valuation committee, consisting of representatives from Guggenheim’s investment management, fund administration, legal and compliance departments (the “Valuation Committee”), the day-to-day responsibility for implementing the Valuation Procedures, including, under most circumstances, the responsibility for determining the fair value of the Fund’s securities and/or other assets.
Valuations of the Fund’s securities and other assets are supplied primarily by pricing services appointed pursuant to the processes set forth in the Valuation Procedures. The Valuation Committee convenes monthly, or more frequently as needed, to review the valuation of all assets which have been fair valued for reasonableness. The Fund’s officers, through the Valuation Committee and consistent with the monitoring and review responsibilities set forth in the Valuation Procedures, regularly review procedures used and valuations provided by the pricing services.
If the pricing service cannot or does not provide a valuation for a particular investment or such valuation is deemed unreliable, such investment is fair valued by the Valuation Committee.
Equity securities listed or traded on a recognized U.S. securities exchange or the National Association of Securities Dealers Automated Quotations (“NASDAQ”) National Market System shall generally be valued on the basis of the last sale price on the primary U.S. exchange or market on which the security is listed or traded; provided, however, that securities listed on NASDAQ will be valued at the NASDAQ Official Closing Price, which may not necessarily represent the last sale price. If there is no sale on the valuation date, exchange-traded U.S. equity securities will be valued on the basis of the last bid price.
Generally, trading in foreign securities markets is substantially completed each day at various times prior to the close of the New York Stock Exchange (“NYSE”). The values of foreign securities are determined as of the close of such foreign markets or the close of the NYSE, if earlier. All investments quoted in foreign currencies are valued in U.S. dollars on the basis of the foreign
42 | THE GUGGENHEIM FUNDS SEMI-ANNUAL REPORT | |
NOTES TO FINANCIAL STATEMENTS (Unaudited)(continued) |
currency exchange rates prevailing at the close of U.S. business at 4:00 p.m. Investments in foreign securities may involve risks not present in domestic investments. The Valuation Committee will determine the current value of such foreign securities by taking into consideration certain factors which may include those discussed above, as well as the following factors, among others: the value of the securities traded on other foreign markets, ADR trading, closed-end fund trading, foreign currency exchange activity, and the trading prices of financial products that are tied to foreign securities. In addition, under the Valuation Procedures, the Valuation Committee and GI are authorized to use prices and other information supplied by a third party pricing vendor in valuing foreign securities.
Open-end investment companies are valued at their NAV as of the close of business, on the valuation date. Exchange-traded funds are valued at the last quoted sale price.
Debt securities with a maturity of greater than 60 days at acquisition are valued at prices that reflect broker-dealer supplied valuations or are obtained from independent pricing services, which may consider the trade activity, treasury spreads, yields or price of bonds of comparable quality, coupon, maturity, and type, as well as prices quoted by dealers who make markets in such securities. Short-term debt securities with a maturity of 60 days or less at acquisition are valued at amortized cost, provided such amount approximates market value.
Typically, loans are valued using information provided by an independent third party pricing service that uses broker quotes, among other inputs. If the pricing service cannot or does not provide a valuation for a particular loan, or such valuation is deemed unreliable, such investment is valued based on a quote from a broker-dealer or is fair valued by the Valuation Committee.
Forward foreign currency exchange contracts are valued daily based on the applicable exchange rate of the underlying currency.
Investments for which market quotations are not readily available are fair-valued as determined in good faith by GI, subject to review and approval by the Valuation Committee, pursuant to methods established or ratified by the Board. Valuations in accordance with these methods are intended to reflect each security’s (or asset’s or liability’s) “fair value”. Each such determination is based on a consideration of all relevant factors, which are likely to vary from one pricing context to another. Examples of such factors may include, but are not limited to market prices; sale prices; broker quotes; and models which derive prices based on inputs such as prices of securities with comparable maturities and characteristics, or based on inputs such as anticipated cash flows or collateral, spread over U.S. Treasury securities, and other information analysis. In connection with futures contracts and other derivative investments, such factors may include obtaining information as to how (a) these contracts and other derivative investments trade in the futures or other derivative markets, respectively, and (b) the securities underlying these contracts and other derivative investments trade in the cash market.
| | THE GUGGENHEIM FUNDS SEMI-ANNUAL REPORT | 43 |
NOTES TO FINANCIAL STATEMENTS (Unaudited)(continued) |
(b) Senior Floating Rate Interests and Loan Investments
Senior floating rate interests in which the Fund invests generally pay interest rates which are periodically adjusted by reference to a base short-term floating rate, plus a premium. These base lending rates are generally (i) the lending rate offered by one or more major European banks, such as the one-month or three-month London Inter-Bank Offered Rate (“LIBOR”), (ii) the prime rate offered by one or more major United States banks, or (iii) the bank’s certificate of deposit rate. Senior floating rate interests often require prepayments from excess cash flows or permit the borrower to repay at its election. The rate at which the borrower repays cannot be predicted with accuracy. As a result, the actual remaining maturity may be substantially less than the stated maturities disclosed in the Fund’s Schedule of Investments.
The Fund invests in loans and other similar debt obligations (“obligations”). A portion of the Fund’s investments in these obligations is sometimes referred to as “covenant lite” loans or obligations (“covenant lite obligations”), which are obligations that lack covenants or possess fewer or less restrictive covenants or constraints on borrowers than certain other types of obligations. The Fund may also obtain exposure to covenant lite obligations through investment in securitization vehicles and other structured products. In recent market conditions, many new or reissued obligations have not featured traditional covenants, which are intended to protect lenders and investors by (i) imposing certain restrictions or other limitations on a borrower’s operations or assets or (ii) providing certain rights to lenders. The Fund may have fewer rights with respect to covenant lite obligations, including fewer protections against the possibility of default and fewer remedies in the event of default. As a result, investments in (or exposure to) covenant lite obligations are subject to more risk than investments in (or exposure to) certain other types of obligations. The Fund is subject to other risks associated with investments in (or exposure to) obligations, including that obligations may not be considered “securities” and, as a result, the Fund may not be entitled to rely on the anti-fraud protections under the federal securities laws and instead may have to resort to state law and direct claims.
(c) Interest on When-Issued Securities
The Fund may purchase and sell interests in securities on a when-issued and delayed delivery basis, with payment and delivery scheduled for a future date. No income accrues to the Fund on such interests or securities in connection with such transactions prior to the date the Fund actually takes delivery of such interests or securities. These transactions are subject to market fluctuations and are subject to the risk that the value at delivery may be more or less than the trade date purchase price. Although the Fund will generally purchase these securities with the intention of acquiring such securities, it may sell such securities before the settlement date.
(d) Currency Translations
The accounting records of the Fund are maintained in U.S. dollars. All assets and liabilities initially expressed in foreign currencies are converted into U.S. dollars at prevailing exchange rates. Purchases and sales of investment securities, dividend and interest income, and certain expenses
44 | THE GUGGENHEIM FUNDS SEMI-ANNUAL REPORT | |
NOTES TO FINANCIAL STATEMENTS (Unaudited)(continued) |
are translated at the rates of exchange prevailing on the respective dates of such transactions. Changes in the relationship of these foreign currencies to the U.S. dollar can significantly affect the value of the investments and earnings of the Fund. Foreign investments may also subject the Fund to foreign government exchange restrictions, expropriation, taxation, or other political, social or economic developments, all of which could affect the market and/or credit risk of the investments.
The Fund does not isolate that portion of the results of operations resulting from changes in the foreign exchange rates on investments from the fluctuations arising from changes in the market prices of securities held. Such fluctuations are included with the net realized gain or loss and unrealized appreciation or depreciation on investments.
Reported net realized foreign exchange gains and losses arise from sales of foreign currencies and currency gains or losses realized between the trade and settlement dates on investment transactions. Net unrealized appreciation and depreciation arise from changes in the fair values of assets and liabilities other than investments in securities at the fiscal period end, resulting from changes in exchange rates.
(e) Forward Foreign Currency Exchange Contracts
The change in value of a forward foreign currency exchange contract is recorded as unrealized appreciation or depreciation until the contract is closed. When the contract is closed, the Fund records a realized gain or loss equal to the difference between the value at the time the contract was opened and the value at the time it was closed.
(f) Foreign Taxes
The Fund may be subject to foreign taxes (a portion of which may be reclaimable) on income, stock dividends, capital gains on investments or certain foreign currency transactions. All foreign taxes are recorded in accordance with the applicable foreign tax regulations and rates that exist in the foreign jurisdictions in which the Fund invests. These foreign taxes, if any, are paid by the Fund and reflected in its Statement of Operations as follows: foreign taxes withheld at source are presented as a reduction of income and foreign taxes on capital gains from sales of investments are included with the net realized gain (loss) on investments. Foreign taxes payable or deferred as of March 31, 2021, if any, are disclosed in the Fund’s Statement of Assets and Liabilities.
(g) Security Transactions
Security transactions are recorded on the trade date for financial reporting purposes. Realized gains and losses from securities transactions are recorded using the identified cost basis. Proceeds from lawsuits related to investment holdings are recorded as a reduction to cost if the securities are still held and as realized gains if no longer held in the Fund. Dividend income is recorded on the ex-dividend date, net of applicable taxes withheld by foreign countries, if any. Taxable non-cash dividends are recorded as dividend income. Interest income, including amortization of premiums and accretion of discounts, is accrued on a daily basis. Interest income
| | THE GUGGENHEIM FUNDS SEMI-ANNUAL REPORT | 45 |
NOTES TO FINANCIAL STATEMENTS (Unaudited)(continued) |
also includes paydown gains and losses on mortgage-backed and asset-backed securities and senior and subordinated loans. Amendment fees are earned as compensation for evaluating and accepting changes to the original loan agreement and are recognized when received. Dividend income from Real Estate Investment Trusts (“REITs”) is recorded based on the income included in the distributions received from the REIT investments using published REIT classifications, including some management estimates when actual amounts are not available. Distributions received in excess of this estimated amount are recorded as a reduction of the cost of investments or reclassified to realized gains. The actual amounts of income, return of capital, and realized gains are only determined by each REIT after its fiscal year-end, and may differ from the estimated amounts.
Income from residual collateralized loan obligations is recognized using the effective interest method. At the time of purchase, management estimates the future expected cash flows and determines the effective yield and estimated maturity date based on the estimated cash flows. Subsequent to the purchase, the estimated cash flows are updated periodically and a revised yield is calculated prospectively.
The Fund may receive other income from investments in senior loan interests including amendment fees, consent fees and commitment fees. For funded loans, these fees are recorded as income when received by the Fund and included in interest income on the Statement of Operations. For unfunded loans, commitment fees are included in realized gain on investments on the Statement of Operations at the end of the commitment period.
(h) Distributions
The Fund declares dividends from investment income daily. The Fund pays its shareholders from its net investment income monthly and distributes any net capital gains that it has realized, at least annually. Distributions to shareholders are recorded on the ex-dividend date. Dividends are reinvested in additional shares, unless shareholders request payment in cash. The character of distributions made during the year from net investment income or net realized gains may differ from their ultimate characterization for U.S. federal income tax purposes.
(i) Class Allocations
Interest and dividend income, most expenses, all realized gains and losses, and all unrealized appreciation and depreciation are allocated to the classes based upon the value of the outstanding shares in each Class. Certain costs, such as distribution and service fees are charged directly to specific classes. In addition, certain expenses have been allocated to the individual Funds in the Trust based on the respective net assets of each Fund included in the Trust.
46 | THE GUGGENHEIM FUNDS SEMI-ANNUAL REPORT | |
NOTES TO FINANCIAL STATEMENTS (Unaudited)(continued) |
(j) Earnings Credits
Under the fee arrangement with the custodian, the Fund may earn credits based on overnight custody cash balances. These credits are utilized to reduce related custodial expenses. The custodian fees disclosed in the Statement of Operations are before the reduction in expense from the related earnings credits, if any. Earnings credits for the period ended March 31, 2021, are disclosed in the Statement of Operations.
(k) Cash
The Fund may leave cash overnight in its cash account with the custodian. Periodically, the Fund may have cash due to the custodian bank as an overdraft balance. A fee is incurred on this overdraft, calculated by multiplying the overdraft by a rate based on the federal funds rate, which was 0.06% at March 31, 2021.
(l) Indemnifications
Under the Fund’s organizational documents, its Trustees and Officers are indemnified against certain liabilities arising out of the performance of their duties to the Trust. In addition, throughout the normal course of business, the Fund enters into contracts that contain a variety of representations and warranties which provide general indemnifications. The Fund’s maximum exposure under these arrangements is unknown, as this would involve future claims that may be made against the Fund and/or its affiliates that have not yet occurred. However, based on experience, the Fund expects the risk of loss to be remote.
Note 2 – Derivatives
As part of its investment strategy, the Fund utilizes a variety of derivative instruments. These investments involve, to varying degrees, elements of market risk and risks in excess of amounts recognized on the Statement of Assets and Liabilities. Valuation and accounting treatment of these instruments can be found under Significant Accounting Policies in Note 1 of these Notes to Financial Statements.
Derivatives are instruments whose values depend on, or are derived from, in whole or in part, the value of one or more other assets, such as securities, currencies, commodities or indices. Derivative instruments may be used to increase investment flexibility (including to maintain cash reserves while maintaining exposure to certain other assets), for risk management (hedging) purposes, to facilitate trading, to reduce transaction costs and to pursue higher investment returns. Derivative instruments may also be used to mitigate certain investment risks, such as foreign currency exchange rate risk, interest rate risk and credit risk. U.S. GAAP requires disclosures to enable investors to better understand how and why a Fund uses derivative instruments, how these derivative instruments are accounted for and their effects on the Fund’s financial position and results of operations.
| | THE GUGGENHEIM FUNDS SEMI-ANNUAL REPORT | 47 |
NOTES TO FINANCIAL STATEMENTS (Unaudited)(continued) |
The Fund utilized derivatives for the following purpose:
Hedge: an investment made in order to reduce the risk of adverse price movements in a security, by taking an offsetting position to protect against broad market moves.
Forward Foreign Currency Exchange Contracts
A forward foreign currency exchange contract is an agreement between two parties to exchange two designated currencies at a specific time in the future. Certain types of contracts may be cash settled, in an amount equal to the change in exchange rates during the term of the contract. The contracts can be used to hedge or manage exposure to foreign currency risks with portfolio investments or to gain exposure to foreign currencies.
The market value of a forward foreign currency exchange contract changes with fluctuations in foreign currency exchange rates. Furthermore, the Fund may be exposed to risk if the counterparties cannot meet the contract terms or if the currency value changes unfavorably as compared to the U.S. dollar.
The following table represents the Fund’s use and volume of forward foreign currency exchange contracts on a monthly basis:
| | | Average Value | |
Use | | Purchased | | | Sold | |
Hedge | | $ | 1,419,829 | | | $ | 51,386,349 | |
Derivative Investment Holdings Categorized by Risk Exposure
The following is a summary of the location of derivative investments on the Fund’s Statement of Assets and Liabilities as of March 31, 2021:
Derivative Investment Type | Asset Derivatives | Liability Derivatives |
Currency contracts | Unrealized appreciation on forward foreign currency exchange contracts | Unrealized depreciation on forward foreign currency exchange contracts |
The following table sets forth the fair value of the Fund’s derivative investments categorized by primary risk exposure at March 31, 2021:
| | Forward Foreign Currency
Exchange Risk | |
Asset Derivative Investments Value | | $ | 883,252 | |
Liability Derivative Investments Value | | $ | 85 | |
48 | THE GUGGENHEIM FUNDS SEMI-ANNUAL REPORT | |
NOTES TO FINANCIAL STATEMENTS (Unaudited)(continued) |
The following is a summary of the location of derivative investments on the Fund’s Statement of Operations for the period ended March 31, 2021:
Derivative Investment Type | Location of Gain (Loss) on Derivatives |
Currency contracts | Net realized gain (loss) on forward foreign currency exchange contracts |
| Net change in unrealized appreciation (depreciation) on forward foreign currency exchange contracts |
The following is a summary of the Fund’s realized gain (loss) and change in unrealized appreciation (depreciation) on derivative investments recognized on the Statement of Operations categorized by primary risk exposure for the period ended March 31, 2021:
Realized Gain (Loss) on Derivative Investments Recognized on the Statement of Operations |
| | Forward Foreign Currency
Exchange Risk | |
| | | $ | (1,241,233 | ) |
Change in Unrealized Appreciation (Depreciation) on Derivative Investments Recognized on the Statement of Operations |
| | Forward Foreign Currency
Exchange Risk | |
| | | $ | 503,011 | |
In conjunction with the use of derivative instruments, the Fund is required to maintain collateral in various forms. Depending on the financial instrument utilized and the broker involved, the Fund uses margin deposits at the broker, cash and/or securities segregated at the custodian bank, discount notes or repurchase agreements allocated to the Fund as collateral.
The Trust has established counterparty credit guidelines and enters into transactions only with financial institutions of investment grade or better. The Trust monitors the counterparty credit risk.
Note 3 – Offsetting
In the normal course of business, the Fund enters into transactions subject to enforceable master netting arrangements or other similar arrangements. Generally, the right to offset in those agreements allows the Fund to counteract the exposure to a specific counterparty with collateral received from or delivered to that counterparty based on the terms of the arrangements. These arrangements provide for the right to liquidate upon the occurrence of an event of default, credit event upon merger or additional termination event.
| | THE GUGGENHEIM FUNDS SEMI-ANNUAL REPORT | 49 |
NOTES TO FINANCIAL STATEMENTS (Unaudited)(continued) |
In order to better define its contractual rights and to secure rights that will help the Fund mitigate its counterparty risk, the Fund may enter into an International Swaps and Derivatives Association, Inc. Master Agreement (“ISDA Master Agreement”) or similar agreement with its derivative contract counterparties. An ISDA Master Agreement is a bilateral agreement between a fund and a counterparty that governs over-the-counter (“OTC”) derivatives, including foreign exchange contracts, and typically contains, among other things, collateral posting terms and netting provisions in the event of a default and/or termination event. The provisions of the ISDA Master Agreement typically permit a single net payment in the event of a default (close-out netting) or similar event, including the bankruptcy or insolvency of the counterparty.
For derivatives traded under an ISDA Master Agreement, the collateral requirements are typically calculated by netting the mark-to-market amount for each transaction under such agreement and comparing that amount to the value of any collateral currently pledged by the Fund and the counterparty. For financial reporting purposes, cash collateral that has been pledged to cover obligations of the Fund and cash collateral received from the counterparty, if any, are reported separately on the Statement of Assets and Liabilities as segregated cash with broker/receivable for variation margin, or payable for swap settlement/variation margin. Cash and/or securities pledged or received as collateral by the Fund in connection with an OTC derivative subject to an ISDA Master Agreement generally may not be invested, sold or rehypothecated by the counterparty or the Fund, as applicable, absent an event of default under such agreement, in which case such collateral generally may be applied towards obligations due to and payable by such counterparty or the Fund, as applicable. Generally, the amount of collateral due from or to a counterparty must exceed a minimum transfer amount threshold (e.g., $300,000) before a transfer is required to be made. To the extent amounts due to the Fund from its counterparties are not fully collateralized, contractually or otherwise, the Fund bears the risk of loss from counterparty nonperformance. The Fund attempts to mitigate counterparty risk by only entering into agreements with counterparties that it believes to be of good standing and by monitoring the financial stability of those counterparties.
For financial reporting purposes, the Fund does not offset derivative assets and derivative liabilities that are subject to netting arrangements in the Statement of Assets and Liabilities.
50 | THE GUGGENHEIM FUNDS SEMI-ANNUAL REPORT | |
NOTES TO FINANCIAL STATEMENTS (Unaudited)(continued) |
The following tables present derivative financial instruments and secured financing transactions that are subject to enforceable netting arrangements:
| | | | | | | | | | | | | | | Gross Amounts Not
Offset in the Statement
of Assets and Liabilities | | | | | |
Instrument | | Gross
Amounts of
Recognized
Assets | | | Gross
Amounts
Offset in the
Statement of
Assets and
Liabilities | | | Net Amount
of Assets
Presented on
the Statement
of Assets and
Liabilities | | | Financial
Instruments | | | Cash
Collateral
Received | | | Net
Amount | |
Forward foreign currency exchange contracts | | $ | 883,252 | | | $ | — | | | $ | 883,252 | | | $ | (85 | ) | | $ | (600,000 | ) | | $ | 283,167 | |
| | | | | | | | | | | | | | | Gross Amounts Not
Offset in the Statement
of Assets and Liabilities | | | | | |
Instrument | | Gross
Amounts of
Recognized
Liabilities | | | Gross
Amounts
Offset in the
Statement of
Assets and
Liabilities | | | Net Amount
of Liabilities
Presented on
the Statement
of Assets and
Liabilities | | | Financial
Instruments | | | Cash
Collateral
Pledged | | | Net
Amount | |
Forward foreign currency exchange contracts | | $ | 85 | | | $ | — | | | $ | 85 | | | $ | (85 | ) | | $ | — | | | $ | — | |
The Fund has the right to offset deposits against any related derivative liabilities outstanding with each counterparty with the exception of exchange-traded or centrally-cleared derivatives. The following table presents deposits held by others in connection with derivative investments as of March 31, 2021.
Counterparty | Asset Type | | Cash
Pledged | | | Cash
Received | |
Barclays Bank plc | Forward foreign currency exchange contracts | | $ | — | | | $ | 600,000 | |
Note 4 – Fair Value Measurement
In accordance with U.S. GAAP, fair value is defined as the price that the Fund would receive to sell an investment or pay to transfer a liability in an orderly transaction with an independent buyer in the principal market, or in the absence of a principal market, the most advantageous market for
| | THE GUGGENHEIM FUNDS SEMI-ANNUAL REPORT | 51 |
NOTES TO FINANCIAL STATEMENTS (Unaudited)(continued) |
the investment or liability. U.S. GAAP establishes a three-tier fair value hierarchy based on the types of inputs used to value assets and liabilities and requires corresponding disclosure. The hierarchy and the corresponding inputs are summarized below:
Level 1 | — quoted prices in active markets for identical assets or liabilities. |
Level 2 — | significant other observable inputs (for example quoted prices for securities that are similar based on characteristics such as interest rates, prepayment speeds, credit risk, etc.). |
Level 3 — | significant unobservable inputs based on the best information available under the circumstances, to the extent observable inputs are not available, which may include assumptions. |
The types of inputs available depend on a variety of factors, such as the type of security and the characteristics of the markets in which it trades, if any. Fair valuation determinations that rely on fewer or no observable inputs require greater judgment. Accordingly, fair value determinations for Level 3 securities require the greatest amount of judgment.
Independent pricing services are used to value a majority of the Fund’s investments. When values are not available from a pricing service, they will be determined using a variety of sources and techniques, including: market prices; broker quotes; and models which derive prices based on inputs such as prices of securities with comparable maturities and characteristics or based on inputs such as anticipated cash flows or collateral, spread over U.S. Treasury securities, and other information and analysis. A significant portion of the Fund’s assets and liabilities are categorized as Level 2, as indicated in this report.
Quotes from broker-dealers, adjusted for fluctuations in criteria such as credit spreads and interest rates, may also be used to value the Fund’s assets and liabilities, i.e. prices provided by a broker-dealer or other market participant who has not committed to trade at that price. Although quotes are typically received from established market participants, the Fund may not have the transparency to view the underlying inputs which support the market quotations. Significant changes in a quote would generally result in significant changes in the fair value of the security.
Certain fixed income securities are valued by obtaining a monthly quote from a broker-dealer, adjusted for fluctuations in criteria such as credit spreads and interest rates.
Certain loans and other securities are valued using a single daily broker quote or a price from a third party vendor based on a single daily or monthly broker quote.
The inputs or methodologies used for valuing securities are not necessarily an indication of the risk associated with investing in those securities. The suitability of the techniques and sources employed to determine fair valuation are regularly monitored and subject to change.
52 | THE GUGGENHEIM FUNDS SEMI-ANNUAL REPORT | |
NOTES TO FINANCIAL STATEMENTS (Unaudited)(continued) |
Note 5 – Investment Advisory Agreement and Other Agreements
Under the terms of an investment advisory contract, the Fund pays GI investment advisory fees calculated at an annualized rate of 0.65% of the average daily net assets of the Fund up to $5 billion; and 0.60% of the average daily net assets in excess of $5 billion.
GI pays operating expenses on behalf of the Trust, such as audit and accounting related services, legal services, custody, printing and mailing, among others, on a pass-through basis. Such expenses are allocated to various Funds within the complex based on relative net assets.
The Board has adopted Distribution Plans related to the offering of A-Class, C-Class and P-Class shares pursuant to Rule 12b-1 under the 1940 Act. The plans provide for payments at an annual rate of 0.25% of the average daily net assets of the Fund’s A-Class and P-Class shares, and 1.00% of the average daily net assets of the Fund’s C-Class shares.
The investment advisory contract for the Fund provides that the total expenses be limited to a percentage of average net assets for each class of shares, exclusive of brokerage costs, dividends or interest on securities sold short, expenses of other investment companies in which the Fund invests, interest, taxes, litigation, indemnification and extraordinary expenses. The limits are listed below:
| | Limit | | | Effective
Date | | | Contract
End Date | |
A-Class | | | 1.02 | % | | | 11/30/12 | | | | 02/01/22 | |
C-Class | | | 1.77 | % | | | 11/30/12 | | | | 02/01/22 | |
P-Class | | | 1.02 | % | | | 05/01/15 | | | | 02/01/22 | |
Institutional Class | | | 0.78 | % | | | 11/30/12 | | | | 02/01/22 | |
R6-Class | | | 0.78 | % | | | 03/13/19 | | | | 02/01/22 | |
GI is entitled to reimbursement by the Fund for fees waived or expenses reimbursed during any of the previous 36 months, beginning on the date of the expense limitation agreement, if on any day the estimated operating expenses are less than the indicated percentages. For purposes of this arrangement, GI is entitled to recoupment of previously waived fees or reimbursed expenses for 36 months from the date of the waiver or reimbursement by GI. At March 31, 2021, the amount of fees waived or expenses reimbursed that are subject to recoupment and will expire during the years ended September 30, are presented in the following table:
| | 2021 | | | 2022 | | | 2023 | | | 2024 | | | Fund
Total | |
A-Class | | $ | 572,780 | | | $ | 478,648 | | | $ | 272,258 | | | $ | 38,086 | | | $ | 1,361,772 | |
C-Class | | | 176,311 | | | | 165,085 | | | | 99,862 | | | | 13,184 | | | | 454,442 | |
P-Class | | | 442,125 | | | | 423,256 | | | | 205,400 | | | | 3,451 | | | | 1,074,232 | |
Institutional Class | | | 1,283,901 | | | | 1,382,501 | | | | 804,754 | | | | 30,252 | | | | 3,501,408 | |
R6-Class | | | — | | | | 2,089 | | | | 1,025 | | | | 251 | | | | 3,365 | |
For the period ended March 31, 2021, GI recouped $1,501 from the Fund.
| | THE GUGGENHEIM FUNDS SEMI-ANNUAL REPORT | 53 |
NOTES TO FINANCIAL STATEMENTS (Unaudited)(continued) |
For the period ended March 31, 2021, GFD retained sales charges of $192,037 relating to sales of A-Class shares of the Trust.
Certain trustees and officers of the Trust are also officers of GI and/or GFD. The Trust does not compensate its officers or trustees who are officers, directors and/or employees of GI or GFD.
MUFG Investor Services (US), LLC (“MUIS”) acts as the Fund’s administrator, transfer agent and accounting agent. As administrator, transfer agent and accounting agent, MUIS maintains the books and records of the Fund’s securities and cash. The Bank of New York Mellon Corp. (“BNY”) acts as the Fund’s custodian. As custodian, BNY is responsible for the custody of the Fund’s assets. For providing the aforementioned administrative and accounting services, MUIS is entitled to receive a monthly fee equal to a percentage of the Fund’s average daily net assets and out of pocket expenses. For providing the aforementioned transfer agent and custodian services, MUIS and BNY are entitled to receive a monthly fee based on the number of transactions during the month and the number of accounts under management, subject to certain minimum monthly fees, and out of pocket expenses.
Note 6 – Federal Income Tax Information
The Fund intends to comply with the provisions of Subchapter M of the Internal Revenue Code applicable to regulated investment companies and will distribute substantially all taxable net investment income and capital gains sufficient to relieve the Fund from all, or substantially all, federal income, excise and state income taxes. Therefore, no provision for federal or state income tax or federal excise tax is required.
Tax positions taken or expected to be taken in the course of preparing the Fund’s tax returns are evaluated to determine whether the tax positions are “more-likely-than-not” of being sustained by the applicable tax authority. Tax positions not deemed to meet the more-likely-than-not threshold would be recorded as a tax benefit or expense in the current year. Management has analyzed the Fund’s tax positions taken, or to be taken, on U.S. federal income tax returns for all open tax years, and has concluded that no provision for income tax is required in the Fund’s financial statements. The Fund’s U.S. federal income tax returns are subject to examination by the Internal Revenue Service for a period of three years after they are filed.
At March 31, 2021, the cost of investments for U.S. federal income tax purposes, the aggregate gross unrealized appreciation for all investments for which there was an excess of value over tax cost, and the aggregate gross unrealized depreciation for all investments for which there was an excess of tax cost over value, were as follows:
| | Tax Cost | | | Tax Unrealized
Appreciation | | | Tax Unrealized
Depreciation | | | Net Tax Unrealized
Appreciation
(Depreciation) | |
| | | $ | 840,662,442 | | | $ | 5,933,517 | | | $ | (19,248,180 | ) | | $ | (13,314,663 | ) |
54 | THE GUGGENHEIM FUNDS SEMI-ANNUAL REPORT | |
NOTES TO FINANCIAL STATEMENTS (Unaudited)(continued) |
Note 7 – Securities Transactions
For the period ended March 31, 2021, the cost of purchases and proceeds from sales of investment securities, excluding government securities, short-term investments and derivatives, were as follows:
| | Purchases | | | Sales | |
| | | $ | 262,305,690 | | | $ | 209,814,690 | |
The Fund is permitted to purchase or sell securities from or to certain affiliated funds under specified conditions outlined in procedures adopted by the Board. The procedures have been designed to ensure that any purchase or sale of securities by the Fund from or to another fund or portfolio that is or could be considered an affiliate by virtue of having a common investment adviser (or affiliated investment advisers), common trustees and/or common officers complies with Rule 17a-7 of the 1940 Act. Further, as defined under these procedures, each transaction is effected at the current market price to save costs, where permissible. For the period ended March 31, 2021, the Fund engaged in purchases and sales of securities, pursuant to Rule 17a-7 of the 1940 Act, as follows:
| | Purchases | | | Sales | | | Realized
Loss | |
| | | $ | — | | | $ | 4,973,759 | | | $ | (53,430 | ) |
Note 8 – Unfunded Loan Commitments
Pursuant to the terms of certain loan agreements, the Fund held unfunded loan commitments as of March 31, 2021. The Fund is obligated to fund these loan commitments at the borrower’s discretion.
The unfunded loan commitments as of March 31, 2021, were as follows:
Borrower | | Maturity
Date | | | Face
Amount | | | Value | |
Aspect Software, Inc. | | | 07/15/23 | | | $ | 939,012 | | | $ | 7,277 | |
DG Investment Intermediate Holdings 2, Inc. | | | 03/17/28 | | | | 680,000 | | | | 3,822 | |
Hillman Group, Inc. | | | 02/24/28 | | | | 869,198 | | | | 2,143 | |
National Mentor Holdings, Inc. | | | 02/18/28 | | | | 350,000 | | | | 1,722 | |
Peraton Corp. | | | 02/22/28 | | | | 3,826,014 | | | | 18,861 | |
Southern Veterinary Partners LLC | | | 10/05/27 | | | | 121,212 | | | | 1,128 | |
TricorBraun Holdings, Inc. | | | 03/03/28 | | | | 594,644 | | | | 6,196 | |
| | | | | | | $ | 7,380,080 | | | $ | 41,149 | |
| | THE GUGGENHEIM FUNDS SEMI-ANNUAL REPORT | 55 |
NOTES TO FINANCIAL STATEMENTS (Unaudited)(continued) |
Note 9 – Restricted Securities
The securities below are considered illiquid and restricted under guidelines established by the Board:
Restricted Securities | | Acquisition
Date | | | Cost | | | Value | |
Airplanes Pass Through Trust | | | | | | | | | | | | |
2001-1A, due 03/15/191 | | | 12/27/11 | | | $ | 723,184 | | | $ | 90 | |
Mirabela Nickel Ltd. | | | | | | | | | | | | |
due 06/24/191 | | | 12/31/13 | | | | 1,160,811 | | | | 51,193 | |
| | | | | | | $ | 1,883,995 | | | $ | 51,283 | |
1 | Security is in default of interest and/or principal obligations. |
Note 10 – Line of Credit
The Trust, along with other affiliated trusts, secured a 364-day committed, $1,230,000,000 line of credit from Citibank, N.A., which was in place through October 2, 2020, at which time the line of credit was renewed. A Fund may draw (borrow) from the line of credit, with limits subject to applicable regulatory requirements around leverage, as a temporary measure for emergency purposes, to facilitate redemption requests, or for other short-term liquidity purposes consistent with the Fund’s investment objective and program. For example, it may be advantageous for the Fund to borrow money rather than sell existing portfolio positions to meet redemption requests. Fees related to borrowings, if any, vary under this arrangement between the greater of Citibank’s “base rate”, LIBOR plus 1%, or the federal funds rate plus 1/2 of 1%.
The commitment fee that may be paid by the Fund is at an annualized rate of 0.15% of the average daily amount of its allocated unused commitment amount. The commitment fee amount is allocated to the individual Funds based on the respective net assets of each participating Fund and is referenced in the Statement of Operations under “Line of credit fees”. The Fund did not have any borrowings under this agreement as of and for the period ended March 31, 2021.
Note 11 – COVID-19
The global ongoing crisis caused by the outbreak of COVID-19 and the current recovery underway is causing disruption to consumer demand and economic output and supply chains. There are still travel restrictions and quarantines, and adverse impacts on local and global economies. Investors should be aware that in light of the current uncertainty, volatility and distress in economies, financial markets, and labor and public health conditions around the world, the Fund’s investments and a shareholder’s investment in the Fund are subject to sudden and substantial losses, increased volatility and other adverse events. Firms through which investors invest with the Fund, the Fund, its service providers, the markets in which it invests and market
56 | THE GUGGENHEIM FUNDS SEMI-ANNUAL REPORT | |
NOTES TO FINANCIAL STATEMENTS (Unaudited)(concluded) |
intermediaries are also impacted by quarantines and similar measures intended to respond to and contain the ongoing pandemic, which can obstruct their functioning and subject them to heightened operational and other risks.
Note 12 – Subsequent Events
The Fund evaluated subsequent events through the date the financial statements were available for issue and determined there were no material events that would require adjustment to or disclosure in the Fund’s financial statements.
| | THE GUGGENHEIM FUNDS SEMI-ANNUAL REPORT | 57 |
OTHER INFORMATION (Unaudited) |
Delivery of Shareholder Reports
Paper copies of the Fund’s annual and semi-annual shareholder reports are not sent by mail, unless you specifically request paper copies of the reports from a fund or from your financial intermediary. Instead, the reports are made available on a website, and you are notified by mail each time a report is posted and provided with a website link to access the report.
You may elect to receive all future shareholder reports in paper free of charge. If you hold shares of a fund directly, you can inform the Fund that you wish to receive paper copies of reports by calling 800.820.0888. If you hold shares of a fund through a financial intermediary, please contact the financial intermediary to make this election. Your election to receive reports in paper may apply to all Guggenheim Funds in which you are invested and may apply to all Guggenheim funds held with your financial intermediary.
Proxy Voting Information
A description of the policies and procedures that the Trust uses to determine how to vote proxies relating to securities held in the Fund’s portfolio is available, without charge and upon request, by calling 800.820.0888. This information is also available from the EDGAR database on the SEC’s website at https://www.sec.gov.
Information regarding how the Fund’s voted proxies relating to portfolio securities during the most recent 12-month period ended June 30 is available without charge, upon request, by calling 800.820.0888. This information is also available from the EDGAR database on the SEC’s website at https://www.sec.gov.
Sector Classification
Information in the Schedule of Investments is categorized by sectors using sector-level Classifications defined by the Bloomberg Industry Classification System, a widely recognized industry classification system provider. The Fund’s registration statement has investment policies relating to concentration in specific sectors/industries. For purposes of these investment policies, the Fund usually classifies sectors/industries based on industry-level Classifications used by widely recognized industry classification system providers such as Bloomberg Industry Classification System, Global Industry Classification Standards and Barclays Global Classification Scheme.
Quarterly Portfolio Schedules Information
The Trust files its complete schedule of portfolio holdings with the SEC for the first and third quarters of each fiscal year as an exhibit to its reports on Form N-PORT, and for reporting periods ended prior to March 31, 2019, filed such information on Form N-Q. The Fund’s Forms N-PORT and N-Q are available on the SEC’s website at https://www.sec.gov. Copies of the portfolio holdings are also available to shareholders, without charge and upon request, by calling 800.820.0888.
58 | THE GUGGENHEIM FUNDS SEMI-ANNUAL REPORT | |
INFORMATION ON BOARD OF TRUSTEES AND OFFICERS (Unaudited) |
A Board of Trustees oversees the Trust, as well as other trusts of GI, in which its members have no stated term of service, and continue to serve after election until resignation. The Statement of Additional Information includes further information about Fund Trustees and Officers, and can be obtained without charge by visiting guggenheiminvestments.com or by calling 800.820.0888.
Name, Address*
and Year of Birth | Position(s)
Held with
Trust | Term of Office
and Length of
Time Served** | Principal Occupation(s)
During Past Five Years | Number of
Portfolios
in Fund
Complex
Overseen | Other
Directorships Held
by Trustees*** |
INDEPENDENT TRUSTEES | | | |
Randall C. Barnes (1951) | Trustee and Chair of the Valuation Oversight Committee | Since 2014 (Trustee) Since 2020 (Chair of the Valuation Oversight Committee) | Current: Private Investor (2001-present). Former: Senior Vice President and Treasurer, PepsiCo, Inc. (1993-1997); President, Pizza Hut International (1991-1993); Senior Vice President, Strategic Planning and New Business Development, PepsiCo, Inc. (1987-1990). | 157 | Current: Purpose Investments Funds (2013-present). Former: Managed Duration Investment Grade Municipal Fund (2006-2016). |
Angela Brock-Kyle (1959) | Trustee | Since 2019 | Current: Founder and Chief Executive Officer, B.O.A.R.D.S. (2013-present). Former: Senior Leader, TIAA (1987-2012). | 156 | Current: Bowhead Insurance GP, LLC (2020-present); Hunt Companies, Inc. (2019-present). Former: Infinity Property & Casualty Corp. (2014-2018). |
Thomas F. Lydon, Jr. (1960) | Trustee and Chair of the Contracts Review Committee | Since 2019 (Trustee) Since 2020 (Chair of the Contracts Review Committee) | Current: President, Global Trends Investments (1996-present); Co-Chief Executive Officer, ETF Flows, LLC (2019-present); Chief Executive Officer, Lydon Media (2016-present). | 156 | Current: US Global Investors (GROW) (1995-present). Former: Harvest Volatility Edge Trust (3) (2017-2019). |
| | THE GUGGENHEIM FUNDS SEMI-ANNUAL REPORT | 59 |
INFORMATION ON BOARD OF TRUSTEES AND OFFICERS (Unaudited)(continued) |
Name, Address*
and Year of Birth | Position(s)
Held with
Trust | Term of Office
and Length of
Time Served** | Principal Occupation(s)
During Past Five Years | Number of
Portfolios
in Fund
Complex
Overseen | Other
Directorships Held
by Trustees*** |
INDEPENDENT TRUSTEES - continued | | |
Ronald A. Nyberg (1953) | Trustee and Chair of the Nominating and Governance Committee | Since 2014 | Current: Of Counsel, Momkus LLP (2016-present). Former: Partner, Nyberg & Cassioppi, LLC (2000-2016); Executive Vice President, General Counsel, and Corporate Secretary, Van Kampen Investments (1982-1999). | 157 | Current: PPM Funds (2) (2018-present); Edward-Elmhurst Healthcare System (2012-present). Former: Western Asset Inflation-Linked Opportunities & Income Fund (2004-2020); Western Asset Inflation-Linked Income Fund (2003-2020); Managed Duration Investment Grade Municipal Fund (2003-2016). |
Sandra G. Sponem (1958) | Trustee and Chair of the Audit Committee | Since 2019 (Trustee) Since 2020 (Chair of the Audit Committee) | Current: Retired. Former: Senior Vice President and Chief Financial Officer, M.A. Mortenson-Companies, Inc. (2007-2017). | 156 | Current: SPDR Series Trust (81) (2018-present); SPDR Index Shares Funds (30) (2018-present); SSGA Active Trust (14) (2018-present). Former: SSGA Master Trust (1) (2018-2020). |
60 | THE GUGGENHEIM FUNDS SEMI-ANNUAL REPORT | |
INFORMATION ON BOARD OF TRUSTEES AND OFFICERS (Unaudited)(continued) |
Name, Address*
and Year of Birth | Position(s)
Held with
Trust | Term of Office
and Length of
Time Served** | Principal Occupation(s)
During Past Five Years | Number of
Portfolios
in Fund
Complex
Overseen | Other
Directorships Held
by Trustees*** |
INDEPENDENT TRUSTEES - concluded | | |
Ronald E.
Toupin, Jr. (1958) | Trustee, Chair of the Board and Chair of the Executive Committee | Since 2014 | Current: Portfolio Consultant (2010-present); Member, Governing Council, Independent Directors Council (2013-present); Governor, Board of Governors, Investment Company Institute (2018-present). Former: Member, Executive Committee, Independent Directors Council (2016-2018); Vice President, Manager and Portfolio Manager, Nuveen Asset Management (1998-1999); Vice President, Nuveen Investment Advisory Corp. (1992-1999); Vice President and Manager, Nuveen Unit Investment Trusts (1991-1999); and Assistant Vice President and Portfolio Manager, Nuveen Unit Investment Trusts (1988-1999), each of John Nuveen & Co., Inc. (1982-1999). | 156 | Former: Western Asset Inflation-Linked Opportunities & Income Fund (2004-2020); Western Asset Inflation-Linked Income Fund (2003-2020); Managed Duration Investment Grade Municipal Fund (2003-2016). |
| | THE GUGGENHEIM FUNDS SEMI-ANNUAL REPORT | 61 |
INFORMATION ON BOARD OF TRUSTEES AND OFFICERS (Unaudited)(continued) |
Name, Address*
and Year of Birth | Position(s)
Held with
Trust | Term of Office
and Length of
Time Served** | Principal Occupation(s)
During Past Five Years | Number of
Portfolios
in Fund
Complex
Overseen | Other
Directorships Held
by Trustees*** |
INTERESTED TRUSTEE | |
Amy J. Lee**** (1961) | Trustee, Vice President and Chief Legal Officer | Since 2018 (Trustee) Since 2014 (Chief Legal Officer) Since 2007 (Vice President) | Current: Interested Trustee, certain other funds in the Fund Complex (2018-present); Chief Legal Officer, certain other funds in the Fund Complex (2014-present); Vice President, certain other funds in the Fund Complex (2007-present); Senior Managing Director, Guggenheim Investments (2012-present). Former: President and Chief Executive Officer, certain other funds in the Fund Complex (2017-2019); Vice President, Associate General Counsel and Assistant Secretary, Security Benefit Life Insurance Company and Security Benefit Corporation (2004-2012). | 156 | None. |
* | The business address of each Trustee is c/o Guggenheim Investments, 227 West Monroe Street, Chicago, Illinois 60606. |
** | Each Trustee serves an indefinite term, until his or her successor is elected and qualified. Time served includes time served in the respective position for the Predecessor Corporation. |
*** | Each Trustee also serves on the Boards of Trustees of Guggenheim Funds Trust, Guggenheim Variable Funds Trust, Guggenheim Strategy Funds Trust, Fiduciary/Claymore Energy Infrastructure Fund, Guggenheim Taxable Municipal Bond & Investment Grade Debt Trust, Guggenheim Strategic Opportunities Fund, Guggenheim Enhanced Equity Income Fund, Guggenheim Energy & Income Fund, Guggenheim Credit Allocation Fund, Rydex Series Funds, Rydex Dynamic Funds, Rydex Variable Trust and Transparent Value Trust. Messrs. Barnes and Nyberg also serve on the Board of Trustees of Advent Convertible & Income Fund. |
**** | This Trustee is deemed to be an “interested person” of the Fund under the 1940 Act by reason of her position with the Fund’s Investment Manager and/or the parent of the Investment Manager. |
62 | THE GUGGENHEIM FUNDS SEMI-ANNUAL REPORT | |
INFORMATION ON BOARD OF TRUSTEES AND OFFICERS (Unaudited)(continued) |
Name, Address*
and Year of Birth | Position(s)
Held with
Trust | Term of Office
and Length of
Time Served** | Principal Occupation(s)
During Past Five Years |
OFFICERS | | | |
Brian E. Binder (1972) | President and Chief Executive Officer | Since 2018 | Current: President and Chief Executive Officer, certain other funds in the Fund Complex (2018-present); President, Chief Executive Officer and Chairman of the Board of Managers, Guggenheim Funds Investment Advisors, LLC (2018-present); President and Chief Executive Officer, Security Investors, LLC (2018-present); Board Member of Guggenheim Partners Fund Management (Europe) Limited (2018-present); Senior Managing Director and Chief Administrative Officer, Guggenheim Investments (2018-present). Former: Managing Director and President, Deutsche Funds, and Head of US Product, Trading and Fund Administration, Deutsche Asset Management (2013-2018); Managing Director, Head of Business Management and Consulting, Invesco Ltd. (2010-2012). |
James M. Howley (1972) | Assistant Treasurer | Since 2014 | Current: Managing Director, Guggenheim Investments (2004-present); Assistant Treasurer, certain other funds in the Fund Complex (2006-present). Former: Manager, Mutual Fund Administration of Van Kampen Investments, Inc. (1996-2004). |
Mark E. Mathiasen (1978) | Secretary | Since 2014 | Current: Secretary, certain other funds in the Fund Complex (2007-present); Managing Director, Guggenheim Investments (2007-present). |
Glenn McWhinnie (1969) | Assistant Treasurer | Since 2016 | Current: Vice President, Guggenheim Investments (2009-present); Assistant Treasurer, certain other funds in the Fund Complex (2016-present). |
Michael P. Megaris (1984) | Assistant Secretary | Since 2014 | Current: Assistant Secretary, certain other funds in the Fund Complex (2014-present); Director, Guggenheim Investments (2012-present). |
| | THE GUGGENHEIM FUNDS SEMI-ANNUAL REPORT | 63 |
INFORMATION ON BOARD OF TRUSTEES AND OFFICERS (Unaudited)(continued) |
Name, Address*
and Year of Birth | Position(s)
Held with
Trust | Term of Office
and Length of
Time Served** | Principal Occupation(s)
During Past Five Years |
OFFICERS - continued | |
Elisabeth Miller (1968) | Chief Compliance Officer | Since 2012 | Current: Chief Compliance Officer, certain other funds in the Fund Complex (2012-present); Senior Managing Director, Guggenheim Investments (2012-present). Vice President, Guggenheim Funds Distributors, LLC (2014-present). Former: Chief Compliance Officer, Security Investors, LLC and Guggenheim Funds Investment Advisors, LLC (2012-2018); Chief Compliance Officer, Guggenheim Distributors, LLC (2009-2014); Senior Manager, Security Investors, LLC (2004-2014); Senior Manager, Guggenheim Distributors, LLC (2004-2014). |
Margaux Misantone (1978) | AML Officer | Since 2017 | Current: Chief Compliance Officer, Security Investors, LLC and Guggenheim Funds Investment Advisors, LLC (2018-present); AML Officer, Security Investors, LLC and certain other funds in the Fund Complex (2017-present); Managing Director, Guggenheim Investments (2015-present). Former: Assistant Chief Compliance Officer, Security Investors, LLC and Guggenheim Funds Investments Advisors, LLC (2015-2018). |
Kimberly J. Scott (1974) | Assistant Treasurer | Since 2014 | Current: Director, Guggenheim Investments (2012-present); Assistant Treasurer, certain other funds in the Fund Complex (2012-present). Former: Financial Reporting Manager, Invesco, Ltd. (2010-2011); Vice President/Assistant Treasurer, Mutual Fund Administration for Van Kampen Investments, Inc./Morgan Stanley Investment Management (2009-2010); Manager of Mutual Fund Administration, Van Kampen Investments, Inc./Morgan Stanley Investment Management (2005-2009). |
Bryan Stone (1979) | Vice President | Since 2014 | Current: Vice President, certain other funds in the Fund Complex (2014-present); Managing Director, Guggenheim Investments (2013-present). Former: Senior Vice President, Neuberger Berman Group LLC (2009-2013); Vice President, Morgan Stanley (2002-2009). |
64 | THE GUGGENHEIM FUNDS SEMI-ANNUAL REPORT | |
INFORMATION ON BOARD OF TRUSTEES AND OFFICERS (Unaudited)(concluded) |
Name, Address*
and Year of Birth | Position(s)
Held with
Trust | Term of Office
and Length of
Time Served** | Principal Occupation(s)
During Past Five Years |
OFFICERS - concluded | |
John L. Sullivan (1955) | Chief Financial Officer, Chief Accounting Officer and Treasurer | Since 2014 | Current: Chief Financial Officer, Chief Accounting Officer and Treasurer, certain other funds in the Fund Complex (2010-present); Senior Managing Director, Guggenheim Investments (2010-present). Former: Managing Director and Chief Compliance Officer, each of the funds in the Van Kampen Investments fund complex (2004-2010); Managing Director and Head of Fund Accounting and Administration, Morgan Stanley Investment Management (2002-2004); Chief Financial Officer and Treasurer, Van Kampen Funds (1996-2004). |
Jon Szafran (1989) | Assistant Treasurer | Since 2017 | Current: Vice President, Guggenheim Investments (2017-present); Assistant Treasurer, certain other funds in the Fund Complex (2017-present). Former: Assistant Treasurer of Henderson Global Funds and Manager of US Fund Administration, Henderson Global Investors (North America) Inc. (“HGINA”), (2017); Senior Analyst of US Fund Administration, HGINA (2014–2017); Senior Associate of Fund Administration, Cortland Capital Market Services, LLC (2013-2014); Experienced Associate, PricewaterhouseCoopers LLP (2012-2013). |
* | The business address of each officer is c/o Guggenheim Investments, 227 West Monroe Street, Chicago, Illinois 60606. |
** | Each officer serves an indefinite term, until his or her successor is duly elected and qualified. |
| | THE GUGGENHEIM FUNDS SEMI-ANNUAL REPORT | 65 |
GUGGENHEIM INVESTMENTS PRIVACY NOTICE (Unaudited) |
Who We Are
This Privacy Notice describes the data protection practices of Guggenheim Investments. Guggenheim Investments as used herein refers to the affiliated investment management businesses of Guggenheim Partners, LLC: Guggenheim Funds Investment Advisors, LLC, Guggenheim Partners Investment Management, LLC, Guggenheim Funds Distributors, LLC, Security Investors, LLC, Guggenheim Investment Advisors (Europe) Limited, Guggenheim Real Estate, LLC, GS Gamma Advisors, LLC, Guggenheim Partners India Management, LLC, Guggenheim Partners Europe Limited, as well as the funds in the Guggenheim Funds complex (the “Funds”) (“Guggenheim Investments,” “we,” “us,” or “our”).
Guggenheim Partners Investment Management Holdings, LLC, located at 330 Madison Avenue, New York, New York 10017 is the data controller for your information. The affiliates who are also controllers of certain of your information are: Guggenheim Investment Advisors (Europe) Limited, Guggenheim Partners Europe Limited, Guggenheim Partners, LLC, Guggenheim Funds Investment Advisors, LLC, Guggenheim Partners Investment Management, LLC, Guggenheim Funds Distributors, LLC and Security Investors, LLC, as well as the Funds.
Our Commitment to You
Guggenheim Investments considers your privacy our utmost concern. When you become our client or investor, you entrust us with not only your hard-earned money but also with your personal and financial information. Because we have access to your private information, we hold ourselves to the highest standards in its safekeeping and use. We strictly limit how we share your information with others, whether you are a current or former Guggenheim Investments client or investor.
The Information We Collect About You
We collect certain nonpublic personal information about you from information you provide on applications, other forms, our website, and/or from third parties including investment advisors. This information includes Social Security or other tax identification number, assets, income, tax information, retirement and estate plan information, transaction history, account balance, payment history, bank account information, marital status, family relationships, information that we collect on our website through the use of “cookies,” and other personal information that you or others provide to us. We may also collect such information through your inquiries by mail, e-mail or telephone. We may also collect customer due diligence information, as required by applicable law and regulation, through third party service providers.
How We Handle Your Personal Information
The legal basis for using your information as set out in this Privacy Notice is as follows: (a) use of your personal data is necessary to perform our obligations under any contract with you (such as a contract for us to provide financial services to you); or (b) where use of your personal data is not necessary for performance of a contract, use of your personal data is necessary for our legitimate interests or the legitimate interests of others (for example, to enforce the legal terms
66 | THE GUGGENHEIM FUNDS SEMI-ANNUAL REPORT | |
GUGGENHEIM INVESTMENTS PRIVACY NOTICE (Unaudited)(continued) |
governing our services, operate and market our website and other services we offer, ensure safe environments for our personnel and others, make and receive payments, prevent fraud and to know the customer to whom we are providing the services). Some processing is done to comply with applicable law.
In addition to the specific uses described above, we also use your information in the following manner:
| | ● | We use your information in connection with servicing your accounts. |
| | ● | We use information to respond to your requests or questions. For example, we might use your information to respond to your customer feedback. |
| | ● | We use information to improve our products and services. We may use your information to make our website and products better. We may use your information to customize your experience with us. |
| | ● | We use information for security purposes. We may use your information to protect our company and our customers. |
| | ● | We use information to communicate with you. For example, we will communicate with you about your account or our relationship. We may contact you about your feedback. We might also contact you about this Privacy Notice. We may also enroll you in our email newsletter. |
| | ● | We use information as otherwise permitted by law, as we may notify you. |
| | ● | Aggregate/Anonymous Data. We may aggregate and/or anonymize any information collected through the website so that such information can no longer be linked to you or your device (“Aggregate/Anonymous Information”). We may use Aggregate/Anonymous Information for any purpose, including without limitation for research and marketing purposes, and may also share such data with any third parties, including advertisers, promotional partners, and sponsors. |
We do not sell information about current or former clients or their accounts to third parties. Nor do we share this information, except when necessary to complete transactions at your request, to make you aware of investment products and services that we or our affiliates offer, or as permitted or required by law.
We provide information about you to companies and individuals not affiliated with Guggenheim Investments to complete certain transactions or account changes, or to perform services for us related to your account. For example, if you ask to transfer assets from another financial institution to Guggenheim Investments, we must provide certain information about you to that company to complete the transaction. We provide the third party with only the information necessary to carry out its responsibilities and only for that purpose. And we require these third parties to treat your private information with the same high degree of confidentiality that we do.
| | THE GUGGENHEIM FUNDS SEMI-ANNUAL REPORT | 67 |
GUGGENHEIM INVESTMENTS PRIVACY NOTICE (Unaudited)(continued) |
To alert you to other Guggenheim Investments products and services, we share your information within our family of affiliated companies. You may limit our sharing with affiliated companies as set out below. We may also share information with any successor to all or part of our business, or in connection with steps leading up to a merger or acquisition. For example, if part of our business was sold we may give customer information as part of that transaction. We may also share information about you with your consent.
We will release information about you if you direct us to do so, if we are compelled by law to do so, or in other circumstances as permitted by law (for example, to protect your account from fraud).
If you close your account(s) or become an inactive client or investor, we will continue to adhere to the privacy policies and practices described in this notice.
Opt-Out Provisions and Your Data Choices
The law allows you to “opt out” of certain kinds of information sharing with third parties. We do not share personal information about you with any third parties that triggers this opt-out right. This means YOU ARE ALREADY OPTED OUT.
When you are no longer our client or investor, we continue to share your information as described in this notice, and you may contact us at any time to limit our sharing by sending an email to CorporateDataPrivacy@GuggenheimPartners.com.
European Union Data Subjects and certain others: In addition to the choices set forth above, residents of the European Union and certain other jurisdictions have certain rights to (1) request access to or rectification or deletion of information we collect about them, (2) request a restriction on the processing of their information, (3) object to the processing of their information, or (4) request the portability of certain information. To exercise these or other rights, please contact us using the contact information below. We will consider all requests and provide our response within the time period stated by applicable law. Please note, however, that certain information may be exempt from such requests in some circumstances, which may include if we need to keep processing your information for our legitimate interests or to comply with a legal obligation. We may request you provide us with information necessary to confirm your identity before responding to your request.
Residents of France and certain other jurisdictions may also provide us with instructions regarding the manner in which we may continue to store, erase and share your information after your death, and where applicable, the person you have designated to exercise these rights after your death.
How We Protect Privacy Online
We take steps to protect your privacy when you use our web site – www.guggenheiminvestments.com – by using secure forms of online communication, including encryption technology, Secure Socket Layer (SSL) protocol, firewalls and user names and passwords. These safeguards vary based on the sensitivity of the information that we collect and store. However, we cannot and do not guarantee
68 | THE GUGGENHEIM FUNDS SEMI-ANNUAL REPORT | |
GUGGENHEIM INVESTMENTS PRIVACY NOTICE (Unaudited)(concluded) |
that these measures will prevent every unauthorized attempt to access, use, or disclose your information since despite our efforts, no Internet and/or other electronic transmissions can be completely secure. Our web site uses “http cookies”—tiny pieces of information that we ask your browser to store. We use cookies for session management and security features on the Guggenheim Investments web site. We do not use them to pull data from your hard drive, to learn your e-mail address, or to view data in cookies created by other web sites. We will not share the information in our cookies or give others access to it. See the legal information area on our web site for more details about web site security and privacy features.
How We Safeguard Your Personal Information and Data Retention
We restrict access to nonpublic personal information about you to our employees and in some cases to third parties (for example, the service providers described above) as permitted by law. We maintain strict physical, electronic and procedural safeguards that comply with federal standards to guard your nonpublic personal information.
We keep your information for no longer than necessary for the purposes for which it is processed. The length of time for which we retain information depends on the purposes for which we collected and use it and/or as required to comply with applicable laws. Information may persist in copies made for backup and business continuity purposes for additional time.
International Visitors
If you are not a resident of the United States, please be aware that your information may be transferred to, stored and processed in the United States where our servers are located and our databases are operated. The data protection and other laws of the United States and other countries might not be as comprehensive as those in your country.
In such cases, we ensure that a legal basis for such a transfer exists and that adequate protection is provided as required by applicable law, for example, by using standard contractual clauses or by transferring your data to a jurisdiction that has obtained an adequacy finding. Individuals whose data may be transferred on the basis of standard contractual clauses may contact us as described below.
We’ll Keep You Informed
If you have any questions or concerns about how we treat your personal data, we encourage you to consult with us first. You may also contact the relevant supervisory authority.
We reserve the right to modify this policy at any time and will inform you promptly of material changes. You may access our privacy policy from our web site at www.guggenheiminvestments.com. Should you have any questions regarding our privacy policy, contact us by email at CorporateDataPrivacy@GuggenheimPartners.com.
| | THE GUGGENHEIM FUNDS SEMI-ANNUAL REPORT | 69 |
This page intentionally left blank.
This page intentionally left blank.
This page intentionally left blank.
This page intentionally left blank.
3.31.2021
Guggenheim Funds Semi-Annual Report
|
Guggenheim Total Return Bond Fund | | |
GuggenheimInvestments.com | TRB-SEMI-0321x0921 |

| | |
DEAR SHAREHOLDER | 2 |
ECONOMIC AND MARKET OVERVIEW | 4 |
ABOUT SHAREHOLDERS’ FUND EXPENSES | 6 |
TOTAL RETURN BOND FUND | 9 |
NOTES TO FINANCIAL STATEMENTS | 98 |
OTHER INFORMATION | 125 |
INFORMATION ON BOARD OF TRUSTEES AND OFFICERS | 126 |
GUGGENHEIM INVESTMENTS PRIVACY NOTICE | 133 |
| | THE GUGGENHEIM FUNDS SEMI-ANNUAL REPORT | 1 |
Dear Shareholder:
Guggenheim Partners Investment Management, LLC (“GPIM” or the “Investment Adviser”), is pleased to present the shareholder report for Guggenheim Total Return Bond Fund (the “Fund”) for the semi-annual period ended March 31, 2021.
The Investment Adviser is part of Guggenheim Investments, which represents the investment management businesses of Guggenheim Partners, LLC (“Guggenheim”), a global, diversified financial services firm.
Guggenheim Funds Distributors, LLC is the distributor of the Funds. Guggenheim Funds Distributors, LLC is affiliated with Guggenheim and the Investment Adviser.
We encourage you to read the Economic and Market Overview section of the report, which follows this letter.
We are committed to providing innovative investment solutions and appreciate the trust you place in us.
Sincerely,
Guggenheim Partners Investment Management, LLC
April 30, 2021
Read a prospectus and summary prospectus (if available) carefully before investing. It contains the investment objectives, risks, charges, expenses and other information, which should be considered carefully before investing. Obtain a prospectus and summary prospectus (if available) at guggenheiminvestments.com or call 800.820.0888.
This material is not intended as a recommendation or as investment advice of any kind, including in connection with rollovers, transfers, and distributions. Such material is not provided in a fiduciary capacity, may not be relied upon for or in connection with the making of investment decisions, and does not constitute a solicitation of an offer to buy or sell securities. All content has been provided for informational or educational purposes only and is not intended to be and should not be construed as legal or tax advice and/or a legal opinion. Always consult a financial, tax and/or legal professional regarding your specific situation.
COVID-19. The global ongoing crisis caused by the outbreak of COVID-19 and the current recovery underway is causing disruption to consumer demand and economic output and supply chains. There are still travel restrictions and quarantines, and adverse impacts on local and global economies. Investors should be aware that in light of the current uncertainty, volatility and distress in economies, the financial markets, and labor and public health conditions around the world, the Fund’s investments and shareholder’s investment in the Fund are subject to investment risk, including the possible loss of the entire principal amount invested. Firms through which investors invest with the Fund, the Fund, its service providers, the markets in which it invests and market intermediaries are also impacted by quarantines and similar measures intended to respond to and contain the ongoing pandemic, which can obstruct their functioning and subject them to heightened operational and other risks.
2 | THE GUGGENHEIM FUNDS SEMI-ANNUAL REPORT | |
Total Return Bond Fund may not be suitable for all investors. ● The Fund’s market value will change in response to interest rate changes and market conditions among other factors. In general, bond prices rise when interest rates fall and vice versa. ● The Fund’s exposure to high yield securities may subject the Fund to greater volatility. ● When market conditions are deemed appropriate, the Fund will leverage to the full extent permitted by its investment policies and restrictions and applicable law. Leveraging will exaggerate the effect on net asset value of any increase or decrease in the market value of the Fund’s portfolio. ● The Fund may invest in derivative instruments, which may be more volatile and less liquid, increasing the risk of loss when compared to traditional securities. Certain of the derivative instruments are also subject to the risks of counterparty default and adverse tax treatment. ● Instruments and strategies (such as borrowing transactions and reverse repurchase agreements) may provide leveraged exposure to a particular investment, which will magnify any gains or losses on those investments. ● Investments in reverse repurchase agreements expose the Fund to the many of the same risks as investments in derivatives. ● The Fund’s investments in other investment vehicles subject the Fund to those risks and expenses affecting the investment vehicle. ● The Fund’s investments in foreign securities carry additional risks when compared to U.S. securities, due to the impact of diplomatic, political, or economic developments in the country in question (investments in emerging markets securities are generally subject to an even greater level of risk). ● Investments in syndicated bank loans generally offer a floating interest rate and involve special types of risks. ● The Fund’s investments in municipal securities can be affected by events that affect the municipal bond market. ● The Fund’s investments in real estate securities subject the Fund to the same risks as direct investments in real estate, which is particularly sensitive to economic downturns. ● The Fund’s investments in restricted securities may involve financial and liquidity risk. ● You may have a gain or loss when you sell your shares. ● It is important to note that the Fund is not guaranteed by the U.S. government. ● Please read the prospectus for more detailed information regarding these and other risks.
| | THE GUGGENHEIM FUNDS SEMI-ANNUAL REPORT | 3 |
ECONOMIC AND MARKET OVERVIEW (Unaudited) | March 31, 2021 |
In the six months ending March 31, 2021, the yield on the two-year Treasury rose 3 basis points1 to 0.16% from 0.13%, and the 10-year Treasury climbed 105 basis points to 1.74% from 0.69%. The spread between the two-year Treasury and 10-year Treasury widened from 56 basis points to 158 basis points as investors repositioned in response to fears of inflationary pressure, which we and the Federal Reserve (the “Fed”) regard as a transitory, short-term phenomenon. We expect easy financial conditions and low rates to support credit over the next few years. With market optimism pulling forward rate hike expectations and causing bond yields to rise, we view this as an opportunity to add incremental yield to portfolios.
We upgraded our 2021 U.S. economic growth forecast during the first quarter from 5.5% to over 7%, factoring in more fiscal stimulus than previously anticipated. This forecast captures the effect of stimulus representing roughly 11% of 2020–2021 gross domestic product (“GDP”), versus the previous calculation of about 8%. We see strength in the consumer sector and in housing activity. In addition, U.S. vaccinations for COVID-19 continue to accelerate, nearing 3 million doses per day by the end of the first quarter. More than 213 million doses have been administered in the U.S. so far, and about 35% of the U.S. population has been fully vaccinated. The U.S. is seeing the best-case scenario unfold in its vaccine rollout, but other countries have not been as fortunate.
Europe’s vaccine rollout hit a major speedbump during the first quarter when questions surrounding the safety of the AstraZeneca vaccine led several major European countries to temporarily suspend distribution. Safety concerns, coupled with supply constraints, meant that less than 10% of the populations in Germany, France, and Italy had been vaccinated by the end of the first quarter, well under the pace needed to reach 70% inoculated by summer. Any delay in ending the pandemic on a global scale has implications for other countries too, including the U.S., where travel and hospitality workers represent a large share of the unemployed.
Despite vaccination delays in Europe and its implications abroad, we saw meaningful improvement in the labor market in the first quarter as states moved forward with business re-openings. Seasonally adjusted initial jobless claims fell by 97,000 to 684,000 in the week ending March 20, the lowest level since the pandemic began, before seeing an uptick the following week to 719,000. We saw more positive news across the board in the March payroll report with 916,000 jobs added, with 156,000 more from revisions. Standing in the way of additional labor market gains are local government restrictions on certain sectors, although easing of these restrictions is expected by summer.
Economic developments drove a sharp increase in U.S. Treasury yields. The market pulled forward expectations of the next Federal Reserve (Fed) rate hike from December 2023 to December 2022, while repricing the long-run terminal fed funds rate estimate to 2.25% from just 0.55% last August. We do not expect the Fed to raise interest rates as early as the market is anticipating, even though we expect strong GDP growth in coming years.
Year-over-year inflation measures will rise over the next several months due to base effects, which may be compounded by supply chain disruptions in the goods sector and potential capacity constraints for certain services. However, we think these factors will prove to be short-lived, with
4 | THE GUGGENHEIM FUNDS SEMI-ANNUAL REPORT | |
ECONOMIC AND MARKET OVERVIEW (Unaudited)(concluded) | March 31, 2021 |
base effects set to dampen inflation starting in the summer months. Moreover, the Fed is focused on generating sustainably higher inflation. Even if core inflation rises above the Fed’s 2% target in 2021, the Fed’s focus is on a long-term average of 2%. With years of shortfalls to make up, and the Fed now targeting labor market disparities as part of an expanded definition of full employment, we expect policymakers to remain resolutely patient. Any tapering of asset purchases will likely be deferred until later in 2022, with the first rate hike likely to come sometime after that.
For the six-month period ended March 31, 2021, the Standard & Poor’s 500® (“S&P 500® ”) Index* returned 19.07%. The MSCI Europe-Australasia-Far East (“EAFE”) Index* returned 20.08%. The return of the MSCI Emerging Markets Index* was 22.43%.
In the bond market, the Bloomberg Barclays U.S. Aggregate Bond Index* posted a -2.73% return for the six-month period, while the Bloomberg Barclays U.S. Corporate High Yield Index* returned 7.36%. The return of the ICE Bank of America (“BofA”) Merrill Lynch 3-Month U.S. Treasury Bill Index* was 0.06% for the six-month period.
The opinions and forecasts expressed may not actually come to pass. This information is subject to change at any time, based on market and other conditions, and should not be construed as a recommendation of any specific security or strategy.
1 | Basis point - one basis point is equal to 0.01%. |
*Index Definitions:
The following indices are referenced throughout this report. Indices are unmanaged and not available for direct investment. Index performance does not reflect transaction costs, fees, or expenses.
Bloomberg Barclays U.S. Aggregate Bond Index is a broad-based flagship benchmark that measures the investment grade, U.S. dollar-denominated, fixed-rate taxable bond market, including U.S. Treasuries, government-related and corporate securities, mortgage-backed securities or “MBS” (agency fixed-rate and hybrid adjustable-rate mortgage, or “ARM”, pass-throughs), asset-backed securities (“ABS”), and commercial mortgage-backed securities (“CMBS”) (agency and non-agency).
Bloomberg Barclays U.S. Corporate High Yield Index measures the U.S. dollar-denominated, high yield, fixed-rate corporate bond market. Securities are classified as high yield if the middle rating of Moody’s, Fitch, and S&P is Ba1/BB +/BB + or below.
ICE BofA Merrill Lynch 3-Month U.S. Treasury Bill Index is an unmanaged market Index of U.S. Treasury securities maturing in 90 days that assumes reinvestment of all income.
MSCI EAFE Index is a free float-adjusted market capitalization index that is designed to measure the equity market performance of developed markets, excluding the U.S. & Canada.
MSCI Emerging Markets Index is a free float-adjusted market capitalization weighted index that is designed to measure equity market performance in the global emerging markets.
S&P 500® is a broad-based index, the performance of which is based on the performance of 500 widely held common stocks chosen for market size, liquidity, and industry group representation.
| | THE GUGGENHEIM FUNDS SEMI-ANNUAL REPORT | 5 |
ABOUT SHAREHOLDERS’ FUND EXPENSES (Unaudited) |
All mutual funds have operating expenses, and it is important for our shareholders to understand the impact of costs on their investments. Shareholders of a fund incur two types of costs: (i) transaction costs, including sales charges (loads) on purchase payments, reinvested dividends, other distributions, and exchange fees, and (ii) ongoing costs, including management fees, administrative services, and shareholder reports, among others. These ongoing costs, or operating expenses, are deducted from a fund’s gross income and reduce the investment return of the fund.
A fund’s expenses are expressed as a percentage of its average net assets, which is known as the expense ratio. The following examples are intended to help investors understand the ongoing costs (in dollars) of investing in a fund and to compare these costs with the ongoing costs of investing in other mutual funds.
The examples are based on an investment of $1,000 made at the beginning of the period and held for the entire six-month period beginning September 30, 2020 and ending March 31, 2021.
The following tables illustrate the Fund’s costs in two ways:
Table 1. Based on actual Fund return: This section helps investors estimate the actual expenses paid over the period. The “Ending Account Value” shown is derived from the Fund’s actual return, and the fifth column shows the dollar amount that would have been paid by an investor who started with $1,000 in the Fund. Investors may use the information here, together with the amount invested, to estimate the expenses paid over the period. Simply divide the Fund’s account value by $1,000 (for example, an $8,600 account value divided by $1,000 = 8.6), then multiply the result by the number provided under the heading “Expenses Paid During Period.”
Table 2. Based on hypothetical 5% return: This section is intended to help investors compare a fund’s cost with those of other mutual funds. The table provides information about hypothetical account values and hypothetical expenses based on the Fund’s actual expense ratio and an assumed rate of return of 5% per year before expenses, which is not the Fund’s actual return. The hypothetical account values and expenses may not be used to estimate the actual ending account balance or expenses paid during the period. The example is useful in making comparisons because the U.S. Securities and Exchange Commission (the “SEC”) requires all mutual funds to calculate expenses based on the 5% return. Investors can assess a Fund’s costs by comparing this hypothetical example with the hypothetical examples that appear in shareholder reports of other funds.
The calculations illustrated above assume no shares were bought or sold during the period. Actual costs may have been higher or lower, depending on the amount of investment and the timing of any purchases or redemptions.
6 | THE GUGGENHEIM FUNDS SEMI-ANNUAL REPORT | |
ABOUT SHAREHOLDERS’ FUND EXPENSES (Unaudited)(continued) |
Please note that the expenses shown in the table are meant to highlight your ongoing costs only and do not reflect any transactional costs, such as sales charges (loads) on purchase payments, and contingent deferred sales charges (“CDSC”) on redemptions, if any. Therefore, the second table is useful in comparing ongoing costs only, and will not help you determine the relative total costs of owning different funds. In addition, if these transactional costs were included, your costs would have been higher.
More information about the Fund’s expenses, including annual expense ratios for periods up to five years (subject to the Fund’s inception date), can be found in the Financial Highlights section of this report. For additional information on operating expenses and other shareholder costs, please refer to the Fund’s prospectus.
| | THE GUGGENHEIM FUNDS SEMI-ANNUAL REPORT | 7 |
ABOUT SHAREHOLDERS’ FUND EXPENSES (Unaudited)(concluded) |
| Expense
Ratio1 | Fund
Return | Beginning
Account Value
September 30,
2020 | Ending
Account Value
March 31,
2021 | Expenses
Paid During
Period2 |
Table 1. Based on actual Fund return3 |
A-Class | 0.79% | (0.99%) | $ 1,000.00 | $ 990.10 | $ 3.92 |
C-Class | 1.54% | (1.36%) | 1,000.00 | 986.40 | 7.63 |
P-Class | 0.79% | (0.99%) | 1,000.00 | 990.10 | 3.92 |
Institutional Class | 0.50% | (0.85%) | 1,000.00 | 991.50 | 2.48 |
R6-Class | 0.50% | (0.85%) | 1,000.00 | 991.50 | 2.48 |
|
Table 2. Based on hypothetical 5% return (before expenses) |
A-Class | 0.79% | 5.00% | $ 1,000.00 | $ 1,020.99 | $ 3.98 |
C-Class | 1.54% | 5.00% | 1,000.00 | 1,017.25 | 7.75 |
P-Class | 0.79% | 5.00% | 1,000.00 | 1,020.99 | 3.98 |
Institutional Class | 0.50% | 5.00% | 1,000.00 | 1,022.44 | 2.52 |
R6-Class | 0.50% | 5.00% | 1,000.00 | 1,022.44 | 2.52 |
1 | Annualized and excludes expenses of the underlying funds in which the Fund invests, if any. This ratio represents net expenses, which may include expenses that are excluded from the expense limitation agreement. Excluding these expenses, the net expense ratio for the Fund would be 0.78%, 1.52%, 0.78%, 0.49% and 0.49% for the A-Class, C-Class, P-Class, Institutional Class and R6-Class, respectively. |
2 | Expenses are equal to the Fund’s annualized expense ratio, net of any applicable fee waivers, multiplied by the average account value over the period, multiplied by 182/365 (to reflect the one-half year period). |
3 | Actual cumulative return at net asset value for the period September 30, 2020 to March 31, 2021. |
8 | THE GUGGENHEIM FUNDS SEMI-ANNUAL REPORT | |
PERFORMANCE REPORT AND FUND PROFILE (Unaudited) | March 31, 2021 |
TOTAL RETURN BOND FUND
OBJECTIVE: Seeks to provide total return, comprised of current income and capital appreciation.
Holdings Diversification (Market Exposure as % of Net Assets)
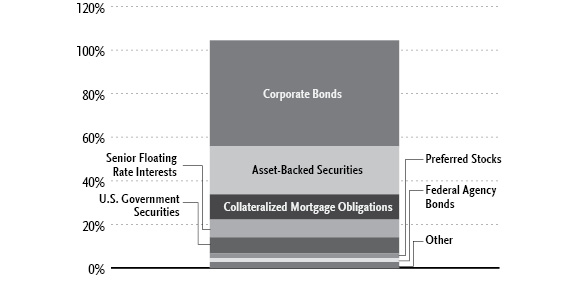
“Holdings Diversification (Market Exposure as % of Net Assets)” excludes any temporary cash investments, investments in Guggenheim Strategy Funds Trust mutual funds, or investments in Guggenheim Ultra Short Duration Fund.
| | THE GUGGENHEIM FUNDS SEMI-ANNUAL REPORT | 9 |
PERFORMANCE REPORT AND FUND PROFILE (Unaudited)(continued) | March 31, 2021 |
Inception Dates: |
A-Class | November 30, 2011 |
C-Class | November 30, 2011 |
P-Class | May 1, 2015 |
Institutional Class | November 30, 2011 |
R6-Class | October 19, 2016 |
Portfolio Composition by Quality Rating1 |
Rating | % of Total
Investments |
Fixed Income Instruments | |
AAA | 21.9% |
AA | 7.6% |
A | 15.5% |
BBB | 29.1% |
BB | 8.8% |
B | 6.5% |
CCC | 0.9% |
CC | 1.2% |
C | 0.1% |
NR2 | 3.1% |
Other Instruments | 5.3% |
Total Investments | 100.0% |
Ten Largest Holdings (% of Total Net Assets) |
U.S. Treasury Notes, 1.13% | 3.1% |
U.S. Treasury Notes, 0.25% | 1.6% |
U.S. Treasury Strips, due 02/15/50 | 1.5% |
Pershing Square Tontine Holdings, Ltd. — Class A | 0.9% |
Delta Air Lines, Inc., 7.00% | 0.7% |
U.S. Treasury Bonds, due 02/15/51 | 0.6% |
Station Place Securitization Trust, 1.01%, due 02/16/22 | 0.6% |
Boeing Co., 5.15% | 0.6% |
SBA Tower Trust, 2.33% | 0.6% |
Sysco Corp., 5.95% | 0.6% |
Top Ten Total | 10.8% |
| | |
“Ten Largest Holdings” excludes any temporary cash or derivative investments. |
1 | Source: BlackRock Solutions. Credit quality ratings are measured on a scale that generally ranges from AAA (highest) to D (lowest). All securities except for those labeled “NR” have been rated by Moody’s, Standard & Poor’s (“S&P”), or Fitch, each of which is a Nationally Recognized Statistical Rating Organization (“NRSRO”). For purposes of this presentation, when ratings are available from more than one agency, the highest rating is used. Guggenheim Investments has converted ratings to the equivalent S&P rating. Security ratings are determined at the time of purchase and may change thereafter. |
2 | NR (not rated) securities do not necessarily indicate low credit quality. |
10 | THE GUGGENHEIM FUNDS SEMI-ANNUAL REPORT | |
PERFORMANCE REPORT AND FUND PROFILE (Unaudited)(concluded) | March 31, 2021 |
Average Annual Returns*
Periods Ended March 31, 2021
| 6 Month† | 1 Year | 5 Year | Since
Inception
(11/30/11) |
A Class Shares | (0.99%) | 7.41% | 5.17% | 5.44% |
A-Class Shares with sales charge‡ | (4.95%) | 3.10% | 4.31% | 4.89% |
C-Class Shares | (1.36%) | 6.61% | 4.39% | 4.67% |
C-Class Shares with CDSC§ | (2.32%) | 5.61% | 4.39% | 4.67% |
Institutional Class Shares | (0.85%) | 7.67% | 5.49% | 5.79% |
Bloomberg Barclays U.S. Aggregate Bond Index | (2.73%) | 0.71% | 3.10% | 3.02% |
| 6 Month† | 1 Year | 5 Year | Since
Inception
(05/01/15) |
P-Class Shares | (0.99%) | 7.41% | 5.18% | 4.50% |
Bloomberg Barclays U.S. Aggregate Bond Index | (2.73%) | 0.71% | 3.10% | 3.07% |
| | 6 Month† | 1 Year | Since
Inception
(10/19/16) |
R6-Class Shares | | (0.85%) | 7.71% | 4.86% |
Bloomberg Barclays U.S. Aggregate Bond Index | | (2.73%) | 0.71% | 2.97% |
* | The performance data above represents past performance that is not predictive of future results. The investment return and principal value of an investment in the Fund will fluctuate so that an investor’s shares, when redeemed, may be worth more or less than their original cost. Returns are historical and include changes in principal and reinvested dividends and capital gains and do not reflect the effect of taxes. The Bloomberg Barclays U.S. Aggregate Bond Index is an unmanaged index and, unlike the Fund, has no management fees or operating expenses to reduce its reported return. |
† | 6 month returns are not annualized. |
‡ | Effective October 1, 2015, the maximum sales charge decreased from 4.75% to 4.00%. A 4.75% maximum sales charge is used in the calculation of the Average Annual Returns based on subscriptions made prior to October 1, 2015, and a 4.00% maximum sales charge will be used to calculate performance for periods based on subscriptions made on or after October 1, 2015. |
§ | Fund returns include a CDSC of 1% if redeemed within 12 months of purchase. |
| | THE GUGGENHEIM FUNDS SEMI-ANNUAL REPORT | 11 |
SCHEDULE OF INVESTMENTS (Unaudited) | March 31, 2021 |
TOTAL RETURN BOND FUND | |
| | Shares | | | Value | |
COMMON STOCKS† - 1.1% |
| | | | | | | | | |
Financial - 1.1% |
Pershing Square Tontine Holdings, Ltd. — Class A* | | | 9,249,470 | | | $ | 222,079,775 | |
KKR Acquisition Holdings I Corp.* | | | 3,797,870 | | | | 38,016,679 | |
RXR Acquisition Corp.* | | | 834,256 | | | | 8,217,421 | |
MSD Acquisition Corp.* | | | 626,308 | | | | 6,357,026 | |
Soaring Eagle Acquisition Corp.* | | | 504,732 | | | | 5,107,888 | |
Colicity, Inc.* | | | 162,939 | | | | 1,645,684 | |
Total Financial | | | | | | | 281,424,473 | |
| | | | | | | | | |
Industrial - 0.0% |
BP Holdco LLC*,†††,1 | | | 532 | | | | 188 | |
Vector Phoenix Holdings, LP*,††† | | | 532 | | | | 60 | |
API Heat Transfer Parent LLC*,††† | | | 42,528 | | | | 4 | |
Total Industrial | | | | | | | 252 | |
| | | | | | | | | |
Total Common Stocks | | | | |
(Cost $238,424,819) | | | | | | | 281,424,725 | |
| | | | | | | | | |
PREFERRED STOCKS†† - 2.2% |
Financial - 2.2% |
First Republic Bank, 4.25%* | | | 3,442,000 | | | | 88,356,140 | |
Wells Fargo & Co., 4.70% | | | 2,184,000 | | | | 55,582,800 | |
Bank of America Corp., 4.13% | | | 2,218,000 | | | | 54,962,040 | |
Public Storage, 4.63% | | | 1,842,400 | | | | 49,486,864 | |
Equitable Holdings, Inc., 4.30% | | | 1,839,200 | | | | 45,814,472 | |
Wells Fargo & Co., 4.38% | | | 1,774,000 | | | | 44,243,560 | |
Bank of America Corp., 4.38% | | | 1,552,000 | | | | 38,800,000 | |
W R Berkley Corp., 4.13% due 03/30/61 | | | 1,540,000 | | | | 38,515,400 | |
American Financial Group, Inc., 4.50% due 09/15/60 | | | 1,292,800 | | | | 34,272,128 | |
First Republic Bank, 4.13% | | | 798,800 | | | | 19,970,000 | |
CNO Financial Group, Inc., 5.13% due 11/25/60 | | | 712,000 | | | | 17,942,400 | |
Assurant, Inc., 5.25% due 01/15/61* | | | 558,400 | | | | 14,362,048 | |
Selective Insurance Group, Inc., 4.60%* | | | 538,000 | | | | 13,423,100 | |
Public Storage, 4.13% | | | 426,000 | | | | 10,995,060 | |
W R Berkley Corp., 4.25% due 09/30/60 | | | 376,400 | | | | 9,586,908 | |
Total Financial | | | | | | | 536,312,920 | |
| | | | | | | | | |
Industrial - 0.0% |
API Heat Transfer Intermediate*,††† | | | 9 | | | | — | |
Total Preferred Stocks | | | | |
(Cost $527,357,237) | | | | | | | 536,312,920 | |
| | | | | | | | | |
WARRANTS† - 0.0% |
Pershing Square Tontine Holdings, Ltd. | | | | | | | | |
Expiring 07/24/25 | | | 1,027,719 | | | | 8,375,909 | |
Total Warrants | | | | |
(Cost $5,836,416) | | | | | | | 8,375,909 | |
| | | | | | | | | |
12 | THE GUGGENHEIM FUNDS SEMI-ANNUAL REPORT | SEE NOTES TO FINANCIAL STATEMENTS. |
SCHEDULE OF INVESTMENTS (Unaudited)(continued) | March 31, 2021 |
TOTAL RETURN BOND FUND | |
| | Shares | | | Value | |
MUTUAL FUNDS† - 0.3% |
Guggenheim Strategy Fund II1 | | | 1,081,546 | | | $ | 27,017,020 | |
Guggenheim Ultra Short Duration Fund — Institutional Class1 | | | 2,674,461 | | | | 26,637,634 | |
Guggenheim Strategy Fund III1 | | | 581,762 | | | | 14,625,487 | |
Total Mutual Funds | | | | |
(Cost $68,126,790) | | | | | | | 68,280,141 | |
| | | | | | | | | |
CLOSED-END FUNDS† - 0.1% |
BlackRock MuniHoldings California Quality Fund, Inc. | | | 614,871 | | | | 9,253,808 | |
BlackRock MuniYield California Quality Fund, Inc. | | | 435,879 | | | | 6,420,498 | |
Total Closed-End Funds | | | | |
(Cost $15,526,030) | | | | | | | 15,674,306 | |
| | | | | | | | | |
MONEY MARKET FUND† - 1.7% |
Federated Hermes U.S. Treasury Cash Reserves Fund — Institutional Shares, 0.01%2 | | | 403,274,507 | | | | 403,274,507 | |
Total Money Market Fund | | | | |
(Cost $403,274,507) | | | | | | | 403,274,507 | |
| | | | | | | | | |
| | | Face
Amount~ | | | | | |
CORPORATE BONDS†† - 48.6% |
Financial - 18.7% | | | | | | | | |
Wells Fargo & Co. | | | | | | | | |
3.07% due 04/30/413 | | | 126,490,000 | | | | 123,693,937 | |
3.90%3,4 | | | 48,500,000 | | | | 48,980,150 | |
2.57% due 02/11/313 | | | 18,410,000 | | | | 18,550,292 | |
Citigroup, Inc. | | | | | | | | |
3.88%3,4 | | | 86,450,000 | | | | 86,046,278 | |
2.57% due 06/03/313 | | | 72,390,000 | | | | 72,281,064 | |
4.00%3,4 | | | 26,450,000 | | | | 26,707,888 | |
American International Group, Inc. | | | | | | | | |
3.40% due 06/30/30 | | | 78,220,000 | | | | 83,087,114 | |
4.38% due 06/30/50 | | | 65,480,000 | | | | 74,522,593 | |
2.50% due 06/30/25 | | | 2,370,000 | | | | 2,485,701 | |
Bank of America Corp. | | | | | | | | |
2.59% due 04/29/313 | | | 100,240,000 | | | | 99,907,509 | |
2.68% due 06/19/413 | | | 43,300,000 | | | | 40,452,715 | |
0.75% (U.S. Secured Overnight Financing Rate + 0.73%, Rate Floor: 0.00%) due 10/24/245 | | | 1,660,000 | | | | 1,667,636 | |
Citizens Financial Group, Inc. | | | | | | | | |
3.25% due 04/30/30 | | | 124,980,000 | | | | 131,923,051 | |
2.50% due 02/06/30 | | | 9,567,000 | | | | 9,473,809 | |
Charles Schwab Corp. | | | | | | | | |
4.00%3,4 | | | 71,500,000 | | | | 70,187,975 | |
5.38%3,4 | | | 47,950,000 | | | | 53,152,575 | |
Nationwide Mutual Insurance Co. | | | | | | | | |
4.35% due 04/30/506 | | | 116,750,000 | | | | 122,196,395 | |
Liberty Mutual Group, Inc. | | | | | | | | |
4.30% due 02/01/616 | | | 94,150,000 | | | | 84,615,976 | |
3.95% due 05/15/606 | | | 33,870,000 | | | | 34,116,554 | |
Macquarie Bank Ltd. | | | | | | | | |
3.62% due 06/03/306 | | | 93,835,000 | | | | 95,862,671 | |
3.05% due 03/03/363,6 | | | 16,000,000 | | | | 15,309,871 | |
Reliance Standard Life Global Funding II | | | | | | | | |
2.75% due 05/07/256 | | | 96,010,000 | | | | 100,758,666 | |
JPMorgan Chase & Co. | | | | | | | | |
2.96% due 05/13/313 | | | 29,530,000 | | | | 30,033,557 | |
4.49% due 03/24/313 | | | 25,750,000 | | | | 29,648,614 | |
2.52% due 04/22/313 | | | 24,520,000 | | | | 24,364,116 | |
3.11% due 04/22/413 | | | 16,439,000 | | | | 16,314,850 | |
Five Corners Funding Trust II | | | | | | | | |
2.85% due 05/15/306 | | | 94,866,000 | | | | 97,701,470 | |
SEE NOTES TO FINANCIAL STATEMENTS. | THE GUGGENHEIM FUNDS SEMI-ANNUAL REPORT | 13 |
SCHEDULE OF INVESTMENTS (Unaudited)(continued) | March 31, 2021 |
TOTAL RETURN BOND FUND | |
| | Face
Amount~ | | | Value | |
Wilton RE Ltd. | | | | | | | | |
6.00%†††,3,4,6 | | | 93,150,000 | | | $ | 91,541,300 | |
Markel Corp. | | | | | | | | |
6.00%3,4 | | | 82,610,000 | | | | 89,838,375 | |
Reinsurance Group of America, Inc. | | | | | | | | |
3.15% due 06/15/30 | | | 84,319,000 | | | | 87,154,708 | |
GLP Capital Limited Partnership / GLP Financing II, Inc. | | | | | | | | |
4.00% due 01/15/31 | | | 53,354,000 | | | | 55,140,025 | |
5.30% due 01/15/29 | | | 28,165,000 | | | | 31,571,557 | |
Equitable Holdings, Inc. | | | | | | | | |
4.95%3,4 | | | 70,950,000 | | | | 75,029,625 | |
Lincoln National Corp. | | | | | | | | |
3.40% due 01/15/31 | | | 49,200,000 | | | | 52,359,861 | |
4.38% due 06/15/50 | | | 18,680,000 | | | | 20,866,046 | |
Fidelity National Financial, Inc. | | | | | | | | |
3.40% due 06/15/30 | | | 52,430,000 | | | | 54,684,923 | |
2.45% due 03/15/31 | | | 17,490,000 | | | | 16,900,328 | |
Intercontinental Exchange, Inc. | | | | | | | | |
3.00% due 06/15/50 | | | 37,190,000 | | | | 34,405,101 | |
2.65% due 09/15/40 | | | 34,550,000 | | | | 31,805,313 | |
2.35% due 09/15/22 | | | 1,535,000 | | | | 1,572,799 | |
Fairfax Financial Holdings Ltd. | | | | | | | | |
3.38% due 03/03/316 | | | 67,460,000 | | | | 67,155,857 | |
Pershing Square Holdings, Ltd. | | | | | | | | |
3.25% due 11/15/306 | | | 68,200,000 | | | | 66,689,449 | |
Iron Mountain, Inc. | | | | | | | | |
5.25% due 07/15/306 | | | 30,050,000 | | | | 31,005,590 | |
5.63% due 07/15/326 | | | 13,350,000 | | | | 13,950,750 | |
4.50% due 02/15/316 | | | 12,000,000 | | | | 11,863,200 | |
5.00% due 07/15/286 | | | 5,275,000 | | | | 5,393,688 | |
4.88% due 09/15/276 | | | 1,938,000 | | | | 1,982,816 | |
United Wholesale Mortgage LLC | | | | | | | | |
5.50% due 04/15/296 | | | 38,750,000 | | | | 38,701,563 | |
5.50% due 11/15/256 | | | 20,100,000 | | | | 20,954,250 | |
Standard Chartered plc | | | | | | | | |
4.64% due 04/01/313,6 | | | 51,325,000 | | | | 58,214,639 | |
1.32% due 10/14/233,6 | | | 1,080,000 | | | | 1,086,858 | |
Crown Castle International Corp. | | | | | | | | |
2.90% due 04/01/41 | | | 41,150,000 | | | | 37,692,234 | |
3.30% due 07/01/30 | | | 17,657,000 | | | | 18,434,729 | |
Ares Finance Company II LLC | | | | | | | | |
3.25% due 06/15/306 | | | 54,785,000 | | | | 55,466,316 | |
MetLife, Inc. | | | | | | | | |
3.85%3,4 | | | 53,200,000 | | | | 54,929,000 | |
Host Hotels & Resorts, LP | | | | | | | | |
3.50% due 09/15/30 | | | 54,518,000 | | | | 54,547,384 | |
OneAmerica Financial Partners, Inc. | | | | | | | | |
4.25% due 10/15/506 | | | 54,430,000 | | | | 52,358,050 | |
NFP Corp. | | | | | | | | |
6.88% due 08/15/286 | | | 25,475,000 | | | | 26,458,335 | |
7.00% due 05/15/256 | | | 23,600,000 | | | | 25,311,000 | |
Bank of New York Mellon Corp. | | | | | | | | |
3.70%3,4 | | | 32,350,000 | | | | 33,281,680 | |
4.70%3,4 | | | 16,500,000 | | | | 17,876,925 | |
Prudential plc | | | | | | | | |
3.13% due 04/14/30 | | | 48,440,000 | | | | 51,059,444 | |
Deloitte LLP | | | | | | | | |
3.56% due 05/07/30††† | | | 30,700,000 | | | | 30,857,566 | |
3.76% due 05/07/35††† | | | 10,200,000 | | | | 9,954,582 | |
3.66% due 05/07/32††† | | | 9,450,000 | | | | 9,466,136 | |
7.33% due 11/20/26††† | | | 4,800,000 | | | | 5,851,658 | |
Teachers Insurance & Annuity Association of America | | | | | | | | |
3.30% due 05/15/506 | | | 50,500,000 | | | | 48,978,833 | |
First American Financial Corp. | | | | | | | | |
4.00% due 05/15/30 | | | 44,960,000 | | | | 48,569,433 | |
14 | THE GUGGENHEIM FUNDS SEMI-ANNUAL REPORT | SEE NOTES TO FINANCIAL STATEMENTS. |
SCHEDULE OF INVESTMENTS (Unaudited)(continued) | March 31, 2021 |
TOTAL RETURN BOND FUND | |
| | Face
Amount~ | | | Value | |
Brookfield Finance, Inc. | | | | | | | | |
3.50% due 03/30/51 | | | 37,420,000 | | | $ | 35,548,459 | |
4.70% due 09/20/47 | | | 10,925,000 | | | | 12,424,550 | |
Nippon Life Insurance Co. | | | | | | | | |
2.75% due 01/21/513,6 | | | 50,350,000 | | | | 47,769,563 | |
Alleghany Corp. | | | | | | | | |
3.63% due 05/15/30 | | | 43,920,000 | | | | 47,324,653 | |
LPL Holdings, Inc. | | | | | | | | |
4.00% due 03/15/296 | | | 44,950,000 | | | | 45,287,125 | |
Quicken Loans LLC / Quicken Loans Company-Issuer, Inc. | | | | | | | | |
3.88% due 03/01/316 | | | 46,650,000 | | | | 45,017,250 | |
Arch Capital Group Ltd. | | | | | | | | |
3.64% due 06/30/50 | | | 44,100,000 | | | | 44,093,083 | |
Aflac, Inc. | | | | | | | | |
3.60% due 04/01/30 | | | 40,160,000 | | | | 43,900,616 | |
UBS Group AG | | | | | | | | |
2.10% due 02/11/323,6 | | | 43,400,000 | | | | 41,030,505 | |
Jefferies Group LLC | | | | | | | | |
2.75% due 10/15/32 | | | 40,440,000 | | | | 39,513,302 | |
6.50% due 01/20/43 | | | 720,000 | | | | 918,014 | |
Belrose Funding Trust | | | | | | | | |
2.33% due 08/15/306 | | | 41,850,000 | | | | 40,277,069 | |
SBA Communications Corp. | | | | | | | | |
3.13% due 02/01/296 | | | 35,500,000 | | | | 34,120,825 | |
3.88% due 02/15/27 | | | 5,425,000 | | | | 5,545,435 | |
Massachusetts Mutual Life Insurance Co. | | | | | | | | |
3.38% due 04/15/506 | | | 37,950,000 | | | | 37,000,629 | |
Everest Reinsurance Holdings, Inc. | | | | | | | | |
3.50% due 10/15/50 | | | 37,760,000 | | | | 36,313,170 | |
Cushman & Wakefield US Borrower LLC | | | | | | | | |
6.75% due 05/15/286 | | | 32,700,000 | | | | 35,356,875 | |
KKR Group Finance Company VIII LLC | | | | | | | | |
3.50% due 08/25/506 | | | 34,760,000 | | | | 34,308,762 | |
Hunt Companies, Inc. | | | | | | | | |
5.25% due 04/15/296 | | | 31,500,000 | | | | 31,500,000 | |
PricewaterhouseCoopers LLP | | | | | | | | |
3.43% due 09/13/30††† | | | 31,500,000 | | | | 31,361,302 | |
Loews Corp. | | | | | | | | |
3.20% due 05/15/30 | | | 29,538,000 | | | | 31,220,077 | |
KKR Group Finance Company VI LLC | | | | | | | | |
3.75% due 07/01/296 | | | 26,978,000 | | | | 29,798,361 | |
Manulife Financial Corp. | | | | | | | | |
2.48% due 05/19/27 | | | 27,800,000 | | | | 28,814,398 | |
Fifth Third Bancorp | | | | | | | | |
2.55% due 05/05/27 | | | 27,190,000 | | | | 28,271,344 | |
AmFam Holdings, Inc. | | | | | | | | |
2.81% due 03/11/316 | | | 27,550,000 | | | | 27,311,870 | |
Dyal Capital Partners III | | | | | | | | |
4.40% due 06/15/40††† | | | 26,750,000 | | | | 27,027,611 | |
Goldman Sachs Group, Inc. | | | | | | | | |
3.50% due 04/01/25 | | | 22,500,000 | | | | 24,368,133 | |
0.57% (U.S. Secured Overnight Financing Rate + 0.54%, Rate Floor: 0.00%) due 11/17/235 | | | 1,660,000 | | | | 1,658,246 | |
Credit Suisse Group AG | | | | | | | | |
4.19% due 04/01/313,6 | | | 23,500,000 | | | | 25,546,689 | |
Pershing Square Holdings Ltd. | | | | | | | | |
5.50% due 07/15/226 | | | 21,300,000 | | | | 22,343,361 | |
Central Storage Safety Project Trust | | | | | | | | |
4.82% due 02/01/387 | | | 20,500,000 | | | | 21,805,814 | |
Kennedy-Wilson, Inc. | | | | | | | | |
4.75% due 03/01/29 | | | 21,400,000 | | | | 21,667,500 | |
Kemper Corp. | | | | | | | | |
2.40% due 09/30/30 | | | 22,380,000 | | | | 21,484,022 | |
Allianz SE | | | | | | | | |
3.50%3,4,6 | | | 20,850,000 | | | | 21,162,750 | |
SEE NOTES TO FINANCIAL STATEMENTS. | THE GUGGENHEIM FUNDS SEMI-ANNUAL REPORT | 15 |
SCHEDULE OF INVESTMENTS (Unaudited)(continued) | March 31, 2021 |
TOTAL RETURN BOND FUND | |
| | Face
Amount~ | | | Value | |
National Australia Bank Ltd. | | | | | | | | |
2.33% due 08/21/306 | | | 22,400,000 | | | $ | 21,144,240 | |
Raymond James Financial, Inc. | | | | | | | | |
3.75% due 04/01/51 | | | 20,300,000 | | | | 20,947,884 | |
Alexandria Real Estate Equities, Inc. | | | | | | | | |
4.90% due 12/15/30 | | | 17,450,000 | | | | 20,598,972 | |
Prudential Financial, Inc. | | | | | | | | |
3.70% due 10/01/503 | | | 17,050,000 | | | | 17,240,960 | |
CNA Financial Corp. | | | | | | | | |
2.05% due 08/15/30 | | | 18,150,000 | | | | 17,239,037 | |
QBE Insurance Group Ltd. | | | | | | | | |
5.88%3,4,6 | | | 15,700,000 | | | | 16,897,125 | |
Australia & New Zealand Banking Group Ltd. | | | | | | | | |
2.57% due 11/25/353,6 | | | 17,400,000 | | | | 16,340,340 | |
Kuvare US Holdings, Inc. | | | | | | | | |
7.00% due 02/17/513,6 | | | 15,650,000 | | | | 15,966,227 | |
Weyerhaeuser Co. | | | | | | | | |
4.00% due 04/15/30 | | | 14,424,000 | | | | 15,933,493 | |
Westpac Banking Corp. | | | | | | | | |
2.96% due 11/16/40 | | | 16,600,000 | | | | 15,403,622 | |
CIT Group, Inc. | | | | | | | | |
3.93% due 06/19/243 | | | 13,925,000 | | | | 14,725,688 | |
PartnerRe Finance B LLC | | | | | | | | |
4.50% due 10/01/503 | | | 13,970,000 | | | | 14,235,334 | |
Apollo Management Holdings, LP | | | | | | | | |
2.65% due 06/05/306 | | | 14,407,000 | | | | 14,146,561 | |
Visa, Inc. | | | | | | | | |
2.00% due 08/15/50 | | | 17,383,000 | | | | 14,024,760 | |
W R Berkley Corp. | | | | | | | | |
4.00% due 05/12/50 | | | 13,105,000 | | | | 13,891,640 | |
4.63% due 03/15/22 | | | 70,000 | | | | 72,789 | |
CNO Financial Group, Inc. | | | | | | | | |
5.25% due 05/30/29 | | | 10,850,000 | | | | 12,496,460 | |
Nasdaq, Inc. | | | | | | | | |
3.25% due 04/28/50 | | | 13,150,000 | | | | 12,322,216 | |
Protective Life Corp. | | | | | | | | |
3.40% due 01/15/306 | | | 11,440,000 | | | | 11,888,373 | |
Brown & Brown, Inc. | | | | | | | | |
2.38% due 03/15/31 | | | 11,960,000 | | | | 11,489,591 | |
Ameriprise Financial, Inc. | | | | | | | | |
3.00% due 04/02/25 | | | 10,740,000 | | | | 11,422,731 | |
Aviation Capital Group LLC | | | | | | | | |
2.88% due 01/20/226 | | | 10,691,000 | | | | 10,845,761 | |
New York Life Insurance Co. | | | | | | | | |
3.75% due 05/15/506 | | | 9,300,000 | | | | 9,760,837 | |
Fidelity & Guaranty Life Holdings, Inc. | | | | | | | | |
5.50% due 05/01/256 | | | 8,050,000 | | | | 9,198,252 | |
American Equity Investment Life Holding Co. | | | | | | | | |
5.00% due 06/15/27 | | | 8,074,000 | | | | 8,967,093 | |
Camden Property Trust | | | | | | | | |
2.80% due 05/15/30 | | | 7,861,000 | | | | 8,058,335 | |
Alliant Holdings Intermediate LLC / Alliant Holdings Company-Issuer | | | | | | | | |
4.25% due 10/15/276 | | | 7,975,000 | | | | 8,047,572 | |
Hanover Insurance Group, Inc. | | | | | | | | |
2.50% due 09/01/30 | | | 7,070,000 | | | | 6,908,151 | |
NFL Trust XI SPV | | | | | | | | |
3.53% due 10/05/35††† | | | 7,000,000 | | | | 6,793,627 | |
Brookfield Finance LLC | | | | | | | | |
3.45% due 04/15/50 | | | 6,820,000 | | | | 6,435,423 | |
HS Wildcat LLC | | | | | | | | |
3.83% due 12/31/50††† | | | 5,000,000 | | | | 4,696,177 | |
16 | THE GUGGENHEIM FUNDS SEMI-ANNUAL REPORT | SEE NOTES TO FINANCIAL STATEMENTS. |
SCHEDULE OF INVESTMENTS (Unaudited)(continued) | March 31, 2021 |
TOTAL RETURN BOND FUND | |
| | Face
Amount~ | | | Value | |
KKR Group Finance Company III LLC | | | | | | | | |
5.13% due 06/01/446 | | | 2,710,000 | | | $ | 3,294,762 | |
Atlas Mara Ltd. | | | | | | | | |
8.00% due 03/20/21†††,7 | | | 6,600,000 | | | | 3,199,680 | |
Fort Knox Military Housing Privatization Project | | | | | | | | |
5.82% due 02/15/526 | | | 1,891,027 | | | | 2,088,436 | |
0.45% (1 Month USD LIBOR + 0.34%) due 02/15/525,6 | | | 1,696,802 | | | | 1,019,912 | |
New York Life Global Funding | | | | | | | | |
0.24% (U.S. Secured Overnight Financing Rate + 0.22%) due 02/02/235,6 | | | 2,070,000 | | | | 2,068,570 | |
Western Group Housing, LP | | | | | | | | |
6.75% due 03/15/576 | | | 1,484,948 | | | | 1,968,914 | |
Assurant, Inc. | | | | | | | | |
6.75% due 02/15/34 | | | 1,450,000 | | | | 1,758,031 | |
Transatlantic Holdings, Inc. | | | | | | | | |
8.00% due 11/30/39 | | | 1,135,000 | | | | 1,674,551 | |
Societe Generale S.A. | | | | | | | | |
1.49% due 12/14/263,6 | | | 1,650,000 | | | | 1,620,860 | |
BNP Paribas S.A. | | | | | | | | |
1.32% due 01/13/273,6 | | | 1,640,000 | | | | 1,603,193 | |
Macquarie Group Ltd. | | | | | | | | |
5.03% due 01/15/303,6 | | | 800,000 | | | | 924,376 | |
1.34% due 01/12/273,6 | | | 570,000 | | | | 559,046 | |
ING Groep N.V. | | | | | | | | |
1.73% due 04/01/273 | | | 1,360,000 | | | | 1,358,050 | |
Mid-Atlantic Military Family Communities LLC | | | | | | | | |
5.24% due 08/01/506 | | | 1,104,970 | | | | 1,268,536 | |
Janus Capital Group, Inc. | | | | | | | | |
4.88% due 08/01/25 | | | 780,000 | | | | 880,448 | |
Atlantic Marine Corporations Communities LLC | | | | | | | | |
5.37% due 12/01/506 | | | 770,775 | | | | 806,503 | |
Univest Financial Corp. | | | | | | | | |
3.74% (3 Month USD LIBOR + 3.54%) due 03/30/255 | | | 805,000 | | | | 801,560 | |
Pacific Beacon LLC | | | | | | | | |
5.51% due 07/15/366 | | | 500,000 | | | | 573,577 | |
Peachtree Corners Funding Trust | | | | | | | | |
3.98% due 02/15/256 | | | 215,000 | | | | 235,129 | |
Sompo International Holdings Ltd. | | | | | | | | |
4.70% due 10/15/22 | | | 140,000 | | | | 148,316 | |
Total Financial | | | | | | | 4,572,088,037 | |
| | | | | | | | | |
Consumer, Non-cyclical - 7.8% |
Sysco Corp. | | | | | | | | |
5.95% due 04/01/30 | | | 109,590,000 | | | | 137,004,993 | |
6.60% due 04/01/40 | | | 1,440,000 | | | | 2,004,671 | |
Altria Group, Inc. | | | | | | | | |
3.70% due 02/04/51 | | | 67,650,000 | | | | 61,485,488 | |
3.40% due 05/06/30 | | | 47,320,000 | | | | 49,355,955 | |
2.35% due 05/06/25 | | | 18,290,000 | | | | 18,953,083 | |
4.45% due 05/06/50 | | | 6,120,000 | | | | 6,318,641 | |
5.95% due 02/14/49 | | | 1,300,000 | | | | 1,616,812 | |
CoStar Group, Inc. | | | | | | | | |
2.80% due 07/15/306 | | | 89,110,000 | | | | 87,059,788 | |
DaVita, Inc. | | | | | | | | |
4.63% due 06/01/306 | | | 47,150,000 | | | | 47,958,622 | |
3.75% due 02/15/316 | | | 38,095,000 | | | | 36,502,629 | |
Centene Corp. | | | | | | | | |
2.50% due 03/01/31 | | | 48,300,000 | | | | 46,005,750 | |
3.00% due 10/15/30 | | | 37,200,000 | | | | 37,138,248 | |
Constellation Brands, Inc. | | | | | | | | |
2.88% due 05/01/30 | | | 59,320,000 | | | | 60,569,675 | |
3.75% due 05/01/50 | | | 14,760,000 | | | | 15,314,021 | |
SEE NOTES TO FINANCIAL STATEMENTS. | THE GUGGENHEIM FUNDS SEMI-ANNUAL REPORT | 17 |
SCHEDULE OF INVESTMENTS (Unaudited)(continued) | March 31, 2021 |
TOTAL RETURN BOND FUND | |
| | Face
Amount~ | | | Value | |
Quanta Services, Inc. | | | | | | | | |
2.90% due 10/01/30 | | | 71,770,000 | | | $ | 72,778,798 | |
BAT Capital Corp. | | | | | | | | |
3.98% due 09/25/50 | | | 41,450,000 | | | | 38,814,763 | |
4.70% due 04/02/27 | | | 22,390,000 | | | | 25,190,681 | |
3.22% due 09/06/26 | | | 1,800,000 | | | | 1,900,239 | |
Zimmer Biomet Holdings, Inc. | | | | | | | | |
3.55% due 03/20/30 | | | 60,550,000 | | | | 64,690,852 | |
Kraft Heinz Foods Co. | | | | | | | | |
4.88% due 10/01/49 | | | 14,525,000 | | | | 16,246,273 | |
4.38% due 06/01/46 | | | 13,090,000 | | | | 13,647,621 | |
4.25% due 03/01/31 | | | 10,850,000 | | | | 11,948,956 | |
5.50% due 06/01/50 | | | 9,250,000 | | | | 11,360,505 | |
5.00% due 06/04/42 | | | 7,850,000 | | | | 8,813,644 | |
5.20% due 07/15/45 | | | 1,930,000 | | | | 2,226,584 | |
Royalty Pharma plc | | | | | | | | |
3.55% due 09/02/506 | | | 39,710,000 | | | | 37,724,154 | |
2.20% due 09/02/306 | | | 20,800,000 | | | | 19,834,360 | |
Alcon Finance Corp. | | | | | | | | |
2.60% due 05/27/306 | | | 50,650,000 | | | | 50,754,057 | |
RELX Capital, Inc. | | | | | | | | |
3.00% due 05/22/30 | | | 47,873,000 | | | | 49,616,998 | |
US Foods, Inc. | | | | | | | | |
6.25% due 04/15/256 | | | 24,050,000 | | | | 25,781,600 | |
4.75% due 02/15/296 | | | 18,750,000 | | | | 18,750,000 | |
Nielsen Finance LLC / Nielsen Finance Co. | | | | | | | | |
5.63% due 10/01/286 | | | 38,800,000 | | | | 40,788,500 | |
Keurig Dr Pepper, Inc. | | | | | | | | |
3.20% due 05/01/30 | | | 36,818,000 | | | | 38,931,368 | |
Anheuser-Busch InBev Worldwide, Inc. | | | | | | | | |
3.50% due 06/01/30 | | | 35,920,000 | | | | 38,813,122 | |
Post Holdings, Inc. | | | | | | | | |
4.50% due 09/15/316 | | | 23,850,000 | | | | 23,587,650 | |
4.63% due 04/15/306 | | | 9,025,000 | | | | 9,042,148 | |
Boston Scientific Corp. | | | | | | | | |
2.65% due 06/01/30 | | | 32,010,000 | | | | 32,258,661 | |
Becton Dickinson and Co. | | | | | | | | |
2.82% due 05/20/30 | | | 29,400,000 | | | | 30,118,648 | |
Emory University | | | | | | | | |
2.97% due 09/01/50 | | | 30,000,000 | | | | 29,583,911 | |
Yale-New Haven Health Services Corp. | | | | | | | | |
2.50% due 07/01/50 | | | 32,350,000 | | | | 28,188,505 | |
California Institute of Technology | | | | | | | | |
3.65% due 09/01/19 | | | 25,760,000 | | | | 25,964,499 | |
TriNet Group, Inc. | | | | | | | | |
3.50% due 03/01/296 | | | 26,450,000 | | | | 25,873,390 | |
University of Chicago | | | | | | | | |
3.00% due 10/01/52 | | | 18,500,000 | | | | 18,131,653 | |
2.76% due 04/01/45 | | | 8,000,000 | | | | 7,678,855 | |
Global Payments, Inc. | | | | | | | | |
2.90% due 05/15/30 | | | 24,810,000 | | | | 25,209,802 | |
Quest Diagnostics, Inc. | | | | | | | | |
2.80% due 06/30/31 | | | 23,530,000 | | | | 23,908,370 | |
CPI CG, Inc. | | | | | | | | |
8.63% due 03/15/266 | | | 22,500,000 | | | | 23,575,275 | |
Duke University | | | | | | | | |
2.83% due 10/01/55 | | | 23,400,000 | | | | 22,581,978 | |
Kimberly-Clark de Mexico SAB de CV | | | | | | | | |
2.43% due 07/01/316 | | | 22,650,000 | | | | 22,079,446 | |
Health Care Service Corporation A Mutual Legal Reserve Co. | | | | | | | | |
3.20% due 06/01/506 | | | 23,030,000 | | | | 21,717,904 | |
Universal Health Services, Inc. | | | | | | | | |
2.65% due 10/15/306 | | | 19,660,000 | | | | 18,982,025 | |
Transurban Finance Company Pty Ltd. | | | | | | | | |
2.45% due 03/16/316 | | | 19,400,000 | | | | 18,829,772 | |
Thermo Fisher Scientific, Inc. | | | | | | | | |
4.50% due 03/25/30 | | | 16,100,000 | | | | 18,731,878 | |
Hologic, Inc. | | | | | | | | |
3.25% due 02/15/296 | | | 18,850,000 | | | | 18,614,375 | |
AMN Healthcare, Inc. | | | | | | | | |
4.63% due 10/01/276 | | | 10,800,000 | | | | 11,043,000 | |
4.00% due 04/15/296 | | | 7,200,000 | | | | 7,164,000 | |
Cheplapharm Arzneimittel GmbH | | | | | | | | |
4.38% due 01/15/28 | | | EUR 13,750,000 | | | | 16,866,323 | |
18 | THE GUGGENHEIM FUNDS SEMI-ANNUAL REPORT | SEE NOTES TO FINANCIAL STATEMENTS. |
SCHEDULE OF INVESTMENTS (Unaudited)(continued) | March 31, 2021 |
TOTAL RETURN BOND FUND | |
| | Face
Amount~ | | | Value | |
Avantor Funding, Inc. | | | | | | | | |
4.63% due 07/15/286 | | | 15,900,000 | | | $ | 16,605,324 | |
Smithfield Foods, Inc. | | | | | | | | |
3.00% due 10/15/306 | | | 15,760,000 | | | | 15,673,162 | |
Sabre GLBL, Inc. | | | | | | | | |
7.38% due 09/01/256 | | | 12,825,000 | | | | 13,976,044 | |
Charles River Laboratories International, Inc. | | | | | | | | |
3.75% due 03/15/296 | | | 13,300,000 | | | | 13,321,014 | |
Spectrum Brands, Inc. | | | | | | | | |
3.88% due 03/15/316 | | | 13,475,000 | | | | 13,171,813 | |
Prime Security Services Borrower LLC / Prime Finance, Inc. | | | | | | | | |
3.38% due 08/31/276 | | | 13,450,000 | | | | 13,046,500 | |
Gartner, Inc. | | | | | | | | |
3.75% due 10/01/306 | | | 9,830,000 | | | | 9,731,700 | |
4.50% due 07/01/286 | | | 2,375,000 | | | | 2,449,219 | |
Moody’s Corp. | | | | | | | | |
3.25% due 05/20/50 | | | 11,180,000 | | | | 10,816,793 | |
4.50% due 09/01/22 | | | 720,000 | | | | 754,147 | |
Service Corporation International | | | | | | | | |
3.38% due 08/15/30 | | | 11,225,000 | | | | 10,956,161 | |
Central Garden & Pet Co. | | | | | | | | |
4.13% due 10/15/30 | | | 8,975,000 | | | | 9,064,750 | |
OhioHealth Corp. | | | | | | | | |
3.04% due 11/15/50 | | | 9,100,000 | | | | 8,998,731 | |
Johns Hopkins University | | | | | | | | |
2.81% due 01/01/60 | | | 8,750,000 | | | | 8,141,181 | |
Catalent Pharma Solutions, Inc. | | | | | | | | |
3.13% due 02/15/296 | | | 8,075,000 | | | | 7,752,000 | |
Tenet Healthcare Corp. | | | | | | | | |
4.63% due 06/15/286 | | | 7,156,000 | | | | 7,334,757 | |
Endo Luxembourg Finance Company I SARL / Endo US, Inc. | | | | | | | | |
6.13% due 04/01/296 | | | 7,150,000 | | | | 7,223,073 | |
Syneos Health, Inc. | | | | | | | | |
3.63% due 01/15/296 | | | 7,000,000 | | | | 6,807,500 | |
Children’s Hospital Corp. | | | | | | | | |
2.59% due 02/01/50 | | | 7,100,000 | | | | 6,370,674 | |
Kronos Acquisition Holdings, Inc. / KIK Custom Products, Inc. | | | | | | | | |
5.00% due 12/31/266 | | | 6,325,000 | | | | 6,325,000 | |
Jaguar Holding Company II / PPD Development, LP | | | | | | | | |
4.63% due 06/15/256 | | | 4,596,000 | | | | 4,779,840 | |
5.00% due 06/15/286 | | | 1,300,000 | | | | 1,353,950 | |
Children’s Health System of Texas | | | | | | | | |
2.51% due 08/15/50 | | | 6,500,000 | | | | 5,697,974 | |
Wisconsin Alumni Research Foundation | | | | | | | | |
3.56% due 10/01/49 | | | 3,775,000 | | | | 3,822,837 | |
Memorial Sloan-Kettering Cancer Center | | | | | | | | |
2.96% due 01/01/50 | | | 3,500,000 | | | | 3,341,341 | |
California Endowment | | | | | | | | |
2.50% due 04/01/51 | | | 3,100,000 | | | | 2,841,745 | |
Lamb Weston Holdings, Inc. | | | | | | | | |
4.88% due 11/01/266 | | | 2,100,000 | | | | 2,173,500 | |
Molina Healthcare, Inc. | | | | | | | | |
4.38% due 06/15/286 | | | 2,000,000 | | | | 2,057,920 | |
McKesson Corp. | | | | | | | | |
4.88% due 03/15/44 | | | 1,650,000 | | | | 1,942,009 | |
Sotheby’s | | | | | | | | |
7.38% due 10/15/276 | | | 1,784,000 | | | | 1,929,146 | |
Acadia Healthcare Company, Inc. | | | | | | | | |
5.00% due 04/15/296 | | | 1,800,000 | | | | 1,867,896 | |
HCA, Inc. | | | | | | | | |
3.50% due 09/01/30 | | | 1,600,000 | | | | 1,618,472 | |
Cardinal Health, Inc. | | | | | | | | |
4.50% due 11/15/44 | | | 1,450,000 | | | | 1,558,045 | |
Mondelez International Holdings Netherlands BV | | | | | | | | |
2.13% due 09/19/226 | | | 1,440,000 | | | | 1,475,401 | |
SEE NOTES TO FINANCIAL STATEMENTS. | THE GUGGENHEIM FUNDS SEMI-ANNUAL REPORT | 19 |
SCHEDULE OF INVESTMENTS (Unaudited)(continued) | March 31, 2021 |
TOTAL RETURN BOND FUND | |
| | Face
Amount~ | | | Value | |
Trustees of the University of Pennsylvania | | | | | | | | |
4.01% due 08/15/47 | | | 1,250,000 | | | $ | 1,425,800 | |
AmerisourceBergen Corp. | | | | | | | | |
0.74% due 03/15/23 | | | 810,000 | | | | 810,679 | |
Verisk Analytics, Inc. | | | | | | | | |
4.13% due 09/12/22 | | | 696,000 | | | | 729,787 | |
Flowers Foods, Inc. | | | | | | | | |
3.50% due 10/01/26 | | | 500,000 | | | | 541,460 | |
Total Consumer, Non-cyclical | | | 1,904,120,864 | |
| | | | | | | | | |
Industrial - 6.4% | | | | | | | | |
Boeing Co. | | | | | | | | |
5.15% due 05/01/30 | | | 125,140,000 | | | | 143,927,219 | |
5.71% due 05/01/40 | | | 68,110,000 | | | | 83,171,672 | |
5.81% due 05/01/50 | | | 53,550,000 | | | | 67,526,949 | |
5.04% due 05/01/27 | | | 33,850,000 | | | | 38,572,005 | |
3.63% due 02/01/31 | | | 21,400,000 | | | | 22,372,632 | |
1.17% due 02/04/23 | | | 1,650,000 | | | | 1,658,361 | |
FedEx Corp. | | | | | | | | |
4.25% due 05/15/30 | | | 74,049,000 | | | | 84,026,337 | |
3.80% due 05/15/25 | | | 11,750,000 | | | | 12,909,871 | |
WRKCo, Inc. | | | | | | | | |
3.00% due 06/15/33 | | | 82,155,000 | | | | 83,163,969 | |
Sonoco Products Co. | | | | | | | | |
3.13% due 05/01/30 | | | 73,763,000 | | | | 76,118,228 | |
Textron, Inc. | | | | | | | | |
2.45% due 03/15/31 | | | 52,250,000 | | | | 50,560,050 | |
3.00% due 06/01/30 | | | 23,395,000 | | | | 23,746,466 | |
FLNG Liquefaction 3 LLC | | | | | | | | |
3.08% due 06/30/39††† | | | 70,450,000 | | | | 67,561,309 | |
Snap-on, Inc. | | | | | | | | |
3.10% due 05/01/50 | | | 59,779,000 | | | | 59,517,420 | |
Vontier Corp. | | | | | | | | |
2.95% due 04/01/316 | | | 33,850,000 | | | | 33,024,060 | |
2.40% due 04/01/286 | | | 20,100,000 | | | | 19,748,049 | |
BAE Systems plc | | | | | | | | |
3.40% due 04/15/306 | | | 42,797,000 | | | | 45,396,516 | |
Acuity Brands Lighting, Inc. | | | | | | | | |
2.15% due 12/15/30 | | | 44,050,000 | | | | 41,678,901 | |
Owens Corning | | | | | | | | |
3.88% due 06/01/30 | | | 36,890,000 | | | | 40,198,830 | |
Dyal Capital Partners IV | | | | | | | | |
3.65% due 02/22/41††† | | | 41,800,000 | | | | 39,823,031 | |
Standard Industries, Inc. | | | | | | | | |
4.38% due 07/15/306 | | | 13,600,000 | | | | 13,722,400 | |
3.38% due 01/15/316 | | | 14,475,000 | | | | 13,715,063 | |
5.00% due 02/15/276 | | | 7,300,000 | | | | 7,610,250 | |
Carrier Global Corp. | | | | | | | | |
2.70% due 02/15/31 | | | 33,600,000 | | | | 33,564,167 | |
Ardagh Packaging Finance plc / Ardagh Holdings USA, Inc. | | | | | | | | |
4.13% due 08/15/266 | | | 31,850,000 | | | | 32,695,617 | |
GATX Corp. | | | | | | | | |
4.00% due 06/30/30 | | | 28,835,000 | | | | 31,734,442 | |
4.70% due 04/01/29 | | | 400,000 | | | | 459,906 | |
CNH Industrial Capital LLC | | | | | | | | |
1.88% due 01/15/26 | | | 27,960,000 | | | | 28,291,396 | |
Flowserve Corp. | | | | | | | | |
3.50% due 10/01/30 | | | 27,340,000 | | | | 27,799,773 | |
Ball Corp. | | | | | | | | |
2.88% due 08/15/30 | | | 28,585,000 | | | | 27,534,501 | |
Vulcan Materials Co. | | | | | | | | |
3.50% due 06/01/30 | | | 23,400,000 | | | | 25,073,484 | |
Ryder System, Inc. | | | | | | | | |
3.35% due 09/01/25 | | | 22,380,000 | | | | 24,161,071 | |
IDEX Corp. | | | | | | | | |
3.00% due 05/01/30 | | | 22,300,000 | | | | 22,969,715 | |
NFL Ventures, LP | | | | | | | | |
3.02% due 04/15/35††† | | | 20,000,000 | | | | 19,938,621 | |
FLIR Systems, Inc. | | | | | | | | |
2.50% due 08/01/30 | | | 19,920,000 | | | | 19,487,960 | |
Amcor Flexibles North America, Inc. | | | | | | | | |
2.63% due 06/19/30 | | | 18,580,000 | | | | 18,453,191 | |
20 | THE GUGGENHEIM FUNDS SEMI-ANNUAL REPORT | SEE NOTES TO FINANCIAL STATEMENTS. |
SCHEDULE OF INVESTMENTS (Unaudited)(continued) | March 31, 2021 |
TOTAL RETURN BOND FUND | |
| | Face
Amount~ | | | Value | |
Boxer Parent Co., Inc. | | | | | | | | |
6.50% due 10/02/25 | | EUR | 13,500,000 | | | $ | 16,846,506 | |
Graphic Packaging International LLC | | | | | | | | |
3.50% due 03/01/296 | | | 16,750,000 | | | | 16,289,375 | |
Howmet Aerospace, Inc. | | | | | | | | |
6.88% due 05/01/25 | | | 7,083,000 | | | | 8,207,426 | |
5.90% due 02/01/27 | | | 3,950,000 | | | | 4,483,250 | |
6.75% due 01/15/28 | | | 1,988,000 | | | | 2,345,840 | |
5.95% due 02/01/37 | | | 475,000 | | | | 574,299 | |
Vertical US Newco, Inc. | | | | | | | | |
5.25% due 07/15/276 | | | 14,157,000 | | | | 14,820,609 | |
TFI International, Inc. | | | | | | | | |
3.35% due 01/05/33††† | | | 14,000,000 | | | | 13,143,847 | |
Hardwood Funding LLC | | | | | | | | |
3.19% due 06/07/30††† | | | 8,000,000 | | | | 8,020,985 | |
2.83% due 06/07/31††† | | | 2,000,000 | | | | 1,937,081 | |
3.13% due 06/07/36††† | | | 1,000,000 | | | | 964,787 | |
National Basketball Association | | | | | | | | |
2.51% due 12/16/24††† | | | 10,500,000 | | | | 10,741,233 | |
Xylem, Inc. | | | | | | | | |
2.25% due 01/30/31 | | | 10,000,000 | | | | 9,804,423 | |
Airbus SE | | | | | | | | |
3.95% due 04/10/476 | | | 9,000,000 | | | | 9,501,632 | |
PowerTeam Services LLC | | | | | | | | |
9.03% due 12/04/256 | | | 8,490,000 | | | | 9,426,447 | |
Hillenbrand, Inc. | | | | | | | | |
3.75% due 03/01/31 | | | 7,650,000 | | | | 7,489,656 | |
Virgin Media | | | | | | | | |
4.88% due 07/15/28 | | GBP | 5,000,000 | | | | 7,097,434 | |
Great Lakes Dredge & Dock Corp. | | | | | | | | |
8.00% due 05/15/22 | | | 6,800,000 | | | | 6,859,500 | |
American Woodmark Corp. | | | | | | | | |
4.88% due 03/15/266 | | | 4,599,000 | | | | 4,716,274 | |
Oshkosh Corp. | | | | | | | | |
3.10% due 03/01/30 | | | 3,880,000 | | | | 3,991,949 | |
Ardagh Metal Packaging Finance USA LLC / Ardagh Metal Packaging Finance plc | | | | | | | | |
4.00% due 09/01/296 | | | 3,750,000 | | | | 3,740,625 | |
Berry Global, Inc. | | | | | | | | |
1.57% due 01/15/266 | | | 2,750,000 | | | | 2,707,485 | |
Princess Juliana International Airport Operating Company N.V. | | | | | | | | |
5.50% due 12/20/277 | | | 1,791,970 | | | | 1,604,154 | |
Adevinta ASA | | | | | | | | |
3.00% due 11/15/27 | | EUR | 1,300,000 | | | | 1,576,951 | |
Burlington Northern Santa Fe LLC | | | | | | | | |
5.40% due 06/01/41 | | | 1,180,000 | | | | 1,524,582 | |
New Enterprise Stone & Lime Company, Inc. | | | | | | | | |
6.25% due 03/15/266 | | | 1,350,000 | | | | 1,383,750 | |
Crown Americas LLC / Crown Americas Capital Corporation VI | | | | | | | | |
4.75% due 02/01/26 | | | 1,150,000 | | | | 1,192,550 | |
TransDigm, Inc. | | | | | | | | |
6.25% due 03/15/266 | | | 1,075,000 | | | | 1,139,393 | |
Tennant Co. | | | | | | | | |
5.63% due 05/01/25 | | | 975,000 | | | | 1,004,250 | |
JELD-WEN, Inc. | | | | | | | | |
6.25% due 05/15/256 | | | 300,000 | | | | 318,750 | |
Hexcel Corp. | | | | | | | | |
4.20% due 02/15/27 | | | 180,000 | | | | 188,572 | |
Hillman Group, Inc. | | | | | | | | |
6.38% due 07/15/226 | | | 40,000 | | | | 40,050 | |
Total Industrial | | | | | | | 1,555,597,097 | |
| | | | | | | | | |
SEE NOTES TO FINANCIAL STATEMENTS. | THE GUGGENHEIM FUNDS SEMI-ANNUAL REPORT | 21 |
SCHEDULE OF INVESTMENTS (Unaudited)(continued) | March 31, 2021 |
TOTAL RETURN BOND FUND | |
| | Face
Amount~ | | | Value | |
Consumer, Cyclical - 4.9% | | | | |
Marriott International, Inc. | | | | | | | | |
4.63% due 06/15/30 | | | 43,685,000 | | | $ | 48,837,933 | |
3.50% due 10/15/32 | | | 45,690,000 | | | | 47,203,946 | |
2.85% due 04/15/31 | | | 43,490,000 | | | | 42,736,503 | |
5.75% due 05/01/25 | | | 29,691,000 | | | | 34,058,302 | |
Delta Air Lines, Inc. | | | | | | | | |
7.00% due 05/01/256 | | | 136,400,000 | | | | 157,072,363 | |
Walgreens Boots Alliance, Inc. | | | | | | | | |
4.10% due 04/15/50 | | | 72,535,000 | | | | 73,307,710 | |
3.20% due 04/15/30 | | | 33,931,000 | | | | 35,211,796 | |
4.65% due 06/01/46 | | | 1,490,000 | | | | 1,588,360 | |
Hyatt Hotels Corp. | | | | | | | | |
5.38% due 04/23/25 | | | 26,900,000 | | | | 30,153,499 | |
5.75% due 04/23/30 | | | 24,745,000 | | | | 28,884,406 | |
VF Corp. | | | | | | | | |
2.95% due 04/23/30 | | | 52,243,000 | | | | 54,069,917 | |
Hilton Domestic Operating Company, Inc. | | | | | | | | |
3.75% due 05/01/296 | | | 44,400,000 | | | | 43,956,000 | |
4.00% due 05/01/316 | | | 5,750,000 | | | | 5,750,000 | |
3.63% due 02/15/326 | | | 1,900,000 | | | | 1,844,140 | |
5.38% due 05/01/256 | | | 1,744,000 | | | | 1,838,176 | |
Choice Hotels International, Inc. | | | | | | | | |
3.70% due 01/15/31 | | | 45,900,000 | | | | 48,261,096 | |
Delta Air Lines Inc. / SkyMiles IP Ltd. | | | | | | | | |
4.50% due 10/20/256 | | | 45,200,000 | | | | 48,131,524 | |
1011778 BC ULC / New Red Finance, Inc. | | | | | | | | |
4.00% due 10/15/306 | | | 39,300,000 | | | | 37,924,500 | |
3.88% due 01/15/286 | | | 9,200,000 | | | | 9,298,808 | |
Ferguson Finance plc | | | | | | | | |
3.25% due 06/02/306 | | | 41,430,000 | | | | 43,583,125 | |
Mileage Plus Holdings LLC / Mileage Plus Intellectual Property Assets Ltd. | | | | | | | | |
6.50% due 06/20/276 | | | 38,950,000 | | | | 42,650,250 | |
BorgWarner, Inc. | | | | | | | | |
2.65% due 07/01/27 | | | 34,970,000 | | | | 36,291,066 | |
WMG Acquisition Corp. | | | | | | | | |
3.00% due 02/15/316 | | | 28,050,000 | | | | 26,655,915 | |
3.88% due 07/15/306 | | | 7,560,000 | | | | 7,632,916 | |
Lowe’s Companies, Inc. | | | | | | | | |
4.50% due 04/15/30 | | | 29,315,000 | | | | 33,792,488 | |
Whirlpool Corp. | | | | | | | | |
4.60% due 05/15/50 | | | 21,920,000 | | | | 25,127,637 | |
Aramark Services, Inc. | | | | | | | | |
6.38% due 05/01/256 | | | 21,850,000 | | | | 23,161,000 | |
5.00% due 02/01/286 | | | 1,525,000 | | | | 1,582,569 | |
Starbucks Corp. | | | | | | | | |
2.55% due 11/15/30 | | | 19,416,000 | | | | 19,440,138 | |
American Airlines Class AA Pass Through Trust | | | | | | | | |
3.35% due 10/15/29 | | | 9,498,668 | | | | 9,587,854 | |
3.20% due 06/15/28 | | | 5,504,600 | | | | 5,479,802 | |
3.00% due 10/15/28 | | | 4,261,325 | | | | 4,293,739 | |
Yum! Brands, Inc. | | | | | | | | |
4.63% due 01/31/32 | | | 18,250,000 | | | | 18,645,386 | |
Scotts Miracle-Gro Co. | | | | | | | | |
4.00% due 04/01/316 | | | 18,750,000 | | | | 18,487,500 | |
Tempur Sealy International, Inc. | | | | | | | | |
4.00% due 04/15/296 | | | 14,400,000 | | | | 14,328,000 | |
5.50% due 06/15/26 | | | 3,600,000 | | | | 3,758,400 | |
Allison Transmission, Inc. | | | | | | | | |
3.75% due 01/30/316 | | | 12,500,000 | | | | 12,109,375 | |
Dollar General Corp. | | | | | | | | |
3.50% due 04/03/30 | | | 10,650,000 | | | | 11,461,324 | |
Levi Strauss & Co. | | | | | | | | |
3.50% due 03/01/316 | | | 11,100,000 | | | | 10,711,500 | |
Cedar Fair, LP / Canada’s Wonderland Co. / Magnum Management Corp. / Millennium Operations LLC | | | | | | | | |
5.50% due 05/01/256 | | | 9,900,000 | | | | 10,403,910 | |
British Airways Class A Pass Through Trust | | | | | | | | |
4.25% due 11/15/326 | | | 9,614,573 | | | | 10,068,065 | |
22 | THE GUGGENHEIM FUNDS SEMI-ANNUAL REPORT | SEE NOTES TO FINANCIAL STATEMENTS. |
SCHEDULE OF INVESTMENTS (Unaudited)(continued) | March 31, 2021 |
TOTAL RETURN BOND FUND | |
| | Face
Amount~ | | | Value | |
Williams Scotsman International, Inc. | | | | | | | | |
4.63% due 08/15/286 | | | 6,775,000 | | | $ | 6,893,562 | |
Six Flags Theme Parks, Inc. | | | | | | | | |
7.00% due 07/01/256 | | | 5,990,000 | | | | 6,482,498 | |
Hanesbrands, Inc. | | | | | | | | |
5.38% due 05/15/256 | | | 6,095,000 | | | | 6,449,272 | |
Smithsonian Institution | | | | | | | | |
2.65% due 09/01/39 | | | 5,000,000 | | | | 4,762,197 | |
PetSmart Incorporated / PetSmart Finance Corp. | | | | | | | | |
4.75% due 02/15/286 | | | 4,550,000 | | | | 4,662,886 | |
Performance Food Group, Inc. | | | | | | | | |
6.88% due 05/01/256 | | | 4,074,000 | | | | 4,348,995 | |
Delta Air Lines, Inc. / SkyMiles IP Ltd. | | | | | | | | |
4.75% due 10/20/286 | | | 3,800,000 | | | | 4,130,124 | |
JB Poindexter & Company, Inc. | | | | | | | | |
7.13% due 04/15/266 | | | 2,850,000 | | | | 3,010,313 | |
HP Communities LLC | | | | | | | | |
5.86% due 09/15/536 | | | 1,420,000 | | | | 1,661,450 | |
Lear Corp. | | | | | | | | |
4.25% due 05/15/29 | | | 1,450,000 | | | | 1,605,479 | |
Hasbro, Inc. | | | | | | | | |
3.90% due 11/19/29 | | | 1,480,000 | | | | 1,590,664 | |
JetBlue Class A Pass Through Trust | | | | | | | | |
4.00% due 11/15/32 | | | 150,000 | | | | 161,713 | |
Total Consumer, Cyclical | | | | | | | 1,185,140,091 | |
| | | | | | | | | |
Communications - 4.0% | | | | |
ViacomCBS, Inc. | | | | | | | | |
4.95% due 01/15/31 | | | 69,401,000 | | | | 82,035,610 | |
4.95% due 05/19/50 | | | 39,600,000 | | | | 46,285,911 | |
4.75% due 05/15/25 | | | 36,350,000 | | | | 41,095,221 | |
2.90% due 01/15/27 | | | 6,570,000 | | | | 6,897,593 | |
5.85% due 09/01/43 | | | 1,260,000 | | | | 1,616,034 | |
T-Mobile USA, Inc. | | | | | | | | |
3.88% due 04/15/306 | | | 65,805,000 | | | | 71,709,683 | |
3.50% due 04/15/31 | | | 28,000,000 | | | | 28,253,400 | |
2.63% due 04/15/26 | | | 13,850,000 | | | | 14,092,375 | |
2.88% due 02/15/31 | | | 7,250,000 | | | | 7,007,125 | |
Level 3 Financing, Inc. | | | | | | | | |
4.25% due 07/01/286 | | | 41,950,000 | | | | 42,424,455 | |
3.63% due 01/15/296 | | | 36,820,000 | | | | 35,669,375 | |
3.88% due 11/15/296 | | | 20,300,000 | | | | 21,391,125 | |
3.75% due 07/15/296 | | | 13,950,000 | | | | 13,652,167 | |
Charter Communications Operating LLC / Charter Communications Operating Capital | | | | | | | | |
2.80% due 04/01/31 | | | 71,850,000 | | | | 71,037,626 | |
3.90% due 06/01/52 | | | 21,650,000 | | | | 20,732,345 | |
3.85% due 04/01/61 | | | 1,000,000 | | | | 902,497 | |
AT&T, Inc. | | | | | | | | |
2.75% due 06/01/31 | | | 48,660,000 | | | | 48,422,161 | |
2.30% due 06/01/27 | | | 6,000,000 | | | | 6,128,746 | |
Booking Holdings, Inc. | | | | | | | | |
4.63% due 04/13/30 | | | 30,557,000 | | | | 35,571,195 | |
4.50% due 04/13/27 | | | 11,700,000 | | | | 13,569,003 | |
Virgin Media Secured Finance plc | | | | | | | | |
4.50% due 08/15/306 | | | 35,400,000 | | | | 35,709,750 | |
5.50% due 08/15/266 | | | 1,200,000 | | | | 1,245,126 | |
Walt Disney Co. | | | | | | | | |
3.80% due 05/13/60 | | | 31,990,000 | | | | 35,080,201 | |
CSC Holdings LLC | | | | | | | | |
3.38% due 02/15/316 | | | 14,175,000 | | | | 13,359,937 | |
5.50% due 05/15/266 | | | 6,861,000 | | | | 7,073,691 | |
4.13% due 12/01/306 | | | 5,741,000 | | | | 5,702,420 | |
6.75% due 11/15/21 | | | 1,800,000 | | | | 1,847,250 | |
CCO Holdings LLC / CCO Holdings Capital Corp. | | | | | | | | |
4.50% due 05/01/326 | | | 18,275,000 | | | | 18,503,437 | |
4.25% due 02/01/316 | | | 9,025,000 | | | | 9,045,036 | |
LCPR Senior Secured Financing DAC | | | | | | | | |
5.13% due 07/15/296 | | | 17,900,000 | | | | 18,215,398 | |
6.75% due 10/15/276 | | | 5,633,000 | | | | 6,005,623 | |
Sirius XM Radio, Inc. | | | | | | | | |
4.13% due 07/01/306 | | | 21,910,000 | | | | 21,935,196 | |
SEE NOTES TO FINANCIAL STATEMENTS. | THE GUGGENHEIM FUNDS SEMI-ANNUAL REPORT | 23 |
SCHEDULE OF INVESTMENTS (Unaudited)(continued) | March 31, 2021 |
TOTAL RETURN BOND FUND | |
| | Face
Amount~ | | | Value | |
5.38% due 07/15/266 | | | 1,625,000 | | | $ | 1,677,812 | |
Fox Corp. | | | | | | | | |
3.50% due 04/08/30 | | | 14,521,000 | | | | 15,438,462 | |
3.05% due 04/07/25 | | | 7,100,000 | | | | 7,548,971 | |
Amazon.com, Inc. | | | | | | | | |
2.70% due 06/03/60 | | | 25,180,000 | | | | 22,244,460 | |
Altice France S.A. | | | | | | | | |
7.38% due 05/01/266 | | | 14,800,000 | | | | 15,392,000 | |
5.13% due 01/15/296 | | | 6,350,000 | | | | 6,429,375 | |
Go Daddy Operating Company LLC / GD Finance Co., Inc. | | | | | | | | |
3.50% due 03/01/296 | | | 22,100,000 | | | | 21,750,820 | |
Radiate Holdco LLC / Radiate Finance, Inc. | | | | | | | | |
4.50% due 09/15/266 | | | 19,750,000 | | | | 19,972,187 | |
Verizon Communications, Inc. | | | | | | | | |
3.15% due 03/22/30 | | | 16,590,000 | | | | 17,482,964 | |
Qualitytech, LP / QTS Finance Corp. | | | | | | | | |
3.88% due 10/01/286 | | | 17,075,000 | | | | 16,989,625 | |
Virgin Media Vendor Financing Notes IV DAC | | | | | | | | |
5.00% due 07/15/286 | | | 15,600,000 | | | | 15,890,628 | |
Lamar Media Corp. | | | | | | | | |
3.63% due 01/15/316 | | | 10,600,000 | | | | 10,176,106 | |
4.00% due 02/15/30 | | | 5,375,000 | | | | 5,360,058 | |
Ziggo BV | | | | | | | | |
4.88% due 01/15/306 | | | 10,125,000 | | | | 10,349,117 | |
Switch Ltd. | | | | | | | | |
3.75% due 09/15/286 | | | 4,200,000 | | | | 4,135,824 | |
Telenet Finance Lux Note | | | | | | | | |
5.50% due 03/01/28 | | | 2,800,000 | | | | 2,940,000 | |
Corning, Inc. | | | | | | | | |
4.38% due 11/15/57 | | | 2,500,000 | | | | 2,715,921 | |
Thomson Reuters Corp. | | | | | | | | |
5.65% due 11/23/43 | | | 1,290,000 | | | | 1,619,538 | |
Match Group Holdings II LLC | | | | | | | | |
4.13% due 08/01/306 | | | 1,250,000 | | | | 1,253,512 | |
Virgin Media Finance plc | | | | | | | | |
5.00% due 07/15/306 | | | 850,000 | | | | 848,938 | |
Motorola Solutions, Inc. | | | | | | | | |
5.50% due 09/01/44 | | | 360,000 | | | | 435,396 | |
Total Communications | | | | | | | 982,868,426 | |
| | | | | | | | | |
Energy - 2.3% | | | | | | | | |
Galaxy Pipeline Assets Bidco Ltd. | | | | | | | | |
3.25% due 09/30/406 | | | 91,750,000 | | | | 87,626,861 | |
2.94% due 09/30/406 | | | 58,850,000 | | | | 56,738,590 | |
1.75% due 09/30/276 | | | 2,050,000 | | | | 2,049,121 | |
BP Capital Markets plc | | | | | | | | |
4.88% 3,4 | | | 114,865,000 | | | | 123,049,131 | |
Sabine Pass Liquefaction LLC | | | | | | | | |
4.50% due 05/15/30 | | | 63,355,000 | | | | 71,050,446 | |
Occidental Petroleum Corp. | | | | | | | | |
3.00% due 02/15/27 | | | 13,280,000 | | | | 12,483,200 | |
5.55% due 03/15/26 | | | 5,940,000 | | | | 6,297,351 | |
4.30% due 08/15/39 | | | 6,600,000 | | | | 5,560,500 | |
3.40% due 04/15/26 | | | 5,000,000 | | | | 4,807,750 | |
4.10% due 02/15/47 | | | 4,900,000 | | | | 3,920,000 | |
3.20% due 08/15/26 | | | 2,375,000 | | | | 2,275,250 | |
4.40% due 08/15/49 | | | 2,500,000 | | | | 2,075,000 | |
4.40% due 04/15/46 | | | 1,400,000 | | | | 1,186,500 | |
4.63% due 06/15/45 | | | 800,000 | | | | 697,648 | |
Valero Energy Corp. | | | | | | | | |
2.15% due 09/15/27 | | | 13,920,000 | | | | 13,631,375 | |
2.85% due 04/15/25 | | | 12,000,000 | | | | 12,538,643 | |
4.00% due 04/01/29 | | | 7,450,000 | | | | 8,023,109 | |
7.50% due 04/15/32 | | | 1,180,000 | | | | 1,588,721 | |
Chevron USA, Inc. | | | | | | | | |
2.34% due 08/12/50 | | | 27,250,000 | | | | 22,572,126 | |
4.20% due 10/15/49 | | | 3,300,000 | | | | 3,746,878 | |
Magellan Midstream Partners, LP | | | | | | | | |
3.25% due 06/01/30 | | | 23,260,000 | | | | 24,334,205 | |
3.95% due 03/01/50 | | | 1,600,000 | | | | 1,571,559 | |
Equinor ASA | | | | | | | | |
2.38% due 05/22/30 | | | 18,770,000 | | | | 18,710,516 | |
1.75% due 01/22/26 | | | 6,500,000 | | | | 6,649,411 | |
24 | THE GUGGENHEIM FUNDS SEMI-ANNUAL REPORT | SEE NOTES TO FINANCIAL STATEMENTS. |
SCHEDULE OF INVESTMENTS (Unaudited)(continued) | March 31, 2021 |
TOTAL RETURN BOND FUND | |
| | Face
Amount~ | | | Value | |
NuStar Logistics, LP | | | | | | | | |
6.38% due 10/01/30 | | | 13,850,000 | | | $ | 14,958,000 | |
5.63% due 04/28/27 | | | 1,799,000 | | | | 1,881,925 | |
Florida Gas Transmission Company LLC | | | | | | | | |
2.55% due 07/01/306 | | | 15,100,000 | | | | 14,889,720 | |
Midwest Connector Capital Company LLC | | | | | | | | |
4.63% due 04/01/296 | | | 13,440,000 | | | | 13,620,778 | |
Baker Hughes a GE Company LLC / Baker Hughes Co-Obligor, Inc. | | | | | | | | |
4.49% due 05/01/308 | | | 6,300,000 | | | | 7,172,158 | |
Phillips 66 | | | | | | | | |
3.70% due 04/06/23 | | | 2,250,000 | | | | 2,383,920 | |
5.88% due 05/01/42 | | | 1,180,000 | | | | 1,514,333 | |
Parkland Corp. | | | | | | | | |
5.88% due 07/15/276 | | | 2,000,000 | | | | 2,132,500 | |
6.00% due 04/01/266 | | | 1,025,000 | | | | 1,071,945 | |
ONEOK Partners, LP | | | | | | | | |
6.20% due 09/15/43 | | | 680,000 | | | | 821,328 | |
3.38% due 10/01/22 | | | 720,000 | | | | 743,828 | |
TransCanada PipeLines Ltd. | | | | | | | | |
6.10% due 06/01/40 | | | 1,200,000 | | | | 1,553,882 | |
Total Energy | | | | | | | 555,928,208 | |
| | | | | | | | | |
Technology - 2.1% | | | | | | | | |
NetApp, Inc. | | | | | | | | |
2.70% due 06/22/30 | | | 123,550,000 | | | | 122,574,116 | |
Broadcom, Inc. | | | | | | | | |
4.15% due 11/15/30 | | | 60,860,000 | | | | 65,759,464 | |
2.45% due 02/15/316 | | | 57,120,000 | | | | 53,974,261 | |
2.60% due 02/15/336 | | | 1,660,000 | | | | 1,543,795 | |
MSCI, Inc. | | | | | | | | |
3.88% due 02/15/316 | | | 31,882,000 | | | | 32,577,028 | |
3.63% due 09/01/306 | | | 21,243,000 | | | | 21,600,944 | |
Leidos, Inc. | | | | | | | | |
2.30% due 02/15/316 | | | 34,450,000 | | | | 32,498,752 | |
3.63% due 05/15/256 | | | 9,200,000 | | | | 9,981,982 | |
4.38% due 05/15/306 | | | 2,650,000 | | | | 2,945,846 | |
Oracle Corp. | | | | | | | | |
3.95% due 03/25/51 | | | 38,750,000 | | | | 39,734,598 | |
NCR Corp. | | | | | | | | |
5.00% due 10/01/286 | | | 30,050,000 | | | | 30,350,500 | |
8.13% due 04/15/256 | | | 600,000 | | | | 657,750 | |
Qorvo, Inc. | | | | | | | | |
4.38% due 10/15/29 | | | 21,000,000 | | | | 22,417,710 | |
3.38% due 04/01/316 | | | 8,675,000 | | | | 8,500,546 | |
Apple, Inc. | | | | | | | | |
2.55% due 08/20/60 | | | 22,850,000 | | | | 19,581,214 | |
Crowdstrike Holdings, Inc. | | | | | | | | |
3.00% due 02/15/29 | | | 14,450,000 | | | | 14,127,765 | |
Twilio, Inc. | | | | | | | | |
3.63% due 03/15/29 | | | 13,200,000 | | | | 13,362,756 | |
Analog Devices, Inc. | | | | | | | | |
2.95% due 04/01/25 | | | 6,100,000 | | | | 6,480,429 | |
TeamSystem SpA | | | | | | | | |
3.50% due 02/15/28 | EUR | | 5,000,000 | | | | 5,842,695 | |
Black Knight InfoServ LLC | | | | | | | | |
3.63% due 09/01/286 | | | 5,600,000 | | | | 5,502,616 | |
Booz Allen Hamilton, Inc. | | | | | | | | |
3.88% due 09/01/286 | | | 4,550,000 | | | | 4,573,887 | |
Presidio Holdings, Inc. | | | | | | | | |
4.88% due 02/01/276 | | | 2,300,000 | | | | 2,357,546 | |
Microchip Technology, Inc. | | | | | | | | |
0.97% due 02/15/246 | | | 1,650,000 | | | | 1,646,809 | |
Citrix Systems, Inc. | | | | | | | | |
3.30% due 03/01/30 | | | 1,500,000 | | | | 1,541,769 | |
Entegris, Inc. | | | | | | | | |
4.38% due 04/15/286 | | | 900,000 | | | | 928,035 | |
HP, Inc. | | | | | | | | |
4.05% due 09/15/22 | | | 720,000 | | | | 755,602 | |
Open Text Holdings, Inc. | | | | | | | | |
4.13% due 02/15/306 | | | 210,000 | | | | 212,875 | |
Total Technology | | | | | | | 522,031,290 | |
| | | | | | | | | |
Basic Materials - 1.4% | | | | |
Newcrest Finance Pty Ltd. | | | | | | | | |
3.25% due 05/13/306 | | | 55,600,000 | | | | 58,138,521 | |
SEE NOTES TO FINANCIAL STATEMENTS. | THE GUGGENHEIM FUNDS SEMI-ANNUAL REPORT | 25 |
SCHEDULE OF INVESTMENTS (Unaudited)(continued) | March 31, 2021 |
TOTAL RETURN BOND FUND | |
| | Face
Amount~ | | | Value | |
4.20% due 05/13/506 | | | 26,390,000 | | | $ | 28,486,023 | |
Anglo American Capital plc | | | | | | | | |
5.63% due 04/01/306 | | | 39,500,000 | | | | 47,134,131 | |
2.63% due 09/10/306 | | | 18,000,000 | | | | 17,630,464 | |
3.95% due 09/10/506 | | | 14,140,000 | | | | 14,329,252 | |
2.25% due 03/17/286 | | | 1,010,000 | | | | 996,604 | |
Nucor Corp. | | | | | | | | |
2.70% due 06/01/30 | | | 45,300,000 | | | | 46,240,763 | |
2.00% due 06/01/25 | | | 5,000,000 | | | | 5,127,552 | |
Alcoa Nederland Holding BV | | | | | | | | |
4.13% due 03/31/296 | | | 13,400,000 | | | | 13,514,436 | |
5.50% due 12/15/276 | | | 6,525,000 | | | | 7,023,510 | |
6.13% due 05/15/286 | | | 2,800,000 | | | | 3,049,760 | |
6.75% due 09/30/246 | | | 400,000 | | | | 413,400 | |
Minerals Technologies, Inc. | | | | | | | | |
5.00% due 07/01/286 | | | 20,050,000 | | | | 20,676,563 | |
Valvoline, Inc. | | | | | | | | |
3.63% due 06/15/316 | | | 18,300,000 | | | | 17,705,250 | |
Steel Dynamics, Inc. | | | | | | | | |
3.25% due 01/15/31 | | | 7,620,000 | | | | 8,058,582 | |
2.40% due 06/15/25 | | | 5,950,000 | | | | 6,199,041 | |
Reliance Steel & Aluminum Co. | | | | | | | | |
2.15% due 08/15/30 | | | 12,040,000 | | | | 11,545,290 | |
Corporation Nacional del Cobre de Chile | | | | | | | | |
3.75% due 01/15/316 | | | 10,430,000 | | | | 11,250,737 | |
INEOS Quattro Finance 2 plc | | | | | | | | |
2.50% due 01/15/26 | EUR | | 8,500,000 | | | | 9,952,515 | |
Carpenter Technology Corp. | | | | | | | | |
6.38% due 07/15/28 | | | 2,415,000 | | | | 2,595,351 | |
Southern Copper Corp. | | | | | | | | |
7.50% due 07/27/35 | | | 1,150,000 | | | | 1,631,854 | |
Dow Chemical Co. | | | | | | | | |
4.25% due 10/01/34 | | | 1,420,000 | | | | 1,570,431 | |
International Paper Co. | | | | | | | | |
7.30% due 11/15/39 | | | 1,030,000 | �� | | | 1,535,864 | |
WR Grace & Company-Conn | | | | | | | | |
4.88% due 06/15/276 | | | 925,000 | | | | 957,560 | |
Sherwin-Williams Co. | | | | | | | | |
2.75% due 06/01/22 | | | 220,000 | | | | 224,920 | |
Total Basic Materials | | | | | | | 335,988,374 | |
| | | | | | | | | |
Utilities - 0.9% | | | | | | | | |
Cheniere Corpus Christi Holdings LLC | | | | | | | | |
3.52% due 12/31/39††† | | | 97,100,000 | | | | 92,422,118 | |
AES Corp. | | | | | | | | |
3.95% due 07/15/306 | | | 26,390,000 | | | | 28,137,810 | |
3.30% due 07/15/256 | | | 3,750,000 | | | | 3,978,225 | |
NRG Energy, Inc. | | | | | | | | |
2.45% due 12/02/276 | | | 26,000,000 | | | | 25,778,418 | |
Arizona Public Service Co. | | | | | | | | |
3.35% due 05/15/50 | | | 23,140,000 | | | | 22,857,959 | |
Alexander Funding Trust | | | | | | | | |
1.84% due 11/15/236 | | | 14,400,000 | | | | 14,619,742 | |
Clearway Energy Operating LLC | | | | | | | | |
3.75% due 02/15/316 | | | 11,150,000 | | | | 10,693,866 | |
4.75% due 03/15/286 | | | 3,325,000 | | | | 3,459,297 | |
Black Hills Corp. | | | | | | | | |
2.50% due 06/15/30 | | | 14,360,000 | | | | 14,097,623 | |
ONE Gas, Inc. | | | | | | | | |
0.85% due 03/11/23 | | | 1,620,000 | | | | 1,621,361 | |
Southern Power Co. | | | | | | | | |
5.25% due 07/15/43 | | | 1,350,000 | | | | 1,537,161 | |
Dominion Energy, Inc. | | | | | | | | |
0.71% (3 Month USD LIBOR + 0.53%) due 09/15/235 | | | 1,030,000 | | | | 1,031,331 | |
AmeriGas Partners Limited Partnership / AmeriGas Finance Corp. | | | | | | | | |
5.75% due 05/20/27 | | | 825,000 | | | | 899,250 | |
Atmos Energy Corp. | | | | | | | | |
0.63% due 03/09/23 | | | 800,000 | | | | 800,312 | |
Total Utilities | | | | | | | 221,934,473 | |
| | | | | | | | | |
26 | THE GUGGENHEIM FUNDS SEMI-ANNUAL REPORT | SEE NOTES TO FINANCIAL STATEMENTS. |
SCHEDULE OF INVESTMENTS (Unaudited)(continued) | March 31, 2021 |
TOTAL RETURN BOND FUND | |
| | Face
Amount~ | | | Value | |
Financial Institutions - 0.1% |
Bain Capital, LP | | | | | | | | |
3.41% due 04/15/41††† | | | 36,000,000 | | | $ | 32,893,636 | |
Total Corporate Bonds | | | | |
(Cost $11,636,291,479) | | | 11,868,590,496 | |
| | | | | | | | | |
ASSET-BACKED SECURITIES†† - 22.0% |
Collateralized Loan Obligations - 13.1% |
BXMT Ltd. | | | | | | | | |
2020-FL2, 1.01% (1 Month USD LIBOR + 0.90%, Rate Floor: 0.90%) due 02/16/375,6 | | | 76,225,000 | | | | 76,211,866 | |
2020-FL3, 1.86% (1 Month USD LIBOR + 1.75%, Rate Floor: 1.75%) due 03/15/375,6 | | | 23,550,000 | | | | 23,679,796 | |
2020-FL3, 2.66% (1 Month USD LIBOR + 2.55%, Rate Floor: 2.55%) due 03/15/375,6 | | | 16,125,000 | | | | 16,274,466 | |
2020-FL2, 1.51% (1 Month USD LIBOR + 1.40%, Rate Floor: 1.40%) due 02/16/375,6 | | | 16,000,000 | | | | 15,989,546 | |
2020-FL3, 2.26% (1 Month USD LIBOR + 2.15%, Rate Floor: 2.15%) due 03/15/375,6 | | | 10,600,000 | | | | 10,682,737 | |
2020-FL2, 1.76% (1 Month USD LIBOR + 1.65%, Rate Floor: 1.65%) due 02/16/375,6 | | | 5,360,000 | | | | 5,358,151 | |
2020-FL2, 1.26% (1 Month USD LIBOR + 1.15%, Rate Floor: 1.15%) due 02/16/375,6 | | | 5,200,000 | | | | 5,203,190 | |
Dryden 33 Senior Loan Fund | | | | | | | | |
2020-33A, 1.24% (3 Month USD LIBOR + 1.00%, Rate Floor: 1.00%) due 04/15/295,6 | | | 56,722,408 | | | | 56,662,759 | |
2020-33A, 1.64% (3 Month USD LIBOR + 1.40%, Rate Floor: 1.40%) due 04/15/295,6 | | | 48,700,000 | | | | 48,458,828 | |
2020-33A, 2.24% (3 Month USD LIBOR + 2.00%, Rate Floor: 2.00%) due 04/15/295,6 | | | 27,000,000 | | | | 27,110,616 | |
KREF Funding V LLC | | | | | | | | |
1.86% (1 Month USD LIBOR + 1.75%, Rate Floor: 1.75%) due 06/25/26†††,5 | | | 115,000,000 | | | | 114,130,970 | |
0.15% due 06/25/26†††,11 | | | 313,636,364 | | | | 153,682 | |
Cerberus Loan Funding XXX, LP | | | | | | | | |
2020-3A, 2.08% (3 Month USD LIBOR + 1.85%, Rate Floor: 1.85%) due 01/15/335,6 | | | 100,000,000 | | | | 99,889,730 | |
2020-3A, 2.73% (3 Month USD LIBOR + 2.50%, Rate Floor: 2.50%) due 01/15/335,6 | | | 10,200,000 | | | | 10,209,301 | |
HERA Commercial Mortgage Ltd. | | | | | | | | |
2021-FL1, 1.73% (1 Month USD LIBOR + 1.60%, Rate Floor: 1.60%) due 02/18/385,6 | | | 49,562,000 | | | | 49,585,145 | |
SEE NOTES TO FINANCIAL STATEMENTS. | THE GUGGENHEIM FUNDS SEMI-ANNUAL REPORT | 27 |
SCHEDULE OF INVESTMENTS (Unaudited)(continued) | March 31, 2021 |
TOTAL RETURN BOND FUND | |
| | Face
Amount~ | | | Value | |
2021-FL1, 1.43% (1 Month USD LIBOR + 1.30%, Rate Floor: 1.30%) due 02/18/385,6 | | | 28,000,000 | | | $ | 28,014,664 | |
2021-FL1, 2.08% (1 Month USD LIBOR + 1.95%, Rate Floor: 1.95%) due 02/18/385,6 | | | 19,200,000 | | | | 19,244,532 | |
2021-FL1, 1.18% (1 Month USD LIBOR + 1.05%, Rate Floor: 1.05%) due 02/18/385,6 | | | 10,000,000 | | | | 10,003,952 | |
Cerberus Loan Funding XXXII, LP | | | | | | | | |
2021-2A, (3 Month USD LIBOR + 1.62%, Rate Floor: 1.62%) due 04/22/335,6 | | | 105,125,000 | | | | 105,103,975 | |
Woodmont Trust | | | | | | | | |
2020-7A, 2.05% (3 Month USD LIBOR + 1.90%, Rate Floor: 1.90%) due 01/15/325,6 | | | 83,000,000 | | | | 82,904,558 | |
2020-7A, 2.75% (3 Month USD LIBOR + 2.60%, Rate Floor: 2.60%) due 01/15/325,6 | | | 13,500,000 | | | | 13,451,207 | |
2020-7A, 2.40% (3 Month USD LIBOR + 2.25%, Rate Floor: 2.25%) due 01/15/325,6 | | | 7,000,000 | | | | 6,984,446 | |
GoldenTree Loan Management US CLO 1 Ltd. | | | | | | | | |
2020-1A, 1.17% (3 Month USD LIBOR + 0.95%, Rate Floor: 0.95%) due 04/20/295,6 | | | 49,250,000 | | | | 49,249,109 | |
2021-9A, 1.63% (3 Month USD LIBOR + 1.50%, Rate Floor: 1.50%) due 01/20/335,6 | | | 35,900,000 | | | | 35,763,268 | |
2020-1A, 1.67% (3 Month USD LIBOR + 1.45%, Rate Floor: 1.45%) due 04/20/295,6 | | | 12,500,000 | | | | 12,498,671 | |
2021-9A, 1.93% (3 Month USD LIBOR + 1.80%, Rate Floor: 1.80%) due 01/20/335,6 | | | 3,900,000 | | | | 3,884,393 | |
MidOcean Credit CLO VII | | | | | | | | |
2020-7A, 1.28% (3 Month USD LIBOR + 1.04%, Rate Floor: 0.00%) due 07/15/295,6 | | | 52,000,000 | | | | 51,938,848 | |
2020-7A, 1.84% (3 Month USD LIBOR + 1.60%, Rate Floor: 0.00%) due 07/15/295,6 | | | 27,500,000 | | | | 27,168,124 | |
2020-7A, 1.69% (3 Month USD LIBOR + 1.45%, Rate Floor: 0.00%) due 07/15/295,6 | | | 14,800,000 | | | | 14,804,763 | |
28 | THE GUGGENHEIM FUNDS SEMI-ANNUAL REPORT | SEE NOTES TO FINANCIAL STATEMENTS. |
SCHEDULE OF INVESTMENTS (Unaudited)(continued) | March 31, 2021 |
TOTAL RETURN BOND FUND | |
| | Face
Amount~ | | | Value | |
Venture XIV CLO Ltd. | | | | | | | | |
2020-14A, 1.22% (3 Month USD LIBOR + 1.03%, Rate Floor: 1.03%) due 08/28/295,6 | | | 69,000,000 | | | $ | 68,910,921 | |
2020-14A, 2.44% (3 Month USD LIBOR + 2.25%, Rate Floor: 2.25%) due 08/28/295,6 | | | 22,725,000 | | | | 22,684,913 | |
ABPCI Direct Lending Fund IX LLC | | | | | | | | |
2020-9A, 2.19% (3 Month USD LIBOR + 1.95%, Rate Floor: 1.95%) due 11/18/315,6 | | | 72,500,000 | | | | 72,562,292 | |
2020-9A, 2.84% (3 Month USD LIBOR + 2.60%, Rate Floor: 2.60%) due 11/18/315,6 | | | 15,250,000 | | | | 15,311,560 | |
Palmer Square Loan Funding Ltd. | | | | | | | | |
2021-1A, 1.41% (3 Month USD LIBOR + 1.25%, Rate Floor: 1.25%) due 04/20/295,6 | | | 19,000,000 | | | | 18,959,661 | |
2021-2A, (3 Month USD LIBOR + 1.40%, Rate Floor: 1.40%) due 05/20/295,6 | | | 17,500,000 | | | | 17,496,500 | |
2019-3A, 1.03% (3 Month USD LIBOR + 0.85%, Rate Floor: 0.85%) due 08/20/275,6 | | | 16,340,096 | | | | 16,341,470 | |
2018-4A, 1.09% (3 Month USD LIBOR + 0.90%, Rate Floor: 0.00%) due 11/15/265,6 | | | 13,155,001 | | | | 13,158,380 | |
2018-4A, 1.64% (3 Month USD LIBOR + 1.45%, Rate Floor: 0.00%) due 11/15/265,6 | | | 12,000,000 | | | | 12,010,494 | |
2021-1A, 1.96% (3 Month USD LIBOR + 1.80%, Rate Floor: 1.80%) due 04/20/295,6 | | | 7,100,000 | | | | 7,106,841 | |
GPMT Ltd. | | | | | | | | |
2019-FL2, 1.41% (1 Month USD LIBOR + 1.30%, Rate Floor: 1.30%) due 02/22/365,6 | | | 25,899,000 | | | | 25,937,110 | |
2019-FL2, 1.71% (1 Month USD LIBOR + 1.60%, Rate Floor: 1.60%) due 02/22/365,6 | | | 24,300,000 | | | | 24,316,597 | |
2019-FL2, 2.46% (1 Month USD LIBOR + 2.35%, Rate Floor: 2.35%) due 02/22/365,6 | | | 21,400,000 | | | | 21,375,666 | |
2019-FL2, 2.01% (1 Month USD LIBOR + 1.90%, Rate Floor: 1.90%) due 02/22/365,6 | | | 12,750,000 | | | | 12,741,512 | |
ABPCI Direct Lending Fund CLO I LLC | | | | | | | | |
2021-1A, 1.79% (3 Month USD LIBOR + 1.60%, Rate Floor: 1.60%) due 04/20/325,6 | | | 83,450,000 | | | | 83,450,000 | |
Cerberus Loan Funding XXXI, LP | | | | | | | | |
2021-1A, 1.69% (3 Month USD LIBOR + 1.50%, Rate Floor: 1.50%) due 04/15/325,6 | | | 70,250,000 | | | | 70,250,000 | |
SEE NOTES TO FINANCIAL STATEMENTS. | THE GUGGENHEIM FUNDS SEMI-ANNUAL REPORT | 29 |
SCHEDULE OF INVESTMENTS (Unaudited)(continued) | March 31, 2021 |
TOTAL RETURN BOND FUND | |
| | Face
Amount~ | | | Value | |
2021-1A, 2.79% (3 Month USD LIBOR + 2.60%, Rate Floor: 2.60%) due 04/15/325,6 | | | 12,000,000 | | | $ | 12,000,000 | |
LoanCore Issuer Ltd. | | | | | | | | |
2019-CRE2, 1.61% (1 Month USD LIBOR + 1.50%, Rate Floor: 1.50%) due 05/15/365,6 | | | 19,984,000 | | | | 19,964,052 | |
2018-CRE1, 1.61% (1 Month USD LIBOR + 1.50%, Rate Floor: 1.50%) due 05/15/285,6 | | | 17,747,000 | | | | 17,729,722 | |
2019-CRE3, 1.16% (1 Month USD LIBOR + 1.05%, Rate Floor: 1.05%) due 04/15/345,6 | | | 13,551,300 | | | | 13,572,546 | |
2021-CRE4, 1.81% (1 Month USD LIBOR + 1.70%, Rate Floor: 1.70%) due 07/15/355,6 | | | 13,182,000 | | | | 13,158,032 | |
2019-CRE2, 1.81% (1 Month USD LIBOR + 1.70%, Rate Floor: 1.70%) due 05/15/365,6 | | | 11,575,000 | | | | 11,546,100 | |
2019-CRE3, 1.71% (1 Month USD LIBOR + 1.60%, Rate Floor: 1.60%) due 04/15/345,6 | | | 4,410,000 | | | | 4,383,120 | |
Parliament Funding II Ltd. | | | | | | | | |
2020-1A, 2.67% (3 Month USD LIBOR + 2.45%, Rate Floor: 2.45%) due 08/12/305,6 | | | 71,650,000 | | | | 71,714,041 | |
2020-1A, 3.42% (3 Month USD LIBOR + 3.20%, Rate Floor: 3.20%) due 08/12/305,6 | | | 6,000,000 | | | | 6,003,071 | |
Golub Capital Partners CLO Ltd. | | | | | | | | |
2018-36A, 1.50% (3 Month USD LIBOR + 1.30%, Rate Floor: 0.00%) due 02/05/315,6 | | | 76,300,000 | | | | 75,829,786 | |
CHCP Ltd. | | | | | | | | |
2021-FL1, 1.16% (1 Month USD LIBOR + 1.05%, Rate Floor: 1.05%) due 02/15/385,6 | | | 28,000,000 | | | | 28,008,350 | |
2021-FL1, 1.41% (1 Month USD LIBOR + 1.30%, Rate Floor: 1.30%) due 02/15/385,6 | | | 22,250,000 | | | | 22,258,466 | |
2021-FL1, 1.76% (1 Month USD LIBOR + 1.65%, Rate Floor: 1.65%) due 02/15/385,6 | | | 5,900,000 | | | | 5,902,545 | |
2021-FL1, 2.21% (1 Month USD LIBOR + 2.10%, Rate Floor: 2.10%) due 02/15/385,6 | | | 2,950,000 | | | | 2,951,270 | |
Wellfleet CLO Ltd. | | | | | | | | |
2020-2A, 1.28% (3 Month USD LIBOR + 1.06%, Rate Floor: 0.00%) due 10/20/295,6 | | | 52,250,000 | | | | 52,264,087 | |
2018-2A, 1.80% (3 Month USD LIBOR + 1.58%, Rate Floor: 1.58%) due 10/20/285,6 | | | 2,500,000 | | | | 2,502,030 | |
30 | THE GUGGENHEIM FUNDS SEMI-ANNUAL REPORT | SEE NOTES TO FINANCIAL STATEMENTS. |
SCHEDULE OF INVESTMENTS (Unaudited)(continued) | March 31, 2021 |
TOTAL RETURN BOND FUND | |
| | Face
Amount~ | | | Value | |
Diamond CLO Ltd. | | | | | | | | |
2021-1A, 1.65% (3 Month USD LIBOR + 1.45%, Rate Floor: 1.45%) due 04/25/295,6 | | | 23,825,000 | | | $ | 23,820,235 | |
2018-1A, 1.72% (3 Month USD LIBOR + 1.50%, Rate Floor: 1.50%) due 07/22/305,6 | | | 18,000,000 | | | | 17,963,262 | |
2021-1A, 2.60% (3 Month USD LIBOR + 2.40%, Rate Floor: 2.40%) due 04/25/295,6 | | | 2,300,000 | | | | 2,299,540 | |
2021-1A, 1.90% (3 Month USD LIBOR + 1.70%, Rate Floor: 1.70%) due 04/25/295,6 | | | 2,150,000 | | | | 2,149,570 | |
Fortress Credit Opportunities XI CLO Ltd. | | | | | | | | |
2018-11A, 1.54% (3 Month USD LIBOR + 1.30%, Rate Floor: 0.00%) due 04/15/315,6 | | | 44,300,000 | | | | 43,887,718 | |
2018-11A, 2.74% (3 Month USD LIBOR + 2.50%, Rate Floor: 0.00%) due 04/15/315,6 | | | 2,300,000 | | | | 2,306,626 | |
Whitebox CLO II Ltd. | | | | | | | | |
2020-2A, 1.99% (3 Month USD LIBOR + 1.75%, Rate Floor: 1.75%) due 10/24/315,6 | | | 36,500,000 | | | | 36,570,394 | |
2020-2A, 2.49% (3 Month USD LIBOR + 2.25%, Rate Floor: 2.25%) due 10/24/315,6 | | | 7,000,000 | | | | 7,027,201 | |
Denali Capital CLO XI Ltd. | | | | | | | | |
2018-1A, 1.35% (3 Month USD LIBOR + 1.13%, Rate Floor: 0.00%) due 10/20/285,6 | | | 39,879,704 | | | | 39,884,474 | |
Lake Shore MM CLO III LLC | | | | | | | | |
2020-1A, 2.53% (3 Month USD LIBOR + 2.30%, Rate Floor: 2.30%) due 10/15/295,6 | | | 38,900,000 | | | | 38,939,441 | |
MP CLO VIII Ltd. | | | | | | | | |
2018-2A, 1.13% (3 Month USD LIBOR + 0.91%, Rate Floor: 0.00%) due 10/28/275,6 | | | 38,919,430 | | | | 38,907,058 | |
LCM XXIV Ltd. | | | | | | | | |
2021-24A, 1.59% (3 Month USD LIBOR + 1.40%, Rate Floor: 0.00%) due 03/20/305,6 | | | 24,200,000 | | | | 24,133,423 | |
2021-24A, 2.09% (3 Month USD LIBOR + 1.90%, Rate Floor: 0.00%) due 03/20/305,6 | | | 13,050,000 | | | | 13,008,739 | |
Marathon CLO V Ltd. | | | | | | | | |
2017-5A, 1.05% (3 Month USD LIBOR + 0.87%, Rate Floor: 0.00%) due 11/21/275,6 | | | 18,236,534 | | | | 18,218,872 | |
2017-5A, 1.63% (3 Month USD LIBOR + 1.45%, Rate Floor: 0.00%) due 11/21/275,6 | | | 18,020,137 | | | | 17,847,201 | |
SEE NOTES TO FINANCIAL STATEMENTS. | THE GUGGENHEIM FUNDS SEMI-ANNUAL REPORT | 31 |
SCHEDULE OF INVESTMENTS (Unaudited)(continued) | March 31, 2021 |
TOTAL RETURN BOND FUND | |
| | Face
Amount~ | | | Value | |
NXT Capital CLO LLC | | | | | | | | |
2017-1A, 1.92% (3 Month USD LIBOR + 1.70%, Rate Floor: 0.00%) due 04/20/295,6 | | | 34,100,000 | | | $ | 34,155,102 | |
Madison Park Funding XLVIII Ltd. | | | | | | | | |
2021-48A, 1.59% (3 Month USD LIBOR + 1.45%, Rate Floor: 1.45%) due 04/19/335,6 | | | 27,500,000 | | | | 27,450,082 | |
2021-48A, 2.14% (3 Month USD LIBOR + 2.00%, Rate Floor: 2.00%) due 04/19/335,6 | | | 5,900,000 | | | | 5,894,978 | |
Telos CLO Ltd. | | | | | | | | |
2017-6A, 1.97% (3 Month USD LIBOR + 1.75%, Rate Floor: 0.00%) due 01/17/275,6 | | | 32,000,000 | | | | 32,019,840 | |
Neuberger Berman Loan Advisers CLO 40 Ltd. | | | | | | | | |
2021-40A, 1.59% (3 Month USD LIBOR + 1.40%, Rate Floor: 1.40%) due 04/16/335,6 | | | 26,700,000 | | | | 26,599,066 | |
2021-40A, 1.94% (3 Month USD LIBOR + 1.75%, Rate Floor: 1.75%) due 04/16/335,6 | | | 2,000,000 | | | | 1,992,012 | |
TCW CLO Ltd. | | | | | | | | |
2020-1A, 1.87% (3 Month USD LIBOR + 1.65%, Rate Floor: 1.65%) due 10/20/315,6 | | | 28,000,000 | | | | 27,860,050 | |
FDF II Ltd. | | | | | | | | |
2016-2A, 4.29% due 05/12/316 | | | 21,500,000 | | | | 21,681,985 | |
2016-2A, 5.29% due 05/12/316 | | | 5,000,000 | | | | 4,987,224 | |
Wind River CLO Ltd. | | | | | | | | |
2017-2A, 1.11% (3 Month USD LIBOR + 0.87%, Rate Floor: 0.00%) due 10/15/275,6 | | | 26,568,221 | | | | 26,544,976 | |
610 Funding CLO 3 Ltd. | | | | | | | | |
2018-3A, 1.47% (3 Month USD LIBOR + 1.25%, Rate Floor: 0.00%) due 07/17/285,6 | | | 25,874,727 | | | | 25,874,318 | |
OCP CLO Ltd. | | | | | | | | |
2020-4A, 1.67% (3 Month USD LIBOR + 1.45%, Rate Floor: 1.45%) due 04/24/295,6 | | | 25,500,000 | | | | 25,095,647 | |
2019-17A, 0.87% (3 Month USD LIBOR + 0.65%, Rate Floor: 0.65%) due 07/20/325,6 | | | 750,000 | | | | 748,972 | |
Canyon CLO Ltd. | | | | | | | | |
2020-1A, 2.99% (3 Month USD LIBOR + 2.75%, Rate Floor: 2.75%) due 07/15/285,6 | | | 22,500,000 | | | | 22,559,355 | |
2020-1A, 4.02% (3 Month USD LIBOR + 3.78%, Rate Floor: 3.78%) due 07/15/285,6 | | | 2,000,000 | | | | 1,998,536 | |
32 | THE GUGGENHEIM FUNDS SEMI-ANNUAL REPORT | SEE NOTES TO FINANCIAL STATEMENTS. |
SCHEDULE OF INVESTMENTS (Unaudited)(continued) | March 31, 2021 |
TOTAL RETURN BOND FUND | |
| | Face
Amount~ | | | Value | |
Halcyon Loan Advisors Funding Ltd. | | | | | | | | |
2017-3A, 1.12% (3 Month USD LIBOR + 0.90%, Rate Floor: 0.00%) due 10/18/275,6 | | | 24,518,576 | | | $ | 24,524,046 | |
Ares LVII CLO Ltd. | | | | | | | | |
2020-57A, 2.74% (3 Month USD LIBOR + 2.50%, Rate Floor: 2.50%) due 10/25/315,6 | | | 13,500,000 | | | | 13,485,438 | |
2020-57A, 1.99% (3 Month USD LIBOR + 1.75%, Rate Floor: 1.75%) due 10/25/315,6 | | | 9,500,000 | | | | 9,554,906 | |
Magnetite Xxix Ltd. | | | | | | | | |
2021-29A, 1.50% (3 Month USD LIBOR + 1.40%, Rate Floor: 1.40%) due 01/15/345,6 | | | 15,100,000 | | | | 15,100,000 | |
2021-29A, 1.75% (3 Month USD LIBOR + 1.65%, Rate Floor: 1.65%) due 01/15/345,6 | | | 7,700,000 | | | | 7,700,000 | |
Voya CLO Ltd. | | | | | | | | |
2020-1A, 1.30% (3 Month USD LIBOR + 1.06%, Rate Floor: 1.06%) due 04/15/315,6 | | | 18,850,000 | | | | 18,906,297 | |
2013-1A, due 10/15/306,9 | | | 10,575,071 | | | | 3,517,702 | |
STWD Ltd. | | | | | | | | |
2019-FL1, 1.71% (1 Month USD LIBOR + 1.60%, Rate Floor: 1.60%) due 07/15/385,6 | | | 11,210,000 | | | | 11,191,018 | |
2019-FL1, 2.06% (1 Month USD LIBOR + 1.95%, Rate Floor: 1.95%) due 07/15/385,6 | | | 8,800,000 | | | | 8,809,083 | |
2019-FL1, 1.51% (1 Month USD LIBOR + 1.40%, Rate Floor: 1.40%) due 07/15/385,6 | | | 2,200,000 | | | | 2,201,544 | |
Apres Static CLO Ltd. | | | | | | | | |
2020-1A, 1.94% (3 Month USD LIBOR + 1.70%, Rate Floor: 0.00%) due 10/15/285,6 | | | 21,750,000 | | | | 21,784,076 | |
NewStar Fairfield Fund CLO Ltd. | | | | | | | | |
2018-2A, 1.49% (3 Month USD LIBOR + 1.27%, Rate Floor: 1.27%) due 04/20/305,6 | | | 21,171,638 | | | | 20,957,851 | |
Allegro CLO IX Ltd. | | | | | | | | |
2018-3A, 1.39% (3 Month USD LIBOR + 1.17%, Rate Floor: 1.17%) due 10/16/315,6 | | | 20,400,000 | | | | 20,459,668 | |
Avery Point VI CLO Ltd. | | | | | | | | |
2021-6A, 1.96% (3 Month USD LIBOR + 1.80%, Rate Floor: 1.80%) due 08/05/275,6 | | | 12,100,000 | | | | 12,070,195 | |
2021-6A, 1.51% (3 Month USD LIBOR + 1.35%, Rate Floor: 1.35%) due 08/05/275,6 | | | 8,000,000 | | | | 7,991,528 | |
SEE NOTES TO FINANCIAL STATEMENTS. | THE GUGGENHEIM FUNDS SEMI-ANNUAL REPORT | 33 |
SCHEDULE OF INVESTMENTS (Unaudited)(continued) | March 31, 2021 |
TOTAL RETURN BOND FUND | |
| | Face
Amount~ | | | Value | |
Recette CLO Ltd. | | | | | | | | |
2021-1A, 1.51% (3 Month USD LIBOR + 1.40%, Rate Floor: 0.00%) due 04/20/345,6 | | | 9,800,000 | | | $ | 9,800,000 | |
2021-1A, 1.86% (3 Month USD LIBOR + 1.75%, Rate Floor: 0.00%) due 04/20/345,6 | | | 9,200,000 | | | | 9,200,000 | |
AMMC CLO XIV Ltd. | | | | | | | | |
2021-14A, 1.62% (3 Month USD LIBOR + 1.40%, Rate Floor: 1.40%) due 07/25/295,6 | | | 18,290,000 | | | | 18,267,622 | |
Neuberger Berman Loan Advisers CLO 32 Ltd. | | | | | | | | |
2021-32A, 1.59% (3 Month USD LIBOR + 1.40%, Rate Floor: 1.40%) due 01/20/325,6 | | | 14,100,000 | | | | 14,051,506 | |
2021-32A, 1.89% (3 Month USD LIBOR + 1.70%, Rate Floor: 1.70%) due 01/20/325,6 | | | 4,200,000 | | | | 4,184,088 | |
Owl Rock CLO IV Ltd. | | | | | | | | |
2020-4A, 2.80% (3 Month USD LIBOR + 2.62%, Rate Floor: 2.62%) due 05/20/295,6 | | | 18,000,000 | | | | 18,050,929 | |
BSPRT Issuer Ltd. | | | | | | | | |
2018-FL4, 1.16% (1 Month USD LIBOR + 1.05%, Rate Floor: 1.05%) due 09/15/355,6 | | | 7,214,715 | | | | 7,214,714 | |
2021-FL6, 2.15% (1 Month USD LIBOR + 2.05%, Rate Floor: 2.05%) due 03/15/365,6 | | | 5,550,000 | | | | 5,542,074 | |
2018-FL3, 1.16% (1 Month USD LIBOR + 1.05%, Rate Floor: 1.05%) due 03/15/285,6 | | | 5,215,344 | | | | 5,215,343 | |
BDS Ltd. | | | | | | | | |
2019-FL3, 2.11% (1 Month USD LIBOR + 2.00%, Rate Floor: 2.00%) due 12/15/355,6 | | | 9,900,000 | | | | 9,895,014 | |
2020-FL5, 1.91% (1 Month USD LIBOR + 1.80%, Rate Floor: 1.80%) due 02/16/375,6 | | | 4,400,000 | | | | 4,423,572 | |
2020-FL5, 1.46% (1 Month USD LIBOR + 1.35%, Rate Floor: 1.35%) due 02/16/375,6 | | | 3,200,000 | | | | 3,202,299 | |
Owl Rock CLO II Ltd. | | | | | | | | |
2021-2A, 1.74% (3 Month USD LIBOR + 1.55%, Rate Floor: 1.55%) due 04/20/335,6 | | | 15,600,000 | | | | 15,596,100 | |
Dryden 36 Senior Loan Fund | | | | | | | | |
2020-36A, 2.29% (3 Month USD LIBOR + 2.05%, Rate Floor: 2.05%) due 04/15/295,6 | | | 15,200,000 | | | | 15,263,354 | |
34 | THE GUGGENHEIM FUNDS SEMI-ANNUAL REPORT | SEE NOTES TO FINANCIAL STATEMENTS. |
SCHEDULE OF INVESTMENTS (Unaudited)(continued) | March 31, 2021 |
TOTAL RETURN BOND FUND | |
| | Face
Amount~ | | | Value | |
Crown Point CLO III Ltd. | | | | | | | | |
2017-3A, 1.69% (3 Month USD LIBOR + 1.45%, Rate Floor: 0.00%) due 12/31/275,6 | | | 10,280,000 | | | $ | 10,279,980 | |
2017-3A, 1.15% (3 Month USD LIBOR + 0.91%, Rate Floor: 0.00%) due 12/31/275,6 | | | 4,722,215 | | | | 4,721,891 | |
Shackleton CLO Ltd. | | | | | | | | |
2017-8A, 1.14% (3 Month USD LIBOR + 0.92%, Rate Floor: 0.00%) due 10/20/275,6 | | | 6,150,633 | | | | 6,150,053 | |
2017-8A, 1.52% (3 Month USD LIBOR + 1.30%, Rate Floor: 0.00%) due 10/20/275,6 | | | 5,510,000 | | | | 5,410,020 | |
2018-6RA, 1.24% (3 Month USD LIBOR + 1.02%, Rate Floor: 1.02%) due 07/17/285,6 | | | 3,366,854 | | | | 3,365,425 | |
NewStar Clarendon Fund CLO LLC | | | | | | | | |
2019-1A, 1.52% (3 Month USD LIBOR + 1.30%, Rate Floor: 0.00%) due 01/25/275,6 | | | 12,662,801 | | | | 12,653,887 | |
2019-1A, 3.27% (3 Month USD LIBOR + 3.05%, Rate Floor: 0.00%) due 01/25/275,6 | | | 2,000,000 | | | | 1,990,742 | |
KREF Ltd. | | | | | | | | |
2018-FL1, 1.21% (1 Month USD LIBOR + 1.10%, Rate Floor: 1.10%) due 06/15/365,6 | | | 13,396,506 | | | | 13,398,297 | |
Octagon Investment Partners 49 Ltd. | | | | | | | | |
2021-5A, 1.76% (3 Month USD LIBOR + 1.55%, Rate Floor: 1.55%) due 01/15/335,6 | | | 12,800,000 | | | | 12,842,764 | |
Fortress Credit Opportunities IX CLO Ltd. | | | | | | | | |
2017-9A, 1.74% (3 Month USD LIBOR + 1.55%, Rate Floor: 0.00%) due 11/15/295,6 | | | 11,527,000 | | | | 11,497,657 | |
2020-9A, 2.53% due 11/15/296 | | | 1,250,000 | | | | 1,248,624 | |
Newstar Commercial Loan Funding LLC | | | | | | | | |
2017-1A, 2.69% (3 Month USD LIBOR + 2.50%, Rate Floor: 0.00%) due 03/20/275,6 | | | 12,750,000 | | | | 12,739,469 | |
Marathon CLO VII Ltd. | | | | | | | | |
2017-7A, 1.87% (3 Month USD LIBOR + 1.65%, Rate Floor: 0.00%) due 10/28/255,6 | | | 12,600,000 | | | | 12,593,922 | |
Golub Capital Partners CLO 17 Ltd. | | | | | | | | |
2017-17A, 1.87% (3 Month USD LIBOR + 1.65%, Rate Floor: 0.00%) due 10/25/305,6 | | | 12,600,000 | | | | 12,577,504 | |
SEE NOTES TO FINANCIAL STATEMENTS. | THE GUGGENHEIM FUNDS SEMI-ANNUAL REPORT | 35 |
SCHEDULE OF INVESTMENTS (Unaudited)(continued) | March 31, 2021 |
TOTAL RETURN BOND FUND | |
| | Face
Amount~ | | | Value | |
Benefit Street Partners Clo XXII Ltd. | | | | | | | | |
2020-22A, 1.59% (3 Month USD LIBOR + 1.45%, Rate Floor: 1.45%) due 01/20/325,6 | | | 7,700,000 | | | $ | 7,686,907 | |
2020-22A, 2.29% (3 Month USD LIBOR + 2.15%, Rate Floor: 2.15%) due 01/20/325,6 | | | 4,300,000 | | | | 4,326,770 | |
Columbia Cent CLO 27 Ltd. | | | | | | | | |
2020-27A, 1.83% due 10/25/286 | | | 12,000,000 | | | | 11,997,600 | |
Sudbury Mill CLO Ltd. | | | | | | | | |
2017-1A, 1.87% (3 Month USD LIBOR + 1.65%, Rate Floor: 0.00%) due 01/17/265,6 | | | 11,850,000 | | | | 11,808,916 | |
KVK CLO Ltd. | | | | | | | | |
2017-1A, 1.13% (3 Month USD LIBOR + 0.90%, Rate Floor: 0.00%) due 01/14/285,6 | | | 4,909,795 | | | | 4,905,116 | |
2018-1A, 1.83% (3 Month USD LIBOR + 1.65%, Rate Floor: 0.00%) due 05/20/295,6 | | | 3,850,000 | | | | 3,846,871 | |
2018-1A, 1.11% (3 Month USD LIBOR + 0.93%, Rate Floor: 0.00%) due 05/20/295,6 | | | 2,983,803 | | | | 2,982,332 | |
Monroe Capital CLO Ltd. | | | | | | | | |
2017-1A, 1.92% (3 Month USD LIBOR + 1.70%, Rate Floor: 0.00%) due 10/22/265,6 | | | 11,100,000 | | | | 11,064,447 | |
2017-1A, 1.57% (3 Month USD LIBOR + 1.35%, Rate Floor: 0.00%) due 10/22/265,6 | | | 101,736 | | | | 101,718 | |
Neuberger Berman CLO XVI-S Ltd. | | | | | | | | |
2021-16SA, 1.60% (3 Month USD LIBOR + 1.40%, Rate Floor: 1.40%) due 04/15/345,6 | | | 10,200,000 | | | | 10,197,960 | |
Mountain View CLO Ltd. | | | | | | | | |
2018-1A, 1.04% (3 Month USD LIBOR + 0.80%, Rate Floor: 0.80%) due 10/15/265,6 | | | 9,875,670 | | | | 9,866,546 | |
Treman Park CLO Ltd. | | | | | | | | |
2015-1A, due 10/20/286,9 | | | 13,600,000 | | | | 9,152,548 | |
Dryden 37 Senior Loan Fund | | | | | | | | |
2015-37A, due 01/15/316,9 | | | 10,000,000 | | | | 8,555,861 | |
ACIS CLO Ltd. | | | | | | | | |
2015-6A, 2.69% (3 Month USD LIBOR + 2.48%, Rate Floor: 0.00%) due 05/01/275,6 | | | 7,500,000 | | | | 7,496,374 | |
THL Credit Lake Shore MM CLO I Ltd. | | | | | | | | |
2019-1A, 1.94% (3 Month USD LIBOR + 1.70%, Rate Floor: 1.70%) due 04/15/305,6 | | | 7,250,000 | | | | 7,225,514 | |
36 | THE GUGGENHEIM FUNDS SEMI-ANNUAL REPORT | SEE NOTES TO FINANCIAL STATEMENTS. |
SCHEDULE OF INVESTMENTS (Unaudited)(continued) | March 31, 2021 |
TOTAL RETURN BOND FUND | |
| | Face
Amount~ | | | Value | |
Golub Capital Partners CLO 16 Ltd. | | | | | | | | |
2017-16A, 2.07% (3 Month USD LIBOR + 1.85%, Rate Floor: 0.00%) due 07/25/295,6 | | | 6,700,000 | | | $ | 6,684,369 | |
TCP Waterman CLO Ltd. | | | | | | | | |
2016-1A, 2.23% (3 Month USD LIBOR + 2.05%, Rate Floor: 0.00%) due 12/15/285,6 | | | 6,617,373 | | | | 6,621,971 | |
ACRE Commercial Mortgage Ltd. | | | | | | | | |
2021-FL4, 1.51% (1 Month USD LIBOR + 1.40%, Rate Floor: 1.40%) due 12/18/375,6 | | | 3,100,000 | | | | 3,106,729 | |
2021-FL4, 1.86% (1 Month USD LIBOR + 1.75%, Rate Floor: 1.75%) due 12/18/375,6 | | | 3,100,000 | | | | 3,106,487 | |
Owl Rock CLO I Ltd. | | | | | | | | |
2019-1A, 1.98% (3 Month USD LIBOR + 1.80%, Rate Floor: 1.80%) due 05/20/315,6 | | | 5,650,000 | | | | 5,655,931 | |
Apres Static CLO 2 Ltd. | | | | | | | | |
2020-1A, 3.99% (3 Month USD LIBOR + 3.75%, Rate Floor: 3.75%) due 04/15/285,6 | | | 2,800,000 | | | | 2,800,065 | |
2020-1A, 4.54% (3 Month USD LIBOR + 4.30%, Rate Floor: 4.30%) due 04/15/285,6 | | | 2,700,000 | | | | 2,699,897 | |
Ivy Hill Middle Market Credit Fund X Ltd. | | | | | | | | |
2018-10A, 2.02% (3 Month USD LIBOR + 1.80%, Rate Floor: 0.00%) due 07/18/305,6 | | | 5,300,000 | | | | 5,226,992 | |
GoldenTree Loan Opportunities IX Ltd. | | | | | | | | |
2018-9A, 1.32% (3 Month USD LIBOR + 1.11%, Rate Floor: 1.11%) due 10/29/295,6 | | | 5,152,000 | | | | 5,157,327 | |
VOYA CLO | | | | | | | | |
2021-2A, 2.2% (3 Month USD LIBOR + 2.15%, Rate Floor: 2.15%) due 06/07/305,6 | | | 4,950,000 | | | | 4,949,010 | |
Seneca Park CLO Ltd. | | | | | | | | |
2017-1A, 1.72% (3 Month USD LIBOR + 1.50%, Rate Floor: 0.00%) due 07/17/265,6 | | | 4,942,434 | | | | 4,942,009 | |
TICP CLO III-2 Ltd. | | | | | | | | |
2018-3R, 1.06% (3 Month USD LIBOR + 0.84%, Rate Floor: 0.84%) due 04/20/285,6 | | | 4,377,099 | | | | 4,378,959 | |
Atlas Senior Loan Fund III Ltd. | | | | | | | | |
2017-1A, 1.49% (3 Month USD LIBOR + 1.30%, Rate Floor: 0.00%) due 11/17/275,6 | | | 4,300,000 | | | | 4,257,682 | |
SEE NOTES TO FINANCIAL STATEMENTS. | THE GUGGENHEIM FUNDS SEMI-ANNUAL REPORT | 37 |
SCHEDULE OF INVESTMENTS (Unaudited)(continued) | March 31, 2021 |
TOTAL RETURN BOND FUND | |
| | Face
Amount~ | | | Value | |
Avery Point V CLO Ltd. | | | | | | | | |
2017-5A, 1.20% (3 Month USD LIBOR + 0.98%, Rate Floor: 0.00%) due 07/17/265,6 | | | 4,183,614 | | | $ | 4,183,808 | |
TICP CLO I Ltd. | | | | | | | | |
2018-1A, 1.02% (3 Month USD LIBOR + 0.80%, Rate Floor: 0.00%) due 07/20/275,6 | | | 4,153,685 | | | | 4,153,498 | |
TRTX Issuer Ltd. | | | | | | | | |
2019-FL3, 1.26% (1 Month USD LIBOR + 1.15%, Rate Floor: 1.15%) due 10/15/345,6 | | | 2,600,000 | | | | 2,600,574 | |
2019-FL3, 1.86% (1 Month USD LIBOR + 1.75%, Rate Floor: 1.75%) due 10/15/345,6 | | | 1,500,000 | | | | 1,505,096 | |
Northwoods Capital XII-B Ltd. | | | | | | | | |
2018-12BA, 2.03% (3 Month USD LIBOR + 1.85%, Rate Floor: 1.85%) due 06/15/315,6 | | | 4,000,000 | | | | 3,957,269 | |
Ready Capital Mortgage Financing LLC | | | | | | | | |
2019-FL3, 1.11% (1 Month USD LIBOR + 1.00%, Rate Floor: 1.00%) due 03/25/345,6 | | | 3,822,771 | | | | 3,814,819 | |
Carlyle Global Market Strategies CLO Ltd. | | | | | | | | |
2012-3A, due 01/14/326,9 | | | 8,920,000 | | | | 3,725,402 | |
Newfleet CLO Ltd. | | | | | | | | |
2018-1A, 1.17% (3 Month USD LIBOR + 0.95%, Rate Floor: 0.00%) due 04/20/285,6 | | | 3,485,964 | | | | 3,483,536 | |
Golub Capital Partners CLO 39B Ltd. | | | | | | | | |
2018-39A, 1.62% (3 Month USD LIBOR + 1.40%, Rate Floor: 1.40%) due 10/20/285,6 | | | 3,100,000 | | | | 3,101,489 | |
Monroe Capital BSL CLO Ltd. | | | | | | | | |
2017-1A, 1.93% (3 Month USD LIBOR + 1.75%, Rate Floor: 0.00%) due 05/22/275,6 | | | 3,000,000 | | | | 3,002,411 | |
ACRES Commercial Realty Corp. | | | | | | | | |
2020-RSO8, 1.56% (1 Month USD LIBOR + 1.45%, Rate Floor: 1.45%) due 03/15/355,6 | | | 3,000,000 | | | | 2,996,816 | |
Avery Point II CLO Ltd. | | | | | | | | |
2013-3X COM, due 01/18/259 | | | 4,956,331 | | | | 2,922,349 | |
Oaktree CLO Ltd. | | | | | | | | |
2017-1A, 1.09% (3 Month USD LIBOR + 0.87%) due 10/20/275,6 | | | 2,917,399 | | | | 2,917,686 | |
Ocean Trails CLO IV | | | | | | | | |
2017-4A, 1.99% (3 Month USD LIBOR + 1.80%, Rate Floor: 0.00%) due 08/13/255,6 | | | 2,500,000 | | | | 2,488,315 | |
38 | THE GUGGENHEIM FUNDS SEMI-ANNUAL REPORT | SEE NOTES TO FINANCIAL STATEMENTS. |
SCHEDULE OF INVESTMENTS (Unaudited)(continued) | March 31, 2021 |
TOTAL RETURN BOND FUND | |
| | Face
Amount~ | | | Value | |
Allegro CLO VII Ltd. | | | | | | | | |
2018-1A, 2.14% (3 Month USD LIBOR + 1.90%, Rate Floor: 1.90%) due 06/13/315,6 | | | 2,500,000 | | | $ | 2,435,379 | |
Grand Avenue CRE Ltd. | | | | | | | | |
2020-FL2, 4.37% (1 Month USD LIBOR + 4.26%, Rate Floor: 4.26%) due 03/15/355,6 | | | 1,100,000 | | | | 1,116,274 | |
2020-FL2, 3.36% (1 Month USD LIBOR + 3.25%, Rate Floor: 3.25%) due 03/15/355,6 | | | 900,000 | | | | 908,573 | |
Tralee CLO III Ltd. | | | | | | | | |
2017-3A, 1.67% (3 Month USD LIBOR + 1.45%, Rate Floor: 0.00%) due 10/20/275,6 | | | 2,000,000 | | | | 1,991,999 | |
Cerberus Loan Funding XXVI, LP | | | | | | | | |
2019-1A, 1.99% (3 Month USD LIBOR + 1.75%, Rate Floor: 1.75%) due 04/15/315,6 | | | 2,000,000 | | | | 1,990,944 | |
Ivy Hill Middle Market Credit Fund IX Ltd. | | | | | | | | |
2017-9A, 1.97% (3 Month USD LIBOR + 1.75%, Rate Floor: 0.00%) due 01/18/305,6 | | | 1,000,000 | | | | 983,600 | |
2017-9A, 2.57% (3 Month USD LIBOR + 2.35%, Rate Floor: 0.00%) due 01/18/305,6 | | | 1,000,000 | | | | 954,970 | |
Dryden XXV Senior Loan Fund | | | | | | | | |
2017-25A, 1.59% (3 Month USD LIBOR + 1.35%, Rate Floor: 0.00%) due 10/15/275,6 | | | 1,766,703 | | | | 1,753,423 | |
Catamaran CLO Ltd. | | | | | | | | |
2016-2A, 2.27% (3 Month USD LIBOR + 2.05%, Rate Floor: 2.05%) due 10/18/265,6 | | | 1,750,000 | | | | 1,750,666 | |
Venture XIII CLO Ltd. | | | | | | | | |
2013-13A, due 09/10/296,9 | | | 3,700,000 | | | | 1,155,862 | |
Mountain Hawk II CLO Ltd. | | | | | | | | |
2018-2A, 1.82% (3 Month USD LIBOR + 1.60%, Rate Floor: 0.00%) due 07/20/245,6 | | | 602,370 | | | | 602,262 | |
Dryden 43 Senior Loan Fund | | | | | | | | |
2019-43A, 0.82% (3 Month USD LIBOR + 0.60%, Rate Floor: 0.60%) due 07/20/295,6 | | | 600,000 | | | | 599,482 | |
Great Lakes CLO Ltd. | | | | | | | | |
2014-1A, due 10/15/296,9 | | | 461,538 | | | | 202,219 | |
Atlas Senior Loan Fund IX Ltd. | | | | | | | | |
2018-9A, due 04/20/286,9 | | | 1,200,000 | | | | 144,331 | |
Babson CLO Ltd. | | | | | | | | |
2014-IA, due 07/20/256,9 | | | 1,300,000 | | | | 125,450 | |
Copper River CLO Ltd. | | | | | | | | |
2007-1A, due 01/20/217,9 | | | 1,500,000 | | | | 44,190 | |
SEE NOTES TO FINANCIAL STATEMENTS. | THE GUGGENHEIM FUNDS SEMI-ANNUAL REPORT | 39 |
SCHEDULE OF INVESTMENTS (Unaudited)(continued) | March 31, 2021 |
TOTAL RETURN BOND FUND | |
| | Face
Amount~ | | | Value | |
OHA Credit Partners IX Ltd. | | | | | | | | |
2013-9A, due 10/20/256,9 | | | 1,808,219 | | | $ | 2,098 | |
Total Collateralized Loan Obligations | | | 3,187,490,225 | |
| | | | | | | | | |
Financial - 3.2% | | | | | | | | |
Station Place Securitization Trust | | | | | | | | |
2021-3, 1.01% (1 Month USD LIBOR + 0.90%, Rate Floor: 0.90%) due 02/16/22†††,5,6 | | | 144,500,000 | | | | 144,500,000 | |
2020-16, 1.11% (1 Month USD LIBOR + 1.00%, Rate Floor: 1.00%) due 12/22/21†††,5,6 | | | 114,400,000 | | | | 114,400,000 | |
2021-7, 1.02% (1 Month USD LIBOR + 0.80%, Rate Floor: 0.80%) due 09/24/215,6 | | | 61,100,000 | | | | 61,100,000 | |
2021-SP1, 1.86% (1 Month USD LIBOR + 1.75%, Rate Floor: 1.75%) due 08/17/22†††,5,6 | | | 42,600,000 | | | | 42,600,000 | |
2020-12, 1.61% (1 Month USD LIBOR + 1.50%, Rate Floor: 0.00%) due 06/09/21†††,5,6 | | | 35,500,000 | | | | 35,500,000 | |
2020-5, 0.92% (1 Month USD LIBOR + 1.00%, Rate Floor: 0.00%) due 05/24/22†††,5,7 | | | 20,000,000 | | | | 20,000,000 | |
2020-WL1, 2.86% (1 Month USD LIBOR + 2.75%, Rate Floor: 0.00%) due 06/25/51†††,5,7 | | | 10,000,000 | | | | 10,000,000 | |
2021-WL1, 0.96% (1 Month USD LIBOR + 0.85%, Rate Floor: 0.85%) due 01/26/545,6 | | | 8,850,000 | | | | 8,847,181 | |
2021-WL1, 1.16% (1 Month USD LIBOR + 1.05%, Rate Floor: 1.05%) due 01/26/545,6 | | | 6,750,000 | | | | 6,747,854 | |
2021-WL1, 1.36% (1 Month USD LIBOR + 1.25%, Rate Floor: 1.25%) due 01/26/545,6 | | | 3,400,000 | | | | 3,398,921 | |
2020-WL1, 2.36% (1 Month USD LIBOR + 2.25%, Rate Floor: 0.00%) due 06/25/51†††,5,7 | | | 3,000,000 | | | | 3,000,000 | |
HV Eight LLC | | | | | | | | |
2.75% (3 Month Euribor + 2.75%, Rate Floor: 2.75%) due 12/28/25 | EUR | | 107,000,000 | | | | 125,469,043 | |
Aesf Vi Verdi LP | | | | | | | | |
2.15% due 11/25/24††† | EUR | | 49,173,889 | | | | 57,646,008 | |
2.40% due 11/25/24††† | | | 15,163,796 | | | | 15,002,611 | |
Strategic Partners Fund VIII LP | | | | | | | | |
3.11% due 03/10/25††† | | | 51,900,000 | | | | 52,875,749 | |
Oxford Finance Funding | | | | | | | | |
2020-1A, 3.10% due 02/15/286 | | | 23,750,000 | | | | 24,528,288 | |
Ceamer Finance LLC | | | | | | | | |
3.69% due 03/22/31 | | | 23,275,000 | | | | 22,809,500 | |
40 | THE GUGGENHEIM FUNDS SEMI-ANNUAL REPORT | SEE NOTES TO FINANCIAL STATEMENTS. |
SCHEDULE OF INVESTMENTS (Unaudited)(continued) | March 31, 2021 |
TOTAL RETURN BOND FUND | |
| | Face
Amount~ | | | Value | |
Madison Avenue Secured Funding Trust Series | | | | | | | | |
2020-1, 1.73% (1 Month USD LIBOR + 1.63%, Rate Floor: 0.00%) due 12/13/21†††,5,6 | | | 20,050,000 | | | $ | 20,050,000 | |
Nassau LLC | | | | | | | | |
2019-1, 3.98% due 08/15/346 | | | 17,499,849 | | | | 17,731,732 | |
Industrial DPR Funding Ltd. | | | | | | | | |
2016-1A, 5.24% due 04/15/266 | | | 3,132,118 | | | | 3,420,220 | |
Total Financial | | | | | | | 789,627,107 | |
| | | | | | | | | |
Transport-Aircraft - 1.6% | | | | |
Castlelake Aircraft Structured Trust | | | | | | | | |
2021-1A, 3.47% due 01/15/466 | | | 77,791,791 | | | | 78,989,801 | |
AASET Trust | | | | | | | | |
2020-1A, 3.35% due 01/16/406 | | | 28,696,468 | | | | 28,646,275 | |
2019-1, 3.84% due 05/15/396 | | | 13,955,786 | | | | 13,846,284 | |
2017-1A, 3.97% due 05/16/426 | | | 7,317,870 | | | | 7,331,918 | |
2019-2, 3.38% due 10/16/396 | | | 2,235,940 | | | | 2,245,420 | |
AASET US Ltd. | | | | | | | | |
2018-2A, 4.45% due 11/18/386 | | | 50,579,202 | | | | 50,987,229 | |
Castlelake Aircraft Securitization Trust | | | | | | | | |
2018-1, 4.13% due 06/15/436 | | | 25,939,039 | | | | 25,991,238 | |
2017-1, 3.97% due 07/15/42 | | | 12,347,794 | | | | 12,355,707 | |
2016-1, 4.45% due 08/15/41 | | | 374,060 | | | | 374,331 | |
Sapphire Aviation Finance I Ltd. | | | | | | | | |
2018-1A, 4.25% due 03/15/406 | | | 33,006,125 | | | | 32,838,913 | |
KDAC Aviation Finance Ltd. | | | | | | | | |
2017-1A, 4.21% due 12/15/426 | | | 33,919,253 | | | | 32,820,880 | |
Sapphire Aviation Finance II Ltd. | | | | | | | | |
2020-1A, 3.23% due 03/15/406 | | | 33,074,623 | | | | 32,813,293 | |
MAPS Ltd. | | | | | | | | |
2018-1A, 4.21% due 05/15/436 | | | 24,082,380 | | | | 24,308,757 | |
Falcon Aerospace Ltd. | | | | | | | | |
2019-1, 3.60% due 09/15/396 | | | 13,665,311 | | | | 13,772,879 | |
2017-1, 4.58% due 02/15/426 | | | 7,507,294 | | | | 7,580,136 | |
WAVE LLC | | | | | | | | |
2019-1, 3.60% due 09/15/446 | | | 12,916,203 | | | | 12,919,191 | |
AIM Aviation Finance Ltd. | | | | | | | | |
2015-1A, 4.21% due 02/15/406 | | | 14,830,389 | | | | 11,760,606 | |
Raspro Trust | | | | | | | | |
2005-1A, 1.15% (3 Month USD LIBOR + 0.93%, Rate Floor: 0.93%) due 03/23/245,6 | | | 10,546,044 | | | | 10,463,374 | |
Stripes Aircraft Ltd. | | | | | | | | |
2013-1 A1, 3.61% due 03/20/23††† | | | 623,686 | | | | 614,657 | |
Turbine Engines Securitization Ltd. | | | | | | | | |
2013-1A, 5.13% due 12/13/487 | | | 694,434 | | | | 555,547 | |
SEE NOTES TO FINANCIAL STATEMENTS. | THE GUGGENHEIM FUNDS SEMI-ANNUAL REPORT | 41 |
SCHEDULE OF INVESTMENTS (Unaudited)(continued) | March 31, 2021 |
TOTAL RETURN BOND FUND | |
| | Face
Amount~ | | | Value | |
Airplanes Pass Through Trust | | | | | | | | |
2001-1A, 1.26% (1 Month USD LIBOR + 0.55%, Rate Floor: 0.55%) due 03/15/19†††,7,15 | | | 409,604 | | | $ | 41 | |
Total Transport-Aircraft | | | | | | | 401,216,477 | |
| | | | | | | | | |
Whole Business - 1.1% | | | | |
Arbys Funding LLC | | | | | | | | |
2020-1A, 3.24% due 07/30/506 | | | 97,062,250 | | | | 98,963,699 | |
ServiceMaster Funding LLC | | | | | | | | |
2020-1, 3.34% due 01/30/516 | | | 29,300,000 | | | | 29,950,167 | |
2020-1, 2.84% due 01/30/516 | | | 9,800,000 | | | | 10,008,446 | |
SERVPRO Master Issuer LLC | | | | | | | | |
2021-1A, 2.39% due 04/25/516 | | | 30,200,000 | | | | 29,925,361 | |
Domino’s Pizza Master Issuer LLC | | | | | | | | |
2017-1A, 1.47% (3 Month USD LIBOR + 1.25%, Rate Floor: 0.00%) due 07/25/475,6 | | | 16,684,000 | | | | 16,682,999 | |
2017-1A, 4.12% due 07/25/476 | | | 10,427,500 | | | | 11,226,038 | |
Wingstop Funding LLC | | | | | | | | |
2020-1A, 2.84% due 12/05/506 | | | 25,500,000 | | | | 25,824,615 | |
Wendy’s Funding LLC | | | | | | | | |
2019-1A, 3.78% due 06/15/496 | | | 12,954,975 | | | | 13,710,380 | |
2015-1A, 4.50% due 06/15/456 | | | 7,938,000 | | | | 7,990,549 | |
2019-1A, 4.08% due 06/15/496 | | | 1,603,813 | | | | 1,692,712 | |
Taco Bell Funding LLC | | | | | | | | |
2016-1A, 4.97% due 05/25/466 | | | 14,774,375 | | | | 16,009,513 | |
Applebee’s Funding LLC / IHOP Funding LLC | | | | | | | | |
2019-1A, 4.72% due 06/07/496 | | | 3,482,500 | | | | 3,663,451 | |
2019-1A, 4.19% due 06/07/496 | | | 3,373,050 | | | | 3,463,785 | |
DB Master Finance LLC | | | | | | | | |
2019-1A, 4.35% due 05/20/496 | | | 591,000 | | | | 638,244 | |
Drug Royalty III Limited Partnership 1 | | | | | | | | |
2017-1A, 3.60% due 04/15/276 | | | 232,324 | | | | 232,729 | |
Total Whole Business | | | | | | | 269,982,688 | |
| | | | | | | | | |
Net Lease - 0.9% | | | | | | | | |
Capital Automotive REIT | | | | | | | | |
2020-1A, 3.48% due 02/15/506 | | | 22,222,827 | | | | 22,721,387 | |
2020-1A, 3.81% due 02/15/506 | | | 20,049,094 | | | | 20,227,811 | |
2014-1A, 3.66% due 10/15/446 | | | 10,940,717 | | | | 10,955,679 | |
Capital Automotive LLC | | | | | | | | |
2017-1A, 3.87% due 04/15/476 | | | 49,840,155 | | | | 49,921,903 | |
2017-1A, 4.18% due 04/15/476 | | | 275,107 | | | | 277,643 | |
Store Master Funding I-VII | | | | | | | | |
2016-1A, 3.96% due 10/20/466 | | | 28,598,769 | | | | 29,273,537 | |
2016-1A, 4.32% due 10/20/466 | | | 11,585,254 | | | | 11,993,509 | |
Oak Street Investment Grade Net Lease Fund Series | | | | | | | | |
2020-1A, 2.21% due 11/20/506 | | | 22,120,661 | | | | 22,028,639 | |
42 | THE GUGGENHEIM FUNDS SEMI-ANNUAL REPORT | SEE NOTES TO FINANCIAL STATEMENTS. |
SCHEDULE OF INVESTMENTS (Unaudited)(continued) | March 31, 2021 |
TOTAL RETURN BOND FUND | |
| | Face
Amount~ | | | Value | |
2020-1A, 2.26% due 11/20/506 | | | 15,000,000 | | | $ | 14,748,723 | |
CF Hippolyta LLC | | | | | | | | |
2020-1, 2.28% due 07/15/606 | | | 10,498,167 | | | | 10,671,030 | |
2020-1, 2.60% due 07/15/606 | | | 4,576,247 | | | | 4,557,900 | |
STORE Master Funding I LLC | | | | | | | | |
2015-1A, 4.17% due 04/20/456 | | | 9,654,679 | | | | 10,015,220 | |
STORE Master Funding LLC | | | | | | | | |
2014-1A, 5.00% due 04/20/446 | | | 4,346,250 | | | | 4,514,645 | |
2013-3A, 5.21% due 11/20/436 | | | 654,444 | | | | 670,341 | |
CARS-DB4, LP | | | | | | | | |
2020-1A, 3.25% due 02/15/506 | | | 3,529,661 | | | | 3,589,278 | |
Total Net Lease | | | | | | | 216,167,245 | |
| | | | | | | | | |
Collateralized Debt Obligations - 0.8% |
Anchorage Credit Funding 4 Ltd. | | | | | | | | |
2021-4A, 2.72% due 04/27/396 | | | 108,450,000 | | | | 107,639,542 | |
2021-4A, 3.12% due 04/27/396 | | | 23,000,000 | | | | 22,795,795 | |
Anchorage Credit Funding 3 Ltd. | | | | | | | | |
2021-3A, 2.87% due 01/28/396 | | | 54,000,000 | | | | 53,687,000 | |
Putnam Structured Product Funding Ltd. | | | | | | | | |
2003-1A, 1.18% (1 Month USD LIBOR + 1.00%, Rate Floor: 0.00%) due 10/15/385,7 | | | 1,415,186 | | | | 1,408,407 | |
Total Collateralized Debt Obligations | | | 185,530,744 | |
| | | | | | | | | |
Infrastructure - 0.7% | | | | |
SBA Tower Trust | | | | | | | | |
2.33% due 01/15/286 | | | 140,500,000 | | | | 142,703,054 | |
Secured Tenant Site Contract Revenue Notes Series | | | | | | | | |
2018-1A, 3.97% due 06/15/486 | | | 21,806,511 | | | | 22,293,680 | |
Diamond Issuer LLC | | | | | | | | |
2020-1A, 2.74% due 07/20/506 | | | 7,900,000 | | | | 7,917,806 | |
Total Infrastructure | | | | | | | 172,914,540 | |
| | | | | | | | | |
Transport-Container - 0.5% |
Textainer Marine Containers VII Ltd. | | | | | | | | |
2020-1A, 2.73% due 08/21/456 | | | 64,570,585 | | | | 65,701,028 | |
CLI Funding VI LLC | | | | | | | | |
2020-3A, 2.07% due 10/18/456 | | | 26,814,333 | | | | 26,815,687 | |
2020-1A, 2.08% due 09/18/456 | | | 5,640,000 | | | | 5,621,296 | |
CAL Funding IV Ltd. | | | | | | | | |
2020-1A, 2.22% due 09/25/456 | | | 21,065,000 | | | | 21,095,622 | |
Textainer Marine Containers VIII Ltd. | | | | | | | | |
2020-2A, 2.10% due 09/20/456 | | | 11,200,242 | | | | 11,221,750 | |
Total Transport-Container | | | 130,455,383 | |
| | | | | | | | | |
Diversified Payment Rights - 0.1% |
Bib Merchant Voucher Receivables Ltd. | | | | | | | | |
4.18% due 04/07/28††† | | | 21,400,000 | | | | 22,874,527 | |
CCR Incorporated MT100 Payment Rights Master Trust | | | | | | | | |
2012-CA, 4.75% due 07/10/226 | | | 180,952 | | | | 183,638 | |
Total Diversified Payment Rights | | | 23,058,165 | |
| | | | | | | | | |
Insurance - 0.0% | | | | | | | | |
Chesterfield Financial Holdings LLC | | | | | | | | |
2014-1A, 4.50% due 12/15/346 | | | 2,475,000 | | | | 2,538,353 | |
SEE NOTES TO FINANCIAL STATEMENTS. | THE GUGGENHEIM FUNDS SEMI-ANNUAL REPORT | 43 |
SCHEDULE OF INVESTMENTS (Unaudited)(continued) | March 31, 2021 |
TOTAL RETURN BOND FUND | |
| | Face
Amount~ | | | Value | |
321 Henderson Receivables VI LLC | | | | | | | | |
2010-1A, 5.56% due 07/15/596 | | | 1,153,817 | | | $ | 1,269,401 | |
JGWPT XXV LLC | | | | | | | | |
2012-1A, 4.21% due 02/16/656 | | | 493,383 | | | | 548,421 | |
JG Wentworth XXXV LLC | | | | | | | | |
2015-2A, 3.87% due 03/15/586 | | | 38,722 | | | | 42,136 | |
Total Insurance | | | | | | | 4,398,311 | |
| | | | | | | | | |
Transport-Rail - 0.0% |
TRIP Rail Master Funding LLC | | | | | | | | |
2017-1A, 2.71% due 08/15/476 | | | 414,323 | | | | 414,590 | |
Total Asset-Backed Securities | | | | |
(Cost $5,359,346,764) | | | 5,381,255,475 | |
| | | | | | | | | |
COLLATERALIZED MORTGAGE OBLIGATIONS†† - 11.6% |
Residential Mortgage Backed Securities - 7.0% |
CSMC Trust | | | | | | | | |
2020-RPL5, 3.02% (WAC) due 08/25/605,6 | | | 103,007,440 | | | | 104,695,742 | |
2021-RPL1, 1.67% (WAC) due 09/27/605,6 | | | 40,322,053 | | | | 40,222,735 | |
2018-RPL9, 3.85% (WAC) due 09/25/575,6 | | | 30,327,847 | | | | 32,157,638 | |
2020-NQM1, 1.72% due 05/25/656,10 | | | 11,815,062 | | | | 11,821,843 | |
FKRT | | | | | | | | |
2020-C2A, 3.25% due 12/30/23†††,7 | | | 113,927,996 | | | | 114,064,710 | |
Morgan Stanley ABS Capital I Incorporated Trust | | | | | | | | |
2006-NC5, 0.26% (1 Month USD LIBOR + 0.15%, Rate Floor: 0.15%) due 10/25/365 | | | 30,295,035 | | | | 20,062,802 | |
2007-HE5, 0.45% (1 Month USD LIBOR + 0.34%, Rate Floor: 0.34%) due 03/25/375 | | | 31,973,137 | | | | 17,882,364 | |
2006-HE6, 0.35% (1 Month USD LIBOR + 0.24%, Rate Floor: 0.24%) due 09/25/365 | | | 25,780,390 | | | | 12,617,709 | |
2006-HE4, 0.59% (1 Month USD LIBOR + 0.48%, Rate Floor: 0.48%) due 06/25/365 | | | 10,177,337 | | | | 6,832,113 | |
2006-NC1, 0.68% (1 Month USD LIBOR + 0.57%, Rate Floor: 0.57%) due 12/25/355 | | | 6,331,198 | | | | 6,303,168 | |
2007-HE2, 0.24% (1 Month USD LIBOR + 0.13%, Rate Floor: 0.13%) due 01/25/375 | | | 9,513,372 | | | | 5,852,061 | |
2007-HE3, 0.22% (1 Month USD LIBOR + 0.11%, Rate Floor: 0.11%) due 12/25/365 | | | 6,732,294 | | | | 4,309,803 | |
2007-HE6, 0.17% (1 Month USD LIBOR + 0.06%, Rate Floor: 0.06%) due 05/25/375 | | | 3,369,400 | | | | 3,047,253 | |
2007-NC3, 0.30% (1 Month USD LIBOR + 0.19%, Rate Floor: 0.19%) due 05/25/375 | | | 2,595,468 | | | | 2,213,465 | |
2007-HE3, 0.24% (1 Month USD LIBOR + 0.13%, Rate Floor: 0.13%) due 12/25/365,6 | | | 2,473,190 | | | | 1,801,887 | |
44 | THE GUGGENHEIM FUNDS SEMI-ANNUAL REPORT | SEE NOTES TO FINANCIAL STATEMENTS. |
SCHEDULE OF INVESTMENTS (Unaudited)(continued) | March 31, 2021 |
TOTAL RETURN BOND FUND | |
| | Face
Amount~ | | | Value | |
LSTAR Securities Investment Ltd. | | | | | | | | |
2021-1, 1.92% (1 Month USD LIBOR + 1.80%, Rate Floor: 1.80%) due 02/01/265,7 | | | 75,462,614 | | | $ | 75,666,061 | |
2021-2, 1.82% (1 Month USD LIBOR + 1.70%, Rate Floor: 1.70%) due 03/02/265,7 | | | 39,789,480 | | | | 39,761,962 | |
Home Equity Loan Trust | | | | | | | | |
2007-FRE1, 0.30% (1 Month USD LIBOR + 0.19%, Rate Floor: 0.19%) due 04/25/375 | | | 76,127,847 | | | | 71,735,833 | |
Soundview Home Loan Trust | | | | | | | | |
2006-OPT5, 0.25% (1 Month USD LIBOR + 0.14%, Rate Floor: 0.14%) due 07/25/365 | | | 58,386,699 | | | | 57,119,801 | |
2005-OPT3, 0.81% (1 Month USD LIBOR + 0.71%, Rate Floor: 0.71%) due 11/25/355 | | | 11,827,261 | | | | 11,799,080 | |
JP Morgan Mortgage Acquisition Trust | | | | | | | | |
2006-WMC4, 0.24% (1 Month USD LIBOR + 0.13%, Rate Floor: 0.13%) due 12/25/365 | | | 76,186,546 | | | | 56,479,700 | |
2006-WMC4, 0.23% (1 Month USD LIBOR + 0.12%, Rate Floor: 0.12%) due 12/25/365 | | | 13,676,831 | | | | 8,787,182 | |
Verus Securitization Trust | | | | | | | | |
2020-1, 2.42% due 01/25/606,10 | | | 23,827,067 | | | | 24,081,316 | |
2019-4, 2.64% due 11/25/596,10 | | | 20,387,661 | | | | 20,749,304 | |
Starwood Mortgage Residential Trust | | | | | | | | |
2020-1, 2.28% (WAC) due 02/25/505,6 | | | 18,795,599 | | | | 19,141,457 | |
2020-1, 2.56% (WAC) due 02/25/505,6 | | | 12,023,568 | | | | 12,155,477 | |
2020-1, 2.41% (WAC) due 02/25/505,6 | | | 9,248,898 | | | | 9,399,621 | |
2019-1, 2.94% (WAC) due 06/25/495,6 | | | 1,428,308 | | | | 1,436,707 | |
NovaStar Mortgage Funding Trust Series | | | | | | | | |
2007-2, 0.31% (1 Month USD LIBOR + 0.20%, Rate Cap/Floor: 11.00%/0.20%) due 09/25/375 | | | 39,485,327 | | | | 38,709,393 | |
2007-1, 0.24% (1 Month USD LIBOR + 0.13%, Rate Cap/Floor: 11.00%/0.13%) due 03/25/375 | | | 3,551,224 | | | | 2,695,595 | |
Citigroup Mortgage Loan Trust, Inc. | | | | | | | | |
2007-AMC1, 0.27% (1 Month USD LIBOR + 0.16%, Rate Floor: 0.16%) due 12/25/365,6 | | | 26,613,342 | | | | 17,761,720 | |
2005-HE3, 0.84% (1 Month USD LIBOR + 0.74%, Rate Floor: 0.74%) due 09/25/355 | | | 8,884,630 | | | | 8,869,735 | |
SEE NOTES TO FINANCIAL STATEMENTS. | THE GUGGENHEIM FUNDS SEMI-ANNUAL REPORT | 45 |
SCHEDULE OF INVESTMENTS (Unaudited)(continued) | March 31, 2021 |
TOTAL RETURN BOND FUND | |
| | Face
Amount~ | | | Value | |
2007-AMC3, 0.29% (1 Month USD LIBOR + 0.18%, Rate Floor: 0.18%) due 03/25/375 | | | 8,068,059 | | | $ | 7,373,226 | |
2006-WF1, 5.21% due 03/25/36 | | | 9,535,330 | | | | 6,549,427 | |
GSAMP Trust | | | | | | | | |
2007-NC1, 0.24% (1 Month USD LIBOR + 0.13%, Rate Floor: 0.13%) due 12/25/465 | | | 30,706,348 | | | | 20,430,969 | |
2006-HE8, 0.34% (1 Month USD LIBOR + 0.23%, Rate Floor: 0.23%) due 01/25/375 | | | 10,107,000 | | | | 8,885,205 | |
2006-NC2, 0.41% (1 Month USD LIBOR + 0.30%, Rate Floor: 0.30%) due 06/25/365 | | | 7,636,831 | | | | 5,468,569 | |
2007-NC1, 0.26% (1 Month USD LIBOR + 0.15%, Rate Floor: 0.15%) due 12/25/465 | | | 6,851,035 | | | | 4,497,122 | |
2005-HE6, 0.77% (1 Month USD LIBOR + 0.66%, Rate Floor: 0.66%) due 11/25/355 | | | 45,667 | | | | 45,658 | |
Alternative Loan Trust | | | | | | | | |
2007-OA4, 0.28% (1 Month USD LIBOR + 0.17%, Rate Floor: 0.17%) due 05/25/475 | | | 21,993,650 | | | | 20,803,406 | |
2007-OH3, 0.40% (1 Month USD LIBOR + 0.29%, Rate Cap/Floor: 10.00%/0.29%) due 09/25/475 | | | 8,352,935 | | | | 7,959,535 | |
2006-43CB, 6.00% (1 Month USD LIBOR + 0.50%, Rate Cap/Floor: 6.00%/6.00%) due 02/25/375 | | | 7,462,193 | | | | 5,846,783 | |
2007-OA7, 0.29% (1 Month USD LIBOR + 0.18%, Rate Floor: 0.18%) due 05/25/475 | | | 3,431,134 | | | | 3,266,722 | |
2007-OH3, 0.33% (1 Month USD LIBOR + 0.22%, Rate Cap/Floor: 10.00%/0.22%) due 09/25/475 | | | 830,312 | | | | 786,197 | |
Structured Asset Securities Corporation Mortgage Loan Trust | | | | | | | | |
2008-BC4, 0.74% (1 Month USD LIBOR + 0.63%, Rate Floor: 0.63%) due 11/25/375 | | | 34,296,259 | | | | 33,761,608 | |
2006-BC4, 0.28% (1 Month USD LIBOR + 0.17%, Rate Floor: 0.17%) due 12/25/365 | | | 4,183,202 | | | | 4,107,300 | |
2006-BC6, 0.28% (1 Month USD LIBOR + 0.17%, Rate Floor: 0.17%) due 01/25/375 | | | 404,371 | | | | 402,013 | |
2006-OPT1, 0.37% (1 Month USD LIBOR + 0.26%, Rate Floor: 0.26%) due 04/25/365 | | | 108,597 | | | | 107,648 | |
46 | THE GUGGENHEIM FUNDS SEMI-ANNUAL REPORT | SEE NOTES TO FINANCIAL STATEMENTS. |
SCHEDULE OF INVESTMENTS (Unaudited)(continued) | March 31, 2021 |
TOTAL RETURN BOND FUND | |
| | Face
Amount~ | | | Value | |
BRAVO Residential Funding Trust | | | | | | | | |
2019-NQM1, 2.67% (WAC) due 07/25/595,6 | | | 18,756,307 | | | $ | 18,969,457 | |
2019-NQM2, 2.75% (WAC) due 11/25/595,6 | | | 11,502,769 | | | | 11,862,228 | |
2021-HE1, 1.52% (30 Day Average U.S. Secured Overnight Financing Rate + 1.50%, Rate Floor: 0.00%) due 01/25/705,6 | | | 7,500,000 | | | | 7,481,458 | |
CIT Mortgage Loan Trust | | | | | | | | |
2007-1, 1.46% (1 Month USD LIBOR + 1.35%, Rate Floor: 1.35%) due 10/25/375,6 | | | 33,404,344 | | | | 33,578,383 | |
CIM Trust | | | | | | | | |
2018-R4, 4.07% (WAC) due 12/26/575,6 | | | 21,953,525 | | | | 22,040,953 | |
2018-R2, 3.69% (WAC) due 08/25/575,6 | | | 9,485,301 | | | | 9,501,646 | |
Washington Mutual Mortgage Pass-Through Certificates WMALT Series Trust | | | | | | | | |
2006-AR10, 0.28% (1 Month USD LIBOR + 0.17%, Rate Floor: 0.17%) due 12/25/365 | | | 12,887,558 | | | | 12,495,764 | |
2006-AR9, 1.09% (1 Year CMT Rate + 0.83%, Rate Floor: 0.83%) due 11/25/465 | | | 11,361,506 | | | | 10,337,666 | |
2006-AR9, 1.10% (1 Year CMT Rate + 0.84%, Rate Floor: 0.84%) due 11/25/465 | | | 5,248,820 | | | | 4,508,739 | |
2006-7, 4.18% due 09/25/36 | | | 2,366,906 | | | | 985,237 | |
2006-8, 4.24% due 10/25/36 | | | 396,677 | | | | 197,472 | |
ACE Securities Corporation Home Equity Loan Trust Series | | | | | | | | |
2006-NC1, 0.72% (1 Month USD LIBOR + 0.62%, Rate Floor: 0.62%) due 12/25/355 | | | 16,761,000 | | | | 16,153,757 | |
2005-HE2, 1.13% (1 Month USD LIBOR + 1.02%, Rate Floor: 1.02%) due 04/25/355 | | | 7,670,085 | | | | 7,660,312 | |
2007-WM2, 0.32% (1 Month USD LIBOR + 0.21%, Rate Floor: 0.21%) due 02/25/375 | | | 7,522,144 | | | | 4,379,491 | |
New Residential Mortgage Loan Trust | | | | | | | | |
2019-6A, 3.50% (WAC) due 09/25/595,6 | | | 13,086,199 | | | | 13,791,951 | |
2018-1A, 4.00% (WAC) due 12/25/575,6 | | | 10,705,132 | | | | 11,427,060 | |
2018-2A, 3.50% (WAC) due 02/25/585,6 | | | 2,736,314 | | | | 2,855,936 | |
Cascade Funding Mortgage Trust | | | | | | | | |
2018-RM2, 4.00% (WAC) due 10/25/685,7 | | | 14,811,902 | | | | 15,425,992 | |
SEE NOTES TO FINANCIAL STATEMENTS. | THE GUGGENHEIM FUNDS SEMI-ANNUAL REPORT | 47 |
SCHEDULE OF INVESTMENTS (Unaudited)(continued) | March 31, 2021 |
TOTAL RETURN BOND FUND | |
| | Face
Amount~ | | | Value | |
2019-RM3, 2.80% (WAC) due 06/25/695,7 | | | 11,319,798 | | | $ | 11,574,305 | |
HSI Asset Securitization Corporation Trust | | | | | | | | |
2006-OPT2, 0.69% (1 Month USD LIBOR + 0.59%, Rate Floor: 0.59%) due 01/25/365 | | | 27,052,690 | | | | 26,972,182 | |
Homeward Opportunities Fund I Trust | | | | | | | | |
2019-3, 2.68% (WAC) due 11/25/595,6 | | | 15,300,043 | | | | 15,486,441 | |
2019-2, 2.70% (WAC) due 09/25/595,6 | | | 10,651,101 | | | | 10,713,066 | |
American Home Mortgage Investment Trust | | | | | | | | |
2007-1, 2.08% due 05/25/4711 | | | 156,060,784 | | | | 24,685,664 | |
RALI Series Trust | | | | | | | | |
2007-QO4, 0.30% (1 Month USD LIBOR + 0.19%, Rate Floor: 0.19%) due 05/25/475 | | | 6,343,105 | | | | 6,092,834 | |
2006-QO2, 0.55% (1 Month USD LIBOR + 0.44%, Rate Floor: 0.44%) due 02/25/465 | | | 18,253,609 | | | | 5,594,536 | |
2007-QO2, 0.26% (1 Month USD LIBOR + 0.15%, Rate Floor: 0.15%) due 02/25/475 | | | 9,013,901 | | | | 4,742,423 | |
2006-QO2, 0.65% (1 Month USD LIBOR + 0.54%, Rate Floor: 0.54%) due 02/25/465 | | | 5,919,553 | | | | 1,886,095 | |
2006-QO6, 0.47% (1 Month USD LIBOR + 0.36%, Rate Floor: 0.36%) due 06/25/465 | | | 5,152,478 | | | | 1,728,706 | |
2007-QO3, 0.43% (1 Month USD LIBOR + 0.32%, Rate Floor: 0.32%) due 03/25/475 | | | 1,234,143 | | | | 1,178,147 | |
IXIS Real Estate Capital Trust | | | | | | | | |
2007-HE1, 0.22% (1 Month USD LIBOR + 0.11%, Rate Floor: 0.11%) due 05/25/375 | | | 29,213,551 | | | | 9,964,956 | |
2006-HE1, 0.71% (1 Month USD LIBOR + 0.60%, Rate Floor: 0.60%) due 03/25/365 | | | 13,490,577 | | | | 8,825,492 | |
2007-HE1, 0.34% (1 Month USD LIBOR + 0.23%, Rate Floor: 0.23%) due 05/25/375 | | | 3,328,363 | | | | 1,156,779 | |
2007-HE1, 0.17% (1 Month USD LIBOR + 0.06%, Rate Floor: 0.06%) due 05/25/375 | | | 2,723,096 | | | | 921,038 | |
Lehman XS Trust Series | | | | | | | | |
2007-4N, 0.31% (1 Month USD LIBOR + 0.20%, Rate Floor: 0.20%) due 03/25/475 | | | 11,518,978 | | | | 11,551,047 | |
48 | THE GUGGENHEIM FUNDS SEMI-ANNUAL REPORT | SEE NOTES TO FINANCIAL STATEMENTS. |
SCHEDULE OF INVESTMENTS (Unaudited)(continued) | March 31, 2021 |
TOTAL RETURN BOND FUND | |
| | Face
Amount~ | | | Value | |
2007-2N, 0.29% (1 Month USD LIBOR + 0.18%, Rate Floor: 0.18%) due 02/25/375 | | | 6,395,624 | | | $ | 6,285,773 | |
2007-15N, 0.36% (1 Month USD LIBOR + 0.25%, Rate Floor: 0.00%) due 08/25/375 | | | 2,554,907 | | | | 2,436,284 | |
2006-10N, 0.53% (1 Month USD LIBOR + 0.42%, Rate Floor: 0.42%) due 07/25/465 | | | 467,694 | | | | 473,952 | |
Residential Mortgage Loan Trust | | | | | | | | |
2020-1, 2.38% (WAC) due 02/25/245,6 | | | 15,611,337 | | | | 15,794,661 | |
2020-1, 2.68% (WAC) due 02/25/245,6 | | | 3,884,681 | | | | 3,914,025 | |
SPS Servicer Advance Receivables Trust | | | | | | | | |
2020-T2, 1.83% due 11/15/556 | | | 20,000,000 | | | | 19,616,572 | |
Bear Stearns Asset Backed Securities I Trust | | | | | | | | |
2006-HE9, 0.25% (1 Month USD LIBOR + 0.14%, Rate Floor: 0.14%) due 11/25/365 | | | 20,163,046 | | | | 19,558,875 | |
First NLC Trust | | | | | | | | |
2005-4, 0.89% (1 Month USD LIBOR + 0.78%, Rate Cap/Floor: 14.00%/0.78%) due 02/25/365 | | | 16,665,485 | | | | 16,461,030 | |
2005-1, 0.56% (1 Month USD LIBOR + 0.46%, Rate Cap/Floor: 14.00%/0.46%) due 05/25/355 | | | 2,689,787 | | | | 2,591,662 | |
Argent Securities Incorporated Asset-Backed Pass-Through Certificates Series | | | | | | | | |
2005-W4, 0.87% (1 Month USD LIBOR + 0.76%, Rate Floor: 0.76%) due 02/25/365 | | | 12,191,257 | | | | 11,075,265 | |
2005-W2, 0.84% (1 Month USD LIBOR + 0.74%, Rate Floor: 0.74%) due 10/25/355 | | | 6,220,411 | | | | 6,212,570 | |
ABFC Trust | | | | | | | | |
2007-WMC1, 1.36% (1 Month USD LIBOR + 1.25%, Rate Floor: 1.25%) due 06/25/375 | | | 18,923,330 | | | | 16,738,385 | |
Merrill Lynch Mortgage Investors Trust Series | | | | | | | | |
2007-HE2, 0.37% (1 Month USD LIBOR + 0.26%, Rate Floor: 0.26%) due 02/25/375 | | | 21,467,422 | | | | 8,948,955 | |
2006-HE6, 0.39% (1 Month USD LIBOR + 0.28%, Rate Floor: 0.28%) due 11/25/375 | | | 10,222,066 | | | | 6,994,315 | |
SEE NOTES TO FINANCIAL STATEMENTS. | THE GUGGENHEIM FUNDS SEMI-ANNUAL REPORT | 49 |
SCHEDULE OF INVESTMENTS (Unaudited)(continued) | March 31, 2021 |
TOTAL RETURN BOND FUND | |
| | Face
Amount~ | | | Value | |
HarborView Mortgage Loan Trust | | | | | | | | |
2006-14, 0.26% (1 Month USD LIBOR + 0.15%, Rate Floor: 0.15%) due 01/25/475 | | | 9,252,282 | | | $ | 8,678,300 | |
2006-12, 0.30% (1 Month USD LIBOR + 0.19%, Rate Floor: 0.19%) due 01/19/385 | | | 7,223,518 | | | | 6,908,450 | |
SG Residential Mortgage Trust | | | | | | | | |
2019-3, 2.70% (WAC) due 09/25/595,6 | | | 15,354,618 | | | | 15,573,584 | |
Angel Oak Mortgage Trust | | | | | | | | |
2020-1, 2.77% (WAC) due 12/25/595,6 | | | 9,141,160 | | | | 9,226,822 | |
2020-1, 2.67% (WAC) due 12/25/595,6 | | | 6,063,544 | | | | 6,125,632 | |
Securitized Asset Backed Receivables LLC Trust | | | | | | | | |
2006-WM4, 0.19% (1 Month USD LIBOR + 0.08%, Rate Floor: 0.08%) due 11/25/365 | | | 33,109,956 | | | | 12,983,063 | |
2006-HE2, 0.41% (1 Month USD LIBOR + 0.30%, Rate Floor: 0.30%) due 07/25/365 | | | 3,799,177 | | | | 2,128,380 | |
Merrill Lynch Alternative Note Asset Trust Series | | | | | | | | |
2007-A1, 0.34% (1 Month USD LIBOR + 0.23%, Rate Floor: 0.23%) due 01/25/375 | | | 22,370,297 | | | | 9,843,732 | |
2007-A1, 0.26% (1 Month USD LIBOR + 0.15%, Rate Floor: 0.15%) due 01/25/375 | | | 8,483,190 | | | | 3,661,062 | |
First Franklin Mortgage Loan Trust | | | | | | | | |
2006-FF3, 0.69% (1 Month USD LIBOR + 0.58%, Rate Floor: 0.58%) due 02/25/365 | | | 8,616,000 | | | | 8,532,744 | |
2004-FF10, 1.38% (1 Month USD LIBOR + 1.28%, Rate Floor: 1.28%) due 07/25/345 | | | 4,158,098 | | | | 4,174,362 | |
Deephaven Residential Mortgage Trust | | | | | | | | |
2019-3A, 2.96% (WAC) due 07/25/595,6 | | | 11,894,595 | | | | 11,979,939 | |
Citigroup Mortgage Loan Trust | | | | | | | | |
2019-IMC1, 2.72% (WAC) due 07/25/495,6 | | | 11,266,160 | | | | 11,472,497 | |
Credit-Based Asset Servicing and Securitization LLC | | | | | | | | |
2006-CB2, 0.49% (1 Month USD LIBOR + 0.38%, Rate Floor: 0.38%) due 12/25/365 | | | 11,599,421 | | | | 11,319,495 | |
50 | THE GUGGENHEIM FUNDS SEMI-ANNUAL REPORT | SEE NOTES TO FINANCIAL STATEMENTS. |
SCHEDULE OF INVESTMENTS (Unaudited)(continued) | March 31, 2021 |
TOTAL RETURN BOND FUND | |
| | Face
Amount~ | | | Value | |
Asset-Backed Securities Corporation Home Equity Loan Trust Series AEG | | | | | | | | |
2006-HE1, 0.71% (1 Month USD LIBOR + 0.60%, Rate Floor: 0.60%) due 01/25/365 | | | 10,072,000 | | | $ | 9,879,090 | |
Master Asset Backed Securities Trust | | | | | | | | |
2006-NC2, 0.59% (1 Month USD LIBOR + 0.48%, Rate Floor: 0.48%) due 08/25/365 | �� | | 8,915,460 | | | | 4,772,913 | |
2006-WMC4, 0.26% (1 Month USD LIBOR + 0.15%, Rate Floor: 0.15%) due 10/25/365 | | | 6,639,185 | | | | 2,931,613 | |
2006-WMC3, 0.27% (1 Month USD LIBOR + 0.16%, Rate Floor: 0.16%) due 08/25/365 | | | 3,874,336 | | | | 1,792,765 | |
Wachovia Asset Securitization Issuance II LLC Trust | | | | | | | | |
2007-HE2A, 0.25% (1 Month USD LIBOR + 0.13%, Rate Floor: 0.13%) due 07/25/375,6 | | | 5,194,458 | | | | 4,878,053 | |
2007-HE1, 0.26% (1 Month USD LIBOR + 0.14%, Rate Floor: 0.14%) due 07/25/375,6 | | | 4,204,945 | | | | 4,010,669 | |
WaMu Asset-Backed Certificates WaMu Series | | | | | | | | |
2007-HE4, 0.28% (1 Month USD LIBOR + 0.17%, Rate Floor: 0.17%) due 07/25/475 | | | 5,889,952 | | | | 4,935,622 | |
2007-HE4, 0.36% (1 Month USD LIBOR + 0.25%, Rate Floor: 0.25%) due 07/25/475 | | | 4,224,264 | | | | 3,188,791 | |
WaMu Mortgage Pass-Through Certificates Series Trust | | | | | | | | |
2007-OA6, 1.07% (1 Year CMT Rate + 0.81%, Rate Floor: 0.81%) due 07/25/475 | | | 6,196,025 | | | | 5,171,557 | |
2006-AR13, 1.14% (1 Year CMT Rate + 0.88%, Rate Floor: 0.88%) due 10/25/465 | | | 1,861,800 | | | | 1,746,559 | |
2006-AR11, 1.18% (1 Year CMT Rate + 0.92%, Rate Floor: 0.92%) due 09/25/465 | | | 1,011,622 | | | | 995,723 | |
Impac Secured Assets CMN Owner Trust | | | | | | | | |
2005-2, 0.61% (1 Month USD LIBOR + 0.50%, Rate Floor: 0.50%) due 03/25/365 | | | 8,522,345 | | | | 7,887,789 | |
SEE NOTES TO FINANCIAL STATEMENTS. | THE GUGGENHEIM FUNDS SEMI-ANNUAL REPORT | 51 |
SCHEDULE OF INVESTMENTS (Unaudited)(continued) | March 31, 2021 |
TOTAL RETURN BOND FUND | |
| | Face
Amount~ | | | Value | |
American Home Mortgage Assets Trust | | | | | | | | |
2006-4, 0.30% (1 Month USD LIBOR + 0.19%, Rate Floor: 0.19%) due 10/25/465 | | | 8,990,919 | | | $ | 5,810,765 | |
2006-6, 0.30% (1 Month USD LIBOR + 0.19%, Rate Floor: 0.19%) due 12/25/465 | | | 1,977,654 | | | | 1,690,083 | |
GSAA Home Equity Trust | | | | | | | | |
2006-5, 0.47% (1 Month USD LIBOR + 0.36%, Rate Floor: 0.36%) due 03/25/365 | | | 14,761,408 | | | | 7,005,600 | |
2007-7, 0.65% (1 Month USD LIBOR + 0.54%, Rate Floor: 0.54%) due 07/25/375 | | | 126,532 | | | | 124,656 | |
CSMC Series | | | | | | | | |
2015-12R, 0.63% (WAC) due 11/30/375,6 | | | 6,259,113 | | | | 6,243,915 | |
Long Beach Mortgage Loan Trust | | | | | | | | |
2006-8, 0.27% (1 Month USD LIBOR + 0.16%, Rate Floor: 0.16%) due 09/25/365 | | | 7,950,906 | | | | 3,129,069 | |
2006-6, 0.36% (1 Month USD LIBOR + 0.25%, Rate Floor: 0.25%) due 07/25/365 | | | 5,145,916 | | | | 2,718,413 | |
Deutsche Alt-A Securities Mortgage Loan Trust Series 2006-AR4 | | | | | | | | |
2006-AR4, 0.37% (1 Month USD LIBOR + 0.26%, Rate Floor: 0.26%) due 12/25/365 | | | 11,488,682 | | | | 5,632,555 | |
Structured Asset Investment Loan Trust | | | | | | | | |
2005-11, 0.83% (1 Month USD LIBOR + 0.72%, Rate Floor: 0.72%) due 01/25/365 | | | 3,784,195 | | | | 3,764,500 | |
2006-3, 0.26% (1 Month USD LIBOR + 0.15%, Rate Floor: 0.15%) due 06/25/365 | | | 683,301 | | | | 670,584 | |
2004-BNC2, 1.31% (1 Month USD LIBOR + 1.20%, Rate Floor: 1.20%) due 12/25/345 | | | 662,167 | | | | 663,023 | |
ASG Resecuritization Trust | | | | | | | | |
2010-3, 0.71% (1 Month USD LIBOR + 0.29%, Rate Cap/Floor: 10.50%/0.29%) due 12/28/455,6 | | | 4,100,867 | | | | 4,057,658 | |
Option One Mortgage Loan Trust | | | | | | | | |
2007-2, 0.36% (1 Month USD LIBOR + 0.25%, Rate Floor: 0.25%) due 03/25/375 | | | 5,974,369 | | | | 3,776,054 | |
52 | THE GUGGENHEIM FUNDS SEMI-ANNUAL REPORT | SEE NOTES TO FINANCIAL STATEMENTS. |
SCHEDULE OF INVESTMENTS (Unaudited)(continued) | March 31, 2021 |
TOTAL RETURN BOND FUND | |
| | Face
Amount~ | | | Value | |
CWABS Asset-Backed Certificates Trust | | | | | | | | |
2004-15, 1.46% (1 Month USD LIBOR + 1.35%, Rate Floor: 1.35%) due 04/25/355 | | | 3,434,647 | | | $ | 3,438,629 | |
Morgan Stanley Capital I Incorporated Trust | | | | | | | | |
2006-HE1, 0.69% (1 Month USD LIBOR + 0.58%, Rate Floor: 0.58%) due 01/25/365 | | | 3,007,543 | | | | 2,957,591 | |
Deutsche Alt-A Securities Mortgage Loan Trust Series | | | | | | | | |
2007-OA2, 1.03% (1 Year CMT Rate + 0.77%, Rate Floor: 0.77%) due 04/25/475 | | | 2,944,070 | | | | 2,828,693 | |
Finance of America HECM Buyout | | | | | | | | |
2021-HB1, 2.08% (WAC) due 02/25/315,6 | | | 2,600,000 | | | | 2,586,731 | |
Nationstar HECM Loan Trust | | | | | | | | |
2019-2A, 2.27% (WAC) due 11/25/295,6 | | | 2,503,176 | | | | 2,507,742 | |
Morgan Stanley Resecuritization Trust | | | | | | | | |
2014-R9, 0.25% (1 Month USD LIBOR + 0.14%, Rate Floor: 0.14%) due 11/26/465,6 | | | 2,398,535 | | | | 2,306,289 | |
Nomura Resecuritization Trust | | | | | | | | |
2015-4R, 1.81% (1 Month USD LIBOR + 0.43%, Rate Floor: 0.43%) due 03/26/365,6 | | | 1,175,203 | | | | 1,169,570 | |
2015-4R, 0.60% (1 Month USD LIBOR + 0.39%, Rate Floor: 0.39%) due 12/26/365,6 | | | 434,331 | | | | 428,593 | |
GE-WMC Asset-Backed Pass-Through Certificates Series | | | | | | | | |
2005-2, 0.61% (1 Month USD LIBOR + 0.50%, Rate Floor: 0.50%) due 12/25/355 | | | 1,481,039 | | | | 1,479,224 | |
Countrywide Asset-Backed Certificates | | | | | | | | |
2005-15, 0.56% (1 Month USD LIBOR + 0.45%, Rate Floor: 0.45%) due 03/25/365 | | | 1,500,000 | | | | 1,461,137 | |
Impac Secured Assets Trust | | | | | | | | |
2006-2, 0.45% (1 Month USD LIBOR + 0.34%, Rate Cap/Floor: 11.50%/0.34%) due 08/25/365 | | | 1,153,935 | | | | 1,031,207 | |
Alliance Bancorp Trust | | | | | | | | |
2007-OA1, 0.35% (1 Month USD LIBOR + 0.24%, Rate Floor: 0.24%) due 07/25/375 | | | 766,986 | | | | 712,326 | |
SEE NOTES TO FINANCIAL STATEMENTS. | THE GUGGENHEIM FUNDS SEMI-ANNUAL REPORT | 53 |
SCHEDULE OF INVESTMENTS (Unaudited)(continued) | March 31, 2021 |
TOTAL RETURN BOND FUND | |
| | Face
Amount~ | | | Value | |
UCFC Manufactured Housing Contract | | | | | | | | |
1997-2, 7.38% due 10/15/28 | | | 343,455 | | | $ | 350,171 | |
Morgan Stanley Re-REMIC Trust | | | | | | | | |
2010-R5, 1.55% due 06/26/366 | | | 185,778 | | | | 170,782 | |
Irwin Home Equity Loan Trust | | | | | | | | |
2007-1, 6.35% due 08/25/376 | | | 20,460 | | | | 20,898 | |
Total Residential Mortgage Backed Securities | | | 1,717,891,826 | |
| | | | | | | | | |
Government Agency - 2.5% | | | | |
Fannie Mae | | | | | | | | |
2.43% due 01/01/30 | | | 53,650,000 | | | | 55,900,389 | |
3.40% due 02/01/33 | | | 25,000,000 | | | | 27,496,936 | |
2.40% due 03/01/40 | | | 27,004,000 | | | | 26,393,599 | |
3.83% due 05/01/49 | | | 19,000,000 | | | | 21,049,333 | |
2.81% due 09/01/39 | | | 20,780,000 | | | | 20,972,074 | |
4.17% due 02/01/49 | | | 16,500,000 | | | | 18,425,673 | |
2013-124, due 12/25/4312,15 | | | 20,487,209 | | | | 18,256,113 | |
2.30% due 11/01/29 | | | 17,060,000 | | | | 17,663,906 | |
2.46% due 01/01/30 | | | 14,500,000 | | | | 15,207,573 | |
4.08% due 04/01/49 | | | 12,879,000 | | | | 14,135,461 | |
3.42% due 09/01/47 | | | 12,752,005 | | | | 13,669,578 | |
2.07% due 10/01/50 | | | 13,420,971 | | | | 12,397,645 | |
3.59% due 04/01/33 | | | 11,163,765 | | | | 11,766,982 | |
2.00% due 09/01/50 | | | 12,060,201 | | | | 10,997,292 | |
4.21% due 10/01/48 | | | 9,750,000 | | | | 10,925,568 | |
2013-100, due 10/25/4312,15 | | | 10,241,833 | | | | 9,132,400 | |
3.43% due 03/01/33 | | | 8,100,000 | | | | 8,688,455 | |
1.76% due 08/01/40 | | | 9,360,000 | | | | 8,398,163 | |
2.17% due 03/01/51 | | | 8,638,000 | | | | 7,950,094 | |
2.09% due 04/01/35 | | | 7,683,275 | | | | 7,538,914 | |
3.29% due 03/01/33 | | | 6,700,000 | | | | 7,117,881 | |
2.10% due 07/01/50 | | | 7,653,727 | | | | 7,085,699 | |
2.15% due 09/01/29 | | | 6,683,000 | | | | 6,786,074 | |
2.79% due 01/01/32 | | | 6,478,157 | | | | 6,784,845 | |
3.56% due 02/01/38 | | | 6,350,047 | | | | 6,742,516 | |
4.04% due 08/01/48 | | | 6,100,000 | | | | 6,650,335 | |
3.61% due 04/01/39 | | | 6,193,000 | | | | 6,448,587 | |
3.05% due 03/01/50 | | | 6,150,063 | | | | 6,348,491 | |
1.83% due 08/01/40 | | | 5,726,445 | | | | 5,361,731 | |
4.07% due 05/01/49 | | | 4,778,974 | | | | 5,184,126 | |
3.16% due 11/01/30 | | | 4,887,020 | | | | 5,145,611 | |
4.27% due 12/01/33 | | | 4,589,703 | | | | 5,126,756 | |
2.17% due 10/01/50 | | | 5,281,463 | | | | 4,925,138 | |
2.50% due 04/01/35 | | | 4,522,591 | | | | 4,705,613 | |
3.71% due 04/01/31 | | | 4,200,000 | | | | 4,697,234 | |
2.99% due 01/01/40 | | | 4,429,000 | | | | 4,522,945 | |
3.76% due 03/01/37 | | | 4,000,000 | | | | 4,520,518 | |
3.37% due 06/01/39 | | | 4,067,000 | | | | 4,495,751 | |
3.50% due 02/01/48 | | | 4,052,341 | | | | 4,367,544 | |
3.65% due 03/01/33 | | | 3,600,000 | | | | 3,859,855 | |
4.24% due 08/01/48 | | | 3,400,000 | | | | 3,787,159 | |
2.94% due 02/01/40 | | | 3,370,833 | | | | 3,563,606 | |
3.92% due 04/01/39 | | | 3,198,000 | | | | 3,460,331 | |
2.96% due 10/01/49 | | | 2,900,040 | | | | 2,957,124 | |
3.94% due 06/01/35 | | | 2,600,000 | | | | 2,793,449 | |
2.62% due 11/01/28 | | | 2,600,000 | | | | 2,744,400 | |
2.86% due 01/01/33 | | | 2,524,000 | | | | 2,643,560 | |
3.26% due 11/01/46 | | | 2,443,912 | | | | 2,579,829 | |
3.50% due 12/01/47 | | | 2,308,708 | | | | 2,474,968 | |
2.92% due 03/01/50 | | | 2,401,607 | | | | 2,434,879 | |
2.51% due 07/01/50 | | | 2,425,250 | | | | 2,374,101 | |
2.69% due 10/01/34 | | | 2,288,171 | | | | 2,338,353 | |
3.51% due 11/01/37 | | | 2,150,000 | | | | 2,242,808 | |
1.68% due 09/01/37 | | | 2,151,642 | | | | 2,092,672 | |
2.68% due 04/01/50 | | | 1,965,596 | | | | 1,959,114 | |
3.17% due 02/01/30 | | | 1,750,000 | | | | 1,908,847 | |
3.46% due 08/01/49 | | | 1,706,514 | | | | 1,829,953 | |
4.00% due 12/01/38 | | | 1,687,212 | | | | 1,825,242 | |
2.77% due 02/01/36 | | | 1,768,003 | | | | 1,811,910 | |
4.50% due 03/01/48 | | | 1,549,745 | | | | 1,688,029 | |
3.50% due 12/01/46 | | | 1,509,311 | | | | 1,605,050 | |
3.08% due 02/01/33 | | | 1,300,000 | | | | 1,402,295 | |
3.74% due 02/01/48 | | | 1,267,288 | | | | 1,395,228 | |
3.27% due 08/01/34 | | | 1,285,597 | | | | 1,382,410 | |
4.00% due 08/01/47 | | | 1,245,266 | | | | 1,359,749 | |
2.32% due 07/01/50 | | | 1,397,173 | | | | 1,329,289 | |
4.00% due 01/01/46 | | | 1,193,466 | | | | 1,300,025 | |
2.89% due 05/01/33 | | | 1,230,286 | | | | 1,286,569 | |
4.05% due 09/01/48 | | | 1,169,378 | | | | 1,265,181 | |
2.25% due 10/01/50 | | | 1,290,635 | | | | 1,217,396 | |
3.50% due 12/01/45 | | | 1,096,365 | | | | 1,179,142 | |
54 | THE GUGGENHEIM FUNDS SEMI-ANNUAL REPORT | SEE NOTES TO FINANCIAL STATEMENTS. |
SCHEDULE OF INVESTMENTS (Unaudited)(continued) | March 31, 2021 |
TOTAL RETURN BOND FUND | |
| | Face
Amount~ | | | Value | |
2.50% due 01/01/35 | | | 1,092,781 | | | $ | 1,137,079 | |
3.13% due 01/01/30 | | | 997,075 | | | | 1,087,456 | |
3.96% due 06/01/49 | | | 974,694 | | | | 1,059,135 | |
3.60% due 10/01/47 | | | 944,716 | | | | 1,022,934 | |
3.00% due 07/01/46 | | | 904,810 | | | | 951,784 | |
3.18% due 09/01/42 | | | 876,041 | | | | 920,288 | |
3.63% due 01/01/37 | | | 717,729 | | | | 773,126 | |
3.91% due 07/01/49 | | | 683,309 | | | | 749,870 | |
3.36% due 12/01/39 | | | 697,623 | | | | 715,198 | |
2.75% due 11/01/31 | | | 632,053 | | | | 666,959 | |
4.50% due 02/01/45 | | | 579,670 | | | | 649,500 | |
3.99% due 06/01/49 | | | 536,910 | | | | 584,070 | |
5.00% due 12/01/44 | | | 434,014 | | | | 489,885 | |
5.00% due 05/01/44 | | | 378,536 | | | | 423,591 | |
3.50% due 08/01/43 | | | 365,075 | | | | 395,578 | |
4.50% due 05/01/47 | | | 352,536 | | | | 387,196 | |
4.33% due 09/01/48 | | | 337,494 | | | | 376,719 | |
4.22% due 04/01/49 | | | 315,000 | | | | 347,580 | |
Fannie Mae-Aces | | | | | | | | |
2020-M23, 1.50% (WAC) due 03/25/355,11 | | | 297,720,113 | | | | 38,506,256 | |
Freddie Mac Seasoned Credit Risk Transfer Trust | | | | | | | | |
2020-2, 2.00% due 11/25/59 | | | 16,139,666 | | | | 16,144,929 | |
2020-3, 2.00% due 05/25/60 | | | 13,025,009 | | | | 13,020,400 | |
Freddie Mac | | | | | | | | |
3.55% due 10/01/33 | | | 4,556,487 | | | | 4,919,347 | |
2018-4762, 4.00% due 01/15/46 | | | 4,673,889 | | | | 4,851,273 | |
3.26% due 09/01/45 | | | 2,244,133 | | | | 2,311,848 | |
3.50% due 01/01/44 | | | 1,406,179 | | | | 1,519,818 | |
1.96% due 05/01/50 | | | 1,593,019 | | | | 1,442,239 | |
4.00% due 02/01/46 | | | 1,222,241 | | | | 1,334,165 | |
1.95% due 05/01/50 | | | 1,467,593 | | | | 1,326,476 | |
3.40% due 04/01/31 | | | 988,740 | | | | 1,082,259 | |
4.00% due 11/01/45 | | | 961,097 | | | | 1,051,095 | |
3.00% due 08/01/46 | | | 938,012 | | | | 987,086 | |
4.50% due 06/01/48 | | | 774,767 | | | | 845,594 | |
FREMF Mortgage Trust | | | | | | | | |
2013-K29, 0.13% due 05/25/466,11 | | | 729,376,361 | | | | 1,285,963 | |
Freddie Mac Multifamily Structured Pass Through Certificates | | | | | | | | |
2015-K043, 0.53% (WAC) due 12/25/245,11 | | | 43,001,933 | | | | 770,681 | |
Total Government Agency | | | 616,213,443 | |
| | | | | | | | | |
Military Housing - 1.1% |
Freddie Mac Military Housing Bonds Resecuritization Trust Certificates | | | | | | | | |
2015-R1, 3.48% (WAC) due 11/25/555,6 | | | 115,225,315 | | | | 129,190,242 | |
2015-R1, 4.32% (WAC) due 10/25/525,6 | | | 13,608,997 | | | | 14,422,072 | |
2015-R1, 4.11% (WAC) due 11/25/525,6 | | | 12,636,553 | | | | 13,673,908 | |
2015-R1, 0.52% (WAC) due 11/25/555,6,11 | | | 173,501,425 | | | | 11,339,689 | |
2015-R1, 4.11% (WAC) due 11/25/525,6 | | | 9,441,310 | | | | 10,376,351 | |
Capmark Military Housing Trust | | | | | | | | |
2006-RILY, 6.15% due 07/10/516 | | | 12,915,938 | | | | 13,132,365 | |
2008-AMCW, 6.90% due 07/10/556 | | | 8,237,830 | | | | 10,694,387 | |
2007-AETC, 5.75% due 02/10/526 | | | 7,354,833 | | | | 7,571,438 | |
2007-ROBS, 6.06% due 10/10/526 | | | 4,639,421 | | | | 4,830,314 | |
2006-RILY, 2.09% (1 Month USD LIBOR + 0.37%, Rate Floor: 0.37%) due 07/10/515,6 | | | 6,943,741 | | | | 4,030,725 | |
SEE NOTES TO FINANCIAL STATEMENTS. | THE GUGGENHEIM FUNDS SEMI-ANNUAL REPORT | 55 |
SCHEDULE OF INVESTMENTS (Unaudited)(continued) | March 31, 2021 |
TOTAL RETURN BOND FUND | |
| | Face
Amount~ | | | Value | |
2007-AET2, 6.06% due 10/10/526 | | | 3,047,743 | | | $ | 3,144,722 | |
GMAC Commercial Mortgage Asset Corp. | | | | | | | | |
2007-HCKM, 6.11% due 08/10/526 | | | 22,029,462 | | | | 24,294,956 | |
2005-DRUM, 5.47% due 05/10/50†††,6 | | | 4,499,355 | | | | 4,818,835 | |
2005-BLIS, 5.25% due 07/10/506 | | | 2,500,000 | | | | 2,637,650 | |
Total Military Housing | | | | | | | 254,157,654 | |
| | | | | | | | | |
Commercial Mortgage Backed Securities - 1.0% |
Citigroup Commercial Mortgage Trust | | | | | | | | |
2019-GC43, 0.63% (WAC) due 11/10/525,11 | | | 219,524,548 | | | | 9,663,778 | |
2019-GC41, 1.06% (WAC) due 08/10/565,11 | | | 104,680,733 | | | | 6,946,415 | |
2016-C2, 1.74% (WAC) due 08/10/495,11 | | | 33,206,651 | | | | 2,381,747 | |
2016-P4, 1.95% (WAC) due 07/10/495,11 | | | 31,518,986 | | | | 2,295,329 | |
2016-P5, 1.50% (WAC) due 10/10/495,11 | | | 30,509,634 | | | | 1,682,600 | |
2016-GC37, 1.70% (WAC) due 04/10/495,11 | | | 20,382,086 | | | | 1,398,668 | |
2015-GC35, 0.78% (WAC) due 11/10/485,11 | | | 30,473,485 | | | | 823,104 | |
2015-GC29, 1.04% (WAC) due 04/10/485,11 | | | 19,415,432 | | | | 696,284 | |
2016-C3, 1.14% (WAC) due 11/15/495,11 | | | 11,913,668 | | | | 493,690 | |
2013-GC15, 4.37% (WAC) due 09/10/465 | | | 380,000 | | | | 411,208 | |
GB Trust | | | | | | | | |
2020-FLIX, 2.46% (1 Month USD LIBOR + 2.35%, Rate Floor: 2.35%) due 08/15/375,6 | | | 23,300,000 | | | | 23,358,173 | |
2020-FLIX, 1.71% (1 Month USD LIBOR + 1.60%, Rate Floor: 1.60%) due 08/15/375,6 | | | 2,000,000 | | | | 2,005,078 | |
Life Mortgage Trust | | | | | | | | |
2021-BMR, 2.46% (1 Month USD LIBOR + 2.35%, Rate Floor: 2.35%) due 03/15/385,6 | | | 19,500,000 | | | | 19,531,192 | |
2021-BMR, 1.86% (1 Month USD LIBOR + 1.75%, Rate Floor: 1.75%) due 03/15/385,6 | | | 5,250,000 | | | | 5,258,400 | |
Wells Fargo Commercial Mortgage Trust | | | | | | | | |
2017-C38, 1.02% (WAC) due 07/15/505,11 | | | 71,195,222 | | | | 3,455,125 | |
2016-BNK1, 1.74% (WAC) due 08/15/495,11 | | | 36,071,280 | | | | 2,648,606 | |
2017-RB1, 1.24% (WAC) due 03/15/505,11 | | | 39,965,941 | | | | 2,363,142 | |
2016-C35, 1.92% (WAC) due 07/15/485,11 | | | 25,965,544 | | | | 1,954,982 | |
2017-C42, 0.88% (WAC) due 12/15/505,11 | | | 34,929,012 | | | | 1,690,851 | |
56 | THE GUGGENHEIM FUNDS SEMI-ANNUAL REPORT | SEE NOTES TO FINANCIAL STATEMENTS. |
SCHEDULE OF INVESTMENTS (Unaudited)(continued) | March 31, 2021 |
TOTAL RETURN BOND FUND | |
| | Face
Amount~ | | | Value | |
2015-NXS4, 1.04% (WAC) due 12/15/485,11 | | | 39,971,893 | | | $ | 1,608,929 | |
2016-C32, 4.72% (WAC) due 01/15/595 | | | 1,400,000 | | | | 1,545,391 | |
2017-RC1, 1.49% (WAC) due 01/15/605,11 | | | 25,602,590 | | | | 1,529,622 | |
2016-NXS5, 1.44% (WAC) due 01/15/595,11 | | | 23,702,373 | | | | 1,310,784 | |
2015-P2, 0.92% (WAC) due 12/15/485,11 | | | 27,740,378 | | | | 1,021,398 | |
2015-C30, 0.89% (WAC) due 09/15/585,11 | | | 30,276,321 | | | | 1,016,827 | |
2016-C37, 0.93% (WAC) due 12/15/495,11 | | | 15,522,777 | | | | 458,599 | |
2015-NXS1, 1.10% (WAC) due 05/15/485,11 | | | 8,867,607 | | | | 306,152 | |
GS Mortgage Securities Trust | | | | | | | | |
2020-GC45, 0.67% (WAC) due 02/13/535,11 | | | 153,917,174 | | | | 7,404,386 | |
2019-GC42, 0.81% (WAC) due 09/01/525,11 | | | 69,738,723 | | | | 3,907,028 | |
2017-GS6, 1.03% (WAC) due 05/10/505,11 | | | 42,356,185 | | | | 2,345,342 | |
2017-GS6, 3.87% due 05/10/50 | | | 521,000 | | | | 564,605 | |
2015-GC28, 0.99% (WAC) due 02/10/485,11 | | | 15,736,736 | | | | 500,409 | |
JPMDB Commercial Mortgage Securities Trust | | | | | | | | |
2017-C7, 0.87% (WAC) due 10/15/505,11 | | | 133,189,249 | | | | 5,781,279 | |
2016-C4, 0.79% (WAC) due 12/15/495,11 | | | 84,914,191 | | | | 3,114,712 | |
2016-C4, 3.64% (WAC) due 12/15/495 | | | 2,650,000 | | | | 2,775,447 | |
2016-C2, 1.57% (WAC) due 06/15/495,11 | | | 28,024,140 | | | | 1,560,704 | |
2017-C5, 0.95% (WAC) due 03/15/505,11 | | | 8,265,318 | | | | 363,966 | |
COMM Mortgage Trust | | | | | | | | |
2018-COR3, 0.44% (WAC) due 05/10/515,11 | | | 197,414,577 | | | | 5,530,787 | |
2015-CR26, 0.93% (WAC) due 10/10/485,11 | | | 83,496,225 | | | | 2,862,902 | |
2015-CR24, 0.76% (WAC) due 08/10/485,11 | | | 46,590,422 | | | | 1,301,988 | |
2015-CR23, 0.89% (WAC) due 05/10/485,11 | | | 40,665,779 | | | | 1,133,128 | |
2015-CR27, 0.92% (WAC) due 10/10/485,11 | | | 26,736,392 | | | | 948,899 | |
2015-CR23, 3.80% due 05/10/48 | | | 700,000 | | | | 756,954 | |
2013-CR13, 0.75% (WAC) due 11/10/465,11 | | | 36,189,740 | | | | 629,633 | |
2014-LC15, 1.09% (WAC) due 04/10/475,11 | | | 11,145,637 | | | | 282,107 | |
SEE NOTES TO FINANCIAL STATEMENTS. | THE GUGGENHEIM FUNDS SEMI-ANNUAL REPORT | 57 |
SCHEDULE OF INVESTMENTS (Unaudited)(continued) | March 31, 2021 |
TOTAL RETURN BOND FUND | |
| | Face
Amount~ | | | Value | |
BENCHMARK Mortgage Trust | | | | | | | | |
2019-B14, 0.79% (WAC) due 12/15/625,11 | | | 109,460,784 | | | $ | 5,198,205 | |
2018-B2, 0.42% (WAC) due 02/15/515,11 | | | 131,266,931 | | | | 2,647,706 | |
2018-B6, 0.44% (WAC) due 10/10/515,11 | | | 64,414,553 | | | | 1,445,823 | |
2018-B6, 4.62% (WAC) due 10/10/515 | | | 750,000 | | | | 828,416 | |
GS Mortgage Securities Corporation Trust | | | | | | | | |
2020-UPTN, 3.25% (WAC) due 02/10/375,6 | | | 5,350,000 | | | | 5,229,505 | |
2020-DUNE, 1.46% (1 Month USD LIBOR + 1.35%, Rate Floor: 1.35%) due 12/15/365,6 | | | 3,750,000 | | | | 3,654,449 | |
2020-DUNE, 2.01% (1 Month USD LIBOR + 1.90%, Rate Floor: 1.90%) due 12/15/365,6 | | | 1,000,000 | | | | 945,488 | |
KKR Industrial Portfolio Trust | | | | | | | | |
2021-KDIP, 1.66% (1 Month USD LIBOR + 1.55%, Rate Floor: 1.55%) due 12/15/375,6 | | | 8,750,000 | | | | 8,728,168 | |
DBGS Mortgage Trust | | | | | | | | |
2018-C1, 4.64% (WAC) due 10/15/515 | | | 7,588,000 | | | | 8,593,275 | |
CSAIL Commercial Mortgage Trust | | | | | | | | |
2019-C15, 1.05% (WAC) due 03/15/525,11 | | | 97,013,217 | | | | 6,052,461 | |
2015-C1, 0.83% (WAC) due 04/15/505,11 | | | 50,921,552 | | | | 1,328,284 | |
2016-C6, 1.92% (WAC) due 01/15/495,11 | | | 5,554,448 | | | | 394,559 | |
BANK | | | | | | | | |
2020-BN25, 0.44% (WAC) due 01/15/635,11 | | | 140,000,000 | | | | 4,926,614 | |
2017-BNK6, 0.82% (WAC) due 07/15/605,11 | | | 42,542,811 | | | | 1,607,795 | |
2017-BNK4, 1.40% (WAC) due 05/15/505,11 | | | 12,855,535 | | | | 768,866 | |
BX Commercial Mortgage Trust | | | | | | | | |
2019-XL, 2.11% (1 Month USD LIBOR + 2.00%, Rate Floor: 2.00%) due 10/15/365,6 | | | 6,818,706 | | | | 6,814,601 | |
Benchmark Mortgage Trust | | | | | | | | |
2020-IG3, 3.13% (WAC) due 09/15/485,6 | | | 5,232,000 | | | | 5,022,059 | |
UBS Commercial Mortgage Trust | | | | | | | | |
2017-C2, 1.06% (WAC) due 08/15/505,11 | | | 50,439,294 | | | | 2,531,069 | |
2017-C5, 1.00% (WAC) due 11/15/505,11 | | | 53,332,145 | | | | 2,425,418 | |
CD Mortgage Trust | | | | | | | | |
2016-CD1, 1.41% (WAC) due 08/10/495,11 | | | 31,814,157 | | | | 1,888,326 | |
2017-CD6, 0.92% (WAC) due 11/13/505,11 | | | 45,230,451 | | | | 1,778,977 | |
58 | THE GUGGENHEIM FUNDS SEMI-ANNUAL REPORT | SEE NOTES TO FINANCIAL STATEMENTS. |
SCHEDULE OF INVESTMENTS (Unaudited)(continued) | March 31, 2021 |
TOTAL RETURN BOND FUND | |
| | Face
Amount~ | | | Value | |
2016-CD2, 0.65% (WAC) due 11/10/495,11 | | | 34,075,150 | | | $ | 823,647 | |
JP Morgan Chase Commercial Mortgage Securities Trust | | | | | | | | |
2016-JP3, 1.42% (WAC) due 08/15/495,11 | | | 67,932,870 | | | | 3,839,185 | |
CD Commercial Mortgage Trust | | | | | | | | |
2017-CD4, 1.29% (WAC) due 05/10/505,11 | | | 31,742,296 | | | | 1,754,063 | |
2017-CD3, 1.01% (WAC) due 02/10/505,11 | | | 34,211,689 | | | | 1,570,491 | |
JPMBB Commercial Mortgage Securities Trust | | | | | | | | |
2015-C27, 1.21% (WAC) due 02/15/485,11 | | | 71,599,890 | | | | 2,680,550 | |
2013-C12, 0.47% (WAC) due 07/15/455,11 | | | 34,478,332 | | | | 262,797 | |
BBCMS Mortgage Trust | | | | | | | | |
2018-C2, 0.77% (WAC) due 12/15/515,11 | | | 58,088,935 | | | | 2,806,154 | |
JPMCC Commercial Mortgage Securities Trust | | | | | | | | |
2017-JP6, 1.13% (WAC) due 07/15/505,11 | | | 57,498,409 | | | | 2,714,224 | |
CGMS Commercial Mortgage Trust | | | | | | | | |
2017-B1, 0.82% (WAC) due 08/15/505,11 | | | 65,225,069 | | | | 2,495,746 | |
Cam Commercial Mortgage Corp. | | | | | | | | |
2002-CAM2, 6.16% due 12/14/216 | | | 2,197,355 | | | | 2,244,580 | |
Morgan Stanley Bank of America Merrill Lynch Trust | | | | | | | | |
2015-C27, 0.88% (WAC) due 12/15/475,11 | | | 65,437,297 | | | | 2,051,237 | |
CFCRE Commercial Mortgage Trust | | | | | | | | |
2016-C3, 0.99% (WAC) due 01/10/485,11 | | | 38,631,453 | | | | 1,576,681 | |
Banc of America Commercial Mortgage Trust | | | | | | | | |
2017-BNK3, 1.10% (WAC) due 02/15/505,11 | | | 23,806,940 | | | | 1,142,102 | |
DBJPM Mortgage Trust | | | | | | | | |
2017-C6, 0.99% (WAC) due 06/10/505,11 | | | 23,179,113 | | | | 1,002,562 | |
Bancorp Commercial Mortgage Trust | | | | | | | | |
2018-CR3, 1.36% (1 Month USD LIBOR + 1.25%, Rate Floor: 1.25%) due 01/15/335,6 | | | 774,677 | | | | 773,975 | |
SG Commercial Mortgage Securities Trust | | | | | | | | |
2016-C5, 1.95% (WAC) due 10/10/485,11 | | | 6,039,824 | | | | 395,441 | |
Morgan Stanley Capital I Trust | | | | | | | | |
2016-UBS9, 4.61% (WAC) due 03/15/495 | | | 275,000 | | | | 287,527 | |
SEE NOTES TO FINANCIAL STATEMENTS. | THE GUGGENHEIM FUNDS SEMI-ANNUAL REPORT | 59 |
SCHEDULE OF INVESTMENTS (Unaudited)(continued) | March 31, 2021 |
TOTAL RETURN BOND FUND | |
| | Face
Amount~ | | | Value | |
GS Mortgage Securities Corporation II | | | | | | | | |
2013-GC10, 2.94% due 02/10/46 | | | 225,000 | | | $ | 232,993 | |
WFRBS Commercial Mortgage Trust | | | | | | | | |
2013-C12, 1.18% (WAC) due 03/15/485,6,11 | | | 8,489,715 | | | | 145,009 | |
Total Commercial Mortgage Backed Securities | | | 241,229,378 | |
| | | | | | | | | |
Total Collateralized Mortgage Obligations | | | | |
(Cost $2,833,212,349) | | | 2,829,492,301 | |
| | | | | | | | | |
SENIOR FLOATING RATE INTERESTS††,5 - 8.1% |
Consumer, Non-cyclical - 1.6% |
Valeo F1 Company Ltd. | | | | | | | | |
due 08/27/27 | GBP | | 34,400,000 | | | | 47,273,503 | |
Bombardier Recreational Products, Inc. | | | | | | | | |
2.11% (1 Month USD LIBOR + 2.00%, Rate Floor: 2.00%) due 05/24/27 | | | 34,000,000 | | | | 33,580,440 | |
Packaging Coordinators Midco, Inc. | | | | | | | | |
4.50% (6 Month USD LIBOR + 3.75%, Rate Floor: 4.50%) due 11/30/27 | | | 32,358,332 | | | | 32,317,884 | |
Sunshine Investments BV | | | | | | | | |
3.25% (3 Month EURIBOR + 3.25%, Rate Floor: 3.25%) due 03/28/25 | EUR | | 20,259,706 | | | | 23,701,576 | |
Nidda Healthcare Holding GmbH | | | | | | | | |
3.50% (3 Month EURIBOR + 3.50%, Rate Floor: 3.50%) due 08/21/26 | EUR | | 18,276,306 | | | | 21,254,992 | |
Southern Veterinary Partners LLC | | | | | | | | |
5.00% (3 Month USD LIBOR + 4.00%, Rate Floor: 5.00%) due 10/05/27 | | | 19,504,148 | | | | 19,552,908 | |
Sigma Holding BV (Flora Food) | | | | | | | | |
3.50% (1 Month EURIBOR + 3.50% and 6 Month EURIBOR + 3.50%, Rate Floor: 3.50%) due 07/02/25 | EUR | | 17,000,000 | | | | 19,540,631 | |
Triton Water Holdings, Inc. | | | | | | | | |
due 03/16/285 | | | 18,750,000 | | | | 18,662,062 | |
HAH Group Holding Co. LLC | | | | | | | | |
6.00% (3 Month USD LIBOR + 5.00%, Rate Floor: 6.00%) due 10/29/27 | | | 17,487,784 | | | | 17,531,504 | |
National Mentor Holdings, Inc. | | | | | | | | |
4.50% (1 Month USD LIBOR + 3.75%, Rate Floor: 4.50%) due 03/02/28 | | | 15,340,058 | | | | 15,236,513 | |
Endo Luxembourg Finance Company I SARL | | | | | | | | |
due 03/11/28 | | | 12,600,000 | | | | 12,458,250 | |
60 | THE GUGGENHEIM FUNDS SEMI-ANNUAL REPORT | SEE NOTES TO FINANCIAL STATEMENTS. |
SCHEDULE OF INVESTMENTS (Unaudited)(continued) | March 31, 2021 |
TOTAL RETURN BOND FUND | |
| | Face
Amount~ | | | Value | |
Quirch Foods Holdings LLC | | | | | | | | |
6.25% (6 Month USD LIBOR + 5.25%, Rate Floor: 6.25%) due 10/27/27 | | | 11,700,000 | | | $ | 11,765,871 | |
AI Aqua Zip Bidco Pty Ltd. | | | | | | | | |
due 12/13/23 | | | 10,830,341 | | | | 10,834,890 | |
Option Care Health, Inc. | | | | | | | | |
due 08/06/26 | | | 10,224,116 | | | | 10,179,437 | |
Weber-Stephen Products LLC | | | | | | | | |
4.00% (1 Month USD LIBOR + 3.25%, Rate Floor: 4.00%) due 10/29/27 | | | 8,900,000 | | | | 8,888,875 | |
Women’s Care Holdings, Inc. | | | | | | | | |
5.25% (3 Month USD LIBOR + 4.50%, Rate Floor: 5.25%) due 01/15/28 | | | 8,868,429 | | | | 8,868,429 | |
Energizer Holdings, Inc. | | | | | | | | |
2.75% (1 Month USD LIBOR + 2.25%, Rate Floor: 2.75%) due 12/22/27 | | | 7,500,000 | | | | 7,459,350 | |
Avantor Funding, Inc. | | | | | | | | |
3.25% (1 Month USD LIBOR + 2.25%, Rate Floor: 3.25%) due 11/08/27 | | | 7,400,000 | | | | 7,396,300 | |
SCP Eye Care Services LLC | | | | | | | | |
5.25% (3 Month USD LIBOR + 4.50%, Rate Floor: 5.25%) due 03/11/28††† | | | 7,329,545 | | | | 7,320,383 | |
PPD, Inc. | | | | | | | | |
2.75% (1 Month USD LIBOR + 2.25%, Rate Floor: 2.75%) due 01/13/28 | | | 7,200,000 | | | | 7,157,592 | |
Elanco Animal Health, Inc. | | | | | | | | |
1.87% (1 Month USD LIBOR + 1.75%, Rate Floor: 1.75%) due 08/02/27 | | | 6,796,293 | | | | 6,701,621 | |
IQVIA, Inc. | | | | | | | | |
2.00% (3 Month EURIBOR + 2.00%, Rate Floor: 2.00%) due 03/07/24 | EUR | | 4,929,123 | | | | 5,763,340 | |
Arterra Wines Canada, Inc. | | | | | | | | |
4.25% (3 Month USD LIBOR + 3.50%, Rate Floor: 4.25%) due 11/24/27 | | | 5,400,000 | | | | 5,397,732 | |
Elsan SAS | | | | | | | | |
due 02/05/285 | EUR | | 4,500,000 | | | | 5,258,478 | |
Spectrum Brands, Inc. | | | | | | | | |
2.50% (3 Month USD LIBOR + 2.00%, Rate Floor: 2.50%) due 03/03/28 | | | 4,000,000 | | | | 3,987,520 | |
Dole Food Company, Inc. | | | | | | | | |
3.75% (1 Month USD LIBOR + 2.75%, Rate Floor: 3.75%) due 04/05/24 | | | 3,837,179 | | | | 3,833,457 | |
Midwest Physician Administrative Services | | | | | | | | |
4.00% (3 Month USD LIBOR + 3.25%, Rate Floor: 4.00%) due 03/12/28 | | | 3,000,000 | | | | 2,979,390 | |
SEE NOTES TO FINANCIAL STATEMENTS. | THE GUGGENHEIM FUNDS SEMI-ANNUAL REPORT | 61 |
SCHEDULE OF INVESTMENTS (Unaudited)(continued) | March 31, 2021 |
TOTAL RETURN BOND FUND | |
| | Face
Amount~ | | | Value | |
4.00% (3 Month USD LIBOR + 3.25%, Rate Floor: 4.00%) due 08/15/24††† | | | 498,715 | | | $ | 499,483 | |
B&G Foods, Inc. | | | | | | | | |
2.61% (1 Month USD LIBOR + 2.50%, Rate Floor: 2.50%) due 10/12/26 | | | 3,300,000 | | | | 3,293,400 | |
Kronos Acquisition Holdings, Inc. | | | | | | | | |
4.25% (3 Month USD LIBOR + 3.75%, Rate Floor: 4.25%) due 12/22/26 | | | 3,231,900 | | | | 3,182,258 | |
Callaway Golf Company | | | | | | | | |
4.61% (1 Month USD LIBOR + 4.50%, Rate Floor: 4.50%) due 01/02/26 | | | 2,518,122 | | | | 2,527,565 | |
Hayward Industries, Inc. | | | | | | | | |
3.61% (1 Month USD LIBOR + 3.50%, Rate Floor: 3.50%) due 08/05/24 | | | 1,720,511 | | | | 1,717,294 | |
Hostess Brands LLC | | | | | | | | |
3.00% (1 Month USD LIBOR + 2.25% and 3 Month USD LIBOR + 2.25%, Rate Floor: 3.00%) due 08/04/25 | | | 827,904 | | | | 822,846 | |
Atkins Nutritionals, Inc. | | | | | | | | |
4.75% (1 Month USD LIBOR + 3.75%, Rate Floor: 4.75%) due 07/07/24 | | | 175,138 | | | | 175,357 | |
Total Consumer, Non-cyclical | | | 387,121,131 | |
| | | | | | | | | |
Consumer, Cyclical - 1.4% |
MB2 Dental Solutions LLC | | | | | | | | |
7.00% (3 Month USD LIBOR + 6.00%, Rate Floor: 7.00%) due 01/29/27††† | | | 45,032,384 | | | | 44,157,246 | |
6.19% (3 Month USD LIBOR + 6.00%, Rate Floor: 6.00%) due 01/29/27 | | | 1,704,096 | | | | 1,670,979 | |
CHG Healthcare Services, Inc. | | | | | | | | |
4.00% (3 Month USD LIBOR + 3.00%, Rate Floor: 4.00%) due 06/07/23 | | | 44,305,181 | | | | 44,131,061 | |
Verisure Holding AB | | | | | | | | |
due 01/14/285 | EUR | | 30,010,000 | | | | 35,026,681 | |
3.50% (6 Month EURIBOR + 3.50%, Rate Floor: 3.50%) due 07/20/26 | EUR | | 6,890,000 | | | | 8,048,971 | |
Samsonite IP Holdings SARL | | | | | | | | |
5.50% (1 Month USD LIBOR + 4.50%, Rate Floor: 5.50%) due 04/25/25 | | | 37,795,393 | | | | 38,031,614 | |
BGIS (BIFM CA Buyer, Inc.) | | | | | | | | |
3.61% (1 Month USD LIBOR + 3.50%, Rate Floor: 3.50%) due 06/01/26 | | | 32,885,340 | | | | 32,638,700 | |
CNT Holdings I Corp. | | | | | | | | |
4.50% (6 Month USD LIBOR + 3.75%, Rate Floor: 4.50%) due 11/08/27 | | | 24,250,000 | | | | 24,181,857 | |
62 | THE GUGGENHEIM FUNDS SEMI-ANNUAL REPORT | SEE NOTES TO FINANCIAL STATEMENTS. |
SCHEDULE OF INVESTMENTS (Unaudited)(continued) | March 31, 2021 |
TOTAL RETURN BOND FUND | |
| | Face
Amount~ | | | Value | |
Flamingo | | | | | | | | |
due 03/18/28 | EUR | | 18,600,000 | | | $ | 21,578,879 | |
PetSmart LLC | | | | | | | | |
4.25% (3 Month USD LIBOR + 3.50%, Rate Floor: 4.25%) due 02/11/28 | | | 20,200,000 | | | | 20,153,540 | |
Packers Holdings LLC | | | | | | | | |
4.00% (3 Month USD LIBOR + 3.25%, Rate Floor: 4.00%) due 03/09/28 | | | 20,026,469 | | | | 19,784,549 | |
Adevinta ASA | | | | | | | | |
due 10/22/275 | | | 11,000,000 | | | | 12,909,393 | |
3.75% (1 Month USD LIBOR + 3.00%, Rate Floor: 3.75%) due 10/22/27 | EUR | | 3,800,000 | | | | 3,797,644 | |
New Trojan Parent, Inc. | | | | | | | | |
3.75% (1 Month USD LIBOR + 3.25%, Rate Floor: 3.75%) due 01/06/28 | | | 14,050,000 | | | | 13,962,188 | |
Truck Hero, Inc. | | | | | | | | |
4.50% (1 Month USD LIBOR + 3.75%, Rate Floor: 4.50%) due 01/31/28 | | | 9,000,000 | | | | 8,971,290 | |
BCPE Empire Holdings, Inc. | | | | | | | | |
5.00% (1 Month USD LIBOR + 4.25%, Rate Floor: 5.00%) due 06/11/26 | | | 6,000,000 | | | | 5,985,000 | |
Power Solutions (Panther) | | | | | | | | |
3.61% (3 Month USD LIBOR + 3.50%, Rate Floor: 3.50%) due 04/30/26 | | | 4,509,814 | | | | 4,459,078 | |
Wabash National Corporation | | | | | | | | |
4.00% (1 Month USD LIBOR + 3.25%, Rate Floor: 4.00%) due 09/28/27 | | | 3,933,671 | | | | 3,923,837 | |
SP PF Buyer LLC | | | | | | | | |
4.61% (1 Month USD LIBOR + 4.50%, Rate Floor: 4.50%) due 12/22/25 | | | 3,391,349 | | | | 3,266,988 | |
Cast & Crew Payroll LLC | | | | | | | | |
3.86% (1 Month USD LIBOR + 3.75%, Rate Floor: 3.75%) due 02/09/26 | | | 2,397,684 | | | | 2,357,979 | |
Whatabrands, LLC | | | | | | | | |
2.86% (1 Month USD LIBOR + 2.75%, Rate Floor: 2.75%) due 07/31/26 | | | 1,341,787 | | | | 1,332,099 | |
1011778 BC Unlimited Liability Co. | | | | | | | | |
1.86% (1 Month USD LIBOR + 1.75%, Rate Floor: 1.75%) due 11/19/26 | | | 1,041,113 | | | | 1,021,269 | |
Rent-A-Center, Inc. | | | | | | | | |
4.75% (1 Month USD LIBOR + 4.00%, Rate Floor: 4.75%) due 02/17/28 | | | 500,000 | | | | 502,085 | |
Total Consumer, Cyclical | | | 351,892,927 | |
| | | | | | | | | |
Industrial - 1.4% | | | | | | | | |
American Bath Group LLC | | | | | | | | |
4.25% (3 Month USD LIBOR + 3.75%, Rate Floor: 4.25%) due 11/23/27 | | | 34,340,000 | | | | 34,087,944 | |
SEE NOTES TO FINANCIAL STATEMENTS. | THE GUGGENHEIM FUNDS SEMI-ANNUAL REPORT | 63 |
SCHEDULE OF INVESTMENTS (Unaudited)(continued) | March 31, 2021 |
TOTAL RETURN BOND FUND | |
| | Face
Amount~ | | | Value | |
Mileage Plus Holdings LLC | | | | | | | | |
6.25% (3 Month USD LIBOR + 5.25%, Rate Floor: 6.25%) due 06/21/27 | | | 30,500,000 | | | $ | 32,373,005 | |
Berry Global, Inc. | | | | | | | | |
due 07/01/26 | | | 27,200,000 | | | | 26,957,648 | |
IFCO Management GmbH | | | | | | | | |
3.25% (6 Month EURIBOR + 3.25%, Rate Floor: 3.25%) due 05/29/26 | EUR | | 19,870,000 | | | | 23,242,867 | |
Galileo Global Education Finance SARL | | | | | | | | |
3.25% (3 Month EURIBOR + 3.25%, Rate Floor: 3.25%) due 11/12/26 | EUR | | 19,200,000 | | | | 22,352,871 | |
AI Convoy Luxembourg SARL | | | | | | | | |
3.50% (3 Month EURIBOR + 3.50%, Rate Floor: 3.50%) due 01/18/27 | EUR | | 18,618,000 | | | | 21,760,224 | |
TransDigm, Inc. | | | | | | | | |
2.36% (1 Month USD LIBOR + 2.25%, Rate Floor: 2.25%) due 12/09/25 | | | 14,876,915 | | | | 14,554,532 | |
2.36% (1 Month USD LIBOR + 2.25%, Rate Floor: 2.25%) due 05/30/25 | | | 5,827,709 | | | | 5,703,287 | |
Vertical (TK Elevator) | | | | | | | | |
4.48% (6 Month USD LIBOR + 4.25%, Rate Floor: 4.25%) due 07/30/27 | | | 12,785,830 | | | | 12,805,009 | |
4.25% (6 Month EURIBOR + 4.25%, Rate Floor: 4.25%) due 07/29/27 | EUR | | 3,000,000 | | | | 3,527,814 | |
Pelican Products, Inc. | | | | | | | | |
4.50% (3 Month USD LIBOR + 3.50%, Rate Floor: 4.50%) due 05/01/25 | | | 15,050,308 | | | | 14,871,661 | |
Alliance Laundry Systems LLC | | | | | | | | |
4.25% (3 Month USD LIBOR + 3.50%, Rate Floor: 4.25%) due 10/08/27 | | | 13,665,750 | | | | 13,632,952 | |
Hillman Group, Inc. | | | | | | | | |
due 02/24/285 | | | 12,468,354 | | | | 12,395,664 | |
Fugue Finance BV | | | | | | | | |
3.25% (3 Month EURIBOR + 3.25%, Rate Floor: 3.25%) due 08/30/24 | EUR | | 10,500,000 | | | | 12,201,202 | |
Filtration Group Corp. | | | | | | | | |
3.50% (3 Month EURIBOR + 3.50%, Rate Floor: 3.50%) due 03/31/25 | EUR | | 8,000,000 | | | | 9,331,989 | |
3.11% (1 Month USD LIBOR + 3.00%, Rate Floor: 3.00%) due 03/31/25 | | | 1,661,120 | | | | 1,635,788 | |
Service Logic Acquisition, Inc. | | | | | | | | |
4.75% (2 Month USD LIBOR + 4.00% and 3 Month USD LIBOR + 4.00%, Rate Floor: 4.75%) due 10/29/27 | | | 10,077,463 | | | | 10,064,866 | |
64 | THE GUGGENHEIM FUNDS SEMI-ANNUAL REPORT | SEE NOTES TO FINANCIAL STATEMENTS. |
SCHEDULE OF INVESTMENTS (Unaudited)(continued) | March 31, 2021 |
TOTAL RETURN BOND FUND | |
| | Face
Amount~ | | | Value | |
Waterlogic Holdings Ltd. | | | | | | | | |
3.75% (6 Month EURIBOR + 3.75%, Rate Floor: 3.75%) due 03/14/25 | EUR | | 5,999,999 | | | $ | 7,000,468 | |
CapStone Acquisition Holdings, Inc. | | | | | | | | |
5.75% (1 Month USD LIBOR + 4.75%, Rate Floor: 5.75%) due 11/12/27 | | | 6,767,040 | | | | 6,762,844 | |
Dispatch Terra Acquisition LLC | | | | | | | | |
5.00% (3 Month USD LIBOR + 4.25%, Rate Floor: 5.00%) due 03/17/28 | | | 6,200,000 | | | | 6,169,000 | |
DXP Enterprises, Inc. | | | | | | | | |
5.75% (1 Month USD LIBOR + 4.75%, Rate Floor: 5.75%) due 12/23/27 | | | 5,985,000 | | | | 5,970,038 | |
YAK MAT (YAK ACCESS LLC) | | | | | | | | |
10.19% (3 Month USD LIBOR + 10.00%, Rate Floor: 10.00%) due 07/10/26 | | | 7,240,000 | | | | 5,867,441 | |
Diversitech Holdings, Inc. | | | | | | | | |
4.25% (3 Month USD LIBOR + 3.25%, Rate Floor: 4.25%) due 06/03/24††† | | | 5,775,631 | | | | 5,757,583 | |
American Residential Services LLC | | | | | | | | |
4.25% (1 Month USD LIBOR + 3.50%, Rate Floor: 4.25%) due 10/15/27 | | | 5,000,000 | | | | 4,981,250 | |
Berlin Packaging LLC | | | | | | | | |
3.12% (1 Month USD LIBOR + 3.00% and 3 Month USD LIBOR + 3.00%, Rate Floor: 3.00%) due 11/07/25 | | | 4,569,977 | | | | 4,482,645 | |
Charter Nex US Holdings, Inc. | | | | | | | | |
5.00% (1 Month USD LIBOR + 4.25%, Rate Floor: 5.00%) due 12/01/27 | | | 4,300,000 | | | | 4,305,375 | |
Pike Corp. | | | | | | | | |
3.13% (1 Month USD LIBOR + 3.00%, Rate Floor: 3.00%) due 12/21/27 | | | 3,500,000 | | | | 3,485,615 | |
Anchor Packaging LLC | | | | | | | | |
4.11% (1 Month USD LIBOR + 4.00%, Rate Floor: 4.00%) due 07/20/26 | | | 1,968,246 | | | | 1,968,246 | |
FCG Acquisitions, Inc | | | | | | | | |
due 03/16/28 | | | 1,680,000 | | | | 1,669,500 | |
CHI Overhead Doors, Inc. | | | | | | | | |
4.50% (1 Month USD LIBOR + 3.50%, Rate Floor: 4.50%) due 07/31/25 | | | 1,446,375 | | | | 1,446,375 | |
DG Investment Intermediate Holdings 2, Inc. | | | | | | | | |
3.75% (1 Month USD LIBOR + 3.00%, Rate Floor: 3.75%) due 02/03/25 | | | 808,099 | | | | 805,068 | |
SEE NOTES TO FINANCIAL STATEMENTS. | THE GUGGENHEIM FUNDS SEMI-ANNUAL REPORT | 65 |
SCHEDULE OF INVESTMENTS (Unaudited)(continued) | March 31, 2021 |
TOTAL RETURN BOND FUND | |
| | Face
Amount~ | | | Value | |
Fly Funding II SARL | | | | | | | | |
2.50% (3 Month USD LIBOR + 1.75%, Rate Floor: 2.50%) due 08/11/25 | | | 658,803 | | | $ | 643,156 | |
CPG International LLC | | | | | | | | |
3.25% (3 Month USD LIBOR + 2.50%, Rate Floor: 3.25%) due 05/06/24 | | | 508,112 | | | | 507,477 | |
Gates Global LLC | | | | | | | | |
3.50% (1 Month USD LIBOR + 2.75%, Rate Floor: 3.50%) due 03/31/27 | | | 451,328 | | | | 449,825 | |
VC GB Holdings, Inc. | | | | | | | | |
4.00% (1 Month USD LIBOR + 3.00%, Rate Floor: 4.00%) due 02/28/24††† | | | 181,614 | | | | 180,479 | |
BWAY Holding Co. | | | | | | | | |
3.44% (3 Month USD LIBOR + 3.25%, Rate Floor: 3.25%) due 04/03/24 | | | 123,715 | | | | 120,931 | |
API Heat Transfer | | | | | | | | |
12.00% (3 Month USD LIBOR, Rate Floor: 1.00%) (in-kind rate was 11.00%) due 01/01/24†††,13 | | | 44,655 | | | | 18,978 | |
12.00% (3 Month USD LIBOR, Rate Floor: 1.00%) (in-kind rate was 11.00%) due 10/02/23†††,13 | | | 8,206 | | | | 6,154 | |
Total Industrial | | | | | | | 334,097,771 | |
| | | | | | | | | |
Financial - 1.3% | | | | | | | | |
Citadel Securities, LP | | | | | | | | |
2.61% (1 Month USD LIBOR + 2.50%, Rate Floor: 2.50%) due 02/02/28 | | | 63,000,000 | | | | 62,264,790 | |
Jane Street Group LLC | | | | | | | | |
2.86% (1 Month USD LIBOR + 2.75%, Rate Floor: 2.75%) due 01/26/28 | | | 37,419,833 | | | | 36,987,259 | |
Nexus Buyer LLC | | | | | | | | |
3.86% (1 Month USD LIBOR + 3.75%, Rate Floor: 3.75%) due 11/09/26 | | | 26,054,609 | | | | 25,908,182 | |
USI, Inc. | | | | | | | | |
3.45% (3 Month USD LIBOR + 3.25%, Rate Floor: 3.25%) due 12/02/26 | | | 18,954,467 | | | | 18,754,687 | |
3.20% (3 Month USD LIBOR + 3.00%, Rate Floor: 3.00%) due 05/16/24 | | | 6,489,176 | | | | 6,411,566 | |
Jefferies Finance LLC | | | | | | | | |
4.50% (1 Month USD LIBOR + 3.75%, Rate Floor: 4.50%) due 09/30/27††† | | | 20,497,000 | | | | 20,317,651 | |
3.13% (1 Month USD LIBOR + 3.00%, Rate Floor: 3.00%) due 06/03/26 | | | 1,909,421 | | | | 1,890,804 | |
Alter Domus | | | | | | | | |
4.50% (2 Month USD LIBOR + 3.75%, Rate Floor: 4.50%) due 02/11/28 | | | 20,890,000 | | | | 20,794,324 | |
66 | THE GUGGENHEIM FUNDS SEMI-ANNUAL REPORT | SEE NOTES TO FINANCIAL STATEMENTS. |
SCHEDULE OF INVESTMENTS (Unaudited)(continued) | March 31, 2021 |
TOTAL RETURN BOND FUND | |
| | Face
Amount~ | | | Value | |
Higginbotham | | | | | | | | |
6.50% (1 Month USD LIBOR + 5.75%, Rate Floor: 6.50%) due 11/25/26††† | | | 18,806,358 | | | $ | 18,541,332 | |
Franchise Group, Inc. | | | | | | | | |
5.50% (3 Month USD LIBOR + 4.75%, Rate Floor: 5.50%) due 03/10/26 | | | 15,200,000 | | | | 15,209,576 | |
HUB International Ltd. | | | | | | | | |
3.22% (3 Month USD LIBOR + 3.00%, Rate Floor: 3.00%) due 04/25/25 | | | 14,810,903 | | | | 14,592,146 | |
AmWINS Group, Inc. | | | | | | | | |
3.00% (1 Month USD LIBOR + 2.25% and 1 Month USD LIBOR + 2.25%, Rate Floor: 3.00%) due 02/19/28 | | | 13,400,000 | | | | 13,291,192 | |
Orion Advisor Solutions, Inc. | | | | | | | | |
due 09/24/275 | | | 12,200,000 | | | | 12,184,750 | |
Cross Financial Corp. | | | | | | | | |
5.50% (1 Month USD LIBOR + 4.50%, Rate Floor: 5.50%) due 09/15/27 | | | 12,119,625 | | | | 12,157,559 | |
Duff & Phelps | | | | | | | | |
4.75% (1 Month USD LIBOR + 3.75%, Rate Floor: 4.75%) due 04/09/27 | | | 10,274,185 | | | | 10,272,542 | |
Alliant Holdings Intermediate LLC | | | | | | | | |
3.36% (1 Month USD LIBOR + 3.25%, Rate Floor: 3.25%) due 05/09/25 | | | 8,189,326 | | | | 8,082,128 | |
4.25% (1 Month USD LIBOR + 3.75%, Rate Floor: 4.25%) due 11/05/27 | | | 897,058 | | | | 894,331 | |
Jones Deslauriers Insurance Management, Inc. | | | | | | | | |
due 03/12/28††† | CAD | | 6,974,000 | | | | 5,564,568 | |
due 03/12/29††† | CAD | | 3,171,000 | | | | 2,530,147 | |
GT Polaris, Inc. | | | | | | | | |
5.00% (3 Month USD LIBOR + 4.00%, Rate Floor: 5.00%) due 09/24/27 | | | 5,436,375 | | | | 5,429,580 | |
NFP Corp. | | | | | | | | |
3.36% (1 Month USD LIBOR + 3.25%, Rate Floor: 3.25%) due 02/15/27 | | | 5,458,430 | | | | 5,371,423 | |
PAI Holdco, Inc. | | | | | | | | |
5.00% (3 Month USD LIBOR + 4.00%, Rate Floor: 5.00%) due 10/22/27 | | | 5,150,000 | | | | 5,162,875 | |
Tegra118 Wealth Solutions, Inc. | | | | | | | | |
4.19% (2 Month USD LIBOR + 4.00%, Rate Floor: 4.00%) due 02/18/27 | | | 1,200,000 | | | | 1,197,996 | |
AmeriLife Holdings LLC | | | | | | | | |
4.11% (3 Month USD LIBOR + 4.00%, Rate Floor: 4.00%) due 03/18/27 | | | 562,109 | | | | 560,940 | |
SEE NOTES TO FINANCIAL STATEMENTS. | THE GUGGENHEIM FUNDS SEMI-ANNUAL REPORT | 67 |
SCHEDULE OF INVESTMENTS (Unaudited)(continued) | March 31, 2021 |
TOTAL RETURN BOND FUND | |
| | Face
Amount~ | | | Value | |
Virtu Financial, Inc. | | | | | | | | |
3.11% (1 Month USD LIBOR + 3.00%, Rate Floor: 3.00%) due 03/01/26 | | | 500,000 | | | $ | 498,235 | |
Total Financial | | | | | | | 324,870,583 | |
| | | | | | | | | |
Technology - 1.1% | | | | | | | | |
Ascend Learning LLC | | | | | | | | |
4.75% (1 Month USD LIBOR + 3.75%, Rate Floor: 4.75%) due 07/12/24 | | | 54,501,125 | | | | 54,467,334 | |
Planview Parent, Inc. | | | | | | | | |
4.75% (3 Month USD LIBOR + 4.00%, Rate Floor: 4.75%) due 12/17/27 | | | 26,259,394 | | | | 26,215,803 | |
4.75% 3 Month USD LIBOR + 4.00%, Rate Floor: 4.75%) due 12/17/27††† | | | 3,690,606 | | | | 3,705,978 | |
Team.Blue Finco SARL | | | | | | | | |
due 03/18/285 | EUR | | 21,520,270 | | | | 25,127,590 | |
Valkyr Purchaser, LLC | | | | | | | | |
4.75% (3 Month USD LIBOR + 4.00%, Rate Floor: 4.75%) due 11/05/27 | | | 23,250,000 | | | | 23,240,235 | |
RealPage, Inc. | | | | | | | | |
3.75% due 02/18/28 | | | 19,135,000 | | | | 19,036,646 | |
Peraton Corp. | | | | | | | | |
4.50% (3 Month USD LIBOR + 3.75%, Rate Floor: 4.50%) due 02/01/28 | | | 12,264,907 | | | | 12,254,727 | |
RP Crown Parent LLC (Blue Yonder) | | | | | | | | |
4.00% (1 Month USD LIBOR + 3.00%, Rate Floor: 4.00%) due 02/02/26 | | | 11,641,500 | | | | 11,630,557 | |
Sabre GLBL, Inc. | | | | | | | | |
4.75% (1 Month USD LIBOR + 4.00%, Rate Floor: 4.75%) due 12/10/27 | | | 9,625,875 | | | | 9,716,166 | |
ThoughtWorks, Inc. | | | | | | | | |
3.75% (1 Month USD LIBOR + 3.25%, Rate Floor: 3.75%) due 03/19/28 | | | 8,450,000 | | | | 8,421,862 | |
Cloudera, Inc. | | | | | | | | |
3.25% (1 Month USD LIBOR + 2.50%, Rate Floor: 3.25%) due 12/22/27 | | | 8,000,000 | | | | 7,980,000 | |
Transact Holdings, Inc. | | | | | | | | |
4.86% (1 Month USD LIBOR + 4.75%, Rate Floor: 4.75%) due 04/30/26 | | | 7,341,411 | | | | 7,267,997 | |
Imprivata, Inc. | | | | | | | | |
4.25% (1 Month USD LIBOR + 3.75%, Rate Floor: 4.25%) due 12/01/27 | | | 7,100,000 | | | | 7,078,913 | |
E2open LLC | | | | | | | | |
4.00% (3 Month USD LIBOR + 3.50%, Rate Floor: 4.00%) due 02/04/28 | | | 7,000,000 | | | | 6,986,910 | |
Provation Software Group, Inc. | | | | | | | | |
5.50% (6 Month USD LIBOR + 4.75%, Rate Floor: 5.50%) due 12/16/27 | | | 6,500,000 | | | | 6,418,750 | |
Sportradar Capital SARL | | | | | | | | |
4.25% (3 Month EURIBOR + 4.25%, Rate Floor: 4.25%) due 11/22/27 | EUR | | 5,300,000 | | | | 6,209,664 | |
68 | THE GUGGENHEIM FUNDS SEMI-ANNUAL REPORT | SEE NOTES TO FINANCIAL STATEMENTS. |
SCHEDULE OF INVESTMENTS (Unaudited)(continued) | March 31, 2021 |
TOTAL RETURN BOND FUND | |
| | Face
Amount~ | | | Value | |
Storable, Inc. | | | | | | | | |
due 02/26/28 | | | 5,000,000 | | | $ | 4,950,000 | |
Navicure, Inc. | | | | | | | | |
4.75% (1 Month USD LIBOR + 4.00%, Rate Floor: 4.75%) due 10/22/26††† | | | 4,688,250 | | | | 4,697,064 | |
Boxer Parent Co., Inc. | | | | | | | | |
4.00% (3 Month EURIBOR + 4.00%, Rate Floor: 4.00%) due 10/02/25 | EUR | | 4,000,000 | | | | 4,682,833 | |
Cologix Holdings, Inc. | | | | | | | | |
4.00% (1 Month USD LIBOR + 3.00%, Rate Floor: 4.00%) due 03/20/24 | | | 2,390,223 | | | | 2,384,677 | |
4.75% (1 Month USD LIBOR + 3.75%, Rate Floor: 4.75%) due 03/20/24 | | | 2,100,000 | | | | 2,095,128 | |
Project Boost Purchaser LLC | | | | | | | | |
3.61% (1 Month USD LIBOR + 3.50%, Rate Floor: 3.50%) due 06/01/26 | | | 3,366,977 | | | | 3,318,055 | |
Informatica LLC | | | | | | | | |
3.36% (1 Month USD LIBOR + 3.25%, Rate Floor: 3.25%) due 02/25/27 | | | 1,915,924 | | | | 1,899,638 | |
Solera LLC | | | | | | | | |
2.86% (1 Month USD LIBOR + 2.75%, Rate Floor: 2.75%) due 03/03/23 | | | 878,727 | | | | 873,077 | |
Aston FinCo SARL | | | | | | | | |
4.36% (1 Month USD LIBOR + 4.25%, Rate Floor: 4.25%) due 10/09/26 | | | 642,508 | | | | 637,290 | |
Omnitracs LLC | | | | | | | | |
2.86% (1 Month USD LIBOR + 2.75%, Rate Floor: 2.75%) due 03/21/25 | | | 372,652 | | | | 362,404 | |
Aspect Software, Inc. | | | | | | | | |
6.00% (3 Month USD LIBOR + 5.00%, Rate Floor: 6.00%) due 01/15/24 | | | 9,683 | | | | 9,650 | |
Total Technology | | | | | | | 261,668,948 | |
| | | | | | | | | |
Communications - 0.5% | | | | |
UPC Financing Partnership | | | | | | | | |
3.61% (1 Month USD LIBOR + 3.50%, Rate Floor: 3.50%) due 01/31/29 | | | 45,150,000 | | | | 45,005,068 | |
Syndigo LLC | | | | | | | | |
5.25% (6 Month USD LIBOR + 4.50%, Rate Floor: 5.25%) due 12/15/27††† | | | 24,900,000 | | | | 24,900,000 | |
Xplornet Communications, Inc. | | | | | | | | |
4.86% (1 Month USD LIBOR + 4.75%, Rate Floor: 4.75%) due 06/10/27 | | | 21,144,479 | | | | 21,127,986 | |
ProQuest, LLC | | | | | | | | |
3.36% (1 Month USD LIBOR + 3.25%, Rate Floor: 3.25%) due 10/23/26 | | | 19,650,000 | | | | 19,512,450 | |
Alchemy Copyrights LLC | | | | | | | | |
3.50% (1 Month USD LIBOR + 3.00%, Rate Floor: 3.50%) due 03/10/28††† | | | 6,034,875 | | | | 6,034,875 | |
SEE NOTES TO FINANCIAL STATEMENTS. | THE GUGGENHEIM FUNDS SEMI-ANNUAL REPORT | 69 |
SCHEDULE OF INVESTMENTS (Unaudited)(continued) | March 31, 2021 |
TOTAL RETURN BOND FUND | |
| | Face
Amount~ | | | Value | |
Radiate Holdco, LLC | | | | | | | | |
4.25% (1 Month USD LIBOR + 3.50%, Rate Floor: 4.25%) due 09/25/26 | | | 2,244,375 | | | $ | 2,242,086 | |
Zayo Group Holdings, Inc. | | | | | | | | |
3.11% (1 Month USD LIBOR + 3.00%, Rate Floor: 3.00%) due 03/09/27 | | | 1,652,094 | | | | 1,637,605 | |
LCPR Loan Financing LLC | | | | | | | | |
due 10/15/285 | | | 1,300,000 | | | | 1,301,625 | |
Authentic Brands | | | | | | | | |
4.00% (3 Month USD LIBOR + 3.25%, Rate Floor: 4.00%) due 09/27/24 | | | 1,071,454 | | | | 1,067,821 | |
Titan US Finco LLC | | | | | | | | |
4.20% (3 Month USD LIBOR + 4.00%, Rate Floor: 4.00%) due 05/01/26 | | | 982,521 | | | | 980,065 | |
Internet Brands, Inc. | | | | | | | | |
3.61% (1 Month USD LIBOR + 3.50%, Rate Floor: 3.50%) due 09/13/24 | | | 764,780 | | | | 755,603 | |
Telenet Financing USD LLC | | | | | | | | |
2.11% (1 Month USD LIBOR + 2.00%, Rate Floor: 2.00%) due 04/28/28 | | | 620,000 | | | | 611,630 | |
Flight Bidco, Inc. | | | | | | | | |
3.61% (1 Month USD LIBOR + 3.50%, Rate Floor: 3.50%) due 07/23/25 | | | 283,906 | | | | 281,334 | |
Total Communications | | | | | | | 125,458,148 | |
| | | | | | | | | |
Basic Materials - 0.5% |
INEOS Ltd. | | | | | | | | |
2.75% (3 Month EURIBOR + 2.75%, Rate Floor: 2.75%) due 01/29/26 | | EUR | 31,100,000 | | | | 36,164,326 | |
Illuminate Buyer LLC | | | | | | | | |
3.61% (1 Month USD LIBOR + 3.50%, Rate Floor: 3.50%) due 06/30/27 | | | 28,492,922 | | | | 28,338,491 | |
GrafTech Finance, Inc. | | | | | | | | |
4.00% (1 Month USD LIBOR + 3.00%, Rate Floor: 4.00%) due 02/12/25 | | | 21,935,840 | | | | 21,908,420 | |
Trinseo Materials Operating S.C.A. | | | | | | | | |
due 03/17/28 | | | 11,100,000 | | | | 10,975,125 | |
PQ Corp. | | | | | | | | |
4.00% (3 Month USD LIBOR + 3.00%, Rate Floor: 4.00%) due 02/08/27 | | | 7,340,985 | | | | 7,337,902 | |
TricorBraun Holdings, Inc. | | | | | | | | |
3.75% (6 Month USD LIBOR + 3.25%, Rate Floor: 3.75%) due 03/03/28 | | | 6,209,832 | | | | 6,145,125 | |
Pregis TopCo Corp. | | | | | | | | |
3.86% (1 Month USD LIBOR + 3.75%, Rate Floor: 3.75%) due 07/31/26 | | | 2,935,500 | | | | 2,909,198 | |
Clearwater Paper Corp. | | | | | | | | |
70 | THE GUGGENHEIM FUNDS SEMI-ANNUAL REPORT | SEE NOTES TO FINANCIAL STATEMENTS. |
SCHEDULE OF INVESTMENTS (Unaudited)(continued) | March 31, 2021 |
TOTAL RETURN BOND FUND | |
| | Face
Amount~ | | | Value | |
3.22% (1 Month USD LIBOR + 3.00% and 3 Month USD LIBOR + 3.00%, Rate Floor: 3.00%) due 07/24/26 | | | 540,257 | | | $ | 538,906 | |
Total Basic Materials | | | | | | | 114,317,493 | |
| | | | | | | | | |
Utilities - 0.2% | | | | | | | | |
Hamilton Projects Acquiror LLC | | | | | | | | |
5.75% (3 Month USD LIBOR + 4.75%, Rate Floor: 5.75%) due 06/17/27 | | | 53,529,766 | | | | 53,686,073 | |
RS Ivy Holdco, Inc. | | | | | | | | |
6.50% (1 Month USD LIBOR + 5.50%, Rate Floor: 6.50%) due 12/23/27††† | | | 5,985,000 | | | | 5,985,000 | |
Total Utilities | | | | | | | 59,671,073 | |
| | | | | | | | | |
Energy - 0.1% | | | | | | | | |
Venture Global Calcasieu Pass LLC | | | | | | | | |
2.48% (1 Month USD LIBOR + 2.38% and 3 Month USD LIBOR + 2.38%, Rate Floor: 2.38%) due 08/19/26††† | | | 16,027,748 | | | | 15,146,222 | |
Lotus Midstream, LLC | | | | | | | | |
3.36% (1 Month USD LIBOR + 3.25%, Rate Floor: 3.25%) due 09/29/25 | | | 550,371 | | | | 546,381 | |
Total Energy | | | | | | | 15,692,603 | |
| | | | | | | | | |
Total Senior Floating Rate Interests | | | | |
(Cost $1,964,196,481) | | | 1,974,790,677 | |
| | | | | | | | | |
U.S. GOVERNMENT SECURITIES†† - 7.4% |
U.S. Treasury Notes |
1.13% due 02/15/3114 | | | 799,908,000 | | | | 755,163,146 | |
0.25% due 05/31/2514 | | | 403,300,000 | | | | 395,549,078 | |
2.00% due 04/30/24 | | | 12,460,000 | | | | 13,075,213 | |
1.75% due 06/30/24 | | | 9,101,000 | | | | 9,487,082 | |
2.38% due 02/29/24 | | | 7,749,000 | | | | 8,205,465 | |
0.50% due 04/30/27 | | | 6,780,000 | | | | 6,489,731 | |
1.38% due 02/15/23 | | | 4,500,000 | | | | 4,602,305 | |
1.75% due 12/31/26 | | | 4,000,000 | | | | 4,137,500 | |
1.50% due 10/31/24 | | | 3,820,000 | | | | 3,949,223 | |
2.25% due 08/15/27 | | | 3,370,000 | | | | 3,569,831 | |
0.50% due 05/31/27 | | | 2,600,000 | | | | 2,483,609 | |
1.13% due 02/28/27 | | | 2,250,000 | | | | 2,242,441 | |
2.13% due 05/15/25 | | | 880,000 | | | | 931,184 | |
U.S. Treasury Strips |
due 02/15/508,12,16 | | | 736,163,000 | | | | 359,368,488 | |
due 02/15/5112,16 | | | 310,000,000 | | | | 147,944,329 | |
due 08/15/5012,16 | | | 160,000,000 | | | | 77,237,611 | |
U.S. Treasury Bonds |
8.00% due 11/15/21 | | | 5,600,000 | | | | 5,876,063 | |
8.13% due 08/15/21 | | | 3,900,000 | | | | 4,017,914 | |
2.88% due 08/15/45 | | | 2,630,000 | | | | 2,864,851 | |
2.38% due 11/15/49 | | | 2,300,000 | | | | 2,278,438 | |
1.38% due 08/15/50 | | | 2,450,000 | | | | 1,904,109 | |
2.75% due 11/15/42 | | | 700,000 | | | | 748,617 | |
Total U.S. Government Securities | | | | |
(Cost $1,946,896,907) | | | 1,812,126,228 | |
| | | | | | | | | |
FEDERAL AGENCY BONDS†† - 1.8% |
Freddie Mac Principal Strips |
due 07/15/3212,14,16 | | | 123,250,000 | | | | 96,968,540 | |
Fannie Mae Principal Strips |
due 07/15/3712,14,16 | | | 89,850,000 | | | | 60,010,815 | |
due 11/15/3012,14,16 | | | 37,570,000 | | | | 30,976,014 | |
due 08/06/3812,16 | | | 5,850,000 | | | | 3,773,619 | |
Tennessee Valley Authority |
4.25% due 09/15/65 | | | 36,250,000 | | | | 46,763,551 | |
5.38% due 04/01/56 | | | 8,960,000 | | | | 13,543,148 | |
due 03/15/3311,16 | | | 3,000,000 | | | | 2,299,737 | |
due 01/15/2811,16 | | | 2,011,000 | | | | 1,812,609 | |
due 03/15/3511,16 | | | 1,142,000 | | | | 820,490 | |
due 09/15/5311,16 | | | 1,612,000 | | | | 576,527 | |
due 09/15/5511,16 | | | 1,612,000 | | | | 537,473 | |
due 09/15/5611,16 | | | 1,612,000 | | | | 518,796 | |
due 03/15/5711,16 | | | 1,612,000 | | | | 510,567 | |
due 09/15/5711,16 | | | 1,612,000 | | | | 502,470 | |
SEE NOTES TO FINANCIAL STATEMENTS. | THE GUGGENHEIM FUNDS SEMI-ANNUAL REPORT | 71 |
SCHEDULE OF INVESTMENTS (Unaudited)(continued) | March 31, 2021 |
TOTAL RETURN BOND FUND | |
| | Face
Amount~ | | | Value | |
due 09/15/5811,16 | | | 1,612,000 | | | $ | 483,083 | |
due 03/15/5911,16 | | | 1,612,000 | | | | 475,374 | |
due 09/15/5911,16 | | | 1,612,000 | | | | 467,788 | |
due 09/15/6011,16 | | | 1,612,000 | | | | 452,977 | |
due 09/15/5411,16 | | | 1,020,000 | | | | 352,262 | |
due 03/15/6111,16 | | | 1,020,000 | | | | 282,049 | |
due 09/15/6111,16 | | | 1,020,000 | | | | 277,548 | |
due 09/15/6211,16 | | | 1,020,000 | | | | 267,667 | |
due 03/15/6311,16 | | | 1,020,000 | | | | 263,382 | |
due 09/15/6311,16 | | | 1,020,000 | | | | 259,167 | |
due 09/15/6411,16 | | | 1,020,000 | | | | 248,800 | |
due 03/15/6511,16 | | | 1,020,000 | | | | 244,794 | |
due 09/15/6511,16 | | | 1,020,000 | | | | 240,852 | |
Tennessee Valley Authority Principal Strips |
due 01/15/4812,16 | | | 38,400,000 | | | | 16,829,069 | |
due 12/15/4212,16 | | | 23,785,000 | | | | 12,480,418 | |
due 01/15/3812,16 | | | 15,800,000 | | | | 9,999,883 | |
due 09/15/3912,16 | | | 570,000 | | | | 335,456 | |
due 04/01/5612,16 | | | 540,000 | | | | 176,949 | |
Freddie Mac Coupon Strips |
due 03/15/3011,16 | | | 12,050,000 | | | | 10,113,565 | |
due 07/15/3011,14,16 | | | 8,600,000 | | | | 7,151,304 | |
due 01/15/3111,16 | | | 7,750,000 | | | | 6,356,124 | |
due 09/15/3011,16 | | | 2,906,000 | | | | 2,403,986 | |
due 03/15/3111,16 | | | 2,500,000 | | | | 2,043,452 | |
due 07/15/3111,16 | | | 1,800,000 | | | | 1,456,929 | |
due 01/15/3011,16 | | | 1,050,000 | | | | 884,913 | |
Federal Farm Credit Bank |
2.43% due 01/29/37 | | | 13,720,000 | | | | 13,985,921 | |
3.58% due 04/11/47 | | | 4,900,000 | | | | 5,629,355 | |
2.00% due 05/14/40 | | | 3,000,000 | | | | 2,782,005 | |
2.04% due 12/22/45 | | | 2,870,000 | | | | 2,556,585 | |
1.99% due 07/30/40 | | | 2,000,000 | | | | 1,837,856 | |
3.11% due 08/05/48 | | | 1,500,000 | | | | 1,593,354 | |
3.79% due 05/18/44 | | | 1,000,000 | | | | 1,180,257 | |
2.88% due 10/01/40 | | | 100,000 | | | | 105,866 | |
3.67% due 02/26/44 | | | 70,000 | | | | 81,106 | |
Freddie Mac |
due 01/02/3416 | | | 18,000,000 | | | | 13,487,778 | |
due 09/15/3616 | | | 7,355,000 | | | | 5,022,553 | |
due 11/15/3816 | | | 6,000,000 | | | | 3,830,220 | |
2.05% due 08/19/50 | | | 2,010,000 | | | | 1,744,680 | |
2.02% due 10/05/45 | | | 720,000 | | | | 636,782 | |
U.S. International Development Finance Corp. |
3.17% due 10/05/34 | | | 11,176,953 | | | | 12,216,056 | |
1.79% due 10/15/29 | | | 9,704,279 | | | | 10,205,501 | |
Fannie Mae |
due 01/15/3216 | | | 9,413,000 | | | | 7,516,921 | |
due 07/15/3216 | | | 3,963,000 | | | | 3,114,462 | |
due 01/15/3516 | | | 2,250,000 | | | | 1,633,489 | |
due 02/06/3316 | | | 1,456,000 | | | | 1,124,087 | |
due 01/15/3316 | | | 1,450,000 | | | | 1,120,882 | |
Federal Home Loan Bank |
3.63% due 06/22/43 | | | 4,850,000 | | | | 5,601,871 | |
3.25% due 06/10/39 | | | 4,500,000 | | | | 5,037,529 | |
2.69% due 09/26/34 | | | 1,350,000 | | | | 1,382,848 | |
Resolution Funding Corporation Principal Strips |
due 01/15/3012,16 | | | 1,950,000 | | | | 1,643,370 | |
due 04/15/3012,16 | | | 725,000 | | | | 605,877 | |
Total Federal Agency Bonds | | | | |
(Cost $405,913,095) | | | | | | | 439,839,358 | |
| | | | | | | | | |
MUNICIPAL BONDS†† - 1.1% |
California - 0.4% | | | | | | | | |
State of California General Obligation Unlimited | | | | | | | | |
7.55% due 04/01/39 | | | 11,900,000 | | | | 19,223,846 | |
7.35% due 11/01/39 | | | 10,135,000 | | | | 15,559,960 | |
San Mateo Foster City School District General Obligation Unlimited | | | | | | | | |
3.06% due 08/01/44 | | | 6,125,000 | | | | 6,146,708 | |
2.63% due 08/01/36 | | | 2,355,000 | | | | 2,374,648 | |
2.73% due 08/01/37 | | | 2,100,000 | | | | 2,121,986 | |
2.79% due 08/01/38 | | | 1,155,000 | | | | 1,167,195 | |
Newport Mesa Unified School District General Obligation Unlimited | | | | | | | | |
due 08/01/4516 | | | 8,565,000 | | | | 3,693,717 | |
due 08/01/3916 | | | 4,000,000 | | | | 2,256,622 | |
due 08/01/4016 | | | 2,500,000 | | | | 1,346,830 | |
due 08/01/4116 | | | 2,000,000 | | | | 1,027,537 | |
due 08/01/4316 | | | 1,900,000 | | | | 893,802 | |
due 08/01/4616 | | | 800,000 | | | | 330,752 | |
72 | THE GUGGENHEIM FUNDS SEMI-ANNUAL REPORT | SEE NOTES TO FINANCIAL STATEMENTS. |
SCHEDULE OF INVESTMENTS (Unaudited)(continued) | March 31, 2021 |
TOTAL RETURN BOND FUND | |
| | Face
Amount~ | | | Value | |
California Public Finance Authority Revenue Bonds | | | | | | | | |
3.07% due 10/15/40 | | | 8,000,000 | | | $ | 8,000,999 | |
Cypress School District General Obligation Unlimited | | | | | | | | |
due 08/01/4816 | | | 14,450,000 | | | | 5,598,963 | |
California State University Revenue Bonds | | | | | | | | |
2.98% due 11/01/51 | | | 5,000,000 | | | | 4,901,041 | |
Palomar Community College District General Obligation Unlimited | | | | | | | | |
2.99% due 08/01/44 | | | 2,900,000 | | | | 2,856,580 | |
San Bernardino Community College District General Obligation Unlimited | | | | | | | | |
due 08/01/4416 | | | 4,750,000 | | | | 2,384,597 | |
Upland Unified School District General Obligation Unlimited | | | | | | | | |
due 08/01/5016 | | | 5,040,000 | | | | 2,120,232 | |
Hanford Joint Union High School District General Obligation Unlimited | | | | | | | | |
due 08/01/4116 | | | 4,125,000 | | | | 1,902,805 | |
San Marcos Unified School District General Obligation Unlimited | | | | | | | | |
due 08/01/4716 | | | 3,600,000 | | | | 1,758,792 | |
San Dieguito Union High School District General Obligation Unlimited | | | | | | | | |
2.85% due 08/01/38 | | | 850,000 | | | | 864,639 | |
2.68% due 08/01/36 | | | 650,000 | | | | 661,414 | |
Hillsborough City School District General Obligation Unlimited | | | | | | | | |
due 09/01/3716 | | | 1,000,000 | | | | 597,212 | |
due 09/01/3916 | | | 1,000,000 | | | | 546,318 | |
Oakland Redevelopment Agency Successor Agency Tax Allocation | | | | | | | | |
4.00% due 09/01/39 | | | 1,100,000 | | | | 1,137,136 | |
Wiseburn School District General Obligation Unlimited | | | | | | | | |
due 08/01/3416 | | | 900,000 | | | | 667,564 | |
Santa Ana Unified School District General Obligation Unlimited | | | | | | | | |
due 08/01/3516 | | | 700,000 | | | | 503,169 | |
Total California | | | | | | | 90,645,064 | |
| | | | | | | | | |
New York - 0.3% | | | | | | | | |
Westchester County Local Development Corp. Revenue Bonds | | | | | | | | |
3.85% due 11/01/50 | | | 40,000,000 | | | | 40,965,184 | |
New York Power Authority Revenue Bonds | | | | | | | | |
2.82% due 11/15/39 | | | 16,500,000 | | | | 15,996,755 | |
New York City Water & Sewer System Revenue Bonds | | | | | | | | |
5.00% due 06/15/49 | | | 650,000 | | | | 800,720 | |
Total New York | | | | | | | 57,762,659 | |
| | | | | | | | | |
Texas - 0.2% | | | | | | | | |
Dallas Fort Worth International Airport Revenue Bonds | | | | | | | | |
3.09% due 11/01/40 | | | 13,800,000 | | | | 13,645,045 | |
SEE NOTES TO FINANCIAL STATEMENTS. | THE GUGGENHEIM FUNDS SEMI-ANNUAL REPORT | 73 |
SCHEDULE OF INVESTMENTS (Unaudited)(continued) | March 31, 2021 |
TOTAL RETURN BOND FUND | |
| | Face
Amount~ | | | Value | |
City of San Antonio Texas Electric & Gas Systems Revenue Bonds | | | | | | | | |
2.91% due 02/01/48 | | | 10,500,000 | | | $ | 10,318,335 | |
Denton County Housing Finance Corp. Revenue Bonds | | | | | | | | |
2.15% due 11/01/38 | | | 7,200,000 | | | | 7,201,771 | |
Wylie Independent School District General Obligation Unlimited | | | | | | | | |
due 08/15/4616 | | | 8,885,000 | | | | 3,503,648 | |
due 08/15/4316 | | | 3,555,000 | | | | 1,599,855 | |
North Texas Tollway Authority Revenue Bonds | | | | | | | | |
3.03% due 01/01/40 | | | 5,000,000 | | | | 4,917,497 | |
Central Texas Turnpike System Revenue Bonds | | | | | | | | |
3.03% due 08/15/41 | | | 3,150,000 | | | | 2,963,584 | |
Tarrant County Cultural Education Facilities Finance Corp. Revenue Bonds | | | | | | | | |
3.42% due 09/01/50 | | | 2,500,000 | | | | 2,465,049 | |
Harris County-Houston Sports Authority Revenue Bonds | | | | | | | | |
due 11/15/4516 | | | 2,850,000 | | | | 1,011,470 | |
due 11/15/4116 | | | 1,500,000 | | | | 655,132 | |
Harris County Cultural Education Facilities Finance Corp. Revenue Bonds | | | | | | | | |
3.34% due 11/15/37 | | | 1,500,000 | | | | 1,472,444 | |
Dallas/Fort Worth International Airport Revenue Bonds | | | | | | | | |
2.92% due 11/01/50 | | | 1,300,000 | | | | 1,235,337 | |
Grand Parkway Transportation Corp. Revenue Bonds | | | | | | | | |
3.31% due 10/01/49 | | | 1,000,000 | | | | 1,007,036 | |
Total Texas | | | | | | | 51,996,203 | |
| | | | | | | | | |
Ohio - 0.1% | | | | | | | | |
Northeast Ohio Regional Sewer District Revenue Bonds | | | | | | | | |
3.30% due 11/15/49 | | | 10,750,000 | | | | 11,162,414 | |
Ohio Turnpike & Infrastructure Commission Revenue Bonds | | | | | | | | |
3.20% due 02/15/48 | | | 5,200,000 | | | | 5,205,518 | |
Dayton-Montgomery County Port Authority Revenue Bonds | | | | | | | | |
1.84% due 09/01/38 | | | 4,600,000 | | | | 4,513,574 | |
County of Franklin Ohio Revenue Bonds | | | | | | | | |
2.88% due 11/01/50 | | | 4,000,000 | | | | 3,684,654 | |
Total Ohio | | | | | | | 24,566,160 | |
| | | | | | | | | |
Illinois - 0.1% | | | | | | | | |
State of Illinois General Obligation Unlimited | | | | | | | | |
5.65% due 12/01/38 | | | 5,850,000 | | | | 6,924,799 | |
6.63% due 02/01/35 | | | 1,820,000 | | | | 2,251,725 | |
City of Chicago Illinois General Obligation Unlimited | | | | | | | | |
6.31% due 01/01/44 | | | 4,500,000 | | | | 5,912,093 | |
Total Illinois | | | | | | | 15,088,617 | |
| | | | | | | | | |
Mississippi - 0.0% | | | | | | | | |
Medical Center Educational Building Corp. Revenue Bonds | | | | | | | | |
2.92% due 06/01/41 | | | 11,800,000 | | | | 11,031,294 | |
| | | | | | | | | |
74 | THE GUGGENHEIM FUNDS SEMI-ANNUAL REPORT | SEE NOTES TO FINANCIAL STATEMENTS. |
SCHEDULE OF INVESTMENTS (Unaudited)(continued) | March 31, 2021 |
TOTAL RETURN BOND FUND | |
| | Face
Amount~ | | | Value | |
Alabama - 0.0% | | | | | | | | |
Auburn University Revenue Bonds | | | | | | | | |
2.68% due 06/01/50 | | | 6,500,000 | | | $ | 5,960,106 | |
2.53% due 06/01/40 | | | 4,100,000 | | | | 3,834,137 | |
Total Alabama | | | | | | | 9,794,243 | |
| | | | | | | | | |
North Carolina - 0.0% | | | | |
Inlivian Revenue Bonds | | | | | | | | |
3.02% due 01/01/38 | | | 4,125,000 | | | | 4,015,821 | |
Total North Carolina | | | | | | | 4,015,821 | |
| | | | | | | | | |
Washington - 0.0% | | | | | | | | |
Central Washington University Revenue Bonds | | | | | | | | |
6.95% due 05/01/40 | | | 1,750,000 | | | | 2,387,540 | |
Klickitat County Public Utility District No. 1 Revenue Bonds | | | | | | | | |
5.25% due 12/01/21 | | | 15,000 | | | | 15,347 | |
Total Washington | | | | | | | 2,402,887 | |
| | | | | | | | | |
Arizona - 0.0% | | | | | | | | |
Northern Arizona University Revenue Bonds | | | | | | | | |
3.09% due 08/01/39 | | | 2,350,000 | | | | 2,227,232 | |
| | | | | | | | | |
Florida - 0.0% | | | | | | | | |
County of Miami-Dade Florida Revenue Bonds | | | | | | | | |
due 10/01/4116 | | | 4,100,000 | | | | 2,137,203 | |
| | | | | | | | | |
Pennsylvania - 0.0% | | | | | | | | |
Pennsylvania Economic Development Financing Authority Revenue Bonds | | | | | | | | |
due 01/01/4116 | | | 995,000 | | | | 595,773 | |
due 01/01/3716 | | | 570,000 | | | | 387,554 | |
Total Pennsylvania | | | | | | | 983,327 | |
| | | | | | | | | |
Oklahoma - 0.0% | | | | | | | | |
Oklahoma Development Finance Authority Revenue Bonds | | | | | | | | |
4.65% due 08/15/30 | | | 450,000 | | | | 503,012 | |
| | | | | | | | | |
Idaho - 0.0% | | | | | | | | |
Boise State University Revenue Bonds | | | | | | | | |
3.06% due 04/01/40 | | | 250,000 | | | | 237,552 | |
| | | | | | | | | |
Virginia - 0.0% | | | | | | | | |
Montgomery County Economic Development Authority Revenue Bonds | | | | | | | | |
4.66% due 06/01/21 | | | 25,000 | | | | 25,174 | |
| | | | | | | | | |
Minnesota - 0.0% | | | | | | | | |
Dakota & Washington Counties Housing & Redevelopment Auth/City of Bloomington Minnesota Revenue Bonds | | | | | | | | |
8.38% due 09/01/21 | | | 5,000 | | | | 5,109 | |
Total Municipal Bonds | | | | |
(Cost $270,038,079) | | | 273,421,557 | |
| | | | | | | | | |
FOREIGN GOVERNMENT DEBT†† - 0.0% |
Bermuda Government International Bond |
3.38% due 08/20/506 | | | 8,400,000 | | | | 8,124,480 | |
Total Foreign Government Debt | | | | |
(Cost $8,376,677) | | | | | | | 8,124,480 | |
| | | | | | | | | |
SENIOR FIXED RATE INTERESTS††† - 0.0% |
Industrial - 0.0% | | | | | | | | |
CTL Logistics | | | | | | | | |
due 10/10/425 | | | 4,756,586 | | | | 4,413,273 | |
Total Senior Fixed Rate Interests | | | | |
(Cost $4,756,586) | | | 4,413,273 | |
| | | | | | | | | |
SEE NOTES TO FINANCIAL STATEMENTS. | THE GUGGENHEIM FUNDS SEMI-ANNUAL REPORT | 75 |
SCHEDULE OF INVESTMENTS (Unaudited)(continued) | March 31, 2021 |
TOTAL RETURN BOND FUND | |
| | | Notional
Value | | | Value | |
| OTC OPTIONS PURCHASED†† - 0.4% |
| Call options on: | | | | | | | | |
| Bank of America, N.A. 2Y-10 CMS CAP Expiring July 2022 with strike price of $0.40 | | | 6,229,100,000 | | | $ | 57,806,048 | |
| Goldman Sachs International 2Y-10 CMS CAP Expiring July 2022 with strike price of $0.61 | | | 1,880,100,000 | | | | 13,875,138 | |
| Morgan Stanley Capital Services LLC 2Y-10 CMS CAP Expiring July 2022 with strike price of $0.40 | | | 1,402,500,000 | | | | 13,015,200 | |
| Bank of America, N.A. 2Y-10 CMS CAP Expiring July 2022 with strike price of $0.61 | | | 630,100,000 | | | | 4,650,138 | |
| | | | | | | | 89,346,524 | |
| Total OTC Options Purchased | | | | | | | | |
| (Cost $23,214,540) | | | | | | | 89,346,524 | |
| | | | | | | | | |
| Total Investments - 106.4% | | | | | | | | |
| (Cost $25,710,788,756) | | | | | | | 25,994,742,877 | |
| Other Assets & Liabilities, net - (6.4)% | | | | | | | (1,573,564,465 | ) |
| Total Net Assets - 100.0% | | | | | | $ | 24,421,178,412 | |
Centrally Cleared Interest Rate Swap Agreements†† |
| |
Counterparty | Exchange | Floating
Rate Type | Floating Rate Index | | Fixed
Rate | | Payment
Frequency | Maturity
Date | | Notional
Amount | |
BofA Securities, Inc. | CME | Receive | 3-Month USD LIBOR | 0.65% | Quarterly | 08/13/30 | | $ | 463,000,000 | |
BofA Securities, Inc. | CME | Receive | 3-Month USD LIBOR | 0.99% | Quarterly | 08/20/50 | | | 127,000,000 | |
BofA Securities, Inc. | CME | Receive | 3-Month USD LIBOR | 0.99% | Quarterly | 08/25/50 | | | 100,000,000 | |
BofA Securities, Inc. | CME | Receive | 3-Month USD LIBOR | 0.53% | Quarterly | 08/06/30 | | | 243,000,000 | |
BofA Securities, Inc. | CME | Receive | 3-Month USD LIBOR | 0.45% | Quarterly | 07/13/27 | | | 300,000,000 | |
BofA Securities, Inc. | CME | Pay | Federal Funds Rate | 1.27% | Annually | 02/07/23 | | | 82,400,000 | |
BofA Securities, Inc. | CME | Pay | Federal Funds Rate | 1.37% | Annually | 12/04/21 | | | 175,200,000 | |
BofA Securities, Inc. | CME | Pay | Federal Funds Rate | 1.34% | Annually | 11/27/21 | | | 164,500,000 | |
BofA Securities, Inc. | CME | Receive | 3-Month USD LIBOR | 0.22% | Quarterly | 07/13/23 | | | 500,000,000 | |
BofA Securities, Inc. | CME | Pay | Federal Funds Rate | 0.59% | Annually | 03/07/22 | | | 150,000,000 | |
BofA Securities, Inc. | CME | Pay | Federal Funds Rate | 0.82% | Annually | 04/01/26 | | | 600,000,000 | |
BofA Securities, Inc. | CME | Pay | Federal Funds Rate | 0.47% | Annually | 03/09/25 | | | 498,005,000 | |
BofA Securities, Inc. | CME | Pay | Federal Funds Rate | 0.52% | Annually | 10/02/30 | | | 132,900,000 | |
BofA Securities, Inc. | CME | Pay | Federal Funds Rate | 0.56% | Annually | 10/07/30 | | | 226,000,000 | |
BofA Securities, Inc. | CME | Pay | Federal Funds Rate | 0.55% | Annually | 10/16/30 | | | 350,000,000 | |
BofA Securities, Inc. | CME | Pay | Federal Funds Rate | 0.68% | Annually | 12/02/30 | | | 400,000,000 | |
BofA Securities, Inc. | CME | Pay | Federal Funds Rate | 0.51% | Annually | 09/02/30 | | | 400,000,000 | |
BofA Securities, Inc. | CME | Pay | Federal Funds Rate | 0.76% | Annually | 01/05/31 | | | 650,000,000 | |
76 | THE GUGGENHEIM FUNDS SEMI-ANNUAL REPORT | SEE NOTES TO FINANCIAL STATEMENTS. |
SCHEDULE OF INVESTMENTS (Unaudited)(continued) | March 31, 2021 |
TOTAL RETURN BOND FUND | |
Counterparty | | Value | | | Upfront
Premiums
Paid | | | Unrealized
Appreciation
(Depreciation)** | |
BofA Securities, Inc. | | $ | 44,626,001 | | | $ | 3,750 | | | $ | 44,622,251 | |
BofA Securities, Inc. | | | 35,249,182 | | | | 2,471 | | | | 35,246,711 | |
BofA Securities, Inc. | | | 27,920,853 | | | | 2,009 | | | | 27,918,844 | |
BofA Securities, Inc. | | | 25,987,049 | | | | 2,097 | | | | 25,984,952 | |
BofA Securities, Inc. | | | 16,093,518 | | | | 1,883 | | | | 16,091,635 | |
BofA Securities, Inc. | | | 1,773,850 | | | | 312 | | | | 1,773,538 | |
BofA Securities, Inc. | | | 1,575,093 | | | | 249 | | | | 1,574,844 | |
BofA Securities, Inc. | | | 1,411,209 | | | | 233 | | | | 1,410,976 | |
BofA Securities, Inc. | | | 1,315,890 | | | | 1,176 | | | | 1,314,714 | |
BofA Securities, Inc. | | | 731,856 | | | | 313 | | | | 731,543 | |
BofA Securities, Inc. | | | (1,268,172 | ) | | | 2,998 | | | | (1,271,170 | ) |
BofA Securities, Inc. | | | (2,333,044 | ) | | | 1,884 | | | | (2,334,928 | ) |
BofA Securities, Inc. | | | (12,427,883 | ) | | | 1,295 | | | | (12,429,178 | ) |
BofA Securities, Inc. | | | (20,331,254 | ) | | | 2,006 | | | | (20,333,260 | ) |
BofA Securities, Inc. | | | (32,112,284 | ) | | | 2,957 | | | | (32,115,241 | ) |
BofA Securities, Inc. | | | (32,759,559 | ) | | | 3,384 | | | | (32,762,943 | ) |
BofA Securities, Inc. | | | (36,244,552 | ) | | | 3,298 | | | | (36,247,850 | ) |
BofA Securities, Inc. | | | (49,272,053 | ) | | | 5,369 | | | | (49,277,422 | ) |
| | | $ | (30,064,300 | ) | | $ | 37,684 | | | $ | (30,101,984 | ) |
SEE NOTES TO FINANCIAL STATEMENTS. | THE GUGGENHEIM FUNDS SEMI-ANNUAL REPORT | 77 |
SCHEDULE OF INVESTMENTS (Unaudited)(continued) | March 31, 2021 |
TOTAL RETURN BOND FUND | |
Total Return Swap Agreements |
Counterparty | Reference
Obligation | Financing
Rate Receive | Payment
Frequency | | Maturity
Date | | | Units | | | Notional
Amount | | | Value and
Unrealized
Appreciation
(Depreciation) | |
OTC Credit Index Swap Agreements†† |
Bank of America, N.A. | iShares iBoxx $ High Yield Corporate Bond ETF | 0.39% (1 Month USD LIBOR - 0.50%) | Monthly | | | 05/04/21 | | | | 267,880 | | | $ | 23,353,778 | | | $ | 66,970 | |
Bank of America, N.A. | iShares iBoxx $ High Yield Corporate Bond ETF | 0.39% (1 Month USD LIBOR - 0.50%) | Monthly | | | 05/04/21 | | | | 286,000 | | | | 24,933,480 | | | | 60,060 | |
Bank of America, N.A. | iShares iBoxx $ High Yield Corporate Bond ETF | 0.39% (1 Month USD LIBOR - 0.50%) | Monthly | | | 05/05/21 | | | | 286,800 | | | | 25,003,224 | | | | 11,472 | |
Bank of America, N.A. | iShares iBoxx $ High Yield Corporate Bond ETF | 0.40% (1 Month USD LIBOR - 0.50%) | Monthly | | | 05/07/21 | | | | 286,300 | | | | 24,959,634 | | | | (8,589 | ) |
Bank of America, N.A. | iShares iBoxx $ High Yield Corporate Bond ETF | 0.30% (1 Month USD LIBOR - 0.40%) | Monthly | | | 05/05/21 | | | | 95,210 | | | | 8,300,408 | | | | (19,994 | ) |
Bank of America, N.A. | iShares iBoxx $ High Yield Corporate Bond ETF | 0.39% (1 Month USD LIBOR - 0.50%) | Monthly | | | 04/30/21 | | | | 1,100,000 | | | | 95,898,000 | | | | (22,000 | ) |
| | | | | | | | | | | | | | $ | 202,448,524 | | | $ | 87,919 | |
78 | THE GUGGENHEIM FUNDS SEMI-ANNUAL REPORT | SEE NOTES TO FINANCIAL STATEMENTS. |
SCHEDULE OF INVESTMENTS (Unaudited)(continued) | March 31, 2021 |
TOTAL RETURN BOND FUND | |
Forward Foreign Currency Exchange Contracts†† |
Counterparty | | Contracts
to Sell | | | Currency | | | Settlement
Date | | | Settlement
Value | | | Value at
March 31,
2021 | | | Unrealized
Appreciation
(Depreciation) | |
Citibank, N.A. | | | 436,650,000 | | | | BRL | | | | 07/01/21 | | | $ | 103,795,927 | | | $ | 77,151,049 | | | $ | 26,644,878 | |
Bank of America, N.A. | | | 17,346,669,000 | | | | JPY | | | | 08/02/21 | | | | 171,181,418 | | | | 156,852,744 | | | | 14,328,674 | |
Goldman Sachs International | | | 149,210,000 | | | | BRL | | | | 07/01/21 | | | | 34,956,073 | | | | 26,363,696 | | | | 8,592,377 | |
JPMorgan Chase Bank, N.A. | | | 10,005,000,000 | | | | JPY | | | | 07/01/21 | | | | 97,867,554 | | | | 90,434,905 | | | | 7,432,649 | |
Morgan Stanley Capital Services LLC | | | 8,674,335,000 | | | | JPY | | | | 08/02/21 | | | | 85,134,311 | | | | 78,435,419 | | | | 6,698,892 | |
Citibank, N.A. | | | 8,674,335,000 | | | | JPY | | | | 05/06/21 | | | | 84,594,646 | | | | 78,366,423 | | | | 6,228,223 | |
Barclays Bank plc | | | 188,330,000 | | | | EUR | | | | 04/16/21 | | | | 225,815,443 | | | | 220,888,073 | | | | 4,927,370 | |
JPMorgan Chase Bank, N.A. | | | 67,200,000 | | | | BRL | | | | 07/01/21 | | | | 15,963,892 | | | | 11,873,470 | | | | 4,090,422 | |
Goldman Sachs International | | | 4,532,865,300 | | | | JPY | | | | 12/20/21 | | | | 44,786,733 | | | | 41,071,875 | | | | 3,714,858 | |
Barclays Bank plc | | | 3,469,734,000 | | | | JPY | | | | 06/01/21 | | | | 33,963,723 | | | | 31,353,002 | | | | 2,610,721 | |
Bank of America, N.A. | | | 49,060,000 | | | | EUR | | | | 06/30/21 | | | | 57,939,958 | | | | 57,635,559 | | | | 304,399 | |
Goldman Sachs International | | | 5,262,000 | | | | GBP | | | | 04/16/21 | | | | 7,358,565 | | | | 7,254,111 | | | | 104,454 | |
Goldman Sachs International | | | 28,886,625 | | | | ILS | | | | 11/30/22 | | | | 8,761,487 | | | | 8,756,943 | | | | 4,544 | |
Goldman Sachs International | | | 2,265,300 | | | | JPY | | | | 06/21/21 | | | | 22,155 | | | | 20,474 | | | | 1,681 | |
Morgan Stanley Capital Services LLC | | | 2,000,000 | | | | EUR | | | | 04/16/21 | | | | 2,346,677 | | | | 2,345,756 | | | | 921 | |
JPMorgan Chase Bank, N.A. | | | 60,000 | | | | GBP | | | | 04/16/21 | | | | 83,255 | | | | 82,715 | | | | 540 | |
Goldman Sachs International | | | 356,625 | | | | ILS | | | | 11/30/21 | | | | 106,446 | | | | 107,341 | | | | (895 | ) |
Citibank, N.A. | | | 260,000 | | | | CAD | | | | 04/16/21 | | | | 205,775 | | | | 206,943 | | | | (1,168 | ) |
Goldman Sachs International | | | 499,481 | | | | ILS | | | | 07/30/21 | | | | 148,223 | | | | 149,921 | | | | (1,698 | ) |
Goldman Sachs International | | | 67,282,219 | | | | ILS | | | | 08/01/22 | | | | 20,296,296 | | | | 20,352,888 | | | | (56,592 | ) |
UBS AG | | | 105,000,000 | | | | EUR | | | | 04/16/21 | | | | 123,054,855 | | | | 123,152,167 | | | | (97,312 | ) |
Bank of America, N.A. | | | 33,128,000 | | | | ILS | | | | 04/30/21 | | | | 9,634,434 | | | | 9,921,551 | | | | (287,117 | ) |
Bank of America, N.A. | | | 75,749,000 | | | | ILS | | | | 01/31/22 | | | | 22,457,456 | | | | 22,832,740 | | | | (375,284 | ) |
Citibank, N.A. | | | 75,123,800 | | | | ILS | | | | 04/30/21 | | | | 21,943,566 | | | | 22,498,931 | | | | (555,365 | ) |
Goldman Sachs International | | | 164,231,850 | | | | ILS | | | | 01/31/22 | | | | 48,573,458 | | | | 49,503,797 | | | | (930,339 | ) |
Goldman Sachs International | | | 108,769,700 | | | | EUR | | | | 07/30/21 | | | | 126,349,602 | | | | 127,869,057 | | | | (1,519,455 | ) |
JPMorgan Chase Bank, N.A. | | | 107,510,325 | | | | EUR | | | | 07/30/21 | | | | 124,085,192 | | | | 126,388,543 | | | | (2,303,351 | ) |
Goldman Sachs International | | | 427,522,900 | | | | ILS | | | | 04/30/21 | | | | 125,180,154 | | | | 128,039,428 | | | | (2,859,274 | ) |
| | | | | | | | | | | | | | | | | | | | | | | $ | 76,697,753 | |
SEE NOTES TO FINANCIAL STATEMENTS. | THE GUGGENHEIM FUNDS SEMI-ANNUAL REPORT | 79 |
SCHEDULE OF INVESTMENTS (Unaudited)(continued) | March 31, 2021 |
TOTAL RETURN BOND FUND | |
| Counterparty | | Contracts
to Buy | | | Currency | | | Settlement
Date | | Settlement
Value | | | Value at
March 31,
2021 | | | Unrealized
Appreciation
(Depreciation) | |
| Goldman Sachs International | | | 239,980,850 | | | | ILS | | | 01/31/22 | | $ | 65,373,467 | | | $ | 72,336,538 | | | $ | 6,963,071 | |
| Goldman Sachs International | | | 216,280,025 | | | | EUR | | | 07/30/21 | | | 248,181,329 | | | | 254,257,600 | | | | 6,076,271 | |
| Goldman Sachs International | | | 267,887,350 | | | | ILS | | | 04/30/21 | | | 74,716,168 | | | | 80,229,955 | | | | 5,513,787 | |
| JPMorgan Chase Bank, N.A. | | | 267,887,350 | | | | ILS | | | 04/30/21 | | | 75,482,488 | | | | 80,229,955 | | | | 4,747,467 | |
| Goldman Sachs International | | | 67,282,219 | | | | ILS | | | 08/01/22 | | | 18,074,472 | | | | 20,352,888 | | | | 2,278,416 | |
| Goldman Sachs International | | | 28,886,625 | | | | ILS | | | 11/30/22 | | | 7,727,829 | | | | 8,756,943 | | | | 1,029,114 | |
| Goldman Sachs International | | | 499,481 | | | | ILS | | | 07/30/21 | | | 134,017 | | | | 149,921 | | | | 15,904 | |
| Goldman Sachs International | | | 356,625 | | | | ILS | | | 11/30/21 | | | 95,100 | | | | 107,341 | | | | 12,241 | |
| Barclays Bank plc | | | 2,265,300 | | | | JPY | | | 06/21/21 | | | 21,468 | | | | 20,474 | | | | (994 | ) |
| JPMorgan Chase Bank, N.A. | | | 3,469,734,000 | | | | JPY | | | 06/01/21 | | | 32,564,373 | | | | 31,353,002 | | | | (1,211,371 | ) |
| Barclays Bank plc | | | 4,532,865,300 | | | | JPY | | | 12/20/21 | | | 43,207,181 | | | | 41,071,876 | | | | (2,135,305 | ) |
| Goldman Sachs International | | | 8,674,335,000 | | | | JPY | | | 05/06/21 | | | 81,311,727 | | | | 78,366,423 | | | | (2,945,304 | ) |
| JPMorgan Chase Bank, N.A. | | | 218,775,000 | | | | BRL | | | 07/01/21 | | | 42,398,256 | | | | 38,655,034 | | | | (3,743,222 | ) |
| Citibank, N.A. | | | 434,285,000 | | | | BRL | | | 07/01/21 | | | 83,284,770 | | | | 76,733,181 | | | | (6,551,589 | ) |
| JPMorgan Chase Bank, N.A. | | | 10,005,000,000 | | | | JPY | | | 07/01/21 | | | 97,690,768 | | | | 90,434,905 | | | | (7,255,863 | ) |
| JPMorgan Chase Bank, N.A. | | | 26,021,004,000 | | | | JPY | | | 08/02/21 | | | 246,341,039 | | | | 235,288,163 | | | | (11,052,876 | ) |
| | | | | | | | | | | | | | | | | | | | | $ | (8,260,253 | ) |
80 | THE GUGGENHEIM FUNDS SEMI-ANNUAL REPORT | SEE NOTES TO FINANCIAL STATEMENTS. |
SCHEDULE OF INVESTMENTS (Unaudited)(continued) | March 31, 2021 |
TOTAL RETURN BOND FUND | |
~ | The face amount is denominated in U.S. dollars unless otherwise indicated. |
* | Non-income producing security. |
** | Includes cumulative appreciation (depreciation). Variation margin is reported within the Statement of Assets and Liabilities. |
† | Value determined based on Level 1 inputs, unless otherwise noted — See Note 4. |
†† | Value determined based on Level 2 inputs, unless otherwise noted — See Note 4. |
††† | Value determined based on Level 3 inputs — See Note 4. |
1 | Affiliated issuer. |
2 | Rate indicated is the 7-day yield as of March 31, 2021. |
3 | Security has a fixed rate coupon which will convert to a floating or variable rate coupon on a future date. |
4 | Perpetual maturity. |
5 | Variable rate security. Rate indicated is the rate effective at March 31, 2021. In some instances, the effective rate is limited by a minimum rate floor or a maximum rate cap established by the issuer. The settlement status of a position may also impact the effective rate indicated. In some cases, a position may be unsettled at period end and may not have a stated effective rate. In instances where multiple underlying reference rates and spread amounts are shown, the effective rate is based on a weighted average. |
6 | Security is a 144A or Section 4(a)(2) security. These securities have been determined to be liquid under guidelines established by the Board of Trustees. The total market value of 144A or Section 4(a)(2) securities is $10,312,640,878 (cost $10,275,737,927), or 42.2% of total net assets. |
7 | Security is a 144A or Section 4(a)(2) security. These securities have been determined to be illiquid and restricted under guidelines established by the Board of Trustees. The total market value of 144A or Section 4(a)(2) illiquid and restricted securities is $318,110,863 (cost $320,287,950), or 1.3% of total net assets — See Note 10. |
8 | All or a portion of this security is pledged as interest rate swap collateral at March 31, 2021. |
9 | Security has no stated coupon. However, it is expected to receive residual cash flow payments on defined deal dates. |
10 | Security is a step up/down bond. The coupon increases or decreases at regular intervals until the bond reaches full maturity. Rate indicated is the rate at March 31, 2021. See table below for additional step information for each security. |
11 | Security is an interest-only strip. |
12 | Security is a principal-only strip. |
13 | Payment-in-kind security. |
14 | All or a portion of this security has been physically segregated or earmarked in connection with reverse repurchase agreements. At March 31, 2021, the total market value of segregated or earmarked securities was $1,345,818,897 — See Note 6. |
15 | Security is in default of interest and/or principal obligations. |
16 | Zero coupon rate security. |
| | BofA — Bank of America |
| | BRL — Brazilian Real |
| | CAD — Canadian Dollar |
| | CME — Chicago Mercantile Exchange |
| | CMS — Constant Maturity Swap |
| | CMT — Constant Maturity Treasury |
| | EURIBOR — European Interbank Offered Rate |
| | EUR — Euro |
| | GBP — British Pound |
| | ILS — Israeli New Shekel |
| | JPY — Japanese Yen |
| | LIBOR — London Interbank Offered Rate |
| | plc — Public Limited Company |
SEE NOTES TO FINANCIAL STATEMENTS. | THE GUGGENHEIM FUNDS SEMI-ANNUAL REPORT | 81 |
SCHEDULE OF INVESTMENTS (Unaudited)(continued) | March 31, 2021 |
TOTAL RETURN BOND FUND | |
| | REMIC — Real Estate Mortgage Investment Conduit |
| | REIT — Real Estate Investment Trust |
| | SARL — Société à Responsabilité Limitée |
| | WAC — Weighted Average Coupon |
| | |
| | See Sector Classification in Other Information section. |
82 | THE GUGGENHEIM FUNDS SEMI-ANNUAL REPORT | SEE NOTES TO FINANCIAL STATEMENTS. |
SCHEDULE OF INVESTMENTS (Unaudited)(continued) | March 31, 2021 |
TOTAL RETURN BOND FUND | |
The following table summarizes the inputs used to value the Fund’s investments at March 31, 2021 (See Note 4 in the Notes to Financial Statements):
Investments in Securities (Assets) | | Level 1
Quoted
Prices | | | Level 2
Significant
Observable
Inputs | | | Level 3
Significant
Unobservable
Inputs | | | Total | |
Common Stocks | | $ | 281,424,473 | | | $ | — | | | $ | 252 | | | $ | 281,424,725 | |
Preferred Stocks | | | — | | | | 536,312,920 | | | | — | * | | | 536,312,920 | |
Warrants | | | 8,375,909 | | | | — | | | | — | | | | 8,375,909 | |
Mutual Funds | | | 68,280,141 | | | | — | | | | — | | | | 68,280,141 | |
Closed-End Funds | | | 15,674,306 | | | | — | | | | — | | | | 15,674,306 | |
Money Market Fund | | | 403,274,507 | | | | — | | | | — | | | | 403,274,507 | |
Corporate Bonds | | | — | | | | 11,360,394,209 | | | | 508,196,287 | | | | 11,868,590,496 | |
Asset-Backed Securities | | | — | | | | 4,727,907,230 | | | | 653,348,245 | | | | 5,381,255,475 | |
Collateralized Mortgage Obligations | | | — | | | | 2,710,608,756 | | | | 118,883,545 | | | | 2,829,492,301 | |
Senior Floating Rate Interests | | | — | | | | 1,809,427,534 | | | | 165,363,143 | | | | 1,974,790,677 | |
U.S. Government Securities | | | — | | | | 1,812,126,228 | | | | — | | | | 1,812,126,228 | |
Federal Agency Bonds | | | — | | | | 439,839,358 | | | | — | | | | 439,839,358 | |
Municipal Bonds | | | — | | | | 273,421,557 | | | | — | | | | 273,421,557 | |
Foreign Government Debt | | | — | | | | 8,124,480 | | | | — | | | | 8,124,480 | |
Senior Fixed Rate Interests | | | — | | | | — | | | | 4,413,273 | | | | 4,413,273 | |
Options Purchased | | | — | | | | 89,346,524 | | | | — | | | | 89,346,524 | |
Interest Rate Swap Agreements** | | | — | | | | 156,670,008 | | | | — | | | | 156,670,008 | |
Credit Index Swap Agreements** | | | — | | | | 138,502 | | | | — | | | | 138,502 | |
Forward Foreign Currency Exchange Contracts** | | | — | | | | 112,321,874 | | | | — | | | | 112,321,874 | |
Total Assets | | $ | 777,029,336 | | | $ | 24,036,639,180 | | | $ | 1,450,204,745 | | | $ | 26,263,873,261 | |
Investments in Securities (Liabilities) | | Level 1
Quoted
Prices | | | Level 2
Significant
Observable
Inputs | | | Level 3
Significant
Unobservable
Inputs | | | Total | |
Interest Rate Swap Agreements** | | $ | — | | | $ | 186,771,992 | | | $ | — | | | $ | 186,771,992 | |
Credit Index Swap Agreements** | | | — | | | | 50,583 | | | | — | | | | 50,583 | |
Forward Foreign Currency Exchange Contracts** | | | — | | | | 43,884,374 | | | | — | | | | 43,884,374 | |
Unfunded Loan Commitments (Note 9) | | | — | | | | — | | | | 1,325,661 | | | | 1,325,661 | |
Total Liabilities | | $ | — | | | $ | 230,706,949 | | | $ | 1,325,661 | | | $ | 232,032,610 | |
* | Security has a market value of $0. |
** | This derivative is reported as unrealized appreciation/depreciation at period end. |
The Fund may hold assets and/or liabilities in which the fair value approximates the carrying amount for financial statement purposes. As of the period end, reverse repurchase agreements of $555,271,893 are categorized as Level 2 within the disclosure hierarchy — See Note 6.
SEE NOTES TO FINANCIAL STATEMENTS. | THE GUGGENHEIM FUNDS SEMI-ANNUAL REPORT | 83 |
SCHEDULE OF INVESTMENTS (Unaudited)(continued) | March 31, 2021 |
TOTAL RETURN BOND FUND | |
The following is a summary of significant unobservable inputs used in the fair valuation of assets and liabilities categorized within Level 3 of the fair value hierarchy:
Category | | Ending
Balance at
March 31, 2021 | | Valuation Technique | Unobservable Inputs | | Input
Range | | | Weighted
Average* | |
Assets: | | | | | | | | | | | | | | |
Asset-Backed Securities | | $ | 317,849,350 | | Option Adjusted Spread off the prior month end broker quote | Broker Quote | — | — |
Asset-Backed Securities | | | 239,975,749 | | Model Price | Purchase Price | — | — |
Asset-Backed Securities | | | 95,523,146 | | Yield Analysis | Yield | 2.2%-3% | 2.4% |
Collateralized Mortgage Obligations | | | 114,064,710 | | Model Price | Purchase Price | — | — |
Collateralized Mortgage Obligations | | | 4,818,835 | | Option Adjusted Spread off the prior month end broker quote | Broker Quote | — | — |
Common Stocks | | | 252 | | Enterprise Value | Valuation Multiple | 2.9x-10.4x | 4.7x |
Corporate Bonds | | | 342,992,130 | | Option Adjusted Spread off the prior month end broker quote | Broker Quote | — | — |
Corporate Bonds | | | 91,541,300 | | Third Party Pricing | Vendor Price | — | — |
Corporate Bonds | | | 70,463,177 | | Third Party Pricing | Trade Price | — | — |
Corporate Bonds | | | 3,199,680 | | Model Price | Purchase Price | — | — |
Senior Fixed Rate Interests | | | 4,413,273 | | Yield Analysis | Yield | 3.4% | — |
Senior Floating Rate Interests | | | 88,004,457 | | Third Party Pricing | Broker Quote | — | — |
Senior Floating Rate Interests | | | 44,157,246 | | Option Adjusted Spread off the prior month end broker quote | Broker Quote | — | — |
Senior Floating Rate Interests | | | 18,541,332 | | Yield Analysis | Yield | 6.8% | — |
Senior Floating Rate Interests | | | 14,660,108 | | Third Party Pricing | Vendor Price | — | — |
Total Assets | | $ | 1,450,204,745 | | | | | |
| | | | | | | | | | | | | | | |
Liabilities: | | | | | | | | | | | | | | |
Unfunded Loan Commitments | | $ | 1,325,661 | | Model Price | Purchase Price | — | — |
* | Inputs are weighted by the fair value of the instruments. |
Significant changes in a quote, yield, market comparable yields, or valuation multiples would generally result in significant changes in the fair value of the security.
The Fund’s fair valuation leveling guidelines classify a single daily broker quote, or a vendor price based on a single daily or monthly broker quote, as Level 3, if such a quote or price cannot be supported with other available market information.
84 | THE GUGGENHEIM FUNDS SEMI-ANNUAL REPORT | SEE NOTES TO FINANCIAL STATEMENTS. |
SCHEDULE OF INVESTMENTS (Unaudited)(continued) | March 31, 2021 |
TOTAL RETURN BOND FUND | |
Transfers between Level 2 and Level 3 may occur as markets fluctuate and/or the availability of data used in an investment’s valuation changes. For the period ended March 31, 2021, the Fund had assets with a total value of $242,513,572 transfer into Level 3 from Level 2 due to a lack of observable inputs and had assets with a total value of $11,905,954 transfer out of Level 3 into Level 2 due to changes in the securities valuation methods based on the availability of observable market inputs.
Summary of Fair Value Level 3 Activity
Following is a reconciliation of Level 3 assets for which significant unobservable inputs were used to determine fair value for the period ended March 31, 2021:
| | | Assets | |
| | Asset-
Backed
Securities | | | Collateralized
Mortgage
Obligations | | | Corporate
Bonds | | | Senior
Floating
Rate Interests | | | Common
Stocks | |
Beginning Balance | | $ | 466,869,292 | | | $ | 167,618,207 | | | $ | 244,694,520 | | | $ | 424,325 | | | $ | 3,870 | |
Purchases/(Receipts) | | | 321,550,000 | | | | 114,123,088 | | | | 282,127,892 | | | | 127,944,807 | | | | — | |
(Sales, maturities and paydowns)/Fundings | | | (330,226,184 | ) | | | (161,432,397 | ) | | | (108,282 | ) | | | (327,267 | ) | | | — | |
Amortization of premiums/discounts | | | 500 | | | | (9,166 | ) | | | (55,534 | ) | | | 125,041 | | | | — | |
Total realized gains (losses) included in earnings | | | 1,341 | | | | (2,264 | ) | | | — | | | | 63 | | | | — | |
Total change in unrealized appreciation (depreciation) included in earnings | | | 748,021 | | | | (1,413,923 | ) | | | (18,396,385 | ) | | | 927,907 | | | | (3,618 | ) |
Transfers into Level 3 | | | 202,506,719 | | | | — | | | | 3,199,680 | | | | 36,807,173 | | | | — | |
Transfers out Level 3 | | | (8,101,444 | ) | | | — | | | | (3,265,604 | ) | | | (538,906 | ) | | | — | |
Ending Balance | | $ | 653,348,245 | | | $ | 118,883,545 | | | $ | 508,196,287 | | | $ | 165,363,143 | | | $ | 252 | |
Net change in unrealized appreciation (depreciation) for investments in Level 3 securities still held at March 31, 2021 | | $ | 712,217 | | | $ | 37,294 | | | $ | (18,090,791 | ) | | $ | 927,865 | | | $ | (3,618 | ) |
| | | Assets | | | | | | | Liabilities | |
| | Preferred
Stocks | | | Senior Fixed
Rate Interests | | | Total
Assets | | | Unfunded
Loan
Commitments | |
Beginning Balance | | $ | 4,598 | | | $ | — | | | $ | 879,614,812 | | | $ | (2,340,507 | ) |
Purchases/(Receipts) | | | — | | | | 4,756,587 | | | | 850,502,374 | | | | (471,736 | ) |
(Sales, maturities and paydowns)/Fundings | | | — | | | | — | | | | (492,094,130 | ) | | | 1,345,128 | |
Amortization of premiums/discounts | | | — | | | | — | | | | 60,841 | | | | 3,176 | |
Total realized gains (losses) included in earnings | | | — | | | | — | | | | (860 | ) | | | — | |
Total change in unrealized appreciation (depreciation) included in earnings | | | (4,598 | ) | | | (343,314 | ) | | | (18,485,910 | ) | | | 138,278 | |
Transfers into Level 3 | | | — | | | | — | | | | 242,513,572 | | | | — | |
Transfers out Level 3 | | | — | | | | — | | | | (11,905,954 | ) | | | — | |
Ending Balance | | $ | — | | | $ | 4,413,273 | | | $ | 1,450,204,745 | | | $ | (1,325,661 | ) |
Net change in unrealized appreciation (depreciation) for investments in Level 3 securities still held at March 31, 2021 | | $ | (4,598 | ) | | $ | (343,314 | ) | | $ | (16,764,944 | ) | | $ | 140,115 | |
SEE NOTES TO FINANCIAL STATEMENTS. | THE GUGGENHEIM FUNDS SEMI-ANNUAL REPORT | 85 |
SCHEDULE OF INVESTMENTS (Unaudited)(continued) | March 31, 2021 |
TOTAL RETURN BOND FUND | |
Step Coupon Bonds
The following table discloses additional information related to step coupon bonds held by the Fund. Certain securities are subject to multiple rate changes prior to maturity. For those securities, a range of rates and corresponding dates have been provided. Rates for all step coupon bonds held by the Fund are scheduled to increase, none are scheduled to decrease.
Name | | Coupon Rate at
Next Reset Date | | | Next Rate
Reset Date | |
CSMC Trust 2020-NQM1, 1.72% due 05/25/65 | | | 2.72 | % | | | 09/26/24 | |
Verus Securitization Trust 2020-1, 2.42% due 01/25/60 | | | 3.42 | % | | | 01/26/24 | |
Verus Securitization Trust 2019-4, 2.64% due 11/25/59 | | | 3.64 | % | | | 10/26/23 | |
Affiliated Transactions
Investments representing 5% or more of the outstanding voting shares of a company, or control of or by, or common control under Guggenheim Investments (“GI”), result in that company being considered an affiliated issuer, as defined in the 1940 Act.
The Fund may invest in certain of the underlying series of Guggenheim Strategy Funds Trust, including Guggenheim Strategy Fund II and Guggenheim Strategy Fund III, (collectively, the “Short Term Investment Vehicles”), each of which are open-end management investment companies managed by GI. The Short Term Investment Vehicles, which launched on March 11, 2014, are offered as short term investment options only to mutual funds, trusts, and other accounts managed by GI and/or its affiliates, and are not available to the public. The Short Term Investment Vehicles pay no investment management fees. The Short Term Investment Vehicles’ annual report on Form N-CSR dated September 30, 2020, is available publicly or upon request. This information is available from the EDGAR database on the SEC’s website at https://www.sec.gov/Archives/edgar/data/1601445/000182126820000133/gug81042-ncsr.htm.
Transactions during the period ended March 31, 2021, in which the company is an affiliated issuer, were as follows:
Security Name | | Value
09/30/20 | | | Additions | | | Reductions | | | Realized
Gain (Loss) | |
Common Stocks | | | | | | | | | | | | | | | | |
BP Holdco LLC * | | $ | 188 | | | $ | — | | | $ | — | | | $ | — | |
Mutual Funds | | | | | | | | | | | | | | | | |
Guggenheim Strategy Fund II | | | 26,762,744 | | | | 243,484 | | | | — | | | | — | |
Guggenheim Strategy Fund III | | | 14,458,530 | | | | 126,478 | | | | — | | | | — | |
Guggenheim Ultra Short Duration Fund — Institutional Class | | | 26,551,766 | | | | 139,246 | | | | — | | | | — | |
| | | $ | 67,773,228 | | | $ | 509,208 | | | $ | — | | | $ | — | |
86 | THE GUGGENHEIM FUNDS SEMI-ANNUAL REPORT | SEE NOTES TO FINANCIAL STATEMENTS. |
SCHEDULE OF INVESTMENTS (Unaudited)(concluded) | March 31, 2021 |
TOTAL RETURN BOND FUND | |
Security Name | | Change in
Unrealized
Appreciation
(Depreciation) | | | Value
03/31/21 | | | Shares
03/31/21 | | | Investment
Income | |
Common Stocks | | | | | | | | | | | | | | | | |
BP Holdco LLC * | | $ | — | | | $ | 188 | | | | 532 | | | $ | — | |
Mutual Funds | | | | | | | | | | | | | | | | |
Guggenheim Strategy Fund II | | | 10,792 | | | | 27,017,020 | | | | 1,081,546 | | | | 243,483 | |
Guggenheim Strategy Fund III | | | 40,479 | | | | 14,625,487 | | | | 581,762 | | | | 126,477 | |
Guggenheim Ultra Short Duration Fund — Institutional Class | | | (53,378 | ) | | | 26,637,634 | | | | 2,674,461 | | | | 139,245 | |
| | | $ | (2,107 | ) | | $ | 68,280,329 | | | | | | | $ | 509,205 | |
* | Non-income producing security. |
SEE NOTES TO FINANCIAL STATEMENTS. | THE GUGGENHEIM FUNDS SEMI-ANNUAL REPORT | 87 |
STATEMENT OF ASSETS AND LIABILITIES (Unaudited) |
TOTAL RETURN BOND FUND |
March 31, 2021
Assets: |
Investments in unaffiliated issuers, at value (cost $25,642,661,778) | | $ | 25,926,462,548 | |
Investments in affiliated issuers, at value (cost $68,126,978) | | | 68,280,329 | |
Foreign currency, at value (cost $359,598) | | | 359,604 | |
Cash | | | 8,876,627 | |
Unamortized upfront premiums paid on interest rate swap agreements | | | 37,684 | |
Unrealized appreciation on OTC swap agreements | | | 138,502 | |
Unrealized appreciation on forward foreign currency exchange contracts | | | 112,321,874 | |
Prepaid expenses | | | 1,330,106 | |
Receivables: |
Securities sold | | | 280,812,382 | |
Interest | | | 159,844,228 | |
Fund shares sold | | | 46,093,581 | |
Variation margin on interest rate swap agreements | | | 2,559,654 | |
Dividends | | | 141,405 | |
Total assets | | | 26,607,258,524 | |
| | | | | |
Liabilities: |
Unfunded loan commitments, at value (Note 9) (commitment fees received $1,481,033) | | | 1,325,661 | |
Reverse repurchase agreements | | | 555,271,893 | |
Segregated cash due to broker | | | 97,408,067 | |
Unrealized depreciation on OTC swap agreements | | | 50,583 | |
Unrealized depreciation on forward foreign currency exchange contracts | | | 43,884,374 | |
Payable for: |
Securities purchased | | | 1,404,270,136 | |
Fund shares redeemed | | | 62,992,808 | |
Distributions to shareholders | | | 8,278,447 | |
Management fees | | | 5,892,104 | |
Fund accounting/administration fees | | $ | 1,387,849 | |
Swap settlement | | | 1,252,276 | |
Distribution and service fees | | | 646,661 | |
Transfer agent/maintenance fees | | | 344,281 | |
Printing fees | | | 239,815 | |
Trustees’ fees* | | | 8,365 | |
Miscellaneous | | | 2,826,792 | |
Total liabilities | | | 2,186,080,112 | |
Net assets | | $ | 24,421,178,412 | |
| | | | | |
Net assets consist of: |
Paid in capital | | $ | 24,011,672,669 | |
Total distributable earnings (loss) | | | 409,505,743 | |
Net assets | | $ | 24,421,178,412 | |
| | | | | |
A-Class: |
Net assets | | $ | 689,472,316 | |
Capital shares outstanding | | | 24,298,595 | |
Net asset value per share | | $ | 28.37 | |
Maximum offering price per share (Net asset value divided by 96.00%) | | $ | 29.55 | |
| | | | | |
C-Class: |
Net assets | | $ | 340,475,604 | |
Capital shares outstanding | | | 11,997,826 | |
Net asset value per share | | $ | 28.38 | |
| | | | | |
P-Class: |
Net assets | | $ | 947,294,177 | |
Capital shares outstanding | | | 33,393,180 | |
Net asset value per share | | $ | 28.37 | |
| | | | | |
Institutional Class: |
Net assets | | $ | 22,239,411,156 | |
Capital shares outstanding | | | 783,063,373 | |
Net asset value per share | | $ | 28.40 | |
| | | | | |
R6-Class: |
Net assets | | $ | 204,525,159 | |
Capital shares outstanding | | | 7,197,270 | |
Net asset value per share | | $ | 28.42 | |
* | Relates to Trustees not deemed “interested persons” within the meaning of Section 2(a)(19) of the 1940 Act. |
88 | THE GUGGENHEIM FUNDS SEMI-ANNUAL REPORT | SEE NOTES TO FINANCIAL STATEMENTS. |
STATEMENT OF OPERATIONS (Unaudited) |
TOTAL RETURN BOND FUND |
Six Months Ended March 31, 2021
Investment Income: |
Dividends from securities of unaffiliated issuers | | $ | 21,087,342 | |
Dividends from securities of affiliated issuers | | | 509,205 | |
Interest from securities of unaffiliated issuers (net of foreign withholding tax of $4,933) | | | 351,707,822 | |
Total investment income | | | 373,304,369 | |
| | | | | |
Expenses: |
Management fees | | | 45,846,236 | |
Distribution and service fees: |
A-Class | | | 917,343 | |
C-Class | | | 1,748,031 | |
P-Class | | | 1,230,204 | |
Transfer agent/maintenance fees: |
A-Class | | | 454,799 | |
C-Class | | | 169,083 | |
P-Class | | | 605,385 | |
Institutional Class | | | 8,809,920 | |
R6-Class | | | 9,395 | |
Fund accounting/administration fees | | | 7,941,221 | |
Line of credit fees | | | 1,086,186 | |
Professional fees | | | 609,267 | |
Interest expense | | | 287,648 | |
Trustees’ fees* | | | 213,876 | |
Custodian fees | | | 55,626 | |
Miscellaneous | | | 573,615 | |
Recoupment of previously waived fees: |
A-Class | | | 8,804 | |
C-Class | | | 8,579 | |
R6-Class | | | 9,520 | |
Total expenses | | | 70,584,738 | |
Less: |
Expenses reimbursed by Adviser: |
A-Class | | $ | (260,015 | ) |
C-Class | | | (81,584 | ) |
P-Class | | | (330,730 | ) |
Institutional Class | | | (6,988,723 | ) |
R6-Class | | | (2,665 | ) |
Expenses waived by Adviser | | | (33,166 | ) |
Earnings credits applied | | | (13,487 | ) |
Total waived/reimbursed expenses | | | (7,710,370 | ) |
Net expenses | | | 62,874,368 | |
Net investment income | | | 310,430,001 | |
| | | | | |
Net Realized and Unrealized Gain (Loss): |
Net realized gain (loss) on: |
Investments in unaffiliated issuers | | | 165,166,634 | |
Swap agreements | | | 44,922,605 | |
Futures contracts | | | 94,051 | |
Options purchased | | | 38,488,836 | |
Forward foreign currency exchange contracts | | | 1,752,496 | |
Foreign currency transactions | | | (4,116,346 | ) |
Net realized gain | | | 246,308,276 | |
Net change in unrealized appreciation (depreciation) on: |
Investments in unaffiliated issuers | | | (787,849,188 | ) |
Investments in affiliated issuers | | | (2,107 | ) |
Swap agreements | | | (87,106,317 | ) |
Options purchased | | | 47,733,960 | |
Forward foreign currency exchange contracts | | | 4,132,086 | |
Foreign currency translations | | | 4,381,293 | |
Net change in unrealized appreciation (depreciation) | | | (818,710,273 | ) |
Net realized and unrealized loss | | | (572,401,997 | ) |
Net decrease in net assets resulting from operations | | $ | (261,971,996 | ) |
* | Relates to Trustees not deemed “interested persons” within the meaning of Section 2(a)(19) of the 1940 Act. |
SEE NOTES TO FINANCIAL STATEMENTS. | THE GUGGENHEIM FUNDS SEMI-ANNUAL REPORT | 89 |
STATEMENTS OF CHANGES IN NET ASSETS |
TOTAL RETURN BOND FUND |
| | Six Months Ended
March 31, 2021
(Unaudited) | | | Year Ended
September 30,
2020 | |
Increase (Decrease) in Net Assets from Operations: | | | | | | | | |
Net investment income | | $ | 310,430,001 | | | $ | 363,342,717 | |
Net realized gain on investments | | | 246,308,276 | | | | 584,388,023 | |
Net change in unrealized appreciation (depreciation) on investments | | | (818,710,273 | ) | | | 795,295,708 | |
Net increase (decrease) in net assets resulting from operations | | | (261,971,996 | ) | | | 1,743,026,448 | |
| | | | | | | | | |
Distributions to shareholders: | | | | | | | | |
A-Class | | | (26,706,188 | ) | | | (14,139,957 | ) |
C-Class | | | (11,917,616 | ) | | | (4,404,558 | ) |
P-Class | | | (37,295,254 | ) | | | (17,649,084 | ) |
Institutional Class | | | (824,662,786 | ) | | | (363,935,819 | ) |
R6-Class | | | (7,163,520 | ) | | | (3,433,470 | ) |
Total distributions to shareholders | | | (907,745,364 | ) | | | (403,562,888 | ) |
| | | | | | | | | |
Capital share transactions: | | | | | | | | |
Proceeds from sale of shares | | | | | | | | |
A-Class | | | 208,660,059 | | | | 390,304,686 | |
C-Class | | | 50,047,003 | | | | 96,598,040 | |
P-Class | | | 283,624,064 | | | | 445,917,866 | |
Institutional Class | | | 6,842,171,701 | | | | 10,467,112,876 | |
R6-Class | | | 66,151,423 | | | | 149,980,117 | |
Distributions reinvested | | | | | | | | |
A-Class | | | 22,613,839 | | | | 12,577,240 | |
C-Class | | | 10,113,539 | | | | 3,666,589 | |
P-Class | | | 37,203,539 | | | | 17,508,562 | |
Institutional Class | | | 708,196,572 | | | | 303,841,966 | |
R6-Class | | | 7,162,981 | | | | 3,433,046 | |
Cost of shares redeemed | | | | | | | | |
A-Class | | | (314,446,331 | ) | | | (257,595,809 | ) |
C-Class | | | (41,491,476 | ) | | | (71,903,157 | ) |
P-Class | | | (252,273,462 | ) | | | (417,273,313 | ) |
Institutional Class | | | (3,400,438,461 | ) | | | (4,949,016,576 | ) |
R6-Class | | | (26,815,500 | ) | | | (53,331,923 | ) |
Net increase from capital share transactions | | | 4,200,479,490 | | | | 6,141,820,210 | |
Net increase in net assets | | | 3,030,762,130 | | | | 7,481,283,770 | |
| | | | | | | | | |
Net assets: | | | | | | | | |
Beginning of period | | | 21,390,416,282 | | | | 13,909,132,512 | |
End of period | | $ | 24,421,178,412 | | | $ | 21,390,416,282 | |
| | | | | | | | | |
90 | THE GUGGENHEIM FUNDS SEMI-ANNUAL REPORT | SEE NOTES TO FINANCIAL STATEMENTS. |
STATEMENTS OF CHANGES IN NET ASSETS (concluded) |
TOTAL RETURN BOND FUND |
| | Six Months Ended
March 31, 2021
(Unaudited) | | | Year Ended
September 30,
2020 | |
Capital share activity: | | | | | | | | |
Shares sold | | | | | | | | |
A-Class | | | 7,092,898 | | | | 13,593,542 | |
C-Class | | | 1,691,364 | | | | 3,373,040 | |
P-Class | | | 9,600,745 | | | | 15,597,287 | |
Institutional Class | | | 232,078,096 | | | | 366,759,309 | |
R6-Class | | | 2,247,066 | | | | 5,376,306 | |
Shares issued from reinvestment of distributions | | | | | | | | |
A-Class | | | 767,638 | | | | 441,156 | |
C-Class | | | 343,228 | | | | 128,418 | |
P-Class | | | 1,263,621 | | | | 615,214 | |
Institutional Class | | | 24,039,496 | | | | 10,620,644 | |
R6-Class | | | 243,019 | | | | 120,055 | |
Shares redeemed | | | | | | | | |
A-Class | | | (10,606,614 | ) | | | (9,218,165 | ) |
C-Class | | | (1,416,635 | ) | | | (2,550,900 | ) |
P-Class | | | (8,623,652 | ) | | | (14,959,306 | ) |
Institutional Class | | | (116,155,302 | ) | | | (176,503,485 | ) |
R6-Class | | | (910,760 | ) | | | (1,897,087 | ) |
Net increase in shares | | | 141,654,208 | | | | 211,496,028 | |
SEE NOTES TO FINANCIAL STATEMENTS. | THE GUGGENHEIM FUNDS SEMI-ANNUAL REPORT | 91 |
FINANCIAL HIGHLIGHTS |
TOTAL RETURN BOND FUND |
This table is presented to show selected data for a share outstanding throughout each period and to assist shareholders in evaluating a Fund’s performance for the periods presented.
A-Class | | Six Months Ended
March 31, 2021a | | | Year
Ended
Sept. 30,
2020 | | | Year
Ended
Sept. 30,
2019 | | | Year
Ended
Sept. 30,
2018 | | | Year
Ended
Sept. 30,
2017 | | | Year
Ended
Sept. 30,
2016 | |
Per Share Data |
Net asset value, beginning of period | | $ | 29.76 | | | $ | 27.42 | | | $ | 26.69 | | | $ | 27.05 | | | $ | 27.23 | | | $ | 26.50 | |
Income (loss) from investment operations: |
Net investment income (loss)b | | | .35 | | | | .56 | | | | .64 | | | | .72 | | | | .83 | | | | .96 | |
Net gain (loss) on investments (realized and unrealized) | | | (.63 | ) | | | 2.41 | | | | .85 | | | | (.37 | ) | | | .05 | | | | .81 | |
Total from investment operations | | | (.28 | ) | | | 2.97 | | | | 1.49 | | | | .35 | | | | .88 | | | | 1.77 | |
Less distributions from: |
Net investment income | | | (.38 | ) | | | (.63 | ) | | | (.65 | ) | | | (.71 | ) | | | (.95 | ) | | | (1.04 | ) |
Net realized gains | | | (.73 | ) | | | — | | | | (.11 | ) | | | — | | | | (.11 | ) | | | — | |
Total distributions | | | (1.11 | ) | | | (.63 | ) | | | (.76 | ) | | | (.71 | ) | | | (1.06 | ) | | | (1.04 | ) |
Net asset value, end of period | | $ | 28.37 | | | $ | 29.76 | | | $ | 27.42 | | | $ | 26.69 | | | $ | 27.05 | | | $ | 27.23 | |
|
Total Returnc | | | (0.99 | %) | | | 10.96 | % | | | 5.70 | % | | | 1.28 | % | | | 3.33 | % | | | 6.88 | % |
Ratios/Supplemental Data |
Net assets, end of period (in thousands) | | $ | 689,472 | | | $ | 804,750 | | | $ | 609,602 | | | $ | 589,760 | | | $ | 744,989 | | | $ | 548,223 | |
Ratios to average net assets: |
Net investment income (loss) | | | 2.38 | % | | | 1.99 | % | | | 2.37 | % | | | 2.66 | % | | | 3.08 | % | | | 3.63 | % |
Total expensesd | | | 0.86 | % | | | 0.87 | % | | | 0.96 | % | | | 0.93 | % | | | 1.02 | % | | | 1.15 | % |
Net expensese,f,g | | | 0.79 | % | | | 0.80 | % | | | 0.80 | % | | | 0.81 | % | | | 0.87 | % | | | 0.97 | % |
Portfolio turnover rate | | | 25 | % | | | 116 | % | | | 68 | % | | | 48 | % | | | 72 | % | | | 86 | % |
92 | THE GUGGENHEIM FUNDS SEMI-ANNUAL REPORT | SEE NOTES TO FINANCIAL STATEMENTS. |
FINANCIAL HIGHLIGHTS (continued) |
TOTAL RETURN BOND FUND |
This table is presented to show selected data for a share outstanding throughout each period and to assist shareholders in evaluating a Fund’s performance for the periods presented.
C-Class | | Six Months Ended
March 31, 2021a | | | Year
Ended
Sept. 30,
2020 | | | Year
Ended
Sept. 30,
2019 | | | Year
Ended
Sept. 30,
2018 | | | Year
Ended
Sept. 30,
2017 | | | Year
Ended
Sept. 30,
2016 | |
Per Share Data |
Net asset value, beginning of period | | $ | 29.76 | | | $ | 27.43 | | | $ | 26.69 | | | $ | 27.05 | | | $ | 27.23 | | | $ | 26.50 | |
Income (loss) from investment operations: |
Net investment income (loss)b | | | .24 | | | | .35 | | | | .43 | | | | .52 | | | | .65 | | | | .75 | |
Net gain (loss) on investments (realized and unrealized) | | | (.62 | ) | | | 2.40 | | | | .87 | | | | (.38 | ) | | | .03 | | | | .82 | |
Total from investment operations | | | (.38 | ) | | | 2.75 | | | | 1.30 | | | | .14 | | | | .68 | | | | 1.57 | |
Less distributions from: |
Net investment income | | | (.27 | ) | | | (.42 | ) | | | (.45 | ) | | | (.50 | ) | | | (.75 | ) | | | (.84 | ) |
Net realized gains | | | (.73 | ) | | | — | | | | (.11 | ) | | | — | | | | (.11 | ) | | | — | |
Total distributions | | | (1.00 | ) | | | (.42 | ) | | | (.56 | ) | | | (.50 | ) | | | (.86 | ) | | | (.84 | ) |
Net asset value, end of period | | $ | 28.38 | | | $ | 29.76 | | | $ | 27.43 | | | $ | 26.69 | | | $ | 27.05 | | | $ | 27.23 | |
|
Total Returnc | | | (1.36 | %) | | | 10.10 | % | | | 4.95 | % | | | 0.53 | % | | | 2.58 | % | | | 6.08 | % |
Ratios/Supplemental Data |
Net assets, end of period (in thousands) | | $ | 340,476 | | | $ | 338,656 | | | $ | 286,050 | | | $ | 265,486 | | | $ | 251,177 | | | $ | 216,255 | |
Ratios to average net assets: |
Net investment income (loss) | | | 1.64 | % | | | 1.24 | % | | | 1.62 | % | | | 1.93 | % | | | 2.44 | % | | | 2.82 | % |
Total expensesd | | | 1.58 | % | | | 1.59 | % | | | 1.60 | % | | | 1.62 | % | | | 1.74 | % | | | 1.83 | % |
Net expensese,f,g | | | 1.54 | % | | | 1.55 | % | | | 1.55 | % | | | 1.55 | % | | | 1.60 | % | | | 1.69 | % |
Portfolio turnover rate | | | 25 | % | | | 116 | % | | | 68 | % | | | 48 | % | | | 72 | % | | | 86 | % |
SEE NOTES TO FINANCIAL STATEMENTS. | THE GUGGENHEIM FUNDS SEMI-ANNUAL REPORT | 93 |
FINANCIAL HIGHLIGHTS (continued) |
TOTAL RETURN BOND FUND |
This table is presented to show selected data for a share outstanding throughout each period and to assist shareholders in evaluating a Fund’s performance for the periods presented.
P-Class | | Six Months Ended
March 31, 2021a | | | Year
Ended
Sept. 30,
2020 | | | Year
Ended
Sept. 30,
2019 | | | Year
Ended
Sept. 30,
2018 | | | Year
Ended
Sept. 30,
2017 | | | Year
Ended
Sept. 30,
2016 | |
Per Share Data |
Net asset value, beginning of period | | $ | 29.75 | | | $ | 27.42 | | | $ | 26.69 | | | $ | 27.04 | | | $ | 27.23 | | | $ | 26.49 | |
Income (loss) from investment operations: |
Net investment income (loss)b | | | .35 | | | | .56 | | | | .63 | | | | .72 | | | | .85 | | | | .96 | |
Net gain (loss) on investments (realized and unrealized) | | | (.62 | ) | | | 2.40 | | | | .86 | | | | (.36 | ) | | | .03 | | | | .84 | |
Total from investment operations | | | (.27 | ) | | | 2.96 | | | | 1.49 | | | | .36 | | | | .88 | | | | 1.80 | |
Less distributions from: |
Net investment income | | | (.38 | ) | | | (.63 | ) | | | (.65 | ) | | | (.71 | ) | | | (.96 | ) | | | (1.06 | ) |
Net realized gains | | | (.73 | ) | | | — | | | | (.11 | ) | | | — | | | | (.11 | ) | | | — | |
Total distributions | | | (1.11 | ) | | | (.63 | ) | | | (.76 | ) | | | (.71 | ) | | | (1.07 | ) | | | (1.06 | ) |
Net asset value, end of period | | $ | 28.37 | | | $ | 29.75 | | | $ | 27.42 | | | $ | 26.69 | | | $ | 27.04 | | | $ | 27.23 | |
|
Total Return | | | (0.99 | %) | | | 10.92 | % | | | 5.70 | % | | | 1.32 | % | | | 3.34 | % | | | 6.97 | % |
Ratios/Supplemental Data |
Net assets, end of period (in thousands) | | $ | 947,294 | | | $ | 926,745 | | | $ | 819,770 | | | $ | 738,694 | | | $ | 572,644 | | | $ | 161,928 | |
Ratios to average net assets: |
Net investment income (loss) | | | 2.39 | % | | | 1.98 | % | | | 2.37 | % | | | 2.69 | % | | | 3.14 | % | | | 3.58 | % |
Total expensesd | | | 0.86 | % | | | 0.88 | % | | | 0.87 | % | | | 0.91 | % | | | 1.03 | % | | | 0.96 | % |
Net expensese,f,g | | | 0.79 | % | | | 0.80 | % | | | 0.80 | % | | | 0.80 | % | | | 0.86 | % | | | 0.82 | % |
Portfolio turnover rate | | | 25 | % | | | 116 | % | | | 68 | % | | | 48 | % | | | 72 | % | | | 86 | % |
94 | THE GUGGENHEIM FUNDS SEMI-ANNUAL REPORT | SEE NOTES TO FINANCIAL STATEMENTS. |
FINANCIAL HIGHLIGHTS (continued) |
TOTAL RETURN BOND FUND |
This table is presented to show selected data for a share outstanding throughout each period and to assist shareholders in evaluating a Fund’s performance for the periods presented.
Institutional Class | | Six Months Ended
March 31, 2021a | | | Year
Ended
Sept. 30,
2020 | | | Year
Ended
Sept. 30,
2019 | | | Year
Ended
Sept. 30,
2018 | | | Year
Ended
Sept. 30,
2017 | | | Year
Ended
Sept. 30,
2016 | |
Per Share Data |
Net asset value, beginning of period | | $ | 29.78 | | | $ | 27.45 | | | $ | 26.71 | | | $ | 27.07 | | | $ | 27.26 | | | $ | 26.53 | |
Income (loss) from investment operations: |
Net investment income (loss)b | | | .39 | | | | .65 | | | | .71 | | | | .80 | | | | .93 | | | | 1.05 | |
Net gain (loss) on investments (realized and unrealized) | | | (.61 | ) | | | 2.39 | | | | .87 | | | | (.37 | ) | | | .04 | | | | .82 | |
Total from investment operations | | | (.22 | ) | | | 3.04 | | | | 1.58 | | | | .43 | | | | .97 | | | | 1.87 | |
Less distributions from: |
Net investment income | | | (.43 | ) | | | (.71 | ) | | | (.73 | ) | | | (.79 | ) | | | (1.05 | ) | | | (1.14 | ) |
Net realized gains | | | (.73 | ) | | | — | | | | (.11 | ) | | | — | | | | (.11 | ) | | | — | |
Total distributions | | | (1.16 | ) | | | (.71 | ) | | | (.84 | ) | | | (.79 | ) | | | (1.16 | ) | | | (1.14 | ) |
Net asset value, end of period | | $ | 28.40 | | | $ | 29.78 | | | $ | 27.45 | | | $ | 26.71 | | | $ | 27.07 | | | $ | 27.26 | |
|
Total Return | | | (0.85 | %) | | | 11.23 | % | | | 6.03 | % | | | 1.59 | % | | | 3.68 | % | | | 7.26 | % |
Ratios/Supplemental Data |
Net assets, end of period (in thousands) | | $ | 22,239,411 | | | $ | 19,152,857 | | | $ | 12,138,270 | | | $ | 8,957,902 | | | $ | 6,418,897 | | | $ | 3,024,918 | |
Ratios to average net assets: |
Net investment income (loss) | | | 2.68 | % | | | 2.29 | % | | | 2.64 | % | | | 2.99 | % | | | 3.47 | % | | | 3.94 | % |
Total expensesd | | | 0.56 | % | | | 0.57 | % | | | 0.58 | % | | | 0.58 | % | | | 0.68 | % | | | 0.79 | % |
Net expensese,f,g | | | 0.50 | % | | | 0.51 | % | | | 0.51 | % | | | 0.50 | % | | | 0.52 | % | | | 0.59 | % |
Portfolio turnover rate | | | 25 | % | | | 116 | % | | | 68 | % | | | 48 | % | | | 72 | % | | | 86 | % |
SEE NOTES TO FINANCIAL STATEMENTS. | THE GUGGENHEIM FUNDS SEMI-ANNUAL REPORT | 95 |
FINANCIAL HIGHLIGHTS (continued) |
TOTAL RETURN BOND FUND |
This table is presented to show selected data for a share outstanding throughout each period and to assist shareholders in evaluating a Fund’s performance for the periods presented.
R6-Class | | Six Months Ended
March 31, 2021a | | | Year
Ended
Sept. 30,
2020 | | | Year
Ended
Sept. 30,
2019 | | | Year
Ended
Sept. 30,
2018 | | | Period
Ended
Sept. 30,
2017h | |
Per Share Data |
Net asset value, beginning of period | | $ | 29.80 | | | $ | 27.46 | | | $ | 26.73 | | | $ | 27.09 | | | $ | 27.15 | |
Income (loss) from investment operations: |
Net investment income (loss)b | | | .39 | | | | .65 | | | | .71 | | | | .81 | | | | .86 | |
Net gain (loss) on investments (realized and unrealized) | | | (.61 | ) | | | 2.40 | | | | .86 | | | | (.38 | ) | | | .18 | |
Total from investment operations | | | (.22 | ) | | | 3.05 | | | | 1.57 | | | | .43 | | | | 1.04 | |
Less distributions from: |
Net investment income | | | (.43 | ) | | | (.71 | ) | | | (.73 | ) | | | (.79 | ) | | | (.99 | ) |
Net realized gains | | | (.73 | ) | | | — | | | | (.11 | ) | | | — | | | | (.11 | ) |
Total distributions | | | (1.16 | ) | | | (.71 | ) | | | (.84 | ) | | | (.79 | ) | | | (1.10 | ) |
Net asset value, end of period | | $ | 28.42 | | | $ | 29.80 | | | $ | 27.46 | | | $ | 26.73 | | | $ | 27.09 | |
|
Total Return | | | (0.85 | %) | | | 11.26 | % | | | 5.99 | % | | | 1.59 | % | | | 3.97 | % |
Ratios/Supplemental Data |
Net assets, end of period (in thousands) | | $ | 204,525 | | | $ | 167,409 | | | $ | 55,441 | | | $ | 37,735 | | | $ | 13,709 | |
Ratios to average net assets: |
Net investment income (loss) | | | 2.68 | % | | | 2.28 | % | | | 2.64 | % | | | 3.00 | % | | | 3.35 | % |
Total expensesd | | | 0.50 | % | | | 0.52 | % | | | 0.52 | % | | | 0.53 | % | | | 0.65 | % |
Net expensese,f,g | | | 0.50 | % | | | 0.51 | % | | | 0.51 | % | | | 0.50 | % | | | 0.51 | % |
Portfolio turnover rate | | | 25 | % | | | 116 | % | | | 68 | % | | | 48 | % | | | 72 | % |
96 | THE GUGGENHEIM FUNDS SEMI-ANNUAL REPORT | SEE NOTES TO FINANCIAL STATEMENTS. |
FINANCIAL HIGHLIGHTS (concluded) |
TOTAL RETURN BOND FUND | |
a | Unaudited figures for the period ended March 31, 2021. Percentage amounts for the period, except total return and portfolio turnover rate, have been annualized. |
b | Net investment income (loss) per share was computed using average shares outstanding throughout the period. |
c | Total return does not reflect the impact of any applicable sales charges. |
d | Does not include expenses of the underlying funds in which the Fund invests. |
e | Net expense information reflects the expense ratios after expense waivers and reimbursements, as applicable. |
f | The portion of the ratios of net expenses to average net assets attributable to recoupments of prior fee reductions or expense reimbursements for the periods presented was as follows: |
| | | 03/31/21 | 09/30/20 | 09/30/19 | 09/30/18 | 09/30/17 |
| | A-Class | 0.00%* | 0.00%* | — | 0.00%* | 0.01% |
| | C-Class | 0.00%* | 0.00%* | — | 0.00%* | 0.01% |
| | P-Class | — | 0.00%* | 0.00%* | 0.00%* | 0.01% |
| | Institutional Class | — | 0.00%* | — | 0.00%* | — |
| | R6-Class | 0.01% | 0.00%* | 0.00%* | 0.00%* | — |
g | Net expenses may include expenses that are excluded from the expense limitation agreement. Excluding these expenses, the net expense ratios for the periods presented would be: |
| | | 03/31/21 | 09/30/20 | 09/30/19 | 09/30/18 | 09/30/17 | 09/30/16 |
| | A-Class | 0.78% | 0.79% | 0.79% | 0.80% | 0.84% | 0.87% |
| | C-Class | 1.52% | 1.54% | 1.54% | 1.55% | 1.57% | 1.60% |
| | P-Class | 0.78% | 0.79% | 0.79% | 0.80% | 0.83% | 0.75% |
| | Institutional Class | 0.49% | 0.50% | 0.50% | 0.49% | 0.49% | 0.49% |
| | R6-Class | 0.49% | 0.50% | 0.50% | 0.49% | 0.48% | — |
h | Since commencement of operations: October 19, 2016. Percentage amounts for the period, except total return and portfolio turnover rate, have been annualized. |
SEE NOTES TO FINANCIAL STATEMENTS. | THE GUGGENHEIM FUNDS SEMI-ANNUAL REPORT | 97 |
NOTES TO FINANCIAL STATEMENTS (Unaudited) |
Note 1 – Organization and Significant Accounting Policies
Organization
Guggenheim Funds Trust (the “Trust”), a Delaware statutory trust, is registered with the SEC under the Investment Company Act of 1940 (“1940 Act”), as an open-ended investment company of the series type. Each series, in effect, is representing a separate fund. The Trust may issue an unlimited number of authorized shares. The Trust accounts for the assets of each fund separately.
The Trust offers a combination of five separate classes of shares: A-Class shares, C-Class shares, P-Class shares, R6-Class shares and Institutional Class shares. Sales of shares of each Class are made without a front-end sales charge at the net asset value per share (“NAV”), with the exception of A-Class shares. A-Class shares are sold at the NAV, plus the applicable front-end sales charge. The sales charge varies depending on the amount purchased. A-Class share purchases of $1 million or more are exempt from the front-end sales charge but have a 1% contingent deferred sales charge (“CDSC”), if shares are redeemed within 12 months of purchase. C-Class shares have a 1% CDSC if shares are redeemed within 12 months of purchase. C-Class shares automatically convert to A-Class shares on or about the 10th day of the month following the 10-year anniversary of the purchase of the C-Class shares. This conversion will be executed without any sales charge, fee or other charge. After the conversion is completed, the shares will be subject to all features and expenses of A-Class shares. Institutional Class shares are offered primarily for direct investment by institutions such as pension and profit sharing plans, endowments, foundations and corporations. Institutional Class shares require a minimum initial investment of $2 million and a minimum account balance of $1 million. R6-Class shares are offered primarily through qualified retirement and benefit plans. R6-Class shares are also offered through certain other plans and platforms sponsored by financial intermediaries. Certain institutional investors and others deemed appropriate by Guggenheim Investments (“GI”) may also be eligible to purchase R6-Class shares subject to a $2 million minimum initial investment. At March 31, 2021, the Trust consisted of nineteen funds (the “Funds”).
This report covers the Total Return Bond Fund (the “Fund”), a diversified investment company. At March 31, 2021, A-Class, C-Class, P-Class, Institutional Class and R6-Class shares have been issued by the Fund.
Guggenheim Partners Investment Management, LLC (“GPIM”) which operates under the name Guggenheim Investments, provides advisory services. Guggenheim Funds Distributors, LLC (“GFD”) acts as principal underwriter for the Trust. GI and GFD are affiliated entities.
Significant Accounting Policies
The Fund operates as an investment company and, accordingly, follows the investment company accounting and reporting guidance of the Financial Accounting Standards Board (“FASB”) Accounting Standards Codification Topic 946 Financial Services – Investment Companies.
98 | THE GUGGENHEIM FUNDS SEMI-ANNUAL REPORT | |
NOTES TO FINANCIAL STATEMENTS (Unaudited)(continued) |
The following significant accounting policies are in conformity with U.S. generally accepted accounting principles (“U.S. GAAP”) and are consistently followed by the Trust. This requires management to make estimates and assumptions that affect the reported amount of assets and liabilities, contingent assets and liabilities at the date of the financial statements, and the reported amounts of revenues and expenses during the reporting period. Actual results could differ from these estimates. All time references are based on Eastern Time.
The NAV of each Class of the Fund is calculated by dividing the market value of the Fund’s securities and other assets, less all liabilities, attributable to the Class by the number of outstanding shares of the Class.
(a) Valuation of Investments
The Board of Trustees of the Fund (the “Board”) has adopted policies and procedures for the valuation of the Fund’s investments (the “Valuation Procedures”). Pursuant to the Valuation Procedures, the Board has delegated to a valuation committee, consisting of representatives from Guggenheim’s investment management, fund administration, legal and compliance departments (the “Valuation Committee”), the day-to-day responsibility for implementing the Valuation Procedures, including, under most circumstances, the responsibility for determining the fair value of the Fund’s securities and/or other assets.
Valuations of the Fund’s securities and other assets are supplied primarily by pricing services appointed pursuant to the processes set forth in the Valuation Procedures. The Valuation Committee convenes monthly, or more frequently as needed, to review the valuation of all assets which have been fair valued for reasonableness. The Fund’s officers, through the Valuation Committee and consistent with the monitoring and review responsibilities set forth in the Valuation Procedures, regularly review procedures used and valuations provided by the pricing services.
If the pricing service cannot or does not provide a valuation for a particular investment or such valuation is deemed unreliable, such investment is fair valued by the Valuation Committee.
Equity securities listed or traded on a recognized U.S. securities exchange or the National Association of Securities Dealers Automated Quotations (“NASDAQ”) National Market System shall generally be valued on the basis of the last sale price on the primary U.S. exchange or market on which the security is listed or traded; provided, however, that securities listed on NASDAQ will be valued at the NASDAQ Official Closing Price, which may not necessarily represent the last sale price. If there is no sale on the valuation date, exchange-traded U.S. equity securities will be valued on the basis of the last bid price.
Generally, trading in foreign securities markets is substantially completed each day at various times prior to the close of the New York Stock Exchange (“NYSE”). The values of foreign securities are determined as of the close of such foreign markets or the close of the NYSE, if earlier. All investments quoted in foreign currencies are valued in U.S. dollars on the basis of the foreign
| | THE GUGGENHEIM FUNDS SEMI-ANNUAL REPORT | 99 |
NOTES TO FINANCIAL STATEMENTS (Unaudited)(continued) |
currency exchange rates prevailing at the close of U.S. business at 4:00 p.m. Investments in foreign securities may involve risks not present in domestic investments. The Valuation Committee will determine the current value of such foreign securities by taking into consideration certain factors which may include those discussed above, as well as the following factors, among others: the value of the securities traded on other foreign markets, ADR trading, closed-end fund trading, foreign currency exchange activity, and the trading prices of financial products that are tied to foreign securities. In addition, under the Valuation Procedures, the Valuation Committee and GI are authorized to use prices and other information supplied by a third party pricing vendor in valuing foreign securities.
Open-end investment companies are valued at their NAV as of the close of business, on the valuation date. Exchange-traded funds and closed-end investment companies are valued at the last quoted sale price.
U.S. Government securities are valued by independent pricing services, the last traded fill price, or at the reported bid price at the close of business.
Debt securities with a maturity of greater than 60 days at acquisition are valued at prices that reflect broker-dealer supplied valuations or are obtained from independent pricing services, which may consider the trade activity, treasury spreads, yields or price of bonds of comparable quality, coupon, maturity, and type, as well as prices quoted by dealers who make markets in such securities. Short-term debt securities with a maturity of 60 days or less at acquisition are valued at amortized cost, provided such amount approximates market value.
Typically, loans are valued using information provided by an independent third party pricing service that uses broker quotes, among other inputs. If the pricing service cannot or does not provide a valuation for a particular loan, or such valuation is deemed unreliable, such investment is valued based on a quote from a broker-dealer or is fair valued by the Valuation Committee.
Exchange-traded options are valued at the mean of the bid and ask prices on the principal exchange on which they are traded. Over-the-counter (“OTC”) options are valued using a price provided by a pricing service.
The value of futures contracts is accounted for using the unrealized appreciation or depreciation on the contracts that is determined by marking the contracts to their current realized settlement prices. Financial futures contracts are valued at the 4:00 p.m. price on the valuation date. In the event that the exchange for a specific futures contract closes earlier than 4:00 p.m., the futures contract is valued at the official settlement price of the exchange. However, the underlying securities from which the futures contract value is derived are monitored until 4:00 p.m. to determine if fair valuation would provide a more accurate valuation
The value of interest rate swap agreements entered into by the Fund is accounted for using the unrealized appreciation or depreciation on the agreements that is determined using the previous day’s Chicago Mercantile Exchange close price, adjusted for the current day’s spreads.
100 | THE GUGGENHEIM FUNDS SEMI-ANNUAL REPORT | |
NOTES TO FINANCIAL STATEMENTS (Unaudited)(continued) |
The values of other swap agreements entered into by the Fund are accounted for using the unrealized appreciation or depreciation on the agreements that are determined by marking the agreements to the last quoted value of the index or other underlying positions that the swaps pertain to at the close of the NYSE.
Forward foreign currency exchange contracts are valued daily based on the applicable exchange rate of the underlying currency.
Investments for which market quotations are not readily available are fair-valued as determined in good faith by GI, subject to review and approval by the Valuation Committee, pursuant to methods established or ratified by the Board. Valuations in accordance with these methods are intended to reflect each security’s (or asset’s or liability’s) “fair value”. Each such determination is based on a consideration of all relevant factors, which are likely to vary from one pricing context to another. Examples of such factors may include, but are not limited to market prices; sale prices; broker quotes; and models which derive prices based on inputs such as prices of securities with comparable maturities and characteristics, or based on inputs such as anticipated cash flows or collateral, spread over U.S. Treasury securities, and other information analysis. In connection with futures contracts and other derivative investments, such factors may include obtaining information as to how (a) these contracts and other derivative investments trade in the futures or other derivative markets, respectively, and (b) the securities underlying these contracts and other derivative investments trade in the cash market.
(b) U.S. Government and Agency Obligations
Certain U.S. Government and Agency Obligations are traded on a discount basis; the interest rates shown on the Schedule of Investments reflect the effective rates paid at the time of purchase by the Fund. Other securities bear interest at the rates shown, payable at fixed dates through maturity.
(c) Senior Floating Rate Interests and Loan Investments
Senior floating rate interests in which the Fund invests generally pay interest rates which are periodically adjusted by reference to a base short-term floating rate, plus a premium. These base lending rates are generally (i) the lending rate offered by one or more major European banks, such as the one-month or three-month London Inter-Bank Offered Rate (“LIBOR”), (ii) the prime rate offered by one or more major United States banks, or (iii) the bank’s certificate of deposit rate. Senior floating rate interests often require prepayments from excess cash flows or permit the borrower to repay at its election. The rate at which the borrower repays cannot be predicted with accuracy. As a result, the actual remaining maturity may be substantially less than the stated maturities disclosed in the Fund’s Schedule of Investments.
The Fund invests in loans and other similar debt obligations (“obligations”). A portion of the Fund’s investments in these obligations is sometimes referred to as “covenant lite” loans or obligations (“covenant lite obligations”), which are obligations that lack covenants or possess
| | THE GUGGENHEIM FUNDS SEMI-ANNUAL REPORT | 101 |
NOTES TO FINANCIAL STATEMENTS (Unaudited)(continued) |
fewer or less restrictive covenants or constraints on borrowers than certain other types of obligations. The Fund may also obtain exposure to covenant lite obligations through investment in securitization vehicles and other structured products. In recent market conditions, many new or reissued obligations have not featured traditional covenants, which are intended to protect lenders and investors by (i) imposing certain restrictions or other limitations on a borrower’s operations or assets or (ii) providing certain rights to lenders. The Fund may have fewer rights with respect to covenant lite obligations, including fewer protections against the possibility of default and fewer remedies in the event of default. As a result, investments in (or exposure to) covenant lite obligations are subject to more risk than investments in (or exposure to) certain other types of obligations. The Fund is subject to other risks associated with investments in (or exposure to) obligations, including that obligations may not be considered “securities” and, as a result, the Fund may not be entitled to rely on the anti-fraud protections under the federal securities laws and instead may have to resort to state law and direct claims.
(d) Interest on When-Issued Securities
The Fund may purchase and sell interests in securities on a when-issued and delayed delivery basis, with payment and delivery scheduled for a future date. No income accrues to the Fund on such interests or securities in connection with such transactions prior to the date the Fund actually takes delivery of such interests or securities. These transactions are subject to market fluctuations and are subject to the risk that the value at delivery may be more or less than the trade date purchase price. Although the Fund will generally purchase these securities with the intention of acquiring such securities, it may sell such securities before the settlement date.
(e) Options
Upon the purchase of an option, the premium paid is recorded as an investment, the value of which is marked-to-market daily. If a purchased option expires, the Fund realizes a loss in the amount of the cost of the option. When the Fund enters into a closing sale transaction, it realizes a gain or loss depending on whether the proceeds from the closing sale transaction are greater or less than the cost of the option. If the Fund exercises a put option, it realizes a gain or loss from the sale of the underlying security and the proceeds from such sale will be decreased by the premium originally paid. When the Fund exercises a call option, the cost of the security purchased by the Fund upon exercise increases by the premium originally paid.
When the Fund writes (sells) an option, an amount equal to the premium received is entered in that Fund’s accounting records as an asset and equivalent liability. The amount of the liability is subsequently marked-to-market to reflect the current value of the option written. When a written option expires, or if the Fund enters into a closing purchase transaction, it realizes a gain (or loss if the cost of a closing purchase transaction exceeds the premium received when the option was sold).
102 | THE GUGGENHEIM FUNDS SEMI-ANNUAL REPORT | |
NOTES TO FINANCIAL STATEMENTS (Unaudited)(continued) |
(f) Futures Contracts
Upon entering into a futures contract, the Fund deposits and maintains as collateral such initial margin as required by the exchange on which the transaction is affected. Pursuant to the contract, the Fund agrees to receive from or pay to the broker an amount of cash equal to the daily fluctuation in value of the contract. Such receipts or payments are known as variation margin and are recorded by the Fund as unrealized appreciation or depreciation. When the contract is closed, the Fund records a realized gain or loss equal to the difference between the value of the contract at the time it was opened and the value at the time it was closed.
(g) Swap Agreements
Swap agreements are marked-to-market daily and the change, if any, is recorded as unrealized appreciation or depreciation. Payments received or made as a result of an agreement or termination of an agreement are recognized as realized gains or losses.
Upon entering into certain centrally-cleared swap transactions, a Fund is required to deposit with its clearing broker an amount of cash or securities as an initial margin. Subsequent variation margin receipts or payments are received or made by the Fund depending on fluctuations in the fair value of the reference entity and are recorded by the Fund as unrealized appreciation or depreciation. When the contract is closed, the Fund records a realized gain or loss equal to the difference between the value of the contract at the time it was opened and the value at the time it was closed.
Upfront payments received or made by a Fund on credit default swap agreements and interest rate swap agreements are amortized over the expected life of the agreement. Periodic payments received or paid by a Fund are recorded as realized gains or losses. Payments received or made as a result of a credit event or termination of the contract are recognized, net of a proportional amount of the upfront payment, as realized gains or losses.
(h) Forward Foreign Currency Exchange Contracts
The change in value of a forward foreign currency exchange contract is recorded as unrealized appreciation or depreciation until the contract is closed. When the contract is closed, the Fund records a realized gain or loss equal to the difference between the value at the time the contract was opened and the value at the time it was closed.
(i) Currency Translations
The accounting records of the Fund are maintained in U.S. dollars. All assets and liabilities initially expressed in foreign currencies are converted into U.S. dollars at prevailing exchange rates. Purchases and sales of investment securities, dividend and interest income, and certain expenses are translated at the rates of exchange prevailing on the respective dates of such transactions. Changes in the relationship of these foreign currencies to the U.S. dollar can significantly affect the value of the investments and earnings of the Fund. Foreign investments may also subject
| | THE GUGGENHEIM FUNDS SEMI-ANNUAL REPORT | 103 |
NOTES TO FINANCIAL STATEMENTS (Unaudited)(continued) |
the Fund to foreign government exchange restrictions, expropriation, taxation, or other political, social or economic developments, all of which could affect the market and/or credit risk of the investments.
The Fund does not isolate that portion of the results of operations resulting from changes in the foreign exchange rates on investments from the fluctuations arising from changes in the market prices of securities held. Such fluctuations are included with the net realized gain or loss and unrealized appreciation or depreciation on investments.
Reported net realized foreign exchange gains and losses arise from sales of foreign currencies and currency gains or losses realized between the trade and settlement dates on investment transactions. Net unrealized appreciation and depreciation arise from changes in the fair values of assets and liabilities other than investments in securities at the fiscal period end, resulting from changes in exchange rates.
(j) Foreign Taxes
The Fund may be subject to foreign taxes (a portion of which may be reclaimable) on income, stock dividends, capital gains on investments or certain foreign currency transactions. All foreign taxes are recorded in accordance with the applicable foreign tax regulations and rates that exist in the foreign jurisdictions in which the Fund invests. These foreign taxes, if any, are paid by the Fund and reflected in its Statement of Operations as follows: foreign taxes withheld at source are presented as a reduction of income and foreign taxes on capital gains from sales of investments are included with the net realized gain (loss) on investments. Foreign taxes payable or deferred as of March 31, 2021, if any, are disclosed in the Fund’s Statement of Assets and Liabilities.
(k) Security Transactions
Security transactions are recorded on the trade date for financial reporting purposes. Realized gains and losses from securities transactions are recorded using the identified cost basis. Proceeds from lawsuits related to investment holdings are recorded as a reduction to cost if the securities are still held and as realized gains if no longer held in the Fund. Dividend income is recorded on the ex-dividend date, net of applicable taxes withheld by foreign countries, if any. Taxable non-cash dividends are recorded as dividend income. Interest income, including amortization of premiums and accretion of discounts, is accrued on a daily basis. Interest income also includes paydown gains and losses on mortgage-backed and asset-backed securities and senior and subordinated loans. Amendment fees are earned as compensation for evaluating and accepting changes to the original loan agreement and are recognized when received. Dividend income from Real Estate Investment Trusts (“REITs”) is recorded based on the income included in the distributions received from the REIT investments using published REIT classifications, including some management estimates when actual amounts are not available. Distributions received in excess of this estimated amount are recorded as a reduction of the cost of investments
104 | THE GUGGENHEIM FUNDS SEMI-ANNUAL REPORT | |
NOTES TO FINANCIAL STATEMENTS (Unaudited)(continued) |
or reclassified to realized gains. The actual amounts of income, return of capital, and realized gains are only determined by each REIT after its fiscal year-end, and may differ from the estimated amounts.
Income from residual collateralized loan obligations is recognized using the effective interest method. At the time of purchase, management estimates the future expected cash flows and determines the effective yield and estimated maturity date based on the estimated cash flows. Subsequent to the purchase, the estimated cash flows are updated periodically and a revised yield is calculated prospectively.
The Fund may receive other income from investments in senior loan interests including amendment fees, consent fees and commitment fees. For funded loans, these fees are recorded as income when received by the Fund and included in interest income on the Statement of Operations. For unfunded loans, commitment fees are included in realized gain on investments on the Statement of Operations at the end of the commitment period.
(l) Distributions
The Fund declares dividends from investment income daily. The Fund pays its shareholders from its net investment income monthly and distributes any net capital gains that it has realized, at least annually. Distributions to shareholders are recorded on the ex-dividend date. Dividends are reinvested in additional shares, unless shareholders request payment in cash. The character of distributions made during the year from net investment income or net realized gains may differ from their ultimate characterization for U.S. federal income tax purposes.
(m) Class Allocations
Interest and dividend income, most expenses, all realized gains and losses, and all unrealized appreciation and depreciation are allocated to the classes based upon the value of the outstanding shares in each Class. Certain costs, such as distribution and service fees are charged directly to specific classes. In addition, certain expenses have been allocated to the individual Funds in the Trust based on the respective net assets of each Fund included in the Trust.
(n) Earnings Credits
Under the fee arrangement with the custodian, the Fund may earn credits based on overnight custody cash balances. These credits are utilized to reduce related custodial expenses. The custodian fees disclosed in the Statement of Operations are before the reduction in expense from the related earnings credits, if any. Earnings credits for the period ended March 31, 2021, are disclosed in the Statement of Operations.
| | THE GUGGENHEIM FUNDS SEMI-ANNUAL REPORT | 105 |
NOTES TO FINANCIAL STATEMENTS (Unaudited)(continued) |
(o) Cash
The Fund may leave cash overnight in its cash account with the custodian. Periodically, the Fund may have cash due to the custodian bank as an overdraft balance. A fee is incurred on this overdraft, calculated by multiplying the overdraft by a rate based on the federal funds rate, which was 0.06% at March 31, 2021.
(p) Indemnifications
Under the Fund’s organizational documents, its Trustees and Officers are indemnified against certain liabilities arising out of the performance of their duties to the Trust. In addition, throughout the normal course of business, the Fund enters into contracts that contain a variety of representations and warranties which provide general indemnifications. The Fund’s maximum exposure under these arrangements is unknown, as this would involve future claims that may be made against the Fund and/or its affiliates that have not yet occurred. However, based on experience, the Fund expects the risk of loss to be remote.
Note 2 – Derivatives
As part of its investment strategy, the Fund utilizes a variety of derivative instruments. These investments involve, to varying degrees, elements of market risk and risks in excess of amounts recognized on the Statement of Assets and Liabilities. Valuation and accounting treatment of these instruments can be found under Significant Accounting Policies in Note 1 of these Notes to Financial Statements.
Derivatives are instruments whose values depend on, or are derived from, in whole or in part, the value of one or more other assets, such as securities, currencies, commodities or indices. Derivative instruments may be used to increase investment flexibility (including to maintain cash reserves while maintaining exposure to certain other assets), for risk management (hedging) purposes, to facilitate trading, to reduce transaction costs and to pursue higher investment returns. Derivative instruments may also be used to mitigate certain investment risks, such as foreign currency exchange rate risk, interest rate risk and credit risk. U.S. GAAP requires disclosures to enable investors to better understand how and why a Fund uses derivative instruments, how these derivative instruments are accounted for and their effects on the Fund’s financial position and results of operations.
The Fund utilized derivatives for the following purposes:
Duration: the use of an instrument to manage the interest rate risk of a portfolio.
Hedge: an investment made in order to reduce the risk of adverse price movements in a security, by taking an offsetting position to protect against broad market moves.
Income: the use of any instrument that distributes cash flows typically based upon some rate of interest.
106 | THE GUGGENHEIM FUNDS SEMI-ANNUAL REPORT | |
NOTES TO FINANCIAL STATEMENTS (Unaudited)(continued) |
Index Exposure: the use of an instrument to obtain exposure to a listed or other type of index.
Speculation: the use of an instrument to express macro-economic and other investment views.
Options Purchased and Written
A call option on a security gives the purchaser of the option the right to buy, and the writer of a call option the obligation to sell, the underlying security. The purchaser of a put option has the right to sell, and the writer of the put option the obligation to buy, the underlying security at any time during the option period. The risk associated with purchasing options is limited to the premium originally paid.
The following table represents the Fund’s use and volume of call/put options purchased on a monthly basis:
| | | Average Number of Contracts | |
Use | | Call | | | Put | |
Hedge | | $ | 14,818,283,333 | | | $ | — | |
Futures Contracts
A futures contract is an agreement to purchase (long) or sell (short) an agreed amount of securities or other instruments at a set price for delivery at a future date. There are significant risks associated with a Fund’s use of futures contracts, including (i) there may be an imperfect or no correlation between the changes in market value of the underlying asset and the prices of futures contracts; (ii) there may not be a liquid secondary market for a futures contract; (iii) trading restrictions or limitations may be imposed by an exchange; and (iv) government regulations may restrict trading in futures contracts. When investing in futures, there is minimal counterparty credit risk to a Fund because futures are exchange-traded and the exchange’s clearinghouse, as counterparty to all exchange-traded futures, guarantees against default. Cash deposits are shown as segregated cash with broker on the Statement of Assets and Liabilities; securities held as collateral are noted on the Schedule of Investments.
The following table represents the Fund’s use and volume of futures on a monthly basis:
| | | Average Notional Amount | |
Use | | Long | | | Short | |
Duration, Hedge, Income | | $ | — | | | $ | 3,273,396 | |
Swap Agreements
A swap is an agreement that obligates two parties to exchange a series of cash flows at specified intervals based upon or calculated by reference to changes in specified prices or rates for a specified amount of an underlying asset. When utilizing OTC swaps, the Fund bears the risk of loss of the amount expected to be received under a swap agreement in the event of the default or
| | THE GUGGENHEIM FUNDS SEMI-ANNUAL REPORT | 107 |
NOTES TO FINANCIAL STATEMENTS (Unaudited)(continued) |
bankruptcy of a swap agreement counterparty or if the underlying asset declines in value. Certain standardized swaps are subject to mandatory central clearing and are executed on a multi-lateral or other trade facility platform, such as a registered exchange. There is limited counterparty credit risk with respect to centrally-cleared swaps as the transaction is facilitated through a central clearinghouse, much like exchange-traded futures contracts. For a Fund utilizing centrally-cleared swaps, the exchange bears the risk of loss resulting from a counterparty not being able to pay. There is no guarantee that a fund or an underlying fund could eliminate its exposure under an outstanding swap agreement by entering into an offsetting swap agreement with the same or another party.
Total return swaps involve commitments where single or multiple cash flows are exchanged based on the price of an underlying reference asset (such as an index or custom basket of securities) for a fixed or variable interest rate. Total return swaps will usually be computed based on the current value of the reference asset as of the close of regular trading on the NYSE or other exchange, with the swap value being adjusted to include dividends accrued, financing charges and/or interest associated with the swap agreement. When utilizing total return swaps, the Fund bears the risk of loss of the amount expected to be received under a swap agreement in the event of the default or bankruptcy of a swap agreement counterparty or if the underlying reference asset declines in value.
��
The following table represents the Fund’s use and volume of total return swaps on a monthly basis:
| | | Average Notional Amount | |
Use | | Long | | | Short | |
Income, Index Exposure, Speculation | | $ | 108,351,551 | | | $ | 15,110,432 | |
Interest rate swaps involve the exchange by the Fund with another party for its respective commitment to pay or receive a fixed or variable interest rate on a notional amount of principal. Interest rate swaps are generally centrally-cleared, but central clearing does not make interest rate swap transactions risk free.
The following table represents the Fund’s use and volume of interest rate swaps on a monthly basis:
| | | Average Notional Amount | |
Use | | Pay Floating Rate | | | Receive Floating Rate | |
Duration, Hedge | | $ | 2,979,005,000 | | | $ | 1,733,000,000 | |
Credit default swaps are instruments which allow for the full or partial transfer of third party credit risk, with respect to a particular entity or entities, from one counterparty to the other. The Fund enters into credit default swaps as a “seller” or “buyer” of protection primarily to gain or reduce exposure to the investment grade and/or high yield bond market. A seller of credit default swaps is selling credit protection or assuming credit risk with respect to the underlying entity or entities.
108 | THE GUGGENHEIM FUNDS SEMI-ANNUAL REPORT | |
NOTES TO FINANCIAL STATEMENTS (Unaudited)(continued) |
The buyer in a credit default swap is obligated to pay the seller a periodic stream of payments over the term of the contract provided that no event of default on an underlying reference obligation has occurred. If a credit event occurs, as defined under the terms of the swap agreement, the seller will either (i) pay to the buyer of protection an amount equal to the notional amount of the swap and take delivery of the referenced obligation or underlying securities comprising the referenced index or (ii) pay a net settlement amount in the form of cash or securities equal to the notional amount of the swap less the recovery value of the referenced obligation or underlying securities comprising the referenced index. The notional amount reflects the maximum potential amount the seller of credit protection could be required to pay to the buyer if a credit event occurs. The seller of protection receives periodic premium payments from the buyer and may also receive or pay an upfront premium adjustment to the stated periodic payments. In the event a credit default occurs on a credit default swap referencing an index, a factor adjustment will take place and the buyer of protection will receive a payment reflecting the par less the default recovery rate of the defaulted index component based on its weighting in the index. If no default occurs, the counterparty will pay the stream of payments and have no further obligations to the fund selling the credit protection. For a fund utilizing centrally-cleared credit default swaps, the exchange bears the risk of loss resulting from a counterparty not being able to pay. For OTC credit default swaps, a fund bears the risk of loss of the amount expected to be received under a swap agreement in the event of the default or bankruptcy of a swap agreement counterparty, or in the case of a credit default swap in which a fund is selling credit protection, the default of a third party issuer.
The quoted market prices and resulting market values for credit default swap agreements on securities and credit indices serve as an indicator of the current status of the payment/performance risk and represent the likelihood of an expected liability (or profit) for the credit derivative had the notional amount of the swap agreement been closed/sold as of the period end. Increasing market values, in absolute terms when compared to the notional amount of the swap, represent a deterioration of the referenced entity’s credit soundness and a greater likelihood or risk of default or other credit event occurring as defined under the terms of the agreement.
The following table represents the Fund’s use and volume of credit default swaps on a monthly basis:
| | | Average Notional Amount | |
Use | | Protection Sold | | | Protection Purchased | |
Hedge, Index Exposure, Speculation | | $ | 249,081,667 | | | $ | — | |
| | THE GUGGENHEIM FUNDS SEMI-ANNUAL REPORT | 109 |
NOTES TO FINANCIAL STATEMENTS (Unaudited)(continued) |
Forward Foreign Currency Exchange Contracts
A forward foreign currency exchange contract is an agreement between two parties to exchange two designated currencies at a specific time in the future. Certain types of contracts may be cash settled, in an amount equal to the change in exchange rates during the term of the contract. The contracts can be used to hedge or manage exposure to foreign currency risks with portfolio investments or to gain exposure to foreign currencies.
The market value of a forward foreign currency exchange contract changes with fluctuations in foreign currency exchange rates. Furthermore, the Fund may be exposed to risk if the counterparties cannot meet the contract terms or if the currency value changes unfavorably as compared to the U.S. dollar.
The following table represents the Fund’s use and volume of forward foreign currency exchange contracts on a monthly basis:
| | | Average Value | |
Use | | Purchased | | | Sold | |
Hedge, Income | | $ | 1,167,147,490 | | | $ | 1,400,449,849 | |
Derivative Investment Holdings Categorized by Risk Exposure
The following is a summary of the location of derivative investments on the Fund’s Statement of Assets and Liabilities as of March 31, 2021:
Derivative Investment Type | Asset Derivatives | Liability Derivatives |
Currency contracts | Unrealized appreciation on forward foreign currency exchange contracts | Unrealized depreciation on forward foreign currency exchange contracts |
Interest Rate contracts | Investments in unaffiliated issuers, at value Unamortized upfront premiums paid on interest rate swap agreements Variation margin on interest rate swap agreements | |
Credit contracts | Unrealized appreciation on OTC swap agreements | Unrealized depreciation on OTC swap agreements |
110 | THE GUGGENHEIM FUNDS SEMI-ANNUAL REPORT | |
NOTES TO FINANCIAL STATEMENTS (Unaudited)(continued) |
The following tables set forth the fair value of the Fund’s derivative investments categorized by primary risk exposure at March 31, 2021:
| | Asset Derivative Investments Value | |
| | Swaps
Interest
Rate
Risk* | | | Swaps
Credit
Risk* | | | Options
Purchased
Interest
Rate Risk | | | Forward
Foreign
Currency
Exchange
Risk | | | Total Value at
September 30,
2020 | |
| | $ | 156,670,008 | | | $ | 138,502 | | | $ | 89,346,524 | | | $ | 112,321,874 | | | $ | 358,476,908 | |
| | Liability Derivative Investments Value | |
| | Swaps
Interest
Rate
Risk* | | | Swaps
Credit
Risk* | | | Options
Purchased
Interest
Rate Risk | | | Forward
Foreign
Currency
Exchange
Risk | | | Total Value at
September 30,
2020 | |
| | $ | 186,771,992 | | | $ | 50,583 | | | $ | — | | | $ | 43,884,374 | | | $ | 230,706,949 | |
* | Includes cumulative appreciation (depreciation) of exchange-traded, OTC and centrally-cleared derivatives as reported on the Schedule of Investments. For exchange-traded and centrally-cleared derivatives, variation margin is reported within the Statement of Assets and Liabilities. |
The following is a summary of the location of derivative investments on the Fund’s Statement of Operations for the period ended March 31, 2021:
Derivative Investment Type | Location of Gain (Loss) on Derivatives |
Currency contracts | Net realized gain (loss) on on forward foreign currency exchange contracts |
| Net change in unrealized appreciation (depreciation) on forward foreign currency exchange contracts |
Interest Rate contracts | Net realized gain (loss) on futures contracts |
| | Net realized gain (loss) on options purchased |
| Net change in unrealized appreciation (depreciation) on futures contracts |
| | Net change in unrealized appreciation (depreciation) on options purchased |
Interest Rate/Credit contracts | Net realized gain (loss) on swap agreements |
| | Net change in unrealized appreciation (depreciation) on swap agreements |
| | THE GUGGENHEIM FUNDS SEMI-ANNUAL REPORT | 111 |
NOTES TO FINANCIAL STATEMENTS (Unaudited)(continued) |
The following is a summary of the Fund’s realized gain (loss) and change in unrealized appreciation (depreciation) on derivative investments recognized on the Statement of Operations categorized by primary risk exposure for the period ended March 31, 2021:
| | Realized Gain (Loss) on Derivative Investments Recognized on the Statement of Operations | |
| | Futures
Interest
Rate
Risk | | | Swaps
Interest
Rate
Risk | | | Swaps
Credit
Risk | | | Options
Purchased
Interest
Rate
Risk | | | Forward
Foreign
Currency
Exchange
Risk | | | Total | |
| | $ | 94,051 | | | $ | 7,235,478 | | | $ | 37,687,127 | | | $ | 38,488,836 | | | $ | 1,752,496 | | | $ | 85,257,988 | |
| | Change in Unrealized Appreciation (Depreciation) on Derivative Investments Recognized on the Statement of Operations | |
| | Futures
Interest
Rate
Risk | | | Swaps
Interest
Rate
Risk | | | Swaps
Credit
Risk | | | Options
Purchased
Interest
Rate
Risk | | | Forward
Foreign
Currency
Exchange
Risk | | | Total | |
| | $ | — | | | $ | (64,927,254 | ) | | $ | (22,179,063 | ) | | $ | 47,733,960 | | | $ | 4,132,086 | | | $ | (35,240,271 | ) |
In conjunction with the use of derivative instruments, the Fund is required to maintain collateral in various forms. Depending on the financial instrument utilized and the broker involved, the Fund uses margin deposits at the broker, cash and/or securities segregated at the custodian bank, discount notes or repurchase agreements allocated to the Fund as collateral.
Foreign Investments
There are several risks associated with exposure to foreign currencies, foreign issuers and emerging markets. A fund’s indirect and direct exposure to foreign currencies subjects the Fund to the risk that those currencies will decline in value relative to the U.S. dollar, or in the case of short positions, that the U.S. dollar will decline in value relative to the currency being hedged. Currency rates in foreign countries may fluctuate significantly over short periods of time for a number of reasons, including changes in interest rates and the imposition of currency controls or other political developments in the U.S. or abroad. In addition, the Fund may incur transaction costs in connection with conversions between various currencies. The Fund may, but is not obligated to, engage in currency hedging transactions, which generally involve buying currency forward, options or futures contracts. However, not all currency risks may be effectively hedged, and in some cases the costs of hedging techniques may outweigh expected benefits. In such instances, the value of securities denominated in foreign currencies can change significantly when foreign currencies strengthen or weaken relative to the U.S. dollar.
112 | THE GUGGENHEIM FUNDS SEMI-ANNUAL REPORT | |
NOTES TO FINANCIAL STATEMENTS (Unaudited)(continued) |
The Fund may invest in securities of foreign companies directly, or in financial instruments, such as ADRs and exchange-traded funds, which are indirectly linked to the performance of foreign issuers. Foreign markets can be more volatile than the U.S. market due to increased risks of adverse issuer, political, regulatory, market, or economic developments and can perform differently from the U.S. market. Investing in securities of foreign companies directly, or in financial instruments that are indirectly linked to the performance of foreign issuers, may involve risks not typically associated with investing in U.S. issuers. The value of securities denominated in foreign currencies, and of dividends from such securities, can change significantly when foreign currencies strengthen or weaken relative to the U.S. dollar. Foreign securities markets generally have less trading volume and less liquidity than U.S. markets, and prices in some foreign markets may fluctuate more than those of securities traded on U.S. markets. Many foreign countries lack accounting and disclosure standards comparable to those that apply to U.S. companies, and it may be more difficult to obtain reliable information regarding a foreign issuer’s financial condition and operations. Transaction costs and costs associated with custody services are generally higher for foreign securities than they are for U.S. securities. Some foreign governments levy withholding taxes against dividend and interest income. Although in some countries portions of these taxes are recoverable, the non-recovered portion will reduce the income received by the Fund.
The Trust has established counterparty credit guidelines and enters into transactions only with financial institutions of investment grade or better. The Trust monitors the counterparty credit risk.
Note 3 – Offsetting
In the normal course of business, the Fund enters into transactions subject to enforceable master netting arrangements or other similar arrangements. Generally, the right to offset in those agreements allows the Fund to counteract the exposure to a specific counterparty with collateral received from or delivered to that counterparty based on the terms of the arrangements. These arrangements provide for the right to liquidate upon the occurrence of an event of default, credit event upon merger or additional termination event.
In order to better define its contractual rights and to secure rights that will help the Fund mitigate its counterparty risk, the Fund may enter into an International Swaps and Derivatives Association, Inc. Master Agreement (“ISDA Master Agreement”) or similar agreement with its derivative contract counterparties. An ISDA Master Agreement is a bilateral agreement between a fund and a counterparty that governs OTC derivatives, including foreign exchange contracts, and typically contains, among other things, collateral posting terms and netting provisions in the event of a default and/or termination event. The provisions of the ISDA Master Agreement typically permit a single net payment in the event of a default (close-out netting) or similar event, including the bankruptcy or insolvency of the counterparty.
| | THE GUGGENHEIM FUNDS SEMI-ANNUAL REPORT | 113 |
NOTES TO FINANCIAL STATEMENTS (Unaudited)(continued) |
For derivatives traded under an ISDA Master Agreement, the collateral requirements are typically calculated by netting the mark-to-market amount for each transaction under such agreement and comparing that amount to the value of any collateral currently pledged by the Fund and the counterparty. For financial reporting purposes, cash collateral that has been pledged to cover obligations of the Fund and cash collateral received from the counterparty, if any, are reported separately on the Statement of Assets and Liabilities as segregated cash with broker/receivable for variation margin, or payable for swap settlement/variation margin. Cash and/or securities pledged or received as collateral by the Fund in connection with an OTC derivative subject to an ISDA Master Agreement generally may not be invested, sold or rehypothecated by the counterparty or the Fund, as applicable, absent an event of default under such agreement, in which case such collateral generally may be applied towards obligations due to and payable by such counterparty or the Fund, as applicable. Generally, the amount of collateral due from or to a counterparty must exceed a minimum transfer amount threshold (e.g., $300,000) before a transfer is required to be made. To the extent amounts due to the Fund from its counterparties are not fully collateralized, contractually or otherwise, the Fund bears the risk of loss from counterparty nonperformance. The Fund attempts to mitigate counterparty risk by only entering into agreements with counterparties that it believes to be of good standing and by monitoring the financial stability of those counterparties.
For financial reporting purposes, the Fund does not offset derivative assets and derivative liabilities that are subject to netting arrangements in the Statement of Assets and Liabilities.
The following tables present derivative financial instruments and secured financing transactions that are subject to enforceable netting arrangements:
| | | | | | | | | | | | | | | Gross Amounts Not
Offset in the Statement
of Assets and Liabilities | | | | | |
Instrument | | Gross
Amounts of
Recognized
Assets1 | | | Gross
Amounts
Offset in the
Statement of
Assets and
Liabilities | | | Net Amount
of Assets
Presented on
the Statement
of Assets and
Liabilities | | | Financial
Instruments | | | Cash
Collateral
Received | | | Net
Amount | |
Credit index swap agreements | | $ | 138,502 | | | $ | — | | | $ | 138,502 | | | $ | (50,583 | ) | | $ | — | | | $ | 87,919 | |
Forward foreign currency exchange contracts | | | 112,321,874 | | | | — | | | | 112,321,874 | | | | (34,491,457 | ) | | | (63,540,391 | ) | | | 14,290,026 | |
Options purchased contracts | | | 89,346,524 | | | | — | | | | 89,346,524 | | | | — | | | | (26,890,338 | ) | | | 62,456,186 | |
114 | THE GUGGENHEIM FUNDS SEMI-ANNUAL REPORT | |
NOTES TO FINANCIAL STATEMENTS (Unaudited)(continued) |
| | | | | | | | | | | | | | | Gross Amounts Not
Offset in the Statement
of Assets and Liabilities | | | | | |
Instrument | | Gross
Amounts of
Recognized
Liabilities1 | | | Gross
Amounts
Offset in the
Statement of
Assets and
Liabilities | | | Net Amount
of Liabilities
Presented on
the Statement
of Assets and
Liabilities | | | Financial
Instruments | | | Cash
Collateral
Pledged | | | Net
Amount | |
Credit index swap agreements | | $ | 50,583 | | | $ | — | | | $ | 50,583 | | | $ | (50,583 | ) | | $ | — | | | $ | — | |
Forward foreign currency exchange contracts | | | 43,884,374 | | | | — | | | | 43,884,374 | | | | (34,491,457 | ) | | | — | | | | 9,392,917 | |
1 | Exchange-traded or centrally-cleared derivatives are excluded from these reported amounts. |
The Fund has the right to offset deposits against any related derivative liabilities outstanding with each counterparty with the exception of exchange-traded or centrally-cleared derivatives. The following table presents deposits held by others in connection with derivative investments as of March 31, 2021.
Counterparty | Asset Type | | Cash Pledged | | | Cash Received | |
Barclays Bank plc | Forward foreign currency exchange contracts | | $ | — | | | $ | 5,401,000 | |
BofA Securities, Inc. | Credit default swap agreements | | | — | | | | 1,431,354 | |
BofA Securities, Inc. | Interest rate swap agreements | | | — | | | | 5,039,265 | |
Citibank N.A. | Forward foreign currency exchange contracts | | | — | | | | 25,446,417 | |
Goldman Sachs International | Futures contracts, Total return swap agreements, Options, Forward foreign currency exchange contracts | | | — | | | | 40,350,031 | |
Morgan Stanley Capital Services LLC | Forward foreign currency exchange contracts, Options | | | — | | | $ | 19,740,000 | |
Total | | | $ | — | | | $ | 97,408,067 | |
Note 4 – Fair Value Measurement
In accordance with U.S. GAAP, fair value is defined as the price that the Fund would receive to sell an investment or pay to transfer a liability in an orderly transaction with an independent buyer in the principal market, or in the absence of a principal market, the most advantageous market for the investment or liability. U.S. GAAP establishes a three-tier fair value hierarchy based on the types of inputs used to value assets and liabilities and requires corresponding disclosure. The hierarchy and the corresponding inputs are summarized below:
Level 1 — | quoted prices in active markets for identical assets or liabilities. |
| | THE GUGGENHEIM FUNDS SEMI-ANNUAL REPORT | 115 |
NOTES TO FINANCIAL STATEMENTS (Unaudited)(continued) |
Level 2 — | significant other observable inputs (for example quoted prices for securities that are similar based on characteristics such as interest rates, prepayment speeds, credit risk, etc.). |
Level 3 — | significant unobservable inputs based on the best information available under the circumstances, to the extent observable inputs are not available, which may include assumptions. |
The types of inputs available depend on a variety of factors, such as the type of security and the characteristics of the markets in which it trades, if any. Fair valuation determinations that rely on fewer or no observable inputs require greater judgment. Accordingly, fair value determinations for Level 3 securities require the greatest amount of judgment.
Independent pricing services are used to value a majority of the Fund’s investments. When values are not available from a pricing service, they will be determined using a variety of sources and techniques, including: market prices; broker quotes; and models which derive prices based on inputs such as prices of securities with comparable maturities and characteristics or based on inputs such as anticipated cash flows or collateral, spread over U.S. Treasury securities, and other information and analysis. A significant portion of the Fund’s assets and liabilities are categorized as Level 2, as indicated in this report.
Quotes from broker-dealers, adjusted for fluctuations in criteria such as credit spreads and interest rates, may also be used to value the Fund’s assets and liabilities, i.e. prices provided by a broker-dealer or other market participant who has not committed to trade at that price. Although quotes are typically received from established market participants, the Fund may not have the transparency to view the underlying inputs which support the market quotations. Significant changes in a quote would generally result in significant changes in the fair value of the security.
Certain fixed income securities are valued by obtaining a monthly quote from a broker-dealer, adjusted for fluctuations in criteria such as credit spreads and interest rates.
Certain loans and other securities are valued using a single daily broker quote or a price from a third party vendor based on a single daily or monthly broker quote.
The inputs or methodologies used for valuing securities are not necessarily an indication of the risk associated with investing in those securities. The suitability of the techniques and sources employed to determine fair valuation are regularly monitored and subject to change.
Note 5 – Investment Advisory Agreement and Other Agreements
Under the terms of an investment advisory contract, the Fund pays GI investment advisory fees calculated at an annualized rate of 0.39% of the average daily net assets of the Fund.
GI pays operating expenses on behalf of the Trust, such as audit and accounting related services, legal services, custody, printing and mailing, among others, on a pass-through basis. Such expenses are allocated to various Funds within the complex based on relative net assets.
116 | THE GUGGENHEIM FUNDS SEMI-ANNUAL REPORT | |
NOTES TO FINANCIAL STATEMENTS (Unaudited)(continued) |
The Board has adopted Distribution Plans related to the offering of A-Class, C-Class and P-Class shares pursuant to Rule 12b-1 under the 1940 Act. The plans provide for payments at an annual rate of 0.25% of the average daily net assets of the Fund’s A-Class and P-Class shares, and 1.00% of the average daily net assets of the Fund’s C-Class shares.
The investment advisory contract for the Fund provides that the total expenses be limited to a percentage of average net assets for each class of shares, exclusive of brokerage costs, dividends or interest on securities sold short, expenses of other investment companies in which the Fund invests, interest, taxes, litigation, indemnification and extraordinary expenses. The limits are listed below:
| | Limit | | | Effective
Date | | | Contract
End Date | |
A-Class | | | 0.79 | % | | | 11/20/17 | | | | 02/01/22 | |
C-Class | | | 1.54 | % | | | 11/20/17 | | | | 02/01/22 | |
P-Class | | | 0.79 | % | | | 11/20/17 | | | | 02/01/22 | |
Institutional Class | | | 0.50 | % | | | 11/30/12 | | | | 02/01/22 | |
R6-Class | | | 0.50 | % | | | 10/19/16 | | | | 02/01/22 | |
GI is entitled to reimbursement by the Fund for fees waived or expenses reimbursed during any of the previous 36 months, beginning on the date of the expense limitation agreement, if on any day the estimated operating expenses are less than the indicated percentages. For purposes of this arrangement, GI is entitled to recoupment of previously waived fees or reimbursed expenses for 36 months from the date of the waiver or reimbursement by GI. At March 31, 2021, the amount of fees waived or expenses reimbursed that are subject to recoupment and will expire during the years ended September 30, are presented in the following table:
| | 2021 | | | 2022 | | | 2023 | | | 2024 | | | Total | |
A-Class | | $ | 690,174 | | | $ | 970,954 | | | $ | 440,686 | | | $ | 260,015 | | | $ | 2,361,829 | |
C-Class | | | 102,786 | | | | 139,409 | | | | 133,369 | | | | 81,584 | | | | 457,148 | |
P-Class | | | 567,755 | | | | 529,763 | | | | 636,580 | | | | 330,730 | | | | 2,064,828 | |
Institutional Class | | | 4,886,581 | | | | 6,918,582 | | | | 8,669,558 | | | | 6,988,723 | | | | 27,463,444 | |
R6-Class | | | — | | | | — | | | | 5,384 | | | | 2,665 | | | | 8,049 | |
For the period ended March 31, 2021, GI recouped $26,903 from the Fund.
If the Fund invests in a fund that is advised by the same adviser or an affiliated adviser, the investing Fund’s adviser has agreed to waive fees at the investing fund level to the extent necessary to offset the proportionate share of any management fee paid by the Fund with respect to its investment in such affiliated fund. Fee waivers will be calculated at the investing Fund level without regard to any expense cap, if any, in effect for the investing Fund. Fees waived under this arrangement are not subject to reimbursement to GI. For the period ended March 31, 2021, the Fund waived $33,166 related to investments in affiliated funds.
| | THE GUGGENHEIM FUNDS SEMI-ANNUAL REPORT | 117 |
NOTES TO FINANCIAL STATEMENTS (Unaudited)(continued) |
For the period ended March 31, 2021, GFD retained sales charges of $192,037 relating to sales of A-Class shares of the Trust.
Certain trustees and officers of the Trust are also officers of GI and/or GFD. The Trust does not compensate its officers or trustees who are officers, directors and/or employees of GI or GFD.
MUFG Investor Services (US), LLC (“MUIS”) acts as the Fund’s administrator, transfer agent and accounting agent. As administrator, transfer agent and accounting agent, MUIS maintains the books and records of the Fund’s securities and cash. The Bank of New York Mellon Corp. (“BNY”) acts as the Fund’s custodian. As custodian, BNY is responsible for the custody of the Fund’s assets. For providing the aforementioned administrative and accounting services, MUIS is entitled to receive a monthly fee equal to a percentage of the Fund’s average daily net assets and out of pocket expenses. For providing the aforementioned transfer agent and custodian services, MUIS and BNY are entitled to receive a monthly fee based on the number of transactions during the month and the number of accounts under management, subject to certain minimum monthly fees, and out of pocket expenses.
Note 6 – Reverse Repurchase Agreements
The Fund may enter into reverse repurchase agreements. Under a reverse repurchase agreement, a Fund sells securities and agrees to repurchase them at a particular price at a future date. In the event the buyer of securities under a reverse repurchase agreement files for bankruptcy or becomes insolvent, such buyer or its trustee or receiver may receive an extension of time to determine whether to enforce the Fund’s obligation to repurchase the securities, and the Fund’s use of the proceeds of the reverse repurchase agreement may effectively be restricted pending such decision.
For the period ended March 31, 2021, the Fund entered into reverse repurchase agreements as follows:
Number of Days
Outstanding | | Balance at
March 31, 2021 | | | Average Balance
Outstanding | | | Average
Interest Rate | |
182 | | $ | 555,271,893 | | | $ | 430,227,318 | | | | 0.13 | % |
118 | THE GUGGENHEIM FUNDS SEMI-ANNUAL REPORT | |
NOTES TO FINANCIAL STATEMENTS (Unaudited)(continued) |
The following table presents reverse repurchase agreements that are subject to netting arrangements and offset in the Statement of Assets of Liabilities in conformity with U.S. GAAP:
| | | | | | | | | | | | | | | Gross Amounts Not
Offset in the Statement
of Assets and Liabilities | | | | | |
Instrument | | Gross
Amounts of
Recognized
Liabilities | | | Gross
Amounts
Offset in the
Statement of
Assets and
Liabilities | | | Net Amount
of Liabilities
Presented on
the Statement
of Assets and
Liabilities | | | Financial
Instruments | | | Cash
Collateral
Pledged | | | Net
Amount | |
Reverse repurchase agreements | | $ | 555,271,893 | | | $ | — | | | $ | 555,271,893 | | | $ | (555,271,893 | ) | | $ | — | | | $ | — | |
As of March 31, 2021, the Fund had outstanding reverse repurchase agreements with various counterparties. Details of the reverse repurchase agreements by counterparty are as follows:
Counterparty | | Interest Rate(s) | | | Maturity Date(s) | | | Face Value | |
BMO Capital Markets Corp. | | | (0.20 | %) | | | 04/01/21 | | | $ | 123,087,146 | |
Barclays Capital Inc. | | | (0.34%) - (0.35 | %) | | | 04/01/21 | | | | 122,925,445 | |
J.P. Morgan Securities LLC | | | 0.14 | % | | | 06/04/21 | | | | 100,985,425 | |
Canadian Imperial Bank of Commerce | | | 0.14 | % | | | 05/04/21 | | | | 113,524,772 | |
Total | | | | | | | | | | $ | 555,271,893 | |
The following is a summary of the remaining contractual maturities of the reverse repurchase agreements outstanding as of year end, aggregated by asset class of the related collateral pledged by the Fund:
Asset Type | | Up to 30 days | | | 31 – 90 days | | | Total | |
Corporate Bonds | | $ | — | | | $ | 24,830,317 | | | $ | 24,830,317 | |
Federal Agency Notes | | | — | | | | 76,155,107 | | | | 76,155,107 | |
Treasury Notes | | | 340,761,696 | | | | 113,524,773 | | | | 454,286,469 | |
Gross amount of recognized liabilities for reverse repurched agreements | | $ | 340,761,696 | | | $ | 214,510,197 | | | $ | 555,271,893 | |
Note 7 – Federal Income Tax Information
The Fund intends to comply with the provisions of Subchapter M of the Internal Revenue Code applicable to regulated investment companies and will distribute substantially all taxable net investment income and capital gains sufficient to relieve the Fund from all, or substantially all, federal income, excise and state income taxes. Therefore, no provision for federal or state income tax or federal excise tax is required.
| | THE GUGGENHEIM FUNDS SEMI-ANNUAL REPORT | 119 |
NOTES TO FINANCIAL STATEMENTS (Unaudited)(continued) |
Tax positions taken or expected to be taken in the course of preparing the Fund’s tax returns are evaluated to determine whether the tax positions are “more-likely-than-not” of being sustained by the applicable tax authority. Tax positions not deemed to meet the more-likely-than-not threshold would be recorded as a tax benefit or expense in the current year. Management has analyzed the Fund’s tax positions taken, or to be taken, on U.S. federal income tax returns for all open tax years, and has concluded that no provision for income tax is required in the Fund’s financial statements. The Fund’s U.S. federal income tax returns are subject to examination by the Internal Revenue Service (“IRS”) for a period of three years after they are filed.
At March 31, 2021, the cost of investments for U.S. federal income tax purposes, the aggregate gross unrealized appreciation for all investments for which there was an excess of value over tax cost, and the aggregate gross unrealized depreciation for all investments for which there was an excess of tax cost over value, were as follows:
| | Tax
Cost | | | Tax
Unrealized
Appreciation | | | Tax
Unrealized
Depreciation | | | Net
Unrealized
Appreciation
(Depreciation) | |
| | | $ | 25,710,801,790 | | | $ | 936,279,032 | | | $ | (613,914,510 | ) | | $ | 322,364,522 | |
Note 8 – Securities Transactions
For the period ended March 31, 2021, the cost of purchases and proceeds from sales of investment securities, excluding government securities, short-term investments and derivatives, were as follows:
| | Purchases | | | Sales | |
| | | $ | 8,140,111,843 | | | $ | 5,752,491,580 | |
For the period ended March 31, 2021, the cost of purchases and proceeds from sales of government securities were as follows:
| | Purchases | | | Sales | |
| | | $ | 1,020,351,884 | | | $ | 16,668,112 | |
The Fund is permitted to purchase or sell securities from or to certain affiliated funds under specified conditions outlined in procedures adopted by the Board. The procedures have been designed to ensure that any purchase or sale of securities by the Fund from or to another fund or portfolio that is or could be considered an affiliate by virtue of having a common investment adviser (or affiliated investment advisers), common trustees and/or common officers complies with Rule 17a-7 of the 1940 Act. Further, as defined under these procedures, each transaction is
120 | THE GUGGENHEIM FUNDS SEMI-ANNUAL REPORT | |
NOTES TO FINANCIAL STATEMENTS (Unaudited)(continued) |
effected at the current market price to save costs, where permissible. For the period ended March 31, 2021, the Fund engaged in purchases and sales of securities, pursuant to Rule 17a-7 of the 1940 Act, as follows:
| | Purchases | | | Sales | | | Realized
Gain | |
| | | $ | 98,129,198 | | | $ | 46,422,554 | | | $ | 2,455,183 | |
Note 9 – Unfunded Loan Commitments
Pursuant to the terms of certain loan agreements, the Fund held unfunded loan commitments as of March 31, 2021. The Fund is obligated to fund these loan commitments at the borrower’s discretion.
The unfunded loan commitments as of March 31, 2021, were as follows:
Borrower | Maturity
Date | | Face
Amount* | | | Value | |
AI Aqua Zip Bidco Pty Ltd. | 12/13/23 | | | 11,119,659 | | | $ | 13,885 | |
Aspect Software, Inc. | 07/15/23 | | | 2,046 | | | | 16 | |
CapStone Acquisition Holdings, Inc. | 10/29/27 | | | 1,216,000 | | | | 11,450 | |
CTL Logistics | 08/10/42 | | | 2,993,414 | | | | 216,054 | |
FCG Acquisitions, Inc | 03/16/28 | | | 320,000 | | | | 2,000 | |
HAH Group Holding Co. LLC | 10/29/27 | | | 2,223,216 | | | | 31,261 | |
Higginbotham | 11/25/22 | | | 5,293,642 | | | | 32,582 | |
Hillman Group, Inc. | 02/24/28 | | | 2,531,646 | | | | 6,242 | |
Jones Deslauriers Insurance Management, Inc. | 03/12/28 | | CAD | 1,905,000 | | | | — | |
MB2 Dental Solutions LLC | 01/29/27 | | | 14,313,520 | | | | 139,145 | |
National Mentor Holdings, Inc. | 02/18/28 | | | 1,609,942 | | | | 7,921 | |
Peraton Corp. | 02/22/28 | | | 21,585,093 | | | | 106,404 | |
SCP Eye Care Services LLC | 03/11/28 | | | 1,270,455 | | | | 1,588 | |
Service Logic Acquisition, Inc. | 10/22/27 | | | 2,472,537 | | | | 23,191 | |
Southern Veterinary Partners LLC | 10/05/27 | | | 2,696,970 | | | | 25,102 | |
Team.Blue Finco SARL | 03/18/28 | | EUR | 1,229,730 | | | | 6,128 | |
TricorBraun Holdings, Inc. | 03/03/28 | | | 1,340,168 | | | | 13,965 | |
Venture Global Calcasieu Pass LLC | 08/19/26 | | | 12,522,252 | | | | 688,724 | |
Zephyr Bidco Ltd. | 04/08/22 | | GBP | 23,950,000 | | | | 3 | |
| | | | | | | | $ | 1,325,661 | |
* | The face amount is denominated in U.S. dollars unless otherwise indicated. |
| | THE GUGGENHEIM FUNDS SEMI-ANNUAL REPORT | 121 |
NOTES TO FINANCIAL STATEMENTS (Unaudited)(continued) |
Note 10– Restricted Securities
The securities below are considered illiquid and restricted under guidelines established by the Board:
Restricted Securities | Acquisition
Date | | Cost | | | Value | |
Airplanes Pass Through Trust | | | | | | | | | |
2001-1A, 1.26% (1 Month USD LIBOR + 0.55%, Rate Floor: 0.55%) due 03/15/192 | 11/30/11 | | $ | 335,966 | | | $ | 41 | |
Atlas Mara Ltd. | | | | | | | | | |
8.00% due 03/20/21 | 10/01/15 | | | 6,587,865 | | | | 3,199,680 | |
Cascade Funding Mortgage Trust | | | | | | | | | |
2018-RM2, 4.00% (WAC) due 10/25/681 | 11/02/18 | | | 14,774,409 | | | | 15,425,992 | |
Cascade Funding Mortgage Trust | | | | | | | | | |
2019-RM3, 2.80% (WAC) due 06/25/691 | 06/25/19 | | | 11,319,687 | | | | 11,574,305 | |
Central Storage Safety Project Trust | | | | | | | | | |
4.82% due 02/01/38 | 02/02/18 | | | 21,182,804 | | | | 21,805,814 | |
Copper River CLO Ltd. | | | | | | | | | |
2007-1A, due 01/20/213 | 05/09/14 | | | 42,900 | | | | 44,190 | |
FKRT | | | | | | | | | |
2020-C2A, 3.25% due 12/30/23 | 12/03/20 | | | 113,992,874 | | | | 114,064,710 | |
LSTAR Securities Investment Ltd. | | | | | | | | | |
2021-1, 1.92% (1 Month USD LIBOR + 1.80%, Rate Floor: 1.80%) due 02/01/261 | 02/04/21 | | | 75,462,614 | | | | 75,666,061 | |
LSTAR Securities Investment Ltd. | | | | | | | | | |
2021-2, 1.82% (1 Month USD LIBOR + 1.70%, Rate Floor: 1.70%) due 03/02/261 | 03/17/21 | | | 39,789,480 | | | | 39,761,962 | |
Princess Juliana International Airport Operating Company N.V. | | | | | | | | | |
5.50% due 12/20/27 | 12/17/12 | | | 1,787,046 | | | | 1,604,154 | |
Putnam Structured Product Funding Ltd. | | | | | | | | | |
2003-1A, 1.18% (1 Month USD LIBOR + 1.00%, Rate Floor: 0.00%) due 10/15/381 | 06/01/16 | | | 1,321,213 | | | | 1,408,407 | |
Station Place Securitization Trust | | | | | | | | | |
2020-WL1, 2.36% (1 Month USD LIBOR + 2.25%, Rate Floor: 0.00%) due 06/25/511 | 07/15/20 | | | 3,000,000 | | | | 3,000,000 | |
Station Place Securitization Trust | | | | | | | | | |
2020-5, 0.92% (1 Month USD LIBOR + 1.00%, Rate Floor: 0.00%) due 05/24/221 | 05/13/20 | | | 20,000,000 | | | | 20,000,000 | |
Station Place Securitization Trust | | | | | | | | | |
2020-WL1, 2.86% (1 Month USD LIBOR + 2.75%, Rate Floor: 0.00%) due 06/25/511 | 07/15/20 | | | 10,000,000 | | | | 10,000,000 | |
122 | THE GUGGENHEIM FUNDS SEMI-ANNUAL REPORT | |
NOTES TO FINANCIAL STATEMENTS (Unaudited)(continued) |
Restricted Securities | Acquisition
Date | | Cost | | | Value | |
Turbine Engines Securitization Ltd. | | | | | | | | | |
2013-1A, 5.13% due 12/13/48 | 11/27/13 | | $ | 691,092 | | | $ | 555,547 | |
| | | | $ | 320,287,950 | | | $ | 318,110,863 | |
1 | Variable rate security. Rate indicated is the rate effective at March 31, 2021. In some instances, the effective rate is limited by a minimum rate floor or a maximum rate cap established by the issuer. The settlement status of a position may also impact the effective rate indicated. In some cases, a position may be unsettled at period end and may not have a stated effective rate. In instances where multiple underlying reference rates and spread amounts are shown, the effective rate is based on a weighted average. |
2 | Security is in default of interest and/or principal obligations. |
3 | Security has no stated coupon. However, it is expected to receive residual cash flow payments on defined deal dates. |
Note 11 – Line of Credit
The Trust, along with other affiliated trusts, secured a 364-day committed, $1,230,000,000 line of credit from Citibank, N.A., which was in place through October 2, 2020, at which time the line of credit was renewed. A Fund may draw (borrow) from the line of credit as a temporary measure for emergency purposes, to facilitate redemption requests, or for other short-term liquidity purposes consistent with the Fund’s investment objective and program. For example, it may be advantageous for the Fund to borrow money rather than sell existing portfolio positions to meet redemption requests. Fees related to borrowings, if any, vary under this arrangement between the greater of Citibank’s “base rate”, LIBOR plus 1%, or the federal funds rate plus 1/2 of 1%.
The commitment fee that may be paid by the Fund is at an annualized rate of 0.15% of the average daily amount of its allocated unused commitment amount. The commitment fee amount is allocated to the individual Funds based on the respective net assets of each participating Fund and is referenced in the Statement of Operations under “Line of credit fees”. The Fund did not have any borrowings under this agreement as of and for the period ended March 31, 2021.
Note 12 – COVID-19
The global ongoing crisis caused by the outbreak of COVID-19 and the current recovery underway is causing disruption to consumer demand and economic output and supply chains. There are still travel restrictions and quarantines, and adverse impacts on local and global economies. Investors should be aware that in light of the current uncertainty, volatility and distress in economies, the financial markets, and labor and public health conditions around the world, the Fund’s investments and shareholder’s investment in the Fund are subject to sudden and substantial losses, increased volatility and other adverse events. Firms through which investors invest with the Fund, the Fund, its service providers, the markets in which it invests and market intermediaries are also impacted by quarantines and similar measures intended to respond to and contain the ongoing pandemic, which can obstruct their functioning and subject them to heightened operational and other risks.
| | THE GUGGENHEIM FUNDS SEMI-ANNUAL REPORT | 123 |
NOTES TO FINANCIAL STATEMENTS (Unaudited)(concluded) |
Note 13 – Subsequent Events
The Fund evaluated subsequent events through the date the financial statements were available for issue and determined there were no material events that would require adjustment to or disclosure in the Fund’s financial statements.
124 | THE GUGGENHEIM FUNDS SEMI-ANNUAL REPORT | |
OTHER INFORMATION (Unaudited) |
Delivery of Shareholder Reports
Paper copies of the Fund’s annual and semi-annual shareholder reports are not sent by mail, unless you specifically request paper copies of the reports from a fund or from your financial intermediary. Instead, the reports are made available on a website, and you are notified by mail each time a report is posted and provided with a website link to access the report.
You may elect to receive all future shareholder reports in paper free of charge. If you hold shares of a fund directly, you can inform the Fund that you wish to receive paper copies of reports by calling 800.820.0888. If you hold shares of a fund through a financial intermediary, please contact the financial intermediary to make this election. Your election to receive reports in paper may apply to all Guggenheim Funds in which you are invested and may apply to all Guggenheim funds held with your financial intermediary.
Proxy Voting Information
A description of the policies and procedures that the Trust uses to determine how to vote proxies relating to securities held in the Fund’s portfolio is available, without charge and upon request, by calling 800.820.0888. This information is also available from the EDGAR database on the SEC’s website at https://www.sec.gov.
Information regarding how the Fund voted proxies relating to portfolio securities during the most recent 12-month period ended June 30 is available without charge, upon request, by calling 800.820.0888. This information is also available from the EDGAR database on the SEC’s website at https://www.sec.gov.
Sector Classification
Information in the Schedule of Investments is categorized by sectors using sector-level Classifications defined by the Bloomberg Industry Classification System, a widely recognized industry classification system provider. The Fund’s registration statement has investment policies relating to concentration in specific sectors/industries. For purposes of these investment policies, the Fund usually classifies sectors/industries based on industry-level Classifications used by widely recognized industry classification system providers such as Bloomberg Industry Classification System, Global Industry Classification Standards and Barclays Global Classification Scheme.
Quarterly Portfolio Schedules Information
The Trust files its complete schedule of portfolio holdings with the SEC for the first and third quarters of each fiscal year as an exhibit to its reports on Form N-PORT, and for reporting periods ended prior to March 31, 2019, filed such information on Form N-Q. The Fund’s Forms N-PORT and N-Q are available on the SEC’s website at https://www.sec.gov. Copies of the portfolio holdings are also available to shareholders, without charge and upon request, by calling 800.820.0888.
| | THE GUGGENHEIM FUNDS SEMI-ANNUAL REPORT | 125 |
INFORMATION ON BOARD OF TRUSTEES AND OFFICERS (Unaudited) |
A Board of Trustees oversees the Trust, as well as other trusts of GI, in which its members have no stated term of service, and continue to serve after election until resignation. The Statement of Additional Information includes further information about Fund Trustees and Officers, and can be obtained without charge by visiting guggenheiminvestments.com or by calling 800.820.0888.
Name, Address*
and Year of Birth | Position(s)
Held with
Trust | Term of Office
and Length of
Time Served** | Principal Occupation(s)
During Past Five Years | Number of
Portfolios
in Fund
Complex
Overseen | Other
Directorships Held
by Trustees*** |
INDEPENDENT TRUSTEES | | | |
Randall C. Barnes (1951) | Trustee and Chair of the Valuation Oversight Committee | Since 2014 (Trustee) Since 2020 (Chair of the Valuation Oversight Committee) | Current: Private Investor (2001-present). Former: Senior Vice President and Treasurer, PepsiCo, Inc. (1993-1997); President, Pizza Hut International (1991-1993); Senior Vice President, Strategic Planning and New Business Development, PepsiCo, Inc. (1987-1990). | 157 | Current: Purpose Investments Funds (2013-present). Former: Managed Duration Investment Grade Municipal Fund (2006-2016). |
Angela Brock-Kyle (1959) | Trustee | Since 2019 | Current: Founder and Chief Executive Officer, B.O.A.R.D.S. (2013-present).
Former: Senior Leader, TIAA (1987-2012). | 156 | Current: Bowhead Insurance GP, LLC (2020-present); Hunt Companies, Inc. (2019-present).
Former: Infinity Property & Casualty Corp. (2014-2018). |
Thomas F. Lydon, Jr. (1960) | Trustee and Chair of the Contracts Review Committee | Since 2019 (Trustee) Since 2020 (Chair of the Contracts Review Committee) | Current: President, Global Trends Investments (1996-present); Co-Chief Executive Officer, ETF Flows, LLC (2019-present); Chief Executive Officer, Lydon Media (2016-present). | 156 | Current: US Global Investors (GROW) (1995-present).
Former: Harvest Volatility Edge Trust (3) (2017-2019). |
126 | THE GUGGENHEIM FUNDS SEMI-ANNUAL REPORT | |
INFORMATION ON BOARD OF TRUSTEES AND OFFICERS (Unaudited)(continued) |
Name, Address*
and Year of Birth | Position(s)
Held with
Trust | Term of Office
and Length of
Time Served** | Principal Occupation(s)
During Past Five Years | Number of
Portfolios
in Fund
Complex
Overseen | Other
Directorships Held
by Trustees*** |
INDEPENDENT TRUSTEES - continued | | |
Ronald A. Nyberg (1953) | Trustee and Chair of the Nominating and Governance Committee | Since 2014 | Current: Of Counsel, Momkus LLP (2016-present).
Former: Partner, Nyberg & Cassioppi, LLC (2000-2016); Executive Vice President, General Counsel, and Corporate Secretary, Van Kampen Investments (1982-1999). | 157 | Current: PPM Funds (2) (2018-present); Edward-Elmhurst Healthcare System (2012-present).
Former: Western Asset Inflation-Linked Opportunities & Income Fund (2004-2020); Western Asset Inflation-Linked Income Fund (2003-2020); Managed Duration Investment Grade Municipal Fund (2003-2016). |
Sandra G. Sponem (1958) | Trustee and Chair of the Audit Committee | Since 2019 (Trustee) Since 2020 (Chair of the Audit Committee) | Current: Retired.
Former: Senior Vice President and Chief Financial Officer, M.A. Mortenson-Companies, Inc. (2007-2017). | 156 | Current: SPDR Series Trust (81) (2018-present); SPDR Index Shares Funds (30) (2018-present); SSGA Active Trust (14) (2018-present). Former: SSGA Master Trust (1) (2018-2020). |
| | THE GUGGENHEIM FUNDS SEMI-ANNUAL REPORT | 127 |
INFORMATION ON BOARD OF TRUSTEES AND OFFICERS (Unaudited)(continued) |
Name, Address*
and Year of Birth | Position(s)
Held with
Trust | Term of Office
and Length of
Time Served** | Principal Occupation(s)
During Past Five Years | Number of
Portfolios
in Fund
Complex
Overseen | Other
Directorships Held
by Trustees*** |
INDEPENDENT TRUSTEES - concluded | | |
Ronald E.
Toupin, Jr. (1958) | Trustee, Chair of the Board and Chair of the Executive Committee | Since 2014 | Current: Portfolio Consultant (2010-present); Member, Governing Council, Independent Directors Council (2013-present); Governor, Board of Governors, Investment Company Institute (2018-present).
Former: Member, Executive Committee, Independent Directors Council (2016-2018); Vice President, Manager and Portfolio Manager, Nuveen Asset Management (1998-1999); Vice President, Nuveen Investment Advisory Corp. (1992-1999); Vice President and Manager, Nuveen Unit Investment Trusts (1991-1999); and Assistant Vice President and Portfolio Manager, Nuveen Unit Investment Trusts (1988-1999), each of John Nuveen & Co., Inc. (1982-1999). | 156 | Former: Western Asset Inflation-Linked Opportunities & Income Fund (2004-2020); Western Asset Inflation-Linked Income Fund (2003-2020); Managed Duration Investment Grade Municipal Fund (2003-2016). |
128 | THE GUGGENHEIM FUNDS SEMI-ANNUAL REPORT | |
INFORMATION ON BOARD OF TRUSTEES AND OFFICERS (Unaudited)(continued) |
Name, Address*
and Year of Birth | Position(s)
Held with
Trust | Term of Office
and Length of
Time Served** | Principal Occupation(s)
During Past Five Years | Number of
Portfolios
in Fund
Complex
Overseen | Other
Directorships Held
by Trustees*** |
INTERESTED TRUSTEE | |
Amy J. Lee**** (1961) | Trustee, Vice President and Chief Legal Officer | Since 2018 (Trustee) Since 2014 (Chief Legal Officer) Since 2007 (Vice President) | Current: Interested Trustee, certain other funds in the Fund Complex (2018-present); Chief Legal Officer, certain other funds in the Fund Complex (2014-present); Vice President, certain other funds in the Fund Complex (2007-present); Senior Managing Director, Guggenheim Investments (2012-present).
Former: President and Chief Executive Officer, certain other funds in the Fund Complex (2017-2019); Vice President, Associate General Counsel and Assistant Secretary, Security Benefit Life Insurance Company and Security Benefit Corporation (2004-2012). | 156 | None. |
* | The business address of each Trustee is c/o Guggenheim Investments, 227 West Monroe Street, Chicago, Illinois 60606. |
** | Each Trustee serves an indefinite term, until his or her successor is elected and qualified. Time served includes time served in the respective position for the Predecessor Corporation. |
*** | Each Trustee also serves on the Boards of Trustees of Guggenheim Funds Trust, Guggenheim Variable Funds Trust, Guggenheim Strategy Funds Trust, Fiduciary/Claymore Energy Infrastructure Fund, Guggenheim Taxable Municipal Bond & Investment Grade Debt Trust, Guggenheim Strategic Opportunities Fund, Guggenheim Enhanced Equity Income Fund, Guggenheim Energy & Income Fund, Guggenheim Credit Allocation Fund, Rydex Series Funds, Rydex Dynamic Funds, Rydex Variable Trust and Transparent Value Trust. Messrs. Barnes and Nyberg also serve on the Board of Trustees of Advent Convertible & Income Fund. |
**** | This Trustee is deemed to be an “interested person” of the Fund under the 1940 Act by reason of her position with the Fund’s Investment Manager and/or the parent of the Investment Manager. |
| | THE GUGGENHEIM FUNDS SEMI-ANNUAL REPORT | 129 |
INFORMATION ON BOARD OF TRUSTEES AND OFFICERS (Unaudited)(continued) |
Name, Address*
and Year of Birth | Position(s)
Held with
Trust | Term of Office
and Length of
Time Served** | Principal Occupation(s)
During Past Five Years |
OFFICERS | | | |
Brian E. Binder (1972) | President and Chief Executive Officer | Since 2018 | Current: President and Chief Executive Officer, certain other funds in the Fund Complex (2018-present); President, Chief Executive Officer and Chairman of the Board of Managers, Guggenheim Funds Investment Advisors, LLC (2018-present); President and Chief Executive Officer, Security Investors, LLC (2018-present); Board Member of Guggenheim Partners Fund Management (Europe) Limited (2018-present); Senior Managing Director and Chief Administrative Officer, Guggenheim Investments (2018-present).
Former: Managing Director and President, Deutsche Funds, and Head of US Product, Trading and Fund Administration, Deutsche Asset Management (2013-2018); Managing Director, Head of Business Management and Consulting, Invesco Ltd. (2010-2012). |
James M. Howley (1972) | Assistant Treasurer | Since 2014 | Current: Managing Director, Guggenheim Investments (2004-present); Assistant Treasurer, certain other funds in the Fund Complex (2006-present).
Former: Manager, Mutual Fund Administration of Van Kampen Investments, Inc. (1996-2004). |
Mark E. Mathiasen (1978) | Secretary | Since 2014 | Current: Secretary, certain other funds in the Fund Complex (2007-present); Managing Director, Guggenheim Investments (2007-present). |
Glenn McWhinnie (1969) | Assistant Treasurer | Since 2016 | Current: Vice President, Guggenheim Investments (2009-present); Assistant Treasurer, certain other funds in the Fund Complex (2016-present). |
Michael P. Megaris (1984) | Assistant Secretary | Since 2014 | Current: Assistant Secretary, certain other funds in the Fund Complex (2014-present); Director, Guggenheim Investments (2012-present). |
Elisabeth Miller (1968) | Chief Compliance Officer | Since 2012 | Current: Chief Compliance Officer, certain other funds in the Fund Complex (2012-present); Senior Managing Director, Guggenheim Investments (2012-present). Vice President, Guggenheim Funds Distributors, LLC (2014-present).
Former: Chief Compliance Officer, Security Investors, LLC and Guggenheim Funds Investment Advisors, LLC (2012-2018); Chief Compliance Officer, Guggenheim Distributors, LLC (2009-2014); Senior Manager, Security Investors, LLC (2004-2014); Senior Manager, Guggenheim Distributors, LLC (2004-2014). |
130 | THE GUGGENHEIM FUNDS SEMI-ANNUAL REPORT | |
INFORMATION ON BOARD OF TRUSTEES AND OFFICERS (Unaudited)(continued) |
Name, Address*
and Year of Birth | Position(s)
Held with
Trust | Term of Office
and Length of
Time Served** | Principal Occupation(s)
During Past Five Years |
OFFICERS - continued | |
Margaux Misantone (1978) | AML Officer | Since 2017 | Current: Chief Compliance Officer, Security Investors, LLC and Guggenheim Funds Investment Advisors, LLC (2018-present); AML Officer, Security Investors, LLC and certain other funds in the Fund Complex (2017-present); Managing Director, Guggenheim Investments (2015-present).
Former: Assistant Chief Compliance Officer, Security Investors, LLC and Guggenheim Funds Investments Advisors, LLC (2015-2018). |
Kimberly J. Scott (1974) | Assistant Treasurer | Since 2014 | Current: Director, Guggenheim Investments (2012-present); Assistant Treasurer, certain other funds in the Fund Complex (2012-present).
Former: Financial Reporting Manager, Invesco, Ltd. (2010-2011); Vice President/Assistant Treasurer, Mutual Fund Administration for Van Kampen Investments, Inc./Morgan Stanley Investment Management (2009-2010); Manager of Mutual Fund Administration, Van Kampen Investments, Inc./Morgan Stanley Investment Management (2005-2009). |
Bryan Stone (1979) | Vice President | Since 2014 | Current: Vice President, certain other funds in the Fund Complex (2014-present); Managing Director, Guggenheim Investments (2013-present).
Former: Senior Vice President, Neuberger Berman Group LLC (2009-2013); Vice President, Morgan Stanley (2002-2009). |
John L. Sullivan (1955) | Chief Financial Officer, Chief Accounting Officer and Treasurer | Since 2014 | Current: Chief Financial Officer, Chief Accounting Officer and Treasurer, certain other funds in the Fund Complex (2010-present); Senior Managing Director, Guggenheim Investments (2010-present).
Former: Managing Director and Chief Compliance Officer, each of the funds in the Van Kampen Investments fund complex (2004-2010); Managing Director and Head of Fund Accounting and Administration, Morgan Stanley Investment Management (2002-2004); Chief Financial Officer and Treasurer, Van Kampen Funds (1996-2004). |
| | THE GUGGENHEIM FUNDS SEMI-ANNUAL REPORT | 131 |
INFORMATION ON BOARD OF TRUSTEES AND OFFICERS (Unaudited)(concluded) |
Name, Address*
and Year of Birth | Position(s)
Held with
Trust | Term of Office
and Length of
Time Served** | Principal Occupation(s)
During Past Five Years |
OFFICERS - concluded | |
Jon Szafran (1989) | Assistant Treasurer | Since 2017 | Current: Vice President, Guggenheim Investments (2017-present); Assistant Treasurer, certain other funds in the Fund Complex (2017-present).
Former: Assistant Treasurer of Henderson Global Funds and Manager of US Fund Administration, Henderson Global Investors (North America) Inc. (“HGINA”), (2017); Senior Analyst of US Fund Administration, HGINA (2014–2017); Senior Associate of Fund Administration, Cortland Capital Market Services, LLC (2013-2014); Experienced Associate, PricewaterhouseCoopers LLP (2012-2013). |
* | The business address of each officer is c/o Guggenheim Investments, 227 West Monroe Street, Chicago, Illinois 60606. |
** | Each officer serves an indefinite term, until his or her successor is duly elected and qualified. |
132 | THE GUGGENHEIM FUNDS SEMI-ANNUAL REPORT | |
GUGGENHEIM INVESTMENTS PRIVACY NOTICE (Unaudited) |
Who We Are
This Privacy Notice describes the data protection practices of Guggenheim Investments. Guggenheim Investments as used herein refers to the affiliated investment management businesses of Guggenheim Partners, LLC: Guggenheim Funds Investment Advisors, LLC, Guggenheim Partners Investment Management, LLC, Guggenheim Funds Distributors, LLC, Security Investors, LLC, Guggenheim Investment Advisors (Europe) Limited, Guggenheim Real Estate, LLC, GS Gamma Advisors, LLC, Guggenheim Partners India Management, LLC, Guggenheim Partners Europe Limited, as well as the funds in the Guggenheim Funds complex (the “Funds”) (“Guggenheim Investments,” “we,” “us,” or “our”).
Guggenheim Partners Investment Management Holdings, LLC, located at 330 Madison Avenue, New York, New York 10017 is the data controller for your information. The affiliates who are also controllers of certain of your information are: Guggenheim Investment Advisors (Europe) Limited, Guggenheim Partners Europe Limited, Guggenheim Partners, LLC, Guggenheim Funds Investment Advisors, LLC, Guggenheim Partners Investment Management, LLC, Guggenheim Funds Distributors, LLC and Security Investors, LLC, as well as the Funds.
Our Commitment to You
Guggenheim Investments considers your privacy our utmost concern. When you become our client or investor, you entrust us with not only your hard-earned money but also with your personal and financial information. Because we have access to your private information, we hold ourselves to the highest standards in its safekeeping and use. We strictly limit how we share your information with others, whether you are a current or former Guggenheim Investments client or investor.
The Information We Collect About You
We collect certain nonpublic personal information about you from information you provide on applications, other forms, our website, and/or from third parties including investment advisors. This information includes Social Security or other tax identification number, assets, income, tax information, retirement and estate plan information, transaction history, account balance, payment history, bank account information, marital status, family relationships, information that we collect on our website through the use of “cookies,” and other personal information that you or others provide to us. We may also collect such information through your inquiries by mail, e-mail or telephone. We may also collect customer due diligence information, as required by applicable law and regulation, through third party service providers.
How We Handle Your Personal Information
The legal basis for using your information as set out in this Privacy Notice is as follows: (a) use of your personal data is necessary to perform our obligations under any contract with you (such as a contract for us to provide financial services to you); or (b) where use of your personal data is not necessary for performance of a contract, use of your personal data is necessary for our
| | THE GUGGENHEIM FUNDS SEMI-ANNUAL REPORT | 133 |
GUGGENHEIM INVESTMENTS PRIVACY NOTICE (Unaudited)(continued) |
legitimate interests or the legitimate interests of others (for example, to enforce the legal terms governing our services, operate and market our website and other services we offer, ensure safe environments for our personnel and others, make and receive payments, prevent fraud and to know the customer to whom we are providing the services). Some processing is done to comply with applicable law.
In addition to the specific uses described above, we also use your information in the following manner:
| | ● | We use your information in connection with servicing your accounts. |
| | ● | We use information to respond to your requests or questions. For example, we might use your information to respond to your customer feedback. |
| | ● | We use information to improve our products and services. We may use your information to make our website and products better. We may use your information to customize your experience with us. |
| | ● | We use information for security purposes. We may use your information to protect our company and our customers. |
| | ● | We use information to communicate with you. For example, we will communicate with you about your account or our relationship. We may contact you about your feedback. We might also contact you about this Privacy Notice. We may also enroll you in our email newsletter. |
| | ● | We use information as otherwise permitted by law, as we may notify you. |
| | ● | Aggregate/Anonymous Data. We may aggregate and/or anonymize any information collected through the website so that such information can no longer be linked to you or your device (“Aggregate/Anonymous Information”). We may use Aggregate/Anonymous Information for any purpose, including without limitation for research and marketing purposes, and may also share such data with any third parties, including advertisers, promotional partners, and sponsors. |
We do not sell information about current or former clients or their accounts to third parties. Nor do we share this information, except when necessary to complete transactions at your request, to make you aware of investment products and services that we or our affiliates offer, or as permitted or required by law.
We provide information about you to companies and individuals not affiliated with Guggenheim Investments to complete certain transactions or account changes, or to perform services for us related to your account. For example, if you ask to transfer assets from another financial institution to Guggenheim Investments, we must provide certain information about you to that company to complete the transaction. We provide the third party with only the information necessary to carry out its responsibilities and only for that purpose. And we require these third
134 | THE GUGGENHEIM FUNDS SEMI-ANNUAL REPORT | |
GUGGENHEIM INVESTMENTS PRIVACY NOTICE (Unaudited)(continued) |
parties to treat your private information with the same high degree of confidentiality that we do. To alert you to other Guggenheim Investments products and services, we share your information within our family of affiliated companies. You may limit our sharing with affiliated companies as set out below. We may also share information with any successor to all or part of our business, or in connection with steps leading up to a merger or acquisition. For example, if part of our business was sold we may give customer information as part of that transaction. We may also share information about you with your consent.
We will release information about you if you direct us to do so, if we are compelled by law to do so, or in other circumstances as permitted by law (for example, to protect your account from fraud).
If you close your account(s) or become an inactive client or investor, we will continue to adhere to the privacy policies and practices described in this notice.
Opt-Out Provisions and Your Data Choices
The law allows you to “opt out” of certain kinds of information sharing with third parties. We do not share personal information about you with any third parties that triggers this opt-out right. This means YOU ARE ALREADY OPTED OUT.
When you are no longer our client or investor, we continue to share your information as described in this notice, and you may contact us at any time to limit our sharing by sending an email to CorporateDataPrivacy@GuggenheimPartners.com.
European Union Data Subjects and certain others: In addition to the choices set forth above, residents of the European Union and certain other jurisdictions have certain rights to (1) request access to or rectification or deletion of information we collect about them, (2) request a restriction on the processing of their information, (3) object to the processing of their information, or (4) request the portability of certain information. To exercise these or other rights, please contact us using the contact information below. We will consider all requests and provide our response within the time period stated by applicable law. Please note, however, that certain information may be exempt from such requests in some circumstances, which may include if we need to keep processing your information for our legitimate interests or to comply with a legal obligation. We may request you provide us with information necessary to confirm your identity before responding to your request.
Residents of France and certain other jurisdictions may also provide us with instructions regarding the manner in which we may continue to store, erase and share your information after your death, and where applicable, the person you have designated to exercise these rights after your death.
How We Protect Privacy Online
We take steps to protect your privacy when you use our web site – www.guggenheiminvestments.com – by using secure forms of online communication, including encryption technology, Secure Socket Layer (SSL) protocol, firewalls and user names and passwords. These safeguards vary based on the
| | THE GUGGENHEIM FUNDS SEMI-ANNUAL REPORT | 135 |
GUGGENHEIM INVESTMENTS PRIVACY NOTICE (Unaudited)(concluded) |
sensitivity of the information that we collect and store. However, we cannot and do not guarantee that these measures will prevent every unauthorized attempt to access, use, or disclose your information since despite our efforts, no Internet and/or other electronic transmissions can be completely secure. Our web site uses “http cookies”—tiny pieces of information that we ask your browser to store. We use cookies for session management and security features on the Guggenheim Investments web site. We do not use them to pull data from your hard drive, to learn your e-mail address, or to view data in cookies created by other web sites. We will not share the information in our cookies or give others access to it. See the legal information area on our web site for more details about web site security and privacy features.
How We Safeguard Your Personal Information and Data Retention
We restrict access to nonpublic personal information about you to our employees and in some cases to third parties (for example, the service providers described above) as permitted by law. We maintain strict physical, electronic and procedural safeguards that comply with federal standards to guard your nonpublic personal information.
We keep your information for no longer than necessary for the purposes for which it is processed. The length of time for which we retain information depends on the purposes for which we collected and use it and/or as required to comply with applicable laws. Information may persist in copies made for backup and business continuity purposes for additional time.
International Visitors
If you are not a resident of the United States, please be aware that your information may be transferred to, stored and processed in the United States where our servers are located and our databases are operated. The data protection and other laws of the United States and other countries might not be as comprehensive as those in your country.
In such cases, we ensure that a legal basis for such a transfer exists and that adequate protection is provided as required by applicable law, for example, by using standard contractual clauses or by transferring your data to a jurisdiction that has obtained an adequacy finding. Individuals whose data may be transferred on the basis of standard contractual clauses may contact us as described below.
We’ll Keep You Informed
If you have any questions or concerns about how we treat your personal data, we encourage you to consult with us first. You may also contact the relevant supervisory authority.
We reserve the right to modify this policy at any time and will inform you promptly of material changes. You may access our privacy policy from our web site at www.guggenheiminvestments.com. Should you have any questions regarding our privacy policy, contact us by email at CorporateDataPrivacy@GuggenheimPartners.com.
136 | THE GUGGENHEIM FUNDS SEMI-ANNUAL REPORT | |
This page intentionally left blank.
3.31.2021
Guggenheim Funds Semi-Annual Report
| |
Guggenheim Ultra Short Duration Fund | | |
GuggenheimInvestments.com | USD-SEMI-0321x0921 |

| | |
DEAR SHAREHOLDER | 2 |
ECONOMIC AND MARKET OVERVIEW | 4 |
ABOUT SHAREHOLDERS’ FUND EXPENSES | 7 |
ULTRA SHORT DURATION FUND | 10 |
NOTES TO FINANCIAL STATEMENTS | 45 |
OTHER INFORMATION | 66 |
INFORMATION ON BOARD OF TRUSTEES AND OFFICERS | 67 |
GUGGENHEIM INVESTMENTS PRIVACY NOTICE | 74 |
| | THE GUGGENHEIM FUNDS SEMI-ANNUAL REPORT | 1 |
Dear Shareholder:
Guggenheim Partners Investment Management, LLC (the “Investment Manager”) is pleased to present the shareholder report for Guggenheim Ultra Short Duration Fund (the “Fund”) for the semi-annual period ended March 31, 2021.
The Investment Manager is responsible for the management of the Funds’ portfolio of investments. It is an affiliate of Guggenheim Partners, LLC (“Guggenheim”), a global diversified financial services firm.
Guggenheim Funds Distributors, LLC is the distributor of the Funds. Guggenheim Funds Distributors, LLC is affiliated with Guggenheim Partners, LLC and the Investment Manager.
We encourage you to read the Economic and Market Overview section of the report, which follows this letter.
We are committed to providing innovative investment solutions and appreciate the trust you place in us.
Sincerely,
Guggenheim Partners Investment Management, LLC
April 30, 2021
Read a prospectus and summary prospectus (if available) carefully before investing. It contains the investment objectives, risks, charges, expenses and other information, which should be considered carefully before investing. Obtain a prospectus and summary prospectus (if available) at guggenheiminvestments.com or call 800.820.0888.
This material is not intended as a recommendation or as investment advice of any kind, including in connection with rollovers, transfers, and distributions. Such material is not provided in a fiduciary capacity, may not be relied upon for or in connection with the making of investment decisions, and does not constitute a solicitation of an offer to buy or sell securities. All content has been provided for informational or educational purposes only and is not intended to be and should not be construed as legal or tax advice and/or a legal opinion. Always consult a financial, tax and/or legal professional regarding your specific situation.
COVID-19. The global ongoing crisis caused by the outbreak of COVID-19 and the current recovery underway is causing disruption to consumer demand and economic output and supply chains. There are still travel restrictions and quarantines, and adverse impacts on local and global economies. Investors should be aware that in light of the current uncertainty, volatility and distress in economies, financial markets, and labor and public health conditions around the world, the Fund’s investments and a shareholder’s investment in the Fund are subject to investment risk, including the possible loss of the entire principal amount invested. Firms through which investors invest with the Fund, the Fund, its service providers, the markets in which it invests and market intermediaries are also impacted by quarantines and similar measures intended to respond to and contain the ongoing pandemic, which can obstruct their functioning and subject them to heightened operational and other risks.
2 | THE GUGGENHEIM FUNDS SEMI-ANNUAL REPORT | |
Ultra Short Duration Fund may not be suitable for all investors. The investments in fixed-income instruments are subject to the possibility that interest rates could rise, causing the value of the holdings and share price to decline. Investors in asset- backed securities, including collateralized loan obligations (CLOs) generally receive payments that are part interest and part return of principal. These payments may vary based on the rate loans are repaid. Some asset-backed securities may have structures that make their reaction to interest rates and other factors difficult to predict, making their prices volatile and they are subject to liquidity and valuation risk. CLOs bear similar risks to investing in loans directly. Investments in loans involve special types of risks, including credit, interest rate, counterparty, prepayment, liquidity, and valuation risks. Loans are often below investment grade, may be unrated, and typically offer a fixed or floating interest rate. High yield and unrated debt securities are at a greater risk of default than investment grade bonds and may be less liquid, which may increase volatility. The use of leverage, through borrowings or instruments such as derivatives, may cause the Fund to be more volatile and riskier than if it had not been leveraged. The more a fund invests in leveraged instruments, the more the leverage will magnify any gains or losses on those investments. Foreign securities carry unique or additional risks when compared to U.S. securities, including currency fluctuations, adverse political and economic developments, unreliable or untimely information, less liquidity and more volatility, limited legal recourse and higher transactional costs, all of which are enhanced when investing in emerging markets. In addition, investments in emerging markets are subject to risks associated with trading in smaller markets, lower volumes of trading, and being subject to lower levels of government regulation and less extensive accounting, financial and other reporting requirements. Please read the prospectus for more detailed information regarding these and other risks.
| | THE GUGGENHEIM FUNDS SEMI-ANNUAL REPORT | 3 |
ECONOMIC AND MARKET OVERVIEW (Unaudited) | March 31, 2021 |
For the six-month period ended March 31, 2021, the yield on the two-year U.S. Treasury Note rose 3 basis points1 to 0.16% from 0.13%, and the 10-year U.S. Treasury Note climbed 105 basis points to 1.74% from 0.69%. The spread between the two-year U.S. Treasury Note and 10-year U.S. Treasury Note widened from 56 basis points to 158 basis points as investors repositioned in response to fears of inflationary pressure, which the Federal Reserve (the “Fed”) regards as a transitory, short-term phenomenon. Easy financial conditions and low rates will likely support credit over the next few years. With market optimism pulling forward rate hike expectations and causing bond yields to rise, we view this as an opportunity to add incremental yield to portfolios.
Our 2021 U.S. economic growth forecast increased during the first quarter of 2021 from an annualized 5.5% to over 7%, factoring in more fiscal stimulus than previously anticipated. This forecast captures the effect of stimulus representing roughly 11% of 2020–2021 gross domestic product (“GDP”), versus the previous calculation of about 8%. We see strength in the consumer sector and in housing activity. In addition, U.S. vaccinations for COVID-19 continue to accelerate, nearing 3 million doses per day by the end of the first quarter. More than 213 million doses have been administered in the U.S. so far, and about 35% of the U.S. population has been fully vaccinated. The U.S. is seeing the best-case scenario unfold in its vaccine rollout, but other countries have not been as fortunate.
Europe’s vaccine rollout hit a major speedbump during the first quarter when questions surrounding the safety of the AstraZeneca vaccine led several major European countries to temporarily suspend distribution. Safety concerns, coupled with supply constraints, meant that less than 10% of the populations of Germany, France, and Italy had been vaccinated by the end of the first quarter, well under the pace needed to reach 70% inoculated by summer. Any delay in ending the pandemic on a global scale has implications for other countries too, including the U.S., where travel and hospitality workers represent a large share of the unemployed.
Despite vaccination delays in Europe and its implications abroad, we saw meaningful improvement in the domestic labor market during the first quarter as states moved forward with business re-openings. Seasonally adjusted initial jobless claims fell by 97,000 to 684,000 in the week ending March 20, 2021, the lowest level since the pandemic began, before seeing an uptick the following week to 719,000. We saw more positive news across the board in the March payroll report with 916,000 jobs added, and with 156,000 more from revisions. Standing in the way of additional labor market gains are local government restrictions on certain sectors, although easing of these restrictions is expected by summer.
Economic developments drove a sharp increase in U.S. Treasury yields. The market pulled forward expectations of the next Fed rate hike from December 2023 to December 2022, while repricing the long-run terminal Fed funds rate estimate to 2.25% from just 0.55% last August. We do not expect the Fed to raise interest rates as early as the market is anticipating, even though we expect strong GDP growth in coming years.
4 | THE GUGGENHEIM FUNDS SEMI-ANNUAL REPORT | |
ECONOMIC AND MARKET OVERVIEW (Unaudited)(continued) | March 31, 2021 |
Year-over-year inflation measures will rise over the next several months due to base effects, which may be compounded by supply chain disruptions in the goods sector and potential capacity constraints for certain services. However, these factors could prove to be short-lived, with base effects set to dampen inflation starting in the summer months. Moreover, the Fed is focused on generating sustainably higher inflation. Even if core inflation rises above the Fed’s 2% target in 2021, the Fed’s focus is on a long-term average of 2%. With years of shortfalls to make up, and the Fed now targeting labor market disparities as part of an expanded definition of full employment, we expect policymakers to remain resolutely patient. Any tapering of asset purchases will likely be deferred until later in 2022, with the first rate hike likely to come sometime after that.
For the six-month period ended March 31, 2021, the Standard & Poor’s 500® (“S&P 500®”) Index* returned 19.07%. The MSCI Europe-Australasia-Far East (“EAFE”) Index* returned 20.08%. The return of the MSCI Emerging Markets Index* was 22.43%.
In the bond market, the Bloomberg Barclays U.S. Aggregate Bond Index* posted a -2.73% return for the six-month period, while the Bloomberg Barclays U.S. Corporate High Yield Index* returned 7.36%. The return of the ICE Bank of America (“BofA”) Merrill Lynch 3-Month U.S. Treasury Bill Index* was 0.06% for the six-month period.
The opinions and forecasts expressed may not actually come to pass. This information is subject to change at any time, based on market and other conditions, and should not be construed as a recommendation of any specific security or strategy.
1 | Basis point – one basis point is equal to 0.01%. |
*Index Definitions:
The following indices are referenced throughout this report. Indices are unmanaged and not available for direct investment. Index performance does not reflect transaction costs, fees, or expenses.
Bloomberg Barclays U.S. Aggregate Bond Index is a broad-based flagship benchmark that measures the investment grade, U.S. dollar-denominated, fixed-rate taxable bond market, including U.S. Treasuries, government-related and corporate securities, mortgage-backed securities or “MBS” (agency fixed-rate and hybrid adjustable-rate mortgage, or “ARM”, pass-throughs), asset-backed securities (“ABS”), and commercial mortgage-backed securities (“CMBS”) (agency and non-agency).
Bloomberg Barclays U.S. Corporate High Yield Index measures the U.S. dollar-denominated, high yield, fixed-rate corporate bond market. Securities are classified as high yield if the middle rating of Moody’s, Fitch, and S&P is Ba1/BB +/BB + or below.
Bloomberg Barclays 1-3 Month U.S. Treasury Bill Index includes all publicly issued zero-coupon U.S. Treasury Bills that have a remaining maturity of less than 3 months and more than 1 month, are rated investment grade, and have $250 million or more of outstanding face value. In addition, the securities must be denominated in U.S. dollars and must be fixed rate and nonconvertible. The 1-3 Month U.S. Treasury Bill Index is market capitalization weighted and the securities in the index are updated on the last business day of each month.
ICE BofA Merrill Lynch 3-Month U.S. Treasury Bill Index is an unmanaged market Index of U.S. Treasury securities maturing in 90 days that assumes reinvestment of all income.
| | THE GUGGENHEIM FUNDS SEMI-ANNUAL REPORT | 5 |
ECONOMIC AND MARKET OVERVIEW (Unaudited)(concluded) | March 31, 2021 |
MSCI EAFE Index is a free float-adjusted market capitalization index that is designed to measure the equity market performance of developed markets, excluding the U.S. & Canada.
MSCI Emerging Markets Index is a free float-adjusted market capitalization weighted index that is designed to measure equity market performance in the global emerging markets.
S&P 500® is a broad-based index, the performance of which is based on the performance of 500 widely held common stocks chosen for market size, liquidity, and industry group representation.
6 | THE GUGGENHEIM FUNDS SEMI-ANNUAL REPORT | |
ABOUT SHAREHOLDERS’ FUND EXPENSES (Unaudited) |
All mutual funds have operating expenses, and it is important for our shareholders to understand the impact of costs on their investments. Shareholders of a fund incur two types of costs: (i) transaction costs, including sales charges (loads) on purchase payments, reinvested dividends, other distributions, and exchange fees, and (ii) ongoing costs, including management fees, administrative services, and shareholder reports, among others. These ongoing costs, or operating expenses, are deducted from a fund’s gross income and reduce the investment return of the fund.
A fund’s expenses are expressed as a percentage of its average net assets, which is known as the expense ratio. The following examples are intended to help investors understand the ongoing costs (in dollars) of investing in a fund and to compare these costs with the ongoing costs of investing in other mutual funds.
The examples are based on an investment of $1,000 made at the beginning of the period and held for the entire six-month period beginning September 30, 2020 and ending March 31, 2021.
The following tables illustrate the Fund’s costs in two ways:
Table 1. Based on actual Fund return: This section helps investors estimate the actual expenses paid over the period. The “Ending Account Value” shown is derived from the Fund’s actual return, and the fifth column shows the dollar amount that would have been paid by an investor who started with $1,000 in the Fund. Investors may use the information here, together with the amount invested, to estimate the expenses paid over the period. Simply divide the Fund’s account value by $1,000 (for example, an $8,600 account value divided by $1,000 = 8.6), then multiply the result by the number provided under the heading “Expenses Paid During Period.”
Table 2. Based on hypothetical 5% return: This section is intended to help investors compare a fund’s cost with those of other mutual funds. The table provides information about hypothetical account values and hypothetical expenses based on the Fund’s actual expense ratio and an assumed rate of return of 5% per year before expenses, which is not the Fund’s actual return. The hypothetical account values and expenses may not be used to estimate the actual ending account balance or expenses paid during the period. The example is useful in making comparisons because the U.S. Securities and Exchange Commission (the “SEC”) requires all mutual funds to calculate expenses based on the 5% return. Investors can assess a Fund’s costs by comparing this hypothetical example with the hypothetical examples that appear in shareholder reports of other funds.
The calculations illustrated above assume no shares were bought or sold during the period. Actual costs may have been higher or lower, depending on the amount of investment and the timing of any purchases or redemptions.
| | THE GUGGENHEIM FUNDS SEMI-ANNUAL REPORT | 7 |
ABOUT SHAREHOLDERS’ FUND EXPENSES (Unaudited)(continued) |
Please note that the expenses shown in the table are meant to highlight your ongoing costs only and do not reflect any transactional costs, such as sales charges (loads) on purchase payments, and contingent deferred sales charges (“CDSC”) on redemptions, if any. Therefore, the second table is useful in comparing ongoing costs only, and will not help you determine the relative total costs of owning different funds. In addition, if these transactional costs were included, your costs would have been higher.
More information about the Fund’s expenses, including annual expense ratios for periods up to five years (subject to the Fund’s inception date), can be found in the Financial Highlights section of this report. For additional information on operating expenses and other shareholder costs, please refer to the Fund’s prospectus.
8 | THE GUGGENHEIM FUNDS SEMI-ANNUAL REPORT | |
ABOUT SHAREHOLDERS’ FUND EXPENSES (Unaudited)(concluded) |
| Expense
Ratio1 | Fund
Return | Beginning
Account Value
September 30,
2020 | Ending
Account Value
March 31,
2021 | Expenses
Paid During
Period2 |
Table 1. Based on actual Fund return3 |
A-Class | 0.58% | 0.30% | $ 1,000.00 | $ 1,003.00 | $ 2.90 |
Institutional Class | 0.33% | 0.32% | 1,000.00 | 1,003.20 | 1.65 |
|
Table 2. Based on hypothetical 5% return (before expenses) |
A-Class | 0.58% | 5.00% | $ 1,000.00 | $ 1,022.04 | $ 2.92 |
Institutional Class | 0.33% | 5.00% | 1,000.00 | 1,023.29 | 1.66 |
1 | Annualized and excludes expenses of the underlying funds in which the Fund invests. |
2 | Expenses are equal to the Fund’s annualized expense ratio, net of any applicable fee waivers, multiplied by the average account value over the period, multiplied by 182/365 (to reflect the one-half year period). |
3 | Actual cumulative return at net asset value for the period September 30, 2020 to March 31, 2021. |
| | THE GUGGENHEIM FUNDS SEMI-ANNUAL REPORT | 9 |
PERFORMANCE REPORT AND FUND PROFILE (Unaudited) | March 31, 2021 |
ULTRA SHORT DURATION FUND
OBJECTIVE: Seeks a high level of income consistent with the preservation of capital.
Holdings Diversification (Market Exposure as % of Net Assets)
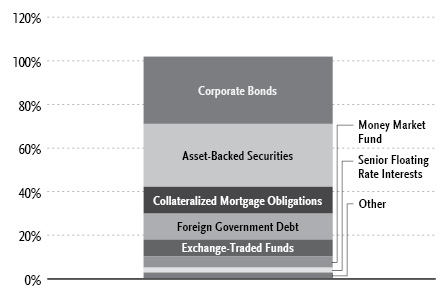
“Holdings Diversification (Market Exposure as % of Net Assets)”
Inception Dates: |
A-Class | November 30, 2018 |
Institutional Class | March 11, 2014 |
Ten Largest Holdings (% of Total Net Assets) |
iShares Core S&P 500 ETF | 4.5% |
iShares Core U.S. Aggregate Bond ETF | 3.1% |
State of Israel, 1.00% | 2.7% |
Kingdom of Spain, (0.51)% | 2.3% |
Province of Ontario, 0.09% | 2.2% |
Republic of France, (0.59)% | 1.9% |
Shackleton CLO Ltd., 1.14% | 1.2% |
Swedbank AB, 0.85% | 1.1% |
CenterPoint Energy Resources Corp., 0.68% | 1.1% |
JPMorgan Chase & Co., 0.70% | 1.0% |
Top Ten Total | 21.1% |
| | |
“Ten Largest Holdings” excludes any temporary cash or derivative investments. |
10 | THE GUGGENHEIM FUNDS SEMI-ANNUAL REPORT | |
PERFORMANCE REPORT AND FUND PROFILE (Unaudited)(continued) | March 31, 2021 |
Portfolio Composition by Quality Rating1 |
Rating | % of Total
Investments |
Fixed Income Instruments | |
AAA | 30.0% |
AA | 10.6% |
A | 21.1% |
BBB | 18.6% |
BB | 2.2% |
B | 1.7% |
NR2 | 3.2% |
Other Instruments | 12.6% |
Total Investments | 100.0% |
1 | Source: BlackRock Solutions. Credit quality ratings are measured on a scale that generally ranges from AAA (highest) to D (lowest). All securities except for those labeled “NR” have been rated by Moody’s, Standard & Poor’s (“S&P”), or Fitch, each of which is a Nationally Recognized Statistical Rating Organization (“NRSRO”). For purposes of this presentation, when ratings are available from more than one agency, the highest rating is used. Guggenheim Investments has converted ratings to the equivalent S&P rating. Security ratings are determined at the time of purchase and may change thereafter. |
2 | NR (not rated) securities do not necessarily indicate low credit quality. |
| | THE GUGGENHEIM FUNDS SEMI-ANNUAL REPORT | 11 |
PERFORMANCE REPORT AND FUND PROFILE (Unaudited)(concluded) | March 31, 2021 |
Average Annual Returns*
Periods Ended March 31, 2021
| 6 Month† | 1 Year | 5 Year | Since
Inception
(03/11/14) |
Institutional Class Shares | 0.32% | 3.13% | 2.18% | 1.78% |
Bloomberg Barclays 1-3 Month U.S. Treasury Bill Index | 0.04% | 0.09% | 1.12% | 0.81% |
| | 6 Month† | 1 Year | Since
Inception
(11/30/18) |
A-Class Shares | | 0.30% | 2.86% | 1.59% |
Bloomberg Barclays 1-3 Month U.S. Treasury Bill Index | | 0.04% | 0.09% | 1.27% |
* | The performance data above represents past performance that is not predictive of future results. The investment return and principal value of an investment in the Fund will fluctuate so that an investor’s shares, when redeemed, may be worth more or less than their original cost. Returns are historical and include changes in principal and reinvested dividends and capital gains and do not reflect the effect of taxes. The Bloomberg Barclays 1-3 Month U.S. Treasury Bill Index is an unmanaged index and, unlike the Fund, has no management fees or operating expenses to reduce its reported return. Prior to November 30, 2018, performance for Institutional Class shares reflects the performance of the Guggenheim Strategy Fund I, which did not charge a management fee and was not publicly offered as a separate investment product. |
† | 6 month returns are not annualized. |
12 | THE GUGGENHEIM FUNDS SEMI-ANNUAL REPORT | |
SCHEDULE OF INVESTMENTS (Unaudited) | March 31, 2021 |
ULTRA SHORT DURATION FUND | |
| | Shares | | | Value | |
EXCHANGE-TRADED FUNDS† - 7.6% |
iShares Core S&P 500 ETF | | | 100,000 | | | $ | 39,782,000 | |
iShares Core U.S. Aggregate Bond ETF1 | | | 243,050 | | | | 27,666,382 | |
Total Exchange-Traded Funds | | | | |
(Cost $67,790,047) | | | | | | | 67,448,382 | |
| | | | | | | | | |
MONEY MARKET FUND† - 5.2% |
Dreyfus Treasury Securities Cash Management Fund — Institutional Shares, 0.01%2 | | | 46,240,865 | | | | 46,240,865 | |
Total Money Market Fund | | | | |
(Cost $46,240,865) | | | | | | | 46,240,865 | |
| | | | | | | | | |
| | | Face
Amount~ | | | | | |
CORPORATE BONDS†† - 30.9% |
Financial - 8.6% | | | | | | | | |
Swedbank AB | | | | | | | | |
0.85% due 03/18/243 | | | 9,550,000 | | | | 9,571,170 | |
JPMorgan Chase & Co. | | | | | | | | |
0.70% due 03/16/244 | | | 9,100,000 | | | | 9,138,238 | |
Charles Schwab Corp. | | | | | | | | |
0.51% (U.S. Secured Overnight Financing Rate + 0.50%) due 03/18/245 | | | 8,850,000 | | | | 8,903,808 | |
Sumitomo Mitsui Trust Bank Ltd. | | | | | | | | |
0.85% due 03/25/243 | | | 8,900,000 | | | | 8,896,992 | |
Sompo International Holdings Ltd. | | | | | | | | |
4.70% due 10/15/22 | | | 5,120,000 | | | | 5,424,135 | |
Credit Suisse AG NY | | | | | | | | |
0.42% (U.S. Secured Overnight Financing Rate + 0.39%) due 02/02/245 | | | 5,250,000 | | | | 5,201,175 | |
Barclays Bank plc | | | | | | | | |
1.70% due 05/12/22 | | | 4,600,000 | | | | 4,663,477 | |
Citizens Bank North America/Providence RI | | | | | | | | |
1.00% (3 Month USD LIBOR + 0.81%) due 05/26/225 | | | 4,215,000 | | | | 4,246,188 | |
Intercontinental Exchange, Inc. | | | | | | | | |
0.83% (3 Month USD LIBOR + 0.65%) due 06/15/235 | | | 1,600,000 | | | | 1,601,341 | |
2.35% due 09/15/22 | | | 1,000,000 | | | | 1,024,625 | |
Svenska Handelsbanken AB | | | | | | | | |
0.65% (3 Month USD LIBOR + 0.47%) due 05/24/215 | | | 2,250,000 | | | | 2,251,649 | |
American Express Co. | | | | | | | | |
0.72% (3 Month USD LIBOR + 0.53%) due 05/17/215 | | | 2,150,000 | | | | 2,150,421 | |
Synchrony Bank | | | | | | | | |
3.65% due 05/24/21 | | | 1,720,000 | | | | 1,723,754 | |
UBS Group AG | | | | | | | | |
2.01% (3 Month USD LIBOR + 1.78%, Rate Floor: 0.00%) due 04/14/213,5 | | | 1,400,000 | | | | 1,400,620 | |
Standard Chartered plc | | | | | | | | |
1.32% due 10/14/233,4 | | | 1,350,000 | | | | 1,358,572 | |
GA Global Funding Trust | | | | | | | | |
1.63% due 01/15/263 | | | 1,300,000 | | | | 1,297,758 | |
SEE NOTES TO FINANCIAL STATEMENTS. | THE GUGGENHEIM FUNDS SEMI-ANNUAL REPORT | 13 |
SCHEDULE OF INVESTMENTS (Unaudited)(continued) | March 31, 2021 |
ULTRA SHORT DURATION FUND | |
| | Face
Amount~ | | | Value | |
Mitsubishi UFJ Financial Group, Inc. | | | | | | | | |
1.01% (3 Month USD LIBOR + 0.79%) due 07/25/225 | | | 950,000 | | | $ | 957,060 | |
1.24% (3 Month USD LIBOR + 1.06%) due 09/13/215 | | | 339,000 | | | | 340,430 | |
Aviation Capital Group LLC | | | | | | | | |
2.88% due 01/20/223 | | | 1,200,000 | | | | 1,217,371 | |
Santander UK plc | | | | | | | | |
0.81% (3 Month USD LIBOR + 0.62%) due 06/01/215 | | | 980,000 | | | | 980,970 | |
Wells Fargo & Co. | | | | | | | | |
4.13% due 08/15/23 | | | 800,000 | | | | 864,494 | |
First American Financial Corp. | | | | | | | | |
4.60% due 11/15/24 | | | 500,000 | | | | 557,294 | |
Nordea Bank Abp | | | | | | | | |
1.13% (3 Month USD LIBOR + 0.94%) due 08/30/233,5 | | | 550,000 | | | | 556,250 | |
Markel Corp. | | | | | | | | |
3.63% due 03/30/23 | | | 450,000 | | | | 476,713 | |
Apollo Management Holdings, LP | | | | | | | | |
4.00% due 05/30/243 | | | 350,000 | | | | 383,619 | |
Australia & New Zealand Banking Group Ltd. | | | | | | | | |
1.18% (3 Month USD LIBOR + 0.99%) due 06/01/213,5 | | | 300,000 | | | | 300,465 | |
Reliance Standard Life Global Funding II | | | | | | | | |
3.85% due 09/19/233 | | | 200,000 | | | | 214,895 | |
Marsh & McLennan Cos., Inc. | | | | | | | | |
4.80% due 07/15/21 | | | 200,000 | | | | 200,087 | |
Total Financial | | | | | | | 75,903,571 | |
| | | | | | | | | |
Industrial - 6.2% | | | | | | | | |
Boeing Co. | | | | | | | | |
1.43% due 02/04/24 | | | 6,550,000 | | | | 6,561,529 | |
1.95% due 02/01/24 | | | 6,000,000 | | | | 6,147,030 | |
Siemens Financieringsmaatschappij N.V. | | | | | | | | |
0.65% due 03/11/243 | | | 7,300,000 | | | | 7,295,199 | |
0.80% (3 Month USD LIBOR + 0.61%) due 03/16/223,5 | | | 1,870,000 | | | | 1,880,936 | |
Ryder System, Inc. | | | | | | | | |
3.35% due 09/01/25 | | | 4,820,000 | | | | 5,203,591 | |
3.75% due 06/09/23 | | | 2,650,000 | | | | 2,824,180 | |
Graphic Packaging International LLC | | | | | | | | |
0.82% due 04/15/243 | | | 6,700,000 | | | | 6,680,178 | |
Teledyne Technologies, Inc. | | | | | | | | |
0.65% due 04/01/23 | | | 4,550,000 | | | | 4,544,260 | |
CNH Industrial Capital LLC | | | | | | | | |
1.95% due 07/02/23 | | | 4,230,000 | | | | 4,343,497 | |
Silgan Holdings, Inc. | | | | | | | | |
1.40% due 04/01/263 | | | 2,350,000 | | | | 2,300,063 | |
Penske Truck Leasing Company LP / PTL Finance Corp. | | | | | | | | |
3.65% due 07/29/213 | | | 1,294,000 | | | | 1,303,831 | |
2.70% due 11/01/243 | | | 900,000 | | | | 947,255 | |
Berry Global, Inc. | | | | | | | | |
0.95% due 02/15/243 | | | 2,150,000 | | | | 2,139,873 | |
Vontier Corp. | | | | | | | | |
1.80% due 04/01/263 | | | 2,150,000 | | | | 2,138,777 | |
Tennant Co. | | | | | | | | |
5.63% due 05/01/25 | | | 150,000 | | | | 154,500 | |
Total Industrial | | | | | | | 54,464,699 | |
| | | | | | | | | |
Consumer, Non-cyclical - 4.9% |
Illumina, Inc. | | | | | | | | |
0.55% due 03/23/23 | | | 8,800,000 | | | | 8,792,256 | |
AmerisourceBergen Corp. | | | | | | | | |
0.74% due 03/15/23 | | | 8,650,000 | | | | 8,657,252 | |
14 | THE GUGGENHEIM FUNDS SEMI-ANNUAL REPORT | SEE NOTES TO FINANCIAL STATEMENTS. |
SCHEDULE OF INVESTMENTS (Unaudited)(continued) | March 31, 2021 |
ULTRA SHORT DURATION FUND | |
| | Face
Amount~ | | | Value | |
IHS Markit Ltd. | | | | | | | | |
4.13% due 08/01/23 | | | 5,791,000 | | | $ | 6,205,693 | |
Sysco Corp. | | | | | | | | |
5.65% due 04/01/25 | | | 3,350,000 | | | | 3,894,047 | |
Molina Healthcare, Inc. | | | | | | | | |
5.38% due 11/15/22 | | | 2,700,000 | | | | 2,831,058 | |
General Mills, Inc. | | | | | | | | |
0.76% (3 Month USD LIBOR + 0.54%) due 04/16/215 | | | 2,450,000 | | | | 2,450,332 | |
1.23% (3 Month USD LIBOR + 1.01%) due 10/17/235 | | | 200,000 | | | | 202,897 | |
CVS Health Corp. | | | | | | | | |
4.00% due 12/05/23 | | | 1,600,000 | | | | 1,728,773 | |
Stryker Corp. | | | | | | | | |
3.38% due 05/15/24 | | | 1,600,000 | | | | 1,723,148 | |
Bayer US Finance II LLC | | | | | | | | |
0.83% (3 Month USD LIBOR + 0.63%) due 06/25/213,5 | | | 1,700,000 | | | | 1,701,275 | |
AbbVie, Inc. | | | | | | | | |
0.53% (3 Month USD LIBOR + 0.35%) due 05/21/215 | | | 1,300,000 | | | | 1,300,431 | |
Altria Group, Inc. | | | | | | | | |
4.75% due 05/05/21 | | | 1,154,000 | | | | 1,158,203 | |
Element Fleet Management Corp. | | | | | | | | |
1.60% due 04/06/243 | | | 900,000 | | | | 898,947 | |
Bunge Limited Finance Corp. | | | | | | | | |
3.00% due 09/25/22 | | | 800,000 | | | | 824,710 | |
Spectrum Brands, Inc. | | | | | | | | |
5.75% due 07/15/25 | | | 700,000 | | | | 721,875 | |
Keurig Dr Pepper, Inc. | | | | | | | | |
3.55% due 05/25/21 | | | 500,000 | | | | 502,260 | |
Total Consumer, Non-cyclical | | | 43,593,157 | |
| | | | | | | | | |
Utilities - 3.8% | | | | | | | | |
CenterPoint Energy Resources Corp. | | | | | | | | |
0.68% (3 Month USD LIBOR + 0.50%) due 03/02/235 | | | 9,400,000 | | | | 9,402,670 | |
NextEra Energy Capital Holdings, Inc. | | | | | | | | |
0.45% (3 Month USD LIBOR + 0.27%) due 02/22/235 | | | 8,600,000 | | | | 8,601,327 | |
0.55% (U.S. Secured Overnight Financing Rate + 0.54%) due 03/01/235 | | | 100,000 | | | | 100,250 | |
Atmos Energy Corp. | | | | | | | | |
0.63% due 03/09/23 | | | 4,650,000 | | | | 4,651,813 | |
0.57% (3 Month USD LIBOR + 0.38%) due 03/09/235 | | | 1,000,000 | | | | 1,000,109 | |
ONE Gas, Inc. | | | | | | | | |
1.10% due 03/11/24 | | | 4,550,000 | | | | 4,548,354 | |
Alexander Funding Trust | | | | | | | | |
1.84% due 11/15/233 | | | 4,300,000 | | | | 4,365,618 | |
Puget Energy, Inc. | | | | | | | | |
6.00% due 09/01/21 | | | 1,300,000 | | | | 1,328,650 | |
Total Utilities | | | | | | | 33,998,791 | |
| | | | | | | | | |
Communications - 3.3% |
NTT Finance Corp. | | | | | | | | |
0.58% due 03/01/243 | | | 8,950,000 | | | | 8,915,957 | |
Verizon Communications, Inc. | | | | | | | | |
0.75% due 03/22/24 | | | 4,400,000 | | | | 4,404,486 | |
Videotron Ltd. | | | | | | | | |
5.00% due 07/15/22 | | | 3,500,000 | | | | 3,640,000 | |
Netflix, Inc. | | | | | | | | |
5.50% due 02/15/22 | | | 2,700,000 | | | | 2,808,000 | |
ViacomCBS, Inc. | | | | | | | | |
4.75% due 05/15/25 | | | 2,210,000 | | | | 2,498,499 | |
T-Mobile USA, Inc. | | | | | | | | |
2.63% due 04/15/26 | | | 1,600,000 | | | | 1,628,000 | |
2.25% due 02/15/26 | | | 600,000 | | | | 604,314 | |
Sirius XM Radio, Inc. | | | | | | | | |
5.38% due 07/15/263 | | | 1,543,000 | | | | 1,593,147 | |
3.88% due 08/01/223 | | | 600,000 | | | | 602,250 | |
SEE NOTES TO FINANCIAL STATEMENTS. | THE GUGGENHEIM FUNDS SEMI-ANNUAL REPORT | 15 |
SCHEDULE OF INVESTMENTS (Unaudited)(continued) | March 31, 2021 |
ULTRA SHORT DURATION FUND | |
| | Face
Amount~ | | | Value | |
Sprint Spectrum Company LLC / Sprint Spectrum Co II LLC / Sprint Spectrum Co III LLC | | | | | | | | |
3.36% due 09/20/213 | | | 1,315,000 | | | $ | 1,324,863 | |
Corning, Inc. | | | | | | | | |
3.70% due 11/15/23 | | | 927,000 | | | | 992,458 | |
CSC Holdings LLC | | | | | | | | |
5.50% due 05/15/263 | | | 200,000 | | | | 206,200 | |
Total Communications | | | | | | | 29,218,174 | |
| | | | | | | | | |
Technology - 2.4% | | | | | | | | |
Fidelity National Information Services, Inc. | | | | | | | | |
0.60% due 03/01/24 | | | 8,200,000 | | | | 8,155,178 | |
HCL America, Inc. | | | | | | | | |
1.38% due 03/10/263 | | | 7,300,000 | | | | 7,165,277 | |
Microchip Technology, Inc. | | | | | | | | |
2.67% due 09/01/233 | | | 2,570,000 | | | | 2,676,358 | |
0.97% due 02/15/243 | | | 500,000 | | | | 499,033 | |
Infor, Inc. | | | | | | | | |
1.45% due 07/15/233 | | | 2,600,000 | | | | 2,632,165 | |
Total Technology | | | | | | | 21,128,011 | |
| | | | | | | | | |
Energy - 1.4% | | | | | | | | |
Enbridge, Inc. | | | | | | | | |
0.42% (U.S. Secured Overnight Financing Rate + 0.40%) due 02/17/235 | | | 4,900,000 | | | | 4,907,450 | |
Phillips 66 | | | | | | | | |
0.90% due 02/15/24 | | | 3,400,000 | | | | 3,400,818 | |
Valero Energy Corp. | | | | | | | | |
1.20% due 03/15/24 | | | 3,000,000 | | | | 3,008,187 | |
Halliburton Co. | | | | | | | | |
3.25% due 11/15/21 | | | 1,130,000 | | | | 1,141,209 | |
Total Energy | | | | | | | 12,457,664 | |
| | | | | | | | | |
Basic Materials - 0.3% |
Carpenter Technology Corp. | | | | | | | | |
4.45% due 03/01/23 | | | 1,350,000 | | | | 1,398,913 | |
Reliance Steel & Aluminum Co. | | | | | | | | |
4.50% due 04/15/23 | | | 1,300,000 | | | | 1,386,382 | |
Total Basic Materials | | | | | | | 2,785,295 | |
| | | | | | | | | |
Total Corporate Bonds | | | | |
(Cost $272,684,551) | | | 273,549,362 | |
| | | | | | | | | |
ASSET-BACKED SECURITIES†† - 28.9% |
Collateralized Loan Obligations - 21.2% |
Shackleton CLO Ltd. | | | | | | | | |
2017-8A, 1.14% (3 Month USD LIBOR + 0.92%, Rate Floor: 0.00%) due 10/20/273,5 | | | 10,696,753 | | | | 10,695,745 | |
2018-6RA, 1.24% (3 Month USD LIBOR + 1.02%, Rate Floor: 1.02%) due 07/17/283,5 | | | 5,050,281 | | | | 5,048,138 | |
Carlyle Global Market Strategies CLO Ltd. | | | | | | | | |
2018-2A, 0.99% (3 Month USD LIBOR + 0.78%, Rate Floor: 0.00%) due 04/27/273,5 | | | 5,589,218 | | | | 5,586,438 | |
2018-4A, 1.24% (3 Month USD LIBOR + 1.00%, Rate Floor: 1.00%) due 01/15/313,5 | | | 4,927,378 | | | | 4,919,332 | |
BXMT Ltd. | | | | | | | | |
2020-FL2, 1.01% (1 Month USD LIBOR + 0.90%, Rate Floor: 0.90%) due 02/16/373,5 | | | 5,000,000 | | | | 4,999,138 | |
16 | THE GUGGENHEIM FUNDS SEMI-ANNUAL REPORT | SEE NOTES TO FINANCIAL STATEMENTS. |
SCHEDULE OF INVESTMENTS (Unaudited)(continued) | March 31, 2021 |
ULTRA SHORT DURATION FUND | |
| | Face
Amount~ | | | Value | |
2020-FL2, 1.26% (1 Month USD LIBOR + 1.15%, Rate Floor: 1.15%) due 02/16/373,5 | | | 2,550,000 | | | $ | 2,551,564 | |
2020-FL3, 1.86% (1 Month USD LIBOR + 1.75%, Rate Floor: 1.75%) due 03/15/373,5 | | | 2,500,000 | | | | 2,513,779 | |
Palmer Square Loan Funding Ltd. | | | | | | | | |
2021-2A, due 05/20/293,5 | | | 4,500,000 | | | | 4,499,100 | |
2021-1A, 1.06% (3 Month USD LIBOR + 0.90%, Rate Floor: 0.90%) due 04/20/293,5 | | | 4,000,000 | | | | 4,004,001 | |
2018-4A, 1.09% (3 Month USD LIBOR + 0.90%, Rate Floor: 0.00%) due 11/15/263,5 | | | 899,949 | | | | 900,180 | |
2019-3A, 1.03% (3 Month USD LIBOR + 0.85%, Rate Floor: 0.85%) due 08/20/273,5 | | | 610,845 | | | | 610,896 | |
HERA Commercial Mortgage Ltd. | | | | | | | | |
2021-FL1, 1.43% (1 Month USD LIBOR + 1.30%, Rate Floor: 1.30%) due 02/18/383,5 | | | 5,000,000 | | | | 5,002,619 | |
2021-FL1, 1.18% (1 Month USD LIBOR + 1.05%, Rate Floor: 1.05%) due 02/18/383,5 | | | 4,250,000 | | | | 4,251,680 | |
Diamond CLO Ltd. | | | | | | | | |
2021-1A, 1.40% (3 Month USD LIBOR + 1.20%, Rate Floor: 1.20%) due 04/25/293,5 | | | 8,250,000 | | | | 8,248,350 | |
Dryden 33 Senior Loan Fund | | | | | | | | |
2020-33A, 1.24% (3 Month USD LIBOR + 1.00%, Rate Floor: 1.00%) due 04/15/293,5 | | | 8,000,000 | | | | 7,991,587 | |
Halcyon Loan Advisors Funding Ltd. | | | | | | | | |
2017-3A, 1.12% (3 Month USD LIBOR + 0.90%, Rate Floor: 0.00%) due 10/18/273,5 | | | 6,854,907 | | | | 6,856,437 | |
CHCP Ltd. | | | | | | | | |
2021-FL1, 1.16% (1 Month USD LIBOR + 1.05%, Rate Floor: 1.05%) due 02/15/383,5 | | | 6,500,000 | | | | 6,501,938 | |
CIFC Funding 2015-III Ltd. | | | | | | | | |
2018-3A, 1.09% (3 Month USD LIBOR + 0.87%, Rate Floor: 0.00%) due 04/19/293,5 | | | 6,475,000 | | | | 6,469,178 | |
LCM XXIV Ltd. | | | | | | | | |
2021-24A, 1.17% (3 Month USD LIBOR + 0.98%, Rate Floor: 0.98%) due 03/20/303,5 | | | 5,750,000 | | | | 5,741,790 | |
GPMT Ltd. | | | | | | | | |
2019-FL2, 1.41% (1 Month USD LIBOR + 1.30%, Rate Floor: 1.30%) due 02/22/363,5 | | | 5,250,000 | | | | 5,257,725 | |
SEE NOTES TO FINANCIAL STATEMENTS. | THE GUGGENHEIM FUNDS SEMI-ANNUAL REPORT | 17 |
SCHEDULE OF INVESTMENTS (Unaudited)(continued) | March 31, 2021 |
ULTRA SHORT DURATION FUND | |
| | Face
Amount~ | | | Value | |
2018-FL1, 1.01% (1 Month USD LIBOR + 0.90%, Rate Floor: 0.90%) due 11/21/353,5 | | | 164,534 | | | $ | 164,438 | |
Westcott Park CLO Ltd. | | | | | | | | |
2019-1A, 1.43% (3 Month USD LIBOR + 1.21%, Rate Floor: 0.00%) due 07/20/283,5 | | | 5,000,000 | | | | 5,000,516 | |
GoldenTree Loan Management US CLO 1 Ltd. | | | | | | | | |
2021-9A, 0.63% (3 Month USD LIBOR + 0.50%, Rate Floor: 0.50%) due 01/20/333,5 | | | 3,000,000 | | | | 2,982,759 | |
2020-1A, 1.17% (3 Month USD LIBOR + 0.95%, Rate Floor: 0.95%) due 04/20/293,5 | | | 2,000,000 | | | | 1,999,964 | |
Madison Park Funding XLVIII Ltd. | | | | | | | | |
2021-48A, 1.59% (3 Month USD LIBOR + 1.45%, Rate Floor: 1.45%) due 04/19/333,5 | | | 4,000,000 | | | | 3,992,739 | |
MidOcean Credit CLO VII | | | | | | | | |
2020-7A, 1.28% (3 Month USD LIBOR + 1.04%, Rate Floor: 0.00%) due 07/15/293,5 | | | 3,500,000 | | | | 3,495,884 | |
LoanCore Issuer Ltd. | | | | | | | | |
2019-CRE2, 1.61% (1 Month USD LIBOR + 1.50%, Rate Floor: 1.50%) due 05/15/363,5 | | | 1,300,000 | | | | 1,298,702 | |
2018-CRE1, 1.61% (1 Month USD LIBOR + 1.50%, Rate Floor: 1.50%) due 05/15/283,5 | | | 1,000,000 | | | | 999,026 | |
2018-CRE1, 1.24% (1 Month USD LIBOR + 1.13%, Rate Floor: 1.13%) due 05/15/283,5 | | | 961,639 | | | | 961,645 | |
Marathon CLO V Ltd. | | | | | | | | |
2017-5A, 1.05% (3 Month USD LIBOR + 0.87%, Rate Floor: 0.00%) due 11/21/273,5 | | | 3,129,945 | | | | 3,126,913 | |
ABPCI Direct Lending Fund CLO I LLC | | | | | | | | |
2021-1A, 1.79% (3 Month USD LIBOR + 1.60%, Rate Floor: 1.60%) due 04/20/323,5 | | | 3,000,000 | | | | 3,000,000 | |
Cerberus Loan Funding XXX, LP | | | | | | | | |
2020-3A, 2.08% (3 Month USD LIBOR + 1.85%, Rate Floor: 1.85%) due 01/15/333,5 | | | 3,000,000 | | | | 2,996,692 | |
Crown Point CLO III Ltd. | | | | | | | | |
2017-3A, 1.15% (3 Month USD LIBOR + 0.91%, Rate Floor: 0.00%) due 12/31/273,5 | | | 2,970,652 | | | | 2,970,448 | |
TICP CLO VII Ltd. | | | | | | | | |
2020-7A, 0.79% (3 Month USD LIBOR + 0.55%, Rate Floor: 0.55%) due 04/15/333,5 | | | 2,812,500 | | | | 2,807,237 | |
18 | THE GUGGENHEIM FUNDS SEMI-ANNUAL REPORT | SEE NOTES TO FINANCIAL STATEMENTS. |
SCHEDULE OF INVESTMENTS (Unaudited)(continued) | March 31, 2021 |
ULTRA SHORT DURATION FUND | |
| | Face
Amount~ | | | Value | |
Woodmont Trust | | | | | | | | |
2020-7A, 2.05% (3 Month USD LIBOR + 1.90%, Rate Floor: 1.90%) due 01/15/323,5 | | | 2,750,000 | | | $ | 2,746,838 | |
MP CLO VIII Ltd. | | | | | | | | |
2018-2A, 1.13% (3 Month USD LIBOR + 0.91%, Rate Floor: 0.00%) due 10/28/273,5 | | | 2,707,097 | | | | 2,706,237 | |
OZLM XII Ltd. | | | | | | | | |
2018-12A, 1.26% (3 Month USD LIBOR + 1.05%, Rate Floor: 0.00%) due 04/30/273,5 | | | 2,544,185 | | | | 2,544,340 | |
Cerberus Loan Funding XXXI, LP | | | | | | | | |
2021-1A, 1.69% (3 Month USD LIBOR + 1.50%, Rate Floor: 1.50%) due 04/15/323,5 | | | 2,500,000 | | | | 2,500,000 | |
Cerberus Loan Funding XXXII, LP | | | | | | | | |
2021-2A, due 04/22/333,5 | | | 2,500,000 | | | | 2,499,500 | |
Venture XIV CLO Ltd. | | | | | | | | |
2020-14A, 1.22% (3 Month USD LIBOR + 1.03%, Rate Floor: 1.03%) due 08/28/293,5 | | | 2,500,000 | | | | 2,496,773 | |
Avery Point VI CLO Ltd. | | | | | | | | |
2021-6A, 1.06% (3 Month USD LIBOR + 0.90%, Rate Floor: 0.90%) due 08/05/273,5 | | | 2,357,588 | | | | 2,355,537 | |
Owl Rock CLO IV Ltd. | | | | | | | | |
2020-4A, 2.80% (3 Month USD LIBOR + 2.62%, Rate Floor: 2.62%) due 05/20/293,5 | | | 2,000,000 | | | | 2,005,659 | |
Parliament Funding II Ltd. | | | | | | | | |
2020-1A, 2.67% (3 Month USD LIBOR + 2.45%, Rate Floor: 2.45%) due 08/12/303,5 | | | 2,000,000 | | | | 2,001,788 | |
ABPCI Direct Lending Fund IX LLC | | | | | | | | |
2020-9A, 2.19% (3 Month USD LIBOR + 1.95%, Rate Floor: 1.95%) due 11/18/313,5 | | | 2,000,000 | | | | 2,001,718 | |
Wellfleet CLO Ltd. | | | | | | | | |
2020-2A, 1.28% (3 Month USD LIBOR + 1.06%, Rate Floor: 0.00%) due 10/20/293,5 | | | 2,000,000 | | | | 2,000,539 | |
Greywolf CLO III Ltd. | | | | | | | | |
2020-3RA, 0.72% (3 Month USD LIBOR + 0.50%, Rate Floor: 0.50%) due 04/15/333,5 | | | 1,944,444 | | | | 1,938,732 | |
Fortress Credit Opportunities XI CLO Ltd. | | | | | | | | |
2018-11A, 1.54% (3 Month USD LIBOR + 1.30%, Rate Floor: 0.00%) due 04/15/313,5 | | | 1,800,000 | | | | 1,783,248 | |
SEE NOTES TO FINANCIAL STATEMENTS. | THE GUGGENHEIM FUNDS SEMI-ANNUAL REPORT | 19 |
SCHEDULE OF INVESTMENTS (Unaudited)(continued) | March 31, 2021 |
ULTRA SHORT DURATION FUND | |
| | Face
Amount~ | | | Value | |
California Street CLO IX, LP | | | | | | | | |
2019-9A, 0.92% (3 Month USD LIBOR + 0.70%, Rate Floor: 0.00%) due 07/16/323,5 | | | 1,750,000 | | | $ | 1,747,717 | |
610 Funding CLO 3 Ltd. | | | | | | | | |
2018-3A, 1.47% (3 Month USD LIBOR + 1.25%, Rate Floor: 0.00%) due 07/17/283,5 | | | 1,658,636 | | | | 1,658,610 | |
Allegro CLO IX Ltd. | | | | | | | | |
2018-3A, 1.39% (3 Month USD LIBOR + 1.17%, Rate Floor: 1.17%) due 10/16/313,5 | | | 1,500,000 | | | | 1,504,387 | |
Hunt CRE Ltd. | | | | | | | | |
2018-FL2, 1.19% (1 Month USD LIBOR + 1.08%, Rate Floor: 1.08%) due 08/15/283,5 | | | 1,500,000 | | | | 1,496,066 | |
Newfleet CLO Ltd. | | | | | | | | |
2018-1A, 1.17% (3 Month USD LIBOR + 0.95%, Rate Floor: 0.00%) due 04/20/283,5 | | | 1,467,774 | | | | 1,466,752 | |
Wind River CLO Ltd. | | | | | | | | |
2017-2A, 1.11% (3 Month USD LIBOR + 0.87%, Rate Floor: 0.00%) due 10/15/273,5 | | | 1,281,822 | | | | 1,280,700 | |
Neuberger Berman CLO XX Ltd. | | | | | | | | |
2017-20A, 1.04% (3 Month USD LIBOR + 0.80%, Rate Floor: 0.00%) due 01/15/283,5 | | | 1,190,554 | | | | 1,188,108 | |
BSPRT Issuer Ltd. | | | | | | | | |
2018-FL4, 1.16% (1 Month USD LIBOR + 1.05%, Rate Floor: 1.05%) due 09/15/353,5 | | | 901,839 | | | | 901,839 | |
2018-FL3, 1.16% (1 Month USD LIBOR + 1.05%, Rate Floor: 1.05%) due 03/15/283,5 | | | 217,306 | | | | 217,306 | |
Mountain View CLO Ltd. | | | | | | | | |
2018-1A, 1.04% (3 Month USD LIBOR + 0.80%, Rate Floor: 0.80%) due 10/15/263,5 | | | 1,071,615 | | | | 1,070,625 | |
Voya CLO Ltd. | | | | | | | | |
2019-2A, 0.87% (3 Month USD LIBOR + 0.65%, Rate Floor: 0.65%) due 07/20/323,5 | | | 1,031,250 | | | | 1,028,707 | |
KVK CLO Ltd. | | | | | | | | |
2017-1A, 1.13% (3 Month USD LIBOR + 0.90%, Rate Floor: 0.00%) due 01/14/283,5 | | | 1,027,632 | | | | 1,026,652 | |
KREF Ltd. | | | | | | | | |
2018-FL1, 1.21% (1 Month USD LIBOR + 1.10%, Rate Floor: 1.10%) due 06/15/363,5 | | | 994,470 | | | | 994,603 | |
BlueMountain CLO XXV Ltd. | | | | | | | | |
2019-25A, 0.89% (3 Month USD LIBOR + 0.65%, Rate Floor: 0.65%) due 07/15/323,5 | | | 875,000 | | | | 873,821 | |
20 | THE GUGGENHEIM FUNDS SEMI-ANNUAL REPORT | SEE NOTES TO FINANCIAL STATEMENTS. |
SCHEDULE OF INVESTMENTS (Unaudited)(continued) | March 31, 2021 |
ULTRA SHORT DURATION FUND | |
| | Face
Amount~ | | | Value | |
ACRE Commercial Mortgage Ltd. | | | | | | | | |
2021-FL4, 1.21% (1 Month USD LIBOR + 1.10%, Rate Floor: 1.10%) due 12/18/373,5 | | | 850,000 | | | $ | 850,292 | |
TICP CLO I Ltd. | | | | | | | | |
2018-1A, 1.02% (3 Month USD LIBOR + 0.80%, Rate Floor: 0.00%) due 07/20/273,5 | | | 639,029 | | | | 639,000 | |
Grand Avenue CRE Ltd. | | | | | | | | |
2020-FL2, 2.56% (1 Month USD LIBOR + 2.45%, Rate Floor: 2.45%) due 03/15/353,5 | | | 422,799 | | | | 425,509 | |
Fortress Credit Opportunities IX CLO Ltd. | | | | | | | | |
2017-9A, 1.74% (3 Month USD LIBOR + 1.55%, Rate Floor: 0.00%) due 11/15/293,5 | | | 382,000 | | | | 381,028 | |
NewStar Clarendon Fund CLO LLC | | | | | | | | |
2019-1A, 1.52% (3 Month USD LIBOR + 1.30%, Rate Floor: 0.00%) due 01/25/273,5 | | | 373,633 | | | | 373,370 | |
Golub Capital Partners CLO 17 Ltd. | | | | | | | | |
2017-17A, 1.87% (3 Month USD LIBOR + 1.65%, Rate Floor: 0.00%) due 10/25/303,5 | | | 350,000 | | | | 349,375 | |
Venture XVI CLO Ltd. | | | | | | | | |
2018-16A, 1.09% (3 Month USD LIBOR + 0.85%, Rate Floor: 0.85%) due 01/15/283,5 | | | 283,100 | | | | 283,115 | |
Mountain Hawk II CLO Ltd. | | | | | | | | |
2018-2A, 1.82% (3 Month USD LIBOR + 1.60%, Rate Floor: 0.00%) due 07/20/243,5 | | | 81,677 | | | | 81,663 | |
Total Collateralized Loan Obligations | | | 187,866,732 | |
| | | | | | | | | |
Financial - 3.0% | | | | | | | | |
Station Place Securitization Trust | | | | | | | | |
2020-5, 0.92% (1 Month USD LIBOR + 1.00%, Rate Floor: 0.00%) due 05/24/22†††,5,6 | | | 8,100,000 | | | | 8,100,000 | |
2020-16, 1.11% (1 Month USD LIBOR + 1.00%, Rate Floor: 1.00%) due 12/22/21†††,3,5 | | | 6,700,000 | | | | 6,700,000 | |
2021-3, 1.01% (1 Month USD LIBOR + 0.90%, Rate Floor: 0.90%) due 02/16/22†††,3,5 | | | 4,000,000 | | | | 4,000,000 | |
2021-SP1, 1.86% (1 Month USD LIBOR + 1.75%, Rate Floor: 1.75%) due 08/17/22†††,3,5 | | | 1,200,000 | | | | 1,200,000 | |
2020-12, 1.61% (1 Month USD LIBOR + 1.50%, Rate Floor: 0.00%) due 06/09/21†††,3,5 | | | 1,000,000 | | | | 1,000,000 | |
SEE NOTES TO FINANCIAL STATEMENTS. | THE GUGGENHEIM FUNDS SEMI-ANNUAL REPORT | 21 |
SCHEDULE OF INVESTMENTS (Unaudited)(continued) | March 31, 2021 |
ULTRA SHORT DURATION FUND | |
| | Face
Amount~ | | | Value | |
2021-7, 1.02% (1 Month USD LIBOR + 0.80%, Rate Floor: 0.80%) due 09/24/213,5 | | | 500,000 | | | $ | 500,000 | |
Madison Avenue Secured Funding Trust Series | | | | | | | | |
2020-1, 1.73% (1 Month USD LIBOR + 1.63%, Rate Floor: 0.00%) due 12/13/21†††,3,5 | | | 5,250,000 | | | | 5,250,000 | |
Total Financial | | | | | | | 26,750,000 | |
| | | | | | | | | |
Transport-Container - 1.5% |
Triton Container Finance VIII LLC | | | | | | | | |
2021-1A, 1.86% due 03/20/463 | | | 7,250,000 | | | | 7,071,673 | |
CLI Funding VIII LLC | | | | | | | | |
2021-1A, 1.64% due 02/18/463 | | | 3,250,000 | | | | 3,173,855 | |
Textainer Marine Containers VII Ltd. | | | | | | | | |
2021-1A, 1.68% due 02/20/463 | | | 2,085,918 | | | | 2,023,837 | |
2020-1A, 2.73% due 08/21/453 | | | 845,288 | | | | 860,086 | |
Total Transport-Container | | | 13,129,451 | |
| | | | | | | | | |
Infrastructure - 1.2% |
VB-S1 Issuer LLC | | | | | | | | |
2020-1A, 3.03% due 06/15/503 | | | 6,050,000 | | | | 6,331,313 | |
SBA Tower Trust | | | | | | | | |
2.33% due 01/15/283 | | | 4,000,000 | | | | 4,062,720 | |
Total Infrastructure | | | | | | | 10,394,033 | |
| | | | | | | | | |
Net Lease - 1.0% | | | | | | | | |
Oak Street Investment Grade Net Lease Fund Series | | | | | | | | |
2020-1A, 1.85% due 11/20/503 | | | 6,710,762 | | | | 6,736,083 | |
CF Hippolyta LLC | | | | | | | | |
2021-1A, 1.98% due 03/15/613 | | | 2,250,000 | | | | 2,242,521 | |
Total Net Lease | | | | | | | 8,978,604 | |
| | | | | | | | | |
Whole Business - 0.7% |
Applebee’s Funding LLC / IHOP Funding LLC | | | | | | | | |
2019-1A, 4.19% due 06/07/493 | | | 4,676,500 | | | | 4,802,298 | |
Taco Bell Funding LLC | | | | | | | | |
2018-1A, 4.32% due 11/25/483 | | | 782,000 | | | | 785,847 | |
DB Master Finance LLC | | | | | | | | |
2019-1A, 3.79% due 05/20/493 | | | 280,725 | | | | 286,449 | |
Total Whole Business | | | | | | | 5,874,594 | |
| | | | | | | | | |
Collateralized Debt Obligations - 0.2% |
Anchorage Credit Funding 3 Ltd. | | | | | | | | |
2021-3A, 2.87% due 01/28/393 | | | 1,750,000 | | | | 1,739,856 | |
| | | | | | | | | |
Transport-Aircraft - 0.1% |
AIM Aviation Finance Ltd. | | | | | | | | |
2015-1A, 4.21% due 02/15/403 | | | 896,096 | | | | 710,611 | |
Raspro Trust | | | | | | | | |
2005-1A, 1.15% (3 Month USD LIBOR + 0.93%, Rate Floor: 0.93%) due 03/23/243,5 | | | 373,311 | | | | 370,385 | |
Total Transport-Aircraft | | | 1,080,996 | |
| | | | | | | | | |
Total Asset-Backed Securities | | | | |
(Cost $255,382,600) | | | 255,814,266 | |
22 | THE GUGGENHEIM FUNDS SEMI-ANNUAL REPORT | SEE NOTES TO FINANCIAL STATEMENTS. |
SCHEDULE OF INVESTMENTS (Unaudited)(continued) | March 31, 2021 |
ULTRA SHORT DURATION FUND | |
| | Face
Amount~ | | | Value | |
COLLATERALIZED MORTGAGE OBLIGATIONS†† - 12.3% |
Residential Mortgage Backed Securities - 10.9% |
CSMC Trust | | | | | | | | |
2021-RPL1, 1.67% (WAC) due 09/27/603,5 | | | 8,015,830 | | | $ | 7,996,086 | |
2020-NQM1, 1.21% due 05/25/653,7 | | | 3,983,240 | | | | 4,000,054 | |
2020-RPL5, 3.02% (WAC) due 08/25/603,5 | | | 3,071,323 | | | | 3,121,662 | |
Verus Securitization Trust | | | | | | | | |
2020-5, 1.22% due 05/25/653,7 | | | 4,690,987 | | | | 4,700,650 | |
2020-1, 2.42% due 01/25/603,7 | | | 2,152,122 | | | | 2,175,087 | |
2019-4, 2.64% due 11/25/593,7 | | | 1,332,527 | | | | 1,356,164 | |
2019-4, 2.85% due 11/25/593,7 | | | 1,188,131 | | | | 1,207,970 | |
SPS Servicer Advance Receivables Trust II | | | | | | | | |
2020-T1, 1.28% due 11/15/523 | | | 7,000,000 | | | | 7,026,542 | |
NRZ Advance Receivables Trust | | | | | | | | |
2020-T2, 1.48% due 09/15/533 | | | 4,150,000 | | | | 4,158,407 | |
2020-T3, 1.32% due 10/15/523 | | | 2,750,000 | | | | 2,758,341 | |
New Residential Advance Receivables Trust Advance Receivables Backed | | | | | | | | |
2020-APT1, 1.04% due 12/16/52†††,3 | | | 4,000,000 | | | | 3,998,845 | |
2020-T1, 1.43% due 08/15/533 | | | 2,000,000 | | | | 2,004,324 | |
Ocwen Master Advance Receivables Trust | | | | | | | | |
2020-T1, 1.28% due 08/15/523 | | | 5,150,000 | | | | 5,162,290 | |
LSTAR Securities Investment Ltd. | | | | | | | | |
2021-1, 1.92% (1 Month USD LIBOR + 1.80%, Rate Floor: 1.80%) due 02/01/265,6 | | | 2,634,747 | | | | 2,641,851 | |
2021-2, 1.82% (1 Month USD LIBOR + 1.70%, Rate Floor: 1.70%) due 03/02/265,6 | | | 1,450,000 | | | | 1,448,997 | |
CFMT LLC | | | | | | | | |
2021-HB5, 0.80% (WAC) due 02/25/313,5 | | | 3,583,280 | | | | 3,578,386 | |
New Residential Mortgage Loan Trust | | | | | | | | |
2019-1A, 3.50% (WAC) due 10/25/593,5 | | | 1,931,064 | | | | 2,038,089 | |
2018-2A, 3.50% (WAC) due 02/25/583,5 | | | 1,270,432 | | | | 1,325,970 | |
CSMC Series | | | | | | | | |
2014-2R, 0.33% (1 Month USD LIBOR + 0.20%, Rate Floor: 0.20%) due 02/27/463,5 | | | 2,033,975 | | | | 2,000,608 | |
2014-7R, 0.28% (WAC) due 10/27/363,5 | | | 1,159,055 | | | | 1,145,439 | |
FKRT | | | | | | | | |
2020-C2A, 3.25% due 12/30/23†††,6 | | | 3,066,689 | | | | 3,070,369 | |
SEE NOTES TO FINANCIAL STATEMENTS. | THE GUGGENHEIM FUNDS SEMI-ANNUAL REPORT | 23 |
SCHEDULE OF INVESTMENTS (Unaudited)(continued) | March 31, 2021 |
ULTRA SHORT DURATION FUND | |
| | Face
Amount~ | | | Value | |
BRAVO Residential Funding Trust | | | | | | | | |
2021-HE1, 0.87% (30 Day Average U.S. Secured Overnight Financing Rate + 0.85%, Rate Floor: 0.00%) due 01/25/703,5 | | | 2,185,716 | | | $ | 2,182,746 | |
2019-NQM1, 2.67% (WAC) due 07/25/593,5 | | | 706,495 | | | | 714,524 | |
Towd Point Mortgage Trust | | | | | | | | |
2018-2, 3.25% (WAC) due 03/25/583,5 | | | 1,010,184 | | | | 1,053,235 | |
2017-6, 2.75% (WAC) due 10/25/573,5 | | | 882,866 | | | | 907,807 | |
2017-5, 0.71% (1 Month USD LIBOR + 0.60%, Rate Floor: 0.00%) due 02/25/573,5 | | | 438,871 | | | | 438,871 | |
Soundview Home Loan Trust | | | | | | | | |
2006-OPT5, 0.25% (1 Month USD LIBOR + 0.14%, Rate Floor: 0.14%) due 07/25/365 | | | 2,391,728 | | | | 2,339,831 | |
CIM Trust | | | | | | | | |
2018-R4, 4.07% (WAC) due 12/26/573,5 | | | 2,312,087 | | | | 2,321,295 | |
Ellington Financial Mortgage Trust | | | | | | | | |
2020-2, 1.49% (WAC) due 10/25/653,5 | | | 1,394,519 | | | | 1,393,845 | |
2020-2, 1.64% (WAC) due 10/25/653,5 | | | 803,295 | | | | 801,225 | |
Morgan Stanley ABS Capital I Incorporated Trust | | | | | | | | |
2006-NC1, 0.68% (1 Month USD LIBOR + 0.57%, Rate Floor: 0.57%) due 12/25/355 | | | 2,069,815 | | | | 2,060,651 | |
Residential Mortgage Loan Trust | | | | | | | | |
2020-1, 2.38% (WAC) due 02/25/243,5 | | | 1,996,799 | | | | 2,020,247 | |
Deephaven Residential Mortgage Trust | | | | | | | | |
2019-3A, 2.96% (WAC) due 07/25/593,5 | | | 1,772,201 | | | | 1,784,916 | |
CIT Mortgage Loan Trust | | | | | | | | |
2007-1, 1.46% (1 Month USD LIBOR + 1.35%, Rate Floor: 1.35%) due 10/25/373,5 | | | 1,618,826 | | | | 1,627,260 | |
Starwood Mortgage Residential Trust | | | | | | | | |
2020-1, 2.28% (WAC) due 02/25/503,5 | | | 1,096,410 | | | | 1,116,585 | |
2019-1, 2.94% (WAC) due 06/25/493,5 | | | 435,679 | | | | 438,240 | |
Argent Securities Incorporated Asset-Backed Pass-Through Certificates Series | | | | | | | | |
2005-W2, 0.84% (1 Month USD LIBOR + 0.74%, Rate Floor: 0.74%) due 10/25/355 | | | 1,498,312 | | | | 1,496,424 | |
24 | THE GUGGENHEIM FUNDS SEMI-ANNUAL REPORT | SEE NOTES TO FINANCIAL STATEMENTS. |
SCHEDULE OF INVESTMENTS (Unaudited)(continued) | March 31, 2021 |
ULTRA SHORT DURATION FUND | |
| | Face
Amount~ | | | Value | |
Homeward Opportunities Fund I Trust | | | | | | | | |
2019-3, 2.68% (WAC) due 11/25/593,5 | | | 873,614 | | | $ | 884,257 | |
2019-2, 2.70% (WAC) due 09/25/593,5 | | | 394,558 | | | | 396,854 | |
GS Mortgage-Backed Securities Trust | | | | | | | | |
2020-NQM1, 1.38% (WAC) due 09/27/603,5 | | | 1,174,955 | | | | 1,178,953 | |
Citigroup Mortgage Loan Trust | | | | | | | | |
2007-WFH2, 0.51% (1 Month USD LIBOR + 0.40%, Rate Floor: 0.40%) due 03/25/375 | | | 667,773 | | | | 664,940 | |
2019-IMC1, 2.72% (WAC) due 07/25/493,5 | | | 493,049 | | | | 502,079 | |
Banc of America Funding Trust | | | | | | | | |
2015-R2, 0.37% (1 Month USD LIBOR + 0.26%, Rate Floor: 0.26%) due 04/29/373,5 | | | 1,151,289 | | | | 1,123,320 | |
Ameriquest Mortgage Securities Incorporated Asset-Backed Pass-Through Certificates Series | | | | | | | | |
2005-R10, 0.75% (1 Month USD LIBOR + 0.65%, Rate Floor: 0.65%) due 01/25/365 | | | 1,005,686 | | | | 1,003,376 | |
Nationstar HECM Loan Trust | | | | | | | | |
2019-2A, 2.27% (WAC) due 11/25/293,5 | | | 500,635 | | | | 501,548 | |
Cascade Funding Mortgage Trust | | | | | | | | |
2019-RM3, 2.80% (WAC) due 06/25/695,6 | | | 390,338 | | | | 399,114 | |
GE-WMC Asset-Backed Pass-Through Certificates Series | | | | | | | | |
2005-2, 0.61% (1 Month USD LIBOR + 0.50%, Rate Floor: 0.50%) due 12/25/355 | | | 261,140 | | | | 260,820 | |
Total Residential Mortgage Backed Securities | | | 96,529,094 | |
| | | | | | | | | |
Commercial Mortgage Backed Securities - 1.4% |
Morgan Stanley Capital I Trust | | | | | | | | |
2018-H3, 0.83% (WAC) due 07/15/515,8 | | | 46,288,488 | | | | 2,116,819 | |
2014-MP, 3.69% due 08/11/333 | | | 1,669,000 | | | | 1,673,535 | |
2014-CPT, 3.35% due 07/13/293 | | | 1,000,000 | | | | 999,904 | |
Life Mortgage Trust | | | | | | | | |
2021-BMR, 1.21% (1 Month USD LIBOR + 1.10%, Rate Floor: 1.10%) due 03/15/383,5 | | | 2,450,000 | | | | 2,452,204 | |
BENCHMARK Mortgage Trust | | | | | | | | |
2019-B14, 0.79% (WAC) due 12/15/625,8 | | | 34,828,431 | | | | 1,653,974 | |
SEE NOTES TO FINANCIAL STATEMENTS. | THE GUGGENHEIM FUNDS SEMI-ANNUAL REPORT | 25 |
SCHEDULE OF INVESTMENTS (Unaudited)(continued) | March 31, 2021 |
ULTRA SHORT DURATION FUND | |
| | Face
Amount~ | | | Value | |
Citigroup Commercial Mortgage Trust | | | | | | | | |
2019-GC41, 1.06% (WAC) due 08/10/565,8 | | | 24,923,984 | | | $ | 1,653,908 | |
JPMDB Commercial Mortgage Securities Trust | | | | | | | | |
2018-C8, 0.64% (WAC) due 06/15/515,8 | | | 29,452,071 | | | | 937,848 | |
KKR Industrial Portfolio Trust | | | | | | | | |
2021-KDIP, 1.11% (1 Month USD LIBOR + 1.00%, Rate Floor: 1.00%) due 12/15/373,5 | | | 650,000 | | | | 649,221 | |
Wells Fargo Commercial Mortgage Trust | | | | | | | | |
2015-NXS1, 2.63% due 05/15/48 | | | 391,506 | | | | 391,372 | |
Total Commercial Mortgage Backed Securities | | | 12,528,785 | |
| | | | | | | | | |
Total Collateralized Mortgage Obligations | | | | |
(Cost $108,568,722) | | | 109,057,879 | |
| | | | | | | | | |
FOREIGN GOVERNMENT DEBT†† - 12.0% |
State of Israel |
1.00% due 04/30/21 | | ILS | 81,180,000 | | | | 24,319,498 | |
Kingdom of Spain |
(0.51)% due 07/09/2111 | | EUR | 17,110,000 | | | | 20,092,309 | |
Province of Ontario |
0.09% due 04/21/2111 | | CAD | 25,000,000 | | | | 19,896,014 | |
Republic of France |
(0.59)% due 04/08/2111 | | EUR | 14,125,000 | | | | 16,563,648 | |
Province of Newfoundland |
0.10% due 04/15/2111 | | CAD | 11,400,000 | | | | 9,072,855 | |
Czech Republic |
0.10% due 04/17/22 | | CZK | 200,400,000 | | | | 8,963,083 | |
United Mexican States |
4.04% due 05/06/2111 | | MXN | 84,280,000 | | | | 4,106,881 | |
Abu Dhabi Government International Bond |
0.75% due 09/02/23 | | | 2,200,000 | | | | 2,207,348 | |
Republic of Portugal |
(0.53)% due 07/16/2111 | | EUR | 1,410,000 | | | | 1,656,025 | |
Total Foreign Government Debt | | | | |
(Cost $108,491,262) | | | | | | | 106,877,661 | |
| | | | | | | | | |
SENIOR FLOATING RATE INTERESTS††,5 - 2.6% |
Industrial - 1.0% | | | | | | | | |
Berry Global, Inc. | | | | | | | | |
due 07/01/26 | | | 4,400,000 | | | | 4,360,796 | |
Reynolds Group Holdings, Inc. | | | | | | | | |
2.86% (1 Month USD LIBOR + 2.75%, Rate Floor: 2.75%) due 02/06/23 | | | 2,200,000 | | | | 2,189,352 | |
Filtration Group Corp. | | | | | | | | |
3.11% (1 Month USD LIBOR + 3.00%, Rate Floor: 3.00%) due 03/31/25 | | | 846,130 | | | | 833,227 | |
Gates Global LLC | | | | | | | | |
3.50% (1 Month USD LIBOR + 2.75%, Rate Floor: 3.50%) due 03/31/27 | | | 696,181 | | | | 693,862 | |
VC GB Holdings, Inc. | | | | | | | | |
4.00% (1 Month USD LIBOR + 3.00%, Rate Floor: 4.00%) due 02/28/24††† | | | 454,035 | | | | 451,197 | |
26 | THE GUGGENHEIM FUNDS SEMI-ANNUAL REPORT | SEE NOTES TO FINANCIAL STATEMENTS. |
SCHEDULE OF INVESTMENTS (Unaudited)(continued) | March 31, 2021 |
ULTRA SHORT DURATION FUND | |
| | Face
Amount~ | | | Value | |
Beacon Roofing Supply, Inc. | | | | | | | | |
2.36% (1 Month USD LIBOR + 2.25%, Rate Floor: 2.25%) due 01/02/25 | | | 136,605 | | | $ | 135,751 | |
Total Industrial | | | | | | | 8,664,185 | |
| | | | | | | | | |
Consumer, Cyclical - 0.5% |
Power Solutions (Panther) | | | | | | | | |
3.36% (1 Month USD LIBOR + 3.25%, Rate Floor: 3.25%) due 04/30/26 | | | 2,159,879 | | | | 2,135,581 | |
Samsonite IP Holdings SARL | | | | | | | | |
5.50% (1 Month USD LIBOR + 4.50%, Rate Floor: 5.50%) due 04/25/25 | | | 1,141,375 | | | | 1,148,509 | |
Go Daddy Operating Company LLC | | | | | | | | |
1.86% (1 Month USD LIBOR + 1.75%, Rate Floor: 1.75%) due 02/15/24 | | | 498,279 | | | | 494,153 | |
CHG Healthcare Services, Inc. | | | | | | | | |
4.00% (3 Month USD LIBOR + 3.00%, Rate Floor: 4.00%) due 06/07/23 | | | 448,834 | | | | 447,070 | |
Burlington Stores, Inc. | | | | | | | | |
1.86% (1 Month USD LIBOR + 1.75%, Rate Floor: 1.75%) due 11/18/24 | | | 400,000 | | | | 396,332 | |
Total Consumer, Cyclical | | | 4,621,645 | |
| | | | | | | | | |
Consumer, Non-cyclical - 0.3% |
Option Care Health, Inc. | | | | | | | | |
due 08/06/26 | | | 2,244,318 | | | | 2,234,510 | |
Dole Food Company, Inc. | | | | | | | | |
3.75% (1 Month USD LIBOR + 2.75%, Rate Floor: 3.75%) due 04/05/24 | | | 397,279 | | | | 396,894 | |
Nomad Foods Lux S.A.R.L | | | | | | | | |
2.36% (1 Month USD LIBOR + 2.25%, Rate Floor: 2.25%) due 05/15/24 | | | 300,000 | | | | 297,063 | |
Total Consumer, Non-cyclical | | | 2,928,467 | |
| | | | | | | | | |
Financial - 0.2% | | | | | | | | |
Focus Financial Partners, LLC | | | | | | | | |
2.11% (1 Month USD LIBOR + 2.00%, Rate Floor: 2.00%) due 07/03/24 | | | 847,565 | | | | 837,776 | |
USI, Inc. | | | | | | | | |
3.20% (3 Month USD LIBOR + 3.00%, Rate Floor: 3.00%) due 05/16/24 | | | 795,876 | | | | 786,357 | |
HUB International Ltd. | | | | | | | | |
3.22% (3 Month USD LIBOR + 3.00%, Rate Floor: 3.00%) due 04/25/25 | | | 447,698 | | | | 441,086 | |
Total Financial | | | | | | | 2,065,219 | |
| | | | | | | | | |
SEE NOTES TO FINANCIAL STATEMENTS. | THE GUGGENHEIM FUNDS SEMI-ANNUAL REPORT | 27 |
SCHEDULE OF INVESTMENTS (Unaudited)(continued) | March 31, 2021 |
ULTRA SHORT DURATION FUND | |
| | Face
Amount~ | | | Value | |
Technology - 0.2% | | | | | | | | |
Boxer Parent Co., Inc. | | | | | | | | |
due 10/02/25 | | | 1,096,853 | | | $ | 1,091,369 | |
Sabre GLBL, Inc. | | | | | | | | |
2.11% (1 Month USD LIBOR + 2.00%, Rate Floor: 2.00%) due 02/22/24 | | | 598,454 | | | | 590,105 | |
MACOM Technology Solutions Holdings, Inc. | | | | | | | | |
2.36% (1 Month USD LIBOR + 2.25%, Rate Floor: 2.25%) due 05/17/24 | | | 344,716 | | | | 341,918 | |
Total Technology | | | | | | | 2,023,392 | |
| | | | | | | | | |
Communications - 0.2% |
ProQuest, LLC | | | | | | | | |
due 10/23/26 | | | 1,300,000 | | | | 1,290,900 | |
| | | | | | | | | |
Basic Materials - 0.2% |
Invictus MD Strategies Corp. | | | | | | | | |
3.11% (1 Month USD LIBOR + 3.00%, Rate Floor: 3.00%) due 03/28/25 | | | 846,409 | | | | 836,430 | |
Univar USA, Inc. | | | | | | | | |
2.36% (1 Month USD LIBOR + 2.25%, Rate Floor: 2.25%) due 07/01/24 | | | 250,000 | | | | 248,985 | |
HB Fuller Co. | | | | | | | | |
2.11% (1 Month USD LIBOR + 2.00%, Rate Floor: 2.00%) due 10/21/24 | | | 137,857 | | | | 137,202 | |
Total Basic Materials | | | | | | | 1,222,617 | |
| | | | | | | | | |
Total Senior Floating Rate Interests | | | | |
(Cost $22,832,218) | | | 22,816,425 | |
| | | | | | | | | |
MUNICIPAL BONDS†† - 1.0% |
New York - 0.5% | | | | | | | | |
City of New York New York General Obligation Unlimited | | | | | | | | |
0.07% (VRDN) due 04/01/4210 | | | 4,010,000 | | | | 4,010,000 | |
New York City Transitional Finance Authority Future Tax Secured Revenue Bonds | | | | | | | | |
0.07% (VRDN) due 08/01/4210 | | | 350,000 | | | | 350,000 | |
New York State Dormitory Authority Revenue Bonds | | | | | | | | |
5.00% due 07/01/21 | | | 25,000 | | | | 25,291 | |
New York City Transitional Finance Authority Building Aid Revenue Bonds | | | | | | | | |
5.00% due 07/15/22 | | | 5,000 | | | | 5,259 | |
Total New York | | | | | | | 4,390,550 | |
| | | | | | | | | |
California - 0.4% | | | | | | | | |
Metropolitan Water District of Southern California Revenue Bonds | | | | | | | | |
0.05% (VRDN) due 07/01/4710 | | | 3,420,000 | | | | 3,420,000 | |
28 | THE GUGGENHEIM FUNDS SEMI-ANNUAL REPORT | SEE NOTES TO FINANCIAL STATEMENTS. |
SCHEDULE OF INVESTMENTS (Unaudited)(continued) | March 31, 2021 |
ULTRA SHORT DURATION FUND | |
| | Face
Amount~ | | | Value | |
Santa Barbara Unified School District General Obligation Unlimited | | | | | | | | |
due 08/01/219 | | | 100,000 | | | $ | 52,982 | |
McKinleyville Union School District General Obligation Unlimited | | | | | | | | |
due 08/01/219 | | | 210,000 | | | | 19,569 | |
City of Fairfield California Revenue Bonds | | | | | | | | |
8.38% due 06/01/21 | | | 10,000 | | | | 10,027 | |
San Francisco City & County Airport Comm-San Francisco International Airport Revenue Bonds | | | | | | | | |
5.00% due 05/03/21 | | | 10,000 | | | | 9,938 | |
Brea Redevelopment Agency Tax Allocation | | | | | | | | |
due 08/01/219 | | | 15,000 | | | | 5,339 | |
Total California | | | | | | | 3,517,855 | |
| | | | | | | | | |
Texas - 0.1% | | | | | | | | |
City of Dallas Texas Waterworks & Sewer System Revenue Bonds | | | | | | | | |
5.00% due 10/01/21 | | | 150,000 | | | | 153,595 | |
West Travis County Public Utility Agency Revenue Bonds | | | | | | | | |
5.00% due 08/15/21 | | | 50,000 | | | | 50,886 | |
Houston Higher Education Finance Corp. Revenue Bonds | | | | | | | | |
5.00% due 09/01/22 | | | 25,000 | | | | 26,680 | |
North Texas Tollway Authority Revenue Bonds | | | | | | | | |
5.00% due 09/01/21 | | | 25,000 | | | | 25,492 | |
City of Austin Texas Water & Wastewater System Revenue Bonds | | | | | | | | |
5.00% due 11/15/21 | | | 15,000 | | | | 15,286 | |
Central Texas Turnpike System Revenue Bonds | | | | | | | | |
due 08/15/219 | | | 10,000 | | | | 9,895 | |
State of Texas General Obligation Unlimited | | | | | | | | |
5.00% due 08/01/21 | | | 5,000 | | | | 5,026 | |
Total Texas | | | | | | | 286,860 | |
| | | | | | | | | |
Colorado - 0.0% | | | | | | | | |
Dawson Ridge Metropolitan District No. 1 | | | | | | | | |
due 10/01/229 | | | 150,000 | | | | 149,577 | |
| | | | | | | | | |
Nevada - 0.0% | | | | | | | | |
Las Vegas Valley Water District General Obligation Limited | | | | | | | | |
5.13% due 06/01/21 | | | 120,000 | | | | 120,923 | |
| | | | | | | | | |
Virginia - 0.0% | | | | | | | | |
Virginia College Building Authority Revenue Bonds | | | | | | | | |
3.00% due 09/01/21 | | | 60,000 | | | | 60,666 | |
University of Virginia Revenue Bonds | | | | | | | | |
2.00% due 08/01/21 | | | 15,000 | | | | 14,937 | |
Virginia Resources Authority Revenue Bonds | | | | | | | | |
5.00% due 11/01/21 | | | 5,000 | | | | 5,090 | |
Montgomery County Economic Development Authority Revenue Bonds | | | | | | | | |
4.71% due 06/01/21 | | | 5,000 | | | | 4,985 | |
Total Virginia | | | | | | | 85,678 | |
| | | | | | | | | |
SEE NOTES TO FINANCIAL STATEMENTS. | THE GUGGENHEIM FUNDS SEMI-ANNUAL REPORT | 29 |
SCHEDULE OF INVESTMENTS (Unaudited)(continued) | March 31, 2021 |
ULTRA SHORT DURATION FUND | |
| | Face
Amount~ | | | Value | |
Pennsylvania - 0.0% | | | | | | | | |
Lancaster County Hospital Authority Revenue Bonds | | | | | | | | |
4.00% due 01/01/22 | | | 25,000 | | | $ | 25,693 | |
4.13% due 01/01/22 | | | 20,000 | | | | 20,381 | |
Central Bucks School District General Obligation Limited | | | | | | | | |
5.10% due 05/15/21 | | | 15,000 | | | | 14,932 | |
County of Montgomery Pennsylvania General Obligation Unlimited | | | | | | | | |
5.20% due 04/01/21 | | | 15,000 | | | | 14,850 | |
City of Erie Pennsylvania General Obligation Unlimited | | | | | | | | |
due 11/15/229 | | | 5,000 | | | | 4,926 | |
Total Pennsylvania | | | | | | | 80,782 | |
| | | | | | | | | |
Connecticut - 0.0% | | | | | | | | |
Connecticut State Health & Educational Facilities Authority Revenue Bonds | | | | | | | | |
5.00% due 07/01/21 | | | 55,000 | | | | 55,595 | |
4.13% due 07/01/21 | | | 10,000 | | | | 9,994 | |
4.00% due 07/01/21 | | | 10,000 | | | | 9,991 | |
Total Connecticut | | | | | | | 75,580 | |
| | | | | | | | | |
New Jersey - 0.0% | | | | | | | | |
New Jersey Health Care Facilities Financing Authority Revenue Bonds | | | | | | | | |
5.25% due 07/01/21 | | | 35,000 | | | | 35,327 | |
New Jersey Transportation Trust Fund Authority Revenue Bonds | | | | | | | | |
5.00% due 06/15/21 | | | 20,000 | | | | 19,989 | |
New Jersey Economic Development Authority Revenue Bonds | | | | | | | | |
due 07/01/219 | | | 10,000 | | | | 9,892 | |
Total New Jersey | | | | | | | 65,208 | |
| | | | | | | | | |
North Carolina - 0.0% | | | | |
County of New Hanover North Carolina Revenue Bonds | | | | | | | | |
4.00% due 10/01/21 | | | 50,000 | | | | 50,906 | |
Inlivian Revenue Bonds | | | | | | | | |
6.00% due 12/01/21 | | | 5,000 | | | | 5,126 | |
Total North Carolina | | | | | | | 56,032 | |
| | | | | | | | | |
Kansas - 0.0% | | | | | | | | |
City of Wichita Kansas Water & Sewer Utility Revenue Bonds | | | | | | | | |
5.00% due 10/01/21 | | | 50,000 | | | | 51,162 | |
| | | | | | | | | |
Washington - 0.0% | | | | | | | | |
Seattle Housing Authority Revenue Bonds | | | | | | | | |
2.88% due 12/01/21 | | | 50,000 | | | | 50,892 | |
| | | | | | | | | |
Maryland - 0.0% | | | | | | | | |
Maryland Health & Higher Educational Facilities Authority Revenue Bonds | | | | | | | | |
4.00% due 07/01/22 | | | 30,000 | | | | 31,425 | |
County of Frederick Maryland General Obligation Unlimited | | | | | | | | |
3.50% due 08/01/21 | | | 10,000 | | | | 10,006 | |
Total Maryland | | | | | | | 41,431 | |
| | | | | | | | | |
30 | THE GUGGENHEIM FUNDS SEMI-ANNUAL REPORT | SEE NOTES TO FINANCIAL STATEMENTS. |
SCHEDULE OF INVESTMENTS (Unaudited)(continued) | March 31, 2021 |
ULTRA SHORT DURATION FUND | |
| | Face
Amount~ | | | Value | |
Arizona - 0.0% | | | | | | | | |
Industrial Development Authority of the County of Pima Revenue Bonds | | | | | | | | |
8.25% due 06/01/21 | | | 30,000 | | | $ | 30,376 | |
City of Mesa Arizona Excise Tax Revenue Bonds | | | | | | | | |
5.00% due 07/01/22 | | | 5,000 | | | | 5,249 | |
Total Arizona | | | | | | | 35,625 | |
| | | | | | | | | |
Ohio - 0.0% | | | | | | | | |
Greater Cleveland Regional Transit Authority Revenue Bonds | | | | | | | | |
5.00% due 12/01/21 | | | 20,000 | | | | 20,423 | |
Ohio Higher Educational Facility Commission Revenue Bonds | | | | | | | | |
5.00% due 01/01/22 | | | 5,000 | | | | 5,131 | |
4.00% due 01/01/22 | | | 5,000 | | | | 5,089 | |
Total Ohio | | | | | | | 30,643 | |
| | | | | | | | | |
Michigan - 0.0% | | | | | | | | |
Michigan Finance Authority Revenue Bonds | | | | | | | | |
5.00% due 12/01/21 | | | 25,000 | | | | 25,554 | |
Hudsonville Public Schools General Obligation Unlimited | | | | | | | | |
5.00% due 05/01/21 | | | 5,000 | | | | 4,968 | |
Total Michigan | | | | | | | 30,522 | |
| | | | | | | | | |
Illinois - 0.0% | | | | | | | | |
City of Moline Illinois General Obligation Unlimited | | | | | | | | |
5.20% due 06/01/21 | | | 10,000 | | | | 9,978 | |
Boone McHenry & DeKalb Counties Community Unit School District 100 General Obligation Unlimited | | | | | | | | |
due 12/01/219 | | | 10,000 | | | | 9,881 | |
Illinois Finance Authority Revenue Bonds | | | | | | | | |
4.00% due 05/15/22 | | | 5,000 | | | | 5,152 | |
Total Illinois | | | | | | | 25,011 | |
| | | | | | | | | |
Massachusetts - 0.0% |
Commonwealth of Massachusetts Transportation Fund Revenue Bonds | | | | | | | | |
4.00% due 06/01/21 | | | 15,000 | | | | 14,941 | |
Massachusetts Development Finance Agency Revenue Bonds | | | | | | | | |
5.25% due 04/01/21 | | | 10,000 | | | | 9,900 | |
Total Massachusetts | | | | | | | 24,841 | |
| | | | | | | | | |
Oregon - 0.0% | | | | | | | | |
Oregon State Lottery Revenue Bonds | | | | | | | | |
5.25% due 04/01/21 | | | 15,000 | | | | 14,850 | |
| | | | | | | | | |
Florida - 0.0% | | | | | | | | |
Capital Trust Agency, Inc. Revenue Bonds | | | | | | | | |
4.38% due 12/01/22 | | | 10,000 | | | | 11,057 | |
| | | | | | | | | |
Puerto Rico - 0.0% | | | | | | | | |
Puerto Rico Highway & Transportation Authority Revenue Bonds | | | | | | | | |
5.25% due 07/01/22 | | | 10,000 | | | | 10,517 | |
SEE NOTES TO FINANCIAL STATEMENTS. | THE GUGGENHEIM FUNDS SEMI-ANNUAL REPORT | 31 |
SCHEDULE OF INVESTMENTS (Unaudited)(continued) | March 31, 2021 |
ULTRA SHORT DURATION FUND | |
| | Face
Amount~ | | | Value | |
Missouri - 0.0% | | | | | | | | |
Health & Educational Facilities Authority of the State of Missouri Revenue Bonds | | | | | | | | |
5.00% due 11/15/21 | | | 5,000 | | | $ | 5,100 | |
| | | | | | | | | |
South Carolina - 0.0% |
South Carolina Jobs-Economic Development Authority Revenue Bonds | | | | | | | | |
6.00% due 08/01/21 | | | 5,000 | | | | 5,044 | |
| | | | | | | | | |
Utah - 0.0% | | | | | | | | |
Intermountain Power Agency Revenue Bonds | | | | | | | | |
5.00% due 07/01/21 | | | 5,000 | | | | 4,997 | |
Total Municipal Bonds | | | | |
(Cost $9,180,921) | | | 9,170,737 | |
| | | | | | | | | |
U.S. TREASURY BILLS†† - 0.0% |
U.S. Treasury Bills |
0.06% due 04/08/2111 | | | 100,000 | | | | 100,000 | |
Total U.S. Treasury Bills | | | | |
(Cost $99,999) | | | | | | | 100,000 | |
| | | | | | | | | |
COMMERCIAL PAPER†† - 1.4% |
Mondelez International, Inc. |
0.10% due 04/06/213,11 | | | 10,000,000 | | | | 9,999,833 | |
McCormick & Co., Inc. |
0.10% due 04/01/213,11 | | | 2,000,000 | | | | 2,000,000 | |
Total Commercial Paper | | | | |
(Cost $11,999,833) | | | | | | | 11,999,833 | |
| | | | | | | | | |
Total Investments - 101.9% | | | | |
(Cost $903,271,018) | | $ | 903,075,410 | |
Other Assets & Liabilities, net - (1.9)% | | | (16,675,656 | ) |
Total Net Assets - 100.0% | | $ | 886,399,754 | |
Centrally Cleared Interest Rate Swap Agreements††
| Counterparty | Exchange | | Floating
Rate
Type | Floating
Rate Index | Fixed
Rate | | Payment
Frequency | | Maturity
Date | | Notional
Amount | | Value | | Upfront
Premiums
Paid | | Unrealized
Appreciation** |
| BofA Securities, Inc. | CME | | Receive | 3-Month USD LIBOR | 1.66% | Quarterly | | 03/16/31 | | $ | 4,500,000 | | $ | 52,441 | | $ | 334 | | $ | 52,107 |
32 | THE GUGGENHEIM FUNDS SEMI-ANNUAL REPORT | SEE NOTES TO FINANCIAL STATEMENTS. |
SCHEDULE OF INVESTMENTS (Unaudited)(continued) | March 31, 2021 |
ULTRA SHORT DURATION FUND | |
Total Return Swap Agreements |
Counterparty | Reference
Obligation | Financing
Rate Receive | Payment
Frequency | | Maturity
Date | | Units | | Notional
Amount | | Value and
Unrealized
Appreciation
(Depreciation) | |
OTC Fixed Income Index Swap Agreements Sold Short†† |
BNP Paribas | iShares Core U.S. Aggregate Bond ETF | 0.37% (1 Month USD LIBOR + 0.26%) | At Maturity | | | 04/30/21 | | | 97,450 | | $ | 11,092,734 | | $ | 351,795 | |
BNP Paribas | iShares Core U.S. Aggregate Bond ETF | 0.39% (1 Month USD LIBOR + 0.28%) | At Maturity | | | 04/19/21 | | | 83,100 | | | 9,459,273 | | | 284,202 | |
BNP Paribas | iShares Core U.S. Aggregate Bond ETF | 0.36% (1 Month USD LIBOR + 0.25%) | At Maturity | | | 04/21/21 | | | 62,500 | | | 7,114,375 | | | 223,750 | |
BNP Paribas | iShares Core S&P 500 ETF | 0.29% (3 Month USD LIBOR + 0.09%) | At Maturity | | | 05/12/21 | | | 100,000 | | | 39,782,000 | | | (610,000 | ) |
| | | | | | | | | | | | $ | 67,448,382 | | $ | 249,747 | |
Forward Foreign Currency Exchange Contracts†† |
Counterparty | | Contracts
to Sell | | | Currency | | | Settlement
Date | | | Settlement
Value | | | Value at
March 31,
2021 | | | Unrealized
Appreciation
(Depreciation) | |
UBS AG | | | 2,724,000,000 | | | | JPY | | | | 04/12/21 | | | $ | 26,174,690 | | | $ | 24,602,950 | | | $ | 1,571,740 | |
UBS AG | | | 81,991,800 | | | | ILS | | | | 04/30/21 | | | | 25,355,939 | | | | 24,555,839 | | | | 800,100 | |
Goldman Sachs International | | | 17,110,000 | | | | EUR | | | | 07/09/21 | | | | 20,890,625 | | | | 20,104,829 | | | | 785,796 | |
Goldman Sachs International | | | 75,210,000 | | | | BRL | | | | 04/01/21 | | | | 14,025,369 | | | | 13,372,093 | | | | 653,276 | |
JPMorgan Chase Bank, N.A. | | | 9,900,000 | | | | BRL | | | | 07/01/21 | | | | 2,372,110 | | | | 1,749,217 | | | | 622,893 | |
Morgan Stanley Capital Services LLC | | | 55,390,000 | | | | BRL | | | | 04/01/21 | | | | 10,422,234 | | | | 9,848,162 | | | | 574,072 | |
Citibank, N.A. | | | 8,240,000 | | | | BRL | | | | 07/01/21 | | | | 1,997,144 | | | | 1,455,913 | | | | 541,231 | |
Citibank, N.A. | | | 14,125,000 | | | | EUR | | | | 04/08/21 | | | | 17,003,166 | | | | 16,564,126 | | | | 439,040 | |
Citibank, N.A. | | | 464,232,000 | | | | JPY | | | | 07/01/21 | | | | 4,571,103 | | | | 4,196,180 | | | | 374,923 | |
Barclays Bank plc | | | 429,214,500 | | | | JPY | | | | 07/01/21 | | | | 4,219,983 | | | | 3,879,657 | | | | 340,326 | |
JPMorgan Chase Bank, N.A. | | | 217,500,000 | | | | JPY | | | | 04/19/21 | | | | 2,100,509 | | | | 1,964,594 | | | | 135,915 | |
Citibank, N.A. | | | 1,410,000 | | | | EUR | | | | 07/16/21 | | | | 1,713,315 | | | | 1,657,061 | | | | 56,254 | |
Goldman Sachs International | | | 860,000 | | | | BRL | | | | 07/01/21 | | | | 201,476 | | | | 151,952 | | | | 49,524 | |
UBS AG | | | 137,000,000 | | | | MXN | | | | 04/08/21 | | | | 6,747,389 | | | | 6,701,218 | | | | 46,171 | |
Barclays Bank plc | | | 200,600,400 | | | | CZK | | | | 04/19/22 | | | | 9,076,214 | | | | 9,072,557 | | | | 3,657 | |
Barclays Bank plc | | | 8,523,623 | | | | ILS | | | | 08/01/22 | | | | 2,581,743 | | | | 2,578,398 | | | | 3,345 | |
Barclays Bank plc | | | 179,895,000 | | | | HUF | | | | 04/21/21 | | | | 583,509 | | | | 582,852 | | | | 657 | |
Barclays Bank plc | | | 200,400 | | | | CZK | | | | 04/19/21 | | | | 9,076 | | | | 9,014 | | | | 62 | |
Barclays Bank plc | | | 63,277 | | | | ILS | | | | 08/02/21 | | | | 18,856 | | | | 18,994 | | | | (138 | ) |
Bank of America, N.A. | | | 643,550 | | | | ILS | | | | 01/31/22 | | | | 190,795 | | | | 193,983 | | | | (3,188 | ) |
Bank of America, N.A. | | | 3,949,100 | | | | ILS | | | | 04/30/21 | | | | 1,169,117 | | | | 1,182,721 | | | | (13,604 | ) |
Citibank, N.A. | | | 4,100,600 | | | | ILS | | | | 04/30/21 | | | | 1,211,792 | | | | 1,228,095 | | | | (16,303 | ) |
SEE NOTES TO FINANCIAL STATEMENTS. | THE GUGGENHEIM FUNDS SEMI-ANNUAL REPORT | 33 |
SCHEDULE OF INVESTMENTS (Unaudited)(continued) | March 31, 2021 |
ULTRA SHORT DURATION FUND | |
Forward Foreign Currency Exchange Contracts†† (continued) |
Counterparty | | Contracts
to Sell | | | Currency | | | Settlement
Date | | | Settlement
Value | | | Value at
March 31,
2021 | | | Unrealized
Appreciation
(Depreciation) | |
Goldman Sachs International | | | 3,270,500 | | | | ILS | | | | 01/31/22 | | | $ | 968,615 | | | $ | 985,814 | | | $ | (17,199 | ) |
Goldman Sachs International | | | 4,191,500 | | | | ILS | | | | 04/30/21 | | | | 1,227,224 | | | | 1,255,319 | | | | (28,095 | ) |
Goldman Sachs International | | | 2,216,500 | | | | EUR | | | | 07/30/21 | | | | 2,574,742 | | | | 2,605,705 | | | | (30,963 | ) |
JPMorgan Chase Bank, N.A. | | | 2,407,925 | | | | EUR | | | | 07/30/21 | | | | 2,779,155 | | | | 2,830,743 | | | | (51,588 | ) |
UBS AG | | | 84,280,000 | | | | MXN | | | | 05/06/21 | | | | 4,040,290 | | | | 4,110,107 | | | | (69,817 | ) |
JPMorgan Chase Bank, N.A. | | | 11,400,000 | | | | CAD | | | | 04/15/21 | | | | 8,980,961 | | | | 9,073,621 | | | | (92,660 | ) |
UBS AG | | | 12,110,000 | | | | CAD | | | | 04/07/21 | | | | 9,544,377 | | | | 9,638,544 | | | | (94,167 | ) |
Barclays Bank plc | | | 25,000,000 | | | | CAD | | | | 04/21/21 | | | | 19,600,463 | | | | 19,898,582 | | | | (298,119 | ) |
| | | | | | | | | | | | | | | | | | | | | | | $ | 6,283,141 | |
| | | | | | | | | | | | | | | | | | | | | | | | | |
Counterparty | | Contracts
to Buy | | | Currency | | | Settlement
Date | | | Settlement
Value | | | Value at
March 31,
2021 | | | Unrealized
Appreciation
(Depreciation) | |
Barclays Bank plc | | | 8,523,623 | | | | ILS | | | | 08/01/22 | | | $ | 2,345,521 | | | $ | 2,578,398 | | | $ | 232,877 | |
Goldman Sachs International | | | 4,624,425 | | | | EUR | | | | 07/30/21 | | | | 5,306,527 | | | | 5,436,448 | | | | 129,921 | |
Goldman Sachs International | | | 6,120,600 | | | | ILS | | | | 04/30/21 | | | | 1,707,090 | | | | 1,833,067 | | | | 125,977 | |
JPMorgan Chase Bank, N.A. | | | 6,120,600 | | | | ILS | | | | 04/30/21 | | | | 1,724,598 | | | | 1,833,067 | | | | 108,469 | |
Goldman Sachs International | | | 3,914,050 | | | | ILS | | | | 01/31/22 | | | | 1,086,030 | | | | 1,179,798 | | | | 93,768 | |
UBS AG | | | 137,000,000 | | | | MXN | | | | 04/08/21 | | | | 6,659,648 | | | | 6,701,218 | | | | 41,570 | |
JPMorgan Chase Bank, N.A. | | | 12,110,000 | | | | CAD | | | | 04/07/21 | | | | 9,601,982 | | | | 9,638,544 | | | | 36,562 | |
Barclays Bank plc | | | 63,277 | | | | ILS | | | | 07/30/21 | | | | 17,340 | | | | 18,993 | | | | 1,653 | |
Citibank, N.A. | | | 179,895,000 | | | | HUF | | | | 04/21/21 | | | | 611,285 | | | | 582,852 | | | | (28,433 | ) |
UBS AG | | | 217,500,000 | | | | JPY | | | | 04/19/21 | | | | 1,994,150 | | | | 1,964,594 | | | | (29,556 | ) |
Citibank, N.A. | | | 37,000,000 | | | | BRL | | | | 04/01/21 | | | | 6,623,346 | | | | 6,578,479 | | | | (44,867 | ) |
JPMorgan Chase Bank, N.A. | | | 41,600,000 | | | | BRL | | | | 04/01/21 | | | | 7,463,223 | | | | 7,396,345 | | | | (66,878 | ) |
Morgan Stanley Capital Services LLC | | | 52,000,000 | | | | BRL | | | | 04/01/21 | | | | 9,331,204 | | | | 9,245,431 | | | | (85,773 | ) |
JPMorgan Chase Bank, N.A. | | | 6,365,000 | | | | BRL | | | | 07/01/21 | | | | 1,233,528 | | | | 1,124,623 | | | | (108,905 | ) |
Citibank, N.A. | | | 12,635,000 | | | | BRL | | | | 07/01/21 | | | | 2,423,071 | | | | 2,232,460 | | | | (190,611 | ) |
JPMorgan Chase Bank, N.A. | | | 2,724,000,000 | | | | JPY | | | | 04/12/21 | | | | 24,968,194 | | | | 24,602,950 | | | | (365,244 | ) |
JPMorgan Chase Bank, N.A. | | | 893,446,500 | | | | JPY | | | | 07/01/21 | | | | 8,723,786 | | | | 8,075,837 | | | | (647,949 | ) |
| | | | | | | | | | | | | | | | | | | | | | | $ | (797,419 | ) |
34 | THE GUGGENHEIM FUNDS SEMI-ANNUAL REPORT | SEE NOTES TO FINANCIAL STATEMENTS. |
SCHEDULE OF INVESTMENTS (Unaudited)(continued) | March 31, 2021 |
ULTRA SHORT DURATION FUND | |
~ | The face amount is denominated in U.S. dollars unless otherwise indicated. |
** | Includes cumulative appreciation (depreciation). Variation margin is reported within the Statement of Assets and Liabilities. |
† | Value determined based on Level 1 inputs — See Note 4. |
†† | Value determined based on Level 2 inputs, unless otherwise noted — See Note 4. |
††† | Value determined based on Level 3 inputs — See Note 4. |
1 | All or a portion of this security is pledged as interest rate swap collateral at March 31, 2021. |
2 | Rate indicated is the 7-day yield as of March 31, 2021. |
3 | Security is a 144A or Section 4(a)(2) security. These securities have been determined to be liquid under guidelines established by the Board of Trustees. The total market value of 144A or Section 4(a)(2) securities is $431,303,946 (cost $430,370,964), or 48.7% of total net assets. |
4 | Security has a fixed rate coupon which will convert to a floating or variable rate coupon on a future date. |
5 | Variable rate security. Rate indicated is the rate effective at March 31, 2021. In some instances, the effective rate is limited by a minimum rate floor or a maximum rate cap established by the issuer. The settlement status of a position may also impact the effective rate indicated. In some cases, a position may be unsettled at period end and may not have a stated effective rate. In instances where multiple underlying reference rates and spread amounts are shown, the effective rate is based on a weighted average. |
6 | Security is a 144A or Section 4(a)(2) security. These securities have been determined to be illiquid and restricted under guidelines established by the Board of Trustees. The total market value of 144A or Section 4(a)(2) illiquid and restricted securities is $15,660,331 (cost $15,643,452), or 1.8% of total net assets — See Note 8. |
7 | Security is a step up/down bond. The coupon increases or decreases at regular intervals until the bond reaches full maturity. Rate indicated is the rate at March 31, 2021. See table below for additional step information for each security. |
8 | Security is an interest-only strip. |
9 | Zero coupon rate security. |
10 | The rate is adjusted periodically by the counterparty, allows the holder to tender the security upon a rate reset, and is not based upon a set reference rate and spread. Rate indicated is the rate effective at March 31, 2021. |
11 | Rate indicated is the effective yield at the time of purchase. |
| | BofA — Bank of America |
| | BRL — Brazilian Real |
| | CAD — Canadian Dollar |
| | CME — Chicago Mercantile Exchange |
| | CZK — Czech Koruna |
| | EUR — Euro |
| | HUF — Hungarian Forint |
| | ILS — Israeli New Shekel |
| | JPY — Japanese Yen |
| | LIBOR — London Interbank Offered Rate |
| | MXN — Mexican Peso |
| | plc — Public Limited Company |
| | SARL — Société à Responsabilité Limitée |
| | VRDN — Variable Rate Demand Note |
| | WAC — Weighted Average Coupon |
| | |
| | See Sector Classification in Other Information section. |
SEE NOTES TO FINANCIAL STATEMENTS. | THE GUGGENHEIM FUNDS SEMI-ANNUAL REPORT | 35 |
SCHEDULE OF INVESTMENTS (Unaudited)(continued) | March 31, 2021 |
ULTRA SHORT DURATION FUND | |
The following table summarizes the inputs used to value the Fund’s investments at March 31, 2021 (See Note 4 in the Notes to Financial Statements):
Investments in Securities (Assets) | | Level 1
Quoted
Prices | | | Level 2
Significant
Observable
Inputs | | | Level 3
Significant
Unobservable
Inputs | | | Total | |
Exchange-Traded Funds | | $ | 67,448,382 | | | $ | — | | | $ | — | | | $ | 67,448,382 | |
Money Market Fund | | | 46,240,865 | | | | — | | | | — | | | | 46,240,865 | |
Corporate Bonds | | | — | | | | 273,549,362 | | | | — | | | | 273,549,362 | |
Asset-Backed Securities | | | — | | | | 229,564,266 | | | | 26,250,000 | | | | 255,814,266 | |
Collateralized Mortgage Obligations | | | — | | | | 101,988,665 | | | | 7,069,214 | | | | 109,057,879 | |
Foreign Government Debt | | | — | | | | 106,877,661 | | | | — | | | | 106,877,661 | |
Senior Floating Rate Interests | | | — | | | | 22,365,228 | | | | 451,197 | | | | 22,816,425 | |
Municipal Bonds | | | — | | | | 9,170,737 | | | | — | | | | 9,170,737 | |
U.S. Treasury Bills | | | — | | | | 100,000 | | | | — | | | | 100,000 | |
Commercial Paper | | | — | | | | 11,999,833 | | | | — | | | | 11,999,833 | |
Interest Rate Swap Agreements** | | | — | | | | 52,107 | | | | — | | | | 52,107 | |
Forward Foreign Currency Exchange Contracts** | | | — | | | | 7,769,779 | | | | — | | | | 7,769,779 | |
Fixed Income Index Swap Agreements** | | | — | | | | 859,747 | | | | — | | | | 859,747 | |
Total Assets | | $ | 113,689,247 | | | $ | 764,297,385 | | | $ | 33,770,411 | | | $ | 911,757,043 | |
Investments in Securities (Liabilities) | | Level 1
Quoted
Prices | | | Level 2
Significant
Observable
Inputs | | | Level 3
Significant
Unobservable
Inputs | | | Total | |
Forward Foreign Currency Exchange Contracts** | | $ | — | | | $ | 2,284,057 | | | $ | — | | | $ | 2,284,057 | |
Fixed Income Index Swap Agreements** | | | — | | | | 610,000 | | | | — | | | | 610,000 | |
Total Liabilities | | $ | — | | | $ | 2,894,057 | | | $ | — | | | $ | 2,894,057 | |
** | This derivative is reported as unrealized appreciation/depreciation at period end. |
36 | THE GUGGENHEIM FUNDS SEMI-ANNUAL REPORT | SEE NOTES TO FINANCIAL STATEMENTS. |
SCHEDULE OF INVESTMENTS (Unaudited)(continued) | March 31, 2021 |
ULTRA SHORT DURATION FUND | |
The following is a summary of significant unobservable inputs used in the fair valuation of assets categorized within Level 3 of the fair value hierarchy:
| Category | | Ending
Balance at
March 31,
2021 | | | Valuation
Technique | | Unobservable
Inputs | | Input
Range | | Weighted
Average |
| Assets: | | | | | | | | | | | | |
| Asset-Backed Securities | | $ | 21,050,000 | | | Option Adjusted Spread off the prior month end broker quote | | Broker Quote | | — | | — |
| Asset-Backed Securities | | | 5,200,000 | | | Model Price | | Purchase Price | | — | | — |
| Collateralized Mortgage Obligations | | | 3,998,845 | | | Option Adjusted Spread off the prior month end broker quote | | Broker Quote | | — | | — |
| Collateralized Mortgage Obligations | | | 3,070,369 | | | Model Price | | Purchase Price | | — | | — |
| Senior Floating Rate Interests | | | 451,197 | | | Third Party Pricing | | Broker Quote | | — | | — |
| Total Assets | | $ | 33,770,411 | | | | | | | | | |
Significant changes in a quote would generally result in significant changes in the fair value of the security.
The Fund’s fair valuation leveling guidelines classify a single daily broker quote, or a vendor price based on a single daily or monthly broker quote, as Level 3, if such a quote or price cannot be supported with other available market information.
Transfers between Level 2 and Level 3 may occur as markets fluctuate and/or the availability of data used in an investment’s valuation changes. For the period ended March 31, 2021, the Fund had securities with a total value of $1,000,000 transfer into Level 3 from Level 2 due to lack of observable inputs.
SEE NOTES TO FINANCIAL STATEMENTS. | THE GUGGENHEIM FUNDS SEMI-ANNUAL REPORT | 37 |
SCHEDULE OF INVESTMENTS (Unaudited)(concluded) | March 31, 2021 |
ULTRA SHORT DURATION FUND | |
Summary of Fair Value Level 3 Activity
Following is a reconciliation of Level 3 assets for which significant unobservable inputs were used to determine fair value for the period ended March 31, 2021:
| | | Assets | | | | | |
| | Asset-Backed
Securities | | | Collateralized
Mortgage
Obligations | | | Senior Floating
Rate Interests | | | Total Assets | |
Beginning Balance | | $ | 15,400,000 | | | $ | 4,875,837 | | | $ | — | | | $ | 20,275,837 | |
Purchases/(Receipts) | | | 17,150,000 | | | | 7,071,935 | | | | 494,000 | | | | 24,715,935 | |
(Sales, maturities and paydowns)/Fundings | | | (7,300,000 | ) | | | (4,835,657 | ) | | | (45,965 | ) | | | (12,181,622 | ) |
Amortization of premiums/discounts | | | — | | | | (199 | ) | | | 1,048 | | | | 849 | |
Total realized gains (losses) included in earnings | | | — | | | | (3 | ) | | | — | | | | (3 | ) |
Total change in unrealized appreciation (depreciation) included in earnings | | | — | | | | (42,699 | ) | | | 2,114 | | | | (40,585 | ) |
Transfers into Level 3 | | | 1,000,000 | | | | — | | | | — | | | | 1,000,000 | |
Transfers out of Level 3 | | | — | | | | — | | | | — | | | | — | |
Ending Balance | | $ | 26,250,000 | | | $ | 7,069,214 | | | $ | 451,197 | | | $ | 33,770,411 | |
Net change in unrealized appreciation (depreciation) for investments in Level 3 securities still held at March 31, 2021 | | $ | — | | | $ | 782 | | | $ | 2,114 | | | $ | 2,896 | |
Step Coupon Bonds
The following table discloses additional information related to step coupon bonds held by the Fund. Certain securities are subject to multiple rate changes prior to maturity. For those securities, a range of rates and corresponding dates have been provided. Rates for all step coupon bonds held by the Fund are scheduled to increase, none are scheduled to decrease.
Name | | Coupon Rate at
Next Reset Date | | | Next Rate
Reset Date | |
CSMC Trust 2020-NQM1, 1.21% due 05/25/65 | | | 2.21 | % | | | 09/26/24 | |
Verus Securitization Trust 2020-1, 2.42% due 01/25/60 | | | 3.42 | % | | | 01/26/24 | |
Verus Securitization Trust 2020-5, 1.22% due 05/25/65 | | | 2.22 | % | | | 10/26/24 | |
Verus Securitization Trust 2019-4, 2.64% due 11/25/59 | | | 3.64 | % | | | 10/26/23 | |
Verus Securitization Trust 2019-4, 2.85% due 11/25/59 | | | 3.85 | % | | | 10/26/23 | |
38 | THE GUGGENHEIM FUNDS SEMI-ANNUAL REPORT | SEE NOTES TO FINANCIAL STATEMENTS. |
STATEMENT OF ASSETS AND LIABILITIES (Unaudited) |
ULTRA SHORT DURATION FUND |
March 31, 2021
Assets: |
Investments, at value (cost $903,271,018) | | $ | 903,075,410 | |
Segregated cash with broker | | | 370,000 | |
Unamortized upfront premiums paid on interest rate swap agreements | | | 334 | |
Unrealized appreciation on OTC swap agreements | | | 859,747 | |
Unrealized appreciation on forward foreign currency exchange contracts | | | 7,769,779 | |
Prepaid expenses | | | 71,715 | |
Receivables: |
Fund shares sold | | | 2,776,636 | |
Interest | | | 1,835,011 | |
Securities sold | | | 356,498 | |
Variation margin on interest rate swap agreements | | | 6,159 | |
Foreign tax reclaims | | | 2,154 | |
Dividends | | | 1,452 | |
Total assets | | | 917,124,895 | |
| | | | | |
Liabilities: |
Overdraft due to custodian bank | | | 103,103 | |
Segregated cash due to broker | | | 4,120,354 | |
Unrealized depreciation on OTC swap agreements | | | 610,000 | |
Unrealized depreciation on forward foreign currency exchange contracts | | | 2,284,057 | |
Payable for: |
Securities purchased | | $ | 17,878,688 | |
Fund shares redeemed | | | 5,245,196 | |
Management fees | | | 181,233 | |
Swap settlement | | | 110,795 | |
Distributions to shareholders | | | 89,614 | |
Fund accounting/administration fees | | | 29,863 | |
Distribution and service fees | | | 21,936 | |
Transfer agent/maintenance fees | | | 7,235 | |
Due to Investment Adviser | | | 3,903 | |
Trustees’ fees* | | | 619 | |
Miscellaneous | | | 38,545 | |
Total liabilities | | | 30,725,141 | |
Net assets | | $ | 886,399,754 | |
| | | | | |
Net assets consist of: |
Paid in capital | | $ | 885,585,680 | |
Total distributable earnings (loss) | | | 814,074 | |
Net assets | | $ | 886,399,754 | |
| | | | | |
A-Class: |
Net assets | | $ | 106,928,239 | |
Capital shares outstanding | | | 10,729,291 | |
Net asset value per share | | $ | 9.97 | |
| | | | | |
Institutional Class: |
Net assets | | $ | 779,471,515 | |
Capital shares outstanding | | | 78,229,011 | |
Net asset value per share | | $ | 9.96 | |
* | Relates to Trustees not deemed “interested persons” within the meaning of Section 2(a)(19) of the 1940 Act. |
SEE NOTES TO FINANCIAL STATEMENTS. | THE GUGGENHEIM FUNDS SEMI-ANNUAL REPORT | 39 |
STATEMENT OF OPERATIONS (Unaudited) |
ULTRA SHORT DURATION FUND |
Six Months Ended March 31, 2021
Investment Income: |
Dividends | | $ | 628,406 | |
Interest | | | 3,875,252 | |
Total investment income | | | 4,503,658 | |
| | | | | |
Expenses: |
Management fees | | | 940,183 | |
Distribution and service fees: |
A-Class | | | 108,661 | |
Transfer agent/maintenance fees: |
A-Class | | | 16,998 | |
Institutional Class | | | 35,749 | |
Fund accounting/administration fees | | | 117,327 | |
Professional fees | | | 42,129 | |
Line of credit fees | | | 16,444 | |
Trustees’ fees* | | | 14,703 | |
Custodian fees | | | 13,824 | |
Miscellaneous | | | 42,588 | |
Recoupment of previously waived fees: |
A-Class | | | 1,375 | |
Institutional Class | | | 36,256 | |
Total expenses | | | 1,386,237 | |
Less: |
Expenses reimbursed by Adviser: |
A-Class | | | (9,919 | ) |
Institutional Class | | | (6,238 | ) |
Expenses waived by Adviser | | | (4,287 | ) |
Earnings credits applied | | | (1,122 | ) |
Total waived/reimbursed expenses | | | (21,566 | ) |
Net expenses | | | 1,364,671 | |
Net investment income | | | 3,138,987 | |
| | | | | |
Net Realized and Unrealized Gain (Loss): |
Net realized gain (loss) on: |
Investments | | $ | 2,484,048 | |
Investments sold short | | | (3,726 | ) |
Swap agreements | | | (691,117 | ) |
Futures contracts | | | 30,413 | |
Forward foreign currency exchange contracts | | | (4,217,849 | ) |
Foreign currency transactions | | | 333,672 | |
Net realized loss | | | (2,064,559 | ) |
Net change in unrealized appreciation (depreciation) on: |
Investments | | | (1,399,841 | ) |
Swap agreements | | | (43,442 | ) |
Futures contracts | | | 1,125 | |
Forward foreign currency exchange contracts | | | 3,052,010 | |
Foreign currency translations | | | (6,693 | ) |
Net change in unrealized appreciation (depreciation) | | | 1,603,159 | |
Net realized and unrealized loss | | | (461,400 | ) |
Net increase in net assets resulting from operations | | $ | 2,677,587 | |
* | Relates to Trustees not deemed “interested persons” within the meaning of Section 2(a)(19) of the 1940 Act. |
40 | THE GUGGENHEIM FUNDS SEMI-ANNUAL REPORT | SEE NOTES TO FINANCIAL STATEMENTS. |
STATEMENTS OF CHANGES IN NET ASSETS |
ULTRA SHORT DURATION FUND |
STATEMENTS OF CHANGES IN NET ASSETS |
| | Six Months Ended
March 31, 2021
(Unaudited) | | | Year Ended
September 30,
2020 | |
Increase (Decrease) in Net Assets from Operations: | | | | | | | | |
Net investment income | | $ | 3,138,987 | | | $ | 7,149,226 | |
Net realized loss on investments | | | (2,064,559 | ) | | | (109,299 | ) |
Net change in unrealized appreciation (depreciation) on investments | | | 1,603,159 | | | | 3,824,596 | |
Net increase in net assets resulting from operations | | | 2,677,587 | | | | 10,864,523 | |
| | | | | | | | | |
Distributions to shareholders: | | | | | | | | |
A-Class | | | (341,019 | ) | | | (703,568 | ) |
Institutional Class | | | (3,414,272 | ) | | | (7,411,376 | ) |
Total distributions to shareholders | | | (3,755,291 | ) | | | (8,114,944 | ) |
| | | | | | | | | |
Capital share transactions: | | | | | | | | |
Proceeds from sale of shares | | | | | | | | |
A-Class | | | 87,810,701 | | | | 98,280,201 | |
Institutional Class | | | 700,399,676 | | | | 611,120,446 | |
Distributions reinvested | | | | | | | | |
A-Class | | | 337,776 | | | | 698,604 | |
Institutional Class | | | 2,989,809 | | | | 6,175,476 | |
Cost of shares redeemed | | | | | | | | |
A-Class | | | (44,032,388 | ) | | | (67,169,591 | ) |
Institutional Class | | | (363,340,432 | ) | | | (603,110,371 | ) |
Net increase from capital share transactions | | | 384,165,142 | | | | 45,994,765 | |
Net increase in net assets | | | 383,087,438 | | | | 48,744,344 | |
| | | | | | | | | |
Net assets: | | | | | | | | |
Beginning of period | | | 503,312,316 | | | | 454,567,972 | |
End of period | | $ | 886,399,754 | | | $ | 503,312,316 | |
| | | | | | | | | |
Capital share activity: | | | | | | | | |
Shares sold | | | | | | | | |
A-Class | | | 8,798,842 | | | | 9,879,376 | |
Institutional Class | | | 70,205,000 | | | | 61,791,120 | |
Shares issued from reinvestment of distributions | | | | | | | | |
A-Class | | | 33,854 | | | | 70,360 | |
Institutional Class | | | 299,786 | | | | 622,640 | |
Shares redeemed | | | | | | | | |
A-Class | | | (4,411,780 | ) | | | (6,767,628 | ) |
Institutional Class | | | (36,420,650 | ) | | | (60,780,621 | ) |
Net increase in shares | | | 38,505,052 | | | | 4,815,247 | |
SEE NOTES TO FINANCIAL STATEMENTS. | THE GUGGENHEIM FUNDS SEMI-ANNUAL REPORT | 41 |
FINANCIAL HIGHLIGHTS |
ULTRA SHORT DURATION FUND |
This table is presented to show selected data for a share outstanding throughout each period and to assist shareholders in evaluating a Fund’s performance for the periods presented.
A-Class | | Six Months Ended
March 31, 2021a | | | Year
Ended
Sept. 30,
2020 | | | Period
Ended
Sept. 30,
2019b | |
Per Share Data |
Net asset value, beginning of period | | $ | 9.98 | | | $ | 9.97 | | | $ | 10.00 | |
Income (loss) from investment operations: |
Net investment income (loss)c | | | .03 | | | | .12 | | | | .17 | |
Net gain (loss) on investments (realized and unrealized) | | | — | | | | .03 | | | | .02 | j |
Total from investment operations | | | .03 | | | | .15 | | | | .19 | |
Less distributions from: |
Net investment income | | | (.04 | ) | | | (.14 | ) | | | (.21 | ) |
Net realized gains | | | — | | | | — | | | | (.01 | ) |
Total distributions | | | (.04 | ) | | | (.14 | ) | | | (.22 | ) |
Net asset value, end of period | | $ | 9.97 | | | $ | 9.98 | | | $ | 9.97 | |
|
Total Return | | | 0.30 | % | | | 1.52 | % | | | 1.89 | % |
Ratios/Supplemental Data |
Net assets, end of period (in thousands) | | $ | 106,928 | | | $ | 62,956 | | | $ | 31,154 | |
Ratios to average net assets: |
Net investment income (loss) | | | 0.62 | % | | | 1.20 | % | | | 2.05 | % |
Total expensesf | | | 0.61 | % | | | 0.65 | % | | | 0.61 | % |
Net expensesg,h,i | | | 0.58 | % | | | 0.61 | % | | | 0.58 | % |
Portfolio turnover rate | | | 46 | % | | | 129 | % | | | 55 | % |
42 | THE GUGGENHEIM FUNDS SEMI-ANNUAL REPORT | SEE NOTES TO FINANCIAL STATEMENTS. |
FINANCIAL HIGHLIGHTS (continued) |
ULTRA SHORT DURATION FUND |
This table is presented to show selected data for a share outstanding throughout each period and to assist shareholders in evaluating a Fund’s performance for the periods presented.
Institutional Class | | Six Months Ended
March 31, 2021a | | | Year
Ended
Sept. 30,
2020 | | | Year
Ended
Sept. 30,
2019e | | | Year
Ended
Sept. 30,
2018e | | | Year
Ended
Sept. 30,
2017e | | | Year
Ended
Sept. 30,
2016e | |
Per Share Data |
Net asset value, beginning of period | | $ | 9.98 | | | $ | 9.96 | | | $ | 10.01 | | | $ | 10.04 | | | $ | 9.99 | | | $ | 9.95 | |
Income (loss) from investment operations: |
Net investment income (loss)c | | | .04 | | | | .15 | | | | .28 | | | | .24 | | | | .17 | | | | .14 | |
Net gain (loss) on investments (realized and unrealized) | | | (.01 | ) | | | .04 | | | | (.04 | ) | | | — | | | | .06 | | | | .04 | |
Total from investment operations | | | .03 | | | | .19 | | | | .24 | | | | .24 | | | | .23 | | | | .18 | |
Less distributions from: |
Net investment income | | | (.05 | ) | | | (.17 | ) | | | (.28 | ) | | | (.27 | ) | | | (.18 | ) | | | (.14 | ) |
Net realized gains | | | — | | | | — | | | | (.01 | ) | | | — | d | | | — | | | | — | |
Total distributions | | | (.05 | ) | | | (.17 | ) | | | (.29 | ) | | | (.27 | ) | | | (.18 | ) | | | (.14 | ) |
Net asset value, end of period | | $ | 9.96 | | | $ | 9.98 | | | $ | 9.96 | | | $ | 10.01 | | | $ | 10.04 | | | $ | 9.99 | |
|
Total Return | | | 0.32 | % | | | 1.88 | % | | | 2.37 | % | | | 2.48 | % | | | 2.24 | % | | | 1.95 | % |
Ratios/Supplemental Data |
Net assets, end of period (in thousands) | | $ | 779,472 | | | $ | 440,356 | | | $ | 423,414 | | | $ | 356,128 | | | $ | 426,592 | | | $ | 407,371 | |
Ratios to average net assets: |
Net investment income (loss) | | | 0.86 | % | | | 1.47 | % | | | 2.54 | % | | | 2.44 | % | | | 1.73 | % | | | 1.37 | % |
Total expensesf | | | 0.34 | % | | | 0.38 | % | | | 0.30 | % | | | 0.07 | % | | | 0.08 | % | | | 0.07 | % |
Net expensesg,h,i | | | 0.33 | % | | | 0.36 | % | | | 0.29 | % | | | 0.07 | % | | | 0.08 | % | | | 0.07 | % |
Portfolio turnover rate | | | 46 | % | | | 129 | % | | | 55 | % | | | 74 | % | | | 65 | % | | | 66 | % |
SEE NOTES TO FINANCIAL STATEMENTS. | THE GUGGENHEIM FUNDS SEMI-ANNUAL REPORT | 43 |
FINANCIAL HIGHLIGHTS (concluded) |
ULTRA SHORT DURATION FUND |
a | Unaudited figures for the period ended March 31, 2021. Percentage amounts for the period, except total return and portfolio turnover rate, have been annualized. |
b | Since commencement of operations: November 30, 2018. Percentage amounts for the period, except total return and portfolio turnover rate, have been annualized. |
c | Net investment income (loss) per share was computed using average shares outstanding throughout the period. |
d | Distributions from realized gains are less than $0.01 per share. |
e | The per share data for the years ended September 30, 2016 through September 30, 2018 and the period October 1, 2018 to November 30, 2018 has been restated to reflect the reorganization of the Guggenheim Strategy Fund I with and into the Guggenheim Ultra Short Duration Fund effective November 30, 2018. In conjunction with the reorganization, Guggenheim Ultra Short Duration Fund issued 2.501601322 Institutional Class shares for every 1 share of Guggenheim Strategy Fund I. |
f | Does not include expenses of the underlying funds in which the Fund invests. |
g | Net expense information reflects the expense ratios after expense waivers and reimbursements, as applicable. |
h | The portion of the ratios of net expenses to average net assets attributable to recoupments of prior fee reductions or expense reimbursements for the periods presented was as follows: |
| | | 03/31/21a | 09/30/20 | 09/30/19 | | |
| | A-Class | 0.00%* | 0.00%* | — | | |
| | Institutional Class | 0.01% | 0.00%* | 0.00%* | | |
i | Net expenses may include expenses that are excluded from the expense limitation agreement. Excluding these expenses, the net expense ratios for the periods presented would be: |
| | | 03/31/21a | 09/30/20 | 09/30/19 | 09/30/18 | 09/30/17 | 09/30/16 |
| | A-Class | 0.58% | 0.58% | 0.58% | N/A | N/A | N/A |
| | Institutional Class | 0.33% | 0.33% | 0.29% | 0.07% | 0.08% | 0.07% |
j | The amount shown for a share outstanding throughout the period does not agree with the aggregate net loss on investments for the period because of the sales and repurchases of fund shares in relation to fluctuating market value of the investments of the Fund. |
44 | THE GUGGENHEIM FUNDS SEMI-ANNUAL REPORT | SEE NOTES TO FINANCIAL STATEMENTS. |
NOTES TO FINANCIAL STATEMENTS (Unaudited) |
Note 1 – Organization and Significant Accounting Policies
Organization
Guggenheim Funds Trust (the “Trust”), a Delaware statutory trust, is registered with the SEC under the Investment Company Act of 1940 (“1940 Act”), as an open-ended investment company of the series type. Each series, in effect, is representing a separate fund. The Trust may issue an unlimited number of authorized shares. The Trust accounts for the assets of each fund separately.
The Trust offers a combination of five separate classes of shares: A-Class shares, C-Class shares, P-Class shares, R6-Class shares and Institutional Class shares. Sales of shares of each Class are made without a front-end sales charge at the net asset value per share (“NAV”), with the exception of A-Class shares. A-Class shares are sold at the NAV, plus the applicable front-end sales charge. The sales charge varies depending on the amount purchased. A-Class share purchases of $1 million or more are exempt from the front-end sales charge but have a 1% contingent deferred sales charge (“CDSC”), if shares are redeemed within 12 months of purchase. C-Class shares have a 1% CDSC if shares are redeemed within 12 months of purchase. C-Class shares automatically convert to A-Class shares on or about the 10th day of the month following the 10-year anniversary of the purchase of the C-Class shares. This conversion will be executed without any sales charge, fee or other charge. After the conversion is completed, the shares will be subject to all features and expenses of A-Class shares. Institutional Class shares are offered primarily for direct investment by institutions such as pension and profit sharing plans, endowments, foundations and corporations. Institutional Class shares require a minimum initial investment of $2 million and a minimum account balance of $1 million. R6-Class shares are offered primarily through qualified retirement and benefit plans. R6-Class shares are also offered through certain other plans and platforms sponsored by financial intermediaries. Certain institutional investors and others deemed appropriate by Guggenheim Investments (“GI”) may also be eligible to purchase R6-Class shares subject to a $2 million minimum initial investment. At March 31, 2021, the Trust consisted of nineteen funds (the “Funds”).
This report covers the Ultra Short Duration Fund (the “Fund”), a diversified investment company. At March 31, 2021, only A-Class and Institutional Class shares have been issued by the Fund.
Guggenheim Partners Investment Management, LLC (“GPIM”), which operates under the name Guggenheim Investments, provides advisory services. Guggenheim Funds Distributors, LLC (“GFD”) acts as principal underwriter for the Trust. GI and GFD are affiliated entities.
Significant Accounting Policies
The Fund operates as an investment company and, accordingly, follows the investment company accounting and reporting guidance of the Financial Accounting Standards Board (“FASB”) Accounting Standards Codification Topic 946 Financial Services – Investment Companies.
| | THE GUGGENHEIM FUNDS SEMI-ANNUAL REPORT | 45 |
NOTES TO FINANCIAL STATEMENTS (Unaudited)(continued) |
The following significant accounting policies are in conformity with U.S. generally accepted accounting principles (“U.S. GAAP”) and are consistently followed by the Trust. This requires management to make estimates and assumptions that affect the reported amount of assets and liabilities, contingent assets and liabilities at the date of the financial statements, and the reported amounts of revenues and expenses during the reporting period. Actual results could differ from these estimates. All time references are based on Eastern Time.
The NAV of each Class of the Fund is calculated by dividing the market value of the Fund’s securities and other assets, less all liabilities, attributable to the Class by the number of outstanding shares of the Class.
(a) Valuation of Investments
The Board of Trustees of the Fund (the “Board”) has adopted policies and procedures for the valuation of the Fund’s investments (the “Valuation Procedures”). Pursuant to the Valuation Procedures, the Board has delegated to a valuation committee, consisting of representatives from Guggenheim’s investment management, fund administration, legal and compliance departments (the “Valuation Committee”), the day-to-day responsibility for implementing the Valuation Procedures, including, under most circumstances, the responsibility for determining the fair value of the Fund’s securities and/or other assets.
Valuations of the Fund’s securities and other assets are supplied primarily by pricing services appointed pursuant to the processes set forth in the Valuation Procedures. The Valuation Committee convenes monthly, or more frequently as needed, to review the valuation of all assets which have been fair valued for reasonableness. The Fund’s officers, through the Valuation Committee and consistent with the monitoring and review responsibilities set forth in the Valuation Procedures, regularly review procedures used and valuations provided by the pricing services.
If the pricing service cannot or does not provide a valuation for a particular investment or such valuation is deemed unreliable, such investment is fair valued by the Valuation Committee.
Generally, trading in foreign securities markets is substantially completed each day at various times prior to the close of the New York Stock Exchange (“NYSE”). The values of foreign securities are determined as of the close of such foreign markets or the close of the NYSE, if earlier. All investments quoted in foreign currencies are valued in U.S. dollars on the basis of the foreign currency exchange rates prevailing at the close of U.S. business at 4:00 p.m. Investments in foreign securities may involve risks not present in domestic investments. The Valuation Committee will determine the current value of such foreign securities by taking into consideration certain factors which may include those discussed above, as well as the following factors, among others: the value of the securities traded on other foreign markets, ADR trading, closed-end fund trading, foreign currency exchange activity, and the trading prices of financial products that are
46 | THE GUGGENHEIM FUNDS SEMI-ANNUAL REPORT | |
NOTES TO FINANCIAL STATEMENTS (Unaudited)(continued) |
tied to foreign securities. In addition, under the Valuation Procedures, the Valuation Committee and GI are authorized to use prices and other information supplied by a third party pricing vendor in valuing foreign securities.
Open-end investment companies are valued at their NAV as of the close of business, on the valuation date. Exchange-traded funds are valued at the last quoted sale price.
U.S. Government securities are valued by independent pricing services, the last traded fill price, or at the reported bid price at the close of business.
Debt securities with a maturity of greater than 60 days at acquisition are valued at prices that reflect broker-dealer supplied valuations or are obtained from independent pricing services, which may consider the trade activity, treasury spreads, yields or price of bonds of comparable quality, coupon, maturity, and type, as well as prices quoted by dealers who make markets in such securities. Short-term debt securities with a maturity of 60 days or less at acquisition are valued at amortized cost, provided such amount approximates market value.
Typically, loans are valued using information provided by an independent third party pricing service that uses broker quotes, among other inputs. If the pricing service cannot or does not provide a valuation for a particular loan, or such valuation is deemed unreliable, such investment is valued based on a quote from a broker-dealer or is fair valued by the Valuation Committee.
The value of futures contracts is accounted for using the unrealized appreciation or depreciation on the contracts that is determined by marking the contracts to their current realized settlement prices. Financial futures contracts are valued at the 4:00 p.m. price on the valuation date. In the event that the exchange for a specific futures contract closes earlier than 4:00 p.m., the futures contract is valued at the official settlement price of the exchange. However, the underlying securities from which the futures contract value is derived are monitored until 4:00 p.m. to determine if fair valuation would provide a more accurate valuation.
The value of interest rate swap agreements entered into by the Fund is accounted for using the unrealized appreciation or depreciation on the agreements that is determined using the previous day’s Chicago Mercantile Exchange close price, adjusted for the current day’s spreads.
The values of other swap agreements entered into by the Fund are accounted for using the unrealized appreciation or depreciation on the agreements that are determined by marking the agreements to the last quoted value of the index or other underlying position that the swaps pertain to at the close of the NYSE.
Forward foreign currency exchange contracts are valued daily based on the applicable exchange rate of the underlying currency.
Investments for which market quotations are not readily available are fair-valued as determined in good faith by GI, subject to review and approval by the Valuation Committee, pursuant to methods established or ratified by the Board. Valuations in accordance with these methods are
| | THE GUGGENHEIM FUNDS SEMI-ANNUAL REPORT | 47 |
NOTES TO FINANCIAL STATEMENTS (Unaudited)(continued) |
intended to reflect each security’s (or asset’s or liability’s) “fair value”. Each such determination is based on a consideration of all relevant factors, which are likely to vary from one pricing context to another. Examples of such factors may include, but are not limited to market prices; sale prices; broker quotes; and models which derive prices based on inputs such as prices of securities with comparable maturities and characteristics, or based on inputs such as anticipated cash flows or collateral, spread over U.S. Treasury securities, and other information analysis. In connection with futures contracts and other derivative investments, such factors may include obtaining information as to how (a) these contracts and other derivative investments trade in the futures or other derivative markets, respectively, and (b) the securities underlying these contracts and other derivative investments trade in the cash market.
(b) U.S. Government and Agency Obligations
Certain U.S. Government and Agency Obligations are traded on a discount basis; the interest rates shown on the Schedule of Investments reflect the effective rates paid at the time of purchase by the Fund. Other securities bear interest at the rates shown, payable at fixed dates through maturity.
(c) Senior Floating Rate Interests and Loan Investments
Senior floating rate interests in which the Fund invests generally pay interest rates which are periodically adjusted by reference to a base short-term floating rate, plus a premium. These base lending rates are generally (i) the lending rate offered by one or more major European banks, such as the one-month or three-month London Inter-Bank Offered Rate (“LIBOR”), (ii) the prime rate offered by one or more major United States banks, or (iii) the bank’s certificate of deposit rate. Senior floating rate interests often require prepayments from excess cash flows or permit the borrower to repay at its election. The rate at which the borrower repays cannot be predicted with accuracy. As a result, the actual remaining maturity may be substantially less than the stated maturities disclosed in the Fund’s Schedule of Investments.
The Fund invests in loans and other similar debt obligations (“obligations”). A portion of the Fund’s investments in these obligations is sometimes referred to as “covenant lite” loans or obligations (“covenant lite obligations”), which are obligations that lack covenants or possess fewer or less restrictive covenants or constraints on borrowers than certain other types of obligations. The Fund may also obtain exposure to covenant lite obligations through investment in securitization vehicles and other structured products. In recent market conditions, many new or reissued obligations have not featured traditional covenants, which are intended to protect lenders and investors by (i) imposing certain restrictions or other limitations on a borrower’s operations or assets or (ii) providing certain rights to lenders. The Fund may have fewer rights with respect to covenant lite obligations, including fewer protections against the possibility of default and fewer remedies in the event of default. As a result, investments in (or exposure to) covenant lite obligations are subject to more risk than investments in (or exposure to) certain other types of obligations. The Fund is subject to other risks associated with investments in (or
48 | THE GUGGENHEIM FUNDS SEMI-ANNUAL REPORT | |
NOTES TO FINANCIAL STATEMENTS (Unaudited)(continued) |
exposure to) obligations, including that obligations may not be considered “securities” and, as a result, the Fund may not be entitled to rely on the anti-fraud protections under the federal securities laws and instead may have to resort to state law and direct claims.
(d) Interest on When-Issued Securities
The Fund may purchase and sell interests in securities on a when-issued and delayed delivery basis, with payment and delivery scheduled for a future date. No income accrues to the Fund on such interests or securities in connection with such transactions prior to the date the Fund actually takes delivery of such interests or securities. These transactions are subject to market fluctuations and are subject to the risk that the value at delivery may be more or less than the trade date purchase price. Although the Fund will generally purchase these securities with the intention of acquiring such securities, it may sell such securities before the settlement date.
(e) Short Sales
When the Fund engages in a short sale of a security, an amount equal to the proceeds is reflected as an asset and an equivalent liability. The amount of the liability is subsequently marked-to-market to reflect the market value of the short sale. The Fund maintains a segregated account of cash and/or securities as collateral for short sales.
Fees, if any, paid to brokers to borrow securities in connection with short sales are recorded as interest expense. In addition, the Fund must pay out the dividend rate of the equity or coupon rate of the obligation to the lender and record this as an expense. Short dividend or interest expense is a cost associated with the investment objective of short sales transactions, rather than an operational cost associated with the day-to-day management of any mutual fund. The Fund may also receive rebate income from the broker resulting from the investment of the proceeds from securities sold short.
(f) Futures Contracts
Upon entering into a futures contract, the Fund deposits and maintains as collateral such initial margin as required by the exchange on which the transaction is affected. Pursuant to the contract, the Fund agrees to receive from or pay to the broker an amount of cash equal to the daily fluctuation in value of the contract. Such receipts or payments are known as variation margin and are recorded by the Fund as unrealized appreciation or depreciation. When the contract is closed, the Fund records a realized gain or loss equal to the difference between the value of the contract at the time it was opened and the value at the time it was closed.
(g) Swap Agreements
Swap agreements are marked-to-market daily and the change, if any, is recorded as unrealized appreciation or depreciation. Payments received or made as a result of an agreement or termination of an agreement are recognized as realized gains or losses.
| | THE GUGGENHEIM FUNDS SEMI-ANNUAL REPORT | 49 |
NOTES TO FINANCIAL STATEMENTS (Unaudited)(continued) |
Upon entering into certain centrally-cleared swap transactions, a Fund is required to deposit with its clearing broker an amount of cash or securities as an initial margin. Subsequent variation margin receipts or payments are received or made by the Fund depending on fluctuations in the fair value of the reference entity and are recorded by the Fund as unrealized appreciation or depreciation. When the contract is closed, the Fund records a realized gain or loss equal to the difference between the value of the contract at the time it was opened and the value at the time it was closed.
Upfront payments received or made by a Fund on credit default swap agreements and interest rate swap agreements are amortized over the expected life of the agreement. Periodic payments received or paid by a Fund are recorded as realized gains or losses. Payments received or made as a result of a credit event or termination of the contract are recognized, net of a proportional amount of the upfront payment, as realized gains or losses.
(h) Currency Translations
The accounting records of the Fund are maintained in U.S. dollars. All assets and liabilities initially expressed in foreign currencies are converted into U.S. dollars at prevailing exchange rates. Purchases and sales of investment securities, dividend and interest income, and certain expenses are translated at the rates of exchange prevailing on the respective dates of such transactions. Changes in the relationship of these foreign currencies to the U.S. dollar can significantly affect the value of the investments and earnings of the Fund. Foreign investments may also subject the Fund to foreign government exchange restrictions, expropriation, taxation, or other political, social or economic developments, all of which could affect the market and/or credit risk of the investments.
The Fund does not isolate that portion of the results of operations resulting from changes in the foreign exchange rates on investments from the fluctuations arising from changes in the market prices of securities held. Such fluctuations are included with the net realized gain or loss and unrealized appreciation or depreciation on investments.
Reported net realized foreign exchange gains and losses arise from sales of foreign currencies and currency gains or losses realized between the trade and settlement dates on investment transactions. Net unrealized appreciation and depreciation arise from changes in the fair values of assets and liabilities other than investments in securities at the fiscal period end, resulting from changes in exchange rates.
(i) Forward Foreign Currency Exchange Contracts
The change in value of a forward foreign currency exchange contract is recorded as unrealized appreciation or depreciation until the contract is closed. When the contract is closed, the Fund records a realized gain or loss equal to the difference between the value at the time the contract was opened and the value at the time it was closed.
50 | THE GUGGENHEIM FUNDS SEMI-ANNUAL REPORT | |
NOTES TO FINANCIAL STATEMENTS (Unaudited)(continued) |
(j) Foreign Taxes
The Fund may be subject to foreign taxes (a portion of which may be reclaimable) on income, stock dividends, capital gains on investments or certain foreign currency transactions. All foreign taxes are recorded in accordance with the applicable foreign tax regulations and rates that exist in the foreign jurisdictions in which the Fund invests. These foreign taxes, if any, are paid by the Fund and reflected in its Statement of Operations as follows: foreign taxes withheld at source are presented as a reduction of income and foreign taxes on capital gains from sales of investments are included with the net realized gain (loss) on investments. Foreign taxes payable or deferred as of March 31, 2021, if any, are disclosed in the Fund’s Statement of Assets and Liabilities.
(k) Security Transactions
Security transactions are recorded on the trade date for financial reporting purposes. Realized gains and losses from securities transactions are recorded using the identified cost basis. Proceeds from lawsuits related to investment holdings are recorded as a reduction to cost if the securities are still held and as realized gains if no longer held in the Fund. Dividend income is recorded on the ex-dividend date, net of applicable taxes withheld by foreign countries, if any. Taxable non-cash dividends are recorded as dividend income. Interest income, including amortization of premiums and accretion of discounts, is accrued on a daily basis. Interest income also includes paydown gains and losses on mortgage-backed and asset-backed securities and senior and subordinated loans. Amendment fees are earned as compensation for evaluating and accepting changes to the original loan agreement and are recognized when received.
Income from residual collateralized loan obligations is recognized using the effective interest method. At the time of purchase, management estimates the future expected cash flows and determines the effective yield and estimated maturity date based on the estimated cash flows. Subsequent to the purchase, the estimated cash flows are updated periodically and a revised yield is calculated prospectively.
The Fund may receive other income from investments in senior loan interests including amendment fees, consent fees and commitment fees. For funded loans, these fees are recorded as income when received by the Fund and included in interest income on the Statement of Operations. For unfunded loans, commitment fees are included in realized gain on investments on the Statement of Operations at the end of the commitment period.
(l) Distributions
The Fund declares dividends from investment income daily. The Fund pays its shareholders from its net investment income monthly and distributes any net capital gains that it has realized, at least annually. Distributions to shareholders are recorded on the ex-dividend date. Dividends are reinvested in additional shares, unless shareholders request payment in cash. The character of distributions made during the year from net investment income or net realized gains may differ from their ultimate characterization for U.S. federal income tax purposes.
| | THE GUGGENHEIM FUNDS SEMI-ANNUAL REPORT | 51 |
NOTES TO FINANCIAL STATEMENTS (Unaudited)(continued) |
(m) Class Allocations
Interest and dividend income, most expenses, all realized gains and losses, and all unrealized appreciation and depreciation are allocated to the classes based upon the value of the outstanding shares in each Class. Certain costs, such as distribution and service fees are charged directly to specific classes. In addition, certain expenses have been allocated to the individual Funds in the Trust based on the respective net assets of each Fund included in the Trust.
(n) Earnings Credits
Under the fee arrangement with the custodian, the Fund may earn credits based on overnight custody cash balances. These credits are utilized to reduce related custodial expenses. The custodian fees disclosed in the Statement of Operations are before the reduction in expense from the related earnings credits, if any. Earnings credits for the period ended March 31, 2021, are disclosed in the Statement of Operations.
(o) Cash
The Fund may leave cash overnight in its cash account with the custodian. Periodically, the Fund may have cash due to the custodian bank as an overdraft balance. A fee is incurred on this overdraft, calculated by multiplying the overdraft by a rate based on the federal funds rate, which was 0.06% at March 31, 2021.
(p) Indemnifications
Under the Fund’s organizational documents, its Trustees and Officers are indemnified against certain liabilities arising out of the performance of their duties to the Trust. In addition, throughout the normal course of business, the Fund enters into contracts that contain a variety of representations and warranties which provide general indemnifications. The Fund’s maximum exposure under these arrangements is unknown, as this would involve future claims that may be made against the Fund and/or its affiliates that have not yet occurred. However, based on experience, the Fund expects the risk of loss to be remote.
Note 2 – Financial Instruments and Derivatives
As part of its investment strategy, the Fund utilizes short sales and a variety of derivative instruments. These investments involve, to varying degrees, elements of market risk and risks in excess of amounts recognized on the Statement of Assets and Liabilities. Valuation and accounting treatment of these instruments can be found under Significant Accounting Policies in Note 1 of these Notes to Financial Statements.
52 | THE GUGGENHEIM FUNDS SEMI-ANNUAL REPORT | |
NOTES TO FINANCIAL STATEMENTS (Unaudited)(continued) |
Short Sales
A short sale is a transaction in which the Fund sells a security it does not own. If the security sold short decreases in price between the time the Fund sells the security and closes its short position, the Fund will realize a gain on the transaction. Conversely, if the security increases in price during the period, the Fund will realize a loss on the transaction. The risk of such price increases is the principal risk of engaging in short sales.
Derivatives
Derivatives are instruments whose values depend on, or are derived from, in whole or in part, the value of one or more other assets, such as securities, currencies, commodities or indices. Derivative instruments may be used to increase investment flexibility (including to maintain cash reserves while maintaining exposure to certain other assets), for risk management (hedging) purposes, to facilitate trading, to reduce transaction costs and to pursue higher investment returns. Derivative instruments may also be used to mitigate certain investment risks, such as foreign currency exchange rate risk, interest rate risk and credit risk. U.S. GAAP requires disclosures to enable investors to better understand how and why a Fund uses derivative instruments, how these derivative instruments are accounted for and their effects on the Fund’s financial position and results of operations.
The Fund utilized derivatives for the following purposes:
Duration: the use of an instrument to manage the interest rate risk of a portfolio.
Hedge: an investment made in order to reduce the risk of adverse price movements in a security, by taking an offsetting position to protect against broad market moves.
Income: the use of any instrument that distributes cash flows typically based upon some rate of interest.
Futures Contracts
A futures contract is an agreement to purchase (long) or sell (short) an agreed amount of securities or other instruments at a set price for delivery at a future date. There are significant risks associated with a Fund’s use of futures contracts, including (i) there may be an imperfect or no correlation between the changes in market value of the underlying asset and the prices of futures contracts; (ii) there may not be a liquid secondary market for a futures contract; (iii) trading restrictions or limitations may be imposed by an exchange; and (iv) government regulations may restrict trading in futures contracts. When investing in futures, there is minimal counterparty credit risk to a Fund because futures are exchange-traded and the exchange’s clearinghouse, as counterparty to all exchange-traded futures, guarantees against default. Cash deposits are shown as segregated cash with broker on the Statement of Assets and Liabilities; securities held as collateral are noted on the Schedule of Investments.
| | THE GUGGENHEIM FUNDS SEMI-ANNUAL REPORT | 53 |
NOTES TO FINANCIAL STATEMENTS (Unaudited)(continued) |
The following table represents the Fund’s use and volume of futures on a monthly basis:
| | | Average Notional Amount | |
Use | | Long | | | Short | |
Duration, Income | | $ | — | | | $ | 10,539,604 | |
Swap Agreements
A swap is an agreement that obligates two parties to exchange a series of cash flows at specified intervals based upon or calculated by reference to changes in specified prices or rates for a specified amount of an underlying asset. When utilizing over-the-counter (“OTC”) swaps, the Fund bears the risk of loss of the amount expected to be received under a swap agreement in the event of the default or bankruptcy of a swap agreement counterparty or if the underlying asset declines in value. Certain standardized swaps are subject to mandatory central clearing and are executed on a multi-lateral or other trade facility platform, such as a registered exchange. There is limited counterparty credit risk with respect to centrally-cleared swaps as the transaction is facilitated through a central clearinghouse, much like exchange-traded futures contracts. For a Fund utilizing centrally-cleared swaps, the exchange bears the risk of loss resulting from a counterparty not being able to pay. There is no guarantee that a fund or an underlying fund could eliminate its exposure under an outstanding swap agreement by entering into an offsetting swap agreement with the same or another party.
Total return swaps involve commitments where single or multiple cash flows are exchanged based on the price of an underlying reference asset (such as an index) for a fixed or variable interest rate. Total return swaps will usually be computed based on the current value of the reference asset as of the close of regular trading on the NYSE or other exchange, with the swap value being adjusted to include dividends accrued, financing charges and/or interest associated with the swap agreement. When utilizing total return swaps, the Fund bears the risk of loss of the amount expected to be received under a swap agreement in the event of the default or bankruptcy of a swap agreement counterparty or if the underlying reference asset declines in value.
The following table represents the Fund’s use and volume of total return swaps on a monthly basis:
| | | Average Notional Amount | |
Use | | Long | | | Short | |
Income | | $ | 516,119 | | | $ | 55,749,704 | |
Interest rate swaps involve the exchange by the Fund with another party for its respective commitment to pay or receive a fixed or variable interest rate on a notional amount of principal. Interest rate swaps are generally centrally-cleared, but central clearing does not make interest rate swap transactions risk free.
54 | THE GUGGENHEIM FUNDS SEMI-ANNUAL REPORT | |
NOTES TO FINANCIAL STATEMENTS (Unaudited)(continued) |
The following table represents the Fund’s use and volume of interest rate swaps on a monthly basis:
| | | Average Notional Amount | |
Use | | Pay Floating Rate | | | Receive Floating Rate | |
Duration, Hedge | | $ | — | | | $ | 750,000 | |
Forward Foreign Currency Exchange Contracts
A forward foreign currency exchange contract is an agreement between two parties to exchange two designated currencies at a specific time in the future. Certain types of contracts may be cash settled, in an amount equal to the change in exchange rates during the term of the contract. The contracts can be used to hedge or manage exposure to foreign currency risks with portfolio investments or to gain exposure to foreign currencies.
The market value of a forward foreign currency exchange contract changes with fluctuations in foreign currency exchange rates. Furthermore, the Fund may be exposed to risk if the counterparties cannot meet the contract terms or if the currency value changes unfavorably as compared to the U.S. dollar.
The following table represents the Fund’s use and volume of forward foreign currency exchange contracts on a monthly basis:
| | | Average Value | |
Use | | Purchased | | | Sold | |
Hedge, Income | | $ | 61,321,910 | | | $ | 232,687,641 | |
Derivative Investment Holdings Categorized by Risk Exposure
The following is a summary of the location of derivative investments on the Fund’s Statement of Assets and Liabilities as of March 31, 2021:
Derivative Investment Type | Asset Derivatives | Liability Derivatives |
Interest Rate contracts | Unrealized appreciation on OTC swap agreements | Unrealized depreciation on OTC swap agreements |
| | Unamortized upfront premiums paid on interest rate swap agreements | |
| | Variation margin on interest rate swap agreements | |
Currency contracts | Unrealized appreciation on forward foreign currency exchange contracts | Unrealized depreciation on forward foreign currency exchange contracts |
| | THE GUGGENHEIM FUNDS SEMI-ANNUAL REPORT | 55 |
NOTES TO FINANCIAL STATEMENTS (Unaudited)(continued) |
The following tables set forth the fair value of the Fund’s derivative investments categorized by primary risk exposure at March 31, 2021:
Asset Derivative Investments Value |
| | Swaps
Interest Rate
Risk* | | | Forward
Foreign Currency
Exchange Risk | | | Total Value at
March 31,
2021 | | |
| | | $ | 911,854 | | | $ | 7,769,779 | | | $ | 8,681,633 | | |
Liability Derivative Investments Value |
| | Swaps
Interest Rate
Risk* | | | Forward
Foreign Currency
Exchange Risk | | | Total Value at
March 31,
2021 | | |
| | | $ | 610,000 | | | $ | 2,284,057 | | | $ | 2,894,057 | | |
* | Includes cumulative appreciation (depreciation) of exchange-traded, OTC and centrally-cleared derivatives contracts as reported on the Schedule of Investments. For exchange-traded and centrally-cleared derivatives, variation margin is reported within the Statement of Assets and Liabilities. |
The following is a summary of the location of derivative investments on the Fund’s Statement of Operations for the period ended March 31, 2021:
Derivative Investment Type | Location of Gain (Loss) on Derivatives |
Interest Rate contracts | Net realized gain (loss) on futures contracts |
| Net change in unrealized appreciation (depreciation) on futures contracts |
Interest Rate/Credit contracts | Net realized gain (loss) on swap agreements |
| | Net change in unrealized appreciation (depreciation) on swap agreements |
Currency contracts | Net realized gain (loss) on forward foreign currency exchange contracts |
| | Net change in unrealized appreciation (depreciation) on forward foreign currency exchange contracts |
56 | THE GUGGENHEIM FUNDS SEMI-ANNUAL REPORT | |
NOTES TO FINANCIAL STATEMENTS (Unaudited)(continued) |
The following is a summary of the Fund’s realized gain (loss) and change in unrealized appreciation (depreciation) on derivative investments recognized on the Statement of Operations categorized by primary risk exposure for the period ended March 31, 2021:
Realized Gain (Loss) on Derivative Investments Recognized on the Statement of Operations |
| | Futures
Interest Rate
Risk | | | Swaps
Interest Rate
Risk | | | Swaps
Credit
Risk | | | Forward
Foreign
Currency
Exchange
Risk | | | Total | |
| | | $ | 30,413 | | | $ | (697,921 | ) | | $ | 6,804 | | | $ | (4,217,849 | ) | | $ | (4,878,553 | ) |
Change in Unrealized Appreciation (Depreciation) on Derivative Investments Recognized on the Statement of Operations |
| | Futures
Interest Rate
Risk | | | Swaps
Interest Rate
Risk | | | Swaps
Credit
Risk | | | Forward
Foreign
Currency
Exchange
Risk | | | Total | |
| | | $ | 1,125 | | | $ | (43,442 | ) | | $ | — | | | $ | 3,052,010 | | | $ | 3,009,693 | |
In conjunction with the use of short sales and derivative instruments, the Fund is required to maintain collateral in various forms. Depending on the financial instrument utilized and the broker involved, the Fund uses margin deposits at the broker, cash and/or securities segregated at the custodian bank, discount notes or repurchase agreements allocated to the Fund as collateral.
Foreign Investments
There are several risks associated with exposure to foreign currencies, foreign issuers and emerging markets. A fund’s indirect and direct exposure to foreign currencies subjects the Fund the risk that those currencies will decline in value relative to the U.S. dollar, or in the case of short positions, that the U.S. dollar will decline in value relative to the currency being hedged. Currency rates in foreign countries may fluctuate significantly over short periods of time for a number of reasons, including changes in interest rates and the imposition of currency controls or other political developments in the U.S. or abroad. In addition, the Fund may incur transaction costs connection with conversions between various currencies. The Fund may, but is not obligated to, engage in currency hedging transactions, which generally involve buying currency forward, options or futures contracts. However, not all currency risks may be effectively hedged, and in some cases the costs of hedging techniques may outweigh expected benefits. In such instances, the value of securities denominated in foreign currencies can change significantly when foreign currencies strengthen or weaken relative to the U.S. dollar.
| | THE GUGGENHEIM FUNDS SEMI-ANNUAL REPORT | 57 |
NOTES TO FINANCIAL STATEMENTS (Unaudited)(continued) |
The Fund may invest in securities of foreign companies directly, or in financial instruments, such as ADRs and exchange-traded funds, which are indirectly linked to the performance of foreign issuers. Foreign markets can be more volatile than the U.S. market due to increased risks of adverse issuer, political, regulatory, market, or economic developments and can perform differently from the U.S. market. Investing in securities of foreign companies directly, or in financial instruments that are indirectly linked to the performance of foreign issuers, may involve risks not typically associated with investing in U.S. issuers. The value of securities denominated foreign currencies, and of dividends from such securities, can change significantly when foreign currencies strengthen or weaken relative to the U.S. dollar. Foreign securities markets generally have less trading volume and less liquidity than U.S. markets, and prices in some foreign markets may fluctuate more than those of securities traded on U.S. markets. Many foreign countries lack accounting and disclosure standards comparable to those that apply to U.S. companies, and it may be more difficult to obtain reliable information regarding a foreign issuer’s financial condition and operations. Transaction costs and costs associated with custody services are generally higher for foreign securities than they are for U.S. securities. Some foreign governments levy withholding taxes against dividend and interest income. Although in some countries portions of these taxes are recoverable, the non-recovered portion will reduce the income received by the Fund.
The Trust has established counterparty credit guidelines and enters into transactions only with financial institutions of investment grade or better. The Trust monitors the counterparty credit risk.
Note 3 – Offsetting
In the normal course of business, the Fund enters into transactions subject to enforceable master netting arrangements or other similar arrangements. Generally, the right to offset in those agreements allows the Fund to counteract the exposure to a specific counterparty with collateral received from or delivered to that counterparty based on the terms of the arrangements. These arrangements provide for the right to liquidate upon the occurrence of an event of default, credit event upon merger or additional termination event.
In order to better define its contractual rights and to secure rights that will help the Fund mitigate its counterparty risk, the Fund may enter into an International Swaps and Derivatives Association, Inc. Master Agreement (“ISDA Master Agreement”) or similar agreement with its derivative contract counterparties. An ISDA Master Agreement is a bilateral agreement between a fund and a counterparty that governs OTC derivatives, including foreign exchange contracts, and typically contains, among other things, collateral posting terms and netting provisions in the event of a default and/or termination event. The provisions of the ISDA Master Agreement typically permit a single net payment in the event of a default (close-out netting) or similar event, including the bankruptcy or insolvency of the counterparty.
58 | THE GUGGENHEIM FUNDS SEMI-ANNUAL REPORT | |
NOTES TO FINANCIAL STATEMENTS (Unaudited)(continued) |
For derivatives traded under an ISDA Master Agreement, the collateral requirements are typically calculated by netting the mark-to-market amount for each transaction under such agreement and comparing that amount to the value of any collateral currently pledged by the Fund and the counterparty. For financial reporting purposes, cash collateral that has been pledged to cover obligations of the Fund and cash collateral received from the counterparty, if any, are reported separately on the Statement of Assets and Liabilities as segregated cash with broker/receivable for variation margin, or payable for swap settlement/variation margin. Cash and/or securities pledged or received as collateral by the Fund in connection with an OTC derivative subject to an ISDA Master Agreement generally may not be invested, sold or rehypothecated by the counterparty or the Fund, as applicable, absent an event of default under such agreement, in which case such collateral generally may be applied towards obligations due to and payable by such counterparty or the Fund, as applicable. Generally, the amount of collateral due from or to a counterparty must exceed a minimum transfer amount threshold (e.g., $300,000) before a transfer is required to be made. To the extent amounts due to the Fund from its counterparties are not fully collateralized, contractually or otherwise, the Fund bears the risk of loss from counterparty nonperformance. The Fund attempts to mitigate counterparty risk by only entering into agreements with counterparties that it believes to be of good standing and by monitoring the financial stability of those counterparties.
For financial reporting purposes, the Fund does not offset derivative assets and derivative liabilities that are subject to netting arrangements in the Statement of Assets and Liabilities.
The following tables present derivative financial instruments and secured financing transactions that are subject to enforceable netting arrangements:
| | | | | | | | | | | | | | | Gross Amounts Not Offset
in the Statement of
Assets and Liabilities | | | | | |
Instrument | | Gross
Amounts of
Recognized
Assets1 | | | Gross
Amounts
Offset in the
Statement of
Assets and
Liabilities | | | Net Amount
of Assets
Presented on
the Statement
of Assets and
Liabilities | | | Financial
Instruments | | | Cash
Collateral
Received | | | Net
Amount | |
Fixed income index swap agreements | | $ | 859,747 | | | $ | — | | | $ | 859,747 | | | $ | (610,000 | ) | | $ | (80,000 | ) | | $ | 169,747 | |
Forward foreign currency exchange contracts | | | 7,769,779 | | | | — | | | | 7,769,779 | | | | (1,837,880 | ) | | | (3,474,624 | ) | | | 2,457,275 | |
| | THE GUGGENHEIM FUNDS SEMI-ANNUAL REPORT | 59 |
NOTES TO FINANCIAL STATEMENTS (Unaudited)(continued) |
| | | | | | | | | | | | | | | Gross Amounts Not
Offset in the Statement
of Assets and Liabilities | | | | | |
Instrument | | Gross
Amounts of
Recognized
Liabilities1 | | | Gross
Amounts
Offset in the
Statement of
Assets and
Liabilities | | | Net Amount
of Liabilities
Presented on
the Statement
of Assets and
Liabilities | | | Financial
Instruments | | | Cash
Collateral
Pledged | | | Net
Amount | |
Fixed income index swap agreements | | $ | 610,000 | | | $ | — | | | $ | 610,000 | | | $ | (610,000 | ) | | $ | — | | | $ | — | |
Forward foreign currency exchange contracts | | | 2,284,057 | | | | — | | | | 2,284,057 | | | | (1,837,880 | ) | | | (370,000 | ) | | | 76,177 | |
1 | Exchange-traded or centrally-cleared derivatives are excluded from these reported amounts. |
The Fund has the right to offset deposits against any related derivative liabilities outstanding with each counterparty with the exception of exchange-traded or centrally-cleared derivatives. The following table presents deposits held by others in connection with derivative investments as of March 31, 2021.
Counterparty | Asset Type | | Cash Pledged | | | Cash Received | |
Barclays Bank plc | Forward foreign currency exchange contracts | | $ | — | | | $ | 370,000 | |
BNP Paribas | Total return swap agreements | | | — | | | | 80,000 | |
BofA Securities, Inc. | Interest rate swap agreements | | | — | | | | 354 | |
Citibank N.A. | Forward foreign currency exchange contracts | | | — | | | | 940,000 | |
Goldman Sachs International | Forward foreign currency exchange contracts | | | — | | | | 2,060,000 | |
JPMorgan Chase Bank, N.A. | Forward foreign currency exchange contracts | | | 370,000 | | | | — | |
Morgan Stanley Capital Services LLC | Forward foreign currency exchange contracts | | | — | | | | 670,000 | |
| | | | | 370,000 | | | | 4,120,354 | |
Note 4 – Fair Value Measurement
In accordance with U.S. GAAP, fair value is defined as the price that the Fund would receive to sell an investment or pay to transfer a liability in an orderly transaction with an independent buyer in the principal market, or in the absence of a principal market, the most advantageous market for the investment or liability. U.S. GAAP establishes a three-tier fair value hierarchy based on the types of inputs used to value assets and liabilities and requires corresponding disclosure. The hierarchy and the corresponding inputs are summarized below:
Level 1 — | quoted prices in active markets for identical assets or liabilities. |
60 | THE GUGGENHEIM FUNDS SEMI-ANNUAL REPORT | |
NOTES TO FINANCIAL STATEMENTS (Unaudited)(continued) |
Level 2 — | significant other observable inputs (for example quoted prices for securities that are similar based on characteristics such as interest rates, prepayment speeds, credit risk, etc.). |
Level 3 — | significant unobservable inputs based on the best information available under the circumstances, to the extent observable inputs are not available, which may include assumptions. |
The types of inputs available depend on a variety of factors, such as the type of security and the characteristics of the markets in which it trades, if any. Fair valuation determinations that rely on fewer or no observable inputs require greater judgment. Accordingly, fair value determinations for Level 3 securities require the greatest amount of judgment.
Independent pricing services are used to value a majority of the Fund’s investments. When values are not available from a pricing service, they will be determined using a variety of sources and techniques, including: market prices; broker quotes; and models which derive prices based on inputs such as prices of securities with comparable maturities and characteristics or based on inputs such as anticipated cash flows or collateral, spread over U.S. Treasury securities, and other information and analysis. A significant portion of the Fund’s assets and liabilities are categorized as Level 2, as indicated in this report.
Quotes from broker-dealers, adjusted for fluctuations in criteria such as credit spreads and interest rates, may also be used to value the Fund’s assets and liabilities, i.e. prices provided by a broker-dealer or other market participant who has not committed to trade at that price. Although quotes are typically received from established market participants, the Fund may not have the transparency to view the underlying inputs which support the market quotations. Significant changes in a quote would generally result in significant changes in the fair value of the security.
Certain fixed income securities are valued by obtaining a monthly quote from a broker-dealer, adjusted for fluctuations in criteria such as credit spreads and interest rates.
Certain loans and other securities are valued using a single daily broker quote or a price from a third party vendor based on a single daily or monthly broker quote.
The inputs or methodologies used for valuing securities are not necessarily an indication of the risk associated with investing in those securities. The suitability of the techniques and sources employed to determine fair valuation are regularly monitored and subject to change.
Note 5 – Investment Advisory Agreement and Other Agreements
Under the terms of an investment advisory contract, the Fund pays GI investment advisory fees calculated at an annualized rate of 0.25% of the average daily net assets of the Fund.
GI pays operating expenses on behalf of the Trust, such as audit and accounting related services, legal services, custody, printing and mailing, among others, on a pass-through basis. Such expenses are allocated to various Funds within the complex based on relative net assets.
| | THE GUGGENHEIM FUNDS SEMI-ANNUAL REPORT | 61 |
NOTES TO FINANCIAL STATEMENTS (Unaudited)(continued) |
The Board has adopted a Distribution Plan related to the offering of A-Class shares pursuant to Rule 12b-1 under the 1940 Act. The plan provides for payments at an annual rate of 0.25% of the average daily net assets of the Fund’s A-Class shares.
The investment advisory contract for the Fund provides that the total expenses be limited to a percentage of average net assets for each class of shares, exclusive of brokerage costs, dividends or interest on securities sold short, expenses of other investment companies in which the Fund invests, interest, taxes, litigation, indemnification and extraordinary expenses. The limits are listed below:
| | Limit | | | Effective
Date | | | Contract
End Date | |
A-Class | | | 0.58 | % | | | 11/30/18 | | | | 02/01/22 | |
Institutional Class | | | 0.33 | % | | | 11/30/18 | | | | 02/01/22 | |
GI is entitled to reimbursement by the Fund for fees waived or expenses reimbursed during any of the previous 36 months, beginning on the date of the expense limitation agreement, if on any day the estimated operating expenses are less than the indicated percentages. For purposes of this arrangement, GI is entitled to recoupment of previously waived fees or reimbursed expenses for 36 months from the date of the waiver or reimbursement by GI. At March 31, 2021, the amount of fees waived or expenses reimbursed that are subject to recoupment and will expire during the years ended September 30, are presented in the following table:
| | 2021 | | | 2022 | | | 2023 | | | 2024 | | | Total | |
A-Class | | $ | — | | | $ | — | | | $ | 16,978 | | | $ | 10,447 | | | $ | 27,425 | |
Institutional Class | | | — | | | | — | | | | 42,338 | | | | 9,997 | | | | 52,335 | |
For the period ended March 31, 2021, GI recouped $37,631 from the Fund.
For the period ended March 31, 2021, GFD retained sales charges of $192,037 relating to sales of A-Class shares of the Trust.
Certain trustees and officers of the Trust are also officers of GI and/or GFD. The Trust does not compensate its officers or trustees who are officers, directors and/or employees of GI or GFD.
MUFG Investor Services (US), LLC (“MUIS”) acts as the Fund’s administrator, transfer agent and accounting agent. As administrator, transfer agent and accounting agent, MUIS maintains the books and records of the Fund’s securities and cash. The Bank of New York Mellon Corp. (“BNY”) acts as the Fund’s custodian. As custodian, BNY is responsible for the custody of the Fund’s assets. For providing the aforementioned administrative and accounting services, MUIS is entitled to receive a monthly fee equal to a percentage of the Fund’s average daily net assets and out of pocket expenses. For providing the aforementioned transfer agent and custodian services, MUIS and BNY are entitled to receive a monthly fee based on the number of transactions during the month and the number of accounts under management, subject to certain minimum monthly fees, and out of pocket expenses.
62 | THE GUGGENHEIM FUNDS SEMI-ANNUAL REPORT | |
NOTES TO FINANCIAL STATEMENTS (Unaudited)(continued) |
At March 31, 2021, GI and its affiliates owned 39% of the outstanding shares of the Fund.
Note 6 – Federal Income Tax Information
The Fund intends to comply with the provisions of Subchapter M of the Internal Revenue Code applicable to regulated investment companies and will distribute substantially all taxable net investment income and capital gains sufficient to relieve the Fund from all, or substantially all, federal income, excise and state income taxes. Therefore, no provision for federal or state income tax or federal excise tax is required.
Tax positions taken or expected to be taken in the course of preparing the Fund’s tax returns are evaluated to determine whether the tax positions are “more-likely-than-not” of being sustained by the applicable tax authority. Tax positions not deemed to meet the more-likely-than-not threshold would be recorded as a tax benefit or expense in the current year. Management has analyzed the Fund’s tax positions taken, or to be taken, on U.S. federal income tax returns for all open tax years, and has concluded that no provision for income tax is required in the Fund’s financial statements. The Fund’s U.S. federal income tax returns are subject to examination by the Internal Revenue Service (“IRS”) for a period of three years after they are filed.
At March 31, 2021, the cost of investments for U.S. federal income tax purposes, the aggregate gross unrealized appreciation for all investments for which there was an excess of value over tax cost, and the aggregate gross unrealized depreciation for all investments for which there was an excess of tax cost over value, were as follows:
| | Tax
Cost | | | Tax
Unrealized
Appreciation | | | Tax
Unrealized
Depreciation | | | Net Tax
Unrealized
Appreciation
(Depreciation) | |
| | | $ | 903,271,018 | | | $ | 10,896,963 | | | $ | (5,304,995 | ) | | $ | 5,591,968 | |
Note 7 – Securities Transactions
For the period ended March 31, 2021, the cost of purchases and proceeds from sales of investment securities, excluding government securities, short-term investments and derivatives, were as follows:
| | Purchases | | | Sales | |
| | | $ | 454,915,661 | | | $ | 191,588,320 | |
For the period ended March 31, 2021, the cost of purchases and proceeds from sales of government securities, were as follows:
| | Purchases | | | Sales | |
| | | $ | 5,173,208 | | | $ | 31,652,396 | |
| | THE GUGGENHEIM FUNDS SEMI-ANNUAL REPORT | 63 |
NOTES TO FINANCIAL STATEMENTS (Unaudited)(continued) |
The Fund is permitted to purchase or sell securities from or to certain affiliated funds under specified conditions outlined in procedures adopted by the Board. The procedures have been designed to ensure that any purchase or sale of securities by the Fund from or to another fund or portfolio that is or could be considered an affiliate by virtue of having a common investment adviser (or affiliated investment advisers), common trustees and/or common officers complies with Rule 17a-7 of the 1940 Act. Further, as defined under these procedures, each transaction is effected at the current market price to save costs, where permissible. For the period ended March 31, 2021, the Fund engaged in purchases and sales of securities, pursuant to Rule 17a-7 of the 1940 Act, as follows:
| | Purchases | | | Sales | | | Realized
Gain (Loss) | |
| | | $ | 24,662,329 | | | $ | — | | | $ | — | |
Note 8 – Restricted Securities
The securities below are considered illiquid and restricted under guidelines established by the Board:
Restricted
Securities | | Acquisition
Date | | | Cost | | | Value | |
Cascade Funding Mortgage Trust | | | | | | | | | | | | |
2019-RM3, 2.80% (WAC) due 06/25/691 | | | 06/25/19 | | | $ | 390,270 | | | $ | 399,114 | |
FKRT | | | | | | | | | | | | |
2020-C2A, 3.25% due 12/30/23 | | | 12/03/20 | | | | 3,068,435 | | | | 3,070,369 | |
LSTAR Securities Investment Ltd. | | | | | | | | | | | | |
2021-2, 1.82% (1 Month USD LIBOR + 1.70%, Rate Floor: 1.70%) due 03/02/261 | | | 03/17/21 | | | | 1,450,000 | | | | 1,448,997 | |
LSTAR Securities Investment Ltd. | | | | | | | | | | | | |
2021-1, 1.92% (1 Month USD LIBOR + 1.80%, Rate Floor: 1.80%) due 02/01/261 | | | 02/04/21 | | | | 2,634,747 | | | | 2,641,851 | |
Station Place Securitization Trust | | | | | | | | | | | | |
2020-5, 0.92% (1 Month USD LIBOR + 1.00%, Rate Floor: 0.00%) due 05/24/221 | | | 05/13/20 | | | | 8,100,000 | | | | 8,100,000 | |
| | | | | | | $ | 15,643,452 | | | $ | 15,660,331 | |
1 | Variable rate security. Rate indicated is the rate effective at March 31, 2021. In some instances, the effective rate is limited by a minimum rate floor or a maximum rate cap established by the issuer. The settlement status of a position may also impact the effective rate indicated. In some cases, a position may be unsettled at period end and may not have a stated effective rate. In instances where multiple underlying reference rates and spread amounts are shown, the effective rate is based on a weighted average. |
64 | THE GUGGENHEIM FUNDS SEMI-ANNUAL REPORT | |
NOTES TO FINANCIAL STATEMENTS (Unaudited)(concluded) |
Note 9 – Line of Credit
The Trust, along with other affiliated trusts, secured a 364-day committed, $1,230,000,000 line of credit from Citibank, N.A., which was in place through October 2, 2020, at which time the line of credit was renewed. A Fund may draw (borrow) from the line of credit as a temporary measure for emergency purposes, to facilitate redemption requests, or for other short-term liquidity purposes consistent with the Fund’s investment objective and program. For example, it may be advantageous for the Fund to borrow money rather than sell existing portfolio positions to meet redemption requests. Fees related to borrowings, if any, vary under this arrangement between the greater of Citibank’s “base rate”, LIBOR plus 1%, or the federal funds rate plus 1/2 of 1%.
The commitment fee that may be paid by the Fund is at an annualized rate of 0.15% of the average daily amount of its allocated unused commitment amount. The allocated commitment fee amount for the Fund is referenced in the Statement of Operations under “Line of credit fees”. The Fund did not have any borrowings under this agreement as of and for the period ended March 31, 2021.
Note 10 – COVID-19
The global ongoing crisis caused by the outbreak of COVID-19 and the current recovery underway is causing disruption to consumer demand and economic output and supply chains. There are still travel restrictions and quarantines, and adverse impacts on local and global economies. Investors should be aware that in light of the current uncertainty, volatility and distress in economies, financial markets, and labor and public health conditions around the world, the Fund’s investments and a shareholder’s investment in the Fund are subject to sudden and substantial losses, increased volatility and other adverse events. Firms through which investors invest with the Fund, the Fund, its service providers, the markets in which it invests and market intermediaries are also impacted by quarantines and similar measures intended to respond to and contain the ongoing pandemic, which can obstruct their functioning and subject them to heightened operational and other risks.
Note 11 – Subsequent Events
The Fund evaluated subsequent events through the date the financial statements were available for issue and determined there were no material events that would require adjustment to or disclosure in the Fund’s financial statements.
| | THE GUGGENHEIM FUNDS SEMI-ANNUAL REPORT | 65 |
OTHER INFORMATION (Unaudited) |
Delivery of Shareholder Reports
Paper copies of the Fund’s annual and semi-annual shareholder reports are not sent by mail, unless you specifically request paper copies of the reports from a fund or from your financial intermediary. Instead, the reports are made available on a website, and you are notified by mail each time a report is posted and provided with a website link to access the report.
You may elect to receive all future shareholder reports in paper free of charge. If you hold shares of a fund directly, you can inform the Fund that you wish to receive paper copies of reports by calling 800.820.0888. If you hold shares of a fund through a financial intermediary, please contact the financial intermediary to make this election. Your election to receive reports in paper may apply to all Guggenheim Funds in which you are invested and may apply to all Guggenheim funds held with your financial intermediary.
Proxy Voting Information
A description of the policies and procedures that the Trust uses to determine how to vote proxies relating to securities held in the Fund’s portfolio is available, without charge and upon request, by calling 800.820.0888. This information is also available from the EDGAR database on the SEC’s website at https://www.sec.gov.
Information regarding how the Fund voted proxies relating to portfolio securities during the most recent 12-month period ended June 30 is available without charge, upon request, by calling 800.820.0888. This information is also available from the EDGAR database on the SEC’s website at https://www.sec.gov.
Sector Classification
Information in the Schedule of Investments is categorized by sectors using sector-level Classifications defined by the Bloomberg Industry Classification System, a widely recognized industry classification system provider. The Fund’s registration statement has investment policies relating to concentration in specific sectors/industries. For purposes of these investment policies, the Fund usually classifies sectors/industries based on industry-level Classifications used by widely recognized industry classification system providers such as Bloomberg Industry Classification System, Global Industry Classification Standards and Barclays Global Classification Scheme.
Quarterly Portfolio Schedules Information
The Trust files its complete schedule of portfolio holdings with the SEC for the first and third quarters of each fiscal year as an exhibit to its reports on Form N-PORT, and for reporting periods ended prior to March 31, 2019, filed such information on Form N-Q. The Fund’s Forms N-PORT and N-Q are available on the SEC’s website at https://www.sec.gov. Copies of the portfolio holdings are also available to shareholders, without charge and upon request, by calling 800.820.0888.
66 | THE GUGGENHEIM FUNDS SEMI-ANNUAL REPORT | |
INFORMATION ON BOARD OF TRUSTEES AND OFFICERS (Unaudited) |
A Board of Trustees oversees the Trust, as well as other trusts of GI, in which its members have no stated term of service, and continue to serve after election until resignation. The Statement of Additional Information includes further information about Fund Trustees and Officers, and can be obtained without charge by visiting guggenheiminvestments.com or by calling 800.820.0888.
Name, Address*
and Year of Birth | Position(s)
Held with
Trust | Term of Office
and Length of
Time Served** | Principal Occupation(s)
During Past Five Years | Number of
Portfolios
in Fund
Complex
Overseen | Other
Directorships Held
by Trustees*** |
INDEPENDENT TRUSTEES | | | |
Randall C. Barnes (1951) | Trustee and Chair of the Valuation Oversight Committee | Since 2014 (Trustee) Since 2020 (Chair of the Valuation Oversight Committee) | Current: Private Investor (2001-present). Former: Senior Vice President and Treasurer, PepsiCo, Inc. (1993-1997); President, Pizza Hut International (1991-1993); Senior Vice President, Strategic Planning and New Business Development, PepsiCo, Inc. (1987-1990). | 157 | Current: Purpose Investments Funds (2013-present). Former: Managed Duration Investment Grade Municipal Fund (2006-2016). |
Angela Brock-Kyle (1959) | Trustee | Since 2019 | Current: Founder and Chief Executive Officer, B.O.A.R.D.S. (2013-present).
Former: Senior Leader, TIAA (1987-2012). | 156 | Current: Bowhead Insurance GP, LLC (2020-present); Hunt Companies, Inc. (2019-present).
Former: Infinity Property & Casualty Corp. (2014-2018). |
Thomas F. Lydon, Jr. (1960) | Trustee and Chair of the Contracts Review Committee | Since 2019 (Trustee) Since 2020 (Chair of the Contracts Review Committee) | Current: President, Global Trends Investments (1996-present); Co-Chief Executive Officer, ETF Flows, LLC (2019-present); Chief Executive Officer, Lydon Media (2016-present). | 156 | Current: US Global Investors (GROW) (1995-present).
Former: Harvest Volatility Edge Trust (3) (2017-2019). |
| | THE GUGGENHEIM FUNDS SEMI-ANNUAL REPORT | 67 |
INFORMATION ON BOARD OF TRUSTEES AND OFFICERS (Unaudited)(continued) |
Name, Address*
and Year of Birth | Position(s)
Held with
Trust | Term of Office
and Length of
Time Served** | Principal Occupation(s)
During Past Five Years | Number of
Portfolios
in Fund
Complex
Overseen | Other
Directorships Held
by Trustees*** |
INDEPENDENT TRUSTEES - continued | | |
Ronald A. Nyberg (1953) | Trustee and Chair of the Nominating and Governance Committee | Since 2014 | Current: Of Counsel, Momkus LLP (2016-present).
Former: Partner, Nyberg & Cassioppi, LLC (2000-2016); Executive Vice President, General Counsel, and Corporate Secretary, Van Kampen Investments (1982-1999). | 157 | Current: PPM Funds (2) (2018-present); Edward-Elmhurst Healthcare System (2012-present).
Former: Western Asset Inflation-Linked Opportunities & Income Fund (2004-2020); Western Asset Inflation-Linked Income Fund (2003-2020); Managed Duration Investment Grade Municipal Fund (2003-2016). |
Sandra G. Sponem (1958) | Trustee and Chair of the Audit Committee | Since 2019 (Trustee) Since 2020 (Chair of the Audit Committee) | Current: Retired.
Former: Senior Vice President and Chief Financial Officer, M.A. Mortenson-Companies, Inc. (2007-2017). | 156 | Current: SPDR Series Trust (81) (2018-present); SPDR Index Shares Funds (30) (2018-present); SSGA Active Trust (14) (2018-present). Former: SSGA Master Trust (1) (2018-2020). |
68 | THE GUGGENHEIM FUNDS SEMI-ANNUAL REPORT | |
INFORMATION ON BOARD OF TRUSTEES AND OFFICERS (Unaudited)(continued) |
Name, Address*
and Year of Birth | Position(s)
Held with
Trust | Term of Office
and Length of
Time Served** | Principal Occupation(s)
During Past Five Years | Number of
Portfolios
in Fund
Complex
Overseen | Other
Directorships Held
by Trustees*** |
INDEPENDENT TRUSTEES - concluded | | |
Ronald E.
Toupin, Jr. (1958) | Trustee, Chair of the Board and Chair of the Executive Committee | Since 2014 | Current: Portfolio Consultant (2010-present); Member, Governing Council, Independent Directors Council (2013-present); Governor, Board of Governors, Investment Company Institute (2018-present).
Former: Member, Executive Committee, Independent Directors Council (2016-2018); Vice President, Manager and Portfolio Manager, Nuveen Asset Management (1998-1999); Vice President, Nuveen Investment Advisory Corp. (1992-1999); Vice President and Manager, Nuveen Unit Investment Trusts (1991-1999); and Assistant Vice President and Portfolio Manager, Nuveen Unit Investment Trusts (1988-1999), each of John Nuveen & Co., Inc. (1982-1999). | 156 | Former: Western Asset Inflation-Linked Opportunities & Income Fund (2004-2020); Western Asset Inflation-Linked Income Fund (2003-2020); Managed Duration Investment Grade Municipal Fund (2003-2016). |
| | THE GUGGENHEIM FUNDS SEMI-ANNUAL REPORT | 69 |
INFORMATION ON BOARD OF TRUSTEES AND OFFICERS (Unaudited)(continued) |
Name, Address*
and Year of Birth | Position(s)
Held with
Trust | Term of Office
and Length of
Time Served** | Principal Occupation(s)
During Past Five Years | Number of
Portfolios
in Fund
Complex
Overseen | Other
Directorships Held
by Trustees*** |
INTERESTED TRUSTEE | |
Amy J. Lee**** (1961) | Trustee, Vice President and Chief Legal Officer | Since 2018 (Trustee) Since 2014 (Chief Legal Officer) Since 2007 (Vice President) | Current: Interested Trustee, certain other funds in the Fund Complex (2018-present); Chief Legal Officer, certain other funds in the Fund Complex (2014-present); Vice President, certain other funds in the Fund Complex (2007-present); Senior Managing Director, Guggenheim Investments (2012-present).
Former: President and Chief Executive Officer, certain other funds in the Fund Complex (2017-2019); Vice President, Associate General Counsel and Assistant Secretary, Security Benefit Life Insurance Company and Security Benefit Corporation (2004-2012). | 156 | None. |
* | The business address of each Trustee is c/o Guggenheim Investments, 227 West Monroe Street, Chicago, Illinois 60606. |
** | Each Trustee serves an indefinite term, until his or her successor is elected and qualified. Time served includes time served in the respective position for the Predecessor Corporation. |
*** | Each Trustee also serves on the Boards of Trustees of Guggenheim Funds Trust, Guggenheim Variable Funds Trust, Guggenheim Strategy Funds Trust, Fiduciary/Claymore Energy Infrastructure Fund, Guggenheim Taxable Municipal Bond & Investment Grade Debt Trust, Guggenheim Strategic Opportunities Fund, Guggenheim Enhanced Equity Income Fund, Guggenheim Energy & Income Fund, Guggenheim Credit Allocation Fund, Rydex Series Funds, Rydex Dynamic Funds, Rydex Variable Trust and Transparent Value Trust. Messrs. Barnes and Nyberg also serve on the Board of Trustees of Advent Convertible & Income Fund. |
**** | This Trustee is deemed to be an “interested person” of the Fund under the 1940 Act by reason of her position with the Fund’s Investment Manager and/or the parent of the Investment Manager. |
70 | THE GUGGENHEIM FUNDS SEMI-ANNUAL REPORT | |
INFORMATION ON BOARD OF TRUSTEES AND OFFICERS (Unaudited)(continued) |
Name, Address*
and Year of Birth | Position(s)
Held with
Trust | Term of Office
and Length of
Time Served** | Principal Occupation(s)
During Past Five Years |
OFFICERS | | | |
Brian E. Binder (1972) | President and Chief Executive Officer | Since 2018 | Current: President and Chief Executive Officer, certain other funds in the Fund Complex (2018-present); President, Chief Executive Officer and Chairman of the Board of Managers, Guggenheim Funds Investment Advisors, LLC (2018-present); President and Chief Executive Officer, Security Investors, LLC (2018-present); Board Member of Guggenheim Partners Fund Management (Europe) Limited (2018-present); Senior Managing Director and Chief Administrative Officer, Guggenheim Investments (2018-present).
Former: Managing Director and President, Deutsche Funds, and Head of US Product, Trading and Fund Administration, Deutsche Asset Management (2013-2018); Managing Director, Head of Business Management and Consulting, Invesco Ltd. (2010-2012). |
James M. Howley (1972) | Assistant Treasurer | Since 2014 | Current: Managing Director, Guggenheim Investments (2004-present); Assistant Treasurer, certain other funds in the Fund Complex (2006-present).
Former: Manager, Mutual Fund Administration of Van Kampen Investments, Inc. (1996-2004). |
Mark E. Mathiasen (1978) | Secretary | Since 2014 | Current: Secretary, certain other funds in the Fund Complex (2007-present); Managing Director, Guggenheim Investments (2007-present). |
Glenn McWhinnie (1969) | Assistant Treasurer | Since 2016 | Current: Vice President, Guggenheim Investments (2009-present); Assistant Treasurer, certain other funds in the Fund Complex (2016-present). |
Michael P. Megaris (1984) | Assistant Secretary | Since 2014 | Current: Assistant Secretary, certain other funds in the Fund Complex (2014-present); Director, Guggenheim Investments (2012-present). |
| | THE GUGGENHEIM FUNDS SEMI-ANNUAL REPORT | 71 |
INFORMATION ON BOARD OF TRUSTEES AND OFFICERS (Unaudited)(continued) |
Name, Address*
and Year of Birth | Position(s)
Held with
Trust | Term of Office
and Length of
Time Served** | Principal Occupation(s)
During Past Five Years |
OFFICERS - continued | |
Elisabeth Miller (1968) | Chief Compliance Officer | Since 2012 | Current: Chief Compliance Officer, certain other funds in the Fund Complex (2012-present); Senior Managing Director, Guggenheim Investments (2012-present). Vice President, Guggenheim Funds Distributors, LLC (2014-present).
Former: Chief Compliance Officer, Security Investors, LLC and Guggenheim Funds Investment Advisors, LLC (2012-2018); Chief Compliance Officer, Guggenheim Distributors, LLC (2009-2014); Senior Manager, Security Investors, LLC (2004-2014); Senior Manager, Guggenheim Distributors, LLC (2004-2014). |
Margaux Misantone (1978) | AML Officer | Since 2017 | Current: Chief Compliance Officer, Security Investors, LLC and Guggenheim Funds Investment Advisors, LLC (2018-present); AML Officer, Security Investors, LLC and certain other funds in the Fund Complex (2017-present); Managing Director, Guggenheim Investments (2015-present).
Former: Assistant Chief Compliance Officer, Security Investors, LLC and Guggenheim Funds Investments Advisors, LLC (2015-2018). |
Kimberly J. Scott (1974) | Assistant Treasurer | Since 2014 | Current: Director, Guggenheim Investments (2012-present); Assistant Treasurer, certain other funds in the Fund Complex (2012-present).
Former: Financial Reporting Manager, Invesco, Ltd. (2010-2011); Vice President/Assistant Treasurer, Mutual Fund Administration for Van Kampen Investments, Inc./Morgan Stanley Investment Management (2009-2010); Manager of Mutual Fund Administration, Van Kampen Investments, Inc./Morgan Stanley Investment Management (2005-2009). |
Bryan Stone (1979) | Vice President | Since 2014 | Current: Vice President, certain other funds in the Fund Complex (2014-present); Managing Director, Guggenheim Investments (2013-present).
Former: Senior Vice President, Neuberger Berman Group LLC (2009-2013); Vice President, Morgan Stanley (2002-2009). |
72 | THE GUGGENHEIM FUNDS SEMI-ANNUAL REPORT | |
INFORMATION ON BOARD OF TRUSTEES AND OFFICERS (Unaudited)(concluded) |
Name, Address*
and Year of Birth | Position(s)
Held with
Trust | Term of Office
and Length of
Time Served** | Principal Occupation(s)
During Past Five Years |
OFFICERS - concluded | |
John L. Sullivan (1955) | Chief Financial Officer, Chief Accounting Officer and Treasurer | Since 2014 | Current: Chief Financial Officer, Chief Accounting Officer and Treasurer, certain other funds in the Fund Complex (2010-present); Senior Managing Director, Guggenheim Investments (2010-present).
Former: Managing Director and Chief Compliance Officer, each of the funds in the Van Kampen Investments fund complex (2004-2010); Managing Director and Head of Fund Accounting and Administration, Morgan Stanley Investment Management (2002-2004); Chief Financial Officer and Treasurer, Van Kampen Funds (1996-2004). |
Jon Szafran (1989) | Assistant Treasurer | Since 2017 | Current: Vice President, Guggenheim Investments (2017-present); Assistant Treasurer, certain other funds in the Fund Complex (2017-present).
Former: Assistant Treasurer of Henderson Global Funds and Manager of US Fund Administration, Henderson Global Investors (North America) Inc. (“HGINA”), (2017); Senior Analyst of US Fund Administration, HGINA (2014–2017); Senior Associate of Fund Administration, Cortland Capital Market Services, LLC (2013-2014); Experienced Associate, PricewaterhouseCoopers LLP (2012-2013). |
* | The business address of each officer is c/o Guggenheim Investments, 227 West Monroe Street, Chicago, Illinois 60606. |
** | Each officer serves an indefinite term, until his or her successor is duly elected and qualified. |
| | THE GUGGENHEIM FUNDS SEMI-ANNUAL REPORT | 73 |
GUGGENHEIM INVESTMENTS PRIVACY NOTICE (Unaudited) |
Who We Are
This Privacy Notice describes the data protection practices of Guggenheim Investments. Guggenheim Investments as used herein refers to the affiliated investment management businesses of Guggenheim Partners, LLC: Guggenheim Funds Investment Advisors, LLC, Guggenheim Partners Investment Management, LLC, Guggenheim Funds Distributors, LLC, Security Investors, LLC, Guggenheim Investment Advisors (Europe) Limited, Guggenheim Real Estate, LLC, GS Gamma Advisors, LLC, Guggenheim Partners India Management, LLC, Guggenheim Partners Europe Limited, as well as the funds in the Guggenheim Funds complex (the “Funds”) (“Guggenheim Investments,” “we,” “us,” or “our”).
Guggenheim Partners Investment Management Holdings, LLC, located at 330 Madison Avenue, New York, New York 10017 is the data controller for your information. The affiliates who are also controllers of certain of your information are: Guggenheim Investment Advisors (Europe) Limited, Guggenheim Partners Europe Limited, Guggenheim Partners, LLC, Guggenheim Funds Investment Advisors, LLC, Guggenheim Partners Investment Management, LLC, Guggenheim Funds Distributors, LLC and Security Investors, LLC, as well as the Funds.
Our Commitment to You
Guggenheim Investments considers your privacy our utmost concern. When you become our client or investor, you entrust us with not only your hard-earned money but also with your personal and financial information. Because we have access to your private information, we hold ourselves to the highest standards in its safekeeping and use. We strictly limit how we share your information with others, whether you are a current or former Guggenheim Investments client or investor.
The Information We Collect About You
We collect certain nonpublic personal information about you from information you provide on applications, other forms, our website, and/or from third parties including investment advisors. This information includes Social Security or other tax identification number, assets, income, tax information, retirement and estate plan information, transaction history, account balance, payment history, bank account information, marital status, family relationships, information that we collect on our website through the use of “cookies,” and other personal information that you or others provide to us. We may also collect such information through your inquiries by mail, e-mail or telephone. We may also collect customer due diligence information, as required by applicable law and regulation, through third party service providers.
How We Handle Your Personal Information
The legal basis for using your information as set out in this Privacy Notice is as follows: (a) use of your personal data is necessary to perform our obligations under any contract with you (such as a contract for us to provide financial services to you); or (b) where use of your personal data is not necessary for performance of a contract, use of your personal data is necessary for our
74 | THE GUGGENHEIM FUNDS SEMI-ANNUAL REPORT | |
GUGGENHEIM INVESTMENTS PRIVACY NOTICE (Unaudited)(continued) |
legitimate interests or the legitimate interests of others (for example, to enforce the legal terms governing our services, operate and market our website and other services we offer, ensure safe environments for our personnel and others, make and receive payments, prevent fraud and to know the customer to whom we are providing the services). Some processing is done to comply with applicable law.
In addition to the specific uses described above, we also use your information in the following manner:
| | ● | We use your information in connection with servicing your accounts. |
| | ● | We use information to respond to your requests or questions. For example, we might use your information to respond to your customer feedback. |
| | ● | We use information to improve our products and services. We may use your information to make our website and products better. We may use your information to customize your experience with us. |
| | ● | We use information for security purposes. We may use your information to protect our company and our customers. |
| | ● | We use information to communicate with you. For example, we will communicate with you about your account or our relationship. We may contact you about your feedback. We might also contact you about this Privacy Notice. We may also enroll you in our email newsletter. |
| | ● | We use information as otherwise permitted by law, as we may notify you. |
| | ● | Aggregate/Anonymous Data. We may aggregate and/or anonymize any information collected through the website so that such information can no longer be linked to you or your device (“Aggregate/Anonymous Information”). We may use Aggregate/Anonymous Information for any purpose, including without limitation for research and marketing purposes, and may also share such data with any third parties, including advertisers, promotional partners, and sponsors. |
We do not sell information about current or former clients or their accounts to third parties. Nor do we share this information, except when necessary to complete transactions at your request, to make you aware of investment products and services that we or our affiliates offer, or as permitted or required by law.
We provide information about you to companies and individuals not affiliated with Guggenheim Investments to complete certain transactions or account changes, or to perform services for us related to your account. For example, if you ask to transfer assets from another financial institution to Guggenheim Investments, we must provide certain information about you to that company to complete the transaction. We provide the third party with only the information necessary to carry out its responsibilities and only for that purpose. And we require these third
| | THE GUGGENHEIM FUNDS SEMI-ANNUAL REPORT | 75 |
GUGGENHEIM INVESTMENTS PRIVACY NOTICE (Unaudited)(continued) |
parties to treat your private information with the same high degree of confidentiality that we do. To alert you to other Guggenheim Investments products and services, we share your information within our family of affiliated companies. You may limit our sharing with affiliated companies as set out below. We may also share information with any successor to all or part of our business, or in connection with steps leading up to a merger or acquisition. For example, if part of our business was sold we may give customer information as part of that transaction. We may also share information about you with your consent.
We will release information about you if you direct us to do so, if we are compelled by law to do so, or in other circumstances as permitted by law (for example, to protect your account from fraud).
If you close your account(s) or become an inactive client or investor, we will continue to adhere to the privacy policies and practices described in this notice.
Opt-Out Provisions and Your Data Choices
The law allows you to “opt out” of certain kinds of information sharing with third parties. We do not share personal information about you with any third parties that triggers this opt-out right. This means YOU ARE ALREADY OPTED OUT.
When you are no longer our client or investor, we continue to share your information as described in this notice, and you may contact us at any time to limit our sharing by sending an email to CorporateDataPrivacy@GuggenheimPartners.com.
European Union Data Subjects and certain others: In addition to the choices set forth above, residents of the European Union and certain other jurisdictions have certain rights to (1) request access to or rectification or deletion of information we collect about them, (2) request a restriction on the processing of their information, (3) object to the processing of their information, or (4) request the portability of certain information. To exercise these or other rights, please contact us using the contact information below. We will consider all requests and provide our response within the time period stated by applicable law. Please note, however, that certain information may be exempt from such requests in some circumstances, which may include if we need to keep processing your information for our legitimate interests or to comply with a legal obligation. We may request you provide us with information necessary to confirm your identity before responding to your request.
Residents of France and certain other jurisdictions may also provide us with instructions regarding the manner in which we may continue to store, erase and share your information after your death, and where applicable, the person you have designated to exercise these rights after your death.
76 | THE GUGGENHEIM FUNDS SEMI-ANNUAL REPORT | |
GUGGENHEIM INVESTMENTS PRIVACY NOTICE (Unaudited)(continued) |
How We Protect Privacy Online
We take steps to protect your privacy when you use our web site – www.guggenheiminvestments.com – by using secure forms of online communication, including encryption technology, Secure Socket Layer (SSL) protocol, firewalls and user names and passwords. These safeguards vary based on the sensitivity of the information that we collect and store. However, we cannot and do not guarantee that these measures will prevent every unauthorized attempt to access, use, or disclose your information since despite our efforts, no Internet and/or other electronic transmissions can be completely secure. Our web site uses “http cookies”—tiny pieces of information that we ask your browser to store. We use cookies for session management and security features on the Guggenheim Investments web site. We do not use them to pull data from your hard drive, to learn your e-mail address, or to view data in cookies created by other web sites. We will not share the information in our cookies or give others access to it. See the legal information area on our web site for more details about web site security and privacy features.
How We Safeguard Your Personal Information and Data Retention
We restrict access to nonpublic personal information about you to our employees and in some cases to third parties (for example, the service providers described above) as permitted by law. We maintain strict physical, electronic and procedural safeguards that comply with federal standards to guard your nonpublic personal information.
We keep your information for no longer than necessary for the purposes for which it is processed. The length of time for which we retain information depends on the purposes for which we collected and use it and/or as required to comply with applicable laws. Information may persist in copies made for backup and business continuity purposes for additional time.
International Visitors
If you are not a resident of the United States, please be aware that your information may be transferred to, stored and processed in the United States where our servers are located and our databases are operated. The data protection and other laws of the United States and other countries might not be as comprehensive as those in your country.
In such cases, we ensure that a legal basis for such a transfer exists and that adequate protection is provided as required by applicable law, for example, by using standard contractual clauses or by transferring your data to a jurisdiction that has obtained an adequacy finding. Individuals whose data may be transferred on the basis of standard contractual clauses may contact us as described below.
We’ll Keep You Informed
If you have any questions or concerns about how we treat your personal data, we encourage you to consult with us first. You may also contact the relevant supervisory authority.
| | THE GUGGENHEIM FUNDS SEMI-ANNUAL REPORT | 77 |
GUGGENHEIM INVESTMENTS PRIVACY NOTICE (Unaudited)(concluded) |
We reserve the right to modify this policy at any time and will inform you promptly of material changes. You may access our privacy policy from our web site at www.guggenheiminvestments.com. Should you have any questions regarding our privacy policy, contact us by email at CorporateDataPrivacy@GuggenheimPartners.com.
78 | THE GUGGENHEIM FUNDS SEMI-ANNUAL REPORT | |
This page intentionally left blank.
This page intentionally left blank.
This page intentionally left blank.
3.31.2021
Guggenheim Funds Semi-Annual Report
| |
Guggenheim Limited Duration Fund | | |
GuggenheimInvestments.com | LD-SEMI-0321x0921 |

| | |
DEAR SHAREHOLDER | 2 |
ECONOMIC AND MARKET OVERVIEW | 4 |
ABOUT SHAREHOLDERS’ FUND EXPENSES | 6 |
LIMITED DURATION FUND | 8 |
NOTES TO FINANCIAL STATEMENTS | 39 |
OTHER INFORMATION | 53 |
INFORMATION ON BOARD OF TRUSTEES AND OFFICERS | 54 |
GUGGENHEIM INVESTMENTS PRIVACY NOTICE | 59 |
| | THE GUGGENHEIM FUNDS SEMI-ANNUAL REPORT | 1 |
Dear Shareholder:
Guggenheim Partners Investment Management, LLC (the “Investment Manager”) is pleased to present the shareholder report for Guggenheim Limited Duration Fund (the “Fund”) for the semi-annual period ended March 31, 2021.
The Investment Manager is part of Guggenheim Investments, which represents the investment management businesses of Guggenheim Partners, LLC (“Guggenheim”), a global, diversified financial services firm.
Guggenheim Funds Distributors, LLC is the distributor of the Fund. Guggenheim Funds Distributors, LLC is affiliated with Guggenheim and the Investment Manager.
We encourage you to read the Economic and Market Overview section of the report, which follows this letter.
We are committed to providing innovative investment solutions and appreciate the trust you place in us.
Sincerely,
Guggenheim Partners Investment Management, LLC
April 30, 2021
Read a prospectus and summary prospectus (if available) carefully before investing. It contains the investment objectives, risks, charges, expenses and other information, which should be considered carefully before investing. Obtain a prospectus and summary prospectus (if available) at guggenheiminvestments.com or call 800.820.0888.
This material is not intended as a recommendation or as investment advice of any kind, including in connection with rollovers, transfers, and distributions. Such material is not provided in a fiduciary capacity, may not be relied upon for or in connection with the making of investment decisions, and does not constitute a solicitation of an offer to buy or sell securities. All content has been provided for informational or educational purposes only and is not intended to be and should not be construed as legal or tax advice and/or a legal opinion. Always consult a financial, tax and/or legal professional regarding your specific situation.
COVID-19. The global ongoing crisis caused by the outbreak of COVID-19 and the current recovery underway is causing disruption to consumer demand and economic output and supply chains. There are still travel restrictions and quarantines, and adverse impacts on local and global economies. Investors should be aware that in light of the current uncertainty, volatility and distress in economies, the financial markets, and labor and public health conditions around the world, the Fund’s investments and a shareholder’s investment in the Fund are subject to investment risk, including the possible loss of the entire principal amount invested. Firms through which investors invest with the Fund, the Fund, its service providers, the markets in which it invests and market intermediaries are also impacted by quarantines and similar measures intended to respond to and contain the ongoing pandemic, which can obstruct their functioning and subject them to heightened operational and other risks.
2 | THE GUGGENHEIM FUNDS SEMI-ANNUAL REPORT | |
Limited Duration Fund may not be suitable for all investors. ● The Fund’s market value will change in response to interest rate changes and market conditions among other factors. In general, bond prices rise when interest rates fall and vice versa. ● The Fund’s exposure to high yield securities may subject the Fund to greater volatility. ● When market conditions are deemed appropriate, the Fund may use leverage to the full extent permitted by its investment policies and restrictions and applicable law. Leveraging will exaggerate the effect on net asset value of any increase or decrease in the market value of the Fund’s portfolio. ● The Fund may invest in derivative instruments, which may be more volatile and less liquid, increasing the risk of loss when compared to traditional securities. Certain of the derivative instruments are also subject to the risks of counterparty default and adverse tax treatment. ● Instruments and strategies (such as borrowing transactions and reverse repurchase agreements) may provide leveraged exposure to a particular investment, which will magnify any gains or losses on those investments. ● Investments in reverse repurchase agreements expose the Fund to the many of the same risks as investments in derivatives. ● The Fund’s investments in other investment vehicles subject the Fund to those risks and expenses affecting the investment vehicle. ● The Fund’s investments in foreign securities carry additional risks when compared to U.S. securities, due to the impact of diplomatic, political or economic developments in the country in question (investments in emerging markets securities are generally subject to an even greater level of risks). ● Investments in syndicated bank loans generally offer a floating interest rate and involve special types of risks. ● The Fund’s investments in municipal securities can be affected by events that affect the municipal bond market. ● The Fund’s investments in real estate securities subject the Fund to the same risks as direct investments in real estate, which is particularly sensitive to economic downturns. ● The Fund’s investments in restricted securities may involve financial and liquidity risk. ● You may have a gain or loss when you sell your shares. ● It is important to note that the Fund is not guaranteed by the U.S. government. ● Please read the prospectus for more detailed information regarding these and other risks.
| | THE GUGGENHEIM FUNDS SEMI-ANNUAL REPORT | 3 |
ECONOMIC AND MARKET OVERVIEW (Unaudited) | March 31, 2021 |
For the six-month period ended March 31, 2021, the yield on the two-year U.S. Treasury Note rose 3 basis points1 to 0.16% from 0.13%, and the 10-year U.S. Treasury Note climbed 105 basis points to 1.74% from 0.69%. The spread between the two-year U.S. Treasury Note and 10-year U.S. Treasury Note widened from 56 basis points to 158 basis points as investors repositioned in response to fears of inflationary pressure, which the Federal Reserve (the “Fed”) regards as a transitory, short-term phenomenon. Easy financial conditions and low rates will likely support credit over the next few years. With market optimism pulling forward rate hike expectations and causing bond yields to rise, we view this as an opportunity to add incremental yield to portfolios.
Our 2021 U.S. economic growth forecast increased during the first quarter of 2021 from an annualized 5.5% to over 7%, factoring in more fiscal stimulus than previously anticipated. This forecast captures the effect of stimulus representing roughly 11% of 2020–2021 gross domestic product (“GDP”), versus the previous calculation of about 8%. We see strength in the consumer sector and in housing activity. In addition, U.S. vaccinations for COVID-19 continue to accelerate, nearing 3 million doses per day by the end of the first quarter. More than 213 million doses have been administered in the U.S. so far, and about 35% of the U.S. population has been fully vaccinated. The U.S. is seeing the best-case scenario unfold in its vaccine rollout, but other countries have not been as fortunate.
Europe’s vaccine rollout hit a major speedbump during the first quarter when questions surrounding the safety of the AstraZeneca vaccine led several major European countries to temporarily suspend distribution. Safety concerns, coupled with supply constraints, meant that less than 10% of the populations of Germany, France, and Italy had been vaccinated by the end of the first quarter, well under the pace needed to reach 70% inoculated by summer. Any delay in ending the pandemic on a global scale has implications for other countries too, including the U.S., where travel and hospitality workers represent a large share of the unemployed.
Despite vaccination delays in Europe and its implications abroad, we saw meaningful improvement in the domestic labor market during the first quarter as states moved forward with business re-openings. Seasonally adjusted initial jobless claims fell by 97,000 to 684,000 in the week ending March 20, 2021, the lowest level since the pandemic began, before seeing an uptick the following week to 719,000. We saw more positive news across the board in the March payroll report with 916,000 jobs added, and with 156,000 more from revisions. Standing in the way of additional labor market gains are local government restrictions on certain sectors, although easing of these restrictions is expected by summer.
Economic developments drove a sharp increase in U.S. Treasury yields. The market pulled forward expectations of the next Fed rate hike from December 2023 to December 2022, while repricing the long-run terminal Fed funds rate estimate to 2.25% from just 0.55% last August. We do not expect the Fed to raise interest rates as early as the market is anticipating, even though we expect strong GDP growth in coming years.
Year-over-year inflation measures will rise over the next several months due to base effects, which may be compounded by supply chain disruptions in the goods sector and potential capacity constraints for certain services. However, these factors could prove to be short-lived, with base effects set to dampen inflation starting in the summer months. Moreover, the Fed is focused on generating sustainably higher inflation. Even if core inflation rises above the Fed’s 2% target in 2021, the Fed’s focus is on a long-term average of 2%. With years of shortfalls to make up, and the Fed now targeting labor market disparities as part of an expanded definition of full employment, we expect policymakers to remain resolutely patient. Any tapering of asset purchases will likely be deferred until later in 2022, with the first rate hike likely to come sometime after that.
For the six-month period ended March 31, 2021, the Standard & Poor’s 500® (“S&P 500®”) Index* returned 19.07%. The MSCI Europe-Australasia-Far East (“EAFE”) Index* returned 20.08%. The return of the MSCI Emerging Markets Index* was 22.43%.
In the bond market, the Bloomberg Barclays U.S. Aggregate Bond Index* posted a -2.73% return for the six-month period, while the Bloomberg Barclays U.S. Corporate High Yield Index* returned 7.36%. The return of the ICE Bank of America (“BofA”) Merrill Lynch 3-Month U.S. Treasury Bill Index* was 0.06% for the six-month period.
The opinions and forecasts expressed may not actually come to pass. This information is subject to change at any time, based on market and other conditions, and should not be construed as a recommendation of any specific security or strategy.
1 | Basis point – one basis point is equal to 0.01%. |
4 | THE GUGGENHEIM FUNDS SEMI-ANNUAL REPORT | |
ECONOMIC AND MARKET OVERVIEW (Unaudited)(concluded) | March 31, 2021 |
*Index Definitions:
The following indices are referenced throughout this report. Indices are unmanaged and not available for direct investment. Index performance does not reflect transaction costs, fees, or expenses.
Bloomberg Barclays U.S. Aggregate Bond Index is a broad-based flagship benchmark that measures the investment grade, U.S. dollar-denominated, fixed-rate taxable bond market, including U.S. Treasuries, government-related and corporate securities, mortgage-backed securities or “MBS” (agency fixed-rate and hybrid adjustable-rate mortgage, or “ARM”, pass-throughs), asset-backed securities (“ABS”), and commercial mortgage-backed securities (“CMBS”) (agency and non-agency).
Bloomberg Barclays U.S. Corporate High Yield Index measures the U.S. dollar-denominated, high yield, fixed-rate corporate bond market. Securities are classified as high yield if the middle rating of Moody’s, Fitch, and S&P is Ba1/BB +/BB + or below.
Bloomberg Barclays U.S. Aggregate 1-3 Year Index measures the performance of publicly issued investment grade corporate, U.S. Treasury and government agency securities with remaining maturities of one to three years.
ICE BofA Merrill Lynch 3-Month U.S. Treasury Bill Index is an unmanaged market index of U.S. Treasury securities maturing in 90 days that assumes reinvestment of all income.
MSCI EAFE Index is a free float-adjusted market capitalization index that is designed to measure the equity market performance of developed markets, excluding the U.S. & Canada.
MSCI Emerging Markets Index is a free float-adjusted market capitalization weighted index that is designed to measure equity market performance in the global emerging markets.
S&P 500® is a broad-based index, the performance of which is based on the performance of 500 widely held common stocks chosen for market size, liquidity, and industry group representation.
| | THE GUGGENHEIM FUNDS SEMI-ANNUAL REPORT | 5 |
ABOUT SHAREHOLDERS’ FUND EXPENSES (Unaudited) | |
All mutual funds have operating expenses, and it is important for our shareholders to understand the impact of costs on their investments. Shareholders of a fund incur two types of costs: (i) transaction costs, including sales charges (loads) on purchase payments, reinvested dividends, other distributions, and exchange fees, and (ii) ongoing costs, including management fees, administrative services, and shareholder reports, among others. These ongoing costs, or operating expenses, are deducted from a fund’s gross income and reduce the investment return of the fund.
A fund’s expenses are expressed as a percentage of its average net assets, which is known as the expense ratio. The following examples are intended to help investors understand the ongoing costs (in dollars) of investing in a fund and to compare these costs with the ongoing costs of investing in other mutual funds.
The examples are based on an investment of $1,000 made at the beginning of the period and held for the entire six-month period beginning September 30, 2020 and ending March 31, 2021.
The following tables illustrate the Fund’s costs in two ways:
Table 1. Based on actual Fund return: This section helps investors estimate the actual expenses paid over the period. The “Ending Account Value” shown is derived from the Fund’s actual return, and the fifth column shows the dollar amount that would have been paid by an investor who started with $1,000 in the Fund. Investors may use the information here, together with the amount invested, to estimate the expenses paid over the period. Simply divide the Fund’s account value by $1,000 (for example, an $8,600 account value divided by $1,000 = 8.6), then multiply the result by the number provided under the heading “Expenses Paid During Period.”
Table 2. Based on hypothetical 5% return: This section is intended to help investors compare a fund’s cost with those of other mutual funds. The table provides information about hypothetical account values and hypothetical expenses based on the Fund’s actual expense ratio and an assumed rate of return of 5% per year before expenses, which is not the Fund’s actual return. The hypothetical account values and expenses may not be used to estimate the actual ending account balance or expenses paid during the period. The example is useful in making comparisons because the U.S. Securities and Exchange Commission (the “SEC”) requires all mutual funds to calculate expenses based on the 5% return. Investors can assess a Fund’s costs by comparing this hypothetical example with the hypothetical examples that appear in shareholder reports of other funds.
The calculations illustrated above assume no shares were bought or sold during the period. Actual costs may have been higher or lower, depending on the amount of investment and the timing of any purchases or redemptions.
Please note that the expenses shown in the table are meant to highlight your ongoing costs only and do not reflect any transactional costs, such as sales charges (loads) on purchase payments, and contingent deferred sales charges (“CDSC”) on redemptions, if any. Therefore, the second table is useful in comparing ongoing costs only, and will not help you determine the relative total costs of owning different funds. In addition, if these transactional costs were included, your costs would have been higher.
More information about the Fund’s expenses, including annual expense ratios for periods up to five years (subject to the Fund’s inception date), can be found in the Financial Highlights section of this report. For additional information on operating expenses and other shareholder costs, please refer to the Fund’s prospectus.
6 | THE GUGGENHEIM FUNDS SEMI-ANNUAL REPORT | |
ABOUT SHAREHOLDERS’ FUND EXPENSES (Unaudited)(concluded) | |
| Expense
Ratio1 | Fund
Return | Beginning
Account Value
September 30, 2020 | Ending
Account Value
March 31, 2021 | Expenses
Paid During
Period2 |
Table 1. Based on actual Fund return3 | | | | | |
A-Class | 0.74% | 0.45% | $ 1,000.00 | $ 1,004.50 | $ 3.70 |
C-Class | 1.49% | 0.08% | 1,000.00 | 1,000.80 | 7.43 |
P-Class | 0.74% | 0.45% | 1,000.00 | 1,004.50 | 3.70 |
Institutional Class | 0.49% | 0.57% | 1,000.00 | 1,005.70 | 2.45 |
R6-Class | 0.49% | 0.57% | 1,000.00 | 1,005.70 | 2.45 |
|
Table 2. Based on hypothetical 5% return (before expenses) | | | | |
A-Class | 0.74% | 5.00% | $ 1,000.00 | $ 1,021.24 | $ 3.73 |
C-Class | 1.49% | 5.00% | 1,000.00 | 1,017.50 | 7.49 |
P-Class | 0.74% | 5.00% | 1,000.00 | 1,021.24 | 3.73 |
Institutional Class | 0.49% | 5.00% | 1,000.00 | 1,022.49 | 2.47 |
R6-Class | 0.49% | 5.00% | 1,000.00 | 1,022.49 | 2.47 |
1 | Annualized and excludes expenses of the underlying funds in which the Fund invests, if any. This ratio represents net expenses, which may include expenses that are excluded from the expense limitation agreement. Excluding these expenses, the net expense ratio for the Fund would be 0.74%, 1.48%, 0.74%, 0.49% and 0.49% for the A-Class, C-Class, P-Class, Institutional Class and R6-Class, respectively. |
2 | Expenses are equal to the Fund’s annualized expense ratio, net of any applicable fee waivers, multiplied by the average account value over the period, multiplied by 182/365 (to reflect the one-half year period). |
3 | Actual cumulative return at net asset value for the period September 30, 2020 to March 31, 2021. |
| | THE GUGGENHEIM FUNDS SEMI-ANNUAL REPORT | 7 |
PERFORMANCE REPORT AND FUND PROFILE (Unaudited) | March 31, 2021 |
LIMITED DURATION FUND
OBJECTIVE: Seeks to provide a high level of income consistent with preservation of capital.
Holdings Diversification (Market Exposure as % of Net Assets)
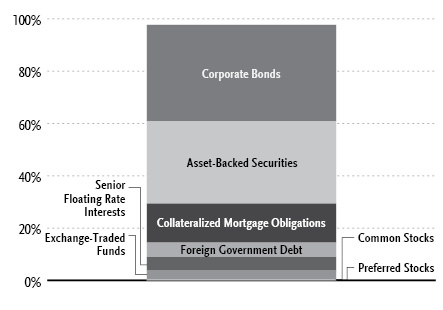
“Holdings Diversification (Market Exposure as % of Net Assets)” excludes any temporary cash investments, investments in Guggenheim Strategy Funds Trust mutual funds, or investments in Guggenheim Ultra Short Duration Fund.
Portfolio Composition by Quality Rating1 |
Rating | % of Total
Investments |
Fixed Income Instruments | |
AAA | 24.3% |
AA | 9.6% |
A | 19.9% |
BBB | 23.1% |
BB | 6.4% |
B | 3.4% |
CCC | 0.5% |
CC | 0.1% |
NR2 | 3.5% |
Other Instruments | 9.2% |
Total Investments | 100.0% |
Inception Dates: |
A-Class | December 16, 2013 |
C-Class | December 16, 2013 |
P-Class | May 1, 2015 |
Institutional Class | December 16, 2013 |
R6-Class | March 13, 2019 |
Ten Largest Holdings (% of Total Net Assets) |
iShares Core U.S. Aggregate Bond ETF | 3.5% |
State of Israel, 1.00% | 2.6% |
Shackleton CLO Ltd., 1.14% | 1.3% |
Station Place Securitization Trust, 0.92% | 1.1% |
Boeing Co., 4.88% | 1.1% |
Czech Republic, 0.10% | 1.0% |
Diamond CLO Ltd., 1.40% | 0.9% |
CSMC Trust, 1.67% | 0.9% |
Kingdom of Spain, (0.51)% | 0.8% |
Oak Street Investment Grade Net Lease Fund Series, 1.85% | 0.8% |
Top Ten Total | 14.0% |
| | |
“Ten Largest Holdings” excludes any temporary cash or derivative investments. |
1 | Source: BlackRock Solutions. Credit quality ratings are measured on a scale that generally ranges from AAA (highest) to D (lowest). All securities except for those labeled “NR” have been rated by Moody’s, Standard & Poor’s (“S&P”), or Fitch, each of which is a Nationally Recognized Statistical Rating Organization (“NRSRO”). For purposes of this presentation, when ratings are available from more than one agency, the highest rating is used. Guggenheim Investments has converted ratings to the equivalent S&P rating. Security ratings are determined at the time of purchase and may change thereafter. |
2 | NR (not rated) securities do not necessarily indicate low credit quality. |
8 | THE GUGGENHEIM FUNDS SEMI-ANNUAL REPORT | |
PERFORMANCE REPORT AND FUND PROFILE (Unaudited)(concluded) | March 31, 2021 |
Average Annual Returns*
Periods Ended March 31, 2021
| 6 Month† | 1 Year | 5 Year | Inception
(12/16/13) |
A-Class Shares | 0.45% | 6.38% | 3.24% | 2.73% |
A-Class Shares with sales charge‡ | (1.82%) | 3.99% | 2.77% | 2.40% |
C-Class Shares | 0.08% | 5.55% | 2.47% | 1.96% |
C-Class Shares with CDSC§ | (0.92%) | 4.55% | 2.47% | 1.96% |
Institutional Class Shares | 0.57% | 6.60% | 3.50% | 2.99% |
Bloomberg Barclays U.S. Aggregate 1-3 Year Index | 0.15% | 1.19% | 1.96% | 1.68% |
| 6 Month† | 1 Year | 5 Year | Since
Inception
(05/01/15) |
P-Class Shares | 0.45% | 6.38% | 3.24% | 2.75% |
Bloomberg Barclays U.S. Aggregate 1-3 Year Index | 0.15% | 1.19% | 1.96% | 1.83% |
| | 6 Month† | 1 Year | Since
Inception
(03/13/19) |
R6-Class Shares | | 0.57% | 6.65% | 3.98% |
Bloomberg Barclays U.S. Aggregate 1-3 Year Index | | 0.15% | 1.19% | 3.04% |
* | The performance data above represents past performance that is not predictive of future results. The investment return and principal value of an investment in the Fund will fluctuate so that an investor’s shares, when redeemed, may be worth more or less than their original cost. Returns are historical and include changes in principal and reinvested dividends and capital gains and do not reflect the effect of taxes. The Bloomberg Barclays U.S. Aggregate 1-3 Year Index is an unmanaged index and, unlike the Fund, has no management fees or operating expenses to reduce its reported return. |
† | 6 month returns are not annualized. |
‡ | Fund returns are calculated using the maximum sales charge of 2.25%. |
§ | Fund returns include a CDSC of 1% if redeemed within 12 months of purchase. |
| | THE GUGGENHEIM FUNDS SEMI-ANNUAL REPORT | 9 |
SCHEDULE OF INVESTMENTS (Unaudited) | March 31, 2021 |
LIMITED DURATION FUND | |
| | Shares | | | Value | |
COMMON STOCKS† - 0.2% |
| | | | | | | | | |
Financial - 0.2% |
KKR Acquisition Holdings I Corp.* | | | 820,948 | | | $ | 8,217,689 | |
RXR Acquisition Corp.* | | | 165,463 | | | | 1,629,811 | |
MSD Acquisition Corp.* | | | 136,871 | | | | 1,389,241 | |
Soaring Eagle Acquisition Corp.* | | | 98,317 | | | | 994,968 | |
Colicity, Inc.* | | | 33,744 | | | | 340,814 | |
Total Financial | | | | | | | 12,572,523 | |
| | | | | | | | | |
Total Common Stocks | | | | |
(Cost $12,550,612) | | | | | | | 12,572,523 | |
| | | | | | | | | |
PREFERRED STOCKS†† - 0.1% |
Financial - 0.1% |
American Financial Group, Inc., 4.50% due 09/15/60 | | | 113,600 | | | | 3,011,536 | |
First Republic Bank, 4.13% | | | 69,600 | | | | 1,740,000 | |
Total Financial | | | | | | | 4,751,536 | |
| | | | | | | | | |
Total Preferred Stocks | | | | |
(Cost $4,580,000) | | | | | | | 4,751,536 | |
| | | | | | | | | |
EXCHANGE-TRADED FUNDS† - 3.5% |
iShares Core U.S. Aggregate Bond ETF | | | 1,526,500 | | | | 173,761,495 | |
Total Exchange-Traded Funds | | | | |
(Cost $180,013,520) | | | | | | | 173,761,495 | |
| | | | | | | | | |
MUTUAL FUNDS† - 1.8% |
Guggenheim Strategy Fund III1 | | | 1,186,951 | | | | 29,839,957 | |
Guggenheim Strategy Fund II1 | | | 1,187,278 | | | | 29,658,216 | |
Guggenheim Ultra Short Duration Fund — Institutional Class1 | | | 2,919,361 | | | | 29,076,836 | |
Total Mutual Funds | | | | |
(Cost $87,057,622) | | | | | | | 88,575,009 | |
| | | | | | | | | |
MONEY MARKET FUND† - 3.8% |
Dreyfus Treasury Securities Cash Management Fund — Institutional Shares, 0.01%2 | | | 190,564,399 | | | | 190,564,399 | |
Total Money Market Fund | | | | |
(Cost $190,564,399) | | | | | | | 190,564,399 | |
| | | | | | | | | |
| | | Face
Amount~ | | | | | |
CORPORATE BONDS†† - 36.8% |
Financial - 13.5% | | | | | | | | |
Wells Fargo & Co. | | | | | | | | |
2.88% due 10/30/303 | | | 25,000,000 | | | | 25,735,395 | |
3.90%3,4 | | | 11,150,000 | | | | 11,260,385 | |
2.57% due 02/11/313 | | | 2,240,000 | | | | 2,257,070 | |
Santander UK plc | | | | | | | | |
0.81% (3 Month USD LIBOR + 0.62%) due 06/01/215 | | | 30,740,000 | | | | 30,770,429 | |
American International Group, Inc. | | | | | | | | |
2.50% due 06/30/25 | | | 26,630,000 | | | | 27,930,055 | |
Equitable Financial Life Global Funding | | | | | | | | |
1.40% due 07/07/256 | | | 15,000,000 | | | | 14,986,091 | |
1.80% due 03/08/286 | | | 12,000,000 | | | | 11,724,725 | |
BNP Paribas S.A. | | | | | | | | |
1.32% due 01/13/273,6 | | | 21,350,000 | | | | 20,870,839 | |
2.22% due 06/09/263,6 | | | 400,000 | | | | 410,066 | |
Citizens Bank North America/Providence RI | | | | | | | | |
2.25% due 04/28/25 | | | 20,000,000 | | | | 20,744,432 | |
Bank of America Corp. | | | | | | | | |
2.59% due 04/29/313 | | | 19,650,000 | | | | 19,584,822 | |
Reliance Standard Life Global Funding II | | | | | | | | |
2.75% due 05/07/256 | | | 17,890,000 | | | | 18,774,842 | |
Barclays Bank plc | | | | | | | | |
1.70% due 05/12/22 | | | 18,450,000 | | | | 18,704,597 | |
Credit Agricole S.A. | | | | | | | | |
1.25% due 01/26/273,6 | | | 17,950,000 | | | | 17,548,098 | |
1.91% due 06/16/263,6 | | | 400,000 | | | | 405,389 | |
Intercontinental Exchange, Inc. | | | | | | | | |
0.83% (3 Month USD LIBOR + 0.65%) due 06/15/235 | | | 17,100,000 | | | | 17,114,330 | |
Credit Suisse Group AG | | | | | | | | |
1.31% due 02/02/273,6 | | | 15,000,000 | | | | 14,523,574 | |
4.28% due 01/09/286 | | | 2,000,000 | | | | 2,197,726 | |
2.59% due 09/11/253,6 | | | 250,000 | | | | 259,222 | |
Mitsubishi UFJ Financial Group, Inc. | | | | | | | | |
0.87% (3 Month USD LIBOR + 0.65%) due 07/26/215 | | | 11,450,000 | | | | 11,471,585 | |
1.24% (3 Month USD LIBOR + 1.06%) due 09/13/215 | | | 5,068,000 | | | | 5,089,372 | |
Citibank North America | | | | | | | | |
0.79% (3 Month USD LIBOR + 0.57%) due 07/23/215 | | | 16,390,000 | | | | 16,410,117 | |
Cooperatieve Rabobank UA | | | | | | | | |
1.34% due 06/24/263,6 | | | 15,000,000 | | | | 14,868,399 | |
Svenska Handelsbanken AB | | | | | | | | |
0.65% (3 Month USD LIBOR + 0.47%) due 05/24/215 | | | 13,500,000 | | | | 13,509,892 | |
3.35% due 05/24/21 | | | 1,179,000 | | | | 1,184,044 | |
Regions Financial Corp. | | | | | | | | |
2.25% due 05/18/25 | | | 14,000,000 | | | | 14,521,688 | |
Fidelity & Guaranty Life Holdings, Inc. | | | | | | | | |
5.50% due 05/01/256 | | | 11,450,000 | | | | 13,083,228 | |
Citigroup, Inc. | | | | | | | | |
2.57% due 06/03/313 | | | 12,850,000 | | | | 12,830,663 | |
American Tower Corp. | | | | | | | | |
1.60% due 04/15/26 | | | 12,500,000 | | | | 12,522,762 | |
Deloitte LLP | | | | | | | | |
4.35% due 11/17/23††† | | | 7,300,000 | | | | 7,729,502 | |
3.46% due 05/07/27††† | | | 4,500,000 | | | | 4,611,710 | |
Lincoln National Corp. | | | | | | | | |
3.40% due 01/15/31 | | | 11,590,000 | | | | 12,334,366 | |
BlackRock, Inc. | | | | | | | | |
1.90% due 01/28/31 | | | 12,600,000 | | | | 12,177,394 | |
Iron Mountain, Inc. | | | | | | | | |
4.88% due 09/15/276 | | | 7,360,000 | | | | 7,530,200 | |
5.00% due 07/15/286 | | | 4,175,000 | | | | 4,268,937 | |
10 | THE GUGGENHEIM FUNDS SEMI-ANNUAL REPORT | SEE NOTES TO FINANCIAL STATEMENTS. |
SCHEDULE OF INVESTMENTS (Unaudited)(continued) | March 31, 2021 |
LIMITED DURATION FUND | |
| | Face
Amount~ | | | Value | |
Standard Chartered plc | | | | | | | | |
1.32% due 10/14/233,6 | | | 10,150,000 | | | $ | 10,214,452 | |
4.25% due 01/20/233,6 | | | 500,000 | | | | 513,987 | |
Societe Generale S.A. | | | | | | | | |
1.49% due 12/14/263,6 | | | 10,500,000 | | | | 10,314,561 | |
3.88% due 03/28/246 | | | 350,000 | | | | 377,463 | |
Apollo Management Holdings, LP | | | | | | | | |
4.40% due 05/27/266 | | | 7,115,000 | | | | 8,031,723 | |
4.00% due 05/30/246 | | | 1,846,000 | | | | 2,023,314 | |
Essex Portfolio, LP | | | | | | | | |
1.70% due 03/01/28 | | | 10,450,000 | | | | 10,053,167 | |
ING Groep N.V. | | | | | | | | |
1.73% due 04/01/273 | | | 9,800,000 | | | | 9,785,949 | |
Charles Schwab Corp. | | | | | | | | |
5.38%3,4 | | | 8,650,000 | | | | 9,588,525 | |
Ares Finance Company LLC | | | | | | | | |
4.00% due 10/08/246 | | | 8,967,000 | | | | 9,555,070 | |
BPCE S.A. | | | | | | | | |
1.65% due 10/06/263,6 | | | 9,500,000 | | | | 9,473,847 | |
First American Financial Corp. | | | | | | | | |
4.00% due 05/15/30 | | | 7,860,000 | | | | 8,491,009 | |
Aviation Capital Group LLC | | | | | | | | |
2.88% due 01/20/226 | | | 8,000,000 | | | | 8,115,806 | |
Markel Corp. | | | | | | | | |
6.00%3,4 | | | 7,210,000 | | | | 7,840,875 | |
KKR Group Finance Company VI LLC | | | | | | | | |
3.75% due 07/01/296 | | | 7,040,000 | | | | 7,775,983 | |
Morgan Stanley | | | | | | | | |
2.19% due 04/28/263 | | | 7,000,000 | | | | 7,229,907 | |
3.77% due 01/24/293 | | | 361,000 | | | | 394,628 | |
Goldman Sachs Group, Inc. | | | | | | | | |
3.50% due 04/01/25 | | | 6,900,000 | | | | 7,472,894 | |
GA Global Funding Trust | | | | | | | | |
1.63% due 01/15/266 | | | 7,300,000 | | | | 7,287,410 | |
Prudential plc | | | | | | | | |
3.13% due 04/14/30 | | | 6,640,000 | | | | 6,999,065 | |
SBA Communications Corp. | | | | | | | | |
3.13% due 02/01/296 | | | 6,500,000 | | | | 6,247,475 | |
3.88% due 02/15/27 | | | 700,000 | | | | 715,540 | |
Belrose Funding Trust | | | | | | | | |
2.33% due 08/15/306 | | | 7,100,000 | | | | 6,833,147 | |
LPL Holdings, Inc. | | | | | | | | |
4.00% due 03/15/296 | | | 4,450,000 | | | | 4,483,375 | |
4.63% due 11/15/276 | | | 2,000,000 | | | | 2,075,000 | |
UBS Group AG | | | | | | | | |
2.01% (3 Month USD LIBOR + 1.78%, Rate Floor: 0.00%) due 04/14/215,6 | | | 5,700,000 | | | | 5,702,524 | |
Fidelity National Financial, Inc. | | | | | | | | |
2.45% due 03/15/31 | | | 5,500,000 | | | | 5,314,569 | |
Fifth Third Bancorp | | | | | | | | |
2.55% due 05/05/27 | | | 5,060,000 | | | | 5,261,236 | |
Manulife Financial Corp. | | | | | | | | |
2.48% due 05/19/27 | | | 5,030,000 | | | | 5,213,540 | |
Westpac Banking Corp. | | | | | | | | |
1.08% (3 Month USD LIBOR + 0.85%) due 01/11/225 | | | 5,000,000 | | | | 5,032,208 | |
MetLife, Inc. | | | | | | | | |
3.85%3,4 | | | 4,620,000 | | | | 4,770,150 | |
Alexandria Real Estate Equities, Inc. | | | | | | | | |
4.90% due 12/15/30 | | | 3,500,000 | | | | 4,131,599 | |
United Wholesale Mortgage LLC | | | | | | | | |
5.50% due 11/15/256 | | | 3,880,000 | | | | 4,044,900 | |
Quicken Loans LLC / Quicken Loans Company-Issuer, Inc. | | | | | | | | |
3.88% due 03/01/316 | | | 4,100,000 | | | | 3,956,500 | |
Bank of New York Mellon Corp. | | | | | | | | |
4.70%3,4 | | | 3,010,000 | | | | 3,261,184 | |
Hunt Companies, Inc. | | | | | | | | |
5.25% due 04/15/296 | | | 3,250,000 | | | | 3,250,000 | |
CNA Financial Corp. | | | | | | | | |
4.50% due 03/01/26 | | | 2,298,000 | | | | 2,595,476 | |
NFP Corp. | | | | | | | | |
7.00% due 05/15/256 | | | 2,200,000 | | | | 2,359,500 | |
Crown Castle International Corp. | | | | | | | | |
3.30% due 07/01/30 | | | 2,188,000 | | | | 2,284,374 | |
Loews Corp. | | | | | | | | |
3.20% due 05/15/30 | | | 2,140,000 | | | | 2,261,865 | |
Ameriprise Financial, Inc. | | | | | | | | |
3.00% due 04/02/25 | | | 2,060,000 | | | | 2,190,952 | |
Equitable Holdings, Inc. | | | | | | | | |
4.35% due 04/20/28 | | | 1,700,000 | | | | 1,902,507 | |
Brookfield Finance, Inc. | | | | | | | | |
3.90% due 01/25/28 | | | 1,400,000 | | | | 1,537,479 | |
CIT Group, Inc. | | | | | | | | |
3.93% due 06/19/243 | | | 1,450,000 | | | | 1,533,375 | |
Mizuho Financial Group, Inc. | | | | | | | | |
1.32% (3 Month USD LIBOR + 1.14%) due 09/13/215 | | | 1,500,000 | | | | 1,507,071 | |
Weyerhaeuser Co. | | | | | | | | |
4.00% due 04/15/30 | | | 912,000 | | | | 1,007,442 | |
Trinity Acquisition plc | | | | | | | | |
4.40% due 03/15/26 | | | 881,000 | | | | 991,263 | |
Old Republic International Corp. | | | | | | | | |
3.88% due 08/26/26 | | | 700,000 | | | | 777,929 | |
Sumitomo Mitsui Financial Group, Inc. | | | | | | | | |
1.36% (3 Month USD LIBOR + 1.14%) due 10/19/215 | | | 702,000 | | | | 706,051 | |
RenaissanceRe Finance, Inc. | | | | | | | | |
3.70% due 04/01/25 | | | 400,000 | | | | 432,152 | |
BBVA USA | | | | | | | | |
3.88% due 04/10/25 | | | 150,000 | | | | 163,831 | |
Greystar Real Estate Partners LLC | | | | | | | | |
5.75% due 12/01/256 | | | 150,000 | | | | 154,125 | |
OneMain Finance Corp. | | | | | | | | |
7.13% due 03/15/26 | | | 50,000 | | | | 57,668 | |
Total Financial | | | | | | | 674,241,588 | |
| | | | | | | | | |
Consumer, Non-cyclical - 5.2% | | | | | | | | |
Anthem, Inc. | | | | | | | | |
1.50% due 03/15/26 | | | 29,000,000 | | | | 29,018,115 | |
Sysco Corp. | | | | | | | | |
5.65% due 04/01/25 | | | 20,550,000 | | | | 23,887,364 | |
SEE NOTES TO FINANCIAL STATEMENTS. | THE GUGGENHEIM FUNDS SEMI-ANNUAL REPORT | 11 |
SCHEDULE OF INVESTMENTS (Unaudited)(continued) | March 31, 2021 |
LIMITED DURATION FUND | |
| | Face
Amount~ | | | Value | |
General Mills, Inc. | | | | | | | | |
0.76% (3 Month USD LIBOR + 0.54%) due 04/16/215 | | | 20,750,000 | | | $ | 20,752,810 | |
CoStar Group, Inc. | | | | | | | | |
2.80% due 07/15/306 | | | 15,280,000 | | | | 14,928,443 | |
Lamb Weston Holdings, Inc. | | | | | | | | |
4.63% due 11/01/246 | | | 8,818,000 | | | | 9,150,615 | |
4.88% due 11/01/266 | | | 3,750,000 | | | | 3,881,250 | |
BAT International Finance plc | | | | | | | | |
1.67% due 03/25/26 | | | 13,000,000 | | | | 12,862,548 | |
Molina Healthcare, Inc. | | | | | | | | |
5.38% due 11/15/22 | | | 9,500,000 | | | | 9,961,130 | |
4.38% due 06/15/286 | | | 1,725,000 | | | | 1,774,956 | |
DaVita, Inc. | | | | | | | | |
4.63% due 06/01/306 | | | 10,250,000 | | | | 10,425,787 | |
3.75% due 02/15/316 | | | 800,000 | | | | 766,560 | |
Prime Security Services Borrower LLC / Prime Finance, Inc. | | | | | | | | |
3.38% due 08/31/276 | | | 11,200,000 | | | | 10,864,000 | |
Constellation Brands, Inc. | | | | | | | | |
2.88% due 05/01/30 | | | 10,500,000 | | | | 10,721,200 | |
Centene Corp. | | | | | | | | |
2.50% due 03/01/31 | | | 5,050,000 | | | | 4,810,125 | |
5.38% due 06/01/266 | | | 3,000,000 | | | | 3,137,100 | |
3.00% due 10/15/30 | | | 2,500,000 | | | | 2,495,850 | |
Altria Group, Inc. | | | | | | | | |
2.35% due 05/06/25 | | | 8,000,000 | | | | 8,290,031 | |
Anheuser-Busch InBev Worldwide, Inc. | | | | | | | | |
3.50% due 06/01/30 | | | 6,550,000 | | | | 7,077,560 | |
Spectrum Brands, Inc. | | | | | | | | |
5.75% due 07/15/25 | | | 6,780,000 | | | | 6,991,875 | |
McCormick & Company, Inc. | | | | | | | | |
2.50% due 04/15/30 | | | 7,000,000 | | | | 6,977,138 | |
BAT Capital Corp. | | | | | | | | |
4.70% due 04/02/27 | | | 4,220,000 | | | | 4,747,864 | |
3.56% due 08/15/27 | | | 2,000,000 | | | | 2,125,322 | |
Jaguar Holding Company II / PPD Development, LP | | | | | | | | |
4.63% due 06/15/256 | | | 6,400,000 | | | | 6,656,000 | |
Kraft Heinz Foods Co. | | | | | | | | |
4.25% due 03/01/31 | | | 5,700,000 | | | | 6,277,332 | |
Zimmer Biomet Holdings, Inc. | | | | | | | | |
3.55% due 03/20/30 | | | 5,350,000 | | | | 5,715,872 | |
3.05% due 01/15/26 | | | 400,000 | | | | 427,079 | |
Alcon Finance Corp. | | | | | | | | |
2.60% due 05/27/306 | | | 5,910,000 | | | | 5,922,142 | |
US Foods, Inc. | | | | | | | | |
6.25% due 04/15/256 | | | 3,750,000 | | | | 4,020,000 | |
4.75% due 02/15/296 | | | 1,700,000 | | | | 1,700,000 | |
Element Fleet Management Corp. | | | | | | | | |
1.60% due 04/06/246 | | | 5,050,000 | | | | 5,044,092 | |
Royalty Pharma plc | | | | | | | | |
1.75% due 09/02/276 | | | 5,150,000 | | | | 4,998,206 | |
Thermo Fisher Scientific, Inc. | | | | | | | | |
4.13% due 03/25/25 | | | 4,200,000 | | | | 4,662,240 | |
ADT Security Corp. | | | | | | | | |
3.50% due 07/15/22 | | | 3,096,000 | | | | 3,142,440 | |
Bunge Limited Finance Corp. | | | | | | | | |
1.63% due 08/17/25 | | | 1,900,000 | | | | 1,900,064 | |
Hologic, Inc. | | | | | | | | |
3.25% due 02/15/296 | | | 1,550,000 | | | | 1,530,625 | |
Avantor Funding, Inc. | | | | | | | | |
4.63% due 07/15/286 | | | 1,050,000 | | | | 1,096,578 | |
Service Corporation International | | | | | | | | |
3.38% due 08/15/30 | | | 750,000 | | | | 732,037 | |
Nielsen Finance LLC / Nielsen Finance Co. | | | | | | | | |
5.00% due 04/15/226 | | | 149,000 | | | | 149,031 | |
Carriage Services, Inc. | | | | | | | | |
6.63% due 06/01/266 | | | 100,000 | | | | 105,000 | |
Tenet Healthcare Corp. | | | | | | | | |
7.50% due 04/01/256 | | | 75,000 | | | | 80,975 | |
Total Consumer, Non-cyclical | | | | | | | 259,807,356 | |
| | | | | | | | | |
Industrial - 4.9% | | | | | | | | |
Boeing Co. | | | | | | | | |
4.88% due 05/01/25 | | | 50,000,000 | | | | 55,652,710 | |
2.20% due 02/04/26 | | | 10,450,000 | | | | 10,413,213 | |
Siemens Financieringsmaatschappij N.V. | | | | | | | | |
0.80% (3 Month USD LIBOR + 0.61%) due 03/16/225,6 | | | 20,410,000 | | | | 20,529,360 | |
Berry Global, Inc. | | | | | | | | |
1.57% due 01/15/266 | | | 11,750,000 | | | | 11,568,345 | |
4.88% due 07/15/266 | | | 5,165,000 | | | | 5,465,371 | |
FedEx Corp. | | | | | | | | |
3.80% due 05/15/25 | | | 9,100,000 | | | | 9,998,283 | |
4.25% due 05/15/30 | | | 4,350,000 | | | | 4,936,118 | |
CNH Industrial Capital LLC | | | | | | | | |
1.95% due 07/02/23 | | | 9,600,000 | | | | 9,857,582 | |
1.88% due 01/15/26 | | | 4,960,000 | | | | 5,018,789 | |
Ryder System, Inc. | | | | | | | | |
3.35% due 09/01/25 | | | 10,600,000 | | | | 11,443,581 | |
3.75% due 06/09/23 | | | 1,350,000 | | | | 1,438,733 | |
Graphic Packaging International LLC | | | | | | | | |
1.51% due 04/15/266 | | | 6,500,000 | | | | 6,451,882 | |
0.82% due 04/15/246 | | | 6,250,000 | | | | 6,231,509 | |
Silgan Holdings, Inc. | | | | | | | | |
1.40% due 04/01/266 | | | 12,600,000 | | | | 12,332,250 | |
Teledyne Technologies, Inc. | | | | | | | | |
2.25% due 04/01/28 | | | 12,000,000 | | | | 11,933,076 | |
Vontier Corp. | | | | | | | | |
1.80% due 04/01/266 | | | 7,050,000 | | | | 7,013,199 | |
2.40% due 04/01/286 | | | 3,900,000 | | | | 3,831,711 | |
Standard Industries, Inc. | | | | | | | | |
5.00% due 02/15/276 | | | 7,010,000 | | | | 7,307,925 | |
4.75% due 01/15/286 | | | 2,671,000 | | | | 2,768,759 | |
BAE Systems plc | | | | | | | | |
3.40% due 04/15/306 | | | 6,950,000 | | | | 7,372,147 | |
Owens Corning | | | | | | | | |
3.88% due 06/01/30 | | | 5,910,000 | | | | 6,440,094 | |
GATX Corp. | | | | | | | | |
3.85% due 03/30/27 | | | 2,900,000 | | | | 3,193,231 | |
4.00% due 06/30/30 | | | 2,550,000 | | | | 2,806,410 | |
3.50% due 03/15/28 | | | 200,000 | | | | 215,959 | |
12 | THE GUGGENHEIM FUNDS SEMI-ANNUAL REPORT | SEE NOTES TO FINANCIAL STATEMENTS. |
SCHEDULE OF INVESTMENTS (Unaudited)(continued) | March 31, 2021 |
LIMITED DURATION FUND | |
| | Face
Amount~ | | | Value | |
IDEX Corp. | | | | | | | | |
3.00% due 05/01/30 | | | 4,100,000 | | | $ | 4,223,131 | |
Penske Truck Leasing Company LP / PTL Finance Corp. | | | | | | | | |
4.45% due 01/29/266 | | | 2,475,000 | | | | 2,771,156 | |
4.20% due 04/01/276 | | | 500,000 | | | | 559,298 | |
Textron, Inc. | | | | | | | | |
2.45% due 03/15/31 | | | 3,250,000 | | | | 3,144,884 | |
Hardwood Funding LLC | | | | | | | | |
2.37% due 06/07/28††† | | | 3,000,000 | | | | 2,928,945 | |
Ardagh Metal Packaging Finance USA LLC / Ardagh Metal Packaging Finance plc | | | | | | | | |
4.00% due 09/01/296 | | | 2,500,000 | | | | 2,493,750 | |
Howmet Aerospace, Inc. | | | | | | | | |
6.88% due 05/01/25 | | | 1,900,000 | | | | 2,201,625 | |
Xylem, Inc. | | | | | | | | |
1.95% due 01/30/28 | | | 2,050,000 | | | | 2,045,056 | |
National Basketball Association | | | | | | | | |
2.51% due 12/16/24††† | | | 1,900,000 | | | | 1,943,652 | |
PGT Innovations, Inc. | | | | | | | | |
6.75% due 08/01/266 | | | 200,000 | | | | 212,500 | |
EnerSys | | | | | | | | |
5.00% due 04/30/236 | | | 175,000 | | | | 183,313 | |
Amsted Industries, Inc. | | | | | | | | |
4.63% due 05/15/306 | | | 100,000 | | | | 101,250 | |
Total Industrial | | | | | | | 247,028,797 | |
| | | | | | | | | |
Communications - 3.6% | | | | | | | | |
ViacomCBS, Inc. | | | | | | | | |
4.95% due 01/15/31 | | | 13,560,000 | | | | 16,028,629 | |
4.75% due 05/15/25 | | | 6,860,000 | | | | 7,755,522 | |
4.20% due 05/19/32 | | | 4,100,000 | | | | 4,595,741 | |
Verizon Communications, Inc. | | | | | | | | |
2.10% due 03/22/28 | | | 22,600,000 | | | | 22,717,266 | |
3.00% due 03/22/27 | | | 2,100,000 | | | | 2,244,867 | |
NTT Finance Corp. | | | | | | | | |
1.59% due 04/03/286 | | | 24,000,000 | | | | 23,413,073 | |
Level 3 Financing, Inc. | | | | | | | | |
3.63% due 01/15/296 | | | 5,400,000 | | | | 5,231,250 | |
5.25% due 03/15/26 | | | 3,991,000 | | | | 4,110,730 | |
4.25% due 07/01/286 | | | 2,775,000 | | | | 2,806,385 | |
3.75% due 07/15/296 | | | 2,150,000 | | | | 2,104,097 | |
Walt Disney Co. | | | | | | | | |
2.65% due 01/13/317 | | | 12,720,000 | | | | 12,932,382 | |
T-Mobile USA, Inc. | | | | | | | | |
3.50% due 04/15/256 | | | 5,000,000 | | | | 5,397,050 | |
2.63% due 04/15/26 | | | 3,200,000 | | | | 3,256,000 | |
2.25% due 02/15/26 | | | 3,150,000 | | | | 3,172,649 | |
3.88% due 04/15/306 | | | 540,000 | | | | 588,454 | |
Sirius XM Radio, Inc. | | | | | | | | |
4.63% due 07/15/246 | | | 6,620,000 | | | | 6,819,262 | |
3.88% due 08/01/226 | | | 3,527,000 | | | | 3,540,226 | |
5.38% due 07/15/266 | | | 1,900,000 | | | | 1,961,750 | |
5.50% due 07/01/296 | | | 75,000 | | | | 81,094 | |
Ziggo BV | | | | | | | | |
4.88% due 01/15/306 | | | 10,800,000 | | | | 11,039,058 | |
AT&T, Inc. | | | | | | | | |
2.30% due 06/01/27 | | | 9,000,000 | | | | 9,193,119 | |
Netflix, Inc. | | | | | | | | |
5.50% due 02/15/22 | | | 8,400,000 | | | | 8,736,000 | |
Altice France S.A. | | | | | | | | |
7.38% due 05/01/266 | | | 5,385,000 | | | | 5,600,400 | |
Videotron Ltd. | | | | | | | | |
5.00% due 07/15/22 | | | 5,350,000 | | | | 5,564,000 | |
Charter Communications Operating LLC / Charter Communications Operating Capital | | | | | | | | |
2.80% due 04/01/31 | | | 3,250,000 | | | | 3,213,254 | |
Booking Holdings, Inc. | | | | | | | | |
4.50% due 04/13/27 | | | 2,500,000 | | | | 2,899,360 | |
Fox Corp. | | | | | | | | |
3.05% due 04/07/25 | | | 1,360,000 | | | | 1,446,000 | |
3.50% due 04/08/30 | | | 1,080,000 | | | | 1,148,236 | |
Virgin Media Vendor Financing Notes IV DAC | | | | | | | | |
5.00% due 07/15/286 | | | 1,850,000 | | | | 1,884,465 | |
Thomson Reuters Corp. | | | | | | | | |
3.35% due 05/15/26 | | | 1,550,000 | | | | 1,674,293 | |
CSC Holdings LLC | | | | | | | | |
5.50% due 05/15/266 | | | 550,000 | | | | 567,050 | |
AMC Networks, Inc. | | | | | | | | |
4.75% due 08/01/25 | | | 500,000 | | | | 512,912 | |
Sprint Spectrum Co. LLC / Sprint Spectrum Co. II LLC / Sprint Spectrum Co. III LLC | | | | | | | | |
3.36% due 09/20/216 | | | 203,750 | | | | 205,278 | |
CCO Holdings LLC / CCO Holdings Capital Corp. | | | | | | | | |
5.75% due 02/15/266 | | | 85,000 | | | | 87,699 | |
Match Group Holdings II LLC | | | | | | | | |
4.63% due 06/01/286 | | | 75,000 | | | | 76,632 | |
Total Communications | | | | | | | 182,604,183 | |
| | | | | | | | | |
Technology - 3.0% | | | | | | | | |
HCL America, Inc. | | | | | | | | |
1.38% due 03/10/266 | | | 38,700,000 | | | | 37,985,783 | |
Microchip Technology, Inc. | | | | | | | | |
2.67% due 09/01/236 | | | 17,800,000 | | | | 18,536,644 | |
NetApp, Inc. | | | | | | | | |
2.38% due 06/22/27 | | | 17,800,000 | | | | 18,172,952 | |
Infor, Inc. | | | | | | | | |
1.75% due 07/15/256 | | | 13,800,000 | | | | 13,918,232 | |
1.45% due 07/15/236 | | | 1,100,000 | | | | 1,113,608 | |
Oracle Corp. | | | | | | | | |
2.30% due 03/25/28 | | | 12,400,000 | | | | 12,537,741 | |
Fidelity National Information Services, Inc. | | | | | | | | |
1.65% due 03/01/28 | | | 11,000,000 | | | | 10,736,118 | |
CDK Global, Inc. | | | | | | | | |
5.88% due 06/15/26 | | | 7,635,000 | | | | 7,883,137 | |
Citrix Systems, Inc. | | | | | | | | |
1.25% due 03/01/26 | | | 7,250,000 | | | | 7,124,050 | |
MSCI, Inc. | | | | | | | | |
3.88% due 02/15/316 | | | 6,796,000 | | | | 6,944,153 | |
Broadcom, Inc. | | | | | | | | |
4.15% due 11/15/30 | | | 5,790,000 | | | | 6,256,117 | |
SEE NOTES TO FINANCIAL STATEMENTS. | THE GUGGENHEIM FUNDS SEMI-ANNUAL REPORT | 13 |
SCHEDULE OF INVESTMENTS (Unaudited)(continued) | March 31, 2021 |
LIMITED DURATION FUND | |
| | Face
Amount~ | | | Value | |
NCR Corp. | | | | | | | | |
5.13% due 04/15/296 | | | 2,850,000 | | | $ | 2,882,291 | |
Qorvo, Inc. | | | | | | | | |
4.38% due 10/15/29 | | | 1,380,000 | | | | 1,473,164 | |
3.38% due 04/01/316 | | | 1,200,000 | | | | 1,175,868 | |
Twilio, Inc. | | | | | | | | |
3.63% due 03/15/29 | | | 2,600,000 | | | | 2,632,058 | |
Leidos, Inc. | | | | | | | | |
3.63% due 05/15/256 | | | 1,950,000 | | | | 2,115,746 | |
CDW LLC / CDW Finance Corp. | | | | | | | | |
3.25% due 02/15/29 | | | 810,000 | | | | 799,875 | |
Entegris, Inc. | | | | | | | | |
4.38% due 04/15/286 | | | 100,000 | | | | 103,115 | |
Total Technology | | | | | | | 152,390,652 | |
| | | | | | | | | |
Consumer, Cyclical - 3.0% | | | | | | | | |
Marriott International, Inc. | | | | | | | | |
4.63% due 06/15/30 | | | 7,320,000 | | | | 8,183,442 | |
5.75% due 05/01/25 | | | 6,610,000 | | | | 7,582,277 | |
2.13% due 10/03/22 | | | 2,345,000 | | | | 2,379,315 | |
Walgreens Boots Alliance, Inc. | | | | | | | | |
3.20% due 04/15/30 | | | 13,950,000 | | | | 14,476,572 | |
Delta Air Lines, Inc. | | | | | | | | |
7.00% due 05/01/256 | | | 12,550,000 | | | | 14,452,039 | |
Starbucks Corp. | | | | | | | | |
2.55% due 11/15/30 | | | 13,300,000 | | | | 13,316,535 | |
Hanesbrands, Inc. | | | | | | | | |
5.38% due 05/15/256 | | | 11,633,000 | | | | 12,309,168 | |
VF Corp. | | | | | | | | |
2.80% due 04/23/27 | | | 11,650,000 | | | | 12,257,984 | |
Hyatt Hotels Corp. | | | | | | | | |
5.38% due 04/23/25 | | | 5,180,000 | | | | 5,806,510 | |
5.75% due 04/23/30 | | | 4,320,000 | | | | 5,042,660 | |
Delta Air Lines Inc. / SkyMiles IP Ltd. | | | | | | | | |
4.50% due 10/20/256 | | | 10,000,000 | | | | 10,648,567 | |
Choice Hotels International, Inc. | | | | | | | | |
3.70% due 01/15/31 | | | 7,350,000 | | | | 7,728,084 | |
Hilton Domestic Operating Company, Inc. | | | | | | | | |
3.63% due 02/15/326 | | | 5,000,000 | | | | 4,853,000 | |
5.38% due 05/01/256 | | | 1,450,000 | | | | 1,528,300 | |
Lowe’s Companies, Inc. | | | | | | | | |
4.50% due 04/15/30 | | | 5,400,000 | | | | 6,224,780 | |
American Airlines Class AA Pass Through Trust | | | | | | | | |
3.35% due 10/15/29 | | | 3,026,430 | | | | 3,054,846 | |
3.00% due 10/15/28 | | | 1,849,177 | | | | 1,863,243 | |
BorgWarner, Inc. | | | | | | | | |
2.65% due 07/01/27 | | | 4,610,000 | | | | 4,784,153 | |
Mileage Plus Holdings LLC / Mileage Plus Intellectual Property Assets Ltd. | | | | | | | | |
6.50% due 06/20/276 | | | 3,350,000 | | | | 3,668,250 | |
Aramark Services, Inc. | | | | | | | | |
6.38% due 05/01/256 | | | 1,900,000 | | | | 2,014,000 | |
5.00% due 02/01/286 | | | 275,000 | | | | 285,381 | |
Dollar General Corp. | | | | | | | | |
3.50% due 04/03/30 | | | 2,050,000 | | | | 2,206,170 | |
Suburban Propane Partners Limited Partnership/Suburban Energy Finance Corp. | | | | | | | | |
5.88% due 03/01/27 | | | 1,800,000 | | | | 1,872,000 | |
5.75% due 03/01/25 | | | 200,000 | | | | 203,250 | |
5.50% due 06/01/24 | | | 75,000 | | | | 76,151 | |
WMG Acquisition Corp. | | | | | | | | |
3.63% due 10/15/26††† | | EUR | 1,000,000 | | | | 1,207,352 | |
3.88% due 07/15/306 | | | 500,000 | | | | 504,823 | |
1011778 BC ULC / New Red Finance, Inc. | | | | | | | | |
5.75% due 04/15/256 | | | 700,000 | | | | 743,750 | |
Performance Food Group, Inc. | | | | | | | | |
6.88% due 05/01/256 | | | 375,000 | | | | 400,313 | |
5.50% due 06/01/246 | | | 75,000 | | | | 75,281 | |
Total Consumer, Cyclical | | | | | | | 149,748,196 | |
| | | | | | | | | |
Basic Materials - 1.7% | | | | | | | | |
Anglo American Capital plc | | | | | | | | |
2.25% due 03/17/286 | | | 14,000,000 | | | | 13,814,316 | |
2.63% due 09/10/306 | | | 9,370,000 | | | | 9,177,636 | |
4.00% due 09/11/276 | | | 750,000 | | | | 826,141 | |
5.38% due 04/01/256 | | | 600,000 | | | | 683,339 | |
Newcrest Finance Pty Ltd. | | | | | | | | |
3.25% due 05/13/306 | | | 14,960,000 | | | | 15,643,027 | |
Valvoline, Inc. | | | | | | | | |
3.63% due 06/15/316 | | | 10,761,000 | | | | 10,411,268 | |
4.25% due 02/15/306 | | | 125,000 | | | | 127,500 | |
Carpenter Technology Corp. | | | | | | | | |
4.45% due 03/01/23 | | | 8,405,000 | | | | 8,709,525 | |
6.38% due 07/15/28 | | | 1,295,000 | | | | 1,391,710 | |
Kaiser Aluminum Corp. | | | | | | | | |
4.63% due 03/01/286 | | | 9,643,000 | | | | 9,870,093 | |
Arconic Corp. | | | | | | | | |
6.00% due 05/15/256 | | | 7,811,000 | | | | 8,418,579 | |
Nucor Corp. | | | | | | | | |
2.00% due 06/01/25 | | | 5,000,000 | | | | 5,127,553 | |
Steel Dynamics, Inc. | | | | | | | | |
2.40% due 06/15/25 | | | 1,050,000 | | | | 1,093,948 | |
Minerals Technologies, Inc. | | | | | | | | |
5.00% due 07/01/286 | | | 150,000 | | | | 154,687 | |
Novelis Corp. | | | | | | | | |
5.88% due 09/30/266 | | | 50,000 | | | | 52,340 | |
Total Basic Materials | | | | | | | 85,501,662 | |
| | | | | | | | | |
Energy - 1.1% | | | | | | | | |
Galaxy Pipeline Assets Bidco Ltd. | | | | | | | | |
2.16% due 03/31/346 | | | 20,000,000 | | | | 19,374,971 | |
Sabine Pass Liquefaction LLC | | | | | | | | |
4.50% due 05/15/30 | | | 8,330,000 | | | | 9,341,808 | |
5.63% due 03/01/25 | | | 500,000 | | | | 571,525 | |
BP Capital Markets plc | | | | | | | | |
4.88%3,4 | | | 7,500,000 | | | | 8,034,375 | |
Valero Energy Corp. | | | | | | | | |
2.15% due 09/15/27 | | | 3,100,000 | | | | 3,035,723 | |
2.85% due 04/15/25 | | | 1,750,000 | | | | 1,828,552 | |
2.70% due 04/15/23 | | | 500,000 | | | | 519,190 | |
14 | THE GUGGENHEIM FUNDS SEMI-ANNUAL REPORT | SEE NOTES TO FINANCIAL STATEMENTS. |
SCHEDULE OF INVESTMENTS (Unaudited)(continued) | March 31, 2021 |
LIMITED DURATION FUND | |
| | Face
Amount~ | | | Value | |
Occidental Petroleum Corp. | | | | | | | | |
5.50% due 12/01/25 | | | 5,000,000 | | | $ | 5,277,450 | |
Equinor ASA | | | | | | | | |
1.75% due 01/22/267 | | | 3,500,000 | | | | 3,580,452 | |
Magellan Midstream Partners, LP | | | | | | | | |
3.25% due 06/01/30 | | | 2,120,000 | | | | 2,217,907 | |
NuStar Logistics, LP | | | | | | | | |
4.75% due 02/01/22 | | | 1,186,000 | | | | 1,202,307 | |
Cheniere Corpus Christi Holdings LLC | | | | | | | | |
7.00% due 06/30/24 | | | 550,000 | | | | 633,019 | |
Parkland Corp. | | | | | | | | |
5.88% due 07/15/276 | | | 500,000 | | | | 533,125 | |
Crestwood Midstream Partners Limited Partnership / Crestwood Midstream Finance Corp. | | | | | | | | |
6.25% due 04/01/23 | | | 100,000 | | | | 100,020 | |
Total Energy | | | | | | | 56,250,424 | |
| | | | | | | | | |
Utilities - 0.8% | | | | | | | | |
Alexander Funding Trust | | | | | | | | |
1.84% due 11/15/236 | | | 19,050,000 | | | | 19,340,701 | |
Entergy Corp. | | | | | | | | |
1.90% due 06/15/28 | | | 9,100,000 | | | | 8,880,559 | |
Southern Co. | | | | | | | | |
1.75% due 03/15/28 | | | 5,000,000 | | | | 4,854,372 | |
AES Corp. | | | | | | | | |
3.30% due 07/15/256 | | | 4,250,000 | | | | 4,508,655 | |
Clearway Energy Operating LLC | | | | | | | | |
4.75% due 03/15/286 | | | 225,000 | | | | 234,088 | |
Total Utilities | | | | | | | 37,818,375 | |
| | | | | | | | | |
Total Corporate Bonds | | | | |
(Cost $1,812,473,773) | | | 1,845,391,233 | |
| | | | | | | | | |
ASSET-BACKED SECURITIES†† - 31.5% |
Collateralized Loan Obligations - 19.0% | | | | |
Shackleton CLO Ltd. | | | | | | | | |
2017-8A, 1.14% (3 Month USD LIBOR + 0.92%, Rate Floor: 0.00%) due 10/20/275,6 | | | 65,071,915 | | | | 65,065,779 | |
2018-6RA, 1.24% (3 Month USD LIBOR + 1.02%, Rate Floor: 1.02%) due 07/17/285,6 | | | 36,313,927 | | | | 36,298,516 | |
Diamond CLO Ltd. | | | | | | | | |
2021-1A, 1.40% (3 Month USD LIBOR + 1.20%, Rate Floor: 1.20%) due 04/25/295,6 | | | 43,750,000 | | | | 43,741,250 | |
2018-1A, 1.72% (3 Month USD LIBOR + 1.50%, Rate Floor: 1.50%) due 07/22/305,6 | | | 6,000,000 | | | | 5,987,754 | |
BXMT Ltd. | | | | | | | | |
2020-FL2, 1.01% (1 Month USD LIBOR + 0.90%, Rate Floor: 0.90%) due 02/16/375,6 | | | 25,122,000 | | | | 25,117,671 | |
2020-FL2, 1.26% (1 Month USD LIBOR + 1.15%, Rate Floor: 1.15%) due 02/16/375,6 | | | 14,310,000 | | | | 14,318,778 | |
2020-FL3, 1.86% (1 Month USD LIBOR + 1.75%, Rate Floor: 1.75%) due 03/15/375,6 | | | 4,500,000 | | | | 4,524,802 | |
2020-FL3, 2.26% (1 Month USD LIBOR + 2.15%, Rate Floor: 2.15%) due 03/15/375,6 | | | 2,000,000 | | | | 2,015,611 | |
2020-FL2, 1.51% (1 Month USD LIBOR + 1.40%, Rate Floor: 1.40%) due 02/16/375,6 | | | 2,000,000 | | | | 1,998,693 | |
Palmer Square Loan Funding Ltd. | | | | | | | | |
2021-1A, 1.06% (3 Month USD LIBOR + 0.90%, Rate Floor: 0.90%) due 04/20/295,6 | | | 21,000,000 | | | | 21,021,006 | |
2018-4A, 1.09% (3 Month USD LIBOR + 0.90%, Rate Floor: 0.00%) due 11/15/265,6 | | | 14,939,149 | | | | 14,942,987 | |
2019-3A, 1.03% (3 Month USD LIBOR + 0.85%, Rate Floor: 0.85%) due 08/20/275,6 | | | 4,123,202 | | | | 4,123,548 | |
2021-2A, due 05/20/295,6 | | | 4,000,000 | | | | 3,999,200 | |
2018-4A, 1.64% (3 Month USD LIBOR + 1.45%, Rate Floor: 0.00%) due 11/15/265,6 | | | 3,500,000 | | | | 3,503,061 | |
CHCP Ltd. | | | | | | | | |
2021-FL1, 1.16% (1 Month USD LIBOR + 1.05%, Rate Floor: 1.05%) due 02/15/385,6 | | | 34,750,000 | | | | 34,760,362 | |
LCM XXIV Ltd. | | | | | | | | |
2021-24A, 1.17% (3 Month USD LIBOR + 0.98%, Rate Floor: 0.98%) due 03/20/305,6 | | | 31,250,000 | | | | 31,205,381 | |
Carlyle Global Market Strategies CLO Ltd. | | | | | | | | |
2018-2A, 0.99% (3 Month USD LIBOR + 0.78%, Rate Floor: 0.00%) due 04/27/275,6 | | | 25,776,914 | | | | 25,764,093 | |
2018-4A, 1.24% (3 Month USD LIBOR + 1.00%, Rate Floor: 1.00%) due 01/15/315,6 | | | 4,681,009 | | | | 4,673,365 | |
Golub Capital Partners CLO Ltd. | | | | | | | | |
2018-36A, 1.50% (3 Month USD LIBOR + 1.30%, Rate Floor: 0.00%) due 02/05/315,6 | | | 27,500,000 | | | | 27,330,526 | |
LoanCore Issuer Ltd. | | | | | | | | |
2019-CRE2, 1.61% (1 Month USD LIBOR + 1.50%, Rate Floor: 1.50%) due 05/15/365,6 | | | 8,550,000 | | | | 8,541,465 | |
2021-CRE4, 1.36% (1 Month USD LIBOR + 1.25%, Rate Floor: 1.25%) due 07/15/355,6 | | | 7,500,000 | | | | 7,486,409 | |
2018-CRE1, 1.24% (1 Month USD LIBOR + 1.13%, Rate Floor: 1.13%) due 05/15/285,6 | | | 6,416,534 | | | | 6,416,575 | |
2018-CRE1, 1.61% (1 Month USD LIBOR + 1.50%, Rate Floor: 1.50%) due 05/15/285,6 | | | 3,500,000 | | | | 3,496,592 | |
SEE NOTES TO FINANCIAL STATEMENTS. | THE GUGGENHEIM FUNDS SEMI-ANNUAL REPORT | 15 |
SCHEDULE OF INVESTMENTS (Unaudited)(continued) | March 31, 2021 |
LIMITED DURATION FUND | |
| | Face
Amount~ | | | Value | |
MP CLO VIII Ltd. | | | | | | | | |
2018-2A, 1.13% (3 Month USD LIBOR + 0.91%, Rate Floor: 0.00%) due 10/28/275,6 | | | 23,775,378 | | | $ | 23,767,820 | |
Cerberus Loan Funding XXXI, LP | | | | | | | | |
2021-1A, 1.69% (3 Month USD LIBOR + 1.50%, Rate Floor: 1.50%) due 04/15/325,6 | | | 13,500,000 | | | | 13,500,000 | |
2021-1A, 2.09% (3 Month USD LIBOR + 1.90%, Rate Floor: 1.90%) due 04/15/325,6 | | | 9,500,000 | | | | 9,500,000 | |
HERA Commercial Mortgage Ltd. | | | | | | | | |
2021-FL1, 1.18% (1 Month USD LIBOR + 1.05%, Rate Floor: 1.05%) due 02/18/385,6 | | | 22,750,000 | | | | 22,758,991 | |
Madison Park Funding XLVIII Ltd. | | | | | | | | |
2021-48A, 1.59% (3 Month USD LIBOR + 1.45%, Rate Floor: 1.45%) due 04/19/335,6 | | | 22,000,000 | | | | 21,960,066 | |
MidOcean Credit CLO VII | | | | | | | | |
2020-7A, 1.28% (3 Month USD LIBOR + 1.04%, Rate Floor: 0.00%) due 07/15/295,6 | | | 20,500,000 | | | | 20,475,892 | |
GoldenTree Loan Management US CLO 1 Ltd. | | | | | | | | |
2020-1A, 1.17% (3 Month USD LIBOR + 0.95%, Rate Floor: 0.95%) due 04/20/295,6 | | | 12,000,000 | | | | 11,999,783 | |
2021-9A, 1.63% (3 Month USD LIBOR + 1.50%, Rate Floor: 1.50%) due 01/20/335,6 | | | 7,000,000 | | | | 6,973,339 | |
2021-9A, 1.93% (3 Month USD LIBOR + 1.80%, Rate Floor: 1.80%) due 01/20/335,6 | | | 1,000,000 | | | | 995,998 | |
Dryden 33 Senior Loan Fund | | | | | | | | |
2020-33A, 1.24% (3 Month USD LIBOR + 1.00%, Rate Floor: 1.00%) due 04/15/295,6 | | | 10,750,000 | | | | 10,738,695 | |
2020-33A, 1.64% (3 Month USD LIBOR + 1.40%, Rate Floor: 1.40%) due 04/15/295,6 | | | 8,250,000 | | | | 8,209,144 | |
Marathon CLO V Ltd. | | | | | | | | |
2017-5A, 1.05% (3 Month USD LIBOR + 0.87%, Rate Floor: 0.00%) due 11/21/275,6 | | | 18,813,612 | | | | 18,795,391 | |
Cerberus Loan Funding XXXII, LP | | | | | | | | |
2021-2A, due 04/22/335,6 | | | 18,250,000 | | | | 18,246,350 | |
Cerberus Loan Funding XXX, LP | | | | | | | | |
2020-3A, 2.08% (3 Month USD LIBOR + 1.85%, Rate Floor: 1.85%) due 01/15/335,6 | | | 18,000,000 | | | | 17,980,151 | |
ABPCI Direct Lending Fund CLO I LLC | | | | | | | | |
2021-1A, 1.79% (3 Month USD LIBOR + 1.60%, Rate Floor: 1.60%) due 04/20/325,6 | | | 15,250,000 | | | | 15,250,000 | |
2021-1A, 2.34% (3 Month USD LIBOR + 2.15%, Rate Floor: 2.15%) due 04/20/325,6 | | | 2,250,000 | | | | 2,250,000 | |
2021-1A, 2.09% (3 Month USD LIBOR + 1.90%, Rate Floor: 1.90%) due 04/20/325,6 | | | 300,000 | | | | 300,000 | |
Woodmont Trust | | | | | | | | |
2020-7A, 2.05% (3 Month USD LIBOR + 1.90%, Rate Floor: 1.90%) due 01/15/325,6 | | | 16,250,000 | | | | 16,231,314 | |
GPMT Ltd. | | | | | | | | |
2019-FL2, 1.41% (1 Month USD LIBOR + 1.30%, Rate Floor: 1.30%) due 02/22/365,6 | | | 16,100,000 | | | | 16,123,691 | |
ABPCI Direct Lending Fund IX LLC | | | | | | | | |
2020-9A, 2.19% (3 Month USD LIBOR + 1.95%, Rate Floor: 1.95%) due 11/18/315,6 | | | 15,000,000 | | | | 15,012,888 | |
Venture XIV CLO Ltd. | | | | | | | | |
2020-14A, 1.22% (3 Month USD LIBOR + 1.03%, Rate Floor: 1.03%) due 08/28/295,6 | | | 15,000,000 | | | | 14,980,635 | |
610 Funding CLO 3 Ltd. | | | | | | | | |
2018-3A, 1.47% (3 Month USD LIBOR + 1.25%, Rate Floor: 0.00%) due 07/17/285,6 | | | 14,946,683 | | | | 14,946,447 | |
Owl Rock CLO IV Ltd. | | | | | | | | |
2020-4A, 2.80% (3 Month USD LIBOR + 2.62%, Rate Floor: 2.62%) due 05/20/295,6 | | | 14,250,000 | | | | 14,290,319 | |
AMMC CLO XI Ltd. | | | | | | | | |
2020-11A, 1.83% due 04/30/316 | | | 14,300,000 | | | | 14,276,742 | |
Fortress Credit Opportunities XI CLO Ltd. | | | | | | | | |
2018-11A, 1.54% (3 Month USD LIBOR + 1.30%, Rate Floor: 0.00%) due 04/15/315,6 | | | 13,450,000 | | | | 13,324,826 | |
Parliament Funding II Ltd. | | | | | | | | |
2020-1A, 2.67% (3 Month USD LIBOR + 2.45%, Rate Floor: 2.45%) due 08/12/305,6 | | | 12,500,000 | | | | 12,511,173 | |
Halcyon Loan Advisors Funding Ltd. | | | | | | | | |
2017-3A, 1.12% (3 Month USD LIBOR + 0.90%, Rate Floor: 0.00%) due 10/18/275,6 | | | 10,223,872 | | | | 10,226,153 | |
2012-1A, 3.19% (3 Month USD LIBOR + 3.00%, Rate Floor: 0.00%) due 08/15/235,6 | | | 30,210 | | | | 30,238 | |
Neuberger Berman CLO XVI-S Ltd. | | | | | | | | |
2021-16SA, 1.60% (3 Month USD LIBOR + 1.40%, Rate Floor: 1.40%) due 04/15/345,6 | | | 10,200,000 | | | | 10,197,960 | |
Allegro CLO IX Ltd. | | | | | | | | |
2018-3A, 1.39% (3 Month USD LIBOR + 1.17%, Rate Floor: 1.17%) due 10/16/315,6 | | | 10,000,000 | | | | 10,029,249 | |
16 | THE GUGGENHEIM FUNDS SEMI-ANNUAL REPORT | SEE NOTES TO FINANCIAL STATEMENTS. |
SCHEDULE OF INVESTMENTS (Unaudited)(continued) | March 31, 2021 |
LIMITED DURATION FUND | |
| | Face
Amount~ | | | Value | |
Recette CLO Ltd. | | | | | | | | |
2021-1A, 1.51% (3 Month USD LIBOR + 1.40%, Rate Floor: 0.00%) due 04/20/345,6 | | | 10,000,000 | | | $ | 10,000,000 | |
KREF Funding V LLC | | | | | | | | |
1.86% (1 Month USD LIBOR + 1.75%, Rate Floor: 1.75%) due 06/25/26†††,5 | | | 10,000,000 | | | | 9,924,432 | |
0.15% due 06/25/26†††,11 | | | 27,272,727 | | | | 13,364 | |
BSPRT Issuer Ltd. | | | | | | | | |
2021-FL6, 2.15% (1 Month USD LIBOR + 2.05%, Rate Floor: 2.05%) due 03/15/365,6 | | | 5,000,000 | | | | 4,992,860 | |
2018-FL4, 1.16% (1 Month USD LIBOR + 1.05%, Rate Floor: 1.05%) due 09/15/355,6 | | | 2,930,978 | | | | 2,930,977 | |
2018-FL3, 1.16% (1 Month USD LIBOR + 1.05%, Rate Floor: 1.05%) due 03/15/285,6 | | | 1,158,965 | | | | 1,158,965 | |
Westcott Park CLO Ltd. | | | | | | | | |
2019-1A, 1.43% (3 Month USD LIBOR + 1.21%, Rate Floor: 0.00%) due 07/20/285,6 | | | 8,750,000 | | | | 8,750,903 | |
NXT Capital CLO LLC | | | | | | | | |
2017-1A, 1.92% (3 Month USD LIBOR + 1.70%, Rate Floor: 0.00%) due 04/20/295,6 | | | 7,700,000 | | | | 7,712,442 | |
KREF Ltd. | | | | | | | | |
2018-FL1, 1.21% (1 Month USD LIBOR + 1.10%, Rate Floor: 1.10%) due 06/15/365,6 | | | 7,458,525 | | | | 7,459,523 | |
NewStar Fairfield Fund CLO Ltd. | | | | | | | | |
2018-2A, 1.49% (3 Month USD LIBOR + 1.27%, Rate Floor: 1.27%) due 04/20/305,6 | | | 6,529,571 | | | | 6,463,636 | |
Wind River CLO Ltd. | | | | | | | | |
2017-2A, 1.11% (3 Month USD LIBOR + 0.87%, Rate Floor: 0.00%) due 10/15/275,6 | | | 6,211,905 | | | | 6,206,470 | |
Neuberger Berman Loan Advisers CLO 40 Ltd. | | | | | | | | |
2021-40A, 1.59% (3 Month USD LIBOR + 1.40%, Rate Floor: 1.40%) due 04/16/335,6 | | | 6,000,000 | | | | 5,977,318 | |
CIFC Funding Ltd. | | | | | | | | |
2021-4A, 1.36% (3 Month USD LIBOR + 1.25%, Rate Floor: 1.25%) due 04/20/345,6 | | | 5,000,000 | | | | 5,001,028 | |
Owl Rock CLO II Ltd. | | | | | | | | |
2021-2A, due 04/20/335,6 | | | 5,000,000 | | | | 4,998,750 | |
Mountain View CLO Ltd. | | | | | | | | |
2018-1A, 1.04% (3 Month USD LIBOR + 0.80%, Rate Floor: 0.80%) due 10/15/265,6 | | | 4,643,666 | | | | 4,639,376 | |
PFP Ltd. | | | | | | | | |
2021-7, 1.50% (1 Month USD LIBOR + 1.40%, Rate Floor: 1.40%) due 04/14/385,6 | | | 4,600,000 | | | | 4,593,536 | |
ACRE Commercial Mortgage Ltd. | | | | | | | | |
2021-FL4, 1.21% (1 Month USD LIBOR + 1.10%, Rate Floor: 1.10%) due 12/18/375,6 | | | 4,500,000 | | | | 4,501,545 | |
VOYA CLO | | | | | | | | |
2021-2A, due 06/07/305,6 | | | 4,500,000 | | | | 4,499,100 | |
FDF II Ltd. | | | | | | | | |
2016-2A, 4.29% due 05/12/316 | | | 4,000,000 | | | | 4,033,858 | |
Magnetite XXIX Ltd. | | | | | | | | |
2021-29A, 1.50% (3 Month USD LIBOR + 1.40%, Rate Floor: 1.40%) due 01/15/345,6 | | | 4,000,000 | | | | 4,000,000 | |
Avery Point VI CLO Ltd. | | | | | | | | |
2021-6A, 1.51% (3 Month USD LIBOR + 1.35%, Rate Floor: 1.35%) due 08/05/275,6 | | | 4,000,000 | | | | 3,995,764 | |
Neuberger Berman Loan Advisers CLO 32 Ltd. | | | | | | | | |
2021-32A, 1.59% (3 Month USD LIBOR + 1.40%, Rate Floor: 1.40%) due 01/20/325,6 | | | 4,000,000 | | | | 3,986,243 | |
Flagship CLO VIII Ltd. | | | | | | | | |
2018-8A, 1.07% (3 Month USD LIBOR + 0.85%, Rate Floor: 0.00%) due 01/16/265,6 | | | 3,774,150 | | | | 3,773,846 | |
Telos CLO Ltd. | | | | | | | | |
2017-6A, 1.49% (3 Month USD LIBOR + 1.27%, Rate Floor: 0.00%) due 01/17/275,6 | | | 3,763,681 | | | | 3,763,797 | |
NewStar Clarendon Fund CLO LLC | | | | | | | | |
2019-1A, 1.52% (3 Month USD LIBOR + 1.30%, Rate Floor: 0.00%) due 01/25/275,6 | | | 3,321,184 | | | | 3,318,846 | |
AMMC CLO XIV Ltd. | | | | | | | | |
2021-14A, 1.62% (3 Month USD LIBOR + 1.40%, Rate Floor: 1.40%) due 07/25/295,6 | | | 3,250,000 | | | | 3,246,024 | |
STWD Ltd. | | | | | | | | |
2019-FL1, 2.06% (1 Month USD LIBOR + 1.95%, Rate Floor: 1.95%) due 07/15/385,6 | | | 3,200,000 | | | | 3,203,303 | |
Marathon CLO VII Ltd. | | | | | | | | |
2017-7A, 1.87% (3 Month USD LIBOR + 1.65%, Rate Floor: 0.00%) due 10/28/255,6 | | | 3,000,000 | | | | 2,998,553 | |
Newstar Commercial Loan Funding LLC | | | | | | | | |
2017-1A, 2.69% (3 Month USD LIBOR + 2.50%, Rate Floor: 0.00%) due 03/20/275,6 | | | 3,000,000 | | | | 2,997,522 | |
Grand Avenue CRE Ltd. | | | | | | | | |
2020-FL2, 2.56% (1 Month USD LIBOR + 2.45%, Rate Floor: 2.45%) due 03/15/355,6 | | | 2,959,591 | | | | 2,978,565 | |
Fortress Credit Opportunities IX CLO Ltd. | | | | | | | | |
2017-9A, 1.74% (3 Month USD LIBOR + 1.55%, Rate Floor: 0.00%) due 11/15/295,6 | | | 2,982,000 | | | | 2,974,409 | |
SEE NOTES TO FINANCIAL STATEMENTS. | THE GUGGENHEIM FUNDS SEMI-ANNUAL REPORT | 17 |
SCHEDULE OF INVESTMENTS (Unaudited)(continued) | March 31, 2021 |
LIMITED DURATION FUND | |
| | Face
Amount~ | | | Value | |
TCP Waterman CLO Ltd. | | | | | | | | |
2016-1A, 2.23% (3 Month USD LIBOR + 2.05%, Rate Floor: 0.00%) due 12/15/285,6 | | | 2,892,840 | | | $ | 2,894,851 | |
Golub Capital Partners CLO 17 Ltd. | | | | | | | | |
2017-17A, 1.87% (3 Month USD LIBOR + 1.65%, Rate Floor: 0.00%) due 10/25/305,6 | | | 2,500,000 | | | | 2,495,537 | |
Crown Point CLO III Ltd. | | | | | | | | |
2017-3A, 1.15% (3 Month USD LIBOR + 0.91%, Rate Floor: 0.00%) due 12/31/275,6 | | | 2,429,769 | | | | 2,429,602 | |
TRTX Issuer Ltd. | | | | | | | | |
2019-FL3, 1.26% (1 Month USD LIBOR + 1.15%, Rate Floor: 1.15%) due 10/15/345,6 | | | 2,243,000 | | | | 2,243,495 | |
Newfleet CLO Ltd. | | | | | | | | |
2018-1A, 1.17% (3 Month USD LIBOR + 0.95%, Rate Floor: 0.00%) due 04/20/285,6 | | | 2,201,661 | | | | 2,200,128 | |
KVK CLO Ltd. | | | | | | | | |
2017-1A, 1.13% (3 Month USD LIBOR + 0.90%, Rate Floor: 0.00%) due 01/14/285,6 | | | 1,484,357 | | | | 1,482,942 | |
2018-1A, 0.88% (3 Month USD LIBOR + 0.70%, Rate Floor: 0.00%) due 05/20/295,6 | | | 336,193 | | | | 335,955 | |
Seneca Park CLO Ltd. | | | | | | | | |
2017-1A, 1.72% (3 Month USD LIBOR + 1.50%, Rate Floor: 0.00%) due 07/17/265,6 | | | 1,532,538 | | | | 1,532,406 | |
Northwoods Capital XII-B Ltd. | | | | | | | | |
2018-12BA, 0.93% (3 Month USD LIBOR + 0.75%, Rate Floor: 0.75%) due 06/15/315,6 | | | 1,531,250 | | | | 1,527,825 | |
Oaktree CLO Ltd. | | | | | | | | |
2017-1A, 1.09% (3 Month USD LIBOR + 0.87%) due 10/20/275,6 | | | 1,296,622 | | | | 1,296,749 | |
Dryden 37 Senior Loan Fund | | | | | | | | |
2015-37A, due 01/15/316,8 | | | 1,500,000 | | | | 1,283,379 | |
Avery Point V CLO Ltd. | | | | | | | | |
2017-5A, 1.20% (3 Month USD LIBOR + 0.98%, Rate Floor: 0.00%) due 07/17/265,6 | | | 1,161,091 | | | | 1,161,145 | |
Treman Park CLO Ltd. | | | | | | | | |
2015-1A, due 10/20/286,8 | | | 1,000,000 | | | | 791,441 | |
LCM XXII Ltd. | | | | | | | | |
2018-22A, 0.82% (3 Month USD LIBOR + 0.60%, Rate Floor: 0.60%) due 10/20/285,6 | | | 270,833 | | | | 270,489 | |
Hull Street CLO Ltd. | | | | | | | | |
2017-1A, 1.45% (3 Month USD LIBOR + 1.22%, Rate Floor: 0.00%) due 10/18/265,6 | | | 82,315 | | | | 82,316 | |
Monroe Capital CLO Ltd. | | | | | | | | |
2017-1A, 1.57% (3 Month USD LIBOR + 1.35%, Rate Floor: 0.00%) due 10/22/265,6 | | | 42,151 | | | | 42,144 | |
Copper River CLO Ltd. | | | | | | | | |
2007-1A, due 01/20/218,9 | | | 500,000 | | | | 14,730 | |
OHA Credit Partners IX Ltd. | | | | | | | | |
2013-9A, due 10/20/256,8 | | | 301,370 | | | | 350 | |
Total Collateralized Loan Obligations | | | | | | | 949,397,118 | |
| | | | | | | | | |
Financial - 3.7% | | | | | | | | |
Station Place Securitization Trust | | | | | | | | |
2020-5, 0.92% (1 Month USD LIBOR + 1.00%, Rate Floor: 0.00%) due 05/24/22†††,5,9 | | | 57,600,000 | | | | 57,600,000 | |
2020-16, 1.11% (1 Month USD LIBOR + 1.00%, Rate Floor: 1.00%) due 12/22/21†††,5,6 | | | 30,000,000 | | | | 30,000,000 | |
2021-7, 1.02% (1 Month USD LIBOR + 0.80%, Rate Floor: 0.80%) due 09/24/215,6 | | | 26,650,000 | | | | 26,650,000 | |
2021-3, 1.01% (1 Month USD LIBOR + 0.90%, Rate Floor: 0.90%) due 02/16/22†††,5,6 | | | 10,300,000 | | | | 10,300,000 | |
2020-12, 1.61% (1 Month USD LIBOR + 1.50%, Rate Floor: 0.00%) due 06/09/21†††,5,6 | | | 10,000,000 | | | | 10,000,000 | |
2021-SP1, 1.86% (1 Month USD LIBOR + 1.75%, Rate Floor: 1.75%) due 08/17/22†††,5,6 | | | 3,000,000 | | | | 3,000,000 | |
2021-WL1, 0.96% (1 Month USD LIBOR + 0.85%, Rate Floor: 0.85%) due 01/26/545,6 | | | 1,650,000 | | | | 1,649,474 | |
2021-WL1, 1.16% (1 Month USD LIBOR + 1.05%, Rate Floor: 1.05%) due 01/26/545,6 | | | 1,250,000 | | | | 1,249,603 | |
HV Eight LLC | | | | | | | | |
2.75% (3 Month EURIBOR + 2.75%, Rate Floor: 2.75%) due 12/28/255 | | EUR | 21,000,000 | | | | 24,624,766 | |
Madison Avenue Secured Funding Trust Series | | | | | | | | |
2020-1, 1.73% (1 Month USD LIBOR + 1.63%, Rate Floor: 0.00%) due 12/13/21†††,5,6 | | | 8,000,000 | | | | 8,000,000 | |
Aesf Vi Verdi, LP | | | | | | | | |
2.15% due 11/25/24††† | | EUR | 4,998,730 | | | | 5,859,956 | |
Ceamer Finance LLC | | | | | | | | |
3.69% due 03/22/31 | | | 4,500,000 | | | | 4,410,000 | |
Strategic Partners Fund VIII LP | | | | | | | | |
3.11% due 03/10/25††† | | | 4,000,000 | | | | 4,075,202 | |
Total Financial | | | | | | | 187,419,001 | |
| | | | | | | | | |
Transport-Container - 2.4% | | | | | | | | |
Triton Container Finance VIII LLC | | | | | | | | |
2021-1A, 1.86% due 03/20/466 | | | 40,500,000 | | | | 39,503,829 | |
18 | THE GUGGENHEIM FUNDS SEMI-ANNUAL REPORT | SEE NOTES TO FINANCIAL STATEMENTS. |
SCHEDULE OF INVESTMENTS (Unaudited)(continued) | March 31, 2021 |
LIMITED DURATION FUND | |
| | Face
Amount~ | | | Value | |
CLI Funding VI LLC | | | | | | | | |
2020-3A, 2.07% due 10/18/456 | | | 17,939,167 | | | $ | 17,940,072 | |
2020-1A, 2.08% due 09/18/456 | | | 1,880,000 | | | | 1,873,765 | |
CLI Funding VIII LLC | | | | | | | | |
2021-1A, 1.64% due 02/18/466 | | | 18,750,000 | | | | 18,310,699 | |
TIF Funding II LLC | | | | | | | | |
2021-1A, 1.65% due 02/20/466 | | | 18,063,625 | | | | 17,392,587 | |
Textainer Marine Containers VII Ltd. | | | | | | | | |
2021-1A, 1.68% due 02/20/466 | | | 11,224,223 | | | | 10,890,170 | |
2020-1A, 2.73% due 08/21/456 | | | 5,447,409 | | | | 5,542,778 | |
Textainer Marine Containers VIII Ltd. | | | | | | | | |
2020-2A, 2.10% due 09/20/456 | | | 4,766,060 | | | | 4,775,213 | |
CAL Funding IV Ltd. | | | | | | | | |
2020-1A, 2.22% due 09/25/456 | | | 3,590,625 | | | | 3,595,845 | |
Total Transport-Container | | | | | | | 119,824,958 | |
| | | | | | | | | |
Transport-Aircraft - 1.7% | | | | | | | | |
AASET US Ltd. | | | | | | | | |
2018-2A, 4.45% due 11/18/386 | | | 16,944,670 | | | | 17,081,364 | |
Castlelake Aircraft Securitization Trust | | | | | | | | |
2018-1, 4.13% due 06/15/436 | | | 8,479,382 | | | | 8,496,446 | |
2017-1, 3.97% due 07/15/42 | | | 3,331,033 | | | | 3,333,168 | |
Sapphire Aviation Finance I Ltd. | | | | | | | | |
2018-1A, 4.25% due 03/15/406 | | | 10,926,166 | | | | 10,870,812 | |
KDAC Aviation Finance Ltd. | | | | | | | | |
2017-1A, 4.21% due 12/15/426 | | | 9,422,015 | | | | 9,116,911 | |
MAPS Ltd. | | | | | | | | |
2018-1A, 4.21% due 05/15/436 | | | 8,143,800 | | | | 8,220,353 | |
Castlelake Aircraft Structured Trust | | | | | | | | |
2021-1A, 3.47% due 01/15/466 | | | 7,249,089 | | | | 7,360,727 | |
Sapphire Aviation Finance II Ltd. | | | | | | | | |
2020-1A, 3.23% due 03/15/406 | | | 7,325,252 | | | | 7,267,374 | |
Falcon Aerospace Ltd. | | | | | | | | |
2019-1, 3.60% due 09/15/396 | | | 2,915,266 | | | | 2,938,214 | |
2017-1, 4.58% due 02/15/426 | | | 1,627,304 | | | | 1,643,093 | |
AASET Trust | | | | | | | | |
2017-1A, 3.97% due 05/16/426 | | | 3,669,359 | | | | 3,676,403 | |
AIM Aviation Finance Ltd. | | | | | | | | |
2015-1A, 4.21% due 02/15/406 | | | 4,614,895 | | | | 3,659,645 | |
Raspro Trust | | | | | | | | |
2005-1A, 1.15% (3 Month USD LIBOR + 0.93%, Rate Floor: 0.93%) due 03/23/245,6 | | | 2,743,838 | | | | 2,722,329 | |
Total Transport-Aircraft | | | | | | | 86,386,839 | |
| | | | | | | | | |
Net Lease - 1.6% | | | | | | | | |
Oak Street Investment Grade Net Lease Fund Series | | | | | | | | |
2020-1A, 1.85% due 11/20/506 | | | 40,513,120 | | | | 40,665,984 | |
Capital Automotive LLC | | | | | | | | |
2017-1A, 3.87% due 04/15/476 | | | 15,497,675 | | | | 15,523,094 | |
STORE Master Funding I LLC | | | | | | | | |
2015-1A, 4.17% due 04/20/456 | | | 10,383,462 | | | | 10,771,219 | |
CF Hippolyta LLC | | | | | | | | |
2021-1A, 1.98% due 03/15/616 | | | 6,100,000 | | | | 6,079,724 | |
CARS-DB4, LP | | | | | | | | |
2020-1A, 3.19% due 02/15/506 | | | 3,995,833 | | | | 4,099,551 | |
2020-1A, 3.25% due 02/15/506 | | | 923,995 | | | | 939,602 | |
Capital Automotive REIT | | | | | | | | |
2020-1A, 3.48% due 02/15/506 | | | 1,997,917 | | | | 2,042,739 | |
2014-1A, 3.66% due 10/15/446 | | | 919,388 | | | | 920,645 | |
Total Net Lease | | | | | | | 81,042,558 | |
| | | | | | | | | |
Infrastructure - 1.3% | | | | | | | | |
VB-S1 Issuer LLC | | | | | | | | |
2020-1A, 3.03% due 06/15/506 | | | 31,500,000 | | | | 32,964,687 | |
SBA Tower Trust | | | | | | | | |
2.33% due 01/15/286 | | | 24,000,000 | | | | 24,376,323 | |
Secured Tenant Site Contract Revenue Notes Series | | | | | | | | |
2018-1A, 3.97% due 06/15/486 | | | 7,126,311 | | | | 7,285,516 | |
Total Infrastructure | | | | | | | 64,626,526 | |
| | | | | | | | | |
Whole Business - 1.1% | | | | | | | | |
Applebee’s Funding LLC / IHOP Funding LLC | | | | | | | | |
2019-1A, 4.19% due 06/07/496 | | | 25,517,770 | | | | 26,204,198 | |
ServiceMaster Funding LLC | | | | | | | | |
2020-1, 2.84% due 01/30/516 | | | 9,250,000 | | | | 9,446,748 | |
Arbys Funding LLC | | | | | | | | |
2020-1A, 3.24% due 07/30/506 | | | 7,213,750 | | | | 7,355,067 | |
SERVPRO Master Issuer LLC | | | | | | | | |
2021-1A, 2.39% due 04/25/516 | | | 6,000,000 | | | | 5,945,436 | |
Domino’s Pizza Master Issuer LLC | | | | | | | | |
2017-1A, 1.47% (3 Month USD LIBOR + 1.25%, Rate Floor: 0.00%) due 07/25/475,6 | | | 5,092,500 | | | | 5,092,194 | |
Wendy’s Funding LLC | | | | | | | | |
2018-1A, 3.57% due 03/15/486 | | | 1,629,270 | | | | 1,674,743 | |
Total Whole Business | | | | | | | 55,718,386 | |
| | | | | | | | | |
Collateralized Debt Obligations - 0.7% | | | | |
Anchorage Credit Funding 4 Ltd. | | | | | | | | |
2021-4A, 2.72% due 04/27/396 | | | 24,650,000 | | | | 24,465,788 | |
Anchorage Credit Funding 3 Ltd. | | | | | | | | |
2021-3A, 2.87% due 01/28/396 | | | 9,750,000 | | | | 9,693,486 | |
Putnam Structured Product Funding Ltd. | | | | | | | | |
2003-1A, 1.18% (1 Month USD LIBOR + 1.00%, Rate Floor: 0.00%) due 10/15/385,9 | | | 116,958 | | | | 116,398 | |
Total Collateralized Debt Obligations | | | | | | | 34,275,672 | |
| | | | | | | | | |
Insurance - 0.0% | | | | | | | | |
Chesterfield Financial Holdings LLC | | | | | | | | |
2014-1A, 4.50% due 12/15/346 | | | 297,000 | | | | 304,602 | |
| | | | | | | | | |
Transport-Rail - 0.0% | | | | | | | | |
TRIP Rail Master Funding LLC | | | | | | | | |
2017-1A, 2.71% due 08/15/476 | | | 118,378 | | | | 118,454 | |
Total Asset-Backed Securities | | | | |
(Cost $1,577,880,538) | | | 1,579,114,114 | |
| | | | | | | | | |
SEE NOTES TO FINANCIAL STATEMENTS. | THE GUGGENHEIM FUNDS SEMI-ANNUAL REPORT | 19 |
SCHEDULE OF INVESTMENTS (Unaudited)(continued) | March 31, 2021 |
LIMITED DURATION FUND | |
| | Face
Amount~ | | | Value | |
COLLATERALIZED MORTGAGE OBLIGATIONS†† - 14.9% |
Residential Mortgage Backed Securities - 12.3% | | | | |
CSMC Trust | | | | | | | | |
2021-RPL1, 1.67% (WAC) due 09/27/605,6 | | | 43,479,804 | | | $ | 43,372,709 | |
2020-RPL5, 3.02% (WAC) due 08/25/605,6 | | | 18,664,192 | | | | 18,970,100 | |
2018-RPL9, 3.85% (WAC) due 09/25/575,6 | | | 10,194,234 | | | | 10,809,290 | |
2020-NQM1, 1.41% due 05/25/656,10 | | | 7,469,319 | | | | 7,476,704 | |
NRZ Advance Receivables Trust | | | | | | | | |
2020-T2, 1.48% due 09/15/536 | | | 28,950,000 | | | | 29,008,644 | |
2020-T3, 1.32% due 10/15/526 | | | 20,750,000 | | | | 20,812,937 | |
CIM Trust | | | | | | | | |
2018-R4, 4.07% (WAC) due 12/26/575,6 | | | 20,551,885 | | | | 20,633,731 | |
2018-R2, 3.69% (WAC) due 08/25/575,6 | | | 19,365,633 | | | | 19,399,002 | |
Towd Point Mortgage Trust | | | | | | | | |
2017-6, 2.75% (WAC) due 10/25/575,6 | | | 17,487,816 | | | | 17,981,859 | |
2018-2, 3.25% (WAC) due 03/25/585,6 | | | 8,990,634 | | | | 9,373,786 | |
2017-5, 0.71% (1 Month USD LIBOR + 0.60%, Rate Floor: 0.00%) due 02/25/575,6 | | | 7,714,154 | | | | 7,714,153 | |
2018-1, 3.00% (WAC) due 01/25/585,6 | | | 1,330,183 | | | | 1,369,814 | |
Ocwen Master Advance Receivables Trust | | | | | | | | |
2020-T1, 1.28% due 08/15/526 | | | 33,150,000 | | | | 33,229,109 | |
Verus Securitization Trust | | | | | | | | |
2020-5, 1.58% due 05/25/656,10 | | | 14,190,022 | | | | 14,219,639 | |
2019-4, 2.64% due 11/25/596,10 | | | 9,194,435 | | | | 9,357,529 | |
2020-1, 2.42% due 01/25/606,10 | | | 5,226,582 | | | | 5,282,353 | |
New Residential Advance Receivables Trust Advance Receivables Backed | | | | | | | | |
2020-T1, 1.43% due 08/15/536 | | | 15,750,000 | | | | 15,784,050 | |
2020-APT1, 1.04% due 12/16/52†††,6 | | | 10,900,000 | | | | 10,896,851 | |
Soundview Home Loan Trust | | | | | | | | |
2006-OPT5, 0.25% (1 Month USD LIBOR + 0.14%, Rate Floor: 0.14%) due 07/25/365 | | | 16,383,335 | | | | 16,027,843 | |
2005-OPT3, 0.81% (1 Month USD LIBOR + 0.71%, Rate Floor: 0.71%) due 11/25/355 | | | 3,901,777 | | | | 3,892,480 | |
2006-1, 0.71% (1 Month USD LIBOR + 0.60%, Rate Floor: 0.60%) due 02/25/365 | | | 3,456,119 | | | | 3,438,494 | |
LSTAR Securities Investment Ltd. | | | | | | | | |
2021-1, 1.92% (1 Month USD LIBOR + 1.80%, Rate Floor: 1.80%) due 02/01/265,9 | | | 13,612,861 | | | | 13,649,561 | |
2021-2, 1.82% (1 Month USD LIBOR + 1.70%, Rate Floor: 1.70%) due 03/02/265,9 | | | 8,500,000 | | | | 8,494,122 | |
New Residential Mortgage Loan Trust | | | | | | | | |
2018-2A, 3.50% (WAC) due 02/25/585,6 | | | 10,994,119 | | | | 11,474,741 | |
2018-1A, 4.00% (WAC) due 12/25/575,6 | | | 3,104,488 | | | | 3,313,847 | |
2019-6A, 3.50% (WAC) due 09/25/595,6 | | | 2,309,329 | | | | 2,433,874 | |
2017-5A, 1.61% (1 Month USD LIBOR + 1.50%, Rate Floor: 1.50%) due 06/25/575,6 | | | 1,099,749 | | | | 1,117,767 | |
FKRT | | | | | | | | |
2020-C2A, 3.25% due 12/30/23†††,9 | | | 17,610,986 | | | | 17,632,119 | |
BRAVO Residential Funding Trust | | | | | | | | |
2019-NQM1, 2.67% (WAC) due 07/25/595,6 | | | 5,788,702 | | | | 5,854,486 | |
2021-HE1, 0.97% (30 Day Average U.S. Secured Overnight Financing Rate + 0.95%, Rate Floor: 0.00%) due 01/25/705,6 | | | 4,865,891 | | | | 4,862,218 | |
2021-HE1, 0.87% (30 Day Average U.S. Secured Overnight Financing Rate + 0.85%, Rate Floor: 0.00%) due 01/25/705,6 | | | 3,653,546 | | | | 3,648,582 | |
2019-NQM2, 2.75% (WAC) due 11/25/595,6 | | | 1,725,415 | | | | 1,779,334 | |
Home Equity Loan Trust | | | | | | | | |
2007-FRE1, 0.30% (1 Month USD LIBOR + 0.19%, Rate Floor: 0.19%) due 04/25/375 | | | 16,194,456 | | | | 15,260,156 | |
Cascade Funding Mortgage Trust | | | | | | | | |
2018-RM2, 4.00% (WAC) due 10/25/685,9 | | | 10,215,105 | | | | 10,638,615 | |
2019-RM3, 2.80% (WAC) due 06/25/695,9 | | | 3,122,703 | | | | 3,192,912 | |
Structured Asset Securities Corporation Mortgage Loan Trust | | | | | | | | |
2008-BC4, 0.74% (1 Month USD LIBOR + 0.63%, Rate Floor: 0.63%) due 11/25/375 | | | 10,725,280 | | | | 10,558,082 | |
2006-BC4, 0.28% (1 Month USD LIBOR + 0.17%, Rate Floor: 0.17%) due 12/25/365 | | | 1,182,836 | | | | 1,161,375 | |
2007-BC1, 0.24% (1 Month USD LIBOR + 0.13%, Rate Floor: 0.13%) due 02/25/375 | | | 186,247 | | | | 182,264 | |
NovaStar Mortgage Funding Trust Series | | | | | | | | |
2007-2, 0.31% (1 Month USD LIBOR + 0.20%, Rate Cap/Floor: 11.00%/0.20%) due 09/25/375 | | | 11,279,183 | | | | 11,057,534 | |
Starwood Mortgage Residential Trust | | | | | | | | |
2020-1, 2.28% (WAC) due 02/25/505,6 | | | 6,578,460 | | | | 6,699,510 | |
2019-1, 2.94% (WAC) due 06/25/495,6 | | | 3,833,972 | | | | 3,856,516 | |
Banc of America Funding Trust | | | | | | | | |
2015-R2, 0.37% (1 Month USD LIBOR + 0.26%, Rate Floor: 0.26%) due 04/29/375,6 | | | 9,641,629 | | | | 9,407,400 | |
2015-R4, 0.29% (1 Month USD LIBOR + 0.17%, Rate Floor: 0.17%) due 01/27/355,6 | | | 521,661 | | | | 519,529 | |
Alternative Loan Trust | | | | | | | | |
2007-OA7, 0.25% (1 Month USD LIBOR + 0.14%, Rate Floor: 0.14%) due 05/25/475 | | | 6,617,914 | | | | 6,290,747 | |
2007-OH3, 0.40% (1 Month USD LIBOR + 0.29%, Rate Cap/Floor: 10.00%/0.29%) due 09/25/475 | | | 2,823,059 | | | | 2,690,101 | |
Ameriquest Mortgage Securities Incorporated Asset-Backed Pass-Through Certificates Series | | | | | | | | |
2005-R10, 0.75% (1 Month USD LIBOR + 0.65%, Rate Floor: 0.65%) due 01/25/365 | | | 8,380,718 | | | | 8,361,469 | |
20 | THE GUGGENHEIM FUNDS SEMI-ANNUAL REPORT | SEE NOTES TO FINANCIAL STATEMENTS. |
SCHEDULE OF INVESTMENTS (Unaudited)(continued) | March 31, 2021 |
LIMITED DURATION FUND | |
| | Face
Amount~ | | | Value | |
CIT Mortgage Loan Trust | | | | | | | | |
2007-1, 1.46% (1 Month USD LIBOR + 1.35%, Rate Floor: 1.35%) due 10/25/375,6 | | | 7,623,043 | | | $ | 7,662,759 | |
2007-1, 1.56% (1 Month USD LIBOR + 1.45%, Rate Floor: 1.45%) due 10/25/375,6 | | | 378,777 | | | | 380,759 | |
GS Mortgage-Backed Securities Trust | | | | | | | | |
2020-NQM1, 1.38% (WAC) due 09/27/605,6 | | | 7,590,212 | | | | 7,616,037 | |
American Home Mortgage Investment Trust | | | | | | | | |
2006-3, 0.47% (1 Month USD LIBOR + 0.36%, Rate Cap/Floor: 10.50%/0.36%) due 12/25/465 | | | 7,465,291 | | | | 7,208,107 | |
Argent Securities Incorporated Asset-Backed Pass-Through Certificates Series | | | | | | | | |
2005-W2, 0.84% (1 Month USD LIBOR + 0.74%, Rate Floor: 0.74%) due 10/25/355 | | | 7,008,233 | | | | 6,999,399 | |
CFMT LLC | | | | | | | | |
2021-HB5, 1.37% (WAC) due 02/25/315,6 | | | 6,950,000 | | | | 6,918,131 | |
Park Place Securities Incorporated Asset-Backed Pass-Through Certificates Series | | | | | | | | |
2005-WHQ3, 1.05% (1 Month USD LIBOR + 0.95%, Rate Floor: 0.95%) due 06/25/355 | | | 6,355,834 | | | | 6,395,364 | |
Homeward Opportunities Fund I Trust | | | | | | | | |
2019-3, 2.68% (WAC) due 11/25/595,6 | | | 3,541,677 | | | | 3,584,824 | |
2019-2, 2.70% (WAC) due 09/25/595,6 | | | 2,682,996 | | | | 2,698,605 | |
Bear Stearns Asset Backed Securities I Trust | | | | | | | | |
2006-HE9, 0.25% (1 Month USD LIBOR + 0.14%, Rate Floor: 0.14%) due 11/25/365 | | | 6,438,018 | | | | 6,245,520 | |
Morgan Stanley ABS Capital I Incorporated Trust | | | | | | | | |
2007-HE3, 0.36% (1 Month USD LIBOR + 0.25%, Rate Floor: 0.25%) due 12/25/365 | | | 2,787,007 | | | | 1,808,842 | |
2007-HE3, 0.26% (1 Month USD LIBOR + 0.15%, Rate Floor: 0.15%) due 12/25/365 | | | 1,996,612 | | | | 1,283,463 | |
2006-NC1, 0.68% (1 Month USD LIBOR + 0.57%, Rate Floor: 0.57%) due 12/25/355 | | | 1,217,538 | | | | 1,212,148 | |
2007-HE5, 0.29% (1 Month USD LIBOR + 0.18%, Rate Floor: 0.18%) due 03/25/375 | | | 1,901,999 | | | | 1,043,629 | |
Morgan Stanley Home Equity Loan Trust | | | | | | | | |
2006-2, 0.67% (1 Month USD LIBOR + 0.56%, Rate Floor: 0.56%) due 02/25/365 | | | 5,051,520 | | | | 5,009,029 | |
HarborView Mortgage Loan Trust | | | | | | | | |
2006-14, 0.26% (1 Month USD LIBOR + 0.15%, Rate Floor: 0.15%) due 01/25/475 | | | 2,795,810 | | | | 2,622,367 | |
2006-12, 0.30% (1 Month USD LIBOR + 0.19%, Rate Floor: 0.19%) due 01/19/385 | | | 2,414,629 | | | | 2,309,311 | |
First NLC Trust | | | | | | | | |
2005-4, 0.89% (1 Month USD LIBOR + 0.78%, Rate Cap/Floor: 14.00%/0.78%) due 02/25/365 | | | 4,560,506 | | | | 4,504,557 | |
Residential Mortgage Loan Trust | | | | | | | | |
2020-1, 2.38% (WAC) due 02/25/245,6 | | | 4,356,652 | | | | 4,407,812 | |
Countrywide Asset-Backed Certificates | | | | | | | | |
2006-6, 0.45% (1 Month USD LIBOR + 0.34%, Rate Floor: 0.34%) due 09/25/365 | | | 3,243,094 | | | | 3,223,255 | |
2006-5, 0.69% (1 Month USD LIBOR + 0.58%, Rate Floor: 0.58%) due 08/25/365 | | | 977,653 | | | | 969,057 | |
Citigroup Mortgage Loan Trust | | | | | | | | |
2019-IMC1, 2.72% (WAC) due 07/25/495,6 | | | 2,465,243 | | | | 2,510,393 | |
2007-WFH2, 0.51% (1 Month USD LIBOR + 0.40%, Rate Floor: 0.40%) due 03/25/375 | | | 1,669,432 | | | | 1,662,351 | |
Structured Asset Investment Loan Trust | | | | | | | | |
2006-3, 0.26% (1 Month USD LIBOR + 0.15%, Rate Floor: 0.15%) due 06/25/365 | | | 3,349,179 | | | | 3,286,848 | |
2005-2, 0.84% (1 Month USD LIBOR + 0.74%, Rate Floor: 0.74%) due 03/25/355 | | | 325,156 | | | | 324,126 | |
2005-1, 0.83% (1 Month USD LIBOR + 0.72%, Rate Floor: 0.72%) due 02/25/355,6 | | | 94,794 | | | | 94,911 | |
SPS Servicer Advance Receivables Trust | | | | | | | | |
2020-T2, 1.83% due 11/15/556 | | | 3,750,000 | | | | 3,678,107 | |
Nationstar Home Equity Loan Trust | | | | | | | | |
2007-B, 0.33% (1 Month USD LIBOR + 0.22%, Rate Floor: 0.22%) due 04/25/375 | | | 3,652,742 | | | | 3,618,996 | |
Ellington Financial Mortgage Trust | | | | | | | | |
2020-2, 1.64% (WAC) due 10/25/655,6 | | | 3,614,826 | | | | 3,605,514 | |
Asset-Backed Securities Corporation Home Equity Loan Trust Series AEG | | | | | | | | |
2006-HE1, 0.71% (1 Month USD LIBOR + 0.60%, Rate Floor: 0.60%) due 01/25/365 | | | 3,350,000 | | | | 3,285,837 | |
FBR Securitization Trust | | | | | | | | |
2005-2, 0.86% (1 Month USD LIBOR + 0.75%, Rate Cap/Floor: 14.00%/0.75%) due 09/25/355 | | | 3,235,801 | | | | 3,232,938 | |
Nationstar HECM Loan Trust | | | | | | | | |
2019-2A, 2.27% (WAC) due 11/25/295,6 | | | 3,078,906 | | | | 3,084,522 | |
Finance of America HECM Buyout | | | | | | | | |
2021-HB1, 1.59% (WAC) due 02/25/315,6 | | | 2,850,000 | | | | 2,839,018 | |
MFRA Trust | | | | | | | | |
2021-INV1, 1.26% (WAC) due 01/25/565,6 | | | 2,802,911 | | | | 2,794,114 | |
JP Morgan Mortgage Acquisition Trust | | | | | | | | |
2006-HE2, 0.25% (1 Month USD LIBOR + 0.14%, Rate Floor: 0.14%) due 07/25/365 | | | 2,719,843 | | | | 2,700,857 | |
Credit-Based Asset Servicing and Securitization LLC | | | | | | | | |
2006-CB2, 0.49% (1 Month USD LIBOR + 0.38%, Rate Floor: 0.38%) due 12/25/365 | | | 2,598,270 | | | | 2,535,567 | |
SEE NOTES TO FINANCIAL STATEMENTS. | THE GUGGENHEIM FUNDS SEMI-ANNUAL REPORT | 21 |
SCHEDULE OF INVESTMENTS (Unaudited)(continued) | March 31, 2021 |
LIMITED DURATION FUND | |
| | Face
Amount~ | | | Value | |
CSMC Series | | | | | | | | |
2015-12R, 0.63% (WAC) due 11/30/375,6 | | | 2,043,918 | | | $ | 2,038,955 | |
2014-2R, 0.33% (1 Month USD LIBOR + 0.20%, Rate Floor: 0.20%) due 02/27/465,6 | | | 144,562 | | | | 142,190 | |
GSAA Home Equity Trust | | | | | | | | |
2006-3, 0.71% (1 Month USD LIBOR + 0.60%, Rate Floor: 0.60%) due 03/25/365 | | | 2,969,914 | | | | 2,012,428 | |
ACE Securities Corporation Home Equity Loan Trust Series | | | | | | | | |
2005-HE2, 1.13% (1 Month USD LIBOR + 1.02%, Rate Floor: 1.02%) due 04/25/355 | | | 1,992,230 | | | | 1,989,691 | |
Deephaven Residential Mortgage Trust | | | | | | | | |
2019-3A, 2.96% (WAC) due 07/25/595,6 | | | 1,876,448 | | | | 1,889,912 | |
Morgan Stanley Capital I Incorporated Trust | | | | | | | | |
2006-HE1, 0.69% (1 Month USD LIBOR + 0.58%, Rate Floor: 0.58%) due 01/25/365 | | | 1,194,172 | | | | 1,174,338 | |
First Franklin Mortgage Loan Trust | | | | | | | | |
2004-FF10, 1.38% (1 Month USD LIBOR + 1.28%, Rate Floor: 1.28%) due 07/25/345 | | | 814,515 | | | | 817,701 | |
Nomura Resecuritization Trust | | | | | | | | |
2015-4R, 1.81% (1 Month USD LIBOR + 0.43%, Rate Floor: 0.43%) due 03/26/365,6 | | | 783,469 | | | | 779,714 | |
GE-WMC Asset-Backed Pass-Through Certificates Series | | | | | | | | |
2005-2, 0.61% (1 Month USD LIBOR + 0.50%, Rate Floor: 0.50%) due 12/25/355 | | | 425,286 | | | | 424,765 | |
UCFC Manufactured Housing Contract | | | | | | | | |
1997-2, 7.38% due 10/15/28 | | | 203,529 | | | | 207,509 | |
Encore Credit Receivables Trust | | | | | | | | |
2005-4, 0.77% (1 Month USD LIBOR + 0.66%, Rate Floor: 0.66%) due 01/25/365 | | | 111,673 | | | | 111,517 | |
Morgan Stanley Re-REMIC Trust | | | | | | | | |
2010-R5, 1.55% due 06/26/366 | | | 74,311 | | | | 68,313 | |
GSAMP Trust | | | | | | | | |
2005-HE6, 0.77% (1 Month USD LIBOR + 0.66%, Rate Floor: 0.66%) due 11/25/355 | | | 25,688 | | | | 25,683 | |
Total Residential Mortgage Backed Securities | | | | | | | 618,227,728 | |
| | | | | | | | | |
Commercial Mortgage Backed Securities - 1.5% | | | | |
Morgan Stanley Capital I Trust | | | | | | | | |
2014-MP, 3.47% due 08/11/336 | | | 18,800,000 | | | | 18,851,864 | |
2014-CPT, 3.45% (WAC) due 07/13/295,6 | | | 5,000,000 | | | | 4,999,429 | |
2014-MP, 3.69% (WAC) due 08/11/335,6 | | | 2,365,000 | | | | 2,371,426 | |
Life Mortgage Trust | | | | | | | | |
2021-BMR, 1.51% (1 Month USD LIBOR + 1.40%, Rate Floor: 1.40%) due 03/15/385,6 | | | 7,000,000 | | | | 7,011,198 | |
Wells Fargo Commercial Mortgage Trust | | | | | | | | |
2017-C38, 1.02% (WAC) due 07/15/505,11 | | | 24,681,010 | | | | 1,197,777 | |
2016-C37, 0.93% (WAC) due 12/15/495,11 | | | 35,896,422 | | | | 1,060,510 | |
2017-C42, 0.88% (WAC) due 12/15/505,11 | | | 14,758,738 | | | | 714,444 | |
2015-LC22, 0.77% (WAC) due 09/15/585,11 | | | 21,070,137 | | | | 591,761 | |
2017-RB1, 1.24% (WAC) due 03/15/505,11 | | | 9,671,009 | | | | 571,836 | |
2016-NXS5, 1.44% (WAC) due 01/15/595,11 | | | 5,352,149 | | | | 295,983 | |
KKR Industrial Portfolio Trust | | | | | | | | |
2021-KDIP, 1.11% (1 Month USD LIBOR + 1.00%, Rate Floor: 1.00%) due 12/15/375,6 | | | 3,550,000 | | | | 3,545,746 | |
JPMDB Commercial Mortgage Securities Trust | | | | | | | | |
2016-C4, 0.79% (WAC) due 12/15/495,11 | | | 38,597,359 | | | | 1,415,778 | |
2018-C8, 0.64% (WAC) due 06/15/515,11 | | | 42,293,174 | | | | 1,346,750 | |
2016-C2, 1.57% (WAC) due 06/15/495,11 | | | 7,566,095 | | | | 421,366 | |
2017-C5, 0.95% (WAC) due 03/15/505,11 | | | 3,394,862 | | | | 149,494 | |
COMM Mortgage Trust | | | | | | | | |
2015-CR24, 0.76% (WAC) due 08/10/485,11 | | | 61,944,084 | | | | 1,731,052 | |
2018-COR3, 0.44% (WAC) due 05/10/515,11 | | | 35,445,860 | | | | 993,055 | |
Banc of America Commercial Mortgage Trust | | | | | | | | |
2017-BNK3, 1.10% (WAC) due 02/15/505,11 | | | 32,807,124 | | | | 1,573,873 | |
2016-UB10, 1.87% (WAC) due 07/15/495,11 | | | 16,963,348 | | | | 1,109,213 | |
JP Morgan Chase Commercial Mortgage Securities Trust | | | | | | | | |
2016-JP2, 1.79% (WAC) due 08/15/495,11 | | | 35,656,915 | | | | 2,680,626 | |
DBJPM Mortgage Trust | | | | | | | | |
2017-C6, 0.99% (WAC) due 06/10/505,11 | | | 58,270,997 | | | | 2,520,384 | |
BENCHMARK Mortgage Trust | | | | | | | | |
2018-B2, 0.42% (WAC) due 02/15/515,11 | | | 122,496,092 | | | | 2,470,795 | |
UBS Commercial Mortgage Trust | | | | | | | | |
2017-C2, 1.06% (WAC) due 08/15/505,11 | | | 28,723,577 | | | | 1,441,363 | |
2017-C5, 1.00% (WAC) due 11/15/505,11 | | | 13,734,854 | | | | 624,628 | |
GB Trust | | | | | | | | |
2020-FLIX, 1.71% (1 Month USD LIBOR + 1.60%, Rate Floor: 1.60%) due 08/15/375,6 | | | 2,000,000 | | | | 2,005,078 | |
Morgan Stanley Bank of America Merrill Lynch Trust | | | | | | | | |
2017-C34, 0.79% (WAC) due 11/15/525,11 | | | 24,053,430 | | | | 987,877 | |
2015-C27, 0.88% (WAC) due 12/15/475,11 | | | 31,317,800 | | | | 981,707 | |
CSAIL Commercial Mortgage Trust | | | | | | | | |
2019-C15, 1.05% (WAC) due 03/15/525,11 | | | 19,900,147 | | | | 1,241,530 | |
2016-C6, 1.92% (WAC) due 01/15/495,11 | | | 6,943,060 | | | | 493,198 | |
BBCMS Mortgage Trust | | | | | | | | |
2018-C2, 0.77% (WAC) due 12/15/515,11 | | | 29,789,197 | | | | 1,439,054 | |
BAMLL Commercial Mortgage Securities Trust | | | | | | | | |
2012-PARK, 2.96% due 12/10/306 | | | 1,300,000 | | | | 1,348,262 | |
CD Commercial Mortgage Trust | | | | | | | | |
2017-CD4, 1.29% (WAC) due 05/10/505,11 | | | 16,793,325 | | | | 927,991 | |
CD Mortgage Trust | | | | | | | | |
2017-CD6, 0.92% (WAC) due 11/13/505,11 | | | 14,134,516 | | | | 555,930 | |
2016-CD1, 1.41% (WAC) due 08/10/495,11 | | | 6,257,078 | | | | 371,388 | |
CGMS Commercial Mortgage Trust | | | | | | | | |
2017-B1, 0.82% (WAC) due 08/15/505,11 | | | 21,936,682 | | | | 839,376 | |
Citigroup Commercial Mortgage Trust | | | | | | | | |
2016-C2, 1.74% (WAC) due 08/10/495,11 | | | 6,526,163 | | | | 468,089 | |
2016-GC37, 1.70% (WAC) due 04/10/495,11 | | | 3,377,132 | | | | 231,747 | |
GS Mortgage Securities Trust | | | | | | | | |
2017-GS6, 1.03% (WAC) due 05/10/505,11 | | | 11,439,622 | | | | 633,434 | |
22 | THE GUGGENHEIM FUNDS SEMI-ANNUAL REPORT | SEE NOTES TO FINANCIAL STATEMENTS. |
SCHEDULE OF INVESTMENTS (Unaudited)(continued) | March 31, 2021 |
LIMITED DURATION FUND | |
| | Face
Amount~ | | | Value | |
BANK | | | | | | | | |
2017-BNK6, 0.82% (WAC) due 07/15/605,11 | | | 14,947,474 | | | $ | 564,901 | |
JPMBB Commercial Mortgage Securities Trust | | | | | | | | |
2013-C17, 0.74% (WAC) due 01/15/475,11 | | | 22,314,359 | | | | 380,766 | |
Bancorp Commercial Mortgage Trust | | | | | | | | |
2018-CR3, 1.36% (1 Month USD LIBOR + 1.25%, Rate Floor: 1.25%) due 01/15/335,6 | | | 240,889 | | | | 240,671 | |
Total Commercial Mortgage Backed Securities | | | 73,401,350 | |
| | | | | | | | | |
Government Agency - 1.1% | | | | | | | | |
Freddie Mac Multifamily Structured Pass-Through Certificates | | | | | | | | |
2018-K074, 3.60% due 02/25/28 | | | 14,000,000 | | | | 15,672,955 | |
2021-KJ33, 1.57% due 07/25/32 | | | 9,100,000 | | | | 9,134,174 | |
2018-K078, 3.92% due 06/25/28 | | | 3,350,000 | | | | 3,827,356 | |
2013-K035, 0.35% (WAC) due 08/25/235,11 | | | 101,084,241 | | | | 747,053 | |
Fannie Mae | | | | | | | | |
3.59% due 02/01/29 | | | 10,200,000 | | | | 11,233,390 | |
3.21% due 08/01/27 | | | 2,104,573 | | | | 2,293,621 | |
Freddie Mac Seasoned Credit Risk Transfer Trust | | | | | | | | |
2020-3, 2.00% due 05/25/60 | | | 4,651,789 | | | | 4,650,143 | |
2020-2, 2.00% due 11/25/59 | | | 2,689,944 | | | | 2,690,821 | |
Fannie Mae-Aces | | | | | | | | |
2020-M23, 1.74% due 03/25/35 | | | 3,840,000 | | | | 3,595,977 | |
2020-M23, 1.50% (WAC) due 03/25/355,11 | | | 8,910,436 | | | | 1,152,450 | |
Total Government Agency | | | | | | | 54,997,940 | |
| | | | | | | | | |
Total Collateralized Mortgage Obligations | | | | |
(Cost $740,573,270) | | | 746,627,018 | |
| | | | | | | | | |
FOREIGN GOVERNMENT DEBT†† - 5.6% |
State of Israel |
1.00% due 04/30/21 | | ILS | 431,800,000 | | | | 129,356,481 | |
Czech Republic |
0.10% due 04/17/22 | | CZK | 1,094,000,000 | | | | 48,930,203 | |
Kingdom of Spain |
(0.51)% due 07/09/2112 | | EUR | 36,475,000 | | | | 42,832,670 | |
United Mexican States |
4.04% due 05/06/2112 | | MXN | 481,400,000 | | | | 23,458,149 | |
Government of Japan |
(0.10)% due 04/05/2112 | | JPY | 2,284,000,000 | | | | 20,627,532 | |
Newfoundland T-Bill |
0.10% due 04/15/2112 | | CAD | 18,600,000 | | | | 14,803,079 | |
Total Foreign Government Debt | | | | |
(Cost $285,481,729) | | | | | | | 280,008,114 | |
| | | | | | | | | |
SENIOR FLOATING RATE INTERESTS††,5 - 5.1% |
Industrial - 1.1% | | | | | | | | |
Berry Global, Inc. | | | | | | | | |
due 07/01/26 | | | 24,200,000 | | | | 23,984,378 | |
Filtration Group Corp. | | | | | | | | |
3.11% (1 Month USD LIBOR + 3.00%, Rate Floor: 3.00%) due 03/31/25 | | | 5,146,244 | | | | 5,067,764 | |
due 03/31/25 | | EUR | 2,384,577 | | | | 2,781,606 | |
TransDigm, Inc. | | | | | | | | |
2.36% (1 Month USD LIBOR + 2.25%, Rate Floor: 2.25%) due 08/22/24 | | | 4,053,776 | | | | 3,974,647 | |
2.36% (1 Month USD LIBOR + 2.25%, Rate Floor: 2.25%) due 12/09/25 | | | 1,227,166 | | | | 1,200,574 | |
2.36% (1 Month USD LIBOR + 2.25%, Rate Floor: 2.25%) due 05/30/25 | | | 639,871 | | | | 626,209 | |
Reynolds Group Holdings, Inc. | | | | | | | | |
2.86% (1 Month USD LIBOR + 2.75%, Rate Floor: 2.75%) due 02/06/23 | | | 4,409,108 | | | | 4,387,768 | |
Harsco Corp. | | | | | | | | |
2.75% (1 Week USD LIBOR + 2.25%, Rate Floor: 2.75%) due 03/10/28 | | | 4,000,000 | | | | 3,965,000 | |
Mileage Plus Holdings LLC | | | | | | | | |
6.25% (3 Month USD LIBOR + 5.25%, Rate Floor: 6.25%) due 06/21/27 | | | 2,600,000 | | | | 2,759,666 | |
Ravago Holdings America, Inc. | | | | | | | | |
2.61% (3 Month USD LIBOR + 2.50%, Rate Floor: 2.50%) due 03/04/28 | | | 2,000,000 | | | | 1,990,000 | |
TAMKO Building Products, Inc. | | | | | | | | |
due 05/29/26 | | | 1,800,000 | | | | 1,789,884 | |
Pike Corp. | | | | | | | | |
3.13% (1 Month USD LIBOR + 3.00%, Rate Floor: 3.00%) due 12/21/27 | | | 1,000,000 | | | | 995,890 | |
Cushman & Wakefield US Borrower LLC | | | | | | | | |
2.86% (1 Month USD LIBOR + 2.75%, Rate Floor: 2.75%) due 08/21/25 | | | 898,744 | | | | 879,457 | |
Pro Mach Group, Inc. | | | | | | | | |
2.86% (1 Month USD LIBOR + 2.75%, Rate Floor: 2.75%) due 03/07/25 | | | 548,087 | | | | 537,070 | |
Park River Holdings, Inc. | | | | | | | | |
4.00% (2 Month USD LIBOR + 3.25%, Rate Floor: 4.00%) due 12/28/27 | | | 500,000 | | | | 496,565 | |
JetBlue Airways Corp. | | | | | | | | |
6.25% (3 Month USD LIBOR + 5.25%, Rate Floor: 6.25%) due 06/17/24 | | | 217,215 | | | | 222,103 | |
VC GB Holdings, Inc. | | | | | | | | |
4.00% (1 Month USD LIBOR + 3.00%, Rate Floor: 4.00%) due 02/28/24††† | | | 181,614 | | | | 180,479 | |
Berlin Packaging LLC | | | | | | | | |
3.21% (3 Month USD LIBOR + 3.00%, Rate Floor: 3.00%) due 11/07/25 | | | 98,987 | | | | 97,096 | |
BWAY Holding Co. | | | | | | | | |
3.44% (3 Month USD LIBOR + 3.25%, Rate Floor: 3.25%) due 04/03/24 | | | 49,486 | | | | 48,372 | |
Total Industrial | | | | | | | 55,984,528 | |
| | | | | | | | | |
Consumer, Cyclical - 0.9% | | | | | | | | |
Verisure Holding AB | | | | | | | | |
due 01/14/28 | | EUR | 7,970,000 | | | | 9,302,321 | |
3.50% (6 Month EURIBOR + 3.50%, Rate Floor: 3.50%) due 07/20/26 | | EUR | 1,030,000 | | | | 1,203,257 | |
Playtika Holding Corp. | | | | | | | | |
due 03/13/28 | | | 10,000,000 | | | | 9,937,500 | |
SEE NOTES TO FINANCIAL STATEMENTS. | THE GUGGENHEIM FUNDS SEMI-ANNUAL REPORT | 23 |
SCHEDULE OF INVESTMENTS (Unaudited)(continued) | March 31, 2021 |
LIMITED DURATION FUND | |
| | Face
Amount~ | | | Value | |
Samsonite IP Holdings SARL | | | | | | | | |
5.50% (1 Month USD LIBOR + 4.50%, Rate Floor: 5.50%) due 04/25/25 | | | 7,046,750 | | | $ | 7,090,792 | |
1.86% (1 Month USD LIBOR + 1.75%, Rate Floor: 1.75%) due 04/25/25 | | | 300,000 | | | | 294,876 | |
Truck Hero, Inc. | | | | | | | | |
4.50% (1 Month USD LIBOR + 3.75%, Rate Floor: 4.50%) due 01/31/28 | | | 5,000,000 | | | | 4,984,050 | |
Packers Holdings LLC | | | | | | | | |
4.00% (3 Month USD LIBOR + 3.25%, Rate Floor: 4.00%) due 03/09/28 | | | 4,000,000 | | | | 3,951,680 | |
New Trojan Parent, Inc. | | | | | | | | |
3.75% (1 Month USD LIBOR + 3.25%, Rate Floor: 3.75%) due 01/06/28 | | | 2,750,000 | | | | 2,732,812 | |
BGIS (BIFM CA Buyer, Inc.) | | | | | | | | |
3.61% (1 Month USD LIBOR + 3.50%, Rate Floor: 3.50%) due 06/01/26 | | | 2,429,315 | | | | 2,411,095 | |
Intrawest Resorts Holdings, Inc. | | | | | | | | |
2.86% (1 Month USD LIBOR + 2.75%, Rate Floor: 2.75%) due 07/31/24 | | | 1,141,408 | | | | 1,120,726 | |
Murphy Oil USA, Inc. | | | | | | | | |
2.25% (1 Month USD LIBOR + 1.75%, Rate Floor: 2.25%) due 01/31/28††† | | | 700,000 | | | | 702,625 | |
GVC Holdings PLC | | | | | | | | |
3.00% (6 Month USD LIBOR + 2.00%, Rate Floor: 3.00%) due 03/29/24 | | | 198,974 | | | | 198,787 | |
Cast & Crew Payroll LLC | | | | | | | | |
3.86% (1 Month USD LIBOR + 3.75%, Rate Floor: 3.75%) due 02/09/26 | | | 128,762 | | | | 126,630 | |
Total Consumer, Cyclical | | | | | | | 44,057,151 | |
| | | | | | | | | |
Consumer, Non-cyclical - 0.9% | | | | | | | | |
Option Care Health, Inc. | | | | | | | | |
3.86% (1 Month USD LIBOR + 3.75%, Rate Floor: 3.75%) due 08/06/26 | | | 12,418,561 | | | | 12,364,292 | |
Spectrum Brands, Inc. | | | | | | | | |
2.50% (3 Month USD LIBOR + 2.00%, Rate Floor: 2.50%) due 03/03/28 | | | 5,000,000 | | | | 4,984,400 | |
Women’s Care Holdings, Inc. | | | | | | | | |
5.25% (3 Month USD LIBOR + 4.50%, Rate Floor: 5.25%) due 01/15/28 | | | 4,730,000 | | | | 4,730,000 | |
Valeo F1 Company Ltd. | | | | | | | | |
due 08/27/27 | | GBP | 3,200,000 | | | | 4,397,535 | |
Sigma Holding BV (Flora Food) | | | | | | | | |
3.50% (1 Month EURIBOR + 3.50% and 6 Month EURIBOR + 3.50%, Rate Floor: 3.50%) due 07/02/25 | | EUR | 3,700,000 | | | | 4,252,961 | |
Bombardier Recreational Products, Inc. | | | | | | | | |
2.11% (1 Month USD LIBOR + 2.00%, Rate Floor: 2.00%) due 05/24/27 | | | 3,199,496 | | | | 3,160,014 | |
Diamond (BC) BV | | | | | | | | |
3.11% (1 Month USD LIBOR + 3.00%, Rate Floor: 3.00%) due 09/06/24 | | | 2,647,865 | | | | 2,632,693 | |
Hearthside Group Holdings LLC | | | | | | | | |
due 05/23/25 | | | 2,094,643 | | | | 2,083,520 | |
PAREXEL International Corp. | | | | | | | | |
2.86% (1 Month USD LIBOR + 2.75%, Rate Floor: 2.75%) due 09/27/24 | | | 1,040,581 | | | | 1,027,740 | |
Aramark Services, Inc. | | | | | | | | |
1.86% (1 Month USD LIBOR + 1.75%, Rate Floor: 1.75%) due 03/11/25 | | | 700,000 | | | | 691,691 | |
Catalent Pharma Solutions, Inc. | | | | | | | | |
2.50% (1 Month USD LIBOR + 2.00%, Rate Floor: 2.50%) due 02/22/28 | | | 600,000 | | | | 599,748 | |
EyeCare Partners LLC | | | | | | | | |
3.86% (1 Month USD LIBOR + 3.75%, Rate Floor: 3.75%) due 02/18/27 | | | 498,750 | | | | 493,209 | |
Kronos Acquisition Holdings, Inc. | | | | | | | | |
4.25% (3 Month USD LIBOR + 3.75%, Rate Floor: 4.25%) due 12/22/26 | | | 498,750 | | | | 491,089 | |
Froneri US, Inc. | | | | | | | | |
2.36% (1 Month USD LIBOR + 2.25%, Rate Floor: 2.25%) due 01/29/27 | | | 446,625 | | | | 440,171 | |
Pearl Intermediate Parent LLC | | | | | | | | |
2.86% (1 Month USD LIBOR + 2.75%, Rate Floor: 2.75%) due 02/14/25 | | | 400,000 | | | | 393,064 | |
US Foods, Inc. | | | | | | | | |
1.86% (1 Month USD LIBOR + 1.75%, Rate Floor: 1.75%) due 06/27/23 | | | 397,911 | | | | 392,273 | |
Valeant Pharmaceuticals International, Inc. | | | | | | | | |
3.11% (1 Month USD LIBOR + 3.00%, Rate Floor: 3.00%) due 06/02/25 | | | 300,000 | | | | 298,863 | |
Total Consumer, Non-cyclical | | | | | | | 43,433,263 | |
| | | | | | | | | |
Financial - 0.8% | | | | | | | | |
Citadel Securities, LP | | | | | | | | |
2.61% (1 Month USD LIBOR + 2.50%, Rate Floor: 2.50%) due 02/02/28 | | | 11,500,000 | | | | 11,365,795 | |
AlixPartners LLP | | | | | | | | |
3.25% (1 Month USD LIBOR + 2.75%, Rate Floor: 3.25%) due 02/04/28 | | | 10,000,000 | | | | 9,956,900 | |
Delos Finance SARL (International Lease Finance) | | | | | | | | |
1.95% (3 Month USD LIBOR + 1.75%, Rate Floor: 1.75%) due 10/06/23 | | | 6,076,000 | | | | 6,058,623 | |
USI, Inc. | | | | | | | | |
3.20% (3 Month USD LIBOR + 3.00%, Rate Floor: 3.00%) due 05/16/24 | | | 4,831,775 | | | | 4,773,987 | |
HUB International Ltd. | | | | | | | | |
3.22% (3 Month USD LIBOR + 3.00%, Rate Floor: 3.00%) due 04/25/25 | | | 3,532,607 | | | | 3,480,430 | |
Jane Street Group LLC | | | | | | | | |
2.86% (1 Month USD LIBOR + 2.75%, Rate Floor: 2.75%) due 01/26/28 | | | 3,375,000 | | | | 3,335,985 | |
Focus Financial Partners LLC | | | | | | | | |
2.11% (1 Month USD LIBOR + 2.00%, Rate Floor: 2.00%) due 07/03/24 | | | 1,196,923 | | | | 1,183,098 | |
Total Financial | | | | | | | 40,154,818 | |
| | | | | | | | | |
24 | THE GUGGENHEIM FUNDS SEMI-ANNUAL REPORT | SEE NOTES TO FINANCIAL STATEMENTS. |
SCHEDULE OF INVESTMENTS (Unaudited)(continued) | March 31, 2021 |
LIMITED DURATION FUND | |
| | Face
Amount~ | | | Value | |
Basic Materials - 0.6% | | | | | | | | |
Trinseo Materials Operating S.C.A. | | | | | | | | |
due 03/17/28 | | | 11,100,000 | | | $ | 10,975,125 | |
2.11% (1 Month USD LIBOR + 2.00%, Rate Floor: 2.00%) due 09/06/24 | | | 500,000 | | | | 491,770 | |
INEOS Ltd. | | | | | | | | |
2.75% (3 Month EURIBOR + 2.75%, Rate Floor: 2.75%) due 01/29/26 | | EUR | 8,100,000 | | | | 9,419,004 | |
Invictus MD Strategies Corp. | | | | | | | | |
3.11% (1 Month USD LIBOR + 3.00%, Rate Floor: 3.00%) due 03/28/25 | | | 6,443,434 | | | | 6,367,466 | |
W.R. Grace & Co.-Conn | | | | | | | | |
due 03/30/28 | | | 3,500,000 | | | | 3,473,750 | |
GrafTech Finance, Inc. | | | | | | | | |
4.00% (1 Month USD LIBOR + 3.00%, Rate Floor: 4.00%) due 02/12/25 | | | 1,364,442 | | | | 1,362,737 | |
Total Basic Materials | | | | | | | 32,089,852 | |
| | | | | | | | | |
Technology - 0.6% | | | | | | | | |
RealPage, Inc. | | | | | | | | |
due 02/18/28 | | | 11,800,000 | | | | 11,739,348 | |
Boxer Parent Co., Inc. | | | | | | | | |
due 10/02/25 | | | 6,108,125 | | | | 6,077,584 | |
Sabre GLBL, Inc. | | | | | | | | |
2.11% (1 Month USD LIBOR + 2.00%, Rate Floor: 2.00%) due 02/22/24 | | | 3,042,139 | | | | 2,999,701 | |
Peraton Corp. | | | | | | | | |
4.50% (3 Month USD LIBOR + 3.75%, Rate Floor: 4.50%) due 02/01/28 | | | 2,373,269 | | | | 2,371,299 | |
MACOM Technology Solutions Holdings, Inc. | | | | | | | | |
2.36% (1 Month USD LIBOR + 2.25%, Rate Floor: 2.25%) due 05/17/24 | | | 2,181,556 | | | | 2,163,842 | |
Ascend Learning LLC | | | | | | | | |
4.75% (1 Month USD LIBOR + 3.75%, Rate Floor: 4.75%) due 07/12/24 | | | 1,940,250 | | | | 1,939,047 | |
TIBCO Software, Inc. | | | | | | | | |
3.86% (1 Month USD LIBOR + 3.75%, Rate Floor: 3.75%) due 06/30/26 | | | 350,000 | | | | 345,079 | |
Total Technology | | | | | | | 27,635,900 | |
| | | | | | | | | |
Communications - 0.2% | | | | | | | | |
ProQuest, LLC | | | | | | | | |
due 10/23/26 | | | 7,269,218 | | | | 7,218,333 | |
Authentic Brands | | | | | | | | |
4.00% (3 Month USD LIBOR + 3.25%, Rate Floor: 4.00%) due 09/27/24 | | | 1,500,000 | | | | 1,494,915 | |
Zayo Group Holdings, Inc. | | | | | | | | |
3.11% (1 Month USD LIBOR + 3.00%, Rate Floor: 3.00%) due 03/09/27 | | | 1,500,000 | | | | 1,486,845 | |
Altice US Finance I Corp. | | | | | | | | |
2.36% (1 Month USD LIBOR + 2.25%, Rate Floor: 2.25%) due 01/15/26 | | | 465,500 | | | | 458,518 | |
Ziggo Financing Partnership | | | | | | | | |
2.61% (1 Month USD LIBOR + 2.50%, Rate Floor: 2.50%) due 04/28/28 | | | 400,000 | | | | 395,636 | |
Total Communications | | | | | | | 11,054,247 | |
| | | | | | | | | |
Energy - 0.0% | | | | | | | | |
Venture Global Calcasieu Pass LLC | | | | | | | | |
2.48% (1 Month USD LIBOR + 2.38% and 3 Month USD LIBOR + 2.38%, Rate Floor: 2.38%) due 08/19/26††† | | | 1,122,784 | | | | 1,061,031 | |
Total Senior Floating Rate Interests | | | | |
(Cost $256,657,354) | | | 255,470,790 | |
| | | | | | | | | |
MUNICIPAL BONDS†† - 0.1% |
California - 0.1% | | | | | | | | |
California Public Finance Authority Revenue Bonds | | | | | | | | |
1.55% due 10/15/26 | | | 3,145,000 | | | | 3,155,127 | |
San Dieguito Union High School District General Obligation Unlimited | | | | | | | | |
2.68% due 08/01/36 | | | 2,500,000 | | | | 2,543,898 | |
Total California | | | | | | | 5,699,025 | |
| | | | | | | | | |
Total Municipal Bonds | | | | |
(Cost $5,645,000) | | | 5,699,025 | |
| | | | | | | | | |
U.S. GOVERNMENT SECURITIES†† - 0.0% |
U.S. Treasury Notes |
1.13% due 02/15/31 | | | 820,000 | | | | 774,131 | |
Total U.S. Government Securities | | | | |
(Cost $787,044) | | | | | | | 774,131 | |
SEE NOTES TO FINANCIAL STATEMENTS. | THE GUGGENHEIM FUNDS SEMI-ANNUAL REPORT | 25 |
SCHEDULE OF INVESTMENTS (Unaudited)(continued) | March 31, 2021 |
LIMITED DURATION FUND | |
| | Notional
Value | | | Value | |
OTC OPTIONS PURCHASED†† - 0.1% |
Call options on: | | | | | | | | |
Goldman Sachs International 2Y-10 CMS CAP Expiring July 2022 with strike price of $0.40 | | $ | 509,700,000 | | | $ | 4,730,016 | |
Goldman Sachs International 2Y-10 CMS CAP Expiring July 2022 with strike price of $0.61 | | | 177,800,000 | | | | 1,312,164 | |
Bank of America, N.A. 2Y-10 CMS CAP Expiring July 2022 with strike price of $0.40 | | | 30,000,000 | | | | 278,400 | |
Total OTC Options Purchased | | | | |
(Cost $1,483,829) | | | | | | $ | 6,320,580 | |
| | | | | | | | | |
Total Investments - 103.5% | | | | |
(Cost $5,155,748,690) | | $ | 5,189,629,967 | |
Other Assets & Liabilities, net - (3.5)% | | | (176,963,797 | ) |
Total Net Assets - 100.0% | | $ | 5,012,666,170 | |
Centrally Cleared Interest Rate Swap Agreements†† |
| |
Counterparty | Exchange | Floating
Rate
Type | Floating
Rate Index | | Fixed
Rate | | Payment
Frequency | | Maturity
Date | | | Notional
Amount | | | Value | | | Upfront
Premiums
Paid | | | Unrealized
Appreciation** | |
BofA Securities, Inc. | CME | Receive | 3-Month USD LIBOR | 1.65% | Quarterly | 03/17/31 | | $ | 140,000,000 | | | $ | 1,961,806 | | | $ | 1,414 | | | $ | 1,960,392 | |
BofA Securities, Inc. | CME | Pay | Federal Funds Rate | 1.37% | Annually | 12/04/21 | | | 177,800,000 | | | | 1,598,468 | | | | 251 | | | | 1,598,217 | |
BofA Securities, Inc. | CME | Pay | Federal Funds Rate | 1.31% | Annually | 11/25/21 | | | 98,600,000 | | | | 811,919 | | | | 177 | | | | 811,742 | |
BofA Securities, Inc. | CME | Pay | Federal Funds Rate | 0.62% | Annually | 03/04/22 | | | 110,305,000 | | | | 564,694 | | | | — | | | | 564,694 | |
BofA Securities, Inc. | CME | Pay | Federal Funds Rate | 1.40% | Annually | 12/13/21 | | | 54,950,000 | | | | 520,460 | | | | 153 | | | | 520,307 | |
BofA Securities, Inc. | CME | Pay | Federal Funds Rate | 1.36% | Annually | 12/09/21 | | | 46,500,000 | | | | 422,108 | | | | 143 | | | | 421,965 | |
BofA Securities, Inc. | CME | Pay | Federal Funds Rate | 1.37% | Annually | 09/30/21 | | | 43,200,000 | | | | 284,931 | | | | 101 | | | | 284,830 | |
BofA Securities, Inc. | CME | Pay | Federal Funds Rate | 1.23% | Annually | 08/22/21 | | | 44,400,000 | | | | 206,940 | | | | 80 | | | | 206,860 | |
BofA Securities, Inc. | CME | Pay | Federal Funds Rate | 1.46% | Annually | 09/17/21 | | | 29,600,000 | | | | 193,982 | | | | 27 | | | | 193,955 | |
| | | | | | | | | | | | | | | | | | | $ | 6,565,308 | | | $ | 2,346 | | | $ | 6,562,962 | |
26 | THE GUGGENHEIM FUNDS SEMI-ANNUAL REPORT | SEE NOTES TO FINANCIAL STATEMENTS. |
SCHEDULE OF INVESTMENTS (Unaudited)(continued) | March 31, 2021 |
LIMITED DURATION FUND | |
Total Return Swap Agreements |
| |
Counterparty | Reference Obligation | | Financing
Rate Receive | | Payment
Frequency | | Maturity Date | | | Units | | | Notional
Amount | | | Value and
Unrealized
Appreciation
(Depreciation) | |
OTC Credit Index Swap Agreements†† |
Bank of America, N.A. | iShares iBoxx $ High Yield Corporate Bond ETF | 0.30% (1 Month USD LIBOR - 0.40%) | Monthly | | | 05/05/21 | | | | 120,650 | | | $ | 10,518,267 | | | $ | (25,336 | ) |
| | | | | | | | | | | | | | | | | | | | | | | |
OTC Fixed Income Index Swap Agreements Sold Short†† |
BNP Paribas | iShares Core U.S. Aggregate Bond ETF | 0.36% (1 Month USD LIBOR + 0.25%) | At Maturity | | | 04/21/21 | | | | 876,500 | | | $ | 99,771,995 | | | $ | 3,137,870 | |
BNP Paribas | iShares Core U.S. Aggregate Bond ETF | 0.39% (1 Month USD LIBOR + 0.28%) | At Maturity | | | 04/19/21 | | | | 650,000 | | | | 73,989,500 | | | | 2,223,000 | |
| | | | | | | | | | | | | | | | | $ | 173,761,495 | | | $ | 5,360,870 | |
Forward Foreign Currency Exchange Contracts†† |
| |
Counterparty | Contracts to
Sell | Currency | | Settlement
Date | | | Settlement
Value | | | Value at
March 31,
2021 | | | Unrealized
Appreciation
(Depreciation) | |
Citibank, N.A. | 121,120,000 | BRL | | | 07/01/21 | | | $ | 28,823,147 | | | $ | 21,400,515 | | | $ | 7,422,632 | |
Goldman Sachs International | 468,610,000 | BRL | | | 04/01/21 | | | | 87,406,031 | | | | 83,317,332 | | | | 4,088,699 | |
UBS AG | 312,483,900 | ILS | | | 04/30/21 | | | | 96,822,016 | | | | 93,586,238 | | | | 3,235,778 | |
Morgan Stanley Capital Services LLC | 274,900,000 | BRL | | | 04/01/21 | | | | 51,725,436 | | | | 48,876,325 | | | | 2,849,111 | |
UBS AG | 4,449,000,000 | JPY | | | 04/12/21 | | | | 42,750,072 | | | | 40,183,012 | | | | 2,567,060 | |
Goldman Sachs International | 40,300,000 | BRL | | | 07/01/21 | | | | 9,441,256 | | | | 7,120,548 | | | | 2,320,708 | |
Goldman Sachs International | 36,475,000 | EUR | | | 07/09/21 | | | | 44,534,516 | | | | 42,859,360 | | | | 1,675,156 | |
JPMorgan Chase Bank, N.A. | 2,294,500,000 | JPY | | | 04/19/21 | | | | 22,159,169 | | | | 20,725,342 | | | | 1,433,827 | |
Goldman Sachs International | 2,284,000,000 | JPY | | | 04/05/21 | | | | 22,018,321 | | | | 20,627,309 | | | | 1,391,012 | |
JPMorgan Chase Bank, N.A. | 18,300,000 | BRL | | | 07/01/21 | | | | 4,347,309 | | | | 3,233,400 | | | | 1,113,909 | |
Citibank, N.A. | 912,456,000 | JPY | | | 07/01/21 | | | | 8,984,580 | | | | 8,247,663 | | | | 736,917 | |
Barclays Bank plc | 843,421,500 | JPY | | | 07/01/21 | | | | 8,292,415 | | | | 7,623,663 | | | | 668,752 | |
UBS AG | 741,000,000 | MXN | | | 04/08/21 | | | | 36,495,002 | | | | 36,245,272 | | | | 249,730 | |
Barclays Bank plc | 5,797,000 | EUR | | | 04/16/21 | | | | 6,935,659 | | | | 6,799,172 | | | | 136,487 | |
Bank of America, N.A. | 4,988,000 | EUR | | | 06/30/21 | | | | 5,890,838 | | | | 5,859,889 | | | | 30,949 | |
Barclays Bank plc | 1,095,094,000 | CZK | | | 04/19/22 | | | | 49,547,796 | | | | 49,527,830 | | | | 19,966 | |
Barclays Bank plc | 1,094,000 | CZK | | | 04/19/21 | | | | 49,545 | | | | 49,207 | | | | 338 | |
UBS AG | 21,000,000 | EUR | | | 04/16/21 | | | | 24,610,971 | | | | 24,630,433 | | | | (19,462 | ) |
Bank of America, N.A. | 5,454,000 | ILS | | | 04/30/21 | | | | 1,586,157 | | | | 1,633,426 | | | | (47,269 | ) |
Bank of America, N.A. | 13,124,200 | ILS | | | 01/31/22 | | | | 3,890,958 | | | | 3,955,979 | | | | (65,021 | ) |
Citibank, N.A. | 12,524,000 | ILS | | | 04/30/21 | | | | 3,658,244 | | | | 3,750,830 | | | | (92,586 | ) |
JPMorgan Chase Bank, N.A. | 18,600,000 | CAD | | | 04/15/21 | | | | 14,653,146 | | | | 14,804,328 | | | | (151,182 | ) |
Goldman Sachs International | 11,989,250 | EUR | | | 07/30/21 | | | | 13,927,013 | | | | 14,094,496 | | | | (167,483 | ) |
Goldman Sachs International | 42,231,650 | ILS | | | 01/31/22 | | | | 12,500,228 | | | | 12,729,730 | | | | (229,502 | ) |
UBS AG | 481,400,000 | MXN | | | 05/06/21 | | | | 23,077,783 | | | | 23,476,572 | | | | (398,789 | ) |
JPMorgan Chase Bank, N.A. | 21,006,375 | EUR | | | 07/30/21 | | | | 24,244,928 | | | | 24,694,978 | | | | (450,050 | ) |
UBS AG | 110,490,000 | CAD | | | 04/07/21 | | | | 87,081,596 | | | | 87,940,768 | | | | (859,172 | ) |
Goldman Sachs International | 196,647,000 | ILS | | | 04/30/21 | | | | 57,843,530 | | | | 58,894,085 | | | | (1,050,555 | ) |
| | | | | | | | | | | | | | | | | $ | 26,409,960 | |
SEE NOTES TO FINANCIAL STATEMENTS. | THE GUGGENHEIM FUNDS SEMI-ANNUAL REPORT | 27 |
SCHEDULE OF INVESTMENTS (Unaudited)(continued) | March 31, 2021 |
LIMITED DURATION FUND | |
Forward Foreign Currency Exchange Contracts†† (continued) |
| |
Counterparty | Contracts to
Buy | Currency | | Settlement
Date | | | Settlement
Value | | | Value at
March 31,
2021 | | | Unrealized
Appreciation
(Depreciation) | |
Barclays Bank plc | 32,995,625 | EUR | | | 07/30/21 | | | $ | 35,907,159 | | | $ | 38,789,474 | | | $ | 2,882,315 | |
Goldman Sachs International | 55,355,850 | ILS | | | 01/31/22 | | | | 15,359,559 | | | | 16,685,709 | | | | 1,326,150 | |
Goldman Sachs International | 45,495,450 | ILS | | | 04/30/21 | | | | 12,689,087 | | | | 13,625,496 | | | | 936,409 | |
JPMorgan Chase Bank, N.A. | 45,495,450 | ILS | | | 04/30/21 | | | | 12,819,231 | | | | 13,625,496 | | | | 806,265 | |
JPMorgan Chase Bank, N.A. | 110,490,000 | CAD | | | 04/07/21 | | | | 87,607,180 | | | | 87,940,768 | | | | 333,588 | |
UBS AG | 741,000,000 | MXN | | | 04/08/21 | | | | 36,020,428 | | | | 36,245,272 | | | | 224,844 | |
Citibank, N.A. | 223,000,000 | BRL | | | 04/01/21 | | | | 39,919,088 | | | | 39,648,674 | | | | (270,414 | ) |
UBS AG | 2,294,500,000 | JPY | | | 04/19/21 | | | | 21,037,142 | | | | 20,725,342 | | | | (311,800 | ) |
JPMorgan Chase Bank, N.A. | 234,610,000 | BRL | | | 04/01/21 | | | | 42,090,061 | | | | 41,712,894 | | | | (377,167 | ) |
JPMorgan Chase Bank, N.A. | 1,755,877,500 | JPY | | | 07/01/21 | | | | 16,249,098 | | | | 15,871,326 | | | | (377,772 | ) |
Morgan Stanley Capital Services LLC | 285,900,000 | BRL | | | 04/01/21 | | | | 51,303,677 | | | | 50,832,089 | | | | (471,588 | ) |
JPMorgan Chase Bank, N.A. | 4,449,000,000 | JPY | | | 04/12/21 | | | | 40,779,550 | | | | 40,183,012 | | | | (596,538 | ) |
JPMorgan Chase Bank, N.A. | 60,205,000 | BRL | | | 07/01/21 | | | | 11,667,635 | | | | 10,637,533 | | | | (1,030,102 | ) |
Citibank, N.A. | 119,515,000 | BRL | | | 07/01/21 | | | | 22,919,925 | | | | 21,116,931 | | | | (1,802,994 | ) |
| | | | | | | | | | | | | | | | | $ | 1,271,196 | |
~ | The face amount is denominated in U.S. dollars unless otherwise indicated. |
* | Non-income producing security. |
** | Includes cumulative appreciation (depreciation). Variation margin is reported within the Statement of Assets and Liabilities. |
† | Value determined based on Level 1 inputs — See Note 4. |
†† | Value determined based on Level 2 inputs, unless otherwise noted — See Note 4. |
††† | Value determined based on Level 3 inputs — See Note 4. |
1 | Affiliated issuer. |
2 | Rate indicated is the 7-day yield as of March 31, 2021. |
3 | Security has a fixed rate coupon which will convert to a floating or variable rate coupon on a future date. |
4 | Perpetual maturity. |
5 | Variable rate security. Rate indicated is the rate effective at March 31, 2021. In some instances, the effective rate is limited by a minimum rate floor or a maximum rate cap established by the issuer. The settlement status of a position may also impact the effective rate indicated. In some cases, a position may be unsettled at period end and may not have a stated effective rate. In instances where multiple underlying reference rates and spread amounts are shown, the effective rate is based on a weighted average. |
6 | Security is a 144A or Section 4(a)(2) security. These securities have been determined to be liquid under guidelines established by the Board of Trustees. The total market value of 144A or Section 4(a)(2) securities is $2,672,219,010 (cost $2,667,469,136), or 53.3% of total net assets. |
7 | All or a portion of this security is pledged as interest rate swap collateral at March 31, 2021. |
8 | Security has no stated coupon. However, it is expected to receive residual cash flow payments on defined deal dates. |
9 | Security is a 144A or Section 4(a)(2) security. These securities have been determined to be illiquid and restricted under guidelines established by the Board of Trustees. The total market value of 144A or Section 4(a)(2) illiquid and restricted securities is $111,338,457 (cost $110,768,585), or 2.2% of total net assets — See Note 9. |
10 | Security is a step up/down bond. The coupon increases or decreases at regular intervals until the bond reaches full maturity. Rate indicated is the rate at March 31, 2021. See table below for additional step information for each security. |
11 | Security is an interest-only strip. |
12 | Rate indicated is the effective yield at the time of purchase. |
| | BofA — Bank of America |
| | BRL — Brazilian Real |
| | CAD — Canadian Dollar |
| | CME — Chicago Mercantile Exchange |
| | CMS — Constant Maturity Swap |
| | CZK — Czech Koruna |
| | EUR — Euro |
| | EURIBOR — European Interbank Offered Rate |
| | GBP — British Pound |
| | ILS — Israeli New Shekel |
| | JPY — Japanese Yen |
| | LIBOR — London Interbank Offered Rate |
| | MXN — Mexican Peso |
| | plc — Public Limited Company |
28 | THE GUGGENHEIM FUNDS SEMI-ANNUAL REPORT | SEE NOTES TO FINANCIAL STATEMENTS. |
SCHEDULE OF INVESTMENTS (Unaudited)(continued) | March 31, 2021 |
LIMITED DURATION FUND | |
| | REMIC — Real Estate Mortgage Investment Conduit |
| | REIT — Real Estate Investment Trust |
| | SARL — Société à Responsabilité Limitée |
| | WAC — Weighted Average Coupon |
| | |
| | See Sector Classification in Other Information section. |
The following table summarizes the inputs used to value the Fund’s investments at March 31, 2021 (See Note 4 in the Notes to Financial Statements):
Investments in Securities (Assets) | | Level 1
Quoted
Prices | | | Level 2
Significant
Observable
Inputs | | | Level 3
Significant
Unobservable
Inputs | | | Total | |
Common Stocks | | $ | 12,572,523 | | | $ | — | | | $ | — | | | $ | 12,572,523 | |
Preferred Stocks | | | — | | | | 4,751,536 | | | | — | | | | 4,751,536 | |
Exchange-Traded Funds | | | 173,761,495 | | | | — | | | | — | | | | 173,761,495 | |
Mutual Funds | | | 88,575,009 | | | | — | | | | — | | | | 88,575,009 | |
Money Market Fund | | | 190,564,399 | | | | — | | | | — | | | | 190,564,399 | |
Corporate Bonds | | | — | | | | 1,826,970,072 | | | | 18,421,161 | | | | 1,845,391,233 | |
Asset-Backed Securities | | | — | | | | 1,440,341,160 | | | | 138,772,954 | | | | 1,579,114,114 | |
Collateralized Mortgage Obligations | | | — | | | | 718,098,048 | | | | 28,528,970 | | | | 746,627,018 | |
Foreign Government Debt | | | — | | | | 280,008,114 | | | | — | | | | 280,008,114 | |
Senior Floating Rate Interests | | | — | | | | 253,526,655 | | | | 1,944,135 | | | | 255,470,790 | |
Municipal Bonds | | | — | | | | 5,699,025 | | | | — | | | | 5,699,025 | |
U.S. Government Securities | | | — | | | | 774,131 | | | | — | | | | 774,131 | |
Options Purchased | | | — | | | | 6,320,580 | | | | — | | | | 6,320,580 | |
Interest Rate Swap Agreements** | | | — | | | | 6,562,962 | | | | — | | | | 6,562,962 | |
Forward Foreign Currency Exchange Contracts** | | | — | | | | 36,450,602 | | | | — | | | | 36,450,602 | |
Fixed Income Index Swap Agreements** | | | — | | | | 5,360,870 | | | | — | | | | 5,360,870 | |
Total Assets | | $ | 465,473,426 | | | $ | 4,584,863,755 | | | $ | 187,667,220 | | | $ | 5,238,004,401 | |
Investments in Securities (Liabilities) | | Level 1
Quoted
Prices | | | Level 2
Significant
Observable
Inputs | | | Level 3
Significant
Unobservable
Inputs | | | Total | |
Forward Foreign Currency Exchange Contracts** | | $ | — | | | $ | 8,769,446 | | | $ | — | | | $ | 8,769,446 | |
Credit Index Swap Agreements** | | | — | | | | 25,336 | | | | — | | | | 25,336 | |
Unfunded Loan Commitments (Note 8) | | | — | | | | — | | | | 68,837 | | | | 68,837 | |
Total Liabilities | | $ | — | | | $ | 8,794,782 | | | $ | 68,837 | | | $ | 8,863,619 | |
** | This derivative is reported as unrealized appreciation/depreciation at period end. |
SEE NOTES TO FINANCIAL STATEMENTS. | THE GUGGENHEIM FUNDS SEMI-ANNUAL REPORT | 29 |
SCHEDULE OF INVESTMENTS (Unaudited)(continued) | March 31, 2021 |
LIMITED DURATION FUND | |
The following is a summary of significant unobservable inputs used in the fair valuation of assets and liabilities categorized within Level 3 of the fair value hierarchy:
Category | | Ending
Balance at
March 31, 2021 | | Valuation Technique | | Unobservable
Inputs | | Input
Range | | | Weighted
Average | |
Assets: | | | | | | | | | | | | | | | |
Asset-Backed Securities | | $ | 115,537,796
| | Option Adjusted Spread off the prior month end broker quote | | Broker Quote | | | — | | | | — | |
Asset-Backed Securities | | | 17,375,202 | | Model Price | | Purchase Price | | | — | | | | — | |
Asset-Backed Securities | | | 5,859,956 | | Yield Analysis | | Yield | | | 2.2 | % | | | — | |
Collateralized Mortgage Obligations | | | 17,632,119 | | Model Price | | Purchase Price | | | — | | | | — | |
Collateralized Mortgage Obligations | | | 10,896,851
| | Option Adjusted Spread off the prior month end broker quote | | Broker Quote | | | — | | | | — | |
Corporate Bonds | | | 17,213,809
| | Option Adjusted Spread off the prior month end broker quote | | Broker Quote | | | — | | | | — | |
Corporate Bonds | | | 1,207,352 | | Third Party Pricing | | Vendor Price | | | — | | | | — | |
Senior Floating Rate Interests | | | 1,944,135 | | Third Party Pricing | | Broker Quote | | | — | | | | — | |
Total Assets | | $ | 187,667,220 | | | | | | | | | | | | |
Liabilities: | | | | | | | | | | | | | | | |
Unfunded Loan Commitments | | $ | 68,837 | | Model Price | | Purchase Price | | | — | | | | — | |
Significant changes in a quote or yield would generally result in significant changes in the fair value of the security.
The Fund’s fair valuation leveling guidelines classify a single daily broker quote, or a vendor price based on a single daily or monthly broker quote, as Level 3, if such a quote or price cannot be supported with other available market information.
Transfers between Level 2 and Level 3 may occur as markets fluctuate and/or the availability of data used in an investment’s valuation changes. For the period ended March 31, 2021, the Fund had securities with a total value of $23,999,634 transfer from Level 2 to Level 3 due to lack of observable inputs.
Summary of Fair Value Level 3 Activity
Following is a reconciliation of Level 3 assets for which significant unobservable inputs were used to determine fair value for the period ended March 31, 2021:
| | | Assets | | | | | | | Liabilities | |
| | Asset-Backed
Securities | | | Collateralized
Mortgage
Obligations | | | Corporate
Bonds | | | Senior
Floating Rate
Interests | | | Total
Assets | | | Unfunded Loan
Commitments | |
Beginning Balance | | $ | 98,361,270 | | | $ | 28,023,753 | | | $ | 4,682,550 | | | $ | — | | | $ | 131,067,573 | | | $ | (163,932 | ) |
Purchases/(Receipts) | | | 51,300,000 | | | | 28,541,245 | | | | 13,956,262 | | | | 1,926,905 | | | | 95,724,412 | | | | (20,884 | ) |
(Sales, maturities and paydowns)/Fundings | | | (34,901,538 | ) | | | (27,792,937 | ) | | | — | | | | (18,387 | ) | | | (62,712,862 | ) | | | 92,630 | |
Amortization of premiums/discounts | | | — | | | | (1,126 | ) | | | (52,871 | ) | | | 4,667 | | | | (49,330 | ) | | | — | |
Total realized gains (losses) included in earnings | | | 161 | | | | (19 | ) | | | — | | | | — | | | | 142 | | | | — | |
Total change in unrealized appreciation (depreciation) included in earnings | | | 13,427 | | | | (241,946 | ) | | | (164,780 | ) | | | 30,950 | | | | (362,349 | ) | | | 23,349 | |
Transfers into Level 3 | | | 23,999,634 | | | | — | | | | — | | | | — | | | | 23,999,634 | | | | — | |
Ending Balance | | $ | 138,772,954 | | | $ | 28,528,970 | | | $ | 18,421,161 | | | $ | 1,944,135 | | | $ | 187,667,220 | | | $ | (68,837 | ) |
Net change in unrealized appreciation (depreciation) for investments in Level 3 securities still held at March 31, 2021 | | $ | 13,427 | | | $ | 7,967 | | | $ | (164,780 | ) | | $ | 30,950 | | | $ | (112,436 | ) | | $ | 23,349 | |
30 | THE GUGGENHEIM FUNDS SEMI-ANNUAL REPORT | SEE NOTES TO FINANCIAL STATEMENTS. |
SCHEDULE OF INVESTMENTS (Unaudited)(concluded) | March 31, 2021 |
LIMITED DURATION FUND | |
Step Coupon Bonds
The following table discloses additional information related to step coupon bonds held by the Fund. Certain securities are subject to multiple rate changes prior to maturity. For those securities, a range of rates and corresponding dates have been provided. Rates for all step coupon bonds held by the Fund are scheduled to increase, none are scheduled to decrease.
Name | Coupon Rate at
Next Reset Date | Next Rate
Reset Date |
CSMC Trust 2020-NQM1 1.41% due 05/25/65 | 2.41% | 09/26/24 |
Verus Securitization Trust 2019-4 2.64% due 11/25/59 | 3.64% | 10/26/23 |
Verus Securitization Trust 2020-1 2.42% due 01/25/60 | 3.42% | 01/26/24 |
Verus Securitization Trust 2020-5 1.58% due 05/25/65 | 2.58% | 10/26/24 |
Affiliated Transactions
Investments representing 5% or more of the outstanding voting shares of a company, or control of or by, or common control under Guggenheim Investments (“GI”), result in that company being considered an affiliated issuer, as defined in the 1940 Act.
The Fund may invest in certain of the underlying series of Guggenheim Strategy Funds Trust, including Guggenheim Strategy Fund II and Guggenheim Strategy Fund III, (collectively, the “Short Term Investment Vehicles”), each of which are open-end management investment companies managed by GI. The Short Term Investment Vehicles, which launched on March 11, 2014, are offered as short term investment options only to mutual funds, trusts, and other accounts managed by GI and/or its affiliates, and are not available to the public. The Short Term Investment Vehicles pay no investment management fees. The Short Term Investment Vehicles’ annual report on Form N-CSR dated September 30, 2020, is available publicly or upon request. This information is available from the EDGAR database on the SEC’s website at https://www.sec.gov/Archives/edgar/data/1601445/000182126820000133/gug81042-ncsr.htm.
Transactions during the period ended March 31, 2021, in which the company is an affiliated issuer, were as follows:
Security Name | | Value
09/30/20 | | | Additions | | | Reductions | | | Realized
Gain (Loss) | | | Change in
Unrealized
Appreciation
(Depreciation) | | | Value
03/31/21 | | | Shares
03/31/21 | | | Investment
Income | |
Mutual Funds | | | | | | | | | | | | | | | | | | | | | | | | | | | | | | | | |
Guggenheim Strategy Fund II | | $ | 29,379,083 | | | $ | 267,287 | | | $ | — | | | $ | — | | | $ | 11,846 | | | $ | 29,658,216 | | | | 1,187,278 | | | $ | 267,291 | |
Guggenheim Strategy Fund III | | | 29,499,318 | | | | 258,049 | | | | — | | | | — | | | | 82,590 | | | | 29,839,957 | | | | 1,186,951 | | | | 258,046 | |
Guggenheim Ultra Short Duration Fund — Institutional Class | | | 28,983,105 | | | | 151,997 | | | | — | | | | — | | | | (58,266 | ) | | | 29,076,836 | | | | 2,919,361 | | | | 151,996 | |
| | | $ | 87,861,506 | | | $ | 677,333 | | | $ | — | | | $ | — | | | $ | 36,170 | | | $ | 88,575,009 | | | | | | | $ | 677,333 | |
SEE NOTES TO FINANCIAL STATEMENTS. | THE GUGGENHEIM FUNDS SEMI-ANNUAL REPORT | 31 |
STATEMENT OF ASSETS AND LIABILITIES (Unaudited) |
March 31, 2021 |
Assets: |
Investments in unaffiliated issuers, at value (cost $5,068,691,068) | | $ | 5,101,054,958 | |
Investments in affiliated issuers, at value (cost $87,057,622) | | | 88,575,009 | |
Foreign currency, at value (cost $32,994) | | | 32,995 | |
Segregated cash with broker | | | 580,000 | |
Unamortized upfront premiums paid on interest rate swap agreements | | | 2,346 | |
Unrealized appreciation on OTC swap agreements | | | 5,360,870 | |
Unrealized appreciation on forward foreign currency exchange contracts | | | 36,450,602 | |
Prepaid expenses | | | 247,720 | |
Receivables: |
Interest | | | 20,076,509 | |
Fund shares sold | | | 11,614,229 | |
Securities sold | | | 4,408,692 | |
Variation margin on interest rate swap agreements | | | 2,665,394 | |
Swap settlement | | | 215,878 | |
Dividends | | | 107,586 | |
Foreign tax reclaims | | | 11,761 | |
Other assets | | | 6,665 | |
Total assets | | | 5,271,411,214 | |
| | | | | |
Liabilities: |
Unfunded loan commitments, at value (Note 8) (commitment fees received $93,254) | | | 68,837 | |
Overdraft due to custodian bank | | | 605,528 | |
Segregated cash due to broker | | | 37,697,391 | |
Unrealized depreciation on OTC swap agreements | | | 25,336 | |
Unrealized depreciation on forward foreign currency exchange contracts | | | 8,769,446 | |
Payable for: |
Securities purchased | | | 200,228,937 | |
Fund shares redeemed | | | 7,647,779 | |
Distributions to shareholders | | | 1,514,792 | |
Management fees | | | 1,282,148 | |
Distribution and service fees | | | 285,533 | |
Fund accounting/administration fees | | | 282,661 | |
Transfer agent/maintenance fees | | | 106,430 | |
Trustees’ fees* | | | 31,678 | |
Due to Investment Adviser | | | 444 | |
Miscellaneous | | | 198,104 | |
Total liabilities | | | 258,745,044 | |
Net assets | | $ | 5,012,666,170 | |
| | | | | |
Net assets consist of: |
Paid in capital | | $ | 4,957,397,834 | |
Total distributable earnings (loss) | | | 55,268,336 | |
Net assets | | $ | 5,012,666,170 | |
| | | | | |
A-Class: |
Net assets | | $ | 807,099,900 | |
Capital shares outstanding | | | 31,816,845 | |
Net asset value per share | | $ | 25.37 | |
Maximum offering price per share (Net asset value divided by 97.75%) | | $ | 25.95 | |
| | | | | |
C-Class: |
Net assets | | $ | 92,482,104 | |
Capital shares outstanding | | | 3,648,164 | |
Net asset value per share | | $ | 25.35 | |
| | | | | |
P-Class: |
Net assets | | $ | 164,072,593 | |
Capital shares outstanding | | | 6,467,752 | |
Net asset value per share | | $ | 25.37 | |
| | | | | |
Institutional Class: |
Net assets | | $ | 3,911,448,448 | |
Capital shares outstanding | | | 154,226,493 | |
Net asset value per share | | $ | 25.36 | |
| | | | | |
R6-Class: |
Net assets | | $ | 37,563,125 | |
Capital shares outstanding | | | 1,481,871 | |
Net asset value per share | | $ | 25.35 | |
* | Relates to Trustees not deemed “interested persons” within the meaning of Section 2(a)(19) of the 1940 Act. |
32 | THE GUGGENHEIM FUNDS SEMI-ANNUAL REPORT | SEE NOTES TO FINANCIAL STATEMENTS. |
STATEMENT OF OPERATIONS (Unaudited) |
Six Months Ended March 31, 2021 |
Investment Income: |
Dividends from securities of unaffiliated issuers | | $ | 2,764,255 | |
Dividends from securities of affiliated issuers | | | 677,333 | |
Interest from securities of unaffiliated issuers (net of foreign withholding tax of $2,928) | | | 41,711,241 | |
Total investment income | | | 45,152,829 | |
| | | | | |
Expenses: |
Management fees | | | 8,513,049 | |
Distribution and service fees: |
A-Class | | | 916,126 | |
C-Class | | | 450,175 | |
P-Class | | | 199,243 | |
Transfer agent/maintenance fees: |
A-Class | | | 119,694 | |
C-Class | | | 41,815 | |
P-Class | | | 63,245 | |
Institutional Class | | | 1,256,846 | |
R6-Class | | | 442 | |
Fund accounting/administration fees | | | 1,477,607 | |
Professional fees | | | 170,363 | |
Line of credit fees | | | 121,795 | |
Trustees’ fees* | | | 50,097 | |
Custodian fees | | | 29,575 | |
Interest expense | | | 16,868 | |
Miscellaneous | | | 197,654 | |
Recoupment of previously waived fees: |
R6-Class | | | 1,348 | |
Total expenses | | | 13,625,942 | |
Less: |
Expenses reimbursed by Adviser: |
A-Class | | | (84,437 | ) |
C-Class | | | (38,511 | ) |
P-Class | | | (56,298 | ) |
Institutional Class | | | (1,098,704 | ) |
R6-Class | | | (234 | ) |
Expenses waived by Adviser | | | (50,545 | ) |
Earnings credits applied | | | (4,745 | ) |
Total waived/reimbursed expenses | | | (1,333,474 | ) |
Net expenses | | | 12,292,468 | |
Net investment income | | | 32,860,361 | |
| | | | | |
Net Realized and Unrealized Gain (Loss): |
Net realized gain (loss) on: |
Investments in unaffiliated issuers | | | 10,166,684 | |
Swap agreements | | | 2,079,085 | |
Options purchased | | | 2,749,258 | |
Forward foreign currency exchange contracts | | | (16,527,521 | ) |
Foreign currency transactions | | | 1,445,530 | |
Net realized loss | | | (86,964 | ) |
Net change in unrealized appreciation (depreciation) on: |
Investments in unaffiliated issuers | | | (30,347,372 | ) |
Investments in affiliated issuers | | | 36,170 | |
Swap agreements | | | 1,473,268 | |
Options purchased | | | 3,346,761 | |
Forward foreign currency exchange contracts | | | 9,585,001 | |
Foreign currency translations | | | 755,094 | |
Net change in unrealized appreciation (depreciation) | | | (15,151,078 | ) |
Net realized and unrealized loss | | | (15,238,042 | ) |
Net increase in net assets resulting from operations | | $ | 17,622,319 | |
* | Relates to Trustees not deemed “interested persons” within the meaning of Section 2(a)(19) of the 1940 Act. |
SEE NOTES TO FINANCIAL STATEMENTS. | THE GUGGENHEIM FUNDS SEMI-ANNUAL REPORT | 33 |
STATEMENTS OF CHANGES IN NET ASSETS |
| | Six Months Ended
March 31, 2021
(Unaudited) | | | Year Ended
September 30,
2020 | |
Increase (Decrease) in Net Assets from Operations: | | | | | | | | |
Net investment income | | $ | 32,860,361 | | | $ | 57,288,219 | |
Net realized gain (loss) on investments | | | (86,964 | ) | | | 40,958,989 | |
Net change in unrealized appreciation (depreciation) on investments | | | (15,151,078 | ) | | | 69,800,768 | |
Net increase in net assets resulting from operations | | | 17,622,319 | | | | 168,047,976 | |
| | | | | | | | | |
Distributions to shareholders: | | | | | | | | |
A-Class | | | (8,919,679 | ) | | | (9,531,615 | ) |
C-Class | | | (776,033 | ) | | | (897,123 | ) |
P-Class | | | (1,979,598 | ) | | | (1,705,392 | ) |
Institutional Class | | | (45,084,411 | ) | | | (48,269,529 | ) |
R6-Class | | | (477,718 | ) | | | (3,918,302 | ) |
Total distributions to shareholders | | | (57,237,439 | ) | | | (64,321,961 | ) |
| | | | | | | | | |
Capital share transactions: | | | | | | | | |
Proceeds from sale of shares | | | | | | | | |
A-Class | | | 326,322,570 | | | | 359,178,012 | |
C-Class | | | 19,260,472 | | | | 27,892,729 | |
P-Class | | | 42,739,195 | | | | 91,629,526 | |
Institutional Class | | | 1,638,724,342 | | | | 1,908,540,024 | |
R6-Class | | | 11,447,266 | | | | 60,206,782 | |
Distributions reinvested | | | | | | | | |
A-Class | | | 7,207,134 | | | | 7,676,372 | |
C-Class | | | 622,611 | | | | 718,998 | |
P-Class | | | 1,975,772 | | | | 1,700,377 | |
Institutional Class | | | 35,578,930 | | | | 38,678,924 | |
R6-Class | | | 477,691 | | | | 3,918,300 | |
Cost of shares redeemed | | | | | | | | |
A-Class | | | (145,115,318 | ) | | | (329,100,339 | ) |
C-Class | | | (12,806,469 | ) | | | (30,485,763 | ) |
P-Class | | | (29,960,621 | ) | | | (54,176,385 | ) |
Institutional Class | | | (643,595,862 | ) | | | (1,538,644,390 | ) |
R6-Class | | | (5,372,482 | ) | | | (346,906,193 | ) |
Net increase from capital share transactions | | | 1,247,505,231 | | | | 200,826,974 | |
Net increase in net assets | | | 1,207,890,111 | | | | 304,552,989 | |
| | | | | | | | | |
Net assets: | | | | | | | | |
Beginning of period | | | 3,804,776,059 | | | | 3,500,223,070 | |
End of period | | $ | 5,012,666,170 | | | $ | 3,804,776,059 | |
| | | | | | | | | |
34 | THE GUGGENHEIM FUNDS SEMI-ANNUAL REPORT | SEE NOTES TO FINANCIAL STATEMENTS. |
STATEMENTS OF CHANGES IN NET ASSETS (concluded) |
| | Six Months Ended
March 31, 2021
(Unaudited) | | | Year Ended
September 30,
2020 | |
Capital share activity: | | | | | | | | |
Shares sold | | | | | | | | |
A-Class | | | 12,760,658 | | | | 14,310,934 | |
C-Class | | | 753,882 | | | | 1,119,438 | |
P-Class | | | 1,672,277 | | | | 3,610,524 | |
Institutional Class | | | 64,129,967 | | | | 76,326,464 | |
R6-Class | | | 447,748 | | | | 2,435,956 | |
Shares issued from reinvestment of distributions | | | | | | | | |
A-Class | | | 282,120 | | | | 307,849 | |
C-Class | | | 24,386 | | | | 28,862 | |
P-Class | | | 77,339 | | | | 68,147 | |
Institutional Class | | | 1,393,359 | | | | 1,550,215 | |
R6-Class | | | 18,714 | | | | 158,809 | |
Shares redeemed | | | | | | | | |
A-Class | | | (5,684,699 | ) | | | (13,271,088 | ) |
C-Class | | | (501,302 | ) | | | (1,227,834 | ) |
P-Class | | | (1,172,558 | ) | | | (2,192,351 | ) |
Institutional Class | | | (25,181,606 | ) | | | (62,129,659 | ) |
R6-Class | | | (210,226 | ) | | | (14,134,431 | ) |
Net increase in shares | | | 48,810,059 | | | | 6,961,835 | |
SEE NOTES TO FINANCIAL STATEMENTS. | THE GUGGENHEIM FUNDS SEMI-ANNUAL REPORT | 35 |
This table is presented to show selected data for a share outstanding throughout each period and to assist shareholders in evaluating a Fund’s performance for the periods presented.
A-Class | | Six Months Ended
March 31, 2021a | | | Year Ended
September 30,
2020 | | | Year Ended
September 30,
2019 | | | Year Ended
September 30,
2018 | | | Year Ended
September 30,
2017 | | | Year Ended
September 30,
2016 | |
Per Share Data |
Net asset value, beginning of period | | $ | 25.57 | | | $ | 24.68 | | | $ | 24.70 | | | $ | 24.86 | | | $ | 24.71 | | | $ | 24.65 | |
Income (loss) from investment operations: |
Net investment income (loss)b | | | .17 | | | | .40 | | | | .54 | | | | .51 | | | | .53 | | | | .67 | |
Net gain (loss) on investments (realized and unrealized) | | | (.05 | ) | | | .94 | | | | .01 | | | | (.09 | ) | | | .20 | | | | .08 | |
Total from investment operations | | | .12 | | | | 1.34 | | | | .55 | | | | .42 | | | | .73 | | | | .75 | |
Less distributions from: |
Net investment income | | | (.20 | ) | | | (.45 | ) | | | (.57 | ) | | | (.57 | ) | | | (.58 | ) | | | (.69 | ) |
Net realized gains | | | (.12 | ) | | | — | | | | — | c | | | (.01 | ) | | | — | c | | | — | |
Total distributions | | | (.32 | ) | | | (.45 | ) | | | (.57 | ) | | | (.58 | ) | | | (.58 | ) | | | (.69 | ) |
Net asset value, end of period | | $ | 25.37 | | | $ | 25.57 | | | $ | 24.68 | | | $ | 24.70 | | | $ | 24.86 | | | $ | 24.71 | |
|
Total Returnd | | | 0.45 | % | | | 5.51 | % | | | 2.27 | % | | | 1.69 | % | | | 2.95 | % | | | 3.16 | % |
Ratios/Supplemental Data |
Net assets, end of period (in thousands) | | $ | 807,100 | | | $ | 625,386 | | | $ | 570,353 | | | $ | 627,570 | | | $ | 509,410 | | | $ | 215,856 | |
Ratios to average net assets: |
Net investment income (loss) | | | 1.33 | % | | | 1.60 | % | | | 2.18 | % | | | 2.07 | % | | | 2.14 | % | | | 2.73 | % |
Total expensese | | | 0.77 | % | | | 0.84 | % | | | 0.83 | % | | | 0.81 | % | | | 0.86 | % | | | 0.93 | % |
Net expensesf,g,h | | | 0.74 | % | | | 0.77 | % | | | 0.75 | % | | | 0.75 | % | | | 0.81 | % | | | 0.84 | % |
Portfolio turnover rate | | | 27 | % | | | 123 | % | | | 72 | % | | | 45 | % | | | 55 | % | | | 39 | % |
C-Class | | Six Months Ended
March 31, 2021a | | | Year Ended
September 30,
2020 | | | Year Ended
September 30,
2019 | | | Year Ended
September 30,
2018 | | | Year Ended
September 30,
2017 | | | Year Ended
September 30,
2016 | |
Per Share Data |
Net asset value, beginning of period | | $ | 25.55 | | | $ | 24.66 | | | $ | 24.68 | | | $ | 24.84 | | | $ | 24.70 | | | $ | 24.63 | |
Income (loss) from investment operations: |
Net investment income (loss)b | | | .07 | | | | .21 | | | | .35 | | | | .33 | | | | .35 | | | | .48 | |
Net gain (loss) on investments (realized and unrealized) | | | (.05 | ) | | | .95 | | | | .02 | | | | (.10 | ) | | | .18 | | | | .10 | |
Total from investment operations | | | .02 | | | | 1.16 | | | | .37 | | | | .23 | | | | .53 | | | | .58 | |
Less distributions from: |
Net investment income | | | (.10 | ) | | | (.27 | ) | | | (.39 | ) | | | (.38 | ) | | | (.39 | ) | | | (.51 | ) |
Net realized gains | | | (.12 | ) | | | — | | | | — | c | | | (.01 | ) | | | — | c | | | — | |
Total distributions | | | (.22 | ) | | | (.27 | ) | | | (.39 | ) | | | (.39 | ) | | | (.39 | ) | | | (.51 | ) |
Net asset value, end of period | | $ | 25.35 | | | $ | 25.55 | | | $ | 24.66 | | | $ | 24.68 | | | $ | 24.84 | | | $ | 24.70 | |
|
Total Returnd | | | 0.08 | % | | | 4.72 | % | | | 1.51 | % | | | 0.94 | % | | | 2.18 | % | | | 2.39 | % |
Ratios/Supplemental Data |
Net assets, end of period (in thousands) | | $ | 92,482 | | | $ | 86,143 | | | $ | 85,100 | | | $ | 70,981 | | | $ | 50,743 | | | $ | 26,802 | |
Ratios to average net assets: |
Net investment income (loss) | | | 0.58 | % | | | 0.85 | % | | | 1.42 | % | | | 1.34 | % | | | 1.41 | % | | | 1.98 | % |
Total expensese | | | 1.58 | % | | | 1.61 | % | | | 1.60 | % | | | 1.59 | % | | | 1.65 | % | | | 1.73 | % |
Net expensesf,g,h | | | 1.49 | % | | | 1.52 | % | | | 1.50 | % | | | 1.51 | % | | | 1.56 | % | | | 1.58 | % |
Portfolio turnover rate | | | 27 | % | | | 123 | % | | | 72 | % | | | 45 | % | | | 55 | % | | | 39 | % |
36 | THE GUGGENHEIM FUNDS SEMI-ANNUAL REPORT | SEE NOTES TO FINANCIAL STATEMENTS. |
FINANCIAL HIGHLIGHTS (continued) |
This table is presented to show selected data for a share outstanding throughout each period and to assist shareholders in evaluating a Fund’s performance for the periods presented.
P-Class | | Six Months Ended
March 31, 2021a | | | Year Ended
September 30,
2020 | | | Year Ended
September 30,
2019 | | | Year Ended
September 30,
2018 | | | Year Ended
September 30,
2017 | | | Year Ended
September 30,
2016 | |
Per Share Data |
Net asset value, beginning of period | | $ | 25.57 | | | $ | 24.68 | | | $ | 24.70 | | | $ | 24.86 | | | $ | 24.72 | | | $ | 24.65 | |
Income (loss) from investment operations: |
Net investment income (loss)b | | | .17 | | | | .40 | | | | .54 | | | | .52 | | | | .47 | | | | .68 | |
Net gain (loss) on investments (realized and unrealized) | | | (.05 | ) | | | .94 | | | | .01 | | | | (.10 | ) | | | .24 | | | | .08 | |
Total from investment operations | | | .12 | | | | 1.34 | | | | .55 | | | | .42 | | | | .71 | | | | .76 | |
Less distributions from: |
Net investment income | | | (.20 | ) | | | (.45 | ) | | | (.57 | ) | | | (.57 | ) | | | (.57 | ) | | | (.69 | ) |
Net realized gains | | | (.12 | ) | | | — | | | | — | c | | | (.01 | ) | | | — | c | | | — | |
Total distributions | | | (.32 | ) | | | (.45 | ) | | | (.57 | ) | | | (.58 | ) | | | (.57 | ) | | | (.69 | ) |
Net asset value, end of period | | $ | 25.37 | | | $ | 25.57 | | | $ | 24.68 | | | $ | 24.70 | | | $ | 24.86 | | | $ | 24.72 | |
|
Total Return | | | 0.45 | % | | | 5.50 | % | | | 2.27 | % | | | 1.69 | % | | | 2.93 | % | | | 3.17 | % |
Ratios/Supplemental Data |
Net assets, end of period (in thousands) | | $ | 164,073 | | | $ | 150,623 | | | $ | 108,691 | | | $ | 189,965 | | | $ | 92,503 | | | $ | 1,646 | |
Ratios to average net assets: |
Net investment income (loss) | | | 1.33 | % | | | 1.60 | % | | | 2.18 | % | | | 2.12 | % | | | 1.89 | % | | | 2.76 | % |
Total expensese | | | 0.81 | % | | | 0.90 | % | | | 0.88 | % | | | 0.87 | % | | | 0.92 | % | | | 0.94 | % |
Net expensesf,g,h | | | 0.74 | % | | | 0.77 | % | | | 0.75 | % | | | 0.75 | % | | | 0.81 | % | | | 0.84 | % |
Portfolio turnover rate | | | 27 | % | | | 123 | % | | | 72 | % | | | 45 | % | | | 55 | % | | | 39 | % |
Institutional Class | | Six Months Ended
March 31, 2021a | | | Year Ended
September 30,
2020 | | | Year Ended
September 30,
2019 | | | Year Ended
September 30,
2018 | | | Year Ended
September 30,
2017 | | | Year Ended
September 30,
2016 | |
Per Share Data |
Net asset value, beginning of period | | $ | 25.56 | | | $ | 24.67 | | | $ | 24.69 | | | $ | 24.85 | | | $ | 24.71 | | | $ | 24.64 | |
Income (loss) from investment operations: |
Net investment income (loss)b | | | .20 | | | | .46 | | | | .60 | | | | .58 | | | | .59 | | | | .73 | |
Net gain (loss) on investments (realized and unrealized) | | | (.05 | ) | | | .95 | | | | .01 | | | | (.11 | ) | | | .19 | | | | .09 | |
Total from investment operations | | | .15 | | | | 1.41 | | | | .61 | | | | .47 | | | | .78 | | | | .82 | |
Less distributions from: |
Net investment income | | | (.23 | ) | | | (.52 | ) | | | (.63 | ) | | | (.62 | ) | | | (.64 | ) | | | (.75 | ) |
Net realized gains | | | (.12 | ) | | | — | | | | — | c | | | (.01 | ) | | | — | c | | | — | |
Total distributions | | | (.35 | ) | | | (.52 | ) | | | (.63 | ) | | | (.63 | ) | | | (.64 | ) | | | (.75 | ) |
Net asset value, end of period | | $ | 25.36 | | | $ | 25.56 | | | $ | 24.67 | | | $ | 24.69 | | | $ | 24.85 | | | $ | 24.71 | |
|
Total Return | | | 0.57 | % | | | 5.77 | % | | | 2.52 | % | | | 1.95 | % | | | 3.21 | % | | | 3.43 | % |
Ratios/Supplemental Data |
Net assets, end of period (in thousands) | | $ | 3,911,448 | | | $ | 2,911,309 | | | $ | 2,421,315 | | | $ | 2,629,316 | | | $ | 1,637,509 | | | $ | 476,591 | |
Ratios to average net assets: |
Net investment income (loss) | | | 1.58 | % | | | 1.85 | % | | | 2.43 | % | | | 2.35 | % | | | 2.36 | % | | | 2.97 | % |
Total expensese | | | 0.56 | % | | | 0.59 | % | | | 0.57 | % | | | 0.56 | % | | | 0.61 | % | | | 0.67 | % |
Net expensesf,g,h | | | 0.49 | % | | | 0.52 | % | | | 0.50 | % | | | 0.50 | % | | | 0.56 | % | | | 0.58 | % |
Portfolio turnover rate | | | 27 | % | | | 123 | % | | | 72 | % | | | 45 | % | | | 55 | % | | | 39 | % |
SEE NOTES TO FINANCIAL STATEMENTS. | THE GUGGENHEIM FUNDS SEMI-ANNUAL REPORT | 37 |
FINANCIAL HIGHLIGHTS (concluded) |
This table is presented to show selected data for a share outstanding throughout each period and to assist shareholders in evaluating a Fund’s performance for the periods presented.
R6-Class | | Six Months Ended
March 31, 2021a | | | Year Ended
September 30,
2020 | | | Period Ended
September 30,
2019i | |
Per Share Data |
Net asset value, beginning of period | | $ | 25.55 | | | $ | 24.66 | | | $ | 24.58 | |
Income (loss) from investment operations: |
Net investment income (loss)b | | | .20 | | | | .48 | | | | .31 | |
Net gain (loss) on investments (realized and unrealized) | | | (.05 | ) | | | .93 | | | | .14 | |
Total from investment operations | | | .15 | | | | 1.41 | | | | .45 | |
Less distributions from: |
Net investment income | | | (.23 | ) | | | (.52 | ) | | | (.37 | ) |
Net realized gains | | | (.12 | ) | | �� | — | | | | — | |
Total distributions | | | (.35 | ) | | | (.52 | ) | | | (.37 | ) |
Net asset value, end of period | | $ | 25.35 | | | $ | 25.55 | | | $ | 24.66 | |
|
Total Return | | | 0.57 | % | | | 5.78 | % | | | 1.83 | % |
Ratios/Supplemental Data |
Net assets, end of period (in thousands) | | $ | 37,563 | | | $ | 31,315 | | | $ | 314,764 | |
Ratios to average net assets: |
Net investment income (loss) | | | 1.58 | % | | | 1.96 | % | | | 2.24 | % |
Total expensese | | | 0.50 | % | | | 0.53 | % | | | 0.51 | % |
Net expensesf,g,h | | | 0.49 | % | | | 0.52 | % | | | 0.50 | % |
Portfolio turnover rate | | | 27 | % | | | 123 | % | | | 72 | % |
a | Unaudited figures for the period ended March 31, 2021. Percentage amounts for the period, except total return and portfolio turnover rate, have been annualized. |
b | Net investment income (loss) per share was computed using average shares outstanding throughout the period. |
c | Distributions from realized gains are less than $0.01 per share. |
d | Total return does not reflect the impact of any applicable sales charges. |
e | Does not include expenses of the underlying funds in which the Fund invests. |
f | Net expense information reflects the expense ratios after expense waivers and reimbursements, as applicable. |
g | The portion of the ratios of net expenses to average net assets attributable to recoupments of prior fee reductions or expense reimbursements for the periods presented was as follows: |
| | | 03/31/21a | 09/30/20 | 09/30/19 | 09/30/18 | 09/30/17 |
| | A-Class | — | 0.00%* | 0.00%* | — | — |
| | C-Class | — | 0.00%* | — | — | 0.00%* |
| | P-Class | — | 0.00%* | 0.00%* | — | 0.00%* |
| | Institutional Class | — | 0.00%* | 0.00%* | — | — |
| | R6-Class | 0.01% | 0.00%* | 0.00%* | — | — |
h | Net expenses may include expenses that are excluded from the expense limitation agreement. Excluding these expenses, the net expense ratios for the periods presented would be: |
| | | 03/31/21a | 09/30/20 | 09/30/19 | 09/30/18 | 09/30/17 | 09/30/16 |
| | A-Class | 0.74% | 0.75% | 0.75% | 0.75% | 0.79% | 0.80% |
| | C-Class | 1.48% | 1.50% | 1.50% | 1.50% | 1.54% | 1.55% |
| | P-Class | 0.74% | 0.75% | 0.75% | 0.75% | 0.79% | 0.80% |
| | Institutional Class | 0.49% | 0.50% | 0.50% | 0.50% | 0.54% | 0.55% |
| | R6-Class | 0.49% | 0.50% | 0.50% | N/A | N/A | N/A |
i | Since commencement of operations: March 13, 2019. Percentage amounts for the period, except total return and portfolio turnover rate, have been annualized. |
38 | THE GUGGENHEIM FUNDS SEMI-ANNUAL REPORT | SEE NOTES TO FINANCIAL STATEMENTS. |
NOTES TO FINANCIAL STATEMENTS (Unaudited) |
Note 1 – Organization and Significant Accounting Policies
Organization
Guggenheim Funds Trust (the “Trust”), a Delaware statutory trust, is registered with the SEC under the Investment Company Act of 1940 (“1940 Act”), as an open-ended investment company of the series type. Each series, in effect, is representing a separate fund. The Trust may issue an unlimited number of authorized shares. The Trust accounts for the assets of each fund separately.
The Trust offers a combination of five separate classes of shares: A-Class shares, C-Class shares, P-Class shares, R6-Class shares and Institutional Class shares. Sales of shares of each Class are made without a front-end sales charge at the net asset value per share (“NAV”), with the exception of A-Class shares. A-Class shares are sold at the NAV, plus the applicable front-end sales charge. The sales charge varies depending on the amount purchased. A-Class share purchases of $1 million or more are exempt from the front-end sales charge but have a 1% contingent deferred sales charge (“CDSC”), if shares are redeemed within 12 months of purchase. C-Class shares have a 1% CDSC if shares are redeemed within 12 months of purchase. C-Class shares automatically convert to A-Class shares on or about the 10th day of the month following the 10-year anniversary of the purchase of the C-Class shares. This conversion will be executed without any sales charge, fee or other charge. After the conversion is completed, the shares will be subject to all features and expenses of A-Class shares. Institutional Class shares are offered primarily for direct investment by institutions such as pension and profit sharing plans, endowments, foundations and corporations. Institutional Class shares require a minimum initial investment of $2 million and a minimum account balance of $1 million. R6-Class shares are offered primarily through qualified retirement and benefit plans. R6-Class shares are also offered through certain other plans and platforms sponsored by financial intermediaries. Certain institutional investors and others deemed appropriate by Guggenheim Investments (“GI”) may also be eligible to purchase R6-Class shares subject to a $2 million minimum initial investment. At March 31, 2021, the Trust consisted of nineteen funds (the “Funds”).
This report covers the Limited Duration Fund (the “Fund”), a diversified investment company. At March 31, 2021, A-Class, C-Class, P-Class, Institutional Class and R6-Class shares have been issued by the Fund.
Guggenheim Partners Investment Management, LLC (“GPIM”), which operates under the name Guggenheim Investments, provides advisory services. Guggenheim Funds Distributors, LLC (“GFD”) acts as principal underwriter for the Trust. GI and GFD are affiliated entities.
Significant Accounting Policies
The Fund operates as an investment company and, accordingly, follows the investment company accounting and reporting guidance of the Financial Accounting Standards Board (“FASB”) Accounting Standards Codification Topic 946 Financial Services – Investment Companies.
The following significant accounting policies are in conformity with U.S. generally accepted accounting principles (“U.S. GAAP”) and are consistently followed by the Trust. This requires management to make estimates and assumptions that affect the reported amount of assets and liabilities, contingent assets and liabilities at the date of the financial statements, and the reported amounts of revenues and expenses during the reporting period. Actual results could differ from these estimates. All time references are based on Eastern Time.
The NAV of each Class of the Fund is calculated by dividing the market value of the Fund’s securities and other assets, less all liabilities, attributable to the Class by the number of outstanding shares of the Class.
(a) Valuation of Investments
The Board of Trustees of the Fund (the “Board”) has adopted policies and procedures for the valuation of the Fund’s investments (the “Valuation Procedures”). Pursuant to the Valuation Procedures, the Board has delegated to a valuation committee, consisting of representatives from Guggenheim’s investment management, fund administration, legal and compliance departments (the “Valuation Committee”), the day-to-day responsibility for implementing the Valuation Procedures, including, under most circumstances, the responsibility for determining the fair value of the Fund’s securities and/or other assets.
Valuations of the Fund’s securities and other assets are supplied primarily by pricing services appointed pursuant to the processes set forth in the Valuation Procedures. The Valuation Committee convenes monthly, or more frequently as needed, to review the valuation of all assets which have been fair valued for reasonableness. The Fund’s officers, through the Valuation Committee and consistent with the monitoring and review responsibilities set forth in the Valuation Procedures, regularly review procedures used and valuations provided by the pricing services.
If the pricing service cannot or does not provide a valuation for a particular investment or such valuation is deemed unreliable, such investment is fair valued by the Valuation Committee.
| | THE GUGGENHEIM FUNDS SEMI-ANNUAL REPORT | 39 |
NOTES TO FINANCIAL STATEMENTS (Unaudited)(continued) |
Generally, trading in foreign securities markets is substantially completed each day at various times prior to the close of the New York Stock Exchange (“NYSE”). The values of foreign securities are determined as of the close of such foreign markets or the close of the NYSE, if earlier. All investments quoted in foreign currencies are valued in U.S. dollars on the basis of the foreign currency exchange rates prevailing at the close of U.S. business at 4:00 p.m. Investments in foreign securities may involve risks not present in domestic investments. The Valuation Committee will determine the current value of such foreign securities by taking into consideration certain factors which may include those discussed above, as well as the following factors, among others: the value of the securities traded on other foreign markets, ADR trading, closed-end fund trading, foreign currency exchange activity, and the trading prices of financial products that are tied to foreign securities. In addition, under the Valuation Procedures, the Valuation Committee and GI are authorized to use prices and other information supplied by a third party pricing vendor in valuing foreign securities.
Open-end investment companies are valued at their NAV as of the close of business, on the valuation date. Exchange-traded funds are valued at the last quoted sale price.
U.S. Government securities are valued by independent pricing services, the last traded fill price, or at the reported bid price at the close of business.
Repurchase agreements are generally valued at amortized cost, provided such amounts approximate market value
Debt securities with a maturity of greater than 60 days at acquisition are valued at prices that reflect broker-dealer supplied valuations or are obtained from independent pricing services, which may consider the trade activity, treasury spreads, yields or price of bonds of comparable quality, coupon, maturity, and type, as well as prices quoted by dealers who make markets in such securities. Short-term debt securities with a maturity of 60 days or less at acquisition are valued at amortized cost, provided such amount approximates market value.
Typically, loans are valued using information provided by an independent third party pricing service that uses broker quotes, among other inputs. If the pricing service cannot or does not provide a valuation for a particular loan, or such valuation is deemed unreliable, such investment is valued based on a quote from a broker-dealer or is fair valued by the Valuation Committee.
Exchange-traded options are valued at the mean of the bid and ask prices on the principal exchange on which they are traded. Over-the-counter (“OTC”) options are valued using a price provided by a pricing service.
The value of interest rate swap agreements entered into by the Fund is accounted for using the unrealized appreciation or depreciation on the agreements that is determined using the previous day’s Chicago Mercantile Exchange close price, adjusted for the current day’s spreads.
The values of other swap agreements entered into by the Fund are accounted for using the unrealized appreciation or depreciation on the agreements that are determined by marking the agreements to the last quoted value of the index or other underlying position that the swaps pertain to at the close of the NYSE.
Forward foreign currency exchange contracts are valued daily based on the applicable exchange rate of the underlying currency.
Investments for which market quotations are not readily available are fair-valued as determined in good faith by GI, subject to review and approval by the Valuation Committee, pursuant to methods established or ratified by the Board. Valuations in accordance with these methods are intended to reflect each security’s (or asset’s or liability’s) “fair value”. Each such determination is based on a consideration of all relevant factors, which are likely to vary from one pricing context to another. Examples of such factors may include, but are not limited to market prices; sale prices; broker quotes; and models which derive prices based on inputs such as prices of securities with comparable maturities and characteristics, or based on inputs such as anticipated cash flows or collateral, spread over U.S. Treasury securities, and other information analysis.
In connection with futures contracts and other derivative investments, such factors may include obtaining information as to how (a) these contracts and other derivative investments trade in the futures or other derivative markets, respectively, and (b) the securities underlying these contracts and other derivative investments trade in the cash market.
(b) U.S. Government and Agency Obligations
Certain U.S. Government and Agency Obligations are traded on a discount basis; the interest rates shown on the Schedule of Investments reflect the effective rates paid at the time of purchase by the Fund. Other securities bear interest at the rates shown, payable at fixed dates through maturity.
(c) Senior Floating Rate Interests and Loan Investments
Senior floating rate interests in which the Fund invests generally pay interest rates which are periodically adjusted by reference to a base short-term floating rate, plus a premium. These base lending rates are generally (i) the lending rate offered by one or more major European banks, such as the one-month or three-month London Inter-Bank Offered Rate (“LIBOR”), (ii) the prime rate offered by one or more major United States banks, or (iii)
40 | THE GUGGENHEIM FUNDS SEMI-ANNUAL REPORT | |
NOTES TO FINANCIAL STATEMENTS (Unaudited)(continued) |
the bank’s certificate of deposit rate. Senior floating rate interests often require prepayments from excess cash flows or permit the borrower to repay at its election. The rate at which the borrower repays cannot be predicted with accuracy. As a result, the actual remaining maturity may be substantially less than the stated maturities disclosed in the Fund’s Schedule of Investments.
The Fund invests in loans and other similar debt obligations (“obligations”). A portion of the Fund’s investments in these obligations is sometimes referred to as “covenant lite” loans or obligations (“covenant lite obligations”), which are obligations that lack covenants or possess fewer or less restrictive covenants or constraints on borrowers than certain other types of obligations. The Fund may also obtain exposure to covenant lite obligations through investment in securitization vehicles and other structured products. In recent market conditions, many new or reissued obligations have not featured traditional covenants, which are intended to protect lenders and investors by (i) imposing certain restrictions or other limitations on a borrower’s operations or assets or (ii) providing certain rights to lenders. The Fund may have fewer rights with respect to covenant lite obligations, including fewer protections against the possibility of default and fewer remedies in the event of default. As a result, investments in (or exposure to) covenant lite obligations are subject to more risk than investments in (or exposure to) certain other types of obligations. The Fund is subject to other risks associated with investments in (or exposure to) obligations, including that obligations may not be considered “securities” and, as a result, the Fund may not be entitled to rely on the anti-fraud protections under the federal securities laws and instead may have to resort to state law and direct claims.
(d) Interest on When-Issued Securities
The Fund may purchase and sell interests in securities on a when-issued and delayed delivery basis, with payment and delivery scheduled for a future date. No income accrues to the Fund on such interests or securities in connection with such transactions prior to the date the Fund actually takes delivery of such interests or securities. These transactions are subject to market fluctuations and are subject to the risk that the value at delivery may be more or less than the trade date purchase price. Although the Fund will generally purchase these securities with the intention of acquiring such securities, it may sell such securities before the settlement date.
(e) Options
Upon the purchase of an option, the premium paid is recorded as an investment, the value of which is marked-to-market daily. If a purchased option expires, the Fund realizes a loss in the amount of the cost of the option. When the Fund enters into a closing sale transaction, it realizes a gain or loss depending on whether the proceeds from the closing sale transaction are greater or less than the cost of the option. If the Fund exercises a put option, it realizes a gain or loss from the sale of the underlying security and the proceeds from such sale will be decreased by the premium originally paid. When the Fund exercises a call option, the cost of the security purchased by the Fund upon exercise increases by the premium originally paid.
When the Fund writes (sells) an option, an amount equal to the premium received is entered in that Fund’s accounting records as an asset and equivalent liability. The amount of the liability is subsequently marked-to-market to reflect the current value of the option written. When a written option expires, or if the Fund enters into a closing purchase transaction, it realizes a gain (or loss if the cost of a closing purchase transaction exceeds the premium received when the option was sold).
(f) Swap Agreements
Swap agreements are marked-to-market daily and the change, if any, is recorded as unrealized appreciation or depreciation. Payments received or made as a result of an agreement or termination of an agreement are recognized as realized gains or losses.
Upon entering into certain centrally-cleared swap transactions, a Fund is required to deposit with its clearing broker an amount of cash or securities as an initial margin. Subsequent variation margin receipts or payments are received or made by the Fund depending on fluctuations in the fair value of the reference entity and are recorded by the Fund as unrealized appreciation or depreciation. When the contract is closed, the Fund records a realized gain or loss equal to the difference between the value of the contract at the time it was opened and the value at the time it was closed.
Upfront payments received or made by a Fund on credit default swap agreements and interest rate swap agreements are amortized over the expected life of the agreement. Periodic payments received or paid by a Fund are recorded as realized gains or losses. Payments received or made as a result of a credit event or termination of the contract are recognized, net of a proportional amount of the upfront payment, as realized gains or losses.
(g) Currency Translations
The accounting records of the Fund are maintained in U.S. dollars. All assets and liabilities initially expressed in foreign currencies are converted into U.S. dollars at prevailing exchange rates. Purchases and sales of investment securities, dividend and interest income, and certain expenses are translated at the rates of exchange prevailing on the respective dates of such transactions. Changes in the relationship of these foreign currencies to the U.S. dollar can significantly affect the value of the investments and earnings of the Fund. Foreign investments may also subject the Fund to foreign
| | THE GUGGENHEIM FUNDS SEMI-ANNUAL REPORT | 41 |
NOTES TO FINANCIAL STATEMENTS (Unaudited)(continued) |
government exchange restrictions, expropriation, taxation, or other political, social or economic developments, all of which could affect the market and/or credit risk of the investments.
The Fund does not isolate that portion of the results of operations resulting from changes in the foreign exchange rates on investments from the fluctuations arising from changes in the market prices of securities held. Such fluctuations are included with the net realized gain or loss and unrealized appreciation or depreciation on investments.
Reported net realized foreign exchange gains and losses arise from sales of foreign currencies and currency gains or losses realized between the trade and settlement dates on investment transactions. Net unrealized appreciation and depreciation arise from changes in the fair values of assets and liabilities other than investments in securities at the fiscal period end, resulting from changes in exchange rates.
(h) Forward Foreign Currency Exchange Contracts
The change in value of a forward foreign currency exchange contract is recorded as unrealized appreciation or depreciation until the contract is closed. When the contract is closed, the Fund records a realized gain or loss equal to the difference between the value at the time the contract was opened and the value at the time it was closed.
(i) Foreign Taxes
The Fund may be subject to foreign taxes (a portion of which may be reclaimable) on income, stock dividends, capital gains on investments or certain foreign currency transactions. All foreign taxes are recorded in accordance with the applicable foreign tax regulations and rates that exist in the foreign jurisdictions in which the Fund invests. These foreign taxes, if any, are paid by the Fund and reflected in its Statement of Operations as follows: foreign taxes withheld at source are presented as a reduction of income and foreign taxes on capital gains from sales of investments are included with the net realized gain (loss) on investments. Foreign taxes payable or deferred as of March 31, 2021, if any, are disclosed in the Fund’s Statement of Assets and Liabilities.
(j) Security Transactions
Security transactions are recorded on the trade date for financial reporting purposes. Realized gains and losses from securities transactions are recorded using the identified cost basis. Proceeds from lawsuits related to investment holdings are recorded as a reduction to cost if the securities are still held and as realized gains if no longer held in the Fund. Dividend income is recorded on the ex-dividend date, net of applicable taxes withheld by foreign countries, if any. Taxable non-cash dividends are recorded as dividend income. Interest income, including amortization of premiums and accretion of discounts, is accrued on a daily basis. Interest income also includes paydown gains and losses on mortgage-backed and asset-backed securities and senior and subordinated loans. Amendment fees are earned as compensation for evaluating and accepting changes to the original loan agreement and are recognized when received. Dividend income from Real Estate Investment Trusts (“REITs”) is recorded based on the income included in the distributions received from the REIT investments using published REIT classifications, including some management estimates when actual amounts are not available. Distributions received in excess of this estimated amount are recorded as a reduction of the cost of investments or reclassified to realized gains. The actual amounts of income, return of capital, and realized gains are only determined by each REIT after its fiscal year-end, and may differ from the estimated amounts.
Income from residual collateralized loan obligations is recognized using the effective interest method. At the time of purchase, management estimates the future expected cash flows and determines the effective yield and estimated maturity date based on the estimated cash flows. Subsequent to the purchase, the estimated cash flows are updated periodically and a revised yield is calculated prospectively.
The Fund may receive other income from investments in senior loan interests including amendment fees, consent fees and commitment fees. For funded loans, these fees are recorded as income when received by the Fund and included in interest income on the Statement of Operations. For unfunded loans, commitment fees are included in realized gain on investments on the Statement of Operations at the end of the commitment period.
(k) Distributions
The Fund declares dividends from investment income daily. The Fund pays its shareholders from its net investment income monthly and distributes any net capital gains that it has realized, at least annually. Distributions to shareholders are recorded on the ex-dividend date. Dividends are reinvested in additional shares, unless shareholders request payment in cash. The character of distributions made during the year from net investment income or net realized gains may differ from their ultimate characterization for U.S. federal income tax purposes.
(l) Class Allocations
Interest and dividend income, most expenses, all realized gains and losses, and all unrealized appreciation and depreciation are allocated to the classes based upon the value of the outstanding shares in each Class. Certain costs, such as distribution and service fees are charged directly to specific classes. In addition, certain expenses have been allocated to the individual Funds in the Trust based on the respective net assets of each Fund included in the Trust.
42 | THE GUGGENHEIM FUNDS SEMI-ANNUAL REPORT | |
NOTES TO FINANCIAL STATEMENTS (Unaudited)(continued) |
(m) Earnings Credits
Under the fee arrangement with the custodian, the Fund may earn credits based on overnight custody cash balances. These credits are utilized to reduce related custodial expenses. The custodian fees disclosed in the Statement of Operations are before the reduction in expense from the related earnings credits, if any. Earnings credits for the period ended March 31, 2021, are disclosed in the Statement of Operations.
(n) Cash
The Fund may leave cash overnight in its cash account with the custodian. Periodically, the Fund may have cash due to the custodian bank as an overdraft balance. A fee is incurred on this overdraft, calculated by multiplying the overdraft by a rate based on the federal funds rate, which was 0.06% at March 31, 2021.
(o) Indemnifications
Under the Fund’s organizational documents, its Trustees and Officers are indemnified against certain liabilities arising out of the performance of their duties to the Trust. In addition, throughout the normal course of business, the Fund enters into contracts that contain a variety of representations and warranties which provide general indemnifications. The Fund’s maximum exposure under these arrangements is unknown, as this would involve future claims that may be made against the Fund and/or its affiliates that have not yet occurred. However, based on experience, the Fund expects the risk of loss to be remote.
Note 2 – Derivatives
As part of its investment strategy, the Fund utilizes a variety of derivative instruments. These investments involve, to varying degrees, elements of market risk and risks in excess of amounts recognized on the Statement of Assets and Liabilities. Valuation and accounting treatment of these instruments can be found under Significant Accounting Policies in Note 1 of these Notes to Financial Statements.
Derivatives are instruments whose values depend on, or are derived from, in whole or in part, the value of one or more other assets, such as securities, currencies, commodities or indices. Derivative instruments may be used to increase investment flexibility (including to maintain cash reserves while maintaining exposure to certain other assets), for risk management (hedging) purposes, to facilitate trading, to reduce transaction costs and to pursue higher investment returns. Derivative instruments may also be used to mitigate certain investment risks, such as foreign currency exchange rate risk, interest rate risk and credit risk. U.S. GAAP requires disclosures to enable investors to better understand how and why a Fund uses derivative instruments, how these derivative instruments are accounted for and their effects on the Fund’s financial position and results of operations.
The Fund utilized derivatives for the following purposes:
Duration: the use of an instrument to manage the interest rate risk of a portfolio.
Hedge: an investment made in order to reduce the risk of adverse price movements in a security, by taking an offsetting position to protect against broad market moves.
Income: the use of any instrument that distributes cash flows typically based upon some rate of interest.
Index Exposure: the use of an instrument to obtain exposure to a listed or other type of index.
Speculation: the use of an instrument to express macro-economic and other investment views.
Options Purchased
A call option on a security gives the purchaser of the option the right to buy, and the writer of a call option the obligation to sell, the underlying security. The purchaser of a put option has the right to sell, and the writer of the put option the obligation to buy, the underlying security at any time during the option period. The risk associated with purchasing options is limited to the premium originally paid.
| | THE GUGGENHEIM FUNDS SEMI-ANNUAL REPORT | 43 |
NOTES TO FINANCIAL STATEMENTS (Unaudited)(continued) |
The following table represents the Fund’s use and volume of call/put options purchased on a monthly basis:
| | | Average Number Amount | |
Use | | Call | | | Put | |
Hedge | | $ | 1,047,766,667 | | | $ | — | |
Swap Agreements
A swap is an agreement that obligates two parties to exchange a series of cash flows at specified intervals based upon or calculated by reference to changes in specified prices or rates for a specified amount of an underlying asset. When utilizing OTC swaps, the Fund bears the risk of loss of the amount expected to be received under a swap agreement in the event of the default or bankruptcy of a swap agreement counterparty or if the underlying asset declines in value. Certain standardized swaps are subject to mandatory central clearing and are executed on a multi-lateral or other trade facility platform, such as a registered exchange. There is limited counterparty credit risk with respect to centrally-cleared swaps as the transaction is facilitated through a central clearinghouse, much like exchange-traded futures contracts. For a Fund utilizing centrally-cleared swaps, the exchange bears the risk of loss resulting from a counterparty not being able to pay. There is no guarantee that a fund or an underlying fund could eliminate its exposure under an outstanding swap agreement by entering into an offsetting swap agreement with the same or another party.
Total return swaps involve commitments where single or multiple cash flows are exchanged based on the price of an underlying reference asset (such as an index) for a fixed or variable interest rate. Total return swaps will usually be computed based on the current value of the reference asset as of the close of regular trading on the NYSE or other exchange, with the swap value being adjusted to include dividends accrued, financing charges and/or interest associated with the swap agreement. When utilizing total return swaps, the Fund bears the risk of loss of the amount expected to be received under a swap agreement in the event of the default or bankruptcy of a swap agreement counterparty or if the underlying reference asset declines in value.
The following table represents the Fund’s use and volume of total return swaps on a monthly basis:
| | | Average Notional Amount | |
Use | | Long | | | Short | |
Index exposure, Income, Speculation | | $ | 6,268,814 | | | $ | 215,516,159 | |
Interest rate swaps involve the exchange by the Fund with another party for its respective commitment to pay or receive a fixed or variable interest rate on a notional amount of principal. Interest rate swaps are generally centrally-cleared, but central clearing does not make interest rate swap transactions risk free.
The following table represents the Fund’s use and volume of interest rate swaps on a monthly basis:
| | | Average Notional Amount | |
Use | | Pay Floating Rate | | | Receive Floating Rate | |
Duration, Hedge | | $ | 605,355,000 | | | $ | 23,333,333 | |
Credit default swaps are instruments which allow for the full or partial transfer of third party credit risk, with respect to a particular entity or entities, from one counterparty to the other. The Fund enters into credit default swaps as a “seller” or “buyer” of protection primarily to gain or reduce exposure to the investment grade and/or high yield bond market. A seller of credit default swaps is selling credit protection or assuming credit risk with respect to the underlying entity or entities. The buyer in a credit default swap is obligated to pay the seller a periodic stream of payments over the term of the contract provided that no event of default on an underlying reference obligation has occurred. If a credit event occurs, as defined under the terms of the swap agreement, the seller will either (i) pay to the buyer of protection an amount equal to the notional amount of the swap and take delivery of the referenced obligation or underlying securities comprising the referenced index or (ii) pay a net settlement amount in the form of cash or securities equal to the notional amount of the swap less the recovery value of the referenced obligation or underlying securities comprising the referenced index. The notional amount reflects the maximum potential amount the seller of credit protection could be required to pay to the buyer if a credit event occurs. The seller of protection receives periodic premium payments from
44 | THE GUGGENHEIM FUNDS SEMI-ANNUAL REPORT | |
NOTES TO FINANCIAL STATEMENTS (Unaudited)(continued) |
the buyer and may also receive or pay an upfront premium adjustment to the stated periodic payments. In the event a credit default occurs on a credit default swap referencing an index, a factor adjustment will take place and the buyer of protection will receive a payment reflecting the par less the default recovery rate of the defaulted index component based on its weighting in the index. If no default occurs, the counterparty will pay the stream of payments and have no further obligations to the fund selling the credit protection. For a fund utilizing centrally cleared credit default swaps, the exchange bears the risk of loss resulting from a counterparty not being able to pay. For OTC credit default swaps, a fund bears the risk of loss of the amount expected to be received under a swap agreement in the event of the default or bankruptcy of a swap agreement counterparty, or in the case of a credit default swap in which a fund is selling credit protection, the default of a third party issuer.
The quoted market prices and resulting market values for credit default swap agreements on securities and credit indices serve as an indicator of the current status of the payment/performance risk and represent the likelihood of an expected liability (or profit) for the credit derivative had the notional amount of the swap agreement been closed/sold as of the period end. Increasing market values, in absolute terms when compared to the notional amount of the swap, represent a deterioration of the referenced entity’s credit soundness and a greater likelihood or risk of default or other credit event occurring as defined under the terms of the agreement.
The following table represents the Fund’s use and volume of credit default swaps on a monthly basis:
| | | Average Notional Amount | |
Use | | Protection Purchased | | | Protection Sold | |
Index exposure, Speculation | | $ | — | | | $ | 5,300,000 | |
Forward Foreign Currency Exchange Contracts
A forward foreign currency exchange contract is an agreement between two parties to exchange two designated currencies at a specific time in the future. Certain types of contracts may be cash settled, in an amount equal to the change in exchange rates during the term of the contract. The contracts can be used to hedge or manage exposure to foreign currency risks with portfolio investments or to gain exposure to foreign currencies.
The market value of a forward foreign currency exchange contract changes with fluctuations in foreign currency exchange rates. Furthermore, the Fund may be exposed to risk if the counterparties cannot meet the contract terms or if the currency value changes unfavorably as compared to the U.S. dollar.
The following table represents the Fund’s use and volume of forward foreign currency exchange contracts on a monthly basis:
| | | Average Value | |
Use | | Purchased | | | Sold | |
Hedge, Income | | $ | 302,194,262 | | | $ | 832,067,502 | |
Derivative Investment Holdings Categorized by Risk Exposure
The following is a summary of the location of derivative investments on the Fund’s Statement of Assets and Liabilities as of March 31, 2021:
Derivative Investment Type | Asset Derivatives | Liability Derivatives |
Interest contracts | Unamortized upfront premiums paid on interest rate swap agreements Unrealized appreciation on OTC swap agreements Variation margin on interest rate swaps agreements Investments in unaffiliated issuers, at value | |
Credit contracts | | Variation margin on credit default swap agreements Unrealized depreciation on OTC swap agreements |
Currency contracts | Unrealized appreciation on forward foreign currency exchange contracts | Unrealized depreciation on forward foreign currency exchange contracts |
| | THE GUGGENHEIM FUNDS SEMI-ANNUAL REPORT | 45 |
NOTES TO FINANCIAL STATEMENTS (Unaudited)(continued) |
The following tables set forth the fair value of the Fund’s derivative investments categorized by primary risk exposure at March 31, 2021:
Asset Derivative Investments Value | |
| | Swaps
Interest
Rate
Risk* | | | Swaps
Credit
Risk* | | | Options
Purchased
Interest
Rate
Risk | | | Forward
Foreign
Currency
Exchange
Risk | | | Total Value at
March 31,
2021 | |
| | | $ | 11,923,832 | | | $ | — | | | $ | 6,320,580 | | | $ | 36,450,602 | | | $ | 54,695,014 | |
Liability Derivative Investments Value | |
| | Swaps
Interest
Rate
Risk* | | | Swaps
Credit
Risk* | | | Options
Purchased
Interest
Rate
Risk | | | Forward
Foreign
Currency
Exchange
Risk | | | Total Value at
March 31,
2021 | |
| | | $ | — | | | $ | 25,336 | | | $ | — | | | $ | 8,769,446 | | | $ | 8,794,782 | |
* | Includes cumulative appreciation (depreciation) of exchange-traded, OTC and centrally-cleared derivatives contracts as reported on the Schedules of Investments. For exchange-traded and centrally-cleared derivatives, variation margin is reported within the Statements of Assets and Liabilities. |
The following is a summary of the location of derivative investments on the Fund’s Statement of Operations for the period ended March 31, 2021:
Derivative Investment Type | Location of Gain (Loss) on Derivatives |
Interest rate/Credit contracts | Net realized gain (loss) on swap agreements Net change in unrealized appreciation (depreciation) on swap agreements |
Interest rate contracts | Net realized gain (loss) on options purchased Net change in unrealized appreciation (depreciation) on options purchased |
Currency contracts | Net realized gain (loss) on forward foreign currency exchange contracts Net change in unrealized appreciation (depreciation) on forward foreign currency exchange contracts |
The following is a summary of the Fund’s realized gain (loss) and change in unrealized appreciation (depreciation) on derivative investments recognized on the Statement of Operations categorized by primary risk exposure for the period ended March 31, 2021:
Realized Gain (Loss) on Derivative Investments Recognized on the Statement of Operations | |
| | Swaps
Interest
Rate
Risk | | | Swaps
Credit
Risk | | | Options
Purchased
Interest
Rate
Risk | | | Forward
Foreign
Currency
Exchange
Risk | | | Total | |
| | | $ | 1,592,040 | | | $ | 487,045 | | | $ | 2,749,258 | | | $ | (16,527,521 | ) | | $ | (11,699,178 | ) |
Change in Unrealized Appreciation (Depreciation) on Derivative Investments Recognized on the Statement of Operations | |
| | Swaps
Interest
Rate
Risk | | | Swaps
Credit
Risk | | | Options
Purchased
Interest
Rate
Risk | | | Forward
Foreign
Currency
Exchange
Risk | | | Total | |
| | | $ | 1,493,792 | | | $ | (20,524 | ) | | $ | 3,346,761 | | | $ | 9,585,001 | | | $ | 14,405,030 | |
46 | THE GUGGENHEIM FUNDS SEMI-ANNUAL REPORT | |
NOTES TO FINANCIAL STATEMENTS (Unaudited)(continued) |
In conjunction with the use of derivative instruments, the Fund is required to maintain collateral in various forms. Depending on the financial instrument utilized and the broker involved, the Fund uses margin deposits at the broker, cash and/or securities segregated at the custodian bank, discount notes or repurchase agreements allocated to the Fund as collateral.
Foreign Investments
There are several risks associated with exposure to foreign currencies, foreign issuers and emerging markets. A fund’s indirect and direct exposure to foreign currencies subjects the Fund to the risk that those currencies will decline in value relative to the U.S. dollar, or in the case of short positions, that the U.S. dollar will decline in value relative to the currency being hedged. Currency rates in foreign countries may fluctuate significantly over short periods of time for a number of reasons, including changes in interest rates and the imposition of currency controls or other political developments in the U.S. or abroad. In addition, the Fund may incur transaction costs in connection with conversions between various currencies. The Fund may, but is not obligated to, engage in currency hedging transactions, which generally involve buying currency forward, options or futures contracts. However, not all currency risks may be effectively hedged, and in some cases the costs of hedging techniques may outweigh expected benefits. In such instances, the value of securities denominated in foreign currencies can change significantly when foreign currencies strengthen or weaken relative to the U.S. dollar.
The Fund may invest in securities of foreign companies directly, or in financial instruments, such as ADRs and exchange-traded funds, which are indirectly linked to the performance of foreign issuers. Foreign markets can be more volatile than the U.S. market due to increased risks of adverse issuer, political, regulatory, market, or economic developments and can perform differently from the U.S. market. Investing in securities of foreign companies directly, or in financial instruments that are indirectly linked to the performance of foreign issuers, may involve risks not typically associated with investing in U.S. issuers. The value of securities denominated in foreign currencies, and of dividends from such securities, can change significantly when foreign currencies strengthen or weaken relative to the U.S. dollar. Foreign securities markets generally have less trading volume and less liquidity than U.S. markets, and prices in some foreign markets may fluctuate more than those of securities traded on U.S. markets. Many foreign countries lack accounting and disclosure standards comparable to those that apply to U.S. companies, and it may be more difficult to obtain reliable information regarding a foreign issuer’s financial condition and operations. Transaction costs and costs associated with custody services are generally higher for foreign securities than they are for U.S. securities. Some foreign governments levy withholding taxes against dividend and interest income. Although in some countries portions of these taxes are recoverable, the non-recovered portion will reduce the income received by the Fund.
The Trust has established counterparty credit guidelines and enters into transactions only with financial institutions of investment grade or better. The Trust monitors the counterparty credit risk.
Note 3 – Offsetting
In the normal course of business, the Fund enters into transactions subject to enforceable master netting arrangements or other similar arrangements. Generally, the right to offset in those agreements allows the Fund to counteract the exposure to a specific counterparty with collateral received from or delivered to that counterparty based on the terms of the arrangements. These arrangements provide for the right to liquidate upon the occurrence of an event of default, credit event upon merger or additional termination event.
In order to better define its contractual rights and to secure rights that will help the Fund mitigate its counterparty risk, the Fund may enter into an International Swaps and Derivatives Association, Inc. Master Agreement (“ISDA Master Agreement”) or similar agreement with its derivative contract counterparties. An ISDA Master Agreement is a bilateral agreement between a fund and a counterparty that governs OTC derivatives, including foreign exchange contracts, and typically contains, among other things, collateral posting terms and netting provisions in the event of a default and/or termination event. The provisions of the ISDA Master Agreement typically permit a single net payment in the event of a default (close-out netting) or similar event, including the bankruptcy or insolvency of the counterparty.
For derivatives traded under an ISDA Master Agreement, the collateral requirements are typically calculated by netting the mark-to-market amount for each transaction under such agreement and comparing that amount to the value of any collateral currently pledged by the Fund and the counterparty. For financial reporting purposes, cash collateral that has been pledged to cover obligations of the Fund and cash collateral received from the counterparty, if any, are reported separately on the Statement of Assets and Liabilities as segregated cash with broker/receivable for variation margin, or payable for swap settlement/variation margin. Cash and/or securities pledged or received as collateral by the Fund in connection with an OTC derivative subject to an ISDA Master Agreement generally may not be invested, sold or rehypothecated by the counterparty or the Fund, as applicable, absent an event of default under such agreement, in which case such collateral generally may be applied towards obligations due to and payable by such counterparty or the Fund, as applicable. Generally, the amount of collateral due from or to a
| | THE GUGGENHEIM FUNDS SEMI-ANNUAL REPORT | 47 |
NOTES TO FINANCIAL STATEMENTS (Unaudited)(continued) |
counterparty must exceed a minimum transfer amount threshold (e.g., $300,000) before a transfer is required to be made. To the extent amounts due to the Fund from its counterparties are not fully collateralized, contractually or otherwise, the Fund bears the risk of loss from counterparty nonperformance. The Fund attempts to mitigate counterparty risk by only entering into agreements with counterparties that it believes to be of good standing and by monitoring the financial stability of those counterparties.
For financial reporting purposes, the Fund does not offset derivative assets and derivative liabilities that are subject to netting arrangements in the Statement of Assets and Liabilities.
The following tables present derivative financial instruments and secured financing transactions that are subject to enforceable netting arrangements:
| | | | | | | | | | | | | | | Gross Amounts Not Offset
in the Statement of
Assets and Liabilities | | | | | |
Instrument | | Gross
Amounts of
Recognized
Assets1 | | | Gross
Amounts
Offset in the
Statement of
Assets and
Liabilities | | | Net Amount
of Assets
Presented on
the Statement
of Assets and
Liabilities | | | Financial
Instruments | | | Cash
Collateral
Received | | | Net
Amount | |
Fixed income index swap agreements | | $ | 5,360,870 | | | $ | — | | | $ | 5,360,870 | | | $ | — | | | $ | (5,080,000 | ) | | $ | 280,870 | |
Forward foreign currency exchange contracts | | | 36,450,602 | | | | — | | | | 36,450,602 | | | | (8,688,105 | ) | | | (21,387,541 | ) | | | 6,374,956 | |
Options purchased contracts | | | 6,320,580 | | | | — | | | | 6,320,580 | | | | (106,677 | ) | | | (6,042,180 | ) | | | 171,723 | |
| | | | | | | | | | | | | | | Gross Amounts Not Offset
in the Statement of
Assets and Liabilities | | | | | |
Instrument | | Gross
Amounts of
Recognized
Liabilities1 | | | Gross
Amounts
Offset in the
Statement of
Assets and
Liabilities | | | Net Amount
of Liabilities
Presented on
the Statement
of Assets and
Liabilities | | | Financial
Instruments | | | Cash
Collateral
Pledged | | | Net
Amount | |
Credit index swap agreements | | $ | 25,336 | | | $ | — | | | $ | 25,336 | | | $ | (25,336 | ) | | $ | — | | | $ | — | |
Forward foreign currency exchange contracts | | | 8,769,446 | | | | — | | | | 8,769,446 | | | | (8,769,446 | ) | | | — | | | | — | |
1 | Exchange-traded or centrally-cleared derivatives are excluded from these reported amounts. |
The Fund has the right to offset deposits against any related derivative liabilities outstanding with each counterparty with the exception of exchange-traded or centrally-cleared derivatives. The following table presents deposits held by others in connection with derivative investments as of March 31, 2021.
Counterparty | Asset Type | | Cash Pledged | | | Cash Received | |
Barclays Bank plc | Forward foreign currency exchange contracts | | $ | — | | | $ | 4,090,000 | |
BNP Paribas | Total return swap agreements | | | — | | | | 5,080,000 | |
BofA Securities, Inc. | Interest rate swap agreements | | | — | | | | 2,321,607 | |
BofA Securities, Inc. | Credit default swap agreements | | | — | | | | 74,218 | |
Citibank, N.A. | Forward foreign currency exchange contracts | | | — | | | | 5,011,566 | |
Goldman Sachs International | Forward foreign currency exchange contracts, Options | | | — | | | | 18,600,000 | |
JPMorgan Chase Bank, N.A. | Forward foreign currency exchange contracts | | | 580,000 | | | | — | |
Morgan Stanley Capital Services LLC | Forward foreign currency exchange contracts | | | — | | | | 2,520,000 | |
| | | | $ | 580,000 | | | $ | 37,697,391 | |
48 | THE GUGGENHEIM FUNDS SEMI-ANNUAL REPORT | |
NOTES TO FINANCIAL STATEMENTS (Unaudited)(continued) |
Note 4 – Fair Value Measurement
In accordance with U.S. GAAP, fair value is defined as the price that the Fund would receive to sell an investment or pay to transfer a liability in an orderly transaction with an independent buyer in the principal market, or in the absence of a principal market, the most advantageous market for the investment or liability. U.S. GAAP establishes a three-tier fair value hierarchy based on the types of inputs used to value assets and liabilities and requires corresponding disclosure. The hierarchy and the corresponding inputs are summarized below:
Level 1 — | quoted prices in active markets for identical assets or liabilities. |
Level 2 — | significant other observable inputs (for example quoted prices for securities that are similar based on characteristics such as interest rates, prepayment speeds, credit risk, etc.). |
Level 3 — | significant unobservable inputs based on the best information available under the circumstances, to the extent observable inputs are not available, which may include assumptions. |
The types of inputs available depend on a variety of factors, such as the type of security and the characteristics of the markets in which it trades, if any. Fair valuation determinations that rely on fewer or no observable inputs require greater judgment. Accordingly, fair value determinations for Level 3 securities require the greatest amount of judgment.
Independent pricing services are used to value a majority of the Fund’s investments. When values are not available from a pricing service, they will be determined using a variety of sources and techniques, including: market prices; broker quotes; and models which derive prices based on inputs such as prices of securities with comparable maturities and characteristics or based on inputs such as anticipated cash flows or collateral, spread over U.S. Treasury securities, and other information and analysis. A significant portion of the Fund’s assets and liabilities are categorized as Level 2, as indicated in this report. Quotes from broker-dealers, adjusted for fluctuations in criteria such as credit spreads and interest rates, may also be used to value the Fund’s assets and liabilities, i.e. prices provided by a broker-dealer or other market participant who has not committed to trade at that price. Although quotes are typically received from established market participants, the Fund may not have the transparency to view the underlying inputs which support the market quotations. Significant changes in a quote would generally result in significant changes in the fair value of the security. Certain fixed income securities are valued by obtaining a monthly quote from a broker-dealer, adjusted for fluctuations in criteria such as credit spreads and interest rates. Certain loans and other securities are valued using a single daily broker quote or a price from a third party vendor based on a single daily or monthly broker quote.
The inputs or methodologies used for valuing securities are not necessarily an indication of the risk associated with investing in those securities. The suitability of the techniques and sources employed to determine fair valuation are regularly monitored and subject to change.
Note 5 – Investment Advisory Agreement and Other Agreements
Under the terms of an investment advisory contract, the Fund pays GI investment advisory fees calculated at an annualized rate of 0.39% of the average daily net assets of the Fund.
GI pays operating expenses on behalf of the Trust, such as audit and accounting related services, legal services, custody, printing and mailing, among others, on a pass-through basis. Such expenses are allocated to various Funds within the complex based on relative net assets.
The Board has adopted Distribution Plans related to the offering of A-Class, C-Class and P-Class shares pursuant to Rule 12b-1 under the 1940 Act. The plans provide for payments at an annual rate of 0.25% of the average daily net assets of the Fund’s A-Class and P-Class shares, and 1.00% of the average daily net assets of the Fund’s C-Class shares.
| | THE GUGGENHEIM FUNDS SEMI-ANNUAL REPORT | 49 |
NOTES TO FINANCIAL STATEMENTS (Unaudited)(continued) |
The investment advisory contract for the Fund provides that the total expenses be limited to a percentage of average net assets for each class of shares, exclusive of brokerage costs, dividends or interest on securities sold short, expenses of other investment companies in which the Fund invests, interest, taxes, litigation, indemnification and extraordinary expenses. The limits are listed below:
| | Limit | | | Effective
Date | | | Contract
End Date | |
A-Class | | | 0.75 | % | | | 12/01/13 | | | | 02/01/22 | |
C-Class | | | 1.50 | % | | | 12/01/13 | | | | 02/01/22 | |
P-Class | | | 0.75 | % | | | 05/01/15 | | | | 02/01/22 | |
Institutional Class | | | 0.50 | % | | | 12/01/13 | | | | 02/01/22 | |
R6-Class | | | 0.50 | % | | | 03/13/19 | | | | 02/01/22 | |
GI is entitled to reimbursement by the Fund for fees waived or expenses reimbursed during any of the previous 36 months, beginning on the date of the expense limitation agreement, if on any day the estimated operating expenses are less than the indicated percentages. For purposes of this arrangement, GI is entitled to recoupment of previously waived fees or reimbursed expenses for 36 months from the date of the waiver or reimbursement by GI. At March 31, 2021, the amount of fees waived or expenses reimbursed that are subject to recoupment and will expire during the years ended September 30, are presented in the following table:
| | 2021 | | | 2022 | | | 2023 | | | 2024 | | | Fund
Total | |
A-Class | | $ | 266,850 | | | $ | 451,627 | | | $ | 360,600 | | | $ | 86,786 | | | $ | 1,165,863 | |
C-Class | | | 45,748 | | | | 78,366 | | | | 70,291 | | | | 38,818 | | | | 233,223 | |
P-Class | | | 160,386 | | | | 194,676 | | | | 124,505 | | | | 56,839 | | | | 536,406 | |
Institutional Class | | | 846,276 | | | | 1,856,165 | | | | 1,680,554 | | | | 1,109,723 | | | | 5,492,718 | |
R6-Class | | | — | | | | 8,114 | | | | 21,838 | | | | 358 | | | | 30,310 | |
For the period ended March 31, 2020, GI recouped $1,348 from the Fund.
If the Fund invests in a fund that is advised by the same adviser or an affiliated adviser, the investing Fund’s adviser has agreed to waive fees at the investing fund level to the extent necessary to offset the proportionate share of any management fee paid by the Fund with respect to its investment in such affiliated fund. Fee waivers will be calculated at the investing Fund level without regard to any expense cap, if any, in effect for the investing Fund. Fees waived under this arrangement are not subject to reimbursement to GI. For the period ended March 31, 2021, the Fund waived $36,205 related to investments in affiliated funds.
For the period ended March 31, 2021, GFD retained sales charges of $192,037 relating to sales of A-Class shares of the Trust.
Certain trustees and officers of the Trust are also officers of GI and/or GFD. The Trust does not compensate its officers or trustees who are officers, directors and/or employees of GI or GFD.
MUFG Investor Services (US), LLC (“MUIS”) acts as the Fund’s administrator, transfer agent and accounting agent. As administrator, transfer agent and accounting agent, MUIS maintains the books and records of the Fund’s securities and cash. The Bank of New York Mellon Corp. (“BNY”) acts as the Fund’s custodian. As custodian, BNY is responsible for the custody of the Fund’s assets. For providing the aforementioned administrative and accounting services, MUIS is entitled to receive a monthly fee equal to a percentage of the Fund’s average daily net assets and out of pocket expenses. For providing the aforementioned transfer agent and custodian services, MUIS and BNY are entitled to receive a monthly fee based on the number of transactions during the month and the number of accounts under management, subject to certain minimum monthly fees, and out of pocket expenses.
Note 6 – Federal Income Tax Information
The Fund intends to comply with the provisions of Subchapter M of the Internal Revenue Code applicable to regulated investment companies and will distribute substantially all taxable net investment income and capital gains sufficient to relieve the Fund from all, or substantially all, federal income, excise and state income taxes. Therefore, no provision for federal or state income tax or federal excise tax is required.
50 | THE GUGGENHEIM FUNDS SEMI-ANNUAL REPORT | |
NOTES TO FINANCIAL STATEMENTS (Unaudited)(continued) |
Tax positions taken or expected to be taken in the course of preparing the Fund’s tax returns are evaluated to determine whether the tax positions are “more-likely-than-not” of being sustained by the applicable tax authority. Tax positions not deemed to meet the more-likely-than-not threshold would be recorded as a tax benefit or expense in the current year. Management has analyzed the Fund’s tax positions taken, or to be taken, on U.S. federal income tax returns for all open tax years, and has concluded that no provision for income tax is required in the Fund’s financial statements. The Fund’s U.S. federal income tax returns are subject to examination by the Internal Revenue Service for a period of three years after they are filed.
At March 31, 2021, the cost of investments for U.S. federal income tax purposes, the aggregate gross unrealized appreciation for all investments for which there was an excess of value over tax cost, and the aggregate gross unrealized depreciation for all investments for which there was an excess of tax cost over value, were as follows:
| | Tax
Cost | | | Tax
Unrealized
Appreciation | | | Tax
Unrealized
Depreciation | | | Net Tax
Unrealized
Appreciation
(Depreciation) | |
| | | $ | 5,155,748,788 | | | $ | 109,797,435 | | | $ | (36,336,604 | ) | | $ | 73,460,831 | |
Note 7 – Securities Transactions
For the period ended March 31, 2021, the cost of purchases and proceeds from sales of investment securities, excluding government securities, short-term investments and derivatives, were as follows:
| | Purchases | | | Sales | |
| | $ | 2,015,628,582 | | | $ | 951,708,676 | |
The Fund is permitted to purchase or sell securities from or to certain affiliated funds under specified conditions outlined in procedures adopted by the Board. The procedures have been designed to ensure that any purchase or sale of securities by the Fund from or to another fund or portfolio that is or could be considered an affiliate by virtue of having a common investment adviser (or affiliated investment advisers), common trustees and/or common officers complies with Rule 17a-7 of the 1940 Act. Further, as defined under these procedures, each transaction is effected at the current market price to save costs, where permissible. For the period ended March 31, 2021, the Fund engaged in purchases and sales of securities, pursuant to Rule 17a-7 of the 1940 Act, as follows:
| | Purchases | | | Sales | | | Realized
Gain (Loss) | |
| | | $ | 132,452,498 | | | $ | — | | | $ | — | |
Note 8 – Unfunded Loan Commitments
Pursuant to the terms of certain loan agreements, the Fund held unfunded loan commitments as of March 31, 2021. The Fund is obligated to fund these loan commitments at the borrower’s discretion.
The unfunded loan commitments as of March 31, 2021, were as follows:
Borrower | | Maturity Date | | | Face Amount | | | Value | |
Peraton Corp. | | | 02/22/28 | | | $ | 4,176,731 | | | $ | 20,590 | |
Venture Global Calcasieu Pass LLC | | | 08/19/26 | | | | 877,216 | | | | 48,247 | |
WMG Acquisition Corp. | | | 01/20/28 | | | | 10,000,000 | | | | — | |
| | | | | | | $ | 15,053,947 | | | $ | 68,837 | |
| | THE GUGGENHEIM FUNDS SEMI-ANNUAL REPORT | 51 |
NOTES TO FINANCIAL STATEMENTS (Unaudited)(concluded) |
Note 9 – Restricted Securities
The securities below are considered illiquid and restricted under guidelines established by the Board:
Restricted Securities | | Acquisition Date | | | Cost | | | Value | |
Cascade Funding Mortgage Trust | | | | | | | | | | | | |
2019-RM3, 2.80% (WAC) due 06/25/691 | | | 06/25/19 | | | $ | 3,122,162 | | | $ | 3,192,912 | |
Cascade Funding Mortgage Trust | | | | | | | | | | | | |
2018-RM2, 4.00% (WAC) due 10/25/681 | | | 11/02/18 | | | | 10,189,248 | | | | 10,638,615 | |
Copper River CLO Ltd. | | | | | | | | | | | | |
2007-1A, due 01/20/212 | | | 05/09/14 | | | | 14,300 | | | | 14,730 | |
FKRT | | | | | | | | | | | | |
2020-C2A, 3.25% due 12/30/23 | | | 12/03/20 | | | | 17,621,015 | | | | 17,632,119 | |
LSTAR Securities Investment Ltd. | | | | | | | | | | | | |
2021-2, 1.82% (1 Month USD LIBOR + 1.70%, Rate Floor: 1.70%) due 03/02/261 | | | 03/17/21 | | | | 8,500,000 | | | | 8,494,122 | |
LSTAR Securities Investment Ltd. | | | | | | | | | | | | |
2021-1, 1.92% (1 Month USD LIBOR + 1.80%, Rate Floor: 1.80%) due 02/01/261 | | | 02/04/21 | | | | 13,612,861 | | | | 13,649,561 | |
Putnam Structured Product Funding Ltd. | | | | | | | | | | | | |
2003-1A, 1.18% (1 Month USD LIBOR + 1.00%, Rate Floor: 0.00%) due 10/15/381 | | | 06/01/16 | | | | 108,999 | | | | 116,398 | |
Station Place Securitization Trust | | | | | | | | | | | | |
2020-5, 0.92% (1 Month USD LIBOR + 1.00%, Rate Floor: 0.00%) due 05/24/221 | | | 05/13/20 | | | | 57,600,000 | | | | 57,600,000 | |
| | | | | | | $ | 110,768,585 | | | $ | 111,338,457 | |
1 | Variable rate security. Rate indicated is the rate effective at March 31, 2021. In some instances, the effective rate is limited by a minimum rate floor or a maximum rate cap established by the issuer. The settlement status of a position may also impact the effective rate indicated. In some cases, a position may be unsettled at period end and may not have a stated effective rate. In instances where multiple underlying reference rates and spread amounts are shown, the effective rate is based on a weighted average. |
2 | Security has no stated coupon. However, it is expected to receive residual cash flow payments on defined deal dates. |
Note 10 – Line of Credit
The Trust, along with other affiliated trusts, secured a 364-day committed, $1,230,000,000 line of credit from Citibank, N.A., which was in place through October 2, 2020, at which time the line of credit was renewed. A Fund may draw (borrow) from the line of credit, with limits subject to applicable regulatory requirements around leverage, as a temporary measure for emergency purposes, to facilitate redemption requests, or for other short-term liquidity purposes consistent with the Fund’s investment objective and program. For example, it may be advantageous for the Fund to borrow money rather than sell existing portfolio positions to meet redemption requests. Fees related to borrowings, if any, vary under this arrangement between the greater of Citibank’s “base rate”, LIBOR plus 1%, or the federal funds rate plus 1/2 of 1%.
The commitment fee that may be paid by the Fund is at an annualized rate of 0.15% of the average daily amount of its allocated unused commitment amount. The commitment fee amount is allocated to the individual Funds based on the respective net assets of each participating Fund and is referenced in the Statement of Operations under “Line of credit fees”. The Fund did not have any borrowings under this agreement as of and for the period ended March 31, 2021.
Note 11 – COVID-19
The global ongoing crisis caused by the outbreak of COVID-19 and the current recovery underway is causing disruption to consumer demand and economic output and supply chains. There are still travel restrictions and quarantines, and adverse impacts on local and global economies. Investors should be aware that in light of the current uncertainty, volatility and distress in economies, financial markets, and labor and public health conditions around the world, the Fund’s investments and a shareholder’s investment in the Fund are subject to sudden and substantial losses, increased volatility and other adverse events. Firms through which investors invest with the Fund, the Fund, its service providers, the markets in which it invests and market intermediaries are also impacted by quarantines and similar measures intended to respond to and contain the ongoing pandemic, which can obstruct their functioning and subject them to heightened operational and other risks.
Note 12 – Subsequent Events
The Fund evaluated subsequent events through the date the financial statements were available for issue and determined there were no material events that would require adjustment to or disclosure in the Fund’s financial statements.
52 | THE GUGGENHEIM FUNDS SEMI-ANNUAL REPORT | |
OTHER INFORMATION (Unaudited) |
Delivery of Shareholder Reports
Paper copies of the Fund’s annual and semi-annual shareholder reports are not sent by mail, unless you specifically request paper copies of the reports from a fund or from your financial intermediary. Instead, the reports are made available on a website, and you are notified by mail each time a report is posted and provided with a website link to access the report.
You may elect to receive all future shareholder reports in paper free of charge. If you hold shares of a fund directly, you can inform the Fund that you wish to receive paper copies of reports by calling 800.820.0888. If you hold shares of a fund through a financial intermediary, please contact the financial intermediary to make this election. Your election to receive reports in paper may apply to all Guggenheim Funds in which you are invested and may apply to all Guggenheim funds held with your financial intermediary.
Proxy Voting Information
A description of the policies and procedures that the Trust uses to determine how to vote proxies relating to securities held in the Fund’s portfolio is available, without charge and upon request, by calling 800.820.0888. This information is also available from the EDGAR database on the SEC’s website at https://www.sec.gov.
Information regarding how the Fund’s voted proxies relating to portfolio securities during the most recent 12-month period ended June 30 is available without charge, upon request, by calling 800.820.0888. This information is also available from the EDGAR database on the SEC’s website at https://www.sec.gov.
Sector Classification
Information in the Schedule of Investments is categorized by sectors using sector-level Classifications defined by the Bloomberg Industry Classification System, a widely recognized industry classification system provider. The Fund’s registration statement has investment policies relating to concentration in specific sectors/industries. For purposes of these investment policies, the Fund usually classifies sectors/industries based on industry-level Classifications used by widely recognized industry classification system providers such as Bloomberg Industry Classification System, Global Industry Classification Standards and Barclays Global Classification Scheme.
Quarterly Portfolio Schedules Information
The Trust files its complete schedule of portfolio holdings with the SEC for the first and third quarters of each fiscal year as an exhibit to its reports on Form N-PORT, and for reporting periods ended prior to March 31, 2019, filed such information on Form N-Q. The Fund’s Forms N-PORT and N-Q are available on the SEC’s website at https://www.sec.gov. Copies of the portfolio holdings are also available to shareholders, without charge and upon request, by calling 800.820.0888.
| | THE GUGGENHEIM FUNDS SEMI-ANNUAL REPORT | 53 |
INFORMATION ON BOARD OF TRUSTEES AND OFFICERS (Unaudited) |
A Board of Trustees oversees the Trust, as well as other trusts of GI, in which its members have no stated term of service, and continue to serve after election until resignation. The Statement of Additional Information includes further information about Fund Trustees and Officers, and can be obtained without charge by visiting guggenheiminvestments.com or by calling 800.820.0888.
Name, Address*
and Year of Birth | Position(s)
Held with
Trust | Term of Office
and Length of
Time Served** | Principal Occupation(s)
During Past Five Years | Number of
Portfolios
in Fund
Complex
Overseen | Other
Directorships Held
by Trustees*** |
INDEPENDENT TRUSTEES | | | |
Randall C. Barnes (1951) | Trustee and Chair of the Valuation Oversight Committee | Since 2014 (Trustee) Since 2020 (Chair of the Valuation Oversight Committee) | Current: Private Investor (2001-present). Former: Senior Vice President and Treasurer, PepsiCo, Inc. (1993-1997); President, Pizza Hut International (1991-1993); Senior Vice President, Strategic Planning and New Business Development, PepsiCo, Inc. (1987-1990). | 157 | Current: Purpose Investments Funds (2013-present). Former: Managed Duration Investment Grade Municipal Fund (2006-2016). |
Angela Brock-Kyle (1959) | Trustee | Since 2019 | Current: Founder and Chief Executive Officer, B.O.A.R.D.S. (2013-present). Former: Senior Leader, TIAA (1987-2012). | 156 | Current: Bowhead Insurance GP, LLC (2020-present); Hunt Companies, Inc. (2019-present). Former: Infinity Property & Casualty Corp. (2014-2018). |
Thomas F. Lydon, Jr. (1960) | Trustee and Chair of the Contracts Review Committee | Since 2019 (Trustee) Since 2020 (Chair of the Contracts Review Committee) | Current: President, Global Trends Investments (1996-present); Co-Chief Executive Officer, ETF Flows, LLC (2019-present); Chief Executive Officer, Lydon Media (2016-present). | 156 | Current: US Global Investors (GROW) (1995-present). Former: Harvest Volatility Edge Trust (3) (2017-2019). |
Ronald A. Nyberg (1953) | Trustee and Chair of the Nominating and Governance Committee | Since 2014 | Current: Of Counsel, Momkus LLP (2016-present). Former: Partner, Nyberg & Cassioppi, LLC (2000-2016); Executive Vice President, General Counsel, and Corporate Secretary, Van Kampen Investments (1982-1999). | 157 | Current: PPM Funds (2) (2018-present); Edward-Elmhurst Healthcare System (2012-present). Former: Western Asset Inflation-Linked Opportunities & Income Fund (2004-2020); Western Asset Inflation-Linked Income Fund (2003-2020); Managed Duration Investment Grade Municipal Fund (2003-2016). |
54 | THE GUGGENHEIM FUNDS SEMI-ANNUAL REPORT | |
INFORMATION ON BOARD OF TRUSTEES AND OFFICERS (Unaudited)(continued) |
Name, Address*
and Year of Birth | Position(s)
Held with
Trust | Term of Office
and Length of
Time Served** | Principal Occupation(s)
During Past Five Years | Number of
Portfolios
in Fund
Complex
Overseen | Other
Directorships Held
by Trustees*** |
INDEPENDENT TRUSTEES - concluded | | |
Sandra G. Sponem (1958) | Trustee and Chair of the Audit Committee | Since 2019 (Trustee) Since 2020 (Chair of the Audit Committee) | Current: Retired. Former: Senior Vice President and Chief Financial Officer, M.A. Mortenson-Companies, Inc. (2007-2017). | 156 | Current: SPDR Series Trust (81) (2018-present); SPDR Index Shares Funds (30) (2018-present); SSGA Active Trust (14) (2018-present). Former: SSGA Master Trust (1) (2018-2020). |
Ronald E. Toupin, Jr. (1958) | Trustee, Chair of the Board and Chair of the Executive Committee | Since 2014 | Current: Portfolio Consultant (2010-present); Member, Governing Council, Independent Directors Council (2013-present); Governor, Board of Governors, Investment Company Institute (2018-present). Former: Member, Executive Committee, Independent Directors Council (2016-2018); Vice President, Manager and Portfolio Manager, Nuveen Asset Management (1998-1999); Vice President, Nuveen Investment Advisory Corp. (1992-1999); Vice President and Manager, Nuveen Unit Investment Trusts (1991-1999); and Assistant Vice President and Portfolio Manager, Nuveen Unit Investment Trusts (1988-1999), each of John Nuveen & Co., Inc. (1982-1999). | 156 | Former: Western Asset Inflation-Linked Opportunities & Income Fund (2004-2020); Western Asset Inflation-Linked Income Fund (2003-2020); Managed Duration Investment Grade Municipal Fund (2003-2016). |
| | THE GUGGENHEIM FUNDS SEMI-ANNUAL REPORT | 55 |
INFORMATION ON BOARD OF TRUSTEES AND OFFICERS (Unaudited)(continued) |
Name, Address*
and Year of Birth | Position(s)
Held with
Trust | Term of Office
and Length of
Time Served** | Principal Occupation(s)
During Past Five Years | Number of
Portfolios
in Fund
Complex
Overseen | Other
Directorships Held
by Trustees*** |
INTERESTED TRUSTEE | | | | |
Amy J. Lee**** (1961) | Trustee, Vice President and Chief Legal Officer | Since 2018 (Trustee) Since 2014 (Chief Legal Officer) Since 2007 (Vice President) | Current: Interested Trustee, certain other funds in the Fund Complex (2018-present); Chief Legal Officer, certain other funds in the Fund Complex (2014-present); Vice President, certain other funds in the Fund Complex (2007-present); Senior Managing Director, Guggenheim Investments (2012-present). Former: President and Chief Executive Officer, certain other funds in the Fund Complex (2017-2019); Vice President, Associate General Counsel and Assistant Secretary, Security Benefit Life Insurance Company and Security Benefit Corporation (2004-2012). | 156 | None. |
* | The business address of each Trustee is c/o Guggenheim Investments, 227 West Monroe Street, Chicago, Illinois 60606. |
** | Each Trustee serves an indefinite term, until his or her successor is elected and qualified. Time served includes time served in the respective position for the Predecessor Corporation. |
*** | Each Trustee also serves on the Boards of Trustees of Guggenheim Funds Trust, Guggenheim Variable Funds Trust, Guggenheim Strategy Funds Trust, Fiduciary/Claymore Energy Infrastructure Fund, Guggenheim Taxable Municipal Bond & Investment Grade Debt Trust, Guggenheim Strategic Opportunities Fund, Guggenheim Enhanced Equity Income Fund, Guggenheim Energy & Income Fund, Guggenheim Credit Allocation Fund, Rydex Series Funds, Rydex Dynamic Funds, Rydex Variable Trust and Transparent Value Trust. Messrs. Barnes and Nyberg also serve on the Board of Trustees of Advent Convertible & Income Fund. |
**** | This Trustee is deemed to be an “interested person” of the Fund under the 1940 Act by reason of her position with the Fund’s Investment Manager and/or the parent of the Investment Manager. |
56 | THE GUGGENHEIM FUNDS SEMI-ANNUAL REPORT | |
INFORMATION ON BOARD OF TRUSTEES AND OFFICERS (Unaudited)(continued) |
Name, Address*
and Year of Birth | Position(s)
Held with
Trust | Term of Office
and Length of
Time Served** | Principal Occupation(s)
During Past Five Years |
OFFICERS | | | |
Brian E. Binder (1972) | President and Chief Executive Officer | Since 2018 | Current: President and Chief Executive Officer, certain other funds in the Fund Complex (2018-present); President, Chief Executive Officer and Chairman of the Board of Managers, Guggenheim Funds Investment Advisors, LLC (2018-present); President and Chief Executive Officer, Security Investors, LLC (2018-present); Board Member of Guggenheim Partners Fund Management (Europe) Limited (2018-present); Senior Managing Director and Chief Administrative Officer, Guggenheim Investments (2018-present). Former: Managing Director and President, Deutsche Funds, and Head of US Product, Trading and Fund Administration, Deutsche Asset Management (2013-2018); Managing Director, Head of Business Management and Consulting, Invesco Ltd. (2010-2012). |
James M. Howley (1972) | Assistant Treasurer | Since 2014 | Current: Managing Director, Guggenheim Investments (2004-present); Assistant Treasurer, certain other funds in the Fund Complex (2006-present). Former: Manager, Mutual Fund Administration of Van Kampen Investments, Inc. (1996-2004). |
Mark E. Mathiasen (1978) | Secretary | Since 2014 | Current: Secretary, certain other funds in the Fund Complex (2007-present); Managing Director, Guggenheim Investments (2007-present). |
Glenn McWhinnie (1969) | Assistant Treasurer | Since 2016 | Current: Vice President, Guggenheim Investments (2009-present); Assistant Treasurer, certain other funds in the Fund Complex (2016-present). |
Michael P. Megaris (1984) | Assistant Secretary | Since 2014 | Current: Assistant Secretary, certain other funds in the Fund Complex (2014-present); Director, Guggenheim Investments (2012-present). |
Elisabeth Miller (1968) | Chief Compliance Officer | Since 2012 | Current: Chief Compliance Officer, certain other funds in the Fund Complex (2012-present); Senior Managing Director, Guggenheim Investments (2012-present). Vice President, Guggenheim Funds Distributors, LLC (2014-present). Former: Chief Compliance Officer, Security Investors, LLC and Guggenheim Funds Investment Advisors, LLC (2012-2018); Chief Compliance Officer, Guggenheim Distributors, LLC (2009-2014); Senior Manager, Security Investors, LLC (2004-2014); Senior Manager, Guggenheim Distributors, LLC (2004-2014). |
Margaux Misantone (1978) | AML Officer | Since 2017 | Current: Chief Compliance Officer, Security Investors, LLC and Guggenheim Funds Investment Advisors, LLC (2018-present); AML Officer, Security Investors, LLC and certain other funds in the Fund Complex (2017-present); Managing Director, Guggenheim Investments (2015-present). Former: Assistant Chief Compliance Officer, Security Investors, LLC and Guggenheim Funds Investments Advisors, LLC (2015-2018). |
| | THE GUGGENHEIM FUNDS SEMI-ANNUAL REPORT | 57 |
INFORMATION ON BOARD OF TRUSTEES AND OFFICERS (Unaudited)(concluded) |
Name, Address*
and Year of Birth | Position(s)
Held with
Trust | Term of Office
and Length of
Time Served** | Principal Occupation(s)
During Past Five Years |
OFFICERS - concluded | |
Kimberly J. Scott (1974) | Assistant Treasurer | Since 2014 | Current: Director, Guggenheim Investments (2012-present); Assistant Treasurer, certain other funds in the Fund Complex (2012-present). Former: Financial Reporting Manager, Invesco, Ltd. (2010-2011); Vice President/Assistant Treasurer, Mutual Fund Administration for Van Kampen Investments, Inc./Morgan Stanley Investment Management (2009-2010); Manager of Mutual Fund Administration, Van Kampen Investments, Inc./Morgan Stanley Investment Management (2005-2009). |
Bryan Stone (1979) | Vice President | Since 2014 | Current: Vice President, certain other funds in the Fund Complex (2014-present); Managing Director, Guggenheim Investments (2013-present). Former: Senior Vice President, Neuberger Berman Group LLC (2009-2013); Vice President, Morgan Stanley (2002-2009). |
John L. Sullivan (1955) | Chief Financial Officer, Chief Accounting Officer and Treasurer | Since 2014 | Current: Chief Financial Officer, Chief Accounting Officer and Treasurer, certain other funds in the Fund Complex (2010-present); Senior Managing Director, Guggenheim Investments (2010-present). Former: Managing Director and Chief Compliance Officer, each of the funds in the Van Kampen Investments fund complex (2004-2010); Managing Director and Head of Fund Accounting and Administration, Morgan Stanley Investment Management (2002-2004); Chief Financial Officer and Treasurer, Van Kampen Funds (1996-2004). |
Jon Szafran (1989) | Assistant Treasurer | Since 2017 | Current: Vice President, Guggenheim Investments (2017-present); Assistant Treasurer, certain other funds in the Fund Complex (2017-present). Former: Assistant Treasurer of Henderson Global Funds and Manager of US Fund Administration, Henderson Global Investors (North America) Inc. (“HGINA”), (2017); Senior Analyst of US Fund Administration, HGINA (2014–2017); Senior Associate of Fund Administration, Cortland Capital Market Services, LLC (2013-2014); Experienced Associate, PricewaterhouseCoopers LLP (2012-2013). |
* | The business address of each officer is c/o Guggenheim Investments, 227 West Monroe Street, Chicago, Illinois 60606. |
** | Each officer serves an indefinite term, until his or her successor is duly elected and qualified. |
58 | THE GUGGENHEIM FUNDS SEMI-ANNUAL REPORT | |
GUGGENHEIM INVESTMENTS PRIVACY NOTICE (Unaudited) |
Who We Are
This Privacy Notice describes the data protection practices of Guggenheim Investments. Guggenheim Investments as used herein refers to the affiliated investment management businesses of Guggenheim Partners, LLC: Guggenheim Funds Investment Advisors, LLC, Guggenheim Partners Investment Management, LLC, Guggenheim Funds Distributors, LLC, Security Investors, LLC, Guggenheim Investment Advisors (Europe) Limited, Guggenheim Real Estate, LLC, GS Gamma Advisors, LLC, Guggenheim Partners India Management, LLC, Guggenheim Partners Europe Limited, as well as the funds in the Guggenheim Funds complex (the “Funds”) (“Guggenheim Investments,” “we,” “us,” or “our”).
Guggenheim Partners Investment Management Holdings, LLC, located at 330 Madison Avenue, New York, New York 10017 is the data controller for your information. The affiliates who are also controllers of certain of your information are: Guggenheim Investment Advisors (Europe) Limited, Guggenheim Partners Europe Limited, Guggenheim Partners, LLC, Guggenheim Funds Investment Advisors, LLC, Guggenheim Partners Investment Management, LLC, Guggenheim Funds Distributors, LLC and Security Investors, LLC, as well as the Funds.
Our Commitment to You
Guggenheim Investments considers your privacy our utmost concern. When you become our client or investor, you entrust us with not only your hard-earned money but also with your personal and financial information. Because we have access to your private information, we hold ourselves to the highest standards in its safekeeping and use. We strictly limit how we share your information with others, whether you are a current or former Guggenheim Investments client or investor.
The Information We Collect About You
We collect certain nonpublic personal information about you from information you provide on applications, other forms, our website, and/or from third parties including investment advisors. This information includes Social Security or other tax identification number, assets, income, tax information, retirement and estate plan information, transaction history, account balance, payment history, bank account information, marital status, family relationships, information that we collect on our website through the use of “cookies,” and other personal information that you or others provide to us. We may also collect such information through your inquiries by mail, e-mail or telephone. We may also collect customer due diligence information, as required by applicable law and regulation, through third party service providers.
How We Handle Your Personal Information
The legal basis for using your information as set out in this Privacy Notice is as follows: (a) use of your personal data is necessary to perform our obligations under any contract with you (such as a contract for us to provide financial services to you); or (b) where use of your personal data is not necessary for performance of a contract, use of your personal data is necessary for our legitimate interests or the legitimate interests of others (for example, to enforce the legal terms governing our services, operate and market our website and other services we offer, ensure safe environments for our personnel and others, make and receive payments, prevent fraud and to know the customer to whom we are providing the services). Some processing is done to comply with applicable law.
In addition to the specific uses described above, we also use your information in the following manner:
| | ● | We use your information in connection with servicing your accounts. |
| | ● | We use information to respond to your requests or questions. For example, we might use your information to respond to your customer feedback. |
| | ● | We use information to improve our products and services. We may use your information to make our website and products better. We may use your information to customize your experience with us. |
| | ● | We use information for security purposes. We may use your information to protect our company and our customers. |
| | ● | We use information to communicate with you. For example, we will communicate with you about your account or our relationship. We may contact you about your feedback. We might also contact you about this Privacy Notice. We may also enroll you in our email newsletter. |
| | THE GUGGENHEIM FUNDS SEMI-ANNUAL REPORT | 59 |
GUGGENHEIM INVESTMENTS PRIVACY NOTICE (Unaudited)(continued) |
| | ● | We use information as otherwise permitted by law, as we may notify you. |
| | ● | Aggregate/Anonymous Data. We may aggregate and/or anonymize any information collected through the website so that such information can no longer be linked to you or your device (“Aggregate/Anonymous Information”). We may use Aggregate/Anonymous Information for any purpose, including without limitation for research and marketing purposes, and may also share such data with any third parties, including advertisers, promotional partners, and sponsors. |
We do not sell information about current or former clients or their accounts to third parties. Nor do we share this information, except when necessary to complete transactions at your request, to make you aware of investment products and services that we or our affiliates offer, or as permitted or required by law.
We provide information about you to companies and individuals not affiliated with Guggenheim Investments to complete certain transactions or account changes, or to perform services for us related to your account. For example, if you ask to transfer assets from another financial institution to Guggenheim Investments, we must provide certain information about you to that company to complete the transaction. We provide the third party with only the information necessary to carry out its responsibilities and only for that purpose. And we require these third parties to treat your private information with the same high degree of confidentiality that we do. To alert you to other Guggenheim Investments products and services, we share your information within our family of affiliated companies. You may limit our sharing with affiliated companies as set out below. We may also share information with any successor to all or part of our business, or in connection with steps leading up to a merger or acquisition. For example, if part of our business was sold we may give customer information as part of that transaction. We may also share information about you with your consent.
We will release information about you if you direct us to do so, if we are compelled by law to do so, or in other circumstances as permitted by law (for example, to protect your account from fraud).
If you close your account(s) or become an inactive client or investor, we will continue to adhere to the privacy policies and practices described in this notice.
Opt-Out Provisions and Your Data Choices
The law allows you to “opt out” of certain kinds of information sharing with third parties. We do not share personal information about you with any third parties that triggers this opt-out right. This means YOU ARE ALREADY OPTED OUT.
When you are no longer our client or investor, we continue to share your information as described in this notice, and you may contact us at any time to limit our sharing by sending an email to CorporateDataPrivacy@GuggenheimPartners.com.
European Union Data Subjects and certain others: In addition to the choices set forth above, residents of the European Union and certain other jurisdictions have certain rights to (1) request access to or rectification or deletion of information we collect about them, (2) request a restriction on the processing of their information, (3) object to the processing of their information, or (4) request the portability of certain information. To exercise these or other rights, please contact us using the contact information below. We will consider all requests and provide our response within the time period stated by applicable law. Please note, however, that certain information may be exempt from such requests in some circumstances, which may include if we need to keep processing your information for our legitimate interests or to comply with a legal obligation. We may request you provide us with information necessary to confirm your identity before responding to your request.
Residents of France and certain other jurisdictions may also provide us with instructions regarding the manner in which we may continue to store, erase and share your information after your death, and where applicable, the person you have designated to exercise these rights after your death.
How We Protect Privacy Online
We take steps to protect your privacy when you use our web site – www.guggenheiminvestments.com – by using secure forms of online communication, including encryption technology, Secure Socket Layer (SSL) protocol, firewalls and user names and passwords. These safeguards vary based on the sensitivity of the information that we collect and store. However, we cannot and do not guarantee that these measures will prevent every unauthorized attempt to access, use, or disclose your information since despite our efforts, no Internet and/or other
60 | THE GUGGENHEIM FUNDS SEMI-ANNUAL REPORT | |
GUGGENHEIM INVESTMENTS PRIVACY NOTICE (Unaudited)(concluded) |
electronic transmissions can be completely secure. Our web site uses “http cookies”—tiny pieces of information that we ask your browser to store. We use cookies for session management and security features on the Guggenheim Investments web site. We do not use them to pull data from your hard drive, to learn your e-mail address, or to view data in cookies created by other web sites. We will not share the information in our cookies or give others access to it. See the legal information area on our web site for more details about web site security and privacy features.
How We Safeguard Your Personal Information and Data Retention
We restrict access to nonpublic personal information about you to our employees and in some cases to third parties (for example, the service providers described above) as permitted by law. We maintain strict physical, electronic and procedural safeguards that comply with federal standards to guard your nonpublic personal information.
We keep your information for no longer than necessary for the purposes for which it is processed. The length of time for which we retain information depends on the purposes for which we collected and use it and/or as required to comply with applicable laws. Information may persist in copies made for backup and business continuity purposes for additional time.
International Visitors
If you are not a resident of the United States, please be aware that your information may be transferred to, stored and processed in the United States where our servers are located and our databases are operated. The data protection and other laws of the United States and other countries might not be as comprehensive as those in your country.
In such cases, we ensure that a legal basis for such a transfer exists and that adequate protection is provided as required by applicable law, for example, by using standard contractual clauses or by transferring your data to a jurisdiction that has obtained an adequacy finding. Individuals whose data may be transferred on the basis of standard contractual clauses may contact us as described below.
We’ll Keep You Informed
If you have any questions or concerns about how we treat your personal data, we encourage you to consult with us first. You may also contact the relevant supervisory authority.
We reserve the right to modify this policy at any time and will inform you promptly of material changes. You may access our privacy policy from our web site at www.guggenheiminvestments.com. Should you have any questions regarding our privacy policy, contact us by email at CorporateDataPrivacy@GuggenheimPartners.com.
| | THE GUGGENHEIM FUNDS SEMI-ANNUAL REPORT | 61 |
Not required at this time.
| Item 3. | Audit Committee Financial Expert. |
Not required at this time.
| Item 4. | Principal Accountant Fees and Services. |
Not required at this time.
| Item 5. | Audit Committee of Listed Registrants. |
Not applicable.
The Schedule of Investments is included under Item 1 of this form.
| Item 7. | Disclosure of Proxy Voting Policies and Procedures for Closed-End Management Investment Companies. |
Not applicable.
Item 8. Portfolio Managers of Closed-end Management Investment Companies
Not applicable.
| Item 9. | Purchases of Equity Securities by Closed-End Management Investment Company and Affiliated Purchasers. |
Not applicable.
| Item 10. | Submission of Matters to a Vote of Security Holders. |
The registrant does not currently have in place procedures by which shareholders may recommend nominees to the registrant’s board.
There have been no changes to the procedures by which shareholders may recommend nominees to the registrant’s board.
| Item 11. | Controls and Procedures. |
(a) The registrant’s President (principal executive officer) and Treasurer (principal financial officer) have evaluated the registrant’s disclosure controls and procedures (as defined in Rule 30a-3(c) under the Investment Company Act) as of a date within 90 days of this filing and have concluded that based on such evaluation as required by Rule 30a-3(b) under the Investment Company Act, that the registrant’s disclosure controls and procedures were effective as of that date in ensuring that information required to be disclosed by the registrant in this Form N-CSR was recorded, processed, summarized, and reported within the time periods specified in the Securities and Exchange Commission’s rules and forms..
(b) The registrant’s principal executive officer and principal financial officer are aware of no change in the registrant’s internal control over financial reporting that occurred during the period covered by this report that has materially affected, or is reasonably likely to materially affect, the registrant’s internal control over financial reporting.
Item 12. Disclosure of Securities Lending Activities for Closed-End Management Investment Companies.
Not applicable.
| (a)(1) | Not required at this time. |
| (a)(3) | Not applicable to registrant. |
| (a)(4) | Not applicable to registrant. |
SIGNATURES
Pursuant to the requirements of the Securities Exchange Act of 1934 and the Investment Company Act of 1940, the registrant has duly caused this report to be signed on its behalf by the undersigned, thereunto duly authorized.
| (Registrant) | Guggenheim Funds Trust | |
| | | |
| By (Signature and Title)* | /s/ Brian E. Binder | |
| | Brian E. Binder, President and Chief Executive Officer | |
| | | |
| Date | June 7, 2021 | |
Pursuant to the requirements of the Securities Exchange Act of 1934 and the Investment Company Act of 1940, this report has been signed below by the following persons on behalf of the registrant and in the capacities and on the dates indicated.
| By (Signature and Title)* | /s/ Brian E. Binder | |
| | Brian E. Binder, President and Chief Executive Officer | |
| | | |
| Date | June 7, 2021 | |
| | | |
| By (Signature and Title)* | /s/ John L. Sullivan | |
| | John L. Sullivan, Chief Financial Officer, Chief Accounting Officer and Treasurer | |
| | | |
| Date | June 7, 2021 | |
| * | Print the name and title of each signing officer under his or her signature. |


